


Abstract
With the active modernization of power facilities and the increasing deployment of maneuverable combined-cycle gas turbines (CCGTs), the selection of rational start-up strategies becomes increasingly important from the perspective of power quality. Excessive acceleration of power ramp-up may lead to undesirable voltage deviations, particularly in transmission networks with limited grid stiffness. This study investigates the impact of CCGT start-up ramp rate on voltage dynamics and power quality indicators at a 110/220 kV grid node. A detailed model of the Almaty power hub was developed in MATLAB/Simulink, taking into account the network structure, generating units, transformers, and aggregated loads. Three start-up scenarios were analyzed: an existing combined heat and power plant, a 504 MW combined-cycle gas turbine unit, and a 560 MW combined-cycle gas turbine unit with fuel afterburning. Voltage dynamics were evaluated using RMS-based indicators and a stabilization criterion incorporating a 5 s sliding time window and an 80% admissibility threshold. The simulation results reveal a nonlinear relationship between the start-up ramp rate and voltage quality. Increasing the ramp rate reduces the voltage stabilization time; however, beyond approximately 0.05 MW/s, further acceleration does not lead to additional improvement in power quality. The results indicate the existence of an optimal range of start-up ramp rates that provides a compromise between start-up speed and voltage quality requirements. The proposed approach can be used in the development of start-up algorithms for modern combined-cycle power plants connected to 110/220 kV transmission networks.
1. Introduction
In addition to its direct impact on the operation of electrical equipment, the quality of electrical energy also affects quality of life and environmental performance. Therefore, compliance with power quality requirements is an important consideration in modern power systems. In Kazakhstan, these requirements GOST 32144-2013 [1] regulate voltage fluctuations, short-term voltage deviations, steady-state voltage following start-up, frequency, and several other parameters.
Due to the widespread modernization of power facilities in Kazakhstan, start-up-related issues are becoming increasingly important, particularly for maneuverable power plants connected to legacy 110/220 kV networks originally designed during the Soviet period. The power system of Kazakhstan is divided into three interconnected zones: Northern, Western, and Southern. Electricity generation in the country is provided by 233 power plants with a total installed capacity of 25,314.2 MW and an available capacity of 18,890.3 MW. The southern zone accounts for only 3580.5 MW of installed capacity, while thermal power plants represent more than 50% of generation in this region [2].
Given that the southern regions are home to approximately 43% of the country’s population [3] and host a high concentration of industrial facilities, this area is considered to be structurally deficient in terms of electricity supply. As a result, the construction of a significant number of new power plants is currently planned, including the reconstruction of the existing 125 MW Almaty Thermal Power Plant into a new 544 MW combined-cycle unit [4]. Similar projects are planned in other southern regions of Kazakhstan. In this study, the Almaty power hub is modeled using the MATLAB/Simulink environment, taking into account the installed generating equipment, network structure, and load characteristics [5].
This study builds upon a broad body of research devoted to power system and energy network modeling [6,7,8,9,10,11,12,13,14,15,16,17,18,19,20]. In [6], a microgrid system incorporating local renewable energy sources was simulated using the MATLAB/Simulink environment. Anghel et al. [7] proposed a stochastic power system dynamics model capable of reproducing quasi-statistical behavior of electric networks under various disturbances, leading to the development of an optimized approach to operator decision-making. Hu et al. [8] investigated overload phenomena in distribution networks with a high penetration of electrical, thermal, and heat pump loads. In the study by Wang et al. [9], integrated energy systems combining electrical and thermal loads were comprehensively analyzed, with particular attention paid to system operating characteristics and interaction mechanisms. The authors also proposed a generalized model of an integrated energy system.
Cheng et al. [10] proposed a linear optimization model for power system operation that considers not only electrical energy but also thermal energy sources, particularly combined heat and power (CHP) units. A key contribution of their work is the explicit consideration of transient charging processes, which is relevant for analyzing dynamic operating conditions. Wang et al. [11] presented a comprehensive review of modern approaches to the optimal dispatch of CHP plants within integrated energy systems. The authors classify CHP management strategies into cost-based and market-based approaches, highlighting the flexibility of CHP units as a crucial factor for increasing renewable energy integration, reducing wind power curtailment, and enhancing revenues through the provision of ancillary services. Li et al. [12] examined real-time multi-stage stochastic control of grid-connected multi-energy microgrids using a hybrid control strategy, which was shown to outperform conventional approaches. Müller et al. [13] presented an open-source methodology for modeling high-voltage networks using OpenStreetMap data, enabling transparent static analysis of AC power flows for voltages and loads in transmission lines in regional electricity transmission networks.
Kotzur et al. [14] investigated time series aggregation methods for generation and load profiles, aiming to reduce the computational complexity of modeling energy systems with a high share of renewable energy sources. Liu et al. [15] addressed the problem of identifying sources of forced oscillations in power systems with integrated wind turbines. In addition, a number of studies have focused on the dynamic behavior of synchronous machines, particularly transient processes associated with generator switching and load variations. Wang et al. [16] presented a comprehensive review and classification of methods for locating electromechanical oscillation sources in power systems based on wide-area measurement system (WAMS) data, with a particular focus on their practical applicability. Kotha et al. [17] investigated improvements in power system state estimation accuracy through the integration of wide-area measurement systems (WAMSs) and phasor measurement unit (PMU) data within an energy management system (EMS). The authors addressed the optimal PMU placement problem using a modified integer linear programming approach, achieving full system observability with a minimal number of devices and increased measurement redundancy. Hammad et al. [18] investigated the application of static var compensators (SVCs) for improving power system dynamic stability and damping power oscillations, with a focus on optimal control strategies. In the study by Lee et al. [19], an approach to the optimal placement of synchronous condensers and the selection of their excitation voltage was proposed to improve power system stability. The authors demonstrated that the application of synchronous condensers effectively reduces the amplitude of voltage fluctuations and enhances the dynamic response of the network under disturbances.
A number of studies have demonstrated that the rate of change of generation power (ramp rate) is a significant factor affecting the reliability and stability of power systems [20]. In the work by Ahn and Hur, ramp events in wind turbines were analyzed and classified according to the direction, magnitude, and duration of power variation. The authors showed that abrupt changes in generation output can lead to deterioration of power system operating conditions and therefore require careful consideration in grid operation and control. Boljević et al. [21] investigated the influence of distributed generation, including cogeneration units, on the operating modes of urban distribution networks. It was demonstrated that even relatively low-power combined heat and power (CHP) units, typically connected to 0.4 kV or 10 kV buses, are capable of exerting a noticeable impact on short-circuit current levels and voltage stability.
In [22], an automatic control system for dry and wet operating modes of a once-through boiler was proposed, aimed at achieving deep load regulation of a CHP unit. The authors demonstrated the possibility of attaining high power ramp rates while maintaining the stability of the technological process and accounting for operational and environmental constraints. In recent studies, significant attention has been paid to improving the maneuverability of thermal power plants under conditions of a high share of renewable energy sources. In the work by Ding et al. [23], the integration of a steam accumulator into the bypass system of a coal-fired power unit enabled a substantial increase in ramp rate during deep load regulation. Using a 660 MW unit as a case study, ramp rates of up to 3% and 5% of rated power per minute were achieved at a load level of 40% THA. These results confirm that modern thermal power plants are technically capable of operating at high ramp rates under transient conditions. However, the impact of such rapid power changes on electrical network parameters and power quality indicators is not addressed in this study.
In the study by Kubik et al. [24], a system-level analysis of the impact of wind power ramp events on power system operation with a high penetration of renewable energy sources was conducted. The authors showed that the regulation capability of thermal power plants is determined not only by the rate of load change, but also by the stable operating range of generators and the time scale of generation variations. The results highlight the critical role of thermal power plants in maintaining power system stability under transient conditions.
At the same time, the influence of ramp events and generator start-up modes on voltage dynamics and power quality indicators at electrical grid nodes is not considered in this work.
A significant contribution to the study of start-up and ramping processes of thermal power plants was presented by Liu et al. [25]. The authors analyzed dynamic start-up and shutdown procedures of thermal units in detail, taking into account equipment temperature variations and successive stages of generator operation. It was shown that conventional simplified models with fixed ramp limitations do not adequately represent the actual behavior of generators during start-up and may result in abrupt and physically unrealistic power changes.
Existing studies on generator start-up modes and power ramp-rate limitations mainly focus on system stability, flexibility, and overall dynamic behavior of power systems [26,27,28]. Although recent works highlight an increasing number of start-ups and higher ramping rates of thermal power plants due to the growing share of renewable energy sources, the impact of generator start-up speed on short-term voltage deviations and power quality indicators in 110/220 kV transmission networks remains insufficiently investigated. In particular, while Taleb et al. [29] demonstrated the sensitivity of power system nodes to changes in power regimes and system parameters, generator start-up processes and the influence of combined-cycle power plant ramp-up rates on short-term voltage dynamics and power quality in 110/220 kV networks were not addressed.
The study demonstrated that accurate modeling of dynamic generation behavior and ramp characteristics has a substantial impact on power system operating state calculations and dispatch decision-making. However, this work primarily focuses on generator operation planning and optimization, while the influence of start-up ramp processes of thermal and combined-cycle power plants on voltage dynamics and power quality indicators in 110/220 kV grid nodes remains outside the scope of the analysis.
Despite the large number of studies devoted to generator modeling, start-up operations, and power generation optimization, most existing works focus on steady-state representations or static optimization problems. The dynamic behavior of network voltages during start-up operations of thermal and combined-cycle generating units is often only partially addressed or remains outside the main scope of these studies. In particular, the impact of generator start-up processes on short-term voltage deviations and power quality in 110/220 kV transmission networks has not been sufficiently investigated. This issue is especially relevant for modern power systems with a high share of maneuverable thermal and combined-cycle units, as well as for transmission networks undergoing reconstruction and capacity expansion. To address this research gap, the present study investigates the relationship between start-up ramp rate and voltage quality during the start-up of large combined-cycle units connected to a real 110/220 kV transmission network.
The main contributions of this study can be summarized as follows:
- -
- An RMS-based voltage stabilization criterion using a sliding time window is proposed for assessing start-up voltage quality.
- -
- A nonlinear saturation relationship between start-up ramp rate and voltage stabilization time is identified.
- -
- The applicability of the proposed approach is demonstrated using a real 110/220 kV transmission network.
2. Materials and Methods
2.1. General Outline of the Proposed Methodology
The objective of this study is to investigate the impact of power plant loading levels and start-up ramp rates on voltage dynamics and power quality indicators at 110/220 kV grid nodes. The proposed methodology is based on a sequential approach that includes power system modeling, the definition of controlled generator start-up scenarios, and the analysis of voltage time-domain characteristics.
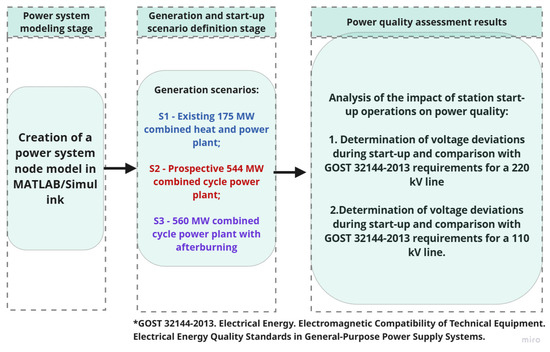
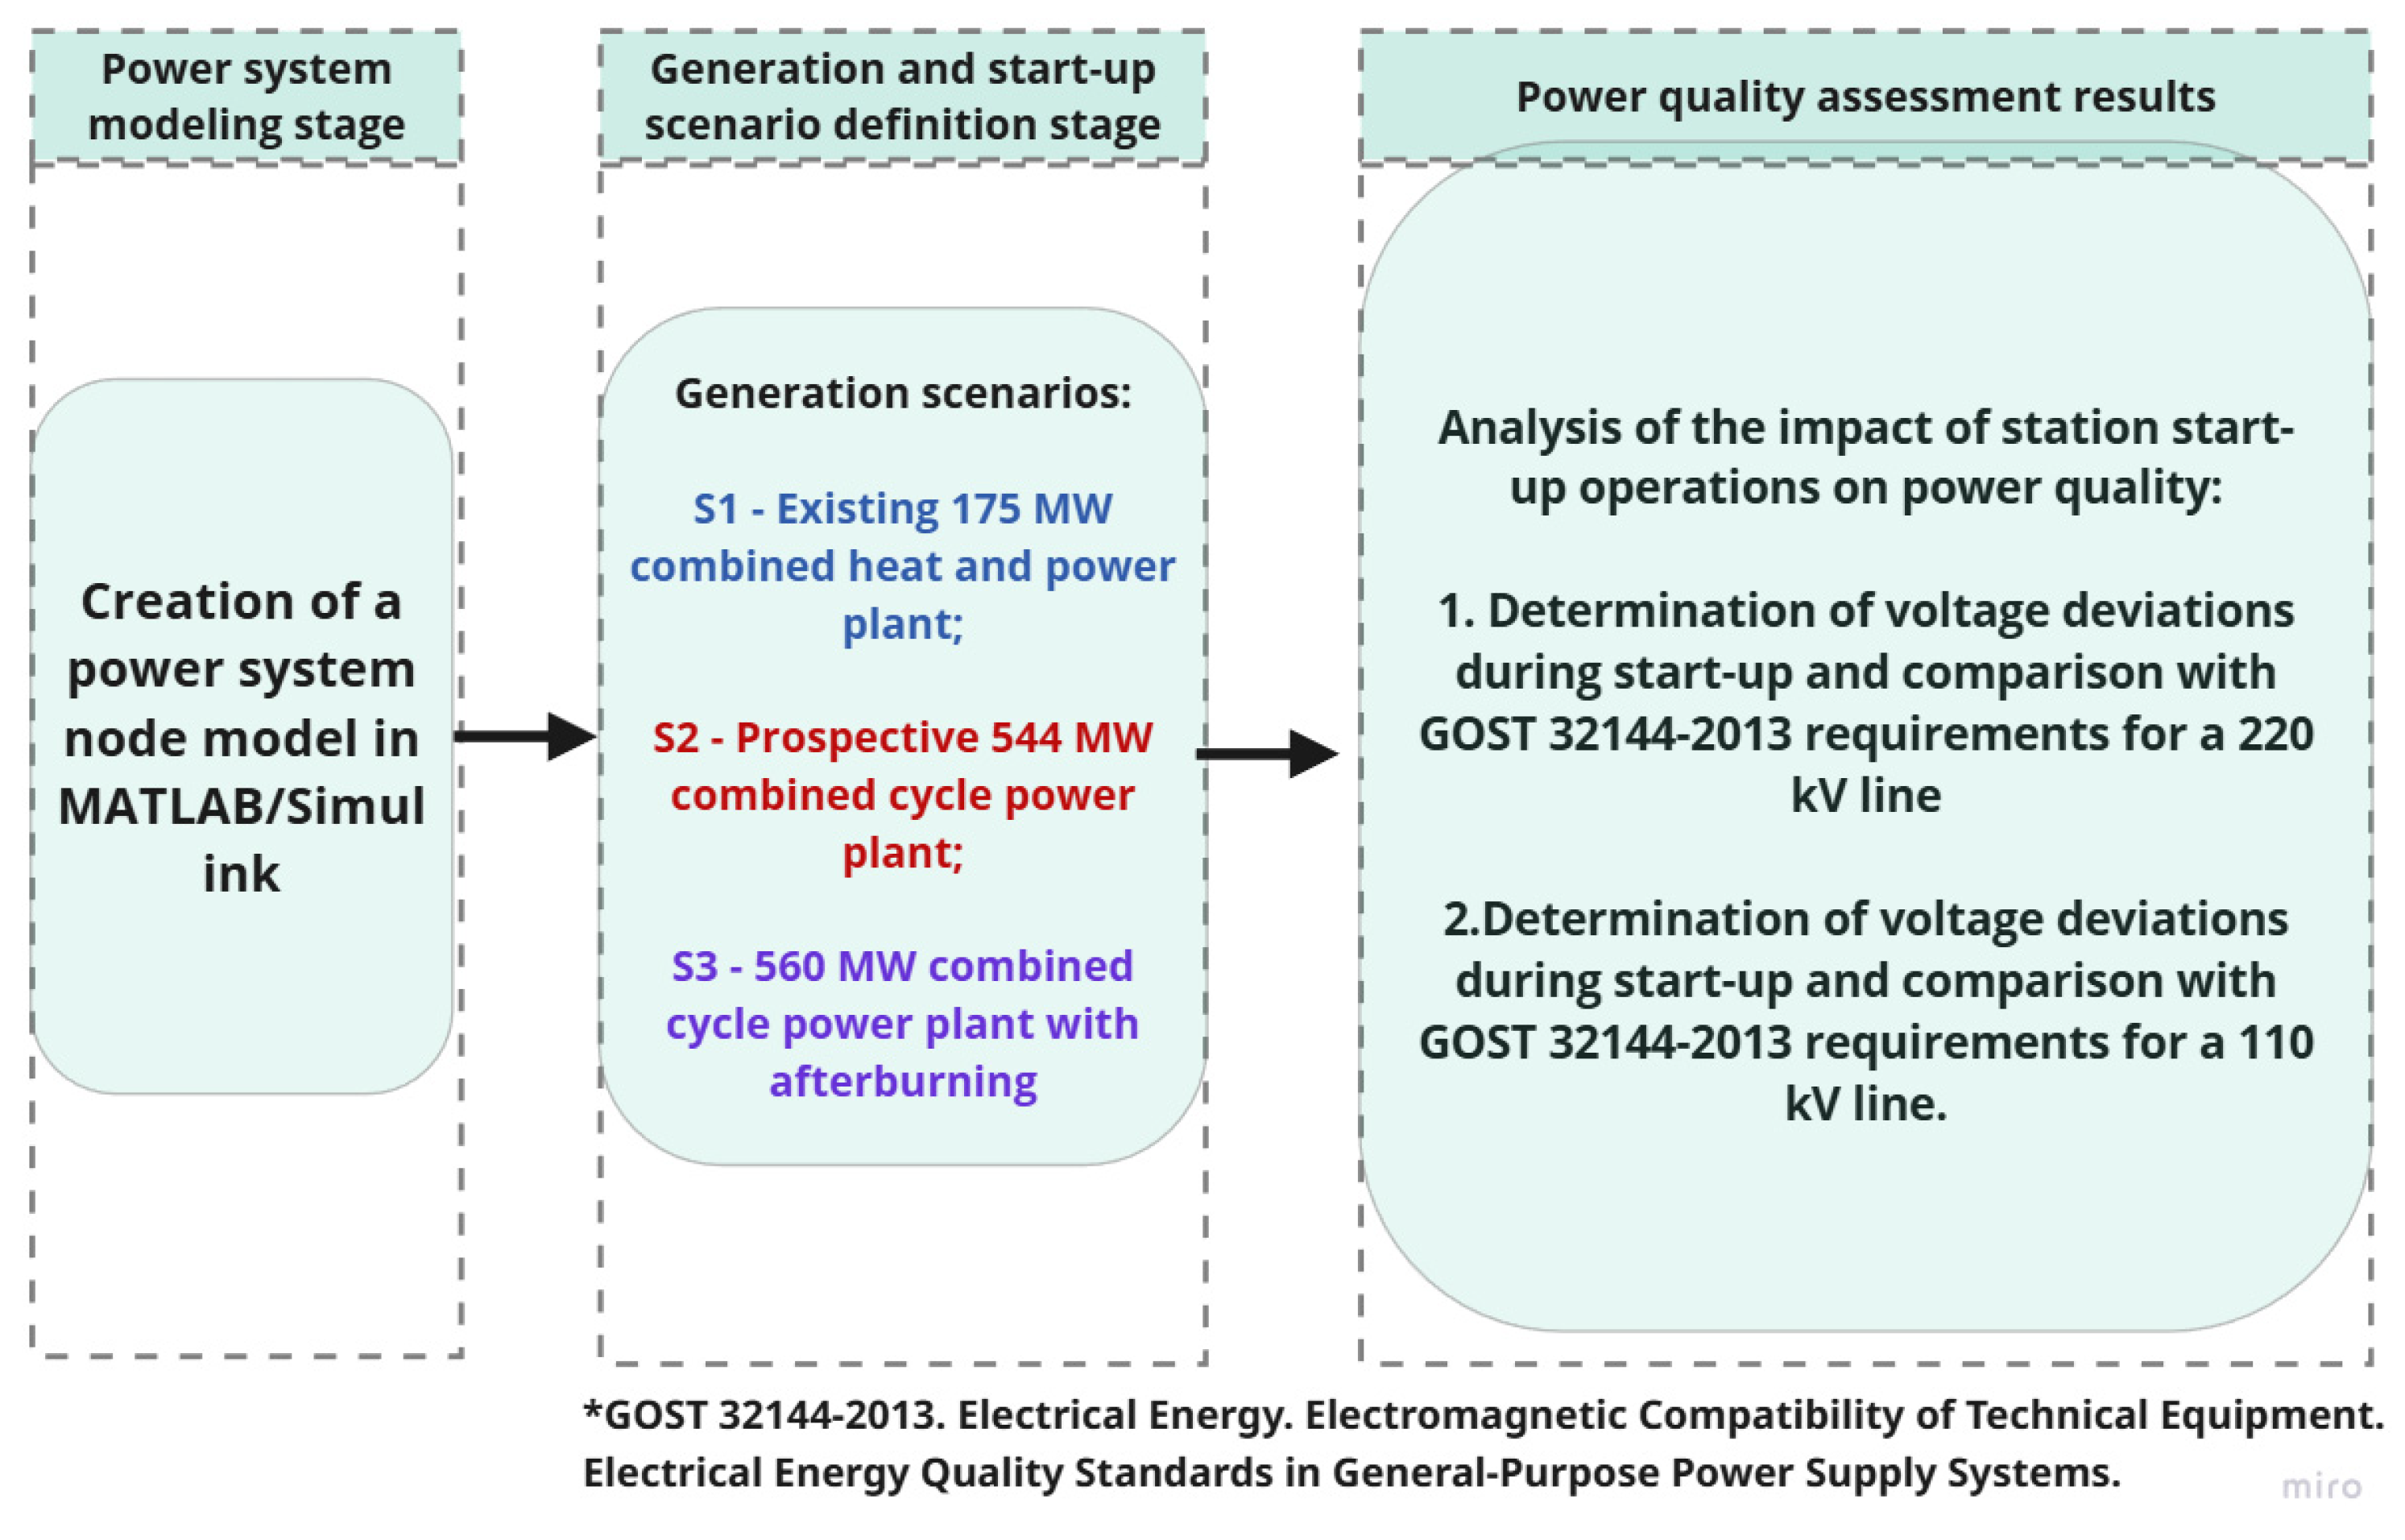
The overall logic of the study is implemented as a step-by-step methodological framework, as illustrated in Figure 1. The first stage involves constructing a model of the investigated power system node in the MATLAB/Simulink ver. R2024a environment, taking into account the network topology, generating units, and load characteristics. The second stage focuses on developing power generation and start-up scenarios that reflect both existing and prospective configurations of power sources. The final stage involves assessing the impact of start-up processes on power quality indicators, including the analysis of voltage dynamics and the comparison of the resulting deviations with regulatory requirements applicable to 110 and 220 kV transmission networks.
Figure 1.
Scheme of the methodology for studying the influence of starting modes of power plants on the quality of electric power. GOST 32144-2013; Electric Energy. Power Quality Standards in Public Power Supply Systems.
2.2. The Energy System Under Study and the Geographical Context
The study focuses on the Almaty power hub, located in the southern zone of the power system of the Republic of Kazakhstan. The southern zone is characterized by high population density, a significant concentration of industrial and municipal loads, and limited local generation capacity. As a result, a substantial share of the region’s electricity demand is supplied from the northern zone via long-distance transmission lines, which reduces grid stiffness and increases the sensitivity of the hub to transient operating conditions.
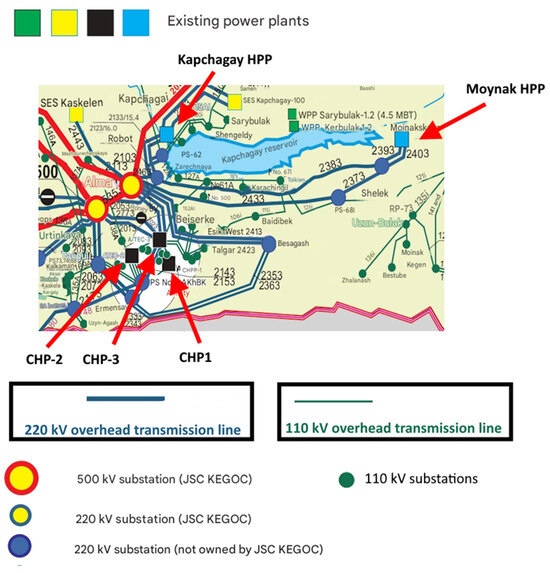
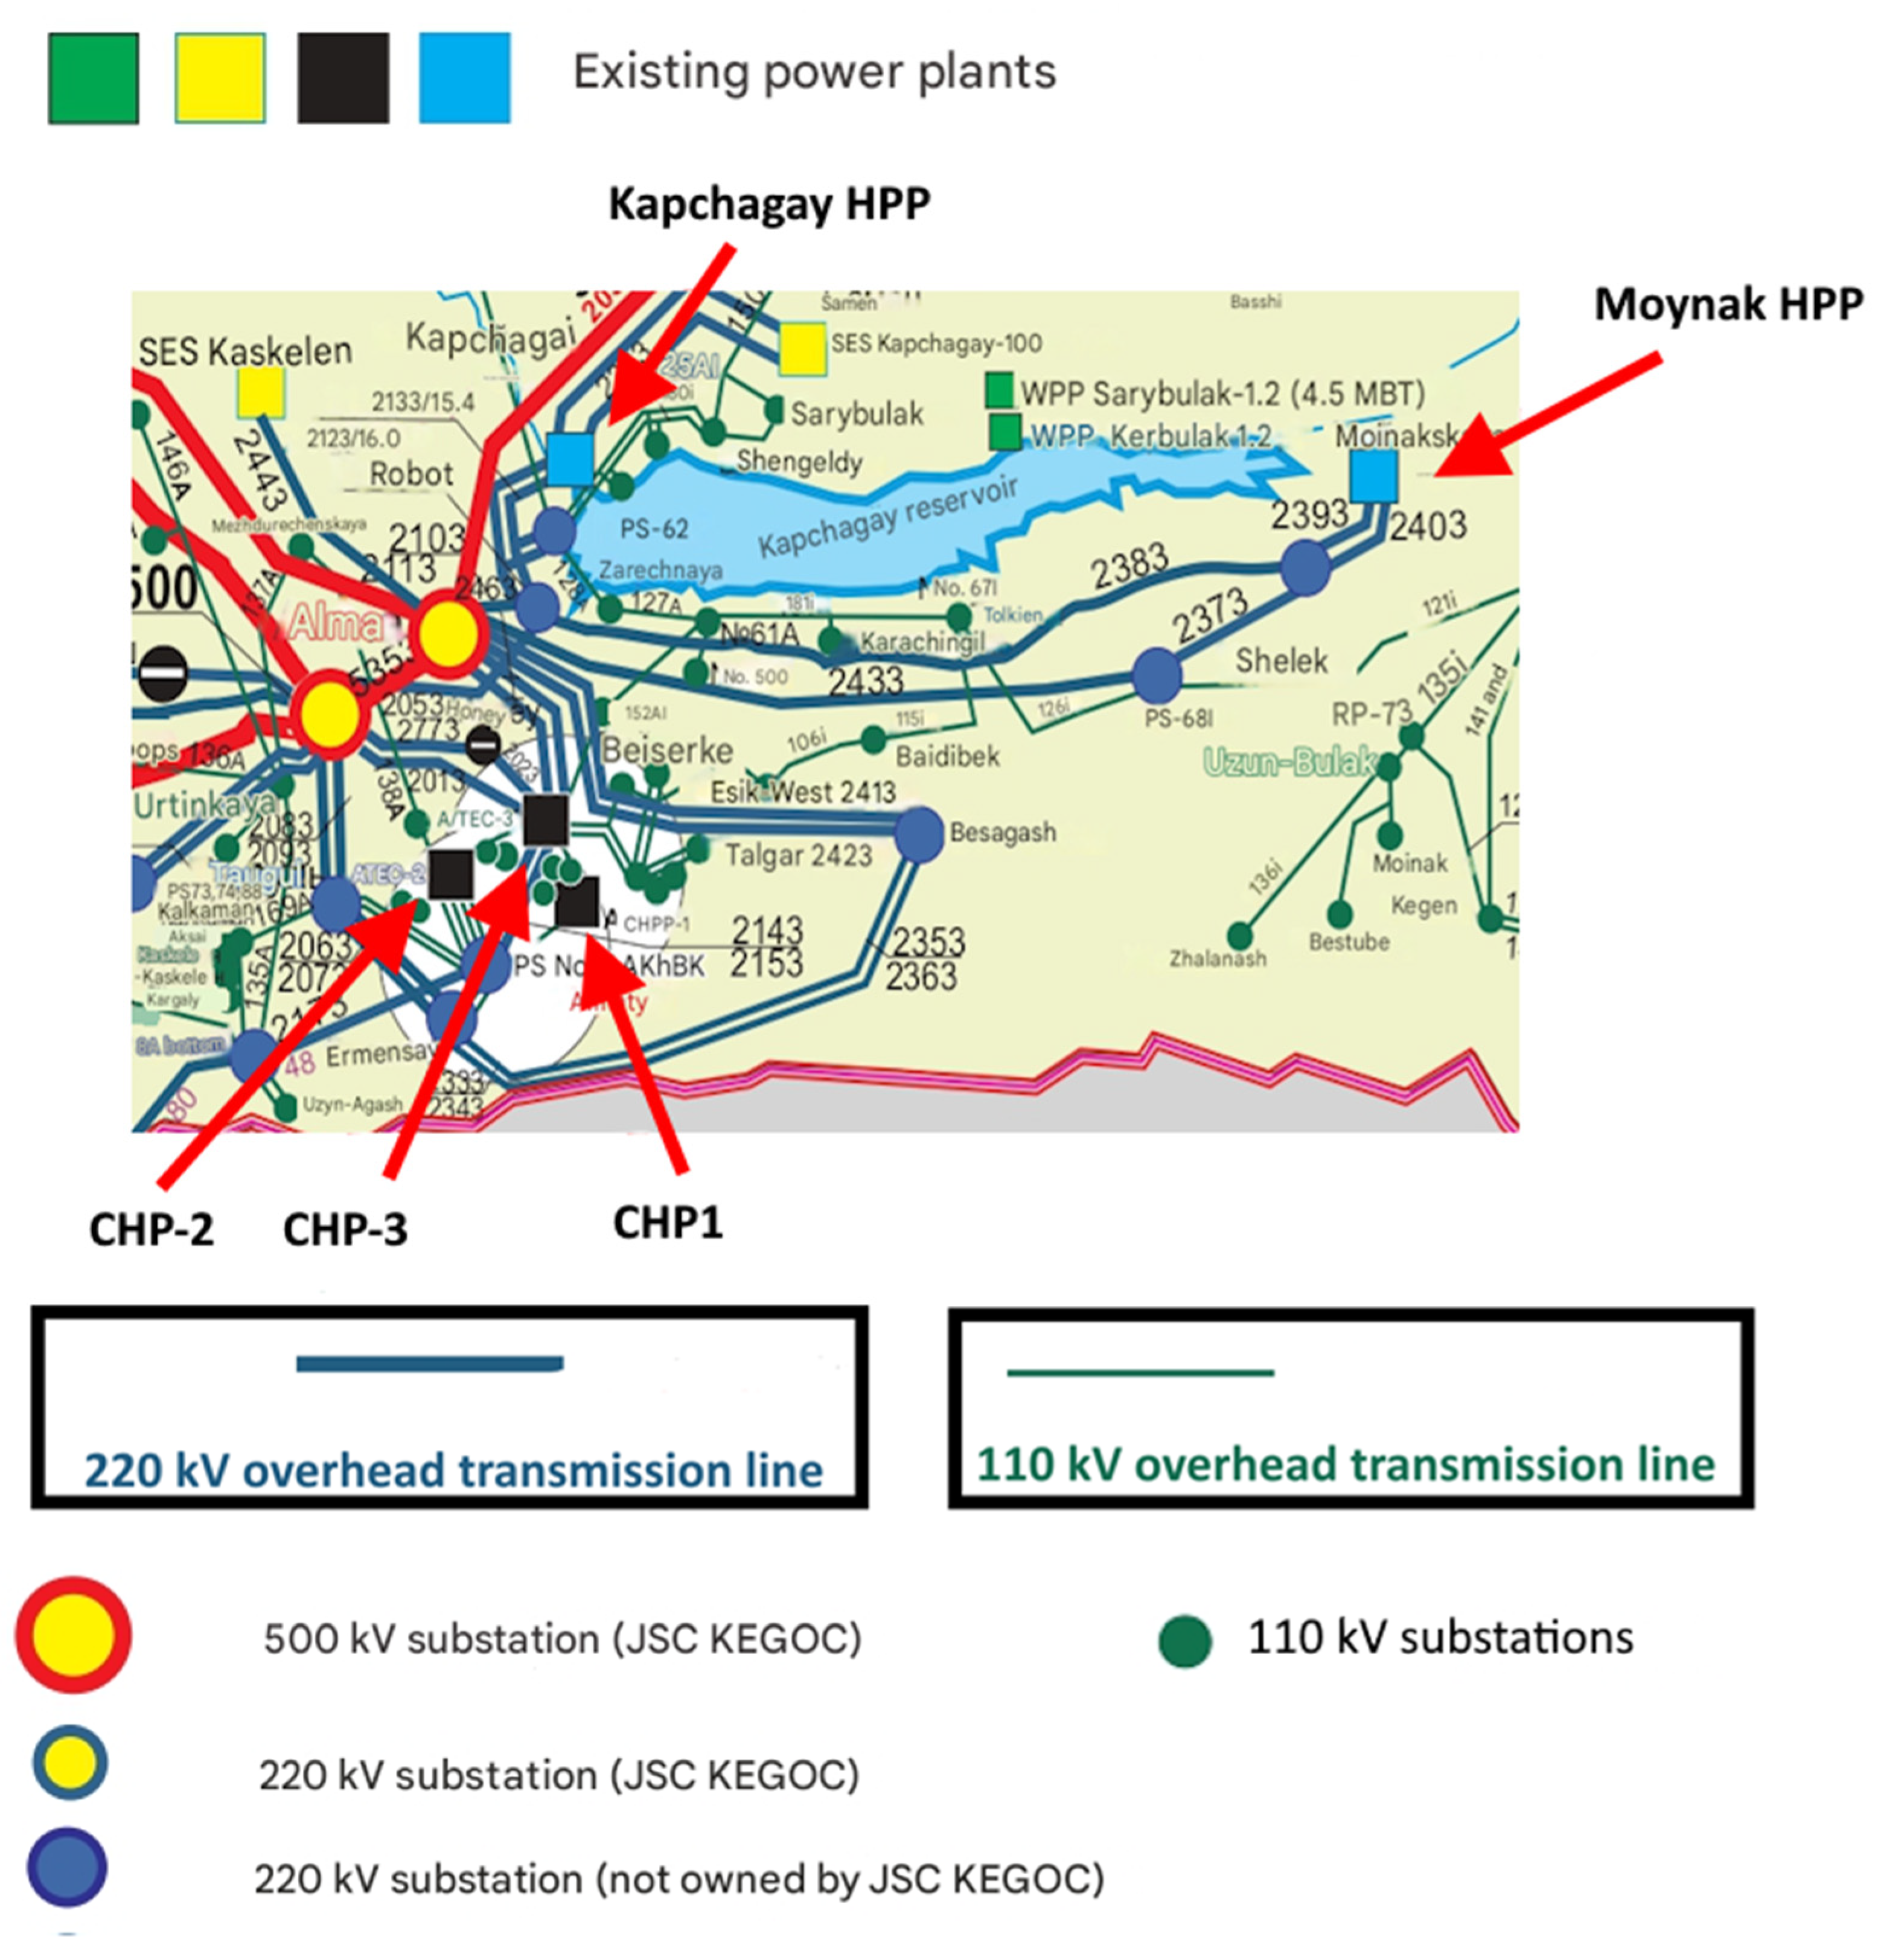
The Almaty power hub represents a key element of the southern zone and includes thermal and hydropower plants, 110 and 220 kV substations, as well as main and distribution transmission lines. The interaction between the 110 and 220 kV voltage levels is provided by power transformers, whose parameters have a significant influence on voltage dynamics during changes in generation operating modes. The geographical location of the investigated hub and its connection to the unified power system of Kazakhstan are schematically illustrated in Figure 2. The diagram presents the position of the Almaty hub within the structure of the southern zone, along with the main directions of power transmission.
Figure 2.
Map of the Almaty energy hub with main stations and lines.
From a power quality perspective, the 110 and 220 kV nodes play a key role, as power is distributed at this voltage level between generation sources and the main consumers of the region. Power plant start-up modes, particularly during the commissioning of large and flexible generating units, may result in short-term voltage fluctuations. The magnitude and duration of these fluctuations depend on the grid topology, load level, and transformer connection parameters.
Table 1 summarizes the list of power plants included in the Almaty power hub, their installed capacities, and the main parameters of the associated power transformers.
Table 1.
Main characteristics of the Almaty energy hub generating units.
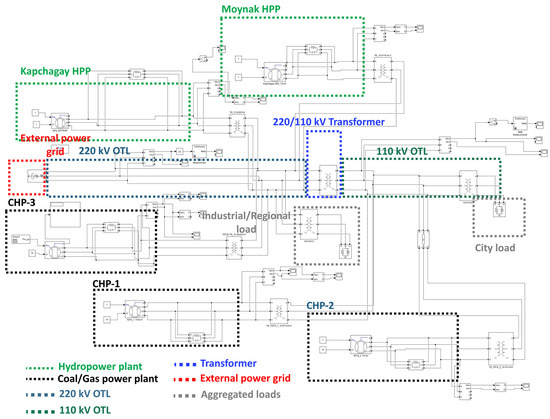
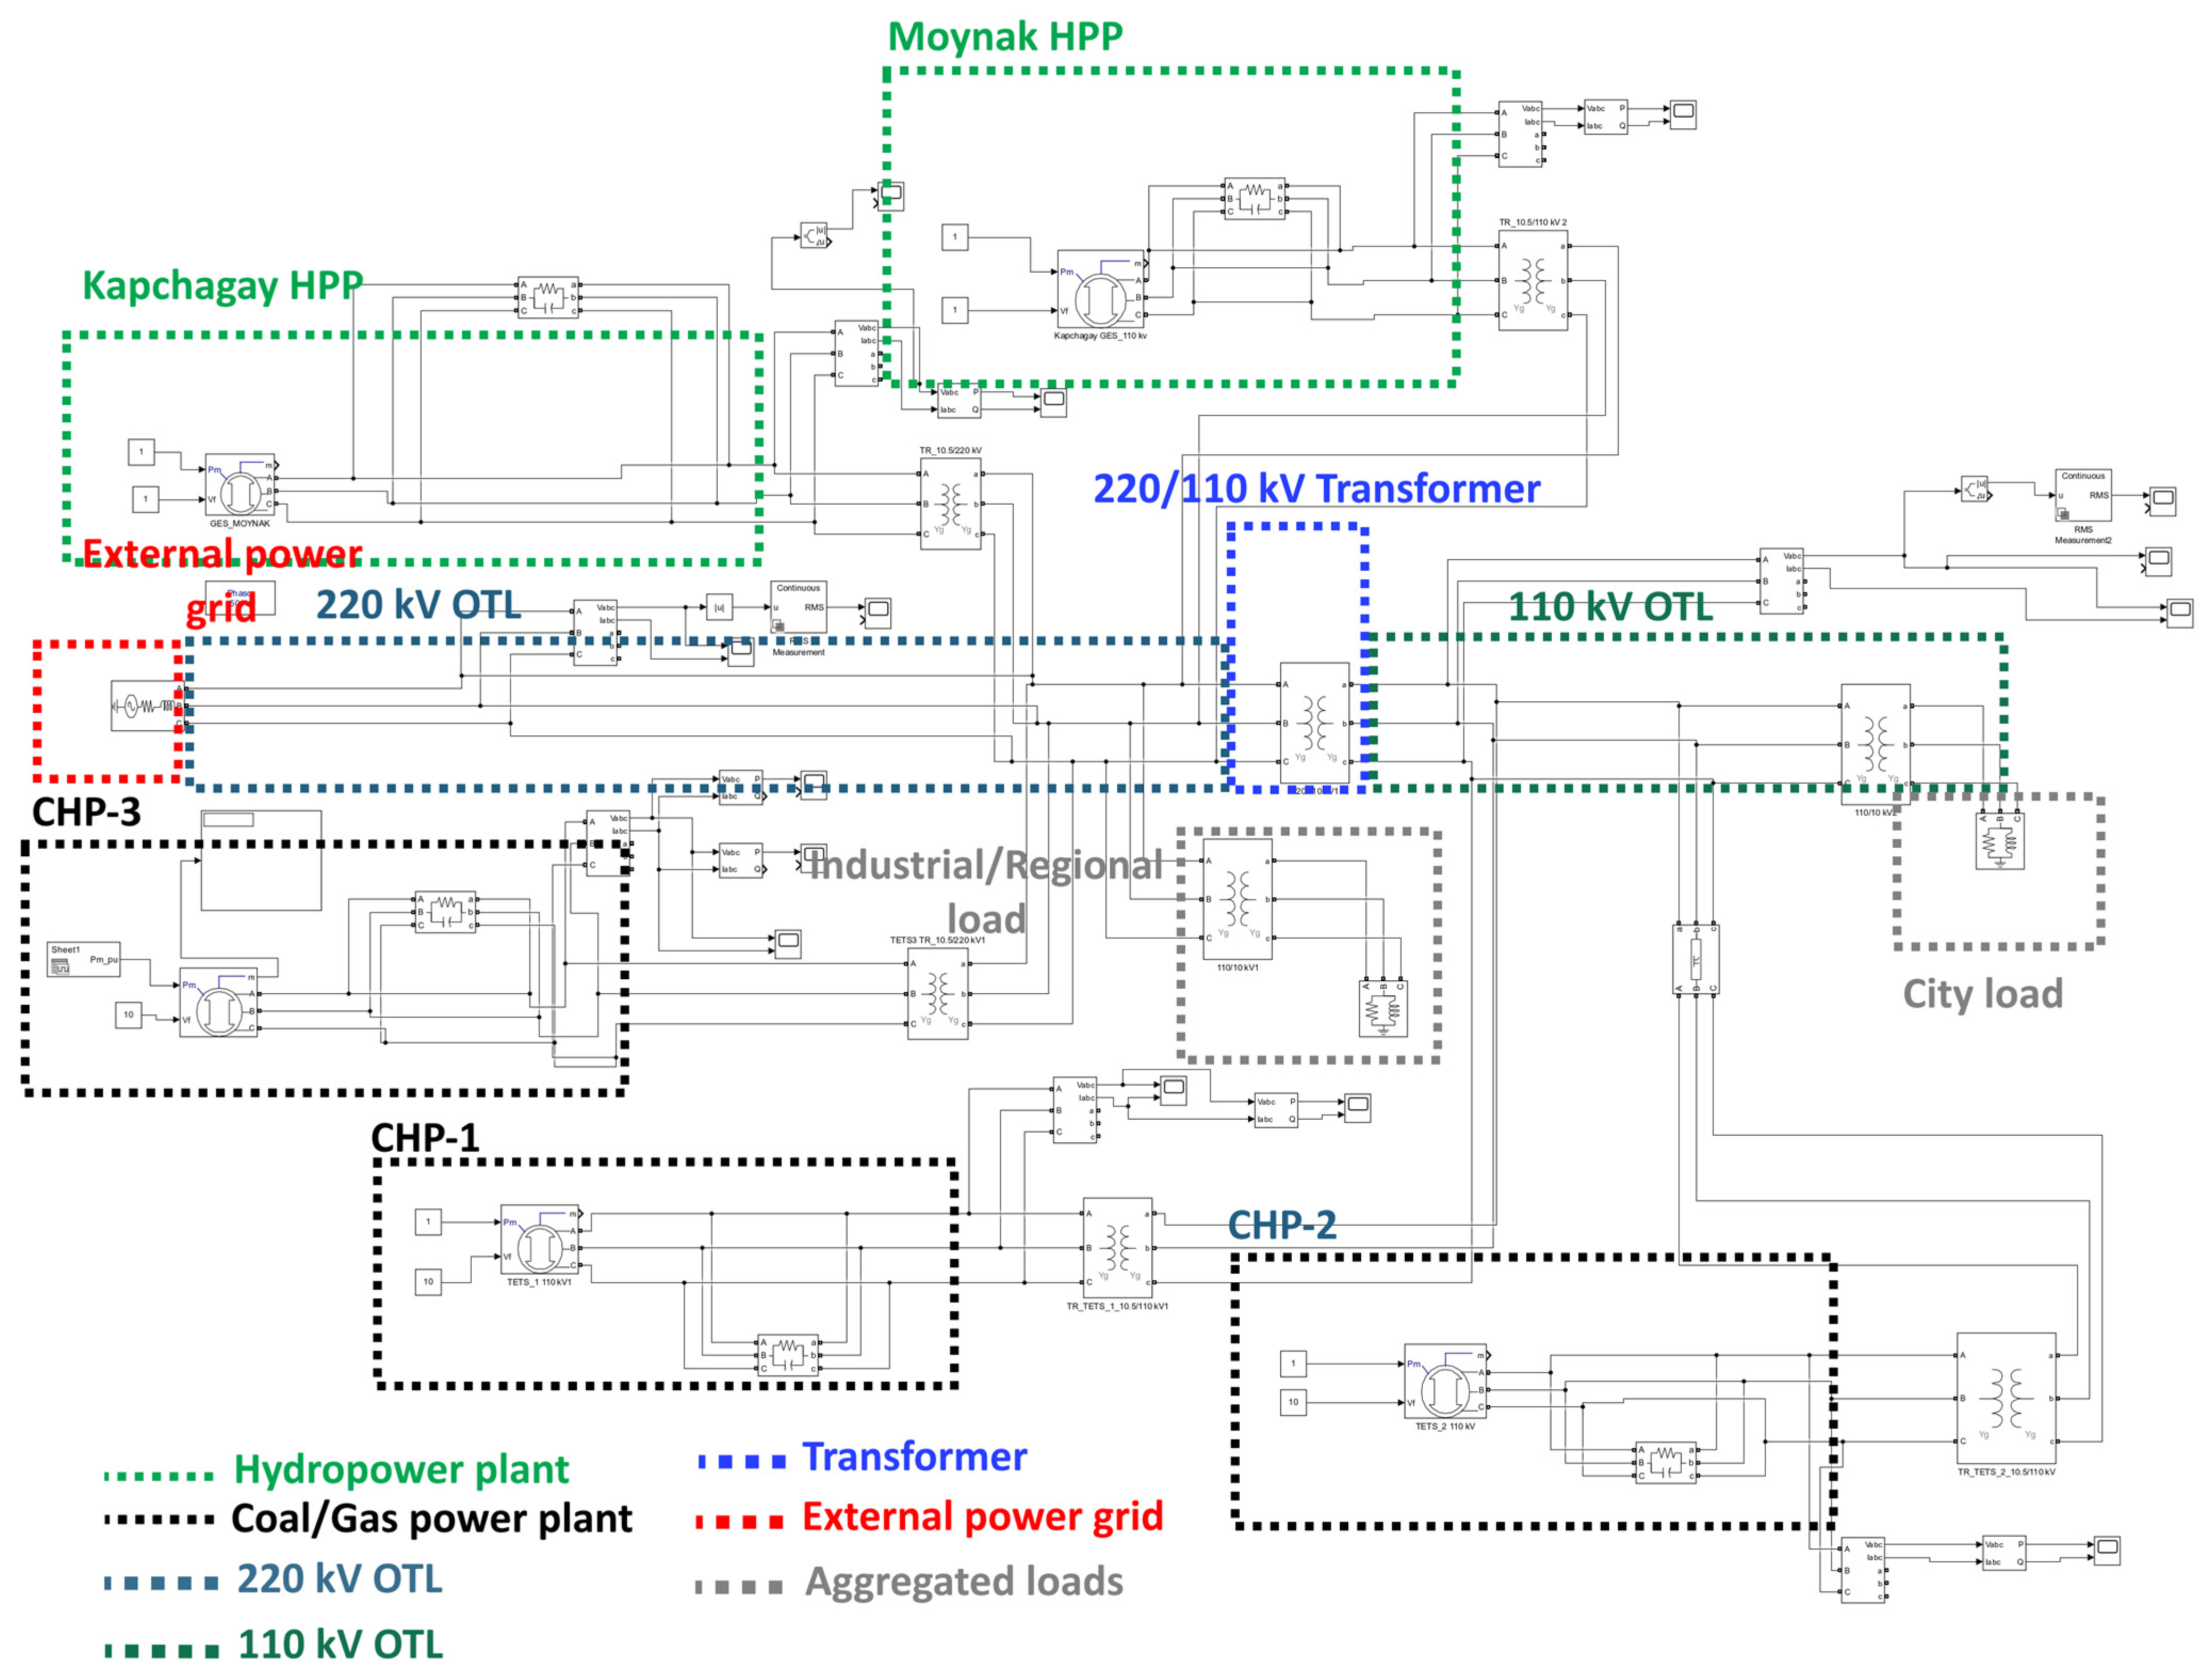
Figure 3 presents the Simulink-based model of the Almaty power hub. As shown in the figure, the diagram includes the main power plants, transformers, and transmission lines of the studied system. The 220 kV and 110 kV networks form the central part of the model. The thermal power plants (CHP-1, CHP-2, and CHP-3) are represented as synchronous generators connected to the 110 or 220 kV buses through step-up transformers. Prior to the initiation of start-up processes, the generators operate in steady-state conditions, while their active power output varies according to the specified start-up and load ramping scenarios.
Figure 3.
Simulink model of the Almaty power system hub including major thermal and hydropower plants, 110/220 kV overhead transmission lines, transformers, and aggregated loads.
The Kapchagay and Moinak hydropower plants are also modeled as synchronous generators. Within the considered scenarios, they operate at partial load, reflecting real operating conditions imposed by hydrological and dispatch constraints. In this way, these units are treated as background generation sources. Power transmission between the nodes is carried out via 110 and 220 kV overhead transmission lines, modeled as three-phase line elements with constant parameters. The coupling between the 110 and 220 kV voltage levels is provided by a 220/110 kV power transformer, whose parameters remain unchanged across all simulation scenarios.
Electric loads are represented as aggregated constant-power PQ loads. The load structure includes:
- -
- urban load connected to the 110 kV network;
- -
- regional and industrial loads representing electricity consumption of adjacent areas and industrial consumers.
Load levels are kept constant in all simulation scenarios in order to eliminate the influence of demand variations and to focus the analysis exclusively on the impact of generator start-up and ramping processes. Power quality indicators are evaluated by monitoring RMS voltage values at selected nodes in the 110 and 220 kV networks. Voltage deviations are analyzed during generator start-up and the subsequent stabilization period. Fast electromagnetic transients are not considered in this study.
The external power system is represented by an equivalent three-phase source with finite internal impedance connected to the 110/220 kV network through transmission lines and transformers. This representation allows the effective grid strength and short-circuit characteristics of the surrounding power system to be taken into account in the voltage dynamics analysis.
The synchronous generator is represented using a standard electromechanical model operating in the phasor domain. Active power during start-up is controlled through a prescribed mechanical power input Pm, defined as a deterministic ramp function with a constant rate of change. This approach represents the action of the turbine governor (GOV) in an aggregated form and allows direct control of the start-up ramp rate without explicit modeling of governor dynamics.
Voltage magnitude and reactive power behavior are regulated by a simplified excitation system, where the automatic voltage regulator (AVR) is represented by an external excitation voltage input maintaining the generator terminal voltage.
This modeling approach enables isolation of the impact of the start-up ramp rate on voltage dynamics while avoiding additional uncertainty related to detailed controller tuning.
RMS-based voltage measurements are employed, which makes the model suitable for power quality assessment in accordance with GOST 32144-2013 [1]. Fast electromagnetic transients are not considered, since the focus of the study is on slow voltage variations associated with power ramping during start-up. Such voltage dynamics occur on electromechanical time scales and are adequately captured by phasor-domain modeling and RMS analysis. Phenomena related to sub-cycle switching transients, high-frequency waveform distortions, and detailed electromagnetic interactions require electromagnetic transient (EMT) models and are outside the scope of the present work. The selected approach allows a clear assessment of voltage magnitude behavior and stabilization time at the transmission and subtransmission levels, which is consistent with the objectives of the study. The main parameters of the network, transformers, and load model used in the simulations are summarized in Table 2.
Table 2.
Network and transformer parameters of the 110/220 kV node.
Table 3 presents the residential electricity loads of the city, as well as the industrial loads of both the city and the surrounding region. According to official statistics, the annual electricity consumption of the region is approximately 480 million kWh, while peak demand during winter periods may exceed 1000 MW. In this study, the analysis is performed for calculated baseline operating conditions of the power system rather than for extreme peak load scenarios. Reactive power is determined assuming a typical power factor of approximately 0.9.
Table 3.
Aggregated electrical loads used in the simulation model.
Table 4 summarizes the structure of the developed MATLAB/Simulink model, including the implemented components, modeling domains (RMS/phasor), and the key assumptions adopted for the simulation study.
Table 4.
Summary of the Simulink modeling framework and assumptions.
Voltage deviations occurring during station start-up operations were selected as the main parameter for analysis. According to GOST [1], the following formula was used for voltage analysis:
where U(t) is the RMS voltage at the corresponding node, and Unom is the nominal phase voltage.
A binary admissibility function was then defined:
where .
The stabilization index was calculated as the fraction of admissible voltage values within a moving time window of 5 s:
Window length:
At the modeling step s:
Moving average of acceptability:
where N—the number of samples within the window.
The moment of stabilization is defined as:
where —criterion of 80% of the time in the acceptable range.
The stabilization time was evaluated using a 5 s sliding RMS window. This choice is aligned with IEC 61000-4-11 [30] and IEEE 1564 [31], where voltage events exceeding 5 s are treated as sustained deviations rather than short-duration sags, making this time scale appropriate for power quality assessment.
Voltage in the model is measured as RMS phase voltage values. For the 220 kV network, a nominal phase voltage of 127 kV is used as the reference value for calculating voltage deviations, while for the 110 kV network, a nominal phase voltage of 63 kV is adopted.
Table 5 summarizes the start-up scenarios considered for the analyzed power plants. At present, a 173 MW coal-fired power plant is in operation at the site. Reconstruction of the facility is currently underway, involving the construction of a new combined-cycle unit [32,33], while the cooling tower of the existing plant is planned to remain in service. To assess the potential impact of future development, a prospective 560 MW power plant equipped with a fuel afterburning system is also included in the analysis.
Table 5.
Startup scenarios.
A joint voltage–frequency stability index was introduced to account for the coupled behavior of voltage and frequency during generator start-upA:
where, and are normalized voltage and frequency deviations;
—is the instantaneous voltage–frequency correlation coefficient;
is a weighting factor accounting for coupling strength (set to 0.25 in this study).
Normalized voltage deviations:
Normalized frequency deviations:
Frequency and voltage deviations was normalized using Δfamd = ±2 Hz and ΔUamd = ±5% (0.05 p.u.). Although frequency is explicitly included in the index formulation, its contribution remains limited in this study because a phasor-domain generator model was used, in which system frequency is regulated and remains close to nominal during start-up. The proposed index therefore primarily reflects voltage dynamics while preserving generality for future EMT-based or weak-grid analyses.
2.3. Model Validation
Model validation was carried out by verifying the steady-state operating conditions prior to the initiation of generator start-up processes. Voltage levels at the 110 and 220 kV nodes were confirmed to remain within acceptable limits in accordance with GOST 32144-2013. Power balance between generation and load was maintained under the base operating conditions. The resulting voltage profiles and system response are consistent with typical operating characteristics of transmission networks at comparable voltage levels.
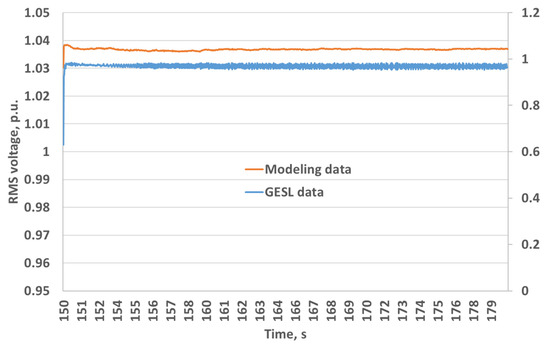
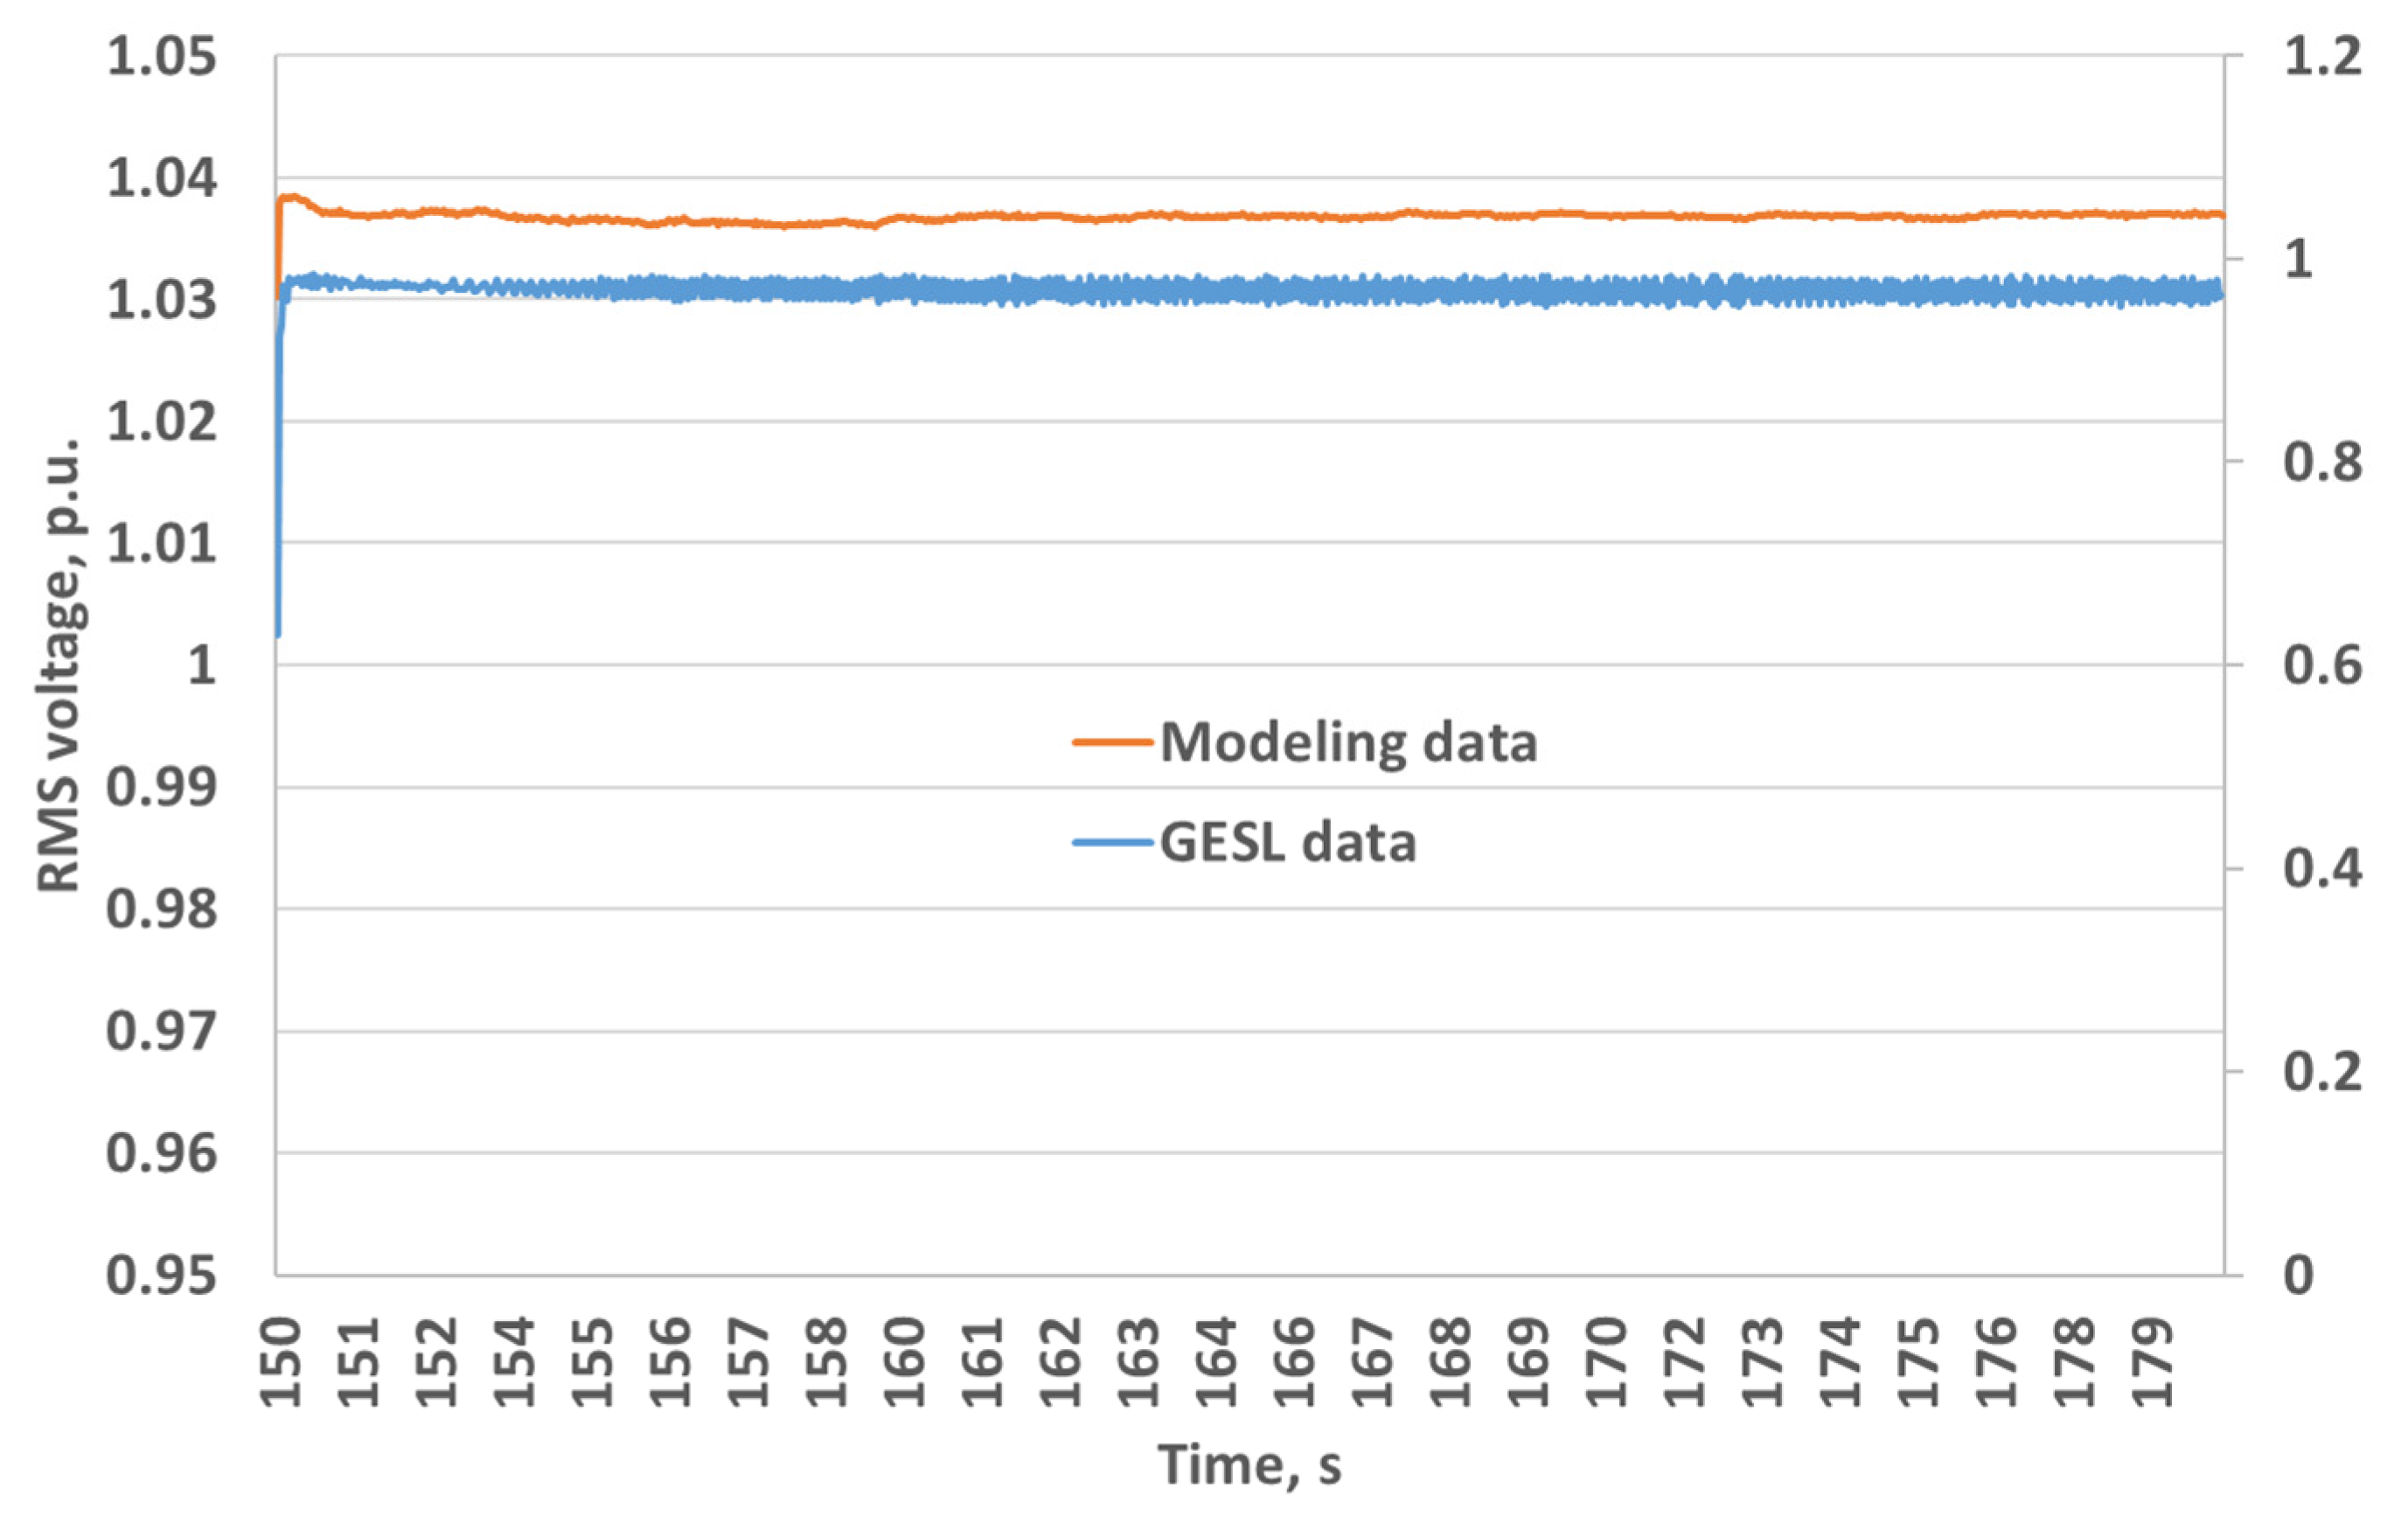
Figure 4 compares the modeled voltage response with publicly available PMU measurements from the GESL database [34]. Due to the lack of detailed information on generator control parameters and network configuration, the validation focuses on the similarity of the dynamic voltage behavior rather than point-by-point matching. The results demonstrate a comparable transient response and steady-state voltage level following generator start-up, confirming the adequacy of the proposed modeling approach for power quality assessment.
Figure 4.
Modeled versus PMU-based voltage magnitude during generator start-up [30], illustrating similar transient and steady-state behavior.
3. Results
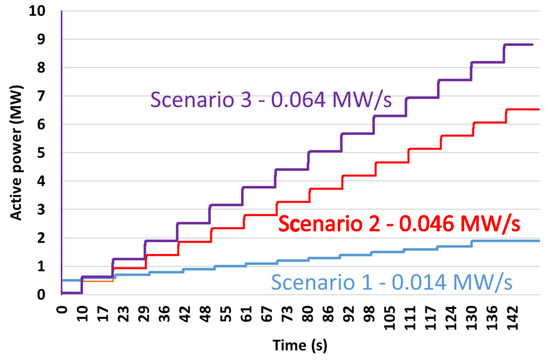
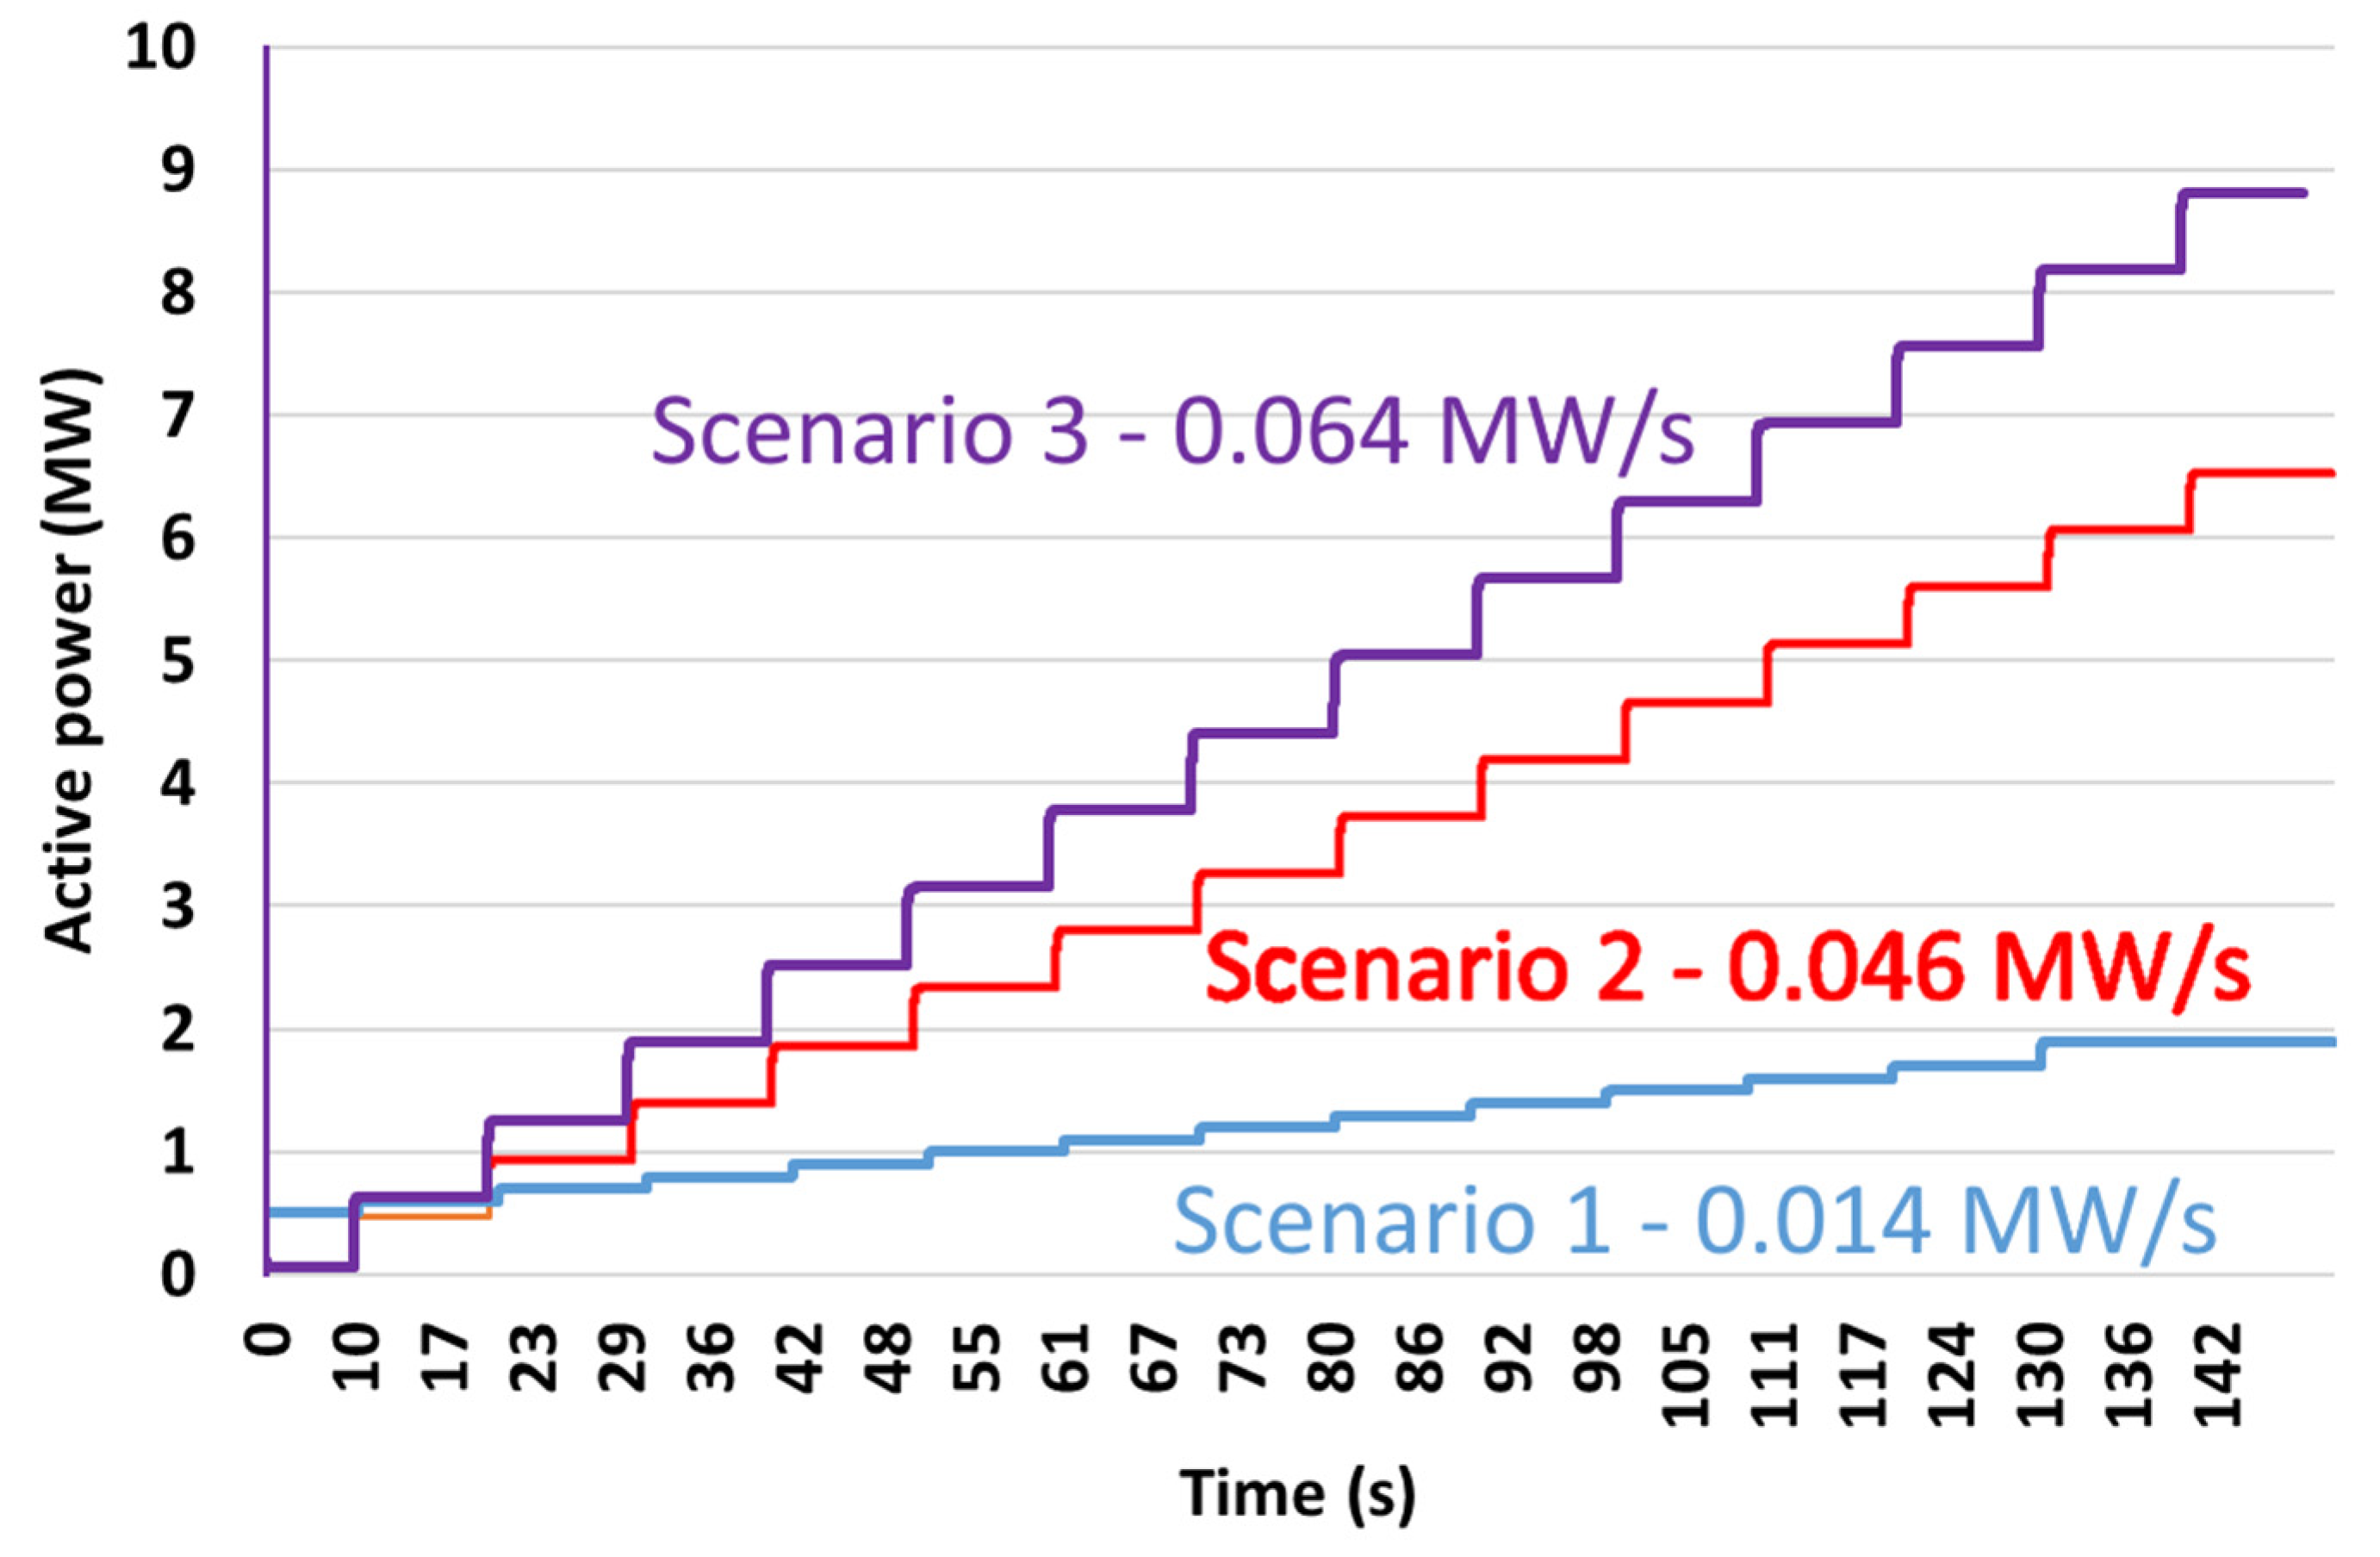
Figure 5 illustrates the active power ramp profiles for the three start-up scenarios considered in this study. As shown in the figure, the slowest increase in active power corresponds to Scenario 1, which represents the start-up of a conventional combined heat and power (CHP) plant with relatively low installed capacity and a prolonged start-up process associated with the steam power unit.
Figure 5.
Active power ramp profiles during start-up for three generation scenarios with different ramp rates.
Scenario 2 demonstrates a ramp rate of 0.046 MW/s, which corresponds to approximately 2–3 MW/min. This value is consistent with typical start-up ramp rates reported in the literature for combined-cycle power plants [35]. Scenario 3 represents the start-up of a combined-cycle gas turbine unit with afterburning. Although the steam turbine is connected at a later stage of the start-up process, the higher total installed capacity results in a significantly increased power ramp rate, reaching approximately 3.84 MW/min. According to [36], the application of afterburning in combined-cycle plants typically leads to a capacity increase of 5–15%; therefore, the installed capacity in this scenario was assumed to be 560 MW.
Voltage Dynamics During Station Start-Up at the 220 kV Network
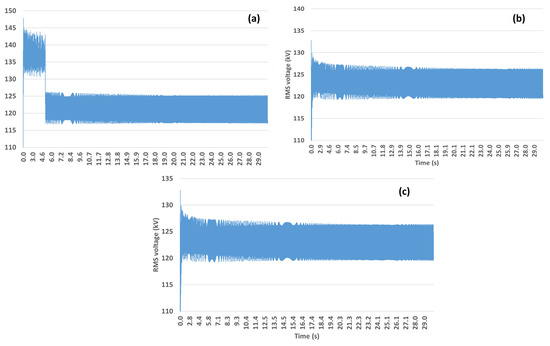
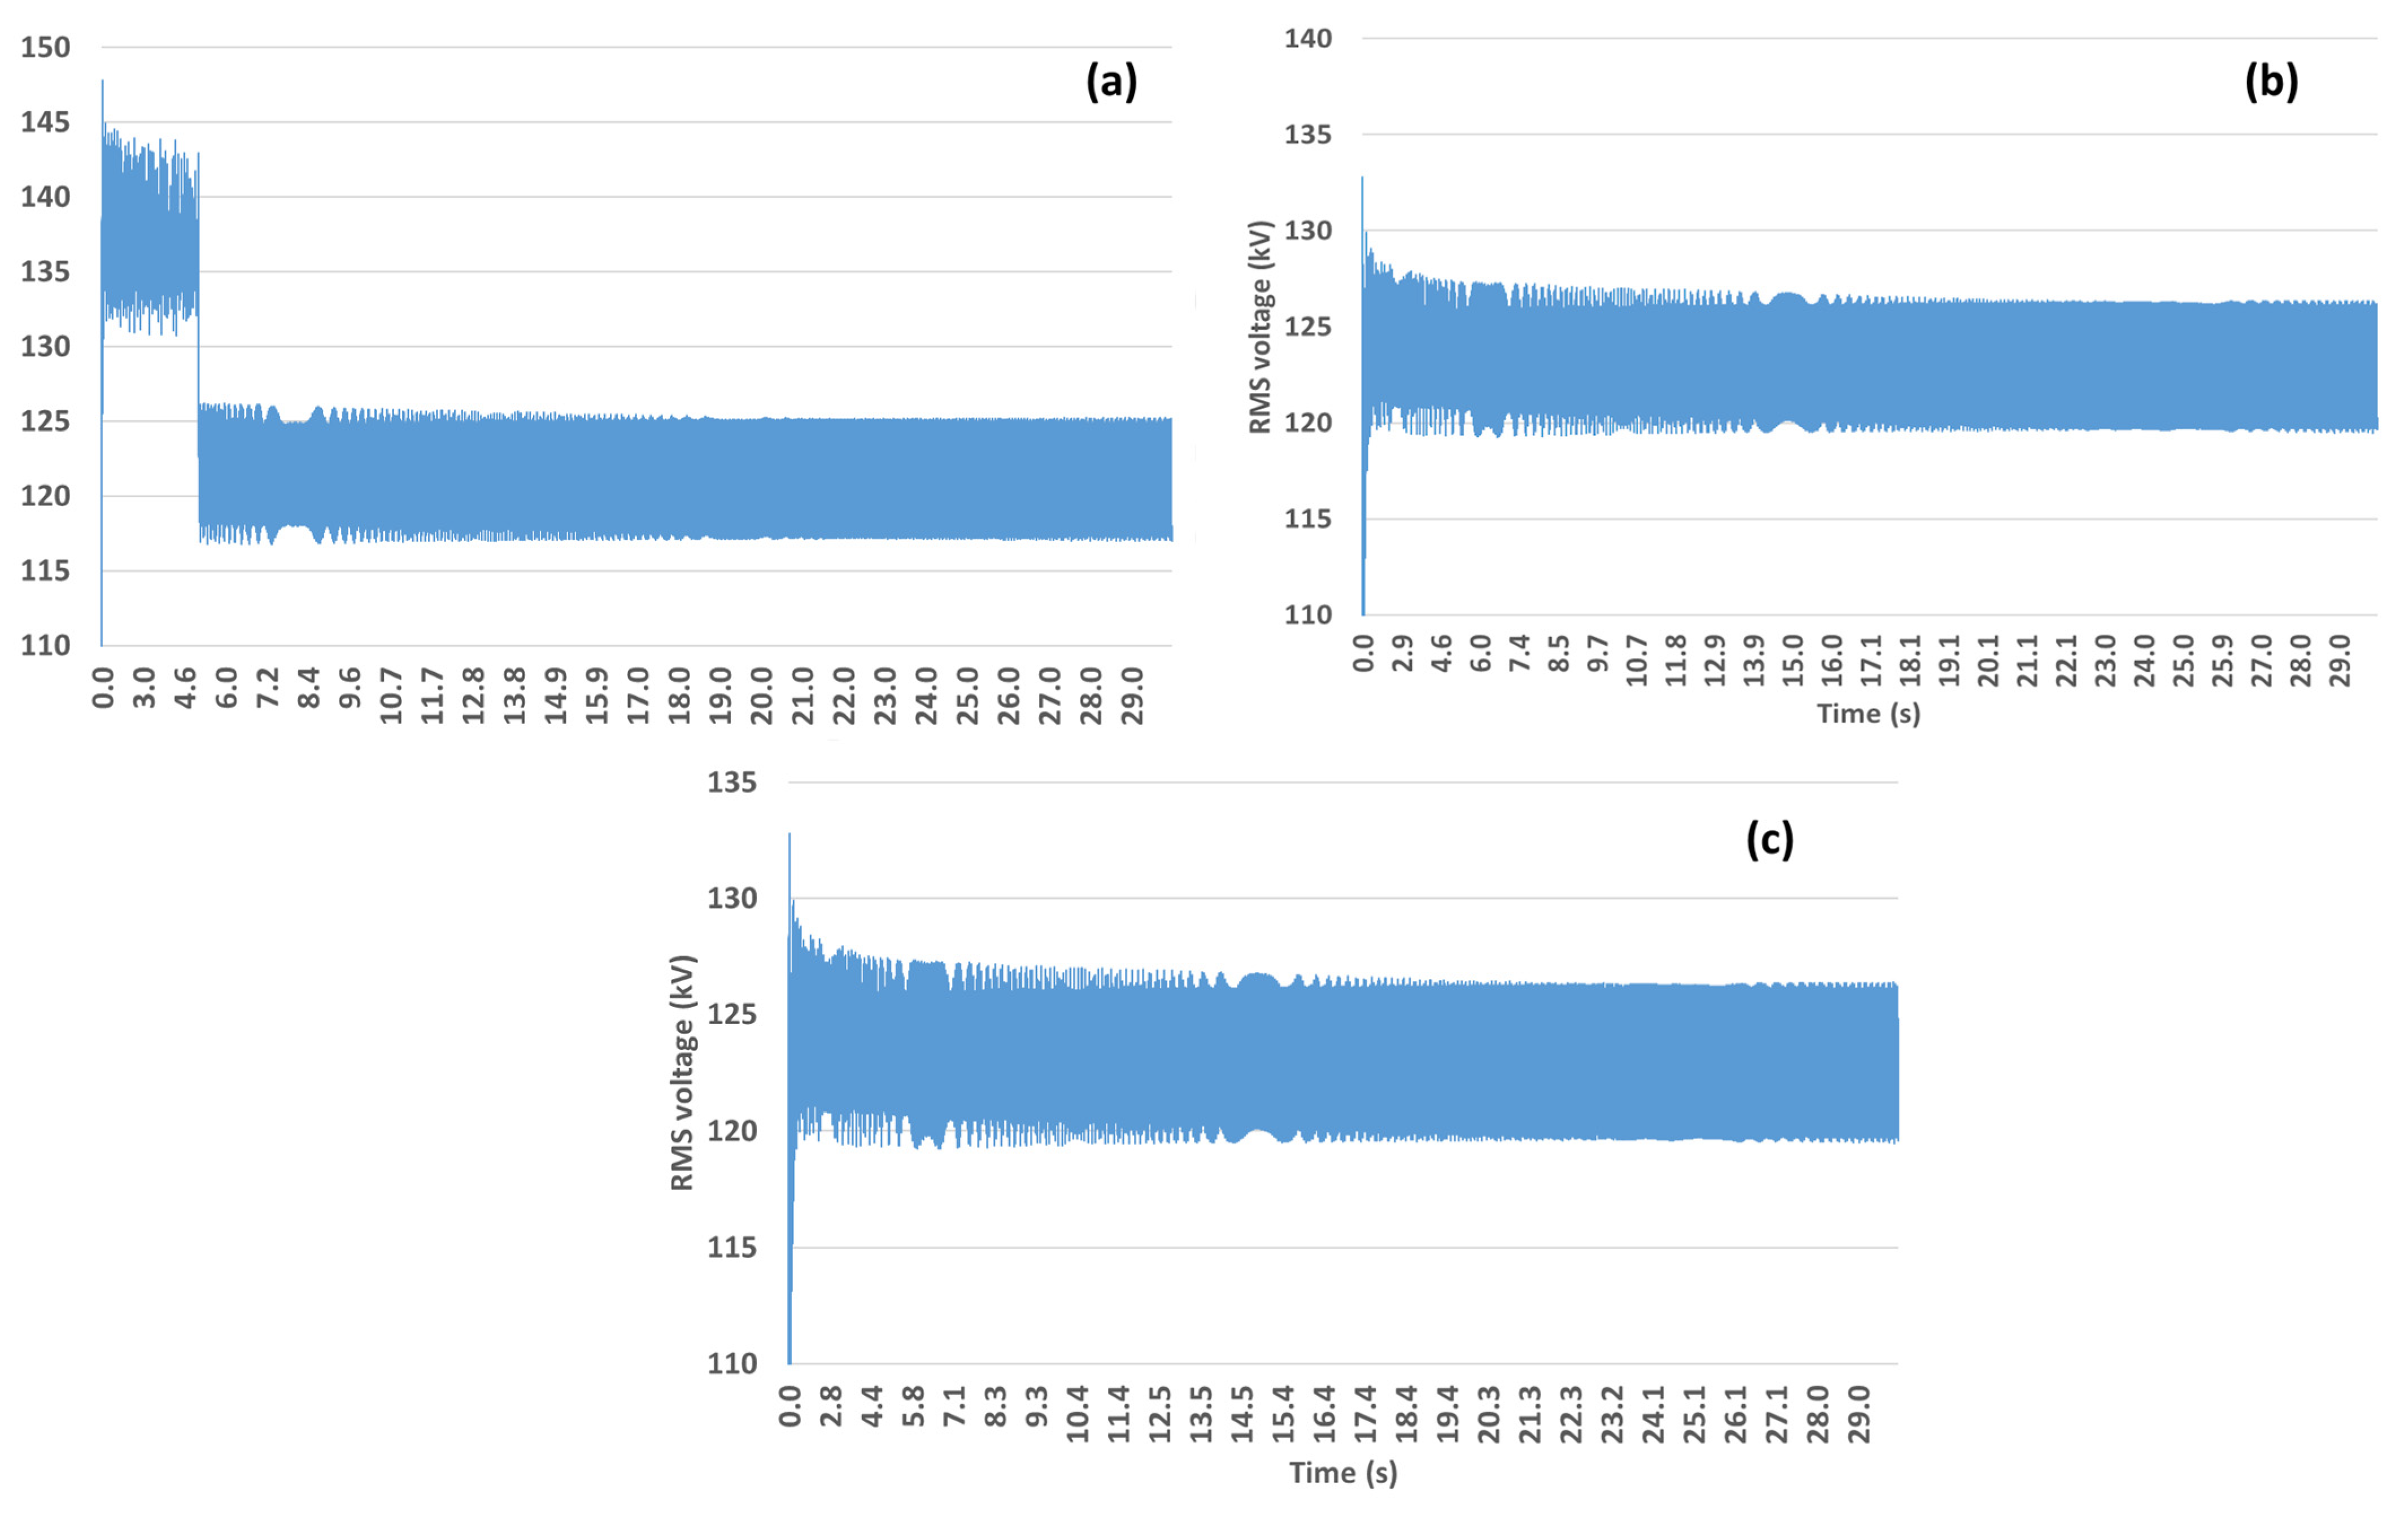
Figure 6 presents the RMS voltage profiles at the 220 kV transmission level during power plant start-up for the three considered scenarios. In Scenario 1, pronounced voltage fluctuations are observed during the initial seconds of the start-up process. The maximum voltage reaches 142.97 kV, while extremely low voltage values are recorded at the very beginning of the simulation. To exclude numerical transients and ensure a correct interpretation of steady voltage behavior, minimum voltage values were evaluated starting from 5 s after the initiation of the start-up process. Under this condition, the minimum voltage level is equal to 116.7 kV. The nominal operating voltage is reached relatively quickly during the early stage of the start-up.
Figure 6.
RMS phase voltage at the 220 kV network node during station start-up for different generation scenarios: (a) Scenario S1—existing combined heat and power plant; (b) Scenario S2—combined-cycle power plant with rated electrical power of 504 MW; (c) Scenario S3—combined-cycle power plant with afterburning (560 MW).
For Scenario 2, noticeably smoother voltage behavior is observed. The maximum voltage during start-up reaches 137.7 kV, while the minimum voltage remains at 119.2 kV. Compared to Scenario 1, the system reaches the nominal operating regime significantly faster, indicating improved voltage stability during the start-up process.
Scenario 3 exhibits voltage profiles similar to those observed in Scenario 2, with no pronounced additional voltage deviations. Despite the higher installed capacity, the start-up characteristics of the combined-cycle plant with afterburning do not result in increased voltage fluctuations at the 220 kV level.
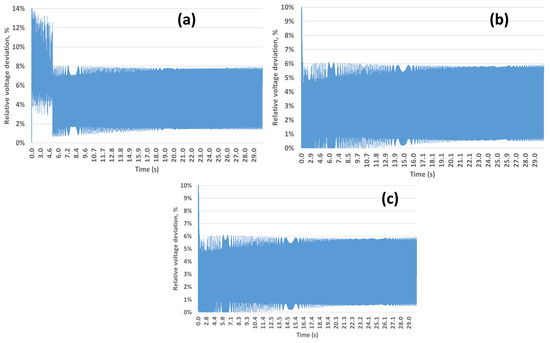
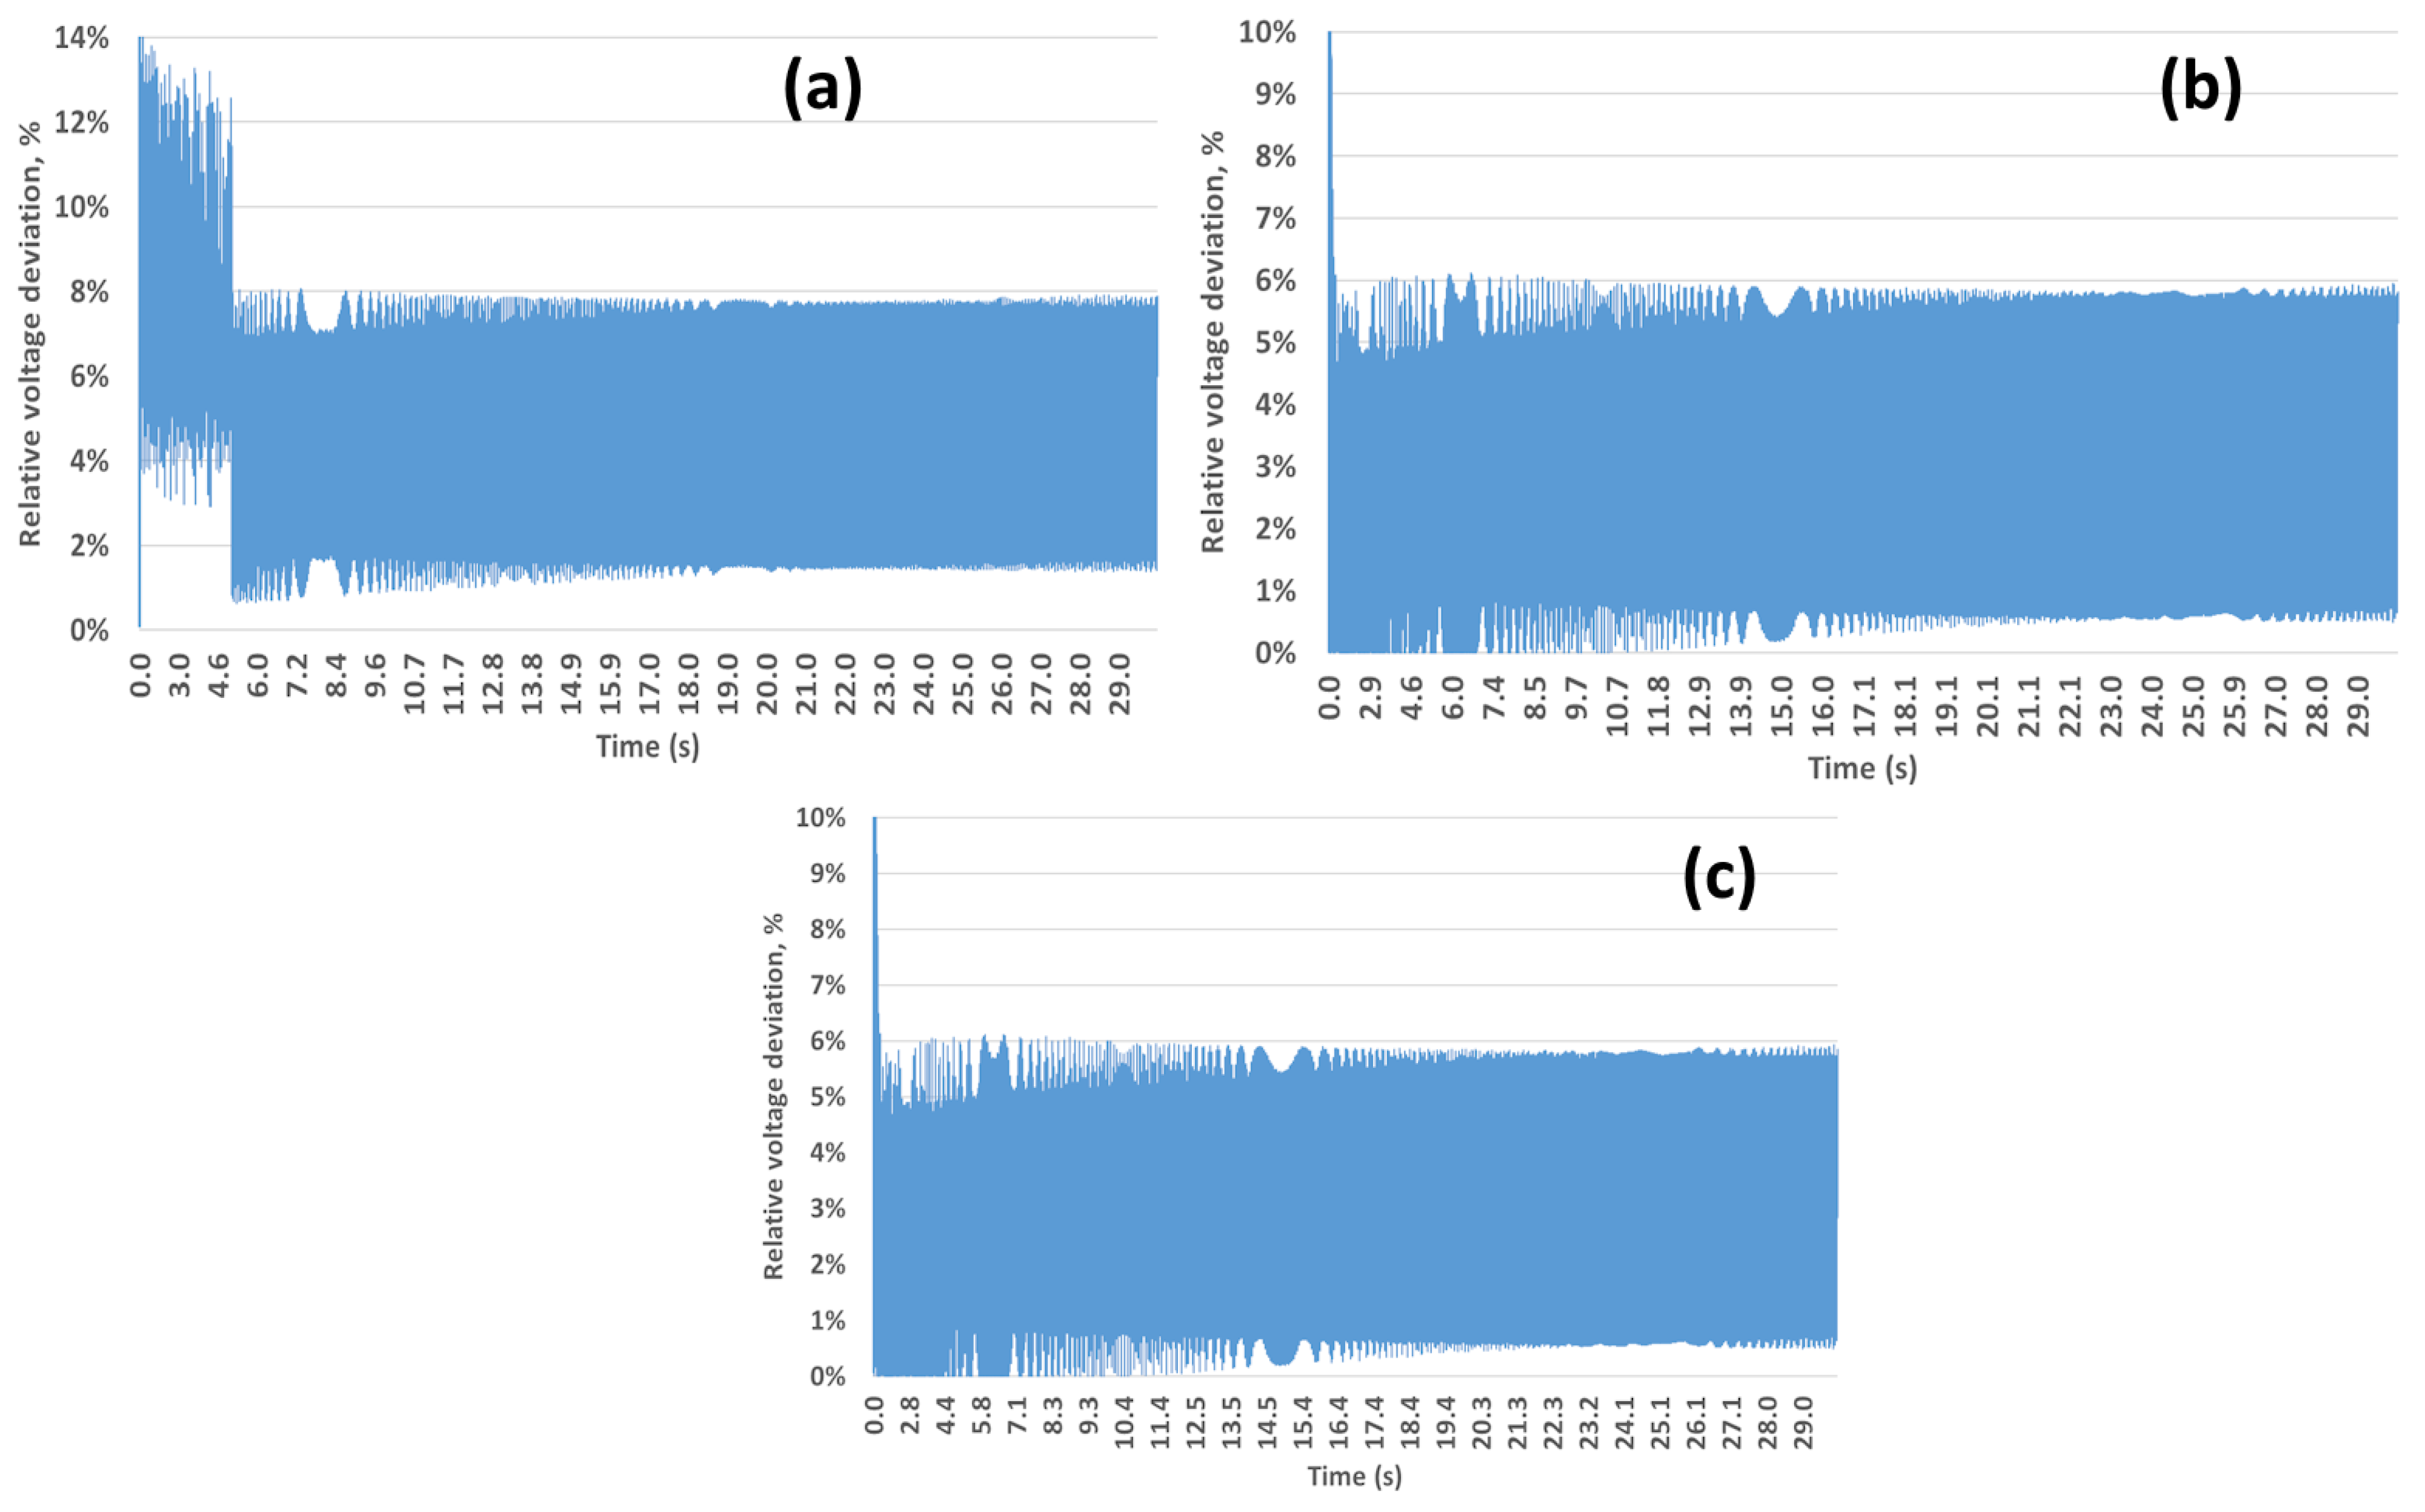
Figure 7 presents the relative voltage deviations for the three considered power plant start-up scenarios. In Scenario 1, short-term spikes in relative voltage deviation of up to 14% are observed at the initial moment of start-up. These peaks are caused by transient processes occurring during the first seconds of generator start-up and are inherently unstable. To ensure an accurate assessment of power quality, further analysis was performed after the completion of the initial transient period.
Figure 7.
Voltage deviations at the 220 kV network node during station start-up for different generation scenarios: (a) Scenario S1—existing combined heat and power plant; (b) Scenario S2—combined-cycle power plant with rated electrical power of 504 MW; (c) Scenario S3—combined-cycle power plant with afterburning (560 MW).
In Scenarios 2 and 3, the maximum relative voltage deviations do not exceed 6%, indicating a smoother start-up process and improved controllability of the combined-cycle gas turbine units.
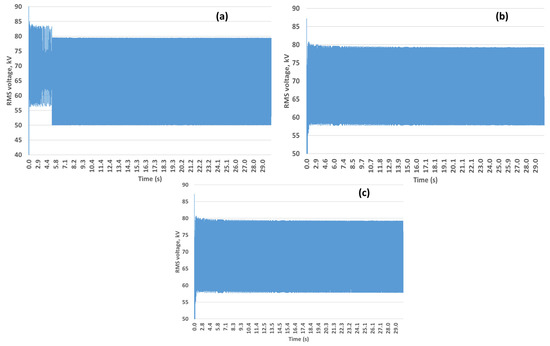
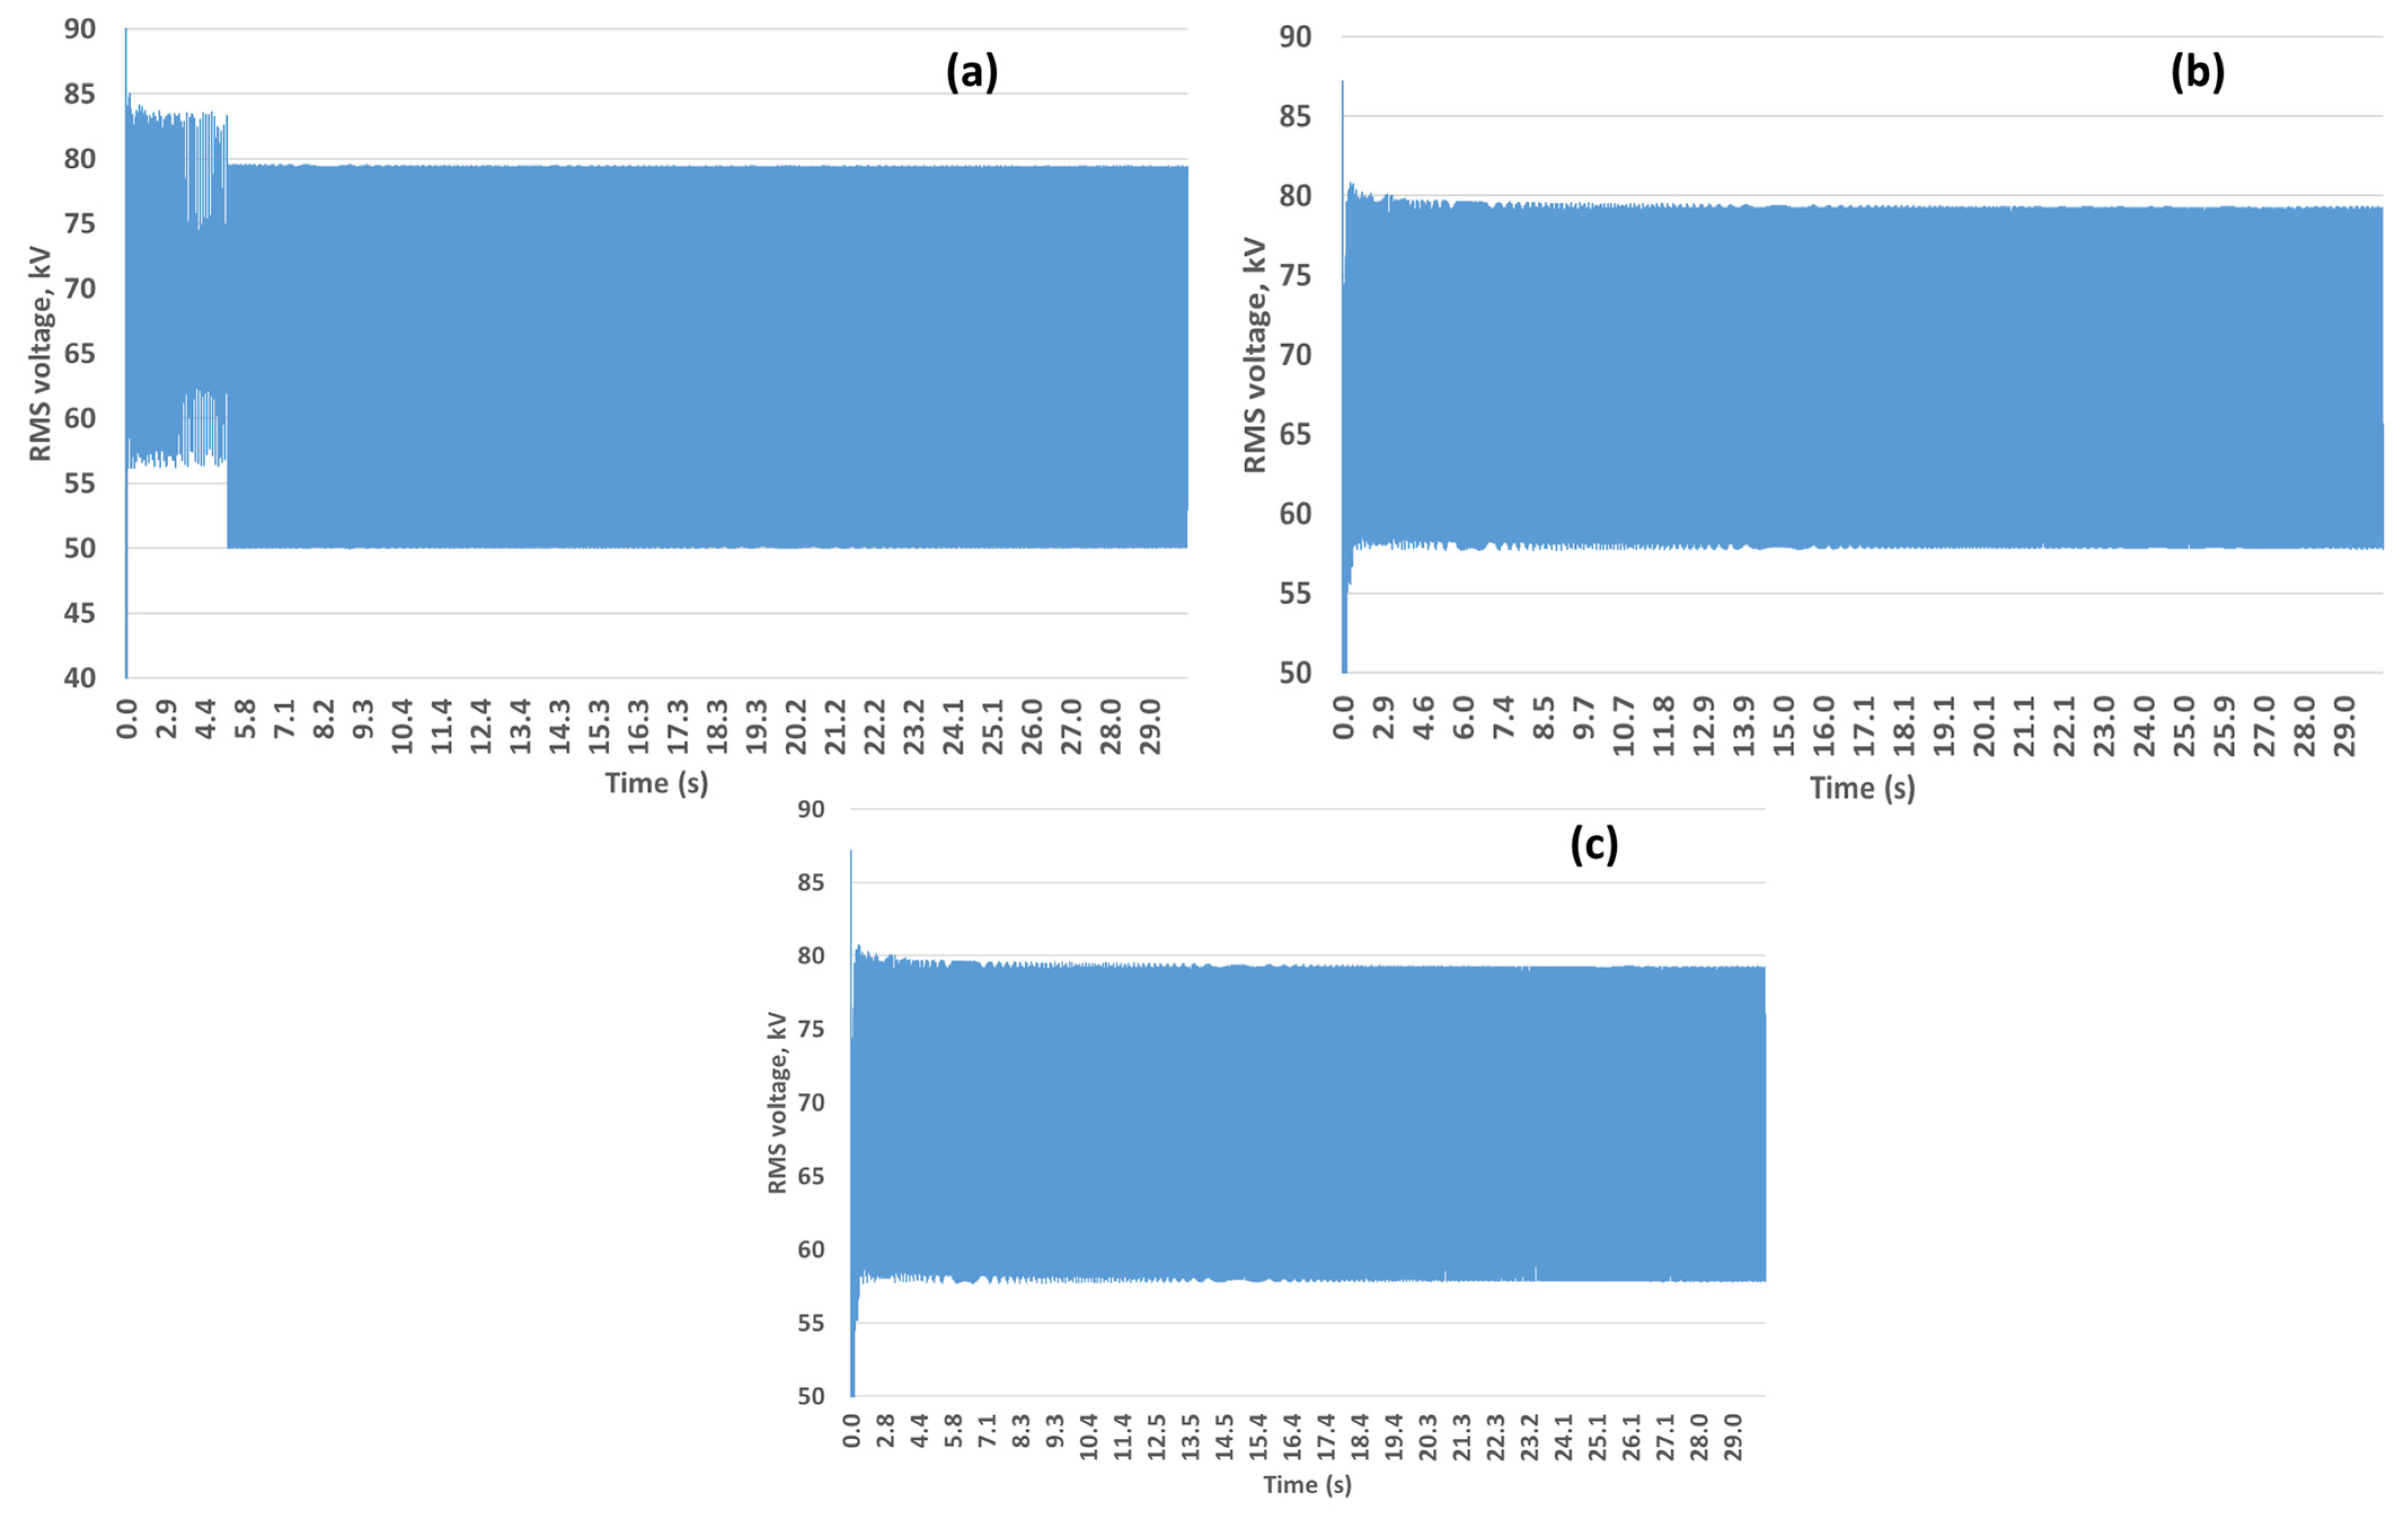
Figure 8 illustrates the RMS voltage profiles at the 110 kV level for all three start-up scenarios. As shown in the figure, Scenario 1 exhibits significant voltage surges during the first seconds of the start-up process, which are particularly pronounced within the initial 0–5 s interval. During this period, both a voltage increase and subsequent decrease are observed, followed by stabilization of the operating mode.
Figure 8.
RMS phase voltage at the 110 kV network node during station start-up for different generation scenarios: (a) Scenario S1—existing combined heat and power plant; (b) Scenario S2—combined-cycle power plant with rated electrical power of 504 MW; (c) Scenario S3—combined-cycle power plant with afterburning (560 MW).
Scenarios 2 and 3 demonstrate similar voltage trends. In the initial seconds, a voltage increase reaching approximately 79 kV and a decrease to about 59 kV are observed, after which the voltage stabilizes. The average RMS voltage value for Scenario 1 is 65.4 kV, whereas for Scenarios 2 and 3, the average values reach approximately 68.9 kV.
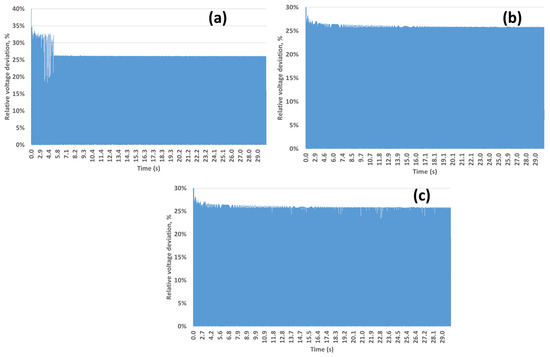
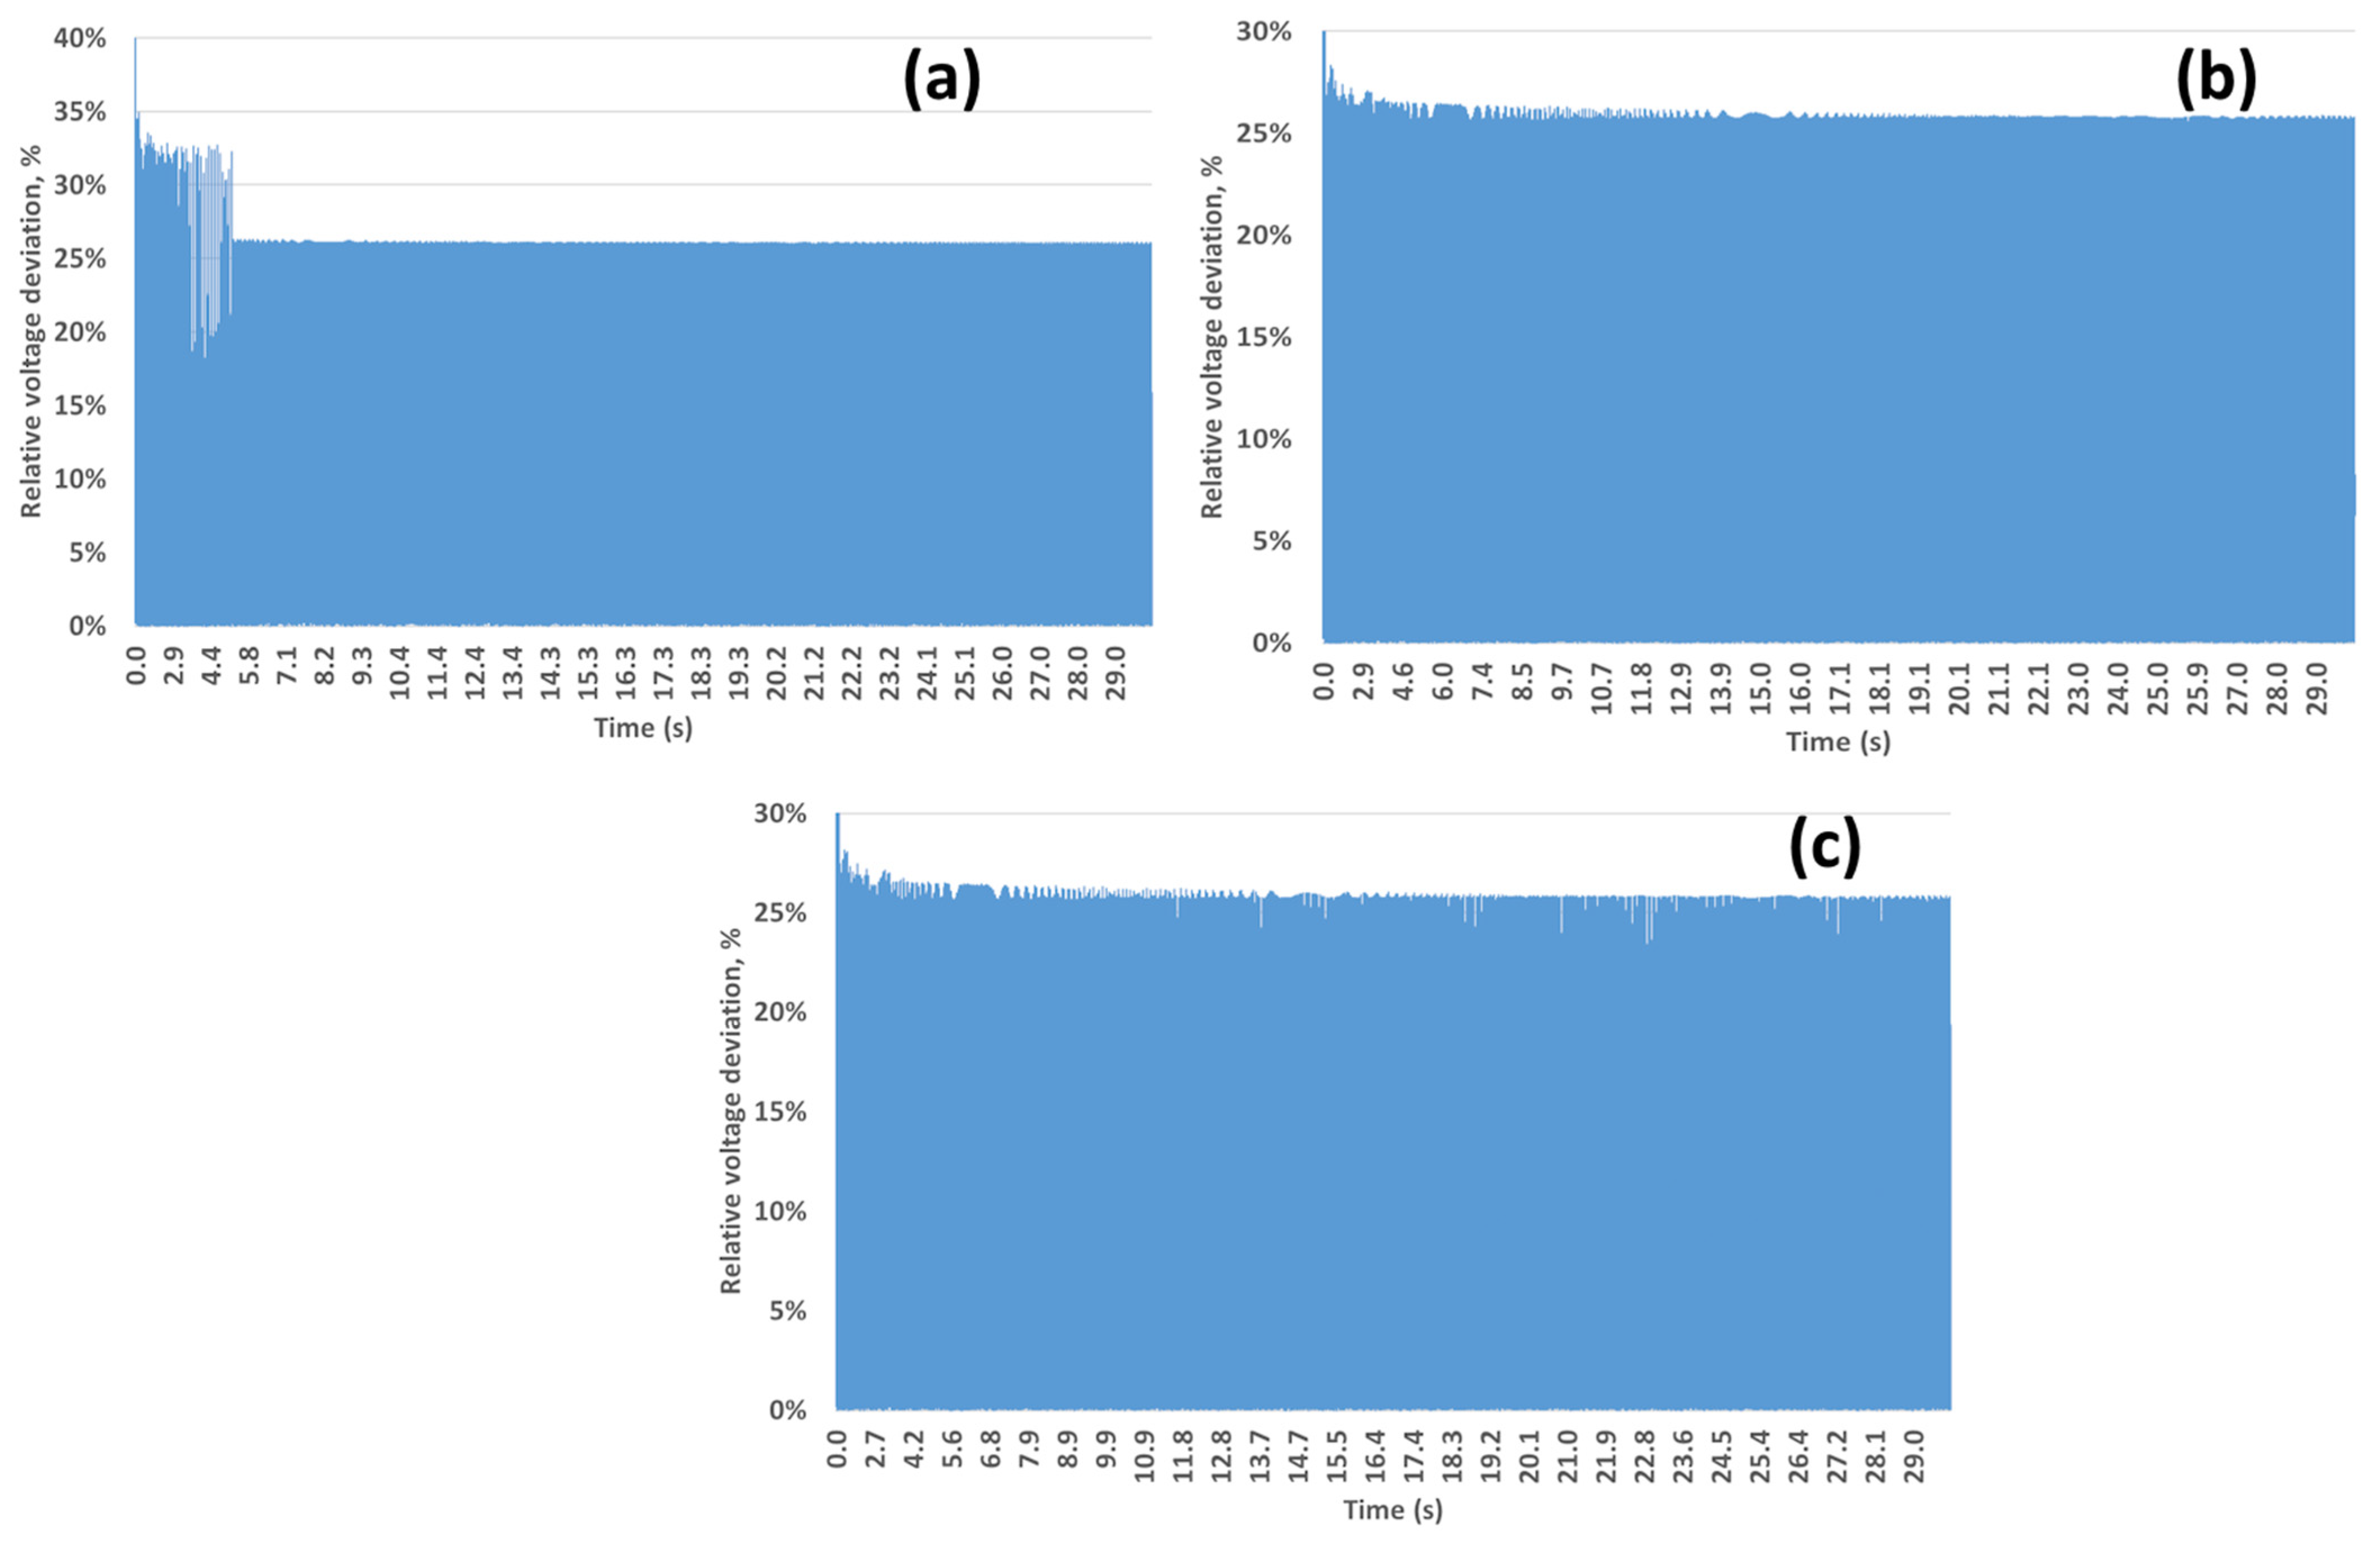
Figure 9 presents the values calculated using Equation (1). The results show that Scenario 1 is characterized by higher voltage surges relative to the nominal value, with the maximum deviation reaching 32%. For Scenarios 2 and 3, the corresponding maximum values reach approximately 26%, indicating improved voltage stabilization during the start-up process. However, as demonstrated in the following analysis, a more stable operating regime can be achieved at lower power levels and reduced ramp rates.
Figure 9.
Voltage deviations at the 110 kV network node during station start-up for different generation scenarios: (a) Scenario S1—existing combined heat and power plant; (b) Scenario S2—combined-cycle power plant with rated electrical power of 504 MW; (c) Scenario S3—combined-cycle power plant with afterburning (560 MW).
It should be noted that the maximum voltage deviations of 26–32% are observed during the initial seconds of start-up and are associated with short-term transient processes. These values are therefore not used for power quality assessment. Subsequent analysis is based on averaged voltage values evaluated after the completion of the initial transient period (t ≥ 5 s).
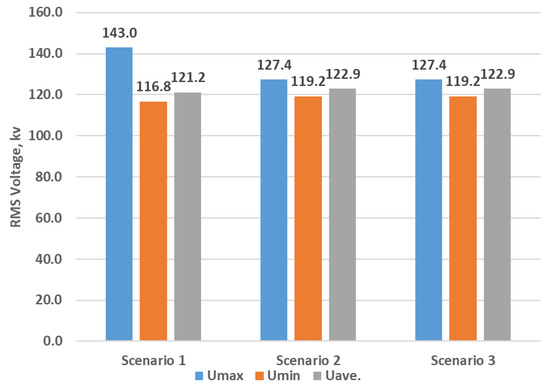
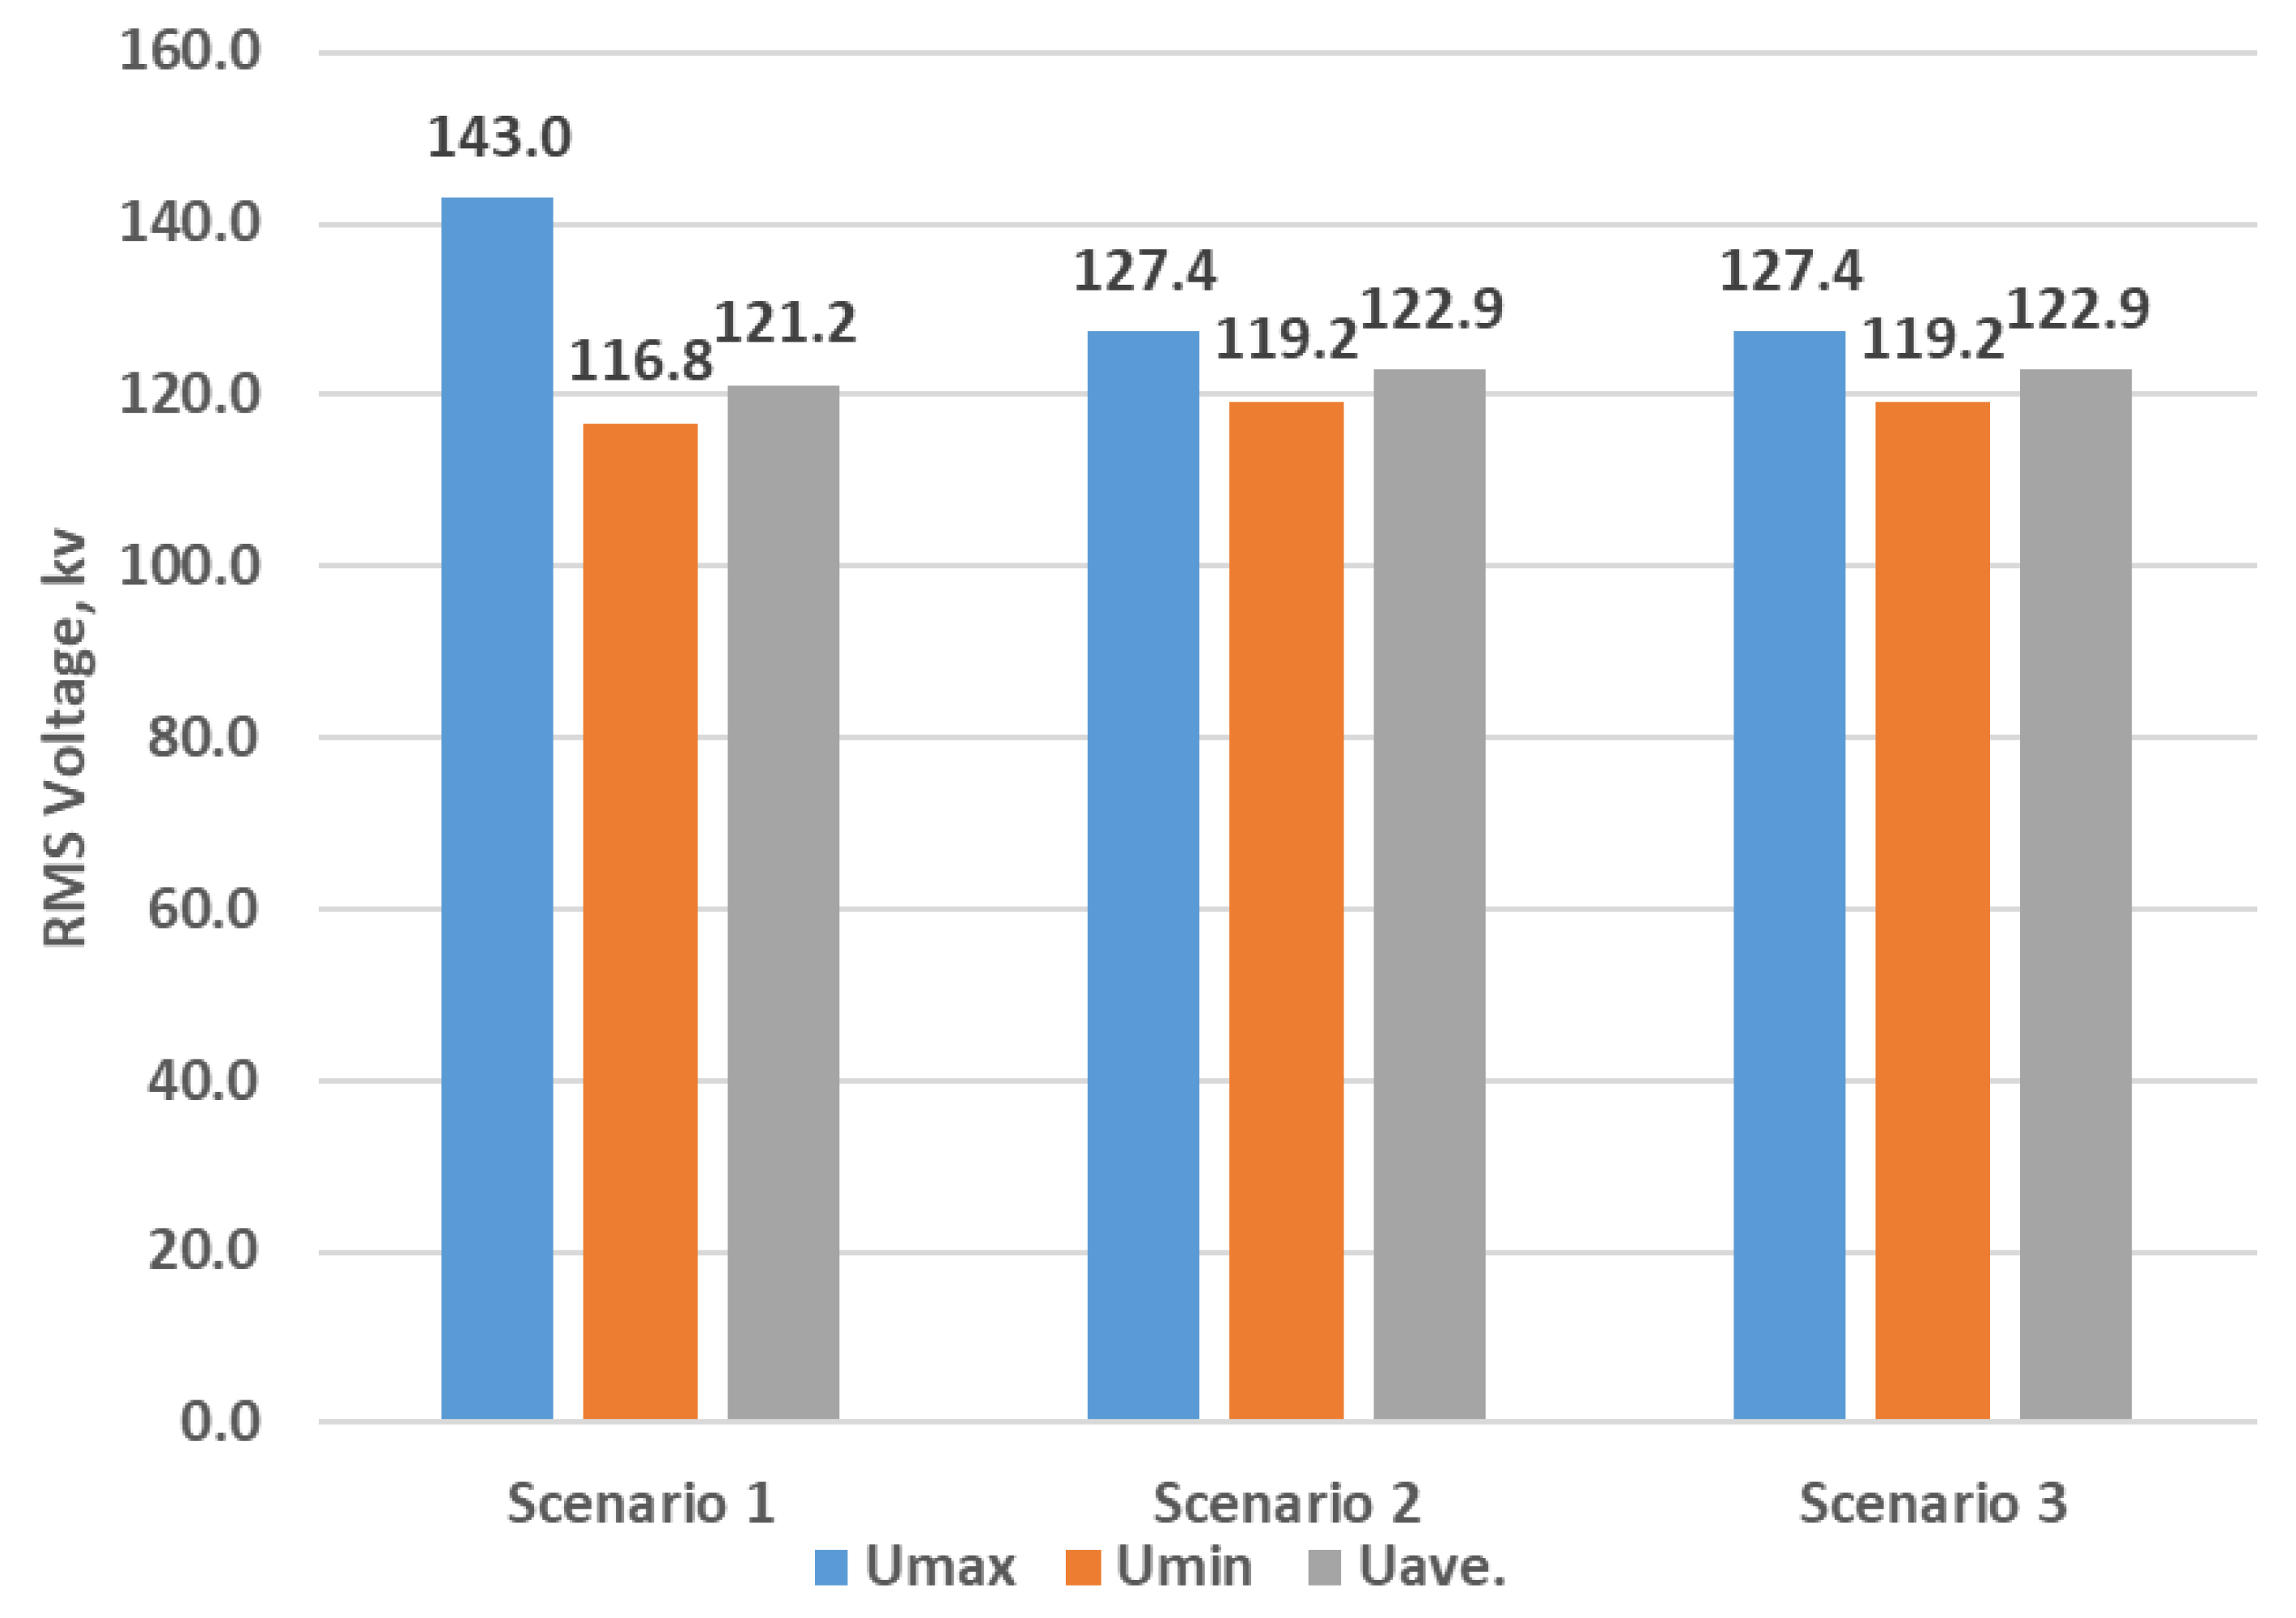
Figure 10 presents the RMS voltage values for all three start-up scenarios. As shown in the figure, Scenario 1 exhibits the highest voltage levels, with maximum values reaching 143 kV. The lowest voltage values are also observed in Scenario 1, with a minimum of 116.8 kV. Consequently, Scenario 1 is characterized by the lowest average voltage level among the considered cases.
Figure 10.
Voltage characteristics for different start-up scenarios (220 kV).
For Scenarios 2 and 3, very similar voltage characteristics are observed. At the 220 kV level, the maximum voltage reaches 127.4 kV, the minimum value is 119.2 kV, and the average voltage is 122.9 kV. Overall, the results indicate that combined-cycle power plants demonstrate more stable voltage behavior in terms of both maximum and minimum RMS voltage values during the start-up process.
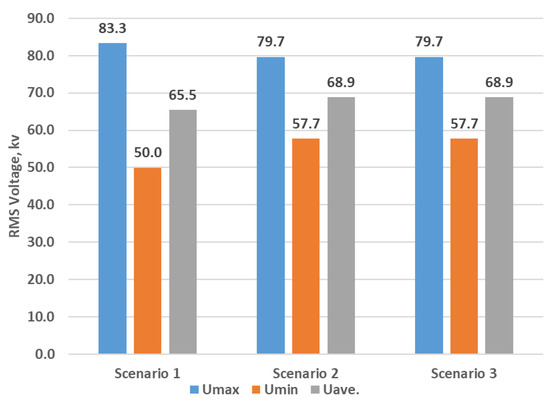
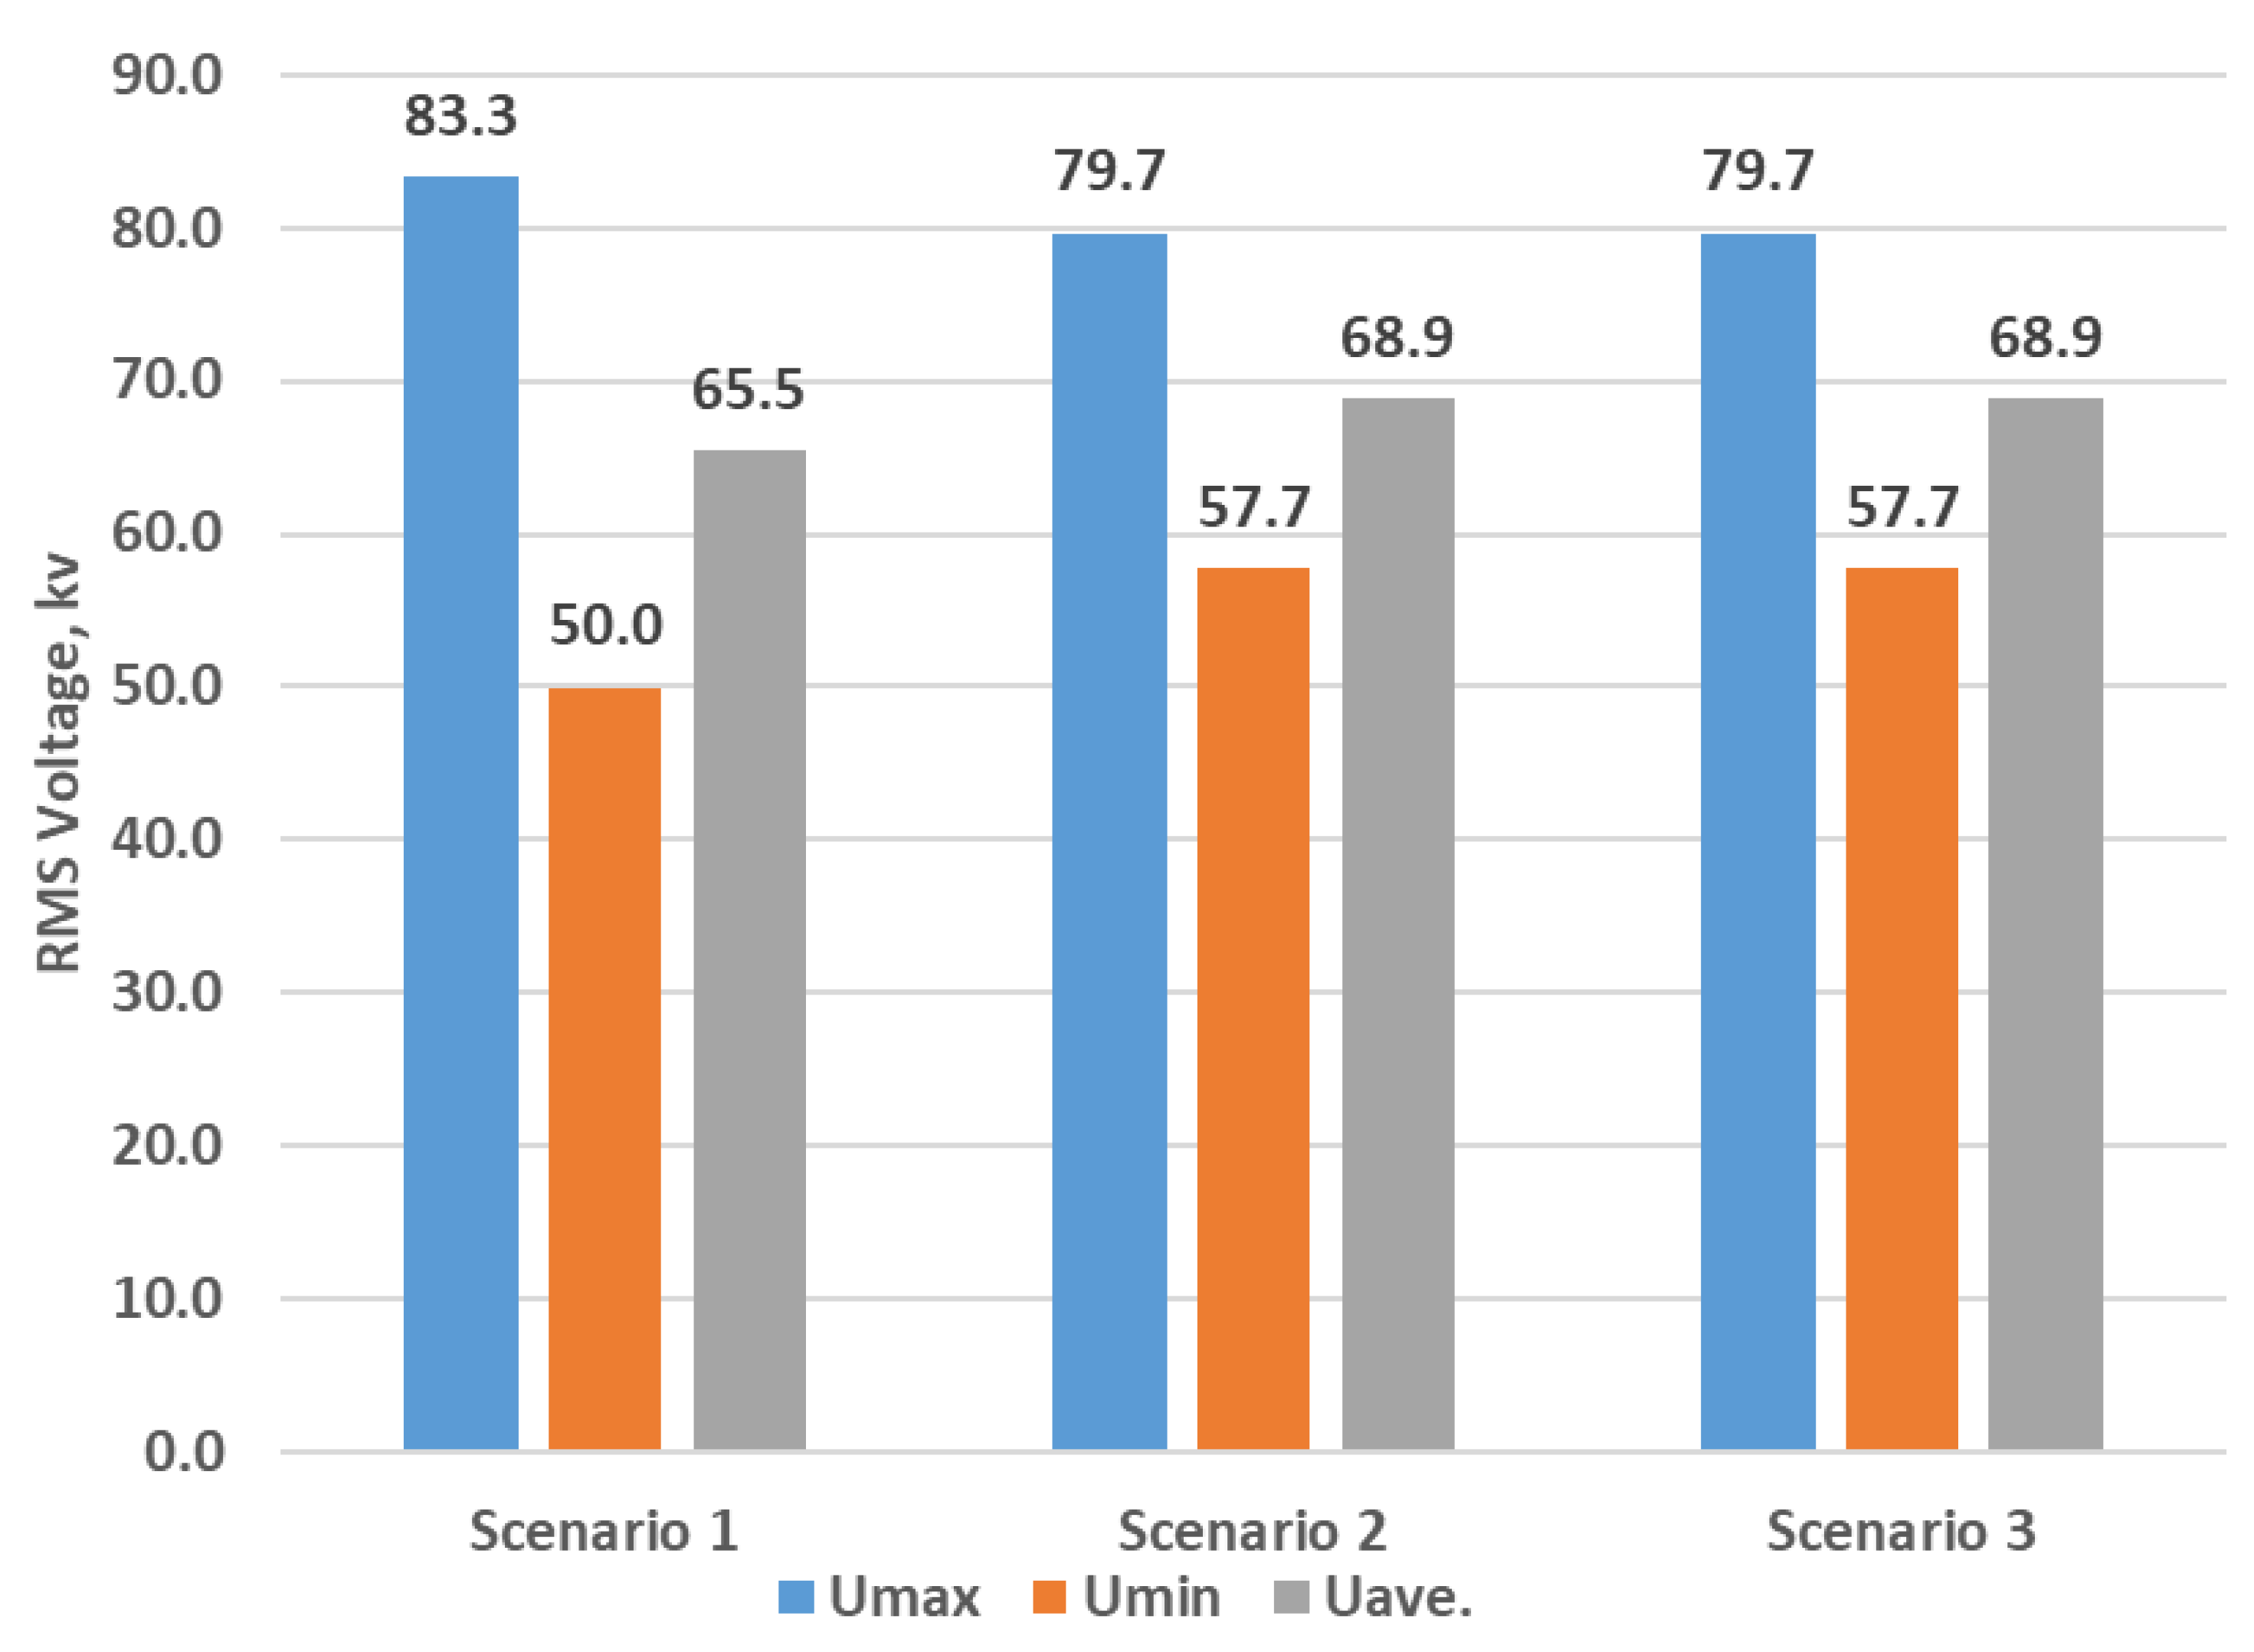
Figure 11 presents the voltage characteristics at the 110 kV level for the considered start-up scenarios. Overall, Scenario 1 is characterized by the deepest voltage sags. In this case, the maximum RMS voltage reaches 83.3 kV, while the minimum value drops to 50 kV. For Scenarios 2 and 3, the corresponding maximum and minimum RMS voltage values are 79.7 kV and 57.7 kV, respectively.
Figure 11.
Voltage characteristics for different start-up scenarios.
The average RMS voltage values are relatively close for all scenarios and amount to 65.5 kV for Scenario 1 and approximately 68.9 kV for Scenarios 2 and 3.
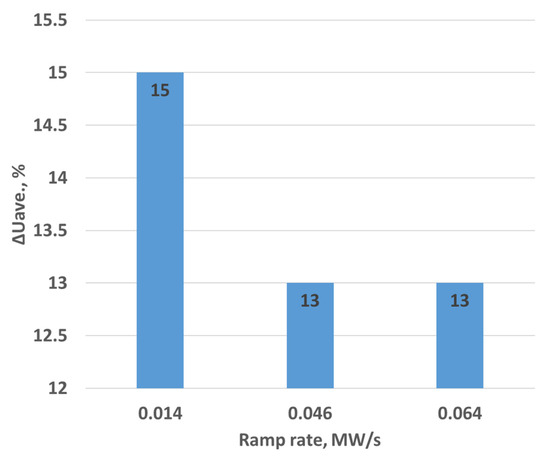
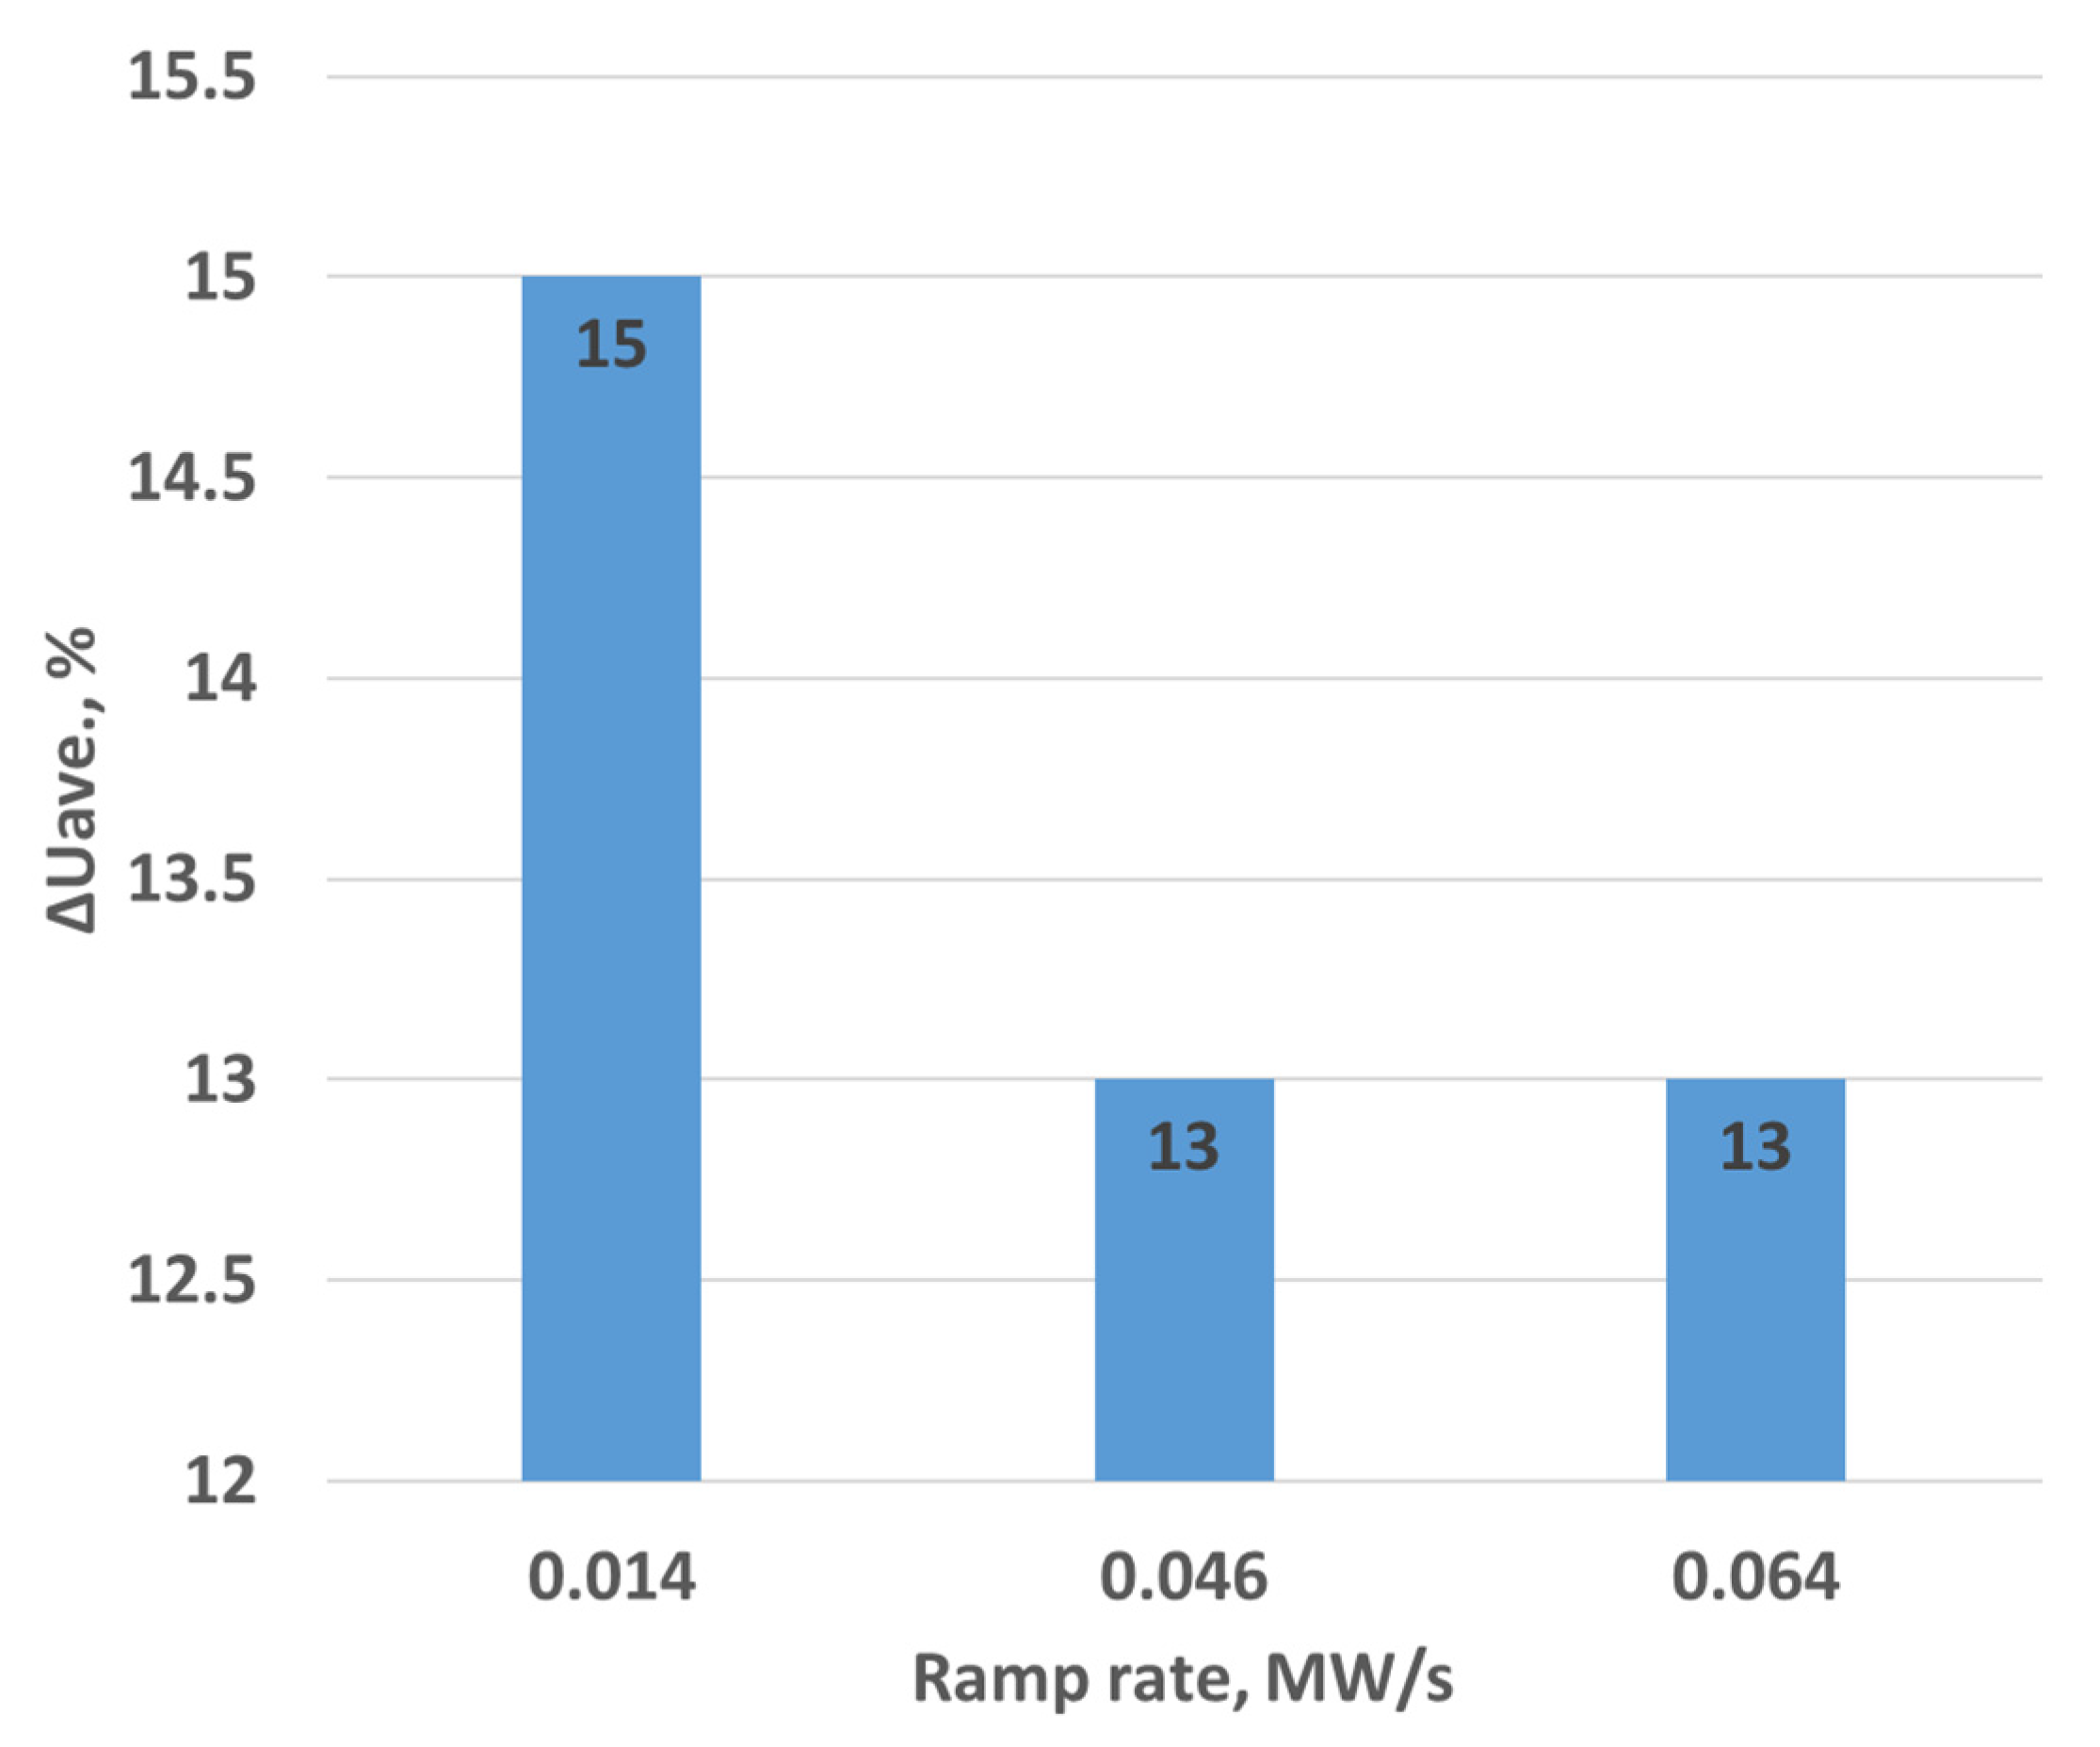
Table 6 presents the results of the voltage stabilization time analysis obtained using Equations (2)–(6). As indicated by the results, the average voltage deviation for Scenario 1 reaches approximately 15%, which can be attributed to the relatively high inertia of the network and the lower rated power of the associated transformers. For Scenarios 2 and 3, the corresponding average values are approximately 13%.
Table 6.
Voltage quality and stabilization time during start-up under different scenarios.
Despite the larger average voltage deviations, Scenario 1 demonstrates a significantly shorter voltage stabilization time compared to the other scenarios. This behavior is primarily explained by the lower power ramp rate, which enables smoother adjustment of generation and facilitates faster attainment of stable voltage conditions. It should be noted that the pronounced voltage deviations observed in Scenario 1 are mainly associated with the initial switching-on phase of the generator and occur within the first seconds of start-up.
Figure 12 illustrates the relationship between the average RMS voltage deviation and the power plant ramp rate. The graph clearly demonstrates the nonlinear nature of this dependence. At low ramp rates, increased average voltage deviations are observed, which can be attributed to a prolonged imbalance between increasing generation and load during the start-up process. As the ramp rate increases, the duration of this imbalance is reduced, resulting in improved voltage quality. However, further increases in the ramp rate lead to a saturation effect, whereby additional acceleration of the start-up process does not produce further improvement in voltage quality. This behavior indicates the existence of an optimal range of start-up ramp rates, determined by the dynamic characteristics of the electrical network.
Figure 12.
Maximum voltage deviation as a function of start-up ramp rate.
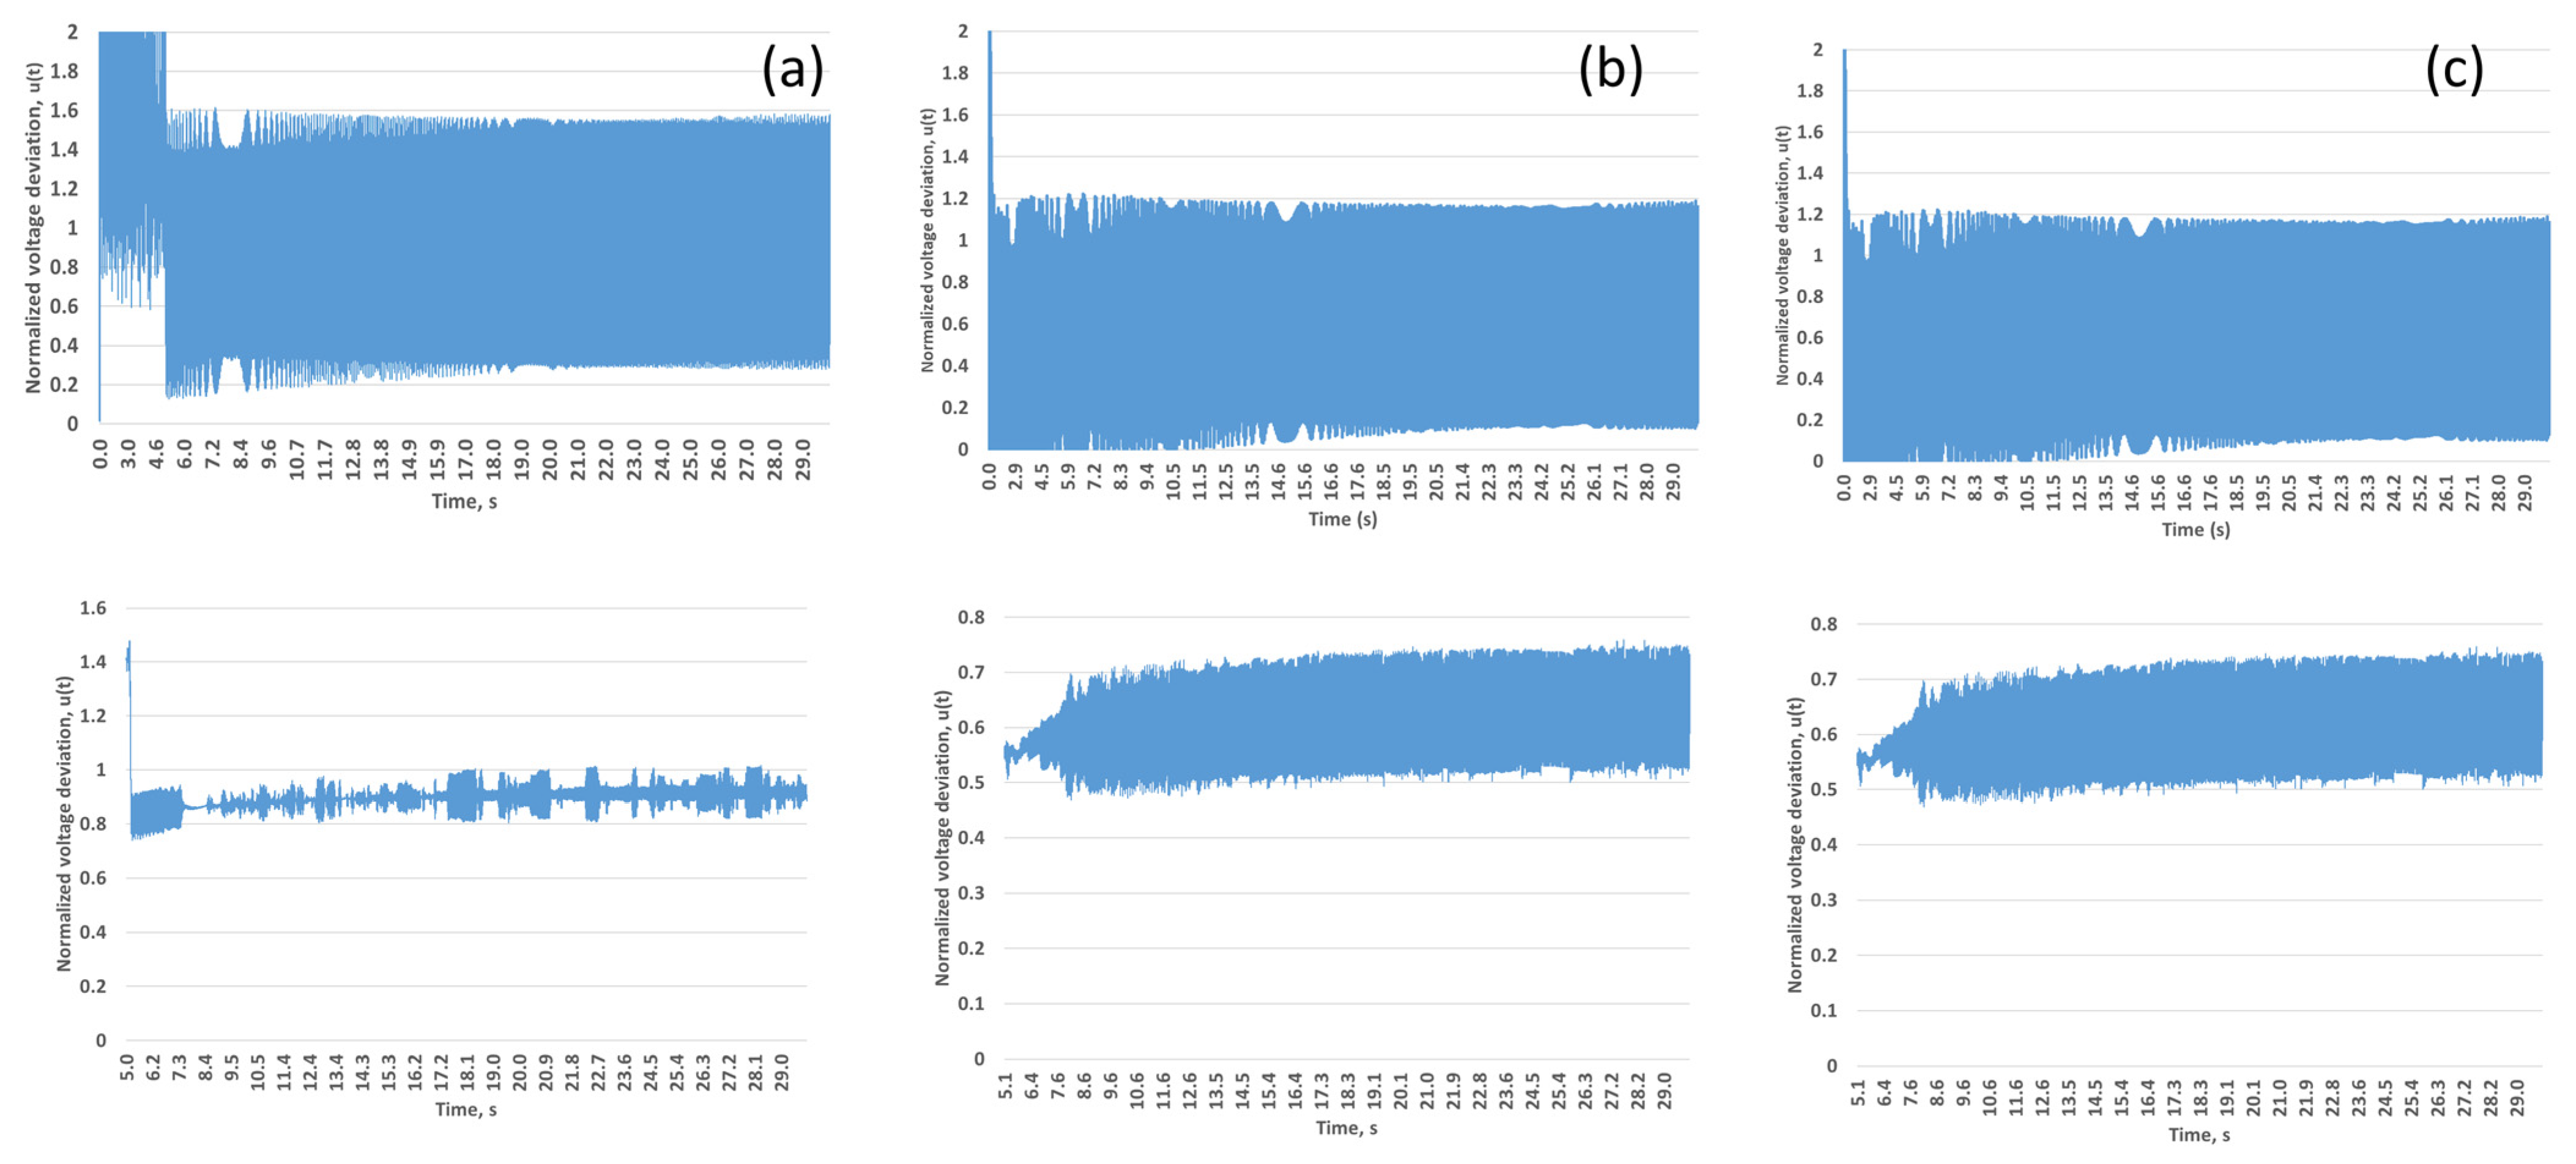
The results obtained in Figure 13 demonstrate differences in the nature of the stress transients for the three startup scenarios considered. Scenario 1 exhibits the highest amplitude of normalized voltage deviations u(t) at the initial instant, which is associated with lower generator maneuverability and lower generator rigidity compared to gas turbine units. Despite subsequent stabilization, the level of oscillations remains higher than in scenarios 2 and 3. For scenarios 2 and 3, the voltage dynamics are characterized by smoother behavior and smaller peak deviations. After excluding the first 5 s, corresponding to the fast electromagnetic transient, it is evident that the normalized voltage deviation transitions to a quasi-steady state with limited dispersion. This indicates more favorable conditions for voltage stabilization during startup of maneuverable gas turbine units. A comparison of scenarios 2 and 3 shows that enabling afterburning does not significantly degrade the voltage regime at the 110/220 kV node, and the shape of the u(t) time dependences remains similar. Thus, the differences between the scenarios are determined primarily by the rate of power increase and the generator’s dynamic characteristics, rather than the nominal installed capacity of the unit. The obtained dependences confirm that the choice of startup strategy has a significant impact on the voltage quality at the grid node and should be taken into account when developing new generating capacity commissioning modes, especially in energy-deficient areas.
Figure 13.
Time-domain evolution of the normalized voltage deviation u(t) for the considered start-up scenarios: (a) Scenario 1 (CHP), (b) Scenario 2 (CCGT), and (c) Scenario 3 (CCGT with duct firing). The upper row shows the full start-up interval including initial transient effects, while the lower row presents the same signals after excluding the first 5 s to focus on quasi-steady RMS voltage dynamics relevant for PMU-based validation.
The data in Table 7 confirm that scenario S1 is characterized by the largest average and maximum voltage deviations, while scenarios S2 and S3 demonstrate comparable and more favorable indicators. The JUF index values indicate a more stable stress state during the start-up of combined-cycle power plants, confirming their milder impact on the 110/220 kV grid.
Table 7.
Joint voltage–frequency stability index values for different start-up scenarios (frequency deviations are negligible).
Table 8 compares this study with related studies using both modeling and PMU measurements. Unlike studies focused on transient generator events or power flow variations, this study focuses on generation start-up modes and their impact on RMS voltage at the 110/220 kV node. This allows us to consider the obtained results as complementary to existing approaches and applicable to engineering assessments of power quality in transmission and distribution networks.
Table 8.
Comparison with other works.
4. Discussion
This paper proposes an approach for assessing voltage dynamics during power plant start-up based on RMS voltage analysis and a stabilization criterion employing a 5 s sliding time window with an 80% acceptance threshold. The influence of dynamic load representations, such as ZIP and induction motor models, on voltage recovery dynamics is beyond the scope of the present study and will be addressed in future work.
Based on modeling of a real 110/220 kV grid node at the Almaty power hub, it is demonstrated that the power plant ramp rate has a significant influence on voltage behavior and on the time required for the system to reach a quasi-steady-state operating condition. An increase in ramp rate leads to a reduction in voltage stabilization time; however, this relationship is nonlinear and constrained by the dynamic properties of the electrical network. Although the total simulation time is 150 s, the voltage in all scenarios reaches a quasi-steady regime within the first tens of seconds. Beyond this interval, voltage variations are negligible and do not affect the comparative assessment of start-up ramp rates or the identified saturation behavior.
It is shown that for ramp rates exceeding approximately 0.05 MW/s, further acceleration of the start-up process does not result in additional improvement in voltage quality or a reduction in stabilization time, indicating the presence of a saturation effect. A comparison of combined-cycle gas turbine start-up scenarios with different installed capacities reveals that voltage quality indicators are governed primarily by the rate of power change and grid characteristics rather than by the nominal capacity of the generating unit.
The results confirm that optimal voltage quality and an acceptable dynamic response are achieved not at the maximum possible start-up speed, but within an optimal range of ramp rates that provides a compromise between power input speed and power quality requirements. The proposed approach can be applied in the development and tuning of start-up algorithms for modern combined-cycle power plants, as well as in the assessment of their impact on 110/220 kV grid nodes during the modernization and reconstruction of power facilities.
Overall, the findings indicate that acceleration of power plant start-up should be treated as an optimization problem constrained by electrical grid characteristics, rather than as an objective aimed solely at achieving the highest possible power ramp rate.
From an engineering perspective, the three startup scenarios considered in this paper correspond to different practical operating conditions for generating units. Scenario 1 reflects the startup of an existing steam power plant at conservative power ramp rates, which ensures minimal voltage disturbances at the grid node but is accompanied by an increased stabilization time. Scenario 2 corresponds to modern maneuverable combined-cycle plants with an increased startup speed and represents a compromise between the speed of power input and voltage quality indicators, making it the most balanced option for most 110/220 kV grids. Scenario 3 characterizes aggressive startup strategies, in which a further increase in the power ramp rate leads to a decrease in the effect of reducing the voltage stabilization time and may be accompanied by an increase in operational loads on the equipment. The obtained results demonstrate that the choice of startup strategy should be based not on maximizing startup speed, but on taking into account the network characteristics and operating priorities.
From a theoretical perspective, the observed voltage response during start-up can be interpreted in terms of power grid strength, commonly characterized by the short-circuit ratio (SCR) at the point of connection. A higher grid strength, associated with a larger short-circuit capacity and lower equivalent impedance, generally reduces voltage sensitivity to power variations during start-up, while weaker grids exhibit more pronounced voltage deviations and longer stabilization times. Although the present study does not perform a parametric analysis of SCR, the identified saturation behavior of voltage stabilization with increasing start-up ramp rate is consistent with general power system theory and is expected to persist across a wide range of transmission and subtransmission networks. The absolute value of the optimal ramp rate may shift depending on grid strength; however, the existence of a saturation effect remains a robust characteristic.
The results presented in this paper were obtained for a baseline load level representative of typical operating conditions of the considered 110/220 kV grid node. Variations in the initial load level, such as transitions from nighttime to daytime operation or from minimum to maximum seasonal demand, may affect the absolute magnitude of voltage deviations and the voltage stabilization time during the start-up of generating units. At higher load levels, voltage sensitivity to power changes generally increases, whereas under lighter loading conditions the magnitude of voltage disturbances tends to decrease. Nevertheless, the nonlinear saturation relationship between start-up ramp rate and voltage stabilization time identified in this study is expected to persist across different load levels. A detailed comparative analysis of start-up modes under various node loading conditions is therefore identified as a promising direction for future research.
The present study considers the start-up of individual generating units in order to isolate the impact of start-up ramp rate on voltage dynamics at the grid node. In practical power system operation, simultaneous or closely timed start-up of multiple units may lead to voltage coupling effects due to overlapping active and reactive power variations. Such interactions can potentially amplify short-term voltage deviations and affect stabilization dynamics, particularly in weaker grids. While the qualitative conclusions regarding the nonlinear saturation behavior are expected to remain valid, a detailed analysis of multi-unit start-up coordination and voltage coupling effects is beyond the scope of this work and is identified as an important direction for future research.
Reactive power compensation devices such as SVC or STATCOM can significantly influence voltage recovery during generator start-up by providing fast dynamic reactive power support and reducing voltage sensitivity to active power ramps, especially in weak grids. In practice, such devices may mitigate short-term voltage deviations and potentially shift the effective saturation threshold of the start-up ramp rate. However, a dedicated assessment of SVC/STATCOM coordination requires additional modeling assumptions (device ratings, control modes, and placement) and would substantially expand the scope of the present study. Therefore, the synergistic effect of dynamic reactive power compensation and start-up ramp optimization is identified as an important direction for future research.
The transformer short-circuit impedance at the connection point directly affects the effective grid strength and voltage sensitivity to active power variations during generator start-up. Higher transformer impedance increases the voltage response to power ramps and may lead to larger voltage deviations and longer stabilization times, whereas lower impedance generally results in a stiffer voltage profile. Consequently, the numerical value of the identified saturation ramp rate is expected to depend on transformer parameters. However, while the absolute threshold may shift under different impedance levels, the nonlinear saturation behavior of voltage stabilization with increasing start-up ramp rate is considered a general characteristic of transmission and subtransmission networks. A systematic parametric assessment of transformer short-circuit impedance effects is beyond the scope of this study and is identified as a direction for future work.
Limitations. It should be noted that the numerical value of the identified saturation ramp rate depends on the effective grid strength at the point of connection, which is determined by the external system short-circuit capacity and transformer impedances. While the absolute threshold may shift under different network conditions, the presence of a saturation behavior in voltage stabilization with increasing start-up ramp rate represents a general characteristic of transmission and subtransmission grids. The present study focuses on the impact of the start-up ramp rate on voltage dynamics using a simplified representation of reactive power control. A detailed sensitivity analysis of reactive power regulation strategies, including variations of AVR parameters, could affect short-term voltage recovery characteristics; however, such an analysis would significantly expand the scope of the study and introduce additional degrees of freedom. Therefore, this aspect is identified as an important direction for future research.
High penetration of renewable energy sources introduces additional variability and uncertainty in power system operation, increasing the frequency of start-up and ramping events of flexible thermal generation. In such conditions, the voltage response of the grid to generator start-up processes becomes more sensitive to both active and reactive power variations. While the present study focuses on conventional combined-cycle power plants connected to a 110/220 kV network, the proposed RMS-based voltage assessment approach and stabilization criterion are not limited to fossil-based generation. The identified nonlinear saturation behavior between start-up ramp rate and voltage stabilization time is expected to remain relevant in power systems with high renewable penetration, although the optimal ramp-rate range may shift depending on grid strength, inertia, and reactive power support. A systematic extension of the proposed framework to scenarios with high shares of renewable generation is identified as an important direction for future research.
It should be noted that the aggregated constant PQ load model adopted in this study is intended to represent equivalent large-scale consumption at the 110/220 kV level; the influence of detailed dynamic and nonlinear load models on voltage recovery dynamics is beyond the scope of the present work and will be addressed in future studies.
Author Contributions
Conceptualization, M.M.U. and D.R.U.; methodology, M.M.U.; software, M.M.U.; validation, M.M.U. and D.R.U.; formal analysis, M.M.U.; investigation, M.M.U.; resources, Y.A.S.; data curation, M.M.U.; writing—original draft preparation, M.M.U.; writing—review and editing, M.M.U., D.R.U. and Y.A.S.; visualization, M.M.U.; supervision, D.R.U.; project administration, D.R.U.; funding acquisition, Y.A.S. All authors have read and agreed to the published version of the manuscript.
Funding
This research received no external funding.
Data Availability Statement
The data presented in this study are available from the corresponding author upon reasonable request.
Conflicts of Interest
The authors declare no conflicts of interest.
Abbreviations
The following abbreviations are used in this manuscript:
| CCGT | Combined-Cycle Gas Turbine |
| CHP | Combined Heat and Power |
| RMS | Root Mean Square |
| PQ | Active and Reactive Power |
| MW | Megawatt |
| kV | Kilovolt |
| GOST | State Standard (CIS countries) |
| Simulink | MATLAB Simulink simulation environment |
References
- GOST 32144-2013; Electric Energy. Power Quality Standards in Public Power Supply Systems. Eurasian Economic Commission: Moscow, Russia, 2013. Available online: https://adilet.zan.kz/rus/docs/H21EK000077 (accessed on 26 January 2026).
- KEGOC Annual Reports. Available online: https://www.kegoc.kz/en/for-investors-and-shareholders/raskrytie-informatsii/annual-reports/ (accessed on 26 January 2026).
- Population of the Republic of Kazakhstan by Gender and Type of Locality (As of 1 October 2025). Available online: https://stat.gov.kz/ru/industries/social-statistics/demography/ (accessed on 26 January 2026).
- Year in Review: Key Achievements and Development Prospects for Kazakhstan’s Energy Sector. Available online: https://primeminister.kz/ru/news/reviews/itogi-goda-klyuchevye-dostizheniya-i-perspektivy-razvitiya-energeticheskogo-sektora-kazakhstana-29496 (accessed on 26 January 2026).
- MathWorks. Simulink, version R2014; The MathWorks, Inc.: Natick, MA, USA, 2024. [Google Scholar]
- Nazir, R.; Laksono, H.D.; Waldi, E.P.; Ekaputra, E.; Coveria, P. Renewable Energy Sources Optimization: A Micro-Grid Model Design. Energy Procedia 2014, 52, 316–327. [Google Scholar] [CrossRef] [Scilit]
- Anghel, M.; Werley, K.A.; Motter, A.E. Stochastic Model for Power Grid Dynamics. In Proceedings of the 2007 40th Annual Hawaii International Conference on System Sciences (HICSS’07), Waikoloa, HI, USA, 3–6 January 2007; IEEE Computer Society: Washington, DC, USA, 2007; p. 113. [Google Scholar] [CrossRef] [Scilit]
- Hu, J.; Liu, X.; Shahidehpour, M.; Xia, S. Optimal Operation of Energy Hubs With Large-Scale Distributed Energy Resources for Distribution Network Congestion Management. IEEE Trans. Sustain. Energy 2021, 12, 1755–1765. [Google Scholar] [CrossRef] [Scilit]
- Tianjin University; Wang, D.; Liu, L.; Jia, H.; Wang, W.; Zhi, Y.; Meng, Z.; Zhou, B. Review of key problems related to integrated energy distribution systems. CSEE J. Power Energy Syst. 2018, 4, 130–145. [Google Scholar] [CrossRef] [Scilit]
- Chen, X.; Kang, C.; O’Malley, M.; Xia, Q.; Bai, J.; Liu, C.; Sun, R.; Wang, W.; Li, H. Increasing the Flexibility of Combined Heat and Power for Wind Power Integration in China: Modeling and Implications. IEEE Trans. Power Syst. 2015, 30, 1848–1857. [Google Scholar] [CrossRef] [Scilit]
- Wang, J.; You, S.; Zong, Y.; Træholt, C.; Zhou, Y.; Mu, S. Optimal dispatch of combined heat and power plant in integrated energy system: A state of the art review and case study of Copenhagen. Energy Procedia 2019, 158, 2794–2799. [Google Scholar] [CrossRef] [Scilit]
- Li, Z.; Wu, L.; Xu, Y.; Moazeni, S.; Tang, Z. Multi-Stage Real-Time Operation of a Multi-Energy Microgrid With Electrical and Thermal Energy Storage Assets: A Data-Driven MPC-ADP Approach. IEEE Trans. Smart Grid 2022, 13, 213–226. [Google Scholar] [CrossRef] [Scilit]
- Müller, U.P.; Cussmann, I.; Wingenbach, C.; Wendiggensen, J. AC Power Flow Simulations within an Open Data Model of a High Voltage Grid. In Advances and New Trends in Environmental Informatics; Springer: Berlin, Germany, 2017. [Google Scholar]
- Kotzur, L.; Markewitz, P.; Robinius, M.; Stolten, D. Impact of different time series aggregation methods on optimal energy system design. Renew. Energy 2018, 117, 474–487. [Google Scholar] [CrossRef] [Scilit]
- Liu, R.; Zhang, Y.; Gao, S.; Li, D.; Liu, C.; Che, J.; Tian, R.; Song, Y. Localization of Forced Oscillation Sources in Power Systems with Grid-Forming Wind Turbines Based on ICEEMDAN-ITEO. Energies 2025, 18, 6025. [Google Scholar] [CrossRef] [Scilit]
- Wang, B.; Sun, K. Location methods of oscillation sources in power systems: A survey. J. Mod. Power Syst. Clean Energy 2017, 5, 151–159. [Google Scholar] [CrossRef] [Scilit]
- Kotha, S.K.; Rajpathak, B. Power System State Estimation using Non-Iterative Weighted Least Square method based on Wide Area Measurements with maximum redundancy. Electr. Power Syst. Res. 2022, 206, 107794. [Google Scholar] [CrossRef] [Scilit]
- Hammad, A.E. Analysis of Power System Stability Enhancement by Static VAR Compensators. IEEE Trans. Power Syst. 1986, 1, 222–227. [Google Scholar] [CrossRef] [Scilit]
- Lee, J.; Jo, H.; Kim, S. Optimal Determination of Synchronous Condenser Placement and Voltage Setting for Enhancing Power System Stability. Energies 2025, 18, 6474. [Google Scholar] [CrossRef] [Scilit]
- Ahn, E.; Hur, J. A Practical Metric to Evaluate the Ramp Events of Wind Generating Resources to Enhance the Security of Smart Energy Systems. Energies 2022, 15, 2676. [Google Scholar] [CrossRef] [Scilit]
- Boljevic, S.; Conlon, M.F. Impact of Combined Heat and Power (CHP) generation on the fault current level in urban distribution networks (UDN). In Proceedings of the 45th International Universities Power Engineering Conference UPEC 2010, Cardiff, UK, 31 August–3 September 2010; IEEE Press: Piscataway, NJ, USA, 2010; pp. 1–6. [Google Scholar]
- Hou, G.; Huang, T.; Jiang, H.; Cao, H.; Zhang, T.; Zhang, J.; Gao, H.; Liu, Y.; Zhou, Z.; An, Z. A flexible and deep peak shaving scheme for combined heat and power plant under full operating conditions. Energy 2024, 299, 131402. [Google Scholar] [CrossRef] [Scilit]
- Ding, H.; Ding, S.; Tan, Q.; Zhang, C.; Fang, Q.; Yang, T. Improving power ramp rate of a coal-fired power plant by a bypass steam accumulator. Heliyon 2024, 10, e32412. [Google Scholar] [CrossRef] [Scilit]
- Kubik, M.L.; Coker, P.J.; Barlow, J.F. Increasing thermal plant flexibility in a high renewables power system. Appl. Energy 2015, 154, 102–111. [Google Scholar] [CrossRef] [Scilit]
- Liu, Y.; Wu, L.; Li, J. Towards accurate modeling of dynamic startup/shutdown and ramping processes of thermal units. Energy 2019, 187, 115891. [Google Scholar] [CrossRef] [Scilit]
- Beiron, J.; Montañés, R.M.; Normann, F.; Johnsson, F. Flexible operation of a combined cycle cogeneration plant—A techno-economic assessment. Appl. Energy 2020, 278, 115630. [Google Scholar] [CrossRef] [Scilit]
- Olsen, K.P.; Zong, Y.; You, S.; Bindner, H.; Koivisto, M.; Gea-Bermúdez, J. Multi-timescale data-driven method identifying flexibility requirements for scenarios with high penetration of renewables. Appl. Energy 2020, 264, 114702. [Google Scholar] [CrossRef] [Scilit]
- Eser, P.; Singh, A.; Chokani, N.; Abhari, R.S. Effect of increased renewables generation on operation of thermal power plants. Appl. Energy 2016, 164, 723–732. [Google Scholar] [CrossRef] [Scilit]
- Taleb, Y.; Lamrani, R.; Abbou, A. Measurement and Evaluation of Voltage Unbalance in 2 × 25 kV 50 Hz High-Speed Trains Using Variable Integration Period. Electricity 2024, 5, 154–173. [Google Scholar] [CrossRef] [Scilit]
- IEC 61000-4-11:2017; Electromagnetic Compatibility (EMC)—Part 4-11: Testing and Measurement Techniques—Voltage Dips, Short Interruptions and Voltage Variations Immunity Tests. International Electrotechnical Commission: Geneva, Switzerland, 2017.
- IEEE Std 1564-2014; IEEE Guide for Voltage Sag Indices. Institute of Electrical and Electronics Engineers: New York, NY, USA, 2014.
- Reconstruction of Almaty CHPP 3 into a Combined Cycle Power Plant with an Increase in Capacity to 500 MW. Available online: https://eabr.org/en/projects/in-process/reconstruction-of-almaty-chpp-3-into-a-combined-cycle-power-plant-with-an-increase-in-capacity-to-50/ (accessed on 26 January 2026).
- Reconstruction of Almaty CHPP-3. Available online: https://www.ales.kz/en/information-about-an-open-two-stage-competition/ (accessed on 26 January 2026).
- Grid Even Signature Library. Available online: https://gesl.ornl.gov/dashboard/5757/graphs-dq (accessed on 9 February 2026).
- Ceccarelli, N.; van Leeuwen, M.; Wolf, T.; van Leeuwen, P.; van der Vaart, R.; Maas, W.; Ramos, A. Flexibility of Low-CO2 Gas Power Plants: Integration of the CO2 Capture Unit with CCGT Operation. Energy Procedia 2014, 63, 1703–1726. [Google Scholar] [CrossRef] [Scilit]
- Most Combined-Cycle Power Plants Have Duct Burners that Add Energy to the Turbine Exhaust. Available online: https://www.eia.gov/todayinenergy/detail.php?id=52778 (accessed on 26 January 2026).
- Filipkowski, J.; Skibko, Z.; Borusiewicz, A.; Romaniuk, W.; Pisarek, Ł.; Milewska, A. Changes in Farm Supply Voltage Caused by Switching Operations at a Wind Turbine. Energies 2024, 17, 5673. [Google Scholar] [CrossRef] [Scilit]

Disclaimer/Publisher’s Note: The statements, opinions and data contained in all publications are solely those of the individual author(s) and contributor(s) and not of MDPI and/or the editor(s). MDPI and/or the editor(s) disclaim responsibility for any injury to people or property resulting from any ideas, methods, instructions or products referred to in the content. |
© 2026 by the authors. Licensee MDPI, Basel, Switzerland. This article is an open access article distributed under the terms and conditions of the Creative Commons Attribution (CC BY) license.