


Abstract
This paper investigates the dynamic interaction between photovoltaic (PV) generation and building electricity demand with a focus on temporal alignment. A combined framework integrating state-based clustering and Dynamic Time Warping (DTW) is proposed to jointly analyze instantaneous operating states and time-dependent profile similarity. High-resolution (15 min) data from a 50 kWp building-integrated PV system supplying an administrative university building were analyzed for March 2025. Unsupervised k-means clustering was applied in the production–consumption state space to identify typical operating regimes, while DTW was used to compare daily PV generation and load profiles accounting for temporal shifts. The results show that days classified as similar based on instantaneous energy states may exhibit substantially different temporal structures that remain invisible in state-based analyses. To assess the practical relevance of temporal similarity, DTW distances were related to daily energy performance indicators. No significant relationship was observed between DTW distance and the self-consumption ratio under high-load conditions; however, a strong and statistically significant correlation (Pearson r = −0.60, p < 0.001; Spearman ρ = −0.53, p < 0.01) was found between DTW distance and a temporal overlap index quantifying the fraction of building load occurring during the PV-active period. The authors demonstrate that the applied DTW algorithm identifies temporal mismatches that have a measurable impact on energy metrics directly linked to load–generation coincidence. These findings confirm that temporal alignment constitutes an independent and operationally meaningful dimension of PV–building energy interaction that cannot be fully captured by state-based or energy-aggregated indicators alone.
1. Introduction
The increasing penetration of photovoltaic (PV) systems in public, commercial, and residential buildings has fundamentally changed the way electricity is generated and consumed at the local level [1,2]. Unlike conventional centralized power plants, PV installations are characterized by strong temporal variability resulting from diurnal cycles, seasonal effects, and rapidly changing weather conditions [3]. At the same time, the electricity demand of buildings—especially administrative and institutional facilities—follows its own operational rhythms determined by working hours, occupancy patterns, and user behavior [4]. As a consequence, effective utilization of locally generated photovoltaic energy is no longer determined solely by installed capacity or total energy balance, but increasingly by the degree of temporal alignment between generation and demand [5].
In recent years, a significant body of research has focused on assessing PV system performance, optimizing self-consumption, and evaluating the suitability of PV installations for specific buildings [6,7]. Many studies rely on aggregated indicators such as monthly or annual energy production, self-consumption ratios, or surplus energy fed into the grid [8]. While these metrics are valuable for long-term planning and economic evaluation, they provide limited insight into the dynamic interaction between generation and demand at shorter time scales [9,10]. From the perspective of modern energy systems, and particularly Smart Grid concepts [11,12,13], understanding how generation and consumption profiles evolve in time—and how well they match—is becoming increasingly important [14].
Data-driven methods have emerged as powerful tools for analyzing complex energy systems based on real measurement data [15]. Among them, unsupervised clustering has been widely applied to identify typical operating states of PV installations and building loads [16]. By grouping data points according to similarity in selected feature spaces, clustering enables the extraction of representative energy states and signatures without the need for prior labeling. Such approaches have proven useful for diagnosing system behavior, identifying periods of high self-consumption or surplus generation, and supporting energy management decisions [17]. However, clustering-based methods inherently operate on sets of observations rather than on ordered temporal sequences. As a result, they largely disregard the temporal continuity and sequential structure of energy profiles, treating individual data points as independent samples.
This limitation becomes particularly relevant when the research question shifts from identifying operating states to assessing temporal alignment between PV generation and building demand [18]. Two daily profiles may belong to the same cluster in terms of average power levels or overall energy balance, yet exhibit substantially different temporal structures, such as shifted peaks or mismatched ramp-up and ramp-down periods. In such cases, clustering alone is unable to capture whether the demand profile follows, precedes, or lags behind the generation profile [19]. Consequently, an alternative methodological perspective is required—one that explicitly accounts for the temporal ordering of measurements and allows for meaningful comparison of time-dependent energy profiles [20].
DTW is a well-established technique for measuring similarity between time series that may be misaligned in time [21]. Originally developed for speech recognition, DTW has since been applied in various domains where temporal distortions are expected, including biomedical signal processing, pattern recognition, and selected areas of energy analysis [22]. Unlike pointwise distance measures, DTW allows nonlinear alignment of two sequences by locally stretching or compressing the time axis, thereby identifying an optimal warping path that minimizes the overall distance between signals [23]. This property makes DTW a promising candidate for analyzing PV generation and building demand profiles, which often share similar shapes but differ in timing due to operational constraints or behavioral factors [24].
Despite extensive research on PV–building interaction, several methodological gaps remain:
- Existing analyses primarily rely on energy-aggregated indicators, which fail to capture the temporal organization of generation and demand within a day [25].
- State-based approaches such as clustering identify typical operating regimes but do not quantify temporal similarity or mismatch between daily profiles [26].
- Visual inspection of daily profiles lacks an objective and scalable metric for ranking days according to temporal alignment [27].
To address these gaps, this study introduces a DTW-based framework that (i) quantifies temporal similarity between daily PV–load profiles, (ii) enables a continuous ranking of days according to temporal alignment, and (iii) links temporal mismatch to physically interpretable energy performance indicators.
The present study addresses this methodological gap by critically examining the use of Dynamic Time Warping for assessing dynamic energy matching between PV generation and building electricity demand. Rather than proposing DTW as a replacement for existing analytical approaches, this work positions DTW as a complementary method whose strengths and limitations must be clearly understood. The analysis is conducted using real measurement data from a 50 kWp PV system supplying an administrative university building, covering the entire month of March 2025. Importantly, the same dataset has been analyzed in previous studies using unsupervised clustering, which enables direct methodological comparison without introducing biases related to data selection or seasonal effects.
By applying DTW to daily power profiles of PV generation and building demand, this study investigates how temporal alignment between the two processes varies across different days and operating conditions [28]. The results are systematically compared with clustering-based interpretations derived from the same data, highlighting situations in which both methods lead to consistent conclusions, as well as cases where DTW reveals temporal mismatches that remain hidden in state-based analyses. Particular attention is paid to the interpretability of results, computational complexity, and suitability of each method for supporting energy analysis and future energy management applications.
Previous studies have applied time-series similarity measures in energy systems primarily for classification, clustering, or anomaly detection of load and generation profiles. However, the majority of these approaches remain descriptive and do not explicitly relate temporal similarity to physically interpretable energy performance indicators. The present study addresses this gap by quantitatively linking DTW-based temporal mismatch to load–generation coincidence.
The main objective of this article is therefore to evaluate the applicability of DTW as a method for dynamic energy matching in PV-powered buildings and to critically compare its capabilities and limitations with clustering-based approaches. The contribution of this work lies not in the development of a new algorithm, but in providing a structured methodological assessment that clarifies what types of research questions DTW can answer in the context of building-integrated PV systems, and where its use may be inappropriate or insufficient. The authors demonstrate that the applied DTW algorithm identifies temporal mismatches that have a measurable impact on the energy metrics. By establishing this methodological foundation, the study aims to support further research on advanced energy matching, demand flexibility, and energy management strategies based on time-resolved data.
2. Materials and Methods
2.1. Measurement Data and Case Study Description
The analysis is based on real measurement data acquired from a PV system with a peak power of 50 kWp supplying an administrative university building. The dataset covers the entire month of March 2025 and consists of power measurements recorded at 15 min intervals. The PV installation is equipped with an advanced inverter and a smart metering system, enabling simultaneous monitoring of generated power, self-consumed power, surplus energy fed into the grid, total building demand, and power drawn from the grid. The authors provided a very detailed description of the tested PV system and the building on whose roof it is installed in their previously published article [17].
March was deliberately selected as the study period, as it represents a transitional month in the local climate, characterized by high variability of solar irradiance and moderate outdoor temperatures. This results in a wide range of daily operating conditions, including days with high PV production, days with limited generation, and days with partial temporal overlap between generation and demand. Importantly, the same dataset has been used in previous studies focused on clustering-based analysis of energy signatures, which enables direct methodological comparison without introducing biases related to seasonal effects or data selection.
For the purposes of this study, the analysis focuses on daily power profiles of PV generation and building electricity demand. Each day is represented as a sequence of 96 measurement points corresponding to a full 24 h period with 15 min resolution. This representation preserves the temporal structure of both processes and provides a consistent basis for applying both clustering-based and time-series-based methods.
2.2. Clustering-Based Analysis as a State-Oriented Baseline
Unsupervised clustering is employed as a baseline method representing a state-oriented approach to energy analysis [29,30]. In this framework, individual measurement points are treated as independent observations described by selected energy-related variables, such as PV production, self-consumption, surplus power, and power drawn from the grid. The goal of clustering is to group these observations into a finite number of operating states characterized by similar energetic properties.
Following the methodology established in previous work [16,17], k-means clustering is applied after appropriate data preprocessing, including normalization to ensure comparability of variables with different numerical ranges. The number of clusters is selected based on a combination of quantitative criteria and expert validation, with emphasis on interpretability of the resulting energy states. The clustering outcome provides a partition of the energy space into states that can be associated with typical operating conditions, such as high self-consumption, dominant surplus generation, or strong dependence on grid supply.
Clustering-based analysis offers several advantages in the context of PV-powered buildings. It enables compact representation of complex datasets, supports intuitive interpretation of operating conditions, and facilitates statistical characterization of energy behavior over longer periods. However, this approach inherently neglects the temporal ordering of measurements. Each data point is assigned to a cluster independently of its position in time, and as a result, clustering does not capture the sequential structure of daily power profiles or the relative timing of generation and demand peaks.
In the context of this study, clustering serves as a reference method that identifies energy states but does not explicitly address temporal alignment between PV generation and building demand.
2.3. Dynamic Time Warping for Time-Oriented Energy Matching
DTW is applied as a time-oriented method designed to assess similarity between entire daily power profiles while explicitly accounting for temporal misalignment. Unlike clustering, which operates on individual observations in a multidimensional feature space, DTW compares ordered sequences of measurements and preserves the temporal continuity of the analyzed signals.
For each day, two time series are constructed: PV generation power and total building demand. Prior to applying DTW, the series are normalized to eliminate the influence of absolute magnitude and focus on profile shape. This normalization allows the method to evaluate similarity in temporal structure independently of differences in installed capacity or absolute load levels.
DTW computes the optimal nonlinear alignment between two sequences by allowing local stretching and compression of the time axis. The resulting DTW distance quantifies the degree of dissimilarity between the profiles after optimal alignment, while the warping path provides information on how individual time segments are matched. To ensure physical plausibility and avoid excessive temporal distortions, the alignment is constrained by a warping window that limits the maximum allowable time shift between matched points. In this study, the window width is selected to reflect realistic demand-shifting horizons in building operation.
The application of DTW yields a scalar distance value for each day, representing the degree of temporal mismatch between PV generation and building demand profiles. Lower distances indicate stronger temporal alignment, while higher distances suggest pronounced mismatch. Unlike clustering, DTW does not assign discrete states but instead provides a continuous measure of similarity that directly reflects the temporal relationship between generation and demand.
2.4. Conceptual and Methodological Comparison Framework
To enable a meaningful comparison between clustering-based analysis and DTW, it is essential to recognize that the two methods address fundamentally different research questions [31]. Clustering focuses on identifying typical energy states based on instantaneous power relationships, whereas DTW evaluates similarity between entire daily profiles while preserving temporal order.
Accordingly, the comparison in this study is not based on accuracy or performance metrics, but on qualitative and methodological criteria relevant to energy analysis. These include the ability to capture temporal alignment, interpretability of results from an energy engineering perspective, sensitivity to time shifts between generation and demand, computational complexity, and suitability for further use in energy management research.
By applying both methods to the same dataset and analyzing their outputs in parallel, this study investigates what types of information are revealed by each approach, where their insights overlap, and where they diverge. This comparative framework provides a structured basis for evaluating the applicability of DTW as a tool for dynamic energy matching and for clarifying its role relative to established clustering-based techniques.
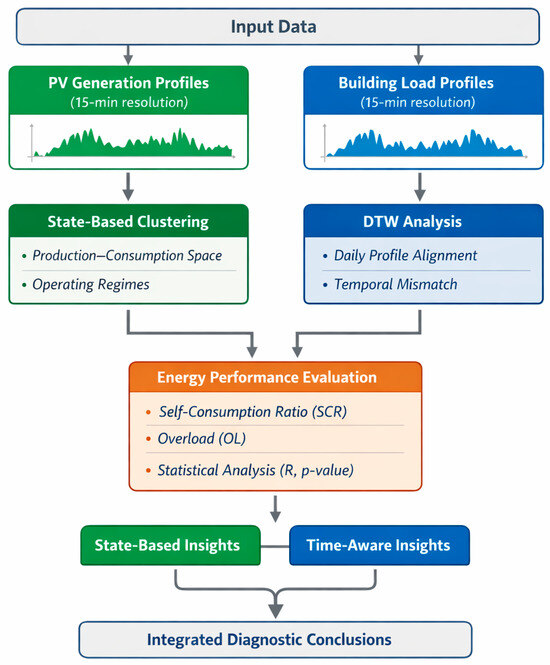
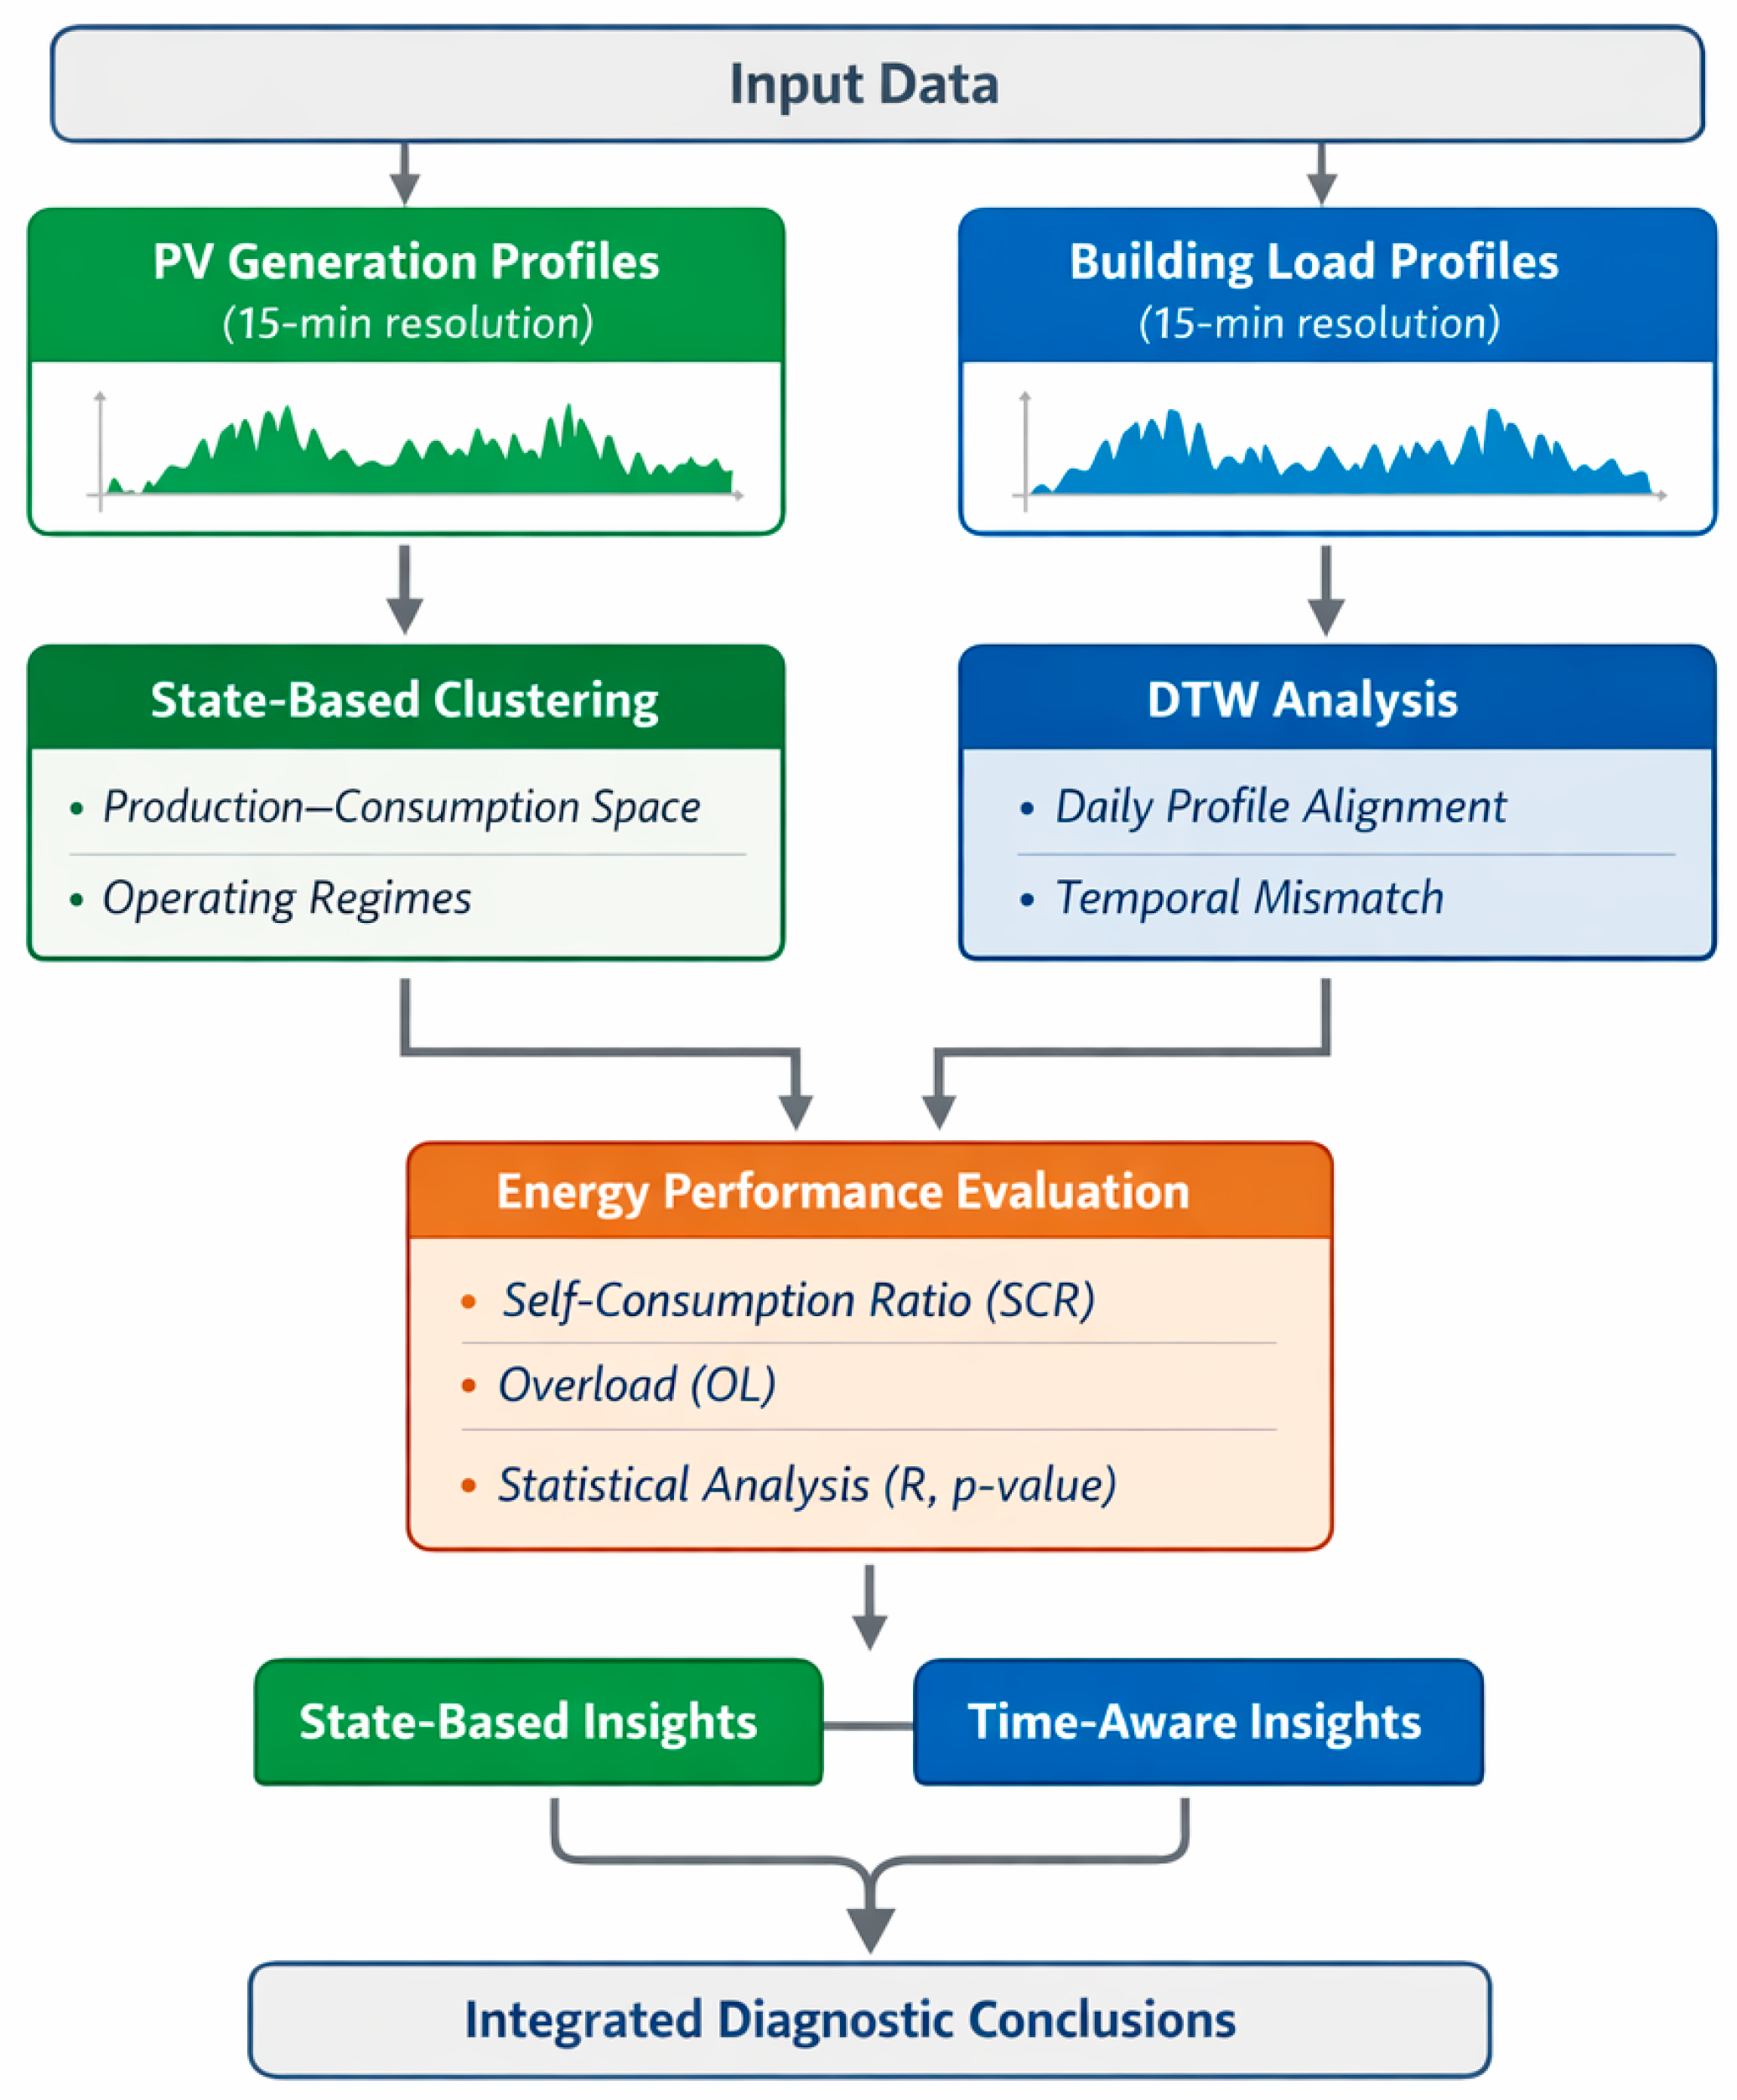
Data flow diagram for comparative analysis: Clustering vs. DTW is shown in Figure 1.
Figure 1.
Data flow diagram for comparative analysis: Clustering vs. DTW.
3. Results
3.1. Overview of Daily Power Profiles
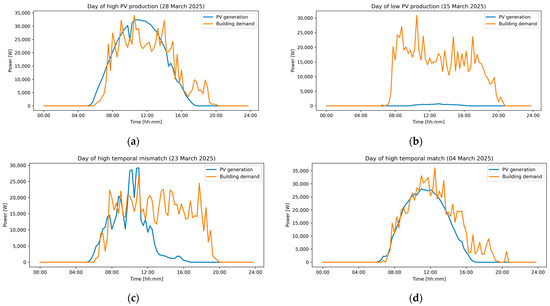
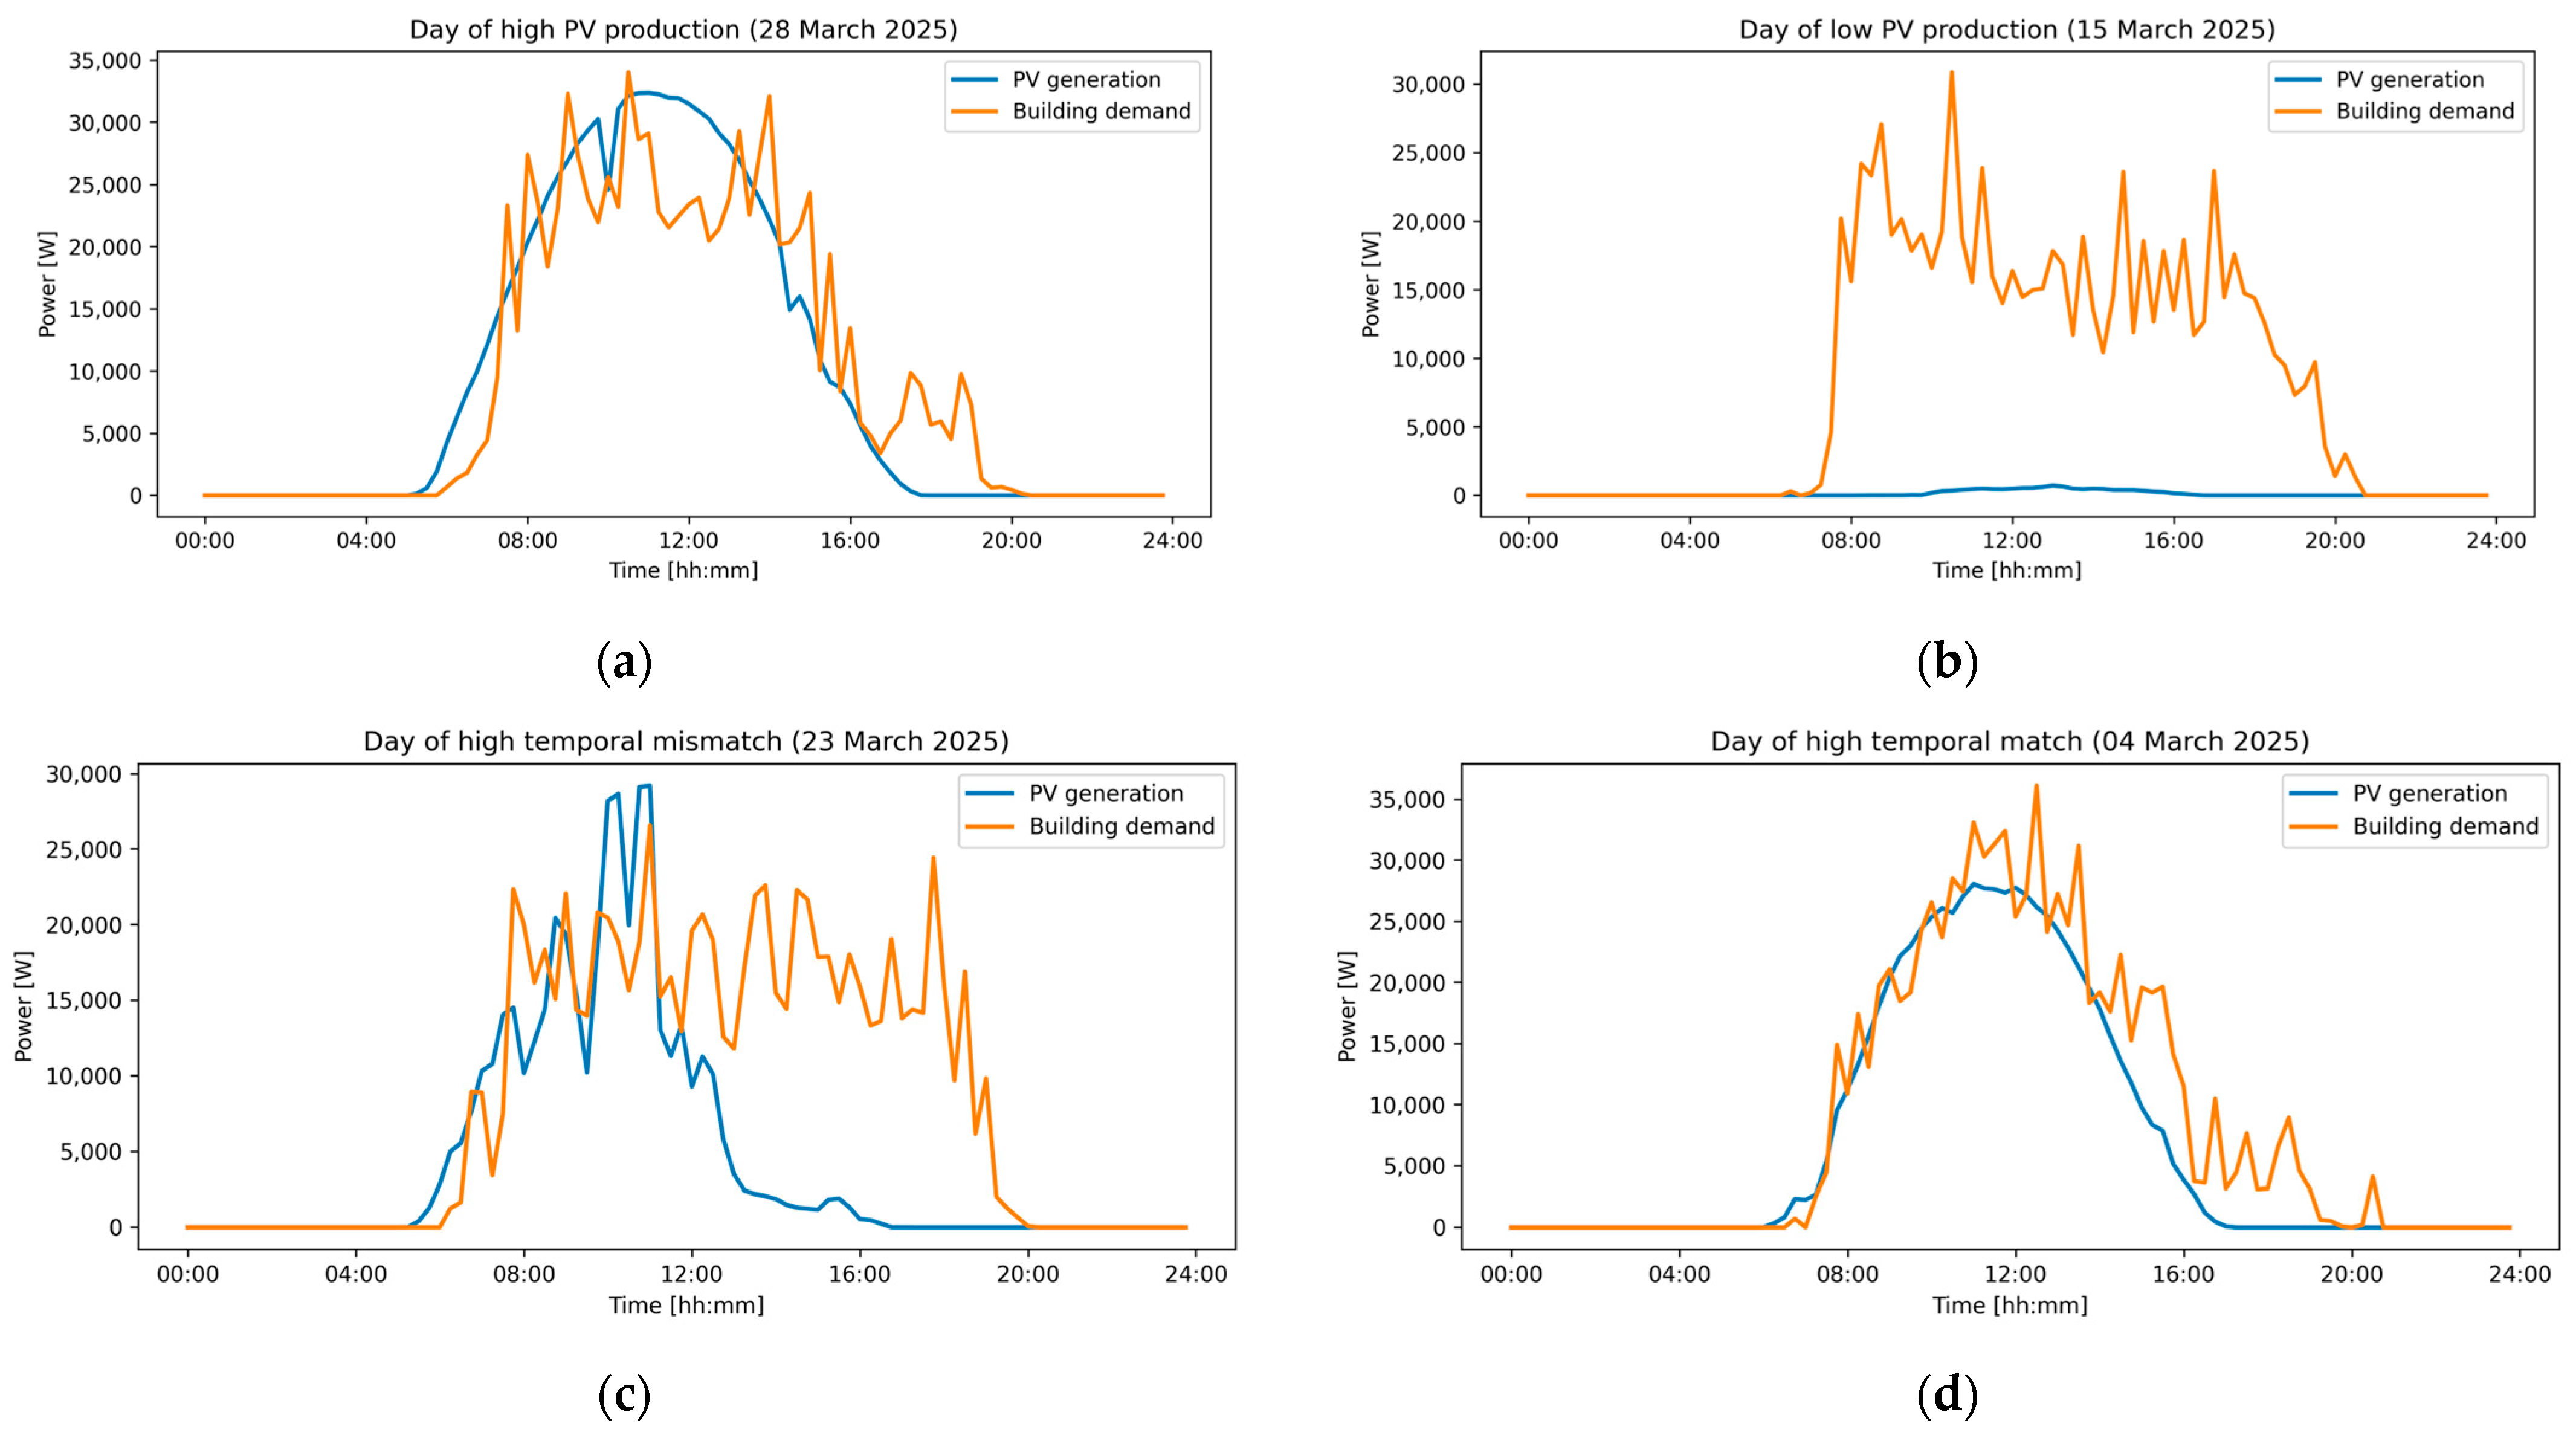
Figure 2 presents four representative daily power profiles illustrating the relationship between PV generation and building electricity demand under different operating conditions observed in March 2025. The day of high PV production shows a pronounced generation peak around midday, significantly exceeding the building demand during several hours, which indicates a high potential for self-consumption and surplus generation. In contrast, the day of low PV production is characterized by minimal generation throughout the day, with building demand almost entirely covered by electricity drawn from the grid. The day identified as having a high temporal mismatch reveals a clear misalignment between the timing of PV generation and the building load, despite moderate generation levels. In this case, peak demand occurs outside the main production window, resulting in limited temporal overlap between the two profiles. Conversely, the day of high temporal match demonstrates a strong synchronization between generation and demand, with load increases coinciding with periods of higher PV output. This situation represents favorable natural alignment without any active demand management. Taken together, these profiles highlight that similar daily energy balances may correspond to fundamentally different temporal relationships. The figure presents that assessing PV system performance solely on the basis of aggregated energy indicators may obscure important timing effects. These observations motivate the use of analytical methods capable of capturing temporal alignment between generation and demand.
Figure 2.
Representative daily power profiles illustrating the relationship between PV generation and building electricity demand under different operating conditions observed in March 2025: (a) Day of high PV production; (b) Day of low PV production; (c) Day of high temporal mismatch; (d) Day of high temporal match.
3.2. Clustering-Based Interpretation of Energy States
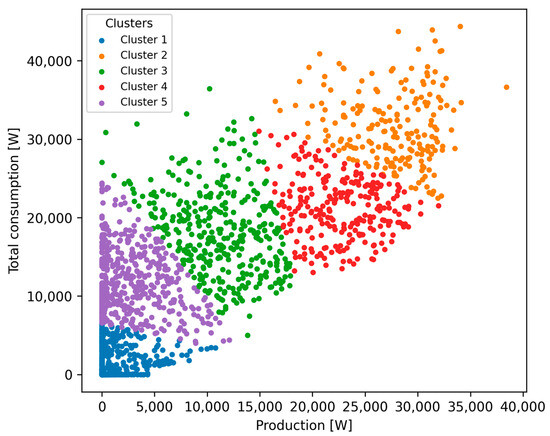
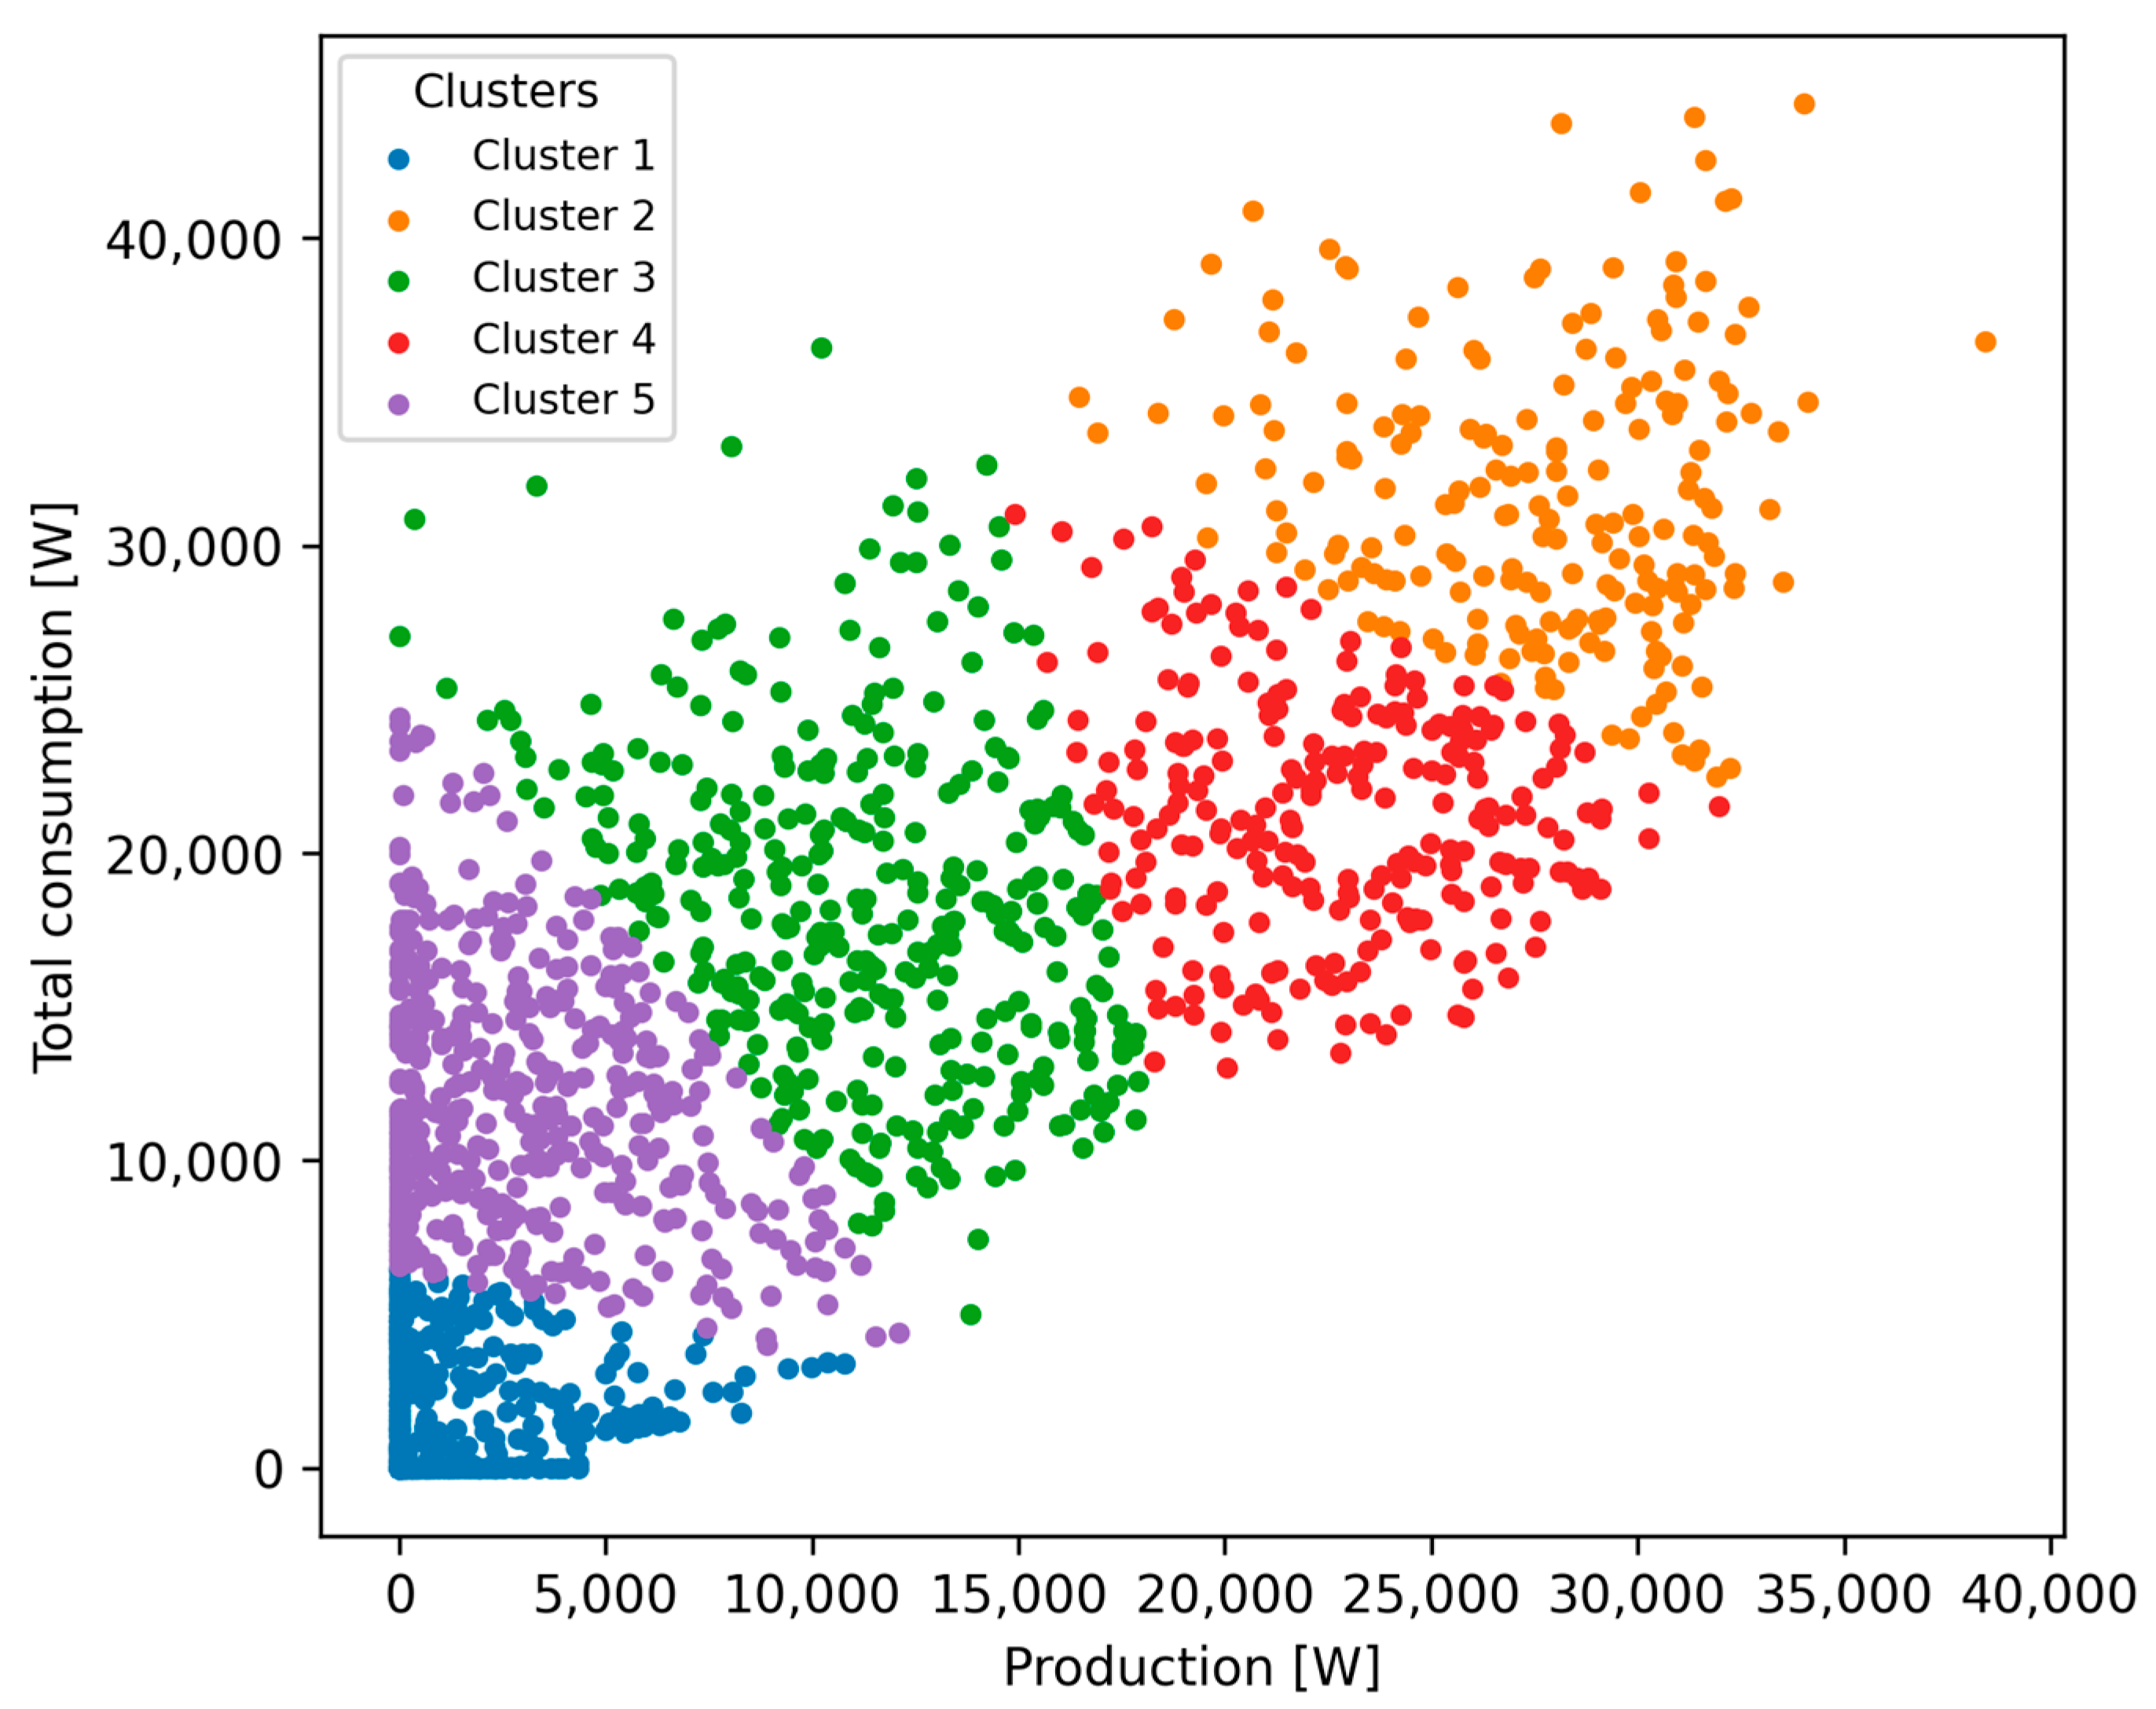
Figure 3 presents the results of unsupervised k-means clustering performed in a two-dimensional state space defined by PV power production and total building electricity consumption. Each point represents a single 15 min measurement, and the clusters delineate typical operating states arising from the mutual relationship between generation and demand. The separation of clusters reflects distinct energetic regimes, ranging from periods of low PV production with dominant grid consumption to intervals of high generation accompanied by potential energy surplus. Intermediate clusters correspond to transitional states in which production and demand are of comparable magnitude. The clustering reveals that a wide range of operating conditions may occupy overlapping regions of the production–consumption space, despite differences in their temporal context. Importantly, the method organizes data according to instantaneous power relationships without preserving information on the temporal sequence of observations. As a result, while clustering effectively identifies representative energy states, it does not provide insight into the timing or alignment of PV generation relative to building demand over the course of the day.
Figure 3.
Unsupervised clustering in Production–Consumption space (5 clusters).
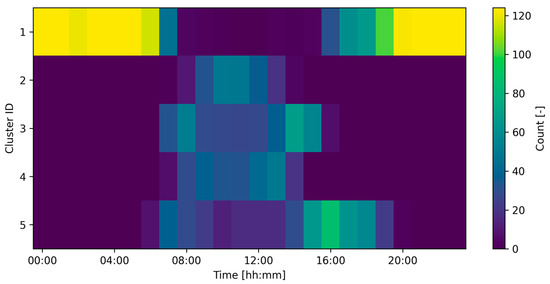
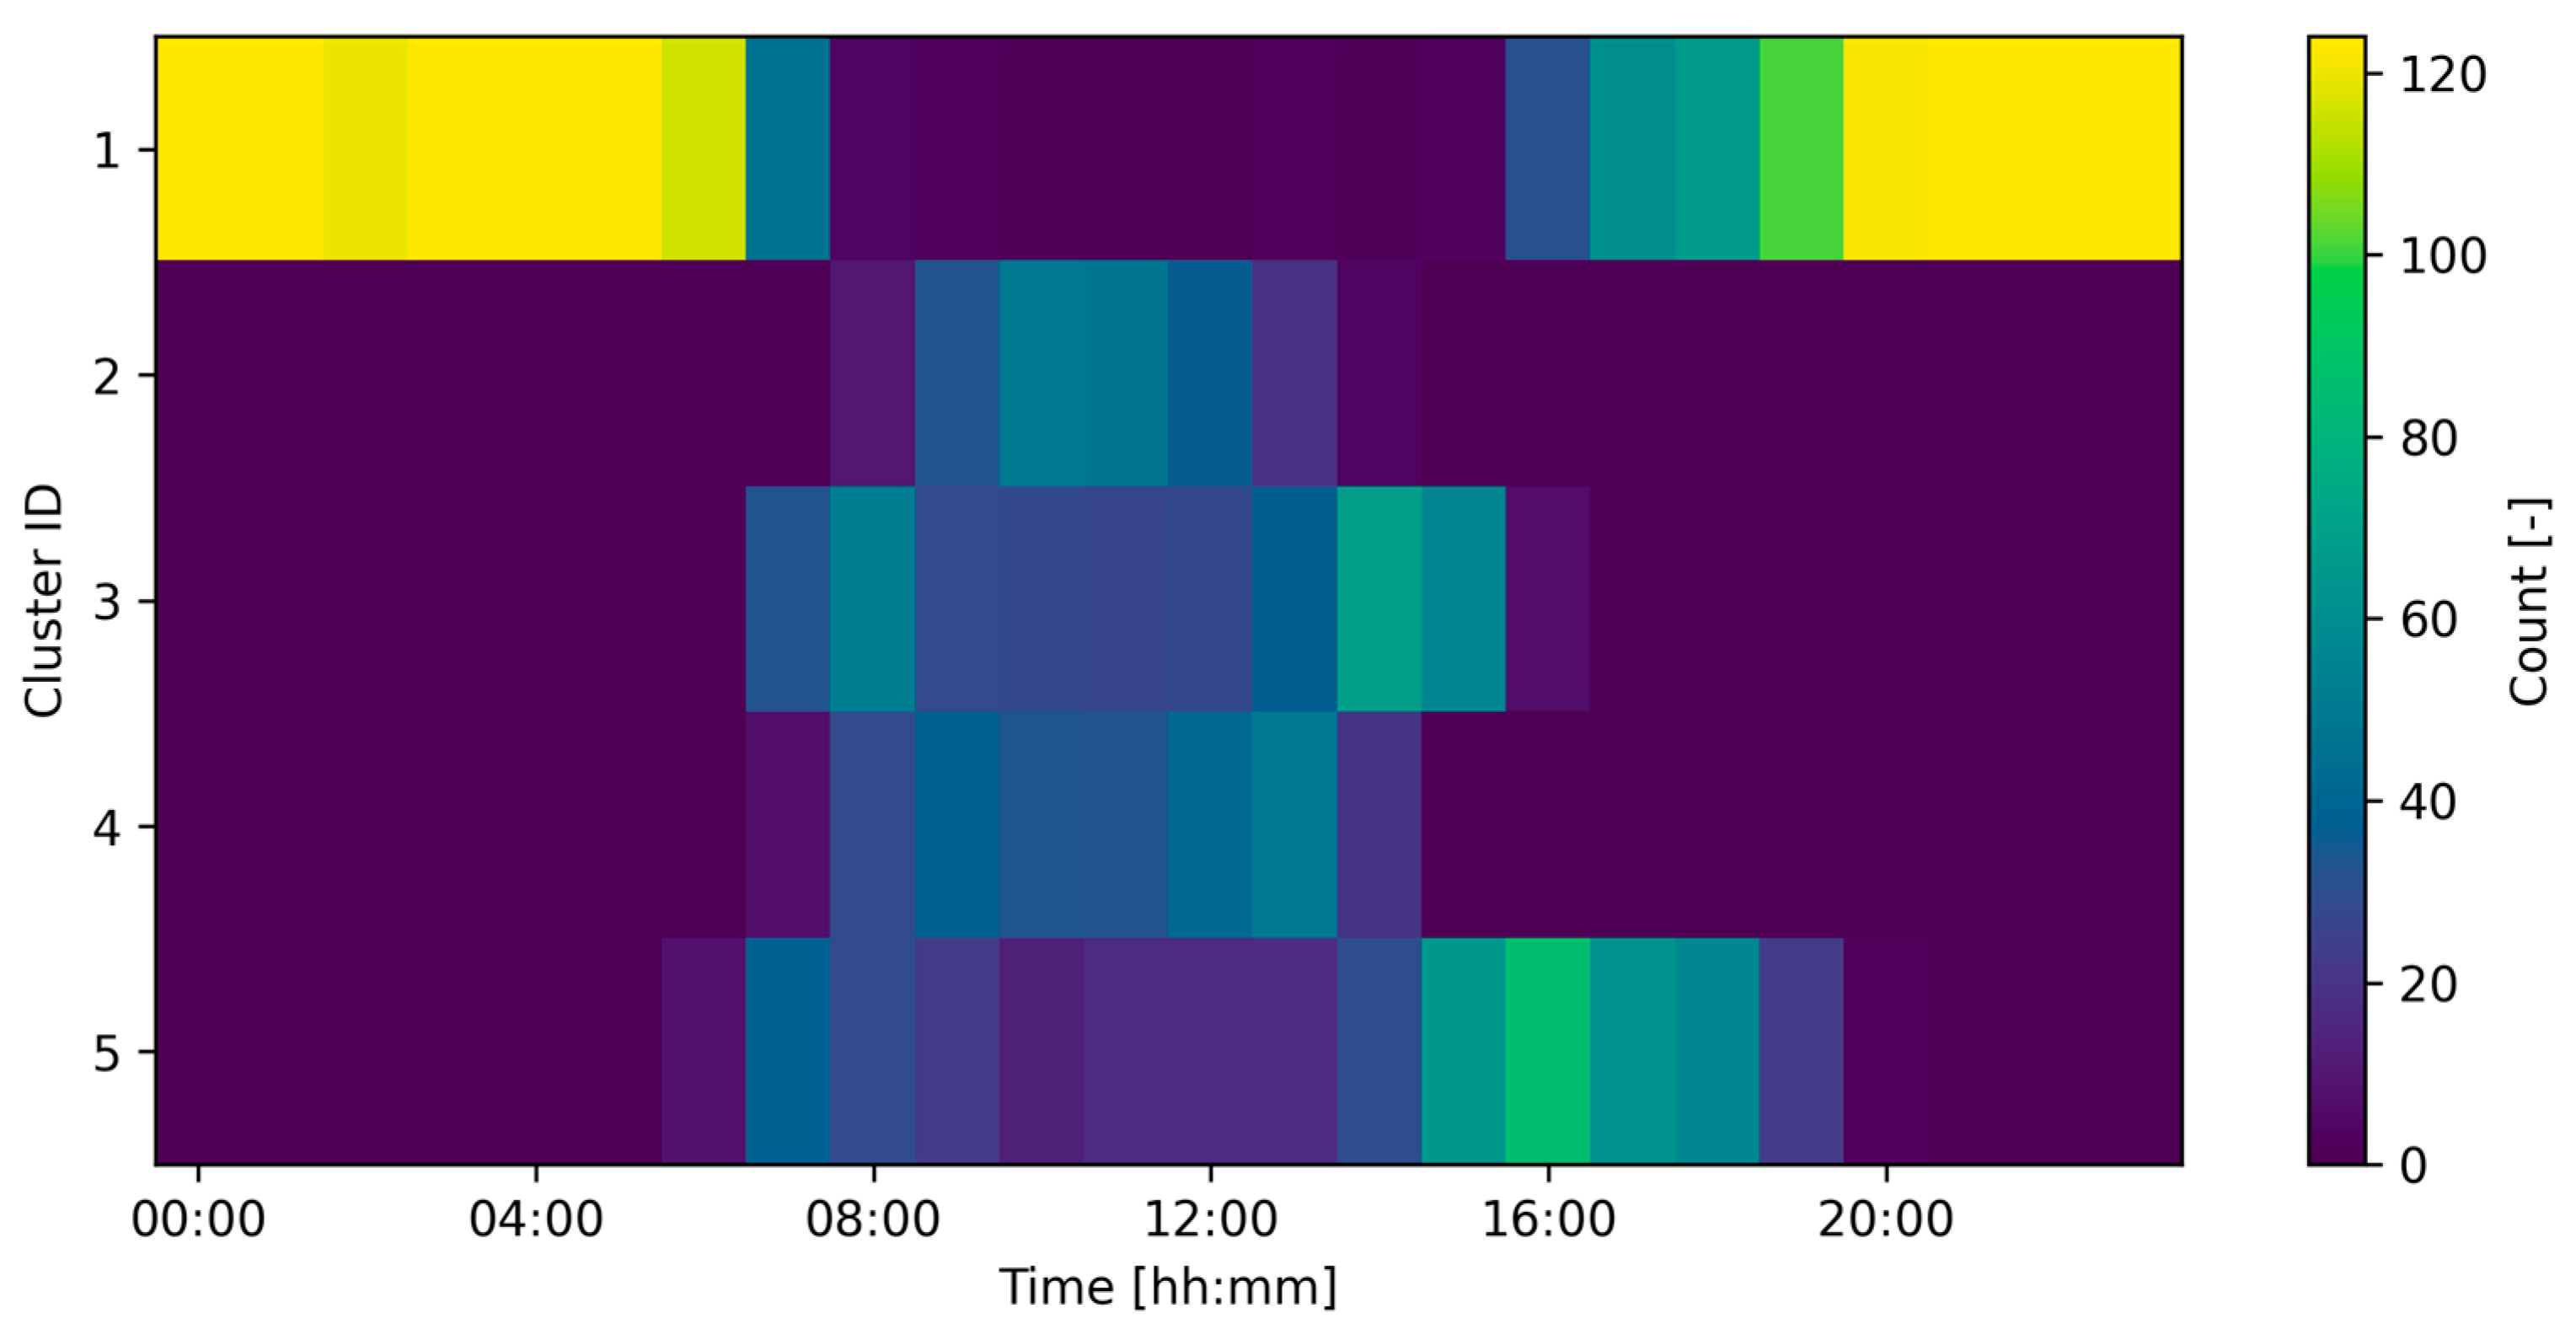
Figure 4 shows the hourly occurrence of the clustering-based operating states over the 24 h period, aggregated for all days of March 2025. The heatmap shows how frequently each cluster appears within individual hourly intervals, providing insight into the typical daily distribution of energy states. Clusters associated with low PV production occur predominantly during nighttime and early morning hours, reflecting the absence of solar generation. In contrast, clusters characterized by higher production levels are concentrated around midday, coinciding with peak solar availability. Transitional clusters appear mainly during morning and afternoon periods, indicating gradual shifts between dominant consumption and dominant production regimes. The figure highlights the strong dependence of operating states on the time of day, driven primarily by the diurnal nature of PV generation. At the same time, the aggregation over hours demonstrates that clustering captures the prevalence of states but does not preserve the temporal ordering or day-specific evolution of profiles.
Figure 4.
Hourly occurrence of clustering-based operating states (5 clusters).
Based on the clustering results, it is also possible to compute the relative frequency of occurrence of individual operating states over selected time horizons. Such information can be used to construct state diagrams and transition matrices describing the probability of moving between clusters in consecutive time steps. This representation enables a compact description of typical energy system dynamics and recurring operational patterns. In the context of energy management, knowledge of state frequencies and transition likelihoods may support decision-making related to demand scheduling, storage utilization, and anticipatory control strategies.
3.3. DTW-Based Comparison of Daily PV and Load Profiles
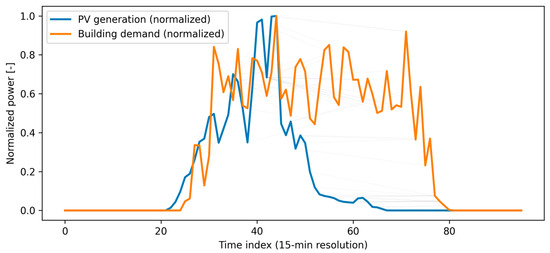
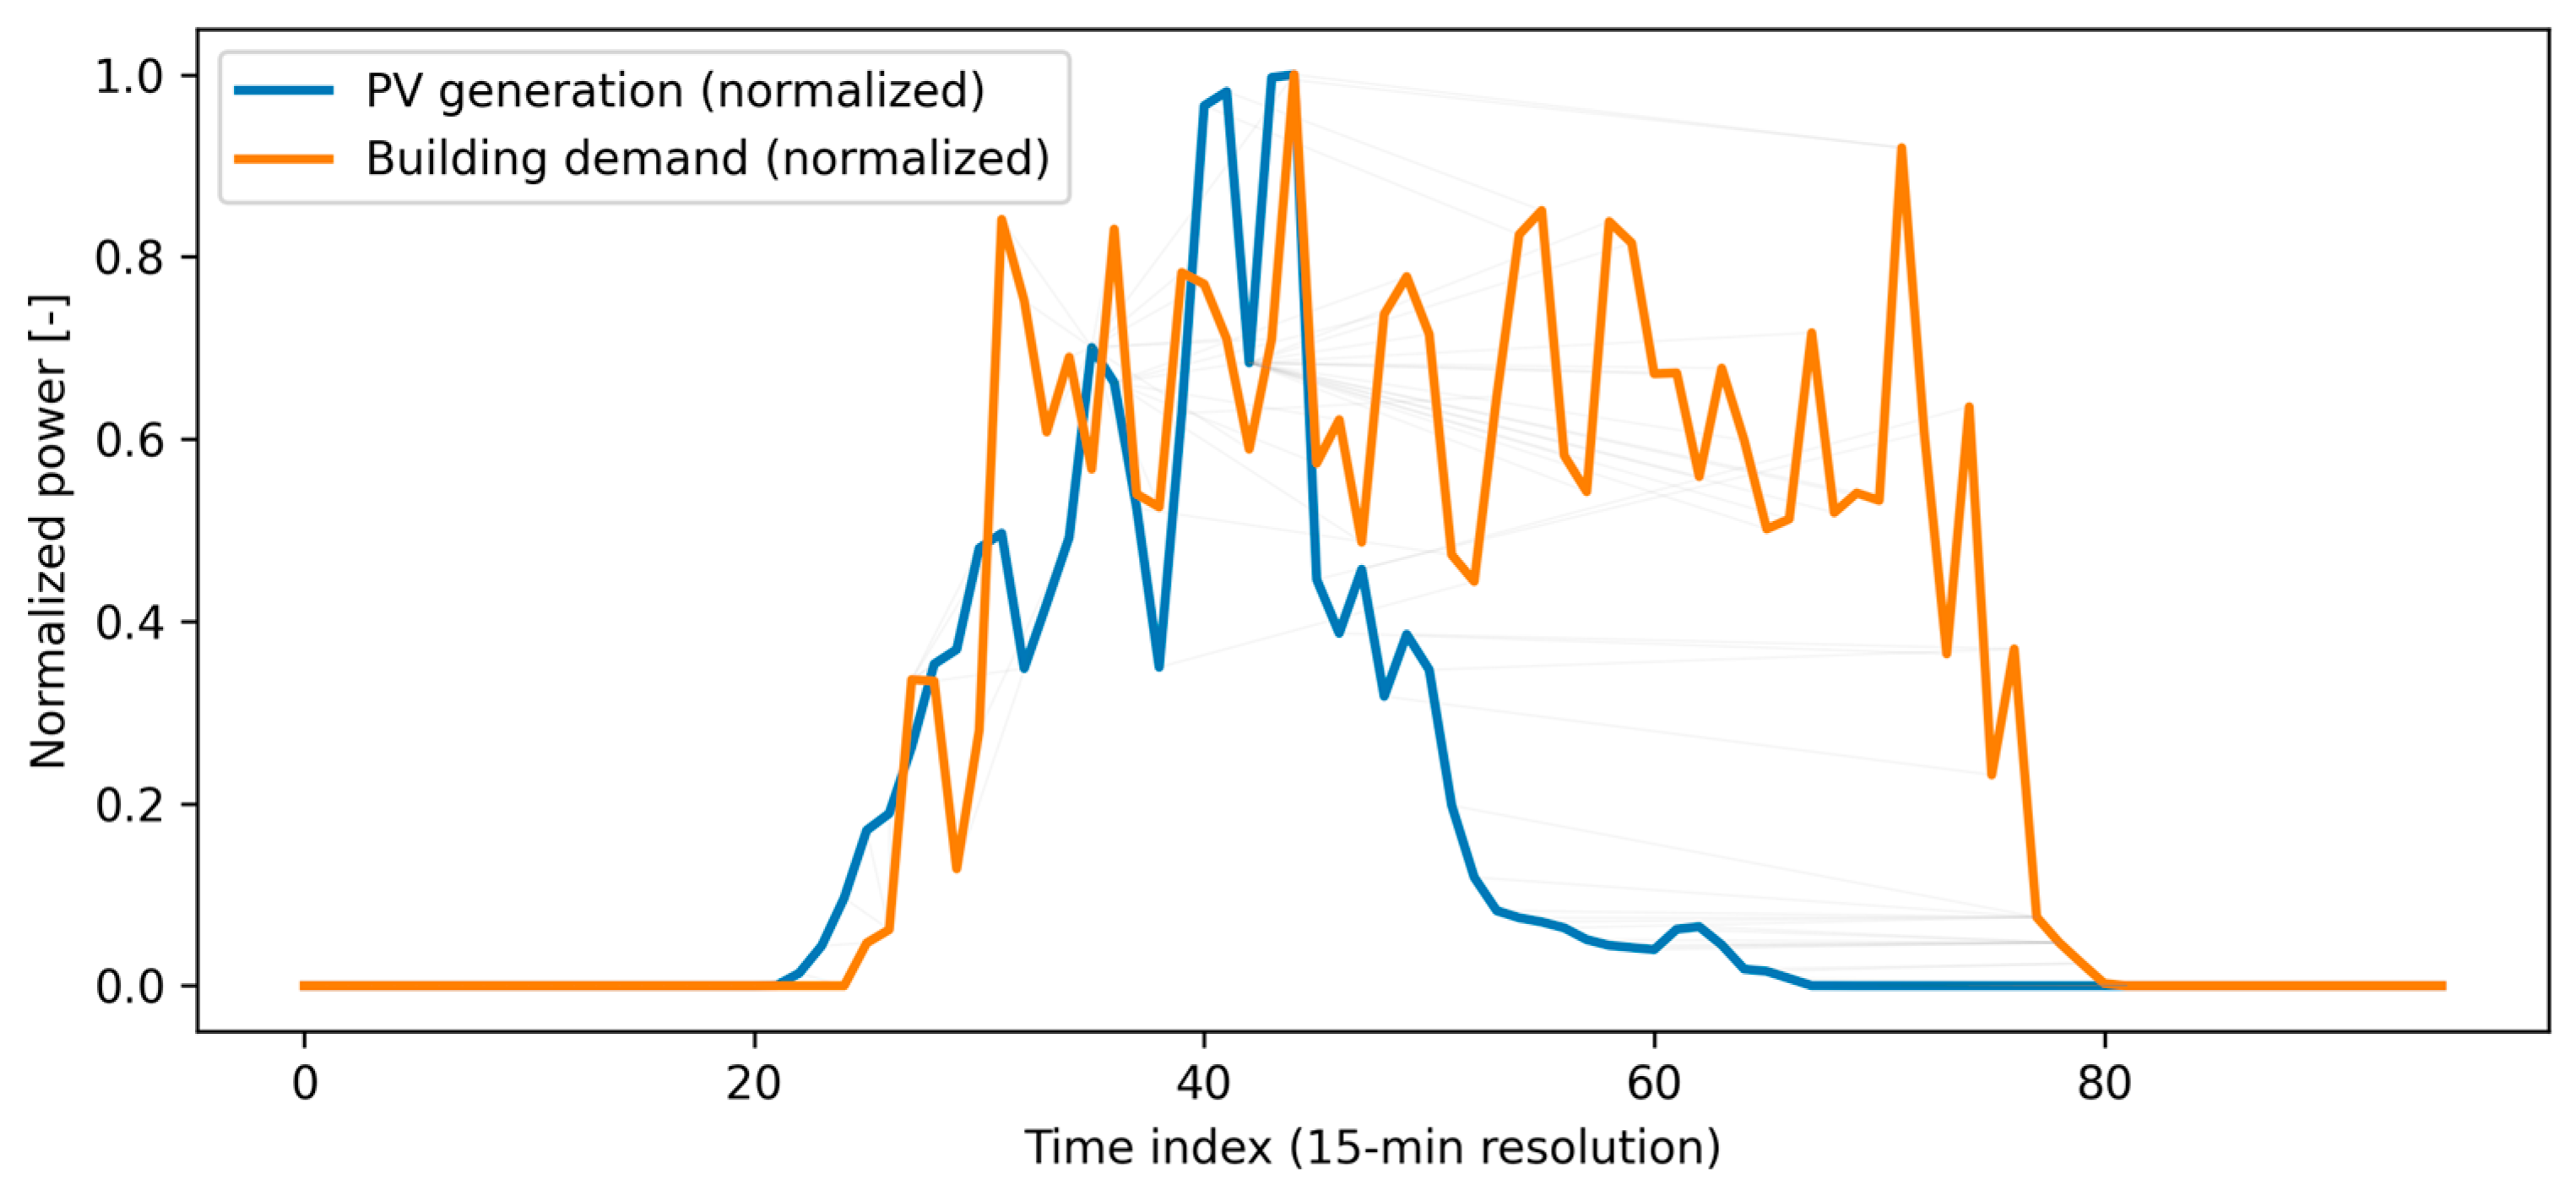
Figure 5 presents the principle of DTW using daily PV generation and building demand profiles recorded on 23 March 2025. Both profiles are normalized to emphasize differences in temporal structure rather than absolute power levels. The two curves represent sequences sampled at a 15 min resolution and exhibit a clear temporal mismatch between production and demand. The dense set of connecting lines visualizes the full DTW path, showing how individual points from one profile are optimally matched with points from the other. Unlike point-to-point comparison, DTW allows multiple points from one sequence to be aligned with a single point from the other, effectively stretching or compressing time locally. Regions with nearly vertical or horizontal connections indicate areas of pronounced temporal misalignment. Diagonal connections correspond to segments where both profiles evolve synchronously. The illustration highlights how DTW preserves the overall shape of the profiles while compensating for time shifts. This mechanism enables a meaningful comparison of daily profiles that differ in the timing of key features such as peaks or ramps. As a result, DTW provides a robust measure of dynamic energy matching that cannot be obtained from state-based or instantaneous analyses.
Figure 5.
DTW path illustration for 23 March 2025.
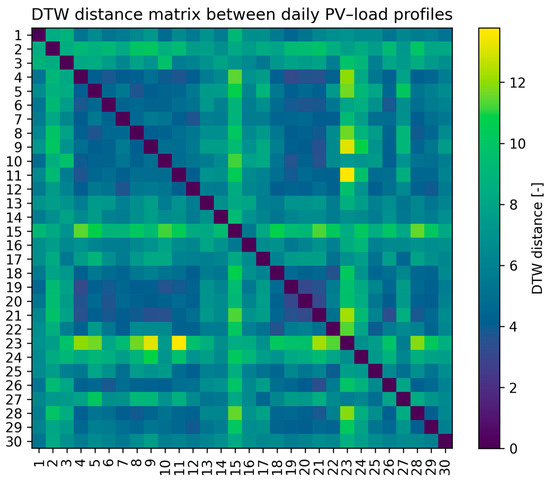
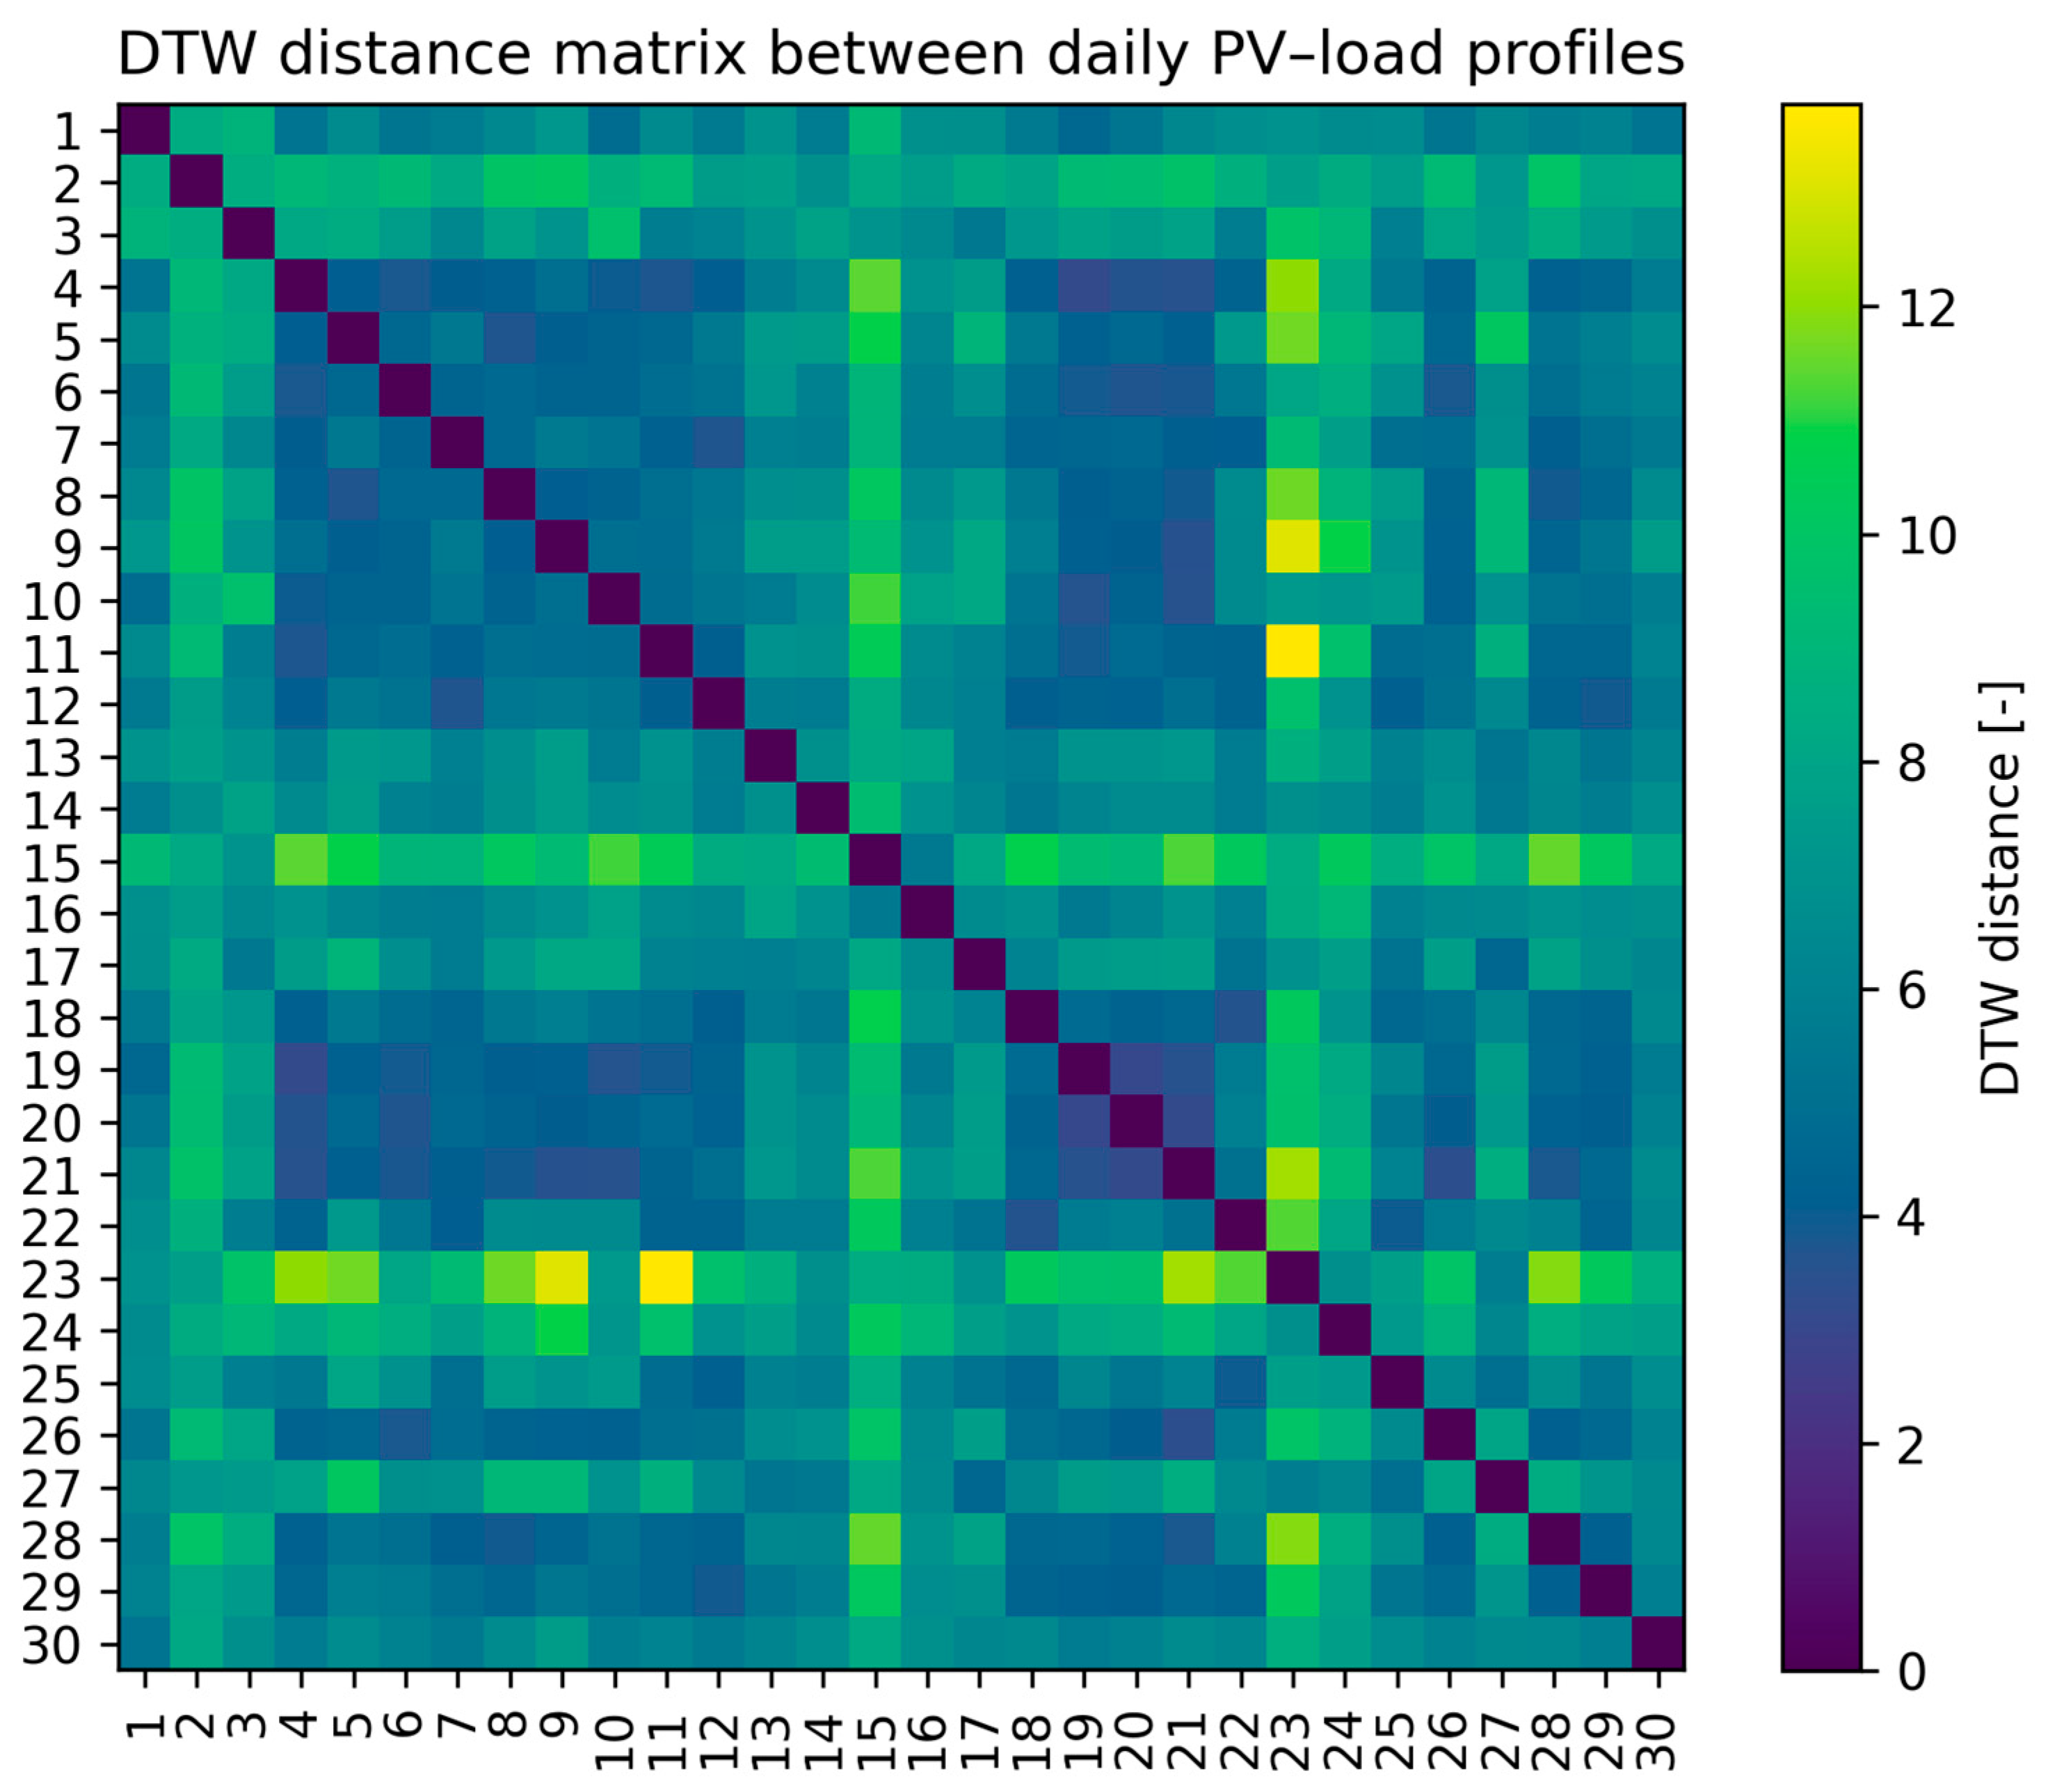
A symmetric warping window corresponding to ±2 h (±8 samples at 15 min resolution) was applied to constrain DTW paths to realistic demand-shifting horizons observed in building operation. Figure 6 presents the DTW distance matrix computed between daily PV generation and building demand profiles for all days of March 2025. DTW distance is interpreted as a relative measure of temporal mismatch and is not used to define absolute categories or thresholds; instead, it enables a continuous ordering of days according to temporal alignment. Each element of the matrix represents the DTW distance between a pair of daily profiles after optimal temporal alignment. Low distance values indicate strong similarity in the temporal structure of the profiles, whereas higher values reflect pronounced differences in their time-dependent behavior. The diagonal of the matrix corresponds to self-comparisons and therefore exhibits minimal distances, serving as a consistency check for the method. Off-diagonal patterns reveal groups of days with comparable temporal evolution of generation and demand, despite possible differences in absolute power levels. At the same time, several days show high DTW distances relative to most others, indicating atypical or strongly mismatched temporal profiles. These discrepancies are not directly observable in state-based clustering results, which disregard temporal ordering. The matrix highlights the variability of dynamic energy matching across the analyzed period and demonstrates that days with similar energy states may differ substantially in temporal alignment. By capturing nonlinear temporal shifts between profiles, DTW provides information that is complementary to clustering-based analyses. This figure thus establishes the basis for a more detailed investigation of agreement and divergence between state-oriented and time-oriented methods.
Figure 6.
DTW distance matrix between daily PC-load profiles.
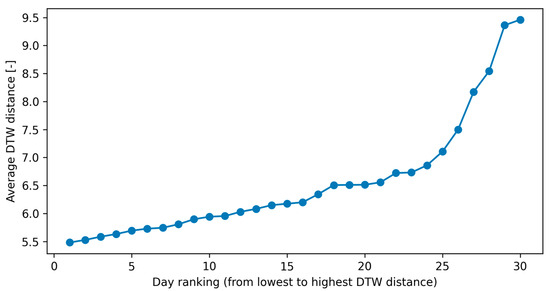
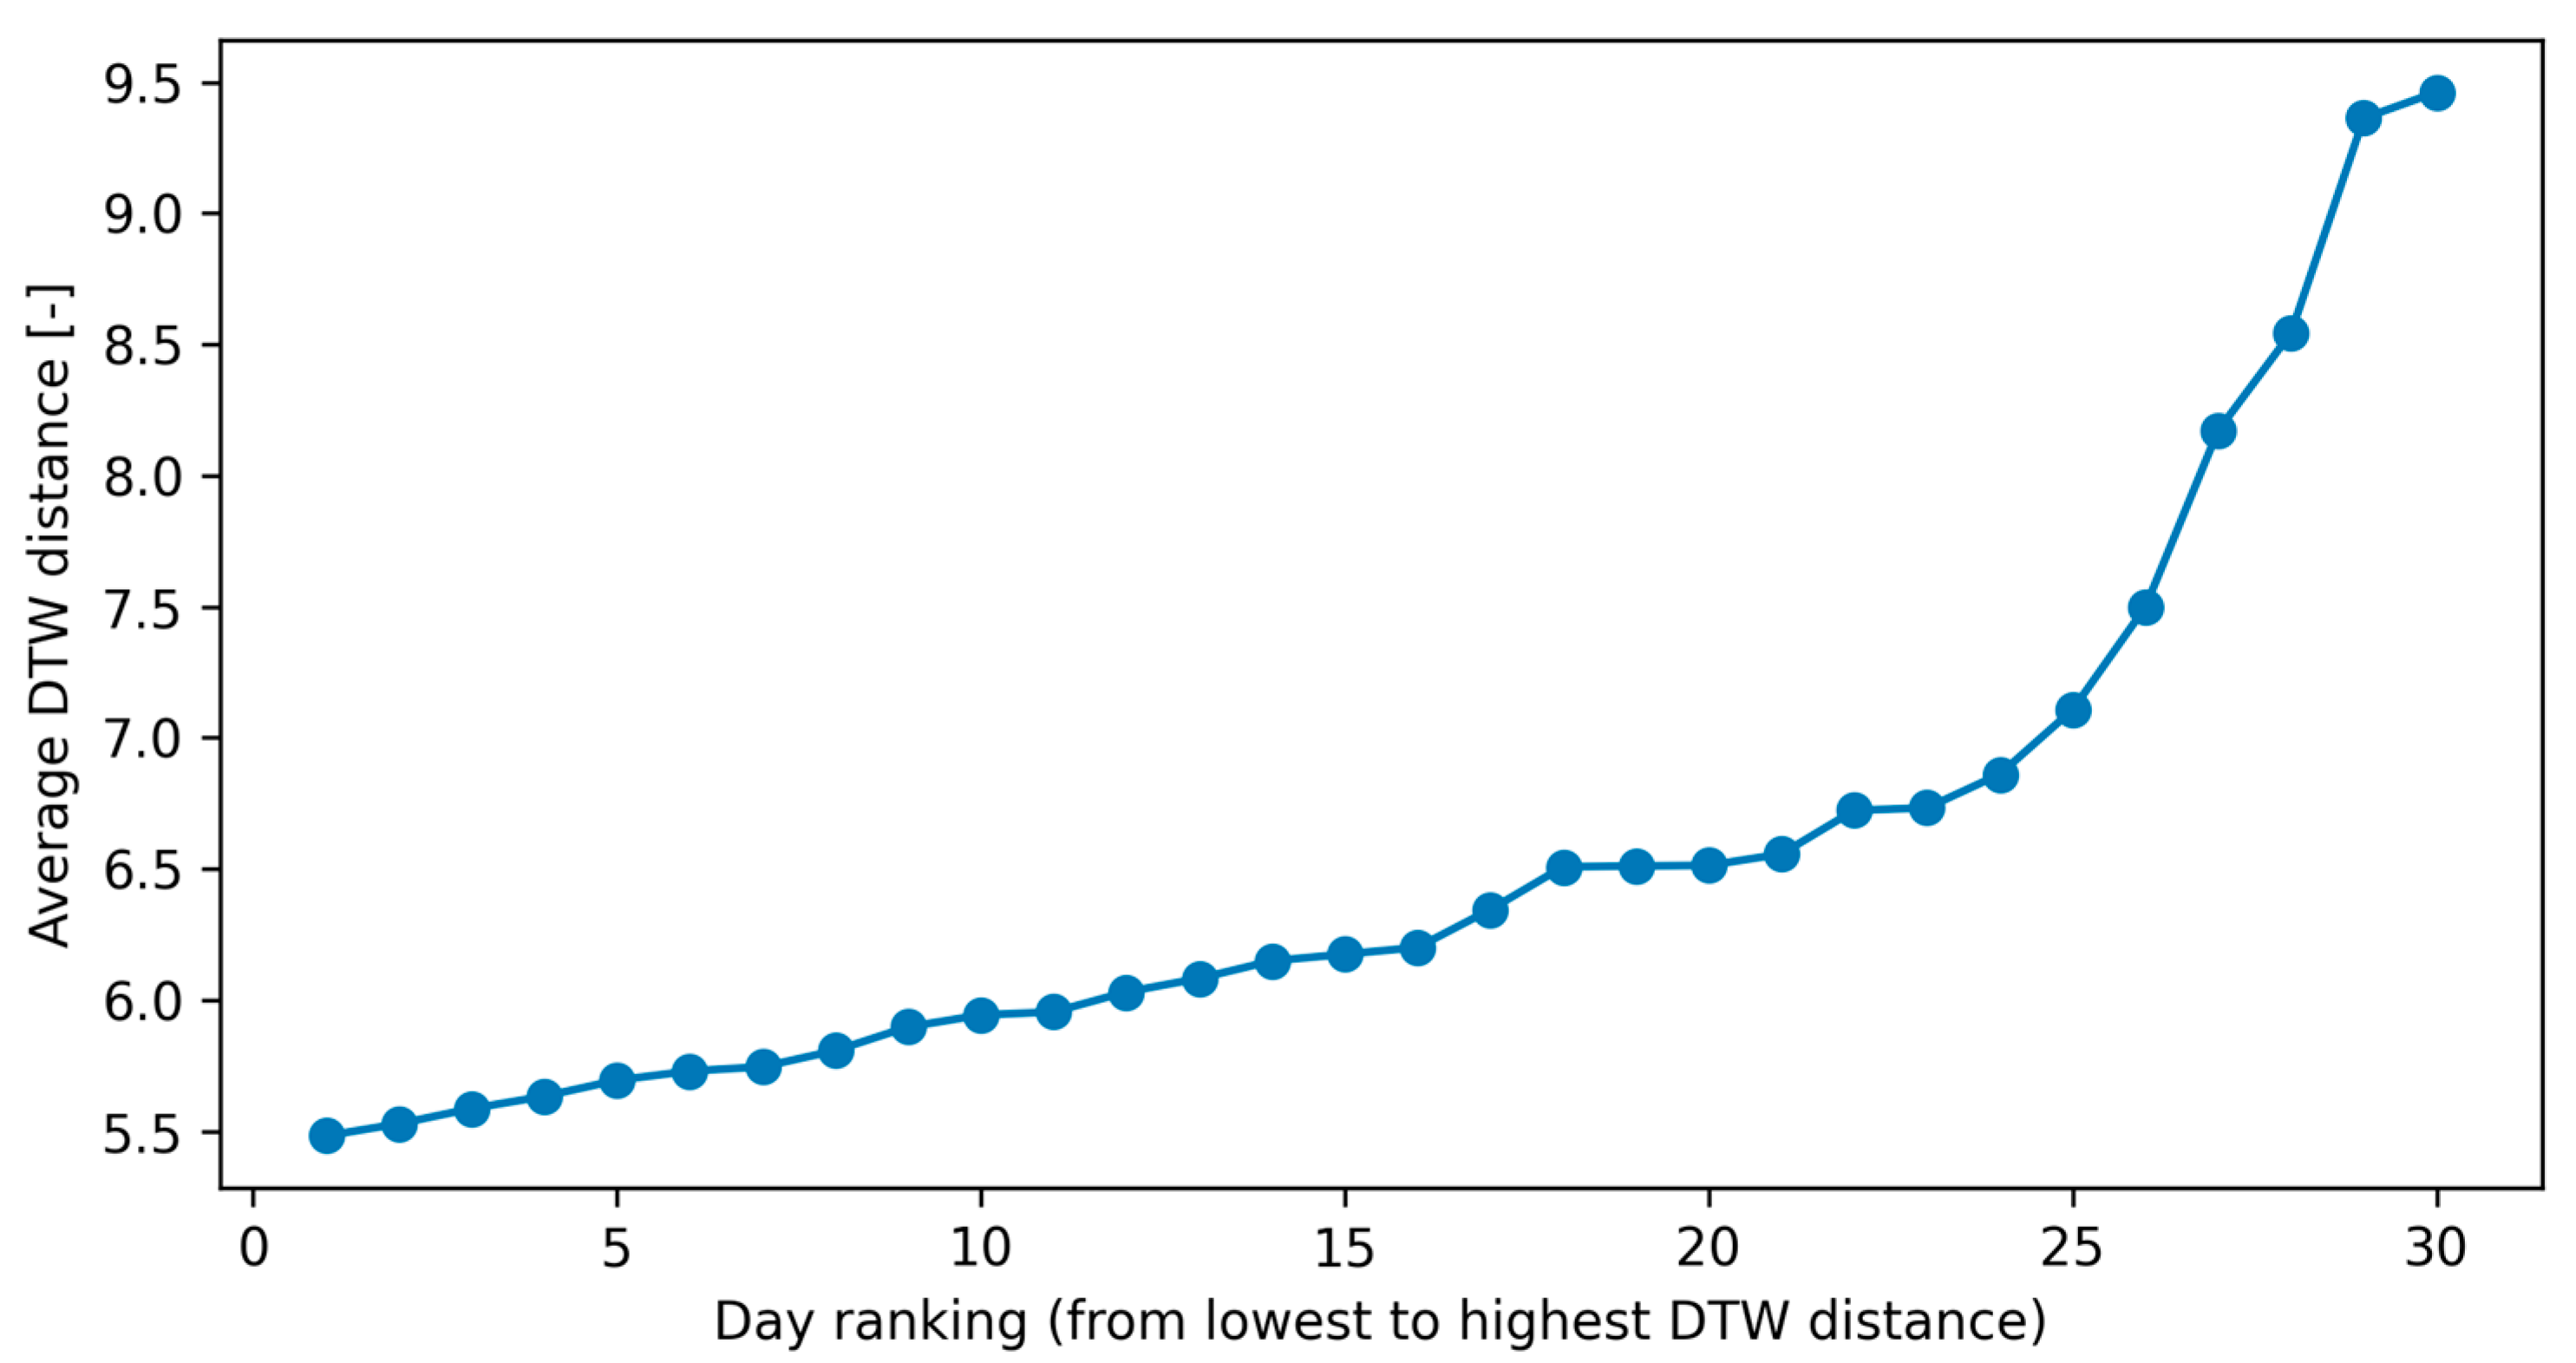
Figure 7 presents a ranking of daily PV generation and building demand profiles based on the average DTW distance computed for each day relative to all other days in the analyzed period. The horizontal axis represents the ordered sequence of days, sorted from the lowest to the highest average DTW distance, and does not correspond to the chronological order of the calendar. The vertical axis shows the mean DTW distance, which quantifies how strongly the temporal structure of a given day differs from the remaining days after optimal time alignment. Days located on the left side of the ranking exhibit low average DTW distances and can therefore be interpreted as temporally typical, characterized by recurrent and repeatable PV–load profiles. In contrast, days appearing on the right side of the plot display markedly higher DTW distances, indicating atypical temporal behavior and pronounced misalignment between generation and demand. The gradual increase in DTW distance across the ranking highlights the continuous nature of temporal variability rather than a sharp separation into discrete classes. Importantly, this ordering cannot be inferred from clustering-based results, as clustering does not account for the sequential structure of daily profiles. The figure demonstrates that days occupying similar regions of the energy state space may nonetheless differ substantially in their temporal evolution. As such, the ranking provides a complementary perspective on dynamic energy matching by identifying both representative and outlying daily patterns. This representation forms a basis for selecting case-study days to further compare agreement and divergence between state-oriented and time-oriented analytical approaches.
Figure 7.
Ranking of daily PV-load profiles based on DTW distance.
Future work may extend the proposed analysis by applying hierarchical clustering to daily PV–load profiles using DTW-based distance measures in order to identify natural families of days with similar temporal dynamics. Such an approach would enable a deeper exploration of intra-month variability and facilitate the selection of representative day types beyond state-based classifications. This perspective could support the development of adaptive energy management strategies tailored to distinct temporal patterns of generation and demand.
3.4. Case Studies: When Clustering and DTW Agree
This subsection examines representative cases in which state-based clustering and DTW lead to consistent conclusions regarding the similarity of daily PV generation and building demand profiles. Days located at the lower end of the DTW-based ranking exhibit low average DTW distances, indicating strong temporal similarity with the majority of the analyzed period. For these days, clustering results also tend to be stable, with operating points occupying similar regions of the production–consumption state space. The temporal distribution of clusters shows comparable patterns across such days, particularly with respect to the dominance of specific operating states during daytime and nighttime periods. In these cases, both methods identify days characterized by repeatable daily structures, including similar timing of PV production peaks and building load variations. The agreement between clustering and DTW suggests that temporal alignment and instantaneous energy relationships are mutually consistent for these profiles. As a result, state-based descriptions provide a sufficiently accurate representation of daily operation without requiring explicit temporal warping. These cases can therefore be interpreted as energetically and temporally typical days within the analyzed month. From a practical perspective, such days may serve as representative references for system characterization, baseline modeling, or validation of energy management strategies. The observed agreement also confirms that DTW does not contradict clustering results but rather generalizes them by incorporating temporal information. This consistency establishes a reliable foundation for identifying cases in which the two methods diverge, which are analyzed in the following subsection.
3.5. Case Studies: When Clustering and DTW Diverge
This subsection analyzes representative cases in which state-based clustering and DTW lead to contrasting interpretations of daily PV generation and building demand profiles. Such cases are typically located at the upper end of the DTW-based ranking, where high average DTW distances indicate pronounced temporal dissimilarity relative to other days. Despite this temporal mismatch, clustering results may still classify these days as similar, as instantaneous operating points occupy comparable regions of the production–consumption state space. The temporal distribution of clusters further reveals that these days may exhibit similar proportions of operating states over the course of the day. However, DTW exposes substantial shifts in the timing of key features, such as PV production peaks or demand maxima, which remain invisible to clustering-based analyses. As a result, days that appear energetically similar in a state-based sense may differ fundamentally in their temporal evolution. This divergence highlights the limitation of clustering methods that disregard the sequential structure of time series data. From an energy management perspective, such temporal mismatches may have significant implications for self-consumption, storage utilization, and load shifting strategies. The identified cases demonstrate that temporal alignment is a critical dimension of energy matching that cannot be inferred from static operating states alone. Consequently, DTW provides complementary insight that is essential for a comprehensive assessment of daily PV–load interactions.
3.6. Implications for Dynamic Energy Matching and Energy Management
The combined results of clustering-based analysis and DTW provide important insights into the nature of dynamic energy matching between PV generation and building electricity demand. While clustering effectively identifies typical operating states and their prevalence, it does not capture the temporal alignment of generation and consumption within a day. DTW complements this perspective by explicitly quantifying temporal similarity and revealing time shifts that may critically affect self-consumption and grid interaction. The case studies demonstrate that days with comparable energy states may differ substantially in their suitability for on-site energy utilization due to temporal mismatches. From an energy management standpoint, this distinction is particularly relevant for systems incorporating storage, flexible loads, or demand response strategies. Temporal information provided by DTW may support anticipatory control by identifying days that require active load shifting or storage scheduling. Conversely, days characterized by strong agreement between clustering and DTW may be managed using simpler, state-based strategies. The proposed framework thus enables a differentiated approach to energy management that accounts for both instantaneous operating conditions and their temporal organization. These findings highlight the importance of integrating time-aware similarity measures into the analysis of building-integrated PV systems.
3.7. Quantitative Energy Performance Indicators and Their Relation to DTW-Based Temporal Similarity
3.7.1. Definition of Daily Energy Performance Indicators
To quantitatively assess the practical relevance of temporal alignment between PV generation and building electricity demand, two daily energy performance indicators were introduced. The daily self-consumption ratio SCRd—Equation (1) was defined as the fraction of PV energy directly utilized by the building without being exported to the grid. It was calculated as the ratio of the time-integrated minimum of PV generation and building demand to the total daily PV energy production. In addition, a PV–load temporal overlap index OLd—Equation (2) was defined to quantify the effective coincidence between generation and demand profiles over the course of the day. This index captures the proportion of PV energy that temporally overlaps with building consumption, independent of instantaneous operating states. Both indicators were computed on a daily basis using 15 min resolution data and provide physically interpretable measures of energy utilization that can be directly related to temporal matching between generation and demand.
3.7.2. Correlation Between DTW Distance and Energy Indicators
To examine whether temporal similarity captured by DTW is reflected in quantitative energy performance metrics, the DTW distance between daily PV generation and building electricity demand profiles was compared with two daily indicators: the self-consumption ratio (SCR) and a temporal overlap index (OL). Both indicators were computed on a daily basis using 15 min resolution data, while DTW distances were derived from normalized daily profiles to isolate temporal structure from absolute power levels.
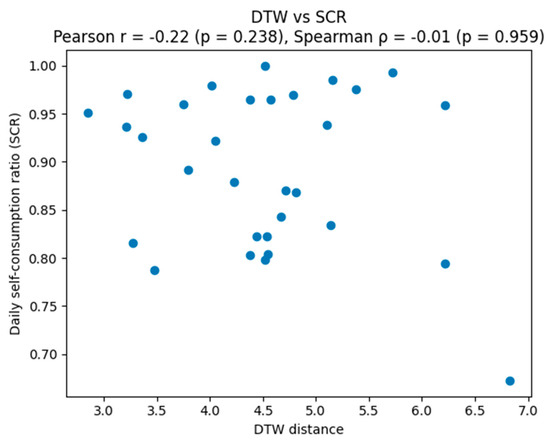
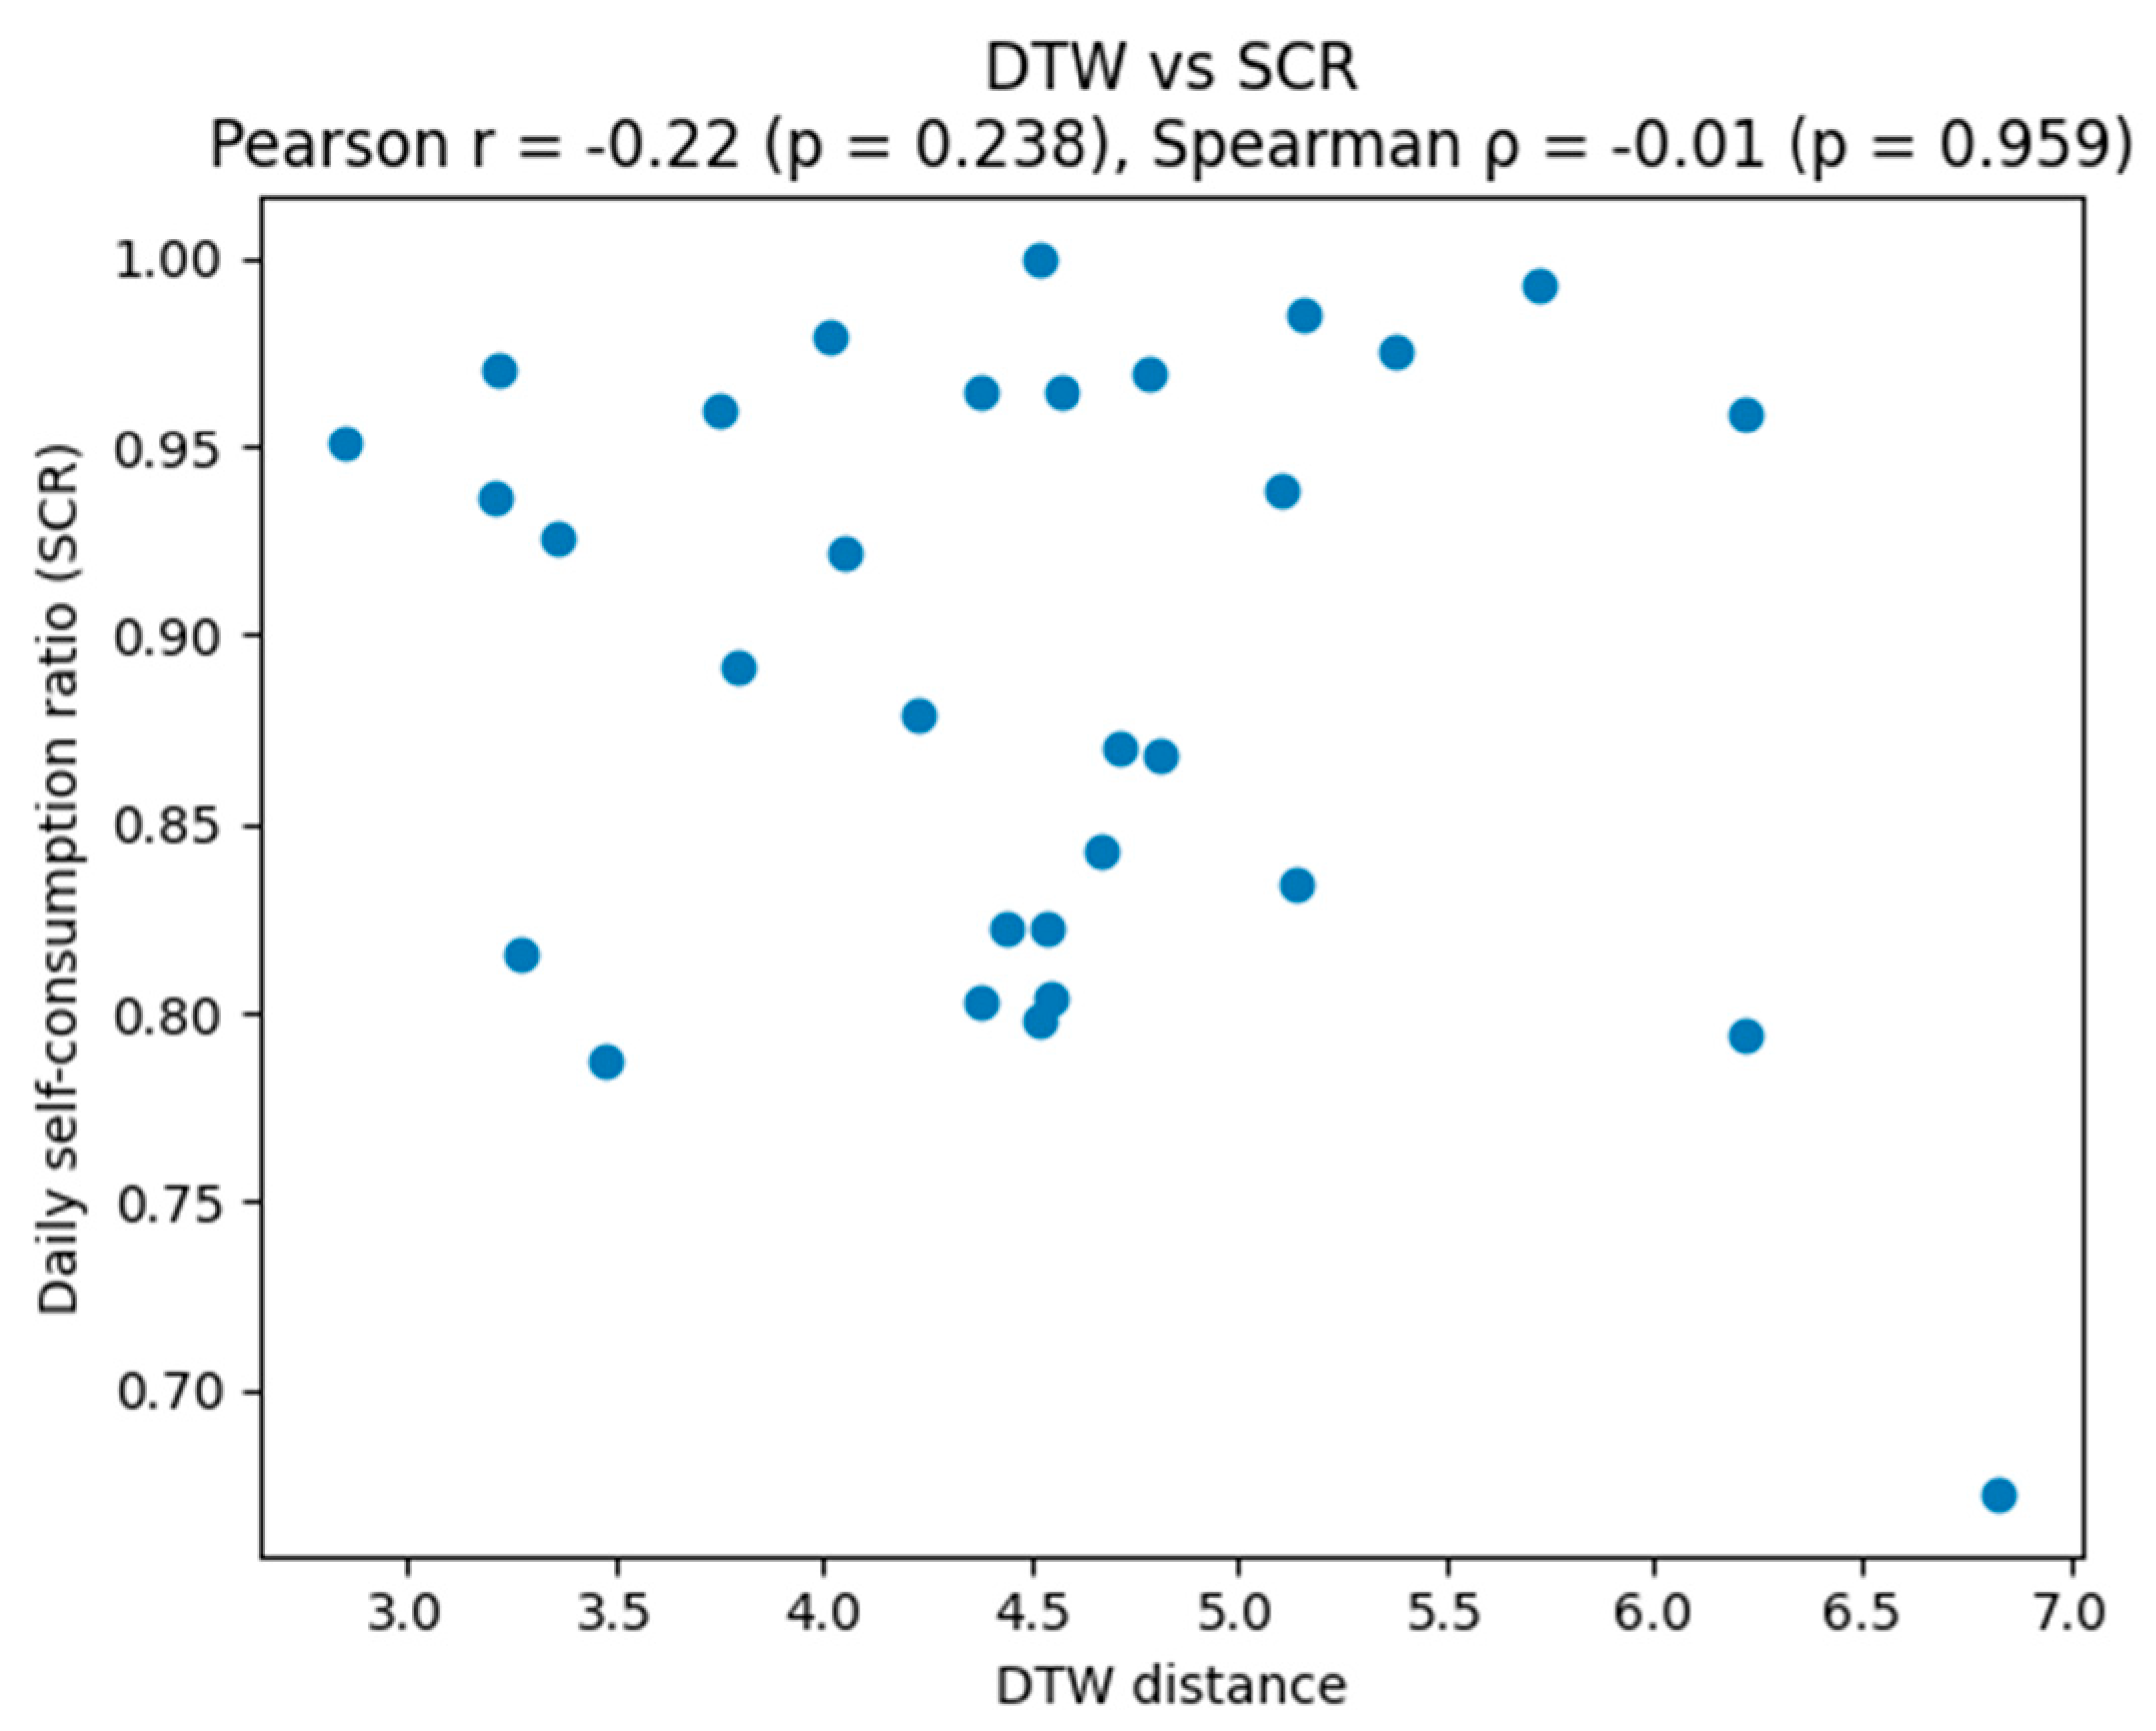
Figure 8 presents the relationship between DTW distance and the daily self-consumption ratio. Although days with large DTW distances tend to include lower values of SCR, no statistically significant correlation is observed over the analyzed period. This result can be attributed to the specific characteristics of the investigated building, which exhibits a consistently high daytime load relative to PV generation. Under such conditions, the self-consumption ratio remains close to saturation for most days, limiting its sensitivity to temporal misalignment between generation and demand. Consequently, SCR primarily reflects the overall energy balance rather than the detailed temporal organization of the profiles.
Figure 8.
Scatter plot showing the relationship between the DTW distance between daily PV generation and building electricity demand profiles and the corresponding daily self-consumption ratio (SCR). Each point represents one day of the analyzed period. The figure depicts the variability of self-consumption levels across days with different degrees of temporal alignment.
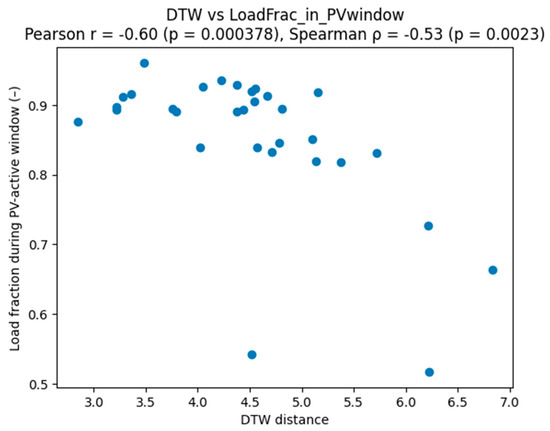
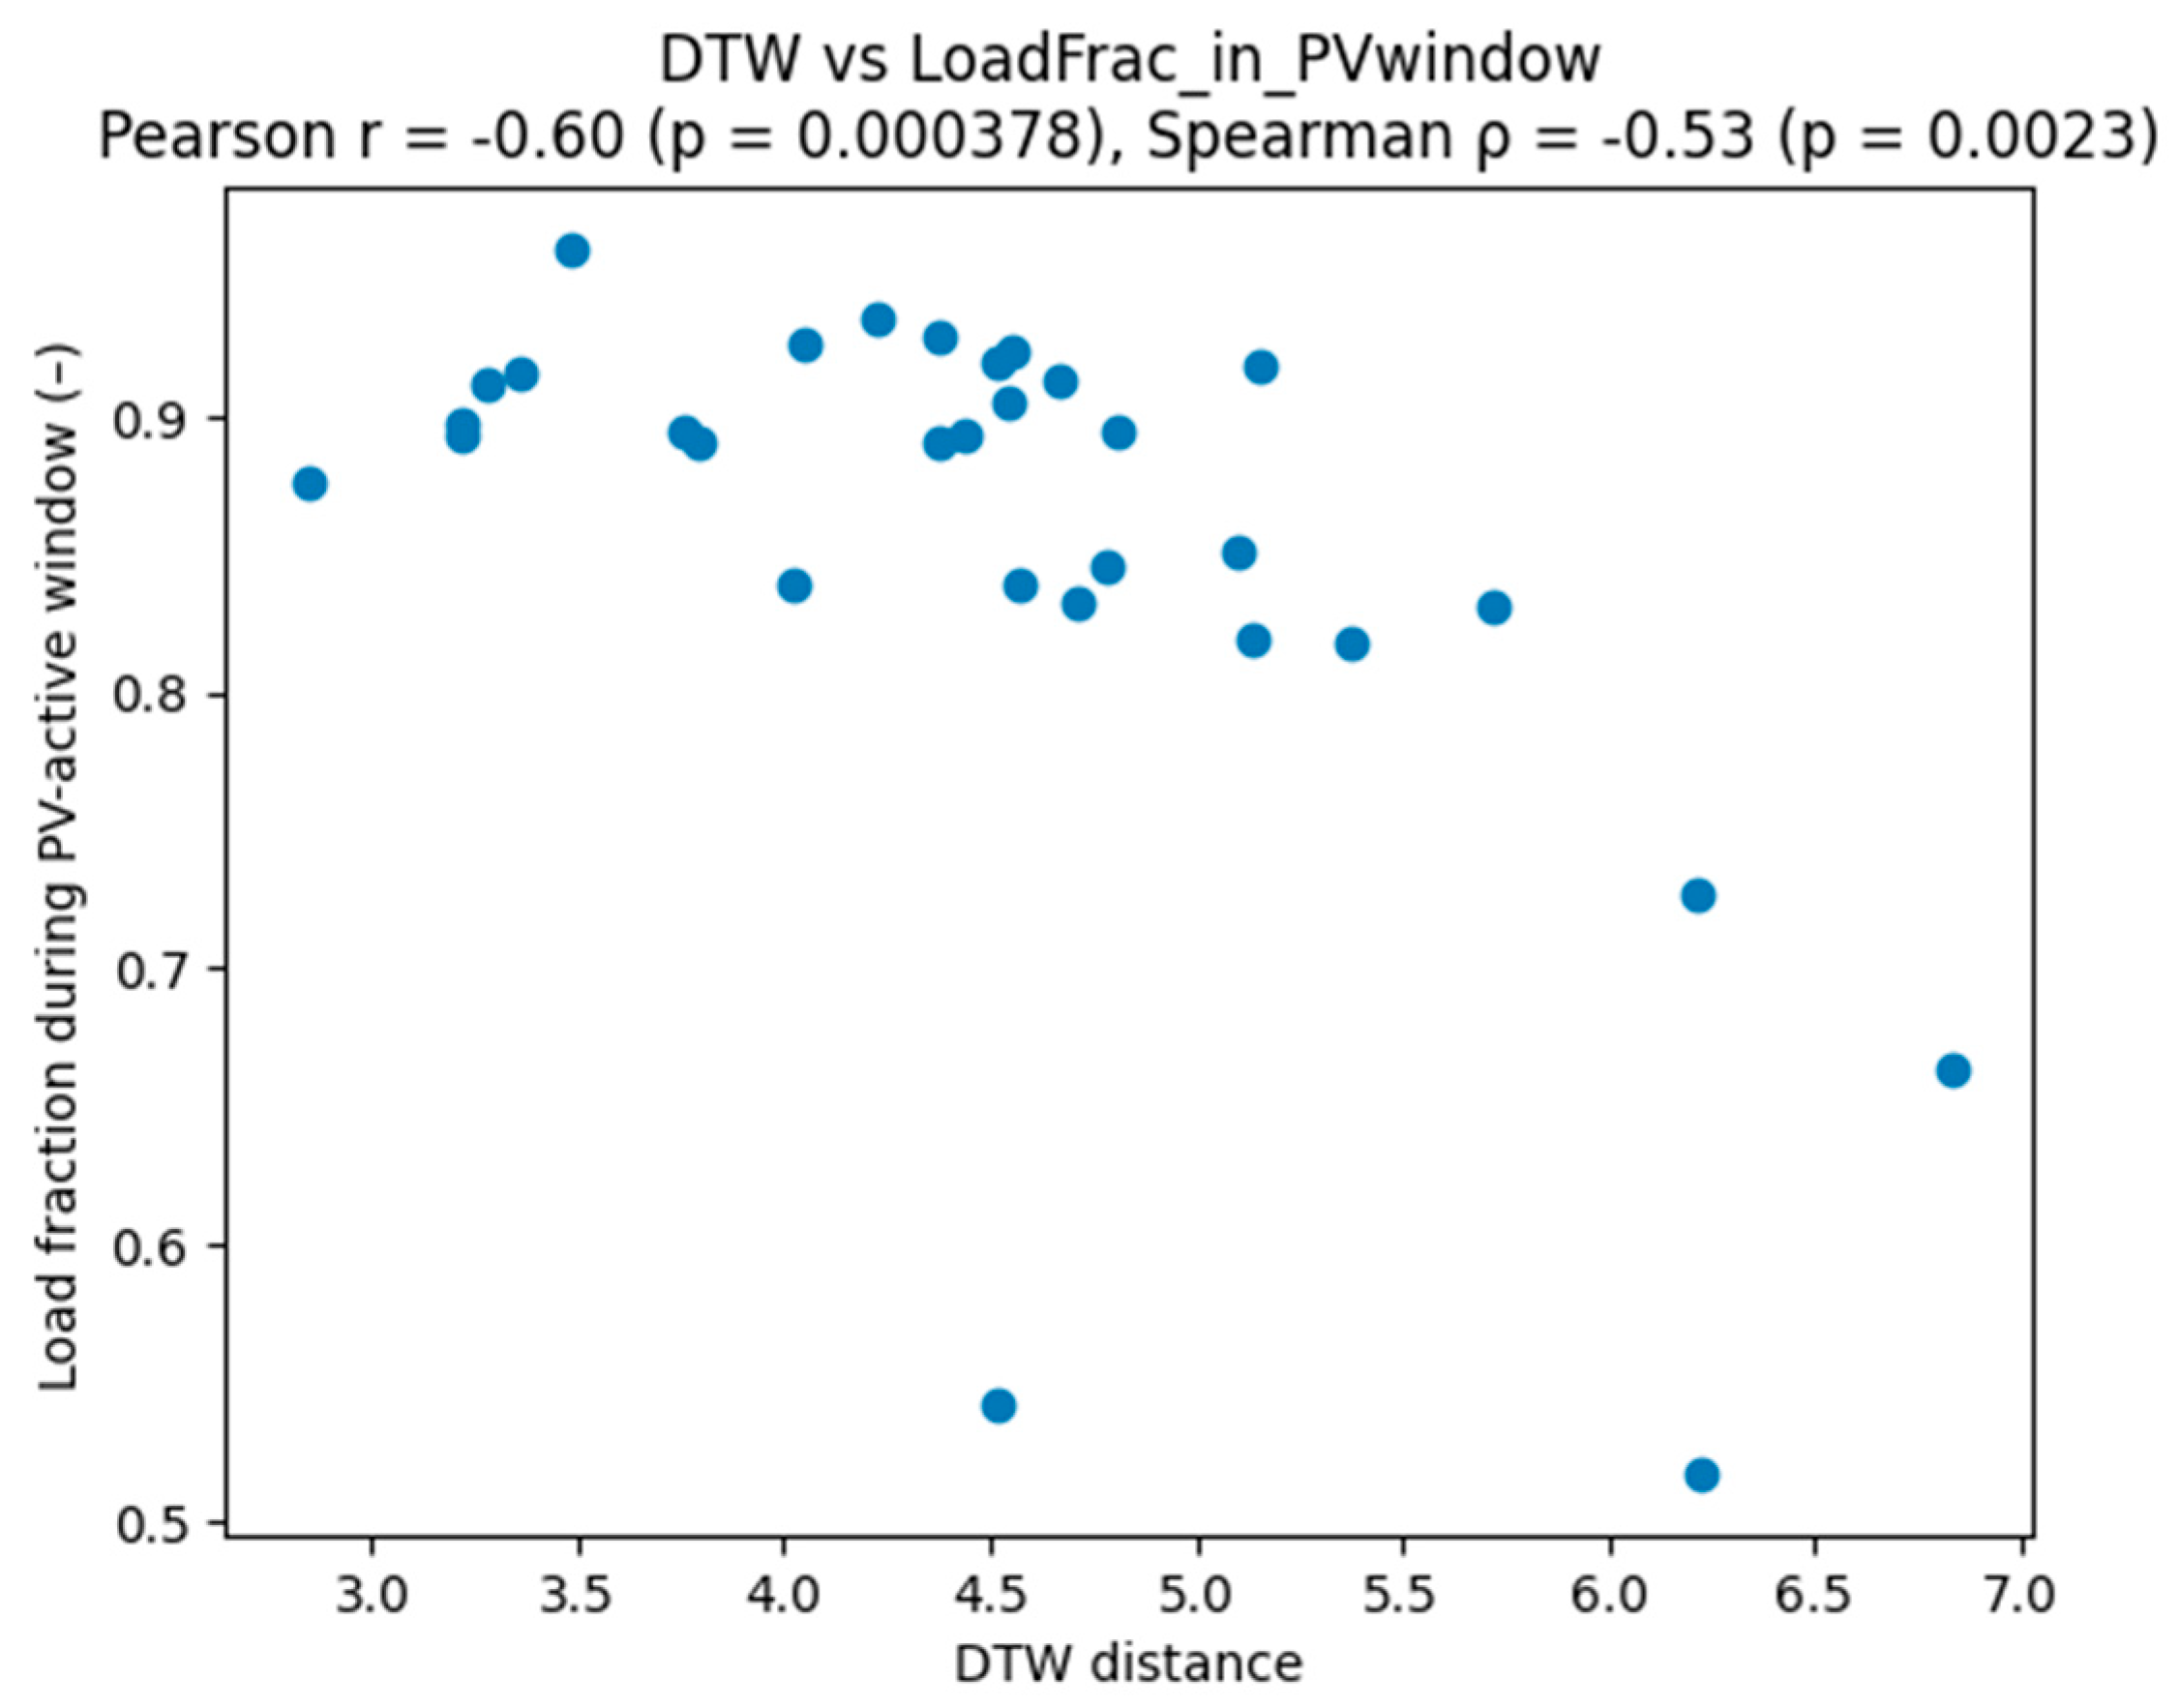
To explicitly assess the impact of temporal alignment, a PV–load temporal overlap index was introduced, defined as the fraction of daily building load occurring during the PV active window. Figure 9 shows a clear and statistically significant negative relationship between DTW distance and the overlap index. Higher DTW distances, indicating stronger temporal mismatch between PV generation and building demand, are associated with a reduced share of load coinciding with periods of active PV production (Pearson r = −0.60, p < 0.001; Spearman ρ = −0.53, p < 0.01). This result demonstrates that DTW-based temporal distance is strongly linked to a physically interpretable measure of load–generation coincidence.
Figure 9.
Scatter plot showing the relationship between the DTW distance (computed between normalized daily PV generation and building demand profiles) and the temporal overlap index OL, defined as the fraction of daily building load occurring during the PV-active window (PVnorm > 0.1). The negative correlation indicates that stronger temporal mismatch is associated with lower load coincidence within the PV generation window.
Taken together, these findings indicate that the relevance of DTW depends on the choice of performance indicator. While energy-based metrics such as SCR may obscure temporal effects under high-load conditions, temporally sensitive indicators reveal a clear relationship between DTW distance and effective PV–load alignment. This confirms that DTW captures a distinct and operationally meaningful dimension of PV–building interaction that is not accessible through state-based or purely energy-aggregated measures alone.
To summarize the complementary roles of state-based clustering and DTW-based temporal analysis, Table 1 provides a structured comparison of the information captured by each method and its relation to the quantitative energy performance indicators used in this study. The table highlights how instantaneous operating regimes and temporal alignment address different aspects of PV–building interaction and clarifies under which conditions temporal similarity measures provide additional insight beyond state-based representations.
Table 1.
Comparative interpretation of state-based clustering and DTW-based analysis.
Table 2 summarizes a representative daily comparison combining state-based clustering results with DTW-based temporal similarity and quantitative energy performance indicators. For each selected day, the dominant daytime operating regime identified in the production–consumption space (excluding the night-time no-PV cluster) is reported together with its temporal prevalence and the corresponding DTW distance and energy indicators. The table presents that days characterized by the same dominant operating regime may exhibit substantially different temporal alignment and energy outcomes.
Table 2.
Representative daily comparison of dominant daytime operating regimes, DTW-based temporal distances, and energy performance indicators.
The results summarized in Table 2 confirm that state-based clustering identifies comparable instantaneous operating regimes across multiple days, while DTW reveals substantial differences in their temporal organization. In particular, days characterized by the same dominant daytime operating regime may exhibit markedly different DTW distances, indicating varying degrees of temporal alignment between PV generation and building demand. These differences are consistently reflected in the temporal overlap index, whereas energy-aggregated indicators such as the self-consumption ratio may remain similar under high-load conditions. This demonstrates that operating state similarity does not imply temporal similarity, and that timing effects constitute an independent dimension of PV–building interaction. Consequently, DTW-based analysis provides complementary information that is essential for interpreting the energetic implications of otherwise similar operating regimes.
4. Discussion
4.1. Interpretation of Key Findings
The presented results demonstrate that the temporal organization of PV generation and building electricity demand constitutes a critical dimension of energy matching that is not captured by state-based analyses alone. The comparison of representative daily profiles revealed that similar energy balances may correspond to fundamentally different temporal relationships between production and consumption. Clustering-based methods effectively identified typical operating states and their distribution over time, providing valuable insight into instantaneous energy interactions. However, the DTW-based analysis showed that days classified as similar in the production–consumption state space may differ substantially in their temporal evolution. The agreement observed for temporally typical days confirms that state-based representations remain valid under conditions of stable and repeatable daily dynamics. In contrast, days exhibiting temporal mismatch highlight situations in which instantaneous similarity masks structural differences in the timing of key features. The DTW distance matrix and subsequent ranking of days revealed a continuum of temporal similarity rather than a binary classification of profiles. These findings indicate that dynamic energy matching cannot be fully assessed without explicitly accounting for temporal alignment. Taken together, the results establish DTW as a complementary analytical tool that extends conventional clustering by incorporating time-dependent information. This integrated perspective provides a more comprehensive understanding of daily PV–load interactions in building energy systems.
4.2. DTW Versus State-Based Approaches
State-based approaches, such as clustering in the production–consumption space, offer an effective means of organizing large volumes of energy data into interpretable operating states. By focusing on instantaneous relationships between generation and demand, these methods provide clear insights into typical energy regimes and their prevalence. However, such representations inherently neglect the sequential structure of time series data and therefore do not capture the temporal alignment of energy flows. DTW addresses this limitation by comparing entire daily profiles and allowing for nonlinear time shifts between characteristic features. Rather than replacing state-based methods, DTW complements them by introducing a time-aware measure of similarity. The case studies demonstrate that agreement between the two approaches occurs when temporal dynamics are stable and repeatable. Conversely, divergence arises when similar instantaneous states are arranged differently in time, leading to distinct operational implications. This comparison highlights that state-based and temporal analyses answer fundamentally different questions about system behavior. Integrating both perspectives enables a more nuanced interpretation of PV–load interactions than either method can provide independently.
4.3. Implications for PV–Building Energy Analysis
The findings of this study have direct implications for the analysis of energy interactions between PV systems and buildings. Temporal alignment between generation and demand emerges as a key factor influencing effective self-consumption and reliance on the electricity grid. Days with similar energy states may differ significantly in operational performance when the timing of production and consumption is taken into account. This distinction is particularly relevant for buildings equipped with flexible loads or energy storage, where temporal mismatch can be mitigated through active control strategies. State-based analyses alone may therefore lead to incomplete conclusions regarding the true utilization potential of on-site generation. The incorporation of DTW-based measures enables the identification of days that require different management approaches despite similar instantaneous characteristics. From a system design perspective, temporal similarity provides additional criteria for evaluating the suitability of storage capacity and control schemes. Overall, the results emphasize that a comprehensive assessment of PV–building systems must consider both the magnitude and the timing of energy flows.
4.4. Methodological Considerations and Limitations
The proposed analysis is subject to several methodological considerations and limitations that should be acknowledged. DTW, while effective in capturing temporal similarity, entails a higher computational cost than state-based methods, particularly when applied to long time series or large datasets. For the analyzed daily profiles (96 samples per day), the computation of DTW distances required only a fraction of a second per day on a standard desktop workstation, confirming that computational cost is negligible for offline diagnostic analysis. The interpretation of DTW distances is also relative rather than absolute, requiring careful contextualization within the analyzed dataset. In this study, daily profiles were normalized to emphasize temporal structure, which may reduce sensitivity to absolute power levels and energy magnitudes. The results are based on measurements from a single building and a limited time horizon, which constrains the generalizability of the findings. Seasonal effects and inter-annual variability were not addressed and may influence temporal matching patterns. Furthermore, the analysis focused on daily aggregation, potentially overlooking shorter-term dynamics at sub-daily scales. These limitations do not diminish the validity of the methodological insights but indicate areas where further investigation is required.
4.5. Relation to Existing Literature and Novelty
The present study contributes to the existing literature by introducing a time-aware perspective to the analysis of PV generation and building electricity demand. Previous works in this domain have predominantly relied on state-based representations, clustering techniques, or aggregated energy indicators to characterize PV–load interactions. While DTW has been widely applied in fields such as speech recognition, biomedical signal processing, and pattern analysis, its use in building energy studies remains limited. The proposed framework demonstrates how DTW can be adapted to energy time series to capture temporal similarities that are not accessible through conventional approaches. Rather than proposing a new algorithm, the novelty of this work lies in the methodological integration of DTW with established state-based analyses. This combination enables a more comprehensive interpretation of daily energy behavior by jointly considering instantaneous operating states and their temporal organization. In this sense, the study provides a foundational contribution that bridges methodological concepts from time-series analysis and applied building energy research.
4.6. Operational Interpretation of DTW Results
The results obtained in Section 3.7 highlight an important distinction between energy-based and time-based performance metrics in the analysis of PV–building interactions. While the self-consumption ratio is widely used to assess PV utilization, it primarily reflects the overall balance between generation and demand. In buildings characterized by high daytime loads, SCR may remain close to saturation even under substantial temporal mismatch, thereby obscuring the timing-related structure of energy flows. This explains the absence of a statistically significant relationship between SCR and DTW distance observed in the present case study.
In contrast, the temporal overlap index explicitly captures the coincidence between building demand and periods of active PV generation. The strong correlation between DTW distance and this index indicates that DTW effectively quantifies the degree of temporal misalignment that directly affects load–generation coincidence. From a physical perspective, DTW does not represent a distortion of PV generation itself, which is largely deterministic, but rather reflects the temporal adaptability of building demand relative to the PV production envelope. In this sense, DTW can be interpreted as a proxy for load-following behavior under real operating conditions.
From a methodological standpoint, these findings demonstrate that the usefulness of DTW depends critically on the choice of performance indicator. When combined with temporally sensitive metrics, DTW provides information that is complementary to state-based clustering and energy-aggregated indicators. Conversely, when evaluated against saturated energy metrics, temporal effects may remain hidden. This highlights the importance of matching time-aware similarity measures with appropriately defined temporal performance indicators when analyzing building-integrated PV systems.
4.7. Outlook and Future Research Directions
Future research may build upon the proposed framework by extending the DTW-based analysis to longer observation periods and multiple buildings in order to assess the robustness of temporal similarity patterns across seasons and usage profiles. The integration of hierarchical clustering with DTW distances represents a natural next step for identifying families of days with similar temporal dynamics. Coupling DTW-based similarity measures with forecasting models could further enhance anticipatory energy management and control strategies. Additionally, the framework may be expanded to incorporate storage systems, flexible loads, and demand response mechanisms. Hybrid approaches combining state-based representations with time-aware similarity metrics offer particular potential for advanced energy management systems. These directions highlight the broader applicability of DTW as a complementary tool in the analysis and optimization of PV–building energy interactions.
5. Conclusions
This study demonstrated that the interaction between PV generation and building electricity demand cannot be fully characterized using state-based or energy-aggregated indicators alone. While unsupervised clustering effectively identifies typical instantaneous operating regimes, it does not capture the temporal organization of these states within a day. The application of DTW revealed substantial temporal mismatches between daily PV generation and load profiles that remain hidden in clustering-based analyses. By relating DTW distance to a temporally sensitive overlap indicator, the authors showed that temporal misalignment has a measurable impact on load–generation coincidence, even under conditions of high self-consumption. These results confirm that temporal alignment constitutes an independent and operationally meaningful dimension of PV–building energy interaction. The proposed framework provides a robust and complementary approach for analyzing building-integrated PV systems and supports the development of time-aware energy management strategies.
This study has several limitations that should be acknowledged. The analysis is based on a single transitional month and therefore does not capture seasonal variability, nor does it incorporate weather forecasting uncertainty or predictive control aspects. Moreover, while DTW was selected due to its ability to capture temporal misalignment, a systematic comparison with alternative time-series similarity measures was beyond the scope of this work and constitutes an important direction for future research.
Author Contributions
Conceptualization, A.M. (Arkadiusz Małek) and A.M. (Andrzej Marciniak); methodology, A.M. (Andrzej Marciniak); software, A.M. (Andrzej Marciniak); validation, A.M. (Arkadiusz Małek), A.M. (Andrzej Marciniak) and J.C.; formal analysis, A.M. (Andrzej Marciniak); investigation, A.M. (Arkadiusz Małek); resources, A.M. (Arkadiusz Małek), J.V. and J.C.; data curation, A.M. (Arkadiusz Małek) and J.C.; writing—original draft preparation, A.M. (Arkadiusz Małek), J.C. and J.V.; writing—review and editing, A.M. (Arkadiusz Małek), J.C. and J.V.; visualization, A.M. (Andrzej Marciniak); supervision, A.M. (Arkadiusz Małek), J.C. and J.V.; project administration, A.M. (Arkadiusz Małek) and J.C.; funding acquisition, J.C. and J.V. All authors have read and agreed to the published version of the manuscript.
Funding
This research received no external funding.
Data Availability Statement
The original contributions presented in this study are included in the article; further inquiries can be directed to the corresponding authors.
Conflicts of Interest
The authors declare no conflicts of interest.
References
- Hamidi, S.; Asfour, O.S. Design Strategies for Building-Integrated Photovoltaics in High-Rise Buildings: A Systematic Review. Architecture 2025, 5, 118. [Google Scholar] [CrossRef] [Scilit]
- Mutule, A.; Borscevskis, O.; Astapov, V.; Antoskova, I.; Carroll, P.; Kairisa, E. PV Energy Communities in Residential Apartments: Technical Capacities and Economic Viability. Sustainability 2025, 17, 2901. [Google Scholar] [CrossRef] [Scilit]
- Yin, Q.; Li, A.; Han, C. The Role of Solar Photovoltaic Roofs in Energy-Saving Buildings: Research Progress and Future Development Trends. Buildings 2024, 14, 3091. [Google Scholar] [CrossRef] [Scilit]
- Roshan Kharrat, R.; Perfetto, G.; Ingaramo, R.; Mutani, G. Optimizing Building Performance with Dynamic Photovoltaic Shading Systems: A Comparative Analysis of Six Adaptive Designs. Smart Cities 2025, 8, 127. [Google Scholar] [CrossRef] [Scilit]
- Rana, S.; Jamil, U.; Asgari, N.; Hayibo, K.S.; Groza, J.; Pearce, J.M. Residential Sizing of Solar Photovoltaic Systems and Heat Pumps for Net Zero Sustainable Thermal Building Energy. Computation 2024, 12, 126. [Google Scholar] [CrossRef] [Scilit]
- Kwag, B.C.; Kim, G.T.; Hwang, I.T. Integration of Photovoltaic Systems for Energy Self-Sufficient Low-Rise Multi-Family Residential Buildings in Republic of Korea. Buildings 2024, 14, 2522. [Google Scholar] [CrossRef] [Scilit]
- Makarskas, V.; Jurevičius, M.; Zakis, J.; Kilikevičius, A.; Borodinas, S.; Matijošius, J.; Kilikevičienė, K. Investigation of the Influence of Hail Mechanical Impact Parameters on Photovoltaic Modules. Eng. Fail. Anal. 2021, 124, 105309. [Google Scholar] [CrossRef] [Scilit]
- De Simone, M.; Bilotta, A. Monitoring of Energy Rates of Domestic PV Systems to Evaluate the Influence of Occupants’ Behavior on Environmental and Economic Benefits. Buildings 2024, 14, 4035. [Google Scholar] [CrossRef] [Scilit]
- Hu, K.; Fu, Z.; Lang, C.; Li, W.; Tao, Q.; Wang, B. Short-Term Photovoltaic Power Generation Prediction Based on Copula Function and CNN-CosAttention-Transformer. Sustainability 2024, 16, 5940. [Google Scholar] [CrossRef] [Scilit]
- Wang, Y.; Li, W.; Chen, H.; Ma, Y.; Yu, B.; Yu, Y. Short-Term Photovoltaic Power Forecasting Based on an Improved Zebra Optimization Algorithm—Stochastic Configuration Network. Sensors 2025, 25, 3378. [Google Scholar] [CrossRef] [Scilit]
- Maghami, M.R.; Pasupuleti, J.; Ling, C.M. Comparative Analysis of Smart Grid Solar Integration in Urban and Rural Networks. Smart Cities 2023, 6, 2593–2618. [Google Scholar] [CrossRef] [Scilit]
- Kuboń, M.; Skibko, Z.; Tabor, S.; Malaga-Toboła, U.; Borusiewicz, A.; Romaniuk, W.; Zarajczyk, J.; Neuberger, P. Analysis of Voltage Distortions in the Power Grid Arising from Agricultural Biogas Plant Operation. Energies 2023, 16, 6189. [Google Scholar] [CrossRef] [Scilit]
- Derkacz, A.J.; Dudziak, A. Savings and Investment Decisions in the Polish Energy Sector. Sustainability 2021, 13, 553. [Google Scholar] [CrossRef] [Scilit]
- Zulu, M.L.T.; Sarma, R.; Tiako, R. Enhancing Power Quality in a PV/Wind Smart Grid with Artificial Intelligence Using Inverter Control and Artificial Neural Network Techniques. Electricity 2025, 6, 35. [Google Scholar] [CrossRef] [Scilit]
- Grimaccia, F.; Niccolai, A.; Mussetta, M.; D’Alessandro, G. ISO 50001 Data Driven Methods for Energy Efficiency Analysis of Thermal Power Plants. Appl. Sci. 2023, 13, 1368. [Google Scholar] [CrossRef] [Scilit]
- Małek, A.; Caban, J.; Gryniewicz-Jaworska, M.; Marciniak, A.; Bednarczyk, T. A Method for Assessing the Selection of a Photovoltaic System for a Building’s Energy Needs Based on Unsupervised Clustering. Appl. Sci. 2025, 15, 9062. [Google Scholar] [CrossRef] [Scilit]
- Marciniak, A.; Małek, A. Determining Energy Production and Consumption Signatures Using Unsupervised Clustering. Energies 2025, 18, 2571. [Google Scholar] [CrossRef] [Scilit]
- Murano, G.; Caffari, F.; Calabrese, N. High-Resolution Analysis of Solar and Storage Integration in Residential Buildings with Reversible Heat Pumps. Sustainability 2025, 17, 10600. [Google Scholar] [CrossRef] [Scilit]
- Gao, C.; Zhang, S.; Li, Z.; Zhou, B.; Guo, D.; Shao, W.; Li, H. Photovoltaic Power Prediction Based on Similar Day Clustering Combined with CNN-GRU. Sustainability 2025, 17, 7383. [Google Scholar] [CrossRef] [Scilit]
- Bokde, N.D. Data-Driven Sustainability: Methods and Evidence Across Energy, Policy, and Industry. Energies 2025, 18, 6164. [Google Scholar] [CrossRef] [Scilit]
- Tomaszewska, J.; Witoś, M.; Kwaśniewski, J. Application of Dynamic Time Warping (DTW) in Comparing MRT Signals of Steel Ropes. Appl. Sci. 2025, 15, 7924. [Google Scholar] [CrossRef] [Scilit]
- Denkowska, A.; Wanat, S. Dynamic Time Warping Algorithm in Modeling Systemic Risk in the European Insurance Sector. Entropy 2021, 23, 1022. [Google Scholar] [CrossRef] [Scilit]
- Jeong, H.; Kim, J.; Jung, D.; Kwon, J. Deep-Learning and Dynamic Time Warping-Based Approaches for the Diagnosis of Reactor Systems. Sensors 2024, 24, 7865. [Google Scholar] [CrossRef] [Scilit]
- Li, H.-Y.; Lawarence, J.A.; Mason, P.J.; Ghail, R.C. Fast Dynamic Time Warping and Hierarchical Clustering with Multispectral and Synthetic Aperture Radar Temporal Analysis for Unsupervised Winter Food Crop Mapping. Agriculture 2025, 15, 82. [Google Scholar] [CrossRef] [Scilit]
- Kim, M.; Firoozjaei, M.D.; Kim, H.; El-Hajj, M. Power Profiling of Smart Grid Users Using Dynamic Time Warping. Electronics 2025, 14, 2015. [Google Scholar] [CrossRef] [Scilit]
- Duda-Mróz, N.; Koperska, W.; Stefaniak, P.; Anufriiev, S.; Stachowiak, M.; Stefanek, P. Application of Dynamic Time Warping to Determine the Shear Wave Velocity from the Down-Hole Test. Appl. Sci. 2023, 13, 9736. [Google Scholar] [CrossRef] [Scilit]
- Małek, A.; Piotrowska, K.; Gryniewicz-Jaworska, M.; Marciniak, A. Temporal Complementarity Analysis of Photovoltaic and Wind Power Generation Using Dynamic Time Warping. Appl. Sci. 2025, 15, 12119. [Google Scholar] [CrossRef] [Scilit]
- Shahbazkia, H.R.; Khosravani, H.R.; Pulatov, A.; Hajimani, E.; Kiazadeh, M. A Comprehensive Comparative Study of Quick Invariant Signature (QIS), Dynamic Time Warping (DTW), and Hybrid QIS + DTW for Time Series Analysis. Mathematics 2025, 13, 999. [Google Scholar] [CrossRef] [Scilit]
- Amangeldy, N.; Gazizova, N.; Milosz, M.; Kurmetbek, B.; Nazyrova, A.; Kassymova, A. Unsupervised Clustering and Ensemble Learning for Classifying Lip Articulation in Fingerspelling. Sensors 2025, 25, 3703. [Google Scholar] [CrossRef] [Scilit]
- Cao, B.; Xing, Q.; Yang, K.; Wu, X.; Li, L. Unsupervised Contrastive Learning for Time Series Data Clustering. Electronics 2025, 14, 1660. [Google Scholar] [CrossRef] [Scilit]
- Xu, Q.; Liu, Y.; Li, S. An Action Evaluation Method for Virtual Reality Simulation Power Training Based on an Improved Dynamic Time Warping Algorithm. Energies 2024, 17, 6242. [Google Scholar] [CrossRef] [Scilit]

Disclaimer/Publisher’s Note: The statements, opinions and data contained in all publications are solely those of the individual author(s) and contributor(s) and not of MDPI and/or the editor(s). MDPI and/or the editor(s) disclaim responsibility for any injury to people or property resulting from any ideas, methods, instructions or products referred to in the content. |
© 2026 by the authors. Licensee MDPI, Basel, Switzerland. This article is an open access article distributed under the terms and conditions of the Creative Commons Attribution (CC BY) license.