


Abstract
This article examines the statistical relationships between ENUS, defined as per capita energy use, and Environmental, Social, and Governance variables, with particular emphasis on the Environmental dimension and its connections with national energy systems. The study investigates whether systematic associations exist between ESG indicators and the cross-country and temporal variation in ENUS as per capita energy use, and to what extent machine learning methods can contribute to the description and interpretation of these relationships in comparison with panel econometric models. The analysis is based on a large World Bank dataset covering approximately 161 countries over the period 2004–2023 and follows a three-step methodological strategy. First, fixed-effects, random-effects, and Weighted Least Squares panel models are estimated to explore the statistical associations between a broad set of ESG variables and ENUS as per capita energy use, while controlling for unobserved country-level heterogeneity. Second, clustering techniques are applied to identify groups of countries with similar joint patterns in multidimensional variables related to energy systems, emissions, climate conditions, and natural resource use. Third, several machine learning models are implemented, with particular attention to the performance of the K-Nearest Neighbors algorithm evaluated through normalized measures of predictive accuracy and goodness of fit. Model interpretability is enhanced using dropout loss and additive explanation methods to assess the contribution of ESG variables to the prediction of ENUS as per capita energy use. Overall, the results reveal a rich and multidimensional structure of relationships between ESG indicators and ENUS expressed as per capita energy use. In particular, the evidence indicates a close association between ENUS and key environmental variables such as emissions intensity, energy intensity as a control variable, and the use of natural resources, together with Social and Governance factors related to development, institutional quality, and economic structure. These findings suggest that cross-country differences in ENUS as per capita energy use correspond to distinct environmental, social, and governance profiles within the ESG framework.
1. Introduction
Energy Use Per Capita (ENUS) is a major point of reference in scientific studies on sustainable development, climate change, and economic transformation. ENUS represents productive capabilities, technological change, living standards, and modern service access, and is also a proxy for the pressures that human activity imposes on the environment. Because of its strong linkages between energy use and greenhouse gas emissions, air pollution, natural resource utilization, and climate change issues, ENUS is at the heart of sustainability debates. Simultaneously, conditions of low-energy use are normally found in situations of poverty, poor health and education services, and restricted economic opportunities. The Environmental, Social, and Governance (ESG) framework has been identified to be one of the most commonly used frameworks for the evaluation of the sustainability performance of different countries, corporations, and financial instruments. ESG factors are widely used for the formulation of policies, risk analysis, and financial decision-making, serving as a multidimensional benchmark for the evaluation of the sustainability process [1,2]. Despite this, the current empirical literature has not been able to clearly define the position of energy consumption per capita in the ESG framework. Most of the current literature on the subject has been examining the subject of energy consumption either in the context of economic development or carbon emissions [3,4]. Other studies on the subject regard ESG factors as outcome or predictor variables for financial or institutional analysis, without ever placing the subject of energy consumption at the core of ESG processes [5]. Specifically, few large-scale investigations have been made on both ENUS and ESG criteria simultaneously [6], and when done, these investigations have utilized linear econometric models [7]. This particular research aims to provide an exhaustive analysis on energy use per capita within the ESG paradigm, with emphasis on the Environmental aspect. The novelty of this research lies in the fact that it has three main dimensions. Conceptually, ENUS is seen not only as a technical or ancillary proxy measure of ESG factors, but as an important outcome variable that is systematically linked to ESG-related environmental factors. Methodologically, this analysis combines panel econometrics, clustering analysis, and machine learning methods within an integrated framework. Contrary to conventional analysis that focuses on energy as an input factor in economic production or as an environmental proxy measure of environmental degradation, this analysis considers ENUS as part of an overall environmental context filtered through an ESG lens that considers factors of resource use, climate-related stresses, integrity of ecosystems, and energy characteristics. The analysis uses panel data methods that estimate systematic empirical relationships between ENUS variables and environmental variables by leveraging cross-country differences and temporal variation [7]. The analysis uses clustering methods to group countries into environmental regimes where patterns of ENUS as per capita energy use covary with varying sets of variables of emissions, climate factors, resource use, and energy characteristics [6]. This allows multiple paths of sustainability analysis that can be traced cross-nationally. Concurrently, machine learning algorithms are used for improving predictive results by identifying complex, non-linear correlations between variables. These machine learning algorithms are tested using a set of normalized performance metrics, while interpretability tools are used to analyze the contribution of individual variables to energy consumption predictions [4,8,9]. The empirical results highlight several important patterns. Panel regression results indicate strong and systematic relationships between ENUS and environmental pressure variables, including emission intensity, energy intensity (as a control variable), and measures of resource use such as carbon dioxide emissions, total greenhouse gas emissions, water withdrawals, and waste generation. Clustering analyses reveal the presence of distinct environmental regimes, characterized by high and low levels of energy use and associated with different environmental pressures, with energy intensity included as a control variable, and different energy sources [3,6]. Machine learning analyses further highlight the relevance of non-linear and local patterns closely associated with ENUS, supporting the view that countries follow distinct environmental and energy trajectories rather than a common global path [3]. Overall, the results point to the existence of a multidimensional ESG framework in which energy consumption per capita is embedded. Accordingly, the results should not be interpreted in isolation, but within the framework of the broader environmental regimes in which countries operate. By positioning countries within multidimensional environmental spaces created through the use of ESG variables, the research helps in providing different insights into sustainability challenges and helps the interpretation of energy and climate policies through the prism of differentiated regimes as opposed to general prescriptions [5,10].
Conceptual Definition of Energy Use per Capita within the ESG Framework. Energy consumption per capita (ENUS) is the dependent variable of this study and represents the central outcome through which the empirical relationship between Environmental, Social, and Governance (ESG) factors and national energy systems is examined. The analysis focuses on documenting and interpreting cross-country and over-time differences in per capita energy use, rather than modeling energy intensity as either a control variable or a causal outcome. This distinction is important because energy use, energy intensity, and energy efficiency represent different dimensions of energy systems and play different conceptual roles within ESG-based analysis. ENUS is interpreted as a macro-level indicator of the scale of energy use observed across countries and over time. It is empirically associated with a broad set of structural and techno-institutional characteristics, including living standards, access to modern energy services, production structures, and environmental pressures. Within the ESG framework adopted in this study, ENUS is therefore not treated as a variable that is causally determined by these factors, but as an endogenous outcome that co-varies with environmental conditions, economic structures, and institutional arrangements. Energy intensity and energy efficiency are introduced as complementary concepts within energy system analysis and play a different role from ENUS in this framework. In particular, energy intensity—defined as energy use per-unit of GDP—is included as an explanatory variable that captures how patterns of economic activity are statistically related to patterns of ENUS as per capita energy use. Higher values of energy intensity are associated with more energy-intensive production structures, without implying a direct causal mechanism. In this sense, energy intensity serves as an intermediary indicator that links ESG-related environmental, technological, and institutional variables to per capita energy use in a purely empirical and associative manner. Accordingly, while efficiency-related variables are explicitly accounted for in the model through energy intensity and related indicators, the analytical focus of the study remains on ENUS as the outcome of interest—that is, on how ESG-related factors are associated with the overall scale of energy consumption rather than on efficiency performance in a causal sense.
The article continues as follows: Section 2 reviews the literature on energy consumption and ESG, highlighting the main theoretical perspectives and empirical gaps. Section 3 presents the methodology, data, and theoretical framework, introducing the integrated use of panel data econometrics, machine learning regression, and clustering techniques. Section 4 analyses the relationship between energy use per capita and the Environmental (E) pillar of ESG using multimethod empirical evidence. Section 5 examines the Social (S) determinants of energy consumption, focusing on social development, labor markets, and demographic dynamics. Section 6 investigates the role of Governance (G) indicators in shaping energy use through institutional quality and regulatory effectiveness. Section 7 interprets energy use per capita as a multidimensional ESG nexus by integrating results across all three pillars. Section 8 discusses policy implications within an integrated ESG framework. Section 9 concludes by summarizing the main findings and contributions of the study.
2. Literature Review
The literature review offered in this section is organized in terms of the empirical link between Environmental, Social, and Governance (ESG) variables and per capita energy use (ENUS). Contrary to being organized in separate strands for ESG issues, energy structures, and economic development, the focus is on finding literature that provides statistical correlations between ESG conditions/context and energy use. In this regard, the literature review provides a conceptual link between the theoretical discussion and the empirical analyses that will be done later in this investigation. More specifically, the Environmental strand focuses on trends and developments related to emissions intensity, resource use, energy efficiency, and environmental pressures that correspond to the environmental variables included in the panel models and clustering analysis. The Social strand analyses the relationship between development ideals, demographic dynamics, and social structures, and observed trends in energy use. The literature offers a systematic survey of how different ESG-related variables correlate with ENUS in the empirical evidence. Current academic thought has increasingly come to consider ESG policies as a key prism for understanding modern energy systems, as well as energy transitions as a whole. Under this interpretation, energy system performance would be evaluated not only in terms of technological efficiency, but also within the broader context of financial, human capital, and other factors associated with specific sustainability pathways. A first group of studies focuses on the theme of governance and quality of institutions, demonstrating how a group of countries featuring stronger regulatory frameworks and higher levels of legal certainty and transparency have different energy/sustainability profiles compared with a group of countries featuring less effective governance frameworks or engaging in green washing [11,12,13,14]. A second set revolves around financial and investment aspects. The literature on green finance, ESG-focused investments, carbon pricing, and green bonds indicates that ESG-oriented financial systems are generally associated with lower vulnerability to energy-intensive activities and display specific patterns of ENUS in terms of per capita energy use and emissions [15,16,17]. Likewise, some studies find that ESG-focused financial practices are linked to desirable attributes of energy efficiency and economic performance [18,19,20,21]. The third school of thought focuses on technological and organizational factors. Smart systems, digitalization, innovation networks, and artificial intelligence are often found to co-exist with differences in energy management, energy intensity, and ESG performance [22,23,24,25,26,27]. They are related to differences in patterns of production/consumption as well as varying levels of energy use [28,29]. Moreover, several studies emphasize structural and sectoral aspects—including resource extraction, geographical and architectural factors, circular economy practices, and decentralized energy systems—which have been empirically shown to be related to energy demand and environmental pressures across countries [30,31,32,33,34]. Even if a number of research works show that the intensity of the use of energy is lower, they also stress that the absolute use of energy is a complex issue that depends on the stage of development and the availability of energy. Overall, this body of literature suggests that ESG factors are systematically associated with cross-country variations in per capita energy consumption. This empirical pattern forms the basis for the analytical framework used in this research, where ENUS is not only seen as an indicator of technical efficiency, but also as an indicator that varies with ESG factors (see Table 1).
Table 1.
ESG mechanisms linking sustainability factors to energy use per capita.
Bridging Literature and Model Specification. The literature reviewed above does not aim to establish one-to-one causal relationships with the dependent variable of this study, but rather to identify the main ESG-related dimensions that are empirically associated with cross-country and over time variation in energy demand. These dimensions are then operationalized in the empirical model through country-level indicators drawn from the World Bank. Specifically, studies on governance and institutional quality inform the inclusion of electricity access and regulatory indicators; the ESG finance and investment literature guides the inclusion of energy structure, fossil fuel use, and renewable energy variables; technological- and efficiency-oriented studies are used to select energy intensity and emissions indicators; and resource and structural transformation studies support the inclusion of water withdrawals, land-use change, and sectoral composition variables. In this way, the literature review provides a conceptual basis for the selection of the explanatory variables used in the panel models examining energy use per capita (ENUS), without implying that the estimated relationships represent causal effects.
3. Methodology, Data and Theoretical Background
In particular, the approach adopted in this work combines panel data econometrics, unsupervised clustering analysis, and machine learning methods to explore the patterns of relationship existing between the Environmental, Social, and Governance (ESG) variables, with particular attention to the Environmental pillar, and the Energy Use normalized for the Population (ENUS) indicator. This work follows the latest suggestions that support the combination of econometric models and data analysis methods for the modeling of sustainability trends in the energy sector [2,7]. In particular, the analysis uses the World Development Indicators dataset provided by the World Bank, which allows for the development of models for nearly 1965 observations in an unbalanced panel of up to 127 countries over nearly 17 years, ensuring the analysis of heterogeneity across variables for the different countries and analysis of the time-series behavior of the variables in accordance with the global ESG rating systems [40,41]. Methodologically, the empirical approach includes three steps. In the first step, panel data models with fixed-effects, random-effects, and Weighted Least Squares estimation are utilized to estimate the empirical association relationships between ENUS and ESG variables. In the FE models, unobserved country-specific attributes, including geographical and energy resource endowments, are accounted for to address cross-country differences in governance and institutional environments [41]. The Weighted Least Squares estimation method tackles the problem of heteroscedasticity and cross-section dependence. Hausman tests confirm that FE models are more valid in describing these relationships than other models (Hausman). This follows common ESG-energy literature practices [7]. In the second stage, the K-Means algorithm is used as an unsupervised machine learning algorithm to identify the regimes in which there is a systematic relationship between ENUS and emissions, climate change stressors, and resource utilization. This method of grouping is consistent with the typologies used by research focused on sustainability issues, such as environmental and ESG issues [40,42]. The clusters are validated using Silhouette scores, CH scores, and Herfindahl indices, resulting in ten balanced groups that represent different regimes along the ESG energy spectrum, ranging from energy-intensive systems to low-energy and renewable energy-focused systems. The third stage evaluates the predictive capability of different machine learning models in forecasting the values of ENUS based on the observed ESG factors. This stage follows the latest trend in algorithmic research, which highlights the application of machine learning techniques to investigate the non-linear relationship between ESG factors and energy consumption [2,7]. The performance of the different models is measured using normalized metrics, such as mean squared error (MSE), root mean squared error (RMSE), Mean Absolute Error (MAE), Mean Absolute Percentage Error (MAPE), and goodness of fit (R-squared), where the KNN model performs the best. The dropout loss function, along with techniques for interpretability, helps to quantify the contribution of the identified ESG factors, including CO2 emissions, energy efficiency, waste, and water, to the prediction of ENUS. From a theoretical perspective, the sustainability variables of the ESG are a multidimensional construct in which energy use is analyzed relative to economic and environmental variables. In this regard, the Environmental dimension encompasses the empirical associations between the management of energy, energy intensity as a control variable, and greenhouse gases emission intensity in the sustainability context of the ESG variables [40,42]. The research methodology encompasses the development of econometric models and machine learning approaches to analyze these associations, as illustrated in Figure 1.
Figure 1.
ESG–Energy Nexus: visual summary of associations between per capita energy use and Environmental, Social, and Governance profiles. Note: This figure summarizes the main empirical associations between per capita energy use and ESG dimensions, highlighting environmental, social, and governance patterns identified through clustering and machine learning, without implying causal relationships among variables.
Diagnostic Testing, Model Fit, and Econometric Limitations. The empirical results involve the estimation of three equivalent panel data equations for each of the Environmental (E), Social (S), and Governance (G) pillars of ESG criteria. All three equations share the same dependent variable—energy use per capita (ENUS)—but differ in their independent institutional pillars, and are estimated on large, unbalanced datasets covering between 127 and 150 cross-sectional units over up to 19 periods. Both diagnostic statistics and econometric aspects are presented collectively because of their common applicability across all three equations. For all specifications, heteroskedasticity, serial correlation, and cross-sectional dependence are detected. Non-parametric Wald tests reject homoscedasticity, whereas Wooldridge tests prove the existence of first-order autocorrelation in every panel. The CD test of Pesaran proves the significance of cross-section dependence. All these properties are common in large cross-country energy panels and do not, in themselves, imply misspecification of the model. To tackle these challenges, a multi-estimator approach is adopted. Fixed-effects (FE) specifications account for unobserved country-level heterogeneity. Random-effects (RE) models are estimated and tested against FE counterparts via Hausman tests, which strongly reject the null hypothesis of RE model consistency, thus confirming the FE specification. Weighted Least Squares (WLS) estimators are employed to alleviate heteroskedasticity problems induced by cross-country scale variations. The FE models show very high R-squared statistics, around 0.98 for the Social and Governance models and above 0.99 for the Environmental model. These values primarily represent the presence of a large number of included country-specific effects and the high persistence level of variables related to energy and ESG factors, rather than mere overfitting. This is supported by the improved R-squared statistics of within observations, which differ significantly across the three pillars: low values for the Governance and Social models of roughly 0.02–0.11 contrast with a much higher value of circa 0.69 for the Environmental model, suggesting relevant explanatory power of time-varying variables in this domain. However, the presence of a certain level of cross-sectional dependence, inherent in the structural processes of the global energy and sustainability system, still persists even after implementing corrective estimators. Therefore, in this study, the implications of the outputs from the three ESG equations above are considered as robust conditional relations and not necessarily causal effects. Clearly explaining this improves the level of transparency and allows for a justifiable evaluation of the implications of the output while maintaining the comparative advantage offered by the ESG-based econometric approach.
Complementarity Between Econometric and Machine Learning Approaches. The application of machine learning approaches within this research helps to add value to, rather than replicate, the econometric part of the research. Although the results from the panel regressions are consistent with theories on the conditional relationships between ESG factors and energy consumption per capita, machine learning approaches help to analyze non-linearities, local similarity structures, and underlying patterns that are not encapsulated in standard parametric models. It is important to note that this study did not focus on any single algorithm within the set of machine learning approaches adopted. For each pillar on ESG issues (Environmental issues—E, Social issues—S, and Governance issues—G), the research design puts forth a systematic comparison between seven supervised machine learning algorithms (Boosting, Decision Trees, K-Nearest Neighbors, Linear Regression, Random Forest, Regularized Linear Models, and Support Vector Machines) and six clustering algorithms (Density-Based, Fuzzy C-Means Clustering, Hierarchical Clustering, model-based clustering, K-Means Clustering, and Random Forest Clustering). These algorithms are chosen for evaluation within a common framework, making use of a set of normalized statistics on performance measures that ensure each algorithm is treated on equal footing across ESG dimensions. This approach helps to eliminate subjective choices on algorithms and helps in determining the best choice among the algorithms for each ESG component. Within the chosen comparative framework, K-Nearest Neighbors (KNN) is among the best-performing supervised machine learning algorithms, as it can identify both proximity-based and non-linear patterns in ESG indicators and country-level energy consumption. As non-parametric models, these algorithms are particularly well suited to the analysis of heterogeneous countries, where energy consumption levels are shaped by country-specific ESG factors rather than by average levels common across all countries in the sample. Employing multiple clustering algorithms allows for the identification of country regimes that are consistent across different clustering paradigms, rather than relying on country-specific averages from regression models.
Endogeneity and Reverse Causality Considerations. A possible methodological issue in the empirical setup is related to endogeneity and mutual dependence between ESG indicators and energy consumption per capita. Environmental, social, and governance dimensions and energy use are jointly observed to vary across countries and over time within specific regulatory, technological, and institutional contexts. Likewise, higher or lower levels of energy consumption are empirically associated with different environmental pressures and social conditions reflected in ESG indicators. The fixed-effects panel method helps to account for time-invariant country characteristics—such as development paths, geography, and structural features—that contribute to these systematic co-movements. However, given data limitations and the difficulty of isolating truly exogenous variation in ESG indicators in large cross-country panels, no instrumental-variable or dynamic identification strategies are applied. Moreover, ESG indicators represent a multidimensional system that co-evolves with economic and energy system characteristics. For this reason, the present study does not seek to identify causal effects but instead focuses on estimating robust conditional associations between ESG dimensions and energy use per capita. A fully causal interpretation is therefore beyond the scope of this analysis and is left to future research based on alternative identification strategies.
Estimator Choice and Hausman Tests across ESG Pillars. Since the empirical framework specifies and estimates three different panel data models representing the Environmental (E), Social (S), and Governance (G) pillars, the specifications to use either fixed-effects (FE) or random-effects (RE) methods to analyze each model are evaluated independently. For each Environmental, Social, and Governance model, a Hausman test for the equality of RE and FE estimators is performed to compare the consistency between the RE and FE estimators. In each of the three test conditions, the null hypothesis suggesting no correlation between variables and country-specific effects is resolutely disapproved. This indicates systematic inconsistency of the RE estimator across all ESG systems, thereby justifying the use of FE models in all cases. The use of country fixed-effects in every analysis allows every model to account for country-specific, time-invariant variations in every analysis. Additionally, random-effects and Weighted Least Squares methods can be used to complement the analysis. Based on the outcomes of the Hausman tests for each ESG dimension, FE models are used in subsequent in-depth analyses for in-depth conclusions. In-depth Hausman test statistics for the Environmental and Social models are located in the Appendix A, Appendix B and Appendix C.
Model Evaluation, Persistence, and Validation Scope. However, the evaluation of machine learning models, including K-Nearest Neighbors (KNN), takes place under an in-sample comparative evaluation approach. This stems from the fact that the objective of the machine learning evaluation is not focused on out-of-sample prediction or forecasting, as in conventional forecasting models. Additionally, energy use per capita has been shown to demonstrate significant persistence properties within cross-country panels; therefore, the overall objective of the machine learning evaluation is actually to evaluate relative algorithm performance, similarity structure, and variable importance with respect to observed data points rather than to ascertain out-of-sample prediction accuracy or relate to optimization problems such as financial time-series prediction with respect to unseen data points. Accordingly, evaluation criteria such as R2 for in-sample predictions and normalized dropout loss are used to enable consistent comparisons across models, algorithms, and ESG factors. While time-aware or nested approaches are commonly adopted in the evaluation of forecasting models, they may capture spurious time-series dependencies that risk obscuring, rather than clarifying, the intrinsic structural aspects of the macro-panel prediction problems addressed in this study.
Variable Importance and Interpretative Scope. The assessment of the relevance of variables to the machine learning model utilizes the normalized dropout loss. Normalized dropout loss measures the extent to which the machine learning model performs poorly when each variable is deliberately removed. Normalized dropout loss measure is specifically suited to the comparative and non-causal nature of the research, given that the measure provides a global effect assessment of the variables without focusing on local marginal influence. While other methods of model interpretability, such as SHAP values and permutation importances, offer the ability to calculate local marginal influence of variables, using these methods to explore macro-panel data could result in estimates that vary across different contexts. Given the exploratory nature of the machine learning analysis, the results should be interpreted as reflecting relative rather than marginal effects.
Clustering Strategy and Pillar-Specific Regime Identification. Clustering analyses are performed separately for the Environmental (E), Social (S), and Governance (G) pillars of the ESG framework. As to the reasons for this approach, ESG can be seen as a multidimensional system with analytically separable yet interactively linked components. An ESG aggregate-oriented clustering analysis would, by necessity, perceive a single sustainability factor, which might neglect pillar-specific relationships and let indicators of environmental sustainability to dominate others. At the same time, pillar-specific clustering maintains clarity of results, as it allows regimes to be selectively mapped within each ESG pillar by indicating how per capita energy use covaries with environmental pressures, social development, or institutional settings independently. While clustering ESG variables together might reveal profiles and trade-off regimes simultaneously (such as high environmental sustainability performance combined with lower levels of governance quality), this approach would shift the analytical perspective further toward typological classification rather than the analysis of specific mechanisms, which is not the objective of this study. Accordingly, in this analysis, trade-offs between pillars can only be inferred indirectly, either through a comparative assessment of E-, S-, and G-specific results or through an integrative synthesis of the findings.
Clustering Strategy, Validation Metrics, and Interpretation. Clustering analysis is carried out separately for Environmental (E), Social (S), and Governance (G) issues that comprise the ESG framework. Hence, there are three distinct clustering analysis tasks. The need for this pillar-specific approach to clustering analysis arises to maintain clarity of concepts, preventing aggregate effects that often compromise dimension-specific patterns. Hence, each clustering analysis exercise attempts to derive clustering within a dimension based on ESG considerations. The choice of clustering solution, as well as its validation, is not dependent on a single index. While the value of silhouette width is cited as an intrinsic indicator of geometric separation, the choice of clustering solution is made within the context of an extensive list of orthogonal criteria to be met simultaneously. These criteria include indices of goodness of fit and information criteria (R-squared, AIC, BIC), indices of compactness/separation (maximum diameter, minimum separation, Dunn index, Calinski–Harabasz index), association indices (Pearson’s gamma), indices of functional properties (entropy), as well as concentration criteria (HH index). Accordingly, clusters with relatively low silhouette scores are not seen as weak from a statistical perspective or as clusters that have little or no significance. Rather, these clusters are seen as indicative of regions where there is overlap or transition, which is seemingly characteristic in the macro setting where data related to ESG issues and energy developments tend to follow a steady, non-linear pattern.
Data Handling, Variable Selection, and Hyperparameter Specification. Regarding data preprocessing, with respect to missing data, imputation or transformation of the missing data was not executed. However, ESG factors with relatively few observations over the period were excluded from the analysis in order to avoid potentially distorted data and to ensure that the results are based solely on reliable observations.
This new set of data with adequate observations on all included factors is retained for further investigation. After this step, variables were assigned to three groups based on the Environmental (E), Social (S), and Governance (G) dimensions. This approach is based on the theoretical framework that underpins ESG. In this respect, all variables within each group were used together in order to carry out clustering. No further variable selection or dimension reduction took place within groups. This approach ensured that as much information as possible within a particular dimension is retained in order to identify underlying patterns through clustering. In this context, for each dimension within pillars of ESG, all variables within a particular group or dimension were used together. With respect to the machine learning analysis, it should be noted that there was no attempt to optimize algorithm-specific hyperparameters through out-of-sample validation, based on the non-predictive and exploratory objectives of this analysis. Rather, it should be pointed out that the specific hyperparameter settings used in each algorithm analysis are comprehensively detailed in Appendix B, to facilitate an appropriate level of transparency and directly replicable functionality with respect to the machine learning model.
Unsupervised Clustering Framework and Substantive Justification of the Number of Clusters. The clustering analysis tasks pursued in the present research utilize exclusively unsupervised clustering models. In the unsupervised approaches, there is no task definition that requires the model to use target variables or labels. The chapters utilize the clustering model to identify the homogeneous regimes for ESG issues Environmental (E), Social (S), and Governance (G) issues separately, using exclusively the ESG variables’ similarity. Energy use per capita is not used to supervise the clustering analysis, nor is any country classification. The clustering model is applied separately for ESG issues, using the same number of clusters for all three clustering analysis tasks. The selection of ten clusters is justified by both model selection criteria and interpretability criteria. From the statistical selection criteria, information criteria (such as the Bayesian Information Criterion) imply that model improvement is slight for K = 10 and beyond, indicating that for K > 10, the returns in the model explanatory power decrease. From the interpretability criteria, the ten-regime model represents adequate granularity to discern heterogeneous ESG profiles without overstating ESG complexity. Exploratory validation of alternative clustering solutions with K = 11 and K = 12 indicates that the majority of additional clusters simply subdivide previously identified regimes without yielding meaningful ESG–energy configurations, thus increasing complexity without providing additional insight. Even for the unsupervised clustering model, alternative clustering approaches are validated using a comprehensive set of criteria, including information criteria (Akaike Information Criterion and Bayesian Information Criterion), measures of cluster compactness and separation (silhouette width, Dunn index, Calinski–Harabasz index, maximum diameter, minimum separation), association criteria (Pearson’s gamma), and distribution criteria (entropy and the HH index). The completion of clustering validation has no task definition character and is instead mainly utilized for the description of the internal validation of clustering analysis tasks.
Validation Strategy and Absence of Cross-Validation. Conventional k-fold cross-validation or nested cross-validation methods were not used in the presented research work. This is because the machine learning sub-models are used for comparative and exploratory purposes rather than for prediction or forecasting. In the context of energy and ESG data with high levels of temporal persistence and structural dependence, like macro-level data, cross-validation methods can result in information leakage and bias subsequent performance comparisons across machine learning models used in the investigation and research work. Additionally, the study used a holdout validation method, reserving 20% of the data for testing and a further 20% for validation.
Diagnostic Issues across the ESG Pillars and Implications for Interpretation. These diagnostic tests were performed for each of the econometric models specified under the Environmental, Social, and Governance themes. In general, the Pesaran CD test shows cross-sectional dependence for each model, the Wooldridge test confirms first-order autocorrelation for each, and the Distribution-Free Wald test shows rejection of the assumption of homoskedasticity in each case. These results hold for each of the ESG factors and can be explained by the typical structure found in broad cross-country panels for the global energy sector, in which countries are interrelated via a set of global economic, institutional, and environmental factors. The presence of heteroskedasticity and autocorrelation in these panels does not indicate any econometric model specification error, but it does indicate a complication in the use of conventional standard errors if not corrected. To account for these complications, fixed-effect models are specified for each of the three econometric specifications to account for unobserved, time-invariant country-specific factors, and Weighted Least Squares models are specified to account for heteroskedasticity driven by differences in cross-sectional size. In each case, Hausman Tests for equivalency between RE and FE models indicate rejection of the RE model and thus support the use of FE model specifications. Further, despite using them to correct for complications in the models, some form of cross-sectional dependence and/or serial correlation might still be present. This serves to indicate, as mentioned earlier, global considerations in the nature and impact of the energy and sustainability sectors, and thus any similarities and variations across the three models should be interpreted in terms of a robust, conditionally related set of associations rather than in terms of causes and effects.
Diagnostic Testing and Model Reliability. To examine the econometric features of the panel data, a range of diagnostic tests is used for all ESG pillar models. More specifically, cross-sectional dependence is tested using the Pesaran CD test, serial correlation is investigated through the Wooldridge test for panel data, and heteroskedasticity is tested using Wald tests. On the other hand, comparison between fixed-effects and random-effects models is performed using Hausman tests, which always result in the rejection of the null hypothesis of the random-effects model being consistent. The results of the tests will be examined in the section “Diagnostic Testing, Model Fit, and Econometric Limitations.”
Role of Machine Learning in the ESG–Energy Framework. The role of machine learning in this study is not to replace panel econometric analysis of inference but to offer a complementary view to study ESG-energy correlations, especially under conditions of non-linearity, heterogeneity, and local similarity. Underlying this framework, predictive accuracy is significant as it shows to what extent ESG patterns explain variation in observed ENUS. As a result, higher predictive accuracy implies that ENUS is more accurately described by ESG profiles defined by proximity and regime structures, compared to a parametric representation. Crucially, the choice of algorithm for the K-Nearest Neighbors (KNN) method was not pre-empted. Instead, a model comparison test was undertaken using a range of seven other regression machine learning algorithms, namely Boosting, Decision Tree, KNN, Linear Regression, Random Forest, Regularized Linear Models, and Support Vector Machines, based on a range of criteria, namely mean squared error (MSE), normalized MSE, Root Mean Squared Error (RMSE), Mean Absolute Error (MAE/MAD), Mean Absolute Percentage Error (MAPE), as well as R-squared, for each category of ESG factors, namely Environmental, Social, and Governance factors, separately, so as not to apply a common algorithmic model to a range of substantively different factors. The outcome of this multi-criteria benchmarking systematically show that the KNN approach is the best-performing algorithm in terms of all three criteria (E, S, and G), optimizing the accuracy of predictions while maintaining significant explanatory capacity. The consistency in outcome across ESG factors gives a strong indication that the underlying dynamics in the ENUS dataset represent non-linear and locally defined structures in the association between ESG variables, which the KNN approach is able to better represent compared to global approaches. Even if the outcome from the machine learning approach is consistent with the panel regression outcome, the two approaches do not represent redundant findings. Instead, they add to the robustness of the empirical findings and provide new information about the structure of ESG-energies. The panel approach estimates the average conditional association across the cross-section, in contrast to the KNN approach, which shows how various countries group together according to a similarity-based ESG-energies regime and variable contributions to ENUS in a non-parametric and heterogeneous way. The complementary role of machine learning is therefore to provide new information about the association in terms of structures that define proximity, non-linearities, and regime-specific structures, which cannot be obtained from the standard econometric approach.
4. Energy Use and the ESG Environmental Pillar: Evidence from Panel Data, Machine Learning, and Clustering
4.1. Environmental Pillar of ESG and Energy Use: Evidence from Cross-Country Panel Regressions
In this section, the empirical relationship between the Environmental dimension of the ESG framework and per capita energy use (ENUS) has been explored using the panel regression framework. By using a broad set of environmental metrics that cover resource utilization, emissions, land dynamics, and energy structure, this analysis attempts to incorporate the complex nature of the E—Environment dimension, its statistical relationship, and the corresponding national patterns of ENUS as per capita energy use. The following equation is estimated:
The fixed-effects model adjusts for all country characteristics that do not change over time, such as geographical, institutional, energy, and developmental factors, thus partly addressing the risk of biased inference from unobserved variables. Nonetheless, in the absence of instruments and dynamic structural modeling, the coefficients cannot be taken as causal effects but rather as conditional relationships. The fixed-effects model shows an excellent fit to the data, as evidenced by the very high values of the LSDV R2 above 0.99 and the R2 of approximately 0.69, which shows that the E—Environment variables are strongly correlated with the ENUS variable. The joint significance of the regressors, as confirmed by F-test p-values close to zero, verifies that the chosen E—Environment variables are significant and correlated with the ENUS variable, as supported by the ESG literature [43,44]. Electricity access has a positive and significant effect in all models, suggesting that the higher the access, the higher the aggregate energy use in empirical observations. In the context of ESG analysis, this finding emphasizes the often-cited trade-off in the literature: the positive relationship between access to modern energy services and environmental pressures, depending on the structure of the energy mix [45,46]. The negative effect of the CAGR-value-added sector indicates that economies with stronger primary sectors are associated with lower levels of aggregate energy use, even when accounting for individual effects, and therefore supports the argument that sectoral structure and environmental performance are inextricably linked in the context of the ESG analysis [47,48]. The positive and significant correlation between annual water withdrawal and ENUS represents the often-cited relationship between resource extraction and the structure and performance of the energy systems in empirical observations [42,44]. Per capita CO2 emissions, in turn, exhibit the strongest positive relationship with ENUS in empirical observations, suggesting the often-cited relationship between the energy system structure and performance and levels of environmental degradation in the context of the Environmental pillar of ESG analysis [43,47]. The sign of energy imports is mixed across specifications, reflecting the complexity of energy security is captured within the E—Environment framework. In the Weighted Least Squares model, the coefficient is negative, meaning that higher levels of energy import dependence are associated with greater energy adjustment and efficiency within structural constraints. This is consistent with the current literature on sustainability and energy risk [46]. The coefficient of energy intensity is positive and significant in all models, meaning that production structures that are highly energy-intensive are generally accompanied by high per capita energy use. This is consistent with the current literature in the field of sustainable finance within the framework of ESG investing [44,49]. The coefficient of fossil fuel use is negative, meaning that the use of fossil fuels is substituted and saturated as a result of the joint consideration of aggregate energy use and GHG emissions. This is consistent with the current literature in the field of sustainable finance within the framework of climate change [43,48]. Finally, the coefficients of GHG emissions due to land-use change, methane, N2O, and tree cover loss are positive, meaning that different GHG sources tend to move together as the level of energy use is generally higher. This is consistent with the current literature within the framework of the ESG model. This model emphasizes the joint consideration of different GHG sources as opposed to individual sources [44,47]. In general, it can be seen that the empirical findings offer clear evidence of strong correlations between E—Environment ESG variables and energy use per capita. Nevertheless, due to the lack of IVs or any form of causal identification methods, it should be noted that these empirical findings should be treated as correlation relationships only, which is in line with existing practices of ESG-energy studies [42,45,48]. See Table 2. Tests and statistics are in Appendix C.
Table 2.
Panel data estimates of Environmental ESG drivers and energy use per capita.
4.2. E-Environment Typologies and Energy Demand: Evidence from K-Means Clustering
The research proposes a simple empirical model that may be explained as a comprehensive panel study of the general correlations between the ESG Environmental factor (in the following text, “E—Environment”) and energy use, as captured by the dependent variable “ENUS.” This kind of research design is in line with the current and growing stream of research focusing on the relevance and co-movements of different environmental aspects within the ESG framework regarding economic, financial, and energy performance [45,47,48]. All independent variables used in the study are taken from the World Bank datasets. This will help in the universality of the variables and is a common feature of current empirical research in the field of ESG issues [43,44]. The study covers a total of 127 cross-sectional observations, assumed to be countries. From a conceptual point of view, the E—Environment considers the management of natural resources, emissions, ecosystem, and stressors related to climate in the ESG factor. This holistic approach is in line with the ESG literature, which considers environmental factors together, reflecting sustainability pressures and risks [47,48]. The variables considered in the regressors represent the holistic approach. Variables like the availability of electricity, the use of fossil fuels, renewable energy variables, GHG emissions, land-use change, and freshwater withdrawal help in understanding environmental factors and performance in relation to patterns of energy use. For this approach, ENUS is not considered as an economic factor but rather as a system representing environmental factors related to ESG, energy transition, and environmental pressures [42,46]. The model is estimated using three panel data methods: fixed-effects, random-effects (using the GLS transformation proposed by Nerlove), and Weighted Least Squares with unit-specific error variances. This multimethod design helps to improve robustness and allows testing of the relative stability of coefficients across models, as often done in panel studies on ESG topics in the recent literature [45,50]. To address the high degree of cross-country heterogeneity, the fixed-effects model includes time-invariant variables such as geography, institutions, and resources in the model’s conditioning information. The corresponding goodness of fit measures (LSDV R-squared above 0.99 and within-R-squared around 0.69) show that a large part of the time-series variability in ENUS correlated with variability in E—Environment indicators. F-tests with p-values close to zero indicate joint significance of the environmental variables and ENUS, as often reported in the literature on the interrelations between environmental and economic variables in the context of ESG environmental metrics [43,44]. Electricity access has a strong and positive relationship with total energy consumption across all models, showing that the more accessible electricity is, the higher the country’s overall energy consumption. Based on an ESG analysis, this relationship shows the co-existence of developmental and environmental pressures, depending on the prevailing energy mix in the country, as extensively documented in [45,46]. Value added in agriculture, forestry, and fishing has a constant negative relationship with energy consumption, which shows that the more primary-sector-oriented an economy is, the less energy consumption per capita the country has, considering country-specific factors. Based on the ESG analysis, this shows the structural relationship of environmental and energy factors related to sectoral composition, as documented in [47,48]. Annual water withdrawal is positively and significantly associated with ENUS, reflecting the well-documented water–energy nexus and the close relationship between natural resource use and energy [42,44]. CO2 emissions per capita have one of the largest coefficients, signifying that there is a strong relationship between energy use and emission and that decoupling is still limited at the global level, consistent with ESG environmental factors that prioritize emission intensity as an important measure of sustainability [43,47]. Energy import variables have mixed signs, which reflect that energy security and trade relationships regarding energy use are not straightforward [46]. Primary energy intensity is positively and significantly associated with ENUS, suggesting that higher energy intensity tends to be associated with higher per capita energy use, consistent with efficiency considerations prominently featured in ESG sustainability discourses [44,49]. Fossil fuel use is negatively associated with ENUS, emissions and energy use variables are controlled for, signifying that there may be substitution/saturation effects in the broader environmental and energy nexus [43,48]. Emissions from land-use change, forestry, methane, N2O, and tree cover loss are positively associated with ENUS, signifying that various environmental factors tend to be associated simultaneously with higher energy use, consistent with ESG discourses that environmental factors interact and offset each other [44,47]. In general, the results show that the proposed model provides strong evidence of a systematic and stable relationship between the E—Environment variables and per capita energy consumption. The use of World Bank data in a panel data approach is consistent with the emerging ESG literature that focuses on the strong relationship between the environment and the use of energy [42,45,48]. See Table 3.
Table 3.
Comparison of clustering and classification models for ESG–energy use analysis.
Under the ESG framework, and within the E–Environment pillar, the K-Means clustering results can be interpreted as a set of distinct environmental “regimes” that describe how energy use per capita (ENUS) co-moves with key environmental, climate, and energy system variables. This interpretation is consistent with recent applications of clustering techniques to environmental and energy data, where unsupervised methods are used to uncover latent sustainability patterns and development pathways [51,52,53]. Because the reported cluster centers are standardized, positive values indicate above-average levels relative to the full sample, and negative values indicate below-average levels. Read in this way, the clusters do not merely segment countries (or observations); they outline different combinations of energy consumption, emissions profiles, climate conditions, and environmental pressures that can be understood as ESG-relevant typologies, as suggested in multidimensional ESG and sustainability analyses [2,40]. A first important result concerns the balance and usability of the partition. Cluster sizes range from 54 to 451 observations, with no single cluster absorbing the majority of the sample. This is important for environmental interpretation because it suggests that the solution is not driven by one dominant “global average” group; instead, it captures multiple meaningful environmental patterns associated with ENUS. Similar balanced clustering structures have been highlighted as desirable in comparative environmental and development studies using K-Means [53,54]. The within-cluster heterogeneity shares are relatively similar across the main clusters (clusters 1, 3, 4, 6, and 7), indicating that K-Means distributes explanatory structure across several clusters rather than concentrating it in a single group. The silhouette scores reinforce this interpretation: several clusters show reasonably good separation (notably clusters 2, 5, 8, and 10), suggesting that some environmental regimes are clearly distinct in the underlying feature space, in line with best practices in clustering-based environmental diagnostics [51,52]. Focusing on ENUS and its relationship with environmental indicators, the centroids immediately identify clusters with high-energy, high-pressure profiles. Cluster 8 is the most extreme case, with ENUS strongly above-average and similarly very high values for CO2 emissions per capita (CO2P) and other environmental stress indicators, including large positive values for PM2.5 and waste-related measures (WSTR). This combination is consistent with an “energy- and emissions-intensive” regime, where high-energy consumption is closely linked with elevated pollution burdens and greenhouse gas emissions. Comparable high-impact clusters have been identified in studies examining emissions-intensive development paths and carbon-intensive regimes using clustering approaches [51,55]. This cluster can be read as a high environmental risk profile in which energy use translates into multiple forms of environmental pressure rather than being mitigated by cleaner technologies or systemic efficiency, a concern emphasized in ESG-based energy sector analyses [2]. Cluster 10 also exhibits an above-average ENUS centroid, together with a high CO2P centroid and positive values on several climate-related variables. Compared with cluster 8, the pattern appears less extreme but still reflects a development trajectory characterized by high per capita energy demand and associated emissions. Together, these clusters highlight a core message of the E pillar: high-energy use is rarely neutral, and the clustering results suggest that it often coincides with higher carbon intensity and broader environmental burdens for specific groups of observations. This finding is consistent with cross-country clustering evidence on emissions drivers and energy use [52,56]. At the opposite end of the spectrum, clusters with below-average ENUS—such as clusters 2, 3, 5, 6, and 7—represent lower-energy regimes, but they are not homogeneous. Cluster 2 combines low-ENUS with strongly negative values in several energy system variables, indicating a low-consumption profile that may reflect limited industrial energy demand, lower electrification, or structural conditions associated with less energy-intensive development. Similar low-energy clusters have been documented in environmental- and development-focused classification studies [54]. Cluster 5 shows below-average ENUS while featuring very high values in variables related to natural capital (such as FRST), suggesting a regime where energy use is relatively low and ecological endowments are strong, a pattern consistent with natural capital-oriented environmental typologies [53]. Cluster 7 also displays low-ENUS but stands out for strong positive values in renewable-related indicators (RENC) and other environmental variables, implying a low-energy profile aligned with cleaner energy structures or stronger environmental performance, as observed in studies linking renewable intensity and environmental outcomes [2,56]. A particularly informative result is that the clustering distinguishes between cases where low-ENUS is associated with environmental advantage and cases where low-ENUS co-exists with other forms of environmental stress. For example, some lower ENUS clusters still show positive values in pollution-related indicators such as PM2.5 or in greenhouse gases other than CO2, suggesting that low-energy use does not imply superior environmental outcomes. Conversely, clusters with higher ENUS differ markedly in their environmental signatures, indicating that the relationship between energy use and environmental impact is mediated by factors such as energy mix, technology, and environmental regulation. This heterogeneity echoes recent ESG research emphasizing that environmental performance depends not only on consumption levels but also on structural and regulatory conditions [40,52]. The silhouette results help identify which environmental regimes are most clearly separated and thus most reliable for interpretation. Clusters with higher silhouette values, such as clusters 2, 5, 8, and 10, represent more coherent and consistent environmental typologies, whereas clusters with lower silhouette values, such as cluster 1, may capture transitional or mixed regimes. This distinction is particularly relevant for ESG reporting and benchmarking, where clarity and stability of classification are essential for policy and investment applications [2]. Overall, the K-Means solution provides a balanced and interpretable typology of environmental profiles linking energy use per capita to emissions, pollution, climate conditions, and energy system characteristics. The clusters demonstrate that ENUS is embedded within broader environmental regimes: some are clearly high-energy and high-impact, others combine low-energy use with strong natural capital or renewable signals, and several occupy intermediate positions where energy use and environmental pressures interact in more nuanced ways. This multidimensional segmentation is therefore useful for ESG-oriented comparative analysis, as it moves beyond single indicators and captures complex environmental patterns associated with energy use [2,51,54]. See Table A1 in Appendix A.
Within the ESG paradigm, and more specifically the E—Environment dimension, the results from the K-Means Cluster Analysis may be seen to define a number of environmental “regimes” in which energy use per capita (ENUS) and environmental variables are simultaneously identified and mapped. This also corresponds to the current use of machine learning models, specifically the K-Means model, in the area of climate and sustainability variables, where unsupervised models seek to define underlying structures in sustainable development data rather than attempting to define causation [51,52,53]. The fact that the variables in the K-Means model are standardized also allows the positive indices to define observations above the sample mean for a given variable, in contrast to the negative indices that define observations below the sample mean. The definition from the ESG paradigm therefore defines a number of environmental “regimes” in which variables for energy use per capita (ENUS) and environmental variables define a number of multidimensional ESG-related climate–sustainability profiles, rather than attempting to define causation [2,40]. One of the main results relates to the balance and interpretability of the partition. The sizes of clusters vary from 54 to 451 cases, and no single cluster tends predominate in the dataset. This means that the K-Means clustering solution does not correspond to any single ‘global average’ pattern of ENUS but instead uncovers a number of distinct environmental contexts in which it is embedded. Balanced clustering patterns of this type have already been found to be important in cross-country environmental and development studies applying K-Means [53,54]. The shape of within-cluster dispersion in the major clusters (1, 3, 4, 6, and 7) shows that explanatory variation is dispersed across several regimes rather than concentrated on any single one of them. Silhouette analysis strongly confirms this finding, suggesting that clusters 2, 5, 8, and 10 tend to be well-separated from each other from the point of view of environmental characteristics [51,52]. Concerning ENUS and environmental factors, it is apparent that there is a clear distinction between high-energy profiles and high-pressure profiles. This is evident in Cluster 8, where ENUS is substantially above the sample mean, alongside indicators of CO2 emissions per capita (CO2P), PM2.5, and waste (WSTR). These factors appear simultaneously in an “energy- and emissions-intensive” regime, whereby higher energy use is positively related to higher levels of environmental pressure and greenhouse gas emissions. Such high-intensity profiles have been identified previously in clustering studies of carbon- and emissions-intensive development patterns [51,56]. Within ESG analysis, Cluster 8 represents a high-risk environmental profile, reflecting simultaneously high levels of energy use and environmental indicators of pollution, as opposed to a causal relationship between energy use and environmental indicators [2]. Cluster 10 also represents a high-ENUS level, along with high levels of CO2 and climate indicators, reflecting a second “high-energy and emissions-intensive” regime, although of slightly different structure compared to Cluster 8. Taken together, these clusters represent a major finding of the Environmental pillar: across countries, there is often a positive relationship between levels of energy use and levels of carbon intensity and environmental pressure, as identified in cross-national studies of energy and emissions patterns [52,56]. By contrast, clusters 2, 3, 5, 6, and 7 have been found to have lower-than-average ENUS but lack homogeneity in terms of the environment. For instance, in cluster 2, the characterlower ENUSlower ENUS and lower values of energy system variables suggest that this cluster has a low-energy structure that is comparable to those in the categories of environmental development [54]. In cluster 5, the characterlower ENUSlower-ENUS and high natural capital variables, including forest cover (FRST), suggest that this cluster has high natural capital that is comparable to those in natural capital categories [53]. In cluster 7, the characteristics of lower-ENUS and high renewable energy variables (RENC), suggest that this cluster has high renewable energy that is comparable to those in cleaner energy structural profiles or those in environment-oriented development structures [2,56]. One of the major strengths of the clustering analysis is its ability to identify variability in the characteristics of those that have lower-ENUS. Some clusters have been found to have lower energy use in conjunction with more favorable environments, while others have been found to have lower ENUS in conjunction with environments that are still stressed (for example, high PM2.5 or non-CO2 greenhouse gases). This suggests that having lower energy use does not always imply having better environments. By contrast, the remaining clusters that have higher ENUS have been found to have highly variable environments, suggesting that the relationship between energy use and environments is also variable in terms of energy mixes, policy structures, and characteristics [40,52]. Silhouette analysis also helps to better distinguish internally homogeneous groups with better interpretability. For example, groups 2, 5, 8, and 10 have larger silhouette values, whereas group 1 has characteristics that appear as if they are transitioning or mixing. This difference has particular importance with regard to ESG benchmarking and comparative environmental analysis. In sum, the K-Means algorithm provides a balanced and informative taxonomy of environmental patterns wherein ENUS is considered simultaneously with emissions, pollution, climatic factors, and energy systems data. These groups indicate that per capita energy consumption is part of larger environmental systems, from high-energy-high-impact groups to low-energy groups tied to natural capital or renewable energy resources, as well as intermediate ones. This multidimensional segmentation has particular importance with regard to ESG comparative analysis, as it focuses on patterns of co-occurrence and association across energy and environmental data, as opposed to causality [2,51,54]. See Appendix A.
This figure brings together two different perspectives that complement each other to form a basis for determining and validating the optimal number of clusters in K-Means analysis through the use of statistical measures in determining model goodness of fit and visual analysis of cluster morphology. Panel A of this figure offers an explanation of the process of determining optimal cluster numbers through an Elbow Method plot, where cluster number is depicted on one axis versus various measures of goodness of fit, including Within-Cluster Sum of Squares (WSS), Akaike Information Criterion (AIC), and Bayesian Information Criterion (BIC) on the other axis. These curves all reduce in intensity with an increase in cluster number, which is an indication of an increase in precision of fit through grouping of points into smaller clusters, though at a rate where increasing benefits of further clustering start to diminish. The point of inflection at which BIC is at its least (at around ten clusters) is the most significant point and an indication that this is an optimal clustering solution, where further clustering is unnecessary, since additional clusters tend to increase overall model complexity rather than enhance goodness of fit. Since BIC is a criterion where complexity is strictly penalized compared to WSS, its trough is an optimal solution that seeks to ensure a balance in explanatory power rather than mere parsimony. Panel B of this figure presents a two-dimensional t-SNE plot of the clustered data for further visualization and interpretation of clusters. Each point in this graph is represented in a cluster, allowing determination of cluster separation and distinctness. It is realized from this graph that each cluster tends to be distinct and separated in this two-dimensional graph, though some appear to be more dispersed than others. However, all clusters seem to be distinct and separated and do not, in large numbers, appear to be overlapping or identical, which is an indication of an optimal solution in clustering that does not suffer from redundancy and overlapping. See Figure 2.
Figure 2.
Determination and validation of optimal clusters in K-Means analysis of cross-country energy use. Note: Panel (A) shows the Elbow Method using WSS, AIC, and BIC to identify the optimal number of clusters, with the minimum BIC indicating ten clusters as the best balance between goodness of fit and model complexity. Panel (B) presents a t-SNE visualization of the resulting clusters, highlighting well-defined and interpretable cross-country energy consumption patterns with limited overlap among clusters.
4.3. Machine Learning Performance in Predicting Energy Use per Capita Within the ESG Environment Pillar
Within this section, the predictive capacity of different machine learning models used to estimate energy usage per capita (ENUS) is assessed, as included in the Environment part of the ESG model [57]. To make all models eligible for comparison, this evaluation uses normalized, consistent values to assess model accuracy and degree of adaptability, including both error reduction and model explainability rates. As part of this benchmarking exercise, this section proceeds to use the concept of dropout loss to evaluate and outline which variables of the Environmental category impact overall prediction rates to the greatest extent, providing insight into the factors leading prediction differences within ENUS estimates in this multivariable and complex setting of MRA study and application [58]. This table reports the performance of several predictive models evaluated using a consistent and normalized set of comparative indicators. The metrics are adjusted to allow direct comparison across models and methods, supporting informed model selection and the assessment of MRA-based approaches for energy use prediction [57]. One of the first things to note is the spread of performance metrics across all models. It is obvious that SVM underperforms, consistently scoring zero across all performance metrics, indicating the largest prediction errors and, correspondingly, the weakest explanations. This means that the SVM does not need to be considered further. Of all the models to be analyzed, it is clear there are significant differences. Although Linear Regression and Regularized Linear models do not perform badly, their error metrics are relatively low, indicating that their R2 values are obviously poor compared to those of non-linear models. This means that linear models do not capture the underlying data process very well, resulting in relatively poor explanatory ability and a large prediction error [59]. Boosting and Decision Tree models show a considerable improvement over linear methods. Both methods show well-balanced but not outstanding results across all metrics. However, upon inspection, Decision Tree methods perform particularly well on MSE but less so on scaled errors and R2 values. These models provide intermediate solutions—they improve forecasting accuracy relative to linear models but fail to outshine all tasks specified across all evaluation criteria [60]. Finally, it is apparent Random Forest outperforms all other competitors. This model scores highest on normalized MSE and shows outstanding performance across all other metrics, indicating a model that effectively combines high predictive quality with low forecasting errors. Indeed, it is typical for higher-quality models to be more accurate and less prone to error across all task sets, as mentioned earlier, especially for methods like Random Forest, which are known for their efficacy and resistance to noise and outliers [61]. Therefore, it is proposed that Random Forest is a highly credible and balanced algorithm capable of making accurate predictions across all specified parameters. However, when all parameters are considered together, it is apparent that the best-performing model is the K-Nearest Neighbors (KNN). This is because KNN supports the maximum values across all error-related parameters, such as scaled MSE, RMSE, MAE/MAD, and MAPE, further revealing lower prediction error values than those of other models used. At the same time, it supports the maximum R2 values. As such, it points to maximum explanation of the total variance of the dependent (Y) variable [62]. The ability to accommodate both maximum and minimum variations across all parameters is notable, as it does not entail compromising one objective in order to achieve another. As such, it is reasonable to state that when both aspects of all parameters are appropriately addressed, KNN is clearly the best-performing procedure for predictions. The other model that supports moderate values is Random Forest, while the rest of the models support varying values of inferiority [57,58,61]. See Table 4.
Table 4.
Comparative performance of machine learning models in predicting energy use per capita (ENUS).
The table mentioned earlier has shown the average dropout loss for a series of environmental variables for the E—Environment domain of ESG, based on values of ENUS, the predicted measure of energy use per capita. Dropout loss measures the loss of predictive accuracy that arises when a particular variable is removed from the model. A higher dropout loss measures a strong relationship between the particular variable and predictive accuracy for ENUS, while lower dropout loss measures a weaker relationship between the two. Dropout loss can be very useful for complex models, especially those that involve non-linear relationships, as it combines the effects of individual variables and their interaction effects on predictive accuracy [55]. The analysis indicates a high level of heterogeneity with regard to the predictive importance of environmental factors for ENUS. CO2P has the highest dropout loss, reflecting an extremely strong statistical relationship with ENUS in the predictive model. This resonates with the ESG literature, which found an extremely strong empirical relationship between energy use and CO2 emissions. The high importance placed on CO2P also reinforces the fact that ENUS has strong links with the Environmental (E) part of ESG analysis, rather than being merely an economic or technological indicator [10]. Some of the other variables that have important predictive values include waste generation (WSTR), water withdrawal (AFWW), and energy efficiency (GEFF). The high rate of loss of cases on these variables indicate that they have important relationships with ENUS in the dataset. Specifically, variables like WSTR and AFWW tend to be associated with energy use in resource-intensive production and consumption processes, while GEFF reflects how differences in efficiency play out in terms of energy use [63,64]. In addition, environmental quality indicators such as TCL, LST, HI35, and PM25 demonstrate significant dropout losses, signifying strong linkages with observed ENUS variability across nations. This signifies the fact that the use of energy, environmental factors, and pollution variables correlate together in a synchronized manner in larger environmental and sustainability frameworks [65]. Other GHG variables, such as methane (CH4P) and nitrous oxide (N2OP), also demonstrate significant predictive power, signifying the fact that the use of energy is embedded in larger frameworks related to agriculture, waste, and industry [10]. Variables capturing the structure of energy systems, including energy imports (ENIM), energy intensity (ENIN), and fossil fuel dependence (FOSS), are found to experience non-negligible dropout losses, thereby implying significant relationships with ENUS, but with less predictive power than emissions, efficiency, and environmental pressure variables. Variables capturing the use of renewable energy resources (RELE, RENC) are found to experience secondary but significant relationships, thereby implying their relationship with overall energy system structures and efficiency dynamics [65]. Land-use and natural capital factors like agricultural land (AGRL), forest area (FRST), and deforestation metrics (ASFD) correlate with ENUS with relatively smaller dropout losses. This implies a less direct statistical relationship with energy use compared to emissions, efficiency, and climate factors, although it confirms that ENUS is part of larger natural system processes [63]. Climate variability factors like HDD, CDD, and SPEI have small but non-zero dropout losses, signifying a relationship to ENUS, although structural and environmental factors are more significant to energy use patterns [55]. In summary, the dropout loss analysis provides an integrated view of how ENUS is statistically connected to various environmental pressure, emissions, efficiency, and resource use variables. Contrary to what the findings may suggest about causality, the results are more about interconnectivity and predictive relationships between energy consumption, the environment, pollution, and resource metrics that define the sustainability factor of the environment captured in the data [63,65]. See Table 5.
Table 5.
Variable importance from dropout loss analysis in the ESG Environmental pillar.
Table 6 presents counterfactual or attribution-style results that specify the statistical association between the E—Environment element of the ESG approach and energy use per capita (ENUS) in the model. For each scenario, the change in ENUS from a standard baseline is shown together with the corresponding attribution variables. The results should be viewed as the model’s associations with ENUS, with negative associations representing links with lower levels of ENUS from the baseline and positive associations representing links with higher levels of ENUS. The table, therefore, presents a detailed breakdown of ENUS into environmental pressures, climate, emissions, resource use, and energy system characteristics. In all nine scenarios, the estimated values of ENUS are always below the baseline, indicating that the configuration of E—Environment variables is statistically associated with lower per capita energy use. In terms of ESG analysis, these findings point to the existence of systematic relationships between environmental variables, efficiency ratios, and climate variables and the corresponding ENUS values, consistent with the patterns of energy and emission relationships established for BRICS economies by [66]. Emission-related variables demonstrate highly significant statistical relationships. Per capita CO2 emissions (CO2P) demonstrate large negative attribution values, often exceeding −200,000, indicating a strong and tight association between energy use and carbon intensity, wherein configurations with low emissions are typically associated with lower ENUS values [67]. Methane (CH4P) and nitrous oxide (N2OP) also demonstrate similar relationships, providing further support to the interpretation that the ENUS system is part of a larger system of greenhouse gases and is not simply associated with CO2 [68]. Resource use and pollution metrics strengthen this evidence. Waste production (WSTR) and atmospheric pollution (PM25) negatively correlate with ENUS predictions, indicating that material use and pollution correlate negatively with energy consumption per capita for the scenarios tested. Water use (AFWW) negatively correlates as well, indicating the established water–energy relationship. These results support a holistic approach to resource use, efficiency, and pollution within the context of ESG analysis [69]. Climate variables show more variability in their correlation patterns. Cooling degree days (CDDs), heating degree days (HDDs), land surface temperature (LST), and heat intensity (HI35) show positive and negative variations in sign and magnitude depending on the situation, which means that ENUS can happen in conjunction under any climatic conditions. In some cases, high cooling demand correlates with high-ENUS, and in other situations, high levels of heat or adverse climatic conditions are associated with low-ENUS, as in the case of Sub-Saharan Africa [70]. Energy systems characteristics and efficiency measures demonstrate systematic relationships with ENUS. Energy efficiency (GEFF) has negative attribution values, indicating that the higher the scores, the lower the ENUS. Energy intensity (ENIN) and imports (ENIM) have negative associations, indicating that systems with lower intensity and lower imports are associated with lower per capita consumption [71]. Fossil fuel dependence (FOSS) is largely negative, indicating that systems with lower dependence on fossil fuels are associated with lower ENUS [66]. Natural capital and land-use variables like forest area (FRST), agricultural land (AGRL), and renewable energy variables (RELE and RENC) demonstrate diverse and enlightening correlations. For instance, increased forest area and increased shares of renewable energy can both represent decreased ENUS, as would be expected from more sustainable developmental trends. However, these variables mainly represent more general structural trends and do not represent the dominant drivers of ENUS [72]. Climate stress and variability variables, like SPEI, demonstrate both positive and negative correlations with ENUS across scenarios, reflecting the two-sided nature of climate stress. On the other hand, climate stress can represent increased energy use because of adaptation needs, while also representing decreased energy use because of limited economic activity. Generally, the breakdown of ENUS in the context of the E—Environment dimension of ESG reveals that emissions intensity, efficiency, pollution, and resource use are the factors most closely linked to variations in per capita energy use, while climatic and land-use factors are found to play a relatively heterogeneous role in this regard [69]. These findings are in line with the perception that energy use is an integrated phenomenon in an overall environmental system rather than an isolated one. In this light, ENUS is found to be an important focal point that links overall environmental factors, emissions, and resource use in the context of overall ESG analysis for sustainability assessments [71] Table 6.
Table 6.
Counterfactual decomposition of energy use per capita under the ESG Environmental pillar.
In addition, the predictive accuracy of the K-Nearest Neighbors (KNN) algorithm is presented in the diagram using two complementary graphics that assess the accuracy and calibration of the predictive models. KNN has been widely applied in predictive modeling and environmental studies due to its ability to describe non-linear relationships between observed and predicted variables, resulting in high predictive accuracy and model calibration [73]. The graph shows the predictive performance, with expected test data plotted against observed test data. Nearly all observed data points are closely clustered around the diagonal, indicating strong consistency between predicted and observed data. However, the observed slight deviations from the diagonal indicate minimal systematic error and an optimal fit provided by the data mode [74]. From this information, it can be concluded that the KNN algorithm accurately replicates the non-linear structure of the data. In the other graph, the mean squared error is plotted against the number of neighbors, with calculations performed on both training and validation data. As anticipated, the mean squared error on the training data decreases continuously as k decreases, reflecting increasing model flexibility. By contrast, the mean squared error for the validation data exhibits a “U” shape. The minimum mean squared error on the validation data is small for small values of k, indicating the optimal combination provided by the KNN model. A small value of k tends to increase the probability of overfitting (Figure 3).
Figure 3.
Predictive Accuracy and Calibration of the K-Nearest Neighbors (KNN) Model. Panel (A) compares observed and predicted test values, showing strong agreement along the 45° line with minimal error. Panel (B) lists training and validation mean squared error results for different values of k. The red dot represents the value of k that results in the smallest validation error, signifying the optimal number of neighbors and the best trade-off between model complexity and generalization. All this evidence further affirms the strong reliability of the KNN predictions.
5. Social Determinants of Energy Consumption: An ESG–S Analysis Using Econometric and ML Approaches
5.1. Social Sustainability and Energy Consumption: Structural Evidence from Panel Regressions
This study investigates the statistical correlation between the Social (S) component of the ESG approach and energy use per capita (ENUS), considering energy use as a socio-economic indicator that has been found to be empirically associated with wider social factors, rather than as an energy use variable that determines the aforementioned factors. Through the use of indicators related to health, demographics, food security, and overall social welfare, this study aims to explore the co-existence of different trajectories of social development and the use of energy in different countries. Using a cross-country panel dataset and a fixed-effects econometric analysis, this study aims to explore the existence of systematic correspondences between the characteristics of the former and the use of the latter, as well as the co-existence of the former and the use of the latter across different contexts of development.
The following equation has been estimated:
Within the ESG context, the Social (S) component comprises a wide range of indicators that reflect human welfare, social integration, demographic characteristics, accessibility of basic services, and the inclusiveness of economic activity [75,76]. In this regard, energy consumption per capita (ENUS), although considered an environmental factor in the traditional sense, can be understood within the context of the Social component of ESG, wherein energy consumption per capita is significantly associated with various aspects of social development [76]. In practical terms, energy consumption per capita is significantly associated in empirical studies not only with production and income but also with characteristics of the health system, demographic structure, food security conditions, lifestyles, and accessibility of infrastructure [1,77]. In this regard, energy consumption per capita can be considered an empirical window through which the co-movements of social development and sustainability can be analyzed. Methodologically, the study uses a panel dataset of 150 countries over an unbalanced time period of up to 18 years, allowing for the estimation of cross-country variability and time-series variability within countries [76]. The rejection of the hypothesis of common intercepts indicates that there are large cross-country differences in the level of energy use per capita, systematically associated with long-term social, demographic, and institutional features [78]. The variance decomposition indicates that cross-country variability in ENUS is much larger than within-country variability, indicating that cross-country structural differences are more closely related to the level of energy use. Moving on to the results of the empirical correlations, the Food Production Index (FDPI) has a negative relationship that is statistically significant with ENUS, as shown by the fixed- and random-effects models, meaning that as the productivity of the food system increases, ENUS decreases over time and across countries [79]. On the basis of the principles of social sustainability, the results match the theory that a nation that has a strong level of food security, as well as more efficient food systems, will be characterized by a lower level of energy use per capita, without any particular causal relationship between them [80]. Hospital beds per capita (HBED) has a strong and persistent positive relationship with ENUS in all models, indicating the co-existence of more advanced health systems and higher energy use per capita [81]. This is an indication of the empirical co-existence of more advanced health systems, welfare states, and energy service infrastructures, rather than a causal relationship [1,77]. Life expectancy at birth (LEXP) is negatively related to ENUS in both fixed- and random-effects models, suggesting that good health and life are usually experienced by populations with lower energy consumption per capita [78]. Under-five mortality rate (U5MR) is also negatively and significantly related to ENUS, suggesting that good health outcomes are usually accompanied by lower energy consumption per capita [76]. These findings are consistent with the patterns of social development that are accompanied by good public health structures and the accumulation of human capital [82,83]. The proportion of people aged 65 years or older (POP65) is also negatively linked to energy use per capita, suggesting that societies that score high on demographic aging tend to have lower average energy use, which relates to differences in mobility, labor force participation, and consumption patterns [77]. In contrast, the share of people overweight (OVWT) is positively and strongly linked to ENUS, capturing the empirical correlation between lifestyle patterns, materialism, and energy use in affluent societies [1,79]. Overall, the findings from the analysis show that the Social pillar of ESG has a systematic relationship with cross-country patterns of ENUS as per capita energy use. Indicators for health, demographic, food security, and lifestyle variables interact with ENUS in complex ways that demonstrate the complementarity and trade-offs that exist in the relationship between the development of the Social pillar and the achievement of sustainability in the ENUS dimension [78,83]. Healthcare systems, demographic structures, and lifestyles interact in complex ways with the profiles of national energy use, highlighting the complex and multi-faceted relationship that exists in the Social pillar and the use of energy in the world’s nations [81,82]. In conclusion, the findings from the analysis show that there is a strong relationship that exists in the Social pillar and the ENUS dimension, with per capita use of energy being the key variable that reflects this relationship [1,75]. ENUS reflects the co-evolution that exists in the provision for welfare, demographic development, consumption patterns, and the use of energy in the world’s nations. Social pillar and ESG development policies should therefore be evaluated in the context of their relationship with energy use and the ENUS dimension, with the use of an integrated approach that focuses on their relationship [77,78]. See Table 7. Test and statistics are reported in Appendix C.
Table 7.
Social determinants of energy use per capita within the ESG–Social pillar.
5.2. Multi-Criteria Evaluation of Clustering Algorithms for S—Social Profiles and ENUS
This section discusses the criteria for determining the most effective clustering method for analyzing the Social (S) element of the ESG approach in the context of energy consumption per capita (ENUS). In the multi-criteria analysis, the assessment involves a set of diverse criteria with opposing optima; the method accounts for goodness of fit and the structural values of the clusters [84]. This approach is utilized in the assessment by ensuring that a normalized and oppositely aligned multi-criteria method is employed [85]. In making the best choice among these algorithms, one needs to appreciate that the criteria in this framework are not all the same and are of opposite nature—in other words, the criteria to be optimized follow both maxim and minim conventions, with criteria Maxim, Silhouette, Minimum Separation, γ, Dunn index, and CH index to be maximized, and criteria AIC, BIC, SD, entropy, and HH index to be minimized. All criteria are arranged in the table in their scaled form, where increases are beneficial in all criteria [86]. Among density-based approaches, this method achieves the best performance in terms of goodness of fit and information criteria, as indicated by the highest R2 and the lowest AIC and BIC. However, although this approach is statistically sound, it has an inferior structure, with a silhouette value of zero and inadequate geometric separation, and, more specifically, it has a high HH index value, which is notable since it suggests that there is not negligible density or number of data points forming each cluster. As such, with regard to equilibrating this structure, this approach is not particularly suitable, although it performs well in terms of goodness of fit [87]. Hierarchical clustering is at the other extreme of this spectrum. The performance of hierarchical clustering is outstanding across various structural and geometric metrics, with silhouette, separation, Pearson γ, Dunn’s indices, and entropy all attaining their best possible values, suggesting a high degree of separation and compactness. However, its performance is sub-optimal with respect to R2, AIC, and BIC criteria, indicating that the obtained clusters fail to capture data variability adequately and that the model is inefficient. Although its performance is high-quality from a modeling perspective, this clustering method is relatively weak from an explanatory viewpoint [84,86]. Fuzzy C-Means has medium performance across all aspects, without being outstanding in any crucial category. Entropy and HH index values are relatively high, indicating a lack of balance and interpretability; nonetheless, they remain less explanatory than other models [85]. Model-based and Random Forest clustering produce fair results on some criteria; however, both are penalized for the lack of explanatory power and high HH index values. Specifically, Random Forest clustering has the highest HH index value, indicating the highest cohesion and, therefore, the least balanced distribution of clusters among the methods assessed [87]. With these considerations in mind, the best compromise in general is provided by K-Means. It yields large values for essential performance measures, such as R2 and the Calinski–Harabasz index, reflecting strong explanatory capability and good compactness relative to separation, respectively [88,89]. It also obtains a good silhouette ranking, with the best value for the normalized maximum diameter, reflecting compactness. Most importantly, it receives the lowest HH index values, indicating a favorable distribution of data points in the clusters, an important aspect when avoiding dominance by large clusters. Thus, taking into account the maximization and minimization objectives that are considered simultaneously, with equal importance given to the cluster balance along with the simplicity of the model itself, K-Means yields the most optimal and valid result [85,89]. Although it does not optimize any particular dimension, it performs very well across all significant dimensions, making it the most suited algorithm for the multi-criteria assessment framework based on ESG [88]. See Table 8.
Table 8.
Comparative evaluation of clustering and machine learning models for ESG–Social energy use profiles.
On the basis of the clustering results, focusing on the overall heterogeneity in social development patterns together with the co-variability of these patterns with energy use, it clearly emerges that the relationship between the variable ENUS (per capita energy use) and the Social (S) aspect of the ESG approach has an informative, albeit purely descriptive, role. In accordance with previous studies on national development [54], countries can be classified on the basis of their social attributes, whereby the relationship between ENUS and the social dimension could be understood not only in terms of an economic relationship but also in terms of a phenomenon systematically connected to welfare systems and demographic patterns [90]. The first notable aspect is related to the size of clusters and their cohesion. The sizes of clusters are not similar, with some being very small (clusters 2 and 5, with only nine observations each) and others being larger in size (clusters 1, 3, 6, and 10). The smaller clusters are characterized by high silhouette values (clusters 2, 5, and 9), indicating that their homogeneity is high and that they are well-separated from other clusters. The larger clusters are characterized by low silhouette values, indicating that their heterogeneity is high, reflecting the overall heterogeneity in social conditions found in the countries in general [54]. Analysis of ENUS across clusters indicates that the relationship is graded. Clusters 5 and 1 record the highest standardized energy use per capita. These two clusters also record the best social indicators, with better access to sanitation, less malnutrition, and, for cluster 1, the highest ESRP, use of internet, life expectancy, and proportion of older population. Descriptive analysis indicates that the highest ENUS is usually associated with highest social development and provision for the well-being of the population within these two clusters [91]. By contrast, clusters 2, 7, and 8 have lower ENUS scores, as well as less desirable social factors, including lower ESRP, lower life expectancy, higher fertility rates, higher mortality of children, lower access to sanitation facilities, lower levels of internet usage, and higher levels of malnutrition. Among these, lower levels of energy use per capita correlate to social deprivation factors as opposed to environmental sustainability factors [92]. Clusters 3, 4, 6, and 10 are those that hold intermediate positions. Their ENUS values are close to zero or slightly negative, and their social indicators are generally in between those of the high- and low-ENUS clusters. These clusters are characterized by moderate ESRP values, improving health indicators, incomplete access to education and sanitation, and relatively balanced demographic structures. In these cases, the values of ENUS and social development are intermediate and overlapping [90]. Demographic factors, together with variables related to the labor market, also show significant correlations with ENUS in the various clusters. For example, a higher fertility rate, together with a higher mortality rate among the under-five group, indicates that the corresponding clusters, namely 2 anlower ENUSlower-ENUS. However, a higher life expectancy, together with a higher percentage of the population aged 65+, indicates that the corresponding clusters show higher ENUS. Moreover, a higher unemployment rate, together with lower labor force participation, indicates that the corresponding clusters show lower-ENUS. However, higher government spending on education, together with higher school enrollment and a higher gender parity index, indicates that the corresponding clusters show higher ENUS [92,93]. Overall, the clustering analysis supports that ENUS is strongly linked to the Social component of ESG issues. Large energy consumption per capita is often found in conjunction with strong social rights, high health standards, high educational achievements, and greater social inclusion, whereas lower ENUS is often found in conjunction with social deprivation rather than sustainability [91]. These findings again emphasize that energy use and social development are co-structured in the ESG framework. Differences in ENUS values across clusters represent differences in welfare, demographics, and social inclusion, which imply that any analysis of energy use in the ESG-Social dimension needs to be conducted in the context of associated social profiles rather than in the context of mere sustainability norms. See Table A3 in Appendix A.
Table A4 in Appendix A reports the standardized centroid values of energy use per capita (ENUS) together with a wide set of ESG-based social indicators, offering an integrated descriptive view of how ENUS is situated within different configurations of societal structures. In line with recent ESG research [45,83], the results highlight the complex embedding of ENUS within social systems, showing how energy use per capita tends to co-vary with patterns of social development rather than reflecting a single underlying driver. Cluster 1 is characterized by high-ENUS values together with strong social performance, reflected in high levels of ESRP, internet use, life expectancy, labor force participation, access to sanitation, and a larger elderly population. This cluster represents countries with advanced welfare systems, where high-energy use per capita is observed alongside extensive social infrastructure and service provision. These features appear jointly in the data as part of a broader social–energy profile. Cluster 5 displays the highest ENUS values, while its social indicators present a more mixed configuration. In this case, elevated energy use per capita is observed together with specific demographic and mobility-related characteristics and service-oriented lifestyles, even in the absence of uniformly high levels of social inclusion. This pattern indicates that particular combinations of social and demographic features can be associated with high-ENUS even when overall social development is uneven. Clusters 2, 7, and 8 are marked by very low-ENUS values and simultaneously exhibit high levels of social deprivation, including low life expectancy, limited internet access, inadequate sanitation, and high fertility or child mortality. In these clusters, low-energy use per capita co-exists with conditions typically linked in the ESG-Social literature to energy poverty and limited access to modern services rather than to favorable sustainability outcomes. Clusters 3 and 4 represent intermediate or transitional profiles, where moderate ENUS values observed alongside partial improvements in social indicators. These clusters illustrate configurations in which social conditions and energy use appear jointly positioned between low-development and high-development regimes. Cluster 6 similarly shows that heterogeneous social outcomes can be observed together with moderate energy use per capita, particularly in contexts characterized by slower economic or social change. Overall, the clustering results underline a central descriptive insight of the ESG framework: high levels of ENUS tend to be observed together with higher degrees of social inclusion, infrastructure, and welfare provision, while low-ENUS is frequently found alongside social exclusion and deprivation. These patterns reflect systematic associations between social conditions and energy use across countries, emphasizing that ENUS is embedded within broader social configurations rather than representing an isolated or purely technical outcome. See Table A4 in Appendix A.
5.3. Benchmarking Machine Learning Models for ENUS Prediction Using ESG–Social Indicators
In this section, the capability of different models using machine learning techniques is evaluated for explaining energy use per capita, commonly referred to as ENUS, through Social—S dimension indicators using ESG. To foster a transparent method of assessment, a normalized multimetric model that considers both error reduction and explanation at the same time is used. In a similar vein, recent studies have used similar methods that involve model comparisons through a variety of metrics for testing predictive models [94,95]. This has made it relatively easy to select a model that presents a more balanced solution for predictive capability, robustness, and, more importantly, explanation, before moving towards analyzing the relative weight that social indicators have in explaining energy consumption. The aim is to identify which machine learning technique performs best among the models considered through a complete relative comparison. This comparison is achieved through a Min–Max normalization technique, ensuring all performance values are relative. This technique has a higher score for values closer to 1. The error metrics include MSE, RMSE, MAE/MAD, and MAPE. For error metrics, lower error values are associated with higher performance. However, the coefficient of determination score has a conventional scale. This technique has successfully enabled relative performance comparison among diverse indicators in a similar predictive model framework as outlined in [96]. As per the normalized outcome results, the best-performing model is seen to be the ‘K-Nearest Neighbors’ (KNN) model. The KNN model also achieves the highest normalized outcome measure (1.00) on all dimensions of evaluation—including absolute and relative error terms and goodness of fit. The superiority of the KNN model is evident on every aspect of the overall evaluation framework, reflecting its strongest predictive capability on every aspect [97]. Considering the aspect of minimizing error norms—both MSE and RMSE—the KNN model remains superior to every other model in the evaluation test and achieves the lowest error norm measure on every dimension. Furthermore, when measuring performance using ‘Mean Absolute Error’ (MAE/MAD) and ‘Mean Absolute Percentage Error’ (MAPE), the KNN model remains the best-performing model on every dimension, reflecting its capability to make exact predictions in terms of both absolute as well as relative deviations [95]. In addition to error measures, KNN also attains the highest value of Normalized R2, which means that the model captures the most variance in the target variable compared to other models. A high value of R2 along with a minimal value of prediction error measures good fit, along with good generalization capabilities within the identified domain. The consistency of both parameters again justifies that KNN attains a much better overall fit rather than just focusing on a specific measure [98]. In relation to other superior models like Random Forest and Decision Trees, KNN retains its superiority. Although Random Forest produces superior scores on many parameters, it does not produce harmony towards optimal values like KNN. Decision Trees are good but more variant on parameters, thus not as stable as KNN. Linear and ridge regression models are inferior to KNN on accuracy despite their simplicity, while Support Vector Machines are not consistent, doing extremely well on some error measures but failing catastrophically on other measures like R2 [96]. In conclusion, the above normalized statistical analysis clearly indicates that the KNN model is the most effective of the lot for this predictive task, based on its outstanding performance, error minimization, and ability to explain the results, as indicated above [94,97]. See Table 9.
Table 9.
Comparative performance of machine learning models in predicting energy use per capita under the ESG–Social dimension.
The role of Social (S) variables related to ESG factors is explored through the use of mean dropout loss scores from machine learning models to determine the relevance of these variables for variation in per capita energy use (ENUS). A high dropout loss score indicates the strength of the relationship between the variable and the model’s ability to predict the variation in ENUS in the multivariate system and does not imply any kind of causality between the two variables. It is evident from the results that there is a high level of statistical relationship between the labor market characteristics, socio-demographic variables, and per capita energy use. In this respect, the variable that is closest to ENUS is the Labor Force Participation Rate (LFPR), because countries with high-ENUS also tend to have high LFPR. This relationship indicates that societies with high economic and social activity tend to use more energy because of the high level of activity and consumption associated with these societies. This relationship also indicates that countries with high-ENUS tend to use more energy because of the high level of activity and consumption associated with these societies. A similar relationship also holds between the level of unemployment (UNEM) and the level of energy use because countries with high ENUS tend to have high population density (POPD). A second set of very pertinent variables relates to demographic dynamics and social investments. Net migration (NMIG) has a large dropout loss value, suggesting that migration data are very closely linked to levels of energy use, as countries experiencing growing or very mobile populations may have divergent consumption, labor, and infrastructure patterns. Government expenditure on education (GEE) is similarly very closely linked to ENUS, as human capital investments, development, and energy-intensive structures of the economy tend to empirically covary. Social development, inclusion, and quality-of-life indicators are similarly very closely linked to ENUS levels. Variables like internet use (INTU) and access to safely managed sanitation facilities (SANT) tap levels of technological diffusion and infrastructure development that tend to be observed together with higher levels of energy use in modern societies. Life expectancy at birth (LEXP) similarly has a very close association with ENUS, as do living standards, development, and energy-intensive lifestyles tend to empirically covary. The Economic and Social Rights Performance Score (ESRP) similarly has a non-negligible level of explanatory relevance, suggesting that levels of institutional development, protection, and rights realization tend to be systematically linked to divergent levels of per capita energy use across countries. Variables like health, demography, hospital beds per capita (HBED), proportion of population 65 years old or over (POP65), and fertility rate (FERT) similarly tend to have non-negligible levels of association with ENUS, as do levels of healthcare systems, demography, and social needs tend to empirically covary together with levels of energy use. In any case, the results presented above show that there are systematic associations between the variables of social development, labor market participation, demographic structure, and the variables in the ESG-Social dimension and per capita energy use. It is essential to highlight the fact that the associations presented in the results need to be considered in terms of patterns of covariation and association and not as causal relationships. Per capita energy use thus appears as a variable situated in a broader social configuration in which welfare, equity, and demographic structure covary with specific patterns of ENUS as per capita energy use. See Table 10.
Table 10.
Dropout loss-based importance of Social (ESG–S) indicators in explaining energy use per capita.
The model provides a decomposition of the predicted energy use per capita (ENUS) difference for each case from a baseline measure of 2.705. For each case, the difference between the predicted ENUS and this baseline measure is decomposed into the statistical contributions of the Social (S) variables as part of the ESG framework. These should be viewed as associational components of the model, with negative signs indicating that each social variable is associated with lower levels of ENUS than the baseline measure, and positive signs indicating association with higher levels of ENUS. Again, it should be noted that none of these indicators provide information on causality. In all five cases, predicted ENUS values are below the baseline, indicating that the set of Social variables in the five cases is collectively related to lower energy use per capita. Labor market variables stand out as the most significant determinants of ENUS. Labor force participation rates display large coefficients in various cases, mainly Cases 1 and 2, indicating that the rates of participation are strongly related to economic activity and energy use patterns. Unemployment also displays large coefficients, mainly with negative signs, indicating that the relationship between the two variables is heterogeneous across the five cases. Demographic variables are also found to present systematic relationships with ENUS. Net migration rates are found to present negative coefficients in all cases, signifying that the rates are systematically linked with low-energy use per capita in these situations. Fertility rates and the percentage of people aged 65 years and above are found to be related to ENUS. Indicators of social infrastructure and availability of basic services strongly correlates with ENUS. The availability of safely managed sanitation has large coefficients in some cases, such as Case 1, which shows that disparities in the availability of the infrastructure correlate with disparities in energy use. The number of Internet users also has a negative relationship with ENUS, which suggests that country with low diffusion also have low-energy use. Health-related and human development factors can be considered within this associational approach as well. Life expectancy at birth, as well as the number of hospital beds per 1000 population, mostly have negative coefficients, suggesting that countries that have not developed their healthcare infrastructure as much tend to be characterized by low-ENUs per capita as well. Under-five mortality rates have smaller and more mixed coefficients, suggesting that child health indicators are only weakly tied to ENUS, controlling for other social factors. The variables relating to the education system further define the S-E profile across cases. Government spending in the education sector, enrollment levels in primary schools, and the level of equality in the education system have large coefficients in many cases, suggesting that differences in structures of the education system correspond to different S-E profiles. In Case 5, for instance, the lack of enrollment in the primary school system is statistically linked to the lack of ENUS, consistent with the idea that lack of development in the educational system is often linked to the lack of development in the economy in terms of its complexity and, by extension, its use of energy. Finally, the Economic and Social Rights Performance Score (ESRP) shows significant coefficients, suggesting that the quality of institutions and the level of protection of social rights are systematically related to infrastructure development and energy consumption patterns of different countries. In general, the analysis shows that social factors are strongly and systematically related to variations in per capita energy use. Labor market conditions, education, healthcare, demographic factors, and social infrastructure are typically correlated with ENUS, meaning that they covary with each other, together forming typical social–energy patterns across cases. These findings should be understood in terms of patterns of relationship and covariation rather than mechanisms, meaning that improvements or deteriorations in the labor market, education, healthcare, and social inclusion are seen to accompany higher or lower levels of energy use, reflecting the embedding of ENUS in the social fabric of development. See Table 11.
Table 11.
Decomposition of predicted energy use per capita by Social (ESG–S) drivers.
The figure contains two panels that represent the performance and tuning of the K-Nearest Neighbors regression model. Panel A contains a scatter diagram with test values on the x-axis and predicted values on the y-axis. Each point in the scatter diagram represents an observation from the test dataset, and the red line represents the 45-degree reference line, where the predicted values are always equal to the observed ones. The points are concentrated along this desired line, suggesting that the predictions match the values accurately. The fact that the points are not perfectly aligned along the reference line, but are instead scattered, especially at the higher end, is expected for real datasets, as even the best model cannot perfectly predict values along the desired line due to residual prediction errors. The fact that the points do not systematically deviate from the reference line; however, indicates that the model does not exhibit bias toward the desired predictions. In Panel B, the issue of model parameterization, or tuning, is handled by using the mean squared error (MSE) as a function of the number of nearest neighbors, k. Two curves are shown: the dotted curve represents the training data, and the solid curve represents the validation data. As k increases, training error increases monotonically, as expected from the prevalence of the smoothing effect from the addition of more and more neighbors. Initially, for small values of k, the models fit the training data closely, resulting in low training error but a very high risk of overfitting.
The error in the validation data initially decreases, reaches a minimum at k = 2 (marked by a red dot), and then steadily increases as k increases. This is, of course, the trade-off between bias and variance. When k is small, the models exhibit substantial variance and, consequently, high generalization error. As k becomes very large, the models become highly biased and consequently underfit. The minimum error on the validation data thus provides the optimal value of k. Overall, the two panels provide different but useful information. Panel A verifies the strong predictive power of the chosen KNN algorithm, while Panel B verifies the choice of k by showing how parameter tuning affects generalization error. See Figure 4.
Figure 4.
Predictive accuracy and hyperparameter tuning of the K-Nearest Neighbors (KNN) regression model. Panel (A) shows the relationship between observed and predicted test values of ENUS, with a strong alignment along the 45-degree reference line, indicating high predictive accuracy and limited bias. Panel (B) displays training and validation mean squared errors for different values of k, illustrating the bias–variance trade-off. The red dot indicates the optimal choice of k (k = 2), corresponding to the minimum validation error and thus the best trade-off between model flexibility and generalization.
6. Institutional Drivers of Energy Use: Insights from ESG Indicators and Multimethod Analysis
6.1. Governance Quality and Energy Use per Capita: Evidence from the ESG G-Pillar
In this section, the statistical relationship between the Governance (G) dimension of the ESG variables and per capita use of energy (ENUS) is explored using panel data analysis, taking into consideration the most important variables that define institutional quality, political stability, gender participation, and innovational ability. This analysis explains how differences in governance-related variables have a systematic relationship with differences in energy use across different nations and at different times. In this analysis, ENUS will be used as a descriptive variable that represents the size, infrastructural development, and technology, rather than as a dependent variable that is associated with the variables in the Governance (G) dimension.
This series of empirical results can be contextualized within the ESG paradigm by focusing on the Governance (G) aspect, thus posing the question of how the level of governance, political stability, institution-building, female representation within political institutions, and the country’s innovation capacity relate statistically to energy consumption per capita (ENUS). Although ENUS is often considered as a measure of an environmental outcome, within this particular study, ENUS can be used as a proxy for a set of structural economic characteristics, encompassing the level, structure, and intensity of economic activity, infrastructure, public services, and technology orientation [99]. Under this particular approach, energy consumption per capita can be conceptualized as a set of factors that exist within, and cointegrate with, environmental, developmental, institutional, and structural characteristics. The addition of the set of variables representing the level of governance within the study can be justified by the idea that these particular variables tend to represent differences within the level of regulation, institution-building, political structures, and innovation that can be systematically connected to the level of energy use, as observed within particular countries [100]. Thus, within this particular context, the set of variables at the level of governance can be considered as part of a particular set within which ENUS can be observed, together with a set of other factors in the energy sector, encompassing the level of emissions, energy efficiency, as well as the energy mix, within the particular context of the energy sector as part of the ESG paradigm as a whole, thus encompassing a particular set of development, sustainability, and the level of institution-building as well [101].
The empirical model is based on a large unbalanced macro-panel dataset with 150 countries and 2583 observations. This imbalance is driven by the heterogeneity of data availability across countries and time, which is common for cross-country governance datasets. ENUS, the dependent variable, varies considerably across countries, with a mean of around 2325.8 and a standard deviation of around 2739.7. Variance decomposition test under the random-effects model indicates that variance is largely between countries and not within countries over time, implying that ENUS varies more across countries than across time for the same country, consistent with the idea that structural and institutional features of countries over time are strongly related to energy use [102].
The findings are presented employing random-effects GLS, fixed-effects (LSDV), and Weighted Least Squares (WLS) methods. The Hausman test rejects the null hypothesis of random-effects model consistency, suggesting correlation between unobserved country-specific variables and governance variables. This means that governance variables and energy use structures are simultaneously captured within the framework of general country-specific features, like the evolution of country institutions, geographical conditions, and the general structure of the economy. This suggests the use of the fixed-effects model as a better framework for understanding the statistical relationship between changes in governance variables and changes in the energy use structure within countries over time, while controlling for general national attributes [100,103]. Heteroskedasticity, cross-sectional dependence, autocorrelation, and non-normality of residuals were observed through diagnostic tests. These features are common in large cross-sectional panel datasets and reflect common global shocks and synchronized paths of development [102]. This suggests the need for inference regarding the direction and relative size of the coefficients and the extent of their compatibility among the different estimators rather than the exact significance levels.
Turning to the patterns of coefficients, political stability and absence of violence (PSAV) are positively and significantly linked to per capita energy use (ENUS), while the share of parliamentary seats held by women (WPAR) and ENUS is negatively and significantly linked, which reveals that nations with higher political stability have higher ENUS, whereas nations with higher female political representation have lower ENUS. These findings can be attributed to institutional, social, and policy environments in which gender representation and ENUS interact and co-evolve. These findings can also be attributed to the effects of the variables that are positively and significantly linked and the variables that are negatively and significantly linked. The rule of law (RLAW) shows a very strong positive correlation with ENUS under all specifications, implying that countries with stronger rule of law indices have stronger energy use per capita, as expected, because these countries are placed within more advanced institutional and economic frameworks. Similarly, Scientific and Technical Journal Articles (SCIAs), used as a proxy for innovation capability, show a positive correlation with ENUS, which means that countries with larger knowledge-intensive and innovation-driven sectors have stronger energy use per capita. Indeed, the empirical findings tend to reveal that quality of governance, political stability, institutions, female participation, and innovation are systematically linked to variations in per capita energy consumption. Rather than indicating the existence of direct causal relationships, the findings tend to underscore that ENUS is imbedded in wider governance and development contexts. In the context of an ESG analysis, it is important to underscore that energy consumption should not be assessed in isolation but in the context of an overall system in which institutional, political, and innovation factors are mutually aligned with economic activity. See Table 12. Tests and statistics are reported in Table A15 in Appendix C.
Table 12.
Governance (ESG–G) determinants of energy use per capita: panel data regression results.
6.2. Identifying Governance–Energy Regimes Through Model-Based Clustering in the ESG Framework
This article provides an account of the clustering process used in this work to outline specific governance–energy regimes within the ESG approach based on ESG factors and indicators. Employing a multi-criteria, normalized approach to alternative algorithm selection, this process determines the clustering method that best balances statistical validity and interpretability used for this work’s purpose and goals. Parallel approaches combining statistical modeling and ESG factors have been successfully used in recent sustainability studies to distinctly classify various governance and energy performance regimes [104]. Applying this method to specific configurations of governance quality and systematically establishing existing associations between various institutional forms and variations in energy use per capita (ENUS), based on several metrics and comparison criteria, this work finds that the best-suited method is model-based clustering. While different methods do not show superior performances across all criteria considered, this method is best at combining all of them. This is particularly important for this work’s specific goals and aims, which are not to optimize a geometric criterion but to achieve and provide a defensible solution, as described in [2]. To begin with, model-based clustering significantly surpasses other models on the most basic evaluation standards for model quality and fit. It has reached the maximum normalized values for R2, AIC, and BIC, which are essential for model assessment in terms of data explanation, while accounting for model complexity. Similar to probabilistic models used in global ESG regulatory research by [40], this model has a distinct advantage in terms of data explanation and stable model results, which are essential for models that do not rely solely on geometric principles for data representation. High R2 values indicate that the model explains a significant portion of the data’s variability. At the same time, the model’s efficiency, as evidenced by the lowest AIC and BIC scores, demonstrates its ability to describe the data without unnecessary components. Model-based clustering is vital in ESG indicator taxonomies for data representation, as it helps distinguish data across categories [105]. Such an application has demonstrated its importance in model-based data representations for distinguishing data across multiple categories based on their indicators. Second, it is clear that the model-based algorithm performs outstandingly on the Calinski–Harabasz index. This global metric evaluates the relationship between inter-cluster and within-cluster dispersion. The high value for this criterion indicates that the algorithm produces dense, globally distinct clusters, supporting the conclusion that it identifies intrinsic patterns within the dataset. This aligns with current research on energy governance, which shows that probabilistic or combined approaches are superior to deterministic algorithms for detecting structural patterns in ESG metrics [2,104]. However, it is recognized that model-based clustering is not the best-performing method when purely geometric and distance-based measures such as the Silhouette index, Dunn index, and minimum separation are used. This, of course, is to be understood in context. These measures prefer models that produce spherical, easily separable clusters. Model-based clustering, on the other hand, models the data-generating process using a mixture of probability distributions. This scenario is perhaps more accurate in practice, as overlapping and hard-to-separate data are common [80]. Thus, slight scores in geometric separation may be far from optimal but reflect a different paradigm. On comparing the options, a trade-off emerges. Fuzzy C-Means is good at measures focusing on separation, like Pearson’s gamma and maximum diameter, but is statistically sub-optimal and does poorly on AIC and BIC. Density-based approaches perform well on measures of concentration, such as the HH index, but not on other parameters. K-Means-, hierarchical-, and Random Forest-based approaches perform on average and do not perform better on any parameter worth considering. In conclusion, model-based clustering is the best all-around and most robust solution. While performances in terms of statistical measures, as well as overall cluster validity, greatly surpass those in terms of geometrical nearness, the preference for interpretability and statistical validity over efficiency and geometrical accuracy makes model-based clustering the optimal solution among the considered approaches. This aligns with new studies in the field of ESG that increasingly use model-based probabilistic approaches to integrate governance, environmental, and institutional variables in a replicable way [80,105]. See Table 13.
Table 13.
Comparative performance of clustering algorithms for ESG–Governance and energy use analysis.
Results from the model-based clustering analysis show large heterogeneity in the Governance (G) dimension of the ESG approach when considering it together with use of energy per capita (ENUS). Contrary to the aim of isolating the causal role, the analysis illustrates the systematic and non-linear covariation patterns of the indicators associated with the Governance dimension and the use of energy per capita in different nations [106,107]. In consideration of the use of ENUS together with other variables like Control of Corruption (CCOR), Political Stability and Absence of Violence (PSAV), Women’s Political Representation (WPAR), regulatory quality (RQUA), rule of law (RLAW), Scientific and Technical Journal Articles (SCIA), and Voice and Accountability (VACC), the analysis isolates institutional patterns that can be associated with the use of ENUS at different levels, as opposed to the role played by the single variables [104]. Clusters 2, 5, and 7 show governance-supportive patterns combined with relatively high values of ENUS, where Cluster 7 records the largest standardized scores on ENUS and governance variables CCOR, PSAV, RQUA, RLAW, and VACC. This finding implies that those nations that have strong and comprehensive governance structures, which cover not only institutional quality and stability but also inclusiveness and regulatory capabilities, tend to be associated with higher energy use per capita [100]. In this respect, it can be seen that ENUS is systematically linked to comprehensive institutional environments, while less comprehensive governance patterns tend to be associated with differing degrees of ENUS [106]. A similar, although less extreme, pattern can also be found in Cluster 5, characterized by relatively high scores on ENUS, together with strong scores on WPAR, RQUA, and SCIA. This result indicates that those countries that have gender representation, regulatory strength, and scientific activities tend to be grouped together with relatively high scores on ENUS, even if their scores on other governance features are not strong [107]. A similar pattern can also be found in Cluster 2, characterized by positive scores on most governance indicators and ENUS. By contrast, the defining characteristics of Clusters 1, 3, 4, 6, and 8 involve lower values of ENUS and relatively weak governance profiles. For instance, Cluster 1 has low values of WPAR, RQUA, and RLAW, as well as relatively low values of ENUS, which capture the combination of fragile institutions and low inclusiveness with low-energy use. Similarly, Cluster 8 has the lowest values of governance indicators and the lowest values of ENUS, which capture the combination of weak institutional environments and low-energy use. Clusters 3 and 4 reveal more blended patterns, where the presence of low-ENUS scores is coupled with overall weak governance scores, except for VACC, which remains high. This pattern indicates that the presence of democratic participation without robust regulatory and institutional frameworks is linked to low scores for ENUS [100,106]. Clusters 9 and 10 again stress the importance of imbalanced governance structures. Cluster 9 has very high CCOR along with low SCIA and VACC. This reflects the imbalance in the institutional structure and is again associated with certain levels of ENUS [108]. Cluster 10, which has very high SCIA, again reflects a different structure where high scientific achievements go along with relatively lower achievements in ENUS [107]. On the whole, the model-based approach to clustering reinforces the finding that the association between ENUS and the Governance dimension of ESG is a complex, systemic one, rather than a simple proportional one. There exist various combinations of governance quality, balance, and innovation that pair off in various ways with various profiles of energy use. This serves to show that energy use per capita is embedded in a governance/institutional context in a way that reinforces the ESG approach, according to which sustainability outcomes are the result of the presence of multiple interrelated factors, rather than any one factor in particular [100,108]. See Table 14.
Table 14.
Governance–energy regimes identified by model-based clustering (ESG–G dimension).
Component analysis reveals specific patterns of governance and energy that define how different sets of institutional quality shape ENUS [106]. In general, it is clear that there is a systematic relationship between ENUS and sets of political stability, institutional quality, inclusiveness, and knowledge capacity [100]. Components 2 and 7 have the best governance patterns, which include high positive values of ENUS along with high scores of Control of Corruption (CCOR), Political Stability (PSAV), regulatory quality (RQUA), and rule of law (RLAW). However, it is important to note that Component 7 shows high values of all governance variables and the highest level of ENUS, which point to a pattern where high institutional, regulatory, and accountability qualities co-exist along with high-energy use per capita [100,106]. Component 5 also shows high values of ENUS along with high scores of PSAV, RQUA, and RLAW, as well as high Voice and Accountability (VACC), which point to a pattern where civic engagement and regulatory quality co-exist along with high-energy use despite low scientific production [107]. By contrast, Components 1, 3, 4, 6, and 8 are distinguished by negative ENUS and weak governance performance. For example, Component 1 combines the lack of political stability, quality of regulations, and rule of law with low-ENUS, defining a profile in which the vulnerability of the institution and the low use of energy are coterminous [100]. Similarly, Component 8 combines low performance across all governance indicators and ENUS, suggesting a profile in which institutional weaknesses in governance are coterminous with low performance in the use of energy [106]. There are other components with relatively asymmetric definitions. For example, Component 9 combines high-ENUS with the variability in the governance performance, defining a profile in which high use of energy and an institutionally imbalanced setting are coterminous. Similarly, Component 10 combines high SCIA with high-ENUS and moderately positive governance performance, suggesting a profile in which the institution’s technological intensity and the use of energy are coterminous in the broader setting of governance performance [107]. Taken together, there is a component pattern that suggests that higher ENUS is more often related to more inclusive and more aligned governance structures, whereas lower ENUS is more often related to less inclusive institutional structures. At the same time, there are components that suggest that certain technological/institutional factors can be present alongside higher or lower levels of energy use even if there is an imbalance of governance. This is not due to causal factors, but because of associations between governance structures and ENUS [100,106,107]. See Table 15.
Table 15.
Component-level governance profiles and average effects on energy use per capita (ENUS).
The figure presents an integrated descriptive representation of the clustering results using an overall graphical representation, combining the selection of the model, the representation of the clusters, and the interpretation of the results of the combination of the two [40,105,109]. In the AIC and BIC graphs shown in Panel A, the AIC and BIC values decrease as the number of clusters increases. This indicates that the statistical models are becoming increasingly adequate to describe the data. Furthermore, the lowest point of the BIC corresponds to the solution with ten clusters. This is consistent with the multidimensional nature of the institutional and sustainability issues related to ESG highlighted by the latest literature [40]. In the second panel, there is a two-dimensional representation of the data points after the application of the clustering algorithm. While there is some overlap and regions with high point density, this indicates that different countries share certain characteristics related to institutions and energy. This is due to the nature of the algorithm, which groups the points according to their probabilistic characteristics and not according to any precise boundaries [105]. A few points are shown to be outside the clusters, but this does not significantly change the structure. In the final panel, there is the average of ENUS and the governance indicators. This indicates the heterogeneity of the structure of governance and energy characteristics. While some clusters present high averages of the ENUS and other indicators, other clusters present low averages. This indicates the co-movement and co-existence of governance characteristics and energy consumption per capita. Other clusters present asymmetry in the indicators, such as the output of the sciences and the rule of law, which present extreme values and moderate values of ENUS [109]. In summary, the three graphs present different results of the combination of governance and energy characteristics. The figure illustrates that the patterns of ENUS factors, governance factors, and governance indicators are regularly coupled together in particular patterns for each cluster, indicating that the factors are not merely linearly connected [40,105,109]. See Figure 5.
Figure 5.
Model-based clustering of Governance (ESG–G) indicators and energy use per capita (ENUS). This figure integrates cluster selection, visualization, and interpretation of governance–energy regimes. Panel (A) identifies the optimal number of clusters using AIC, BIC, and within-cluster sum of squares, with the minimum BIC indicating ten clusters as the best balance between fit and parsimony. Panel (B) displays a two-dimensional representation of clustered observations, highlighting partially overlapping yet distinct governance–energy profiles typical of probabilistic clustering. Panel (C) reports average standardized values of ENUS and governance indicators across clusters, revealing substantial heterogeneity: clusters with strong institutional quality are associated with higher ENUS, while fragile governance environments correspond to lower energy use. Overall, the figure illustrates the multidimensional and conditional relationship between governance structures and energy consumption.
6.3. Machine Learning Evaluation of Governance Drivers of Energy Use per Capita
This report examines the use of machine learning approaches in the Governance (G) area of the ESG paradigm to determine the most effective method for explaining and accurately forecasting per capita energy use [57]. By systematically examining a range of approaches using error measures and explanatory power, this report will explore the predictive validity of these models and the interactions among variables in the area of governance [110]. This report will rely on three key approaches: identifying the best algorithm, assessing variable significance, and interpreting predictive models using additive models. Based on the normalized results, the K-Nearest Neighbors algorithm is found to be the best overall option. This is because a combined analysis of all the above metrics is made, taking into consideration those metrics for which lower values are desirable, in addition to the fact that the R2 metric, for which higher values are desirable, also has to be simultaneously optimized. Normalization allows for comparison among all metrics, since they all share a common range, thereby allowing for all metrics to be easily judged in terms of a relative ranking, ranging from 0 for the worst-performing algorithm to 1 for the best-performing one [111]. KNN achieves maximum values for MSE, scaled MSE, MAPE, and R2, in addition to achieving a maximum or near maximum score for RMSE, MAE, or MAD. This further confirms the fact that the algorithm is one of the best in terms of effectively minimizing average errors while effectively minimizing errors in the form of squares, alongside a supreme ability to establish effective explanations for variations in the given data. In addition, the fact that the algorithm scored a maximum R2 value of 1, confirms the fact that KNN is the best-performing algorithm in relating features or variables, since KNN outperforms all other algorithms, including linear algorithms, in addition to the fact that it is also better than algorithms such as Boosting and Support Vector Machine (SVM) [57]. Random Forest is the nearest rival. It performs very well concerning RMSE, MAE/MAD, and MAPE, with normalized values regularly above 0.95, and it has a high R2 value. At the same time, it is slightly less stable compared to KNN concerning MSE and MSE (scaled), where KNN has a remarkable lead. This suggests that, despite being very accurate, Random Forest can be slightly more volatile regarding squared error performance, possibly because of its increased complexity, which combines several decision trees [110]. The other algorithms have more obvious shortcomings. Decision Trees are robust on both MAE and MAPE metrics but are weaker on R2 and squared error-based metrics. On the other hand, the Boosting algorithm has mediocre performance on all metrics and does not outperform other algorithms on any particular other metric. Linear Regression and Regularized Linear algorithms have normalized values that are generally lower and therefore lack flexibility in handling the non-linear relationship between the two variables. Lastly, the performance of the Support Vector Machine algorithm across all metrics tends towards zero [111]. In a nutshell, owing to its outstanding performance on all evaluation criteria as well as well-distributed error rates, the best algorithm among the ones examined has been determined to be the KNN algorithm [57,110,111]. See Table 16.
Table 16.
Comparative predictive performance of machine learning algorithms for energy use per capita (ENUS).
These findings represent the model importance scores obtained from the KNN model with a mean dropout loss function, where higher scores indicate greater importance, as their absence would lead to a significant reduction in model accuracy [112,113]. The findings clearly show that RQUA is the most crucial feature, with an importance score of 3.09 × 10⁹, indicating that the KNN model is highly dependent on this feature to infer local information and compute pairwise distances between observations. The second-most important feature is VACC, with an importance score of 2.90 × 10⁹, and its high importance indicates that this feature is of equal significance to the RQUA feature and could work together to improve model predictions and accuracy [112]. Both RLAW and CCOR have moderate importance levels at 2.36 × 10⁹ and 2.02 × 10⁹, respectively. Although still important, their importance is not as high as that of the following two most important variables, suggesting that their loss would not significantly affect model accuracy, possibly because of correlations among some features. Both WPAR and PSAV share very close levels of importance, at about 1.9 × 10⁹, suggesting moderate, but not trivial, importance, as these both seem to play an augmenting, rather than a definitional, role in model accuracy. Finally, SCIA has been determined to have the lowest level of importance, at 1.10 × 10⁹. This, again not being a trivial level, suggests that model accuracy would not be significantly reduced in the absence of SCIA, according to the KNN algorithm, as stated by [60]. Overall, the importance value distribution suggests that the KNN model is associated with a small set of principal variables, led by RQUA and VACC. In contrast, the impact of the other variables tends to become smaller cumulatively. Such a description proves highly helpful for explaining the model’s processes as well as for selecting variables or reducing dimensionality, thus confirming previous studies that governance and accountability variables have overriding importance for interpretable machine learning models based upon environmentally/socially responsible governance [60,112,113]. See Table 17.
Table 17.
Variable importance of governance (ESG–G) indicators based on KNN mean dropout loss.
The provided information offers an additive description of the predictions made by the KNN models used in the ESG framework to estimate per capita energy use (ENUS) based on governance dimension indicators. The Base Value (2323.932) refers to the average per capita energy use in the test dataset. The Predicted Value for each observation is the sum of the statistical contributions for the governance variables against the Base Value. The fact that all the predicted values are less than the Base Value implies that, for this sample, their distinct governance structures are, on average, associated with less per capita energy use than the test sample [1]. Specifically, rule of law (RLAW) makes strong negative contributions to all cases, including −1335.482 in Case 3. This means that the low scores for RLAW are significantly associated with low predictions of ENUS in the test. The fact that RLAW covers elements of contract enforcement, property rights, and judicial trust implies that these institutional features are associated with per capita energy use in the sample. Likewise, the Control of Corruption (CCOR) index has negative contributions for all three models, which suggests that the greater the corruption, the lower the energy use. The Voice and Accountability (VACC) index also has negative contributions, which imply that the less people participate in civic affairs, the lower the energy use, as reflected by the values of ENUS. On the other hand, the regulatory quality (RQUA) has a significantly positive impact, above 600 in Cases 4 and 5, indicating that the greater the regulatory quality, the greater the predicted ENUS. Regulatory quality, the ability to develop and implement good regulations, is therefore empirically consistent with greater levels of energy use in the given cases [1,40]. Political Stability and Absence of Violence (PSAV) has been found to have mixed but fairly weak and slightly negative contributions, suggesting that political stability has a weak but significant association with ENUS in the model. Women’s Political Representation (WPAR) has been found to have weak and slightly negative contributions, suggesting that in this particular dataset, women’s representation is associated with slightly lower ENUS. Scientific and Technical Journal Articles (SCIA), as a proxy measure for innovation and knowledge production, also has relatively small negative contributions. This indicates that, within these data, increased scientific production is not systematically associated with increased per capita energy use when governance characteristics are taken into account [1]. In general, the additive results show that ENUS is statistically related to the set of governance variables, namely rule of law, Control of Corruption, Voice and Accountability, and regulatory quality, in this ESG-themed model of energy use per capita. It should be noted that these results do not establish any kind of causal relationship between the variables and that they only represent the tendency of various governance attribute profiles to appear together with various energy use per capita predictions in the dataset [1,40,114]. See Table 18.
Table 18.
Additive decomposition of predicted energy use per capita by governance (ESG–G) drivers.
Panel A (Predictive Performance Plot) shows the correlation between actual ENUS values in the test data and the corresponding KNN model predictions. The strong clustering of data around the 45-degree line indicates high predictive accuracy and excellent model performance. The data points are close to the line, indicating excellent model performance in identifying non-linear associations between ESG factors and ENUS. The data points are not highly dispersed around the line, reflecting low prediction error variability even in the high-ENUS zone. Such results are highly significant in ESG analysis, where institutional variations and governance asymmetry are often associated with non-linear effects of energy consumption patterns that are inadequately modeled through linear predictive techniques. Panel B (mean squared error plot) focuses on model parameterization and robustness of the KNN model through the mean squared error (MSE) measure for both the model’s training and validation datasets across various numbers (k) of nearest neighbors. The validation curve reaches its minimum at a small k (indicated by the red spot), indicating appropriate model parameterization. It clearly demonstrates a sound compromise between model biases and variances, capable of reflecting similarities in local governance patterns without introducing noise. Beyond a certain level of k, the validation error increases gradually, reflecting model underfitting through excessive blurring of local governance patterns. Both graphs provide decisive evidence for KNN as an appropriate predictive tool before additive decomposition of ENUS along its key governance drivers. See Figure 6.
Figure 6.
The predictive accuracy and hyperparameter tuning of the KNN model for energy consumption. As depicted in Panel (A), the relationship between observed and predicted values of ENUS is clearly demonstrated, thus indicating the predictive accuracy of the KNN model. In Panel (B), the mean squared errors of the training and validation sets are depicted, considering various values of the nearest neighbors. The red dot represents the optimal value of k that corresponds to the minimum validation error, thus indicating the best balance between bias and variance.
7. Energy Use per Capita as an Environmental ESG Nexus: Evidence from Multimethod Analysis
The current study provides a comprehensive and multidimensional analysis of the relationships between per capita energy use (ENUS) and the Environmental (E) factor of ESG, reflecting the intricate covariation between energy use, environmental pressures, and sustainability variables [33]. Through the combination of panel econometrics, clustering analysis, and machine learning analysis, the study reveals the structural and situational drivers of global energy use and contributes to the existing literature regarding the statistical relationship between energy and the environment [115]. Results from the analysis of the panel data show that ENUS is positively correlated with various environmental pressure variables, namely CO2 emissions (CO2P), energy intensity (ENIN), and freshwater withdrawal (AFWW), indicating that high-energy use is typically observed toghigh-energyhigh environmental pressure indicators [80]. In contrast, the use of renewable energy (RENC) and forest area (FRST) display negative correlations with ENUS, indicating that energy systems with high shares of renewable energy and high forest area are typically observed together with low environmental pressure indicators [115]. Access to electricity (ACEL) also displays positive correlation with ENUS, reflecting the idea that access to energy services is typically observed together with high-energy use and high-development [33]. Taken together, the results from the regression analysis suggest that ENUS is intricately intertwined with energy efficiency and institutional structure and is not an isolated economic indicator [115]. In addition, the clustering analysis identifies the existence of ten environmental–energy profiles that connect ENUS with various environmental and energy indicators. Clusters with high-ENUS values tend to display high CO2, methane, Particulate Matter 2.5, and climate stress indicators like land surface temperature and Heat Index, while the remaining clusters with low-ENUS tend to display environmentally friendly profiles with high shares of renewable energy and high forest area, and limited access to energy with environmental vulnerability [80,115]. These results highlight the idea that low-ENUS does not imply environmental sustainability, nor does high- ENUS imply environmental failure. Rather, it seems that energy use is integrated in different combinations of energy mix, technology, and governance capacity [33]. As such, the clusters correspond to different ESG-Energy typologies that are distinguished by their common patterns in energy use, emissions, and environmental factors. The machine learning outcomes, particularly those from the K-Nearest Neighbors (KNN) model, further verify that ENUS exhibits non-linear relationships with the set of ESG variables. The better performance of KNN implies that patterns in energy use are more similar among countries that are similar in their set of ESG characteristics than among the entire set of countries [115]. Dropout loss analyses reveal that ENUS is highly associated with variables such as CO2 emissions, waste generation (WSTR), energy efficiency (GEFF), and water withdrawal, in addition to climate factors that are linked to temperature and heat stress. Taken in their entirety, these empirical results demonstrate that ENUS is both an indicator and an element in the larger configuration of characteristics that are linked to the set of ESG factors. High levels of renewable energy use and well-optimized energy systems are generally characterized by moderate ENUS values and low levels of environmental pressure factors, while systems that are focused on fossil fuel are generally characterized by high-ENUS values and high levels of environmental stress. These results underscore that energy use should be examined in the context of the larger set of ESG factors, in which performance factors are jointly characterized by resource use efficiency, emissions, and access to energy services [33,80,115]. In terms of policy considerations, the empirical results generally demonstrate that the set of ESG-focused energy policy considerations should be designed in relation to different empirical regimes: high energy systems are generally characterized by specific emissions and efficiency factors, while low-energy systems are generally characterized by lack of access and environmental vulnerability. The awareness of these factors generally provides the framework for designing sets of ESG-focused policy considerations that are generally in relation to empirical factors in energy use and the environment [115]. See Table 19.
Table 19.
Integrated ESG dimensions and their aggregate effects on energy use per capita (ENUS).
Cautious Interpretation of Empirical Findings. In interpreting the findings emanating from the empirical analysis presented within this study, due care must be taken. The findings from panel regression analyses, clustering analyses, as well as machine learning analysis suggest that there are consistent relations between ESG factors and energy use per capita; however, based on the present empirical setting, direct causality cannot be suggested by the estimates of the models employed within this study. Similarly, analyses based on clustering techniques and machine learning techniques identify patterns associated with the movement of variates such as those associated with ESG issues and energy use, without postulating direct causality between such variates. It is appropriate to note that any consideration within the manuscript associated with ESG “effects” on energy use should be interpreted with its associative intent, consistent with the nature of the investigation within this study setting.
8. Policy Implications of Energy Use Within an Integrated ESG Framework
The results of the research prove the applicability of a holistic approach to energy demand studies in the context of the Environmental, Social, and Governance (ESG) framework. In this regard, the results obtained clearly prove the existence of significant patterns of co-movements and covariations for the three pillars of the ESG framework, which reflects the concept of convergence presented in the ESG framework, according to [116,117]. This confirms the applicability of the holistic approach to the subject area, which was the aim of this research. With regard to the Environmental dimension, the following variables show a positive correlation with the level of ENUS: CO2 emissions (CO2P), energy intensity (ENIN), fossil fuel reliance (FOSS), and water withdrawal (AFWW). The following variables, instead, show a negative correlation with the level of ENUSL: the use of renewable energies (RENC), the use of electricity from renewable energies (RELE), and the area of forests (FRST). This is because different nations exhibit a given energy mix, resource intensity, and environmental endowment in relation to the intensity of energy use. The analysis also reveals the strong links that exist between natural systems, like the withdrawal of freshwater, the land surface temperature, and heat stress measures (HDD, CDD, and HI35), and observed patterns of energy consumption. This co-occurrence indicates interconnections that exist in the relationship between water, energy, and climate in determining the profiles of the environment and the energy. From the Social viewpoint, ENUS is correlated with development and well-being factors such as access to electricity (ACELECTRICITY = ACEL), access to clean fuel for cooking (ACELECTRICITY = ACFT), government education expenditure (GEE), internet use (INTU), life expectancy at birth (LEXP), and access to sanitation (SANT). These factors are systematically correlated with increased use of energy, since social development, provision of services, and energy use are systematically manifested in the development process. Moreover, unemployment (UNEM) and energy use are systematically correlated, thereby implying an empirical relationship between unemployment and energy use. Under the Governance category, the variables that ENUS is consistently correlated with are the quality of regulation (RQUA), rule of law (RLAW), Control of Corruption (CCOR), Political Stability (PSAV), Voice And Accountability (VACC), and scientific capacity (SCIA). A nation that has good governance and institutions is likely to have different energy consumption patterns from those nations with poorer governance and institutions. This is to emphasize the significance of governance being considered as part of the larger ESG factor. In conclusion, the evidence suggests that energy use is embedded in a broader ESG environment where the environment, social, and governance dimensions interact and covary with each other. Rather than reflecting the existence of direct causal mechanisms, the evidence points to the existence of significant associations between ENUS and ESG variables, implying that energy use should also be understood from a multidimensionality Environment, Social, and Governance perspective. For the purposes of energy sustainability, these results confirm the importance of ESG-based approaches in addressing the interconnected nature of these dimensions.
Data-Driven and Cluster-Specific Policy Implications. The policy discussion is framed around integrated ESG-responsive energy policies, where the empirical results are used to derive evidence-based insights from the identified ESG–energy clusters. Rather than implying direct causal mechanisms or universally applicable policy prescriptions, the cluster analysis highlights systematic associations and recurring configurations of environmental, social, governance, and energy use characteristics across countries. These configurations make it possible to compare different country profiles in a structured way and to reflect on how distinct ESG patterns are empirically linked to different energy-related outcomes. For example, some clusters are characterized by the joint presence of high environmental pressure, high total primary energy intensity, and relatively low governance performance. Other clusters combine relatively strong institutional quality with high levels of environmental stress. A further group of clusters is marked by high levels of economic and social development together with high or rising levels of total primary energy use. These patterns do not imply that one dimension produces or determines another; rather, they describe empirically observed co-movements among governance quality, environmental conditions, and energy use profiles. Within this framework, the comparison across clusters allows policymakers and analysts to situate individual countries within broader ESG–energy typologies. This provides a basis for considering how different combinations of welfare levels, institutional arrangements, environmental pressures, and energy systems tend to appear together in the data. In this sense, policy-relevant insights emerge from recognizing how, for instance, higher welfare, institutional strength, and energy intensity often co-exist in some clusters, while other clusters show the joint presence of weaker governance, lower energy use, and higher vulnerability. These empirically identified patterns differ from the approach embedded in Nationally Determined Contributions (NDCs), which are primarily organized around target-based commitments on emissions. The cluster-based perspective instead emphasizes the diversity of institutional, social, and economic contexts in which energy and environmental outcomes are observed, highlighting that similar emission targets may be embedded in very different ESG configurations across countries. Overall, the analysis does not claim that particular Governance, Social, or Environmental features cause specific energy outcomes. Rather, it documents stable associations between groups of ESG characteristics and energy use profiles, offering a descriptive and comparative framework that can inform context-sensitive discussions of energy and sustainability policies across different national settings.
Differentiated ESG-Oriented Energy Policies Based on Integrated Clustering Evidence. While clustering exercises are carried out separately for the Environmental, Social, and Governance (ESG) dimensions, their joint interpretation provides a structured way to describe how different combinations of ESG indicators and energy variables tend to co-occur across countries. The combined analysis highlights recurring ESG–energy profiles, defined by observed associations among per capita energy use, emission intensity, social characteristics, and institutional indicators. These profiles suggest that countries can be grouped into distinct ESG–energy regimes rather than evaluated through a single, uniform framework. For example, countries characterized by high per capita energy use and high carbon intensity, such as those in Cluster 8, are observed to be associated with profiles in which energy demand, efficiency indicators, regulatory quality, and carbon pricing instruments tend to appear together in particular configurations. Similarly, countries with relatively low levels of per capita energy consumption, such as those in Clusters 2 and 7, display patterns in which limited energy use is observed alongside specific social and welfare indicators, as well as particular forms of access to modern energy services. These patterns describe how energy access, social conditions, and technological choices are statistically linked within these country groups, without implying that one dimension directly causes another. In intermediate or transitional clusters, where energy use is moderate and ESG indicators show mixed values, the data reveal configurations in which efficiency, social cohesion, and institutional quality are jointly observed at intermediate levels. These clusters therefore represent blended ESG–energy profiles rather than clearly polarized regimes. Overall, the cluster-based evidence indicates that ESG-oriented energy policy frameworks can be organized around empirically observed ESG–energy regime types. These regime types are defined by associations between structural, social, institutional, and environmental variables, and they provide a descriptive basis for comparing country profiles. Rather than implying causal pathways, the clustering results highlight how different dimensions of ESG and energy use tend to be jointly configured across countries, offering a comparative lens for understanding diversity in structural settings and implementation capacities within energy transition strategies. See Table 20.
Table 20.
Differentiated ESG–Energy policy recommendations based on integrated clustering profiles.
9. Conclusions
This research provides an original and holistic contribution to the literature in energy economics and sustainability studies by contextualizing energy use per capita (ENUS) within the Environmental, Social, and Governance (ESG) framework. Contrary to viewing energy use from an economic standpoint alone or studying individual dimensions of ESG separately, this research takes an integral approach that studies ENUS in the context of a set of factors that encompass overall environmental factors, social development, and governance. In this framework, ENUS is conceptualized not from the standpoint of an outcome measure or an antecedent cause but from an integral measure that is collocated with several dimensions of ESG, indicating how energy use patterns are collocated with characteristics of sustainability. In terms of methodology, the paper contributes to the literature by combining panel econometric models, unsupervised clustering, and machine learning regression models under one research umbrella. Fixed, random, and Weighted Least Squares panel models are used to determine the robust correlation between ESG variables and ENUS, controlling for heterogeneity. Cluster analysis helps to identify ESG-energy regimes, where countries with comparable energy consumption are grouped together with different sets of Environmental, Social, and Governance factors. At the same time, machine learning techniques, specifically the K-Nearest Neighbors algorithm, are used to identify non-linear structures of similarity in the dataset, which are beyond the capability of linear models. The dropout loss function helps to increase the interpretability of the results by pointing to the variables with the highest correlations with model performance. In this study, machine learning is used as a complementary tool to panel econometric analysis, with the aim of confirming the relative importance of ESG variables in predictive terms and highlighting possible cross-country heterogeneity and non-linear patterns, without implying any causal interpretation. Econometric panel estimates remain the main basis for interpreting statistical correlations between ESG dimensions and ENUS, while machine learning provides additional descriptive evidence on similarity structures and variable relevance. From the Environmental (E) perspective, the empirical findings show that ENUS is systematically linked to the following indicators: CO2 and greenhouse gas emissions, water withdrawal, generation of waste, and energy intensity. Panel regressions, clustering estimates, and machine learning results all show that high-ENUS levels are systematically accompanied by high CO2 and greenhouse gas emissions, high water withdrawal, high levels of waste generation, and high levels of energy intensity, whereas low-ENUS levels are instead associated with other systematic patterns of natural assets and environmental characteristics. Under the Social (S) theory, the discussion emphasizes that ENUS is closely related to human development and welfare measures. Variables such as access to electricity, clean fuels for cooking, education, health, and living standards are often closely related to energy consumption per capita. Higher ENUS is normally found in societies that have high social development, whereas lower ENUS is normally found in societies that lack basic services and have lower welfare standards. This discussion clearly suggests that energy consumption is embedded in broader social structures and is not an autonomous economic variable. In the Governance (G) dimension, ENUS is also seen to have strong links with the quality of institutions and the structures of governance. This is because the ENUS profiles of countries with strong regulatory qualities, rule of law, less corruption, political stability, and high innovation capacity differ from the ENUS profiles of countries with less strong institutions and structures of governance. Results from the use of machine learning and clustering also show that the variables in the Governance dimension interact in complex, non-linear patterns in which ENUS, institutions, and innovations co-vary. Taken together, the evidence indicates that the ESG framework should treat ENUS as a nexus variable, capturing the joint distribution of environmental pressures, social development, and governance quality. These factors are interdependent and cannot be disentangled in the analysis of energy patterns. Rather, this research shows that per capita energy consumption is imbedded in ESG patterns that differ across countries and development trajectories. From a policy perspective, these results suggest that ESG-focused energy policies need to be tailored to each of the different ESG-energy regimes that emerge from the data. High- and low-ENUS country groups are each defined by a different set of environmental, social, and institutional characteristics, and these differences are likely to imply different policy focuses. Instead of developing a single policy approach to address the challenge of energy transition, policies can be tailored to each of the ESG-energy regimes that emerge from the data. In summary, this research makes a contribution to the fields of ESG and energy by proving the existence of systematic relationships between energy consumption per capita and the Environmental, Social, and Governance pillars. This research combines the power of panel econometrics, the strength of clustering techniques, and the advantage of machine learning techniques to form a strong empirical basis to examine the positioning of energy consumption among larger sustainability trends.
Author Contributions
Conceptualization, C.D., A.C., M.A., F.A. and A.L.; Methodology, C.D., A.C., M.A., F.A. and A.L.; Software, C.D., A.C., M.A., F.A. and A.L.; Validation, C.D., A.C., M.A., F.A. and A.L.; Formal analysis, C.D., A.C., M.A., F.A. and A.L.; Investigation, C.D., A.C., M.A., F.A. and A.L.; Resources, C.D., A.C., M.A., F.A. and A.L.; Data curation, C.D., A.C., M.A., F.A. and A.L.; Writing—original draft, C.D., A.C., M.A., F.A. and A.L.; Writing—review & editing, C.D., A.C., M.A., F.A. and A.L.; Visualization, C.D., A.C., M.A., F.A. and A.L.; Supervision, C.D., A.C., M.A., F.A. and A.L.; Project administration, C.D., A.C., M.A., F.A. and A.L.; Funding acquisition, C.D., A.C., M.A., F.A. and A.L. All authors have read and agreed to the published version of the manuscript.
Funding
This research received no external funding.
Data Availability Statement
The data presented in this study are openly available in Sovereing ESG Data Portal at https://esgdata.worldbank.org/?lang=en available online 10 October 2025.
Conflicts of Interest
The authors declare no conflicts of interest.
Abbreviations
| Variables | Acronym | ESG |
| Energy use (per capita) | ENUS | y |
| Access to clean fuels and technologies for cooking | ACFT | E-Environment |
| Access to electricity | ACEL | |
| Adjusted savings: natural resources depletion | ASNR | |
| Adjusted savings: net forest depletion | ASFD | |
| Agricultural land | AGRL | |
| Agriculture, forestry, and fishing value added | AFFV | |
| Annual freshwater withdrawals | AFWW | |
| CO2 emissions (per capita) | CO2P | |
| Cooling degree days | CDD | |
| Electricity production from coal | ELCO | |
| Energy imports, net | ENIM | |
| Energy intensity of primary energy | ENIN | |
| Forest area | FRST | |
| Fossil fuel energy consumption | FOSS | |
| GHG emissions/removals (LUCF) | GEFF | |
| Heat Index 35 | HI35 | |
| Heating degree days | HDD | |
| Land surface temperature | LST | |
| Level of water stress | WSTR | |
| Methane emissions (per capita) | CH4P | |
| Nitrous oxide emissions (per capita) | N2OP | |
| PM2.5 air pollution exposure | PM25 | |
| Renewable electricity output | RELE | |
| Renewable energy consumption | RENC | |
| Standardized Precipitation–Evapotranspiration Index | SPEI | |
| Tree cover loss | TCL | |
| Economic and social rights performance score | ESRP | S-Social |
| Fertility rate | FERT | |
| Food production index | FDPI | |
| GDP growth | GDPG | |
| Government expenditure on education | GEE | |
| Hospital beds | HBED | |
| Individuals using the Internet | INTU | |
| Labor force participation rate | LFPR | |
| Life expectancy at birth | LEXP | |
| Mortality rate, under 5 | U5MR | |
| Net migration | NMIG | |
| People using safely managed sanitation | SANT | |
| Population ages 65 and above | POP65 | |
| Population density | POPD | |
| Prevalence of overweight | OVWT | |
| Prevalence of undernourishment | UNDR | |
| Female-to-male labor participation ratio | FLMR | |
| School enrollment, primary | PRIM | |
| School enrollment gender parity index | SGPI | |
| Unemployment rate | UNEM | |
| Control of corruption | CCOR | G-Governance |
| Political stability and absence of violence | PSAV | |
| Proportion of seats held by women | WPAR | |
| Regulatory quality | RQUA | |
| Rule of law | RLAW | |
| Scientific and technical journal articles | SCIA | |
| Voice and accountability | VACC |
Appendix A
Table A1.
K-Means Environmental ESG regimes and energy use per capita (ENUS).
Table A2.
Environmental ESG cluster profiles and energy use per capita (standardized K-Means centroids).
Table A3.
Social–Energy regimes identified through K-Means clustering within the ESG–S Pillar.
Table A4.
Standardized Cluster centroids of energy use and Social ESG indicators (ESG–S pillar).
Table A5.
Hausman test results for ESG panel regressions.
Appendix B. Hyperparameters
Table A6.
Training parameters for the Boosting regression.
Table A7.
Training parameters for the Decision Tree regression model.
Table A8.
Training parameters for the K-Nearest Neighbors (KNN) regression model.
Table A9.
Training parameters for the Linear regression model.
Table A10.
Training parameters for the Random Forest regression model.
Table A11.
Training parameters for the Regularized Linear Regression (LASSO) model.
Table A12.
Training parameters for the Support Vector Machine (SVM) regression model.
Appendix C. Panel Econometric Estimates and Diagnostic Tests for ESG Determinants of Energy Use per Capita (ENUS)
Table A13.
Panel data estimates and diagnostic tests for Environmental ESG drivers of energy use per capita (ENUS).
Table A14.
Panel estimates and diagnostic tests of Social ESG determinants of energy use per capita (ENUS).
Table A15.
Panel estimates and diagnostic tests of Governance ESG determinants of energy use per capita (ENUS).
References
- Drago, C.; Costantiello, A.; Arnone, M.; Leogrande, A. Bridging Sustainability and Inclusion: Financial Access in the Environmental, Social, and Governance Landscape. J. Risk Financ. Manag. 2025, 18, 375. [Google Scholar] [CrossRef] [Scilit]
- Saltık, Ö. Algorithmic Approaches to Unraveling ESGC Impact on Financial Per-formance Based on the Ethical Investing in the Energy Sector. Int. J. Pure Appl. Sci. 2024, 10, 459–517. [Google Scholar]
- Horbach, J. Digitalisation and sustainability measures at the firm level. Digit. Econ. Sustain. Dev. 2024, 2, 19. [Google Scholar] [CrossRef] [Scilit]
- Şahin, E.E. Explaining Economic and Environmental Outcomes Through Renewable Energy Quality: An Interpretable Machine Learning Approach Using XGBoost and SHAP. J. Sustain. Dev. Issues 2025, 3, 32–52. [Google Scholar] [CrossRef] [Scilit]
- Tan, W.; Yan, E.H.; Chen, X.H. Positive press, greener progress: The role of ESG media reputation in corporate energy innovation. Sustain. Dev. 2025, 33, 5162–5184. [Google Scholar] [CrossRef] [Scilit]
- Afzal, M.A.; Rahman, S.U.; Aslam, M.T. Mapping the Nexus of Sustainability, Innovation, and Renewable Energy: A Bibliometric Analysis of Green Technology Research. Crit. Rev. Soc. Sci. Stud. 2025, 3, 1176–1200. [Google Scholar] [CrossRef] [Scilit]
- Davidescu, A.A.; Agafiței, M.D.; Gheorghe, M.; Strat, V.A. A Machine Learning and Econometric Framework for Credibility-Aware AI Adoption Measurement and Macroeconomic Impact Assessment in the Energy Sector. Mathematics 2025, 13, 3075. [Google Scholar] [CrossRef] [Scilit]
- López-Flores, F.J.; Sánchez-Zarco, X.G.; Rubio-Castro, E.; Ponce-Ortega, J.M. A machine learning approach for optimizing the water-energy-food-ecosystem nexus: A resilience perspective for sustainability. Environ. Dev. Sustain. 2025, 27, 8863–8891. [Google Scholar] [CrossRef] [Scilit]
- Xie, M.; Zhao, S.; Lv, K. The impact of green finance and financial technology on regional green energy technological innovation based on the dual machine learning and spatial econometric models. Energies 2024, 17, 2521. [Google Scholar] [CrossRef] [Scilit]
- Drago, C.; Arnone, M.; Leogrande, A. A Machine Learning and Panel Data Analysis of N2O Emissions in an ESG Framework. Sustainability 2025, 17, 4433. [Google Scholar] [CrossRef] [Scilit]
- Adedokun, I.A. Environmental, social, and governance (ESG) metrics and Nigeria’s energy transition: Towards legal integration in the oil and gas sector. J. Sustain. Dev. Law Policy 2026, 17, 139–169. [Google Scholar] [CrossRef] [Scilit]
- Zournatzidou, G.; Staikouras, C.; Ragazou, K.; Zopounidis, C.; Sariannidis, N. Unlocking the threshold effects of ESG performance towards policy energy efficiency of the European energy sector: A hybrid multi-criteria decision-making approach based on weight-entropy TOPSIS. Energy Econ. 2025, 151, 108915. [Google Scholar] [CrossRef] [Scilit]
- Singh, K.; Arora, A. ESG reputation and the possibility of energy inefficiency: Does stakeholder perception conceal the adverse effects of compromised legitimacy? Soc. Responsib. J. 2025, 21, 2253–2270. [Google Scholar] [CrossRef] [Scilit]
- Gao, W.; Sun, J.; Hao, C. Impact of ESG on the total factor productivity of energy enterprises—From the perspectives of investor preference and financing constraints. J. Resour. Ecol. 2025, 16, 1306–1314. [Google Scholar] [CrossRef] [Scilit]
- Lou, Y. Green finance market and carbon neutralization capacity in China. Humanit. Soc. Sci. Commun. 2025, 12, 261. [Google Scholar] [CrossRef] [Scilit]
- Wang, W.; Wang, J. Sustainable finance and carbon neutrality: The role of green bonds, ESG investments, and carbon pricing. J. Environ. Manag. 2025, 395, 127731. [Google Scholar] [CrossRef] [Scilit]
- Sorrosal-Forradellas, M.-T.; Fabregat-Aibar, L.; Barberà-Mariné, M.-G.; Terceño, A. Tailoring fund selection to diverse investors: Integrating financial and sustainability performance. J. Bus. Econ. Manag. 2025, 26, 1027–1049. [Google Scholar] [CrossRef] [Scilit]
- Madwe, M.C.; Nzuza, Z.W.; Olarewaju, O.M. The impact of energy efficiency on financial performance: Evidence from polluters in South Africa. Sustainability 2025, 17, 10630. [Google Scholar] [CrossRef] [Scilit]
- Burinskienė, A.; Grybaite, V.; Lapinskiene, G. The link between ESG factors and corporate profitability: Evidence from resource-intensive industries in Europe and the USA. Sustainability 2025, 17, 10714. [Google Scholar] [CrossRef] [Scilit]
- Christine, A.F.; Hakam, D.F.; Nainggolan, Y.A.; Wiryono, S.K.; Hakam, L.I. Environmental, social, and governance (ESG) impact on corporate financial strategy of energy and utilities companies worldwide. Energy Strategy Rev. 2025, 62, 101916. [Google Scholar] [CrossRef] [Scilit]
- Sklavos, G.; Zournatzidou, G.; Ragazou, K.; Sariannidis, N. Green accounting and ESG-driven eco-efficiency in European financial institutions: A two-stage DEA–CRITIC–TOPSIS evaluation. PLoS ONE 2025, 20, e0334882. [Google Scholar] [CrossRef] [Scilit]
- Nor, M.H.M.; Syafiq Syazwan, M.S.S.; Yusop, F.M.; Sumarwati, S.; Nizam, N.A.M.; Wijayaningtyas, M. An ESG-based smart buildings assessment framework: A bibliometric and conceptual analysis in the Malaysian context. Multidiscip. Rev. 2026, 9, e2026189. [Google Scholar] [CrossRef] [Scilit]
- Niu, N.; Zhang, B.; Song, Y.; Boateng, A. Climate policy uncertainty and ESG performance of energy firms: The moderating effect of cloud computing technology. Int. Rev. Financ. Anal. 2025, 108, 104674. [Google Scholar] [CrossRef] [Scilit]
- Zhou, X.; Peng, Y.; Sun, X.; Cao, X.; Wang, Z.; Zhang, J. Advancing new energy industry quality via artificial intelligence-driven integration of ESG principles. Humanit. Soc. Sci. Commun. 2025, 12, 1491. [Google Scholar] [CrossRef] [Scilit]
- Riti, R.I.; Bacali, L.; Abrudan, C.I. From AI adoption to ESG in industrial B2B marketing: An integrated multi-theory model. Sustainability 2025, 17, 8595. [Google Scholar] [CrossRef] [Scilit]
- Dong, H.; Wang, L.; Wu, X.; Hou, K. The impact of green innovation network embeddedness on ESG performance in energy enterprises: The mediating role of green dynamic capabilities and the moderating role of organizational agility. J. Clean. Prod. 2025, 526, 146632. [Google Scholar] [CrossRef] [Scilit]
- Aljohani, A. A decision-support framework for evaluating AI-enabled ESG strategies in the context of sustainable manufacturing systems. Sci. Rep. 2025, 15, 23864. [Google Scholar] [CrossRef] [Scilit] [PubMed]
- Li, Y.; Darko, A. Incentive mechanisms and decision-making behaviors in warehouse energy efficiency retrofits: A tripartite evolutionary game analysis. Energy Build. 2025, 349, 116578. [Google Scholar] [CrossRef] [Scilit]
- Wang, J.; Zhang, H.; Hou, X.; Yang, Z. Comprehensive value evaluation of rural shared energy storage based on Nash negotiation. Sustainability 2025, 17, 10513. [Google Scholar] [CrossRef] [Scilit]
- Mufungizi, I.; Mpaka, Y.W. Transforming resource wealth into sustainable futures: ESG integration in the Democratic Republic of Congo’s mining sector. Extr. Ind. Soc. 2025, 24, 101719. [Google Scholar] [CrossRef] [Scilit]
- Kiran, M.; Naeem, M.A.; Rabbani, M.R. Evolving dynamics of ecological sustainability: Investigating ESG investments and governance quality in G8 nations. J. Knowl. Econ. 2025, 16, 17755–17783. [Google Scholar] [CrossRef] [Scilit]
- Costanzo, M.R.; Ingenito, S.; Matarazzo, A.; Scuderi, A.; Guagliardi, G.; Lapiana, A. From organic waste to agricultural fertilizer: A measurement of the level of circularity and an assessment of economic feasibility. Environ. Eng. Manag. J. 2025, 24, 2181–2193. [Google Scholar] [CrossRef] [Scilit]
- Magaletti, N.; Notarnicola, V.; Di Molfetta, M.; Leogrande, A. Decarbonizing the building sector: The integrated role of environmental, social, and governance indicators. Buildings 2025, 15, 3601. [Google Scholar] [CrossRef] [Scilit]
- Liu, B.; Song, Z.; Wang, H. An economic scheduling management method for microgrids using multi-strategy improved sand cat swarm optimization. Biomimetics 2025, 10, 735. [Google Scholar] [CrossRef] [Scilit] [PubMed]
- Gao, Y.; Zhang, M.; Nasir, M.A.; Hao, Y.; Wu, J.; Zhang, L. ESG greenwashing behaviour in the electric vehicle supply chain: Insights from evolutionary game theory. Int. J. Prod. Econ. 2025, 289, 109798. [Google Scholar] [CrossRef] [Scilit]
- Veisi, H. Advancing energy transition and climate accountability in Wisconsin firms: A content analysis of corporate sustainability reporting. Sustainability 2025, 17, 8935. [Google Scholar] [CrossRef] [Scilit]
- Fu, Y.-H.; Yang, H.-C.; Feng, G.-F.; Chang, C.-P. What’s the impact of multi-dimensional globalization in accelerating green technology diffusion? Sustain. Dev. 2025, 33, 6399–6417. [Google Scholar] [CrossRef] [Scilit]
- Jin, J.; Xu, S.; Gao, B. Can energy efficiency credit guidelines boost enterprises’ low-carbon technological innovation? Evidence from China. Energy Econ. 2025, 150, 108855. [Google Scholar] [CrossRef] [Scilit]
- Alkhalifa, F.A. Assessing the predictive power of LEED certification on ESG performance: Limitations and implications for holistic sustainability measurement. Sustain. Dev. 2025, 33, 7459–7473. [Google Scholar] [CrossRef] [Scilit]
- Costantiello, A.; Leogrande, A. The Regulatory Quality and ESG Model at World Level; University Library of Munich: Munich, Germany, 2023. [Google Scholar]
- Laureti, L.; Alberto, C.; Angelo, L. The Role of Government Effectiveness in the Light of ESG Data at Global Level; University Library of Munich: Munich, Germany, 2023. [Google Scholar]
- Onomakpo, H.O. Determinants of Renewable Energy Investment: An Integrated Analysis of ESG, Geopolitical Risk, and Finance. J. Invest. Bank. Financ. 2025, 3, 1–18. [Google Scholar] [CrossRef] [Scilit]
- Farooq, U.; Thavorn, J. Exploring the Impact of Environmental, Social, and Governance (ESG) Performance on Firm Efficiency: The Mediating Role of Environmental R&D Investment in BRICS Economies. Corp. Soc. Responsib. Environ. Manag. 2025, 32, 3978–3996. [Google Scholar] [CrossRef] [Scilit]
- Abbas, N.; Hassan, M.; Shaheen, W.A. Sustainability in action: An examination of human capital, green finance, green growth, and environmental taxation on load capacity factors. J. Clim. Community Dev. 2025, 4, 91–104. [Google Scholar]
- Manjengwa, E.; Dunga, S.H.; Mncayi-Makhanya, P.; Makhalima, J. ESG Performance and Economic Growth in BRICS Countries: A Dynamic ARDL Panel Approach. Sustainability 2025, 17, 6334. [Google Scholar] [CrossRef] [Scilit]
- Sharipov, K.; Abdullayev, I.; Kuziboev, B.; Makhmudov, S.; Kalandarov, F.; Khaytboeva, N.; Ilkhamova, Z. The Effect of Energy Policy Risk on Renewable Energy. Int. J. Energy Econ. Policy 2025, 15, 566. [Google Scholar] [CrossRef] [Scilit]
- Lapinskienė, G.; Gedvilaitė, D.; Liučvaitienė, A.; Peleckis, K. How does environmental data from ESG concept affect stock returns: Case of the European Union and US capital markets. Emerg. Sci. J. 2023, 7, 410–427. [Google Scholar] [CrossRef] [Scilit]
- Tutar, H.; Štreimikienė, D.; Mutlu, H.T. The Relationship Between ESG and Financial Performance in Global Firms: A Multidimensional Study Across Sectors and Regions for the Period 2015–2025. Corp. Soc. Responsib. Environ. Manag. 2025, 32, 8280–8294. [Google Scholar] [CrossRef] [Scilit]
- Matsali, C.; Skordoulis, M.; Papagrigoriou, A.; Kalantonis, P. ESG Scores as Indicators of Green Business Strategies and Their Impact on Financial Performance in Tourism Services: Evidence from Worldwide Listed Firms. Adm. Sci. 2025, 15, 208. [Google Scholar] [CrossRef] [Scilit]
- Aslan-Çetin, F.; Öztürk, S.; Akarsu, O.N. The Effect of ESG Data of Companies on Financial Performance: A Panel Data Analysis on The BIST Sustainability Index. Sosyoekonomi 2024, 32, 125–146. [Google Scholar] [CrossRef] [Scilit]
- Krstić, M. Climate change in the EU: Analysis by clustering and regression. Serbian J. Manag. 2023, 18, 111–132. [Google Scholar] [CrossRef] [Scilit]
- Jiménez-Preciado, A.L.; Álvarez-García, J.; Cruz-Aké, S.; Venegas-Martínez, F. On the Latin America Evidence for the Environmental Kuznets Curve: A Two-Stage Approach using K-means Clustering and Polynomial Regression. Int. J. Energy Econ. Policy 2025, 15, 409. [Google Scholar] [CrossRef] [Scilit]
- Noviandy, T.R.; Hardi, I.; Zahriah, Z.; Sofyan, R.; Sasmita, N.R.; Hilal, I.S.; Idroes, G.M. Environmental and economic clustering of indonesian provinces: Insights from K-Means analysis. Leuser J. Environ. Stud. 2024, 2, 41–51. [Google Scholar] [CrossRef] [Scilit]
- Mendoza-Mendoza, A.; Visbal-Cadavid, D.; De La Hoz-Domínguez, E. Classification of Latin American and Caribbean Countries Based on Multidimensional Development Indicators: A Multivariate Empirical Analysis. Economies 2025, 13, 178. [Google Scholar] [CrossRef] [Scilit]
- Lee, K.; Yun, S.J.; Park, S. Varied drivers for reducing CO2 emissions in countries with legislated carbon neutrality targets: A Kaya identity clustering analysis. Environ. Dev. Sustain. 2025, 1–23. [Google Scholar] [CrossRef] [Scilit]
- Lee, J.; Oh, Y.; Kim, S.; Lim, D.Y. Continuum Dropout for Neural Differential Equations. arXiv 2025, arXiv:2511.10446. [Google Scholar] [CrossRef] [Scilit]
- Seow, R.Y.C. Transforming ESG analytics with machine learning: A systematic literature review using TCCM framework. Corp. Soc. Responsib. Environ. Manag. 2025, 32, 7358–7389. [Google Scholar] [CrossRef] [Scilit]
- Selmeya, M.G.; Bialy, B.A.E.; Hassanein, A.; Baker, A.A.; Ali, W.M.; Aboushadi, N.R.; Alhumud, A.A.; Mohamad, E.F.E. Antecedents and forecasting of carbon emissions using machine learning algorithms: Insights from the top ten carbon-emitting nations. Int. J. Energy Econ. Policy 2025, 15, 511–524. [Google Scholar] [CrossRef] [Scilit]
- Almeida, F.P.S.; Castelli, M.; Côrte-Real, N. Leveraging Feature Sets and Machine Learning for Enhanced Energy Load Prediction: A Comparative Analysis. Emerg. Sci. J. 2024, 8, 2120–2143. [Google Scholar] [CrossRef] [Scilit]
- Pence, I.; Kumas, K.; Siseci Cesmeli, M.; Akyüz, A. Detailed analysis of Türkiye’s agricultural biomass-based energy potential with machine learning algorithms based on environmental and climatic conditions. Clean Technol. Environ. Policy 2024, 26, 4177–4195. [Google Scholar] [CrossRef] [Scilit]
- Ekinci, G.; Ozturk, H.K. Forecasting Wind Farm Production in the Short, Medium, and Long Terms Using Various Machine Learning Algorithms. Energies 2025, 18, 1125. [Google Scholar] [CrossRef] [Scilit]
- Yasin, K.H.; Yasin, M.I.; Iguala, A.D.; Gelete, T.B.; Tulu, D.; Kebede, E. Predictive machine learning and geospatial modeling reveal PM10 hotspots and guide targeted air pollution interventions in Addis Ababa, Ethiopia. Discov. Appl. Sci. 2025, 7, 263. [Google Scholar] [CrossRef] [Scilit]
- Ferro, A.; Marazzina, D.; Stocco, D. Uncovering ESG Ratings: The (Im) Balance of Aspirational and Performance Features. Corp. Soc. Responsib. Environ. Manag. 2025, 32, 5895–5917. [Google Scholar] [CrossRef] [Scilit]
- Dey, A.; Yodo, N.; Yadav, O.P.; Shanmugam, R.; Ramoni, M. Addressing uncertainty in tool wear prediction with dropout-based neural network. Computers 2023, 12, 187. [Google Scholar] [CrossRef] [Scilit]
- Kotsompolis, G.; Cheilas, P.; Konstantakis, K.N.; Sfakianakis, E.; Goutte, S.; Michaelides, P.G. Smart Forecasting of Carbon Prices Using Machine Learning and Neural Networks: When ARIMA Meets XGBoost and LSTM. J. Forecasting 2025, 45, 47–60. [Google Scholar] [CrossRef] [Scilit]
- Raza, A.; Alharthi, M.; Shakeel, M.; Khan, M.I. Nexus Between CO2 Emissions, Economic Growth, and Energy Consumption with Special Reference to BRICS: A Panel Data Approach. Energy Nexus 2025, 20, 100556. [Google Scholar] [CrossRef] [Scilit]
- Bagadeem, S. Impact of macroeconomic and sustainability practices on carbon emissions performance. Discov. Sustain. 2025, 6, 992. [Google Scholar] [CrossRef] [Scilit]
- Zohra, K. Exploring the Relationship Between ICT and Carbon Dioxide Emissions in Middle East and North African (MENA) Countries: A Panel ARDL-PMG Analysis. Nat. Environ. Pollut. Technol. 2025, 24, D1764. [Google Scholar] [CrossRef] [Scilit]
- Lu, Y.; Ahmad, S.; Noureen, S.; Salman, M. Green growth and sustainable energy transitions: Evaluating the critical role of technology, resource efficiency, and innovation in Europe’s low-carbon future. Humanit. Soc. Sci. Commun. 2025, 12, 1527. [Google Scholar] [CrossRef] [Scilit]
- Bekele, M.; Sassi, M.; Jemal, K.; Ahmed, B. The dynamic linkage between renewable energy consumption and environmental sustainability in Sub-Saharan African countries: Heterogeneous macro-panel data analysis. Cogent Econ. Financ. 2024, 12, 2285188. [Google Scholar] [CrossRef] [Scilit]
- Mukhiyayeva, D.; Alibekova, A.; Sembiyeva, L.; Shmygol, N.; Zhumatayeva, B.; Khamitova, D. Economic Efficiency of Natural Resource Use in the Context of ESG Integration and the Circular Economy Transition. Resources 2025, 14, 186. [Google Scholar] [CrossRef] [Scilit]
- Dincă, G.; Netcu, I.C.; Ungureanu, C. Renewable Energy Transitions in the EU: A Comparative Panel Data Perspective. Energies 2025, 18, 4836. [Google Scholar] [CrossRef] [Scilit]
- Mokhtara, E.A.A.; Zainurib, N.A.; Jedic, M.A.M.; Ismailb, N.A. K-Nearest Neighbors for Predicting Ozone Concentrations: A Machine Learning Approach for Air Quality Assessment. J. Kejuruter. 2025, 37, 2851–2859. [Google Scholar] [CrossRef] [Scilit]
- Nie, X.; Su, C.; Wei, X.H.; Wang, A.L.; Xu, F.; Fan, J.R.; Ma, D.; Zeng, J.; Huang, C.; Liu, W.; et al. Predicting wheat powdery mildew epidemics in China using meteorological data and machine learning approaches. Pest Manag. Sci. 2025. [Google Scholar] [CrossRef] [Scilit] [PubMed]
- Jílková, P.; Kotěšovcová, J. ESG performance and disclosure: National composite indicators for monitoring sustainable growth conditions in the EU-27. TEM J. 2023, 12, 1845. [Google Scholar] [CrossRef] [Scilit]
- Jiang, P.C.; Feng, G.F.; Wang, H.J.; Chang, C.P. CSR from different perspectives: The global ESG indexes updated. Corp. Soc. Responsib. Environ. Manag. 2024, 31, 4694–4714. [Google Scholar] [CrossRef] [Scilit]
- Kharlamova, G.; Shchur, D.; Humenna, O. S + ESG as a New Dimension of Resilience: Security at the Core of Sustainable Business Development. Sustainability 2025, 17, 8425. [Google Scholar] [CrossRef] [Scilit]
- Jeon, G. Leveraging AI for ESG Performance: A Global Analysis of National AI Capabilities and Sustainability in International Business. Bus. Strategy Dev. 2025, 8, e70162. [Google Scholar] [CrossRef] [Scilit]
- Affonso, T. The ESG Agenda in the Oil and Gas Industry. J. Sustain. Dev. Law Policy 2025, 16, 96–112. [Google Scholar] [CrossRef] [Scilit]
- Costantiello, A.; Laureti, L.; Quarto, A.; Leogrande, A. Methane Emissions in the ESG Framework at the World Level. Methane 2025, 4, 3. [Google Scholar] [CrossRef] [Scilit]
- Hubbard, S. Environmental Social Governance (ESG) Reporting for Large US Airports. Sustainability 2025, 17, 4832. [Google Scholar] [CrossRef] [Scilit]
- Pacheco-Jaramillo, W.A.; Malliaros, P. Income Inequality, Governance Quality, and Political Engagement: A Cross-country Analysis of Disparities and Democratic Participation. F1000Research 2025, 14, 561. [Google Scholar] [CrossRef] [Scilit]
- Enriquez, R.S.; Hillbom, E.; Palacio, A. Can Sovereign ESG Help Guide Nation-States’ Transformative Change? J. Sustain. Dev. 2025, 18, 56–76. [Google Scholar] [CrossRef] [Scilit]
- Ishizaka, A.; Lokman, B.; Tasiou, M. A stochastic multi-criteria divisive hierarchical clustering algorithm. Omega 2021, 103, 102370. [Google Scholar] [CrossRef] [Scilit]
- Sevgi, E.; Figen, A.Z. Determination of Renewable Energy Growth Using Cluster Analysis and Multi-Criteria Decision-Making Methods. Appl. Sci. 2025, 15, 1575. [Google Scholar] [CrossRef] [Scilit]
- Rusu, Ș.; Boloș, M.I.; Leordeanu, M. K-means and agglomerative hierarchical clustering analysis of esg scores, yearly variations, and stock returns: Insights from the energy sector in Europe and the United States. J. Financ. Stud. 2023, 8, 166–180. [Google Scholar] [CrossRef] [Scilit]
- Sultana, N.; Zeya, F. Advancing Firm-Specific ESG Sentiment Analysis: A Machine Learning Approach to Clustering, Prediction, and Financial Performance Implications. Bus. Strategy Dev. 2025, 8, e70150. [Google Scholar] [CrossRef] [Scilit]
- Jauhari, A.; Suzanti, I.O.; Anamisa, D.R.; Tangguh, F. PCA-counseled k-means and k-medoids with dimension reduction for improved in determining optimal aid clustering. J. Ilm. KURSOR 2025, 13, 46–55. [Google Scholar] [CrossRef] [Scilit]
- Sinaga, K.P.; Yang, M.S. A Globally Collaborative Multi-View k-Means Clustering. Electronics 2025, 14, 2129. [Google Scholar] [CrossRef] [Scilit]
- Filì, T.; De Anna, M. Long-term trends in sustainable development across the G7: A multidimensional perspective. Qual. Quant. 2025, 1–15. [Google Scholar] [CrossRef] [Scilit]
- Simionescu, M.; Oancea, B. Does Income Inequality Influence Energy Consumption in the European Union? Energies 2025, 18, 787. [Google Scholar] [CrossRef] [Scilit]
- Huang, L.; Raimi, L.; Al-Faryan, M.A.S. Africa’s Quest for Sustainable Development: Do Financial Development, Energy Transition, and Digitalization Reinforce Multidimensional Gains? Sustain. Dev. 2025, 33, 9444–9465. [Google Scholar] [CrossRef] [Scilit]
- Zhang, Y.; Liu, D. Assessment of socio-economic adaptability to ageing in resource-based cities and its obstacle factor. Sustainability 2023, 15, 12981. [Google Scholar] [CrossRef] [Scilit]
- de Dieu Hagenimana, J.; Sumbiri, D. Benchmarking Machine Learning Models for Landslide Susceptibility: A Study in the Ngororero Sector. J. Inf. Technol. 2025, 5, 16–24. [Google Scholar] [CrossRef] [Scilit]
- Sibai, F.; El-Moursy, A.; Sibai, A. Forecasting the consumer price index: A comparative study of machine learning methods. Int. J. Comput. Digit. Syst. 2024, 15, 487–497. [Google Scholar] [CrossRef] [Scilit]
- Ling, J.Y.X.; Chan, Y.J.; Chen, J.W.; Chong, D.J.S.; Tan, A.L.L.; Arumugasamy, S.K.; Lau, P.L. Machine learning methods for the modelling and optimisation of biogas production from anaerobic digestion: A review. Environ. Sci. Pollut. Res. 2024, 31, 19085–19104. [Google Scholar] [CrossRef] [Scilit]
- Avinash, G.; Pachori, H.; Sharma, A.; Mishra, S. Time series forecasting of bed occupancy in mental health facilities in India using machine learning. Sci. Rep. 2025, 15, 2686. [Google Scholar] [CrossRef] [Scilit]
- Troncoso, J.A.; Quijije, Á.T.; Oviedo, B.; Zambrano-Vega, C. Solar Radiation Prediction in the UTEQ based on Machine Learning Models. arXiv 2023, arXiv:2312.17659. [Google Scholar] [CrossRef] [Scilit]
- Husnain, M.; Mukhtar, M.; Tayyab, M.; Ijaz, S. Unravelling structural underdevelopment: Is governance quality the key? J. Policy Res. 2023, 10, 87–99. [Google Scholar] [CrossRef] [Scilit]
- Waseem, M.; Khurshid, N.; Egbe, C.E.; Rashid, M. Energy Transition and Institutional Quality in E-7 Economies: Unveiling Paths to Sustainable Development with CS-ARDL Analysis. Sustainability 2025, 17, 4321. [Google Scholar] [CrossRef] [Scilit]
- Török, L. Economic Drivers of Renewable Energy Growth in the European Union: Evidence from a Panel Data Analysis (2015–2023). Energies 2025, 18, 3363. [Google Scholar] [CrossRef] [Scilit]
- Bhattacharya, M.; Yan, E. Press freedom and stringency measures: The role of energy consumption during COVID-19 lockdowns. Empir. Econ. 2025, 68, 2515–2547. [Google Scholar] [CrossRef] [Scilit]
- Canh, L.Q.; Anh, D.T.H. Renewable energy policy, renewable energy consumption and economic growth: The moderating role of governance quality. Asian Econ. Financ. Rev. 2025, 15, 1276–1289. [Google Scholar] [CrossRef] [Scilit]
- Ren, B.; Wang, Q.; Ge, H.; Xu, J.; Hao, X.; Wang, H. Sustainability evaluation of the steel industry in belt and road countries using an ESG-MI and obstacle analysis framework. Sci. Rep. 2025, 15, 36615. [Google Scholar] [CrossRef] [Scilit]
- Sica, F.; Tajani, F.; Sáez-Pérez, M.P.; Marín-Nicolás, J. Taxonomy and indicators for ESG investments. Sustainability 2023, 15, 15979. [Google Scholar] [CrossRef] [Scilit]
- You, Z.; Chen, D.; Fang, C.; Gao, M.; Cheng, J. How green governance empowers high-quality development: An EKC framework-based analysis of ESG and green total factor productivity. Sci. Prog. 2024, 107, 368504241288782. [Google Scholar] [CrossRef] [Scilit]
- Zhang, R.; Jing, L.; Li, Y.; Guo, X. The role of technological innovation and institutional quality in environmental and economic growth sustainability in emerging Asian countries. Front. Environ. Sci. 2025, 12, 1510120. [Google Scholar] [CrossRef] [Scilit]
- Zhao, D.; Ngan, S.L.; Jamil, A.H.; Salleh, M.F.M.; Yusoff, W.S. Peer Effects on ESG Disclosure: Drivers and Implications for Sustainable Corporate Governance. Sustainability 2025, 17, 4392. [Google Scholar] [CrossRef] [Scilit]
- Saraswati, E.; Ghofar, A.; Atmini, S.; Dewi, A.A. Clustering of companies based on sustainability performance using ESG materiality approach: Evidence from Indonesia. Int. J. Energy Econ. Policy 2024, 14, 112–125. [Google Scholar] [CrossRef] [Scilit]
- Dipierro, A.R.; Barrionuevo, F.J.; Toma, P. Predicting ESG Controversies in Banks Using Machine Learning Techniques. Corp. Soc. Responsib. Environ. Manag. 2025, 32, 3525–3544. [Google Scholar] [CrossRef] [Scilit]
- Thongsanitkarn, T.; Sugunnasil, P. Prediction of Electricity Consumption Using Interpretable Machine Learning Approach: ข้อมูล จาก ประเทศไทย ใน ช่วง ปี 1973 จนถึง 2021. ASEAN J. Sci. Technol. Rep. 2025, 28, e257539. [Google Scholar] [CrossRef] [Scilit]
- Fabijańska, A.; Wołczek, P.; Sikacz, H. Can machine learning bring ESG ratings closer to small and medium-sized enterprises? Oeconomia Copernic. 2025, 16, 1615–1663. [Google Scholar] [CrossRef] [Scilit]
- Kim, H.; Lee, M. Unraveling the Drivers of ESG Performance in Chinese Firms: An Explainable Machine-Learning Approach. Systems 2025, 13, 578. [Google Scholar] [CrossRef] [Scilit]
- Mahmood, H.; Tanveer, M.; Furqan, M. Rule of law, corruption control, governance, and economic growth in managing renewable and nonrenewable energy consumption in South Asia. Int. J. Environ. Res. Public Health 2021, 18, 10637. [Google Scholar] [CrossRef] [Scilit] [PubMed]
- Gattone, T.; Costantiello, A.; Leogrande, A.; Quarto, A. Modelling CO2 emissions through econometric and machine learning approaches: The role of renewable energy and resource use in climate action. Geol. J. 2025, 60, 2867–2889. [Google Scholar] [CrossRef] [Scilit]
- Abdelkawy, N.A.; Al Shammre, A.S. A Tailored ESG Framework for Economic Growth in Saudi Arabia: ARDL Evidence from 1990 to 2022. Sustainability 2025, 17, 5273. [Google Scholar] [CrossRef] [Scilit]
- Thapa, B.S.; Adhikari, B.; Pathak, D.D. Does ESG Performance Drive Long-Term Sustainable Economic Growth in Asia? Insights from a Novel ESG Index and Panel Cointegration Analysis. Nepal J. Multidiscip. Res. 2025, 8, 1–17. [Google Scholar] [CrossRef] [Scilit]
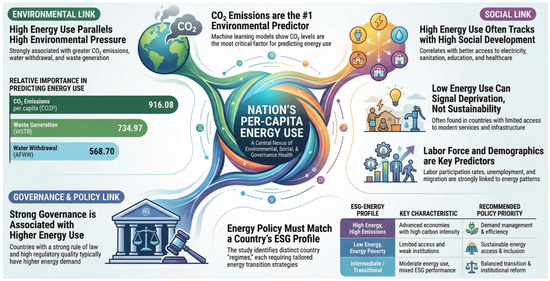
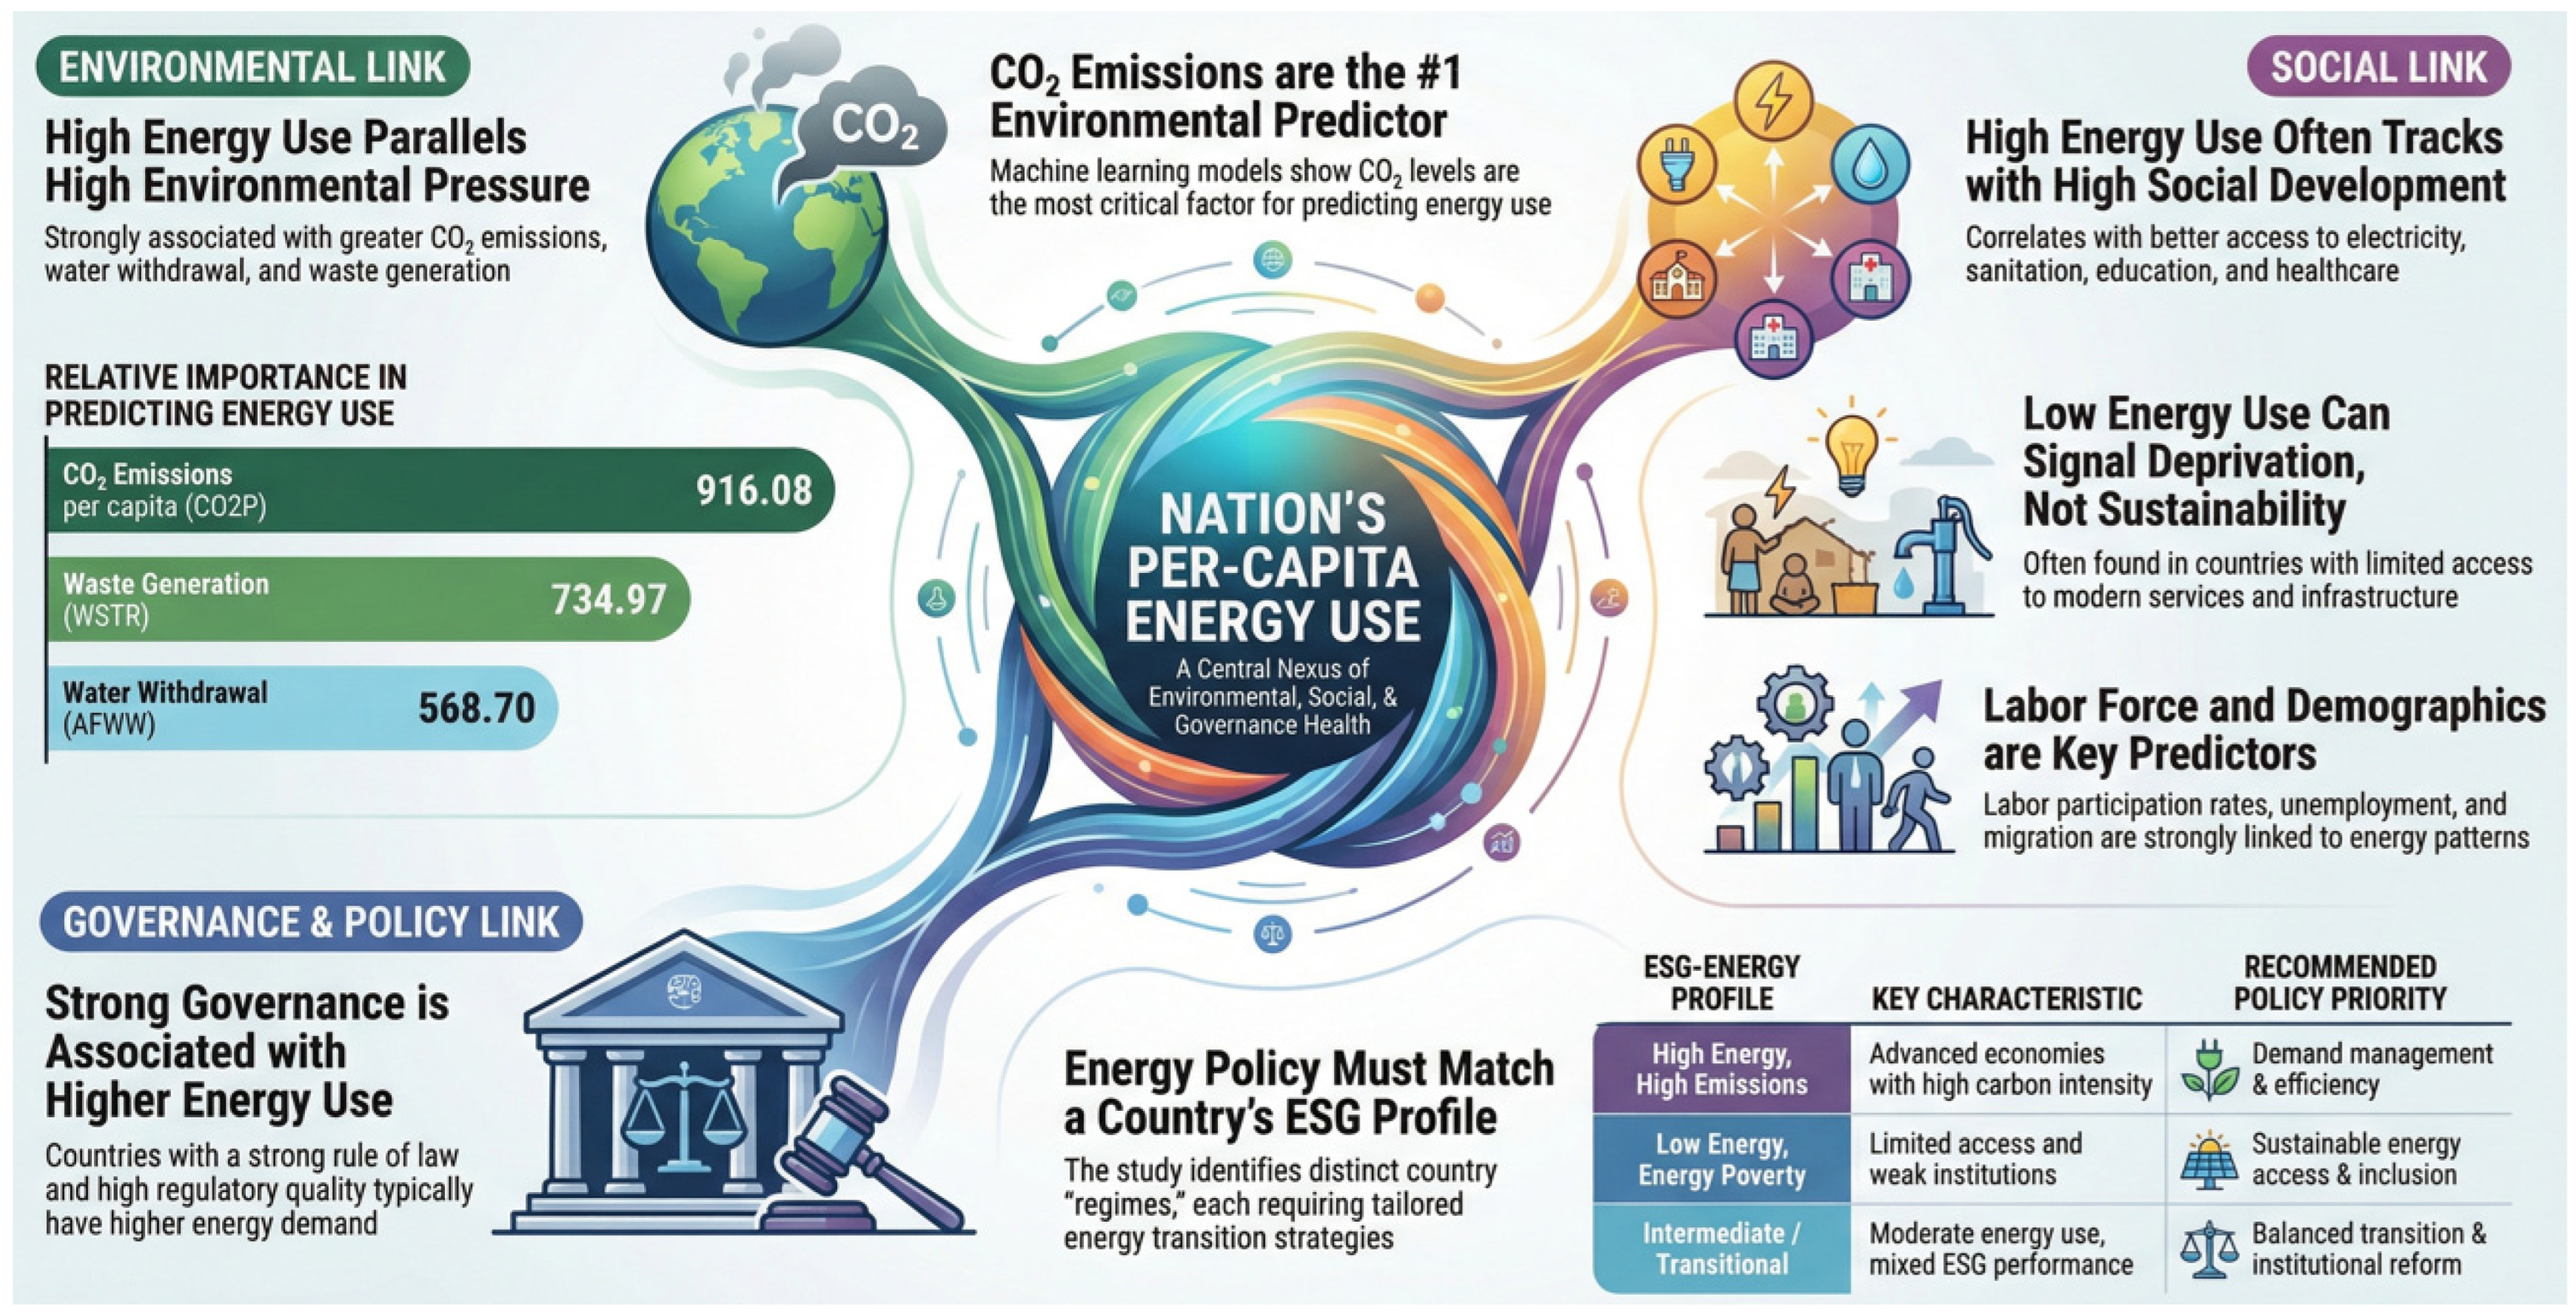
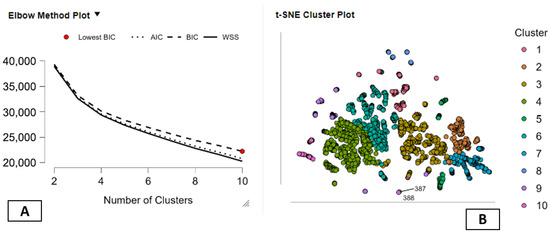
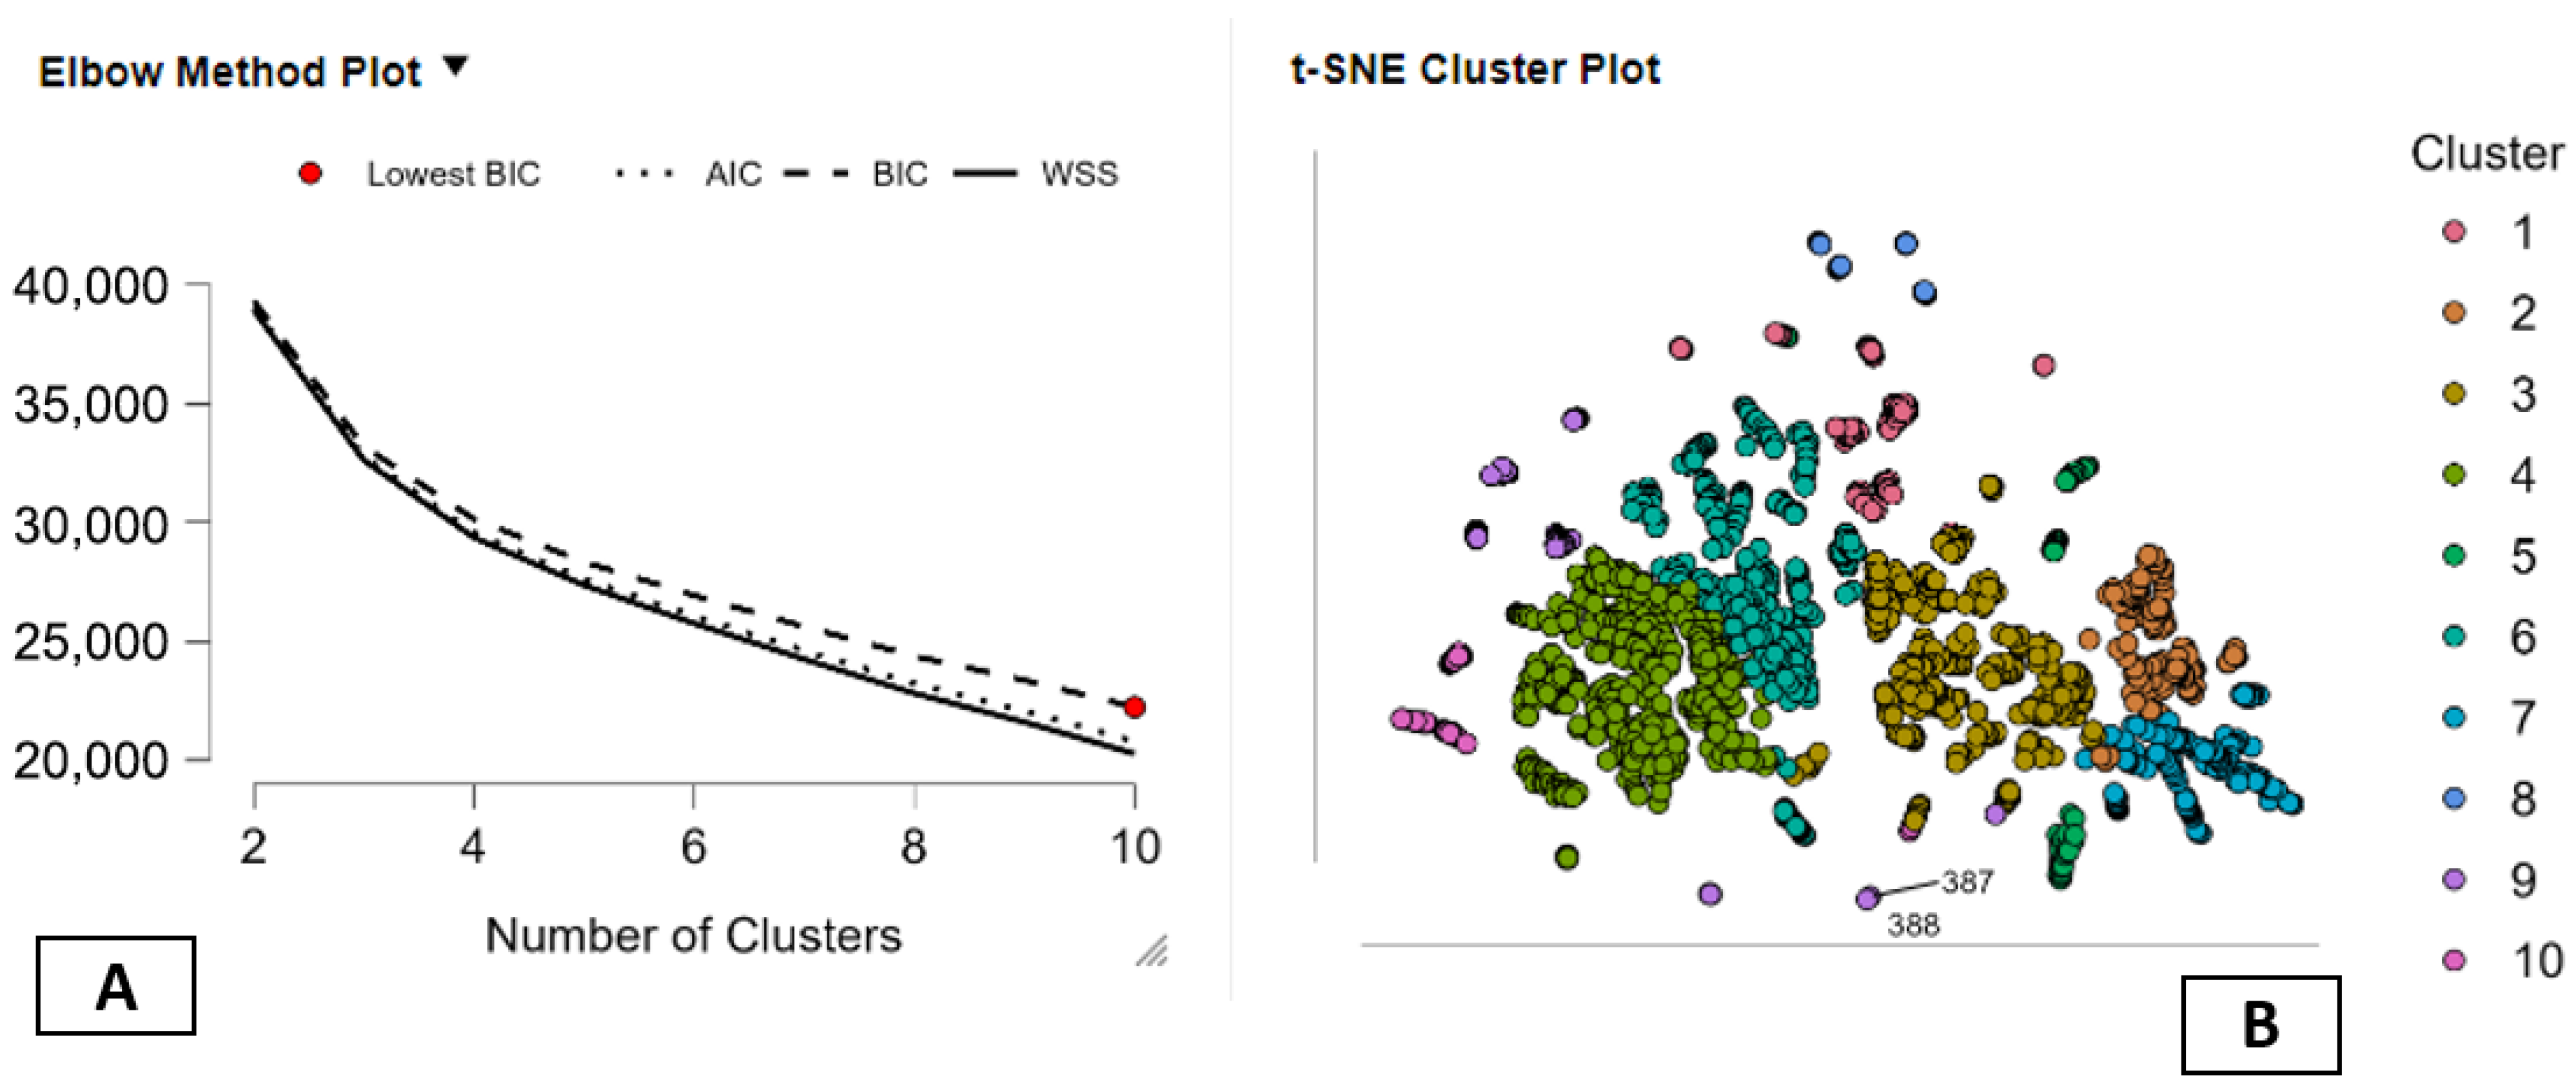
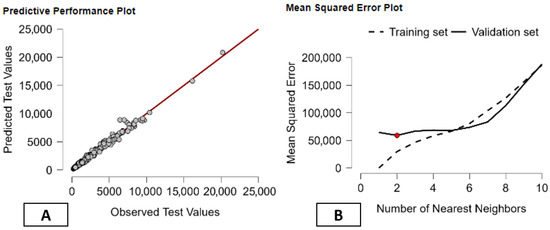
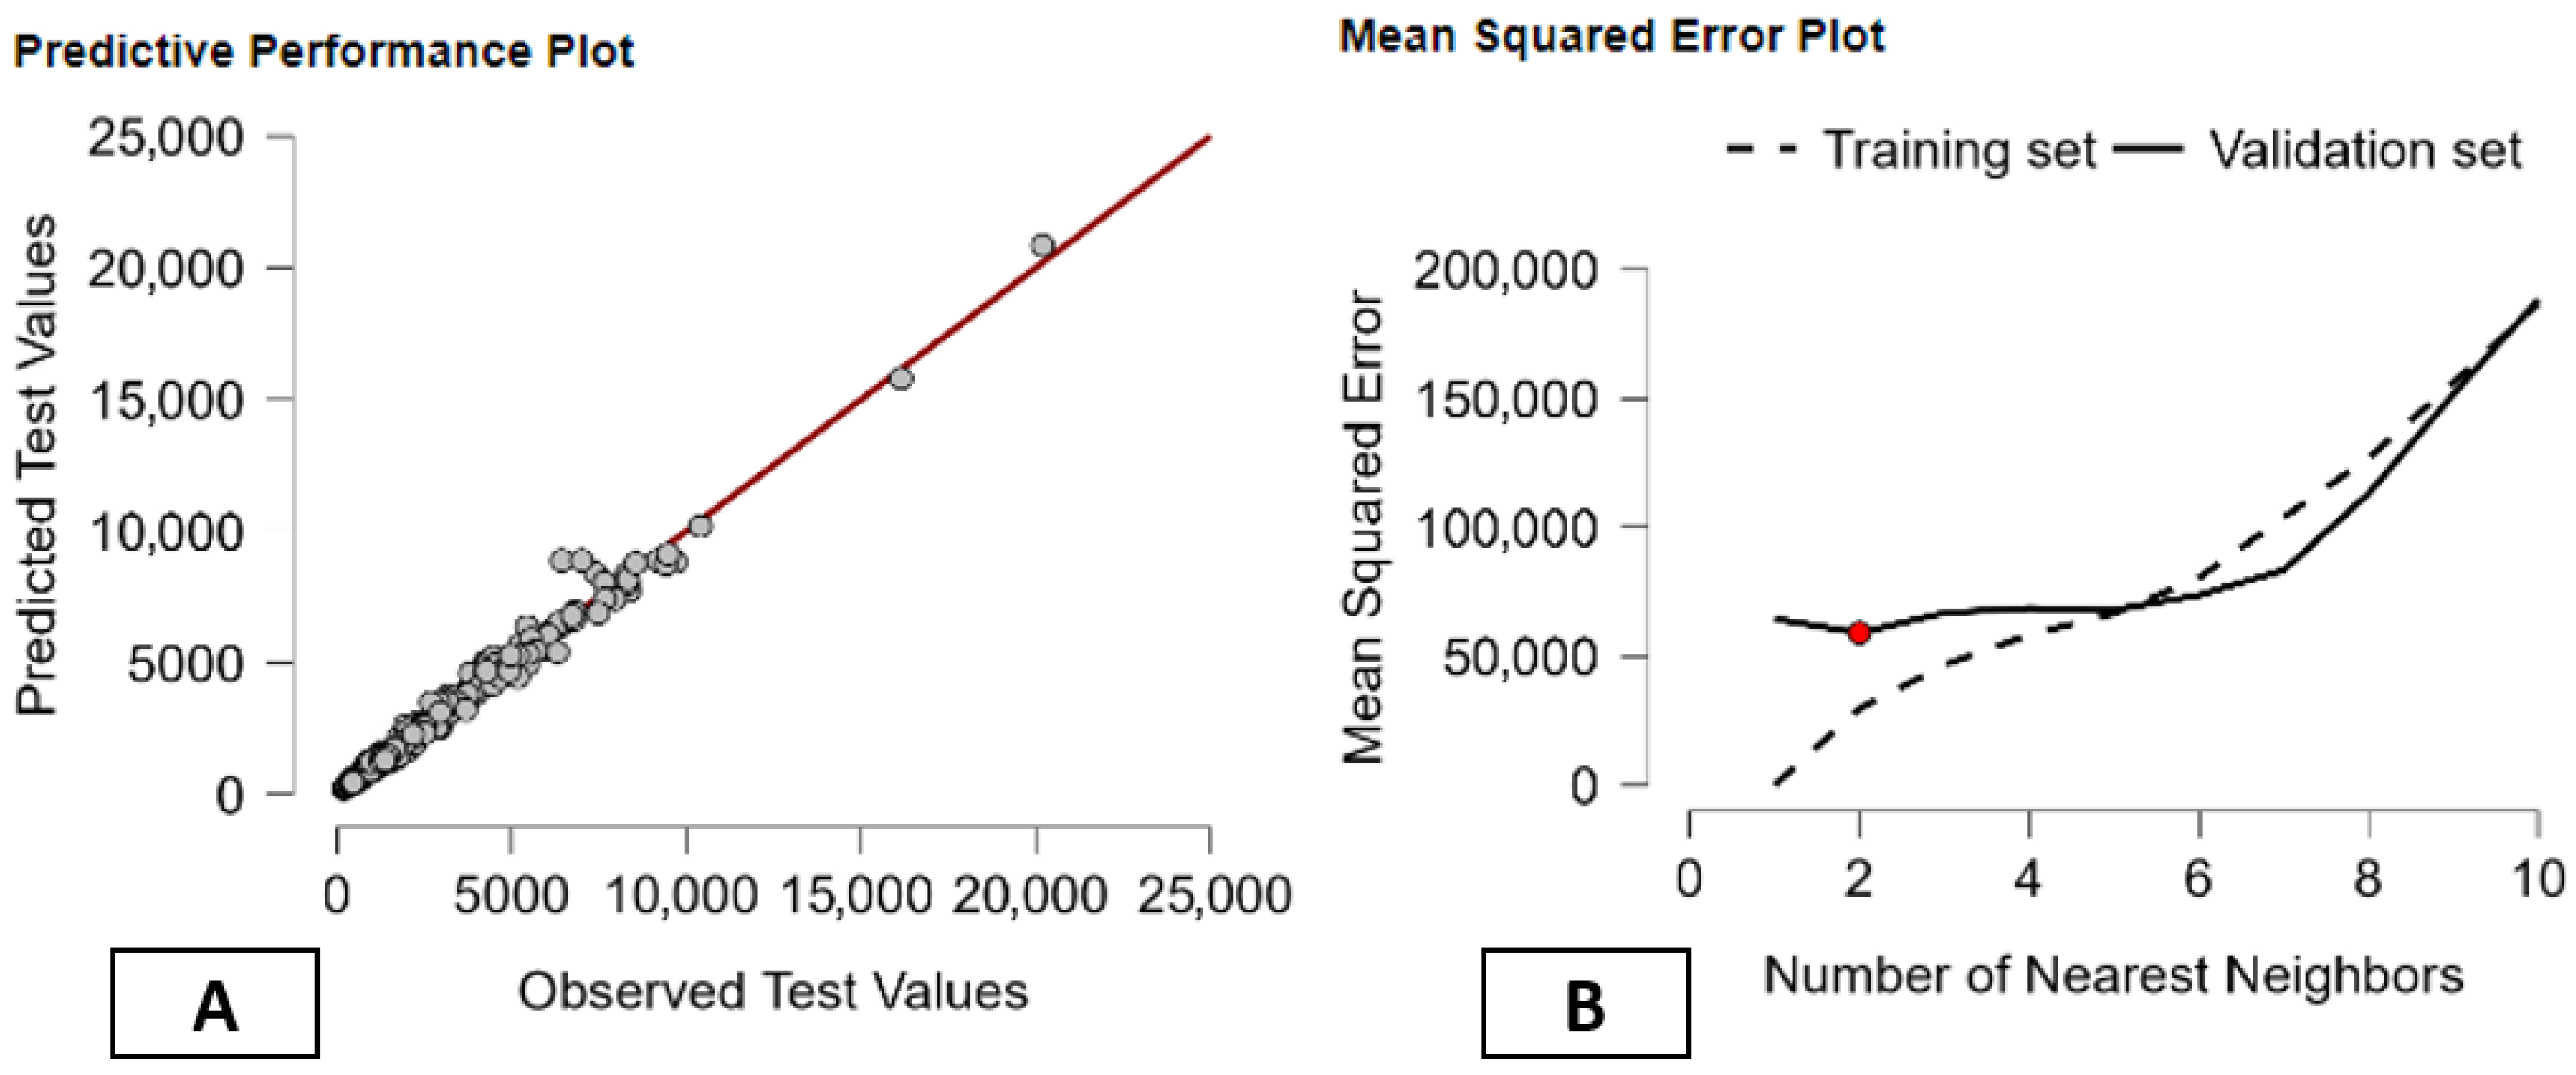
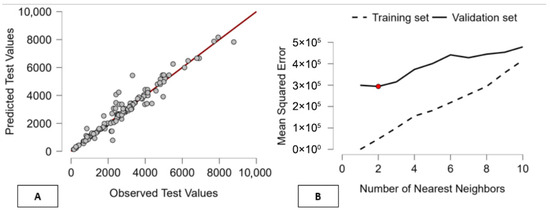
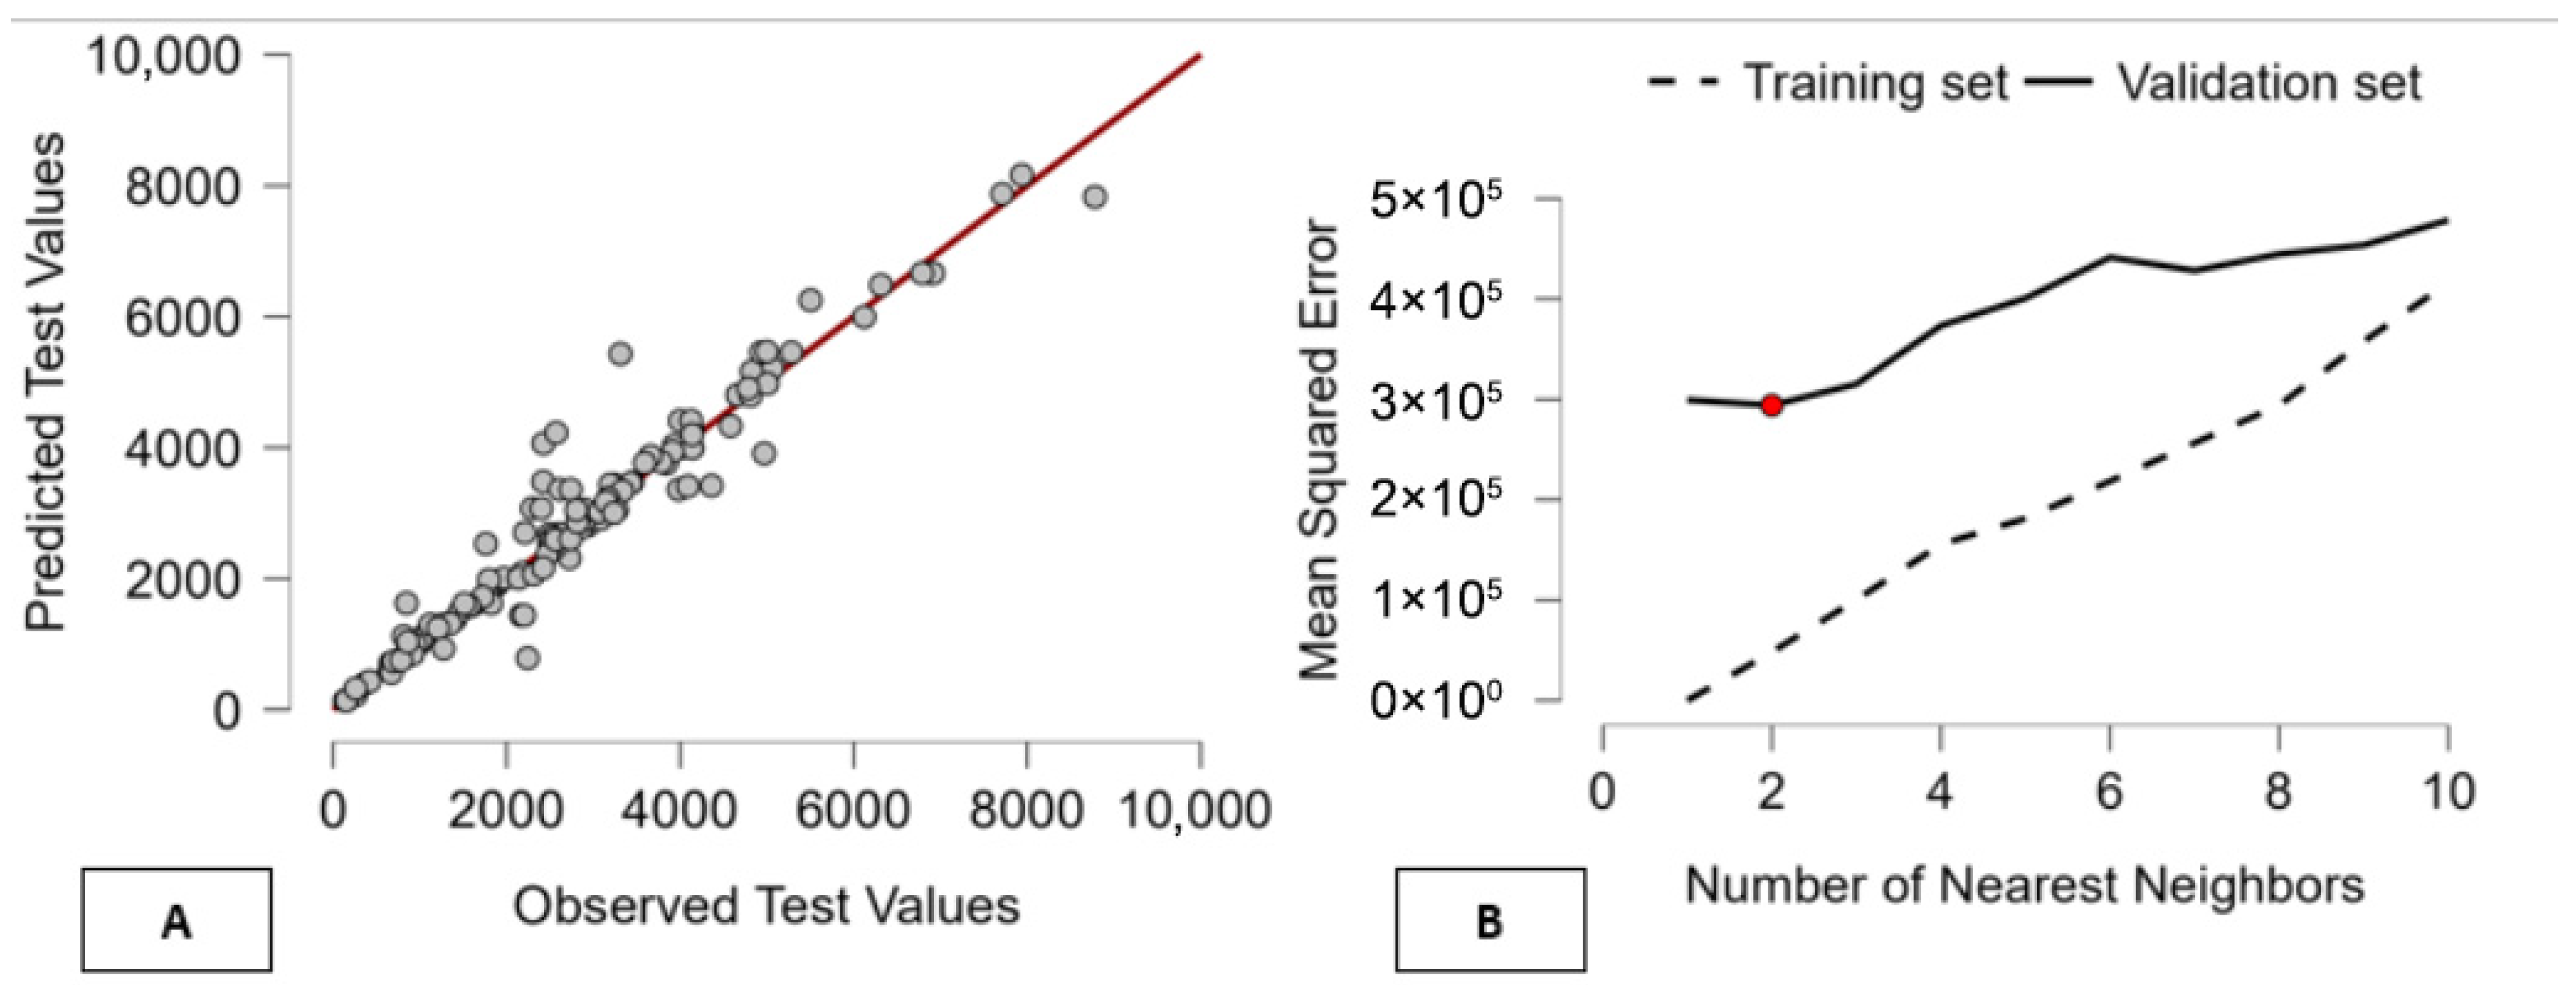
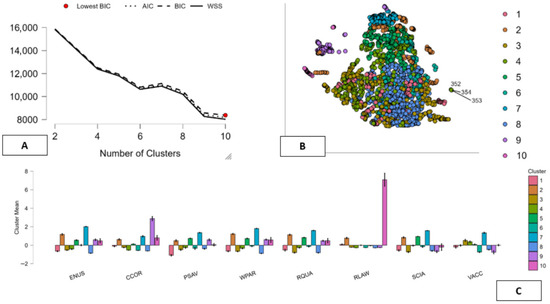
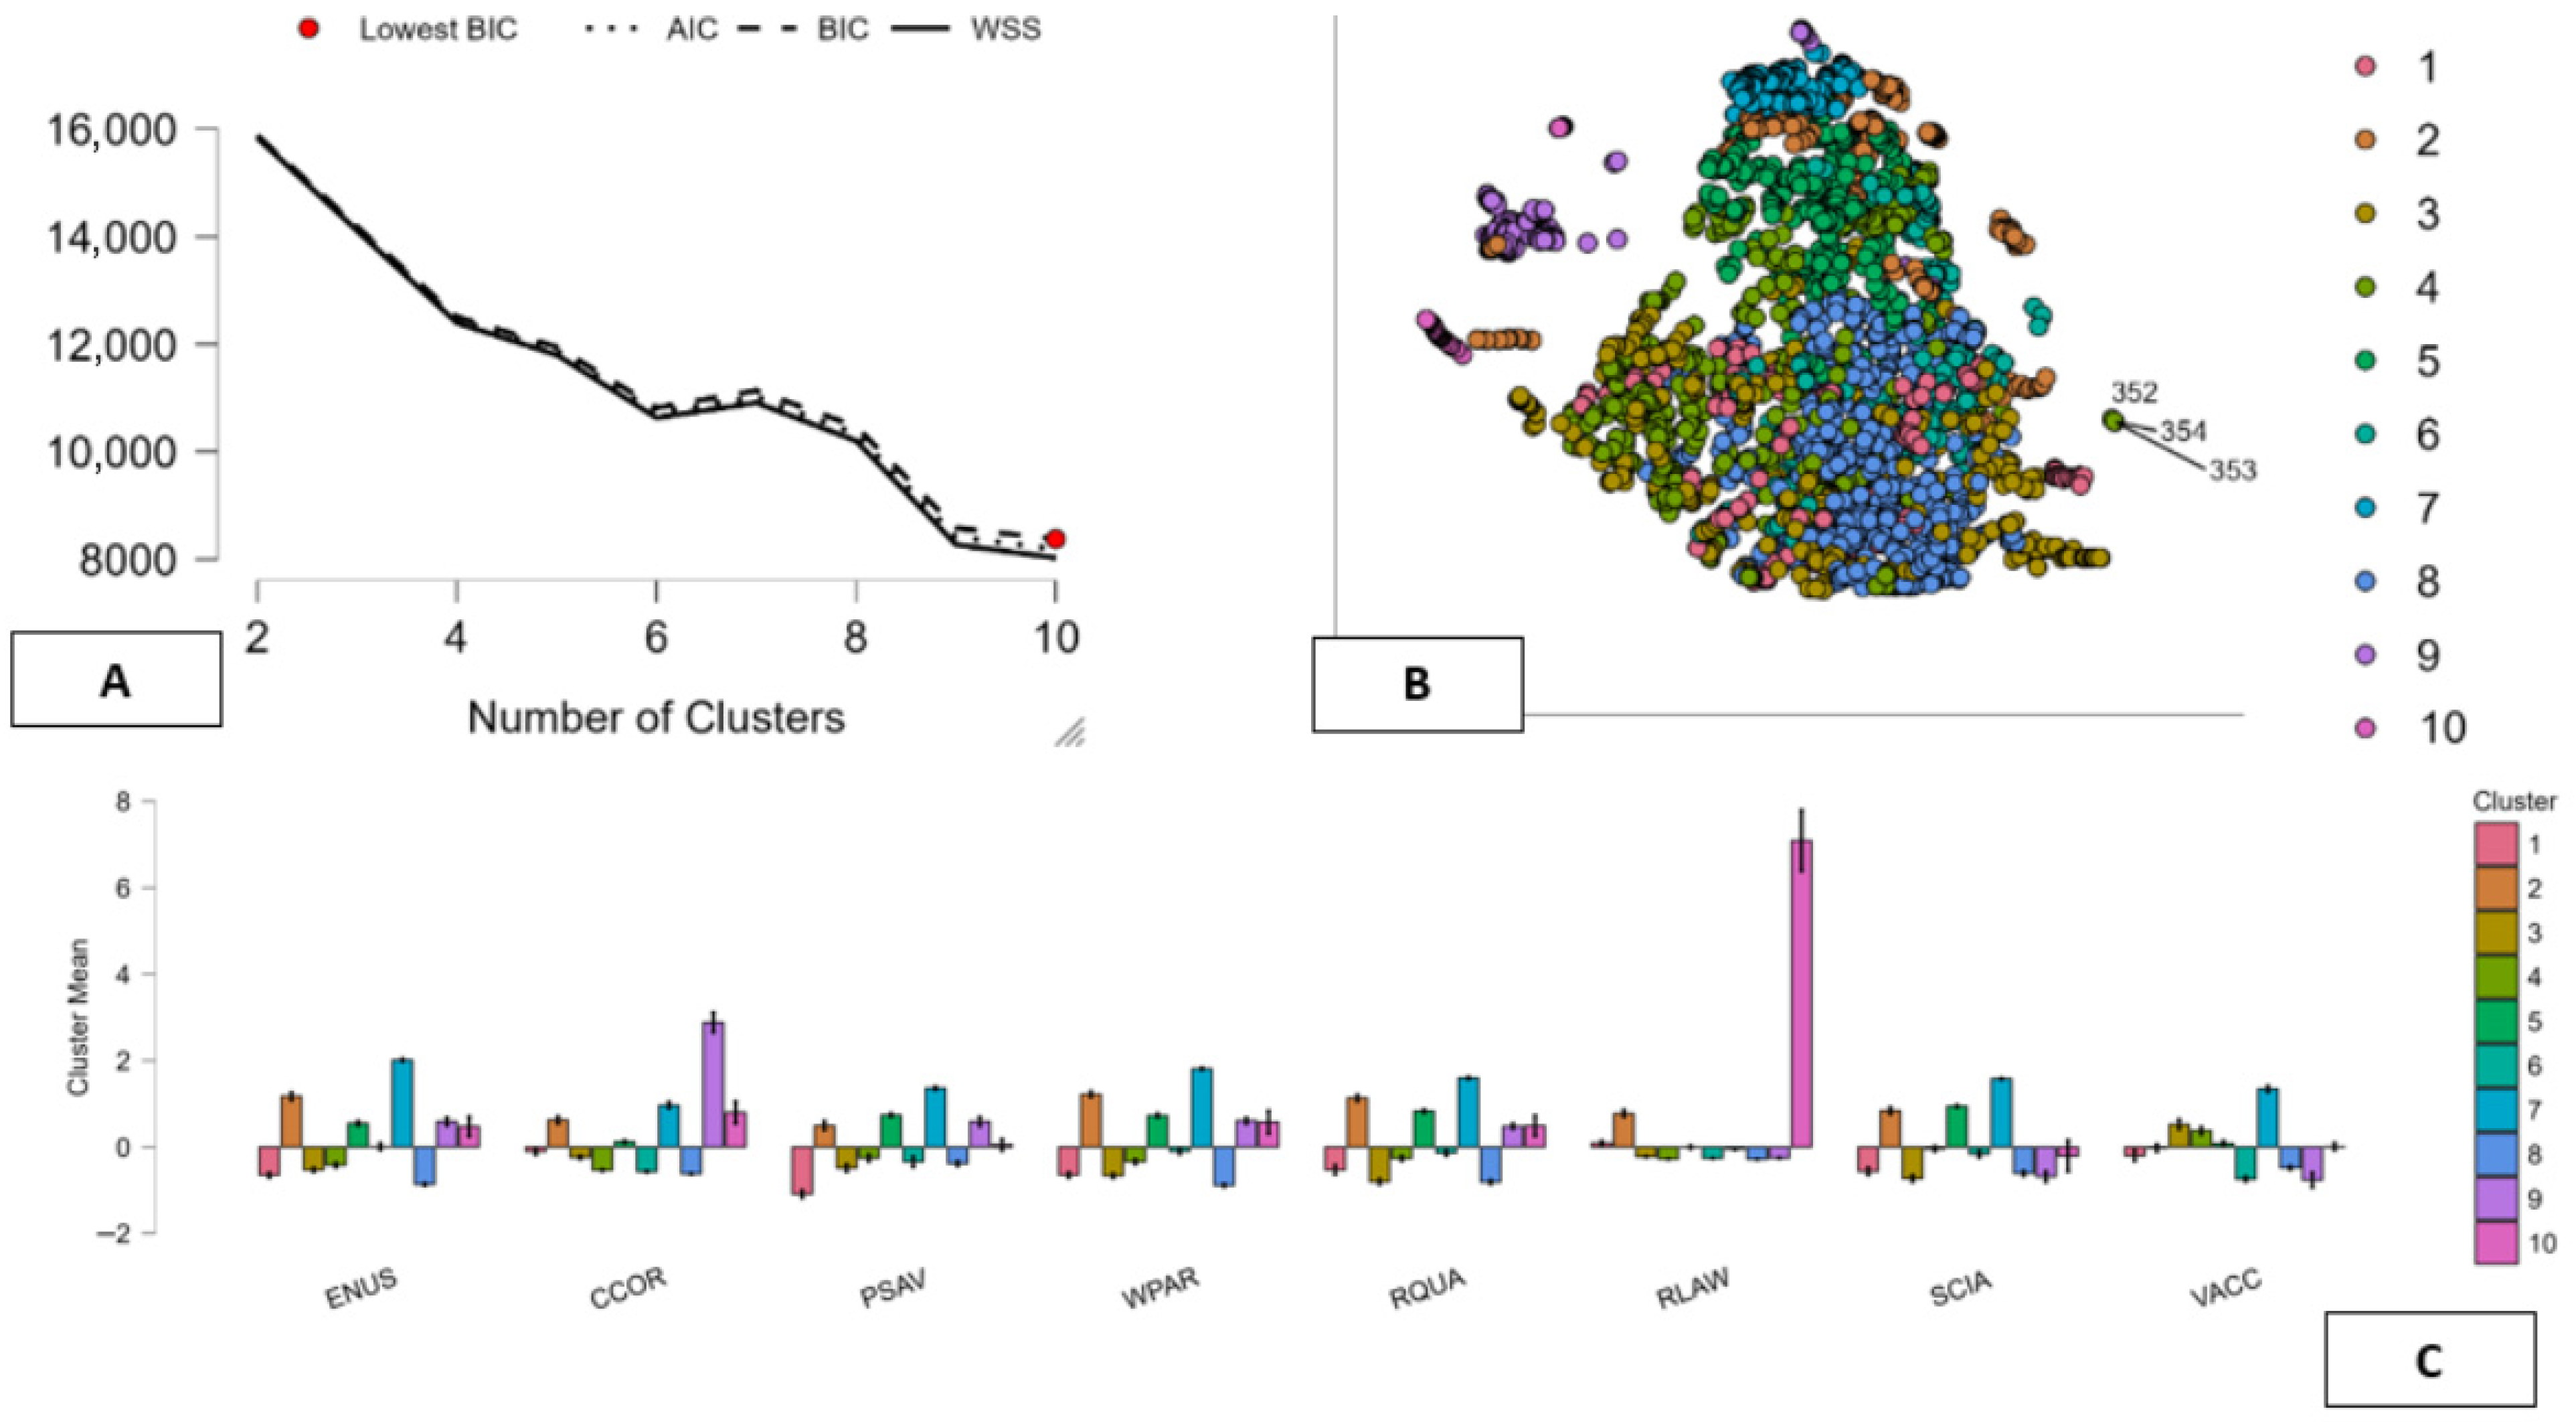
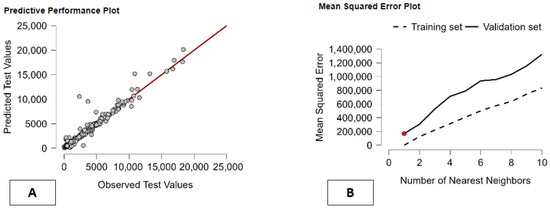
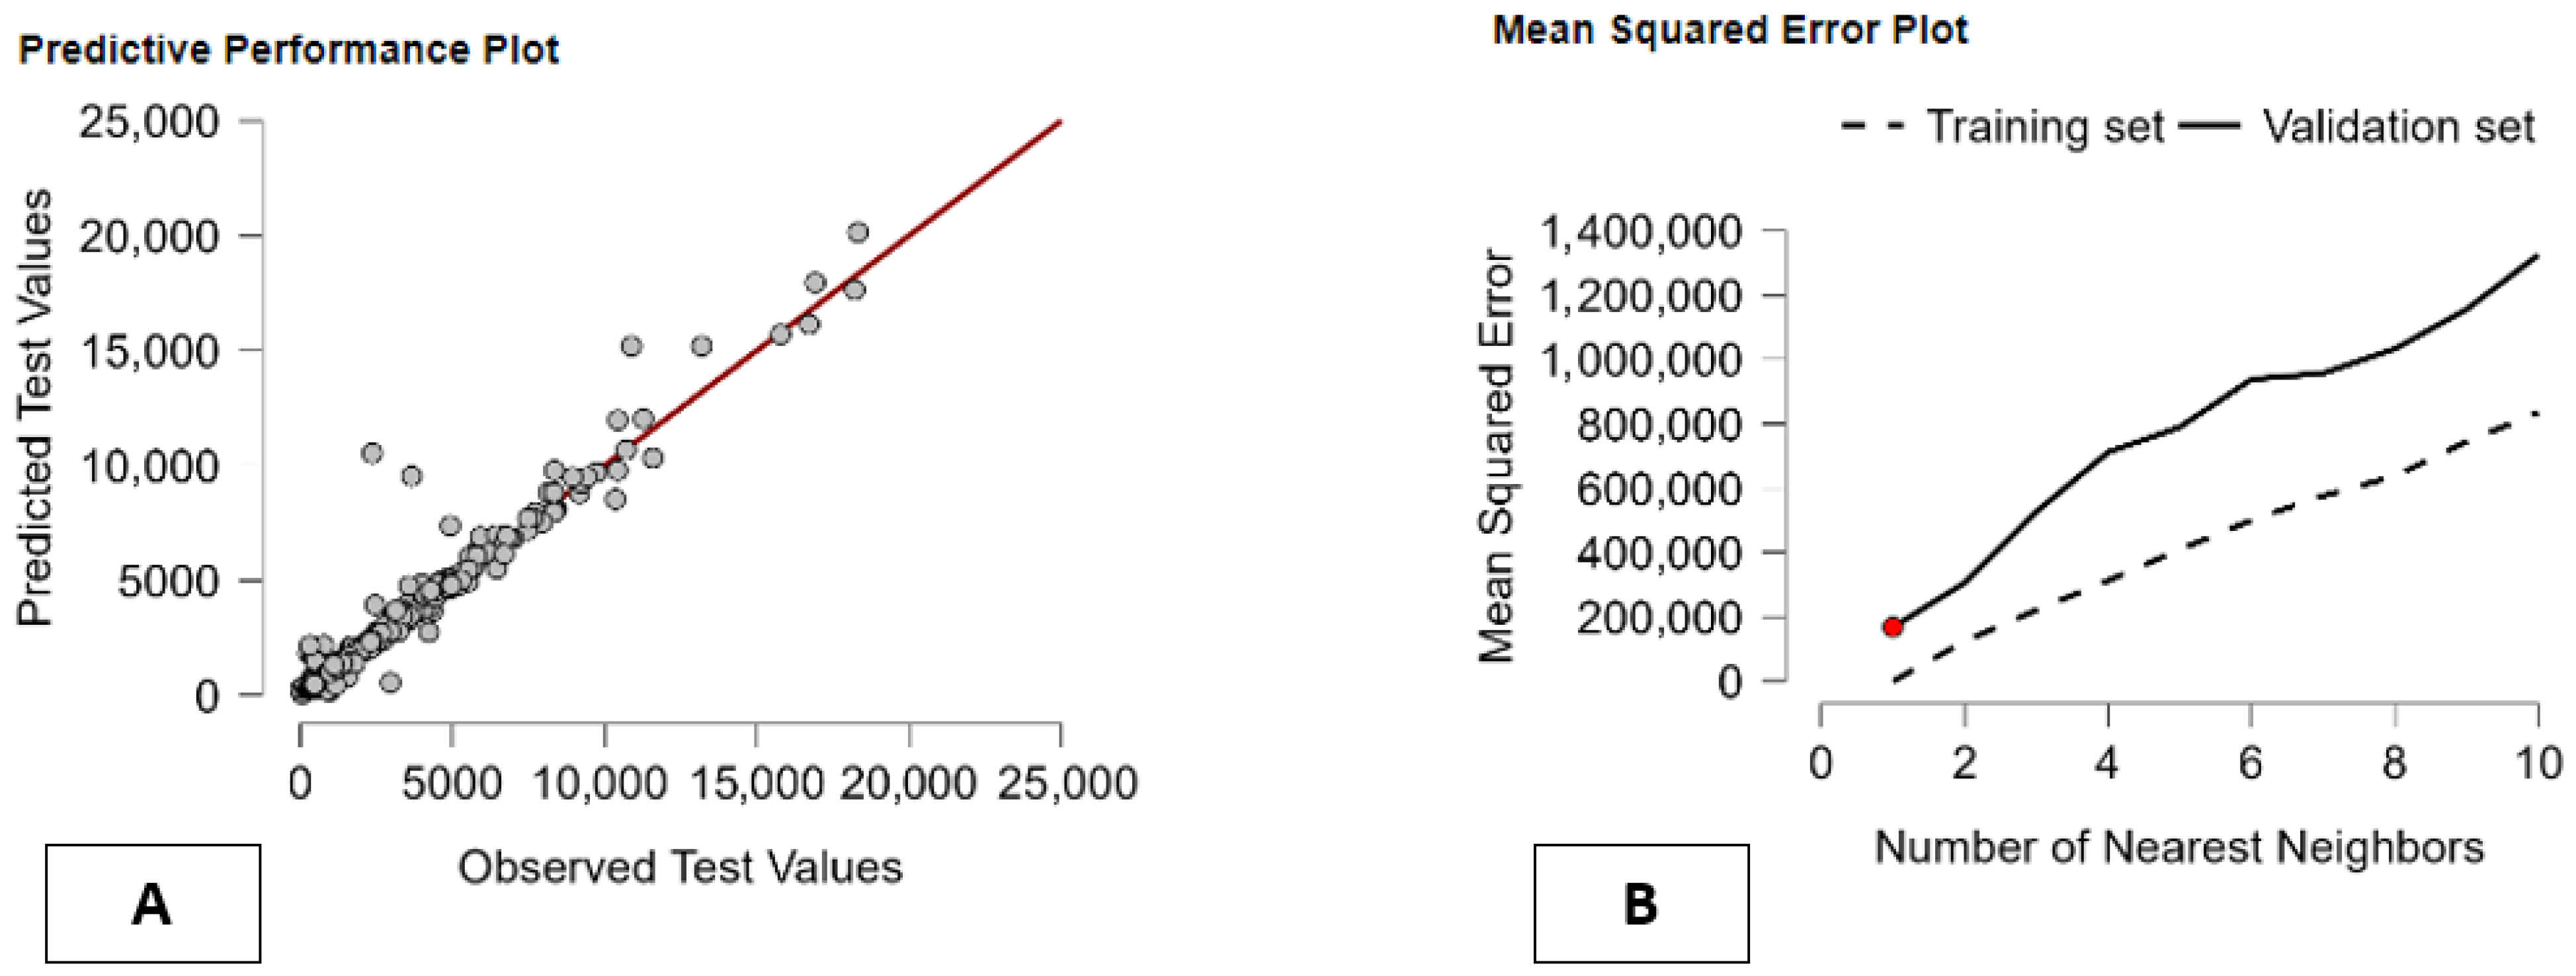

Disclaimer/Publisher’s Note: The statements, opinions and data contained in all publications are solely those of the individual author(s) and contributor(s) and not of MDPI and/or the editor(s). MDPI and/or the editor(s) disclaim responsibility for any injury to people or property resulting from any ideas, methods, instructions or products referred to in the content. |
© 2026 by the authors. Licensee MDPI, Basel, Switzerland. This article is an open access article distributed under the terms and conditions of the Creative Commons Attribution (CC BY) license.