Article

The Evolution of Windmill Design: From Lasithi Plateau Pumping Windmills to Electricity Production


by
Constantinos Condaxakis
1,
Ioannis Ntintakis
1,
Georgios V. Kozyrakis
1,2,
Christos Chrysoulakis
1,
Georgios Chatzakis
1,
Eirini Dakanali
1,
Nikolaos Papadakis
1 and
Dimitris Katsaprakakis
1,*
1
Energy Systems Synthesis Lab, Mechanical Engineering Department, School of Engineering, Hellenic Mediterranean University, Estavromenos, 731 33 Heraklion, Crete, Greece
2
Coastal & Marine Research Laboratory (CMRL), Institute of Applied and Computational Mathematics (IACM), Foundation for Research and Technology–Hellas (FORTH), 700 13 Heraklion, Crete, Greece
*
Author to whom correspondence should be addressed.
Energies 2026, 19(3), 829; https://doi.org/10.3390/en19030829
Submission received: 26 December 2025 / Revised: 29 January 2026 / Accepted: 2 February 2026 / Published: 4 February 2026

Abstract

This study investigates the aerodynamic and structural behavior of a traditional horizontal-axis windmill equipped with a passively controlled fabric-sail rotor system, representative of the historic Lasithi Plateau windmills of Crete. The traditional windmill of the Lasithi Plateau, historically employed for water pumping to support irrigation and domestic water supply, constituted the conceptual basis for its further development into a wind energy system capable of electrical power generation. To this end, the structural and constructional characteristics of the traditional windmill are thoroughly investigated, with the objective of defining the technical specifications required for the design of a new product, namely a small-scale wind turbine incorporating a sail-based rotor configuration. First, the local meteorological conditions in the area are assessed using a long-term mesoscale to microclimatic approach. These parameters determine the operational and extreme working conditions of the windmill. Then emphasis is placed on understanding how important design features—such as the sail geometry, the supporting framework, and the passive aeroelastic deformation mechanism—govern the rotor’s performance and operational robustness. The sail’s ability to deform substantially plays a central role in regulating aerodynamic loading, serving as an inherent load-shedding mechanism that enhances survivability during high-wind events up to 40 m/s. The observed nonlinear trends in torque and thrust with increasing wind speed highlight the importance of aeroelastic effects in the functional design of fabric-sail rotors. Particular attention is given to the behavior of the woven polyester sail material, which enables large reversible deformations without mechanical failure, thereby preserving structural integrity and operational continuity. Overall, this study provides insight into the design principles and operational characteristics of flexible-sail windmills, illustrating how traditional configurations can inform the development of resilient, low-cost wind-driven systems.

1. Introduction

Windmills represent one of humanity’s most significant technological achievements, marking the transition from purely human and animal-based labor to harnessing natural resources. Windmills represent the earliest engines not powered by human labor and serve as the direct predecessors of contemporary wind turbines [1]. The development of windmill technology spans millennia, from ancient Mesopotamia through the Renaissance and into the modern era, demonstrating a remarkable progression in engineering sophistication and practical application. The chronological origins of windmills remain subject to scholarly debate, yet archaeological and historical evidence points to ancient Mesopotamia as the birthplace of wind-powered technology. Humanity’s critical need for food and increased agricultural output led to the creation of windmills around 1700 BCE, which were used to pump water for irrigation [2]. While some sources suggest that windmill invention occurred in the twelfth century CE in Europe, particularly in the Dutch region, the actual historical record reveals much earlier origins in the Middle East. The first Persian windmills, often referred to as “panemones” or vertical-axis windmills, generated thrust mainly through drag forces instead of lift [3]. These primitive vertical-axis machines were developed specifically for grinding grain and represented a pragmatic solution to the challenge of harnessing wind energy in regions where consistent, directional wind patterns were available. Their geographic expansion demonstrates the effectiveness and adaptability of the design, as well as the value placed on wind-powered technology across diverse cultures and climates.
The horizontal-axis windmill became widespread in Europe due to environmental and climatic factors. In Europe, and particularly within the Mediterranean area, wind patterns are characterized by their variability; consequently, it is essential to adjust the rotor’s alignment to ensure it is positioned optimally relative to the incoming wind. This requirement drove the development of mechanisms to keep mills aligned with prevailing winds, representing a significant engineering challenge that would occupy designers for centuries. The Cretan windmill represents perhaps the most thoroughly studied regional variant of horizontal-axis technology and serves as a bridge between ancient and modern wind energy systems. Cretan-type windmills were utilized across the Mediterranean shoreline until the previous century and are regarded as the precursors to all horizontal-axis windmill designs [1]. The configuration features a shaft positioned almost horizontally, supporting six to ten radial spars. These spars are angled so that the fixed sails face the approaching airflow. The ends of neighboring arms are linked to one another, securing triangular sails in the spaces between them [3]. The entire assembly is reinforced by guy wires that connect the outer tips of the arms to the bowsprit, which serves as a forward-protruding extension of the main shaft. The technological sophistication of Cretan windmills becomes evident when examining their operational characteristics and design innovations. The spars are interconnected at their outer ends and further reinforced by guy wires extending to a front-facing extension of the main axle, forming a rigid, three-dimensional triangular framework [4]. The fabric sails are attached to the radial spars and can be fastened either to the subsequent spar or to a specific location on the perimeter wire. In marine terminology, the line that tethers the corner of the sail is referred to as a “sheet” [4]. This specific windmill design creates its own functional airfoil, is highly efficient regarding resource consumption and possesses an inherent self-governing feature: it avoids excessive speeds by naturally altering the angle of attack, similar to the way a sailboat loses power when steered too close to the wind. The Cretan-type windwheel possesses several distinct advantages that have ensured its survival and continued use. The sails exhibit the unique capacity to shape themselves into aerodynamic profiles as soon as the rotor begins to spin [3]. These windwheels are characterized by exceptional self-starting performance, generating significant torque at low rotational velocities—a feature that is especially beneficial in areas with inconsistent wind patterns. Moreover, they are capable of extracting effective power from light breezes, ensuring their utility across various Mediterranean sites. Perhaps their most critical benefit is their inherent self-governing nature: during intense gusts, the sails begin to flutter or “flap”, which naturally slows the rotation and protects the machinery from structural damage [3]. The operational efficiency of Cretan windmills depends on the quantity and dimensions of the sails; historically, a cluster of smaller units was favored over a few massive ones due to their superior handling and ease of use. Consequently, rotors were typically built with four or six arms, while designs with more sails were reserved for exceptionally demanding work or areas with weaker wind resources. Practical trials on a four-meter-diameter sail-rotor windmill demonstrated that this configuration operated efficiently under conditions of low wind speeds and high torque requirements [4]. The maximum power coefficient for Cretan-type rotors is approximately 0.31 for TSR of 0.71, with sail angles of 25 degrees providing optimal performance [5].
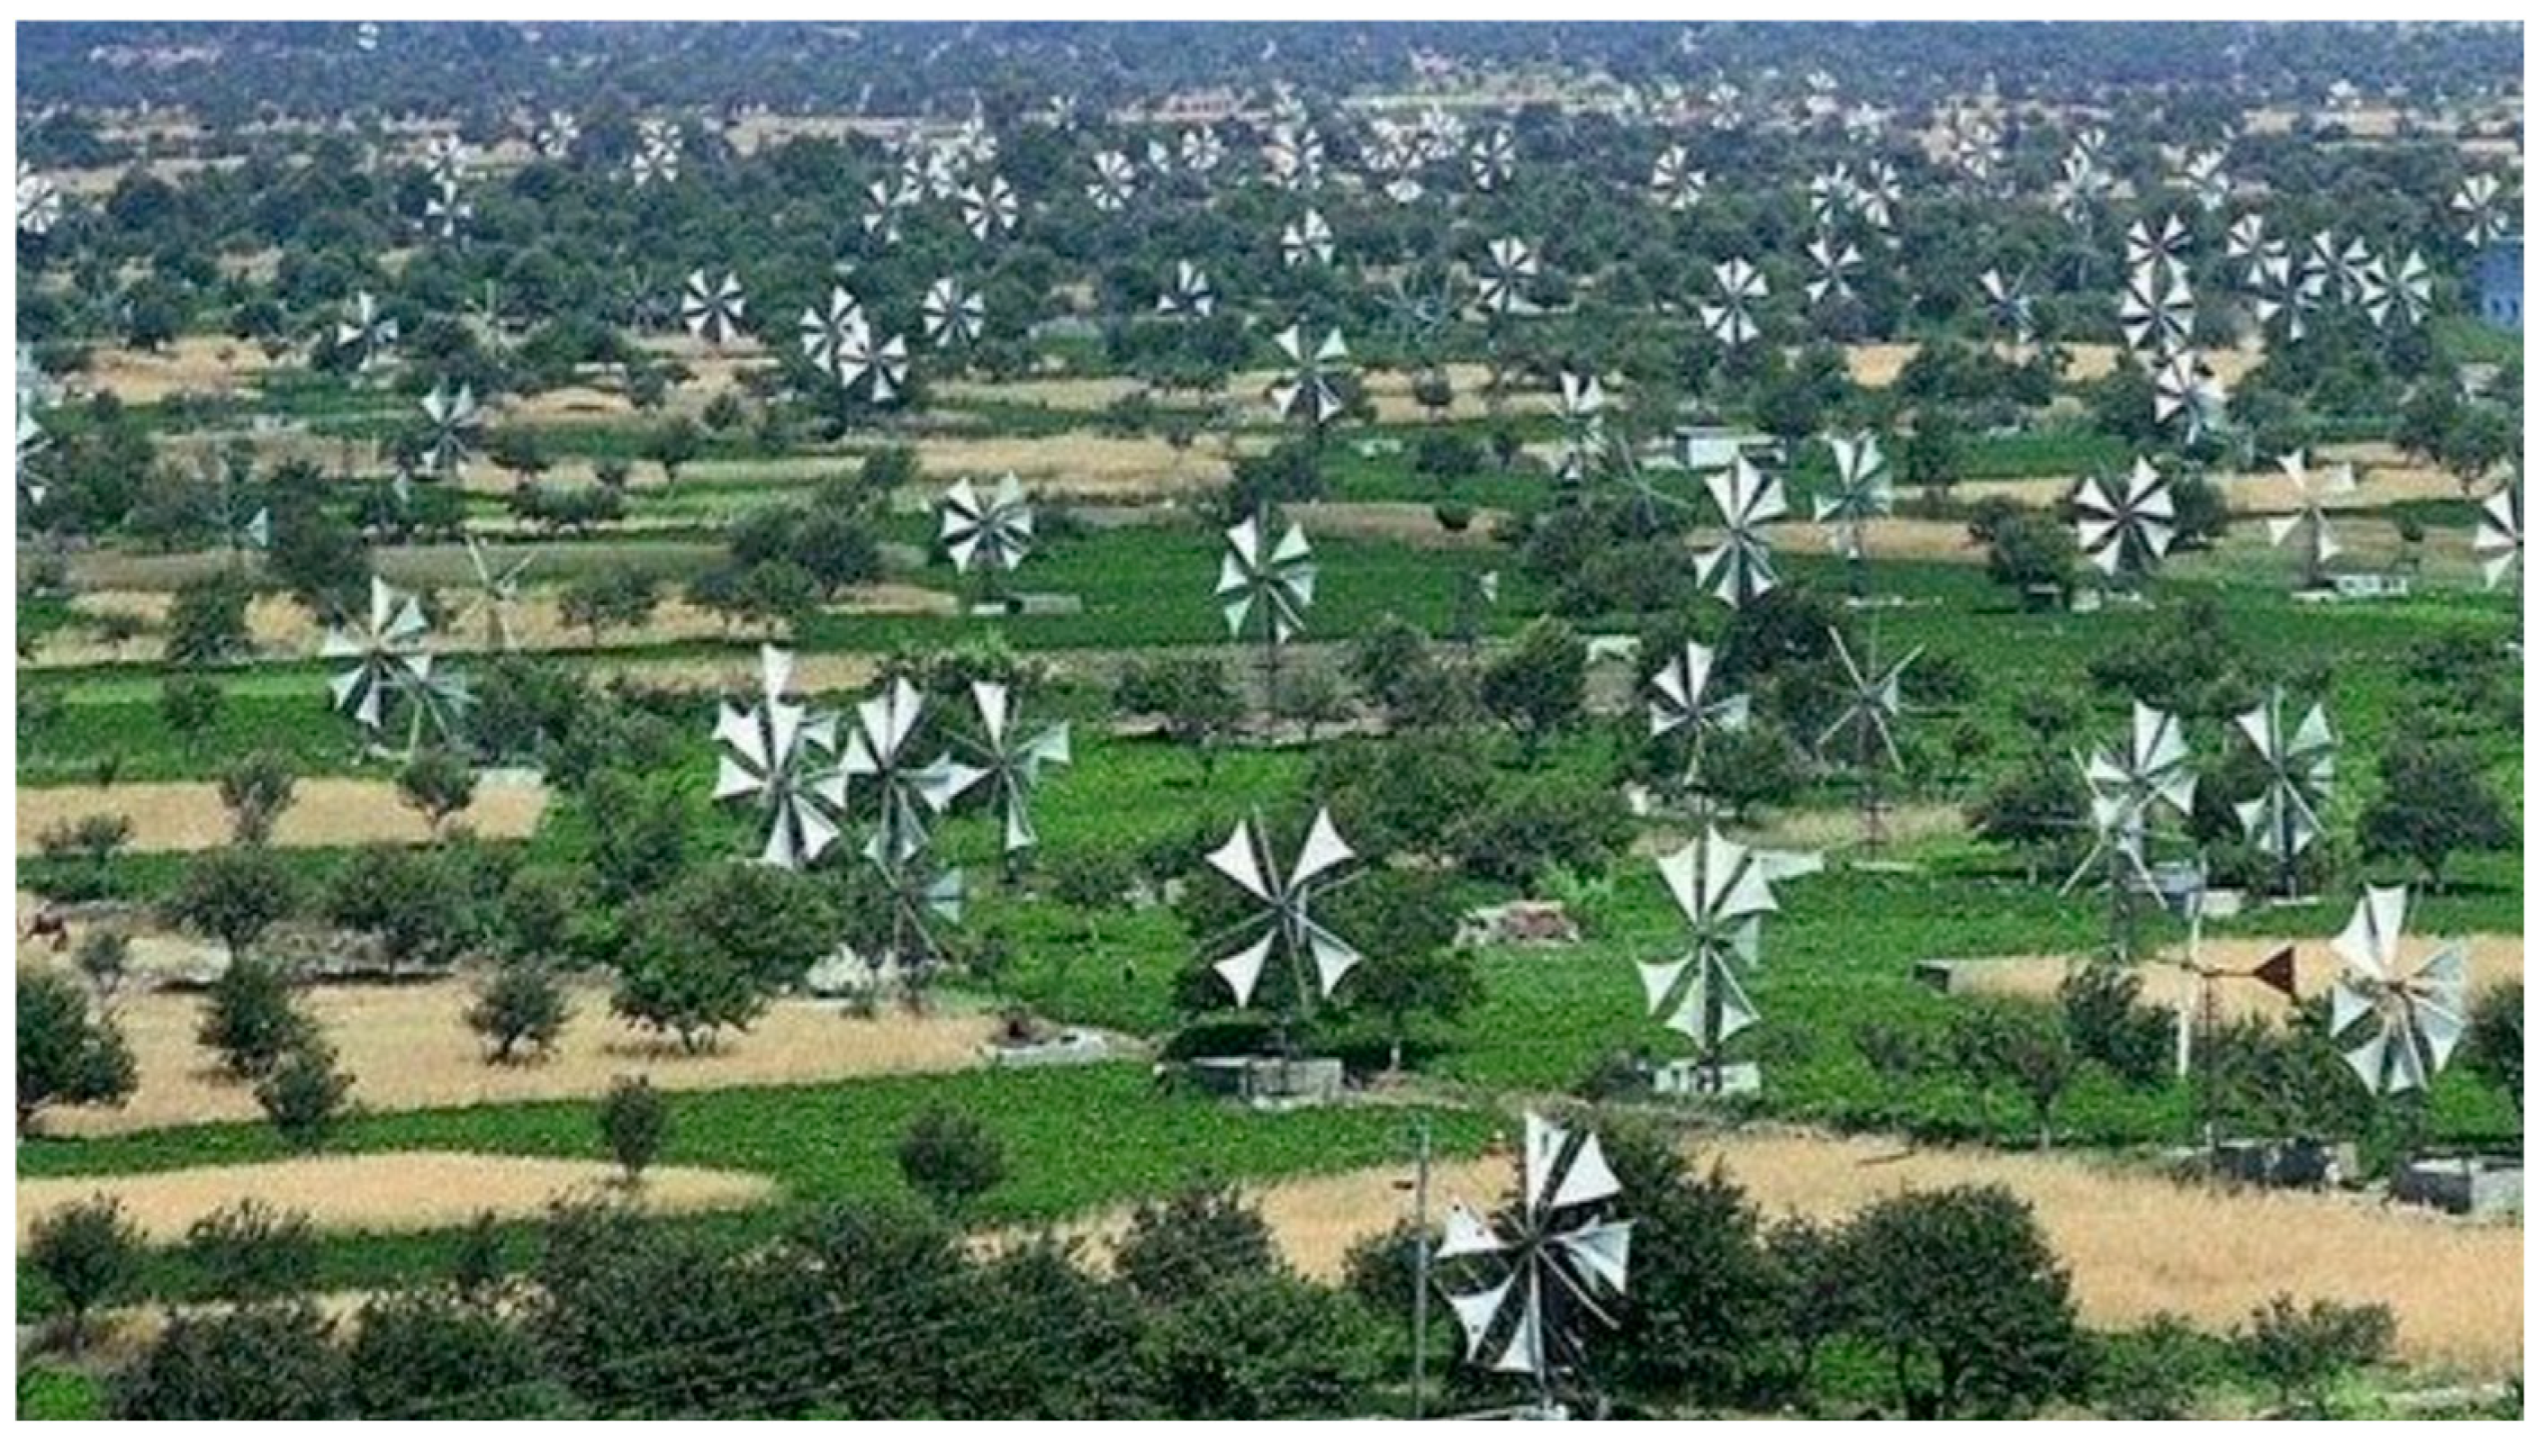
The practical applications of Cretan windmills extended beyond simple grain grinding to include water pumping and irrigation. In the 1920s, a specific Aegean version of the pumping windwheel was created on the island of Crete, coinciding with a swift agricultural shift from cereal cultivation and livestock farming to irrigated vegetable farming [3]. This led to the rise of what is known as the Cretan-type wind pump; at its peak, more than ten thousand of these structures were in operation specifically on the Lasithi Plateau (Figure 1). Their straightforward design, affordability, resilience, and the fact that they could be built by local workers using native materials made them highly suitable for developing areas. It is expected that Cretan-type windwheels will see growing use in developing nations; although they are naturally less efficient at capturing wind energy than contemporary turbines, they remain appealing due to their cost effectiveness and cultural acceptance.
Beyond the Mediterranean, windmill technology developed in diverse forms across Europe, with each region adapting designs to local environmental conditions and cultural preferences. While various windmill designs are found globally, a primary distinction exists between vertical-axis and horizontal-axis machines. Among the horizontal-axis category—which is significantly more common—there are three main variations: the Nordic or pivot type, tripod structures built atop rugged walls, and Mediterranean windmills, which are equipped with either rectangular vanes or triangular lateen sails [6]. In Spain specifically, windmills follow the Mediterranean style, characterized as tower or “rotating-cap” mills; in these designs, the blades or sails are positioned to face the prevailing wind by rotating the conical roof using specialized guidance systems.
The Lasithi Plateau of Crete represents a unique case study in windmill evolution, demonstrating how traditional technology can be adapted to meet changing agricultural and social needs. The area was divided into plots for systematic farming and the construction of traditional windmills began during this period of intensive agricultural development [7].
The technological evolution of water pump windmills on the Lasithi Plateau illustrates broader principles of engineering innovation and material advancement. In response to the limitations of the initial wooden designs, constructors sought to refine the existing model. The primary advancement involved reconfiguring the tower for greater stability, transitioning from a three-legged base to a more robust four-legged structure [8]. A pivotal figure in this evolution was Emmanouil “Spirtokoutis” Papadakis, a visionary inventor credited with the original concept of the wooden windmill [8]. His innovative approach eventually led to a more streamlined and responsive design, better suited to the specific environmental conditions of the plateau. Key technical improvements included a superior turntable assembly featuring an iron outer ring and the introduction of a triangular tail vane to ensure the rotor remained properly aligned with the wind. These collective enhancements resulted in a more efficient iron-based windmill capable of harvesting wind from any direction, supported by a stable tower whose height was no longer restricted by the natural dimensions of local timber [8].
The application of contemporary computational and analytical methods to windmill design has provided unprecedented insight into the aerodynamic and structural behavior of traditional windmill designs. In contemporary windmill research, the integration of three-dimensional geometric modeling, Computational Fluid Dynamics (CFD), and Finite Element Analysis (FEA) has established itself as the baseline methodology. These advanced functional simulations allow for the investigation of critical performance variables that traditional technical reports often overlook. By utilizing localized wind survey data, these CFD and FEA techniques enable a precise evaluation of both torque and total power output produced by the windmill [6]. Computational studies have validated the technical soundness of historical windmill designs. For instance, CFD simulations of the Sardinero windmill [6] demonstrated accurate performance relative to the spatial distribution of wind speeds and pressure gradients it typically encounters (4–7 m/s). This analysis confirmed the mechanical effectiveness and operational utility of this historical design. Similarly, the San Francisco windmill with triangular sails demonstrated correct operation at wind speeds of 5–11 m/s. These findings suggest that windmill designers of past centuries possessed sophisticated understanding of aerodynamic principles, even without the benefit of modern computational tools.
The aerodynamic characteristics of windmill sails have been extensively studied, revealing the sophisticated principles underlying traditional designs. The conceptual framework for flexible-sail wind turbines remains a developing area of study; until quite recently, even basic theoretical assessments regarding the mechanical behavior of these systems were almost entirely absent from the literature [9]. The performance of Cretan-type windmills using flexible sails has been experimentally investigated with detailed results. The distinctive three advantages of flexible triangular sails include their ability to form airfoil profiles, their inherent self-starting ability arising from the significant initial torque generated at minimal rotational velocities and the system’s self-regulating capability [5].
To model the characteristics of a windmill, one would have to ascertain the wind climatology of the area of interest. High-resolution wind resource characterization in mountainous terrain remains a challenge due to sub-grid-scale processes and strong orographic forcing. The Lasithi Plateau is an ideal test case due to its closed topography surrounded by the Dikti Mountains and its significant potential for distributed wind energy development. Similar studies [10,11] apply the WRF-ARW model [12] to downscale ERA5 reanalysis data [13] from 27 km to 3 km resolution and validate the results using in situ meteorological observations. Similar downscaling applications have been reported by García-Díez et al. [14] and Lorenz and Barstad [15] for wind resource mapping in complex terrain. This method ensures that the local wind reign is well documented and validated so that the aerodynamical characteristics of the windmill are “in tune” with the wind’s locality.
Today, as observed during recent fieldwork, only a few traditional windmills remain in operation, maintained primarily by community members interested in preserving cultural heritage [7]. Contemporary interest in windmill technology has emerged from multiple directions: heritage preservation movements seeking to maintain cultural identity, renewable energy advocates recognizing wind power’s environmental benefits, and researchers studying ancient engineering principles and their relevance to sustainable development. The Crete Valley project, for example, aims to merge modern renewable energy production with the revival of traditional windmills, which hold significant cultural and historical value for the community [7].
The decline of traditional windmill technology in the late twentieth century reflected economic factors rather than fundamental design inadequacy, as motor-driven alternatives proved more convenient and powerful. Nevertheless, contemporary interest in windmill technology persists for heritage preservation, renewable energy advocacy, and academic study of sustainable engineering principles. Recent research has explored how modern energy systems can enhance the relevance of wind-based electricity generation through energy communities, behavioral energy efficiency in buildings, integrated renewable systems, and the strategic use of photovoltaics and battery storage [16,17,18,19]. At the same time, participants in energy communities increasingly seek the adoption of applied renewable energy technologies that are compatible with their local living environments [20], and power-generating windmills effectively address these requirements.
The key innovations of this work are threefold: (a) first, quantitative CFD/FEA validation of Lasithi Plateau flexible-sail windmill aerodynamics up to 40 m/s extreme conditions; (b) novel integration of 3D-scanned traditional geometry with DEOL/BEM optimization and SolidWorks 2025 Flow Simulation, in order to create an innovative, manufacturable, electricity-generating design; and (c) quantification of passive aeroelastic load-shedding mechanisms in fabric rotors, revealing nonlinear torque characteristics that enable inherent gust alleviation without active control systems. These advances conjoin cultural heritage preservation with modern rural electrification for non-grid-connected regions.
The structure of this paper is organized as follows. Section 1 provides an introduction to the historical evolution of windmills, from ancient origins to Cretan horizontal-axis designs on the Lasithi Plateau, highlighting their self-regulating sails and cultural significance, while explaining the need for modern computational analysis to revive them for sustainable electricity production. Section 2 details the methodology, encompassing wind climatology assessment via WRF mesoscale downscaling to WAsP microscale modeling, the design process informed by 3D scanning of traditional windmills, CFD simulations using SolidWorks Flow Simulation for aerodynamic performance at nominal and extreme conditions, structural design of subassemblies (tower, nacelle, rotor, tail, generator), protection systems against high winds, and energy utilization strategies compliant with Hellenic regulations. Section 3 presents results and discussion, including Lasithi Plateau wind resource maps, grid-independent CFD outcomes for torque/power coefficients and flow topologies, sail deformation patterns, and FEA validation of structural integrity under 40 m/s gusts with safety factors exceeding 2.0. Finally, Section 4 concludes with key findings on aeroelastic load shedding and implications for resilient, low-cost rural electrification.

2. Methodology

2.1. Wind Climatology

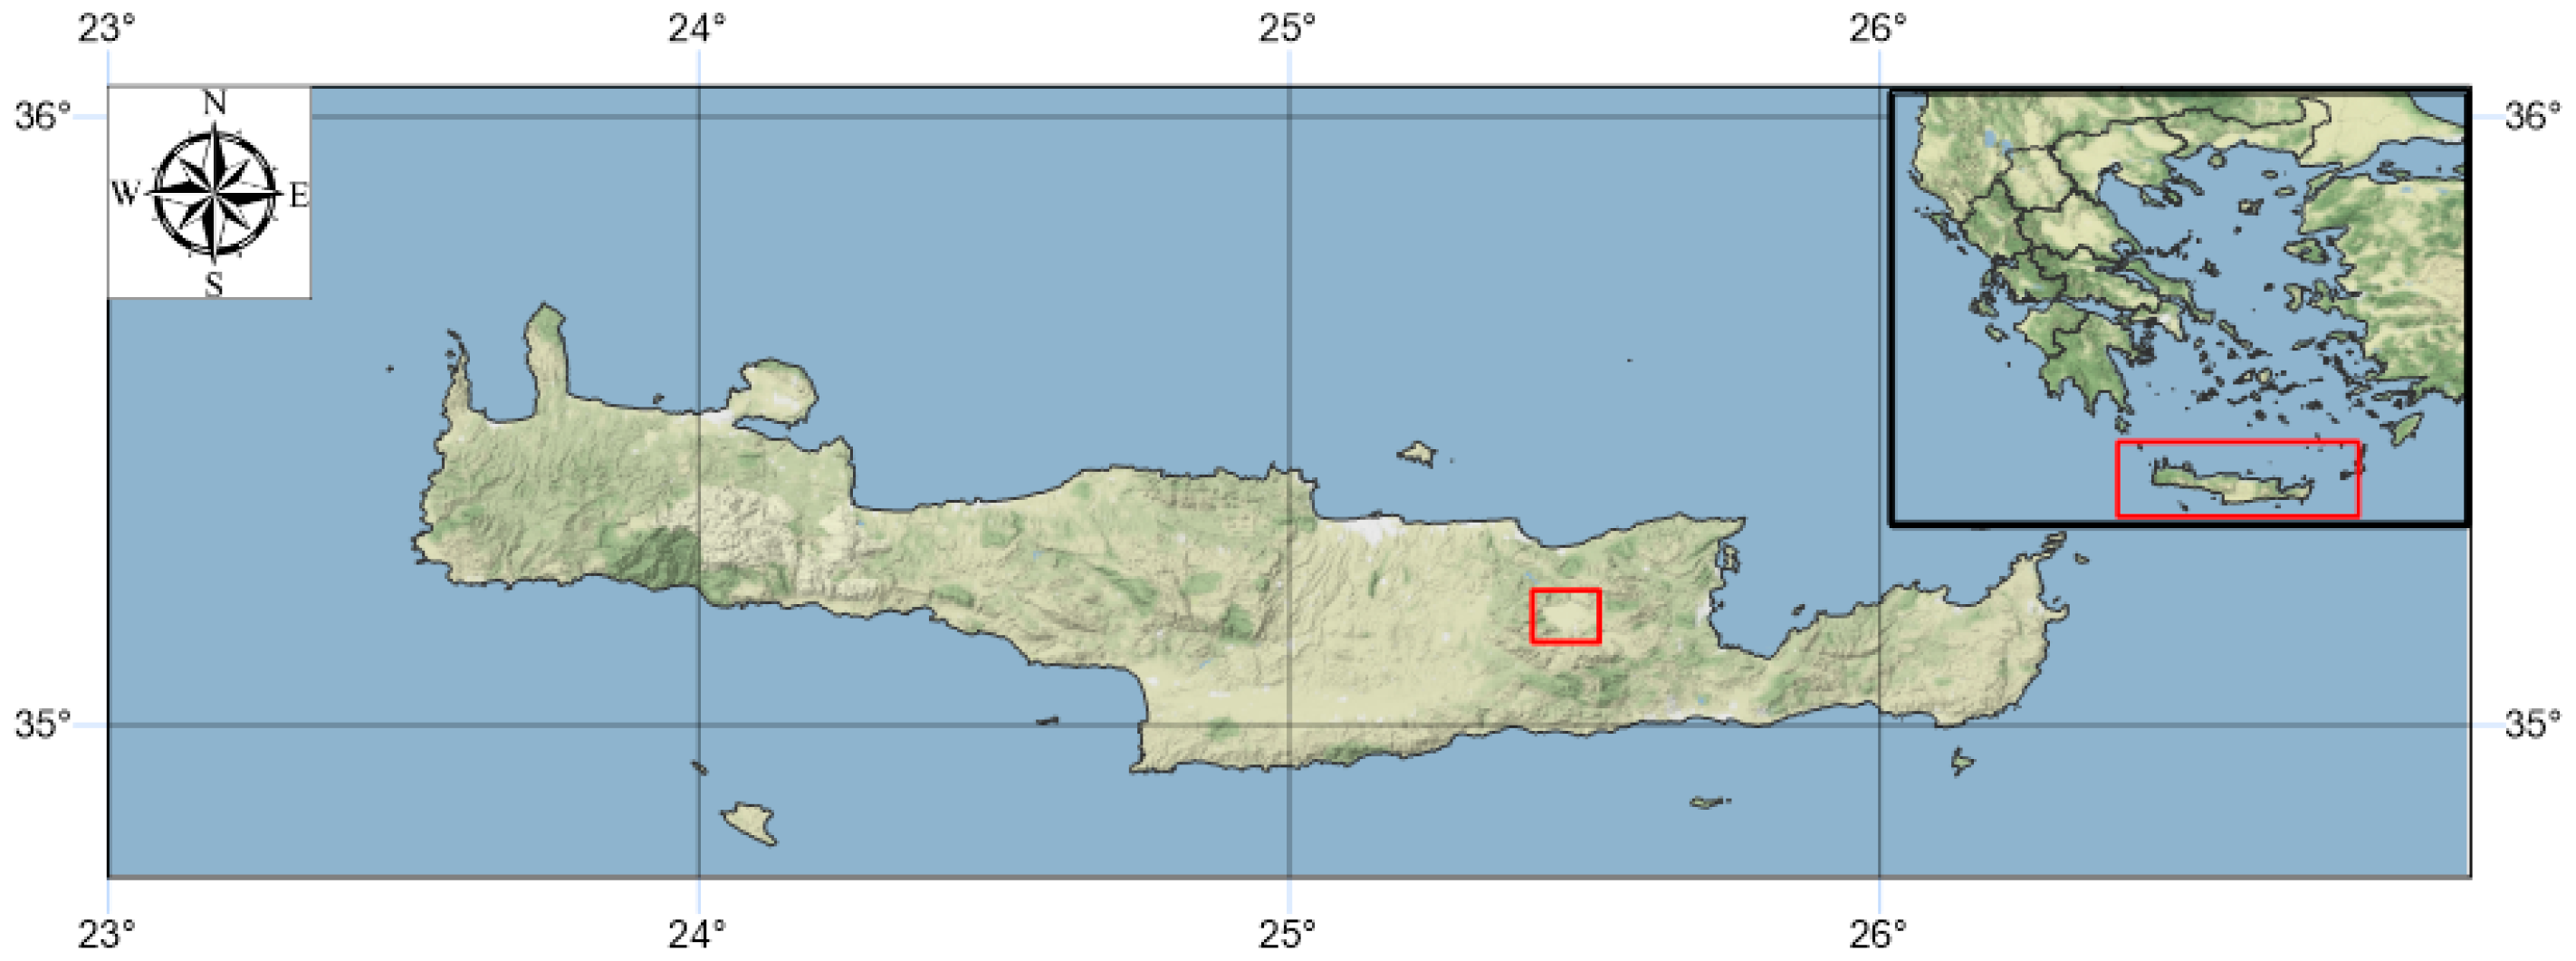
The current methodology is based on previous work [10,11]. There, the WRF setup employs three nested domains centered over Crete, with the innermost grid covering the Lasithi Plateau at 3 km resolution (Figure 2). The configuration includes Thompson microphysics [21], Kain–Fritsch convection [22], RRTM longwave [23], Dudhia shortwave [24], YSU boundary layer scheme [25], and the Unified Noah Land Surface Model [26]. Orography and land-use data are sourced from GMTED2010 and Copernicus EU-DEM datasets [27,28].
Sensitivity tests, extensively discussed in [10,11], include changes in planetary boundary layer scheme, microphysics, and grid-nudging options to identify the most representative configuration for the Lasithi basin flow regime. The resulting wind climate is used to predict the local wind variability using WAsP 10 software from the Risoe National Laboratory, Denmark [29].

2.2. Design Process

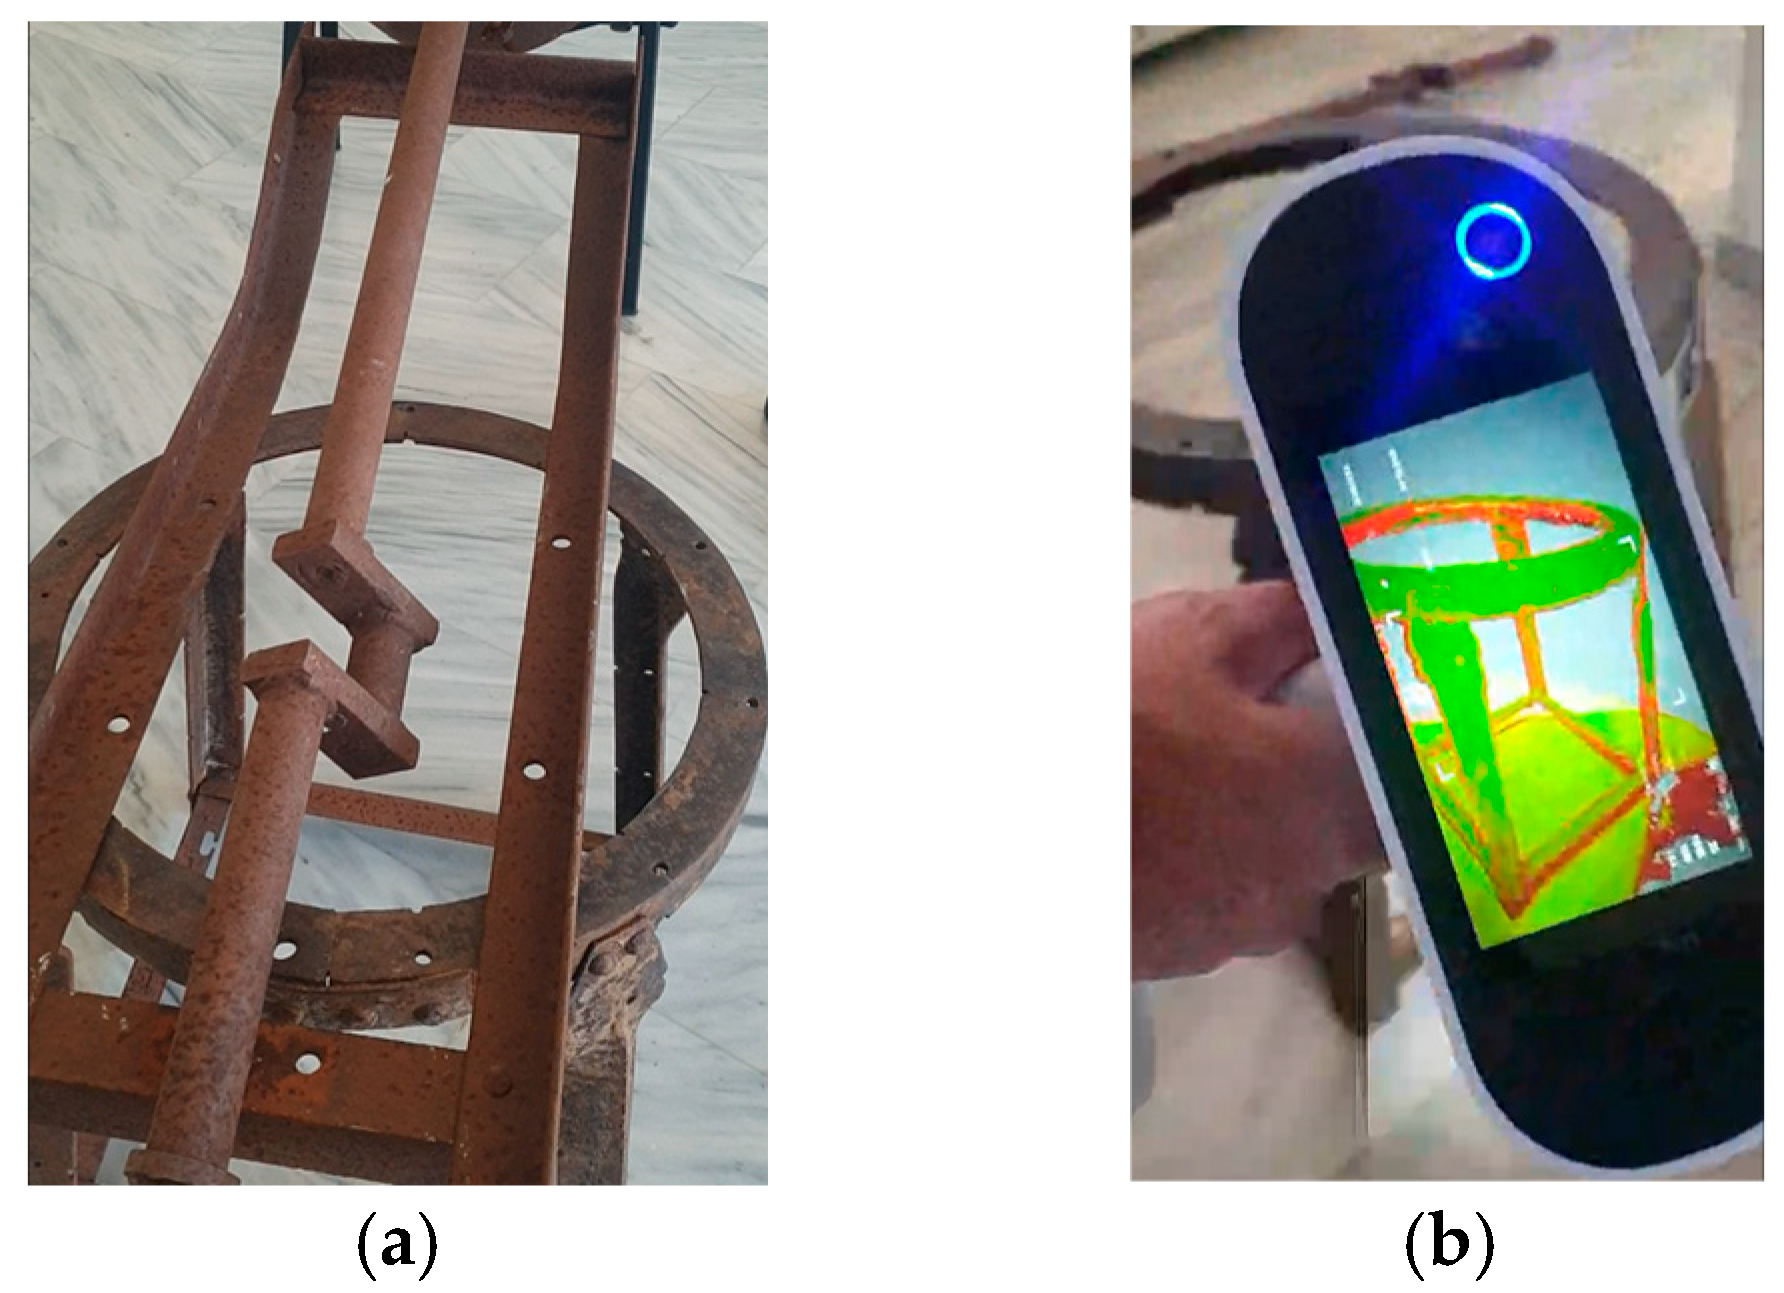
The design process of the new windmill began with an in-depth study of the traditional windmill in order to identify construction details and other useful features and techniques that could contribute to the new design. To ensure that every construction detail was accurately recorded, a high-precision 3D scanner was used (Figure 3). The detailed digital representation of the traditional windmill’s structural frame assisted in understanding its construction and technical details. It also contributed to the preservation of the traditional local fabrication techniques through digital documentation.
The sail-rotor geometry was initially optimized using the following procedure. The aerodynamic performance code DEOL [30] is used to estimate the aerodynamic loads on a specific area, given the wind and rotational speed, the angle of attack and the blade geometric parameters. DEOL is based on Glauert’s vortex theory, modified by researchers at the Massachusetts Institute of Technology [31]. Initially, a refined Blade-Element Momentum (BEM) framework is applied to analyze the performance of the sail-rotor generator. This approach assumes a rotating ring-shaped stream tube moving through the turbine, where momentum balance equations are used to calculate the axial and tangential forces exerted on the fluid within that annulus. Subsequently, the blade is partitioned into discrete radial segments of width ‘dr’. The forces produced by the lift and drag coefficients are calculated for each segment based on the two-dimensional aerodynamic profiles specific to that section of the blade. Ultimately, a repetitive computational process determines the primary geometric dimensions of the rotor layout. The primary objective of this procedure is to optimize the aerodynamic efficiency of the resulting rotor design.
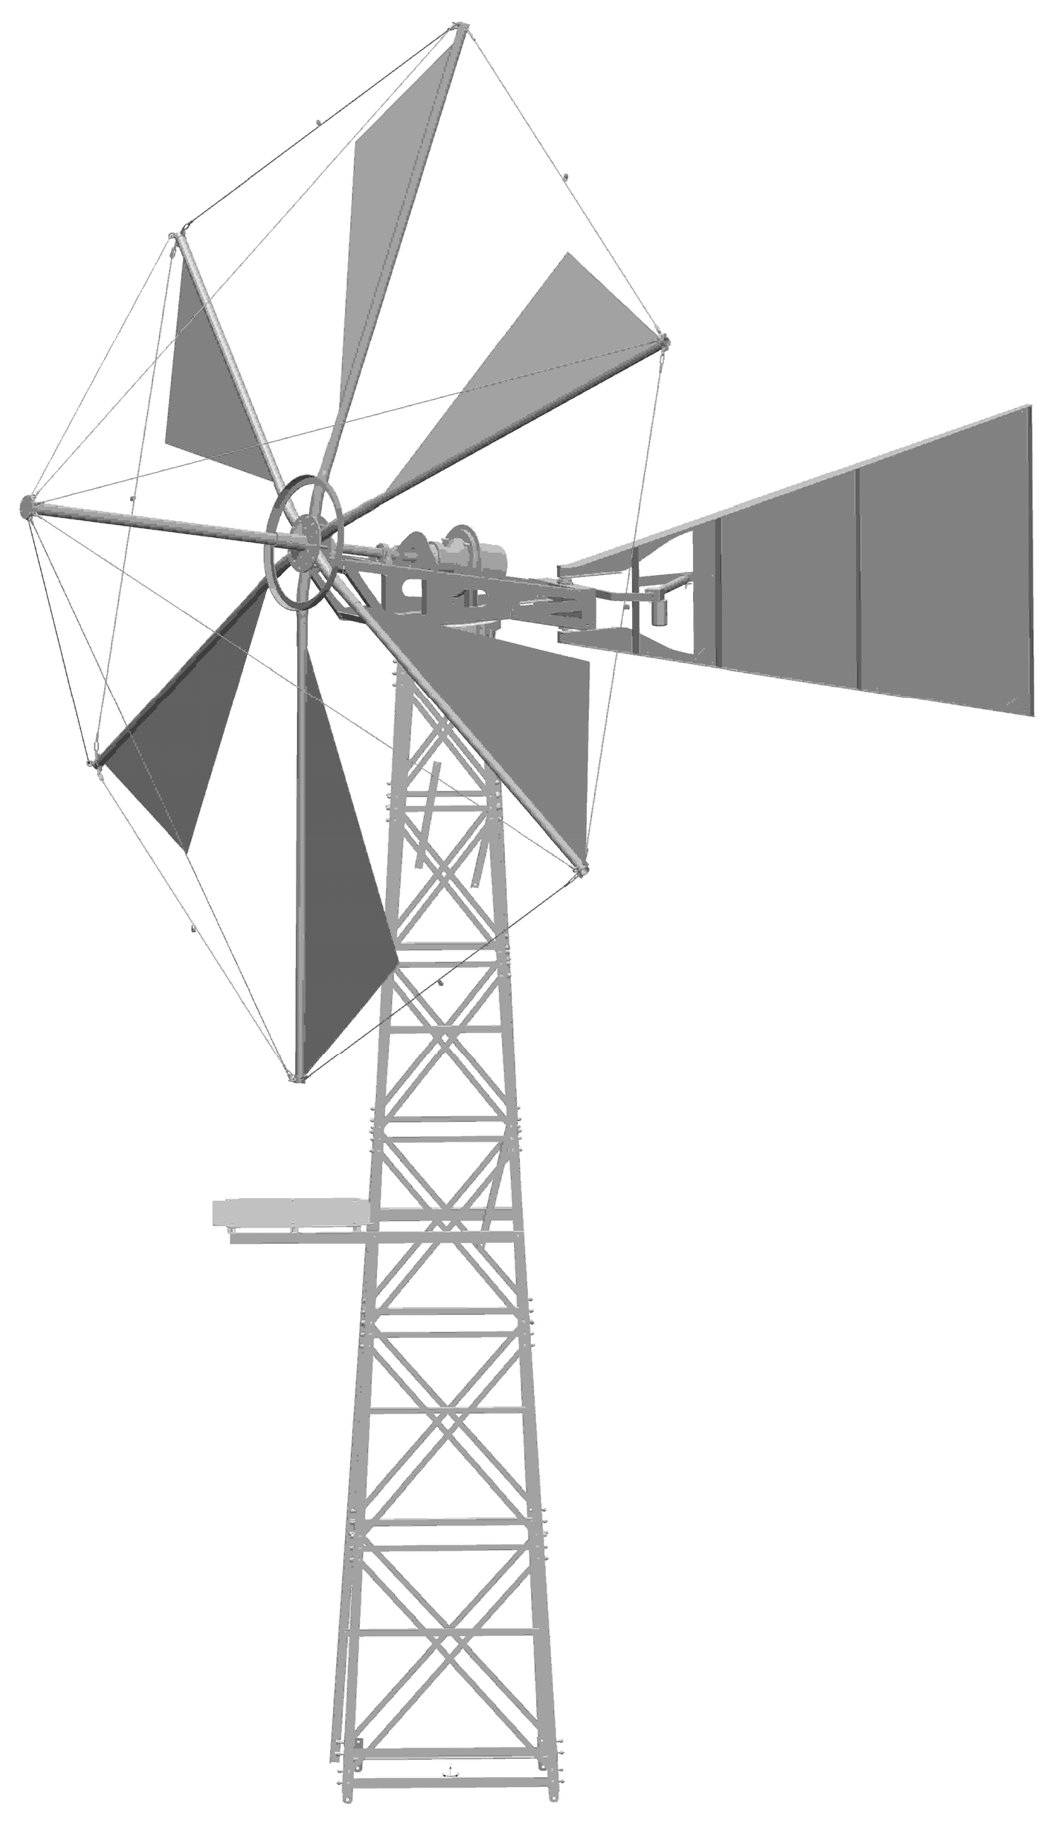
The windmill modeled in this study has a rotor diameter of 5.5 m, corresponding to a swept area of 23.76 m2. The active blade area is 5.28 m2, yielding a solidity ratio of approximately 22.22%. By further unfurling the sails up to 10.86 m2, the solidity ratio becomes 45.71%. The windmill was analyzed with SolidWorks Flow Simulation [32] at a wind speed of 12 m/s and a fixed rotational speed of 55 RPM, corresponding to a TSR of 1.32. To test the design limits of the apparatus, a second set of CFD calculations was conducted at 40 m/s wind speed, with the windmill rotating at 80 RPM with TSR of 0.58. A series of intermediate computations were conducted for different TSR values with fixed wind speed in order to establish the operational characteristics of the windmill and determine its torque and power coefficients curves. Under operational conditions the sails will deform downwind by taking a cambered airfoil-like membrane shape. All calculations were repeated over the initial shape of the sail so that the second set would include the pressure-induced membrane deformation, in order to realistically capture the flow topology in the vicinity of the sail rotor. The trailing tip of the sails was holstered by an elastic rope which in turn was attached to the peripheral guy-wire encircling the windmill sails. This arrangement is essentially a tensioned membrane system (Figure 4). The mast and spars hold the sail at the leading edge, the guy-wire provides a circular frame at the tips, and the elastic rope connects the trailing edge to that frame, ensuring constant but flexible tension. The deformed shapes of the sails are given in the results section as part of the structural analysis of the windmill.

2.3. Computational Fluid Dynamics Simulations

SolidWorks Flow Simulation [32] was used for the CFD analyses. The computational domain extended sufficiently around the windmill to minimize boundary effects, with inlet boundary conditions imposed at least five rotor diameters upstream from the rotor plane and the outlet set at 15 rotor diameters downstream. The two lateral conditions were placed 5.5 rotor diameters away from the windmill’s center. A local rotating region was used to simulate blade motion, while different treatments of wall boundary conditions were applied across cases. Three types of boundary condition strategies were compared: (i) no wall motion (geometry treated as stationary surfaces within a rotating frame); (ii) wall motion with absolute rotation specified; and (iii) wall motion with relative-to-rotating-frame velocity (Table 1). Mesh refinement strategies included local surface refinement on blades and volumetric refinement in the rotating region. The optimal setup was determined by fixing a boundary-layer-type grid in the vicinity of the sails and structural elements of the windmill with stacked cells that follow closely its curvature and the changes in the topographic orientation. The main setup parameters are summarized in Table 1.
The pressure-induced membrane deformation was implemented by a simplified two-way Fluid–Structure Interaction (FSI) technique. The workflow is as follows: (a) The initial CFD run on the undeformed flat sails generates surface pressure loads. (b) Pressure loading and rotational effects are imported to the FEA module using the equivalent material properties in Table 2, thus acquiring the deformed sail geometry. (c) The deformed geometry is re-meshed and solved in the CFD module to update flow topology. Please note here that rotational effects contribute to the centrifugal stiffening of the structure, thus reducing bending and sail deformation.
SolidWorks Flow Simulation employs its proprietary iterative conjugate gradient solver with algebraic multigrid preconditioning as the default for pressure–velocity coupling and discretized linear systems. This solver automatically activates for large-scale systems following mesh refinement, providing robust convergence acceleration through multigrid hierarchies that reduce iteration counts by factors of 10–100x compared to basic iterative methods. No custom solver selection was required, as the software’s built-in implementation handles the increased system size (from coarse to grid-independent meshes) effectively, as demonstrated by the grid convergence study in Section 3.2 where results stabilized across the finest meshes. Also, it employs an implicit Newton–Raphson method with successive substitutions for solving the coupled nonlinear algebraic equations arising from near-wall gradients and discretization. For the sail windmill CFD analyses, this default nonlinear solver demonstrated robust convergence across all mesh refinements, as evidenced by the grid independence study. The Standard k-ε model (based on the transport equations and coefficients) is used for closing the equations, but it is modified with a damping function (fμ) to handle transition and low-Reynolds number effects. It is also coupled with a proprietary two-scales wall function method for boundary layer resolution [32]. The model’s eddy viscosity assumption overpredicts momentum transfer in highly separated regions, potentially underestimating drag forces compared to LES or DES turbulence models. For the sail windmill’s passive load shedding, this may manifest as conservative thrust estimates during extreme conditions. All CFD calculations were performed using steady-state simulations with the provided Local Rotating Region (Averaging) method, engulfing the rotating sail rotor, and were specifically optimized for the specific windmill geometry.
The material properties of the solid steel parts and the equivalent properties of the coated polyester membrane for the sails are summarized in Table 2. The isotropic linear elastic model for Precontraint 705 was adopted as a conservative first approximation justified by the following considerations: (a) the mechanical properties of the material average orthotropic behaviors under biaxial tension; (b) operational strains < 5% remain within linear elastic range before nonlinear fabric crimp effects dominate; and (c) the isotropic model overestimates stiffness vs. actual orthotropic tension-dominated behavior, thus yielding safer structural margins. Full orthotropic hyperelastic fabric models would better capture high preload/low shear coupling, but require extensive biaxial test data unavailable for this study. Future work will implement woven-composite models calibrated against Lasithi Plateau field measurements.

2.4. Structural Design

For the design of the electricity-generating windmill, the findings from the analyses presented in the results section were evaluated and incorporated. In addition, the design aims to simplify the construction process so that the windmill can be manufactured using automated procedures through CNC and laser cutting machines, thereby minimizing manual labor. Adopting this construction approach leads to a reduction in manufacturing time and a significant decrease in construction errors. To simplify the explanation of the construction process, the windmill can be divided into subassemblies as outlined: (a) support tower, (b) nacelle, (c) tail, (d) rotor, and a (e) generator–gearbox unit.
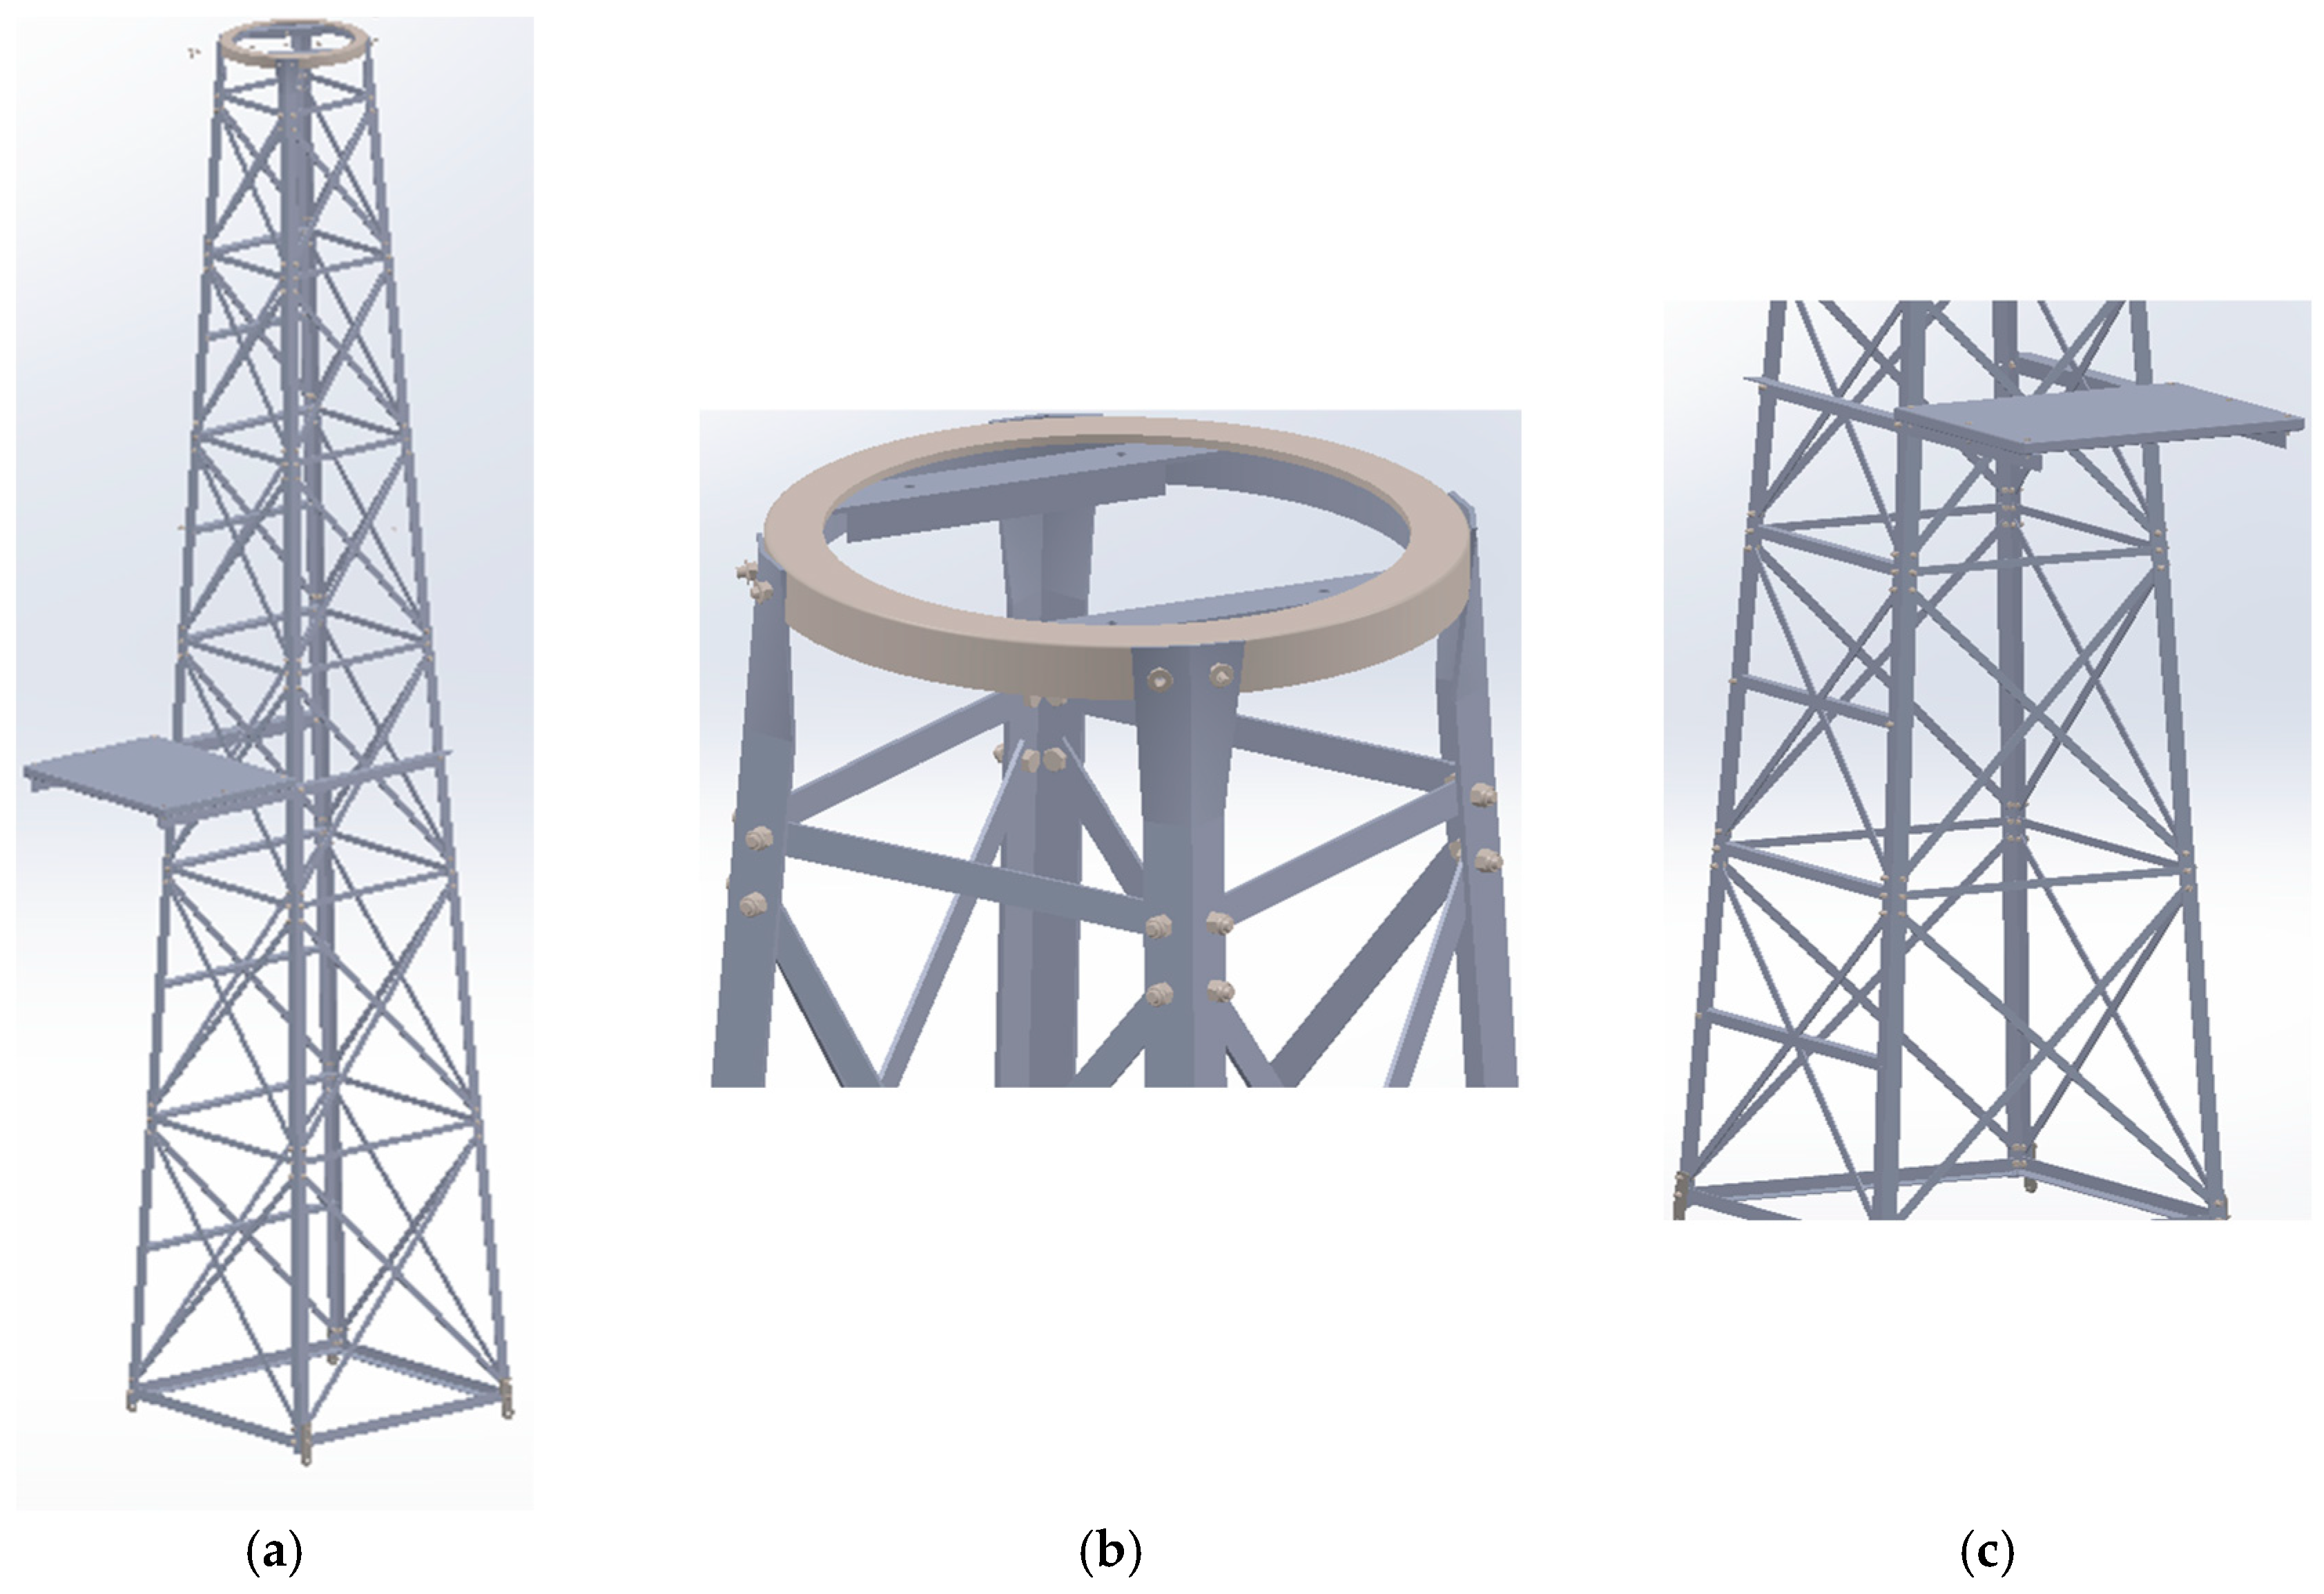
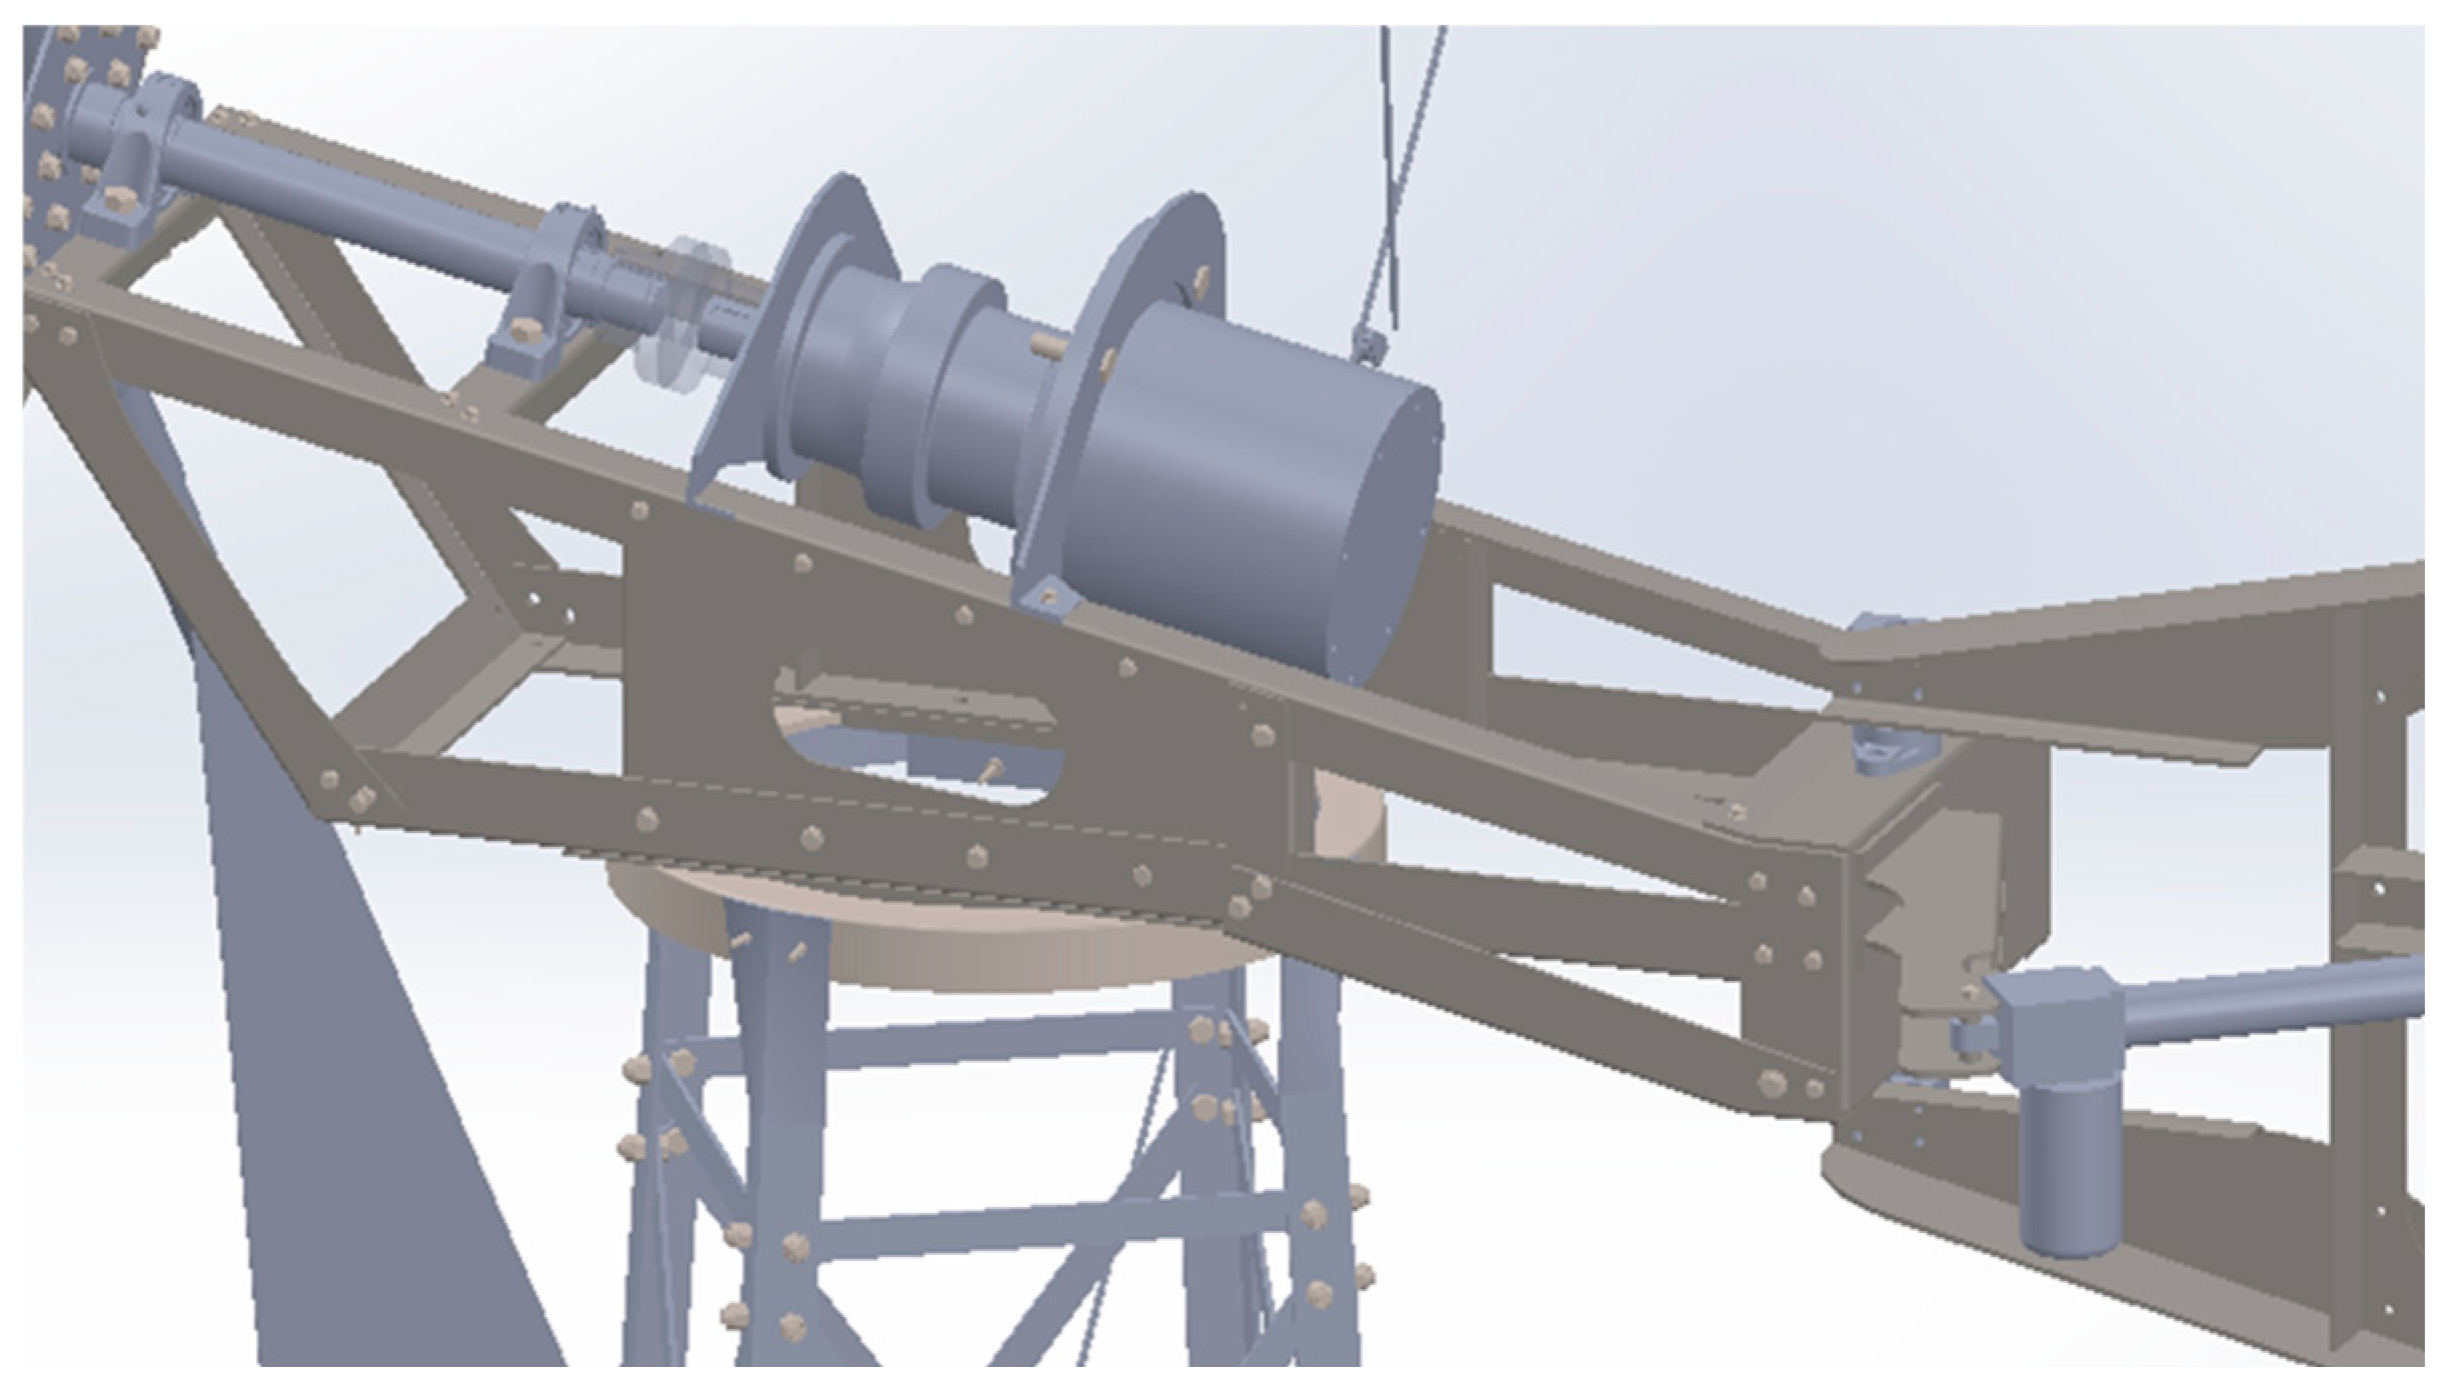
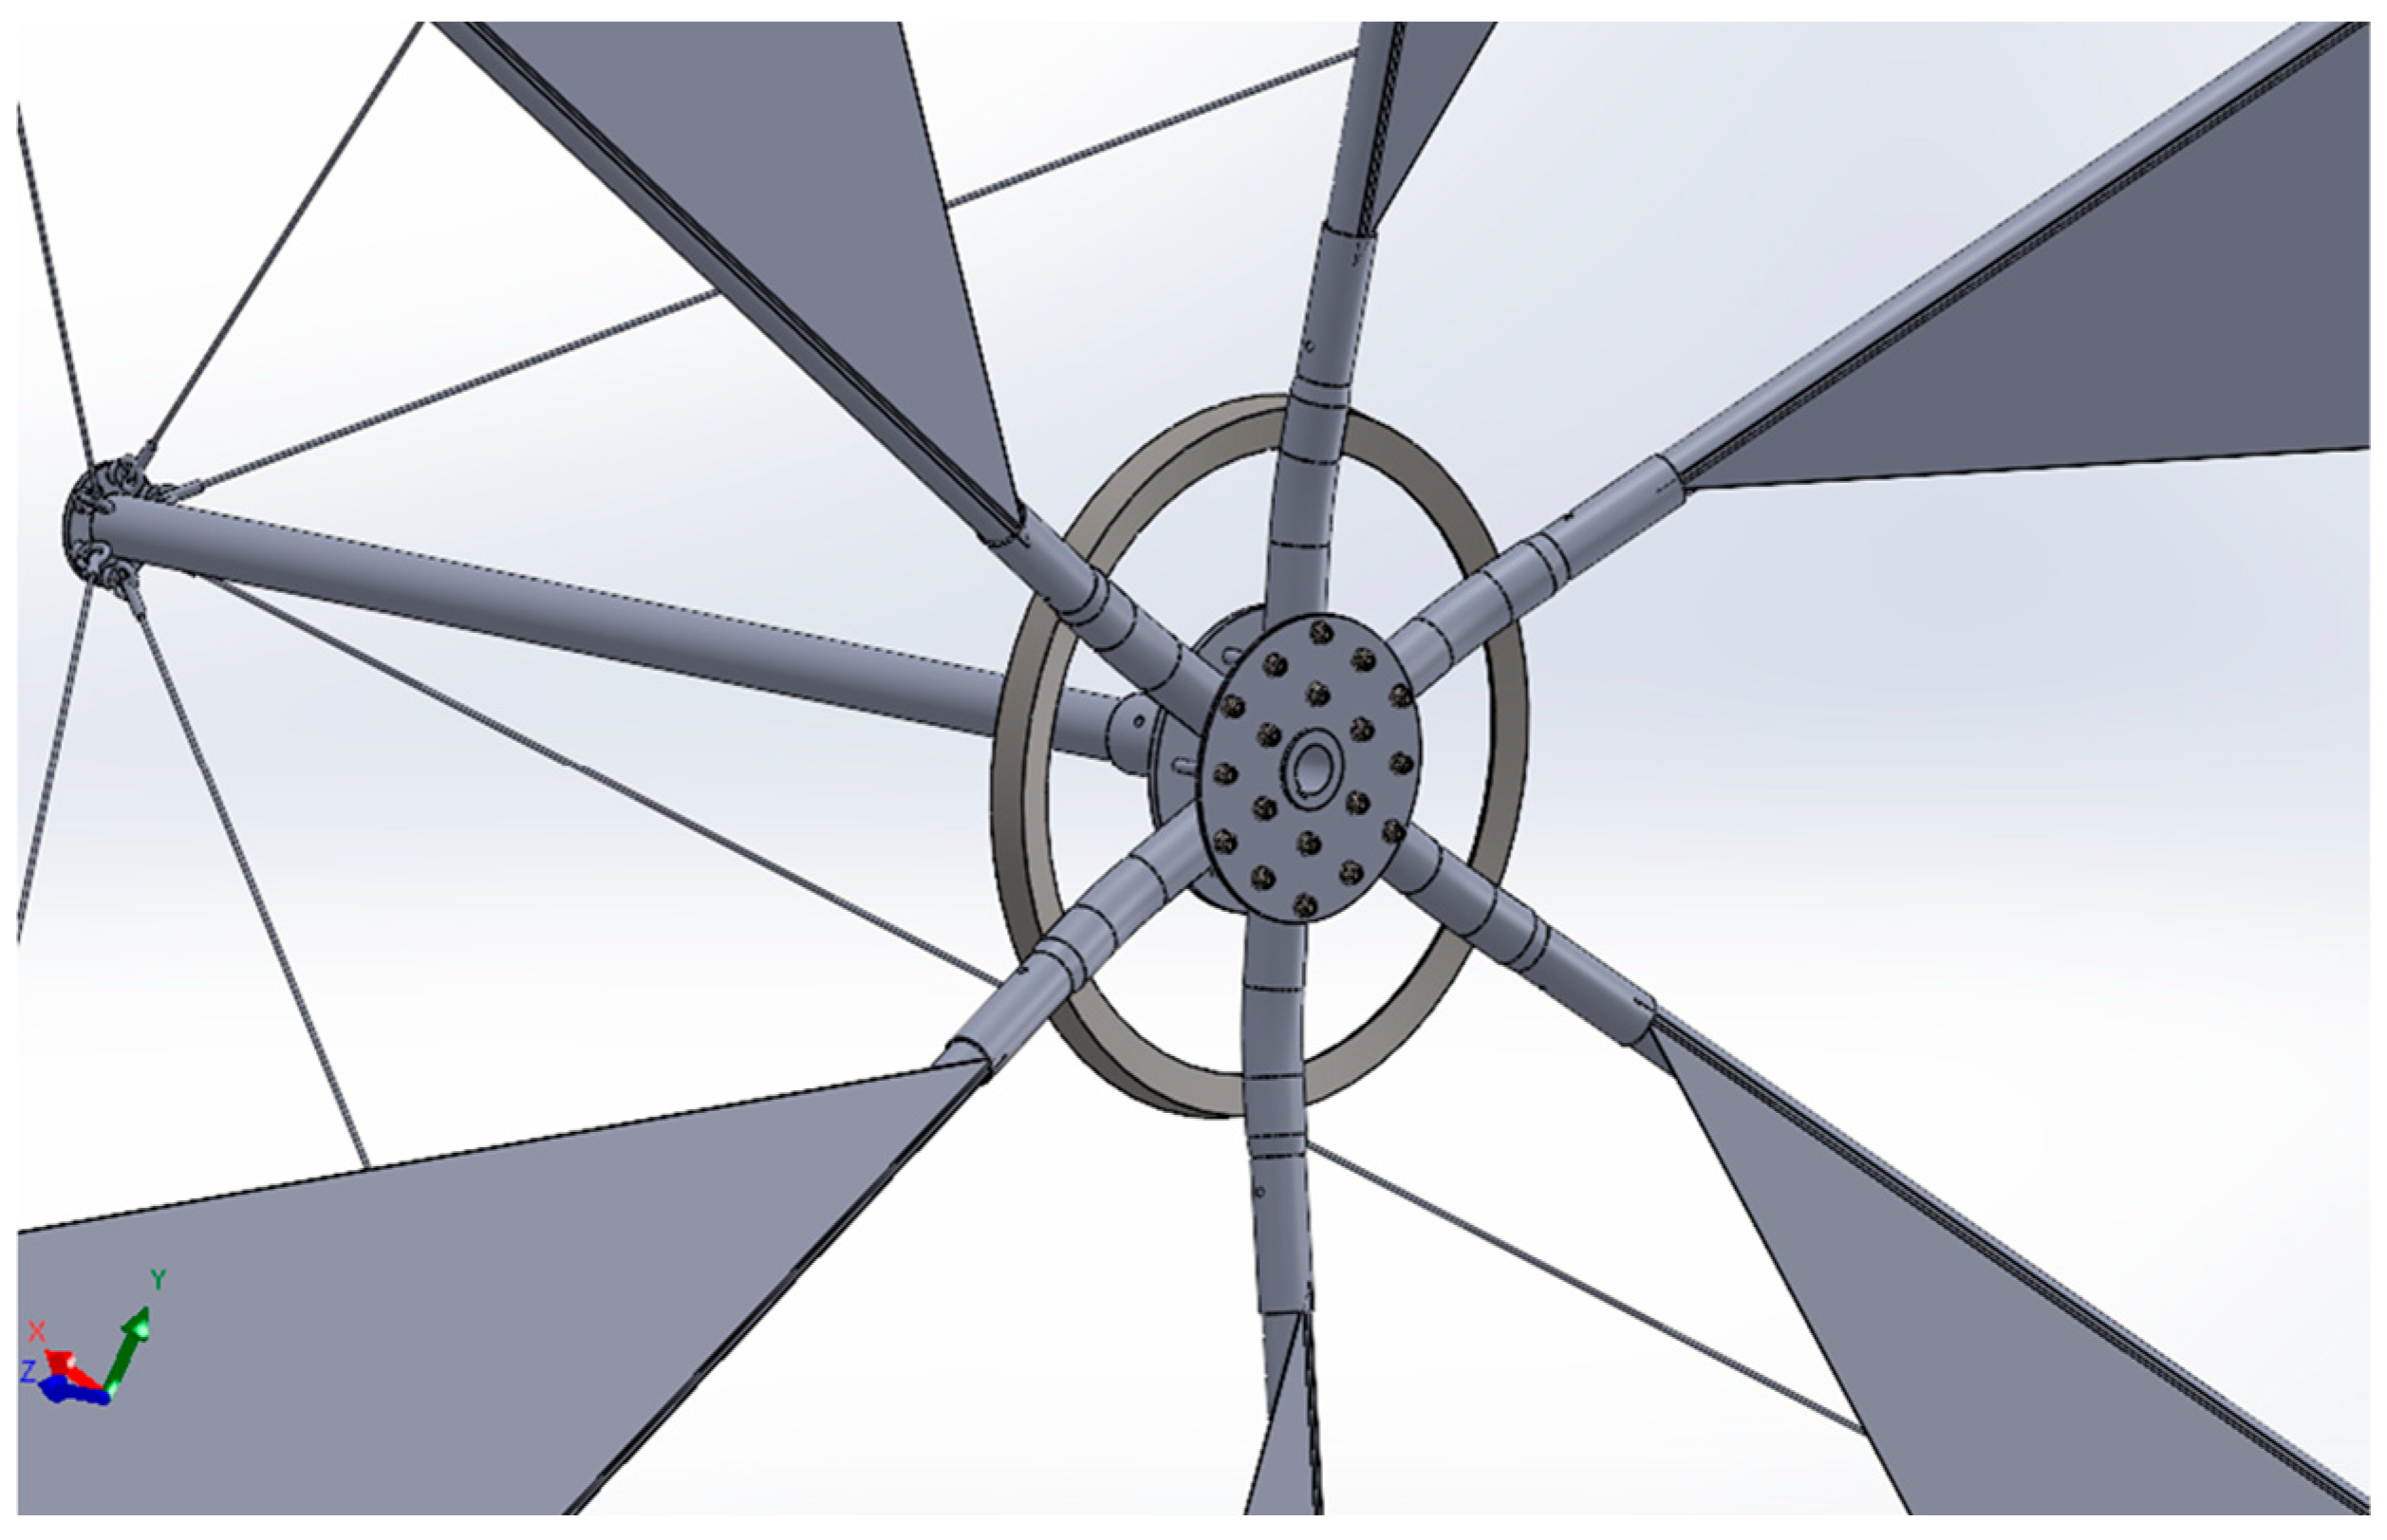
The support tower, which is a steel lattice structure, is bolted at its base to a reinforced concrete foundation installed on the ground (Figure 5a). At the top of the tower, a steel ring—referred to as the tower crown—is formed, onto which the nacelle is mounted, allowing it to rotate around the vertical axis of the tower (Figure 5b). Additionally, one side of the tower includes an additional steel structure that serves as a climbing ladder, along with a mid-height platform, enabling a technician to climb the tower for construction or maintenance of the windmill (Figure 5c). The nacelle is also a steel lattice structure, on which the rotor, the generator–gearbox unit, and the tail are mounted (Figure 6). The rotor, which converts wind energy into mechanical rotational energy, is supported by two rolling bearings mounted on the nacelle. This is achieved through the use of six rotor arms, on which specially shaped sails are attached to capture and transfer the wind power (Figure 7).
The rotor consists of the arms which are connected on one side to a steel hub (Figure 7). On their opposite ends, they are linked together with a 6 mm peripheral steel cable. They are also interconnected, as well as connected to an additional component (a tube), using 5 mm steel cables. All these connections between the components and cables create a pyramidal structure that provides high resistance to the forces exerted by the wind. Additionally, at a radius of 350 mm from the center, the arms are connected to a component called the “collar”, which facilitates the transfer of torque from the arms to the rotor shaft.
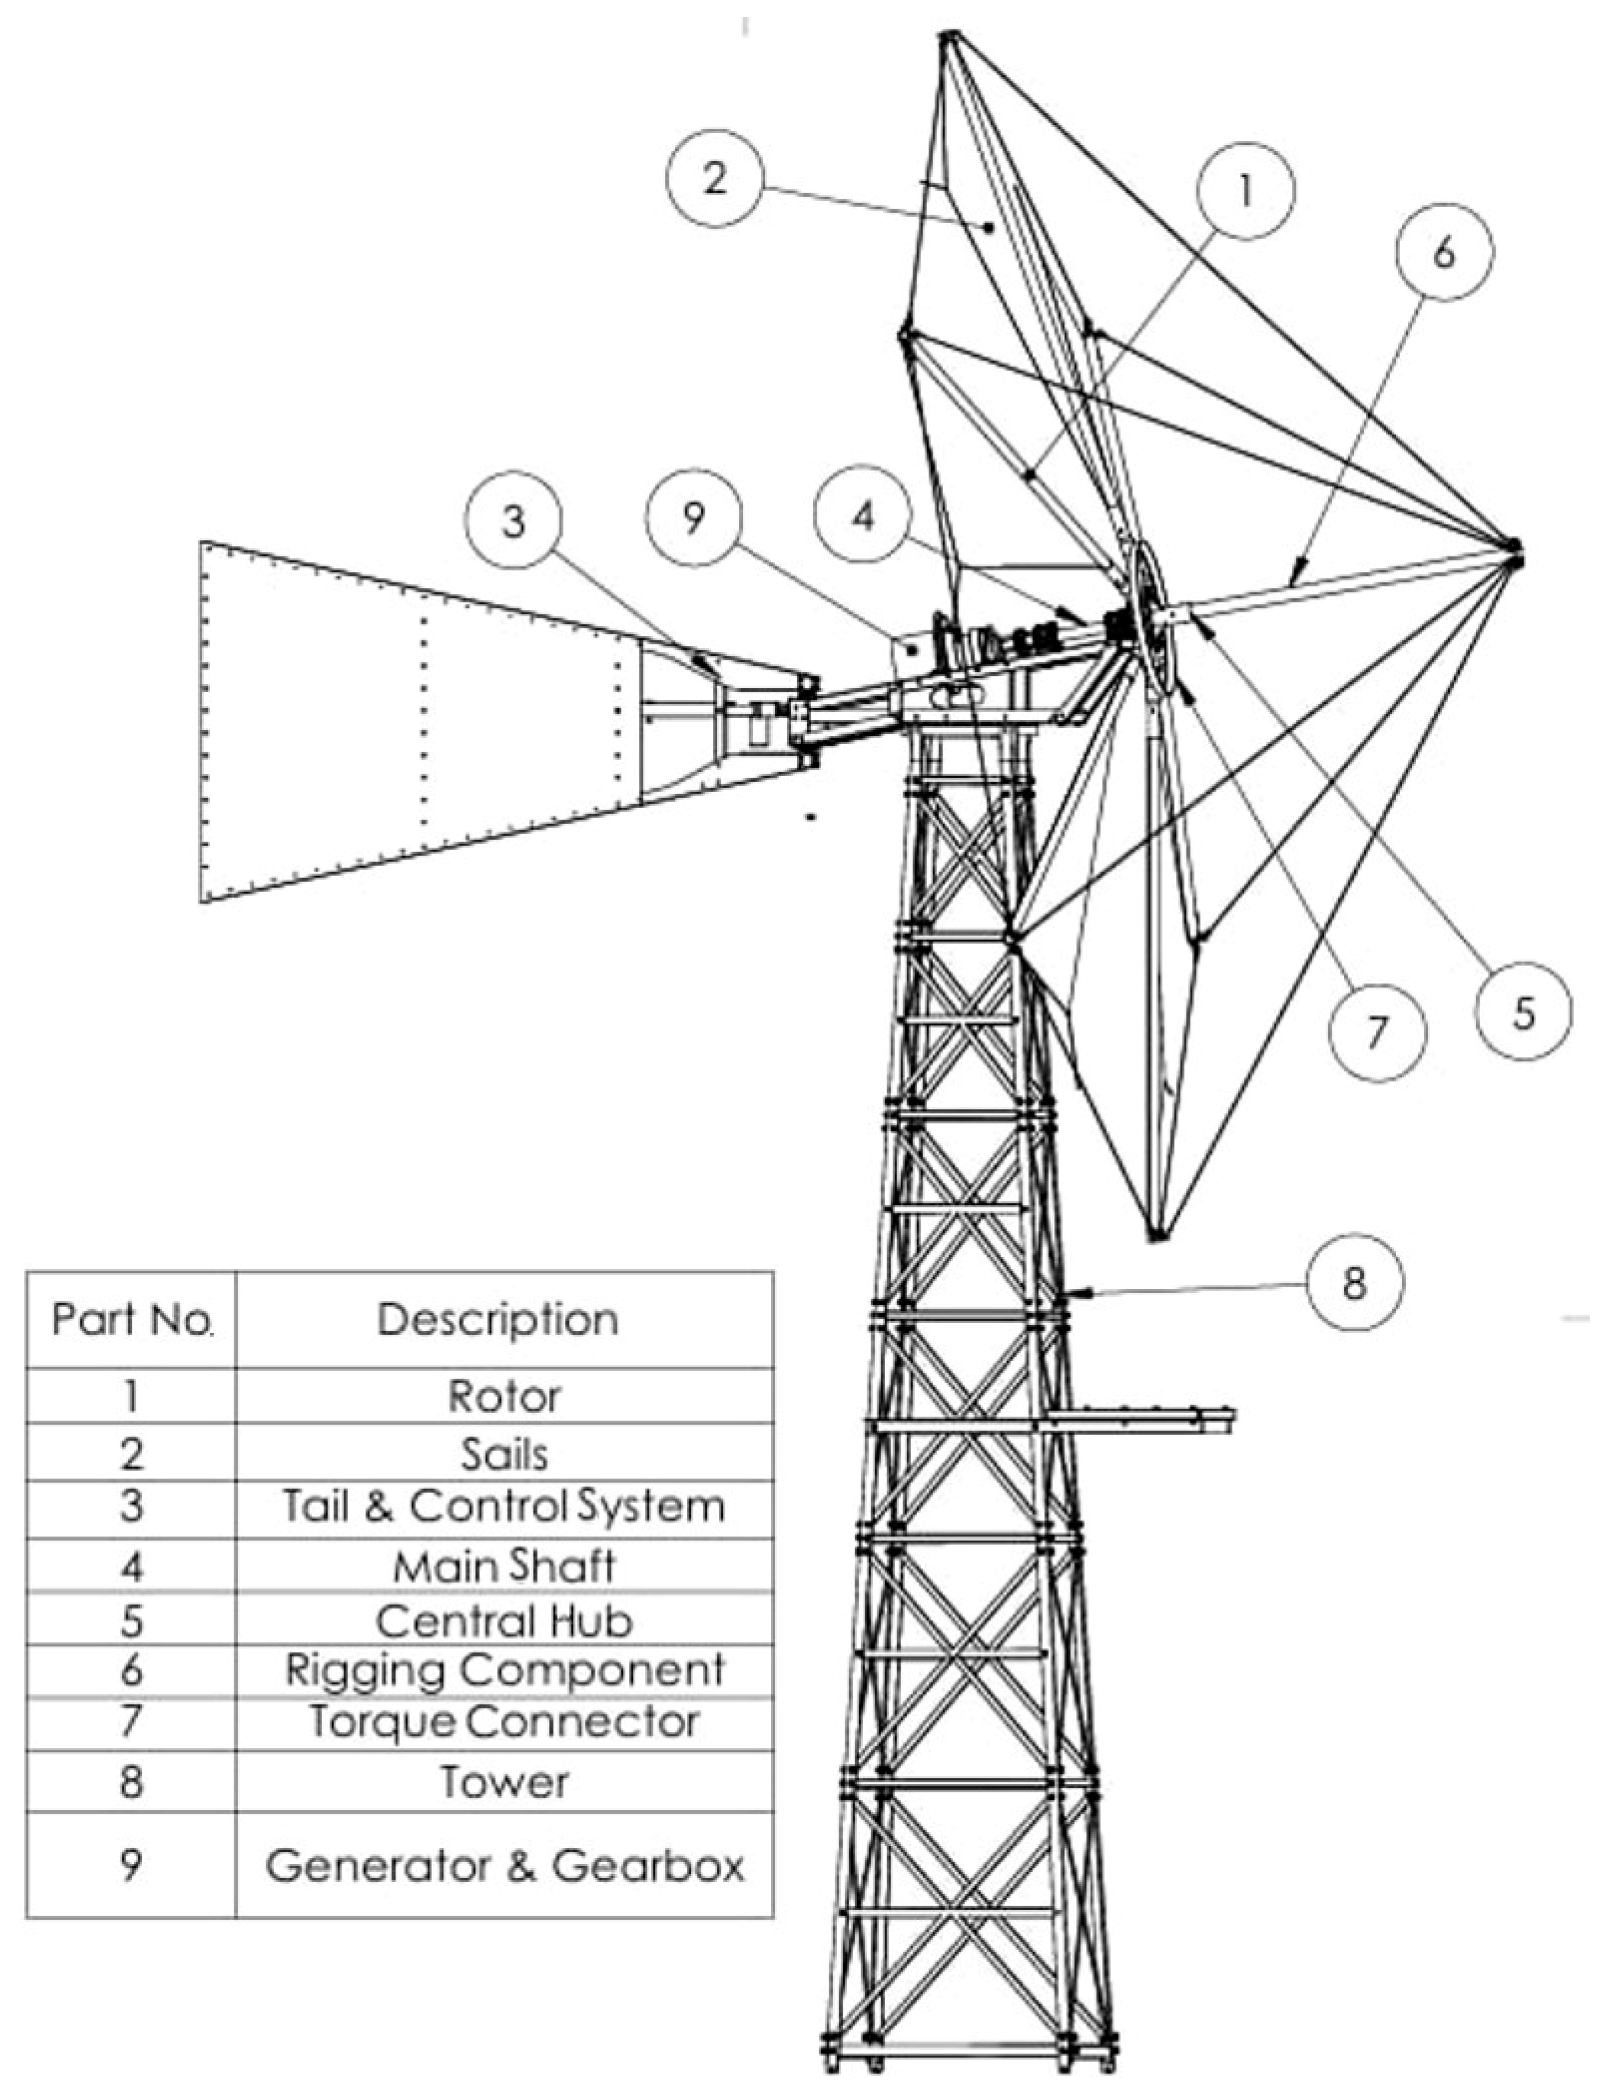
The gearbox–generator assembly is connected to the nacelle through two substructures: (a) specially designed steel mounting bases, and (b) the rotating shaft, which is linked to the rotor hub via a coupler system. The coupler is a type of mechanical connector capable of absorbing shock loads transmitted from the rotor to the gearbox and vice versa—an essential feature for protecting the gearbox gears from overloads. The generator is then electrically connected to an energy management system equipped with electronic monitoring of its rotational speed and, consequently, the speed of the rotor. Finally, the component known as the tail vane—or the windmill’s rudder—is mounted on two bushings with a 20 mm shaft attached to the nacelle (Figure 6). This allows it to rotate around the vertical axis at the mounting point. The rotation of the tail is controlled by an electromechanical linear actuator, anchored on one side to the nacelle and on the other to the tail, at a distance of 720 mm from the tail’s main pivot. This actuator is regulated by an electronic control system that adjusts its length and, consequently, the tail’s angle of rotation. As a result, an angle is created between the wind direction and the operating axis of the windmill, leading to a substantial reduction in the rotor’s power absorption. This mechanism prevents structural damage to the windmill under extreme wind conditions. The main geometric parameters and dimensions for the structural components of the windmill are summarized in Table 3 and shown in Figure 8.

2.5. Protection Systems for Extreme Wind Conditions

Due to the particular wind characteristics of the Lasithi Plateau, the windmill must be designed to withstand extreme conditions. The main mechanisms used to limit the rotational speed of the sail rotor under high-wind events are:
(a)
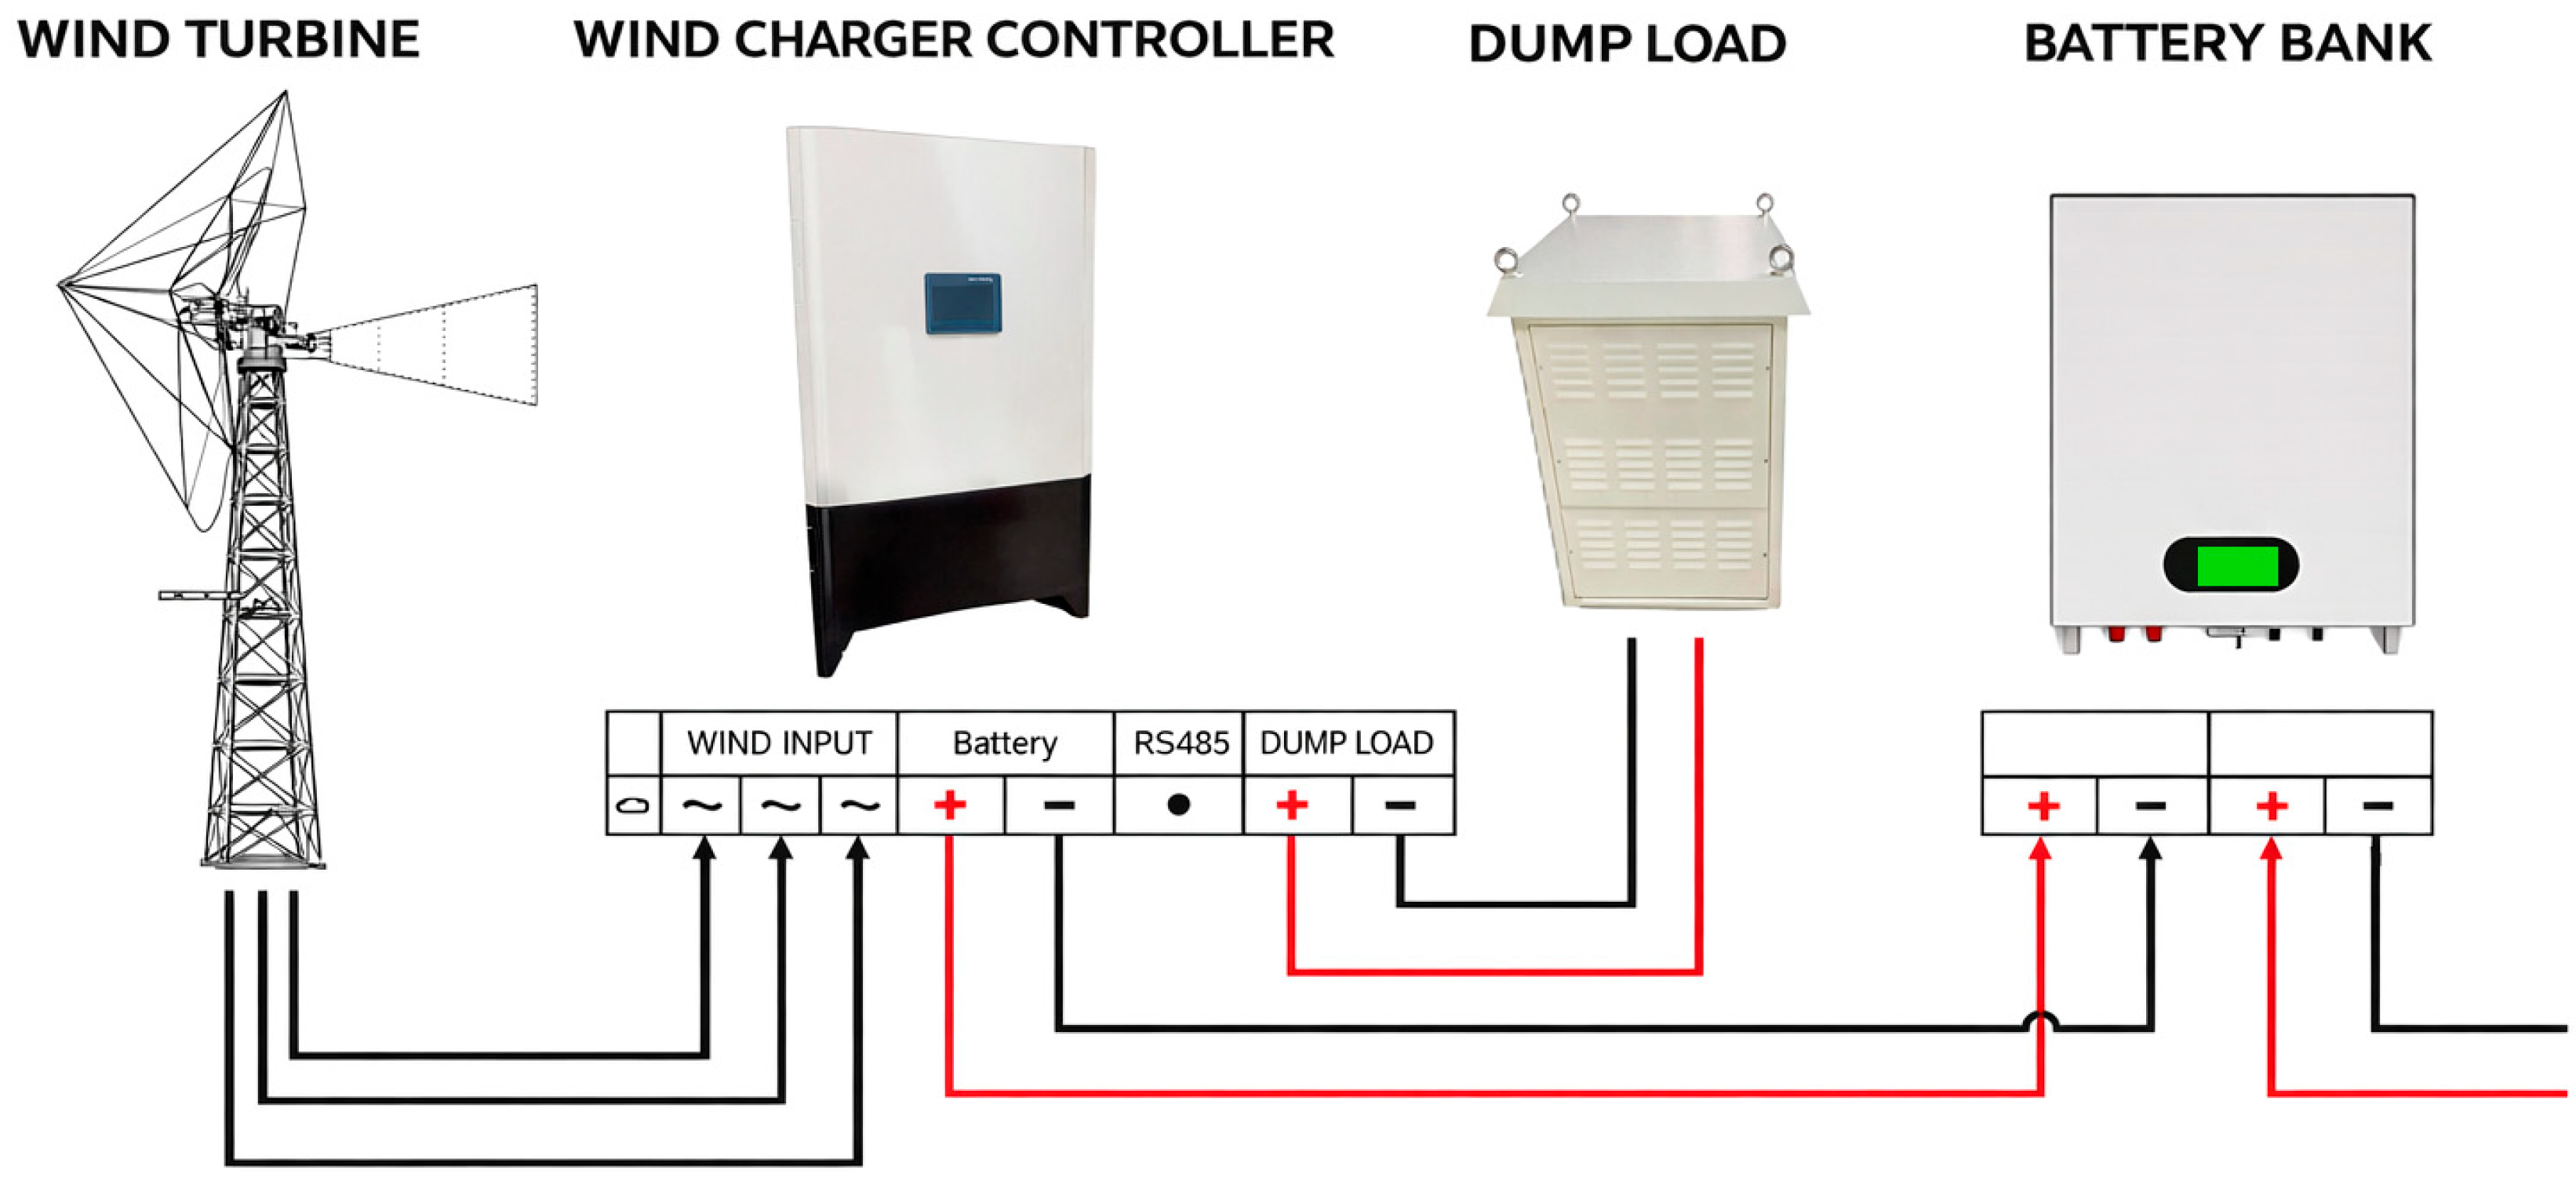
Use of a generator rated at 2.5 times the nominal torque: When the rotor speed exceeds the safe operating limit, the power electronics connected to the generator activate an energy-dissipation resistor (dump load) to brake the rotor (Figure 9). More specifically, while the system can normally absorb up to 2–2.5 kW of power at a certain rotor speed, under safety mode the dump load attempts to absorb 2–2.5 times more power (approximately 5 kW). This increased electrical load results in a deceleration of the rotor.
(b)
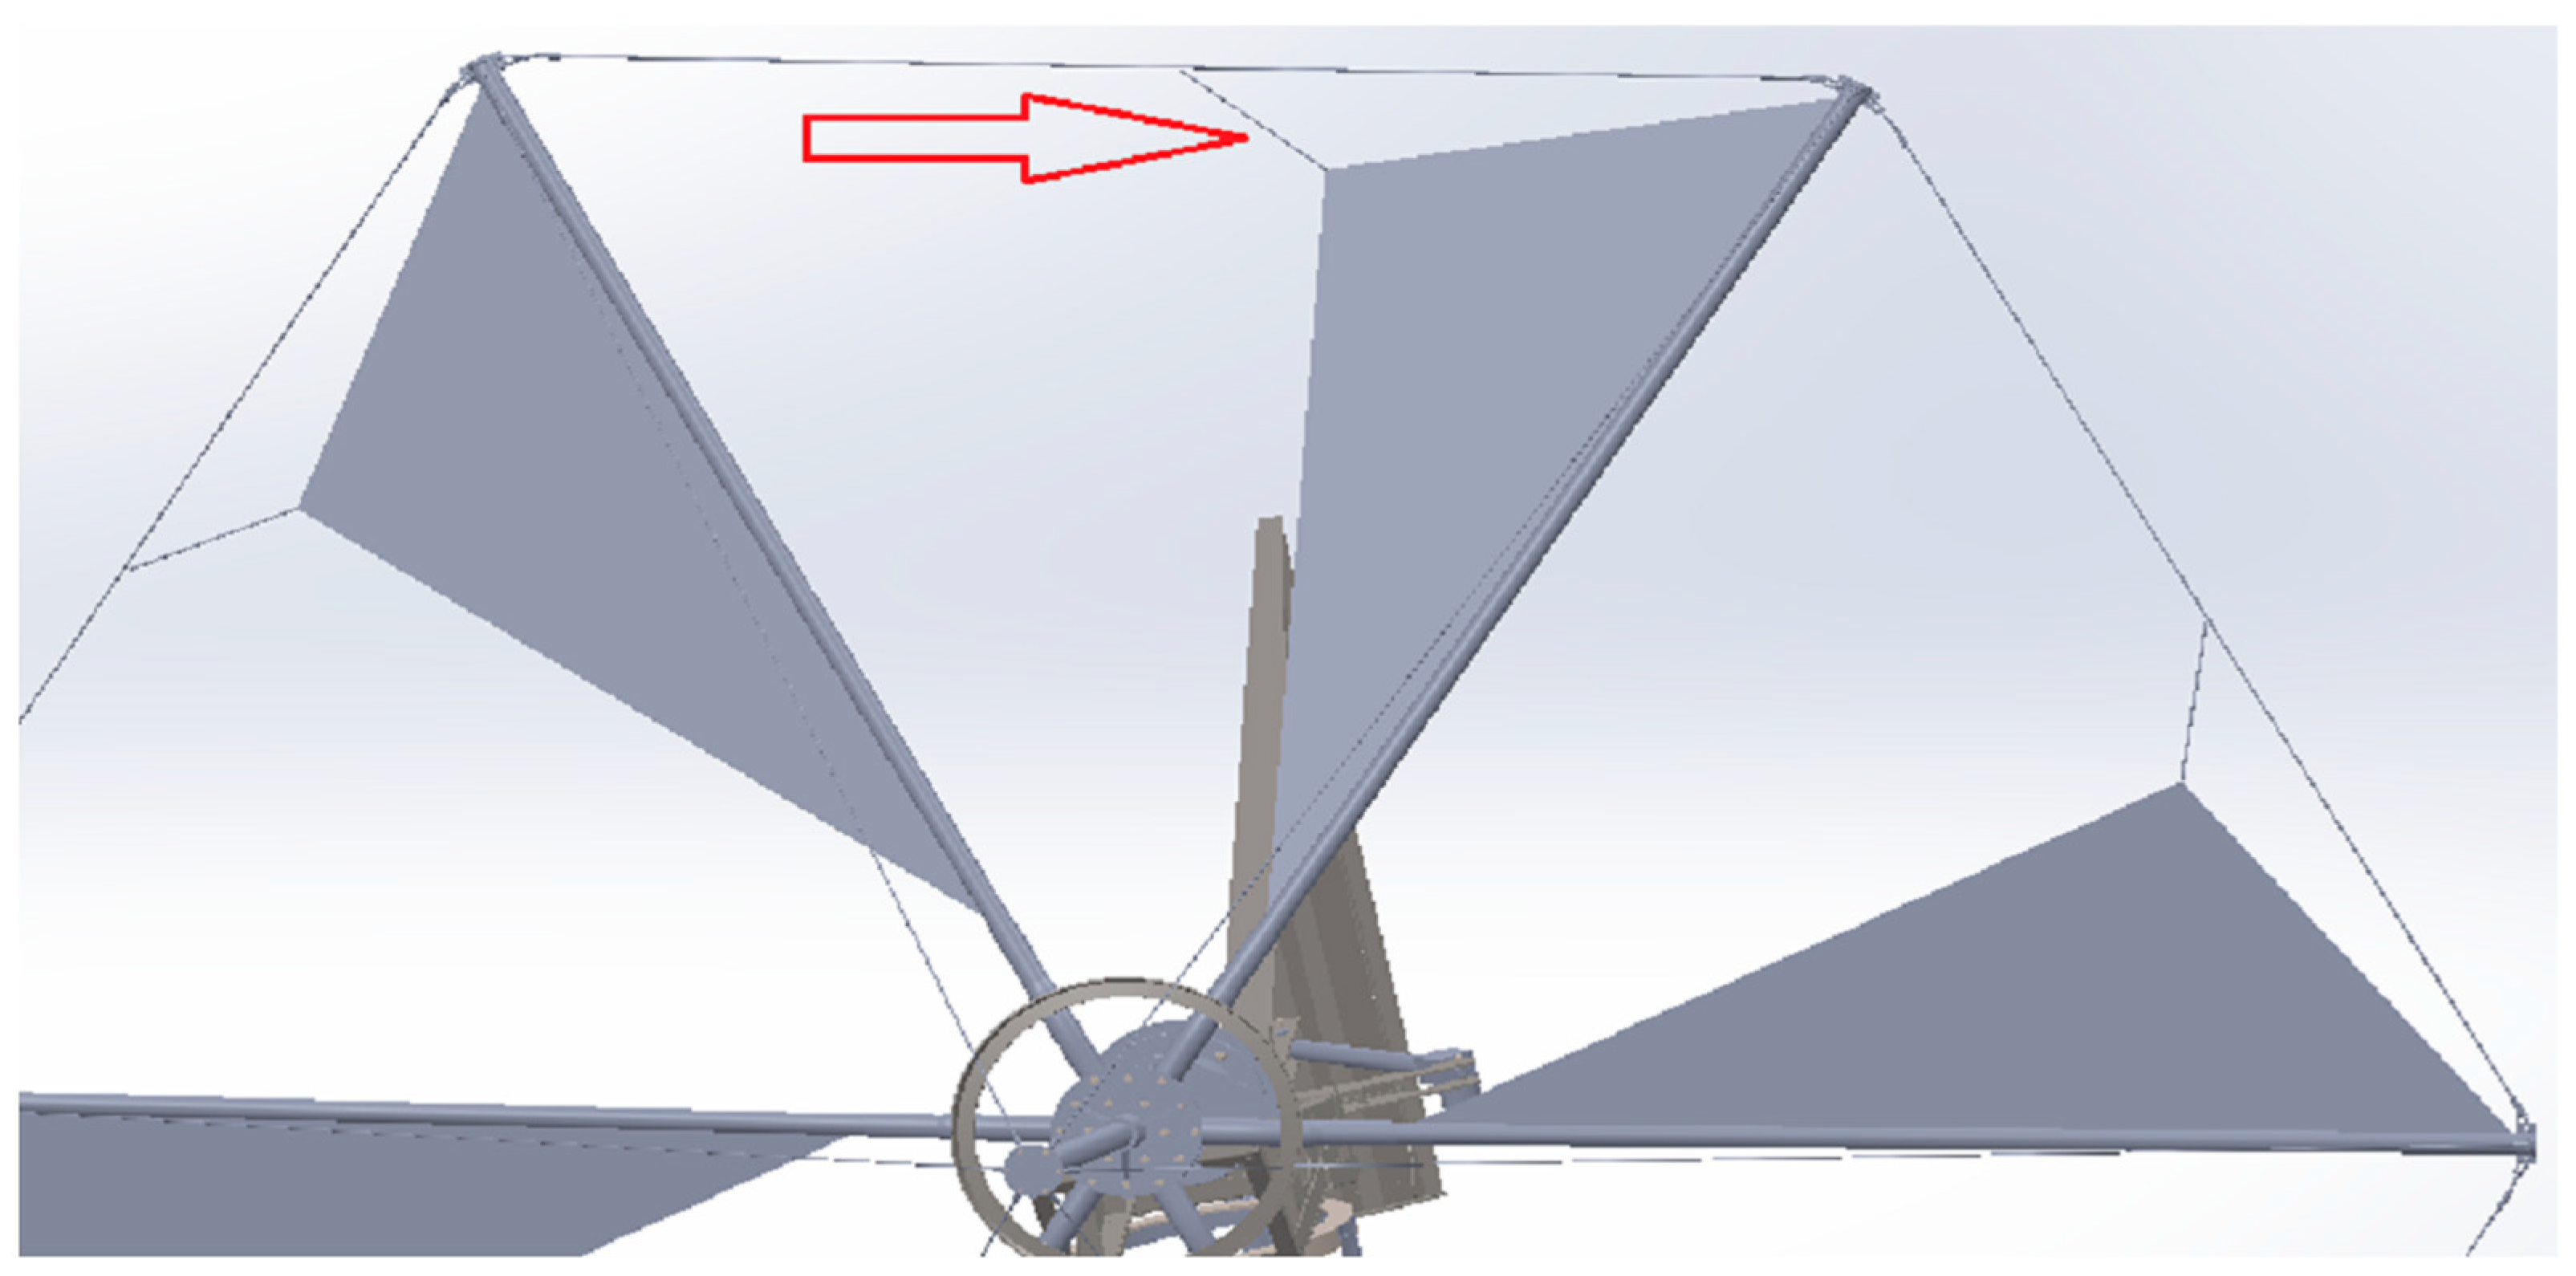
Use of elastic ropes for sail fastening: Elastic ropes are employed to secure the sails so that their length increases under high wind loads due to the elevated aerodynamic forces acting on them (Figure 10). This extension leads to a reduction in the power coefficient (Cp) of the sails, thereby decreasing the amount of energy extracted from the wind. As a result, the forces acting on the sails—and subsequently on the entire windmill—are significantly reduced, which is crucial for ensuring structural integrity under extreme wind speeds.
(c)
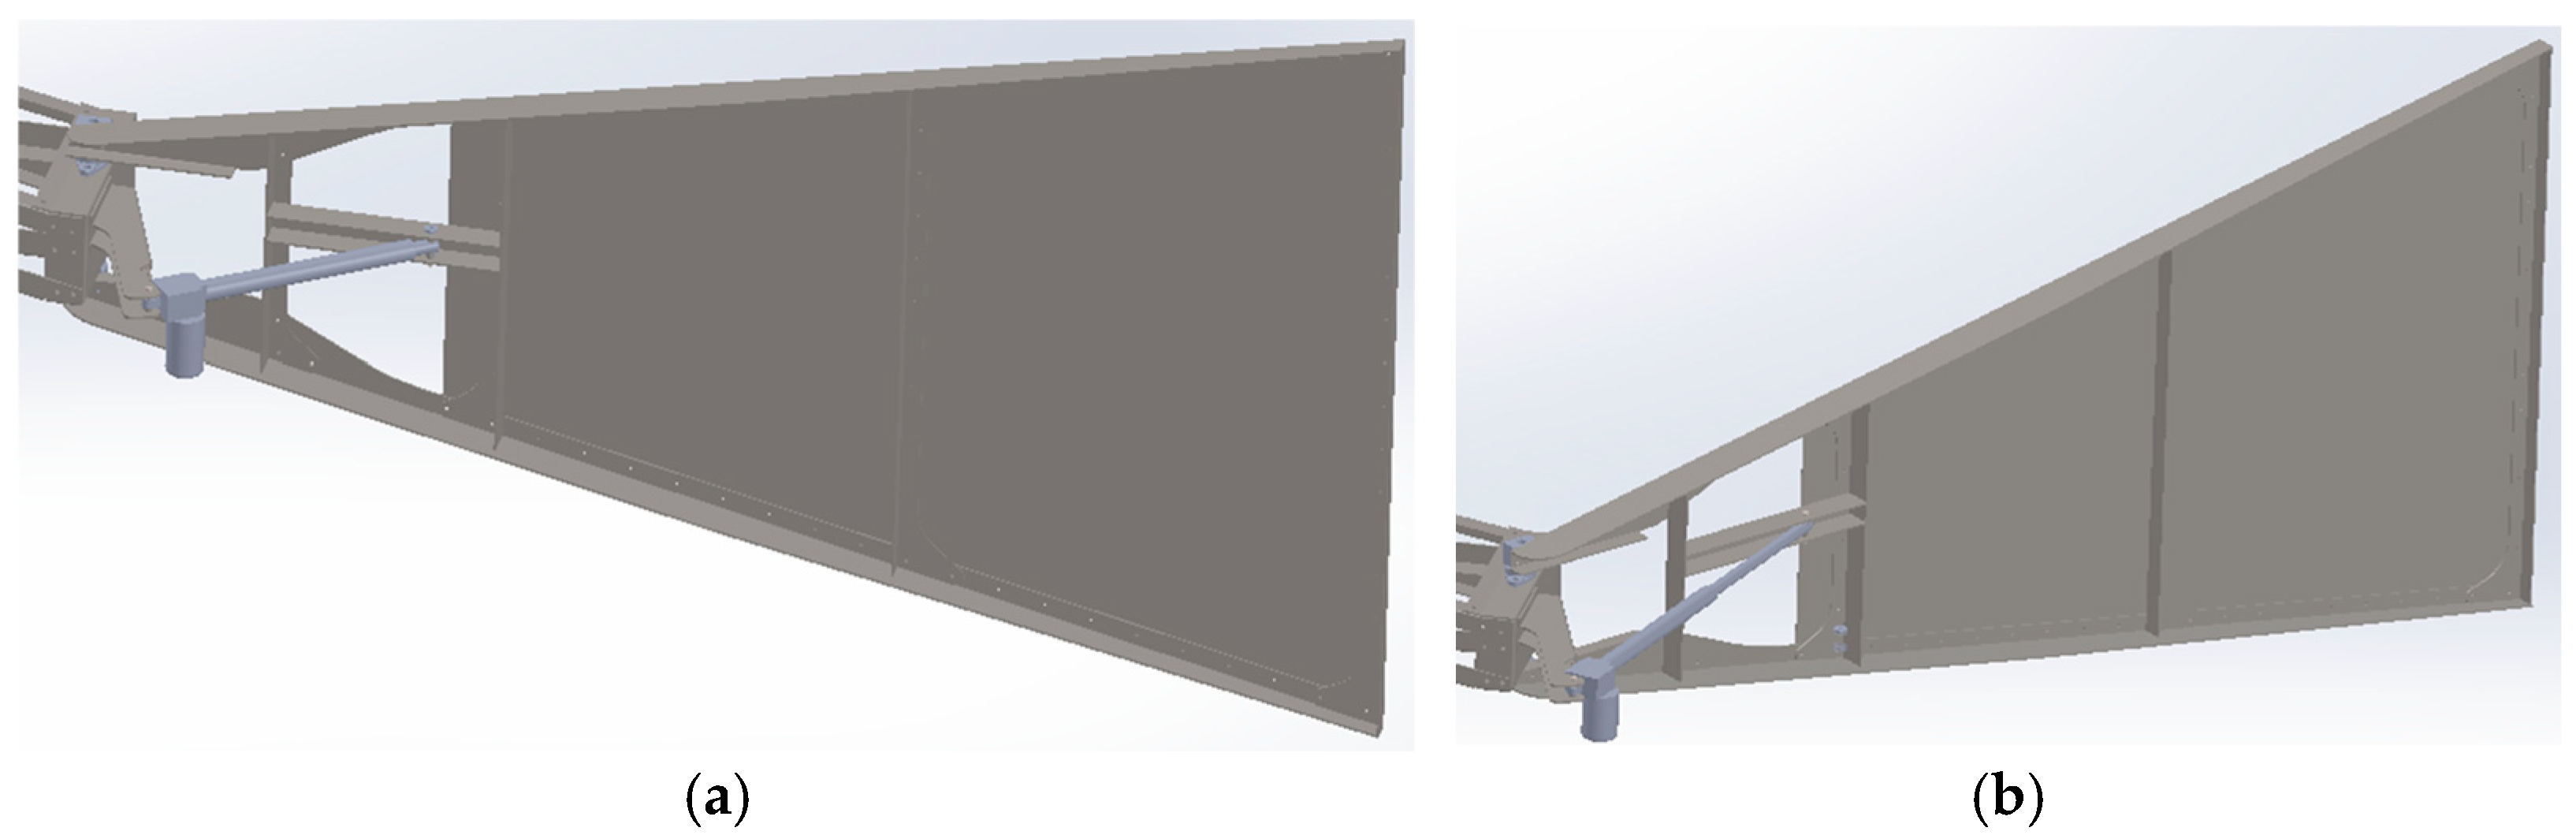
Control of the tail vane rotation angle: The tail vane is appropriately articulated and equipped with an electromechanical linear actuator system that enables controlled rotation relative to the nacelle (Figure 11). By adjusting the tail angle, the rotor is intentionally misaligned with the wind direction. This misalignment results in a substantial reduction in the resultant force on the power shaft, both due to the decrease in effective wind speed acting on it and the considerable change in the power coefficient (Cp).

2.6. Energy Production and Distribution

According to the current Hellenic legislation, windmills, as well as most traditional types of wind turbines or wind machines, that are not certified by a recognized certification body are not permitted to connect to the electricity power grid. Windmills can be utilized in remote areas, with no or limited power grid access.
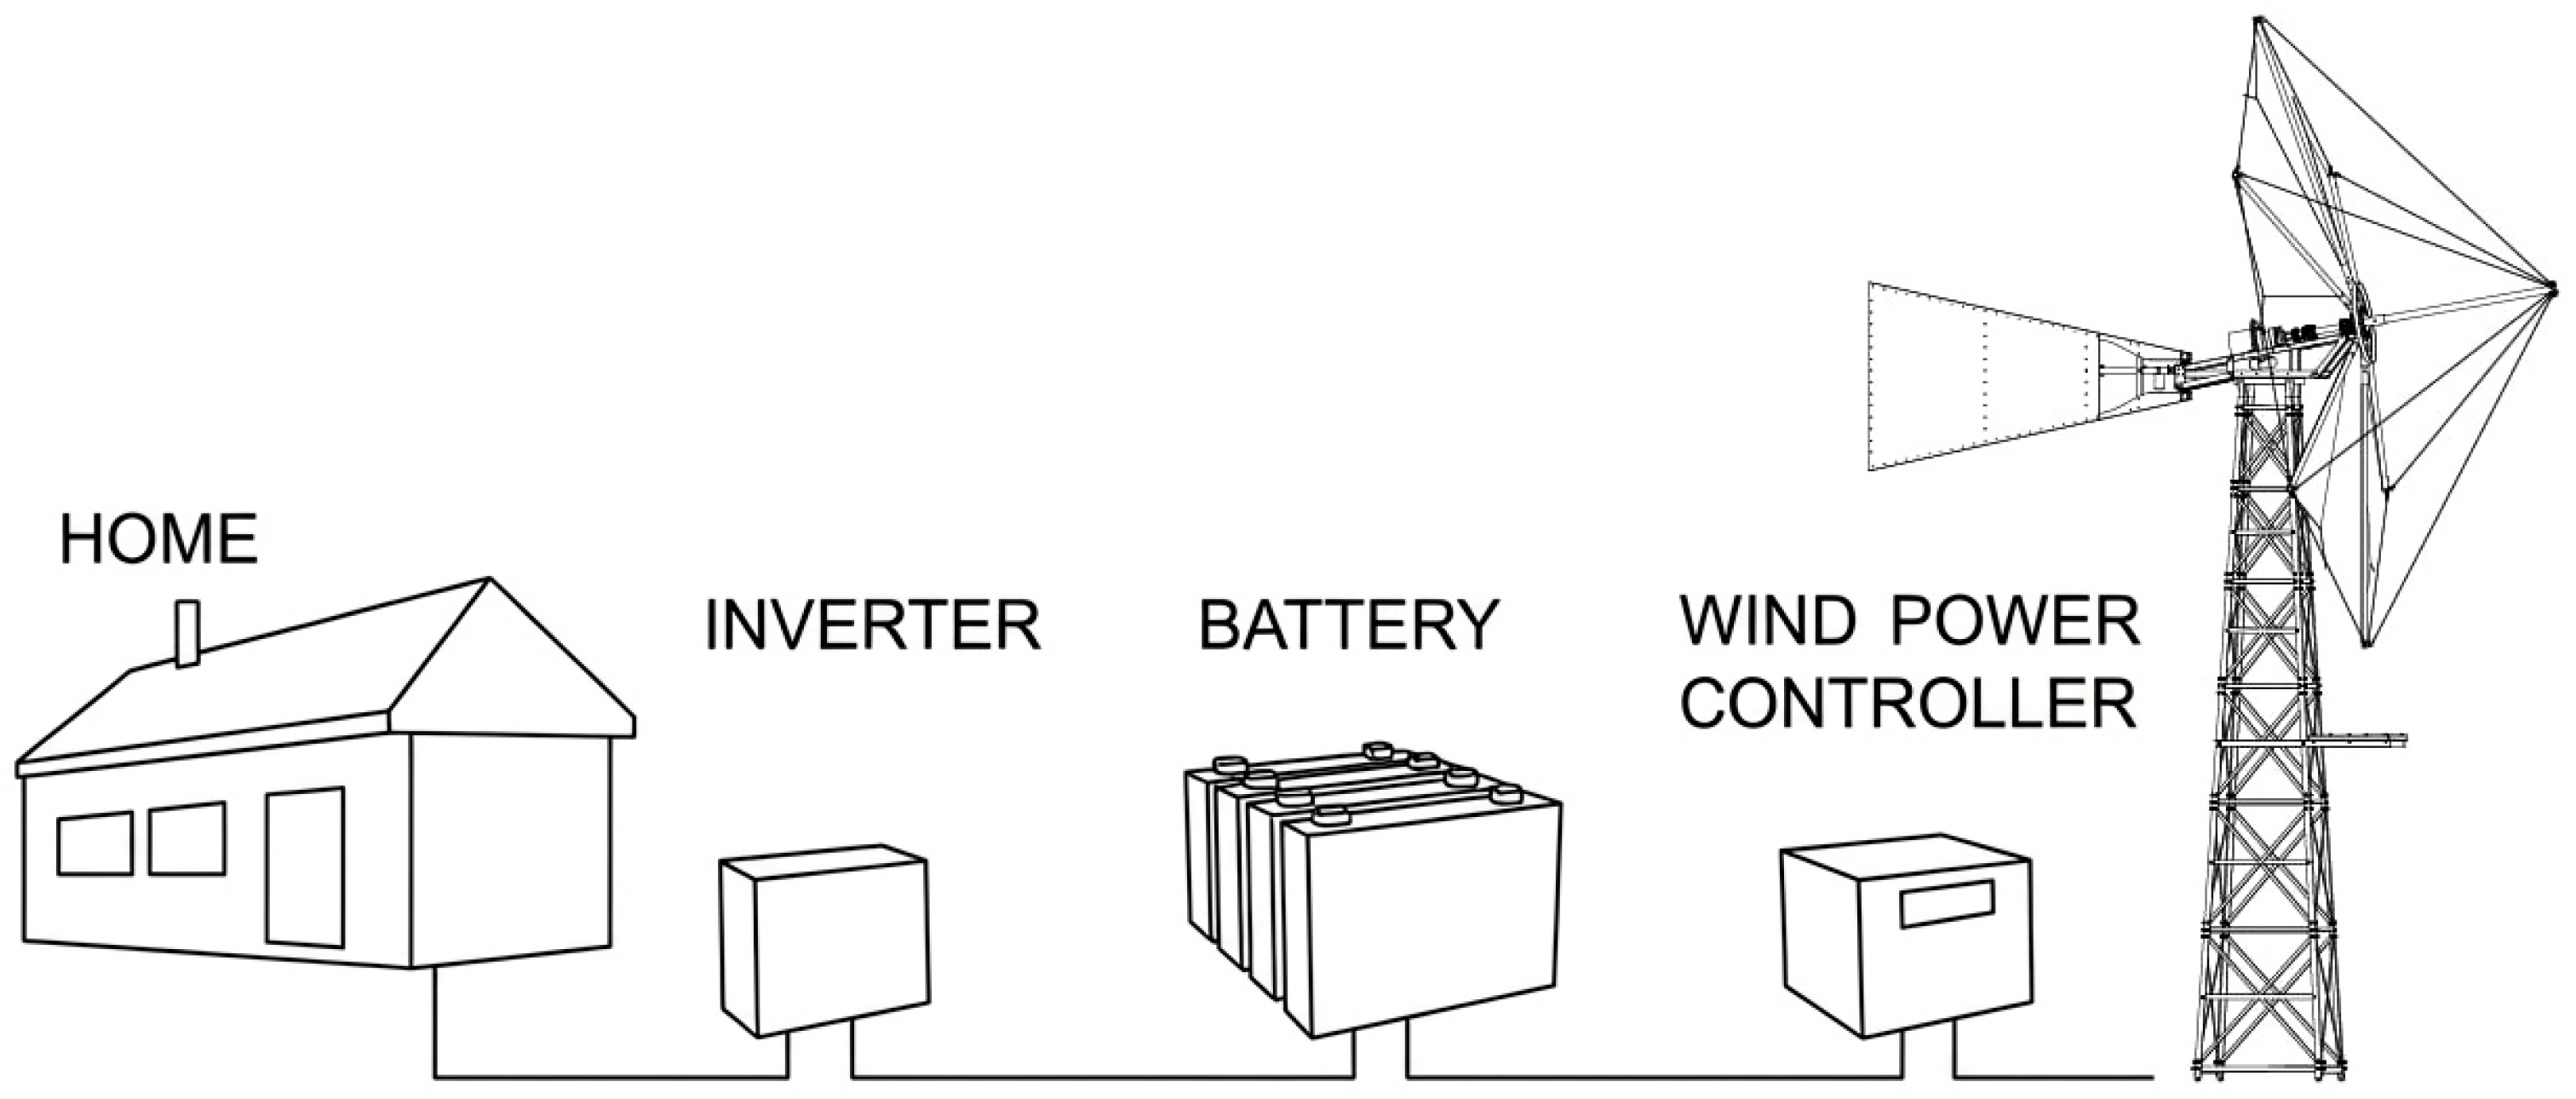
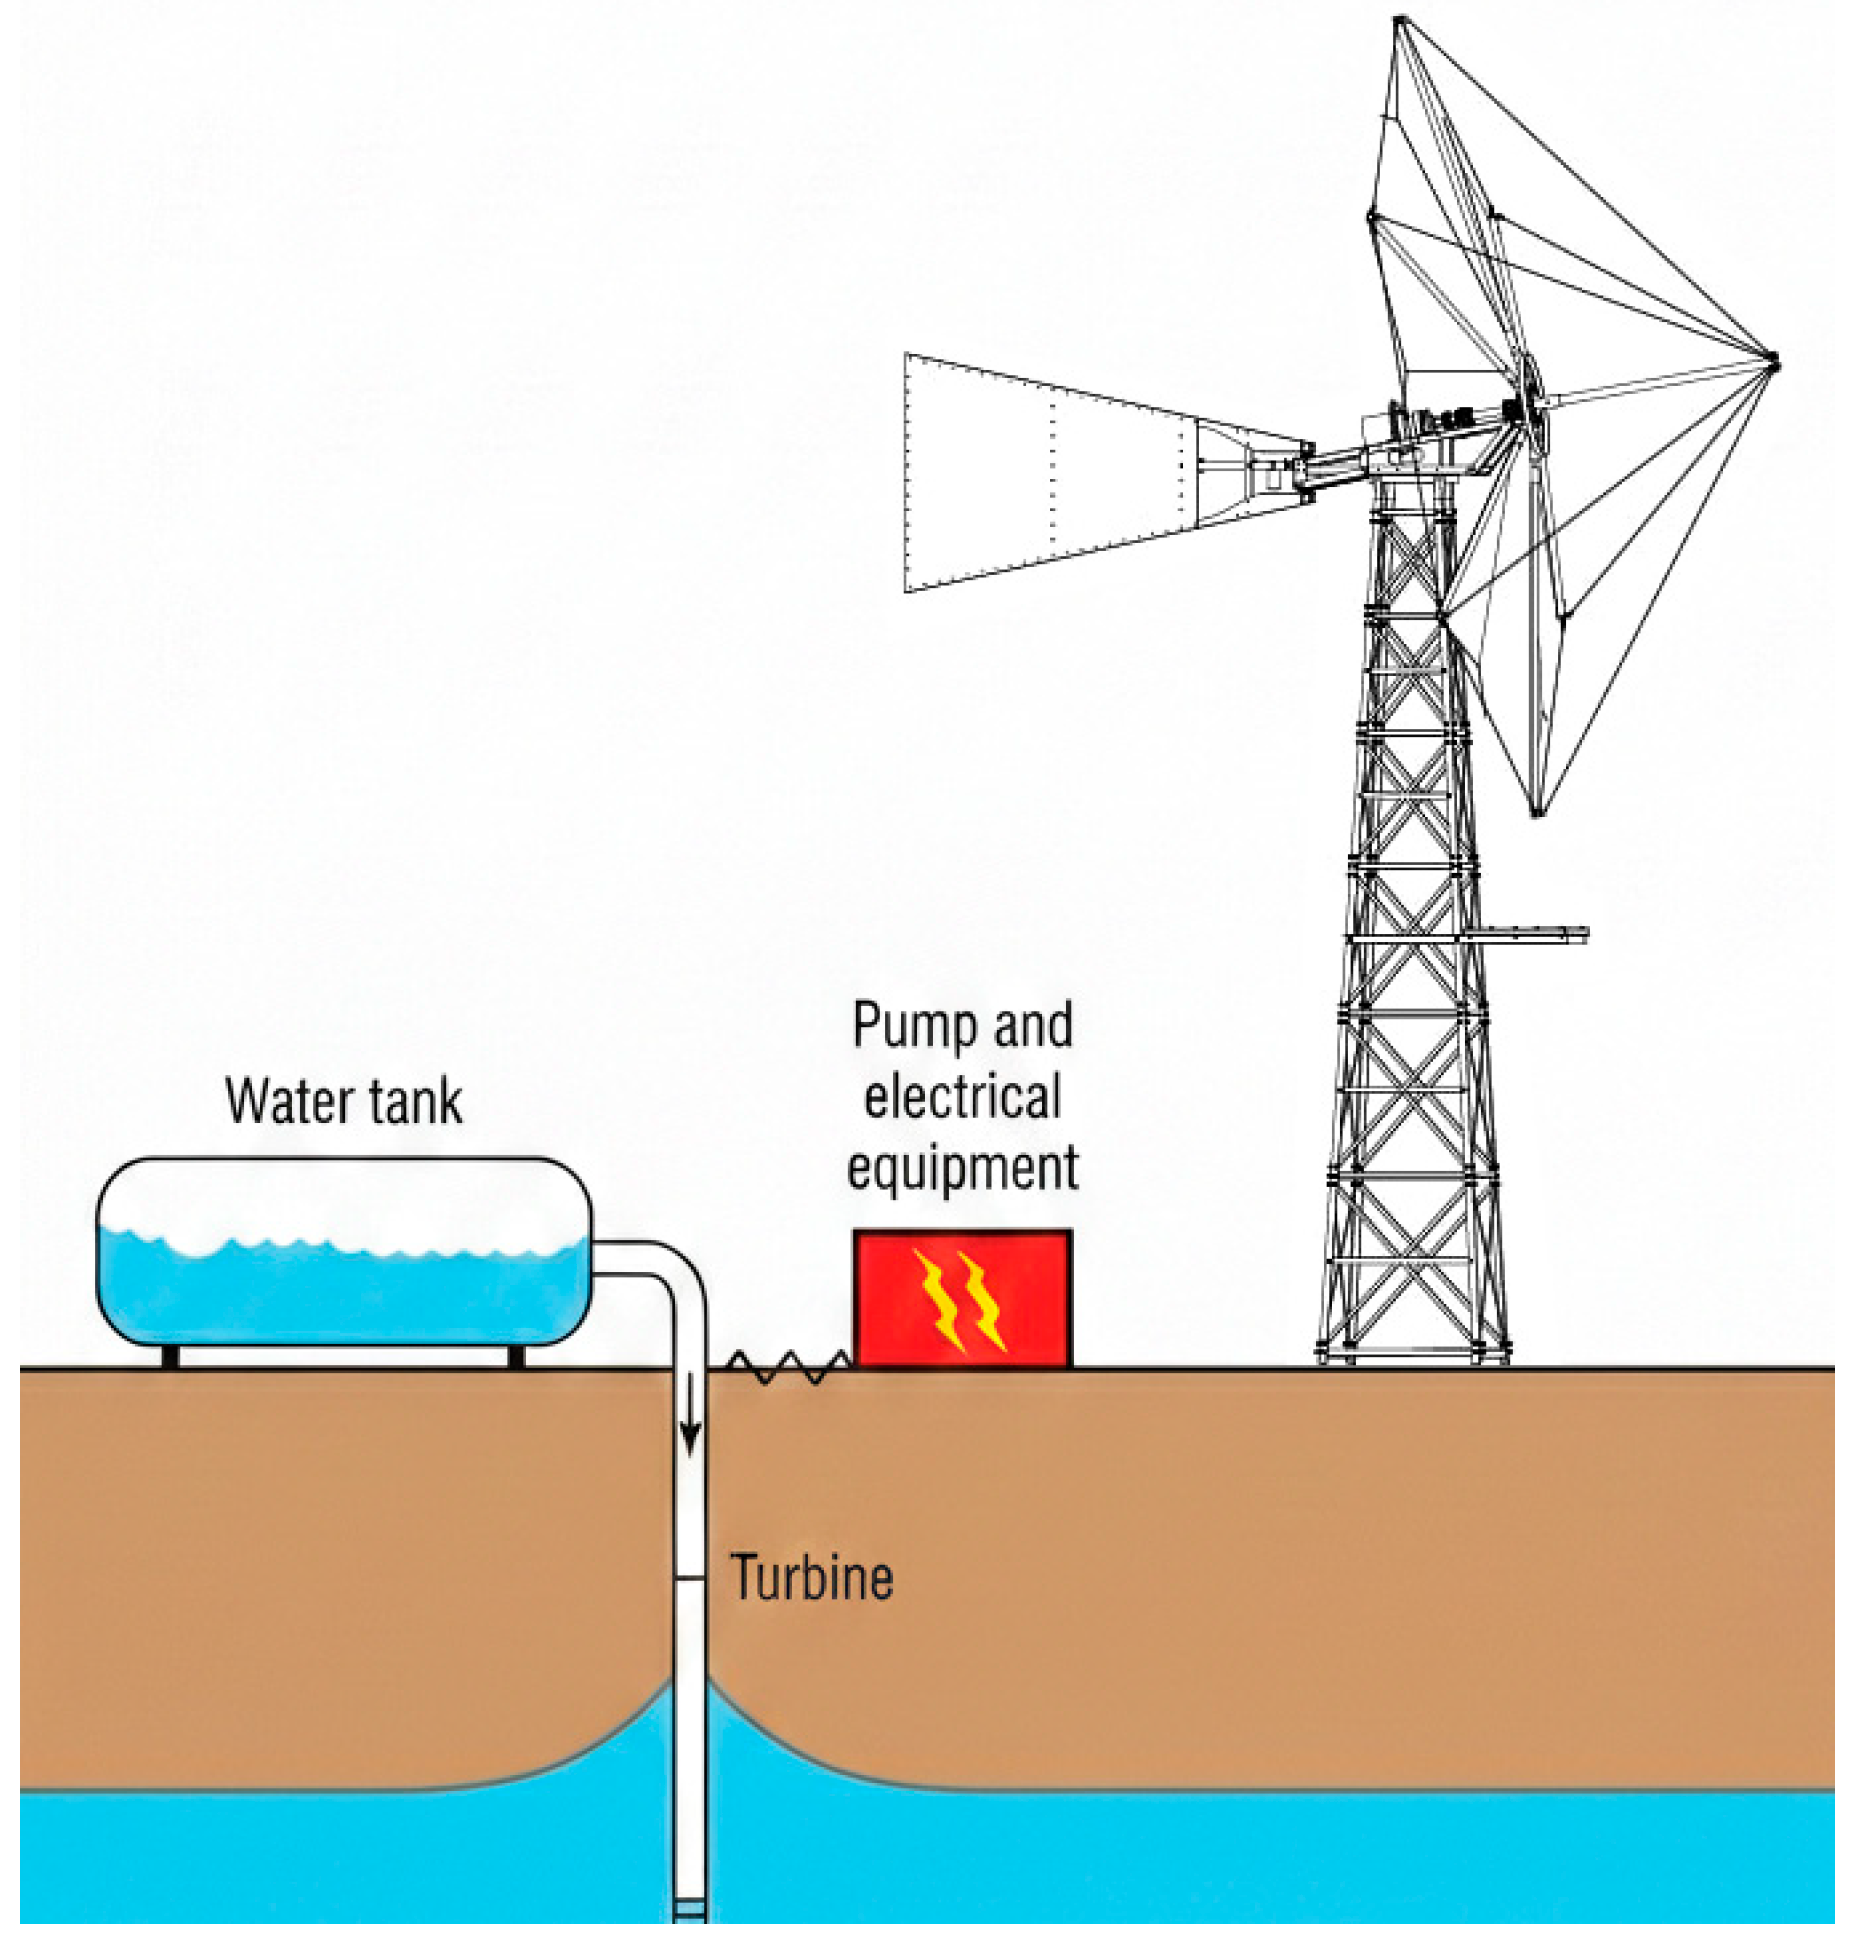
Therefore, the generated energy must be stored in batteries and then used for the benefit of local residents. This solution allows for the energy to be used directly at a local level, without connection to the grid. A 5 kWh battery will be integrated with each windmill to support community needs. The energy storage can be used for heating water or other thermal applications through heating elements, avoiding the need for grid integration. Another approach would be for the windmills to be integrated into a hybrid system, which includes batteries and other energy sources, such as solar panels (Figure 12). These systems allow energy to be utilized locally with greater reliability, even when weather conditions are not favorable. Use of the proposed windmills’ energy in pumping stations is an interesting and sustainable approach. It can be utilized to generate electricity, which can then power pumps for various applications, such as irrigation, drainage, or supplying water to remote areas (Figure 13).

3. Results and Discussion

3.1. Wind Resource Assessment

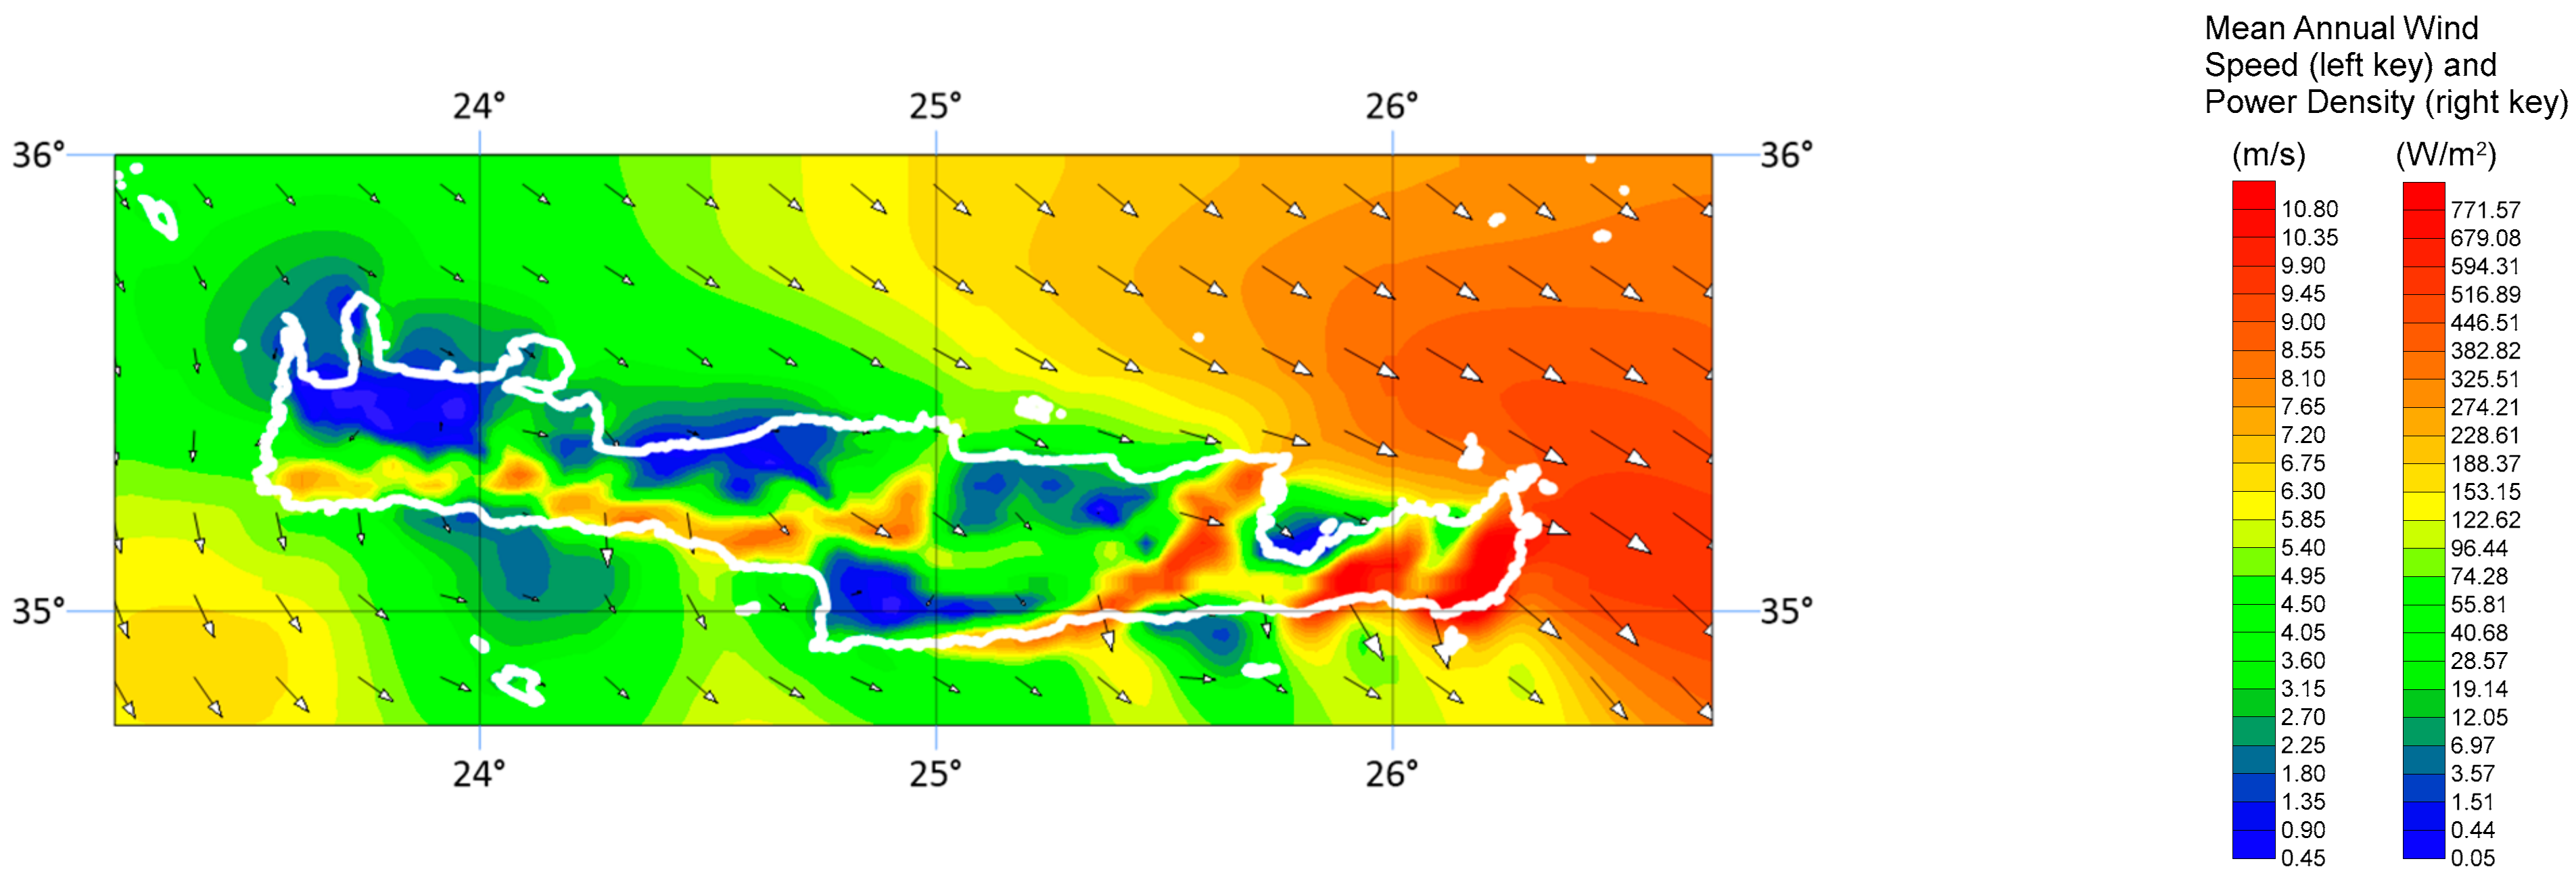
Figure 14 presents the mean annual 10 m wind speed distribution over the Lasithi Plateau based on 40-year downscaled data. The model captures enhanced winter flow along the northeast–southwest axis, with average speeds of 6–7 m/s at exposed ridges and 4–5 m/s within the basin. Summer wind fields are dominated by northerly Etesian winds, channeled through the Dikti passes, showing strong diurnal variability and local acceleration effects.
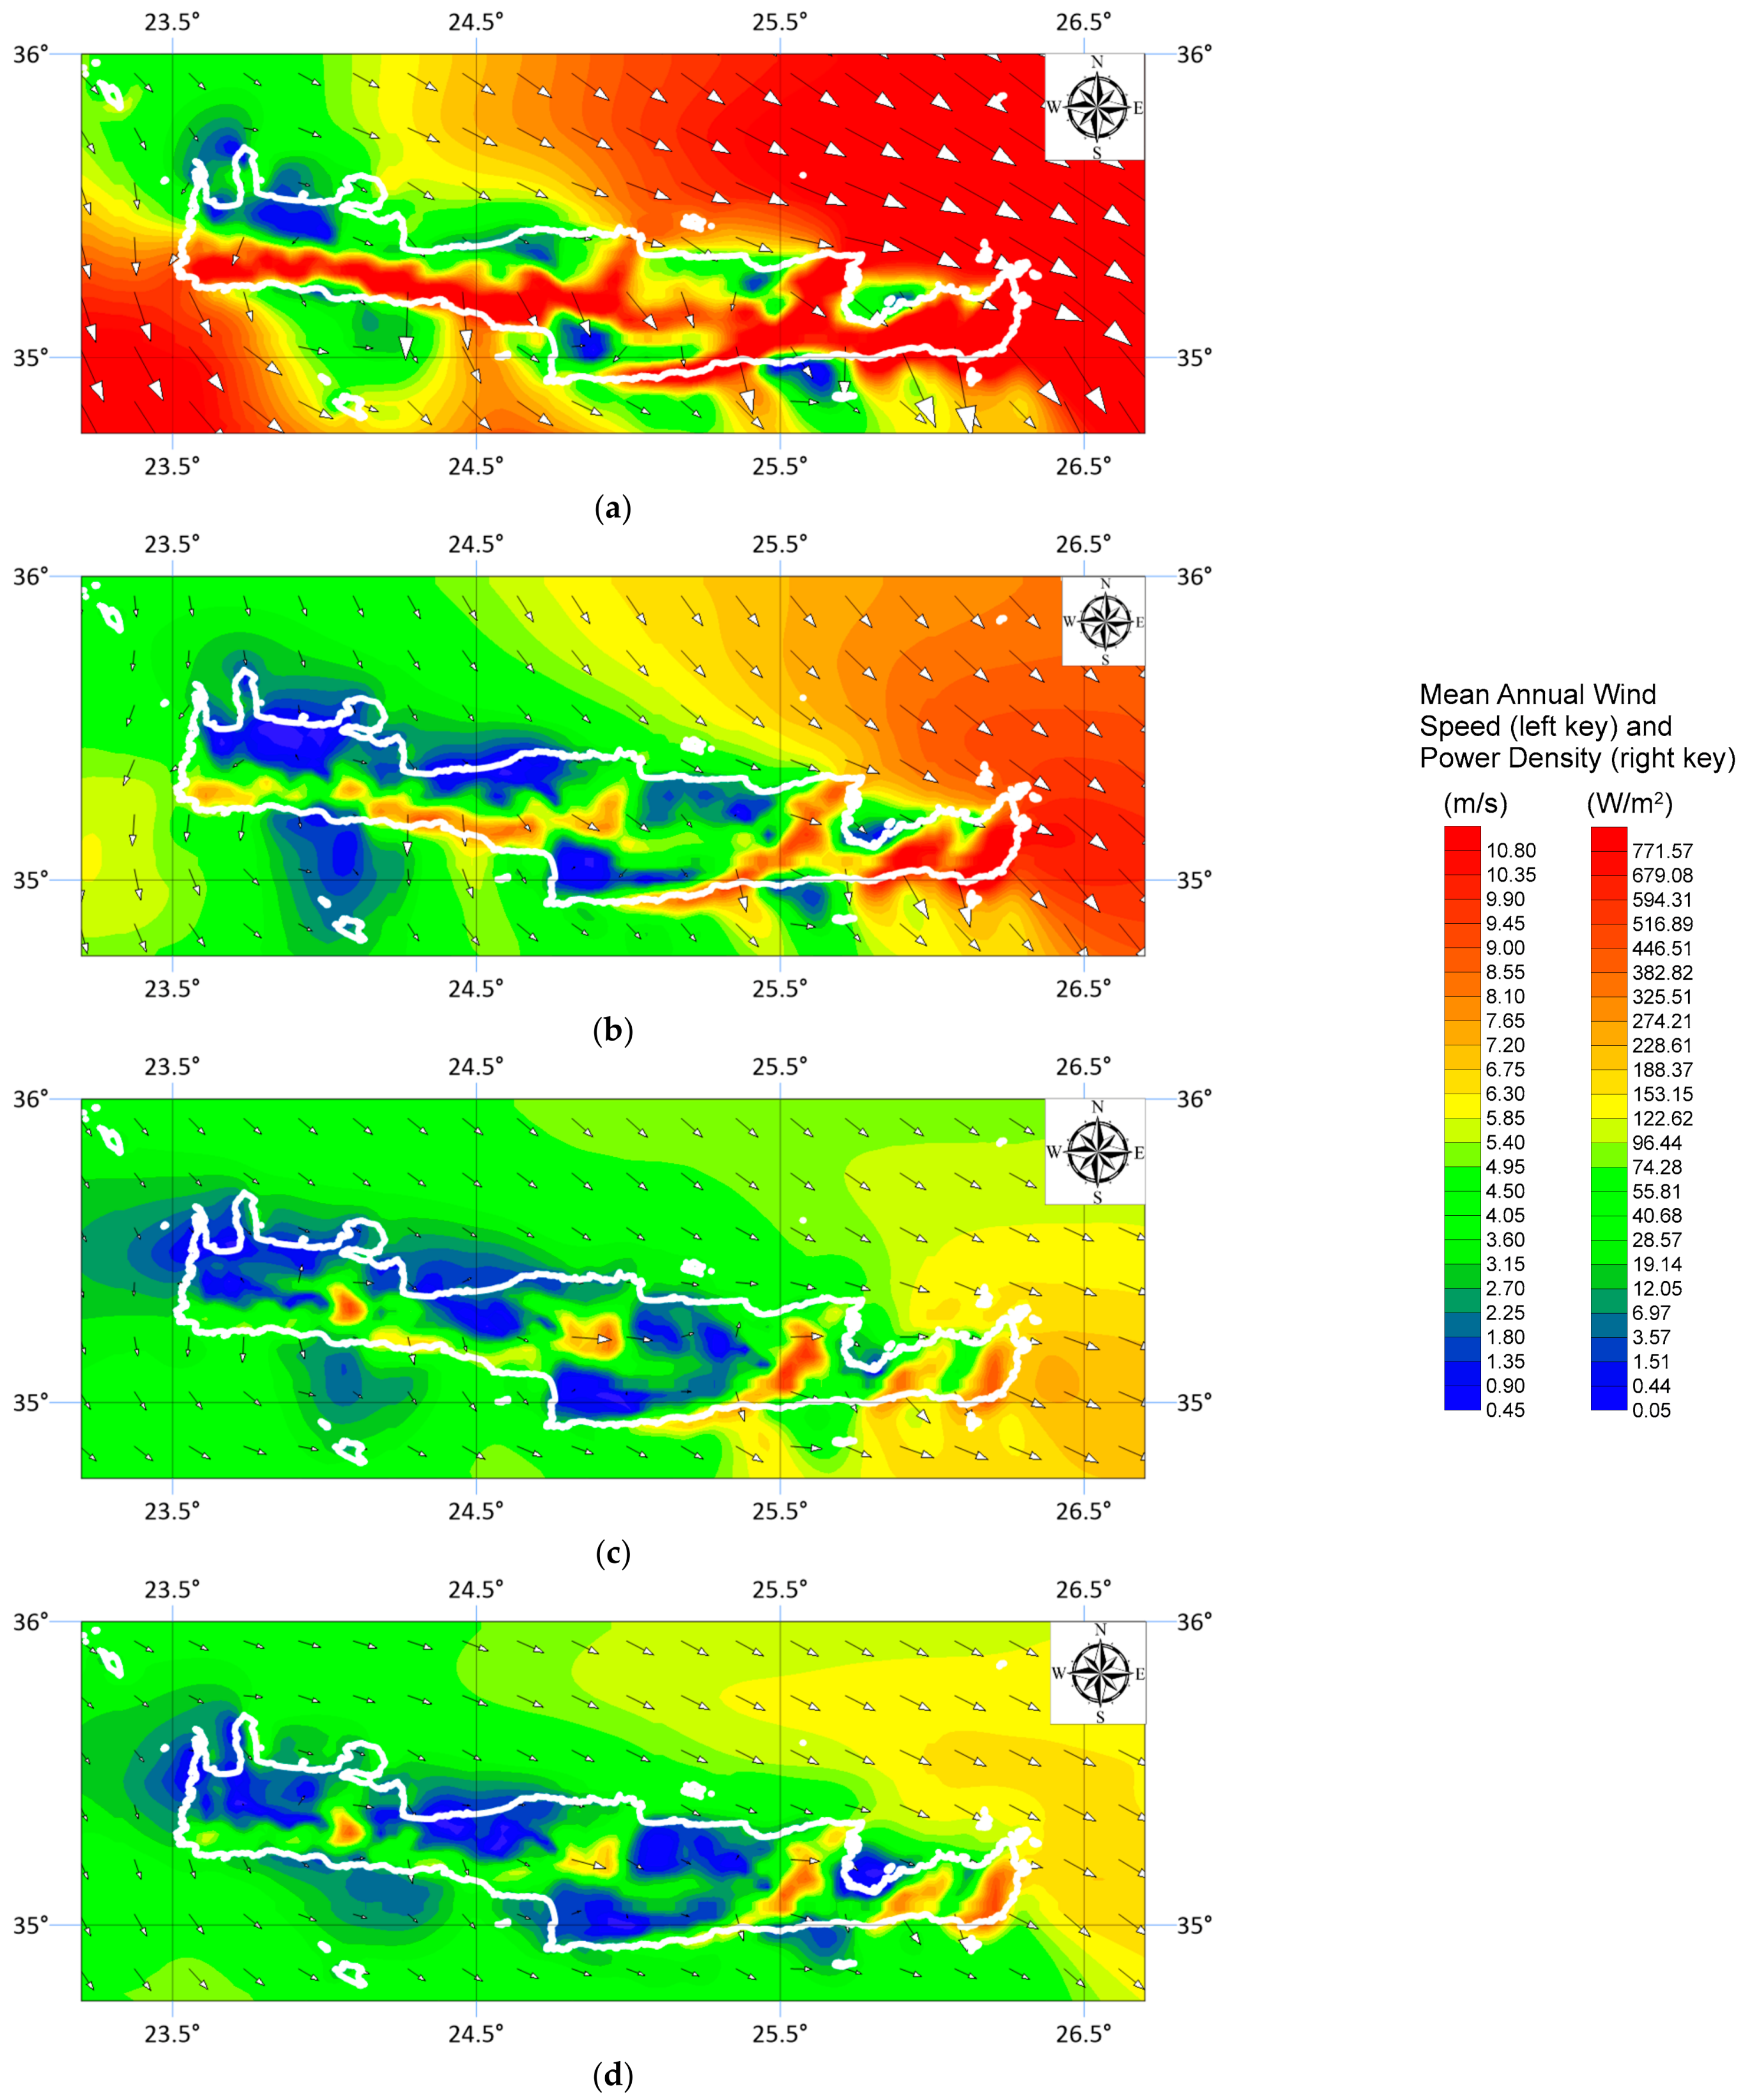
The use of grid-nudging improved the phase alignment of daily wind cycles and reduced timing errors noted in coarse reanalysis. Figure 15a–d summarize seasonal patterns, showing winter peaks and a pronounced summer Etesian regime, consistent with prior observational studies [33,34]. The downscaled results indicate that despite the plateau’s partial enclosure, wind energy potential remains significant, particularly along western ridges where speeds exceed 7 m/s annually, making the area suitable for small-to-medium wind turbine installations. These findings demonstrate the importance of high-resolution dynamical downscaling for accurately resolving complex orographic effects in mountainous basins such as Lasithi.
To enhance the reproducibility of the wind resource assessment methodology, a summary of statistical validation metrics derived from previous studies [10,11] is provided in Table 4. These metrics validate the performance of the WRF dynamic downscaling configuration (identical to the one used in this study) against in situ measurements from meteorological stations in the region. The metrics display high reliability with low bias, validating the model’s performance in the central part of eastern Crete where the plateau is located.
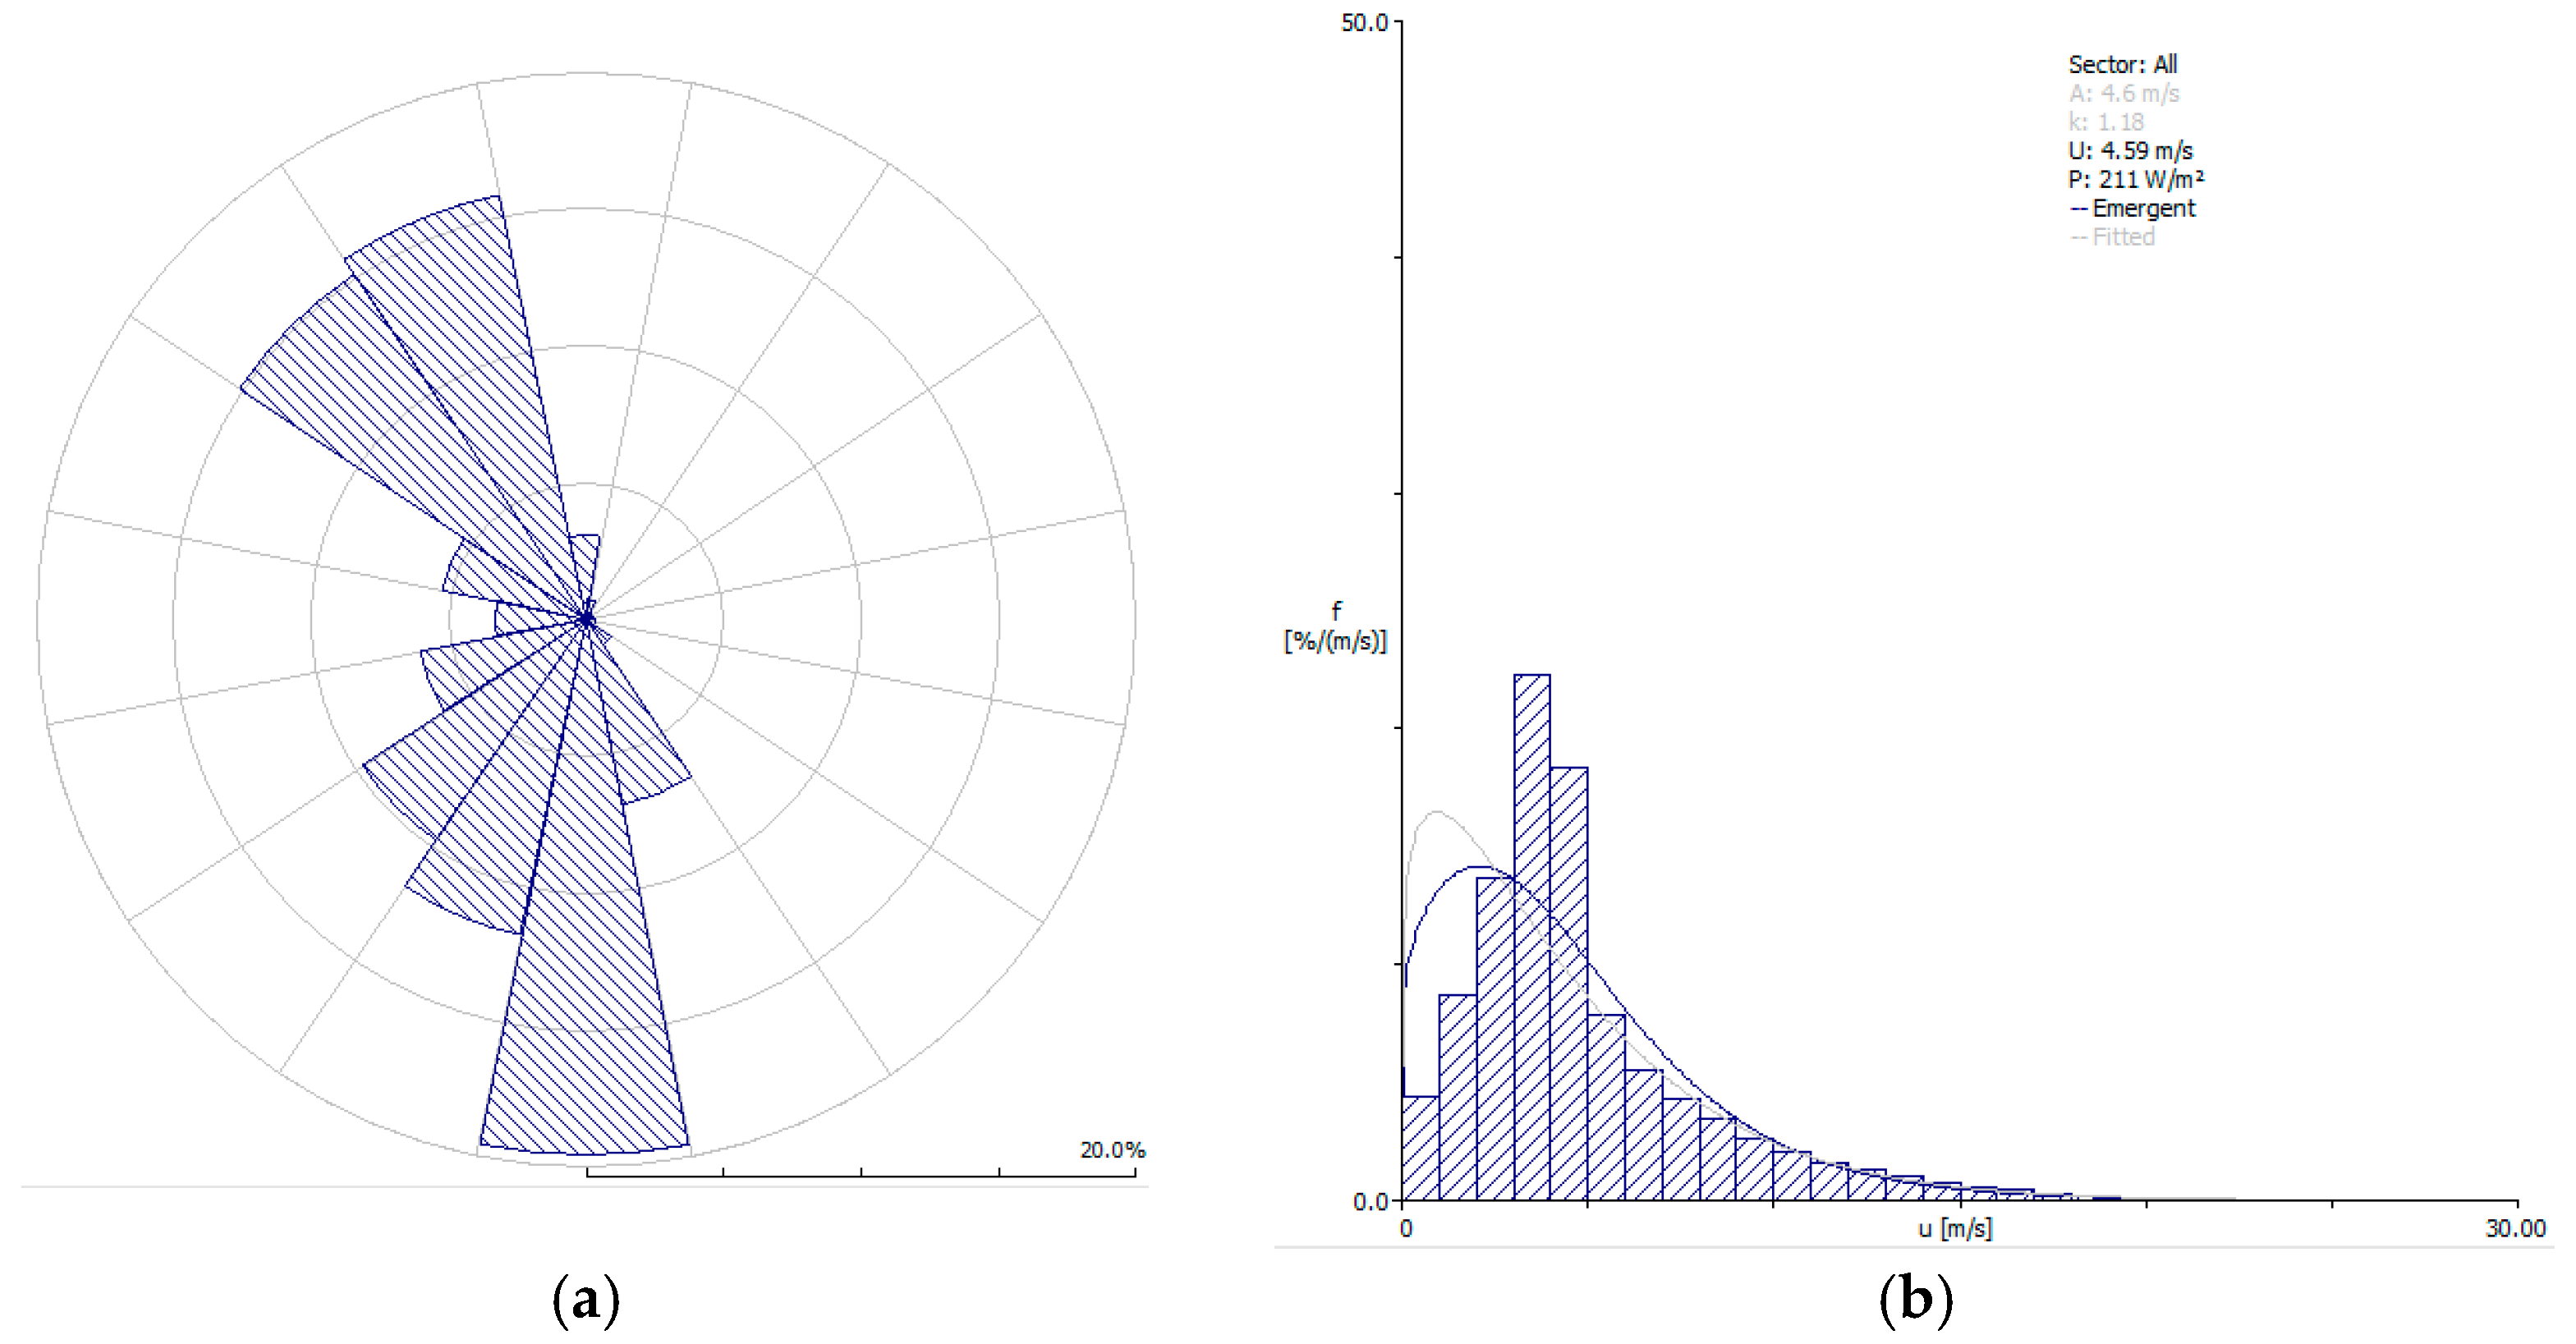
The resulting wind climate for the 40 years period is used to predict the local wind variability using RISOE WASP 10.0 as shown in Figure 16.
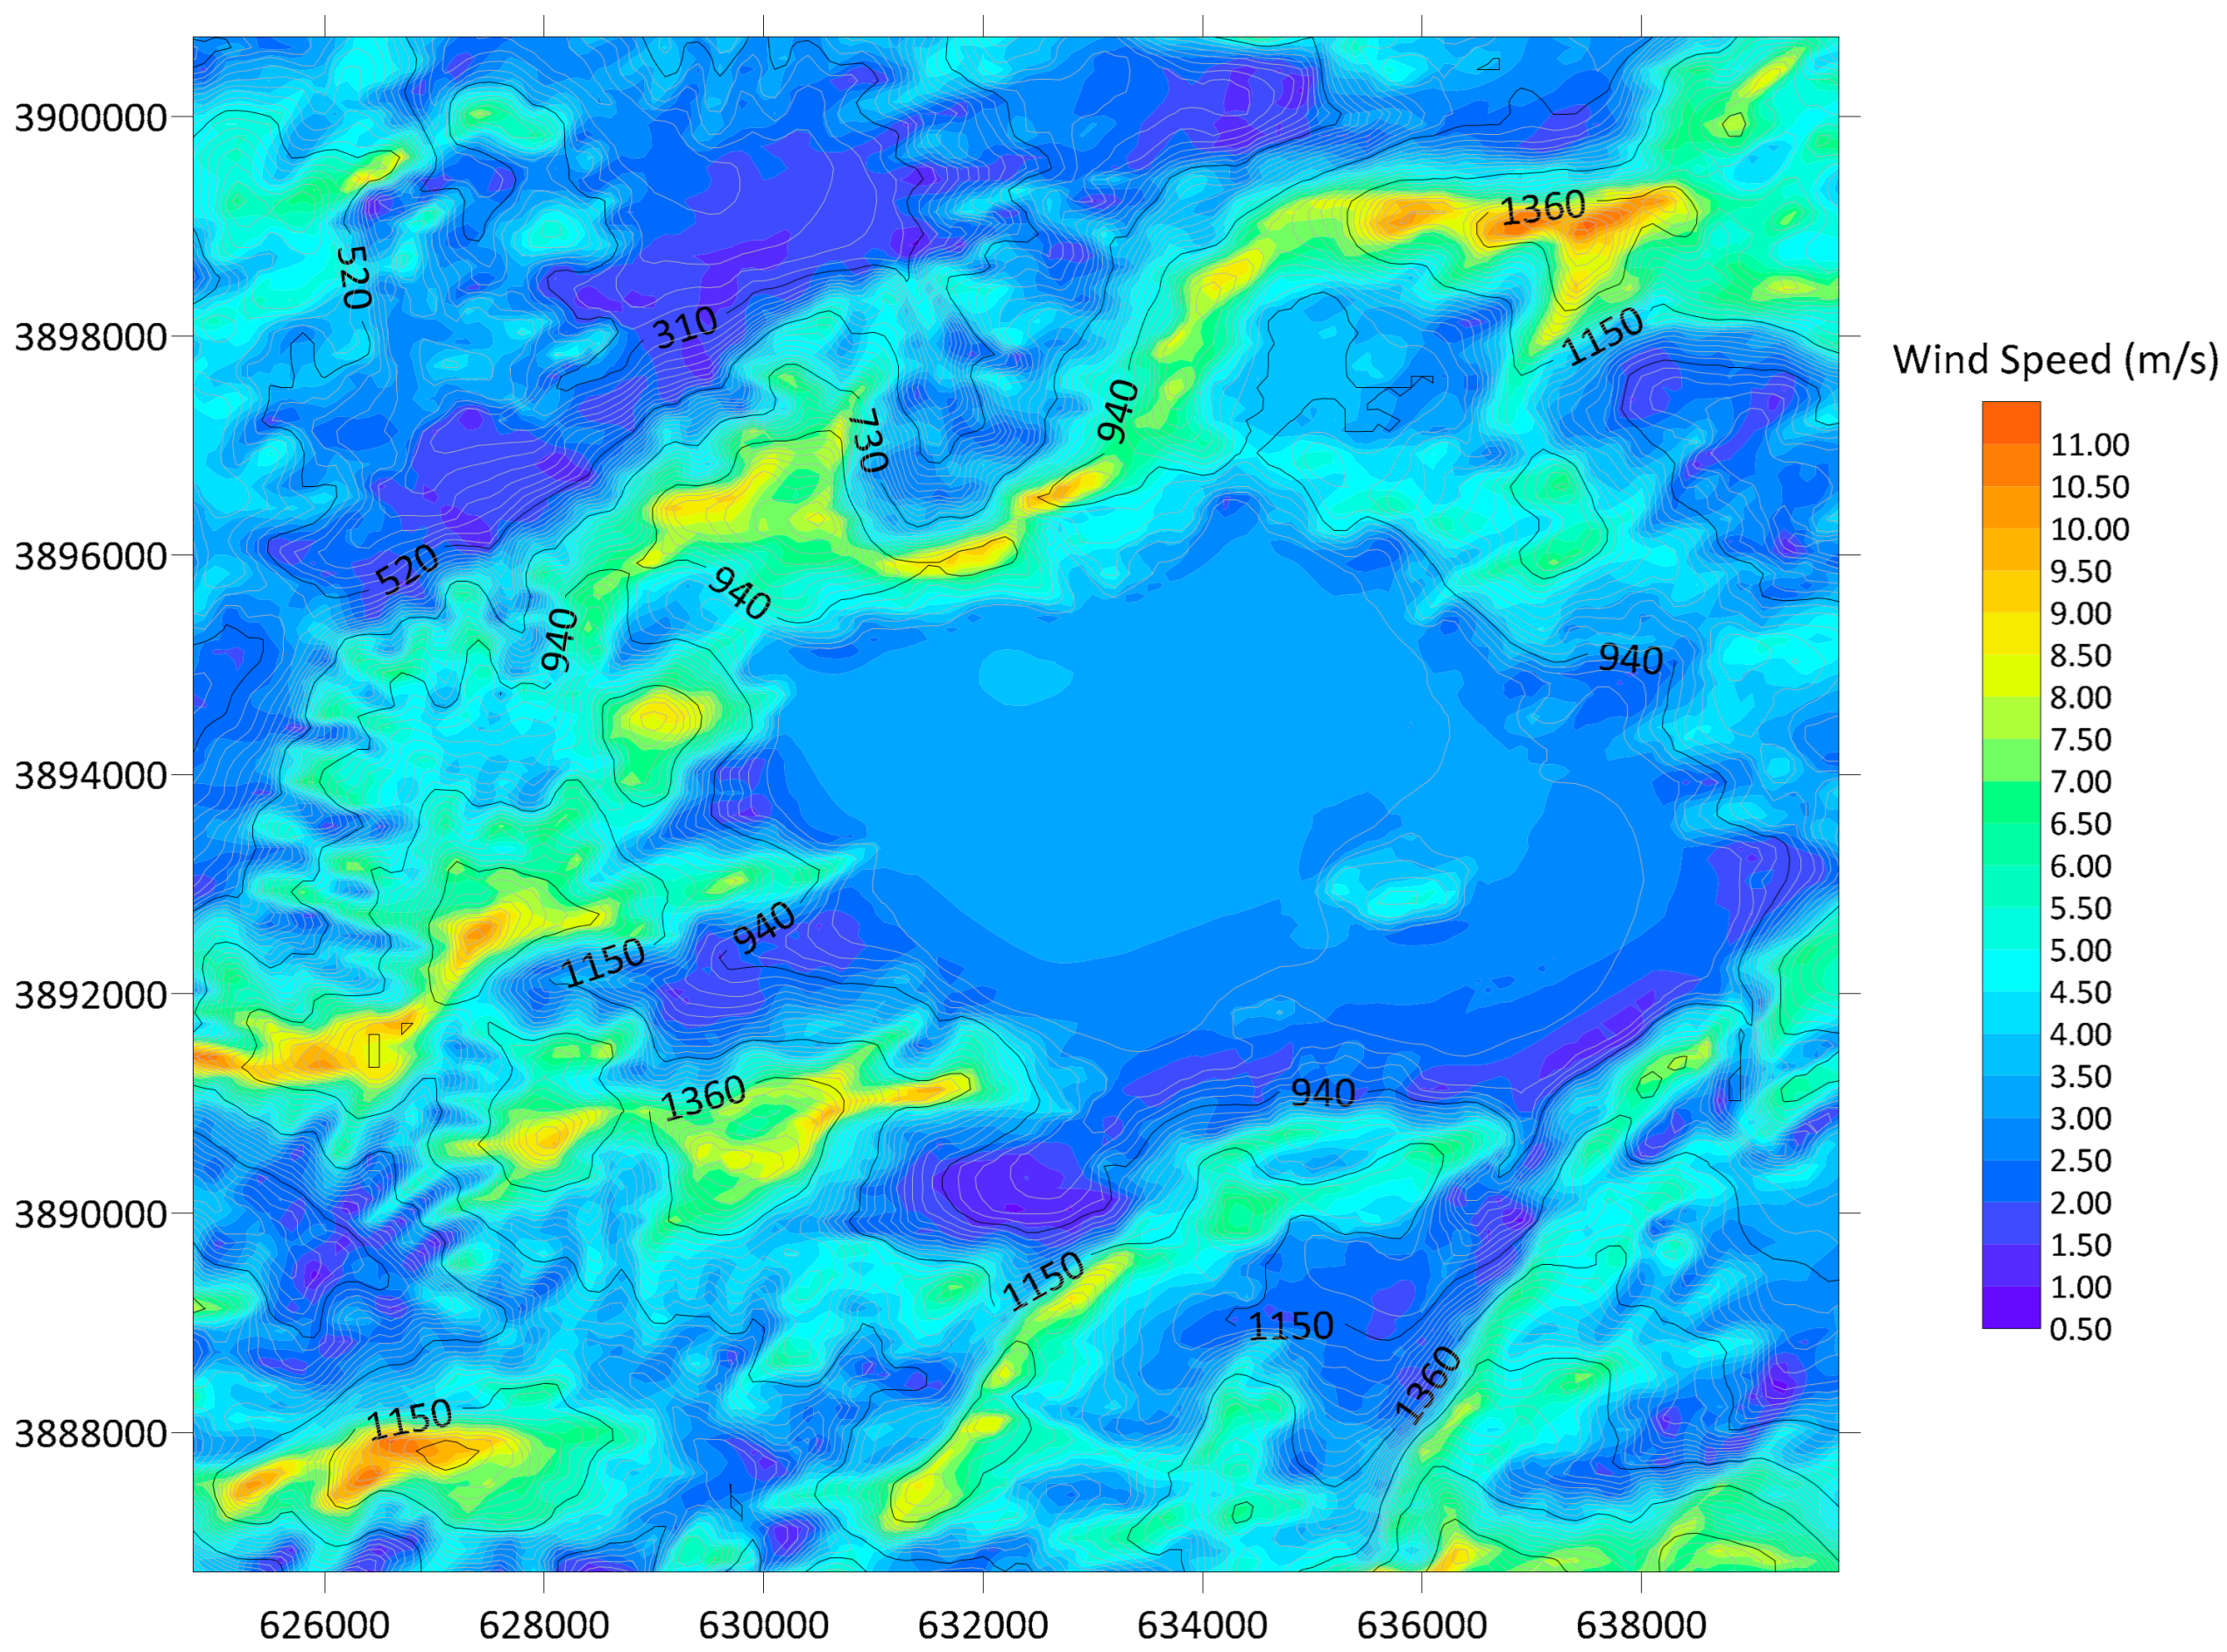
The map in Figure 17 depicts a topographic and wind distribution representation of the Lasithi Plateau, highlighting both elevation contours and wind magnitude variation across the basin. The Lasithi Plateau is clearly visible as a high-elevation enclosed basin surrounded by steep mountainous rims. The northeastern and southwestern sectors show strong gradients (orange–red zones), suggesting dominant wind inflow and outflow channels, consistent with observed Etesian wind channeling and local valley–mountain breeze systems. The plateau center (green-yellow) exhibits moderate winds (4–5 m/s), suitable for windmill energy applications. The southern rim shows local enhancement due to gap flow effects, matching previously observed northerly Etesian inflow channeling into the Lasithi basin. This spatial pattern confirms that Lasithi’s complex terrain exerts strong control on local wind distribution. Orographic acceleration occurs along the plateau edges, while the interior experiences reduced speeds and variable directionality.
The Lasithi Plateau exhibits exceptionally high wind turbulence, characterized by intense gusts and variable shear layers driven by its enclosed basin topography and channeling through the Dikti Mountain passes, necessitating wind energy systems with rigorous adaptability to fluctuating flow conditions. This turbulent regime, while challenging for rigid rotors, highlights the advantages of the traditional Cretan sail design, where flexible polyester sails enable passive aeroelastic deformation that automatically regulates angle of attack, sheds excess loads during gust peaks and maintains operational stability with minimum mechanical failure. Such inherent self-regulation proves particularly valuable in high-turbulence environments, enhancing survivability up to 40 m/s extremes and distinguishing fabric-sail rotors from conventional turbines, thereby justifying focused development for local renewable energy applications.

3.2. Flow Analysis at Nominal Conditions (12 m/s, 55 RPM)

Prior to the CFD calculations, the DEOL code—based on modified Glauert vortex theory and Blade Element Momentum (BEM) theory—yielded the optimal sail geometry as shown in Table 5. This is a rough estimate of the actual deformation of the sails, but nevertheless it gives an indication of the extent of the deformation required to become a lifting apparatus.
Initially, in order to validate the accuracy of the numerical results, extensive grid independency tests and physical parametrization tests were carried out. Results validation via grid independency testing is of significant importance to the legitimacy of the computational outcome. SolidWorks Flow Simulation employs Cartesian cut-cell meshing with Two-Scales Wall Functions (2SWFs). Local refinement (eight levels) achieved y+ = 25 − 32 via child-cell subdivision near cut-cell boundaries. With mesh refinement from grid 1 to grid 8, torque and power increase noticeably at first, while levelling off on the finest meshes (Table 6).
Non-dimensional coefficients track the same behavior with Cp rises from 0.0395 to 0.0815 and Cq from 0.0299 to 0.0617. The biggest jumps occur between coarse meshes (grids 1–4 to 5). From grid 5 to grid 8 the change is small. Coarse meshes under-resolve important flow features with early grids (1–4) being coarse to capture the sail-rotor boundary layer, separation/reattachment, blade–wake shear and the near-blade pressure distribution. That explains the large increases in torque/power as the mesh is refined.
The simulation reaches convergence toward a grid-independent solution after sufficient resolution, where in grids 5 to 8, torque changes from 351.9 to 355.8 Nt·m (+1.1%) and power from 2026.7 to 2049.4 W (+1.1%). Please note that grid 6 torque (349.9 Nt·m) is slightly less than grid 5 (351.9 Nt·m). A small non-monotonic behavior is normal when mesh refinements change local cell quality or wake resolution in non-uniform ways, and it does not invalidate convergence. Table 1 shows a relatively large Reynolds number (for the optimal case Re ≈ 4.5 × 10⁶) and a high-solidity rotor operating at low TSR. That combination makes accurate prediction of boundary layer and separated regions essential. Coarser meshes substantially underpredicted pressure peaks and hence torque/power. The required iterations rise from 600 to 1800 as the grid increases. This is expected since larger meshes and stronger near-wall gradients take more nonlinear iterations to converge residuals and forces. Low final Cp values are physically plausible for this configuration and consistent with high-solidity, low-TSR rotors. The reported Cp/Cq results are therefore physically plausible given Table 1’s geometry and TSR range. Grids 5 and above give near-converged results with grids 6 to 8 showing only 1% spread, so these are considered as grid independent within approx. 1% for torque/power.
The observed nonlinear torque trend aligns with the aeroelastic analyses of flexible rotors reported in [35], which documented similar load nonlinearities in membrane-wing wind turbines due to camber deformation. These effects, also characteristic of fabric rotor systems, provide inherent load alleviation during gust passages, as validated in [6] for Cretan-type sail windmills. The DEOL/BEM optimization thus targets this aeroelastic regime to maximize power extraction while ensuring structural survivability.
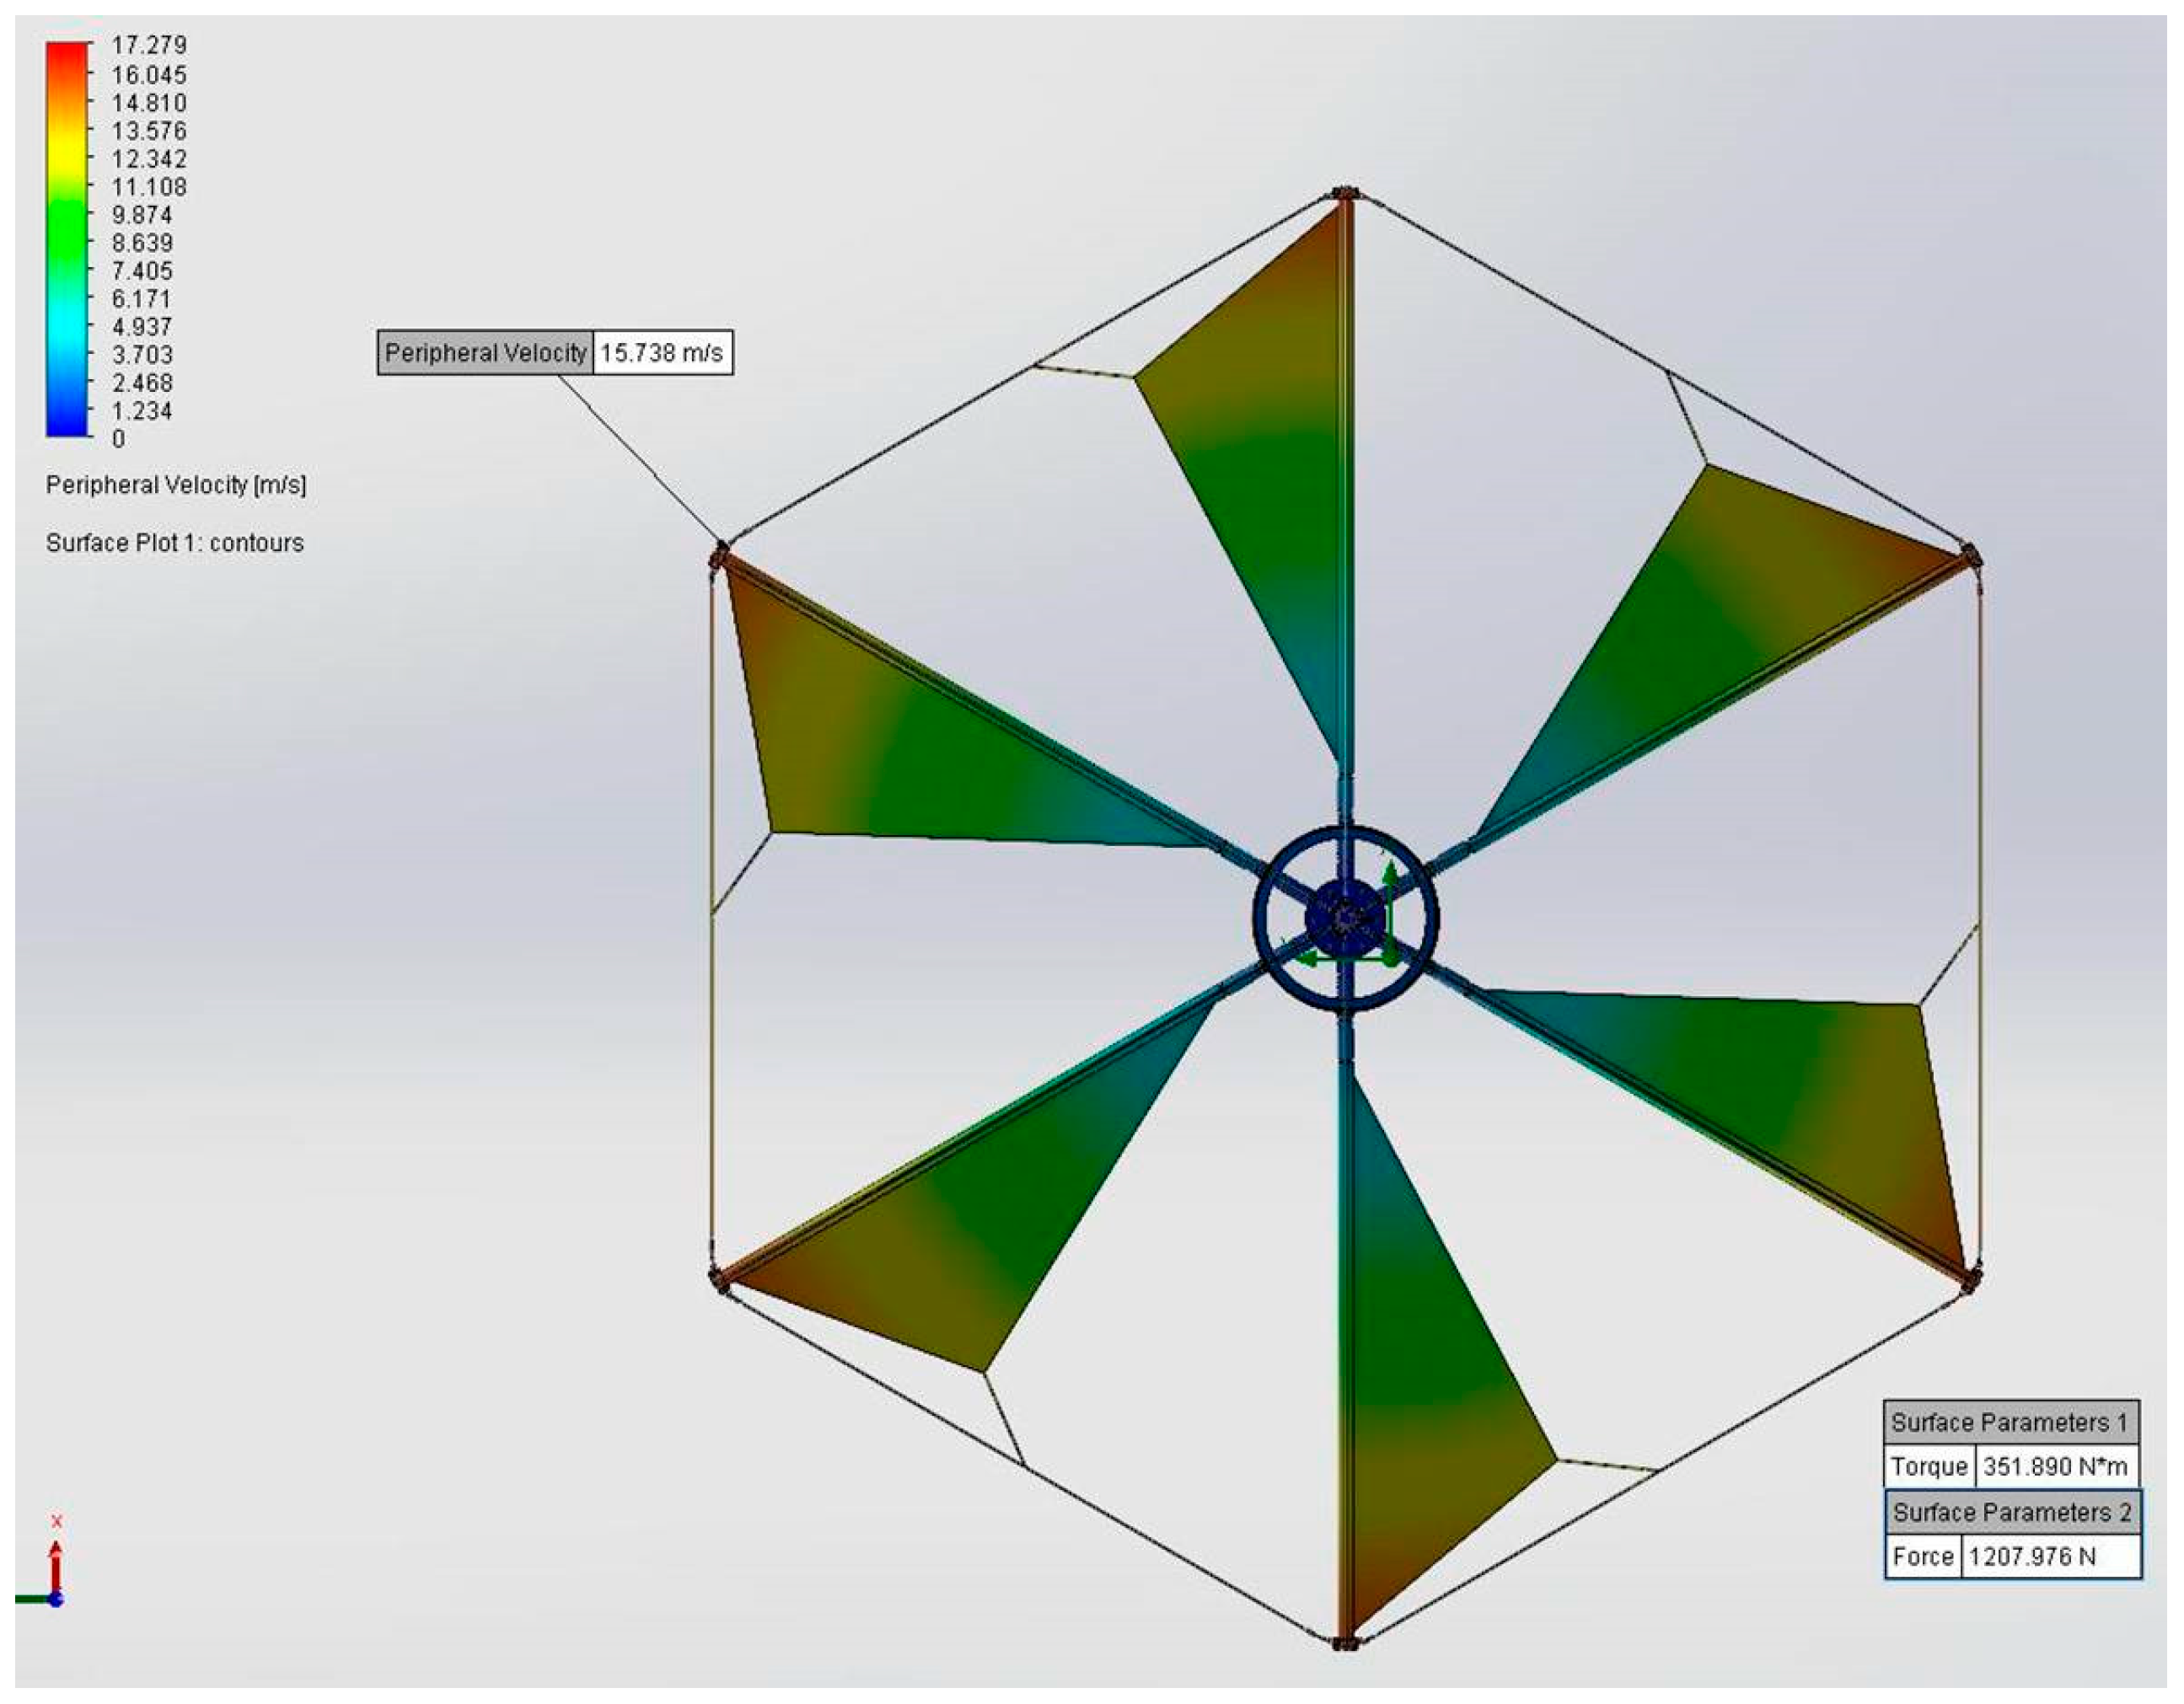
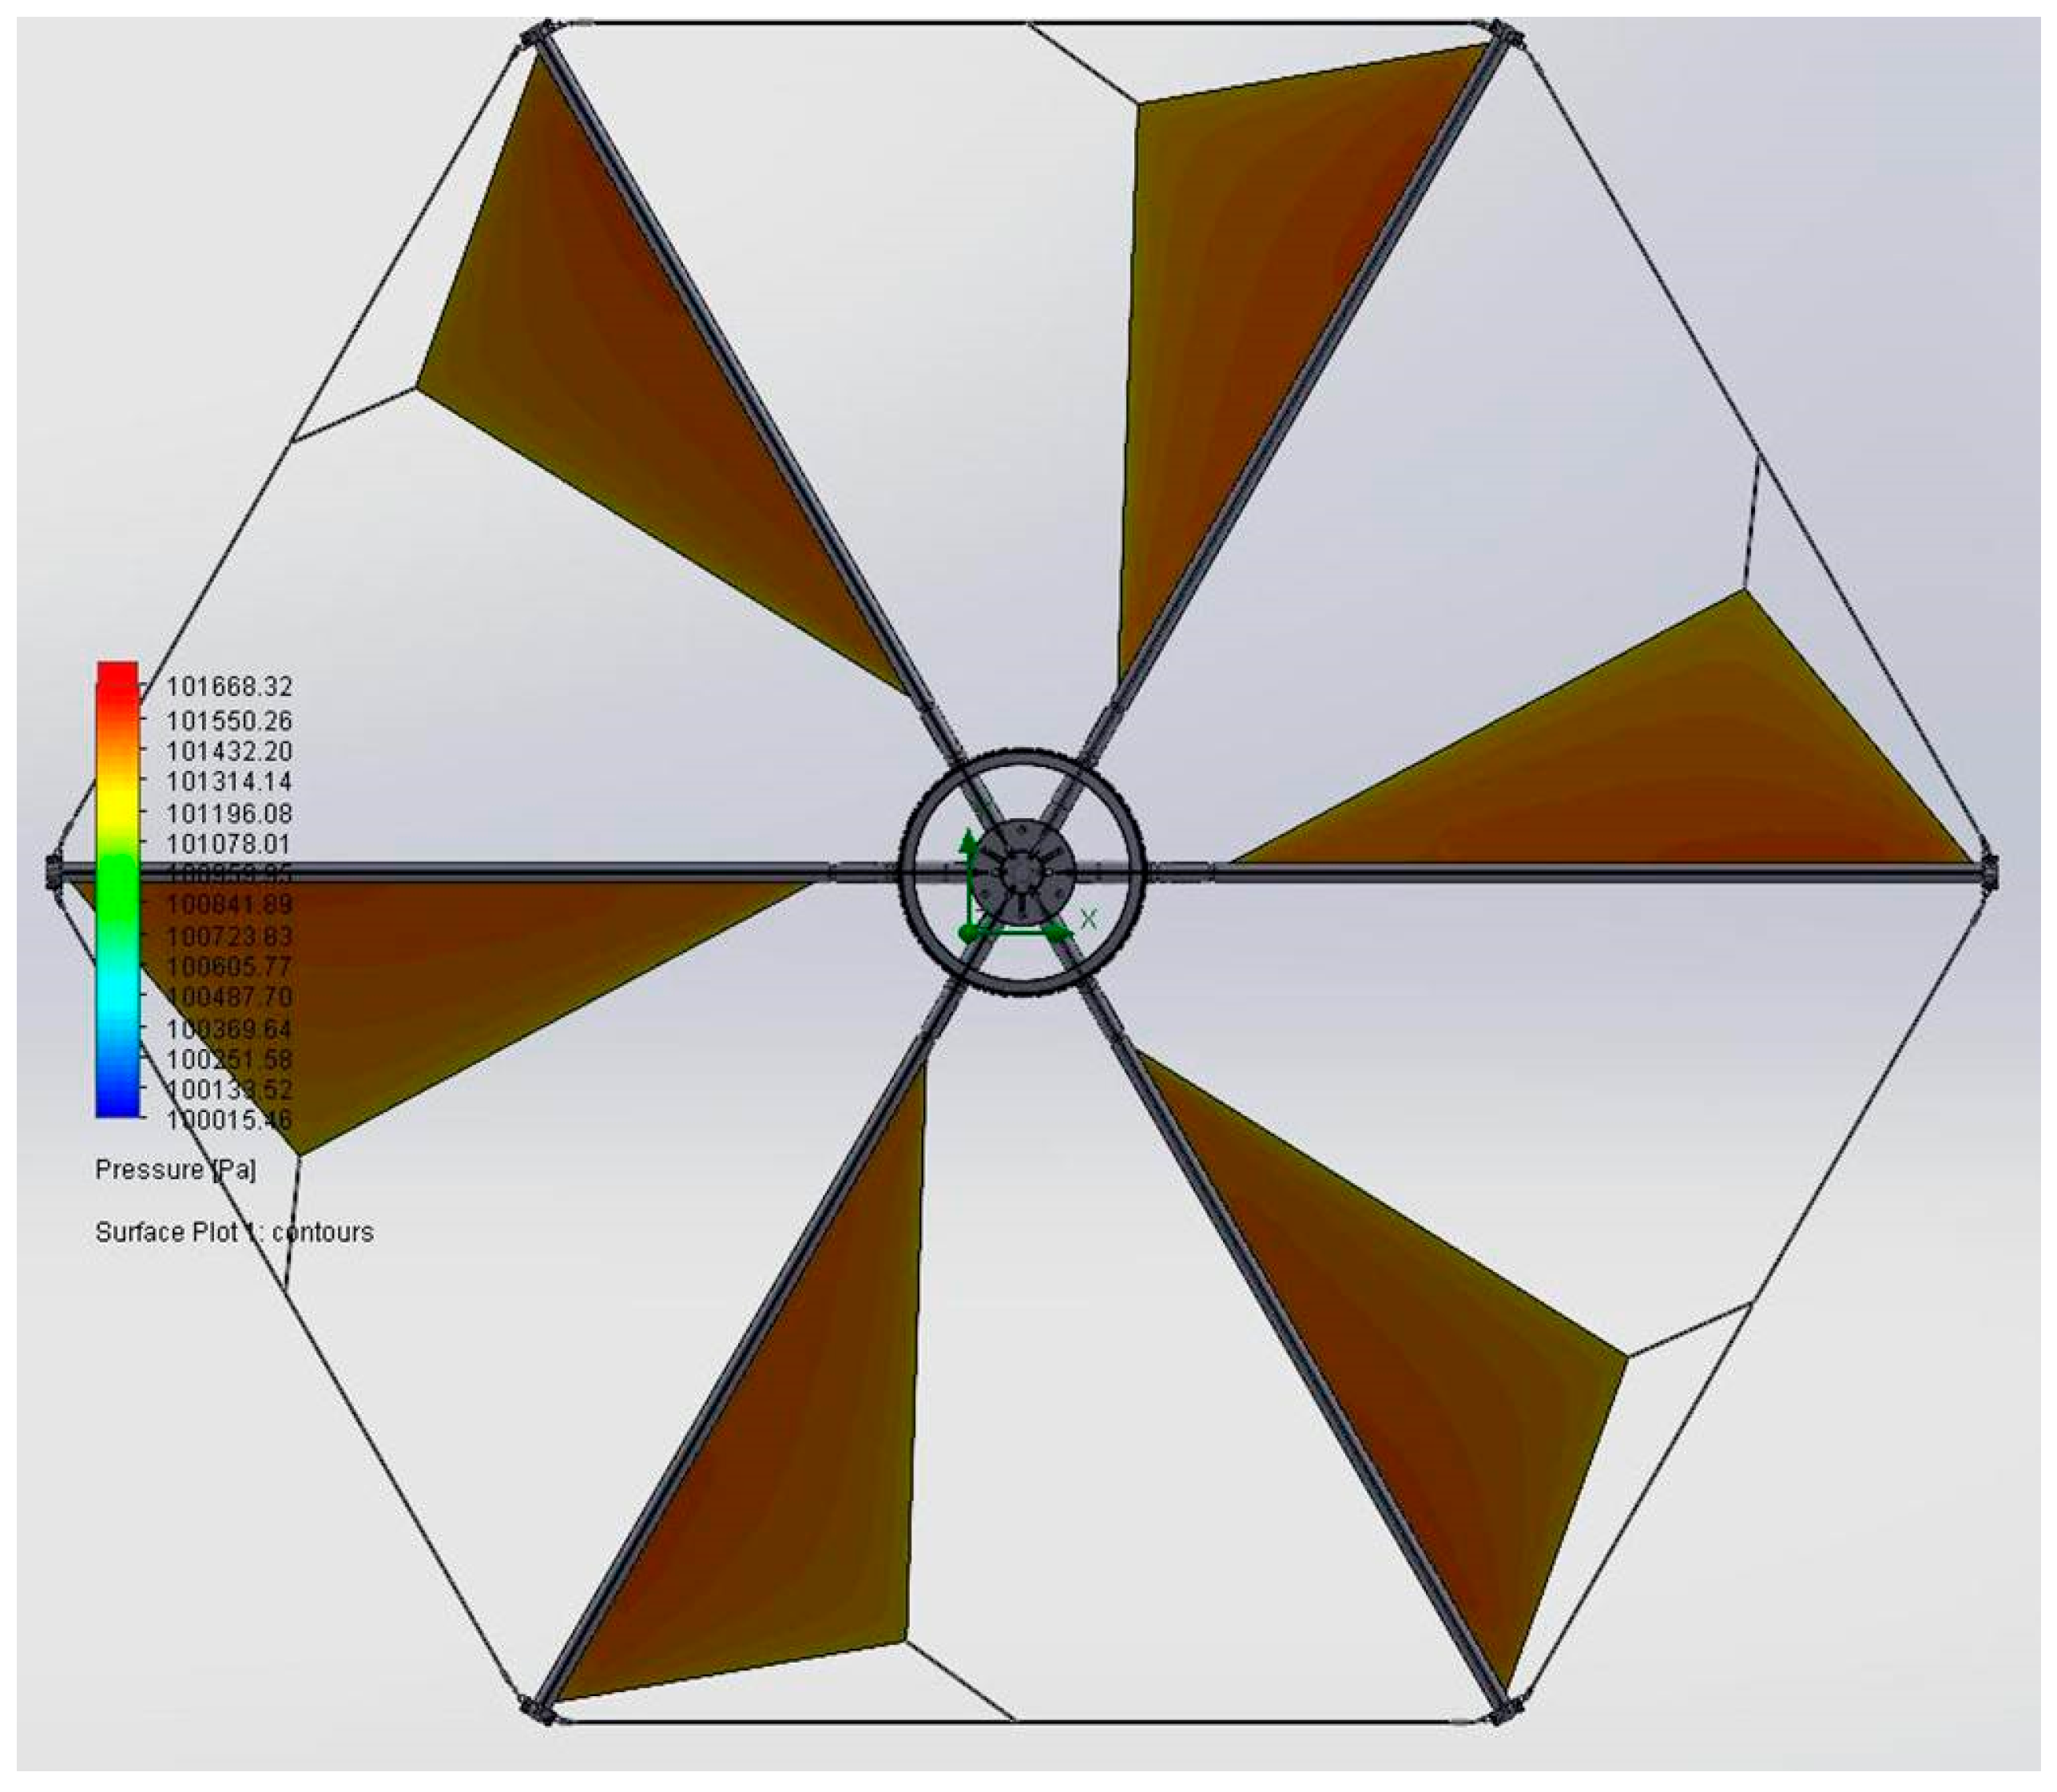
In Figure 18, the peripheral velocity at the blade tips is consistent with rotational kinematics (V_tip = ωR). The torque and surface forces indicate a low-TSR, torque-dominated regime (352 Ntm) with significant hub loads (1208 Nt). In Figure 19, the pressure distribution confirms the aerodynamic load generation as shown in detail.
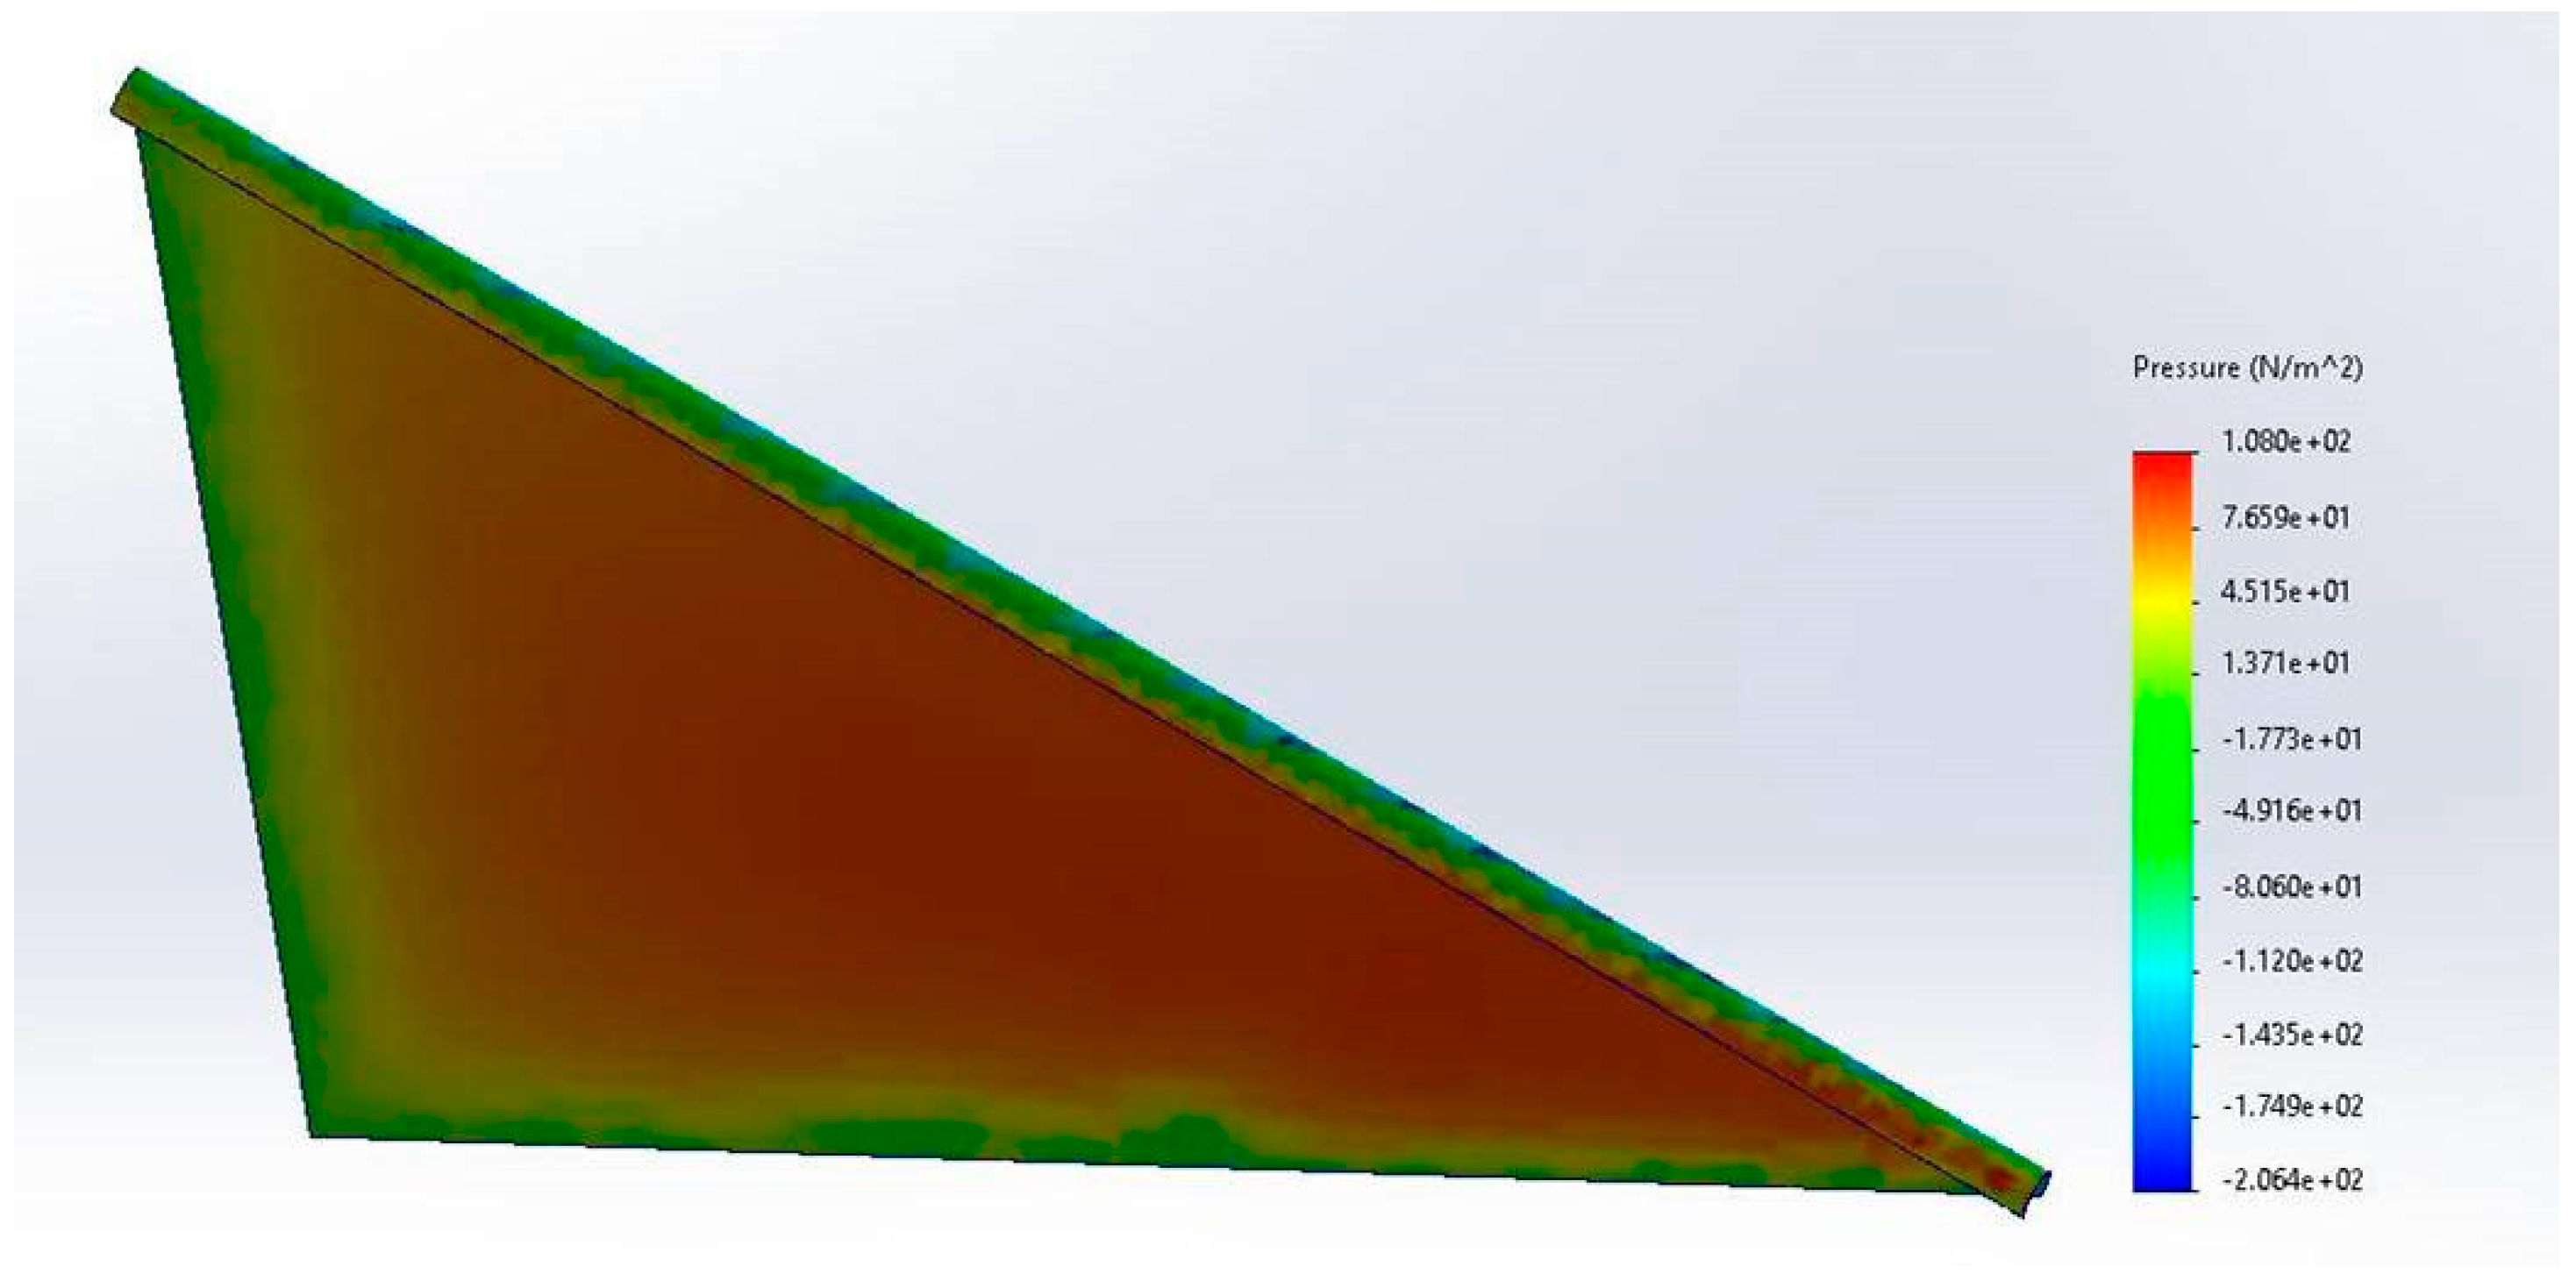
In Figure 19 and Figure 20 the suction and stagnation zones are clearly visible over the upper surface of the sail.
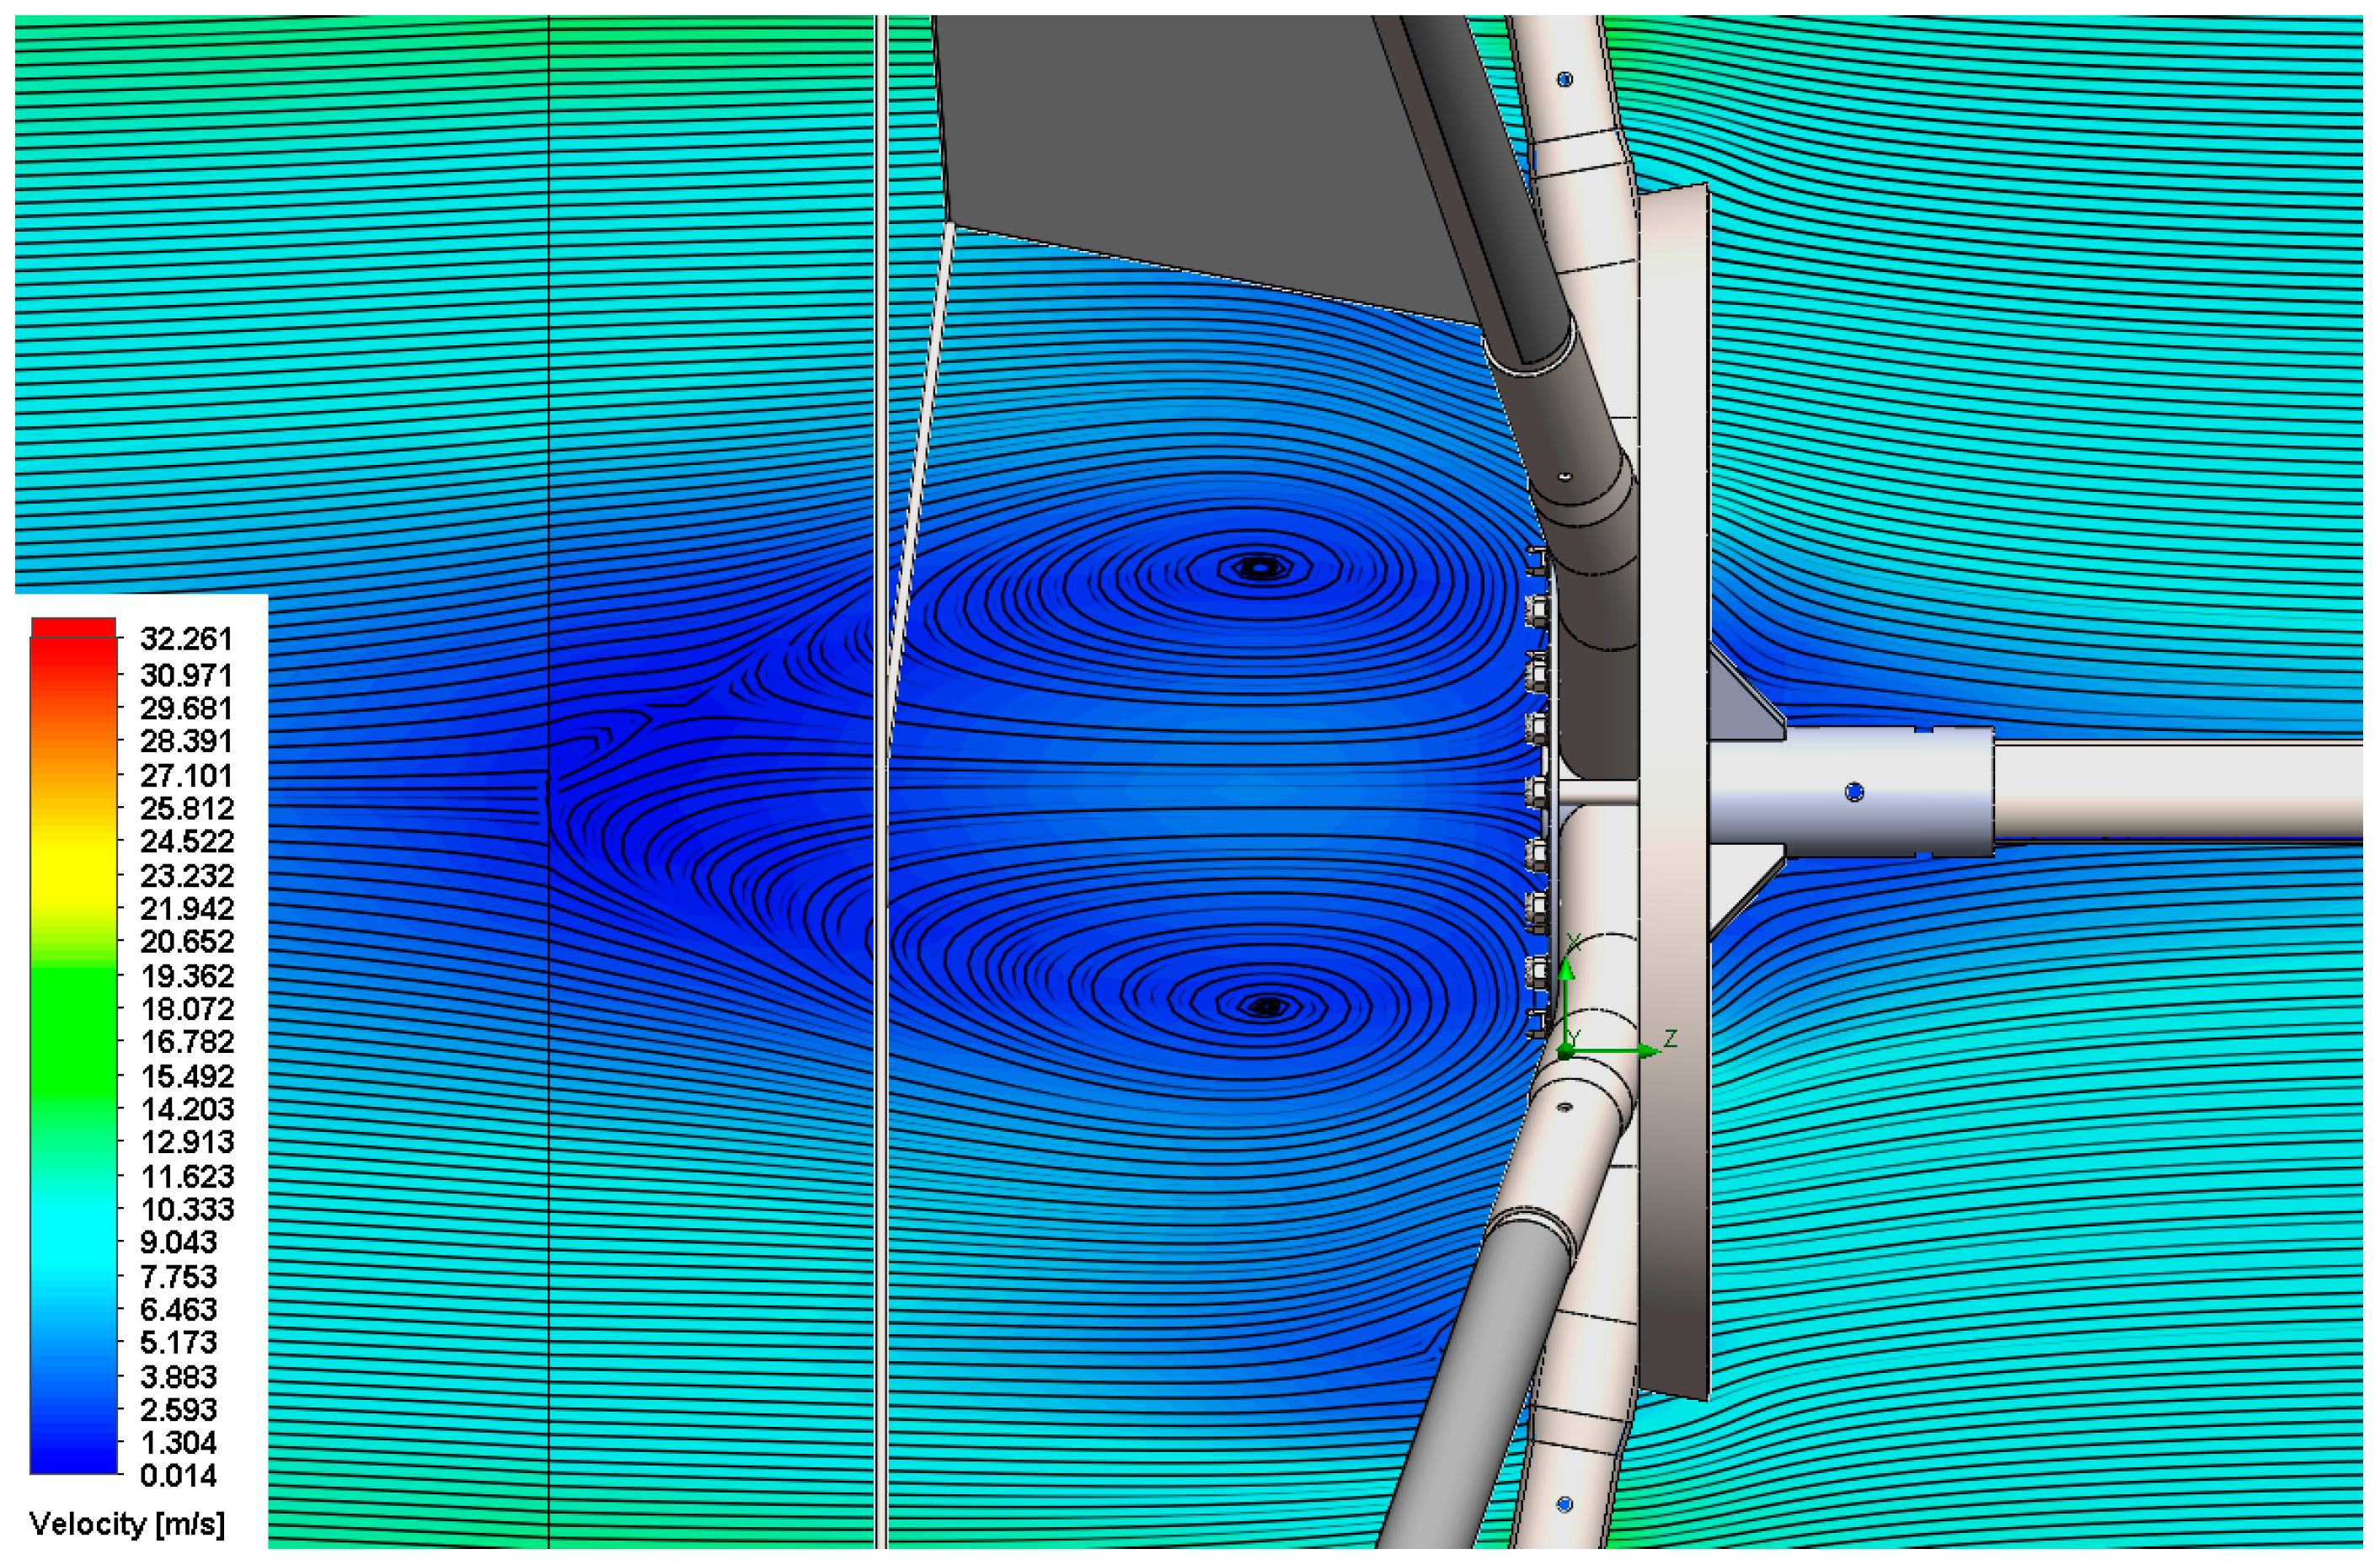
Figure 21 reveals the expected velocity deficit and hub recirculation region in the near wake, where the strong wake coherence is consistent with low TSR operation. Here the reported hub separation and recirculation region obviously reduces the windmill efficiency and increases hub loading.
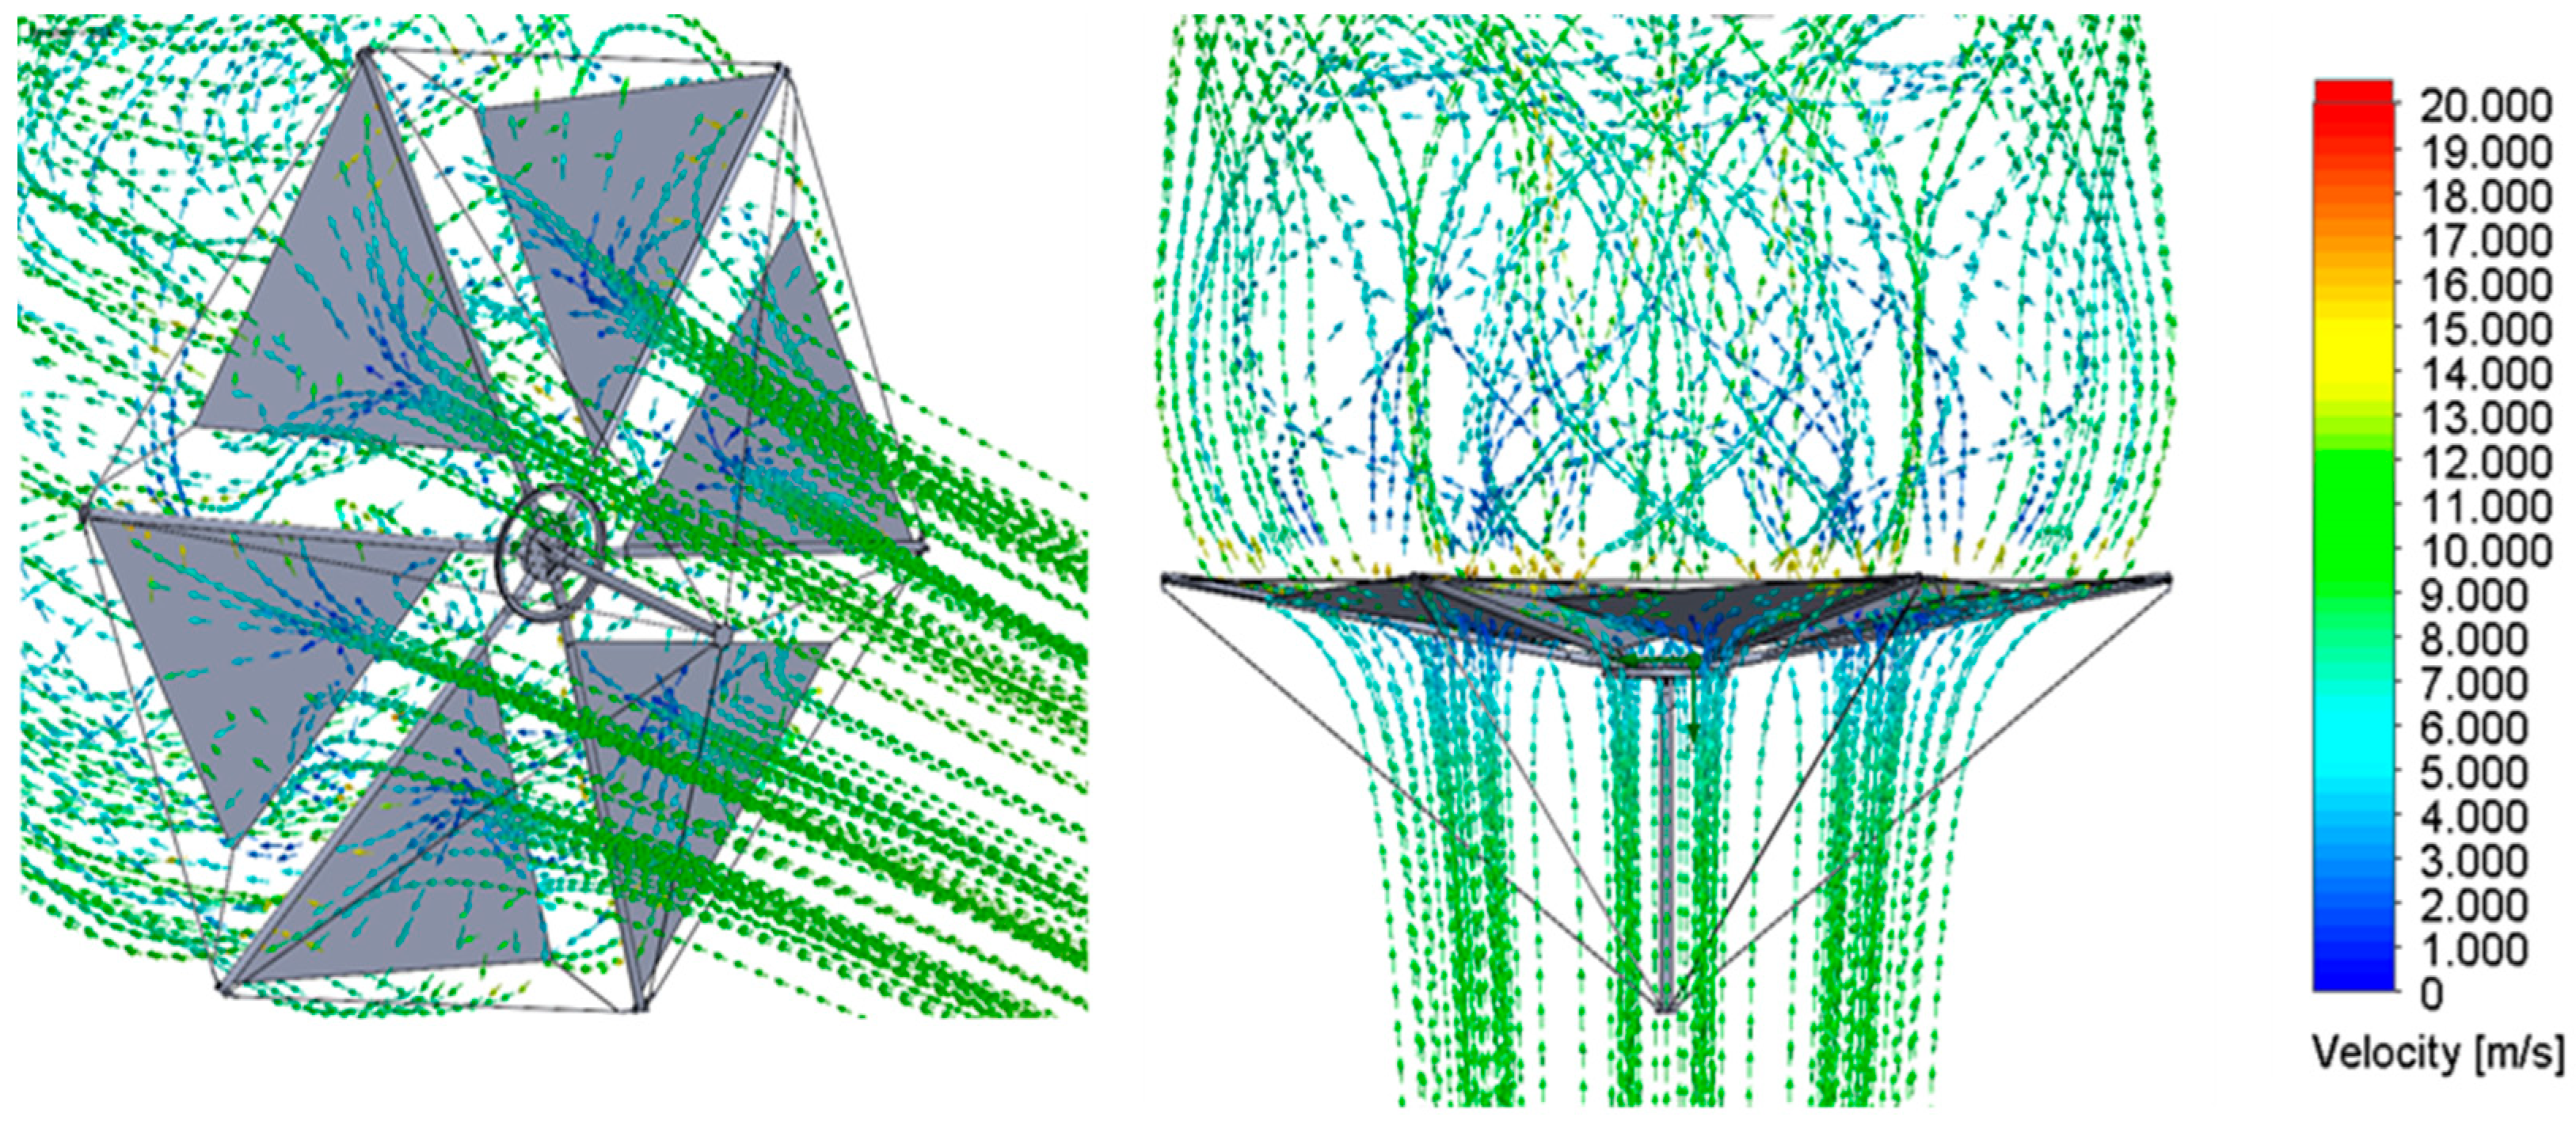
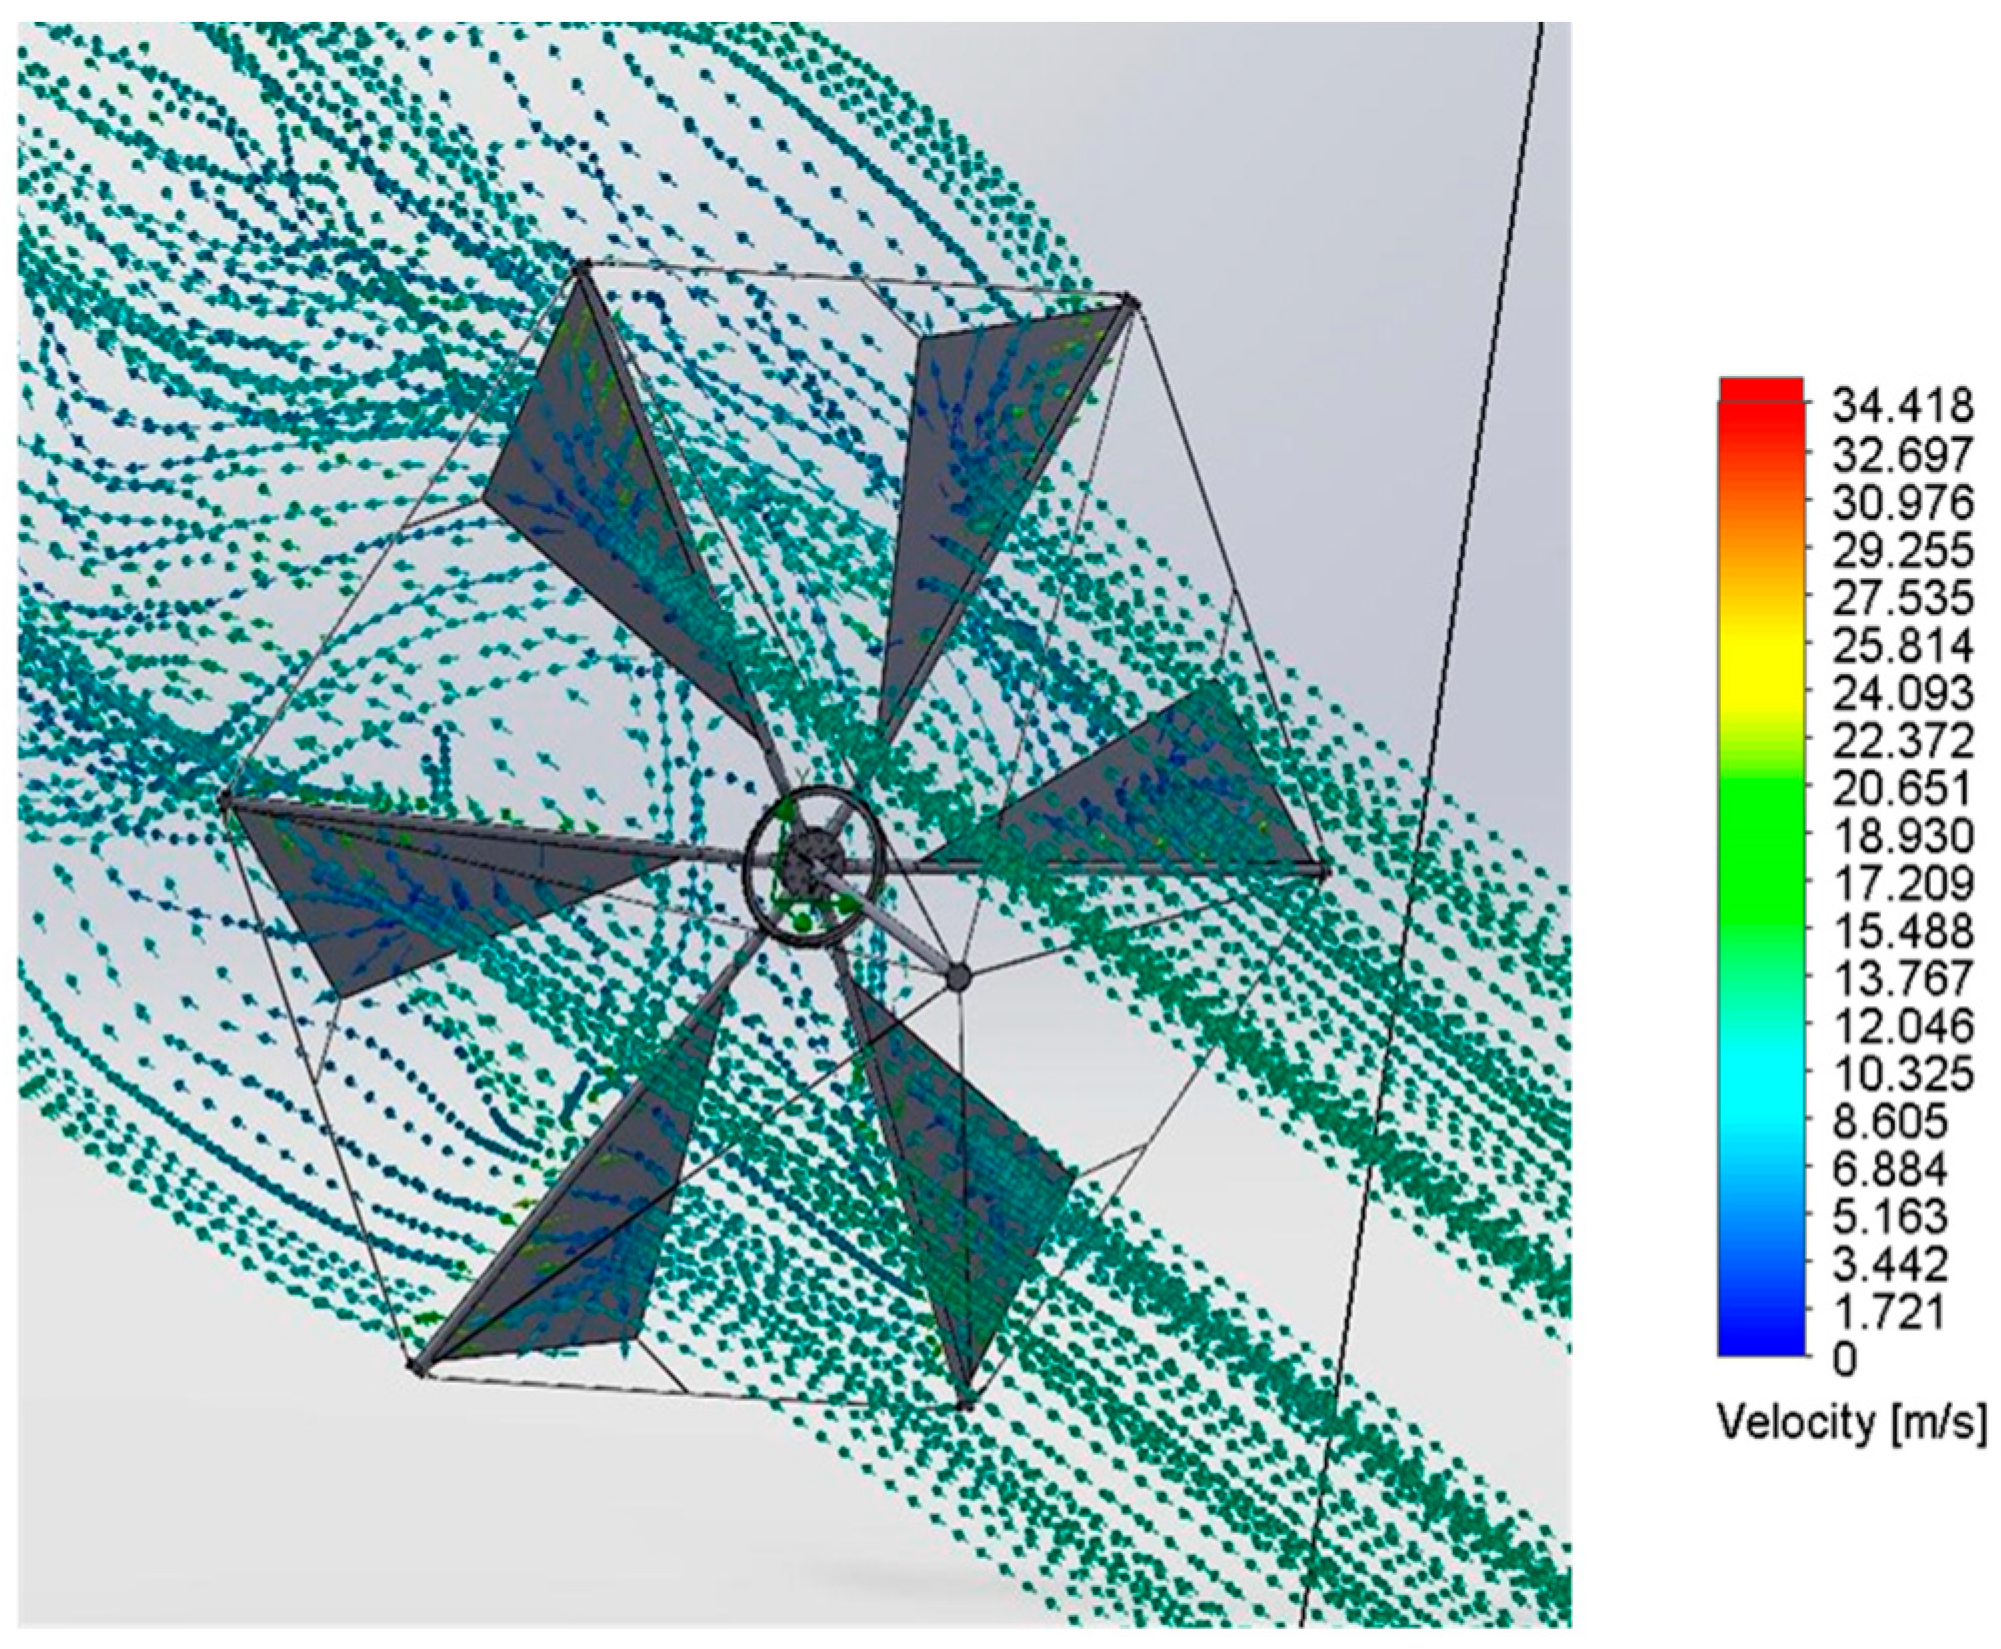
Particle traces for the 45.71% solidity sail-rotor configuration in Figure 22 show spanwise flow and tip vortices. It highlights large-scale three-dimensional flow and potential unsteady loading. The oncoming flow escapes the trailing tip, rotating the shaft and continuing in the wake in the same direction, only to change its orientation approximately one rotor-diameter downwind, affected by flow entrainment from its surroundings. As expected, the exact flow pattern is followed by the 22.22% solidity sail-rotor configuration as shown in Figure 23.

3.3. Flow Analysis at Extreme Conditions (40 m/s, 80 RPM)

The aerodynamic and structural response of the horizontal-axis windmill at a free-stream velocity of 40 m/s and a rotational speed of 80 rpm reveals the extreme operating envelope of the system. This condition corresponds to a reduced tip-speed ratio and significantly higher dynamic pressure compared to nominal 12 m/s cases. Consequently, both torque and axial load magnitudes increase substantially (Q = 2463.51 Ntm, Faxial = 9101.67 Nt), while the distribution of pressure over the sail surface demonstrates strong asymmetry induced by flow separation near the sail tips.
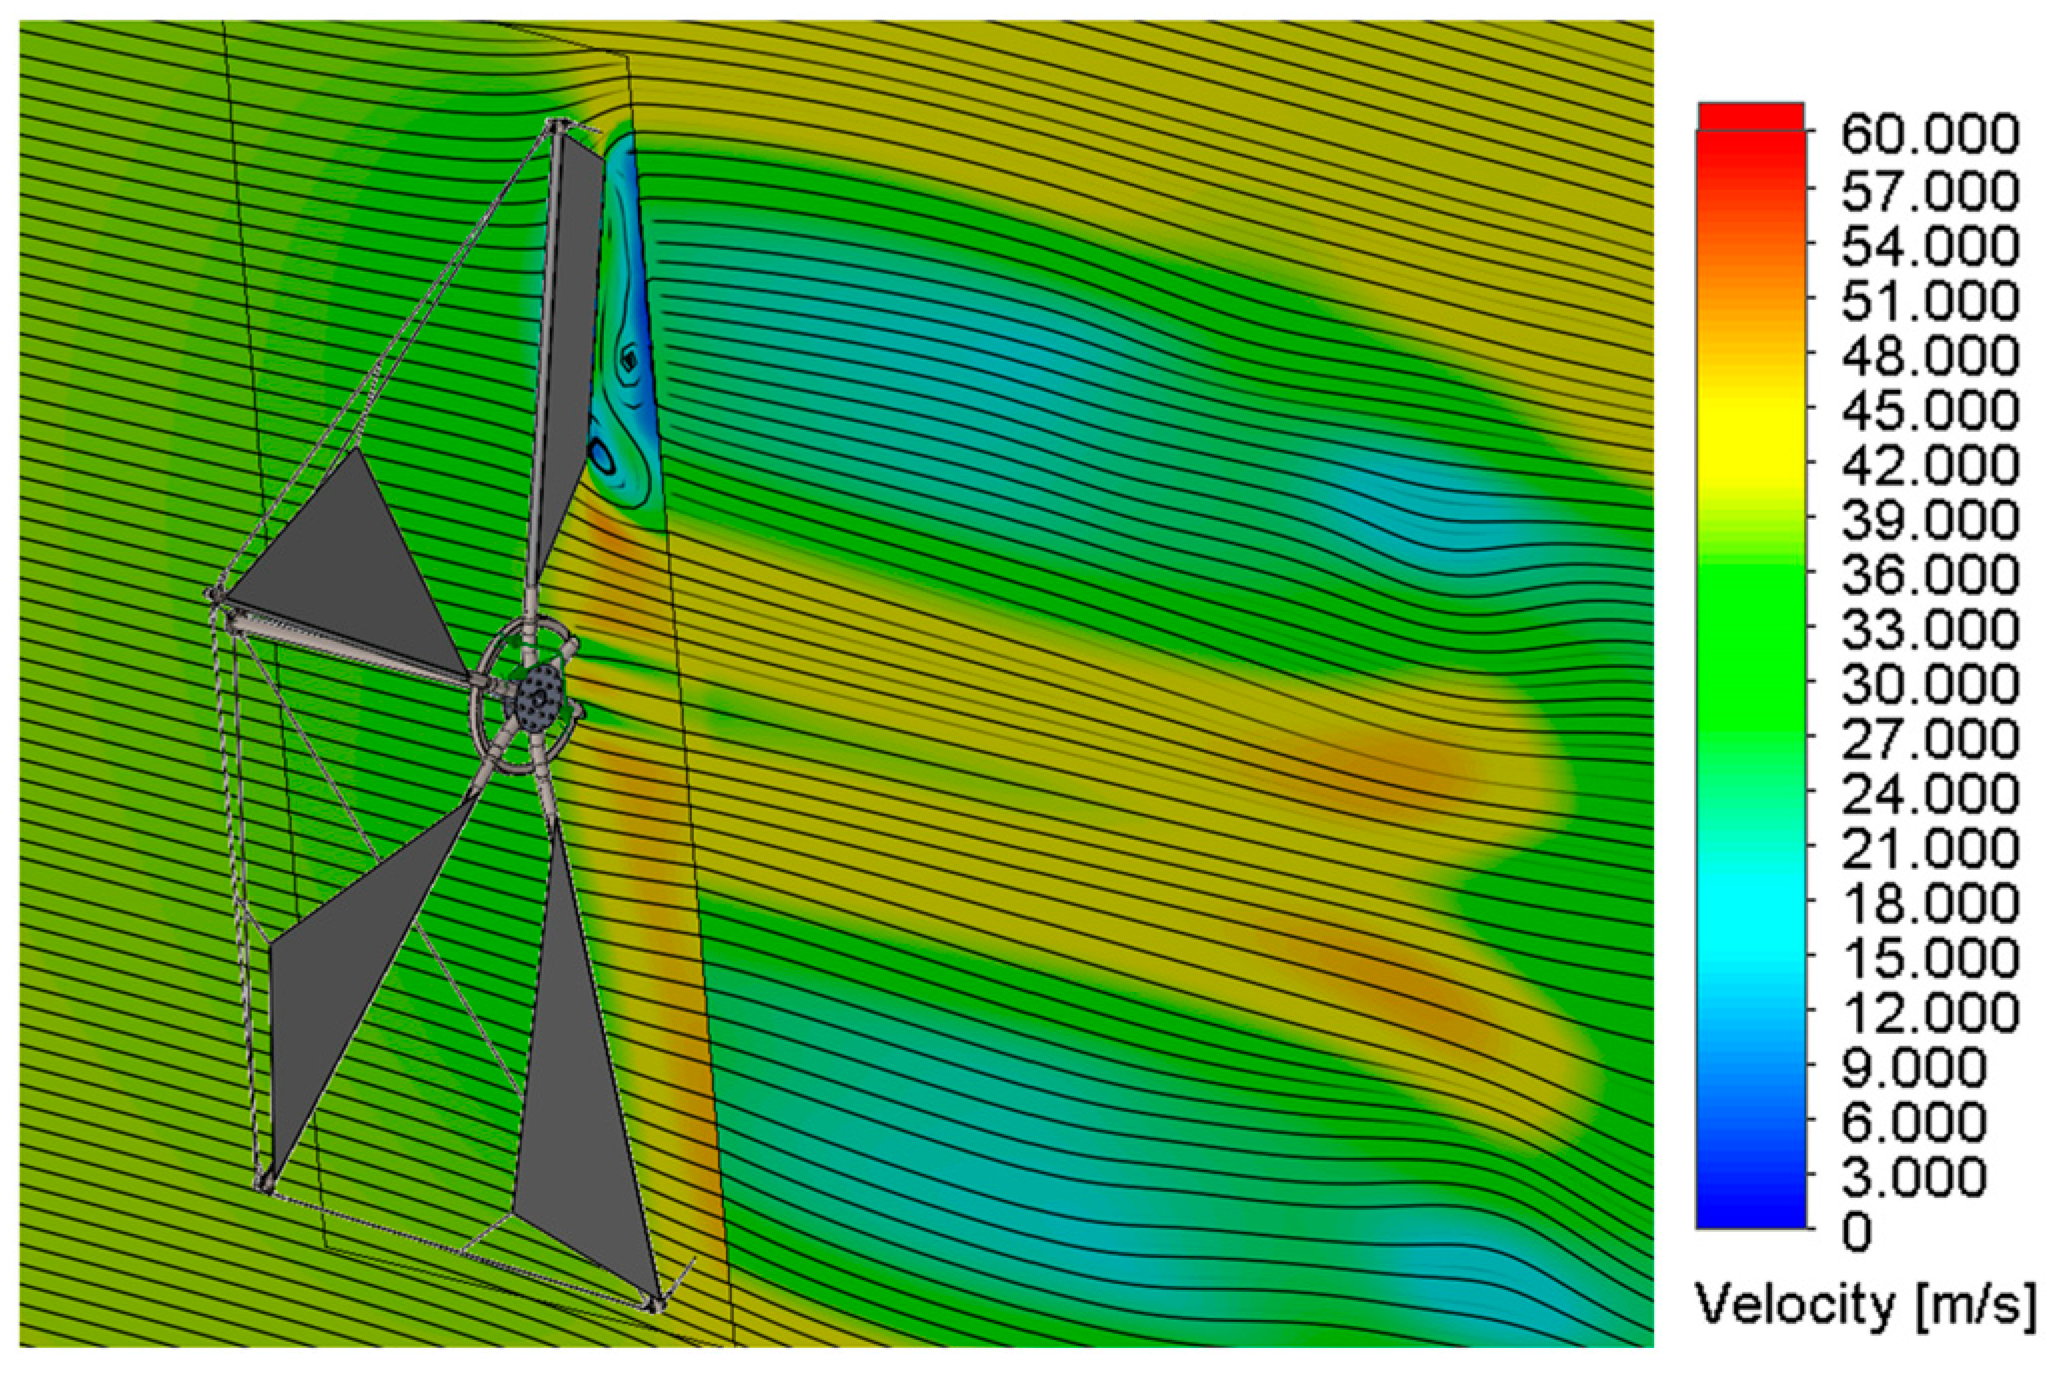
More specifically, Figure 24 presents a velocity contour plot through a quarter of the rotor diameter cut-plane, overlaid with velocity streamlines. The contours clearly illustrate the velocity deficit in the wake of each sail and the redistribution of flow around the rotor periphery. Regions of high velocity occur in the freestream zones and around the sail edges, where the flow accelerates due to the local pressure drop. In contrast, low-velocity regions indicate strong momentum extraction on the sail’s leeward side and in the downstream wake core.

3.4. Structural Analysis

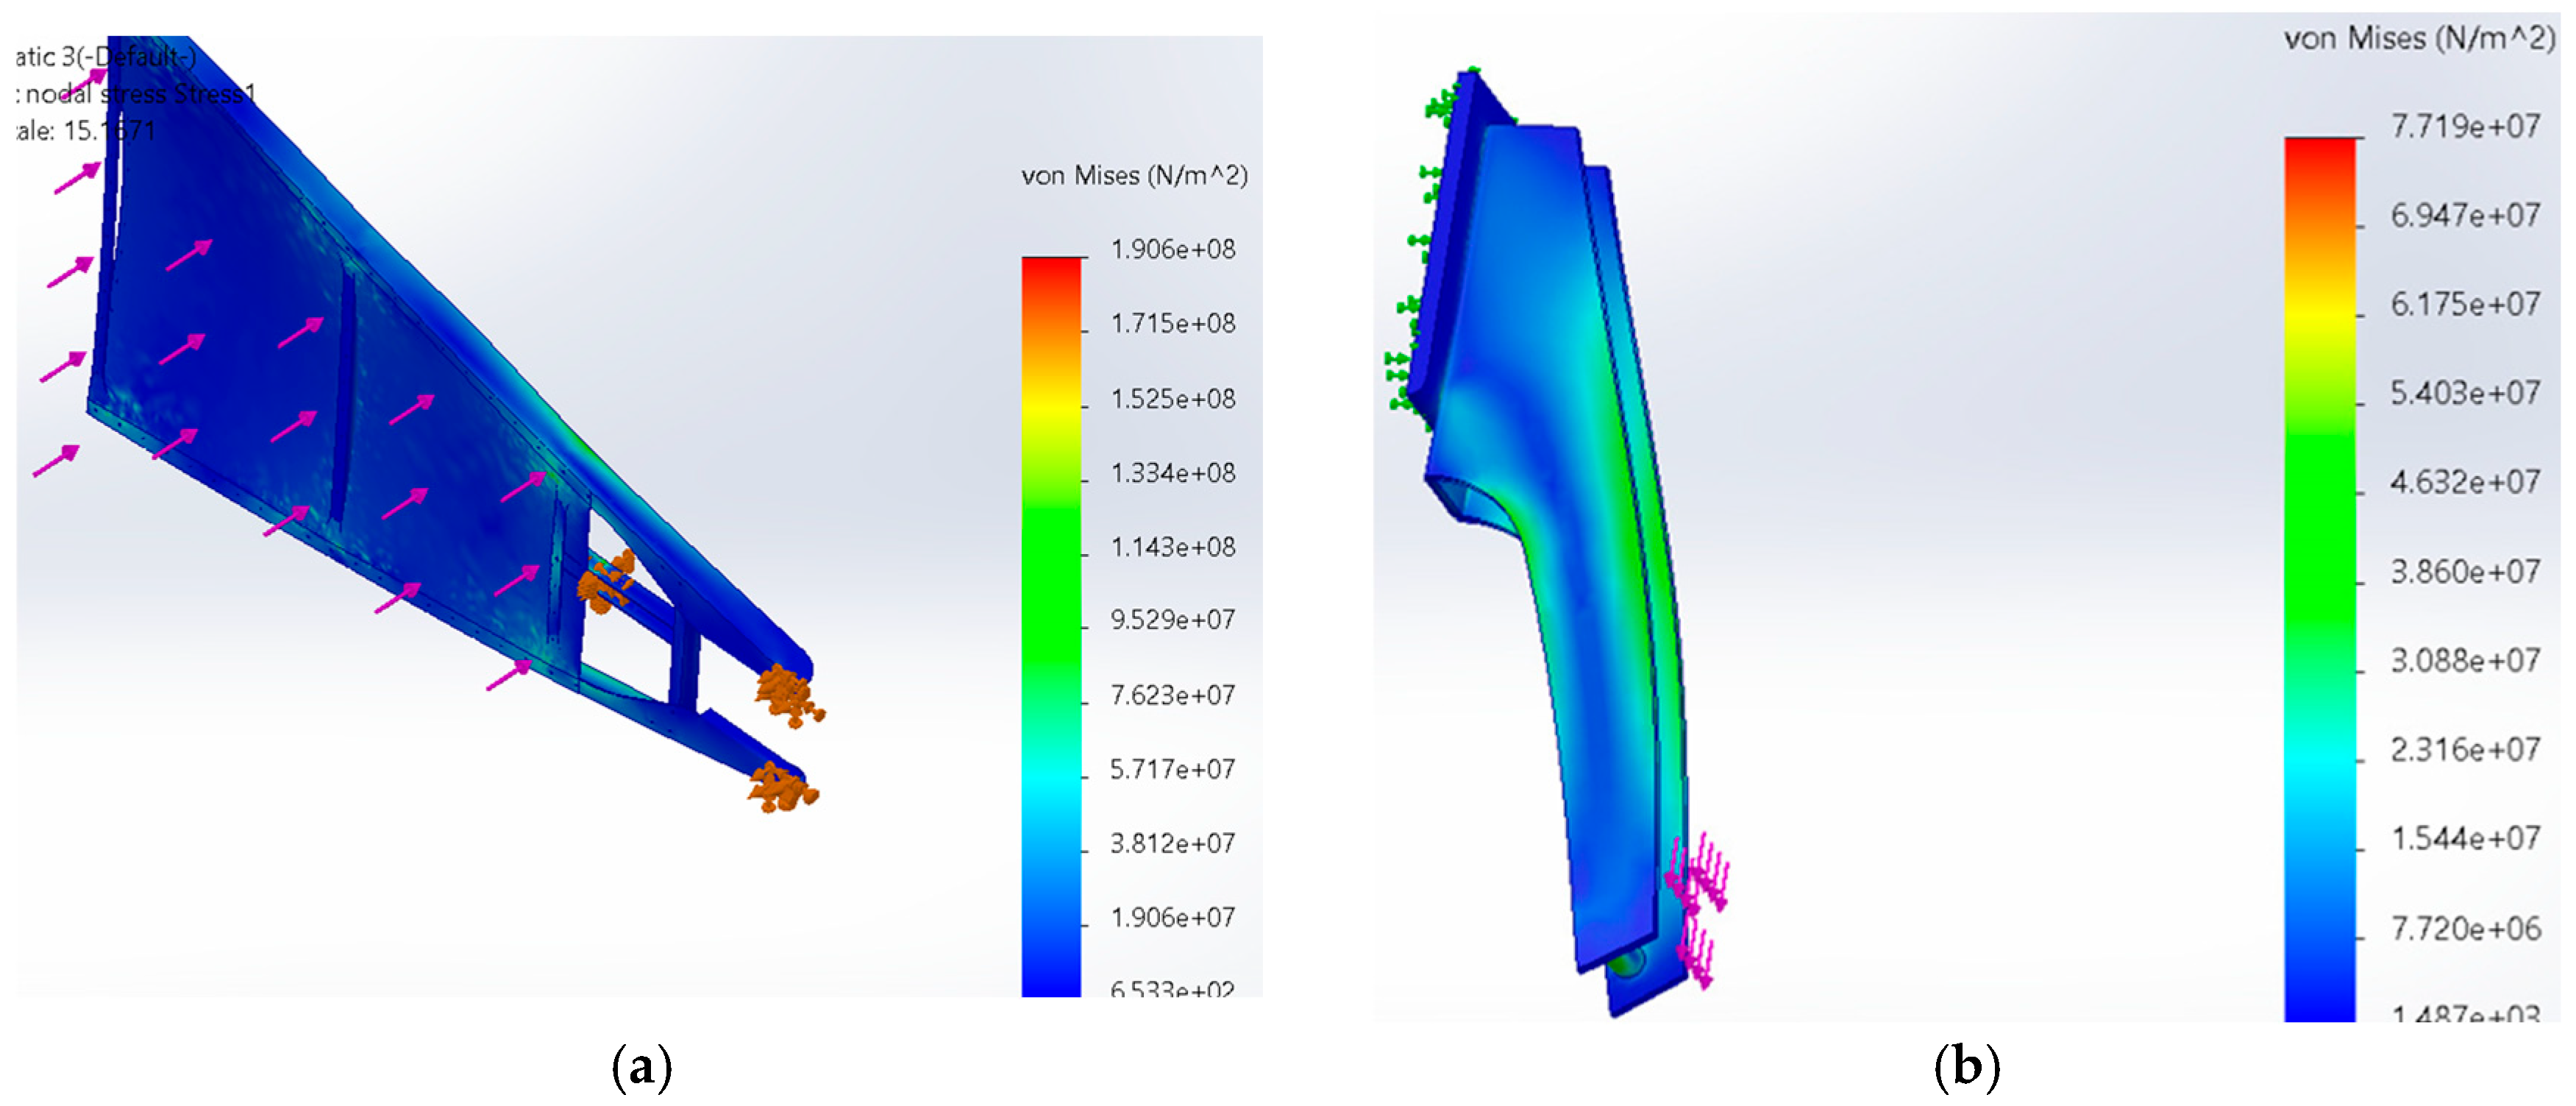
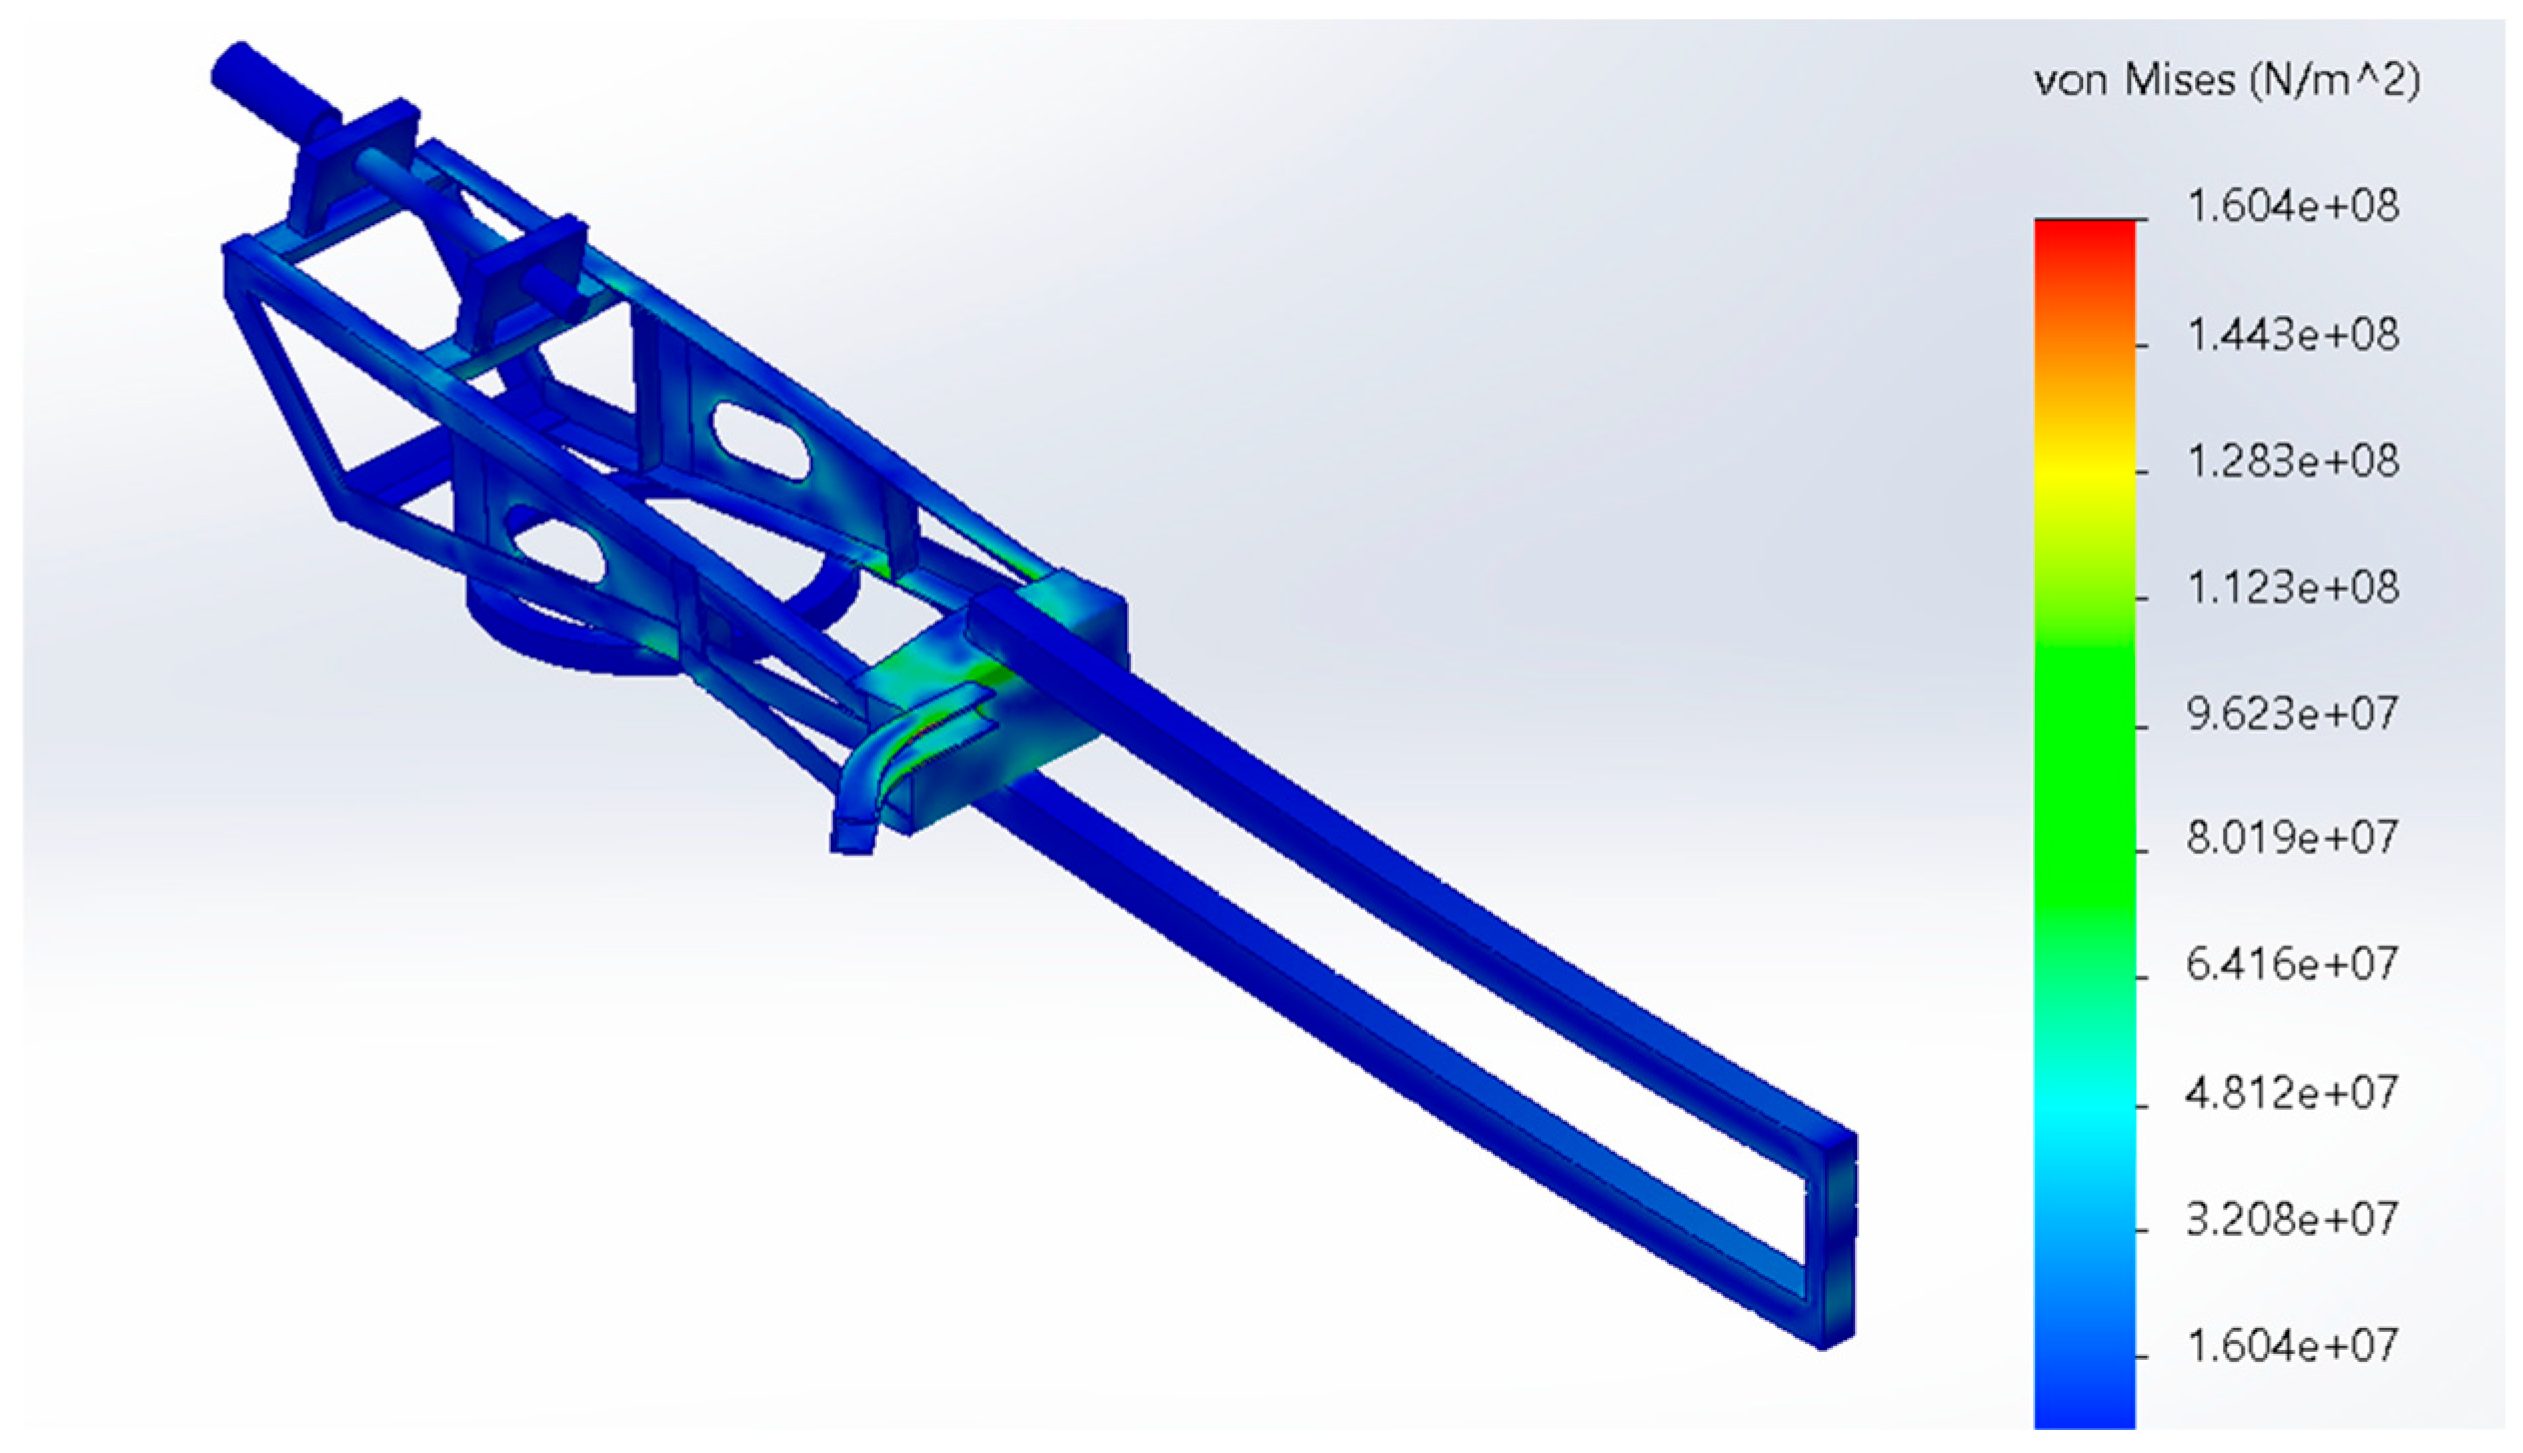
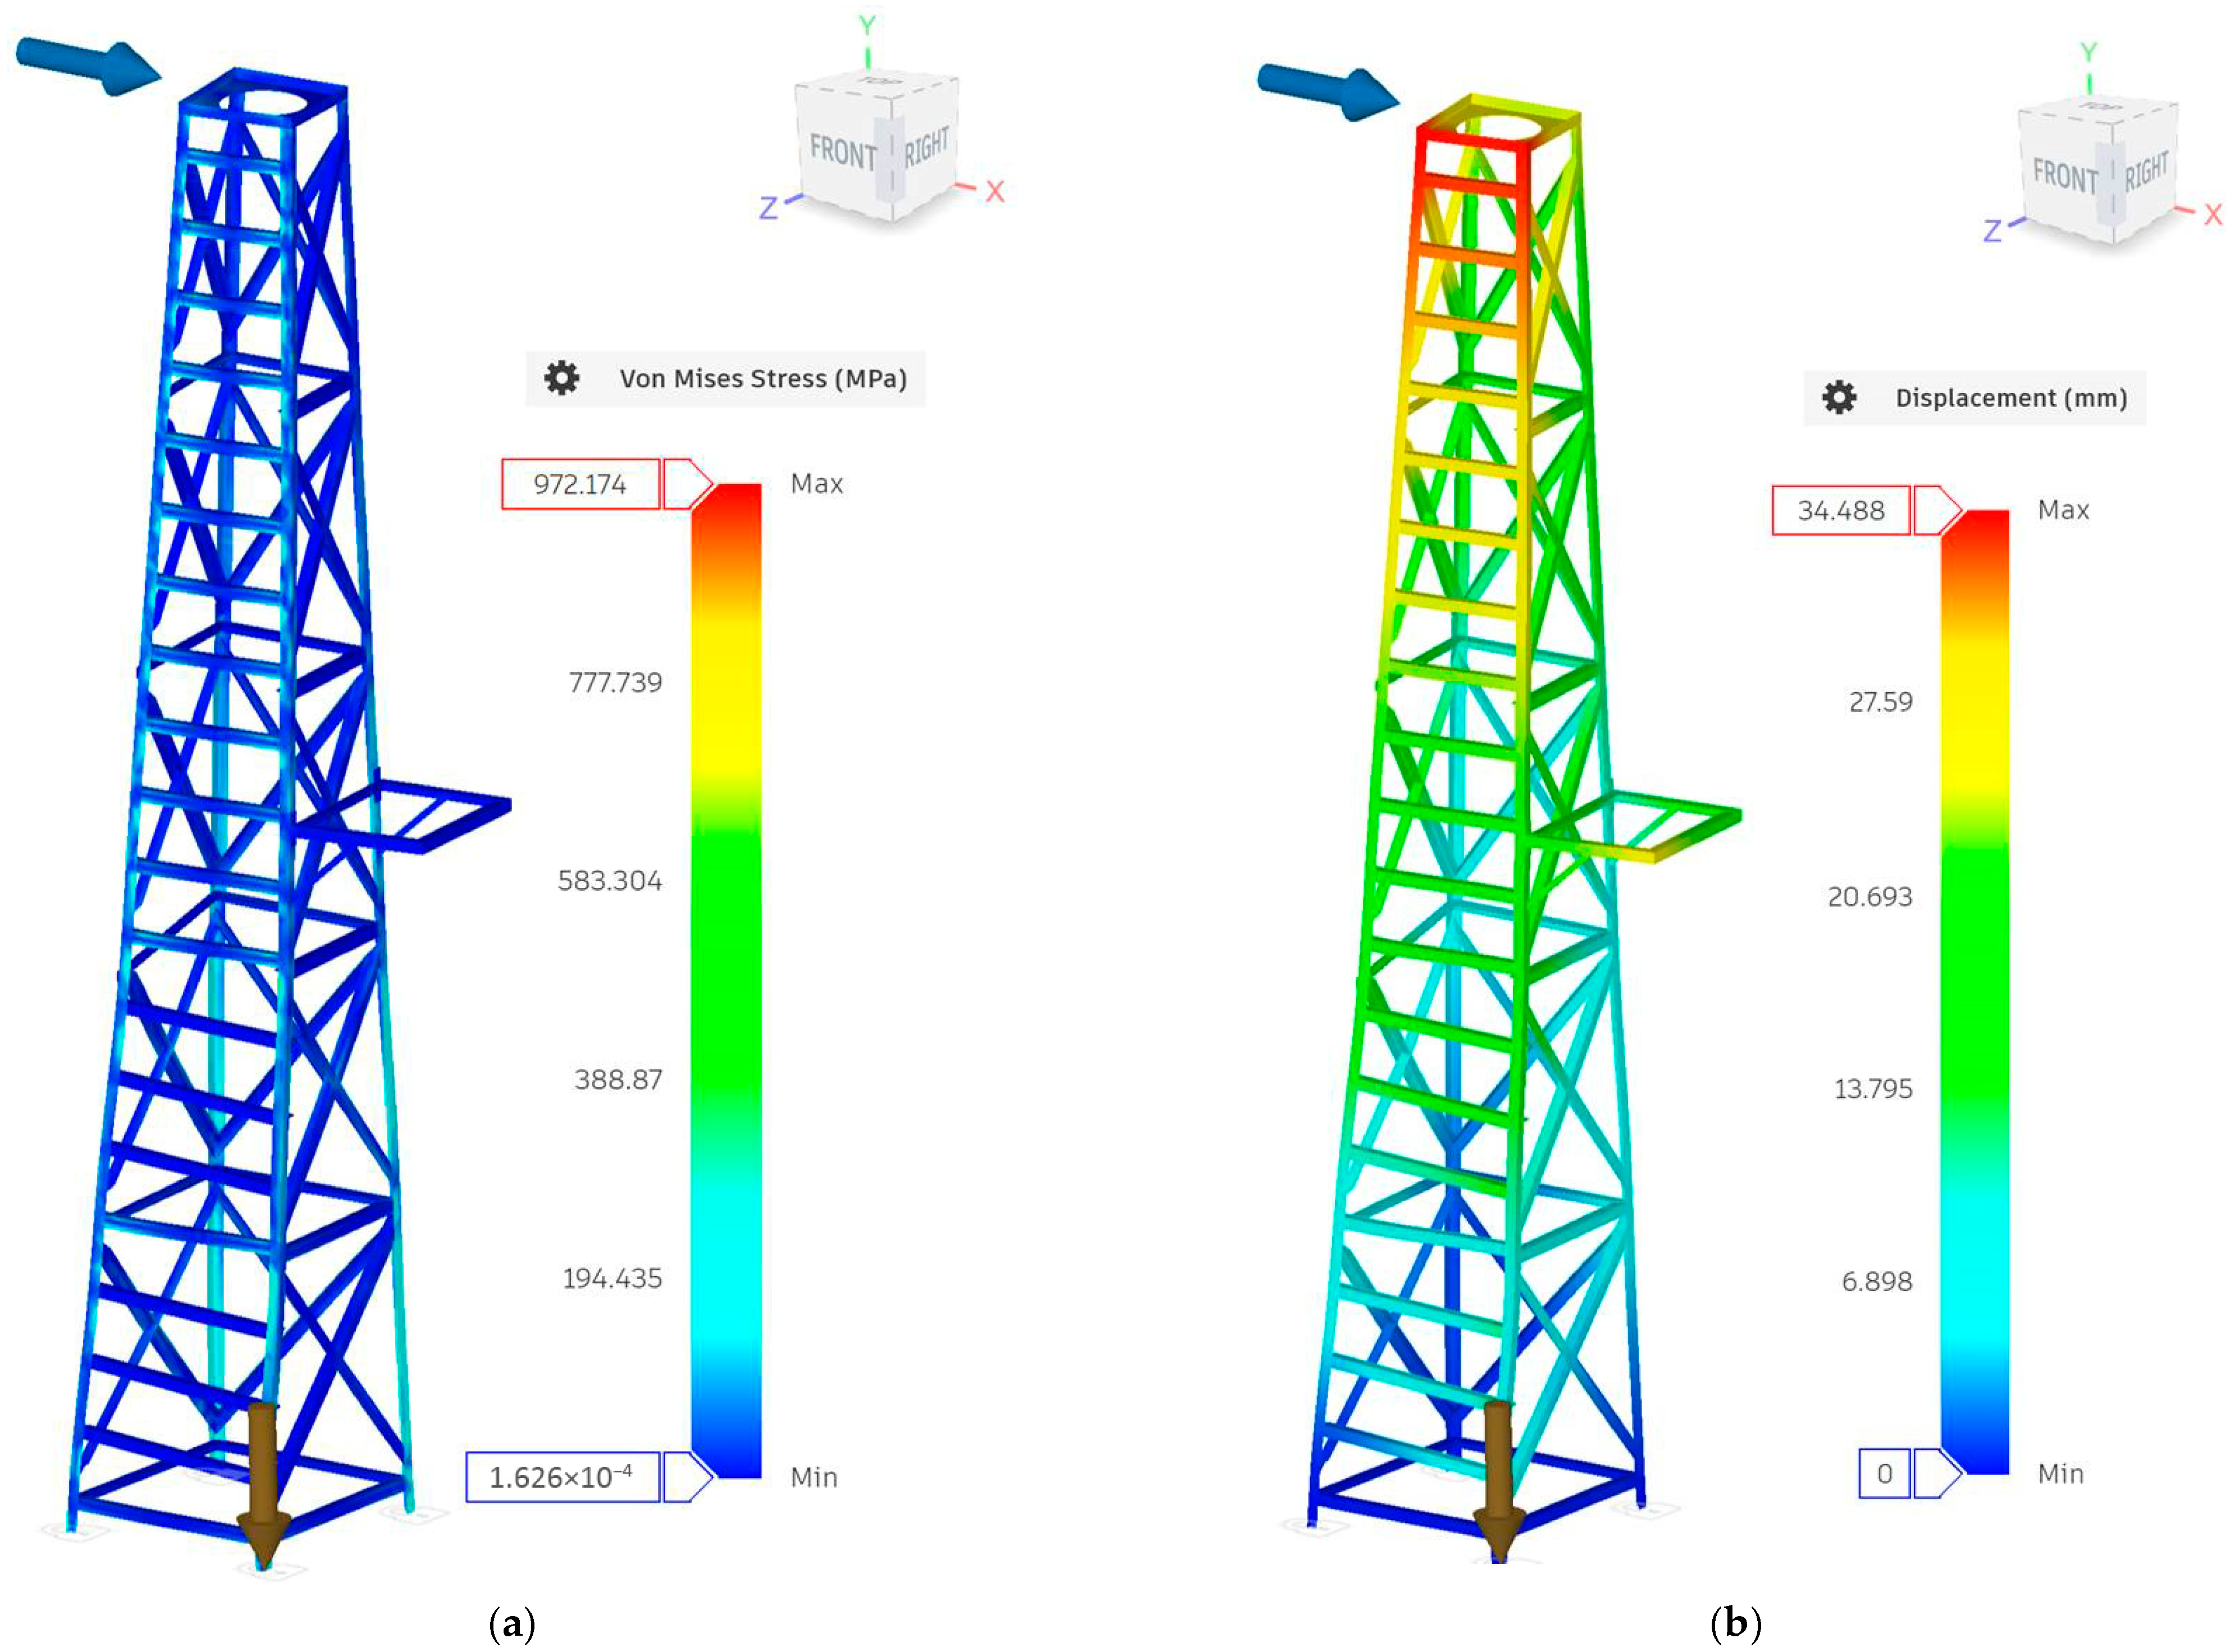
Under the same loading conditions applied during the non-destructive testing of the windmill sail rotor assembly, all additional structural and functional subsystems were likewise tested, including the tail vane (Figure 25), the nacelle (Figure 26), the support tower (Figure 27), the yaw mechanism, and the control and safety systems.
Figure 25, Figure 26 and Figure 27 present finite element analysis (FEA) results for the tail vane, nacelle, and support tower under extreme loading conditions of 40 m/s wind speed, 80 RPM rotor speed, and 22.22% solidity ratio, simulating non-destructive structural testing of the windmill subsystems. For the tail vane analysis (Figure 25), strength tests evaluate the rudder’s response to aerodynamic loads from the electromechanical actuator and misalignment forces, confirming structural integrity without failure. Von Mises stresses remain below yield limits for the steel lattice, with maximum deformations localized at the pivot bushings. This validates the tail’s role in passive load shedding by yawing the rotor away from extreme winds. For the nacelle analysis (Figure 26), tests reveal stress concentrations at rotor bearing mounts and gearbox interfaces under combined torque (2463.51 N·m) and axial thrust (9101.67 N), yet the factor of safety exceeds 2.0 across lattice members. Deformation patterns indicate minimal shaft misalignment, preserving alignment during extreme events. The pyramidal cable bracing effectively distributes hub loads to the yaw ring. For the support tower analysis (Figure 27), simulations under full overturning moments show principal stresses peaking at the base bolts and crown ring, with deflections under 1% of height. Lattice bracing prevents buckling, and the four-legged design enhances stability against Lasithi Plateau gusts. Results affirm the reinforced concrete foundation’s adequacy for cyclic loading. Overall these results demonstrate a robust FEA validation of the windmill’s structural hierarchy, integrating prior CFD-derived loads.

3.5. Comparative Analysis with a Conventional Rigid-Blade Microturbine Generator

To provide context for the performance of the traditional Lasithi-type windmill, a comparative analysis with a conventional rigid-blade microturbine is presented (Table 7). While rigid turbines are optimized for high-speed electricity generation, the Lasithi windmill’s unique ‘sail-wing’ design offers distinct advantages in specific operational regimes.
Conventional rigid turbines often require complex pitch control systems to maintain efficiency and safety in varying winds. In contrast, the Lasithi windmill utilizes the passive aeroelasticity of its triangular sails. As wind speed increases, the sail’s deformation naturally modifies the angle of attack and camber, acting as a self-regulating mechanism that prevents structural failure without electronic sensors. A rigid microturbine of the same diameter (5.5 m) would likely produce more power at high wind speeds due to higher lift-to-drag ratios of specialized airfoils (e.g., NACA profiles). However, the Lasithi windmill excels in low-speed, high-torque applications. Its ability to capture energy in light Cretan breezes, where a rigid turbine might remain stationary, makes it more effective for consistent, long-term energy harvesting in specific microclimates. As discussed in the context of nonlinear frequency domain methods [35], rigid blades are susceptible to flutter and vibration at specific frequencies. The high damping ratio of the fabric sails in the Lasithi design inherently suppresses these aeroelastic instabilities, leading to a milder mechanical response that extends the fatigue life of the traditional supporting structure.

4. Conclusions

The current work advances the understanding of traditional Cretan horizontal-axis windmills from the Lasithi Plateau, with their design evolving from historical water-pumping applications to modern electricity generation while preserving cultural heritage. High-resolution WRF-WAsP modeling reveals that Lasithi’s wind regime features 4–7 m/s averages with extreme gusts to 40 m/s, suitable for resilient small-scale rotors. CFD analyses at nominal (12 m/s, 55 RPM) and extreme conditions confirm aeroelastic sail deformation as a passive load-shedding mechanism, yielding Cp up to 0.08 and torque of 355 N·m with grid-independent solution. Structural FEA validates the lattice tower, nacelle, and tail under 9100 N thrust and 2463 N·m torque, showing safety factors > 2.0 and deflections < 1% height. The 5.5 m diameter rotor integrates six triangulated arms with polyester sails (22–46% solidity), elastic ropes, and active tail yaw for gust protection, complemented by oversized generators and dump loads. CNC-fabricated steel lattices simplify assembly, enabling off-grid battery storage or hybrid pumping systems compliant with Hellenic regulations. The flexible-sail windmills demonstrate self-regulating robustness. These findings conjoin historical engineering with sustainable microgrids, promoting low-cost, culturally resonant renewables for rural electrification and heritage preservation worldwide.

Author Contributions

Conceptualization, C.C. (Constantinos Condaxakis), I.N., G.V.K. and D.K.; methodology, C.C. (Constantinos Condaxakis), I.N., G.V.K., C.C. (Christos Chrysoulakis), G.C., E.D., N.P. and D.K.; software, C.C. (Constantinos Condaxakis), I.N., G.V.K., N.P. and D.K.; validation, C.C. (Constantinos Condaxakis), I.N., G.V.K., N.P. and D.K.; formal analysis, C.C. (Constantinos Condaxakis) and G.V.K.; investigation, C.C. (Constantinos Condaxakis) and G.V.K.; resources, C.C. (Constantinos Condaxakis), G.V.K., C.C. (Christos Chrysoulakis), G.C. and E.D.; data curation, C.C. (Constantinos Condaxakis) and G.V.K.; writing—original draft preparation, G.V.K. and C.C. (Constantinos Condaxakis); writing—review and editing, G.V.K. and C.C. (Constantinos Condaxakis); visualization, C.C. (Constantinos Condaxakis), I.N. and G.V.K.; supervision, C.C. (Constantinos Condaxakis), I.N. and D.K.; project administration, C.C. (Constantinos Condaxakis), I.N. and D.K.; funding acquisition, C.C. (Constantinos Condaxakis), I.N. and D.K. All authors have read and agreed to the published version of the manuscript.

Funding

The work presented is based on research conducted within the framework of the Horizon Europe European Commission project CRETE VALLEY (Grant Agreement No. 101136139). The content of this paper is the sole responsibility of its authors and does not necessary reflect the views of the EC.

Data Availability Statement

Data available from corresponding author upon reasonable request.

Conflicts of Interest

The authors declare no conflicts of interest.

References

  1. Rossi, C.; Russo, F.; Savino, S. Windmills: Ancestors of the wind power generation. Front. Mech. Eng. 2017, 12, 389–396. [Google Scholar] [CrossRef] [Scilit]
  2. Kanaki, M.T.; Probert, S.D. Cretan windmills. Appl. Energy 1979, 5, 215–222. [Google Scholar] [CrossRef] [Scilit]
  3. Fleming, P.D.; Probert, S.D. Design and performance of a small shrouded cretan windwheel. Appl. Energy 1982, 10, 121–139. [Google Scholar] [CrossRef] [Scilit]
  4. Calvert, N.G. The characteristics of a sail mill. J. Wind Eng. Ind. Aerodyn. 1978, 3, 79–84. [Google Scholar] [CrossRef] [Scilit]
  5. Ghosh, P.; Kamoji, M.A.; Date, A.W.; Prabhu, S.V. Experimental Investigations on Sail Type Wind-Turbines. Wind. Eng. 2009, 33, 349–359. [Google Scholar] [CrossRef] [Scilit]
  6. Rojas-Sola, J.I.; Bouza-Rodríguez, J.B.; Menéndez-Díaz, A. Technical and functional analysis of Spanish windmills: 3D modeling, computational-fluid-dynamics simulation and finite-element analysis. Energy Convers. Manag. 2016, 123, 130–139. [Google Scholar] [CrossRef] [Scilit]
  7. Skapoula, A.; Katsigianni, P.; Van den Broeck, P. Bridging the Gaps Between Past and Present for a Sustainable Future Energy Transition and the Case of the Lassithi Plateau; KU Leuven: Leuven, Belgium; Faculteit Wetenschappen: Leuven, Belgium, 2024. [Google Scholar]
  8. Demelis, N. The Restoration and Sustainable Development of the Traditional Aeolian Park of Lassithi Plateau, Crete (Greece). Past, Present, Future; Universita degli Studi di Milano-Bicocca: Milan, Italy, 2017. [Google Scholar]
  9. Fleming, P.D.; Probert, S.D. Flexible sail wind-turbines: Review of pertinent theoretical analyses. Appl. Energy 1984, 18, 89–99. [Google Scholar] [CrossRef] [Scilit]
  10. Kozyrakis, G.V.; Condaxakis, C.; Parasyris, A.; Kampanis, N.A. Wind Resource Assessment over the Hellenic Seas Using Dynamical Downscaling Techniques and Meteorological Station Observations. Energies 2023, 16, 5965. [Google Scholar] [CrossRef] [Scilit]
  11. Kozyrakis, G.V.; Spanoudaki, K.; Varouchakis, E.A. Long-term wave energy potential estimation in the Aegean and Ionian seas using dynamic downscaling and wave modelling techniques. Appl. Ocean Res. 2023, 131, 103446. [Google Scholar] [CrossRef] [Scilit]
  12. Skamarock, W.C.; Klemp, J.B.; Dudhia, J.; Gill, D.O.; Barker, M.; Duda, K.G.; Huang, Y.; Wang, W.; Powers, J.G. A Description of the Advanced Research WRF Version 3; University Corporation for Atmospheric Research location: Boulder, CO, USA, 2008; pp. 1–113. [Google Scholar]
  13. Copernicus Climate Change Service(C3S). ERA5: Fifth Generation of ECMWF Atmospheric Reanalyses of the Global Climate; Copernicus Climate Change Service(C3S): The Hague, The Netherlands, 2019. [Google Scholar]
  14. García-Díez, M.; Fernández, J.; San-Martín, D.; Herrera, S.; Gutiérrez, J.M. Assessing and Improving the Local Added Value of WRF for Wind Downscaling. J. Appl. Meteorol. Climatol. 2015, 54, 1556–1568. [Google Scholar] [CrossRef] [Scilit]
  15. Lorenz, T.; Barstad, I. A dynamical downscaling of ERA-Interim in the North Sea using WRF with a 3 km grid—For wind resource applications. Wind Energy 2016, 19, 1945–1959. [Google Scholar] [CrossRef] [Scilit]
  16. Karapidakis, E.; Markaki, M.; Kikaki, A.; Yfanti, S.; Nikologiannis, M. Introduction of Electricity Storage and Photovoltaics for an Adequate Self-Sufficiency in Large Building Complexes. WSEAS Trans. Environ. Dev. 2024, 20, 37–45. [Google Scholar] [CrossRef] [Scilit]
  17. Karapidakis, E.; Nikologiannis, M.; Markaki, M.; Kikaki, A.; Yfanti, S. Assessment of Batteries’ Contribution for Optimal Self-Sufficiency in Large Building Complexes. Appl. Syst. Innov. 2023, 6, 107. [Google Scholar] [CrossRef] [Scilit]
  18. Karapidakis, E.; Nikologiannis, M.; Markaki, M.; Kouzoukas, G.; Yfanti, S. Enhancing Renewable Energy Integration and Implementing EV Charging Stations for Sustainable Electricity in Crete’s Supermarket Chain. Energies 2025, 18, 754. [Google Scholar] [CrossRef] [Scilit]
  19. Yfanti, S.; Sakkas, N.; Karapidakis, E. An event-driven approach for changing user behaviour towards an enhanced building’s energy efficiency. Buildings 2020, 10, 183. [Google Scholar] [CrossRef] [Scilit]
  20. Yfanti, S.; Katsaprakakis, D.; Sakkas, N.; Condaxakis, C.; Karapidakis, E.; Syntichakis, S.; Stavrakakis, G.M. The Role of Energy Communities in the Achievement of a Region’s Energy Goals: The Case of a Southeast Mediterranean Region. Energies 2025, 18, 1327. [Google Scholar] [CrossRef] [Scilit]
  21. Thompson, G.; Rasmussen, R.M.; Manning, K. Explicit Forecasts of Winter Precipitation Using an Improved Bulk Microphysics Scheme. Part I: Description and Sensitivity Analysis. Mon. Weather Rev. 2004, 132, 519–542. [Google Scholar] [CrossRef] [Scilit]
  22. Kain, J.S. The Kain–Fritsch Convective Parameterization: An Update. J. Appl. Meteorol. 2004, 43, 170–181. [Google Scholar] [CrossRef] [Scilit]
  23. Mlawer, E.J.; Taubman, S.J.; Brown, P.D.; Iacono, M.J.; Clough, S.A. Radiative transfer for inhomogeneous atmospheres: RRTM, a validated correlated-k model for the longwave. J. Geophys. Res. Atmos. 1997, 102, 16663–16682. [Google Scholar] [CrossRef] [Scilit]
  24. Dudhia, J. Numerical Study of Convection Observed during the Winter Monsoon Experiment Using a Mesoscale Two-Dimensional Model. J. Atmos. Sci. 1988, 46, 3077–3107. [Google Scholar] [CrossRef] [Scilit]
  25. Hong, S.-Y.; Noh, Y.; Dudhia, J. A New Vertical Diffusion Package with an Explicit Treatment of Entrainment Processes. Mon. Weather Rev. 2006, 134, 2318–2341. [Google Scholar] [CrossRef] [Scilit]
  26. Tewari, M.; Chen, F.; Wang, W.; Dudhia, J.; LeMone, M.; Mitchell, K.; Ek, M.; Gayno, G.; Wegiel, J. Implementation and verification of the unified NOAH land surface model in the WRF model (Formerly Paper Number 17.5). In Proceedings of the 20th Conference on Weather Analysis and Forecasting/16th Conference on Numerical Weather Prediction, Seattle, WA, USA, 12–16 January 2004; pp. 11–15. [Google Scholar]
  27. OFR 2011-1073: 2011; Global Multi-Resolution Terrain Elevation Data 2010 (GMTED2010). US Geological Survey: Reston, VA, USA, 2011.
  28. Friedl, M.A.; Sulla-Menashe, D.; Tan, B.; Schneider, A.; Ramankutty, N.; Sibley, A.; Huang, X. MODIS Collection 5 global land cover: Algorithm refinements and characterization of new datasets. Remote Sens. Environ. 2010, 114, 168–182. [Google Scholar] [CrossRef] [Scilit]
  29. Mortensen, N.G.; Heathfield, D.N.; Rathmann, O.S.; Nielsen, M. Wind Atlas Analysis and Application Program: WAsP 10 Help Facility; DTU Wind Energy: Roskilde, Denmark, 2011. [Google Scholar]
  30. Le Gouriérès, D. Energie Éolienne: Théorie, Conception et Calcul Pratique des Installations/Désiré Le Gourières, 2nd ed.; Eyrolles: Paris, France, 1982. [Google Scholar]
  31. Serra, M.F.G.; van Schoor, M.C. Aeroelastic Tailoring of a Horizontal Axis Wind Turbine. Wind Eng. 1995, 19, 193–207. [Google Scholar]
  32. Dassault, S. SOLIDWORKS Flow Simulation 2025: Technical Reference; Dassault Systemes SOLIDWORKS Corp.: Waltham, MA, USA, 2025. [Google Scholar]
  33. Koletsis, I.; Lagouvardos, K.; Kotroni, V.; Bartzokas, A. The interaction of northern wind flow with the complex topography of Crete Island—Part 1: Observational study. Nat. Hazards Earth Syst. Sci. 2009, 9, 1845–1855. [Google Scholar] [CrossRef] [Scilit]
  34. Kotroni, V.; Lagouvardos, K.; Lalas, D. The effect of the island of Crete on the Etesian winds over the Aegean Sea. Q. J. R. Meteorol. Soc. 2001, 127, 1917–1937. [Google Scholar] [CrossRef]
  35. Win Naung, S.; Rahmati, M.; Farokhi, H. Nonlinear frequency domain solution method for aerodynamic and aeromechanical analysis of wind turbines. Renew. Energy 2021, 167, 66–81. [Google Scholar] [CrossRef] [Scilit]
Figure 1. Historical photograph (circa 1970s) of the windmill park in Lasithi Plateau in Crete, Greece.
Energies 19 00829 g001
Figure 2. Geographical location of the Lasithi Plateau (red rectangle) on the island of Crete, Greece.
Energies 19 00829 g002
Figure 3. (a) Traditional windmill structure elements; (b) 3D scanning process to capture all the technical details in a traditional windmill.
Energies 19 00829 g003
Figure 4. The 5.5 m diameter windmill geometry with 22.22% solidity ratio.
Energies 19 00829 g004
Figure 5. (a) Support tower; (b) tower crown; (c) mid-height platform.
Energies 19 00829 g005
Figure 6. Nacelle steel lattice structure.
Energies 19 00829 g006
Figure 7. Windmill rotor aft detail.
Energies 19 00829 g007
Figure 8. Windmill principal components categorization. Component numbering is also cited in Table 3.
Energies 19 00829 g008
Figure 9. Safety mechanism for the windmill operation. The diagram illustrates the electrical connections between the windmill, charge controller, dump load, and battery bank. Positive DC power paths are shown in red. Arrows indicate the direction of power flow.
Energies 19 00829 g009
Figure 10. Safety precaution mechanisms: use of elastic ropes marked here by the red arrow.
Energies 19 00829 g010
Figure 11. Safety precaution mechanisms: (a) normal tail position, (b) adjusted tail angle.
Energies 19 00829 g011
Figure 12. Grid connectivity diagram.
Energies 19 00829 g012
Figure 13. Use of the proposed windmill’s energy output in pumping stations.
Energies 19 00829 g013
Figure 14. Mean annual wind speed (10 m a.g.l.) and direction vectors over Crete (WRF 3 km). The coastline is depicted by the thick white line. The arrows depict the prevailing wind direction.
Energies 19 00829 g014
Figure 15. Seasonal mean wind speed and predominant direction over Crete: (a) winter; (b) spring; (c) summer; (d) autumn. The coastline is depicted by the thick white line. The arrows depict the prevailing wind direction.
Energies 19 00829 g015
Figure 16. Wind rose (a) and Weibull distribution (b) at 10 m above ground level resulting from the long-term estimation.
Energies 19 00829 g016
Figure 17. Topographic and wind potential map of the Lasithi Plateau area.
Energies 19 00829 g017
Figure 18. Peripheral wind speed adjacent to surfaces (flow at nominal conditions: 12 m/s, 55 RPM, 22.22% solidity ratio).
Energies 19 00829 g018
Figure 19. Pressure distribution over the upwind surface of the sails (flow at nominal conditions: 12 m/s, 55 RPM, 22.22% solidity ratio).
Energies 19 00829 g019
Figure 20. Detailed view of the pressure distribution over the upper surface of the sail (flow at nominal conditions: 12 m/s, 55 RPM, 22.22% solidity ratio).
Energies 19 00829 g020
Figure 21. Detail of the velocity contours and streamlines over the upper cut-plane revealing strong recirculating near wake flow downwind of the hub (flow at nominal conditions: 12 m/s, 55 RPM, 22.22% solidity ratio).
Energies 19 00829 g021
Figure 22. Isometric (left) and top-down (right) view of flow particle trajectories around the sail rotor (flow at nominal conditions: 12 m/s, 55 RPM, 45.71% solidity ratio).
Energies 19 00829 g022
Figure 23. Isometric view of flow particle trajectories around the sail rotor (flow at nominal conditions: 12 m/s, 55 RPM, 22.22% solidity ratio).
Energies 19 00829 g023
Figure 24. Velocity contours and streamlines over a quarter of the rotor diameter cut-plane revealing recirculating near wake flow of the sail and peripheral wake circulation (flow at extreme conditions: 40 m/s, 80 RPM, 22.22% solidity ratio).
Energies 19 00829 g024
Figure 25. Tail strength tests (a: Tail, b: Arm), simulated under extreme flow conditions (40 m/s, 80 RPM, 22.22% solidity ratio). Arrows depict the load type and direction.
Energies 19 00829 g025
Figure 26. Nacelle strength tests, simulated under extreme flow conditions (40 m/s, 80 RPM, 22.22% solidity ratio).
Energies 19 00829 g026
Figure 27. Support tower tests ((a): Von Mises Stress distribution, (b): Displacement in mm), simulated under extreme flow conditions (40 m/s, 80 RPM, 22.22% solidity ratio).
Energies 19 00829 g027
Table 1. Main setup parametrization.
ParametersOptimal Wind Speed CasesExtreme Wind Speed Cases
Rotor Diameter (m)5.50
Rotor Swept Area (m2)23.758
Active Sail Area (m2)5.280
Solidity Ratio (%)22.224, 45.71
Air Density (kgr/m3)1.225
Reynolds No.4.467 × 1062.978 × 107
Wind speed (m/s)12.0040.00
Rotational Speed (RPM)0.00–80.000.00–80.00
Tip Speed Ratio0.00–2.000.00–0.60
Static Pressure (Pa)101,325.00101,325.00
Turbulence Intensity (%)12.0012.00
Turbulence Length (m)0.3850.385
Wall BCNo-slip BCs, with relative rotation
Turbulence ModelModified k-ε
Near-Wall TreatmentAutomatic wall functions
Numerical Schemes2nd-order upwind for momentum/continuity; 2nd-order central for diffusion
Time IntegrationSteady-state RANS using Local Rotating Regions (Averaging) for rotor motion
Convergence CriteriaResiduals < 1× 10⁻⁵ (continuity/momentum); Force Monitor < 0.1% change over 100 iterations; Goals (torque/power) stable < 0.5%
Table 2. Plain carbon steel and Precontraint 705 material properties.
Material PropertyPlain Carbon Steel Tower MaterialPrecontraint 705 Sail Material
Elastic Modulus
(Nt/m2)
2.100 × 10111.050 × 1011
Poisson’s Ratio (-)0.280.40
Shear Modulus
(Nt/m2)
7.900 × 10102.600 × 1010
Mass Density
(Kgr/m3)
7.800 × 1031.050 × 103
Tensile Strength
(Nt/m2)
3.9983 × 1082.000 × 107
Yield Strength
(Nt/m2)
2.2059 × 1082.000 × 107
Thermal Expansion Coefficient
(/K)
1.300 × 10⁻⁵-
Thermal Conductivity
(W/(m·K))
43.000.32
Specific Heat
(J/(kgr·K))
440.001842.00
Table 3. Principal dimensions of geometric and global parameters. Component numbering corresponds to Figure 8.
Component/CategoryParameter DescriptionValue/Dimension
Rotor (1)Rotor Diameter5.50 m
Rotor Swept Area23.758 m2
Number of Radial Arms6
Collar Connection Radius (from center)350 mm
Peripheral Steel Cable Diameter6 mm
Interconnecting Steel Cable Diameter5 mm
Hub Height7 m
Sails (2)Active Sail Area (Nominal)5.28 m2
Active Sail Area (Unfurled/Max)10.86 m2
Solidity Ratio (Nominal)22.22%
Solidity Ratio (Unfurled/Max)45.71%
Tail and Control System (3)Tail Vane Pivot Shaft Diameter20 mm
Tail Actuator Anchor Distance (from pivot)720 mm
Control Spring Stiffness1660 N/m
Main Shaft (4) Total Length 640 mm
Maximum Diameter 60 mm
Support Diameters 50 mm
Connection Length (Transmission) 410 mm
Keyway Depth 4 mm
Central Hub (5) Flange Diameter 300 mm
Total Length 260 mm
Shaft Placement Diameter 50 mm
Reinforcement Plate Thickness 10 mm
Mounting Hole Diameter 12 mm
Rigging Component (6) Total Length 1600 mm
Pipe Specification 2′′ Green Pipe
Flange Diameter 120 mm
Flange Thickness 8 mm
Torque Connector (7) Outer Diameter 701 mm
Profile Specification Angle 40 × 40 × 4 mm
Computational DomainUpstream Boundary Distance5 × Rotor Diameters
Downstream Boundary Distance15 × Rotor Diameters
Lateral Boundary Distance5.5 × Rotor Diameters
Total Domain Width11 × Rotor Diameters
Table 4. Statistical metrics based on the 10 m a.g.l. wind speed distribution, for terrestrial stations in the vicinity of Lasithi Plateau [10,11].
MetricWRF 3 km vs. Met. StationsWRF vs. ERA5
Bias (m/s)−0.57 to +1.30+0.61 to +2.13
RMSE (m/s)1.08–3.811.83–3.32
Correlation (r)0.51–0.870.40–0.79
MAE (m/s)-1.12–1.45
Table 5. BEM theory resulting geometry.
Section No.Distance from Hub (mm)AoA
(deg)
Cord Length (mm)Thickness (mm)Thickness (%)
1275.0532.75417.26151.8036.00
2550.1127.65616.01142.6023.00
3825.1623.36686.75133.4419.00
41100.2119.92682.81124.2818.00
51375.2617.42657.73115.1017.00
61650.3215.60646.41105.5816.00
71925.3714.39627.3096.1315.00
82200.4213.66631.3687.5413.00
92475.4713.32644.4278.3612.00
102750.5313.28687.1068.7110.00
Table 6. Torque and power numerical results with respect to grid resolution for grid independency testing.
GridFluid CellsSolid CellsTotal CellsRequired IterationsTorque (Nt·m)Power (Watt)CpCq
178,374381782,191600172.41993.020.03950.0299
2185,98915,076201,065800230.231326.050.05270.04
3243,85918,999262,8581000234.81352.330.05380.0407
42,750,49325,1932,775,6861400294.641696.980.06750.0511
52,949,99292,6353,042,6271400351.882026.710.08060.0611
63,667,173704,7114,371,8841600349.922015.420.08010.0607
73,878,556850,5494,729,1051600350.832020.640.08040.0609
84,440,7421,043,6675,484,4091800355.822049.390.08150.0617
Table 7. Comparative analysis of the Lasithi sail windmill with a conventional rigid-blade microturbine generator.
FeatureLasithi Sail Windmill (Flexible)Conventional Microturbine (Rigid)
Startup Wind SpeedVery Low (<2–3 m/s): Due to high torque at low RPM.Higher (>3.5–4 m/s): Requires higher inertia to overcome static friction.
Aerodynamic ProfileAdaptive (Passive): Sail curvature changes with wind pressure, delaying stall.Fixed: Optimized for a narrow range of Tip Speed Ratios (TSRs).
Structural LoadLoad Shedding: Flexible sails ‘spill’ excess wind in high gusts, protecting the chassis.Rigid Response: Higher stress on the root and hub during sudden gusts.
Power Coefficient (Cp)Moderate (~0.25–0.35)High (~0.40–0.45)
Optimal TSR RangeLow (1.5–2.5): High torque/low speed, ideal for pumping or high-torque gen.High (5–8): Low torque/high speed, ideal for modern grid alternators.
Disclaimer/Publisher’s Note: The statements, opinions and data contained in all publications are solely those of the individual author(s) and contributor(s) and not of MDPI and/or the editor(s). MDPI and/or the editor(s) disclaim responsibility for any injury to people or property resulting from any ideas, methods, instructions or products referred to in the content.