


Abstract
Distributed energy systems (DES), such as photovoltaics (PV), heat pumps (HPs), and electric vehicles (EVs), are being rapidly integrated into low-voltage (LV) grids, while measurement coverage remains limited. This paper presents a concept for an LV grid digital twin designed to enable real-time state estimation (SE) and operation-oriented studies under constrained measurement availability. Based on this concept, an exemplary digital twin is developed and demonstrated for a test area with a high PV penetration. The proposed digital twin integrates a topology-aware grid model, realistic parameterization, standardized IEC 61850 data modeling, and a real-time estimation pipeline that processes heterogeneous measurement data, including PV inverter power and voltage as well as transformer and feeder measurements. The approach is demonstrated through software-in-the-loop (SIL) experiments using historical playback and accelerated simulations, as well as hardware-in-the-loop (HIL) tests for real-time operation. The SIL results show that the digital twin enables continuous grid monitoring, enhances transparency for distribution system operators (DSOs), and leverages existing infrastructure to increase the effective PV hosting capacity. Selective PV curtailment mitigates congestion and restores normal operation, indicating a potentially cost-effective alternative to grid reinforcement. The HIL experiments emphasize the importance of high-quality, standardized data. The achieved accuracy depends on data availability and synchronization, highlighting the need for improved data integration. Overall, the proposed approach provides a viable pathway toward data-driven planning and operation of LV grids with high DES penetration.
1. Introduction
The energy supply in Germany, as well as in many other countries, is undergoing a transition toward renewable energy sources. Distribution grids, originally designed decades ago to deliver electricity from large centralized power plants to consumers, are increasingly challenged by the growing integration of decentralized DES, such as PV generators, along with new types of loads, including EVs and HPs. Most of these systems are connected at the distribution level, particularly in LV grids. Consequently, the complexity of LV grid planning and operation is increasing significantly [1].
Reverse power flows can cause operational challenges, such as voltage limit violations and equipment overloading [2,3]. Traditionally, these issues have been addressed through grid reinforcement measures, including the installation of additional lines and transformers. Against this background, the following subsections present the drivers and framework that form the basis of this study.
1.1. Regulatory Drivers for Grid Measurement
Studies have shown that grid integration requires costly grid reinforcement. However, smart grid technologies that utilize measurement data provide flexibility, which can significantly reduce total system costs by deferring or avoiding conventional grid expansion [4]. Real-time SE is expected to play an increasingly important role in future grid management and control applications [5]. Many countries have already recognized the value of real-time measurements for obtaining detailed insights into grid states and have initiated smart meter rollouts accordingly, including Germany [6]. The dynamic data collected from smart meters enable key functionalities such as continuous grid monitoring and proactive congestion management. In Germany, the Metering Point Operation Act [7] legally obliges metering point operators to deploy intelligent metering systems (iMSys). Nevertheless, the development of advanced communication and control infrastructures for distribution grids—particularly at the LV level—remains at an early stage.
1.2. Regulatory Drivers for Real-Time Grid Operation
The §14a of the German Energy Industry Act (EnWG) [8] provides the legal framework for integrating controllable consumer loads (e.g., EV chargers, HPs, and storage systems) into the grid. A central element is the requirement to use smart metering systems that enable measurement, secure communication, and remote control of these devices. Through such metering infrastructure, DSOs can monitor load conditions in real-time and apply temporary reductions in consumption when grid congestion arises. The smart meters thus form the technical backbone for demand-side flexibility, reducing the need for costly grid reinforcement while ensuring stability and transparency in decentralized electricity networks. Before executing a control action under §14a EnWG, the DSOs require a reliable and up-to-date measurement basis. This typically includes the total load at the transformer to detect overall grid congestion, distributed household consumption from smart meters to assess local peaks and variability, and generation output from sources such as PV systems to account for inflows into the grid. Additionally, the status of controllable devices like EV chargers, HPs, and storage systems must be known to determine which units can be modulated, and voltage measurements at key points are needed to ensure grid stability during control actions.
1.3. Regulatory Drivers for PV Functionalities
The European Commission introduced the Regulation (EU) 2016/631, which establishes a common grid code for the grid connection of generators across the EU. This regulation defines the technical requirements for connecting new converter-based generating units to national grids, including PV systems. It specifies the essential capabilities that PV generators must provide in order to contribute to grid stability. In recent years, PV systems have evolved from passive grid integration—characterized by injecting maximum active power and disconnecting during disturbances—toward active grid integration, where they are capable of delivering a broad range of grid support functionalities. These include voltage and frequency ride-through, active and reactive power regulation, and voltage and frequency stabilization, as well as dynamic grid support during both normal operation and disturbance events. According to §9 of the renewable energy law [9], PV systems (>7 kWp) must be remotely controllable.
1.4. Existing Commercial Tools
Discussions with DSOs, such as the local DSO, indicate a consensus that real-time SE down to the LV level will be required within the next five to ten years. This capability would enable active control of distributed systems, support local congestion management, and reduce the need for costly grid reinforcement. In response to these needs, several smart grid technology providers have introduced commercial tools such as [10,11], which are designed to support distribution grid management, particularly at the LV level. These tools offer functionalities such as AI-assisted grid operation, integration of measurement data, and automated control. Nevertheless, their analytical capabilities for grid state assessment and data integration remain limited for research purposes and are primarily tailored to DSO requirements. Moreover, end users have restricted access to internal functionalities, such as calculation methods or internal data modeling. For research purposes, a more flexible environment with open access and extendable functionalities is therefore required.
1.5. State of the Art of Grid Digital Twin
Recent literature has increasingly addressed the application of digital twin technology in electricity distribution systems. A recent review [12] provides a comprehensive overview of digital twin research specifically targeting LV distribution areas and discusses implementation pathways, challenges, and development goals, including monitoring and control functionalities. Furthermore, previous work [13] provides perspectives on digital twins for distributed energy systems that highlight the importance of real-time data integration, observability, and hybrid data-driven approaches for low- and medium-voltage grids. In addition, broader reviews on digital twins for power generation and distribution provide a system-level overview and help contextualize distribution grid digital twin developments within the wider power system domain [14]. These studies together form the contextual foundation for the present work, which focuses on the development and functional validation of a digital twin for LV distribution grids.
1.6. State of the Art of Grid SE
SE has become a fundamental building block for modern distribution grid operation. Due to the lack of comprehensive measurement coverage in LV grids, DSOs cannot reliably detect congestion, validate control actions, or assess the impact of proposed measures. SE addresses these limitations by reconstructing the full grid state through the combination of available measurements, grid models, and suitable estimation algorithms. This enables consistent and reliable approximation of voltages, currents, and power injections across the LV grid. An overview of relevant SE-related work is provided hereinafter. The work in [15] proposes a two-level SE approach that efficiently integrates smart meter data in LV grid SE. First, SE is carried out for each building unit; the results are then uploaded to the cloud. Second, a centralized LV grid SE uses these inputs to determine the feeder state. The method is based on a weighted least squares (WLS) formulation, with uncertainty propagation applied to improve estimation accuracy. The study in [16] uses smart meter data for WLS-based SE in LV grids. Also, considering measurements from the ancillary data at each distributed generation unit, substation at the LV side, and pseudo-measurements in case of data communication problems. For the observability of the grid, an evaluation of the smart meter measurement dependencies of P, Q, and U is conducted. The work in [17] presents a branch-current-based distribution system state estimation (BC-DSSE) approach for LV grids using a multi-area architecture state estimation (MASE). The system is divided into several areas to enable distributed and parallel computation during the Gauss–Newton iterations. Both hierarchical and decentralized coordination schemes are discussed, with estimation carried out using a WLS formulation. The study in [18] introduces a related BC-DSSE method based on phasor measurement units (PMUs). By including the slack-bus voltage as part of the state vector, voltages at the substation can be estimated. The algorithm follows an iterative three-step procedure consisting of equivalent measurement formulation, WLS-based estimation, and voltage computation along the grid graph starting from the slack bus. The work in [19] discusses how to use machine-learning-supported, data-driven SE in order to determine the grid state in the LV grid. Training data are generated by sampling (P, Q) pairs for each load and by running a power solver to obtain the voltage magnitude and voltage angle values. Based on these, a dependency graph is constructed, and the machine learning models can be trained. In order to model real-world input data, realistic load profiles are assigned to each load in the power flow simulation. The approach in [20] introduces a Gaussian mixture model to represent load behavior under different operating scenarios. Smart meter data are used to train the load model, and the extracted parameters are sent to a central dispatching system where a neural network estimates nodal voltages and amplitudes. The study in [21] proposes a linear SE model using smart meter measurements, supplemented by a deep neural network (DNN) to compensate for accuracy losses introduced by linearization. The work in [22] presents an algorithm for linear SE of LV distribution grids based on smart meter data and PV feed-in predictions.
1.7. Research Gap
Integrating large volumes of measurements and heterogeneous data into grid digital twins is essential for improving simulation accuracy and supporting grid operation. However, deploying extensive measurement infrastructures is both complex and costly, making it necessary for DSOs to identify the types and quantities of data required for reliable simulation, particularly for SE. As discussed in Section 1.6, existing studies typically focus either on a single data source, such as smart meter measurements, or on improving SE algorithms for specific datasets. In contrast, the influence of different measurement types and their combinations on SE performance remains insufficiently explored, despite the increasing diversity and volume of available data. Addressing this gap requires, as a first step (i.e., the present work), a flexible environment that supports standardized data integration and real-time SE. This environment provides the technical foundation for future systematic analysis of how different measurement types and their combinations affect SE accuracy.
1.8. Proposed Solution
LV grids, which host the largest share of PV installations, are particularly susceptible to overloading and voltage deviations [23], yet they lack adequate measurement and monitoring infrastructure [24]. To overcome these limitations, real-time SE is required to infer the missing grid states.
This paper presents a concept for a real-time environment for LV grid SE, enabling data collection, monitoring, and congestion management within a grid digital twin environment. Therefore, the proposed concept incorporates a grid model derived from DSO metadata, including transformer, line, load, and PV system data. The digital twin serves as a key instrument to address technical challenges arising from high PV penetration and the increasing integration of DES. By enabling real-time SE, the digital twin enhances congestion management and facilitates higher PV integration.
Compared to commercial solutions (Section 1.4), the proposed approach allows for straightforward and extensible integration of analytical functionalities required for research purposes, as outlined in Section 1.7. Based on this concept, an exemplary grid digital twin is developed and demonstrated in a test area in collaboration with the local DSO, utilizing real data and realistic test conditions.
2. Materials and Methods
The fundamental concept of the proposed grid digital twin, introduced in Section 1.8, along with its components, interfaces, utilized data, and boundary conditions for the exemplary test case, is presented in the following subsections.
2.1. Proposed Structure of Grid Digital Twin
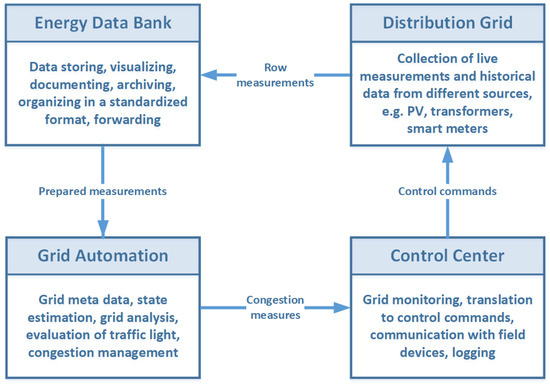
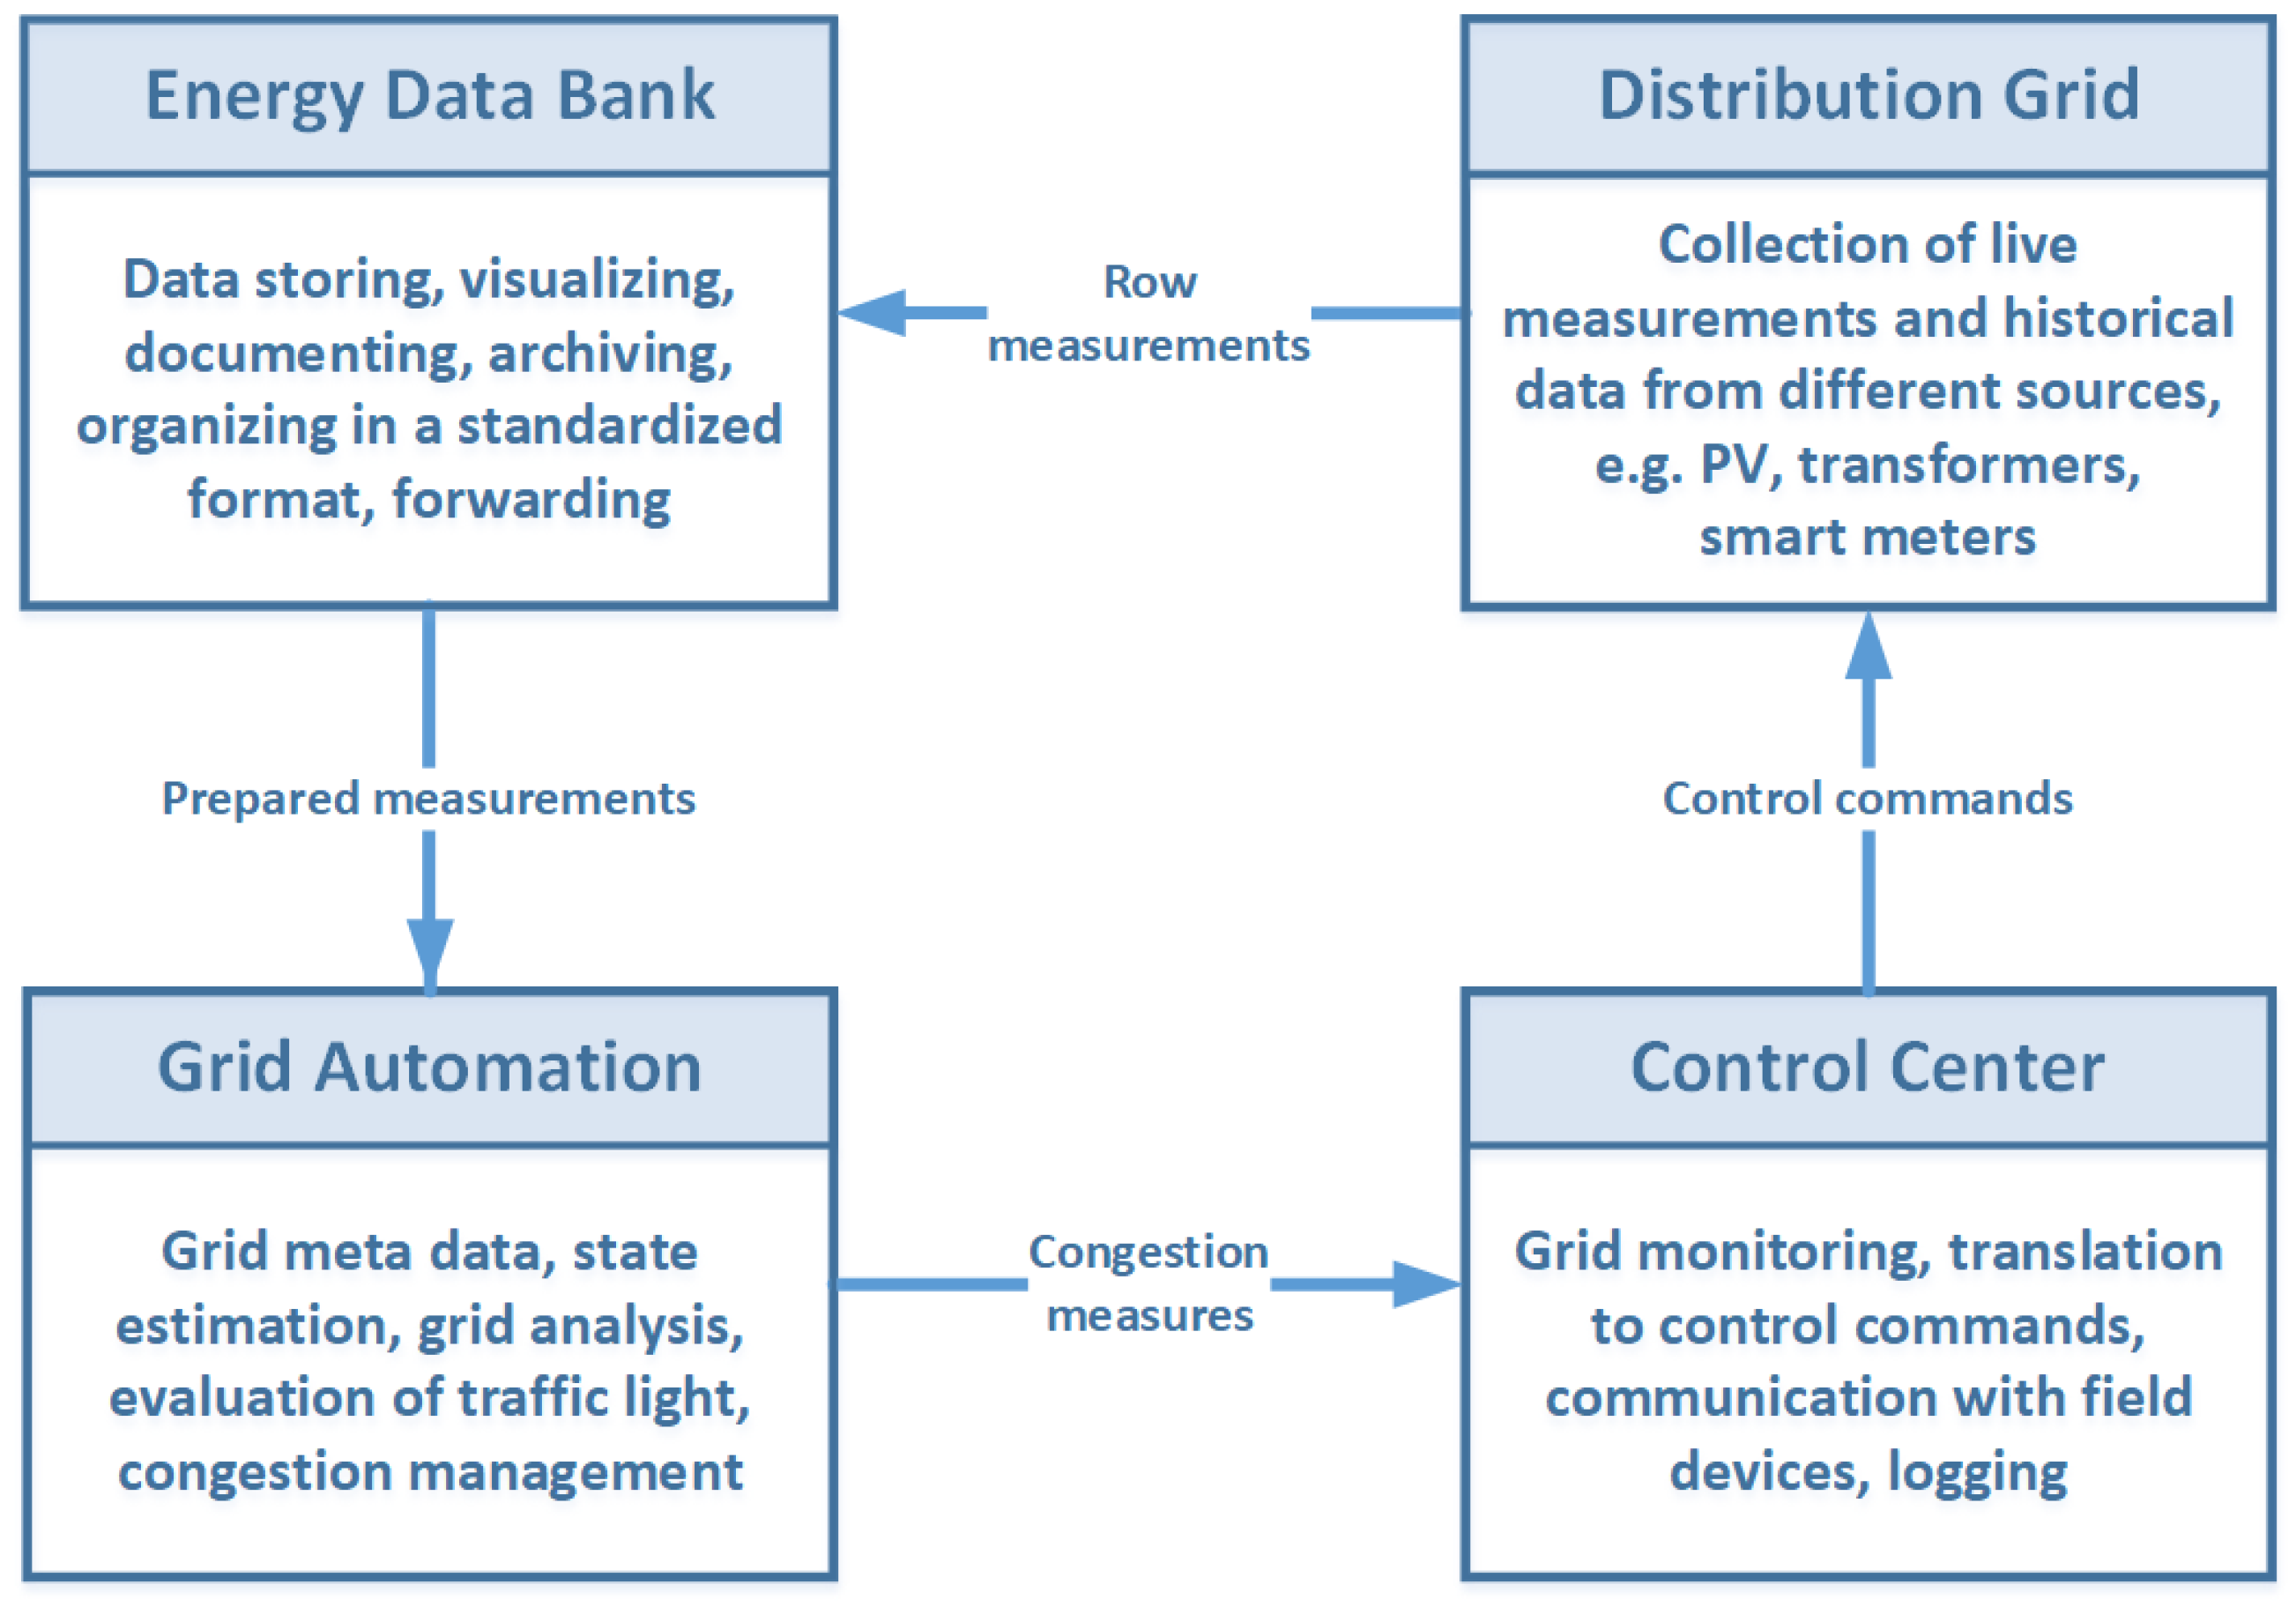
The overall design consists of four key components, as illustrated in Figure 1:
Figure 1.
General architecture of a digital twin environment for LV grids.
A. Distribution Grid: This grid hosts various data sources, including iMSys, manufacturer monitoring platforms of connected PV inverters, transformer measurement devices, and other relevant systems.
B. Energy Data Bank: This component stores the collected grid data for subsequent simulation, documentation, visualization, and other potential applications.
C. Grid Automation: This module hosts the main functionalities of the grid digital twin, based on data retrieved from the Energy Data Bank. Its primary task is to determine the current state of the grid by performing SE using integrated measurements. The grid traffic light status, as described in [25], can be derived from the SE results. In critical grid conditions—such as excessive voltage deviations or component overloading—congestion management actions are triggered and communicated to the control center.
D. Control Center: This system, which is usually employed by any DSO for grid operation, executes control commands directed to the respective controllable systems within the grid. Such measures help mitigate grid irregularities and maintain a stable grid state [26].
2.2. Exemplary Digital Twin Grid
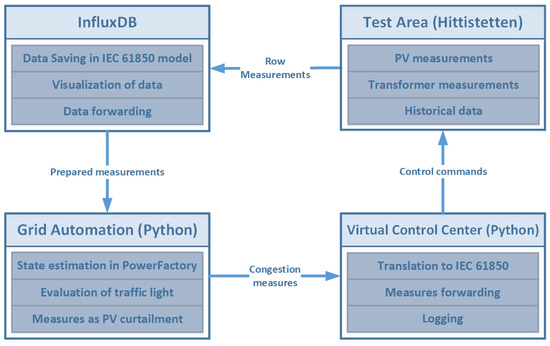
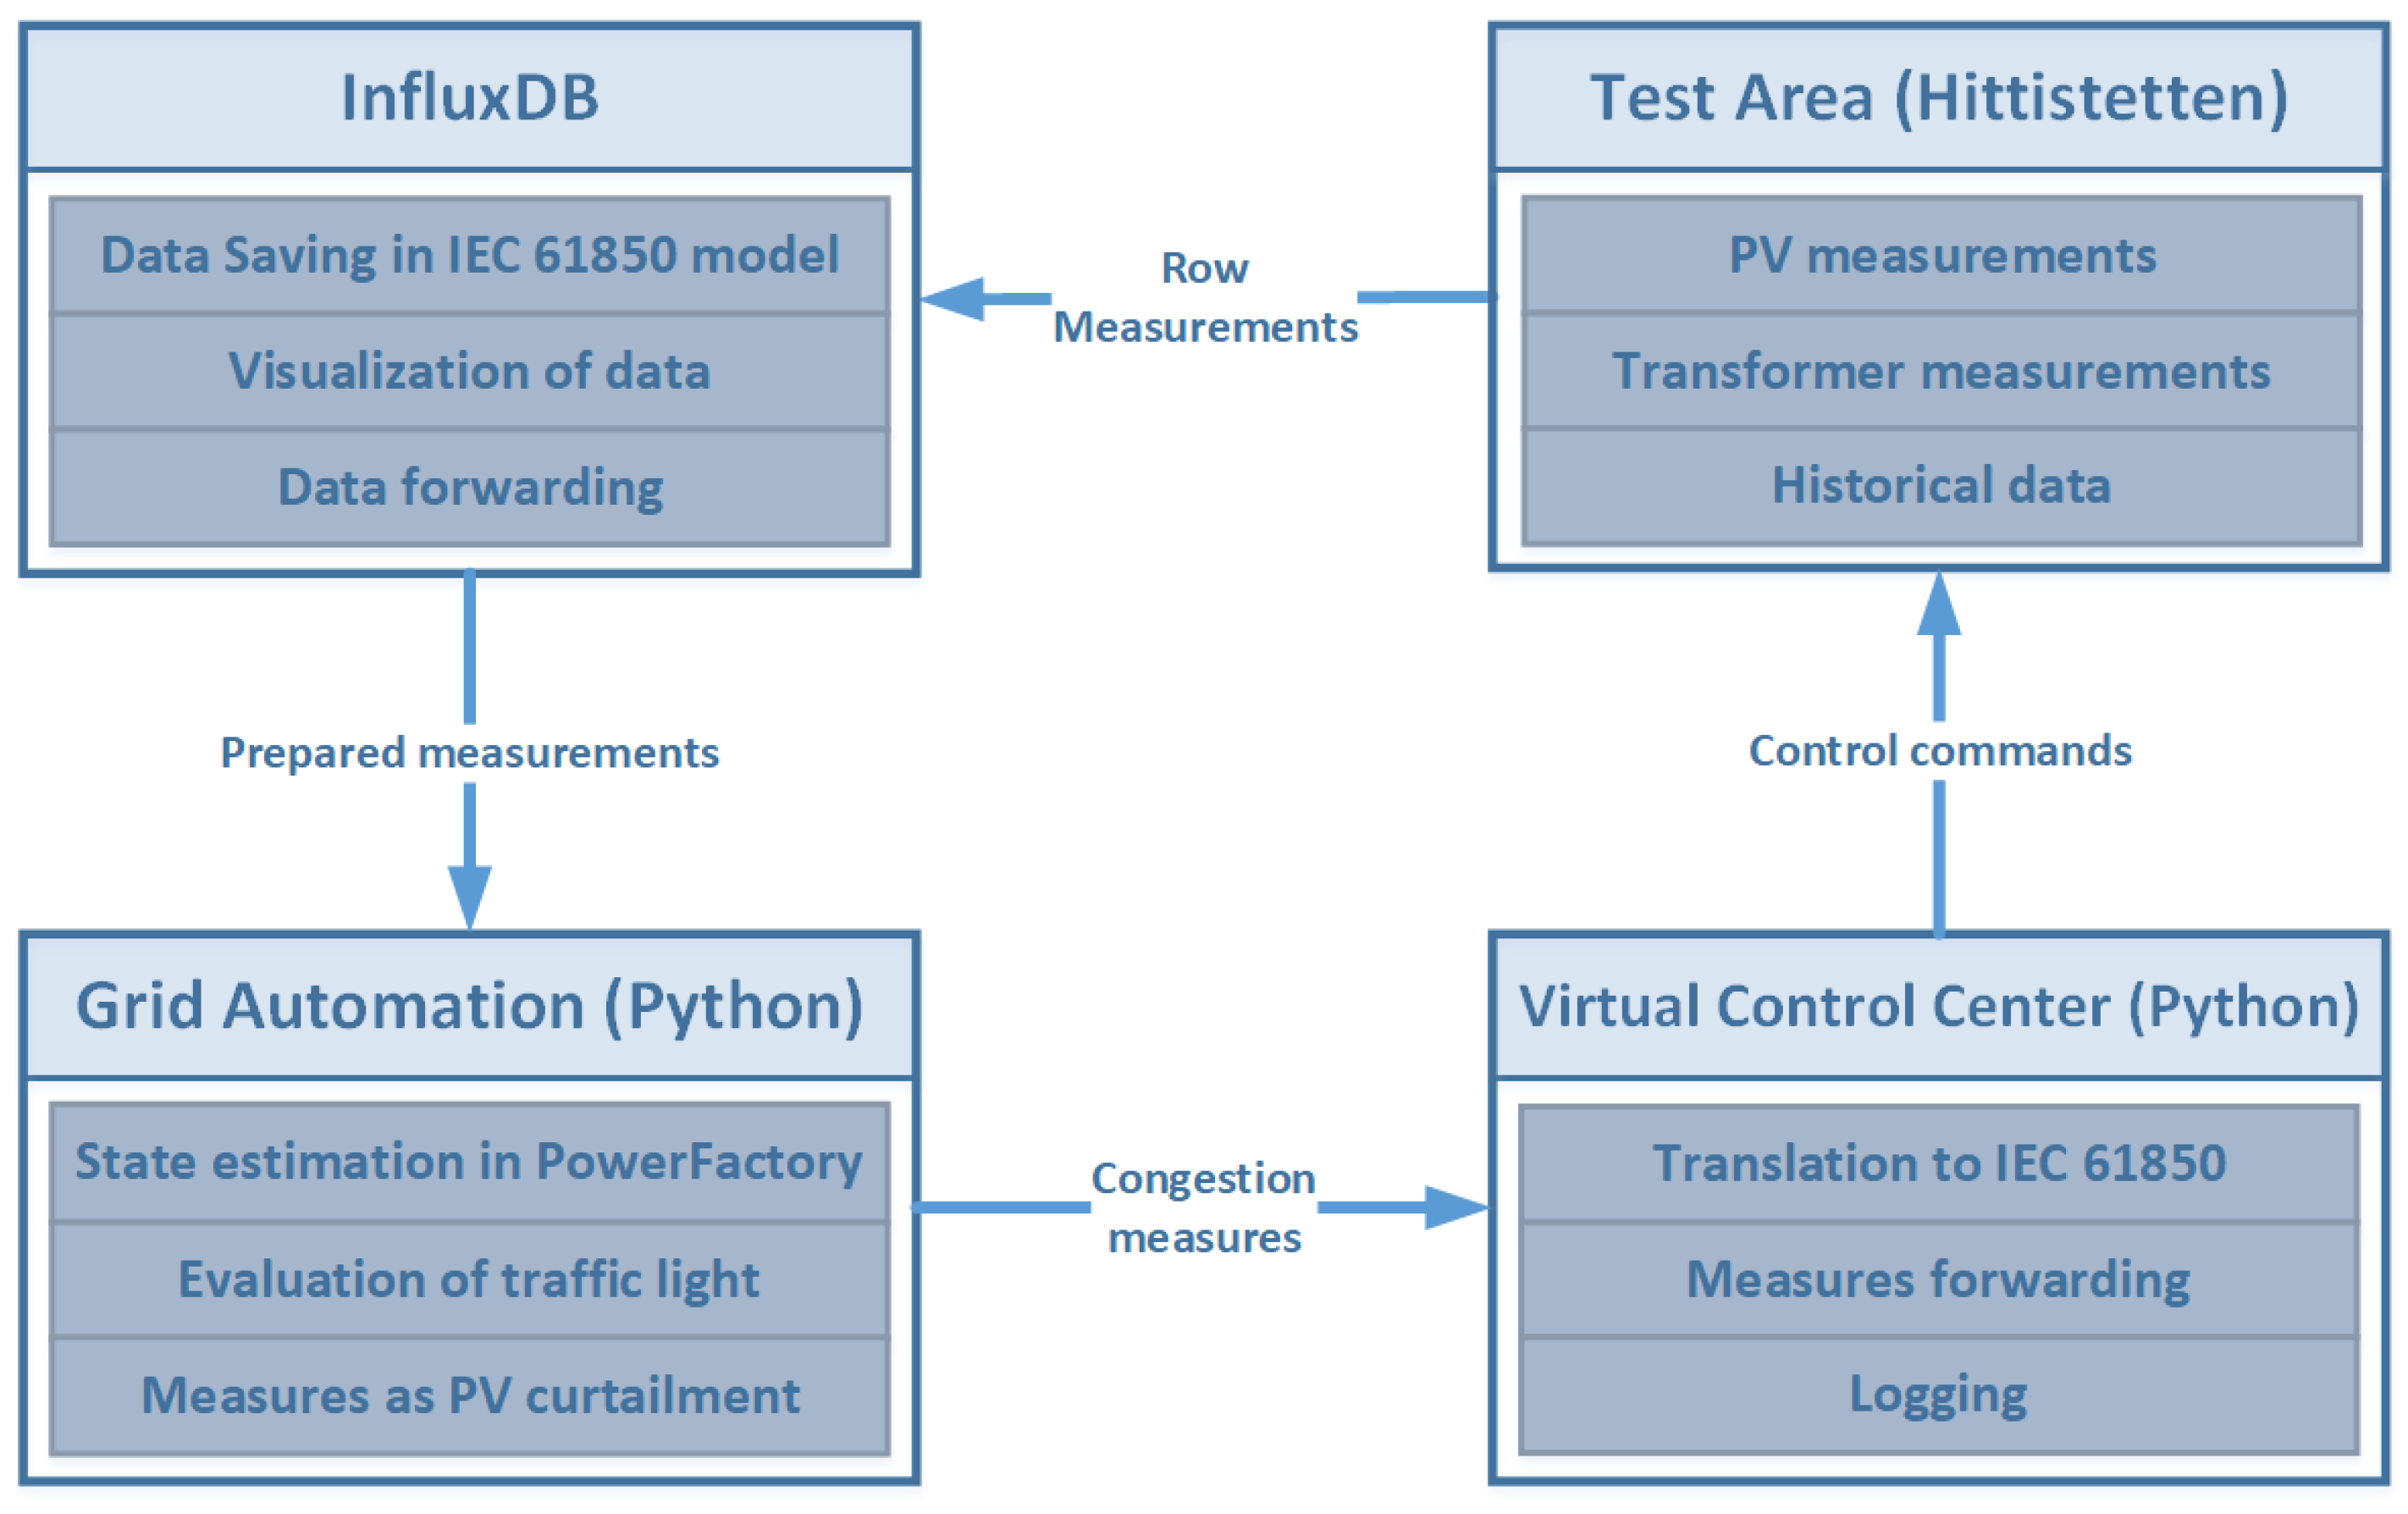
As a concrete example, a grid digital twin is developed and demonstrated based on real data from a test area defined in collaboration with the local DSO. As described in Section 2.1, the implementation consists of four key components, as illustrated in Figure 2:
Figure 2.
Architecture of the developed exemplary digital twin for the test case of the LV grid of Hittistetten.
A. Test Area Hittistetten: This is the distribution grid under investigation (see Section 2.3). Real-time measurements from PV inverter monitoring platforms and transformer measurement devices are collected to perform SE.
B. InfluxDB [27]: A time-series database utilized to store the field data collected from the grid. The data is structured according to the IEC 61850 [28] data model and made available for subsequent simulation, documentation, visualization, and other applications.
C. Grid Automation: Forming the core of the digital twin, this module retrieves preprocessed real-time data from InfluxDB via a standardized interface. This data is integrated into the grid model to determine the current state of the LV grid through SE performed using the grid simulation software PowerFactory [29]. Based on the SE results, key grid parameters—such as node voltages and component loadings—are estimated, enabling the derivation of the grid traffic light status. In critical grid conditions, for example, excessive voltage deviations or component overloading, congestion management actions, such as PV curtailment, are automatically triggered and communicated to the control center.
D. Virtual Control Center: This system executes control commands directed to the respective PV systems. It ensures the implementation of congestion management actions through secure communication with controllable local system (CLS) gateways, which locally regulate the output of the assigned PV inverters. The procedures for implementing these control measures have been described in previous studies (e.g., [30]) and are therefore not the focus of this work. During the development phase, a physical control center was used; however, in later stages, it was replaced by a Python-based virtual control center due to obsolescence of its software. The Python version used in the current work is 3.11.
The following section provides a detailed description of the components used in the exemplary digital twin grid.
2.3. Grid Model
The developed grid digital twin is demonstrated in the test area (Senden, Hittistetten), defined within the research collaboration with the local DSO in Ulm, Germany. Using the tools introduced in [31], a grid model of the area was created in the grid simulation software, including detailed metadata for each grid component—such as impedance, nominal voltages, and rated power—as well as the grid topology.
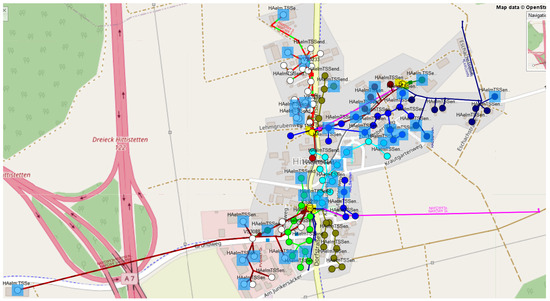
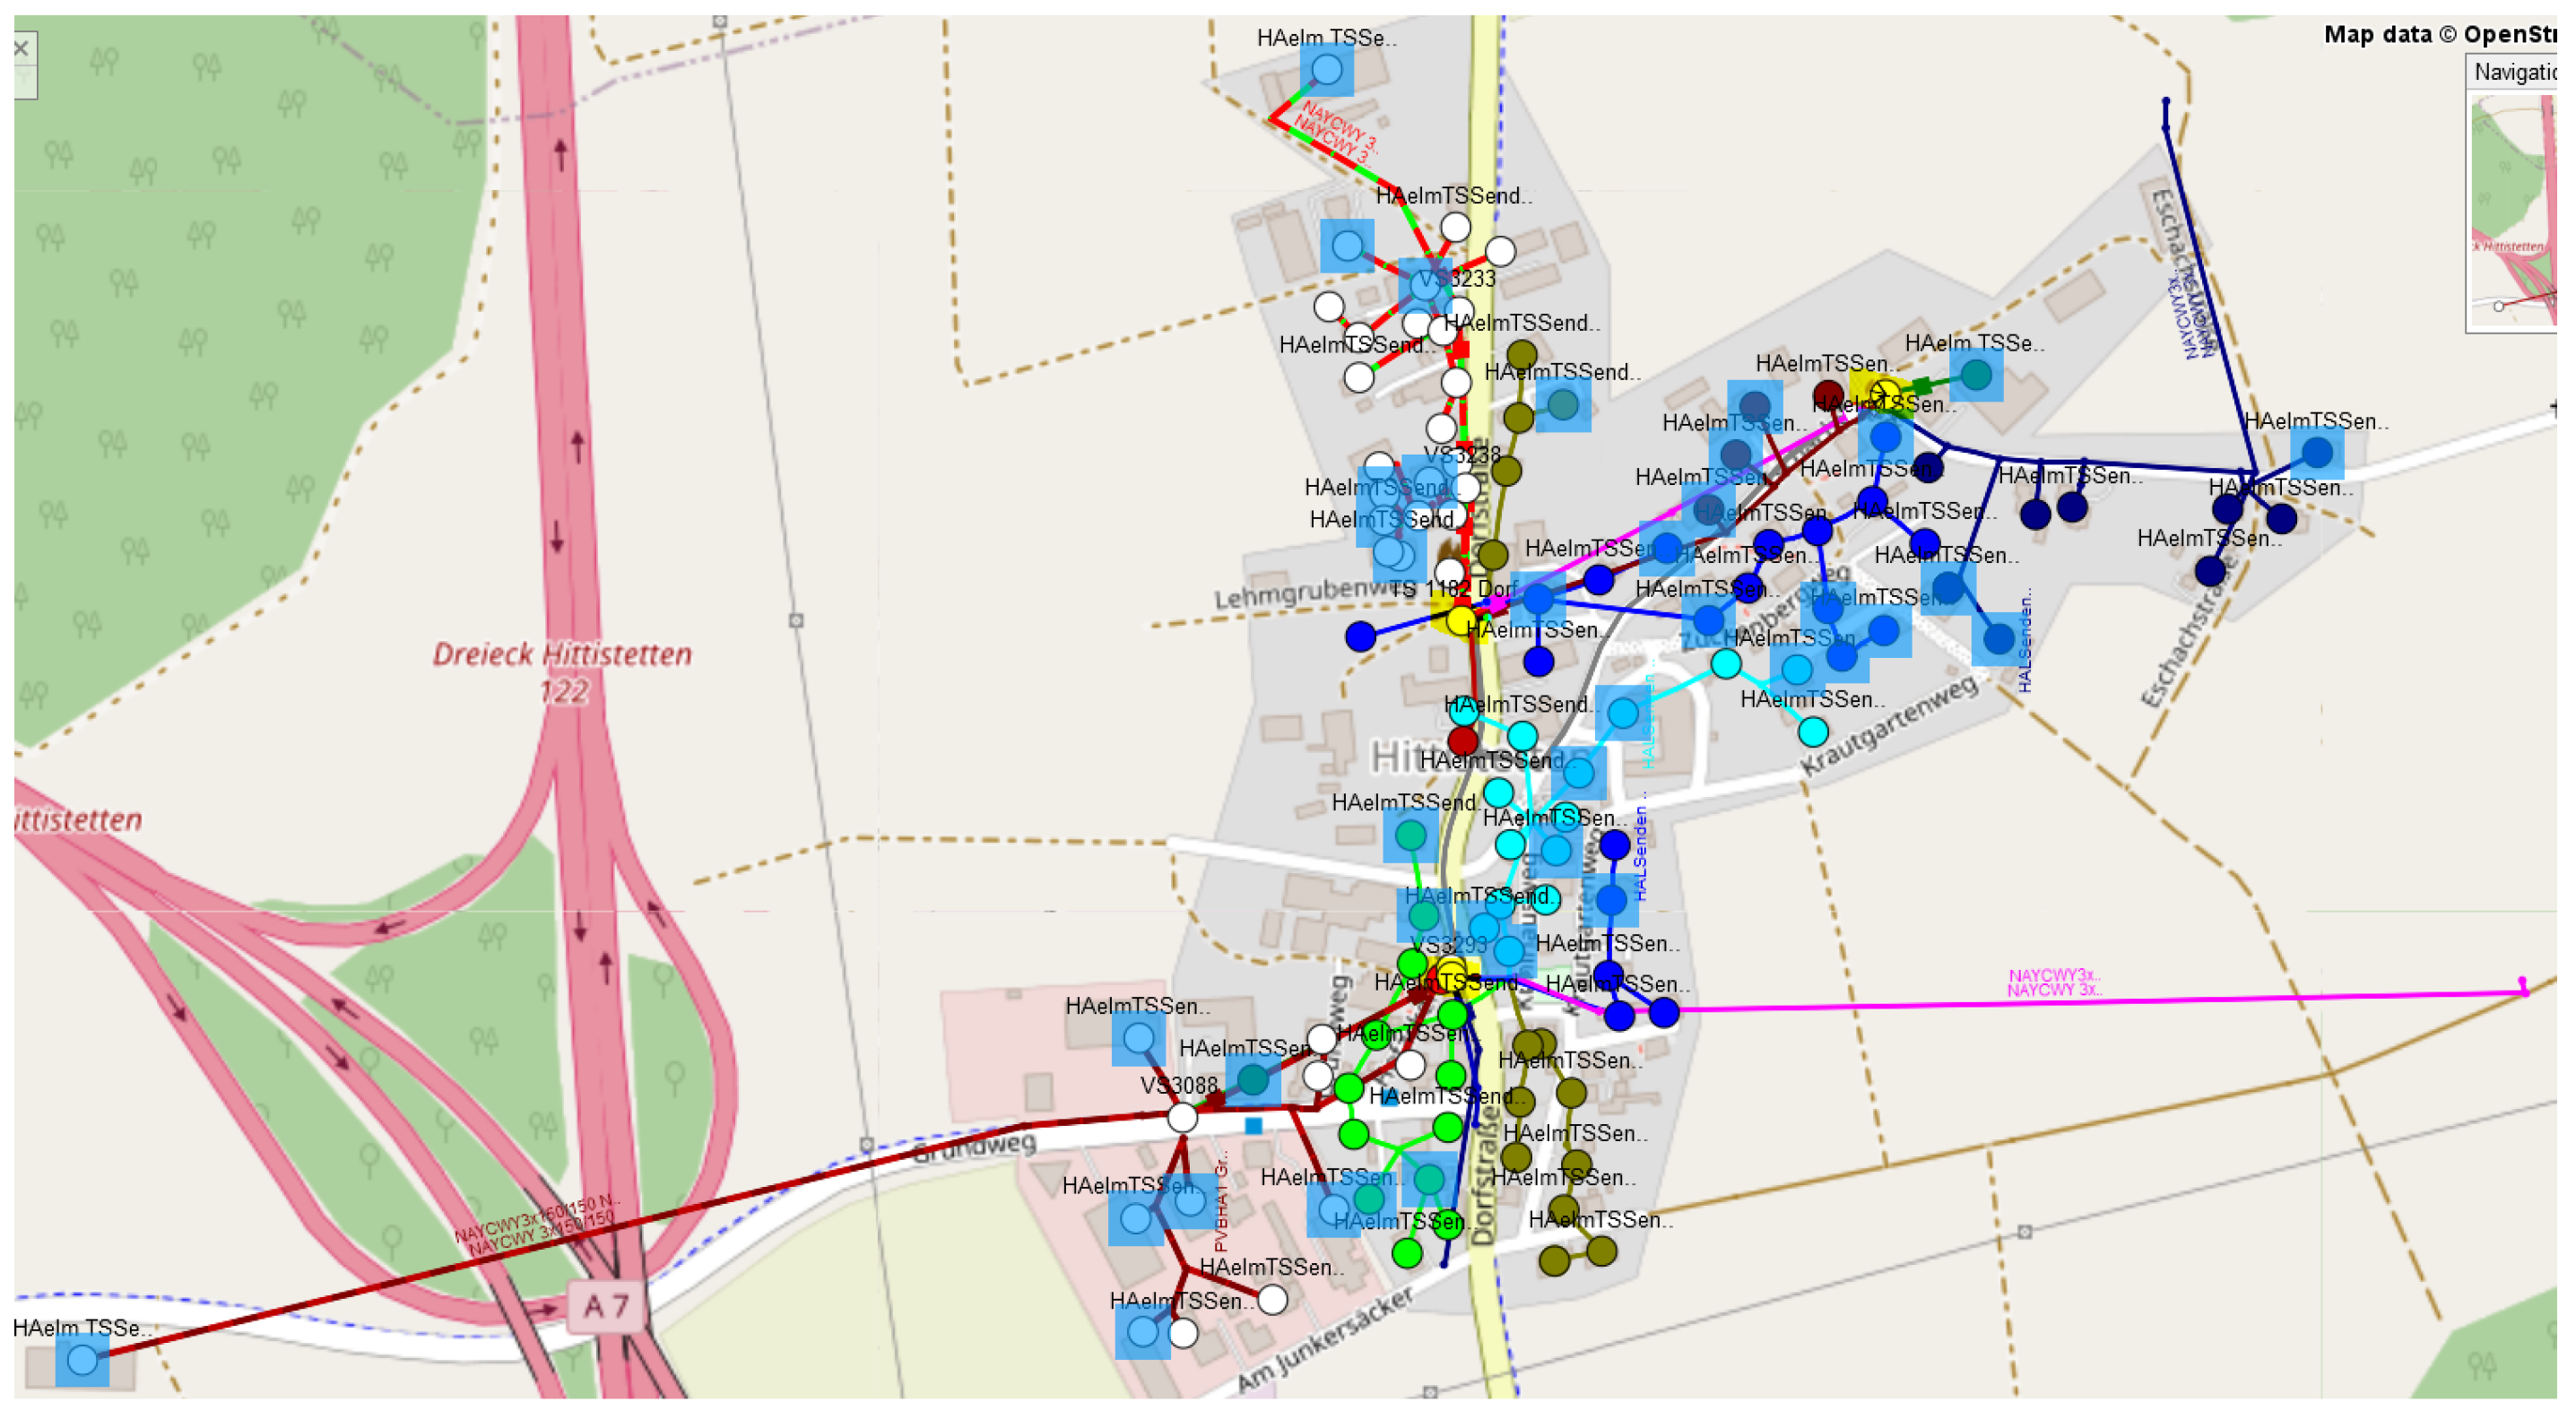
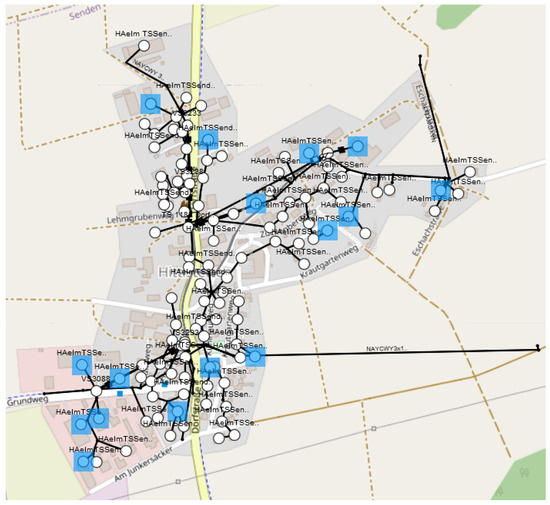
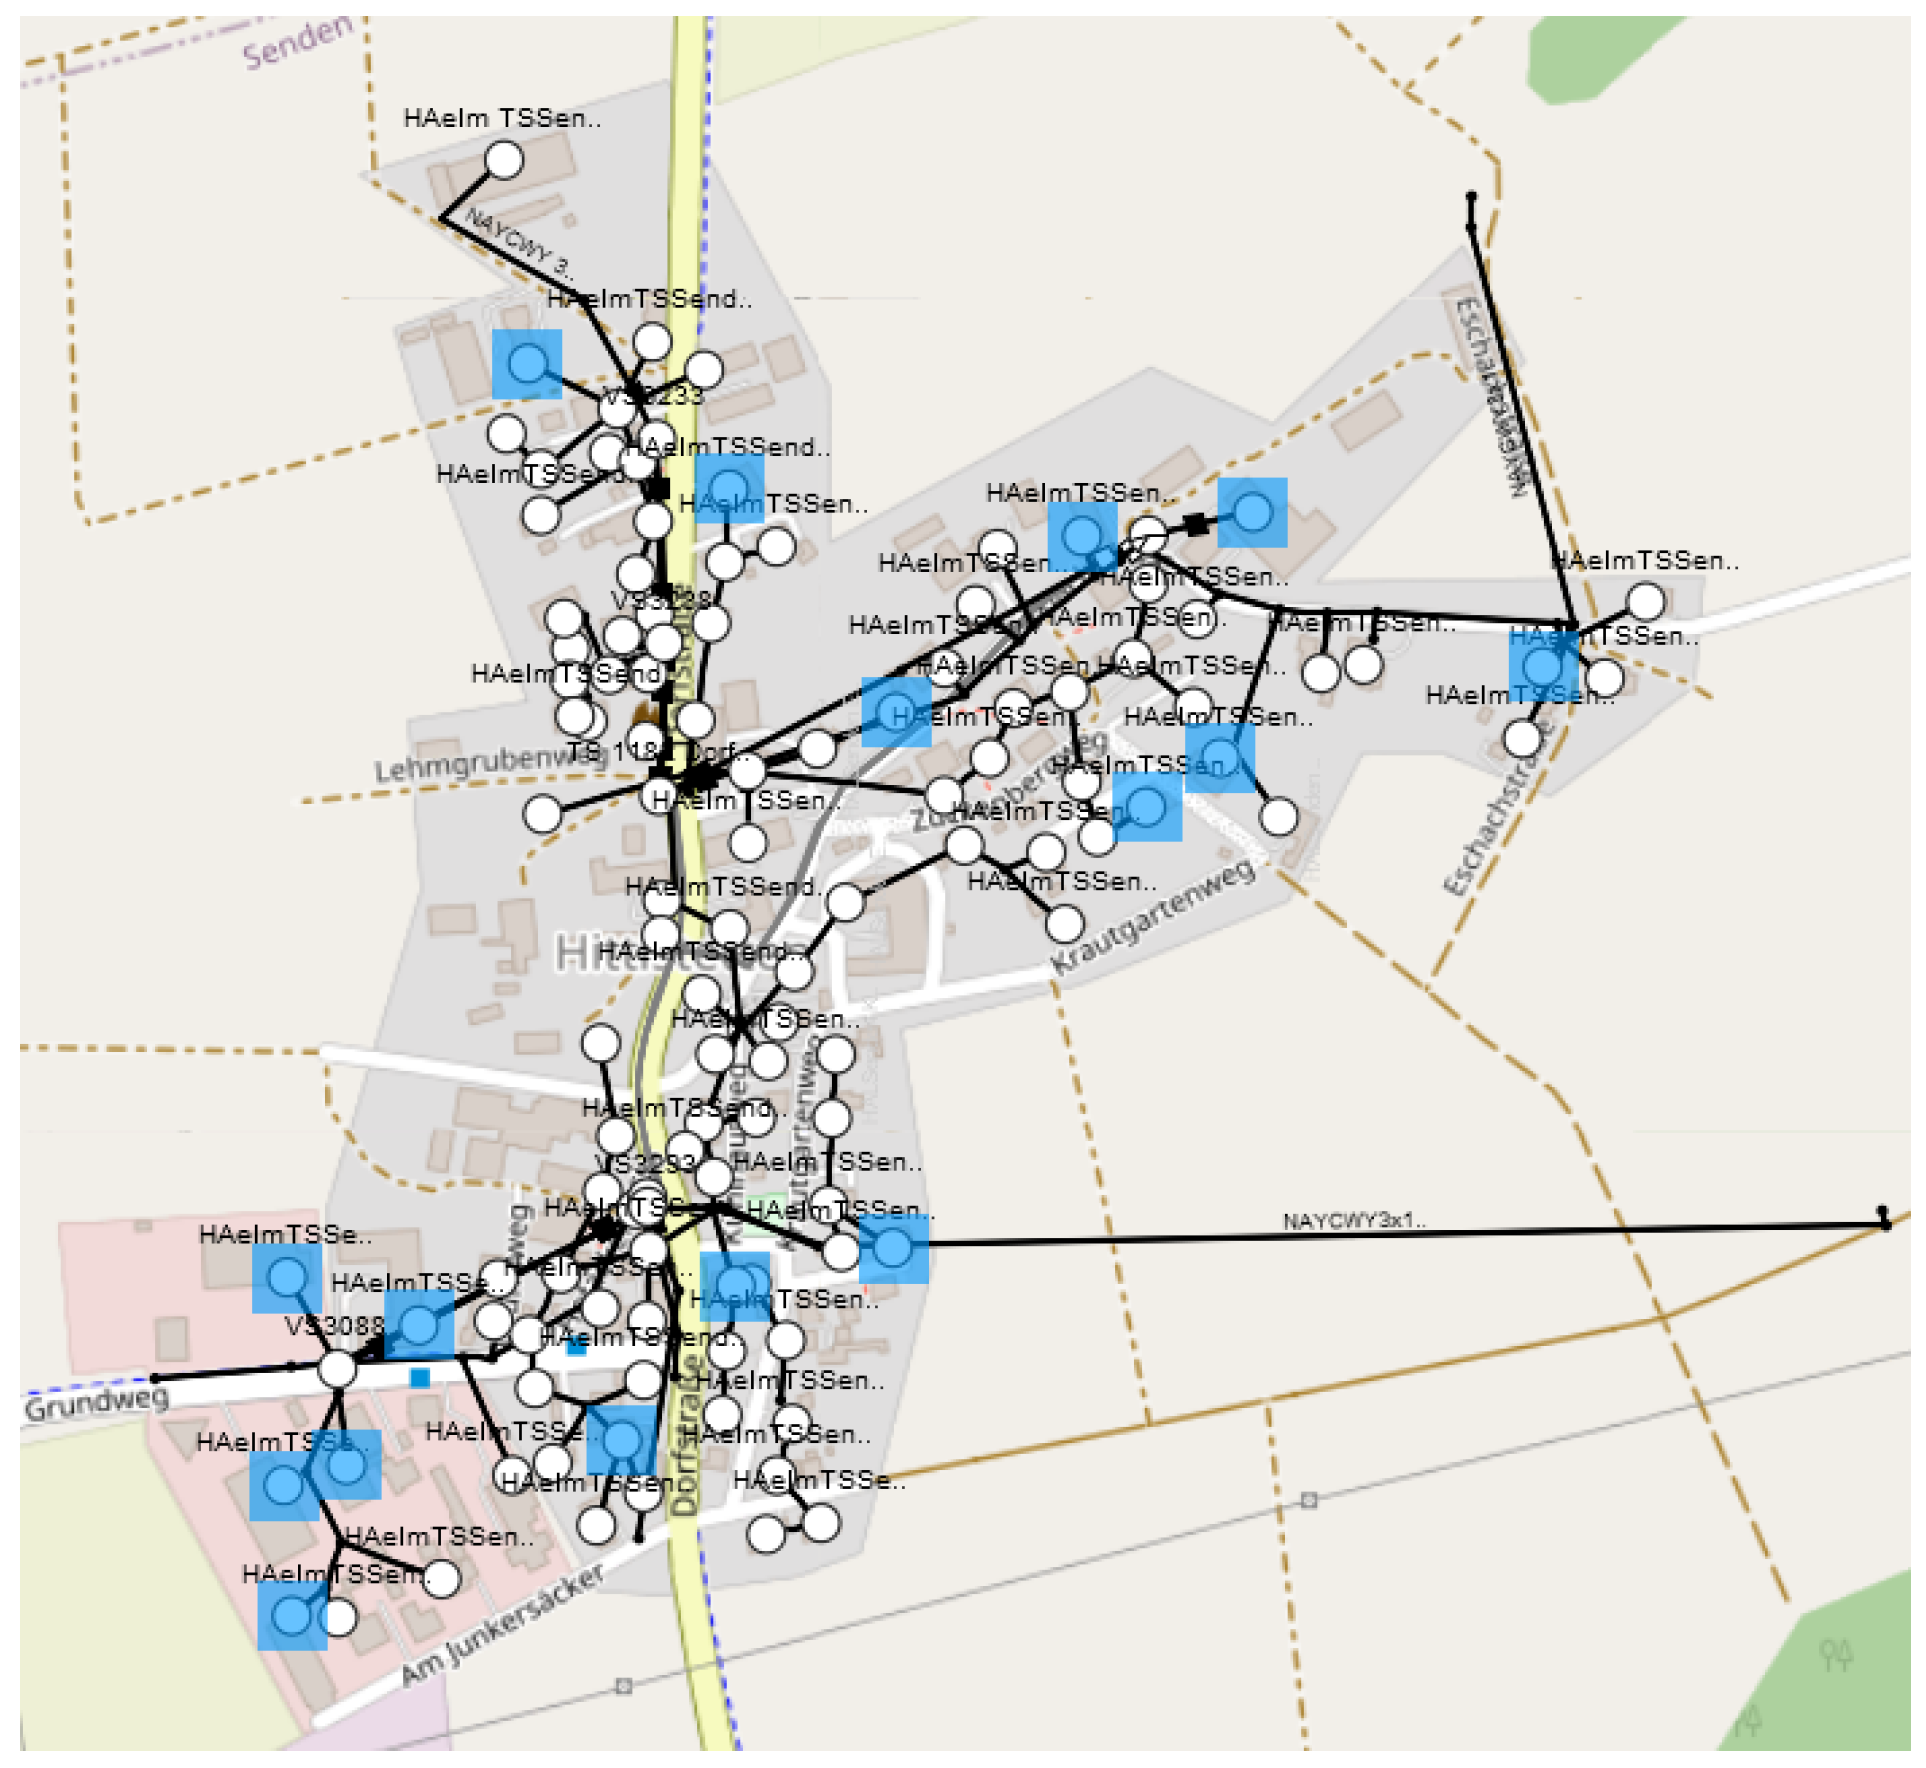
The test area mainly comprises single- and multi-family houses, with a few larger business buildings. The LV grid is structured as a radial grid and is typically supplied by three local transformers. It includes 83 small residential to medium-sized commercial PV systems, providing a total capacity of 1667.26 kVA (as of 2024). Most PV systems (98%) range from 4 kVA to 40 kVA, while the remaining larger systems are installed on commercial buildings. Due to the high number of PV installations, the total annual PV generation in the test area exceeds the total electricity demand. Figure 3 shows a geographical representation of the grid model in the simulation software.
Figure 3.
Geographical representation of the test area grid model in the simulation software (as of 2024). Transformer stations are highlighted in yellow, and households with PV systems are marked in blue. Other colors distinguish grid components within each grid feeder.
2.4. State Estimation Approach
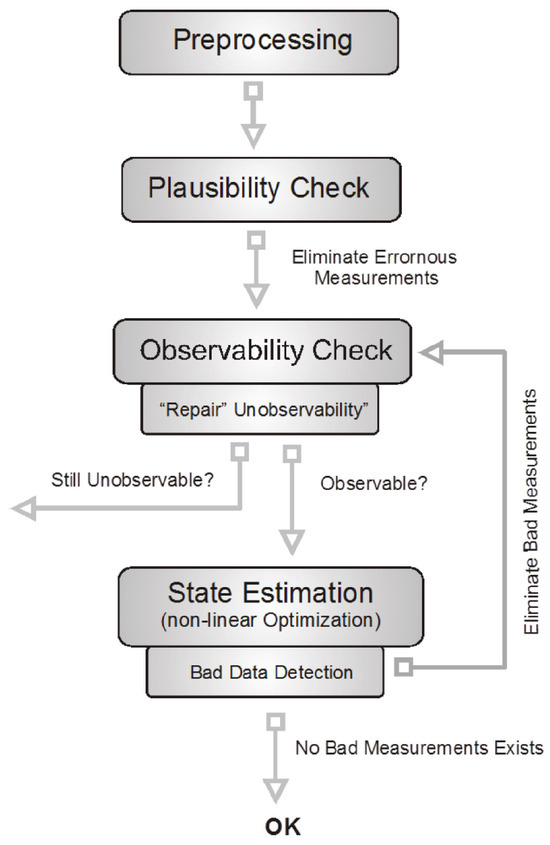
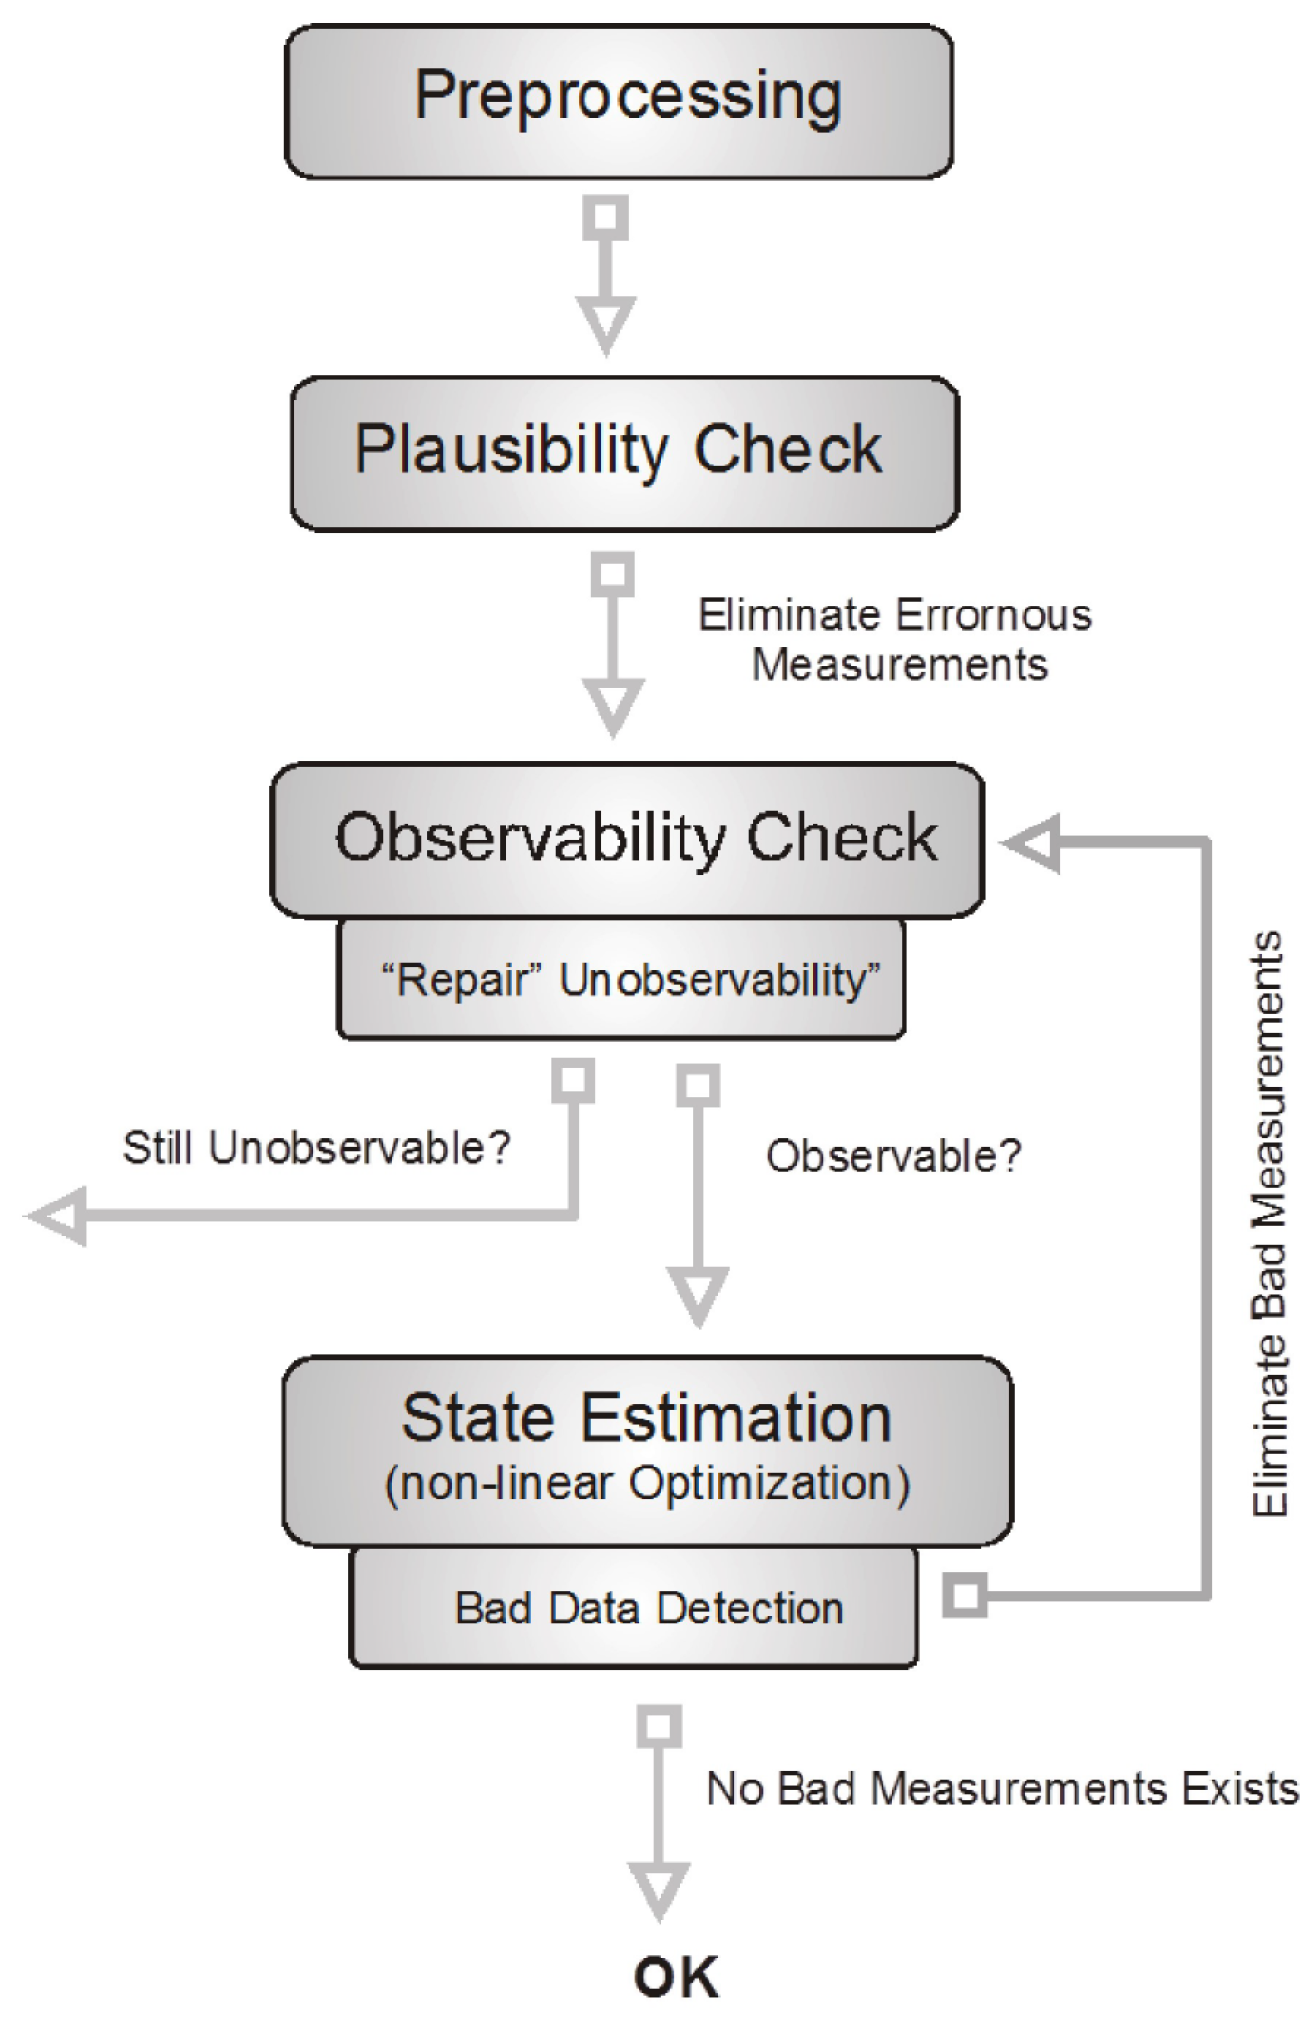
The developed grid digital twin environment employs the SE functionality of the simulation software, which relies on a nonlinear WLS optimization algorithm. A detailed description of the implemented SE method is provided in the user manual of [29].
In brief, the SE function produces consistent load flow results for the entire power system by combining real-time measurements, manually integrated data, and the grid model. This estimated system state forms the basis for subsequent analyses, such as contingency studies or security checks. The primary objective of SE is to estimate generator and load injections such that the resulting load flow closely matches the measured branch flows and bus voltages. Figure 4 illustrates the algorithmic interaction among the involved components.
Figure 4.
PowerFactory state estimation algorithm as in the PowerFactory user manual.
To integrate measurements into the grid model, external measurement models must be created. Using a custom Python script, external measurement models are automatically generated and configured for each measurement point and type of measured value. Currently, three-phase SE is applied under the assumption that the grid is largely symmetrical, given that both households and PV systems are typically connected across all three phases in Germany.
2.5. Real-Time Measurements
At present, the SE incorporates three-phase active power and voltage measurements, which serve as reference inputs in the optimization process to minimize estimation errors. These values are integrated into the grid model in real-time via the interfaces described in Section 2.7. In the simulation software, the measurements are represented through external measurement models. It should be noted that although numerous smart meters are already installed in the test area, they are not currently integrated into the simulation due to data confidentiality restrictions [32] and are therefore not within the scope of this work. Future work should place greater emphasis on the inclusion of smart meter data. The real-time measurements considered are presented hereinafter.
2.5.1. PV Measurements
Through cooperation with local residents, access to 15 PV systems (see Figure 5) via the monitoring platform of a PV inverter manufacturer was enabled. The available data include active power, reactive power, and voltage at the grid connection point, which can be retrieved with high temporal resolution and even per phase. However, due to a daily limit on data requests, a 15 min resolution was adopted. The measured single-phase values were analyzed and found to be very similar in most timestamps; they were therefore averaged to represent three-phase values for a symmetrical SE.
Figure 5.
Location of the PV systems whose measurements were accessed through the monitoring platform of a PV inverter manufacturer.
2.5.2. Transformer Measurements
Measurement devices were installed by the local DSO at the three transformer stations within the test area (see Figure 3), enabling separate monitoring of all feeders. The transformer measurements are accessible via the manufacturer’s monitoring platform. The measured parameters include current and power factor for each feeder and phase, as well as a single-phase voltage measurement for each transformer. Based on these measurements, the power flows for each feeder were calculated.
2.6. Synthetic Power Values
Prior to simulation, the following synthetic and historical data were integrated into the grid model in parameter characteristic objects, rather than measurements. These data serve as initial inputs for the WLS optimization in the SE algorithm but are not considered actual real-time measurements.
2.6.1. Simulated Feed-in of PV
The measured PV systems, including two PV–battery systems, were directly represented based on their available measurement data. For PV systems without measurement data, simulations were performed in the simulation software using global horizontal irradiation as the main input. These systems were modeled in the simulation software with all metadata available from the DSO as of 2024. The azimuth and tilt of the PV installations were derived from a solar roof potential analysis, as described in [33]. In addition, the 70% limitation on maximum active power and the provision of reactive power, as required for the respective PV systems in the test area, were taken into account in the simulation. For validation, the simulated annual PV feed-in of each system was compared with the invoicing electricity meter readings provided by the DSO. This validation was considered sufficient, as the PV simulation primarily serves to generate initial values for the SE.
2.6.2. Synthetic Consumption Data
A suitable tool for simulating synthetic yet representative load profiles is the Artificial Load Profile Generator (ALPG), introduced in [34]. The ALPG follows a bottom-up approach, in which individual household components are specified and simulated separately. The model requires information about household structures, such as the number of residents, their working patterns, installed PV systems, and the electricity consumption of various appliances. Since strict data protection rules restrict access to much of this information, the parameters were varied to generate the most realistic consumption scenarios possible. To ensure comparability and consistency, the generated load profiles were first normalized to an annual consumption of 1000 kWh and subsequently scaled using the historical electricity invoicing meter readings in the test area.
2.7. Interfaces
The developed interfaces, as illustrated in Figure 2, are described in detail in the following subsections.
2.7.1. Data Exchange with InfluxDB
The work in [35] presents a concept in which a time-series database serves as the central element for managing energy data generated by DES and associated intelligent devices. Modern time-series databases enable the implementation of standardized data interfaces, for example, through programming languages such as Python. Within the proposed energy data management framework, data from multiple sources can be efficiently processed and leveraged for the simulation and operation of future energy systems.
Real-time applications generally require well-organized data and efficient data interfaces, which can be challenging due to the selection of communication protocols and data formats. Employing the hierarchical structure of IEC 61850 data models helps streamline energy data management within utilities and reduces the risk of syntax errors in data queries. At the information level, a standardized data interface between intelligent electronic devices and the time-series database was implemented in accordance with the IEC 61850 structure [36].
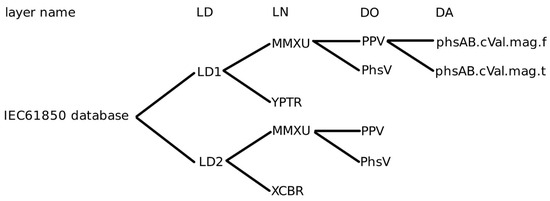
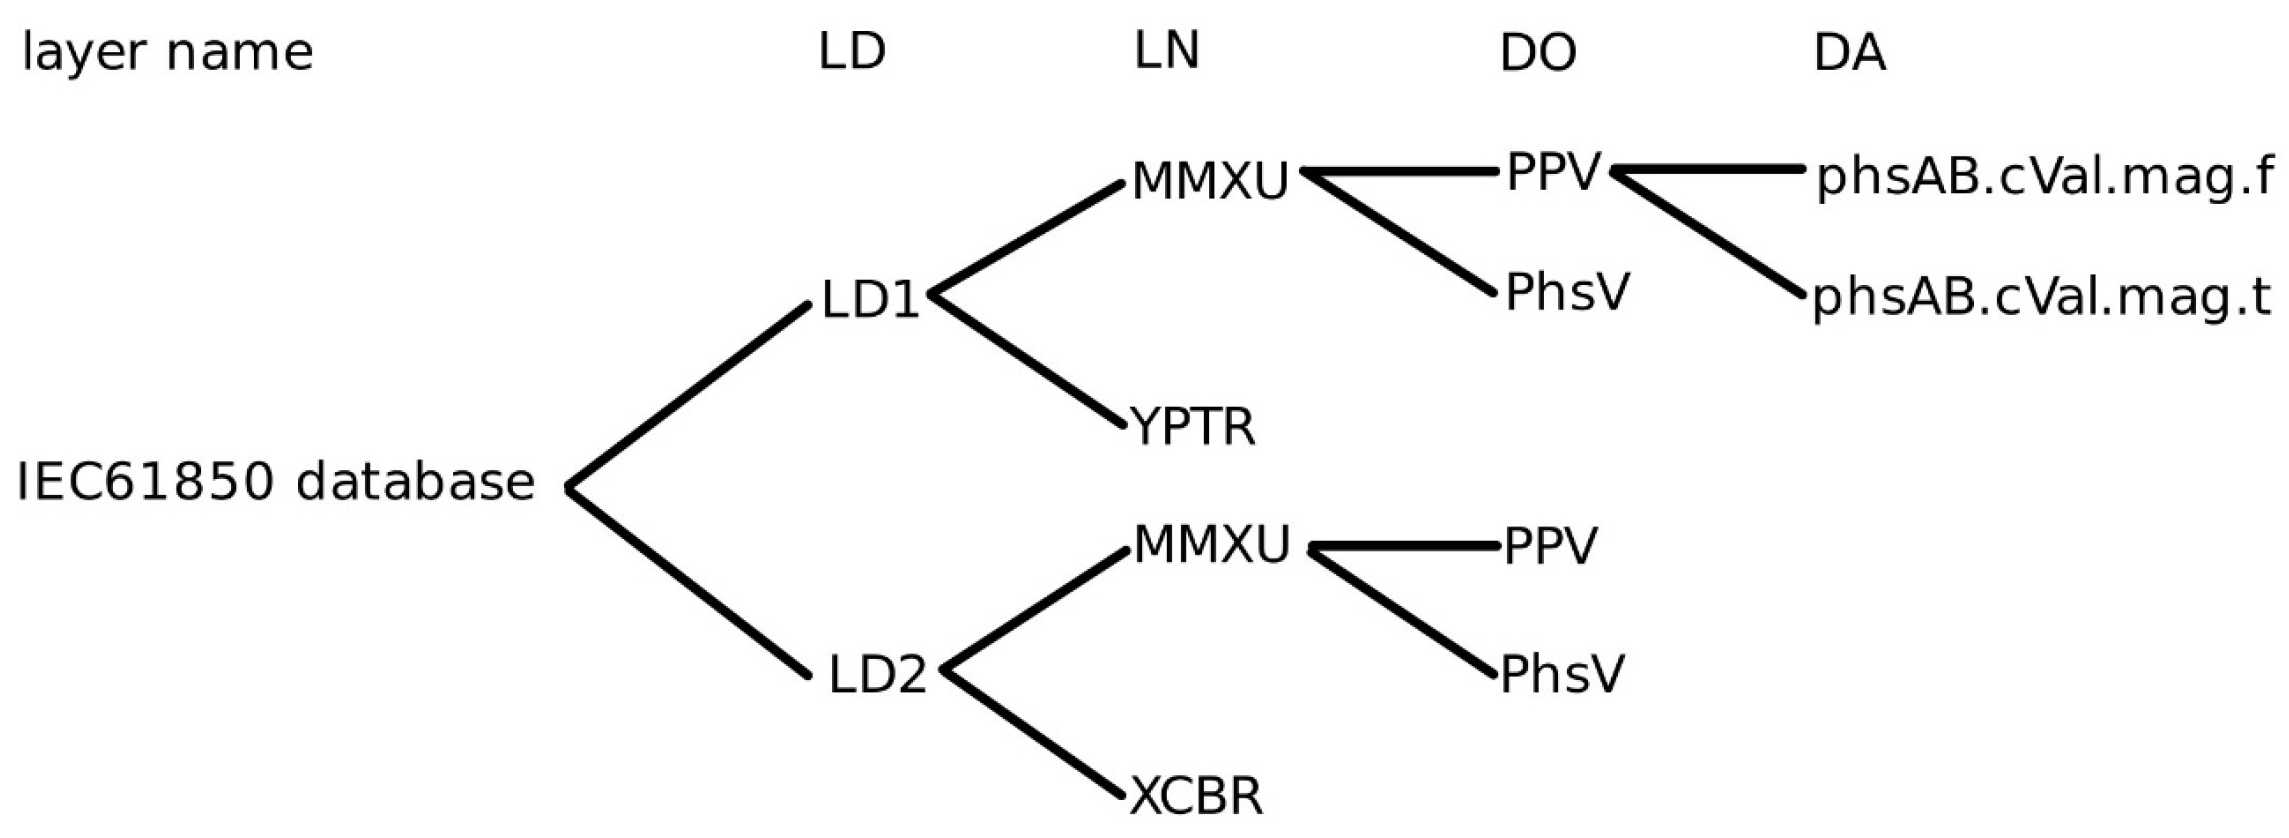
In IEC 61850, each value is identified using a hierarchical data format spanning multiple layers, as illustrated in Figure 6. The short names of these layers are explained in Table 1. To map the data to the corresponding measurement devices, unique IDs are used as LDs.
Figure 6.
Data format according to IEC 61850.
Table 1.
Short names of layers in the IEC 61850 data format.
Except for the LD value, which can be customized, every identifier is defined by IEC 61850. Table 2 explains the meaning of the tags given in the example in Figure 6.
Table 2.
IEC 61850 short names used for LN, DO, and DA.
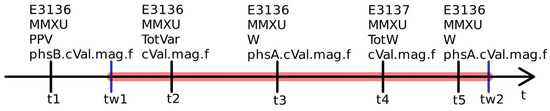
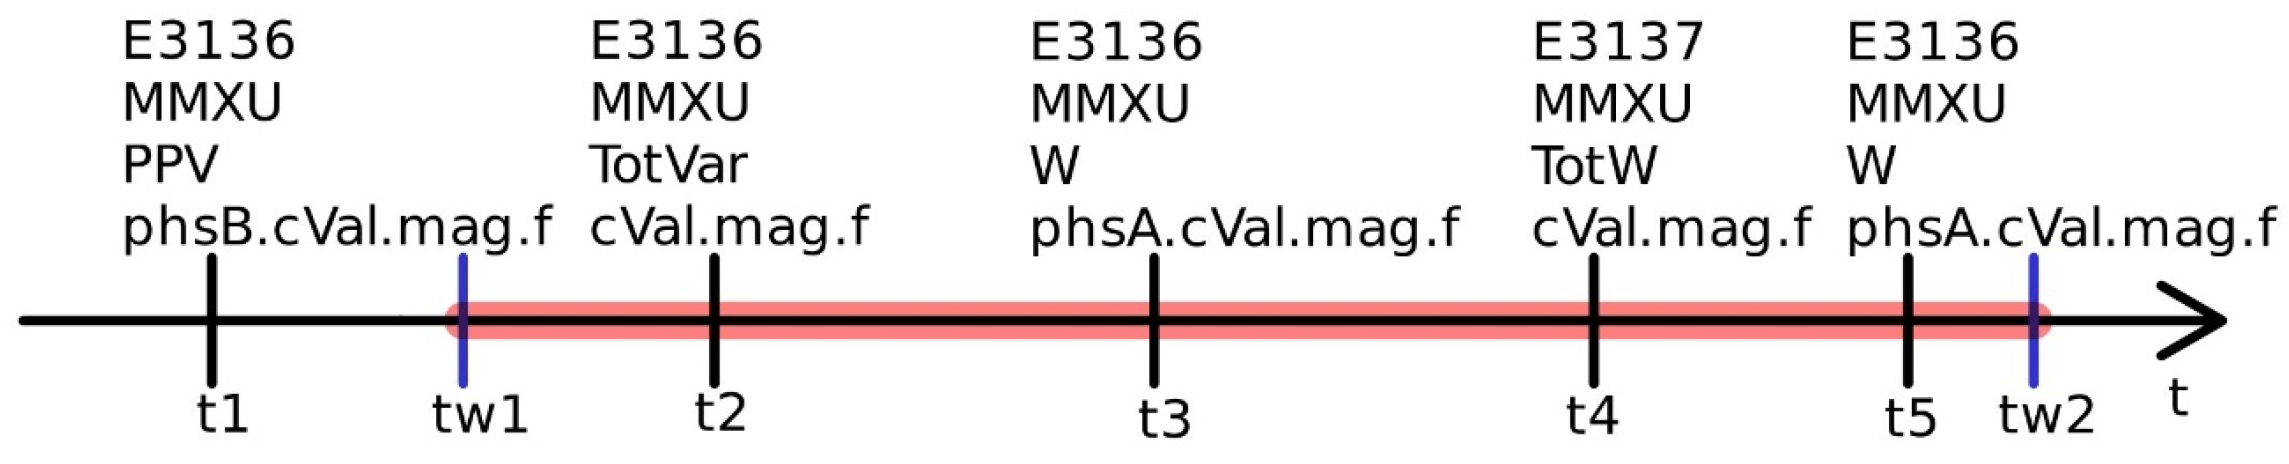
Data Retrieval for Simulation: A Python application programming interface (API), i.e., the InfluxDB client object, was employed to access the measurement data. A download time window was defined, with a standard interval of 15 min. Upon execution of a query, the InfluxDB API returned all measurements recorded within the specified interval. Since the parameters originate from different sources, they are not always measured synchronously; as a result, a given parameter from a specific measuring point may occur multiple times within the same window. To address this, a Python function was developed to ensure that the most recent values were consistently selected for the simulation. Figure 7 illustrates an example of a download time window with four measurements recorded between the start (tw1) and end (tw2) of the time window, highlighted in red.
Figure 7.
Sample download window.
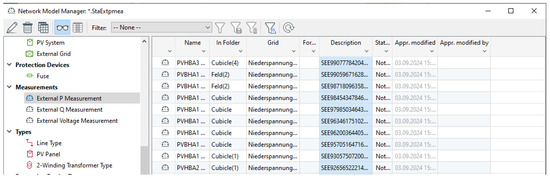
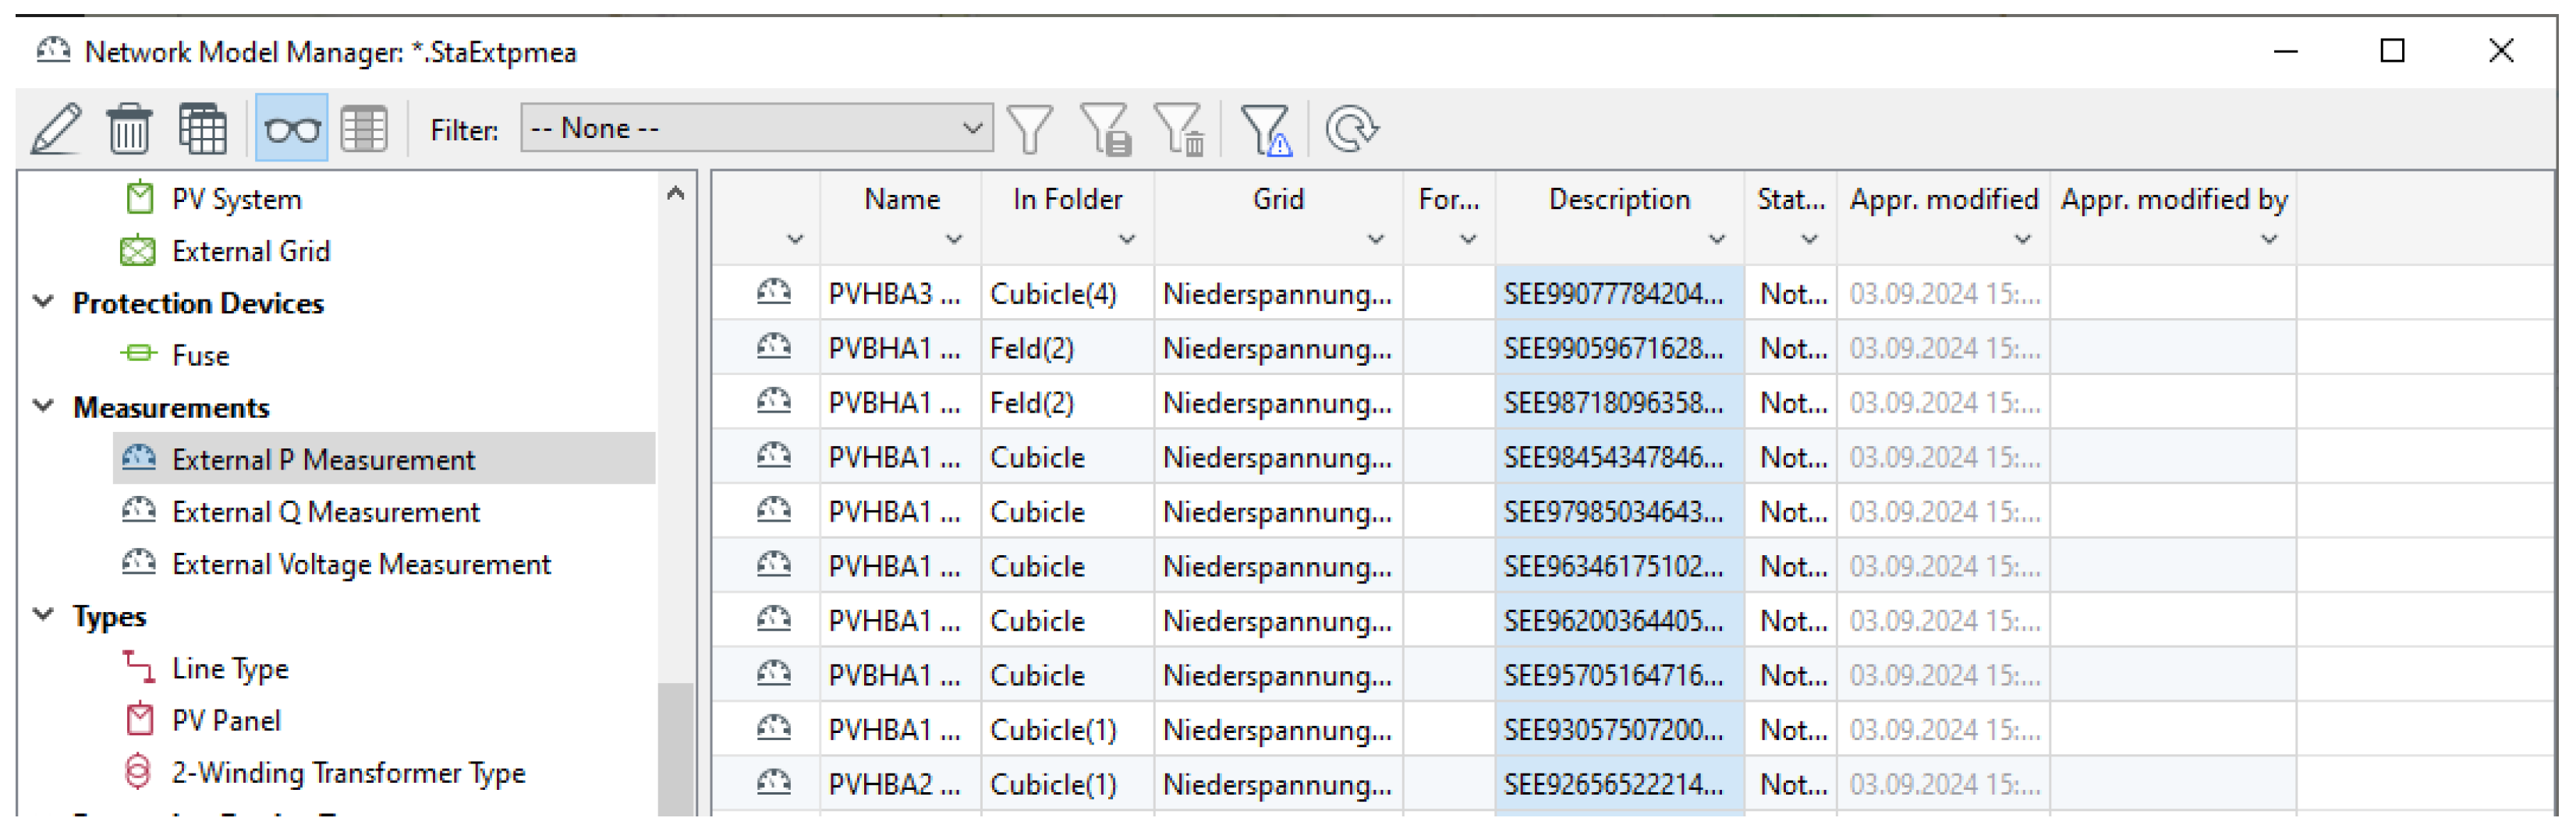
For integrating the data stored in InfluxDB into the grid model and inserting them into the external measurement models, as described in Section 2.4, unique IDs were employed for mapping. These IDs were assigned to the external measurement devices defined in the grid model, as shown in Figure 8, and were likewise associated with the corresponding time series in InfluxDB. Further details regarding the synchronization and alignment of the measurements in the simulation are provided in Section 2.9.
Figure 8.
Example of the IDs inserted in the measurement devices for active power (snapshot from the simulation software).
2.7.2. Data Retrieval from PV Monitoring Platform
In cooperation with local residents and the PV inverter manufacturer, access to the PV systems’ data was established via the platform’s API. The API enables external software (e.g., the developed Python scripts) to retrieve system data using an API key assigned to each PV system. Within the scripts, the time window of interest was specified, after which the PV inverter API was queried. The response was returned in Python-dictionary format and subsequently mapped to the IEC 61850 data structure, consisting of a datapoint key, value, and corresponding timestamp. Finally, the IEC 61850 dictionary was converted into a list format and uploaded into the InfluxDB time-series database.
2.7.3. Data Retrieval from Transformer Monitoring Platform
In cooperation with the transformer measurement manufacturer and the local DSO, an API was made available. This API provides the ability to update measurements every 15 min, ensuring near real-time data with a maximum delay of 15 min, which corresponds to the simulation’s temporal resolution. For feeders with very low load, measurement devices may refrain from transmitting data as a memory-saving measure. Temporary communication issues can also result in missing data. To maintain consistent profiles, missing values were replaced with zeros. The interface design was similar to that of Section 2.7.2, where data were retrieved as dictionaries, mapped to the IEC 61850 format, converted into lists, and subsequently uploaded to InfluxDB.
2.8. Congestion Measures
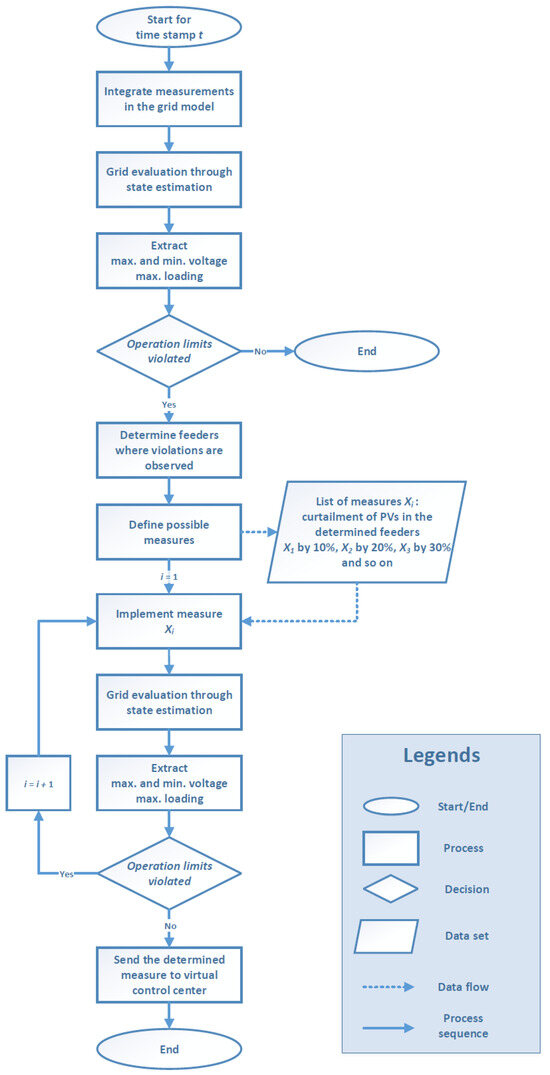
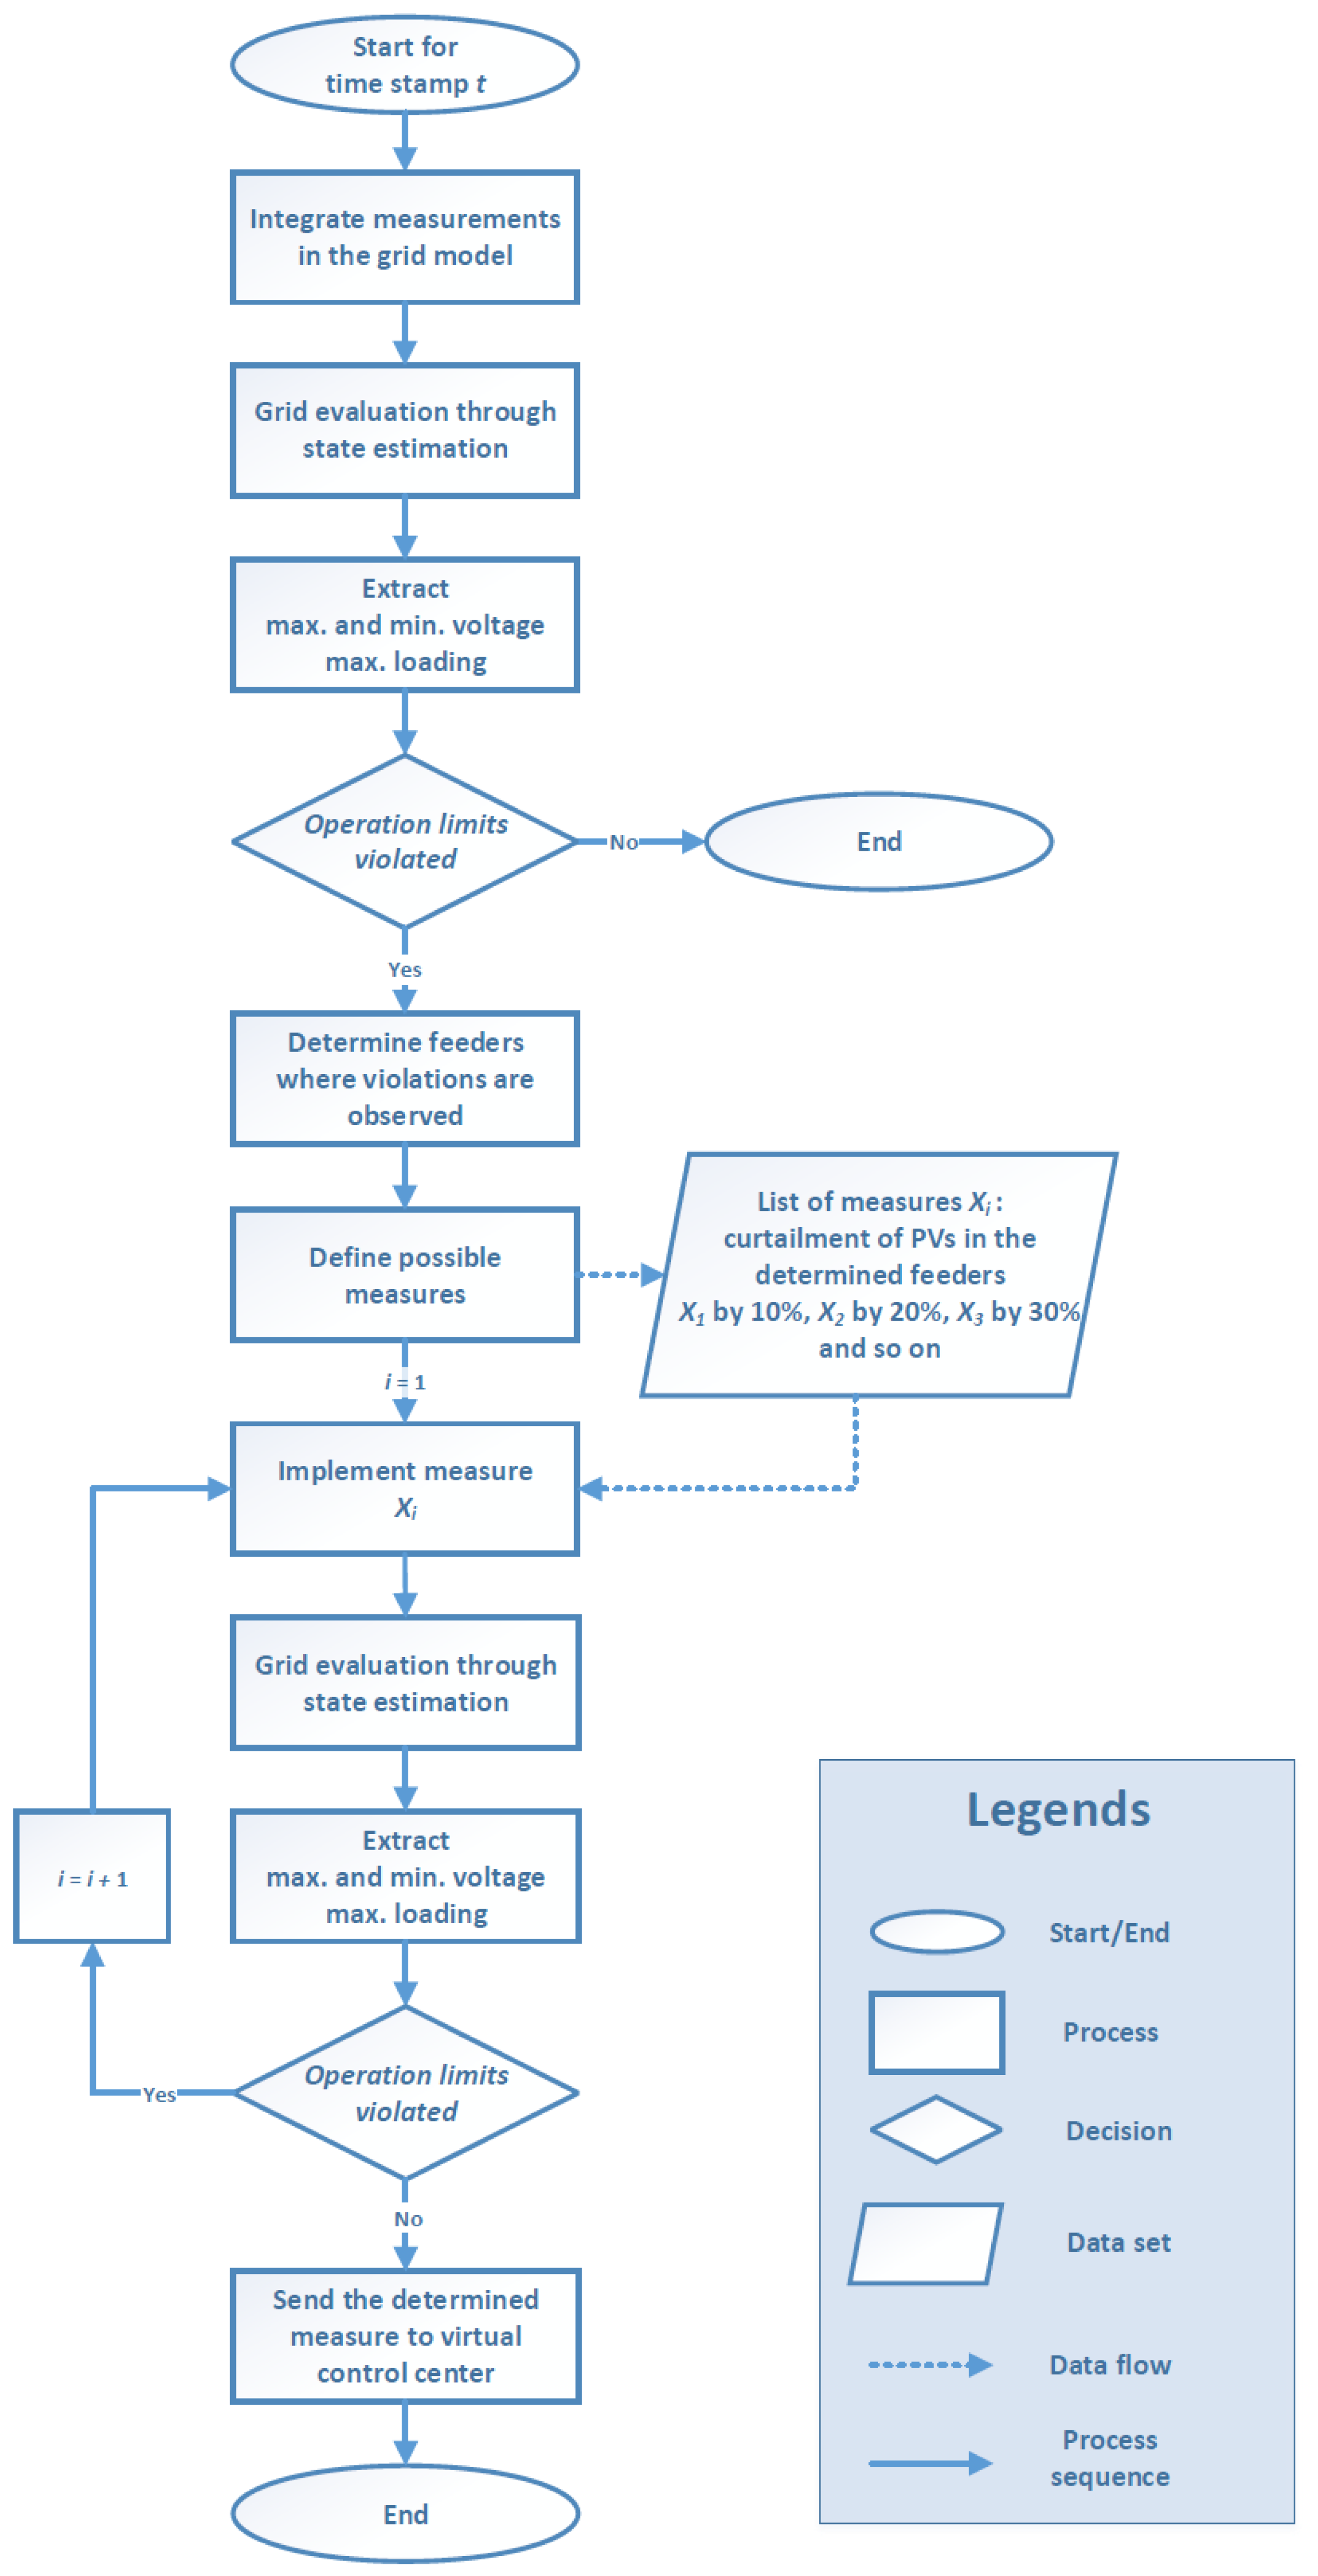
If the SE results indicated a potential congestion, an appropriate mitigation measure was determined based on the algorithm presented in Figure 9. Congestion limits were defined such that the current loading of all grid components must not exceed 100%, and voltage deviations at all grid nodes must not exceed 10% for the LV level.
Figure 9.
Algorithm for the definition of grid congestion measures.
The measures were primarily based on curtailing the output of selected PV systems. To minimize unnecessary PV power losses and to avoid discriminating against prosumers connected to critical grid nodes, all PV systems located within the affected feeder were curtailed. Furthermore, the curtailment level (e.g., 10%, 20%, etc.) was applied incrementally, ensuring that only the minimum necessary power reduction was implemented.
2.9. Data Matching and Synchronization
The development of the grid digital twin requires both live measured data and accurately synthesized (or simulated) consumption and production profiles to ensure precise SE of the grid. Assuming this data is available and that accessing it does not introduce significant delays, the main factor determining the time to obtain simulation results is the convergence time of the SE algorithm. For small grids, such as the test area, this typically takes less than a few seconds. Therefore, in theory, live data could be available at a temporal resolution of a few seconds up to one minute. However, due to the specifications of PV and transformer monitoring platforms, the grid digital twin performs SE every 15 min, as these platforms allow only a limited number of data calls per day. Consequently, the simulation’s temporal resolution was set to 15 min as mentioned in Section 2.7.
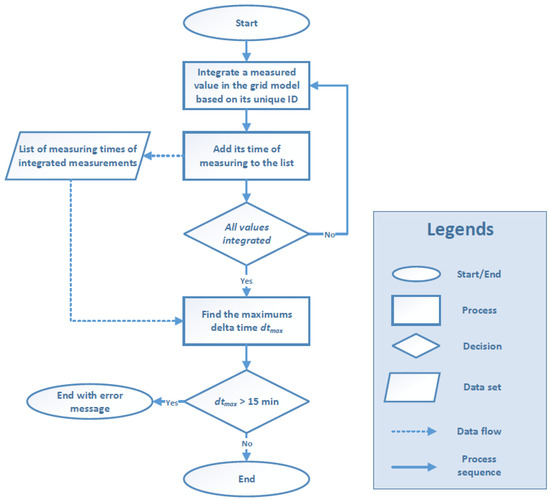
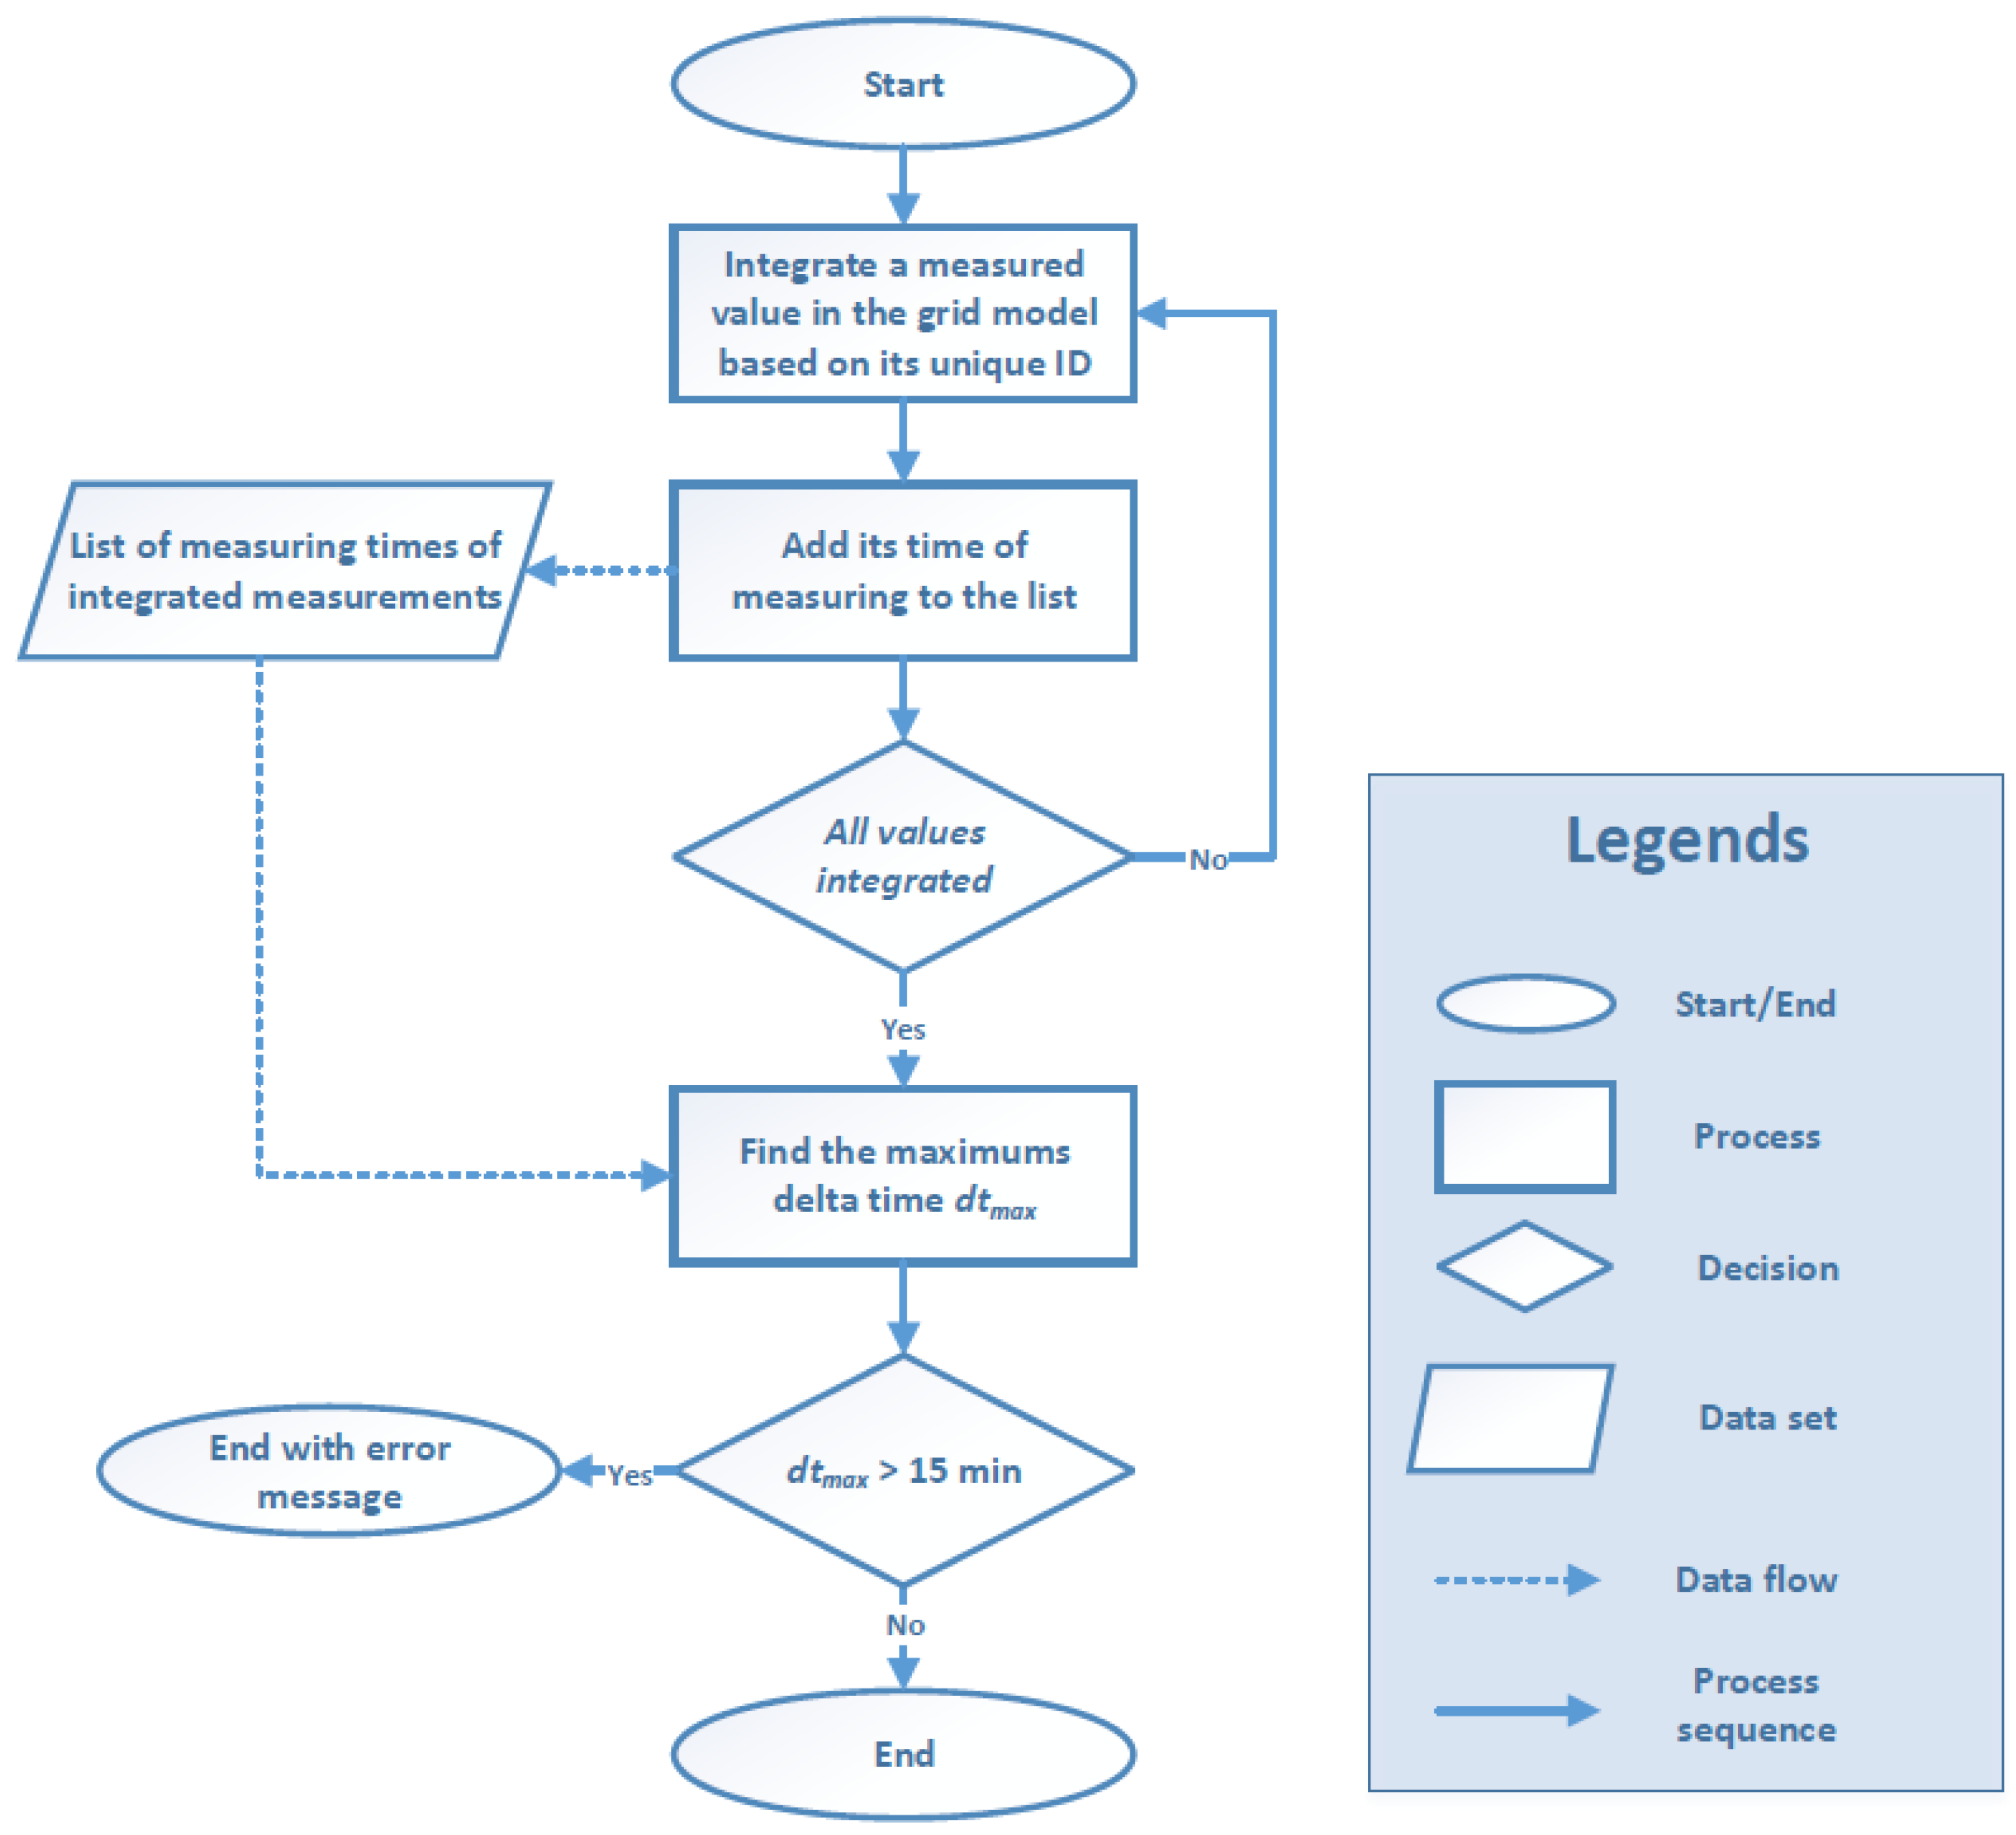
Since the data originates from different sources, the measurements carry different timestamps. For real-time SE, the most recent timestamp of all measurements was integrated, although this cannot fully prevent mismatches in measurement times. To verify simultaneity and exclude unsynchronized data, a function was implemented within the Distribution Grid Automation System. This function checks, for each simulation timestamp, whether the difference between measurement times of all integrated data is less than a certain limit, currently set to 15 min, and accordingly raises errors or exports warnings to a log file. In case a higher time resolution of the collected data is available in the future, this limit must be adapted accordingly. The approach is illustrated in Figure 10.
Figure 10.
The approach for synchronizing the check in the grid digital twin environment.
3. Results
The developed grid digital twin was tested during its development by running numerous SIL simulations. Subsequently, it was also evaluated under real-time conditions as a hardware in the loop (HIL).
3.1. SIL Simulation
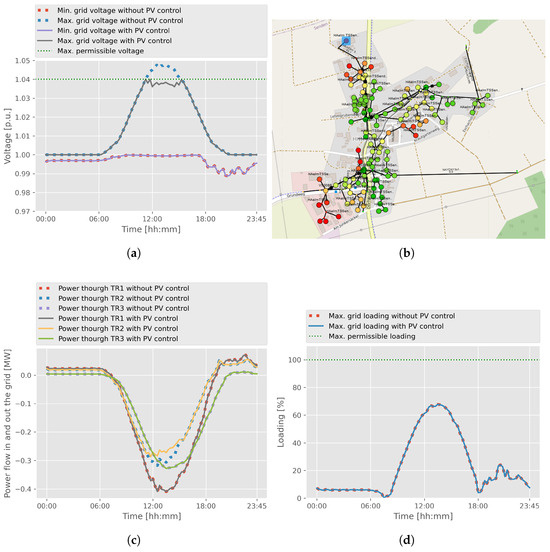
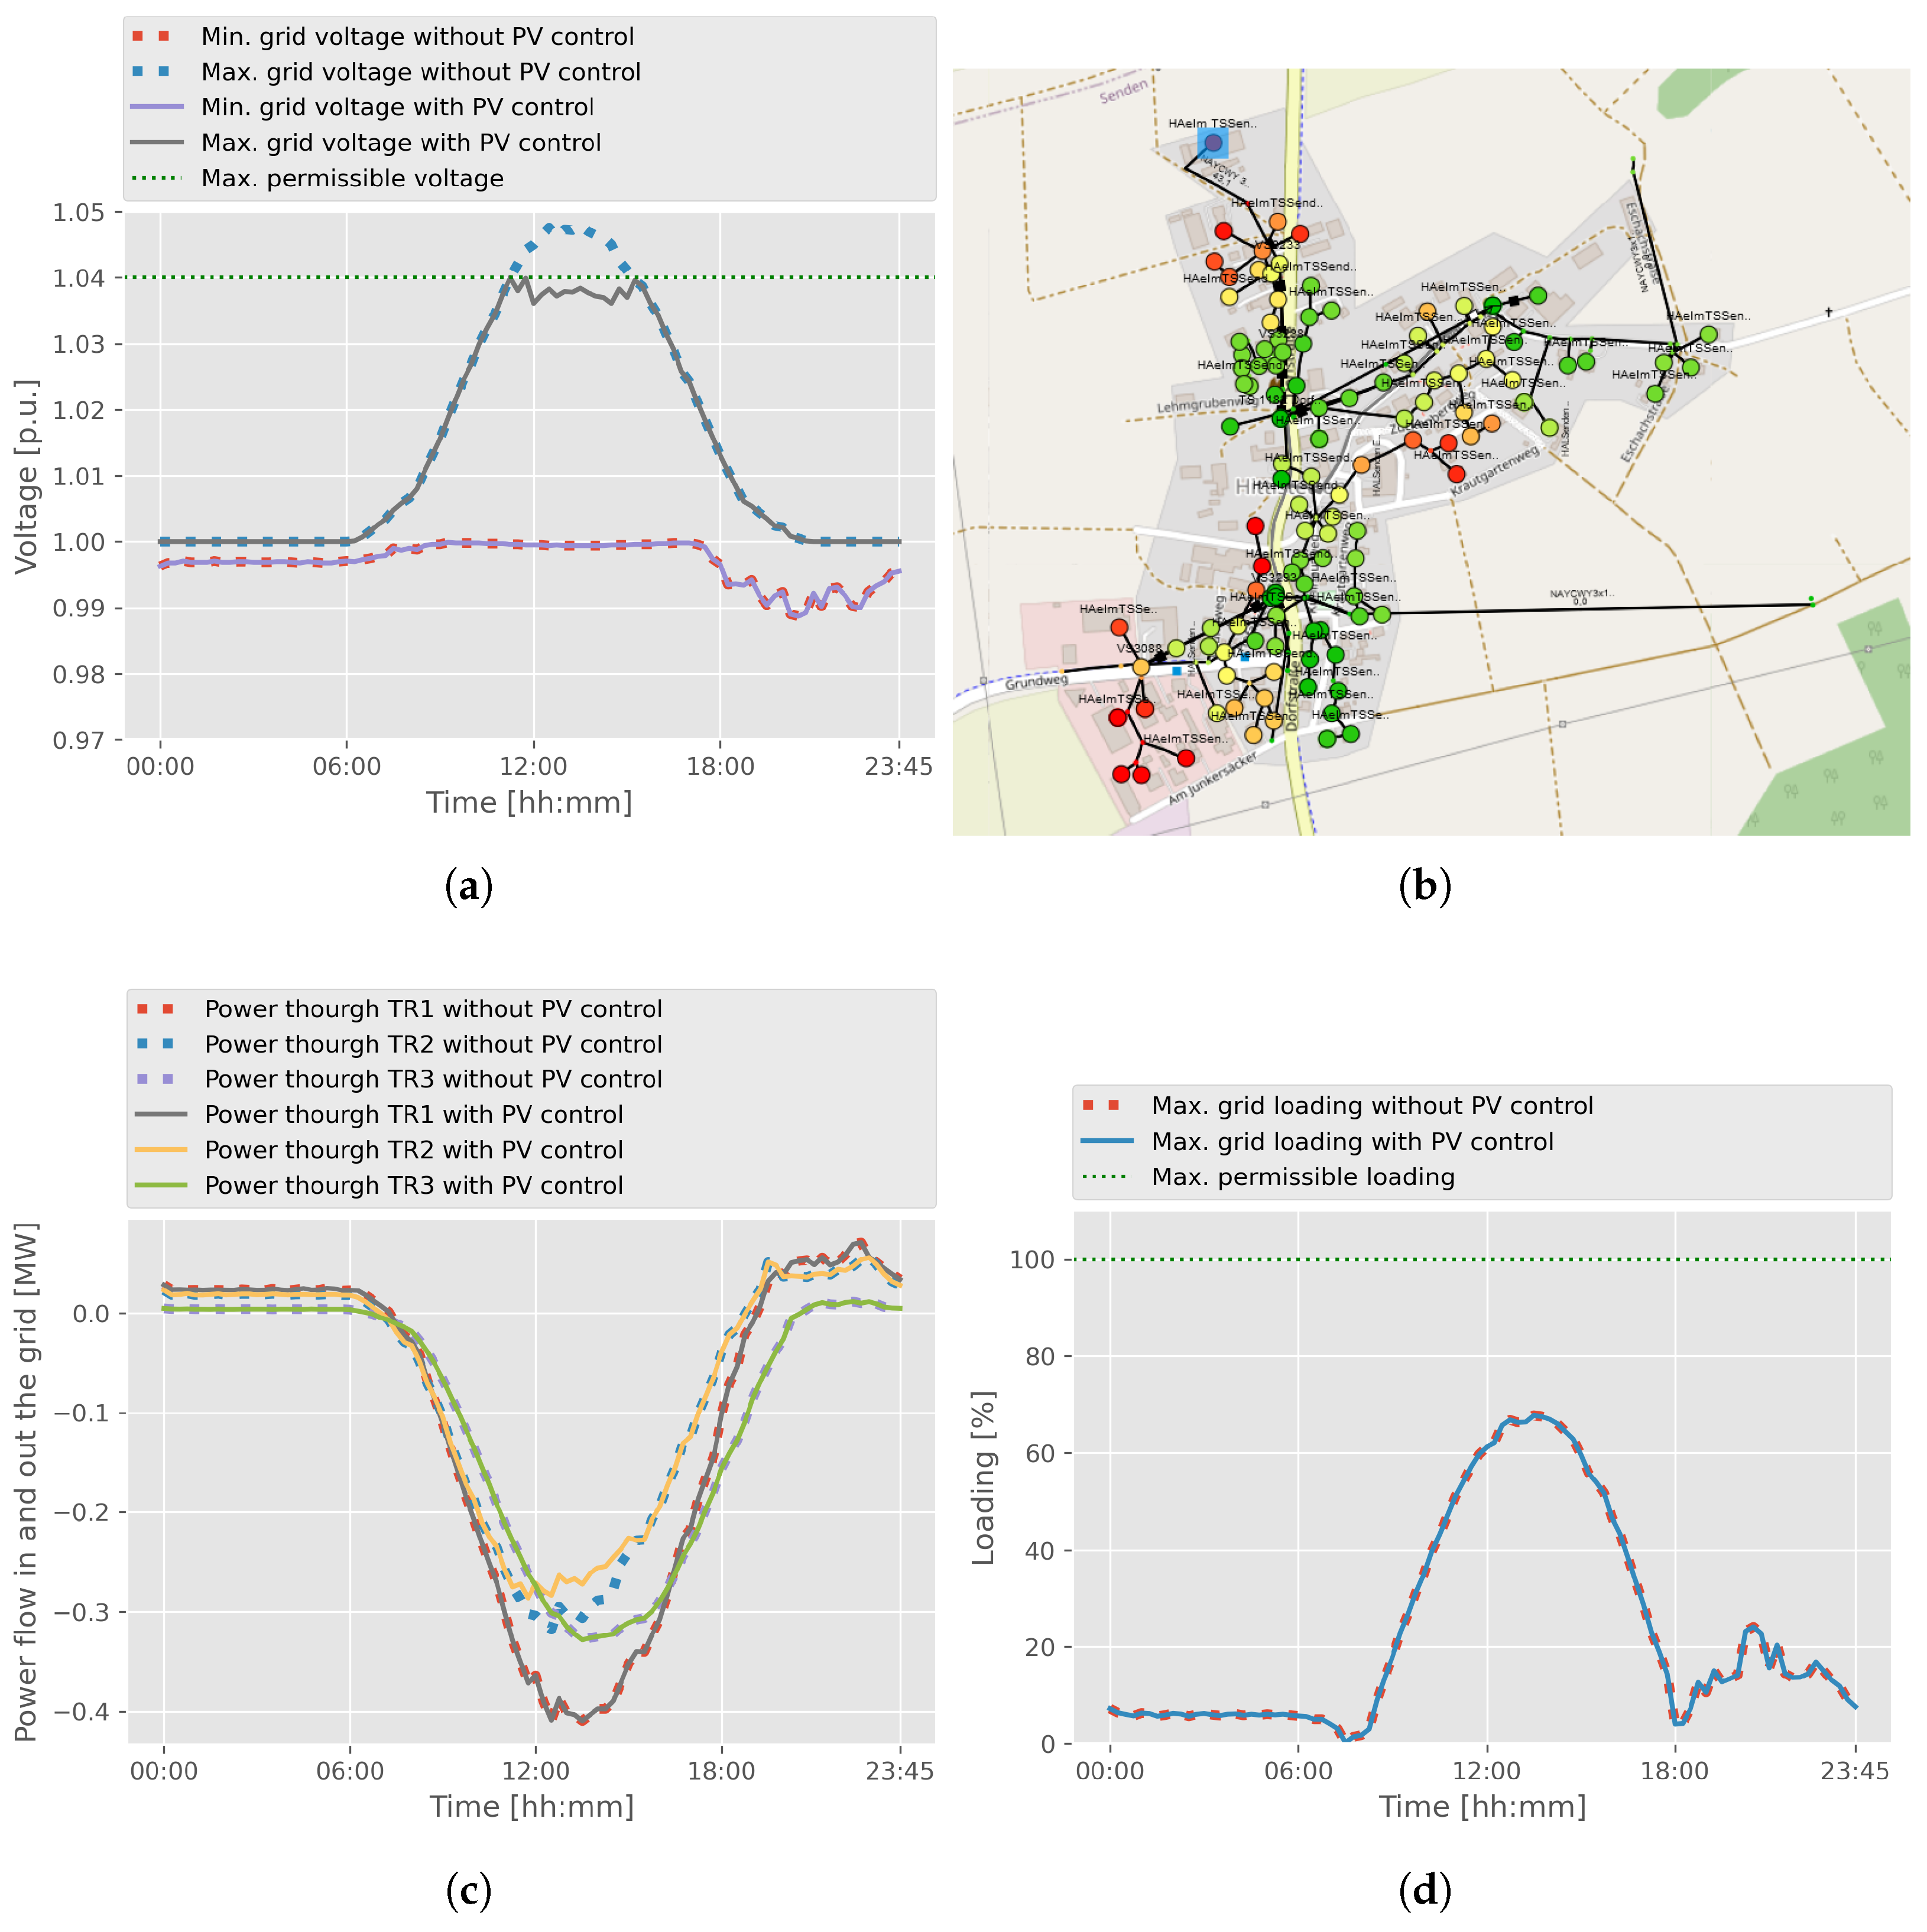
This simulation incorporated both synthetic data integrated into the grid model (see Section 2.6) and historical measurements stored in the InfluxDB (see Section 2.5). The simulation was performed for a past time period in speed-up mode. The primary advantage of SIL simulation is the ability to execute a simulation rapidly—for instance, a full-day simulation can be completed within 30 min instead of 24 h. This allows testing and validation of data integration (based on IEC 61850) and other functionalities, such as congestion management, in an offline environment. The demonstration results presented in Figure 11 are based on data from a summer clear-sky day in 2024. Plausibility was verified by comparing the results with historical measurements and previous simulations.
Figure 11.
SIL Simulation results of the test area for 26 June 2024. (a) Simulation results showing the max. and min. voltage in the grid. The voltage deviation limit was temporarily set to +4% (1.04 p.u.) for SIL testing purposes. (b) Grid depiction of the test area showing the location of the highest voltage deviation marked in blue. Other colors encode the grid voltage deviation from the nominal value, with green denoting low deviation and red denoting high deviation. (c) Simulation results showing the power exchange with the medium-voltage grid through transformers. (d) Simulation results showing the highest loading of lines in the grid.
As shown in (a) of Figure 11, the voltage remains between 0.98 and 1.05 p.u., complying with the distribution grid boundary conditions. To illustrate the developed congestion management functionality, the voltage deviation limit in the algorithm was temporarily set to +4% (1.04 p.u.), only for testing purposes in SIL. The results indicate that this limit could be maintained through PV curtailment.
Panel (b) of Figure 11 identifies the grid node with the highest voltage deviation, which, as expected, is located far from the transformer in a feeder with high PV contribution.
Panel (c) of Figure 11 shows the difference in transformer power flow with and without congestion management. The curtailed energy is reflected in the reduced power flow through the local area transformer TR2 (difference between the dashed blue curve and the yellow curve). In other words, PV curtailment decreases the reverse power through TR2, mitigating voltage rise and maintaining the normal grid conditions.
Panel (d) of Figure 11 depicts the maximum loading of grid components. In this simulation, curtailment did not affect the maximum component loading because the curtailed PV systems are located on a different feeder. Overall, the LV lines show permissible loading levels, thanks to several grid expansion measures implemented by the DSO in recent years. Nevertheless, the high PV feed-in on this clear-sky summer day increases line loading to almost 70%.
3.2. HIL Simulation
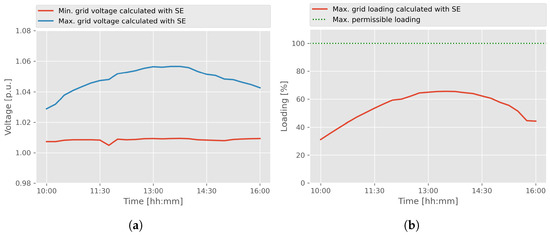
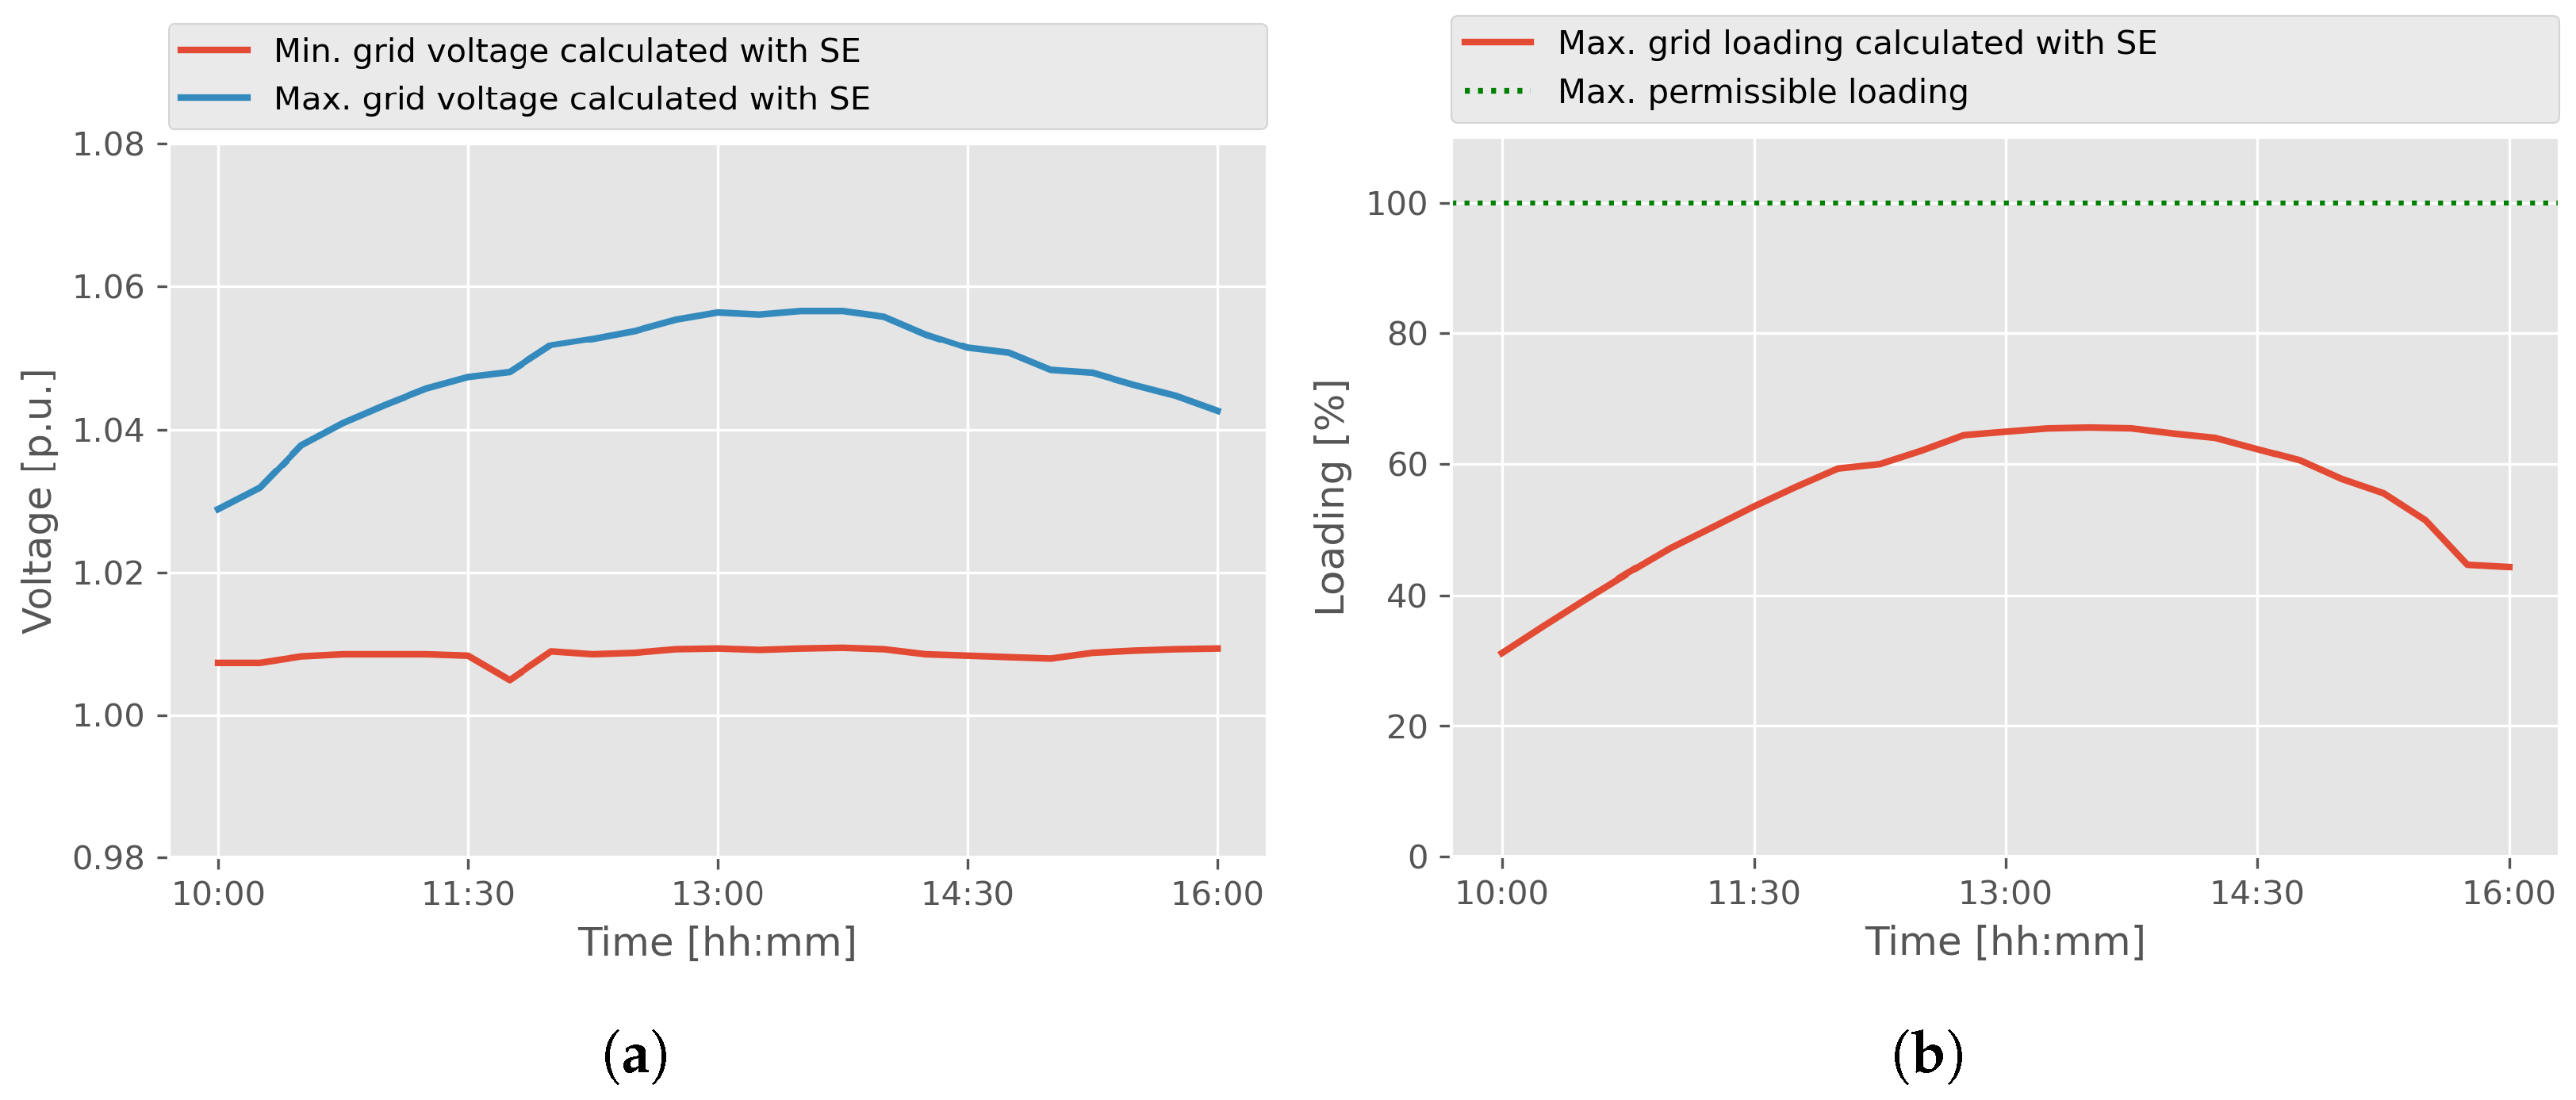
After validating the grid digital twin with numerous SIL simulations during the development phase, it was subsequently tested using several HIL simulations. The focus here is on real-time simulations with live data from the test area. Unlike SIL simulations, a full-day HIL simulation requires one full day of simulation. Therefore, multiple short-term tests (ranging from a few minutes to several hours) were carried out. The results shown in Figure 12 are based on a six-hour real-time simulation. Due to legal and organizational constraints, and since customers were concerned about external control commands, no real control actions were sent to customer PV systems during this test. It should be noted that no congestion occurred during the simulation; hence, no congestion management measures had to be applied. Within this context, however, local control commands were tested and implemented directly in PV inverters, with results to be published in a separate future paper.
Figure 12.
Real-time simulation results of the test area for 16 August 2024. (a) Simulation results showing the max. and min. voltage in the grid. (b) Simulation results showing the highest loading of lines in the grid.
To conduct real-time simulations, the same procedures as for SIL simulations must be followed, including the preparation of the grid model within the Distribution Grid Automation system. As part of this preparation, it is necessary to define which quantities are considered as “states to be estimated” by the state estimator. In general, all values not directly measured are selected as states to be estimated. These states, optimized by minimizing the sum of squared errors across all measurements, include the active and reactive power injections of PV systems and loads at selected grid nodes. The nodes were chosen with a spatial distribution across the grid to ensure broad coverage, thanks to the participation of local residents (see Figure 5). During the real-time simulation in the grid digital twin, measurement data were continuously integrated into the grid model via the developed interfaces. In the simulation software, the external measurement models received the assigned measurements according to the simulation timestamp. An example is provided in Figure 8.
The results for an exemplary day are shown in Figure 12. Panel (a) illustrates the maximum and minimum simulated voltages in the grid, which remain between 1.00 and 1.06 p.u. and therefore comply with the permissible ±10% tolerance band for LV grids. Panel (b) shows the maximum loading of grid components. The results confirm a permissible loading of all LV lines. Nevertheless, the high PV feed-in on a summer day increases line loading to nearly 65%.
The digital twin environment demonstrates that a suitable solution for the SE can be found in almost all simulated timestamps based on the available measurements. However, for a few timestamps, the SE may fail to converge within a reasonable number of iterations (set to a maximum of 50 iterations in this test) due to the limited number of measurements or errors in the measured values. In such cases, the number of parameters selected as “states to be estimated” must be reduced. Non-selected PV and load values behave as in conventional load flow calculations, i.e., they follow their assigned power values derived from synthetic data (see Section 2.6).
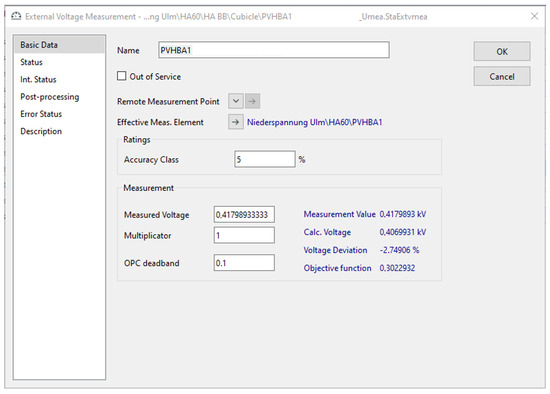
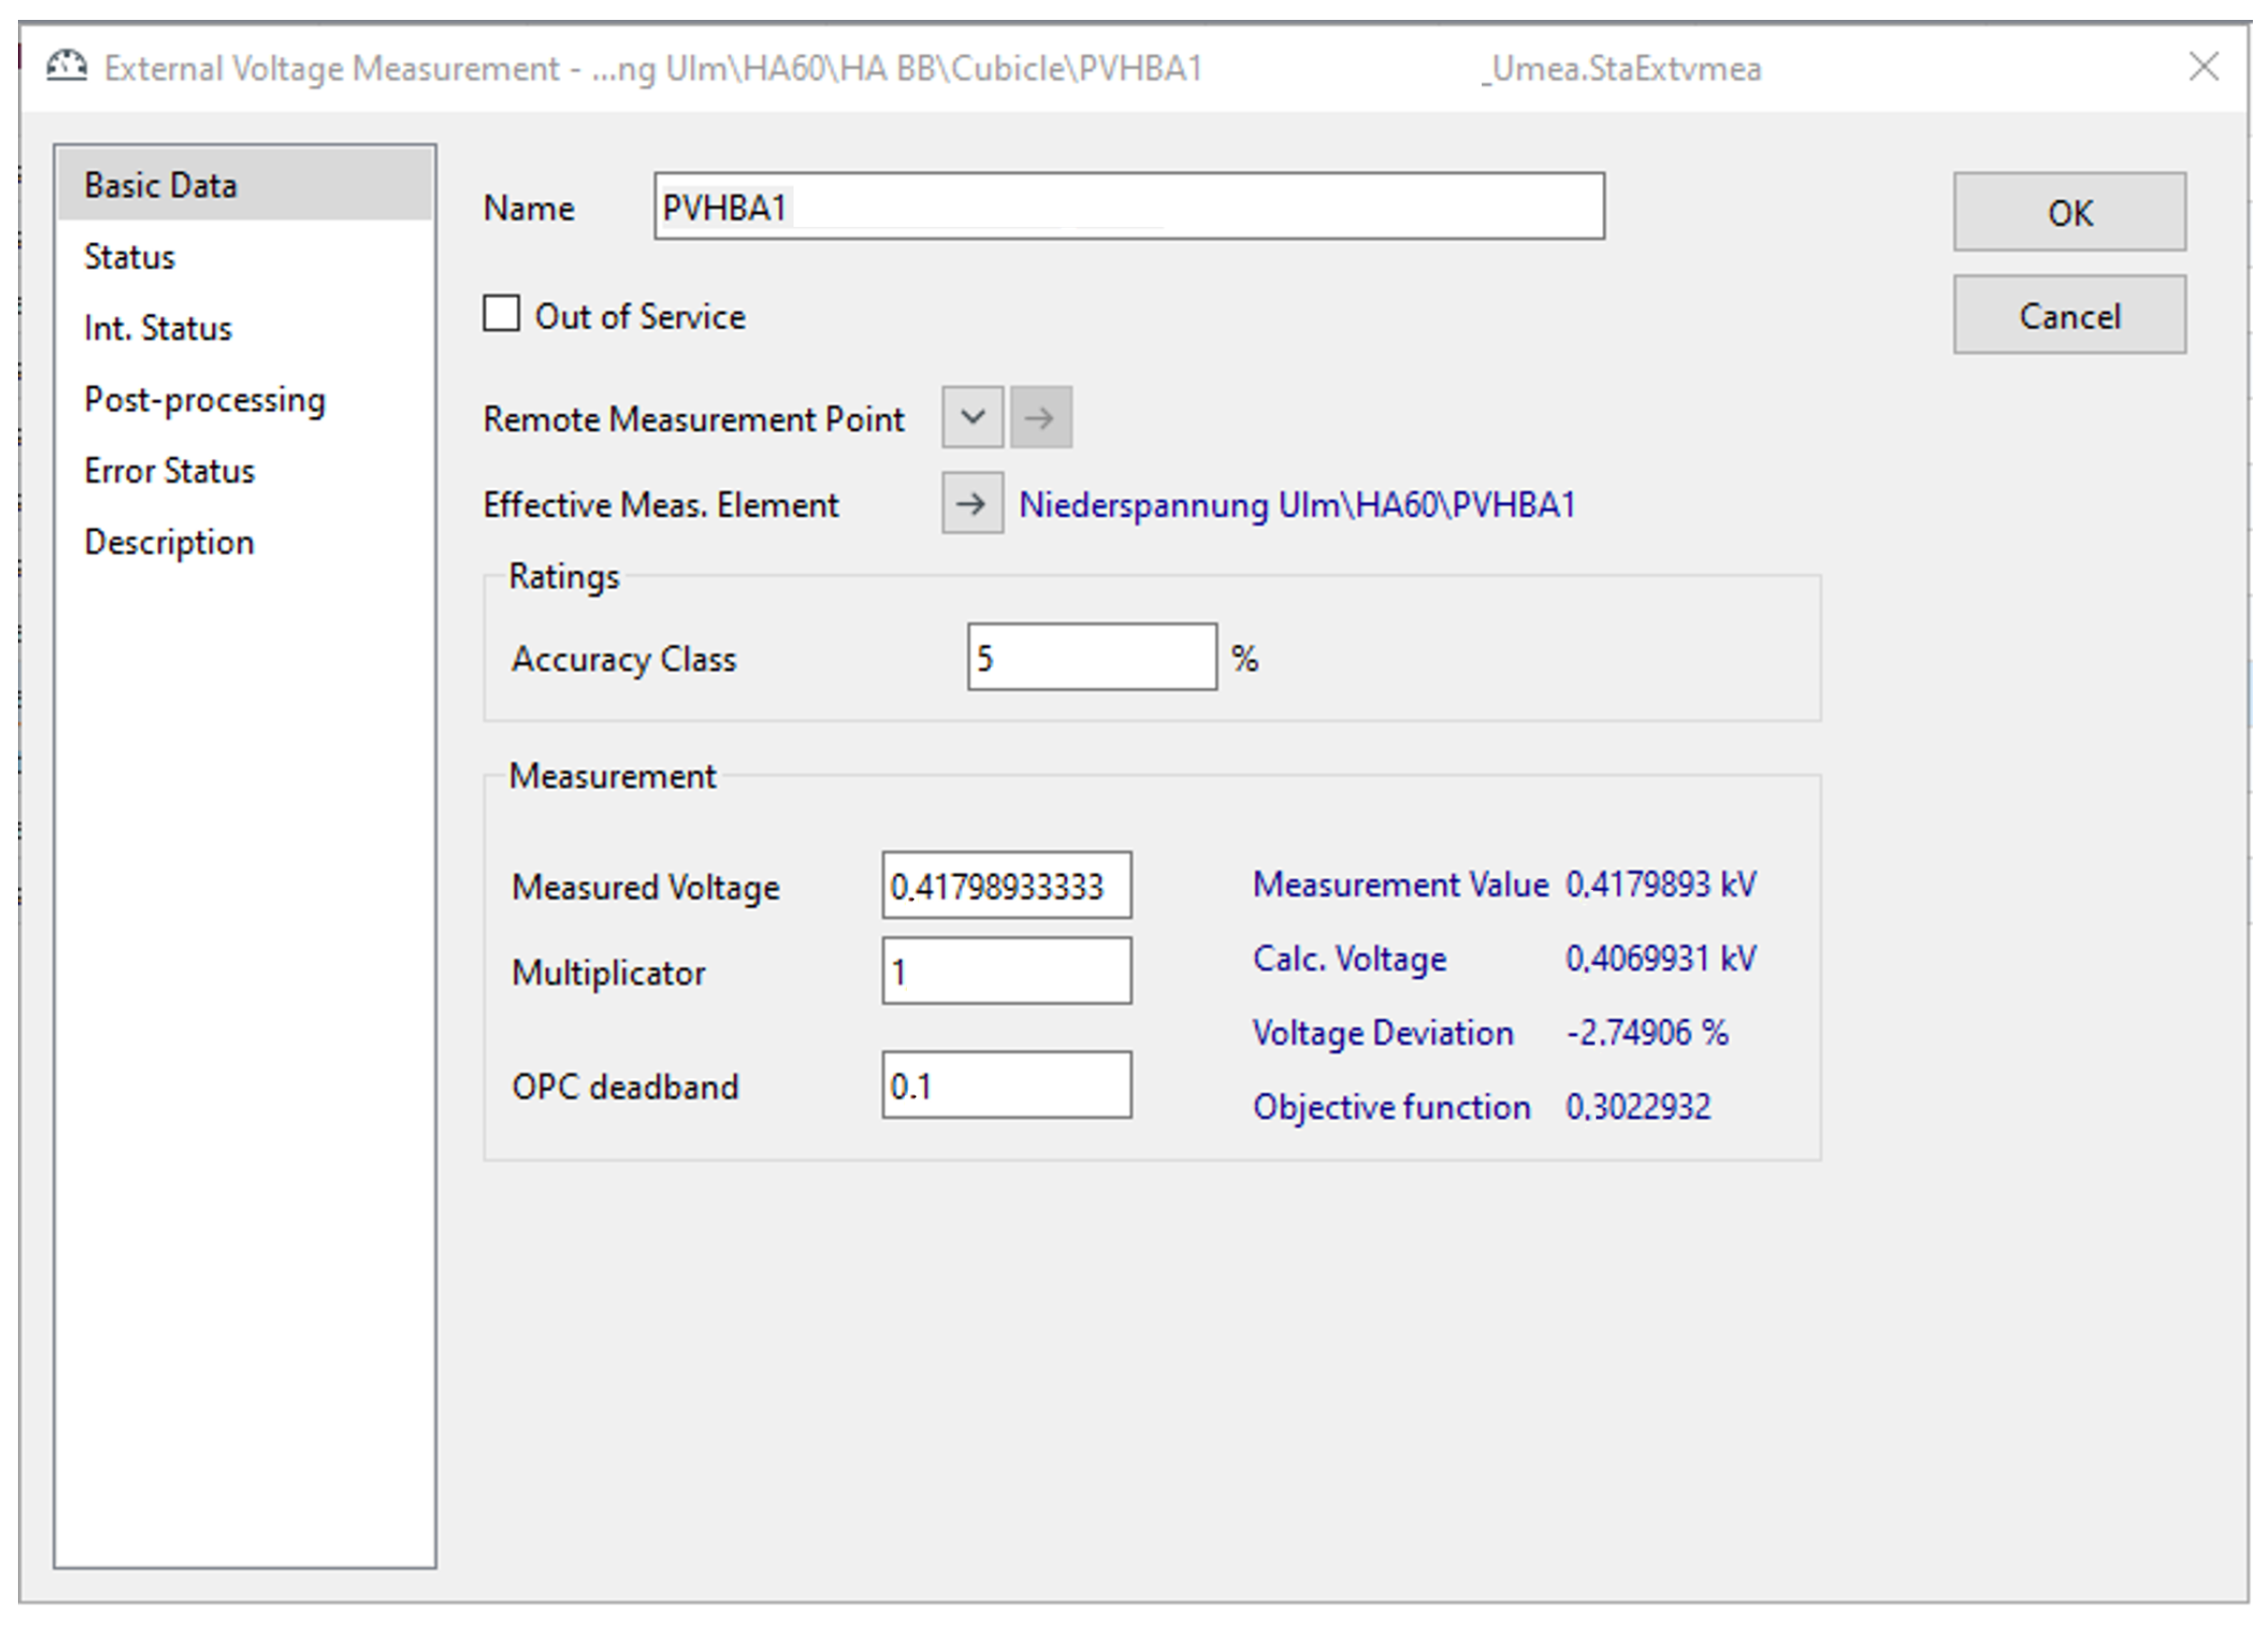
The simulation plausibility was verified through a comparison between the simulation results and other historical data, and also with the measurements that were integrated into the SE as reference values. For example, the deviation between measured and simulated voltages was within 3% for most timestamps. In rare cases, such as during strong fluctuations in feed-in or consumption, deviations of up to 6% were observed. An example is shown in Figure 13.
Figure 13.
Voltage deviation in the simulation of 10 August 2024, as shown in the simulation software (error of the calculated voltage compared to the measured voltage is 2.749%).
4. Discussion
The results indicate that the digital twin can perform real-time state estimation in LV grids with reasonable accuracy (within ~3% of deviation between measured and simulated voltages for most simulated timestamps). At the same time, the estimation remains sensitive to erroneous inputs—e.g., a PV system effectively feeds power while telemetry falsely reports zero output—which can propagate into incorrect conclusions. This highlights the need for further research on improving SE accuracy, for which the presented digital twin environment provides a solid foundation.
Congestion management based on selective PV curtailment was also integrated into the grid digital twin. Although the approach relies on a simplified deterministic algorithm, it proved sufficient to mitigate congestion in high PV feed-in scenarios and restore normal grid operation. Nevertheless, the implemented algorithm cannot prevent congestion under high-consumption conditions, such as the simultaneous charging of many EVs at night. In general, congestion management offers substantial potential for improvement, for example, by integrating additional flexibility measures such as EV charge management.
Collecting data from diverse sources and integrating them into the IT infrastructure of DSOs remain complex and costly. Moreover, communication failures or data inconsistencies between sources—such as measuring devices and the simulation environment—can lead to inaccuracies. This underlines the significant benefits of standardized interfaces and reliable communication infrastructures. The standardized interfaces developed in this work, based on IEC 61850, offer major advantages for data acquisition, harmonization, and integration into grid simulations. The flexibility enabled by such interfaces also facilitated collaboration with other research partners and allowed for the rapid preparation and execution of an additional field test. The results of this test can be presented by the project partners in a future publication.
The next phase of this research will focus on identifying and prioritizing the types and quantities of data required to efficiently perform SE in LV grids and achieve accurate real-time results. A key task will be to evaluate the relative importance of different data categories, including the location of measuring devices within the grid, the type of grid component monitored (e.g., PV systems), the measured parameters, the measurement accuracy, and required forecast parameters. Another objective will be to determine the necessary amount of data, such as the number of measurement points, their spatial distribution, and the appropriate temporal resolution. Based on these analyses, future studies will provide recommendations for stakeholders, specifying which data types are essential to ensure accurate SE results and must therefore be collected and integrated. In addition, the studies will identify data that contribute only marginally to accuracy and may be integrated only if this proves to be cost-effective.
5. Conclusions
Given the growing penetration of DES, particularly rooftop PV, and the limited measurement availability in LV grids, simulation-based approaches are becoming increasingly important for grid planning and operation. This work developed and demonstrated a grid digital twin designed for real-time SE, providing standardized interfaces and congestion management functionalities. The proposed twin enables real-time grid monitoring, increases transparency for DSOs, and supports the efficient utilization of existing LV infrastructure to accommodate a high share of DES.
Key contributions. (i) A concept and implementation of an LV digital twin that couples a topology-aware grid model, realistic model parametrization, and a real-time state estimation pipeline under practical constraints (partial coverage and asynchronous measurement sampling). (ii) Standardized, interoperable data interfaces and modeling based on IEC 61850. (iii) An operation-oriented congestion management approach using selective PV curtailment to restore normal operation in high feed-in scenarios.
Results and evidence. The solution was tested in several simulations—including SIL, historical playback, and speed-up simulations—as well as under real-time conditions with real measurements. The SE achieved reasonable accuracy given the availability and quality of the integrated data, including PV inverter power and voltage measurements as well as transformer and feeder data. Selective PV curtailment was shown to mitigate congestion and restore voltages to admissible ranges, thereby increasing the effective hosting capacity of existing LV grids. Compared to conventional reinforcement, the digital twin based on real-time measurements represents a practical alternative for maintaining normal operation.
Field insights. Demonstration in the test area provided practical insights into the opportunities and challenges of implementing measurement and simulation infrastructures at LV level. It also underscored the importance of high-quality measurements in standardized formats and the value of cooperation between DSOs, software developers, and researchers.
Practical relevance. Recent regulatory developments in Germany call for DSOs to collect real-time measurements and operate digital twins down to the LV level. This highlights the relevance of the presented twin and its IEC 61850-based modeling for large-scale integration of DES. Beyond precise monitoring, the twin helps identify and control local grid fluctuations and can support planning of grid reinforcements under increasing decentralized feed-in.
Limitations. The performance of the SE depends mainly on measurement availability and quality; gaps in coverage and uncertainties in the integrated data can limit accuracy. These factors do not invalidate the approach but delimit its generalization to feeders with different data conditions.
Outlook. Future work will focus on integrating smart meter data as it becomes available for this research. We aim to extend measurement coverage, improve time synchronization, refine the estimation pipeline, and further evaluate congestion management options within the digital twin. A key goal is to identify and prioritize the types and amounts of data needed for accurate real-time state estimation in LV grids, including measurement locations, monitored components, parameters, and forecast inputs. This will help determine the optimal number of measurement points, their spatial distribution, and temporal resolution, allowing DSOs to focus on essential data. These steps towards a grid digital twin will enable DSOs to address operational challenges from a new perspective and strengthen data-driven planning and control in LV grids.
Author Contributions
Conceptualization, B.I. and D.G.; methodology, B.I.; software, B.I.; validation, B.I. and D.G.; formal analysis, B.I.; investigation, B.I.; resources, D.G.; data curation, B.I.; writing—original draft preparation, B.I.; writing—review and editing, B.I. and D.G.; visualization, B.I.; supervision, D.G.; project administration, D.G.; funding acquisition, D.G. All authors have read and agreed to the published version of the manuscript.
Funding
This research was supported by the Project SERENDIPV: Smooth, REliable aNd Dispatchable Integration of PV in EU grids, funded by EU—Horizon 2020/FP8—Grant Agreement nº 953016.
Data Availability Statement
The operational measurements and grid data analyzed in this study are owned by the DSO (Stadtwerke Ulm/Neu-Ulm Netze GmbH, Website: https://www.ulm-netze.de/, accessed on 5 November 2025) and were shared under a data-processing agreement for research purposes. Due to contractual confidentiality, privacy, and critical-infrastructure protection obligations, these data are not publicly available. Aggregated statistics and example configurations of the LV grid digital twin (without identifying information about the test area) are available from the corresponding author upon reasonable request and subject to DSO approval.
Acknowledgments
We gratefully acknowledge the financial support provided by EU Horizon 2020, which made this study possible.
Conflicts of Interest
The authors declare no conflicts of interest.
Abbreviations
The following abbreviations are used in this manuscript:
| ALPG | Artificial load profile generator |
| API | Application programming interface |
| BC-DSSE | Branch-current-based distribution system state estimation |
| CLS | Controllable local system |
| DES | Distributed energy systems |
| DNN | Deep neural network |
| DSO | Distribution system operator |
| DSSE | Distribution system state estimation |
| EU | European Union |
| EV | Electric vehicle |
| EnWG | Energiewirtschaftsgesetz (German Energy Industry Act) |
| HIL | Hardware-in-the-loop |
| HP | Heat pump |
| LV | Low-voltage (distribution grid) |
| MASE | Multi-area state estimation |
| PMU | Phasor measurement unit |
| PV | Photovoltaic (systems) |
| SE | State estimation |
| SIL | Software-in-the-loop |
| THU | Technische Hochschule Ulm (Ulm University of Applied Sciences) |
| WLS | Weighted least squares |
| iMSys | Intelligent metering systems |
References
- Oerter, C.; Neusel-Lange, N. LV-grid automation system—A technology review. In Proceedings of the 2014 IEEE PES General Meeting/Conference & Exposition, National Harbor, MD, USA, 27–31 July 2014; pp. 1–5. [Google Scholar] [CrossRef] [Scilit]
- Majeed, I.B.; Nwulu, N.I. Impact of Reverse Power Flow on Distributed Transformers in a Solar-Photovoltaic-Integrated Low-Voltage Network. Energies 2022, 15, 9238. [Google Scholar] [CrossRef] [Scilit]
- Kotsonias, A.; Hadjidemetriou, L.; Asprou, M.; Panayiotou, C.G. Operational challenges and solution approaches for low voltage distribution grids—A review. Electr. Power Syst. Res. 2025, 239, 111258. [Google Scholar] [CrossRef] [Scilit]
- Giannelos, S.; Borozan, S.; Konstantelos, I.; Strbac, G. Option value, investment costs and deployment levels of smart grid technologies. Sustain. Energy Res. 2024, 11, 47. [Google Scholar] [CrossRef] [Scilit]
- Milbradt, R.G.; Canha, L.N. State Estimation. In Smart Operation for Power Distribution Systems; Bernardon, D.P., Garcia, V.J., Eds.; Springer International Publishing: Cham, Switzerland, 2018; pp. 15–35. [Google Scholar] [CrossRef] [Scilit]
- Federal Ministry for Economic Affairs and Climate Action (BMWK). Smart Meter: Intelligente Messsysteme für die Energiewende. 2025. Available online: https://www.bundeswirtschaftsministerium.de/Redaktion/DE/Textsammlungen/Energie/smart-meter.html (accessed on 11 July 2025).
- Federal Ministry of Justice and Federal Office of Justice. Gesetz über den Messstellenbetrieb und die Datenkommunikation in Intelligenten Energienetzen (MsbG). Legal Text. 2025. Available online: https://www.gesetze-im-internet.de/messbg/ (accessed on 11 July 2025).
- Federal Republic of Germany. German Energy Industry Act (EnWG), Section 14a. Legal Document. 2023. Available online: https://www.gesetze-im-internet.de/enwg_2005/__14a.html (accessed on 24 April 2025).
- Federal Ministry for Economic Affairs and Climate Action (BMWK). Gesetz zur Änderung des Energiewirtschaftsgesetzes zur Vermeidung Temporärer Erzeugungsüberschüsse (“Solarspitzen-Gesetz”)—Inkl. § 9 EEG. Legal Text. 2025. Available online: https://www.clearingstelle-eeg-kwkg.de/gesetz/7055 (accessed on 4 November 2025).
- PSI Software SE. PSIngo. Computer Software Germany. 2025. Available online: https://www.psi.de/loesungen/produkte/psingo (accessed on 20 April 2025).
- VIVAVIS AG. Smart Grid Operation Platform (SGOP). Computer Software. Germany. 2025. Available online: https://sgop.global/ (accessed on 12 March 2025).
- Peng, Y.; Zhao, F.; Zhou, K.; Yu, X.; Jin, Q.; Li, R.; Shuai, Z. Review of digital twin technology in low-voltage distribution area and the implementation path based on the ‘6C’ development goals. Energies 2025, 18, 4459. [Google Scholar] [CrossRef] [Scilit]
- Pereira, A.; Hovstø, A.; Rodrigues, E.; Silvia, F.; Suciu, G.; Al-Naday, M.; Samovich, N.; Kalenskyy, O.; Černý, O.; Santiago, R. Edge Driven Digital Twins in Distributed Energy Systems: Role and Opportunities for Hybrid Data Driven Solutions; Technical Report; Alliance for Internet of Things Innovation (AIOTI) Working Group Energy: Brussels, Belgium, 2024. [Google Scholar]
- Heluany, J.B.; Gkioulos, V. A review on digital twins for power generation and distribution. Int. J. Inf. Secur. 2024, 23, 1171–1195. [Google Scholar] [CrossRef] [Scilit]
- Pau, M.; Patti, E.; Barbierato, L.; Estebsari, A.; Pons, E.; Ponci, F.; Monti, A. Low voltage system state estimation based on smart metering infrastructure. In Proceedings of the 2016 IEEE International Workshop on Applied Measurements for Power Systems (AMPS), Aachen, Germany, 28–30 September 2016; pp. 1–6. [Google Scholar] [CrossRef] [Scilit]
- Abdel-Majeed, A.; Braun, M. Low voltage system state estimation using smart meters. In Proceedings of the 2012 47th International Universities Power Engineering Conference (UPEC), Uxbridge, UK, 4–7 September 2012. [Google Scholar] [CrossRef] [Scilit]
- Li, K.; Han, X. A distributed Gauss–Newton method for distribution system state estimation. Int. J. Electr. Power Energy Syst. 2022, 136, 107694. [Google Scholar] [CrossRef] [Scilit]
- Pau, M.; Pegoraro, P.A.; Sulis, S. Branch current state estimator for distribution system based on synchronized measurements. In Proceedings of the 2012 IEEE International Workshop on Applied Measurements for Power Systems (AMPS) Proceedings, Aachen, Germany, 26–28 September 2012; pp. 1–6. [Google Scholar] [CrossRef] [Scilit]
- Danner, D.; De Meer, H. State Estimation in the Power Distribution System. ACM SIGMETRICS Perform. Eval. Rev. 2019, 46, 86–88. [Google Scholar] [CrossRef] [Scilit]
- Yang, J.; Tian, R.; Hu, S.; Fan, B.; Peng, B.; Qiu, X. Distribution power system state estimation based on Gaussian mixture model-Neural network. In Proceedings of the 2020 IEEE Sustainable Power and Energy Conference (iSPEC), Chengdu, China, 23–25 November 2020; pp. 2552–2557. [Google Scholar] [CrossRef] [Scilit]
- Huang, M.; Zhao, J.; Wei, Z.; Pau, M.; Sun, G. Decentralized robust state estimation for hybrid AC/DC distribution systems with smart meters. Int. J. Electr. Power Energy Syst. 2022, 136, 107656. [Google Scholar] [CrossRef] [Scilit]
- Waeresch, D.; Brandalik, R.; Wellssow, W.H.; Jordan, J.; Bischler, R.; Schneider, N. Linear State Estimation in Low Voltage Grids based on Smart Meter Data. In Proceedings of the 23rd International Conference on Electricity Distribution (CIRED 2015), Lyon, France, 15–18 June 2015; pp. 1–5. [Google Scholar] [CrossRef] [Scilit]
- Wintzek, P.; Ali, S.A.; Monscheidt, J.; Gemsjäger, B.; Slupinski, A.; Zdrallek, M. Planungs- und Betriebsgrundsätze für Städtische Verteilnetze: Leitfaden zur Ausrichtung der Netze an Ihren Zukünftigen Anforderungen; Neue Energie aus Wuppertal, Band 35; Bergische Universität Wuppertal: Wuppertal, Germany; Siemens AG: Erlangen, Germany, 2021; Available online: http://elpub.bib.uni-wuppertal.de/servlets/DocumentServlet?id=14940 (accessed on 20 November 2025).
- Groß, D. Zustandsschätzung für eine Aktive Verteilnetzführung Unter Berücksichtigung Einer Defizitären Messinfrastruktur; Number Band 31 in Schriftenreihe des Instituts für Energieübertragung und Hochspannungstechnik (IEH); BoD–Books on Demand: Norderstedt, Germany, 2020. [Google Scholar]
- Gawron-Deutsch, T.; Kupzog, F.; Einfalt, A.; Ghaemi, S. Avoiding Grid Congestions with Traffic Light Approach and the Flexibility Operator. In Proceedings of the CIRED Workshop 2014, Rome, Italy, 11–12 June 2014; pp. 1–4. Available online: https://www.researchgate.net/publication/265181645_AVOIDING_GRID_CONGESTIONS_WITH_TRAFFIC_LIGHT_APPROACH_AND_THE_FLEXIBILITY_OPERATOR (accessed on 20 November 2025).
- Schäfer, K.F. Netzzustandserkennung. In Netzberechnung; Springer: Wiesbaden, Germany, 2020; pp. 289–345. [Google Scholar] [CrossRef] [Scilit]
- InfluxData Inc. InfluxDB. Database Software. USA. 2025. Available online: https://www.influxdata.com/products/influxdb/ (accessed on 25 April 2025).
- IEC 61850; Communication Networks and Systems for Power Utility Automation. International Electrotechnical Commission: Geneva, Switzerland, 2013.
- DIgSILENT GmbH. PowerFactory. Computer Software. Germany. 2023. Available online: https://www.digsilent.de/en/powerfactory.html (accessed on 5 October 2024).
- Chen, S.; Heilscher, G.; Lorenz, H.; Ebe, F.; Kondzialka, C.; Idlbi, B.; Muratidis, P.; Morris, J.; Ruf, H.; Langer, D. Demonstration der intelligenten, sicheren Steuerung von PV-Systemen über iMsys und CLS-Infrastruktur. In Proceedings of the 36. PV-Symposium, Online, 18–26 May 2021; p. 20. [Google Scholar]
- Kondzialka, C.; Casel, M.; Idlbi, B.; Chen, S.; Heilscher, G.; Ruf, H.; König, M.; Ascher, D. Standardisierter Datenaustausch zwischen IT-Systemen von Verteilnetzbetreibern als Ausweg aus der Integrationsfalle. In Proceedings of the ZUKÜNFTIGE STROMNETZE 2019, Berlin, Germany, 22–23 January 2019; p. 16. [Google Scholar]
- European Parliament and Council of the European Union. Regulation (EU) 2016/679 of 27 April 2016 on the Protection of Natural Persons with Regard to the Processing of Personal Data (General Data Protection Regulation). Off. J. Eur. Union 2016, L119, 1–88. Available online: https://eur-lex.europa.eu/legal-content/EN/TXT/?uri=CELEX%3A32016R0679 (accessed on 5 November 2025).
- Krähmer, S.; Idlbi, B.; Belkilani, K.; Graeber, D. Solar Roof Potential Analysis Case Study: Test Area in South of Germany. In Proceedings of the 41st European Photovoltaic Solar Energy Conference and Exhibition, Vienna, Austria, 23–27 September 2024; 2024; pp. 020468-001–020468-006, ISBN 9783936338904. [Google Scholar] [CrossRef]
- Hoogsteen, G.; Molderink, A.; Hurink, J.L.; Smit, G.J. Generation of flexible domestic load profiles to evaluate Demand Side Management approaches. In Proceedings of the 2016 IEEE International Energy Conference (ENERGYCON), Leuven, Belgium, 4–8 April 2016; pp. 1–6. [Google Scholar] [CrossRef] [Scilit]
- Lu, Z.; Chen, S.; Heilscher, G. Demonstration of a concept for the data management and monitoring of larger-scale DER utilizing a time-series database. In Proceedings of the 27th International Conference on Electricity Distribution (CIRED 2023), Rome, Italy, 12–15 June 2023; pp. 3829–3833. [Google Scholar] [CrossRef] [Scilit]
- Chen, S.; Urban, K.; Rusnák, J.; Heilscher, G. A Novel Container-based Approach for the Integration of Solar Forecast in Real-time Simulation Framework and Model Predictive Control. In Proceedings of the IET Conference Proceedings, CIRED Workshop 2024 (Vienna Workshop), Vienna, Austria, 19–20 June 2024. [Google Scholar] [CrossRef] [Scilit]

Disclaimer/Publisher’s Note: The statements, opinions and data contained in all publications are solely those of the individual author(s) and contributor(s) and not of MDPI and/or the editor(s). MDPI and/or the editor(s) disclaim responsibility for any injury to people or property resulting from any ideas, methods, instructions or products referred to in the content. |
© 2026 by the authors. Licensee MDPI, Basel, Switzerland. This article is an open access article distributed under the terms and conditions of the Creative Commons Attribution (CC BY) license.