1. Introduction
Turbulent swirling flows undergoing vortex breakdown are a fundamental fluid dynamics phenomenon with significant implications across various engineering applications. A prevalent coherent structure accompanying vortex breakdown is the precessing vortex core (PVC). The PVC is a single-helical global instability mode characterized by a well-defined precession frequency, which manifests as a dominant oscillatory motion in the flow field [
1]. The impact of the PVC is highly context-dependent. In some systems, like certain combustion chambers, it can influence mixing and flame dynamics [
2,
3], while in others, it is a source of detrimental flow unsteadiness [
4,
5]. Consequently, the ability to understand and actively control the PVC’s characteristics, particularly its frequency, is a topic of broad scientific and engineering interest.
A prime example of a detrimental PVC occurs in the draft tubes of Francis hydraulic turbines [
6]. Hydropower constitutes a cornerstone of renewable energy and is indispensable for balancing modern power grids with increasing penetration of intermittent generation from solar and wind sources [
7]. This requires hydroelectric power plants (HPPs) to operate across an extensive range of loads. For medium and high heads, Francis turbines are the most prevalent technology. Under part-load regimes, these turbines generate a highly swirling flow downstream of the runner, where vortex breakdown leads to the formation of a PVC, often termed a vortex rope. This PVC generates intense, low-frequency pressure pulsations that exert dynamic loads on the turbine structure and downstream components [
4]. When the precession frequency of the PVC coincides with a natural frequency of any structural element, resonant conditions can arise, leading to elevated vibration amplitudes, reduced efficiency, and operational safety concerns [
8]. Therefore, developing methods to control PVC frequency represents a critical challenge for expanding the operational flexibility of hydropower.
In hydraulic turbines, common flow control methods involve continuous air or water injection, often axially through the runner hub. While effective in reducing pressure pulsation amplitudes, these methods typically require substantial injection flow rates, often 5% to 15% of the turbine discharge, which incur a direct penalty on overall plant efficiency [
9,
10]. This inefficiency largely stems from an empirical, non-targeted approach focused on symptom suppression rather than addressing the root instability mechanism.
From a fundamental hydrodynamic stability perspective, the PVC is a global mode resulting from a supercritical Hopf bifurcation. It emerges in the shear layer of the recirculation zone formed due to vortex breakdown under strong swirl [
11]. Linear Stability Analysis (LSA) provides a rigorous framework for analyzing this instability, treating the PVC as a global eigenmode of the system. Crucially, the adjoint formulation of LSA enables the identification of regions of maximum receptivity within the flow field [
12,
13,
14]. Receptivity maps reveal specific zones where external harmonic forcing most effectively couples energy into the targeted global mode. For Francis turbines, LSA studies have localized this receptive region near the trailing edge of the runner hub, within the core of the recirculation zone [
12]. A spatial map of the flow’s sensitivity to harmonic forcing, which directly visualizes this optimal region for actuator placement, is provided in another work (see Figure 6a in [
12]). This informed the positioning of our rotating actuator to ensure the strongest possible coupling with the PVC’s global instability mode.
This theoretical framework, validated in combustion studies [
2], suggests a highly efficient control strategy: resonant forcing. By applying a low-amplitude periodic disturbance within the high-receptivity region, one can directly interact with the instability mechanism. This interaction can lead to frequency lock-in (synchronization), where the natural frequency of the PVC becomes entrained by the forcing frequency. To reach this synchronization, the actuation amplitude must be increased to a critical threshold, known as the lock-in amplitude, whose value depends on several system parameters.
Prior to this study, frequency lock-in was demonstrated for a self-excited, non-swirling jet forced sinusoidally by a loudspeaker across a range of 0.84 to 1.16 times the global natural frequency. In addition to lock-in, specific bifurcations were observed, including an asymmetry in the synchronization behavior: the jet locked in more readily and exhibited stronger oscillations when forced below its natural frequency compared to forcing above it. Subsequent works by Lückoff [
3,
15] on combustion systems demonstrated that this approach achieves control with remarkably low energy input, as the actuator amplifies the existing natural mode rather than overwhelming it. In the lock-in state, both the frequency and, to a degree, the amplitude of the PVC can be governed by the external forcing [
16]. These lock-in results represent significant progress in the development of efficient actuators for swirl-stabilized burners. Nevertheless, extending and testing this control paradigm in other industrial applications, particularly in hydrodynamic systems such as hydraulic turbines, remain a challenge.
A further limitation of existing research is the predominant focus on pressure amplitude reduction as the sole metric of success. Although vital, this metric offers an incomplete view. However, detailed experimental characterization of how active flow control, particularly jet injection, alters the fundamental frequency of the PVC remains scarce. To the best of our knowledge, the deliberate and direct control of the PVC precession frequency via rotating actuation in a hydrodynamic context has not been systematically demonstrated. It is important to emphasize that the adaptation from combustion systems involves distinct challenges: the absence of heat release simplifies the physics but removes a potential coupling mechanism; the Reynolds number regimes differ; and the constrained, densely packed geometry of hydraulic machinery complicates actuator integration compared to more open combustion chambers. Consequently, the systematic experimental demonstration of direct PVC frequency control via resonant forcing in this context remains an open challenge. Understanding and achieving this frequency control is paramount, as it would enable strategies to detune the instability from structural resonances.
A key metric for evaluating active flow control efficiency is the actuator’s energy input relative to the main flow energy. The dimensionless momentum flux coefficient,
Cμ, serves this purpose [
17]:
where
Sc is the total exit area of the actuator orifices,
S0 = π
D2/4 is the reference cross-sectional area of the flow passage, and
Wc and
W are the mean velocities of the control jet and main flow, respectively.
Cμ represents the ratio of the actuator’s momentum flux to that of the primary flow. Resonant strategies in combustion problems have demonstrated exceptional efficiency, achieving lock-in at
Cμ values as low as 0.2% [
3,
16]. Also, our prior work [
18] established a generalized correlation between
Cμ and the suppression of the PVC’s energetic contribution, underscoring its role as a key scaling parameter for control effectiveness.
Translating this efficient, receptivity-based resonant control paradigm to hydraulic machinery is highly promising. While the absence of combustion simplifies the physics by removing heat release effects, adaptation to different Reynolds numbers and complex geometries is necessary. Stability analyses confirm the absolute instability of the Francis turbine draft tube flow to helical modes (
m = 1) [
13], and even instability of double helical modes (
m = 2) [
19], validating the potential for targeted control. This work presents an experimental study on controlling the precession frequency of the vortex core. The investigation employs an aerodynamic model of a swirling, expanding flow, representative of a Francis turbine draft tube. Excitation was achieved through low-mass-flow air injection via rotating actuators with one and two radial orifices. The choice of one or two orifices is based on the dominant instability modes of the flow. The PVC is associated with azimuthal modes
m = 1 and
m = 2. The flow is stable to perturbations with higher wavenumbers (e.g.,
m = 3); therefore, actuators with three or more holes, designed to excite such stable modes, were not considered, as they would not effectively couple with the dominant global instability targeted for control [
19].
The specific objectives are as follows:
To experimentally demonstrate and characterize the frequency lock-in phenomenon in an aerodynamic model of a Francis turbine, where the PVC precession frequency synchronizes with the actuator rotation frequency.
To investigate the relationship between the lock-in range (synchronization bandwidth) and the injected momentum coefficient (Cμ).
To perform a comparative analysis of the effectiveness of single and dual-orifice actuator geometries for PVC frequency control.
The scientific novelty of this study lies in the adaptation and experimental validation of a stability theory-informed resonant control methodology, proven in reacting flows, for direct vortex frequency management in a hydrodynamic context. The term “stability theory-informed” signifies that the actuator placement and the control principle are guided by the results of linear stability and adjoint-based receptivity analysis. In contrast to traditional hydro-mechanical approaches employing high-flow injection (
Cμ >> 1%) [
9], this investigation operates at very low energy input (
Cμ < 1.6%). Moving beyond a sole focus on amplitude suppression, this research provides fundamental insight into the direct control of the PVC’s spectral characteristics through resonant interaction. The chosen low
Cμ values, informed by theoretical precedents [
3,
12,
16], test the hypothesis that large-scale coherent structures in such flows can be efficiently controlled via targeted excitation of their underlying global instability mode.
2. Experimental Setup and Measurement Techniques
Conducting research across a wide range of operating regimes on full-scale hydraulic turbines is associated with significant difficulties. Field tests require substantial financial costs and do not allow for reproducible variation in operating parameters. Consequently, experimental modeling of swirling flows characteristic of hydraulic machinery has become common practice. This study utilizes an aerodynamic test rig, the configuration of which ensures the formation of velocity fields analogous to those observed in the flow passages of hydraulic turbines [
20,
21]. This approach is based on the concept of parametric modeling, where the target vortex phenomenon is generated without physically recreating the entire turbine structure. Experimental data obtained on setups with both air and water as working media demonstrate comparable vortex wake morphology downstream of the rotor [
22,
23], confirming the validity of transferring hydrodynamic research results to aerodynamic models [
24,
25]. The validity of using an aerodynamic model to represent hydrodynamic turbine flows is established through dynamic similarity based on key dimensionless parameters. The model is designed to match the Swirl number, which characterizes the intensity of flow rotation and governs the onset of vortex breakdown, and the Strouhal number, which scales the precession frequency of the vortex core. By preserving these similarity parameters, the aerodynamic setup replicates the essential vortex dynamics and frequency response characteristic of Francis turbine draft tubes under part-load conditions. The use of air significantly enhances experimental flexibility: geometric components of the rig, such as guide vanes and runner blades, can be rapidly manufactured using additive technologies. Furthermore, sealing requirements are reduced, and the process of measuring flow parameters in the wake region is simplified [
20].
The methodological foundation of the work is the Swirl Flow Generator approach [
20,
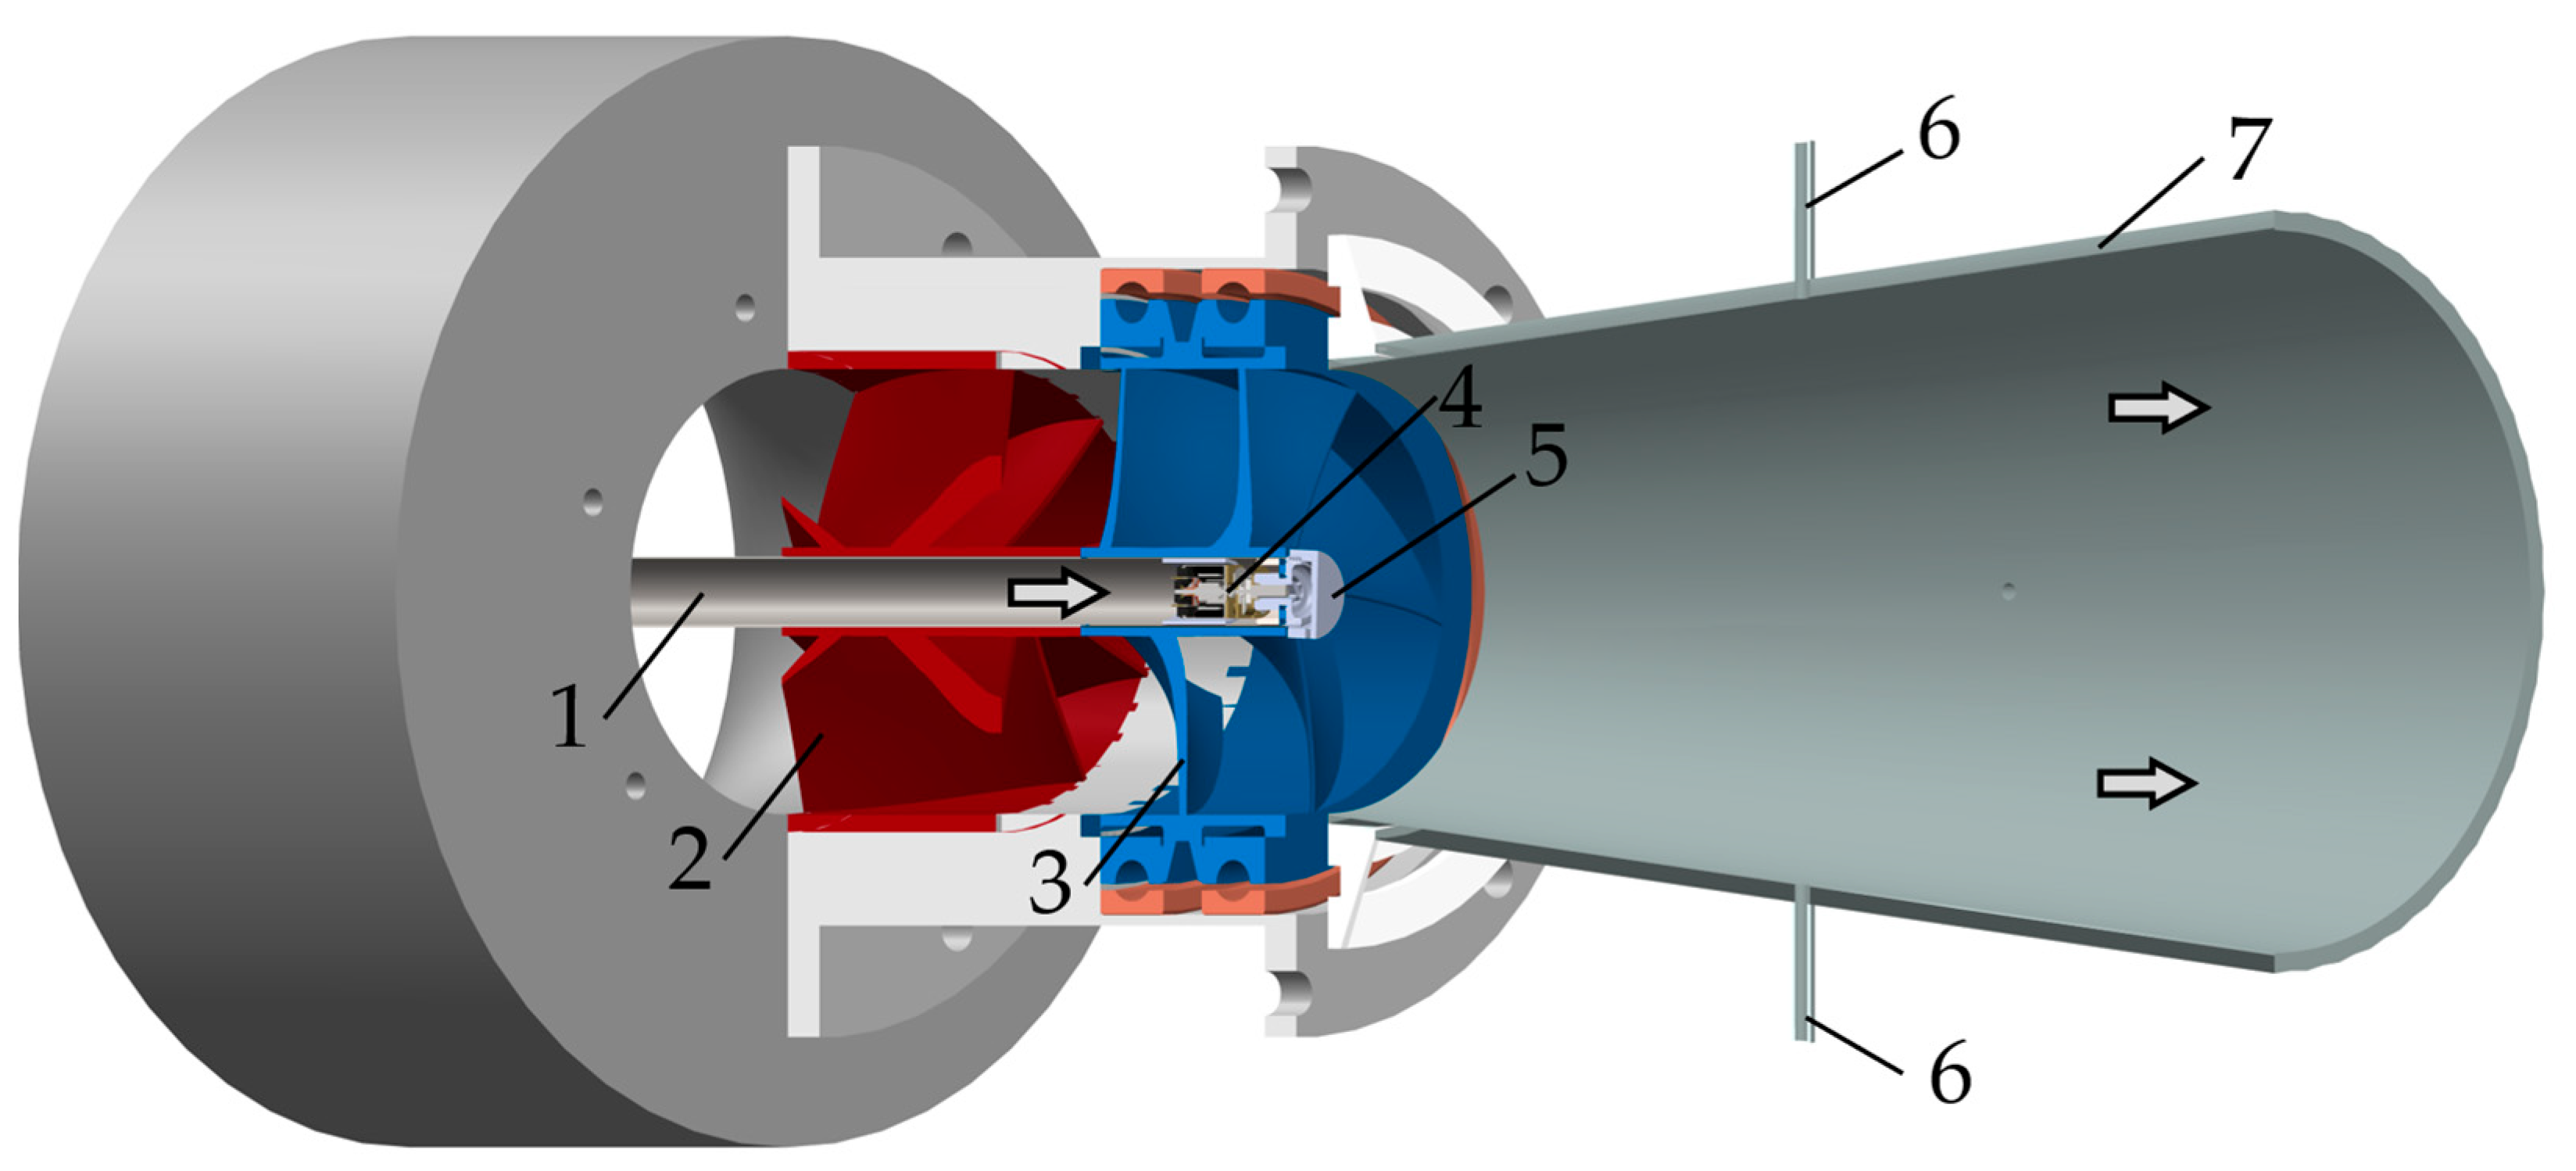
26], which involves modeling realistic velocity profiles using a system of coaxial swirl generators. The aerodynamic test rig comprises the following main components (
Figure 1): an MT-08 blower with a power of 7.5 kW (maximum capacity 550 m
3/h, pressure differential 0.4 atm) equipped with a Danfoss frequency converter; an “IRVIS” ultrasonic flow meter; and the main flow generation module. The flow passage has an inlet diameter of
D = 100 mm. The airflow enters the working section, where it sequentially passes through a stationary swirl generator (simulating the guide vanes) and a rotating swirl generator—the runner. A runner streamline body is attached to the runner, serving in this work as a rotating actuator. The runner module is driven via a belt transmission from an external servomotor (not shown in the figure). The combination of the two swirl generators allows for flexible adjustment of the flow structure, approximating the velocity distributions arising in various operational regimes of real Francis turbines [
20]. The controllable parameters of the setup are the airflow rate through the passage (set with a relative error of 1.5%) and the runner rotational frequency (setting error 0.5%).
The PVC is the primary vortex structure forming downstream of the runner, characteristic of Francis turbine draft tubes. To study the flow behind the Francis turbine model runner with additional control jet injection, a regime with maximum pressure pulsations caused by the PVC was selected; the runner rotation frequency was 28.3 Hz. The main flow rate was
Q = 61 m
3/h, which corresponds to 50% of the flow rate at the optimal design point [
27] and to Reynolds numbers of the order of 1.5 × 10
4. In this regime, the swirl number was 0.75, and the Strouhal number, based on the frequency of the PVC, was 0.45. The airflow rate for the control jet was supplied by a separate compressed air compressor and varied from 0.15% to 0.75% of the main flow rate, i.e., from 0.09 m
3/h to 0.45 m
3/h.
The test rig operation was fully automated and controlled via a custom program written in the “MATLAB R2023a” environment. The program allows for acquiring data from microphones and the photoresistor, setting experimental regime parameters, and operates in a “scheduled” mode. The program structures all measured parameters for the orderly formation of a frequency database across various regimes.
The vortex control system is based on an actuator model that has been successfully applied in studies of both reacting and isothermal swirling flows [
15]. The actuation system is designed for air jet injection into the flow, with air supplied to the actuator through a separate line (indicated by number 1 in
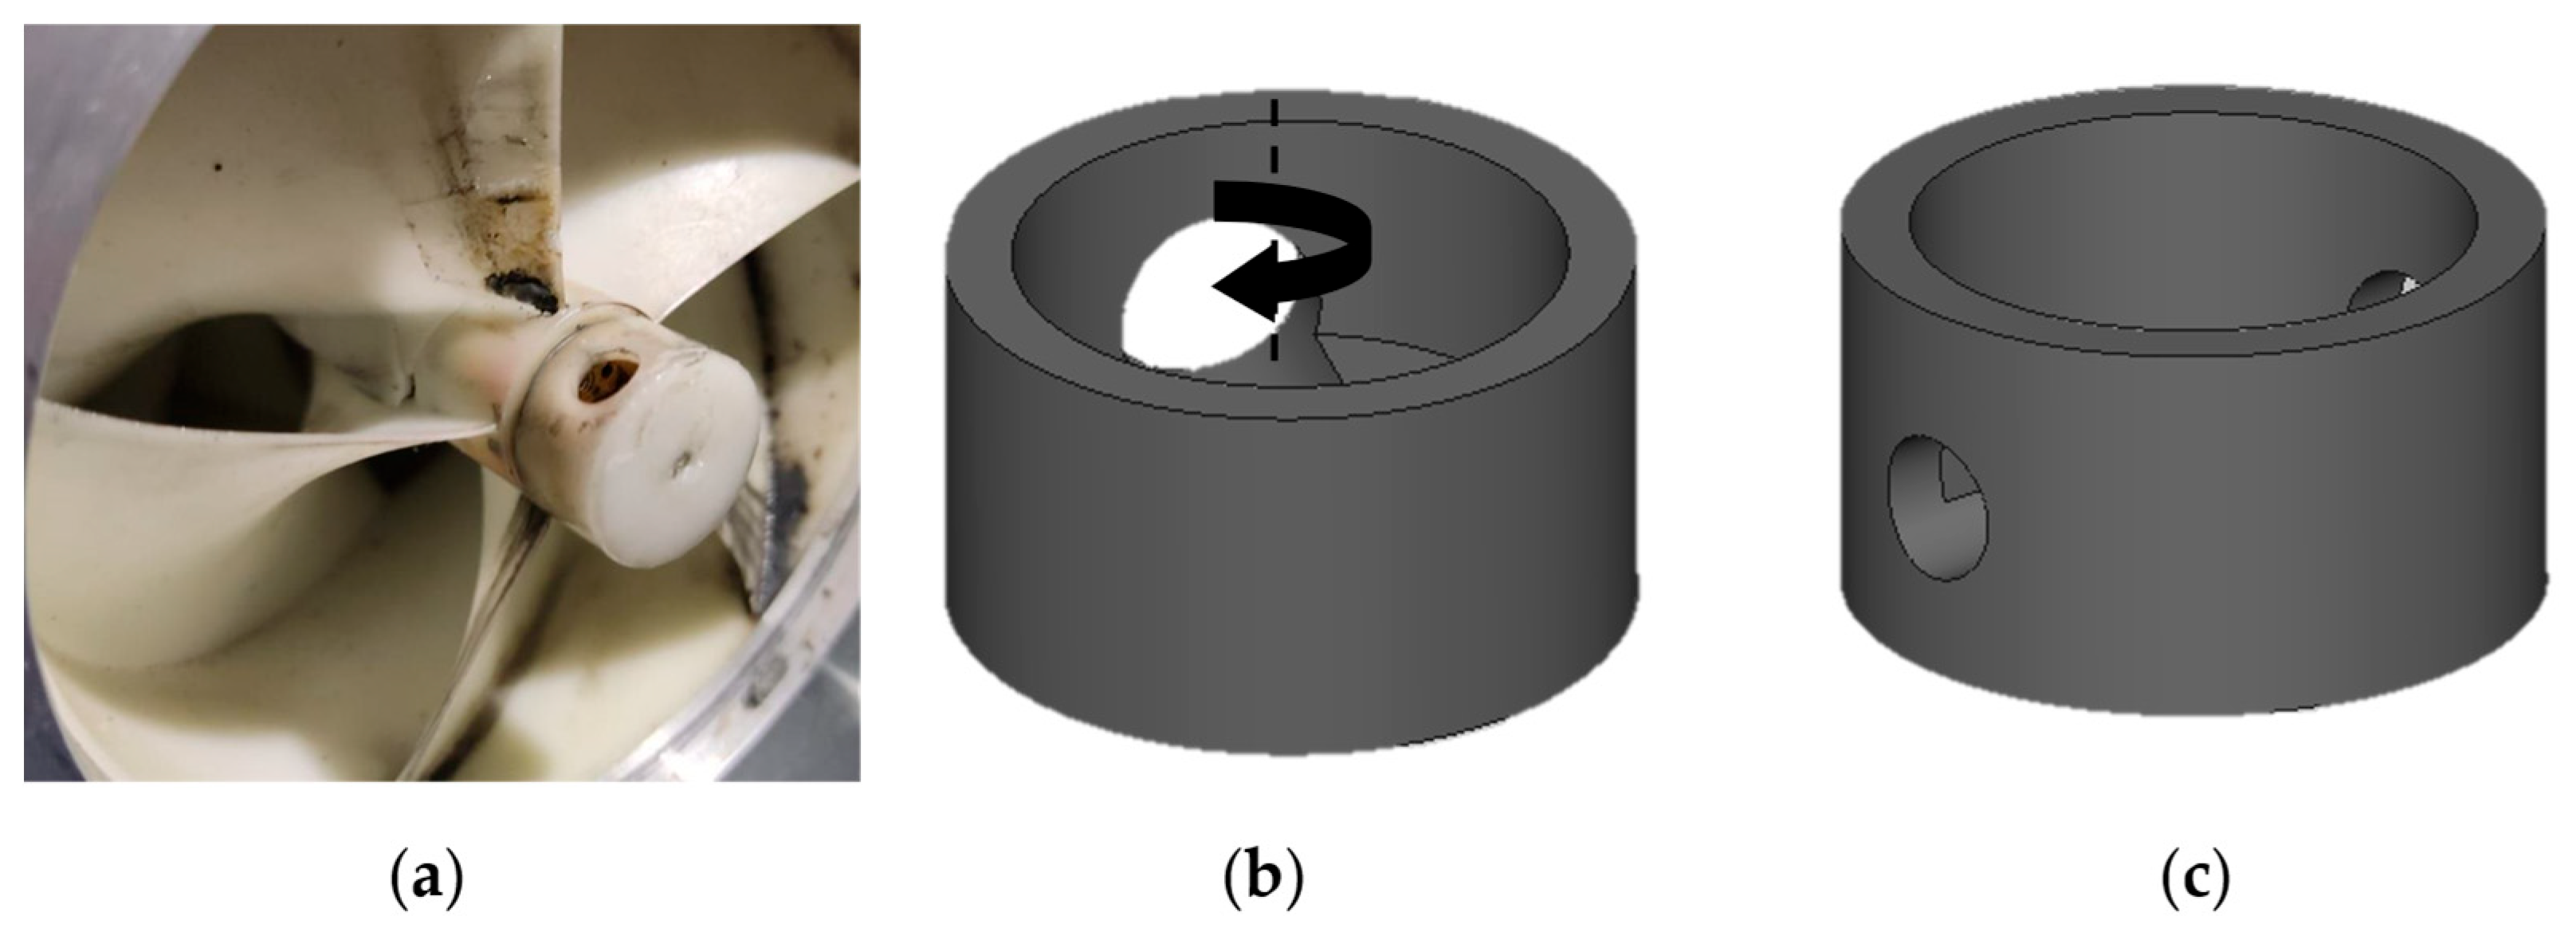
Figure 1). To study the influence of actuator rotation frequency on the frequency characteristics of the PVC, three actuators were manufactured using 3D printing technology. The actuators are cylindrical hollow streamline bodies. The diameter of each actuator was equal to 0.2
D. This diameter was chosen to most effectively influence vortex structures while minimally affecting the main flow [
12]. One actuator had no holes. This actuator was manufactured to study the passive influence on the flow; the results of the main experiment are presented relative to this case. The other two actuators had one and two radial holes, as shown in
Figure 2. Each orifice diameter was equal to 0.06
D. Airflow was supplied through the actuator, controlled by a “Bronkhorst” mass-flow controller with a relative flow rate error of 0.5%; the source was a separate oil-free “Remeza” compressor. The actuators were located downstream of the turbine model runner, in the region where the flow is most receptive to disturbances, in accordance with the results of the linear stability analysis detailed in the Introduction.
The actuator rotation frequency
fc was set independently of the rotational speed of the runner using a programmed Arduino board. The rotation frequency
fc was adjusted via an electric motor with a rotating shaft integrated inside the central supply tube for the control flow (
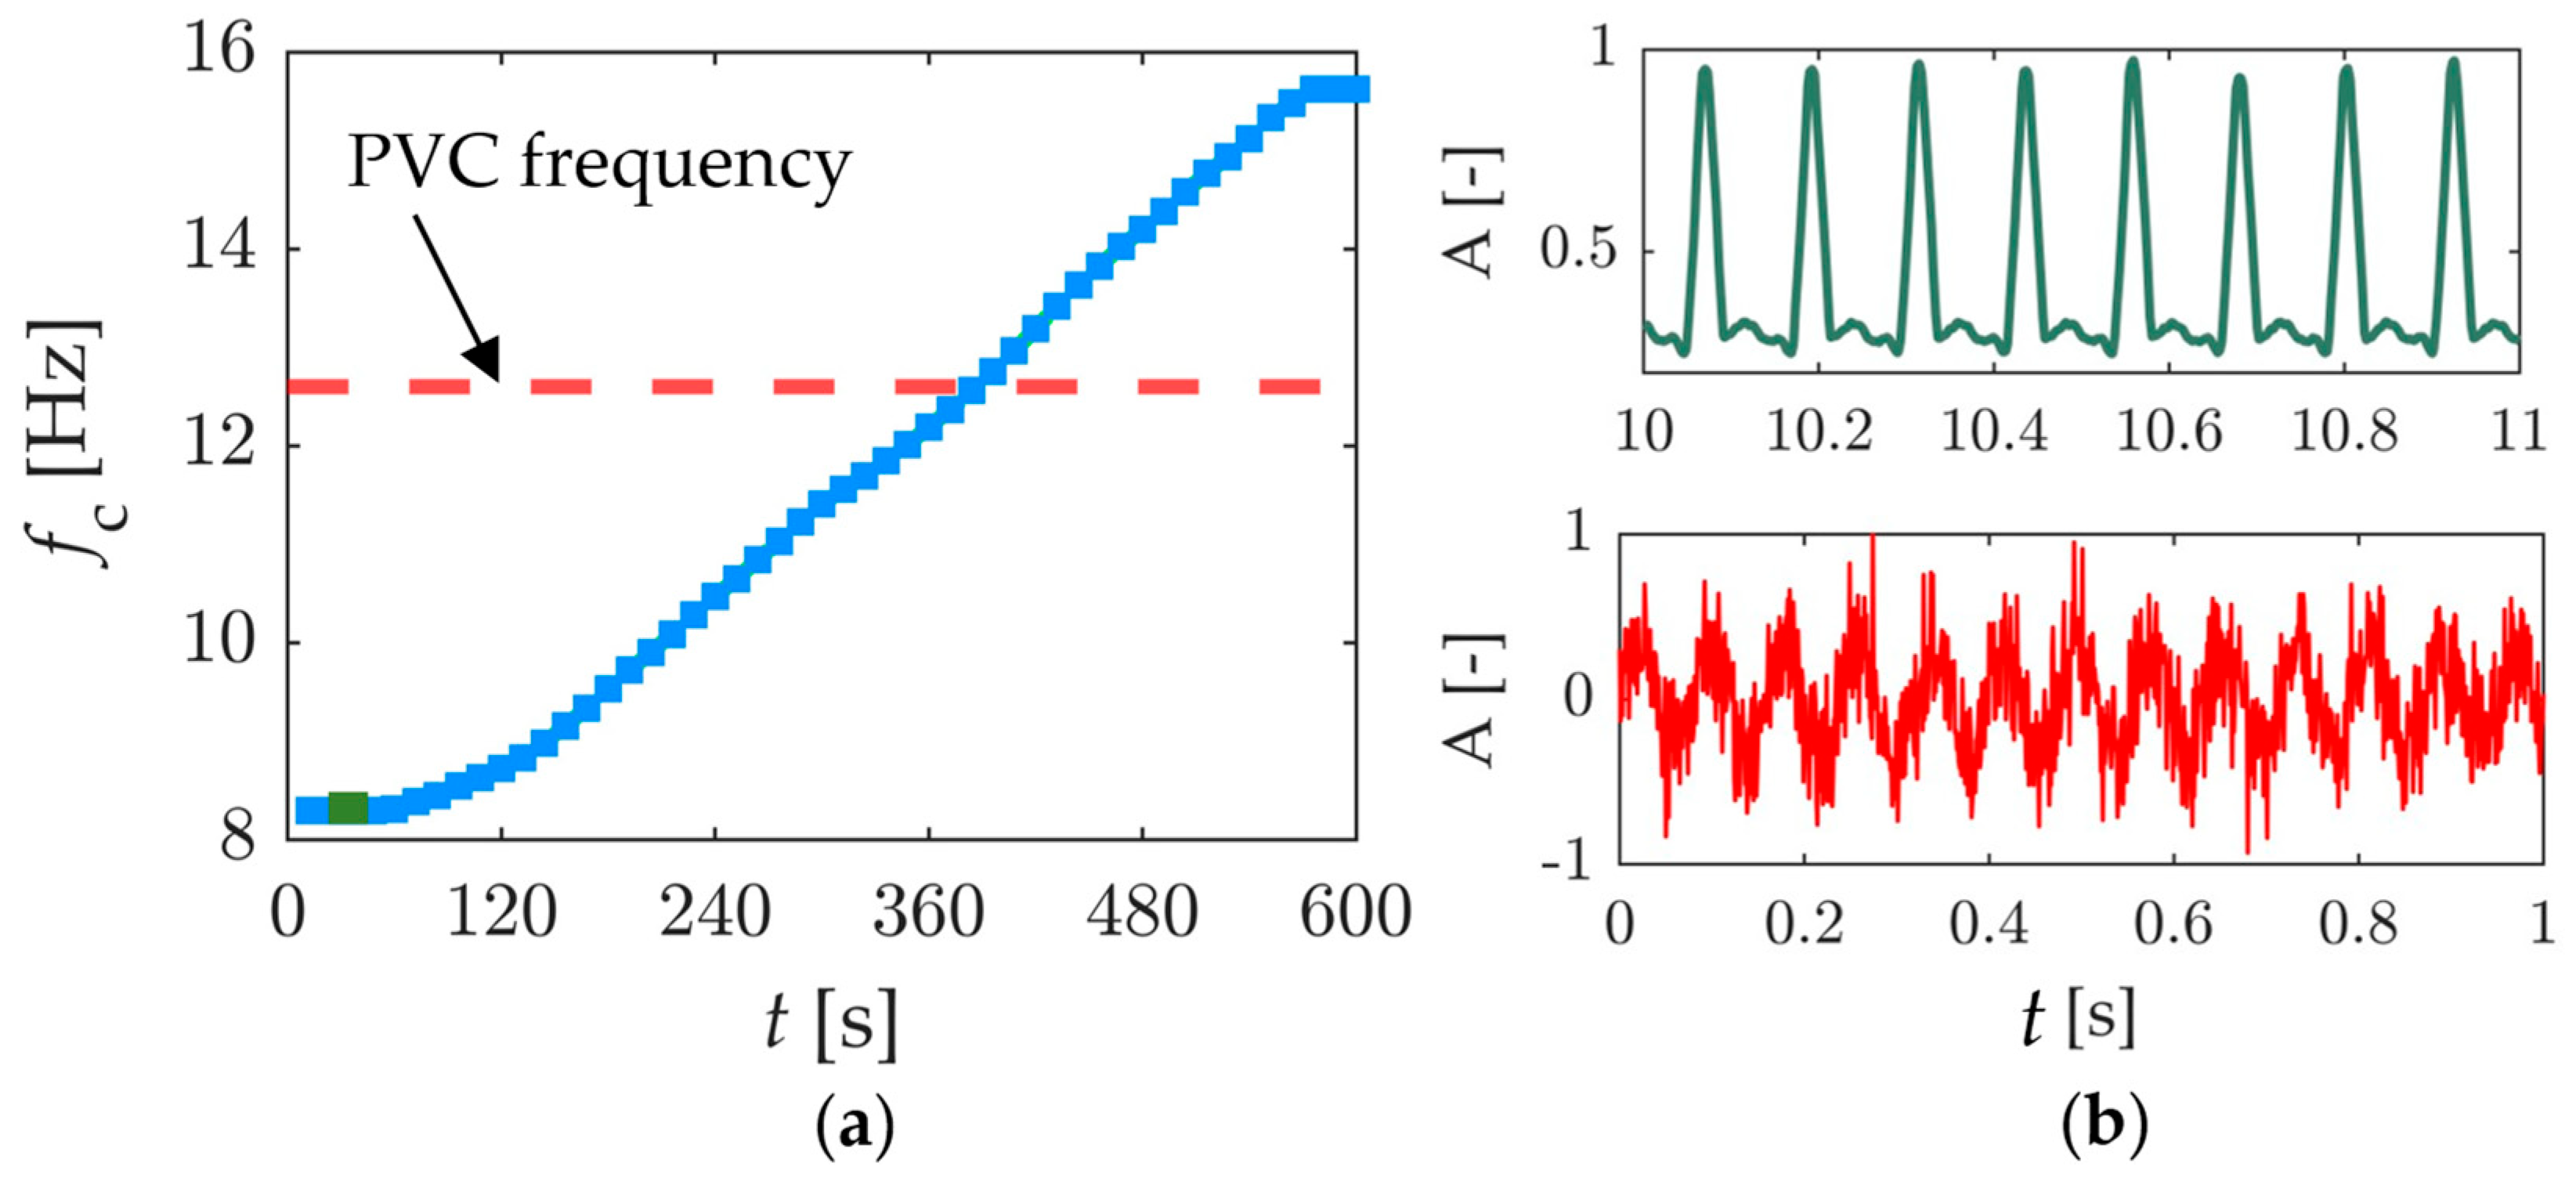
Figure 1). The actuator rotation frequency was measured using a photoresistor by counting pulses from a stationary point light source incident on the photoresistor. An example of the signal from the photoresistor during actuator rotation is shown in
Figure 3b.
During the experiments, signals from four acoustic sensors were recorded simultaneously, while the signal from the photoresistor was recorded on a separate channel. To quantitatively assess the amplitude–frequency characteristics of the PVC in the flow, four “Behringer ECM 8000” microphones were used. The signals from the sensors were digitized using an analog-to-digital converter at a sampling frequency of 2 kHz and amplified using “Microgain M200” preamplifiers. To minimize the influence of the microphones on the flow, pressure taps in the form of thin tubes (300 mm long, 3 mm in diameter) were used. Such taps somewhat alter the amplitude of the measured signal but do not affect frequency determination [
20,
28]. The microphones were installed in the same cross-section, 90 degrees apart from each other, downstream of the turbine model runner at a distance of
D. This distance was chosen based on the region where the PVC generates the strongest pressure pulsations on the draft tube walls [
13]. An example of a difference signal from microphones that eliminates common-mode noise is shown in
Figure 3b.
During data processing, the obtained signals from the acoustic sensors were decomposed into modes with different wavenumbers according to the representation [
29]:
where
pn is the pressure signal from the
n-th sensor and
m is the azimuthal mode number. Decomposition into azimuthal modes allows for a separate examination of different vortex structures arising in the flow. It is known [
13] that
m = 0 corresponds to synchronous pressure pulsations, the first azimuthal mode (
m = 1) describes PVC dynamics, and pressure pulsations with mode
m = 2 are associated with the probably with a weak double PVC. The signal obtained after modal decomposition was represented in terms of Power Spectral Density (PSD) in the frequency and time domains using the Welch periodogram method combined with a sliding Hann window averaging at 50% overlap. The Welch method is an improvement over standard periodograms as it reduces noise in the power spectra. Thus, decomposition into azimuthal modes and subsequent PSD representation allows for unambiguous identification of the PVC in the flow, determination of its frequency and energy in relative units, and quantitative assessment of control effectiveness. The dominant peak in the power spectrum was taken as the amplitude and frequency of pressure pulsations. For the correct measurement of pressure pulsation amplitude–frequency characteristics, the acoustic sensors were calibrated using a test flow with a constant flow rate, thereby equalizing the signal amplitudes across all sensors.
At a fixed runner speed and main flow rate, and in the absence of control, the PVC frequency is also constant and, for this turbine model operating regime, equal to
f0 = 12.6 Hz. The general experimental plan is as follows: (i) study pressure pulsations in detail by decomposing the microphone signals into zero, first, and second modes in the “base” case—with the actuator present in the flow but without supplying control flow through it (the case without active control); and (ii) varying only the magnitude of the control flow supplied through the actuator, obtain the PVC characteristics as a function of the control flow rate. Each experiment with one actuator and a fixed control flow rate was conducted for 600 s. During this time, the actuator rotation frequency
fc increased from approximately 8 Hz to 16 Hz (
Figure 3a). This duration is sufficient for good frequency resolution at a given moment. The actuator rotation frequency was varied with an almost linear increase. This range was chosen to fully cover the first (fundamental) harmonic of the PVC with frequency
f0 [
21]. The entire array of signals from the microphones and the photoresistor was divided into 50 segments, each 12 s long. Signal decomposition into modes and subsequent PSD calculation were performed within each such segment (window) with 50% overlap. The segment width in time was chosen so that approximately a hundred PVC periods fit into one window, achieving a balance between time and frequency resolution. When studying frequency lock-in, the number of segments was increased to 100 in order to more accurately capture the moment of frequency lock-in.
Implementing a strictly linear increase in actuator frequency fc was not feasible, as the Arduino controls the motor current, which in turn nonlinearly depends on the actuator rotation frequency, influenced by effects such as non-zero friction between the actuator walls and the outer part of the control flow supply tube. However, implementing a feedback control system for a strictly linear frequency increase was deemed unnecessary, as the character of the frequency increase was not important for our experiments; its value at a given moment was. This prompted us to use the photoresistor system for accurate real-time frequency measurement.
The experimental robustness of this study is supported by estimated measurement uncertainties and confirmed repeatability. The relative uncertainties for key parameters are: main flowrate
Q, ±1.5%; control flowrate
Qc, ±0.5%; runner rotational frequency, ±0.5%. The frequency of pressure pulsations was determined by spectral analysis, with a resolution defined by the segment window length. Key experimental conditions, including the baseline case and regimes demonstrating lock-in at intermediate
Cμ, were repeated to confirm the reproducibility of spectral features and synchronization thresholds. The efficiency of the resonant forcing strategy is evaluated by the control energy input relative to the main flow. The maximum control flow rate employed here was
Qc = 0.75% of the main flow
Q, which is an order of magnitude lower than the 5–15% typical of conventional, non-resonant injection methods aimed at complete vortex suppression [
9,
10]. This study’s primary objective was not vortex suppression but the controlled investigation of the frequency lock-in phenomenon itself; achieving this with such low
Qc/
Q substantiates the claim of high efficiency. This low-energy input is sufficient to systematically manipulate the vortex dynamics, establishing a foundational step toward future optimized control strategies.
3. Results and Discussion
To obtain the characteristics of the flow unaffected by control, an experiment referred to as the “baseline case” was conducted. This experiment was performed with an actuator installed that did not rotate, had no holes, and no flow was supplied through it. This experiment was necessary for the subsequent comparison of perturbed and unperturbed flow characteristics. The rig’s operational parameters remained the same: the runner rotation frequency and the airflow rate through the swirl generators correspond to the part-load regime of a hydraulic turbine, where a pronounced vortex rope with the highest pressure pulsations on the draft tube walls is formed.
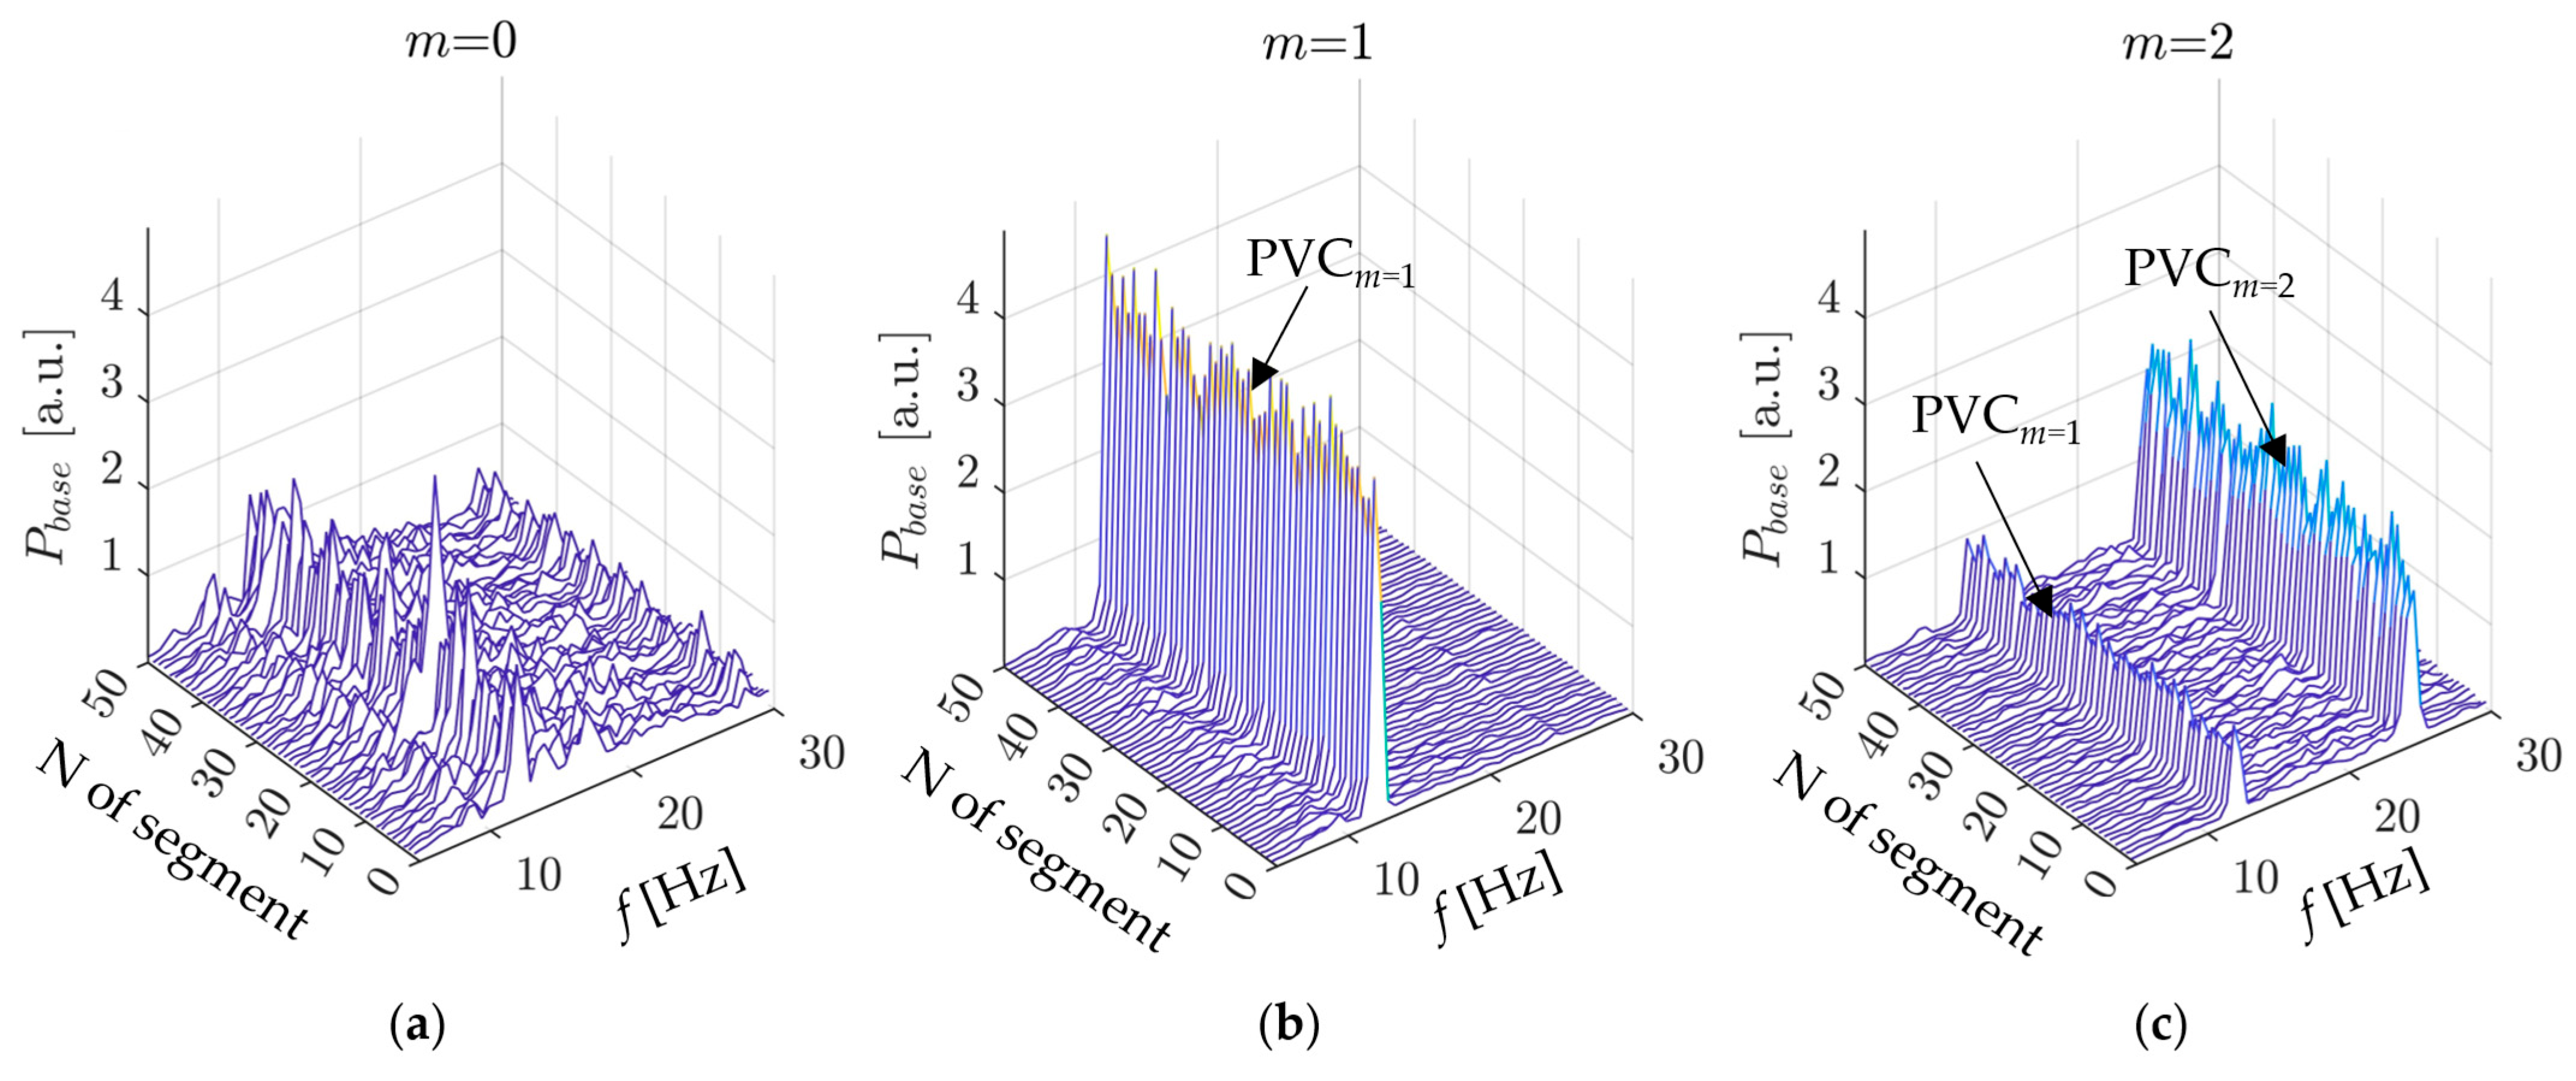
Figure 4 shows spectrograms for three wavenumbers:
m = 0,
m = 1, and
m = 2. The pressure pulsation amplitude,
Pbase, is given in relative units; in subsequent experiments, all pressure pulsation values were normalized by
Pbase.
In the baseline case, it is evident that, for the zero mode (m = 0), there are no distinct frequencies in the flow. This is because the m = 0 mode corresponds to synchronous pressure pulsations generated by various factors; in this case, it is the chaotic “noise” of the experimental setup. For the first mode (m = 1), a clearly defined, powerful peak at a single frequency f0 = 12.6 Hz is observed, corresponding to the PVC. In the spectrum for m = 2, a peak at twice the PVC frequency dominates. The baseline case experiment was repeated separately with a rotating actuator. No significant differences in the spectra were found, indicating that the rotation of the actuator alone, without holes and flow supply, does not affect the characteristics of vortex phenomena in the flow.
Following the study of the baseline case, we can proceed to the pressure pulsation spectra when a control flow rate
Qc is supplied through the actuator. In each experiment, the actuator rotates with a frequency
fc, smoothly varying from 8 to 16 Hz, as described earlier. The flow rate
Qc through the actuator varied from 0.15% to 0.75% of
Q.
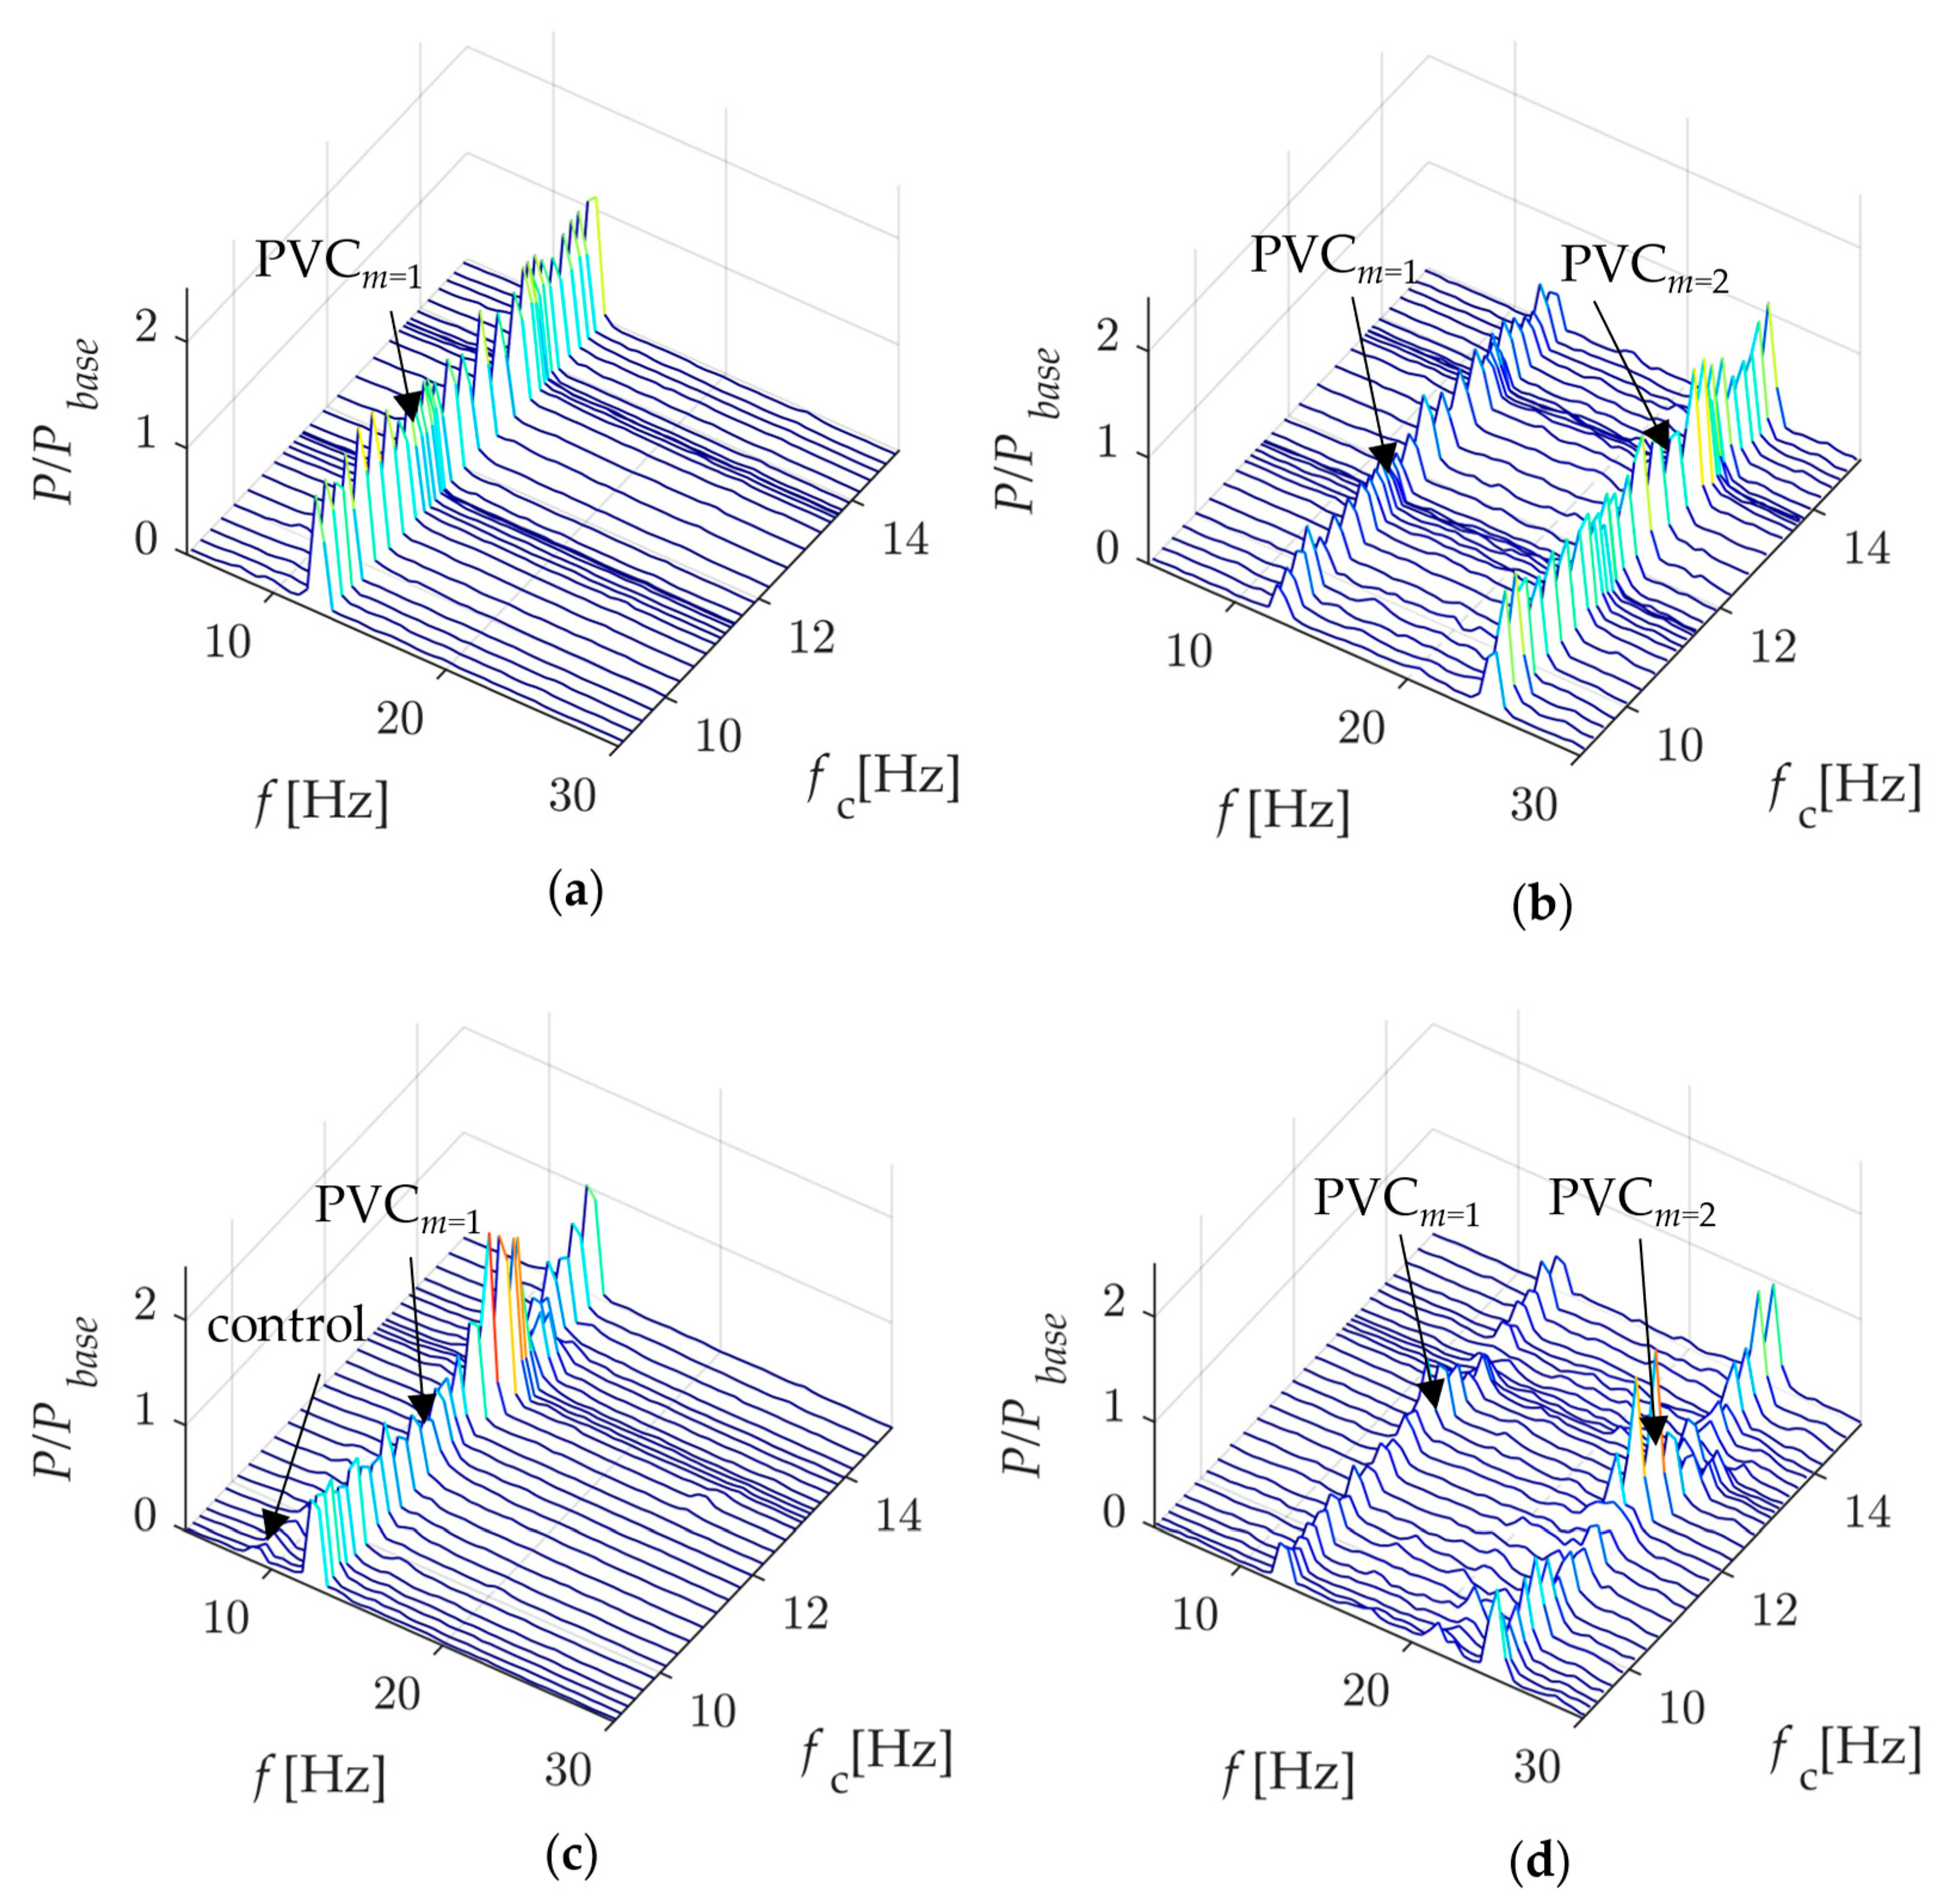
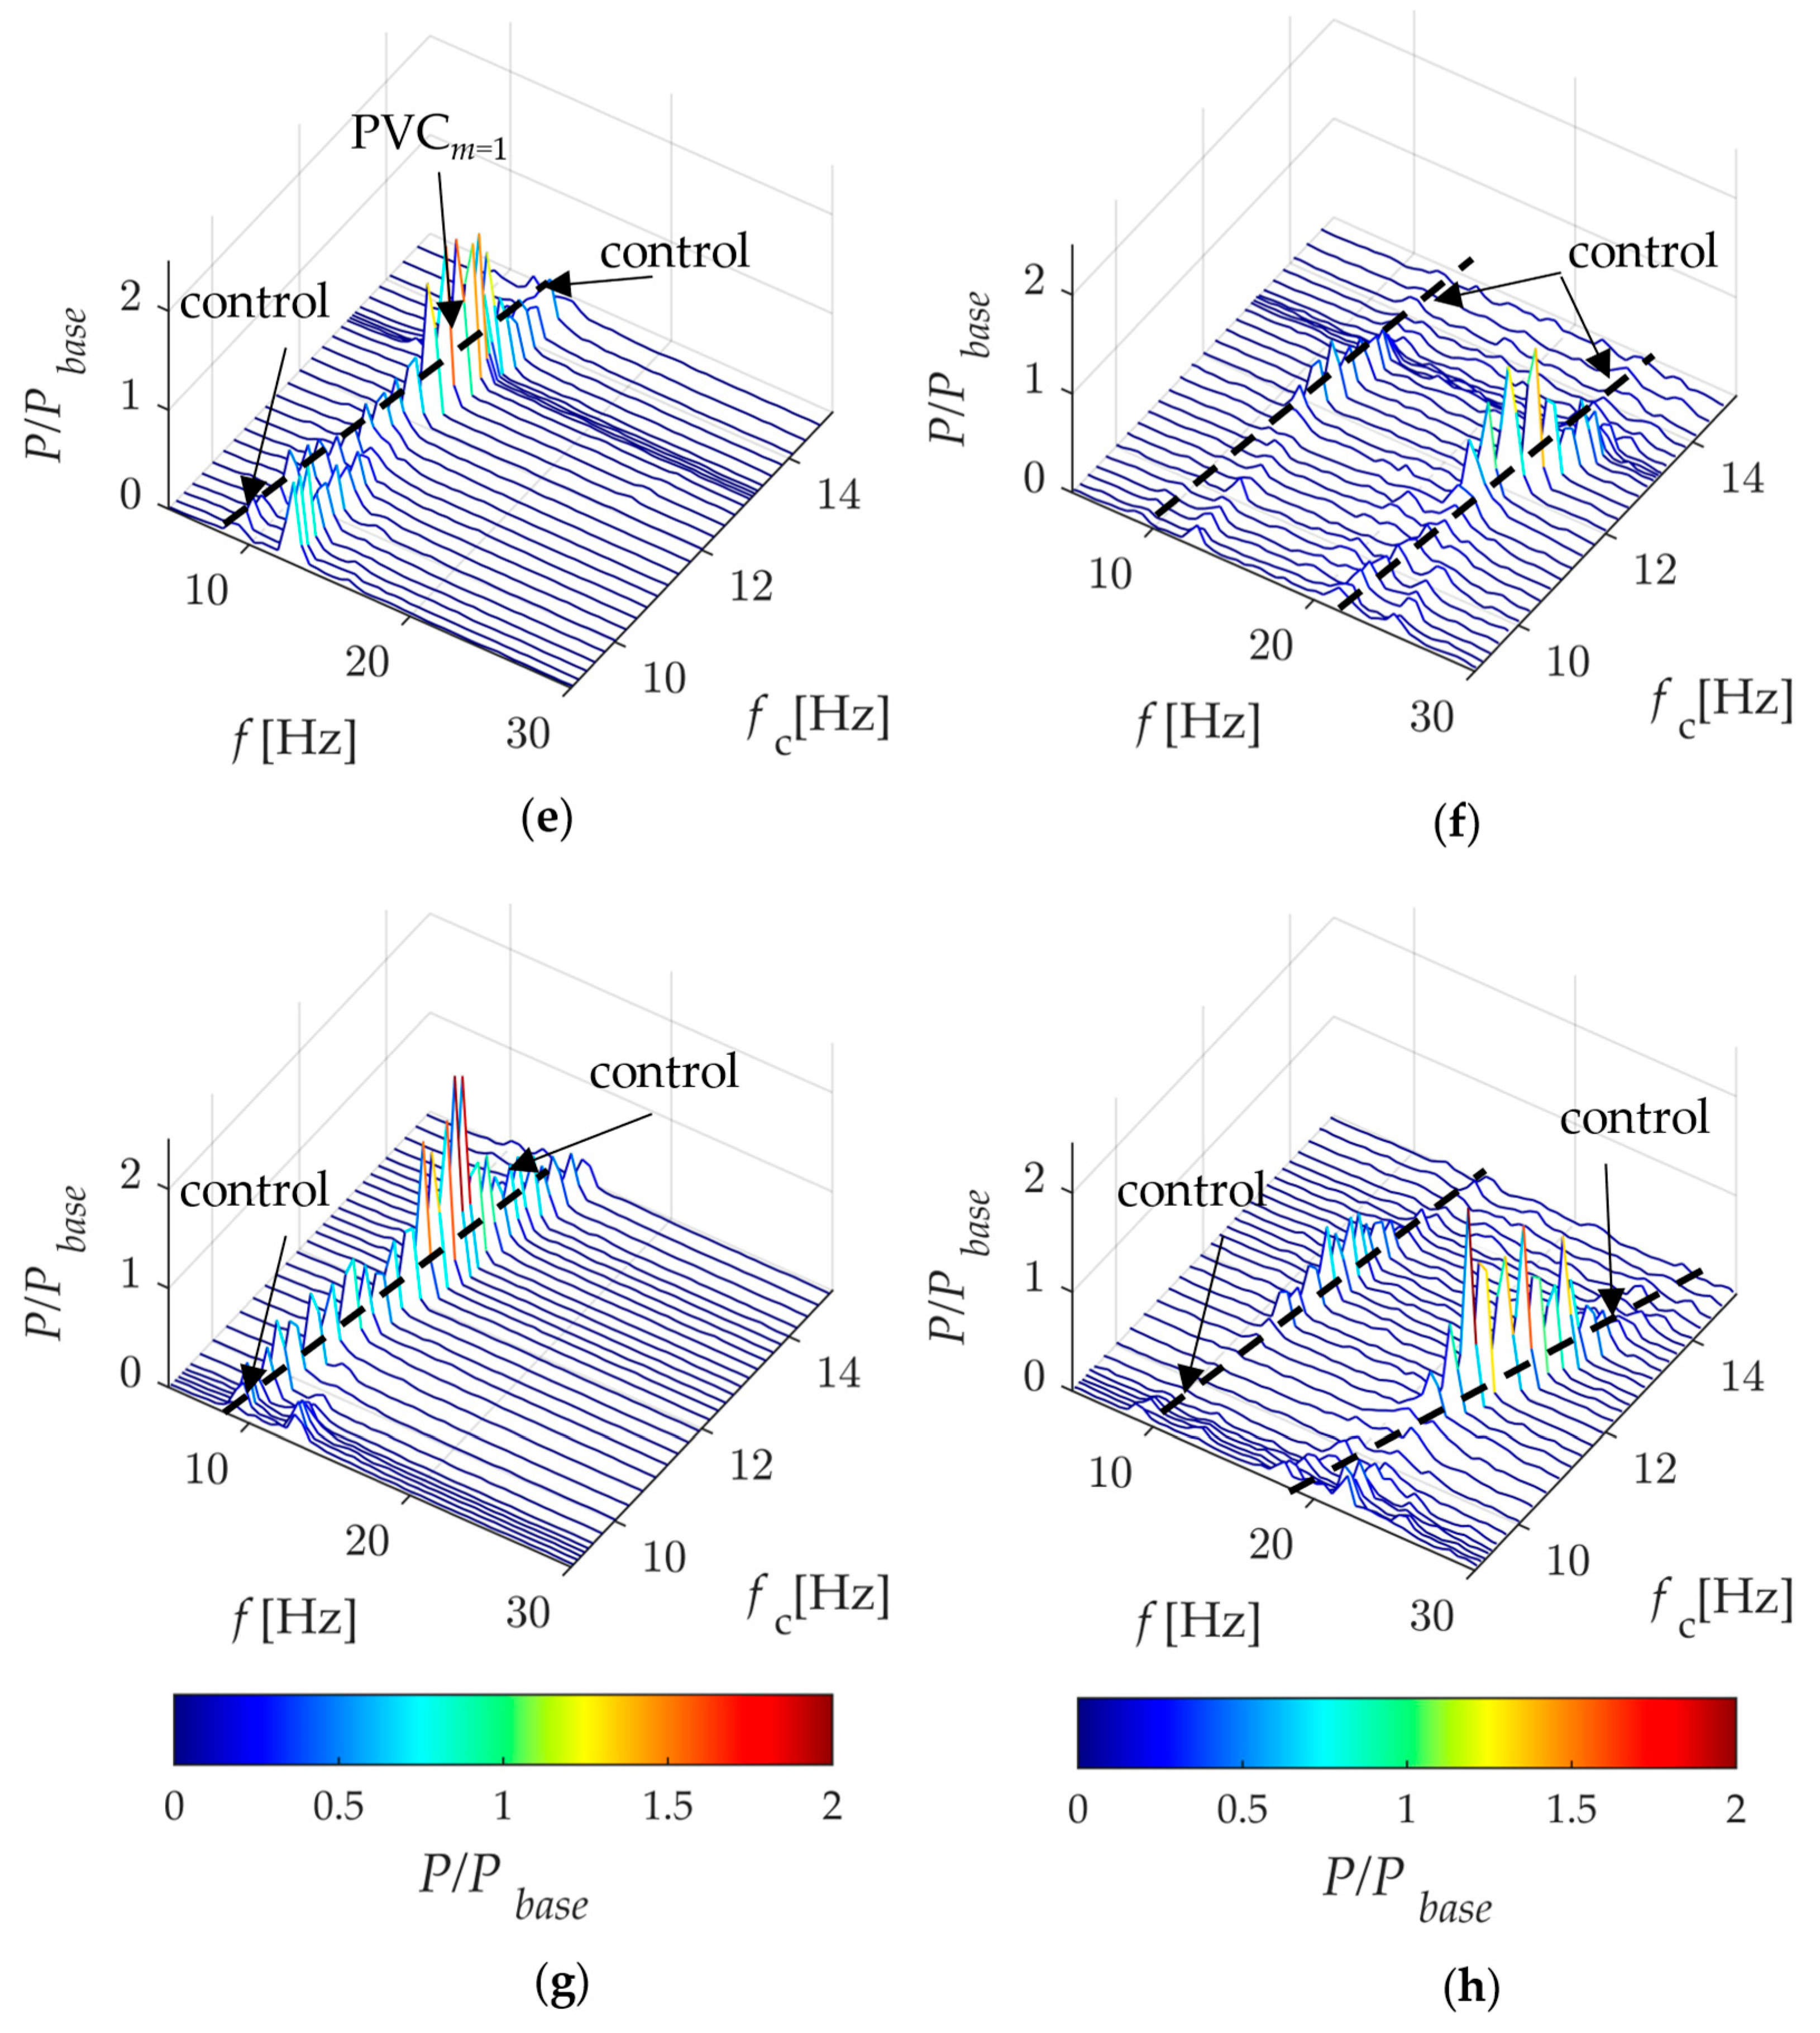
Figure 5 shows the spectra for modes
m = 1 and
m = 2 for these flow rates using the actuator with a single hole. Mode
m = 0 is no longer presented, as it does not contain significant information about vortex phenomena in the flow, as seen from the baseline result (
Figure 4). Pressure pulsation values are normalized by the
Pbase pulsations from the baseline case. The spectra show that as the control flow rate increases, the PVC amplitude decreases; in other words, the suppression of the PVC is achieved. Significant suppression is already attained at a control flow rate of 0.6% of the main flow. The behavior of the first and second modes is quite similar.
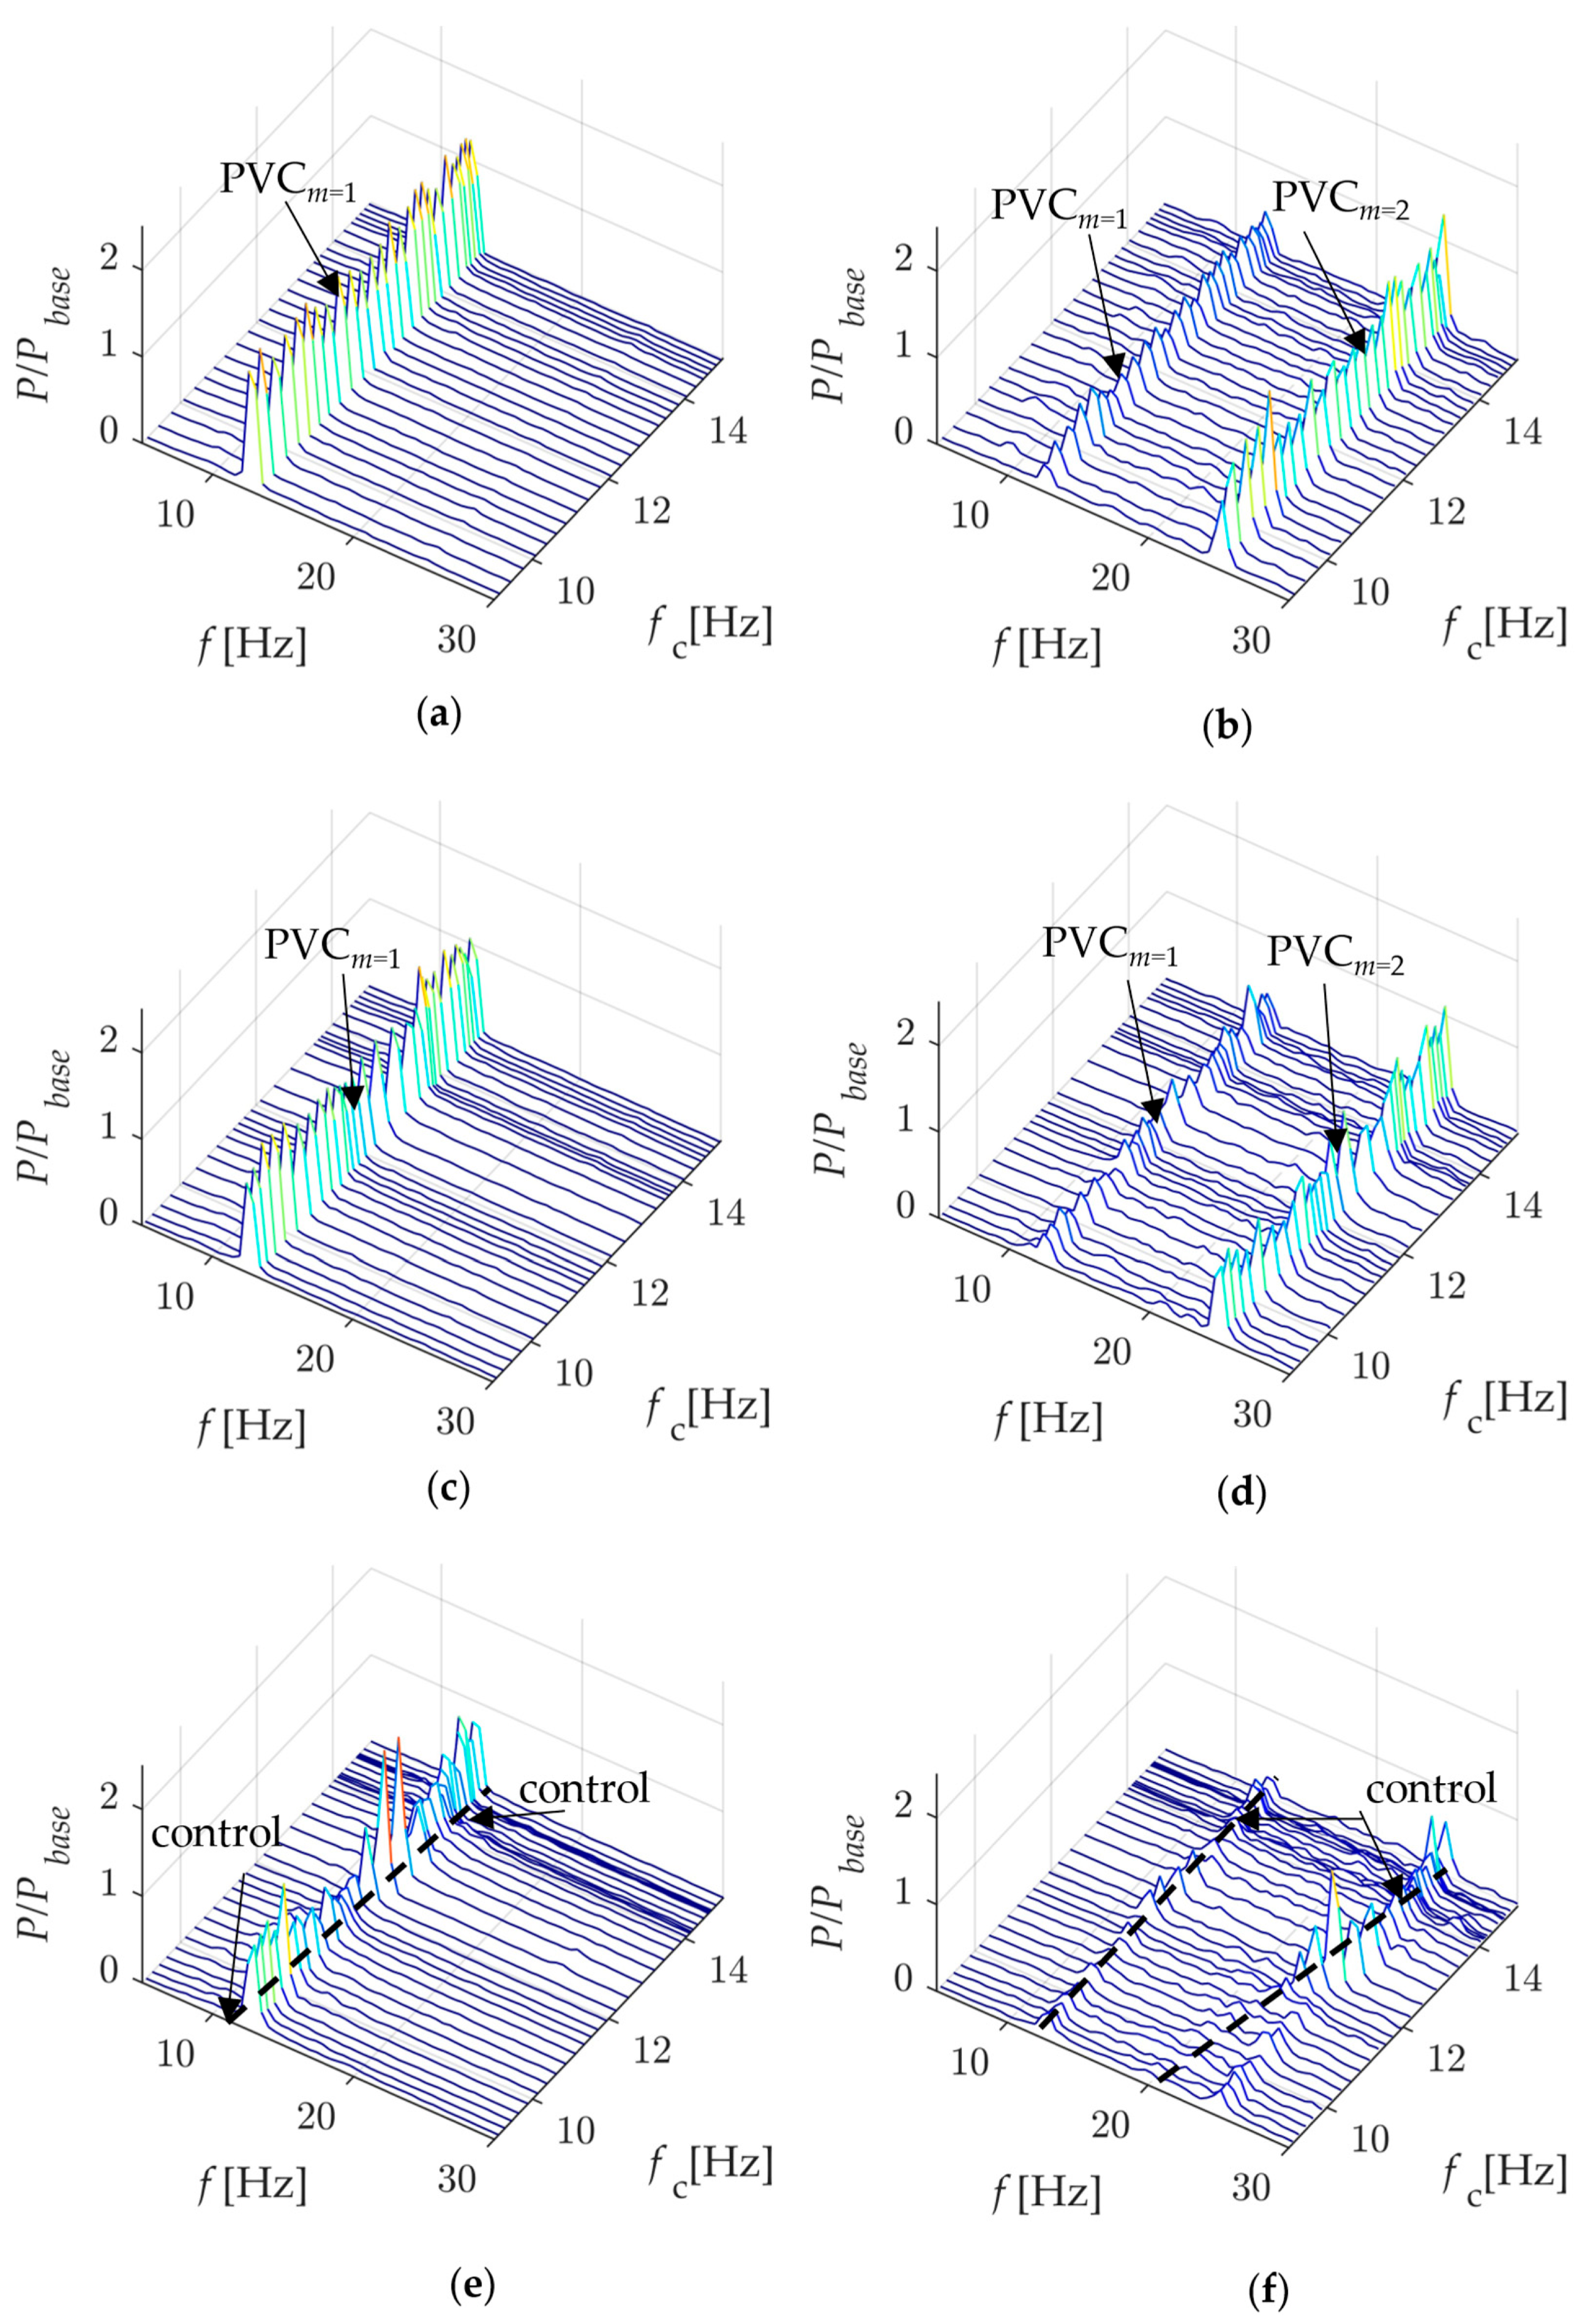
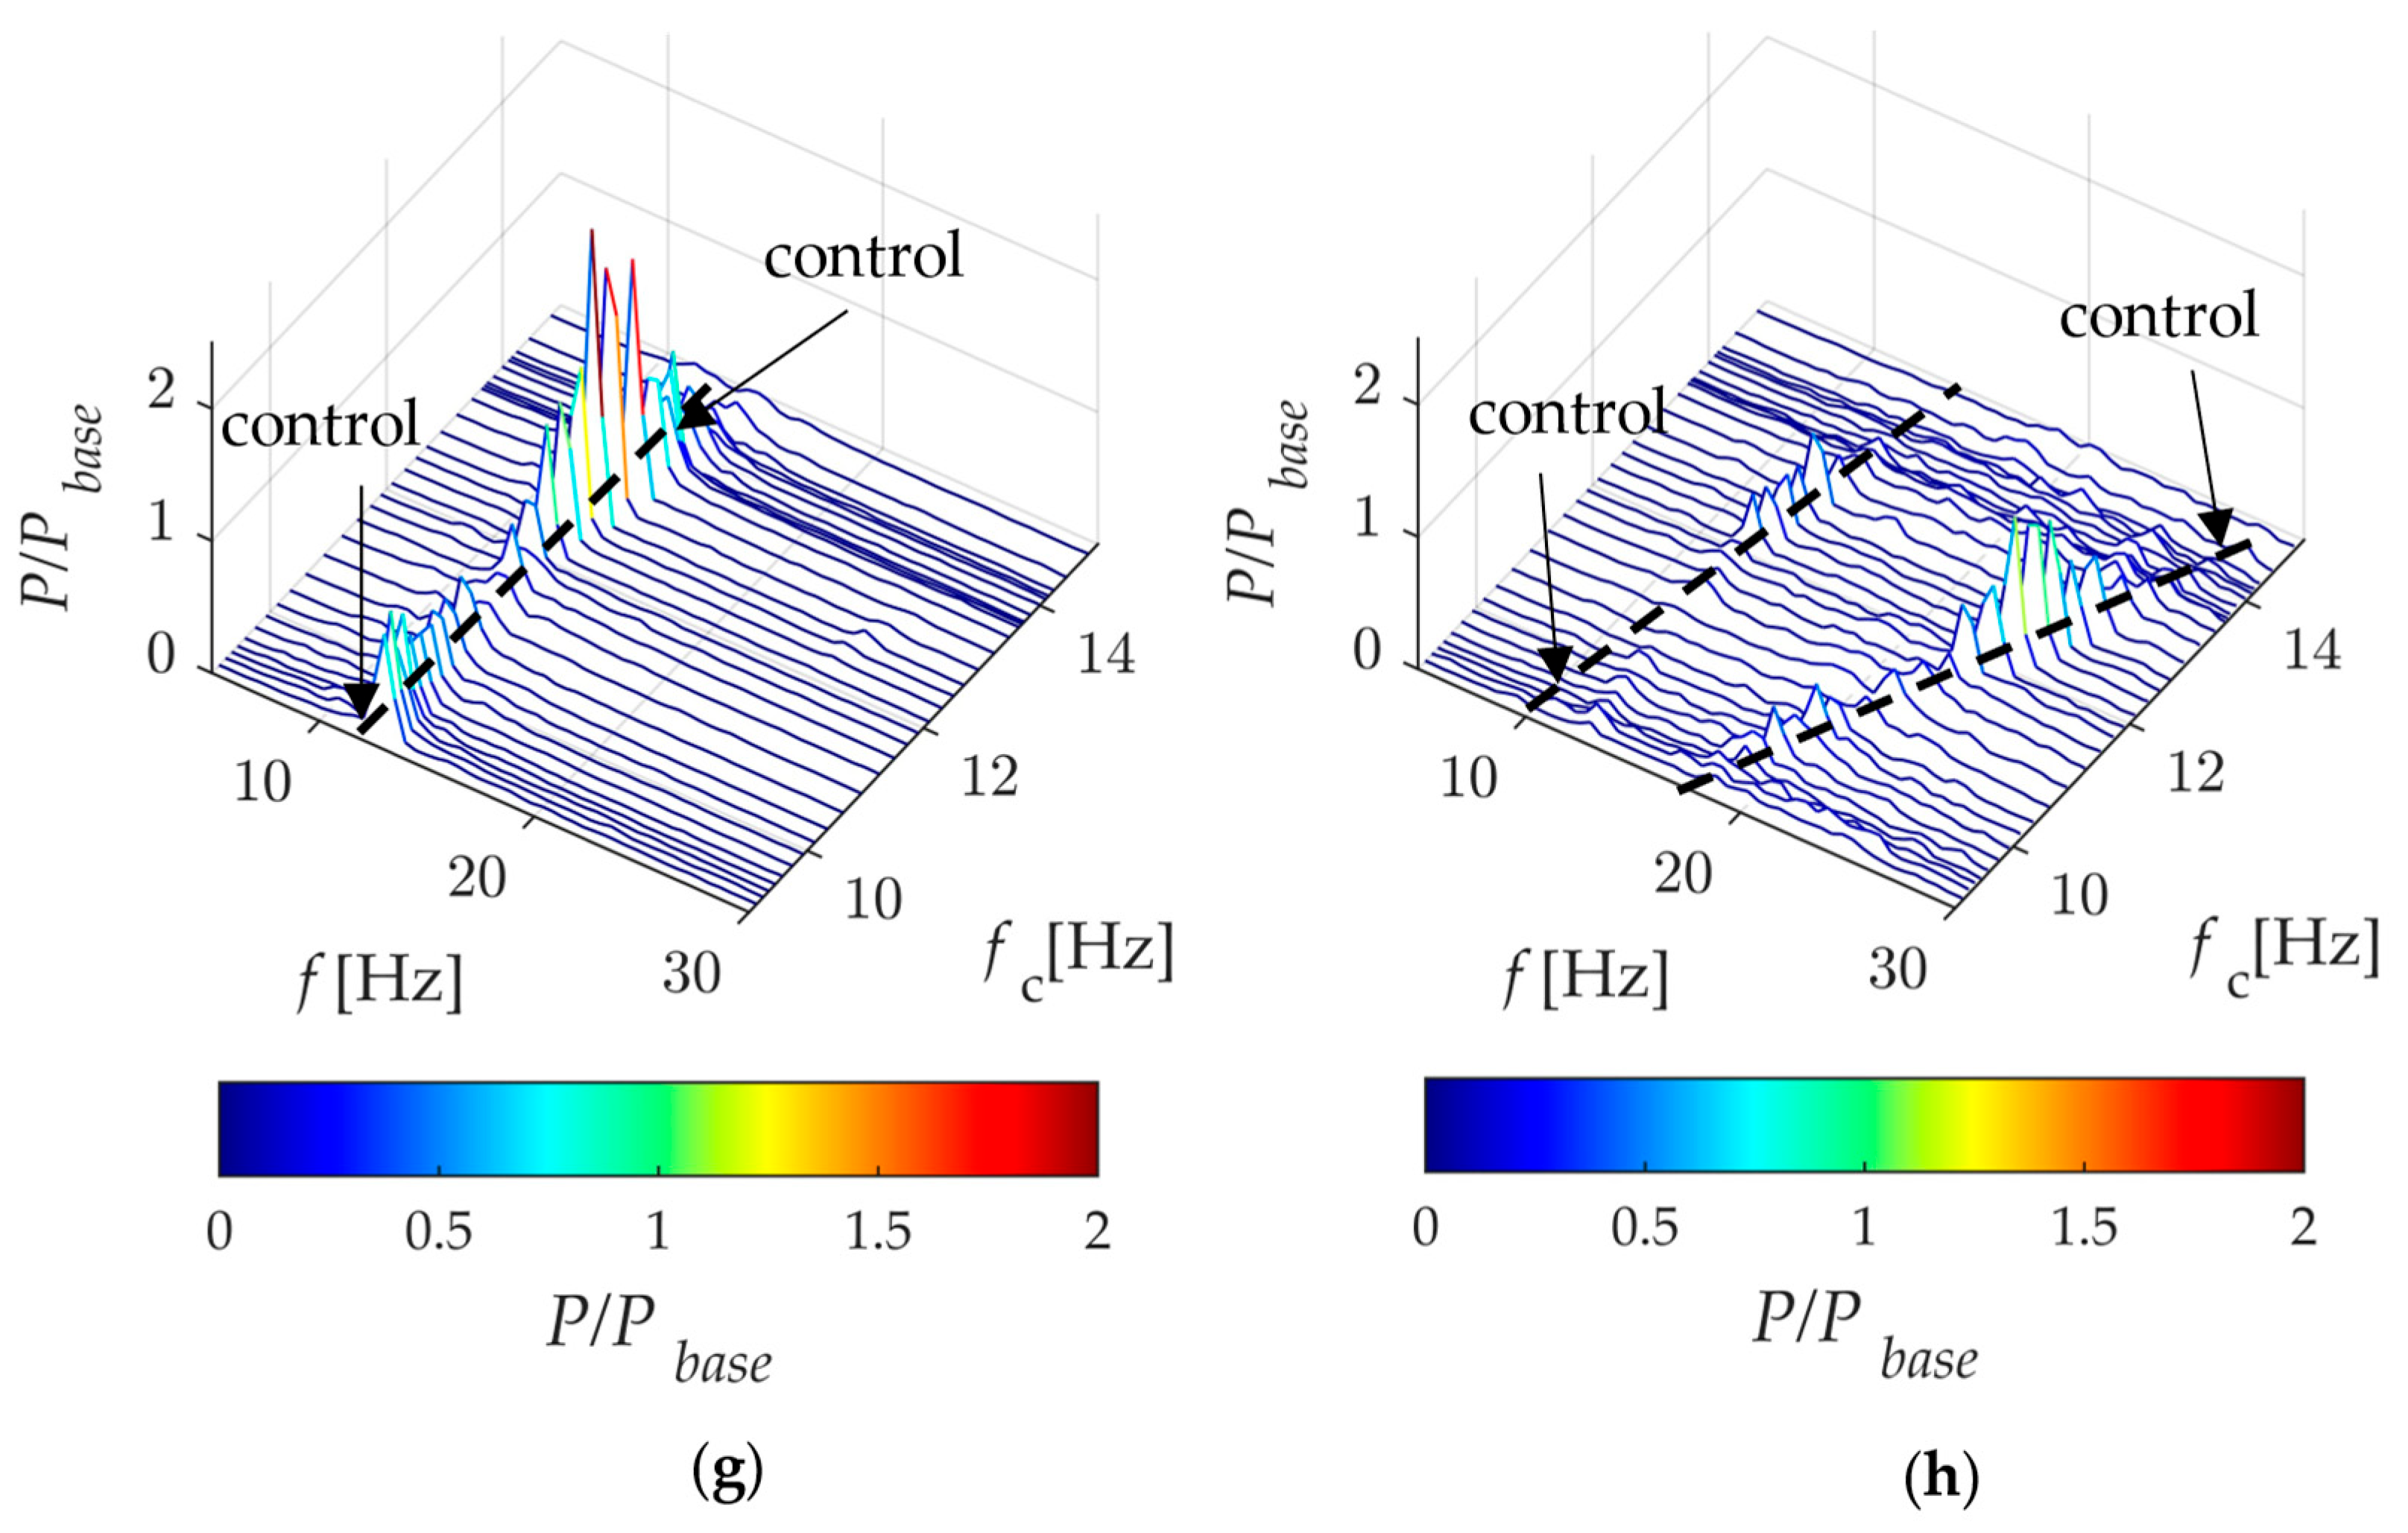
In addition to experiments with the single-hole actuator, similar experiments were conducted for the actuator with two holes. The obtained pressure pulsation spectra are shown in
Figure 6. It is evident that the actuator with two holes suppresses the PVC less effectively than the single-hole actuator. This is likely due to the lower mean-flow velocity of the jet from the two-hole actuator compared to the single-hole actuator, as the total orifice areas are different. Thus, the forcing from the two-hole actuator is lower than that from the single-hole actuator.
The lock-in, or synchronization, of a self-excited global instability like the PVC with external periodic forcing is governed by the interplay between linear receptivity and nonlinear dynamics [
3]. Physically, lock-in occurs when the external perturbation disrupts the self-sustaining cycle of the global mode. Two primary mechanisms are identified, dictated by the forcing location relative to the flow’s receptivity field [
16]. In high-receptivity regions, typically coincident with the core of the instability’s “wavemaker”, lock-in is achieved efficiently through direct nonlinear resonance. Here, the external perturbation is naturally amplified by the flow’s intrinsic instability, leading to a swift, low-energy synchronization via a saddle-node bifurcation. Conversely, in low-receptivity regions, synchronization is achieved indirectly through mean-flow modification. The forcing alters the base flow (e.g., reducing swirl), which shifts the system’s natural global frequency until it coincides with the forcing frequency. This pathway requires significantly greater energy input and involves substantive changes to the mean velocity field. Thus, effective frequency control hinges on targeting high-receptivity zones to exploit direct resonant interaction, minimizing the energy required for synchronization.
The primary result obtained is the detection of the frequency lock-in effect of the control frequency fc with the PVC fv. This frequency lock-in effect forms the basis for controlling the PVC frequency using rotating actuators. Frequency lock-in is a situation where the PVC frequency fv becomes equal to the rotation frequency fc of the control jet emitted by the rotating actuator, and the PVC phase becomes equal to the phase of the control signal. Furthermore, it was found that lock-in occurs well before the actuator rotation frequency rises to the PVC frequency. Moreover, the greater the control flow rate supplied through the actuator, the earlier the lock-in occurs, and the later the desynchronization between the control jet and the PVC happens.
The frequency lock-in effect is visible in the spectra shown in
Figure 5 and
Figure 6, starting from a control flow rate of 0.4% of the main flow. For methodical purposes, consider the regime of the single-hole actuator with a maximum injection flow rate equal to 0.75% of the main flow.
Figure 7 shows the spectrograms obtained from the four microphones for the azimuthal mode
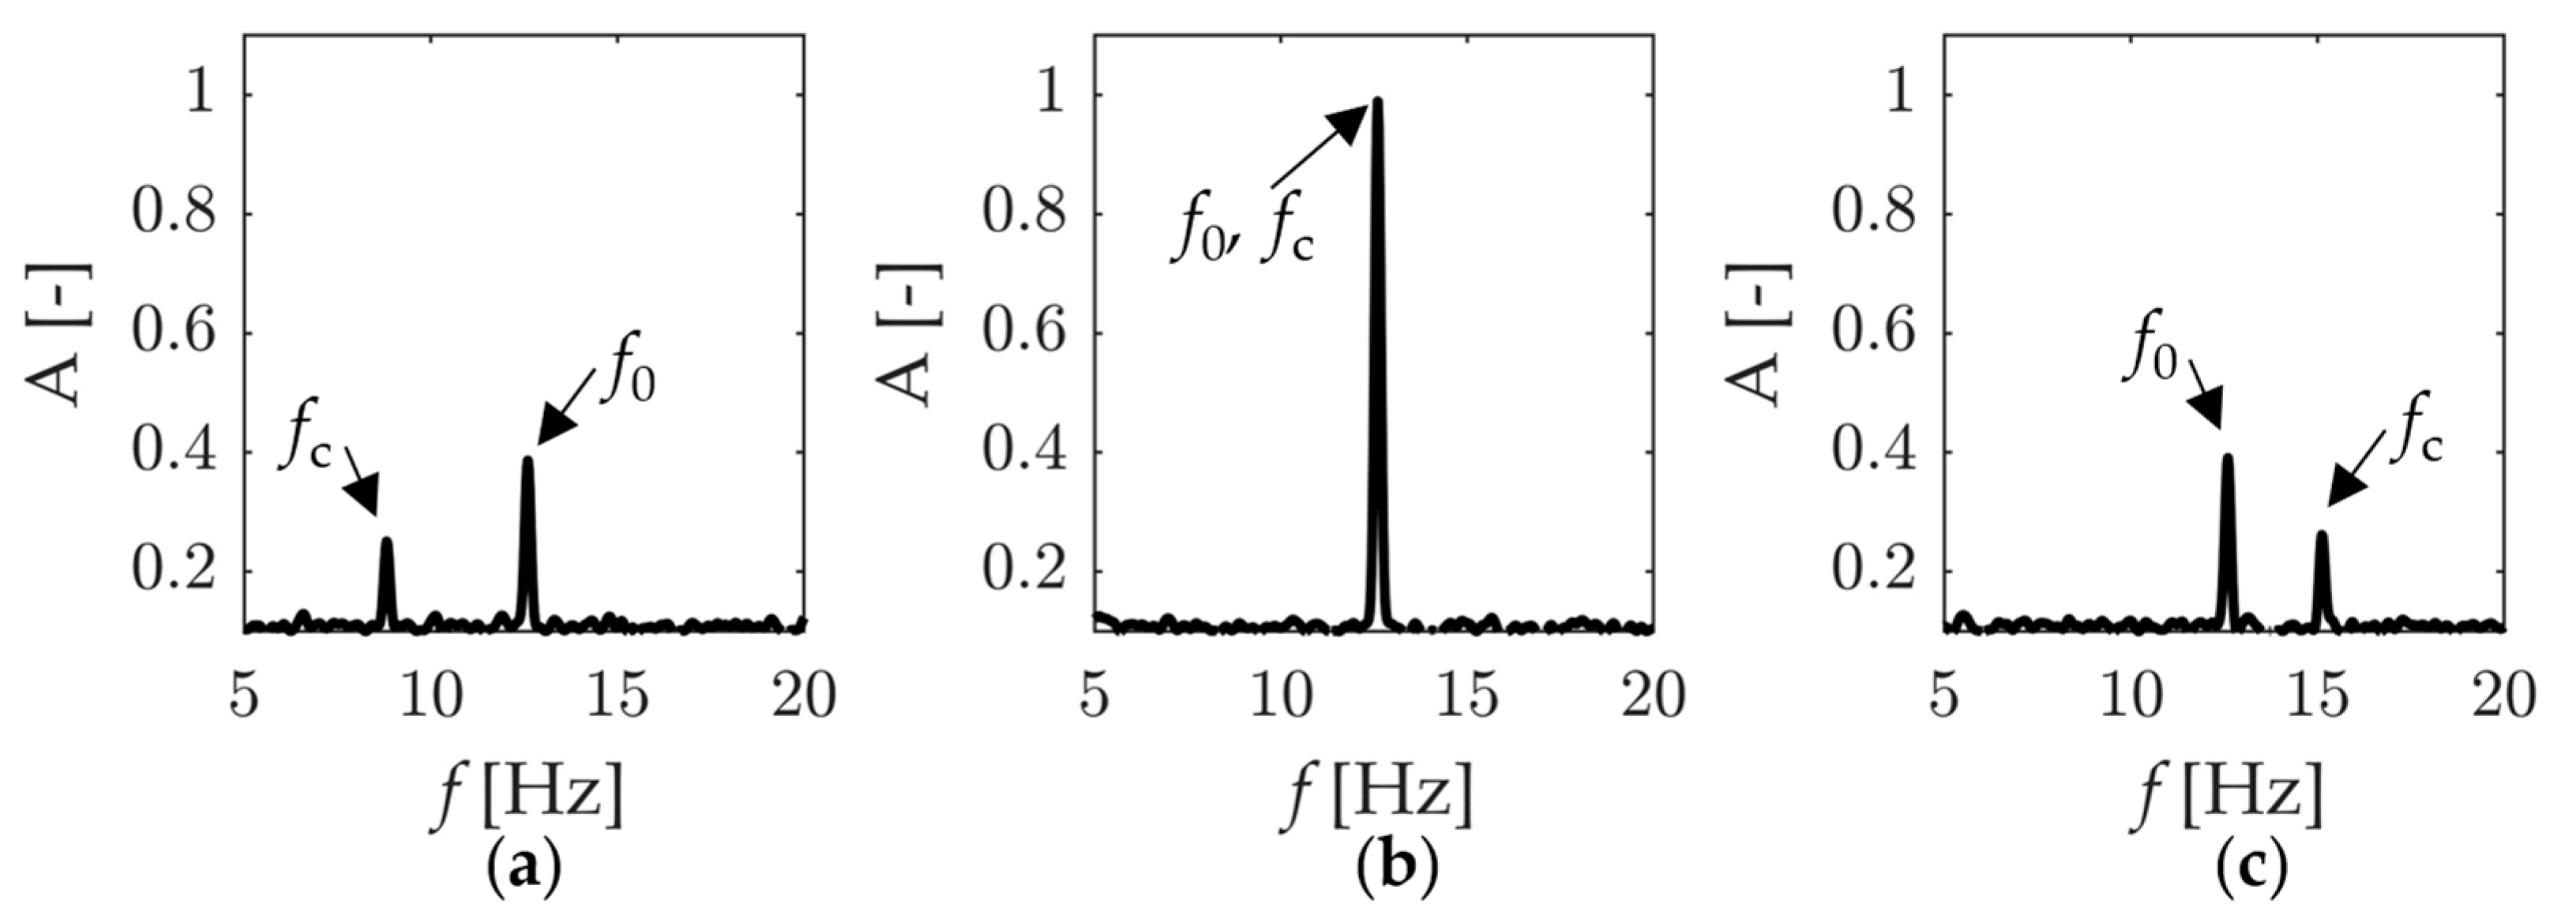
m = 1 and for three specific time segments numbered 11, 31, and 44. It is evident that when the actuator rotation frequency is lower than the PVC frequency, and frequency lock-in has not yet occurred, the spectrum contains two distinct peaks of different amplitudes (
Figure 7a). The peak corresponding to the PVC
f0 has a higher amplitude than the one associated with the rotating jet frequency
fc. At the moment when the PVC frequency locks onto the actuator rotation frequency (
Figure 7b), these two spectral peaks merge into a single peak. The energy of this combined spectral peak intensifies, indicating a complex interaction between the rotating jet and the vortex core. Following the cessation of frequency lock-in, when the actuator rotation frequency significantly exceeds the PVC frequency, two distinct peaks reappear in the spectrum (
Figure 7c). This situation mirrors the first case, with the order of the peak amplitudes effectively reversed. The conducted analysis of the microphone signals also confirmed the accuracy of the actuator rotation frequency extraction method using the photodiode. This provides cross-validation of the obtained experimental data, thereby enhancing its reliability.
To study the frequency lock-in effect more thoroughly, an analysis of the PVC phase and the rotating actuator phase was conducted. To extract the PVC phase, the azimuthal mode m = 1 was used, specifically the complex vector obtained using formula (2). A fourth-order Butterworth filter was applied to this vector to isolate a narrow frequency band from 10 Hz to 15 Hz, within which the PVC frequency f0 = 12.6 Hz lies. The choice of filter order represents a compromise between clear band isolation and acceptable suppression of frequencies outside this band. Compared to other filters, such as Chebyshev Type I/II or elliptic filters, the Butterworth filter has a gentler roll-off and therefore requires a higher order to provide the necessary characteristics in the stopband. However, the Butterworth filter was chosen because it has a more linear phase-frequency characteristic within the passband. The PVC phase was then computed as the phase of the complex number from the filtered m = 1 mode.
Extracting the phase of the rotating actuator is also challenging because the signal from the photoresistor has a complex, non-smooth shape, similar to that shown in
Figure 3b. To extract the phase, peaks were identified in the original voltage vs. time dependence from the photoresistor, where the actuator phase was set to zero. The characteristic time between two adjacent peaks is much shorter than the experiment duration (0.1 s vs. 600 s), allowing us to neglect the change in actuator rotation frequency between peaks. Under this assumption, the actuator phase depends linearly on time. At the initial moment (a voltage peak), the phase is zero; at the moment of the next peak, the phase is 2π, meaning the actuator has completed one full revolution. Applying this procedure to each pair of adjacent voltage peaks yields the dependence of the rotating actuator’s phase on time throughout the entire experiment.
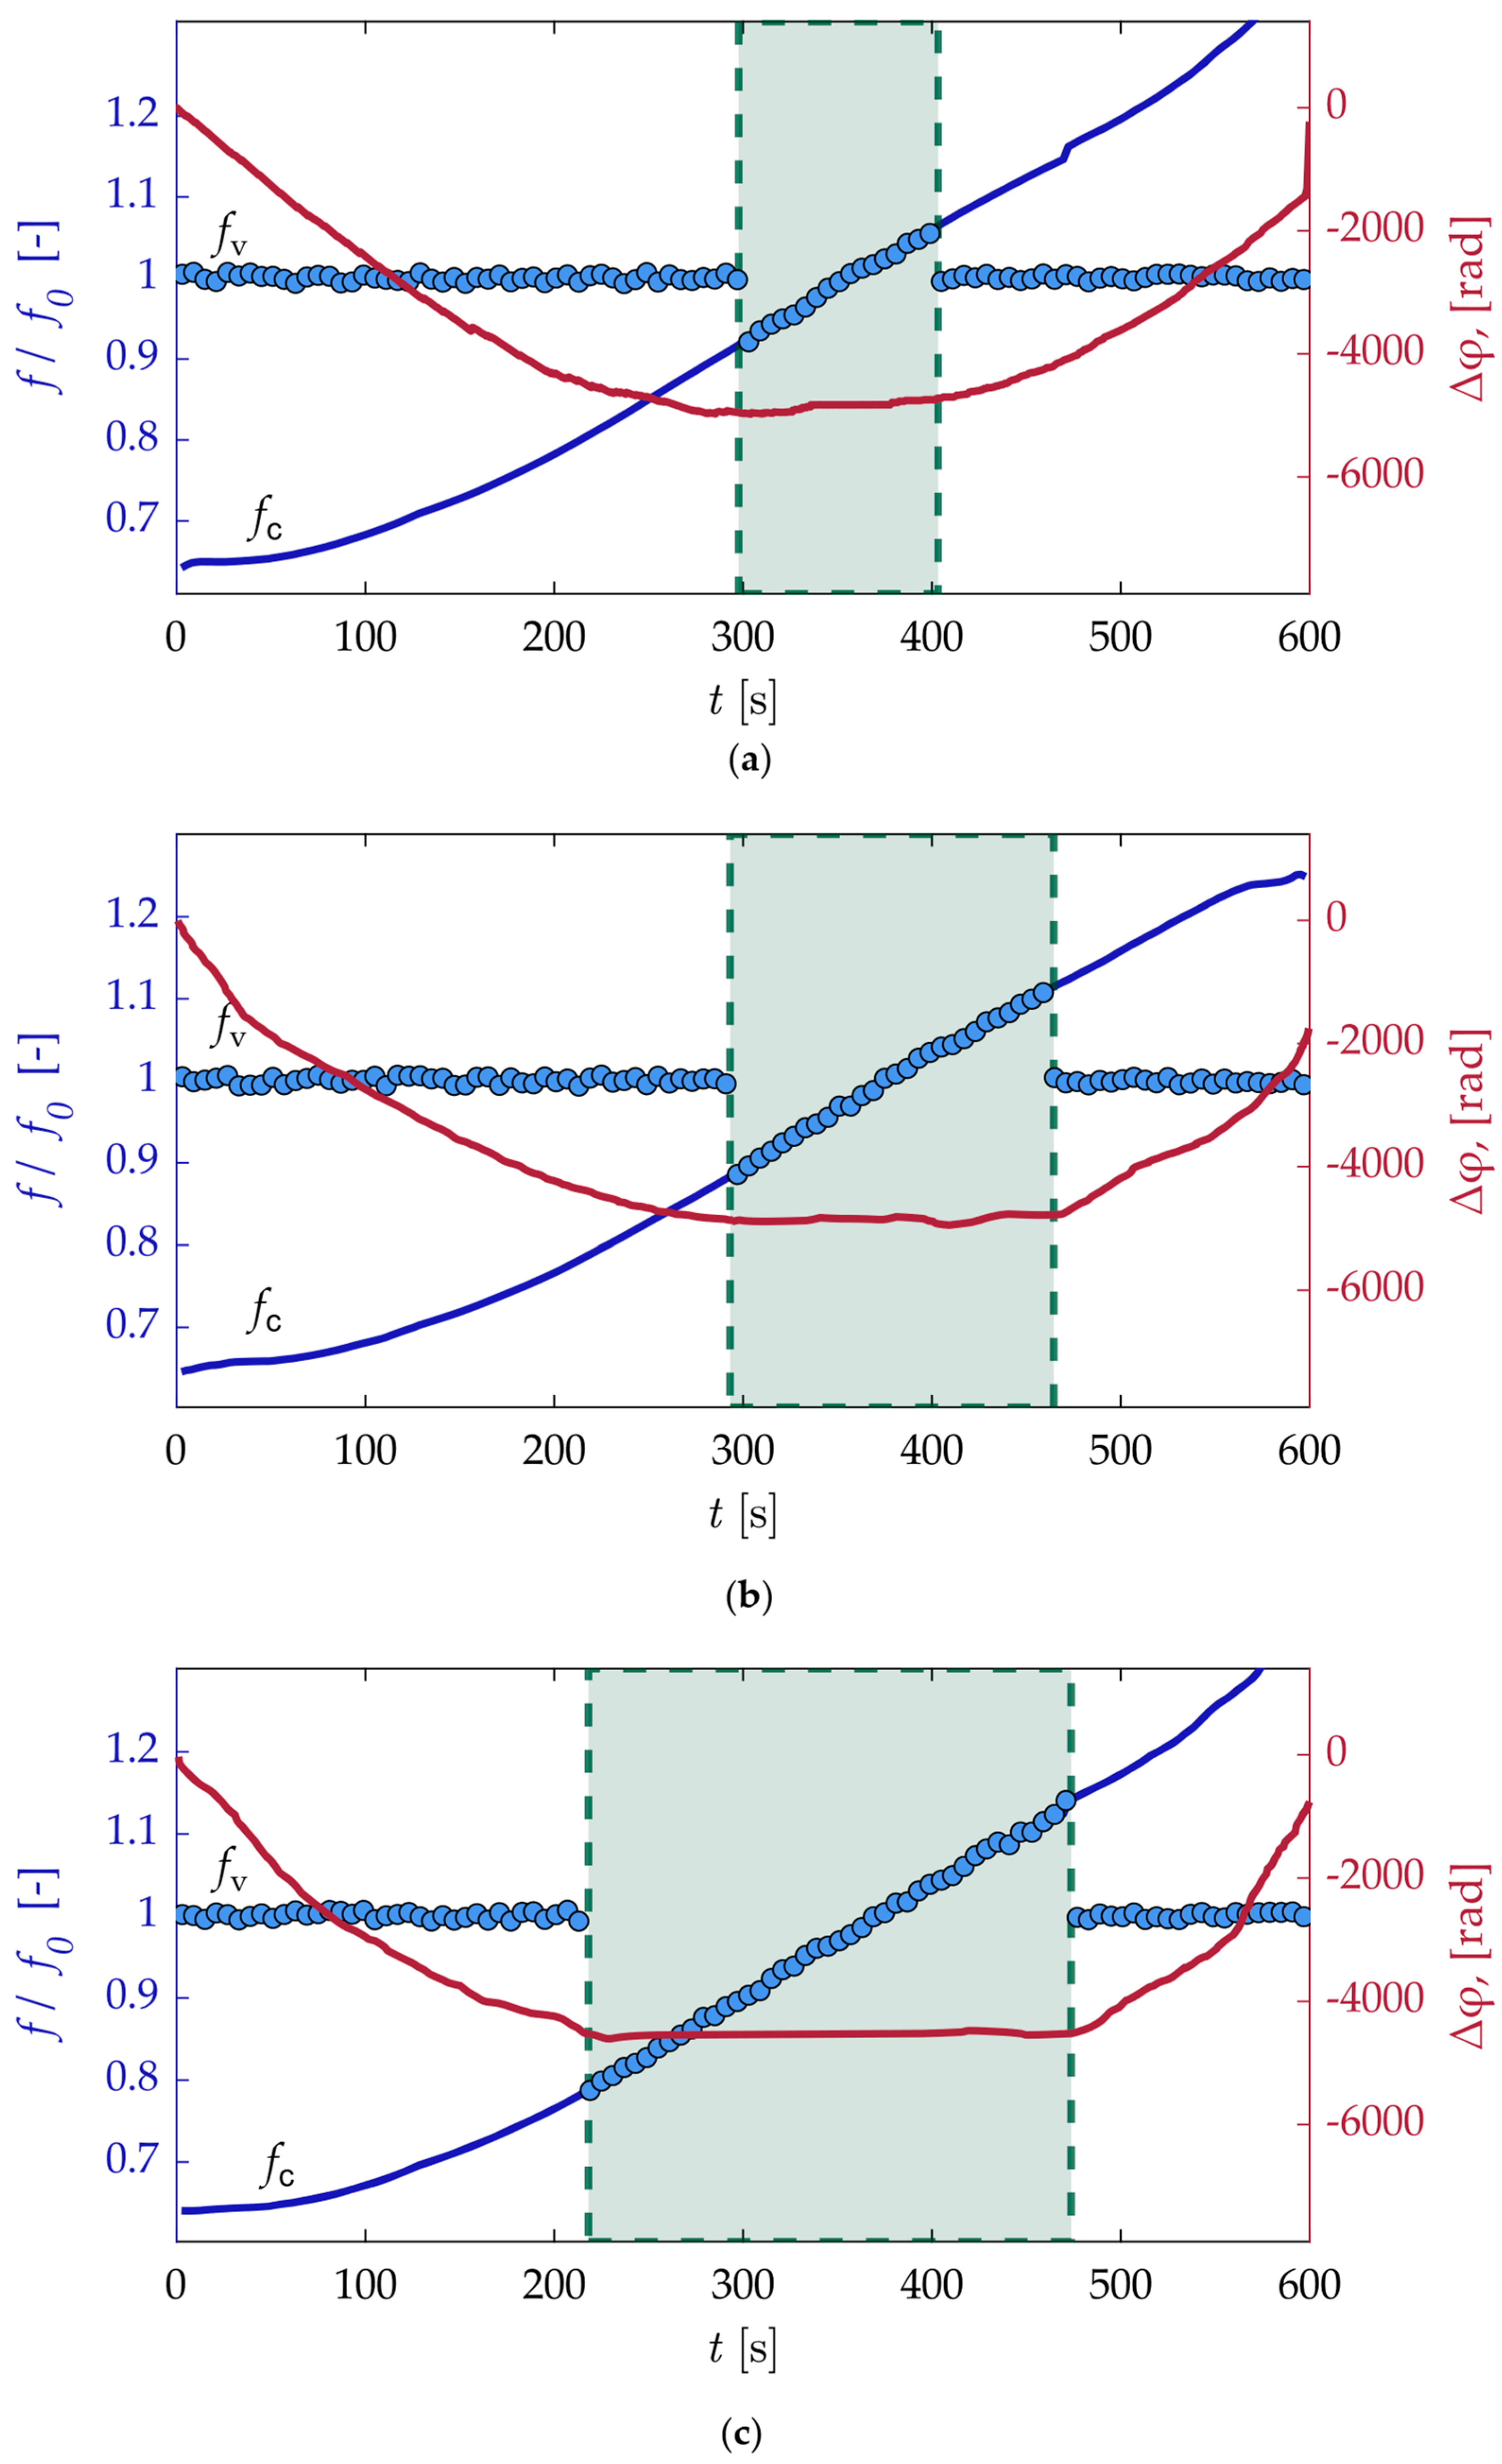
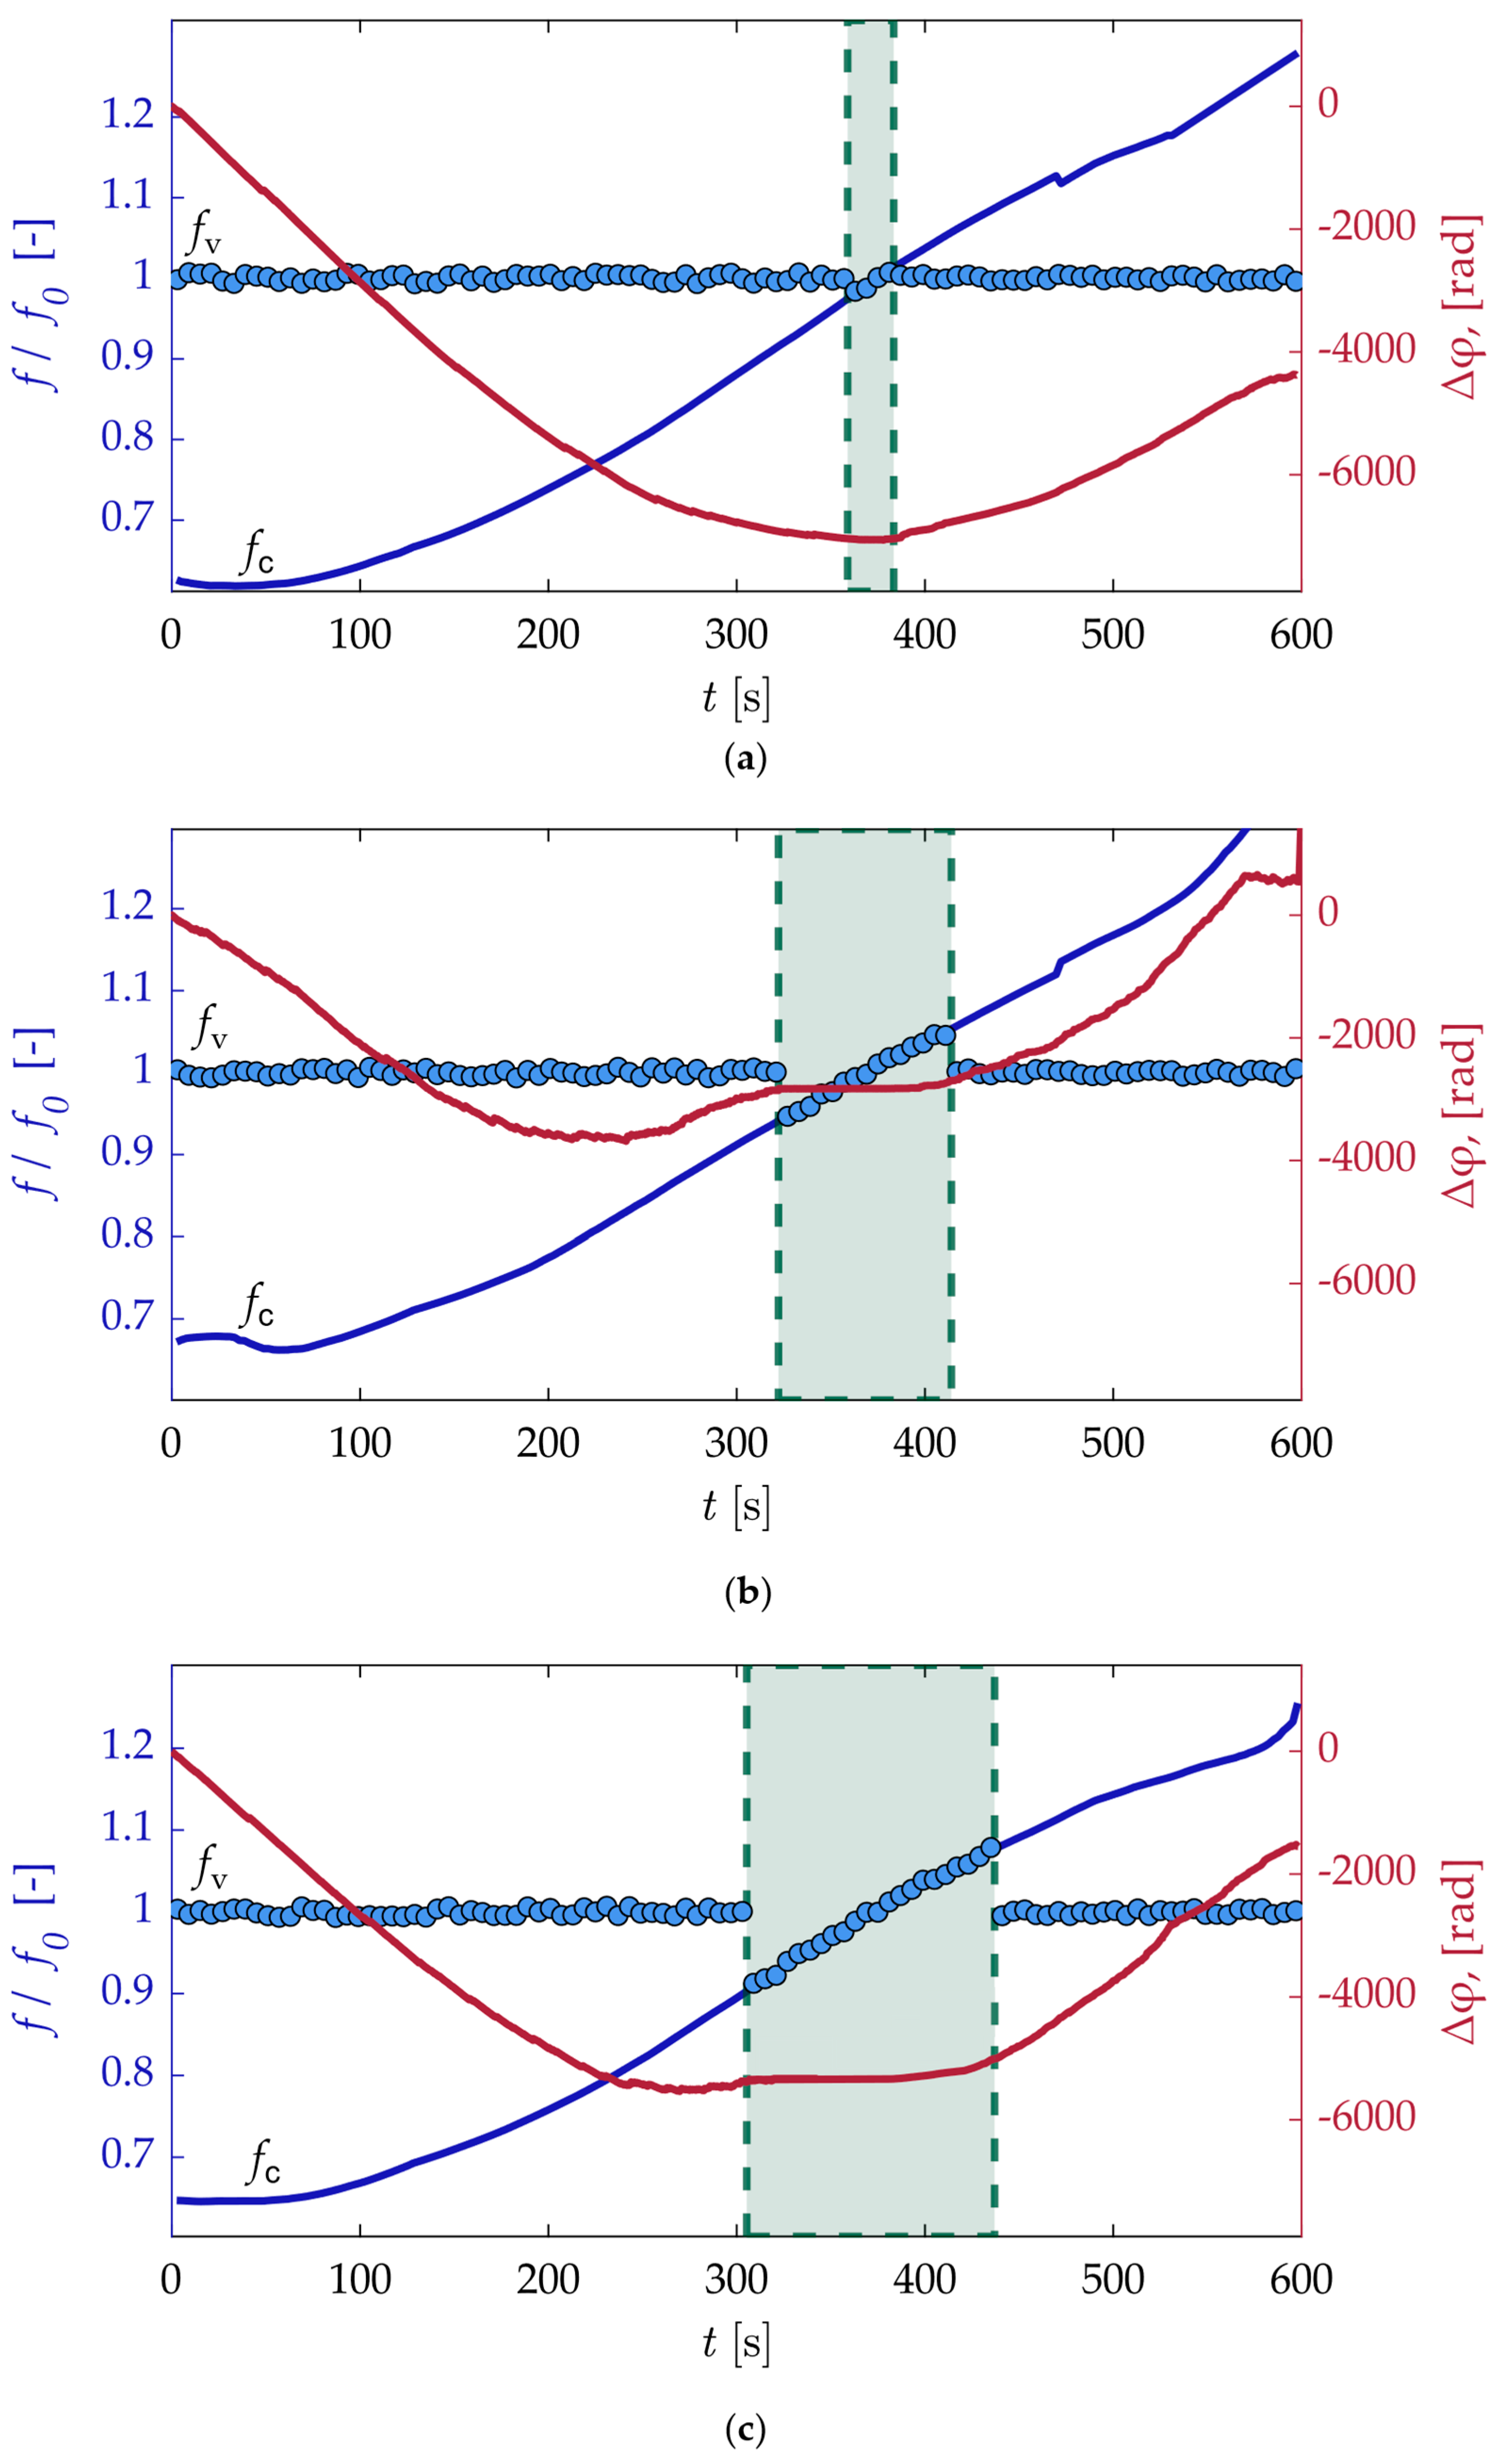
To analyze the lock-in effect, graphs were plotted showing the phase difference between the PVC and the rotating actuator, Δφ [rad]. This difference is shown as a cumulative effect from the start of the experiment. At the moment of lock-in, the phase difference ceases to change, and the graph becomes a straight line parallel to the horizontal time axis (or number of segments). Since the extraction of the PVC and actuator phases involves unavoidable errors, the graph is not strictly a straight line but exhibits minor fluctuations around a mean position.
The graphs also show the actuator frequencies (fc) normalized on the PVC frequency in baseline (f0), obtained inside 100 segments (6 s is the duration of one segment), as a solid blue curve. PVC frequencies were determined by finding the frequency with the maximum amplitude in the spectrum of the filtered m = 1 mode. The PVC frequencies are shown by circles with black outlines.
The frequency lock-in effect for the actuator with a single hole is shown in
Figure 8. In the case of zero control flow (
Qc = 0), no lock-in effect is observed; the constant PVC frequency does not depend on the increasing actuator rotation frequency. The phase difference Δφ becomes constant only for a brief moment when the actuator rotation frequency reaches the PVC frequency. Increasing the control flow to
Qc = 0.15% of the main flow is also insufficient for the lock-in effect to appear. Only at a flow rate of
Qc = 0.4% (
Figure 8a) of the main flow is the lock-in effect clearly visible from approximately 300 s to 405 s, lasting
Tlock ≈ 105 s. During this interval, the phase difference Δφ (solid dark red curve) hardly changes. Lock-in occurs when the actuator frequency reaches 11.6 Hz (with the PVC frequency at
f0 = 12.6 Hz) and ceases when the actuator frequency reaches 13.4 Hz, allowing for frequency adjustment in the range of 0.92
f0–1.06
f0. This is the essence of the obtained result: a rotating actuator with a low-flow control jet can shift the PVC frequency, increasing or decreasing it. Increasing the control flow to
Qc = 0.6% of the main flow (
Figure 8b) leads to a more developed lock-in effect. The effect occurs from approximately 295 s to 465 s, lasting for
Tlock ≈ 170 s. During this interval, the phase difference Δφ hardly changes. Lock-in begins when the actuator frequency becomes 11.1 Hz and ends at 14 Hz, allowing for frequency adjustment in the range of 0.88
f0–1.11
f0. Increasing the control flow to
Qc = 0.75% of the main flow (
Figure 8c) leads to an even more pronounced lock-in effect. The effect occurs from approximately 220 s to 480 s, lasting for
Tlock ≈ 260 s. During this interval, the phase difference Δφ hardly changes. Lock-in begins when the actuator frequency becomes 9.8 Hz and ends at 14.3 Hz, allowing for frequency adjustment in the range of 0.78
f0–1.13
f0. Notably, the data presented, particularly in
Figure 8c, align well with prior descriptions of the lock-in phenomenon in non-swirling flows [
30], specifically regarding the asymmetry between the onset and termination of synchronization. This agreement reinforces the commonality of key lock-in features across different flow configurations.
The frequency lock-in effect for the actuator with two holes is shown in
Figure 9. In the case of near-zero control flow (
Qc = 0.15%), no lock-in effect is observed; the constant PVC frequency is independent of the increasing actuator rotation frequency. The phase difference Δφ becomes constant only for a brief moment when the actuator rotation frequency reaches the PVC frequency. Increasing the control flow to
Qc = 0.4% of the main flow (
Figure 9a) results in a short-duration lock-in effect occurring from approximately 365 s to 390 s, with a duration of
Tlock ≈ 25 s. During this interval, the phase difference Δφ remains nearly constant.
A more pronounced and sustained lock-in effect is achieved at a flow rate of
Qc = 0.6% of the main flow (
Figure 9b), clearly visible from approximately 320 s to 410 s, lasting for
Tlock ≈ 90 s. Throughout this period, the phase difference Δφ shows minimal variation. Lock-in occurs when the actuator frequency reaches 11.7 Hz (with the PVC frequency at
f0 = 12.6 Hz) and ceases when the actuator frequency reaches 13.4 Hz, allowing frequency adjustment in the range of 0.93
f0–1.06
f0. Increasing the control flow to
Qc = 0.75% of the main flow (
Figure 9c) leads to a developed lock-in effect. The effect occurs from approximately 305 s to 435 s, lasting for
Tlock ≈ 130 s. During this interval, the phase difference Δφ hardly changes. Lock-in begins when the actuator frequency becomes 11.3 Hz and ends at 13.6 Hz, allowing frequency adjustment in the range of 0.90
f0–1.08
f0.
Comparing the two actuators, it was found that the single-hole actuator performs better at suppression and control than the two-hole actuator. With the single-hole actuator, a frequency shift of up to 22% from the baseline PVC frequency is achievable, whereas with the two-hole actuator, the frequency shift reaches only 8%. Thus, the two-hole actuator is less effective for controlling the PVC.
The present control strategy is grounded in LSA, specifically for identifying the region of highest flow receptivity to perturbations, which guided the optimal actuator placement [
12,
16]. However, the PVC in a turbulent turbine flow is a saturated nonlinear global mode. The experimental demonstration of lock-in, particularly the observed asymmetry in the synchronization range where frequency capture initiates earlier for forcing below the natural frequency (
Figure 8 and
Figure 9), is itself a signature of nonlinear interaction. Therefore, while linear theory provides the essential map for efficient targeting, the achieved frequency control and the lock-in dynamics result from the nonlinear response of the flow to the resonant forcing.
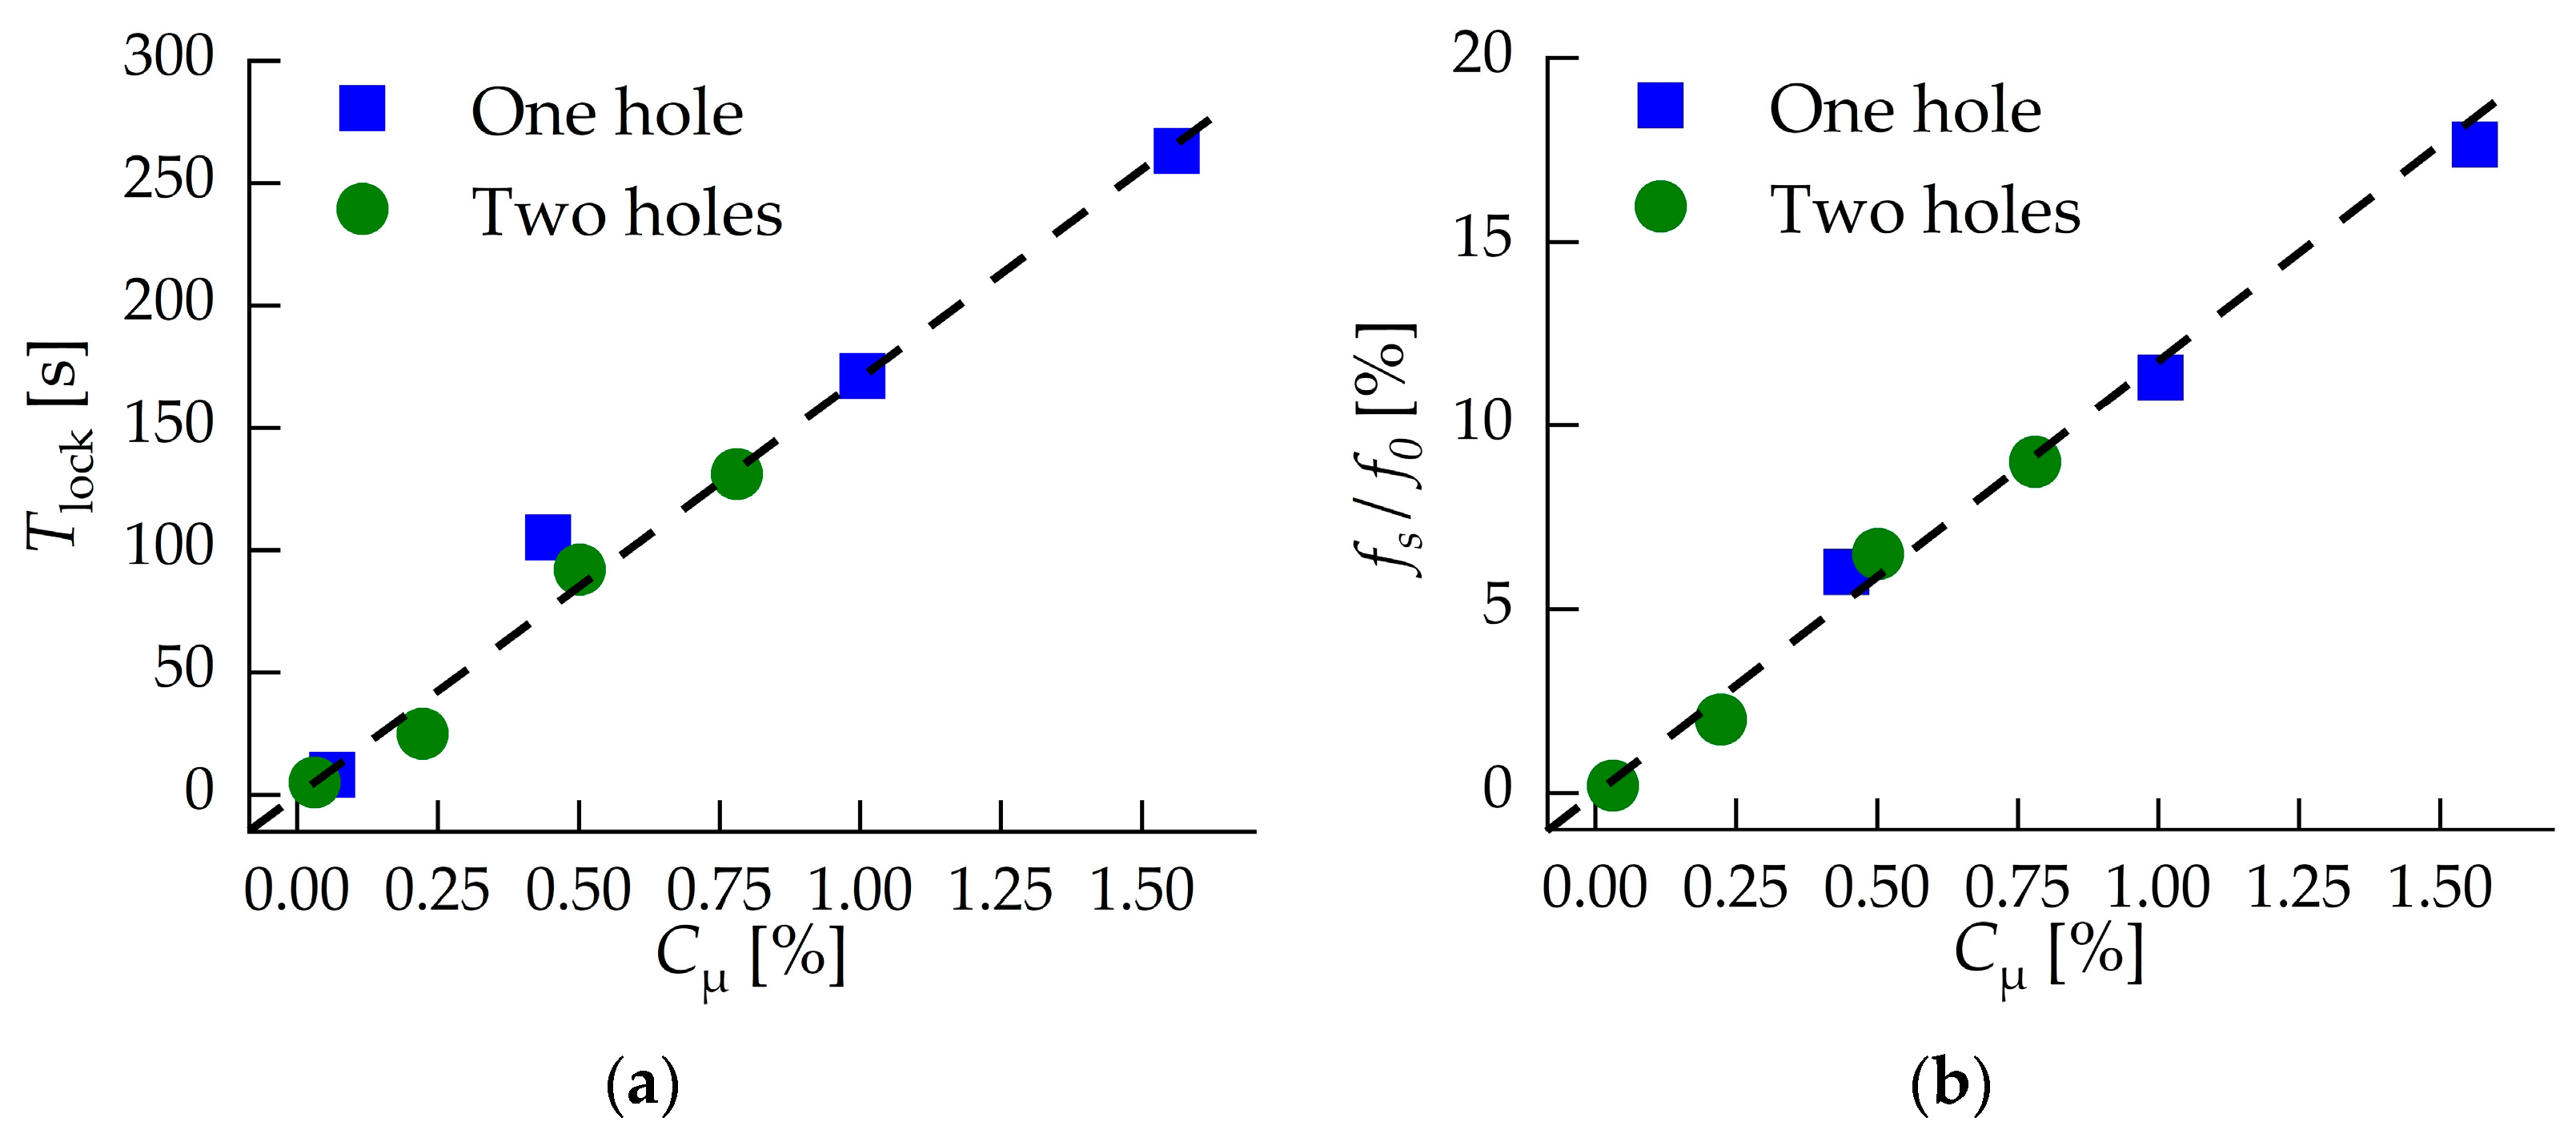
Figure 10 presents aggregated data on the duration of the frequency lock-in state and the mean frequency shift
fs of the PVC relative to its baseline value
f0. A linear relationship (coefficient of determination is equal to 0.98) is observed between the momentum flux coefficient
Cμ and both the lock-in duration
Tlock (
Figure 10a) and the relative frequency shift
fs/
f0 (
Figure 10b). In this state, the PVC captures the rotating actuator’s frequency.
This observed linear trend can be justified from the perspective of the system’s linear response to forcing within the tested regime. The momentum flux coefficient Cμ is a direct measure of the energy input from the actuator into the flow. According to the principles of linear stability theory and resonant interaction with a global mode, the system’s response, in this case, the degree of frequency entrainment (shift) and the stability of the synchronized state (lock-in duration), is expected to be proportional to the amplitude of the applied forcing when operating near the instability threshold. Therefore, as Cμ increases linearly, the forcing strength acting on the receptive region of the PVC increases proportionally. This leads to a corresponding linear increase in both the achievable frequency detuning (shift) and the robustness of the lock-in state, which manifests as a longer duration over which synchronization is maintained despite variations in the actuator frequency. The linear relationship holds for the range of low Cμ values tested, where the control strategy operates within the linear response domain of the global instability, before potential saturation or nonlinear interactions dominate at higher forcing levels.
The superior efficacy of the single-hole actuator for PVC frequency control stems from fundamental fluid-dynamic principles governing momentum injection and its interaction with the global instability. The primary reason is the higher momentum flux density achieved. For an identical control flow rate Qc, the smaller total orifice area of the single-hole actuator results in a significantly higher jet exit velocity Wc. Since the momentum flux coefficient Cμ scales with Wc2, this configuration delivers a more concentrated periodic disturbance with greater penetration into the main flow. This stronger perturbation is applied precisely within the critical high-receptivity region, as identified by linear stability theory, ensuring optimal coupling with the PVC’s global mode structure (azimuthal mode m = 1). In contrast, the dual-hole actuator distributes the same mass flow over a larger area, producing jets with lower velocity and momentum. This results in a weaker, more diffuse forcing that is less coherent spatially, explaining the experimental observation of a higher required control flow rate, a narrower lock-in range, and a smaller maximum frequency shift (8% vs. 22%). Consequently, the single-hole actuator embodies the principle of efficient resonant control more effectively: it delivers energy directly into the instability’s receptive field, acting as a precise amplifier. This finding underscores that for stability-based active flow control, actuator geometry, which determines jet momentum density and spatial coherence, is as critical as the total control flow rate for achieving powerful and efficient control.