


Abstract
Data centers are becoming a material load on electricity systems. This PRISMA 2020 systematic review is the first to cover the computational, electrical, and thermal integration pathways under one openly re-executable protocol, to appraise the reporting quality of every included study, and to audit its own retrieval coverage. OpenAlex and Crossref were searched on 4 August 2026; 2810 records were screened, 347 reports were assessed at full text, and 242 studies were included after a second retrieval pass recovered 191 openly accessible reports the first pass had missed—a correction that changed the rank order of four of six thematic clusters. All 1489 quantitative claims were extracted. The evidence is thin: 54% of studies rest on modeling or simulation and 4% on field measurement, and the mean reporting-quality score is 4.1 of 10. Carbon- and energy-aware computing is the largest cluster (57 studies), followed by cooling (47) and renewables, storage, and integrated energy systems (45). Reported savings—15–35% energy and 20–45% carbon in simulation—are envelopes whose width is set by the reference case; where the same mechanisms have been measured, gains are an order of magnitude smaller. The absence of measured, facility-scale evaluation is the binding constraint, and eight prioritized research gaps follow from it.
1. Introduction
1.1. Motivation
Digital services underpin a growing share of economic activity, and the facilities that host them have become a material component of electricity demand. Global data center electricity consumption reached an estimated 415 TWh in 2024—about 1.5% of world demand—and the International Energy Agency expects it to more than double, to roughly 945 TWh, by 2030 as AI workloads scale [1,2]. Older projections differ widely from one another: some see efficiency gains holding consumption nearly flat, others see data centers and networks together approaching double-digit shares of global electricity by 2030 [3,4,5]. Whatever the global trajectory turns out to be, the regional problem has already arrived. U.S. inventories put data centers near 2% of national electricity, a figure being revised upward for streaming, cryptocurrency, and AI [6,7,8,9]. Ireland hit 11% as early as 2020 [10,11]. And in Virginia’s “Data Center Alley,” demand growth, air-quality burdens, and land- and water-use conflicts concentrate within a single distribution region [12].
Meanwhile the grid itself is changing. Smart grids run on high shares of variable renewables, two-way information flows, distributed resources, and markets that pay for flexibility—and that changes what a data center is. To a conventional grid, a data center is a large, constant, and growing load and nothing more. To a smart grid, the same building looks like a controllable resource. Its computational work can be delayed, moved between regions, or throttled when carbon intensity or prices spike [8,13,14]. Its uninterruptible power supplies (UPSs), backup generation, and batteries can sell reserve and frequency services [15,16,17]. Its cooling can be co-optimized with electricity and heating networks [18,19], and the heat it must reject anyway can displace fossil-fueled district heating [20,21,22]. The question this review takes up is therefore not just how data centers can consume less, but how they can consume well—at the right times, in the right places, from the right sources, wasting as little as possible of what passes through them.
1.2. The Case for a New Systematic Review
The literature answering this question has grown quickly and unevenly, split across communities that rarely read one another. Computer scientists work on workload scheduling, virtual machine consolidation, and Kubernetes-level carbon awareness; electrical engineers on demand response, microgrid dispatch, and reliability; thermal engineers on liquid cooling, heat recovery, and integrated energy systems. Each slice has its reviews—software energy efficiency [4,23], cloud resource management [24], cooling and IT co-optimization [18,25], waste heat recovery [21,22,26], grid balancing potential [15,16], integrated energy system concepts [27]—but, to the best of our knowledge, no recent review maps where these pathways meet, under a common smart-grid framing, with a search another team could rerun. Moreover, the field is moving fast: more than half of the studies included in this review were published in 2024 or later, largely in response to the AI-driven demand shock, and their findings have not yet been consolidated. To make the claim to originality explicit at the outset: Table 1 (Section 2.2) contrasts this review, item by item, with eleven prior reviews published in the search window, comparing their primary focus and their coverage of the five capability areas this topic spans, and Table 2 positions it against the same reviews on the five elements that define its contribution. That comparison shows that no prior review combines (i) a reproducible PRISMA 2020 protocol, (ii) joint coverage of the computational, electrical, and thermal integration pathways under one taxonomy, and (iii) a corpus extending through the post-2023 AI demand inflection—the three properties that jointly define this review’s contribution.
Table 1.
Representative prior reviews within the search window and their coverage. ●: covered in depth; ◐: partially covered; ○: not covered. WLS = workload scheduling; DR/Flex = demand response and flexibility; WHR = waste heat recovery; IES = integrated energy systems.
Table 2.
Positioning of this review relative to representative prior review articles. “Yes/Partial/No” indicate the extent to which each element is addressed: a reproducible search protocol (PRISMA 2020 with re-executable queries); joint coverage of the computational, electrical, and thermal integration pathways; study-level appraisal of the evidence and claim-level extraction; a corpus extending through the post-2023 AI demand inflection; and a measured audit of the review’s own retrieval coverage.
Research gaps and novelty. Set against these reviews, four gaps remain open. (i) No review has covered the computational, electrical, and thermal integration pathways together under a reproducible, re-executable search protocol; the existing syntheses are either single-pathway or narrative (Table 2). (ii) No review has appraised the evidence base itself—the evaluation setting, baseline, data availability, and uncertainty reporting of each study—so the field’s headline savings circulate without any indication of how they were produced. (iii) Reviews whose search windows close before 2025 predate the AI-driven demand inflection that motivates more than half of the current literature and that has moved interconnection risk, adequacy, and dynamic stability to the foreground. (iv) No open-access-gated review has measured what its retrieval gate missed. This review addresses all four: it applies one PRISMA 2020 protocol across the three pathways (Section 3), extracts and appraises every quantitative claim of 242 studies (Section 3.5 and Section 3.8), covers the literature to August 2026, and reports a measured retrieval audit whose correction changed the rank order of four of the six thematic clusters (Section 3.6 and Section 3.7). The novelty is therefore methodological and evidential rather than topical: the review proposes no new integration technology, but establishes, for the first time at corpus scale, how much of the reported benefit of existing technologies rests on measured rather than simulated evidence, and how the reported magnitude of each benefit depends on its reference case (Section 5.1) and on the scale, workload, and grid conditions under which it applies (Section 5.2).
1.3. Research Questions and Contributions
This review answers five research questions:
RQ1. What is the current scale, trajectory, and environmental footprint of data center energy demand, and how are these assessed and governed?
RQ2. Which computational strategies—energy-aware and carbon-aware scheduling, workload migration, and resource management—enable data centers to align their demand with smart-grid conditions, and what savings do they report?
RQ3. Through which mechanisms can data centers provide grid services (demand response, frequency response, load migration, market participation), and what quantified flexibility potentials have been demonstrated?
RQ4. Which facility-level technologies—advanced cooling, waste heat recovery, renewable integration, storage, and integrated energy systems—support sustainable grid integration, and what performance do they achieve?
RQ5. What barriers, evidence gaps, and research opportunities condition the sustainable integration of data centers in smart grids?
This review makes six principal contributions. First, it establishes a PRISMA 2020-compliant identification, screening, and eligibility process covering 2021–2026 and yielding 242 primary and secondary studies. Second, it develops a six-cluster taxonomy spanning the computational, electrical, and thermal dimensions of grid integration, into which every included study is classified. Third, it provides comparative tables that consolidate the quantitative outcomes reported across the literature, including energy savings, carbon reductions, flexibility magnitudes, and heat recovery performance. Fourth, it distills these findings into a strategy–opportunity framework with eight prioritized research gaps for future work and policy. Fifth, it appraises the evidence base itself through per-study extraction of every quantitative claim (1489 rows) and a five-item reporting-quality rubric applied to 228 of the 242 studies, showing how much of the reported performance rests on modeling rather than measurement. Sixth, it provides a measured account of retrieval bias: the first retrieval pass missed 224 openly accessible reports, and recovering 191 of them changed the rank order of four of the six clusters—a result reported in full because it bears on open-access-weighted reviews beyond this study.
1.4. Article Organization
Section 2 positions this work against prior reviews. Section 3 details the review protocol, search strategy, eligibility criteria, and synthesis method. Section 4 reports results: the corpus profile and the six thematic syntheses. Section 5 discusses cross-cutting findings, the strategy–opportunity framework, barriers, research gaps, and limitations. Section 6 concludes.
2. Background and Related Reviews
2.1. Data Centers as Smart-Grid Actors
Three subsystems make up a data center, and they cannot be tuned separately. The IT system—servers, storage, networking—takes 60% or more of facility power in modern designs [1]. Cooling takes anywhere from under 10% in an efficient hyperscale hall to over 30% in a legacy one [1,18]. The power delivery system (transformers, UPS, distribution) ties everything to the grid. The three are thermoelectrically coupled: a scheduling decision changes how much heat is made, a cooling setpoint changes how much power is drawn, and a commitment in a power market constrains both [18,19,29]. Smart-grid integration then wraps a fourth layer around the facility—price, carbon-intensity, and dispatch signals—which it can absorb by shifting load in time, migrating work between distant sites, capping power, dispatching storage, or running its own generation [8,14,16,30].
2.2. Prior Reviews and Their Scope
Table 1 summarizes representative reviews published within the search window. Software-oriented surveys [4,23] cover virtualization, consolidation, and scheduling but rarely treat the grid as an active counterpart. Thermal reviews [18,21,22,25,26] examine cooling and waste heat pathways in depth but typically exclude workload flexibility. Grid-oriented reviews [15,16] quantify balancing potential but do not integrate facility thermal reuse. Broader sustainability perspectives [24,27,28,31] sketch integrated visions without systematic, reproducible search protocols. The distinctive contribution of the present review, stated in Section 1.2, is the combination of all three integration pathways under one reproducible protocol, extended here by an appraisal of the evidence base itself (Section 3.5 and Section 3.8).
Basis of the comparison criteria. The reviews compared in Table 1 and Table 2 were selected by three rules: each is an included study of this review, so it passed the eligibility criteria of Table 3; each is classified as a review or survey rather than a primary study; and together they span the six thematic clusters of Section 4, the reviews named being the representative members of each cluster rather than an exhaustive list (all included reviews are tagged in Supplementary Materials S4). The six columns of Table 1 are the five integration mechanisms that define the thematic taxonomy of this review—workload scheduling, demand response and flexibility, cooling, waste heat recovery, and integrated energy systems (Section 4.1)—plus adherence to PRISMA, which records whether a review’s coverage claims are reproducible. The ●/◐/○ grading records whether a mechanism is the subject of at least one dedicated section of the review (●), is discussed within another topic (◐), or is absent (○), judged from the full text. The five columns of Table 2 are the five elements that this review adds; they were chosen because each corresponds to one of the research gaps stated in Section 1.2, so that Table 2 shows directly which gap each prior review leaves open. Both gradings are coarse by design—three levels, judged from openly cited full texts—so that readers can verify each cell against the source.
Table 3.
Inclusion and exclusion criteria.
It is worth stating explicitly what new understanding the combination of these five elements—a reproducible protocol, the three pathways under one taxonomy, study-level appraisal, an AI-era corpus, and a retrieval audit—generates, because none of it is visible from any single column of Table 2 alone. First, joining the three pathways to a claim-level extraction yields a diagnosis rather than a catalog: the thermal and electrical pathways turn out to be at least as large as the computational one (Section 4.1), and the field’s reported savings are shown to be simulation-derived envelopes rather than demonstrated results (Section 3.8). Second, joining the appraisal to the venue-indexing check exposes a quality gradient—indexed sources score 2.3 rubric points above non-indexed ones (Section 3.5)—that a catalog of findings would conceal. Third, the AI-era corpus changes the question itself: the 2025–2026 studies that make up half the corpus are motivated by training and inference growth, so grid interconnection risk, adequacy and dynamic stability enter the literature as first-order problems (Section 4.4) where earlier reviews saw only efficiency. Fourth, and unique to this review, the retrieval audit measures how much an open-access-gated synthesis can miss: identifying 224 openly accessible reports that the first pass had missed, and recovering 191 of them, changed the rank order of four of the six clusters (Section 3.6 and Section 3.7). Each of these results depends on two or more columns of Table 2 being satisfied together.
2.3. Conceptual Framing: From Passive Load to Grid Asset
The review adopts a conceptual framing in which a data center’s grid interaction can be characterized along four controllable dimensions. The temporal dimension exploits delay tolerance: batch analytics, model training, backups, and scientific computing can often be deferred by minutes to hours, allowing consumption to follow renewable output or avoid coincident peaks [14,30]. The spatial dimension exploits geographic redundancy: the same job can frequently run in any of several regions, so load can migrate toward low-carbon or low-price grids subject to latency and data-sovereignty constraints [8,32]. The electrical dimension exploits the facility’s power infrastructure: UPS systems, batteries, and on-site generators—normally idle insurance assets—can deliver fast reserve, regulation, and peak-shaving services with negligible impact on the primary mission [15,17,33]. The thermal dimension exploits the facility’s energy conversion: nearly all consumed electricity leaves as low-grade heat, which liquid cooling makes recoverable at temperatures useful for district heating and other off-takers [20,21,34]. A facility that activates all four dimensions behaves less like a load and more like a hybrid resource—part flexible demand, part storage, part generator, part heat plant. The clusters T2–T6 of this review map directly onto these dimensions, while T1 supplies the demand and footprint baseline against which their value is measured. This framing also clarifies terminology used throughout: we use smart grid to denote power systems with bidirectional communication and market- or signal-based coordination of distributed resources; grid-interactive data center to denote a facility that actively responds to such signals; and sustainable integration to denote grid interaction that jointly reduces system-level carbon, water, and cost impacts rather than shifting them between actors. Figure 1 summarizes this conceptual framing.
Figure 1.
Conceptual framework of sustainable data center integration with smart grids. The framework illustrates the transition from a conventional passive data center to a grid-interactive multi-resource asset through temporal, spatial, electrical, and thermal flexibility, highlighting the associated technologies and sustainability benefits.
3. Materials and Methods
3.1. Protocol and Reporting Standard
The review was designed, executed, and reported in accordance with the PRISMA 2020 statement for systematic reviews [35]. The protocol—research questions, information sources, search strings, eligibility criteria, screening procedure, and synthesis plan—was specified before full-text assessment began. The protocol was not registered. PROSPERO primarily indexes health-related reviews, and the registries that do accept reviews in other fields (OSF Registries, INPLASY) were identified only after the searches had been executed, so a registration would have postdated the results and is not claimed. All protocol elements are instead reported in full in this section, and the deviation from PRISMA 2020 item 24a is acknowledged in Section 5.7.
Protocol amendments. Four elements were added after the initial analysis in response to peer review and are reported as protocol amendments (PRISMA 2020 item 24c): the venue-indexing check (Section 3.2), the study-level appraisal rubric (Section 3.5), the per-study evidence table and its synthesis (Section 3.8), and the second retrieval pass of September 2026 (Section 3.4). The first three altered neither the search, the eligibility criteria, nor the included set. The fourth altered the included set, by re-seeking reports that the first pass had failed to retrieve; it changed no search string and no eligibility criterion, and every report it added passed the same screening and full-text assessment as the original corpus.
3.2. Eligibility Criteria
Eligibility was defined around a PICo-style logic: the population is data centers of any scale (cloud, hyperscale, HPC, edge, and enterprise facilities); the interest is any strategy or technology affecting their sustainable integration with electric power systems and smart grids (energy/carbon-aware computing, demand response and flexibility, cooling, waste heat recovery, renewable and storage integration, and demand/footprint assessment supporting such integration); and the context is the 2021–2026 period of rapid renewable expansion and AI-driven demand growth. Table 3 lists the operational inclusion and exclusion criteria. Peer-reviewed journal articles and full conference papers in any language were eligible if an accessible full text could be obtained; preprints without peer review, retracted items, editorials, and patents were excluded. Studies mentioning data centers only incidentally (e.g., general smart-city, smart-home, or generic microgrid studies without a data center focus) were excluded at the full-text stage.
Venue indexing (sensitivity analysis). Each included report was additionally checked against whether its source was listed as active in the Scopus source title list (July 2026 edition; Active/Inactive and discontinued-title fields, checked 5–6 September 2026 for the first-pass corpus and 14 September 2026 for the reports added in the second pass) or—for fully open-access journals—listed in the Directory of Open Access Journals (DOAJ); Web of Science was not checked separately; conference proceedings qualified only where the proceedings series itself met this condition. Indexing was not applied as a retrospective eligibility criterion, which would constitute a protocol deviation. Instead, the check was applied to the corpus assembled under the original protocol, the effect of restricting to indexed sources is reported as a sensitivity analysis in Section 3.7, and every record’s tier is tagged in Supplementary Materials S4. The rationale is that the search interfaces used (OpenAlex, Crossref) index metadata without regard to venue quality, so the unfiltered corpus mixes indexed journals with sources that are not indexed anywhere and, in several cases, are listed on community watchlists of predatory publishers.
3.3. Information Sources and Search Strategy
Three complementary source families were searched on 4 August 2026: (i) OpenAlex, an open scholarly index covering major publisher metadata; (ii) the Crossref REST corpus, queried by bibliographic search; and (iii) institutional and subject repositories (including CORE-indexed university portals and eScholarship) used to retrieve author-accepted versions of paywalled reports; in the second retrieval pass (Section 3.4) the OpenAlex location index was additionally used to locate open-access copies of reports already identified. OpenAlex and Crossref were selected in preference to subscription indexes such as Scopus, Web of Science, or IEEE Xplore for two reasons: their application programming interfaces permit fully scripted, openly re-executable queries—so the entire identification stage can be reproduced by any reader without institutional subscriptions—and their publisher-agnostic coverage spans the computing, electrical-engineering, and thermal-engineering venues that this interdisciplinary topic straddles. The trade-off is weaker venue curation than the subscription indexes provide, which was mitigated by the hard topical gate at screening and by full-text adjudication of every candidate report; the possible under-representation of society-published engineering venues is acknowledged as a limitation in Section 5.7. Search strings combined data center terminology with energy-, grid-, and sustainability-related blocks (Table 4). Queries were executed programmatically with quoted-phrase matching, publication-window filtering (2021–2026), and pagination; retraction status was checked against publisher metadata during retrieval, and preprint servers were excluded at source. In PRISMA 2020 terms, OpenAlex and Crossref constitute the database route. The repository search was not an identification source: it was used only to locate author-accepted manuscripts of database-identified reports whose publisher versions were paywalled, and no record entered the review solely through repositories. Table 5 summarizes the sources, access interfaces, filters, and the number of records each contributed.
Table 4.
Core search string blocks (executed as quoted-phrase combinations per source; 34 composite queries in total).
Table 5.
Information sources, access interfaces, filters, and records identified (search date: 4 August 2026).
Why subscription databases were not searched directly. Three considerations, in order of weight, explain why IEEE Xplore, Scopus, and Web of Science were not searched directly. First, reproducibility: Scopus and Web of Science are subscription services whose query interfaces and record sets depend on the institutional license, so a search run through them cannot be re-executed by a reader without the same license, and their terms of use restrict release of the retrieved record set; the OpenAlex and Crossref queries of Table 4 can be re-run by anyone, and the full record-level ledger is released (Supplementary Materials S3 and S5). Second, coverage: OpenAlex and Crossref index publisher-deposited metadata rather than a curated selection, so they already contain the journal records of IEEE, Elsevier, Springer, MDPI, IET, ACM, and the society publishers. Of the 242 included studies, 65 are Elsevier, 52 MDPI, 23 Springer, 10 IEEE journal articles (IEEE Access, IEEE Transactions on Smart Grid, IEEE Transactions on Sustainable Computing, and the IEEE open-access journals of power and energy and of industrial electronics), 6 IET/Wiley, 5 IOP, and 3 ACM—all identified through the two open indexes. Scopus and Web of Science are themselves built from the same publisher metadata; what they add is venue curation and citation indexing, neither of which the identification stage requires. Venue curation was instead applied after inclusion, through the Scopus source-list check of Section 3.2, so that every included study carries a Scopus-indexing tier without the search having been restricted to Scopus-indexed venues. Third, consistency of the search logic: the 34 composite quoted-phrase queries of Table 4 were executed identically against both indexes, which a mixed set of interfaces with different field syntaxes would not have permitted. The residual limitation is stated in Section 5.7: IEEE conference proceedings, which are deposited in Crossref with sparse abstracts, are the records most likely to have been lost at the title/abstract gate (although criterion 6 of Table 3 excludes conference papers in any case), and the 248 reports not retrieved at full text concentrate in subscription titles.
3.4. Selection Process
Figure 2 presents the PRISMA 2020 flow diagram; Table 6 tabulates the same counts together with the retrieval source of every assessed report, and the record-level ledger underlying both is released with the data package. The two databases returned 3415 records (OpenAlex 1389; Crossref 2026); merging and deduplication by digital object identifier and normalized title removed 605 duplicates, leaving 2810 unique records for title/abstract screening. Screening applied criteria 1–4 through a scripted topical gate—a data center term in the title, or in the abstract together with an energy-, grid-, or sustainability-related term—which excluded 2215 records, the large majority being general energy-systems literature retrieved by the energy/grid block (e.g., reviews of hydrogen aviation, wastewater treatment, or generic microgrid control with no data center content), along with preprints and non-research items. All 595 gate-passing reports were sought for retrieval, in two passes. In the first pass (August 2026), 117 were obtained directly as publisher open-access versions; for the remaining 478 the retrieval pipeline found no publisher open-access version at the time of harvest. A repository search (CORE-indexed university portals, eScholarship, and institutional archives) was run for a subset of 100 of these targets and returned 39 files: 19 were author-accepted manuscripts of the intended reports and 20 were incorrect or unrelated documents returned by the resolver, all of which were nevertheless carried to full-text assessment. The first pass therefore assessed 156 reports and recorded 439 as not retrievable. In the second pass (September 2026), undertaken in response to peer review and reported as a protocol amendment (Section 3.1), the DOI of every one of the 439 was checked against the OpenAlex location index; 224 carried at least one open-access location (144 gold, 39 hybrid, 25 diamond, 10 green, and 6 bronze), every one with a working link, and the remaining 215 carried none. All 224 were sought again through the publisher or repository location recorded by OpenAlex; 191 were obtained at full text (184 complete, 7 partial) and 33 were not (23 yielded an abstract only, and 10 no text at all). The second pass changed no search string, no eligibility criterion and no screening decision; it re-sought reports the first pass had failed to obtain, and every report it added was assessed against the same criteria as the original corpus. In total, 347 reports were assessed at full text (156 in the first pass, 191 in the second) and 248 were not retrieved (215 with no open-access location and 33 open-access reports for which no full text could be obtained); the 248 are listed in Supplementary Materials S6, and the census result, retrieval route and outcome for every one of the 439 re-sought reports are released as S9. Of the 347 assessed reports, 105 were excluded: 83 were not data-center-focused or had no energy or grid dimension on close reading (20 of them the incorrect or unrelated documents noted above); 12 were published outside the 2021–2026 window; 4 were duplicate reports of already-included studies, including a translated parallel publication; 3 were wrong or unusable documents; 2 could not have their eligibility resolved from the retrieved text; and 1 was a retracted article (DOI 10.3390/en19030722, identified through its post-publication retraction notice). This yielded 242 included studies—98 from the first pass, 15 of them read from repository versions, and 144 from the second (Table 6). Five further reports whose abstracts indicated eligibility were provisionally included during the second pass and then withdrawn when no full text could be obtained; they are counted among the 33 not retrieved, not among the included studies, and no study in the corpus was classified, clustered or appraised from an abstract alone. Title/abstract screening was performed with the scripted topical gate described above, followed by human adjudication of every excluded full text in the first pass and by large-language-model-assisted adjudication under the same criteria in the second (Section 3.5); given the single-assessor full-text adjudication, borderline cases were resolved conservatively toward inclusion. Because a single assessor performed the full-text adjudication in each pass, no human inter-rater agreement statistic can be reported for this stage; as mitigation, the complete decision trail—the per-record classification of all included studies and the itemized reason for every full-text exclusion—is released in Supplementary Materials S4 and S5, so that each screening decision is externally auditable and contestable. Dual independent human screening was not performed, and the false-exclusion rate of the scripted gate among the 2215 excluded records was not quantified; both remain limitations (Section 5.7). No included study entered the corpus through citation searching alone; all 242 were identified by the database searches.
Figure 2.
PRISMA 2020 flow diagram of identification, screening, retrieval, eligibility assessment, and inclusion. The right-hand column details retrieval in two passes: of 595 reports sought, the first pass (August 2026) obtained 156 (117 publisher open-access versions and 39 repository files, 19 of them usable) and recorded 439 as not retrievable; the second pass (September 2026), reported as a protocol amendment (PRISMA 2020 item 24c), identified open-access locations for 224 of the 439 through an OpenAlex location census and obtained 191 of them at full text. In total 347 reports were assessed and 248 were not retrieved (215 with no open-access location; 33 open-access reports for which no full text could be obtained). Records were identified from databases only; registers were not applicable.
Table 6.
Study flow (PRISMA 2020) by retrieval pass, with reasons for full-text exclusion.
3.5. Data Extraction and Synthesis
For each included study we extracted bibliographic data (authors, year, venue, DOI), study type (modeling/simulation, experimental/prototype, field or case study, survey/review, qualitative), the integration pathway addressed, methods used, quantitative outcomes (energy savings, carbon reduction, cost reduction, flexibility magnitude, coefficient of performance, payback), and reported limitations. Because the corpus is methodologically heterogeneous—spanning reinforcement learning simulations, thermodynamic analyses, mixed-integer dispatch models, interview studies, and techno-economic feasibility assessments—a meta-analysis was neither feasible nor appropriate. We therefore performed a structured thematic synthesis: studies were coded into six mutually exclusive primary clusters (T1–T6, Section 4.1) derived inductively from the corpus—seeded by the research questions and refined over a full-corpus coding pass until every study mapped cleanly to one category—with cross-cutting relationships between clusters analyzed narratively in Section 5. Studies spanning several integration pathways (e.g., joint IT–cooling optimization that also enables heat recovery) were assigned to the single primary cluster constituting their main contribution for counting purposes; their secondary pathways are retained and discussed in the cross-cutting synthesis (Section 5.1), so no multi-pathway evidence is lost to the mutually exclusive counts. Reporting quality was appraised with the five-item rubric described below; the balance between simulation-only and field-validated evidence proved to be the single most consequential quality differentiator across the corpus.
No standard study-level appraisal instrument (e.g., ROBIS, AMSTAR 2, or the JBI checklists) fits this heterogeneous engineering literature, whose designs range from reinforcement-learning simulations to district-heating case studies; a bespoke five-item rubric was therefore constructed and applied to the full text of every included report. Each item is scored 0–2 for a maximum of 10 (Table 7): validation setting, baseline definition, data and code availability, uncertainty reporting, and external validity. Per-study scores are given in Supplementary Materials S4, and per-cluster and per-tier summaries in Table 8.
Table 7.
Quality-appraisal rubric applied to every included study (five items, 0–2 each, maximum 10).
Table 8.
Quality-appraisal summary of the 228 scored studies (of 242 included), by thematic cluster and by venue-indexing tier.
Scientific basis and reliability of the rubric. The five items were not invented for this review; each is a reporting element that established appraisal instruments ask of primary studies. Validation setting and baseline definition correspond to the study-design and comparator questions of the JBI critical-appraisal checklists and to the evaluation-setting distinction of Section 3.8; data and code availability follows the reproducibility criteria of the FAIR principles; uncertainty reporting and external validity map onto the imprecision and indirectness domains of GRADE. The three-level scale (0–2) was chosen so that each item can be scored from the full text against a stated rule (Table 7) rather than by graded judgment. Reliability was assessed for this revision on the 228 scored studies. The five items have a Cronbach’s α of 0.68, at the lower boundary of acceptable internal consistency for a five-item scale, with item–rest correlations of 0.68 (validation setting), 0.52 (baseline definition), 0.50 (external validity), 0.40 (uncertainty reporting), and 0.17 (data and code availability); α rises to 0.73 if the data-and-code item is dropped, which indicates that this item measures a distinct property—openness—rather than the construct shared by the other four, and it is retained for that reason rather than for consistency. Inter-item correlations range from 0.10 to 0.63. The rubric therefore behaves as a short reporting index with two components, not as a unidimensional quality scale, and its totals are used in this review only to rank and stratify studies (Table 8, Figure 3c), never to exclude them. Inter-rater reliability could not be computed, because each study was scored by a single assessor (Section 5.7); the compensating control is that every item score cites the passage of text it rests on (Supplementary Materials S4), so any score can be re-derived and contested.
Figure 3.
Evidence quality across the included corpus. (a) How the 1317 own-result quantitative claims were produced, by evaluation setting; 5% derive from production or field deployment (29 claims with no stated setting are not shown). (b) Reported percentage reduction plotted against evaluation setting for the 207 own-result claims expressed as a percentage reduction, colored by venue-indexing tier; vertical rules mark category medians. Reported magnitude does not fall as validation depth increases. The four studies set aside for integrity in Section 3.9 are excluded from (b). Metrics are heterogeneous (energy, carbon, cost, water) and are pooled only to show dispersion, not to support a pooled estimate. (c) Distribution of the reporting-quality rubric score (Section 3.5) across the four venue-indexing tiers, for the 228 scored studies.
Scoring was applied to the full text of each report by a single assessor in each pass (Section 5.7).
The corpus mean is 4.11 of 10 (median 4) across the 228 studies that could be scored: 27 studies score 7 or above, 122 score 4–6, and 79 score 3 or below (Table 8). Item-level means identify the main weaknesses: validation setting 0.90 of 2 (47 studies score zero, of which 43 contribute no quantitative result of their own and 4 report results without an identifiable evaluation setting), data and code availability 0.51 (126 studies release neither), uncertainty reporting 0.83 (91 studies report none), and external validity 0.73 (90 studies rest on small-scale or synthetic evidence only), against 1.13 for baseline definition. More than half the scored corpus releases neither data nor code, and two in five report no uncertainty of any kind. Mean scores by venue tier—4.44 for the 176 studies in Scopus-active sources, 4.40 for the five in DOAJ-listed sources, 4.36 for the fourteen in sources Scopus has discontinued, and 2.15 for the 33 in non-indexed sources (Table 8; Figure 3c)—agree with the venue-indexing analysis of Section 3.7 and are sharper than in the first-pass corpus, the indexed-to-non-indexed gap now standing at 2.3 rubric points; three quarters of the non-indexed studies score 3 or below against one quarter of the Scopus-active ones. The discontinued stratum no longer scores low, because eight of its fourteen studies are in a single, formerly indexed thermal-engineering title whose discontinuation in 2025 was a publisher-level event rather than a judgment on these articles. Because item 1 scores zero for any study without a quantitative result of its own, the rubric partly reflects study design: the 185 scored studies reporting their own results average 4.90, the 43 that do not average 0.70, and clusters rich in reviews and assessments (T1) score low by construction. The instrument is therefore a reporting-quality rubric, not a risk-of-bias tool. Scores were assigned by a single assessor working from the full text of each report; for the 98 studies of the first pass this was done manually, and for the 144 added in the second pass with assistance from a large language model (LLM) under a fixed rubric prompt, every score citing the passage of full text supporting it and released with it in Supplementary Materials S8. No reliability check across independent assessors was performed for either pass, and dual independent human screening was not performed at any stage; the scores should be read as a structured, auditable reading aid rather than as a validated measurement. Fourteen studies added in the second pass are not scored: their full texts were sufficient for screening, clustering and claim extraction, but the appraisal step returned no usable rubric for them and they were not re-scored. They are counted in the corpus and in the cluster totals but excluded from every appraisal statistic, and are identified in S4.
The fourteen unscored studies. Fourteen of the 242 included studies carry no rubric score [36,37,38,39,40,41,42,43,44,45,46,47,48,49]. They were not excluded by any eligibility judgment: the appraisal step of the second retrieval pass returned no usable item scores for them—the scoring output either failed to cite a supporting passage for one or more items or was not produced at all—and, under the rule that every score must cite its passage, the omission was recorded rather than filled by guesswork. They are distributed across the clusters (T2 five, T4 four, T6 three, T1 one, T3 one); thirteen are in Scopus-active venues; by evaluation setting nine are simulation studies, two analytical models, two reviews, and one a testbed study; and thirteen report quantitative results of their own, which are in the evidence table (S8) and in the synthesis of Section 4. Their effect on the appraisal results is bounded. If all fourteen scored 0, the corpus mean would fall from 4.11 to 3.87; if all scored 10, it would rise to 4.45; imputing each study’s cluster mean leaves it at 4.11. Cluster means move by at most 0.5 points under the extreme assumptions (T2 4.19 to 3.82–4.70; T4 4.12 to 3.77–4.62; T6 4.29 to 4.00–4.67), and the tier gradient of Table 8 is preserved under every assumption (Scopus-active 4.44 to 4.14–4.83 against not-indexed 2.15 to 2.09–2.38). No conclusion of the review depends on where these fourteen studies would fall.
Venue tier per the venue-indexing check of Section 3.2 (Scopus source title list, July 2026 edition, Active/Inactive and discontinued-title fields, checked by ISSN and title on 5–6 September 2026 for the 98 first-pass studies and on 14 September 2026 for the 144 s-pass studies; titles absent from the list checked against DOAJ): 189 studies in Scopus-active sources, 5 in DOAJ-listed sources not in Scopus, 14 in sources discontinued by Scopus, and 34 in sources that are none of these; per-study tiers in Supplementary Materials S4. Fourteen studies are unscored (see text).
3.6. Risk of Bias and Certainty Considerations
Three review-level risks were actively managed. First, retrieval bias, which this review has now measured rather than conjectured. The first retrieval pass failed to obtain 439 of the 595 reports that passed screening, and at that stage the failure was attributed to the absence of any lawful open-access version. That attribution was incorrect. A location census of all 439 DOIs in OpenAlex, conducted on 12 September 2026, found that 224 of them (51%) carry at least one open-access location—144 gold, 39 hybrid, 25 diamond, 10 green, and 6 bronze—with a working link in every case. The failure was a limitation of the retrieval tooling, not of the literature’s licensing. All 224 were sought again and 191 were retrieved, of which 144 met the eligibility criteria. The direction of bias anticipated after the first pass was nevertheless correct, and the effect was larger than expected: the recovered studies fall disproportionately into the thermal and electrical clusters, and their addition moves T4 from fourth place to second and T6 from sixth to third (Section 4.1). The 248 reports that remain unretrieved concentrate in eight subscription titles—Energy, Applied Energy, Energy and Buildings, Energy Conversion and Management, and Renewable Energy among them—so the residual bias is an institutional-access question with a known shape rather than an unknown one. Second, citation-network contamination: the broad energy-block queries returned highly cited but off-topic energy reviews, controlled by a hard topical gate at screening and by full-text adjudication. Third, integrity screening: publisher metadata was checked for retractions and one retracted item was excluded.
3.7. Sensitivity of the Corpus Composition
Because the thematic findings derive from one specific search strategy, source set, and screening threshold, five sensitivity checks were run on the final corpus to test whether the review’s headline structure is an artifact of those choices. The base shares are T2 23.6%, T4 19.4%, T6 18.6%, T1 14.0%, T5 13.2%, and T3 11.2%. First, excluding the partial publication year (the 58 studies from January–August 2026) leaves 184 studies; T2, T4, and T6 remain the three largest clusters in that order, and no cluster share moves by more than 2.9 percentage points. Second, restricting the corpus to the 198 studies that report a quantitative result of their own removes the reviews and assessments and leaves the leading cluster unchanged; T6 rises to second and T1 falls to last, the largest movement being 3.4 percentage points. The direction is informative: T1 is the cluster most composed of secondary and assessment work. Third, restricting to the 98 studies of the first retrieval pass—that is, reproducing the corpus as it stood before the open-access census—returns the first-pass ordering (T2, T1, T5, T4, T3, T6) and moves T6’s share by 10.1 percentage points. This is the retrieval-channel effect of Section 3.6 measured directly, and it is the largest single perturbation in this review. Fourth, restricting to the 148 studies that carry no integrity flag from the full-text verification of Section 3.9 (the four first-pass failures having been resolved, the flagged set is the 94 s-pass studies) preserves T2 as the largest cluster and moves no other cluster by more than 5.5 percentage points, though it reorders the middle of the table. Fifth, venue indexing. Every one of the 242 venues was checked against the Scopus source title list (July 2026 edition) and, for titles absent from it, against DOAJ (Section 3.2): 189 studies appear in Scopus-active titles, 5 in DOAJ-listed titles not in Scopus, 14 in titles Scopus has since discontinued, and 34 in venues indexed by neither. Restricting to Scopus-active or DOAJ-listed sources retains 194 studies (80%) and moves no cluster share by more than 3.1 percentage points, but it changes the leading cluster: T6 (42 studies, 21.6%) edges ahead of T2 (41, 21.1%), with T4 third (34, 17.5%). The eleven non-indexed T1 studies and the sixteen discontinued or non-indexed T2 studies account for the shift; T6, by contrast, is published almost entirely in indexed venues (42 of 45). The 48 studies published in venues that were not Scopus-active or DOAJ-listed at the check date are refs. [1,10,18,25,28,43,50,51,52,53,54,55,56,57,58,59,60,61,62,63,64,65,66,67,68,69,70,71,72,73,74,75,76,77,78,79,80,81,82,83,84,85,86,87,88,89,90,91]; they are also identified in the captions of the cluster evidence tables in Section 4, and the quantitative envelopes reported in Section 4 and Section 5 are drawn from indexed sources unless stated otherwise.
Across the five checks, no ordering statement survives intact. T2 is the largest cluster in the full corpus and in four of the five subsets, and the largest or second-largest in all five; T4 and T6 are second and third in the full corpus and among the three largest in every subset except the first-pass reconstruction. The defensible structural statement is therefore that three pathways—computational demand shaping (T2), cooling and thermal management (T4), and renewables, storage, and integrated energy systems (T6)—together account for 62% of the literature, with no robust ranking among them, and that the dominance of computational research over electrical and thermal integration research, which the first-pass corpus suggested, was an artifact of retrieval: on the enlarged corpus the computational pathway accounts for 23.6% of studies against 32.6% for the thermal pathway (T4 and T5 combined) and 29.8% for the electrical pathway (T3 and T6 combined).
3.8. Evidence Synthesis Across the Corpus
Every quantitative claim in every included report was extracted to a per-study evidence table (Supplementary Materials S8): 1489 rows recording metric, value, unit, baseline, evaluation setting, scale, data source, and a supporting quotation. Each row is marked according to whether the number is the study’s own result or a figure the study cites from elsewhere.
Of the 1489 rows, 1317 are the studies’ own results, and these come from 198 of the 242 included reports; the remaining 44 reports contribute no quantitative finding of their own. A further 172 rows are figures recycled from other sources—several of them, such as the widely cited 40% cooling-energy reduction at Google DeepMind, recur across multiple included reports and would be double-counted by any synthesis that did not separate them. Of the 1317 own-result claims, 865 (66%) derive from simulation, 281 (21%) from analytical models, 81 (6%) from testbed or prototype measurement, and 61 (5%) from production or field deployment, the remaining 29 carrying no stated setting (Figure 3a): between eight and nine tenths of the quantitative evidence in this literature is model output. The enlarged corpus leaves this proportion essentially unchanged from the 98-study first-pass corpus (67% simulation, 5% field), which is itself the most important thing the second retrieval pass established—the scarcity of measurement is a property of the field, not an artifact of which reports could be obtained.
Restricting to the 210 own-result claims expressed as a percentage reduction in energy, carbon, cost, water or a related quantity, and excluding the three that come from the studies set aside for integrity in Section 3.9, the reported magnitude does not decrease as validation deepens: the median reduction is 26% for simulation-derived claims (179 claims from 73 studies), 21% for analytical-model claims (16 from 9), 30% for testbed-derived claims (10 from 6), and 9% for the two production-measured claims (Figure 3b). Claims are not independent—several studies contribute more than one row—and the metrics are heterogeneous, so the comparison shows dispersion, not an effect size. Two readings are available, and both should be stated: either the modeling is broadly accurate, or the reported magnitude carries no information about the strength of the evidence behind it. The corpus cannot distinguish these, because measured reductions on real infrastructure number only twelve and span 1.3% to 66.5%. The lowest of these—a 1.3% carbon reduction from a carbon-aware Kubernetes scheduler evaluated against real grid carbon-intensity data [13]—is the most rigorously evaluated result among those using real grid signals (testbed category; rubric score 7 of 10) and sits an order of magnitude below the simulation median.
3.9. Corpus Integrity
Verification of every included full text against its bibliographic record identified, in the first pass, a small number of retrieval and integrity failures, all but one of which have since been resolved; every action is tagged in Supplementary Materials S4. Two records had resolved to the wrong document—one a university annual report, the other a 2016 policy brief on European corporate research-and-development intensity, neither bearing any relation to the cited title; the correct full texts were re-retrieved from open-access publisher versions, scored, and their quantitative claims extracted into S8. Two records could not initially be read—one a scanned image without a text layer, the other a repository record whose deposited copy is a page-image scan; the first was replaced by the publisher’s open-access full-text rendition and the second was recovered by optical character recognition of its CC BY published version, and both are likewise now scored and represented in S8. One record [50] remains excluded from the synthesis because it presents results inconsistent with its provenance: it reports a twenty-week evaluation across 3200 nodes at two unnamed enterprise organizations spanning three cloud providers, with no named organization, no data-sharing or permission statement, no threats-to-validity discussion, and internally inconsistent section numbering, in a venue that is not indexed; its quantitative claims are excluded from the synthesis (Figure 3b) and are not relied upon in Section 4 and Section 5, while the record itself is retained in the corpus counts (Table 8, Figure 3a) under the original adjudication so that the PRISMA accounting is unchanged. Two further records are flagged for the reader: [51] is published in a repository-typed outlet that sits uneasily with eligibility criterion 2, and [52] carries a DOI registered to a journal whose subject (viticulture) is unrelated to the article, so its indexing status is not relied upon; both are retained under the original adjudication and are included in the list of non-indexed sources in Section 3.7, and removing either would change no cluster ordering. Four further records report values that differ between their own abstract, results, and conclusions; these are retained, with the discrepancy recorded in S8 and the more conservative value used.
The same verification was applied to the 191 reports retrieved in the second pass, and its results are more troubling than those of the first. Ninety-four of the 144 included studies carry at least one integrity flag. The dominant category, appearing in more than thirty studies, is a headline figure in the abstract that the paper’s own results section or tables contradict: among the clearest cases, one study’s abstract reports a “daily operational saving” that its Table 3 shows to be a 31.4% cost increase [92]; another reports a 42.33% increase in green-certificate benefit that its own results text and Table 5 show to be a decrease [93]; a third states a ranking of heat recovery technologies that its own Table 5 reverses [94]. A second category is the unnamed facility: a substantial minority of the case studies identify neither the site nor the operator and decline to release the underlying data. A third, rarer but more serious, is doubtful provenance: two included reports carry reference lists whose entries bear no relation to their subject matter [95,96]; one narrative review contains no quantitative figure, no methods section and a partly unrelated bibliography [53]; and one review shows the uniform, densely enumerated style and untraceable statistics characteristic of machine-generated text [54]. A further report, in which a leaked text-generation instruction appears in place of its limitations section, was one of the two whose eligibility could not be resolved (Section 3.4) and is not in the corpus. Every flag is recorded per study in S4 and, at the level of the individual claim, in S8. Three studies—[53,54,94]—are, like [50] above, set aside from the synthesis on these grounds and are retained in the corpus counts only so that the PRISMA accounting is unchanged; their claims are not relied upon in Section 4 and Section 5 and are excluded from Figure 3b.
These failures were found by reading full texts and could not have been found by screening metadata. That the proportion of flagged studies rose from 4 in 98 in the first pass to 94 in 144 in the second is not evidence that the recovered literature is worse; it reflects a verification procedure that was itself sharpened between passes, and it should be read as a lower bound on what a comparable check would find in the first 98.
4. Results
Reporting convention. Throughout this section every quantitative figure is labeled by the evaluation setting in which it was produced, following the evaluation-setting categories of Section 4.1: simulation (trace-driven, agent-based, or dispatch models with no physical measurement), analytical model, testbed or prototype (a physical system under controlled conditions), and production or field (a measured operating facility). Each cluster synthesis closes with a “Measured versus modeled” paragraph listing the studies evaluated outside simulation, and Section 5.1 restates every headline range with its reference case and setting. Unless a figure is explicitly described as measured, it is a model output; values that reviews compile from other sources are identified as secondary where they appear.
4.1. Corpus Overview
The 242 included studies span 2021–2026 and cluster heavily at the recent end: 17 from 2021, 24 from 2022, 38 from 2023, 39 from 2024, 66 from 2025, and 58 from January–August 2026 alone (Figure 4a). At the 2026 run-rate the corpus would add roughly 87 studies in a full year, against 17 in 2021. The inflection has a clear source: nearly every 2025–2026 study opens with AI training and inference growth as its motivation, where the 2021–2022 papers cited cloud and streaming instead. By theme (Figure 4b, Table 9), carbon- and energy-aware computing is the largest cluster (T2, 57 studies, 23.6%), ahead of cooling and thermal management (T4, 47, 19.4%), renewables, storage, and integrated energy systems (T6, 45, 18.6%), demand and footprint assessment (T1, 34, 14.0%), waste heat recovery and sector coupling (T5, 32, 13.2%), and grid services and flexibility (T3, 27, 11.2%). This distribution differs materially from that of the first-pass corpus, where T2 was followed by T1 and T5 and where T6 was the smallest cluster. The difference is entirely attributable to the retrieval failure described in Section 3.6: of the 144 studies added in the second pass, 36 fall in T6 and 35 in T4, against 24 in T2. Read together with the sensitivity analysis of Section 3.7, the defensible statement is that computational demand-shaping is the single most-studied pathway, not that it dominates the field; the thermal pathway (T4 and T5, 79 studies) is in aggregate larger than the computational one. Methodologically, the evaluation-setting classification (Table 10; see Section 3.8 for the claim-level view) quantifies the validation depth of the corpus: 131 studies (54.1%) rest on modeling or simulation, 36 (14.9%) are assessments or analytical studies, 14 (5.8%) report measurements on a testbed or prototype, 10 (4.1%) report field or production measurement, two each are secondary reviews and qualitative studies, and 47 (19.4%) state no evaluation setting, in nearly every case because they report no quantitative result of their own. Measured evidence of any kind therefore accounts for 24 of 242 studies, just under one in ten, and facility-scale field measurement for one in twenty-four. The enlarged corpus does not change this picture; it confirms it on two and a half times the evidence. Throughout Section 4 and Section 5, claims drawn from the 48 sources that were neither Scopus-active nor DOAJ-listed at the check date (listed in Section 3.7 and identified in the captions of Table 11, Table 12 and Table 13) are reported for completeness; the quantitative envelopes are drawn from indexed sources unless stated otherwise.
Figure 4.
Corpus profile (n = 242): (a) included studies per publication year, stacked by thematic cluster (2026 covers January–August); (b) studies per thematic cluster.
Table 9.
Thematic taxonomy of the included studies (n = 242).
Table 10.
Distribution of the 242 included studies by thematic cluster and primary evaluation setting.
Table 11.
Representative carbon-/energy-aware computing approaches (T2). Refs. [65,66,74] are not Scopus-active or DOAJ-listed at the check date (Section 3.2).
Table 12.
Grid-interaction mechanisms evidenced in T3. Ref. [1] is not Scopus-active or DOAJ-listed at the check date (Section 3.2).
Table 13.
Representative facility-level technologies and reported performance (T4–T6). Refs. [18,25,52,79,88,90,91] are not Scopus-active or DOAJ-listed at the check date (Section 3.2).
4.2. T1: Energy Demand, Environmental Footprint, and Assessment (RQ1)
Demand scale and projections. Estimates of aggregate data center electricity demand differ substantially by system boundary and scenario logic. Koot and Wijnhoven’s system-dynamics model related demand growth to usage drivers rather than simple extrapolation [3]; Katal et al. cite projection envelopes reaching 2967 TWh by 2030 from a 2016 baseline near 200 TWh [4]; Patel et al. note projections in which data centers and networks jointly reach 18% of global electricity by 2030 [5]; while IEA-based figures adopted by more recent studies indicate 415 TWh in 2024 rising to about 945 TWh by 2030 [1,2]. Fan et al. move beyond single-track projections by embedding data center demand within shared socioeconomic pathways, showing that policy and efficiency assumptions dominate long-run outcomes [103]. Crovato and Rosania link AI-era demand to regional sustainability constraints, arguing that cooling burdens and grid congestion are increasingly local problems even when consumption statistics are global [59]. The wide projection envelope is itself a finding: demand uncertainty is now a first-order input for grid planning, and studies that treat demand as endogenous—responsive to efficiency, price, and policy—consistently produce lower and more actionable trajectories than fixed-growth extrapolations [3,103].
Beyond carbon: water, health, minerals. The footprint literature has broadened materially in the review window. Siddik et al. quantified the U.S. data center water and carbon footprint, showing strong spatial mismatch between siting and water scarcity [97]; Mytton documented that data center water consumption—up to 57% potable in surveyed cases—remains under-reported and under-regulated [98]. Sidorkin places generative AI’s per-query impacts (≈4.3 g CO2 and ≈10 mL freshwater per query) in perspective, noting that individual interactions are small but aggregate scaling is not [51]. Gour et al. provide the first dedicated health-implications assessment, using Virginia’s data center cluster to trace pathways from diesel backup generation, noise, and air pollution to community health risk [12]. Stacciarini and Gonçalves widen the lens to critical minerals and geopolitics, framing data centers as material infrastructures whose supply chains carry their own sustainability exposure [102]. Alissa et al.’s life cycle assessment of cloud cooling technologies in Nature demonstrates that embodied impacts and water–energy trade-offs can reorder the merit ranking of cooling options relative to operational-energy comparisons alone [101].
Assessment frameworks and governance. A second strand builds assessment and decision frameworks: data analytics pipelines for HPC facilities [99], data-driven energy management decision frameworks [100], multi-criteria efficiency assessment for national data center fleets [104], and green and low-carbon construction guidance [56]. Country studies for Indonesia [58], India [60], and Brazil [55] document how regulatory maturity, tariff design, and financing determine whether efficiency technologies diffuse. Finally, the organizational literature identifies why technically available efficiency is not adopted: Hanus et al. and Newkirk et al. show through expert and operator interviews that split incentives between IT and facilities teams, risk aversion rooted in uptime culture, procurement cycles, and lack of energy visibility are binding constraints—often more binding than technology cost [6,7]. Romano et al. translate these findings into policy options, from disclosure mandates to utility tariff reform, using Georgia’s rapid buildout as a case [57]. Ewim et al. consolidate the climate-impact evidence and efficiency strategy menu across facility layers [28].
Answer to RQ1. Demand is large, fast-growing, spatially concentrated, and hard to project with confidence. The footprint runs well beyond carbon—into water, health, and materials—and the tightest constraints on mitigation now sit in organizations and governance rather than in the technology itself. That is the backdrop against which the integration strategies of T2–T6 have to work.
Evidence added in the second retrieval pass: methodological families. The fourteen studies added in the second retrieval pass fall into five families, only three of which were present in the first-pass synthesis. The first and largest is analytical emissions accounting, in which demand estimates from third-party sources are combined with grid carbon-intensity data: global and US projections [61], a national projection for China coupled to an east–west relocation policy [108], and a GHG Protocol inventory of a university data center [109]. The second family is new to the cluster and the most rigorous addition: quasi-experimental econometrics on Chinese city panels, using staggered difference-in-differences, spatial Durbin DID, double machine learning and quantile regression to test whether green data center construction and pilot designation raise measured urban energy efficiency [107,111]. The third is expert elicitation and multi-criteria decision analysis: a DEMATEL model of critical success factors for green energy integration [105] and a TOPSIS/VIKOR site-selection study for high-altitude locations [36]. The fourth is metric critique and review, interrogating whether the field’s indicators are fit for purpose [62,106,110], alongside one narrative review that contributes no data [53]. The fifth is instrumentation and prediction: a machine-learning framework for PUE forecasting [112] and a measured facility energy dataset [114]. A qualitative policy paper on grid connection queues stands apart [113].
What the numbers say. The strongest new quantitative contribution is an envelope rather than a point estimate. Working from published demand scenarios and grid carbon intensities, ref. [61] places 2024 global data center operational emissions at 109.2–198.8 MtCO2eq, or 0.26–0.47% of the 41.6 GtCO2eq emitted across all sectors, and projects 315.1–825.7 MtCO2eq by 2030, a 1.6–4.2× increase on 2024 with an average of 2.8×. The value of that study lies less in the range than in its decomposition of the range’s causes. For the United States, where 2024 emissions are put at 64.6–92.2 MtCO2eq, the choice of demand source alone moves the 2030 outcome from a 1.8–4.1× increase (LBNL demand, average CAGR 18.8%) to a 1.5× average increase (EPRI demand, CAGR 6.4%); best and worst cases differ by a factor of six, and the best case is an 8% decrease. Siting matters comparably: emissions across the top ten states vary by 24.8%, or 32.2 MtCO2eq, between the modeled “brown” and “green” growth scenarios. The Chinese national assessment [108] reports data center consumption rising from 161 TWh in 2018 to 260 TWh in 2024, with emissions rising from 104.7 to 142.4 MtCO2, and projects 277, 500 (68% CI 465–535) or 600 TWh for 2030 under conservative, baseline and high-growth assumptions; its policy claim is a modeled 24.2% average emission reduction per kWh in western hubs relative to eastern ones (whose abstract reports a larger 25–40% figure), yielding 20.8–45 MtCO2 of annual savings by 2030 under an annual-average grid assumption (again larger in the abstract). At facility scale, the inventoried university data center totals 404.7 tCO2eq per year, of which 348 t (86%) is Scope 2 purchased electricity and 56.3 t (14%) embodied Scope 3, with no Scope 1 emissions; IT equipment accounts for 222.2 MWh (56%) and non-IT for 177.8 MWh (44%) of annual electricity [109]. These figures are computed from nameplate specifications, not metered. The two econometric studies converge on a positive but modest effect: green data center construction raises urban green total factor energy efficiency by 0.0488–0.0542 against a sample mean of 0.2808 [107], and national pilot designation raises urban energy efficiency by 0.082 with controls and fixed effects, against a mean of 0.3276 [111]. Both attribute the effect chiefly to green technological innovation (coefficients 0.6672 and 0.121), and [111] finds it almost entirely local: direct effect 0.082 against a spillover of 0.005. The expert model in [105] ranks governance and organizational culture the most influential causal factor (net effect 1.351, ahead of investment strategy at 0.637 and workforce readiness at 0.281), with carbon neutrality strategies and renewable energy integration the most prominent but dependent factors (prominence 10.955 and 10.104). Several widely circulated figures in the new reviews—an 8% data center share of global energy by 2030, 6.6 billion m3 of AI-related water demand by 2027—are reproduced from secondary sources rather than derived, and are uncertain [62].
What the new evidence changes. The enlarged cluster confirms the first-pass synthesis’s central claim that the projection envelope is itself the finding, and now supplies the mechanism: [61] demonstrates that the choice of demand source, not of emission factor, generates most of the spread, and that siting and grid decarbonization rates are the dominant levers—Texas decarbonizing at a modeled 4.6% per year against Virginia’s 2.7%. The first-pass synthesis’s claim that the binding constraints are organizational rather than technical is confirmed and strengthened by [105], which places governance and culture upstream of investment, carbon-neutrality strategy and renewable integration in an explicit causal ordering. Two findings qualify the first-pass synthesis. First, the first-pass synthesis treated green data center policy as an untested aspiration; refs. [107,111] now provide quasi-experimental evidence that such policies do raise measured urban energy efficiency, though the effect is small, concentrated in already-efficient cities (rising from a non-significant 0.019 at the tenth quantile to 0.415 at the ninetieth in [111]) and confined to high-demand, high-fiscal-capacity and non-resource-based cities in [107]. Second, the first-pass synthesis treated PUE as the field’s working efficiency metric; refs. [62,110] jointly undercut it, with [110]’s synthesis implying an average PUE of 2.23 from a 44.8% IT share of total power, far above the values usually quoted, and reporting indoor conditions of 15–34 °C and 17–68% RH against an ASHRAE recommended band of 18–27 °C. The frequently cited Google fleet average of 1.10 against an industry average of 1.58 appears in [106] as a reproduced vendor figure, not that study’s measurement. Nothing in the new evidence overturns the first-pass synthesis.
Measured versus modeled. Only one of the fourteen new studies carries an evaluation setting of production or field: [114], which reports 25 m logging at one-minute resolution from June 2018 to April 2022, roughly 21 GB, at a Thai university facility, validated to within about 1 A against clamp measurements. It establishes that the data center accounts for 40% of the whole building’s electricity bill and reports average active power of 10,959.92 W and 6665.48 W for two CRAC units and 6108.42 W and 6531.58 W for two server-room feed channels. No new study reports a testbed evaluation. The PULSE framework [112] is trained on 90 days and over 40,000 rows of genuine operational data from the COMPUTAEX-managed facility, which makes its input measured, but every reported result is prediction accuracy (selected ANN R2 0.9274, MAE 0.0199, RMSE 0.0322) rather than a measured efficiency outcome, and it is classified as modeled here. The measured share of the cluster therefore remains where the first-pass synthesis left it: one facility dataset against thirteen modeled, elicited or reviewed studies.
4.3. T2: Carbon- and Energy-Aware Computing and Workload Management (RQ2)
With 57 studies (33 from the first retrieval pass and 24 from the second), this is the largest cluster in the corpus. Four methodological families run through it.
Reinforcement learning (RL) schedulers. Deep and tabular RL dominates recent work. Actor–critic architectures allocate resources adaptively under load-balancing objectives [65]; SARSA-based frameworks jointly optimize energy and makespan [67,120]; multi-objective deep RL performs carbon-aware spatiotemporal scheduling across geo-distributed U.S. data centers, exploiting the fact that regional grid carbon intensity varies by factors of two to five across hours and locations [8]; and carbon-aware cloud resource scheduling with RL is applied to virtualized fleets [75]. Hybrid approaches combine RL with genetic algorithms for load balancing [70] and with metaheuristics such as gray wolf–cat swarm optimization [74] or enhanced dualist algorithms for VM placement [118]. Reported outcomes cluster around 15–35% energy reduction and 20–45% carbon reduction in simulation, with the caveat—discussed in Section 5—that nearly all evaluations use trace-driven simulators (CloudSim and derivatives) rather than production systems.
Carbon-aware scheduling on real platforms. A smaller but higher-credibility family targets deployable orchestration layers. Piontek et al. implement carbon-emission-aware job scheduling for Kubernetes, shifting flexible jobs toward low-carbon-intensity windows while guaranteeing QoS, and validate against real carbon-intensity signals [13]; Movva extends carbon-aware placement to Kubernetes cluster scheduling [50]; Tantoun demonstrates energy-driven adaptive query scheduling for cloud database systems experimentally [124]; and Haruna et al. deploy an expert green-scheduling system emphasizing thermal-aware job placement [116]. Muraña’s empirical power characterization of servers underpins such schedulers with measured, rather than assumed, power models [115]. Workload-level performance prediction is the enabling layer beneath such schedulers: case-based reasoning has been used to predict and adapt database management system performance to changing workloads [247], the kind of model a carbon-aware database scheduler needs in order to decide which queries can be deferred without violating service levels; this reference is cited as context and is not an included study.
Geo-distributed and renewable-aware orchestration. A third family exploits spatial flexibility. Weng and Li schedule distributed AI training cooperatively across geo-distributed sites according to renewable availability [32]; Miao et al. schedule distributed machine learning tasks across a multi-renewable edge–cloud continuum, jointly minimizing energy and carbon [119]; Tanneru uses federated learning to predict workloads for energy-aware multi-site migration without centralizing operational data [66]; Osnes et al. combine task-usage prediction with latency-sensitivity classification to schedule workloads in wind-powered data centers, showing that latency-tolerant batch work can absorb most wind intermittency [117]; and Alorf schedules energy consumption across edge–cloud hierarchies in smart-grid contexts [63]. Mamodiya et al. make the grid link explicit with a smart-grid-aware cloud framework whose scheduler ingests renewable-generation state [122].
Frameworks, surveys, and green software. Survey and framework studies consolidate the field: energy-utilization management strategies [23], software-level efficiency technologies [4], the green cloud–edge continuum [5], and Buyya et al.’s integrated vision for sustainable cloud resource management [24]. Green software and AI-side interventions include carbon-footprint-aware software frameworks [69], AI for sustainable database management [68], sustainable AI computing combining scheduling with neural network optimization (pruning, quantization) [123], carbon-aware intelligent scheduling [76], AI-driven VM consolidation with renewable-aware scheduling [73], integrated green cloud frameworks [72], security–sustainability co-design [121], carbon-footprint minimization strategy studies [31], carbon-aware HPC scheduling [64], and cryogenic-cooling-dominated quantum data centers as an emerging special case [71].
Measured versus modeled. Of the 265 own-result claims in this cluster, 234 (88%) are simulation outputs, 17 come from testbeds or prototypes, six from a single production deployment, one from an analytical model, and seven state no setting; ten of the 57 studies report no result of their own [4,5,23,31,68,69,70,76,77,124]. The measured evidence is small and instructive. The Kubernetes carbon-aware scheduler of Piontek et al., evaluated on a prototype cluster against the default kube-scheduler with real carbon-intensity signals, reduces emissions by 1.3% (0.37–2.41% across scenarios) [13]. The production deployment reported by Movva attributes a 28.3% carbon reduction per workload unit to a carbon-aware Kubernetes scheduler, but decomposes it into 12.4 points from hardware-aware placement and about 1 point from temporal shifting, with 34% of workload-hours deferrable, 78% of those actually shifted, and a 4.2% completion-time penalty [50]. The two measured figures for the temporal-shifting mechanism—1.3% and about 1 point—thus sit an order of magnitude below the 20–45% simulated carbon envelope, which is obtained on trace-driven simulators that assume unconstrained deferral. The remaining testbed studies measure server power behavior rather than savings: Muraña’s characterization finds a 32% energy reduction from co-locating benchmarks relative to separate execution [115], Lai et al. hold a liquid-cooled server within −15/+10 W of a 260 W target [95], and a measured server power model finds consumption growth slowing above 60% CPU utilization [138].
Answer to RQ2. In simulation, computational demand shaping is repeatedly reported as effective across scheduler designs; documented deployments on real orchestration platforms (Kubernetes, cloud databases) remain comparatively rare (Section 3.8). Reported savings typically run 15–35% for energy and up to 45% for carbon in favorable settings, most of it earned by shifting work into low-carbon hours or moving it to low-carbon regions. Table 11 lays out representative approaches.
Evidence added in the second retrieval pass. The twenty-four studies added in the second retrieval pass enlarge T2 to fifty-seven studies and leave it the largest cluster in the corpus. They fall into five method families, only one of which is new relative to the first-pass evidence. The first is learning-based scheduling. Deep reinforcement learning is applied to joint energy-cost and carbon-footprint optimization in geo-distributed clouds [126] and to carbon-, energy- and SLA-aware virtual machine placement through a deep Q-network [37]; imitation-based optimization is used to learn placement policies from an expert solver [41]; and a systematic literature review of reinforcement learning for data center energy efficiency now maps this family from the inside [131]. The second family is metaheuristic and heuristic consolidation and placement, which the second pass recovered in quantity: ant-colony scheduling under a dynamic power constraint [132], adaptive multi-objective firefly optimization [134], surrogate-guided adaptive swarm optimization [38], decomposition-based multi-objective evolutionary placement [141], threshold- and queuing-based workflow load balancing [39], fault-tolerant energy-aware scheduling [40], greedy-window stochastic optimization [140], and deterministic consolidation or packing heuristics [135,136]. The third family is geo-distributed and renewable-aware orchestration coupled to energy markets and microgrids: renewable-usage maximization across four modeled sites with a wind-forecast front end [125], geographical load balancing priced through financial options [127], distributionally robust co-optimization against renewable uncertainty [128], multi-objective scheduling driven by carbon-intensity forecasts [130], low-carbon dispatch that aggregates fragmented server resources inside a data center microgrid [133], and inter-continental load balancing between three microgrid-backed sites [139]. The fourth family is thermal- and hardware-aware placement [95,137]. The fifth—new to the cluster—is measurement-based power characterization, represented by a power-data generation and prediction framework for edge servers [138] and, more loosely, by a vision paper arguing for carbon-aware datacenter software [77].
What the numbers say is, once again, almost entirely what simulators say. Against each study’s own heuristic or metaheuristic comparators in trace-driven simulation, energy reductions cluster in a 7–28% band: 17.2% for ant-colony scheduling against a power-constrained genetic algorithm over thirty modeled data centers on the Google trace [132], 27.9% for surrogate-guided swarm placement against its strongest baseline over 1000 modeled VMs in CloudSim-Plus [38], 22.39% against DVFS and 8.83–16.50% against five consolidation heuristics on PlanetLab traces with 800 simulated hosts [135], 19.51–25.1% against particle swarm optimization on 100-node synthetic workflows [39], and 7–35% across six comparators on 100 simulated hosts [41]. Values outside that band come from weak baselines: 55% against round-robin on a 1536-server simulated three-tier topology [40], and 38.08% in a scenario study whose authors state that all evaluation data are synthetic [129]. Carbon reductions in simulation run from about 17.5% to 31.4% against the strongest available comparator [38], with 25.3% reported against a cost-optimal scheduler over a modeled 150-server, three-region, ninety-day window [130] and 48.4% carbon-trading reduction reported for spatiotemporal load balancing across three modeled Chinese sites [128]—although that study’s in-text scheme comparison gives 9.4% and 39.0% carbon-trading reductions for temporal-only and spatial-only migration, respectively, and its headline figures are not traceable to those tables. Renewable-utilization figures are the most consistent quantity in the cluster: 73.11% for the proposed placement variant against the authors’ own five variants [125], 72.19% against 59.16% for the best external comparator [126], and a system-wide renewable fraction rising from 31% to 38% in an annual three-site simulation [139], whose abstract headline of “up to 22%” refers only to the Perth microgrid. The complementary framing—brown energy displaced rather than renewable absorbed—gives 5.67–13.22% against four baselines at similar total energy [126]. Where carbon is forced rather than optimized, the cost penalty becomes visible: raising a mandated green-power share from 20% to 80% in a single-site microgrid dispatch cuts emissions by 73.3% while raising operating cost by 37.7% [133]. Carbon-intensity forecasting, the enabling layer for all of this, is reported at a median MAPE below 4.5% at twelve hours and below 6.8% at twenty-four hours across three grid regions [130], though that study’s two tables disagree on the twenty-four-hour values. Claims reported only as figure-level orderings [136,141] or relative rankings [37] yield no defensible magnitudes and are treated as uncertain.
The enlarged cluster confirms rather than overturns what the first-pass synthesis concluded. The first-pass synthesis put reported savings at 15–35% for energy and up to 45% for carbon, and noted that nearly all evaluations were trace-driven simulations in CloudSim and its derivatives. The new evidence sits squarely inside that envelope, and the review of the reinforcement-learning subfield independently reports that CloudSim or WorkflowSim was the platform in approximately 50% of its sixty-five included studies, that around 98% of the algorithms used were model-free, and that only one of fourteen cooling studies was implemented on a real data center [131]; its wider observation that primary studies report improvements from 1 to 3% to over 60% is a characterization of that literature, not a result of its own. Three points are qualified rather than confirmed. First, the geo-distributed pathway is now shown in simulation to be self-limiting once transmission is priced: charging data-network transmission at 5000 and 1000 FLOPs per byte raises system cost by 6.0% and 11.0% and raises carbon-trading emissions from 96.4 t to 107.8 t and 121.8 t, respectively [128]. Second, spatial reallocation is not the dominant lever it is often presented as: between-site reallocation is estimated to explain about 40% of the emissions gains in a three-site federation, the remainder coming from temporal reshaping and frequency scaling [130]. Third, the trade-offs are quantified more honestly than in the first-pass synthesis’s evidence base, with SLA violations, migration counts, server start-ups and solver runtime reported alongside savings [126,130,132,135], and with schedulers shown to hold mean tardiness within 2.6% of a cost-optimal policy [130] and SLA violation at 0.2% [125] in simulation.
Measured evidence remains the binding scarcity. Of the twenty-four new studies, two carry an evaluation setting other than simulation, and none is a production or field deployment. A liquid-cooling energy management system is evaluated on a five-server testbed, holding server power to a maximum of 270 W and a minimum of 245 W around a 260 W target (whose abstract instead reports control “within 260 W”), with model-estimator error below 2.4% and average test delay of 268 ms [95]. A power-data generation framework instruments a single Intel Xeon dual-core server across twenty-five repetitions per utilization point, establishing that power rises almost linearly with CPU utilization up to 60% and more slowly above it, that CPU and memory dominate while disk and network I/O matter less, and that a multiple linear regression power model reaches 10.00 W validation MAE and 0.78 W on the Sysbench testing set [138]; its own scheduling experiment, by contrast, is simulated and unquantified. Everything else in the enlarged cluster is modeled.
4.4. T3: Grid Services, Demand Response, and Flexibility (RQ3)
Flexibility characterization. Zhu et al. quantify the spatiotemporal load migration potential of data center fleets, formalizing the adjustable characteristics conferred by task delay tolerance and geographic distribution and demonstrating their use in power system operation [30]. Zhang S. et al. embed a data center “energy-consumption elastic space” into power-system operational reliability assessment, showing that ignoring data center flexibility biases reliability indices [145]. Nautiyal reframes the sustainability problem as a peak-load problem: with AI growth, coincident peak contribution—not annual energy—is the binding constraint, which elevates flexibility from cost optimization to system necessity [1].
Service provision mechanisms. Al Kez et al. establish that data center UPS fleets and controllable IT load can provide fast frequency response in synchronously isolated, wind-rich systems, where inertia scarcity makes such services most valuable [15]. Jahanshahi et al.’s PowerMorph reshapes server power for regulation service provision while containing QoS impact, demonstrating market-grade granularity from the server level [33]. Zhang Y. et al. co-design energy storage sizing and optimal dispatch to unlock flexibility under progressive loading [17], and Crozier’s review consolidates evidence that data centers can provide meaningful balancing services, while cautioning that demonstrated commercial deployments remain scarce relative to modeled potential [16].
Market and multi-actor coordination. A distinctive Chinese literature examines coordination between data centers and electricity retailers: cooperative-game-based coordinated scheduling [142] and frameworks in which several retailers jointly implement demand response toward distributed data centers [144], both showing bill and system-cost reductions when flexibility is contracted rather than assumed. Saleem et al. integrate IoT- and cloud-based smart energy management for demand-side management, positioning the data center as both enabler and participant of DSM [143]. Fridgen et al. provide the economic keystone: temporally flexible, energy-intensive computing can promote renewable expansion by monetizing otherwise-curtailed generation and dampening price volatility [14].
Answer to RQ3. The mechanisms on record span temporal shifting, spatial migration, server power reshaping, UPS and storage dispatch, and market-mediated demand response. What the models promise is substantial—regulation and fast-frequency products, peak reduction, congestion relief. What the field has delivered is much less: revenue-generating deployments remain the exception, and in this cluster the gap between simulated capability and documented deployment is the widest in the corpus. Table 12 summarizes the mechanisms and the evidence behind each.
Evidence added in the second retrieval pass. The sixteen new studies fall into six method families. The largest is network- and market-level optimization on standard test systems: Stackelberg co-optimization of distribution system operator revenue against virtual power plant cost [42], risk-aware scheduling of coupled power–computing–network–storage systems [158], spatial–temporal dispatch of data center buildings in a 33-bus network coupled to multi-energy hubs [152], source–grid–load resilience scheduling on the IEEE 33-bus and PG&E 69-bus feeders [155], and stochastic market clearing under data-center load uncertainty [154]. A second family treats pricing as the flexibility instrument, deriving time-varying data-service prices that translate market signals into workload decisions [150]. A third family, absent from the first-pass evidence, studies data centers as a dynamic disturbance rather than a resource: electromagnetic-transient analysis of grid-forming storage supporting a hyperscale site through load trips and UPS reconnection [153], and deep reinforcement learning applied to load-side resonance forcing on the IEEE 39-bus and WECC 179-bus benchmarks [159]. A fourth performs probabilistic capacity-expansion and resource-adequacy assessment of ERCOT to 2050 under data-center-driven load growth [156]. A fifth is trace-driven characterization of workload deferability from production scheduler logs [147]. The sixth comprises reviews and policy analysis with no evaluation of their own [78,146,157] and a survey coupling literature synthesis to bench measurements of single accelerators [149].
On the quantity of flexibility available, the most informative new figure is empirical rather than assumed. Using a one-week Alibaba GPU trace covering approximately 6742 GPUs, ref. [147] finds that low-latency tasks make up 94% of the workload and about 79.4% of power, leaving more than 20% of estimated GPU-side power attributable to deferrable tasks; in simulation of three market products, peak deferrable energy reaches 22.08% of window energy under a three-hour window with 60 min notification, 27.8–33.1% at peak points under a four-hour intraday window, and only 10.84% under a one-hour mFRR window with 15 min’ notice, with hourly yields of 2.17, 2.51 and 0.50 kWh/h and rebound energy of 1.4–4.4%. The flexible fraction is therefore conditioned on notification time, and the fastest balancing products capture the least. Economic gains from market-coordinated flexibility, all simulated, sit in a consistent band: an 11.2% reduction in data-center energy cost from a time-varying data-service price against a fixed price, with renewable accommodation rising from 75.2% to 82.8%, and to 85.1% at five price levels [150]; an 18.9% increase in distribution system operator revenue and more than 28% reduction in virtual power plant operating cost against a static-pricing baseline, falling to 8.1% above baseline once wind uncertainty is sampled [42]; and a fall in day-ahead microgrid operating cost from $24.71k to $24.15k against a fixed-price case [154]. At network level, ref. [152] reports a 10.527% cut in total operating cost and a 12.367% cut in peak apparent power against equal load distribution between data center buildings, but the same case raises network losses by 12.290%, so the benefit is one of peak and cost rather than efficiency. Curtailment outcomes are the strongest simulated claim in the cluster: [158] reports expected curtailment falling from 176.939 MWh to 0 MWh per day, and its CVaR from 694.085 MWh to 0 MWh, against a fixed-load data center on the IEEE 39-node system. For resilience, ref. [155] shows workload scheduling alone cutting unserved energy from 2772.76 to 2198.55 kWh on the 33-bus system and by 56.19% on the 69-bus system, where the load loss rate falls from 36.72% to 3.78% with mobile generators and islanding and to 0.31% once task migration is added.
Three results qualify the flexibility narrative by treating data centers as a system risk. In EMT simulation of a 1.1 GW facility on an 8 GW synchronous system, tripping the data center drives frequency to 61.22 Hz without storage, 60.86 Hz with a 400 MW grid-forming ESS and 60.55 Hz with 800 MW, while UPS reconnection produces a nadir of 54.33 Hz without storage, raised to 58.16 and 59.77 Hz, respectively [153]. In full-model simulation, deliberate load modulation of 200 MW produces peak local frequency deviations of only 0.042 Hz on the IEEE 39-bus and 0.044 Hz on the WECC 179-bus system, 1.20 and 2.20 times the random-modulation baseline, and stays below 0.07 Hz even at 300 MW, far below under-frequency load-shedding thresholds [159]; its headline 0.92 Hz figure comes from a reduced-order environment its authors concede is an order of magnitude above the full-model result. At planning scale, ref. [156] projects 10 GW of additional ERCOT data-center load by 2030 under its Base scenario against 35 GW under its High scenario, with 2030 loss-of-load expectation of 0.18 events per year against the NERC reference of 0.1 and 82% of unserved-energy hours falling in winter months.
The enlarged cluster confirms rather than overturns what the first-pass synthesis concluded. The first-pass synthesis held that the gap between simulated capability and documented deployment was the widest in the corpus; fourteen of the sixteen new studies are simulation, review or policy analysis, the two exceptions being a one-hour cluster experiment and one 40-server facility. It qualifies the first-pass synthesis in three ways. First, deferability now has an empirical ceiling of roughly a fifth to a third of window energy, and only where notification exceeds an hour [147], whereas the first-pass synthesis treated temporal shifting as open-ended. Second, the cluster’s center of gravity has shifted from flexibility provision to interconnection risk, adequacy and dynamic stability [78,149,153,156,159], a framing barely present in the first-pass synthesis. Third, the only quantified field response magnitudes in the new material—a 949 kW UPS swing in 30–40 ms at a Norwegian pilot, and 10 MW of FCR-D from server shutdown within one second at a Swedish site—reach the review through a secondary source [146] rather than a primary report, itself evidence for the first-pass synthesis’s conclusion.
Measured evidence remains scarce: only refs. [148,151] evaluate outside simulation. Ref. [148] runs an HPC cluster testbed and measures a 25% electricity cost reduction ($190.4 with participation against $253.8 without) over a one-hour regulation-service experiment, while meeting QoS constraints that a published prior policy misses. Ref. [151] instruments a 40-server, 36.2 m2 facility and measures a summer PUE averaging 1.69 with a maximum of 1.72, falling to 1.40 mid-season under free cooling, with server power of about 10.0 kW rising to 11.5 kW in working hours; its two demand response events yield 11.5 kWh and 3.6 kWh of electricity reduction, 26.8% and 31.1% of cooling load, for a maximum indoor temperature rise of 0.1 °C, though its counterfactual is a calibrated TRNSYS model, not a measured control period. The bench measurements in [149]—a Tesla T4 drawing a sustained 61.2 W with 87.0 W peaks in training, and ramping sub-second from 25.7 W idle to 91.0 W peaks in inference—are genuine, but characterize accelerators, not a facility interacting with a grid.
4.5. T4: Cooling and Thermal Management (RQ4)
Cooling is both the largest non-IT load and the gateway to grid and heat integration. Three technology waves are visible in the corpus. First, optimized air and chiller systems: Kumar et al. apply machine learning to PUE optimization through temperature management [160]; Yu et al. build refrigeration-equipment models for cooling-station control [162]; Gibbons et al. perform techno-economic and sustainability comparison of cooling options for Irish facilities, where free cooling and heat resale materially change the economics [10]. Second, liquid and immersion cooling: Zhang et al. review cold-plate liquid cooling for high-density racks [34]; Pambudi et al. experimentally evaluate single-phase immersion cooling with two dielectric fluids, reporting substantial cooling-energy savings [161]; Şen et al. survey sustainable cooling techniques and innovations, emphasizing the shift to liquid technologies as AI rack densities exceed air-cooling limits [25]; Vora tracks the co-evolution of cooling strategy with next-generation workloads [81]. Third, system-level co-optimization: Gupta et al. couple workload management with cooling through combined energy–exergy–computing efficiency metrics [29]; Hu et al.’s critical review of joint IT–cooling optimization establishes thermoelectrical coupling as the correct system boundary and inventories evaluation metrics across the whole process [18]; Yang and Tang map the rapid growth of AI-enabled cooling optimization [52]; and Chauhan explores geothermal integration for carbon-neutral, AI-optimized cooling [79]. Shah and Vora synthesize the convergence of IT innovation, efficient cooling, and renewable power in green data center design [80].
The cluster’s headline quantitative claims are consistent: cooling consumes from under 10% (efficient hyperscale) to over 30% (legacy) of facility electricity [1,18]; liquid and immersion cooling can cut cooling energy substantially while enabling heat recovery at useful temperatures (Section 4.6); and AI-based control reduces cooling energy in the 15–40% range in reported vendor deployments and simulations, the upper bound being a vendor-reported figure [52,160]. The key structural insight is that cooling choices precondition both grid flexibility (thermal inertia as implicit storage) and sector coupling (outlet temperature determines heat-reuse value) [18,25,88].
Evidence added in the second retrieval pass: methodological families. The thirty-five studies added in the second retrieval pass turn a twelve-study, largely review-based cluster into the corpus’s most methodologically differentiated theme, and fall into six families. The largest is component- and room-scale computational fluid dynamics, applied to immersion-cooled server internals [165,166,172], to heat-exchanger cores and fins [83,187], and to room airflow organization, containment and cabinet modeling [85,177,178,180]. The second is whole-system annual energy simulation driven by hourly weather files, using TRNSYS, EnergyPlus or DesignBuilder to estimate PUE, COP and free-cooling hours across climates [45,46,82,84,163,168,173,176]. The third is machine learning for thermal prediction and control, spanning LSTM-driven predictive control [171], digital-twin reinforcement learning on a prototype [44], temperature twinning in an operating room [183], gradient-boosted load forecasting [184] and multi-agent reinforcement learning for joint IT–cooling scheduling [186]. The fourth is analytical thermo-economic and life-cycle cost modeling, applied to cabinet hydraulics [169], coolant selection [166], nanofluid concentration [172], retrofit payback [84,96] and evaporative condensing [182]. The fifth, and the one of which the first-pass synthesis had only a single example (Pambudi et al. [161]), is instrumented experiment and field monitoring [44,82,86,174,175,181,182,183]. The sixth is narrative review, contributing compiled rather than original values [43,167,170,179,185].
What the numbers say. The free-cooling and economizer evidence now supports a reasonably firm simulated envelope. Across fourteen Asian cities and 121 cases per system type, annual PUE for economizer-equipped facilities ranges from 1.16 to 1.43, with evaporative cooling adding a 0.02–0.05 PUE reduction in dry zones, indirect air-side economization improving on direct by 0.03–0.07 in wet zones, and cooling energy in climate zones 7–8 falling 60–70% against a no-economizer baseline [173]. Simulated retrofits from air-cooled CRAC to chilled-water free cooling give the largest savings in the cluster: for a 1814-rack Nanchang facility whose 2021 cooling consumption of 18,310 MWh was metered by the owner, modeled plans cut cooling energy by 63.19% and 64.54% and PUE from 1.64 to 1.299 and 1.291, with dynamic paybacks of 2.02–5.6 years across five Chinese climate zones [84]. Indirect evaporative units are simulated at 39.41–57.46% saving against precision air conditioners, moving from Shanghai to Urumqi, with annual unit COP of 5.42–7.34 [45]. A combined free-cooling, storage and heat recovery system in Guangzhou is simulated at 16.4% overall saving and PUE 1.36 to 1.30, with natural cooling covering 28% of demand but only 9% of annual hours fully [163]. Pump and airflow control contribute less: 18.15% average annual pump energy against a fixed-frequency baseline [176], and 20.1% for adaptive terminal devices measured against the alternative of lowering supply air temperature by 2 K [180]. Solar absorption chilling is climate-bound, delivering approximately 850 MWh/year in arid climates but only 200–400 in cold humid ones for a 105 kW nominal load, at mean annual COP of 0.70–0.75 and 0.40–0.55, respectively [168]; its water-saving figures are internally contradictory and should not be cited. Liquid and immersion cooling are evaluated almost entirely at component scale. Single-phase immersion is simulated at system PUE of 1.039–1.150 across five world regions, against a literature air-cooled reference of 1.49, with hydrocarbon coolants reducing life-cycle cost by 76.7–90.7% relative to fluorocarbons [166]. Server-internal redesign lowers simulated maximum CPU temperature by 12.5 °C at 120 W [165], while nanofluid additions yield at most about 3 K at Re = 200 and raise pressure drop by about 600% at 4 vol.%, so that the cost-optimal coolant in that study remains plain water [172]. A cylindrical Diamond-TPMS heat exchanger reaches a simulated 140.13 W/cm3 volumetric heat transfer rate at Re = 100,000, against 5–20 and 20–70 W/cm3 for the plate exchangers cited from the literature [83]. Control-side claims are wide and mostly simulated: 37.5% cooling energy reduction and PUE 1.48 to 1.30 against PID control, with cumulative hotspot duration above 27 °C falling from 48 to 2 h over four months [171], and 32.30% cooling and 16.42% total energy reduction for multi-agent reinforcement learning, though that study does not state its baseline clearly [186]. Figures of 55.7% fan-energy reduction, 12–50% fan power and 13.18% cooling energy appear in the new reviews [43,170] but are attributed to cited studies, not obtained by the reviewing authors; reviews likewise compile, rather than measure, PUE of 1.1–1.2 for cold plate and 1.09 for single-phase immersion [167], and field PUEs of 1.08 and 1.1 for two named facilities [179].
What the new evidence changes. The first-pass synthesis asserted that AI-based control reduces cooling energy in the 15–40% range, with the upper bound vendor-reported. The enlarged cluster confirms that range for simulated control—32.30% [186] and 37.5% [171] sit inside it—but qualifies it sharply at the measured end, where the only field-evaluated AI control reports a 2.6% PUE and 2.5% WUE reduction against a vaguely specified conventional baseline [183]. The gap between 37.5% simulated and 2.6% measured is the single most important new datum in this cluster. The first-pass synthesis’s claim that liquid and immersion cooling cut cooling energy substantially is confirmed in direction and now quantified, but every immersion figure in the enlarged cluster is simulated or analytical [165,166,172]; no new study measures an immersion facility. Conversely, the new field evidence overturns nothing but relocates the achievable gain: modernized chiller plant with dedicated control delivered a measured annual COP of 8.63 against 4.12 before modernization at the same site [174], and a measured 69% COP increase with 2064 additional free-cooling hours at the same operator’s facility [181]—improvements of the order simulations predict, but realized through hardware replacement confounded with control change. The most consequential qualification concerns free-cooling capture. The field data show a 59-day gap between the 188 days at which outdoor conditions permitted free cooling and the 129 days actually achieved, costing 92 MWh, or 12% of the 800 MWh annual cooling consumption [174]. Simulated free-cooling hour counts should therefore be read as upper bounds. Finally, the first-pass synthesis’s structural insight that cooling choice preconditions heat reuse is reinforced: the Guangzhou combined system recovers a simulated 3.57 million kWh/year of waste heat to deliver 4.587 million kWh/year of heat [163], linking this cluster to Section 4.6.
Measured versus modeled. Eight of the thirty-five new studies carry an evaluation setting of testbed or production/field, and they are the cluster’s evidential core: [44,82,86,175] on testbeds and [174,181,182,183] in production. Several further studies validate simulations against measurement without themselves being measured studies—on-site outlet temperature within 0.14 K [177], field airflow within a 4.28% mean relative error [178], nine-point temperature deviations below 5% [85], about 1 K against field thermocouples [180], and rig deviations of 6.4% in volumetric heat transfer for the Gyroid and Schwarz structures, though not for the Diamond geometry carrying the headline results [83]. The metered 2021 baseline in [84] is measured; everything built upon it is modeled.
4.6. T5: Waste Heat Recovery and Sector Coupling (RQ4)
Waste heat recovery yields the corpus’s most consistently positive results. Review evidence establishes the technology menu—heat pumps, organic Rankine cycles, absorption systems, direct reuse—and the decisive role of capture temperature [21,22,26]. District heating is the leading pathway: Jürgens et al. show that data center waste heat can cover a large share of the heat demand of existing districts in Frankfurt [20]; Pakere et al. evaluate national-scale potential in Latvia, then extend it with dynamic modeling of temporal matching between heat supply and district demand [87,193]; Yuan et al.’s dedicated review consolidates design rules for feeding fourth-generation district heating networks [21]. Campus- and building-scale studies demonstrate decarbonization of university campuses in Mediterranean climates [191] and deep-decarbonization designs coupling liquid-cooled data centers with building space heating [190]. System-design studies broaden the option space: Ljungdahl et al. provide a decision-support model combining liquid cooling with phase change materials [188]; Al-Sayyab et al. analyze a PV/T-driven compound ejector–heat pump delivering simultaneous data center cooling and district heat with low-GWP refrigerants [189]; Cai et al. quantify energy, economic, and environmental performance of heat recovery from liquid-cooled facilities [88]; and Yoon et al. demonstrate an unconventional but replicable reuse: AI data center waste heat improving smart-farm heating performance [194]. Terenius et al. add a material-social perspective, proposing novel uses (commodity dehydration, storage) and metrics that value heat reuse beyond simple energy accounting [192].
Reported performance in the modeled and case-study evidence is strong where temperature and distance align: heat pump COPs in the 3–6 range for lifting 30–50 °C server heat to 60–80 °C network temperatures, double-digit percentage reductions in district-network fossil input, and payback periods frequently under a decade in European heat markets [20,21,88,189,190]. The binding constraints are institutional—heat off-taker contracts, network access, and seasonal mismatch—rather than thermodynamic [20,87,192].
Evidence added in the second retrieval pass: methodological families. The nineteen studies added in the second retrieval pass more than double the cluster and fall into five families. The largest is the district-heating techno-economic case study, in which an hourly dispatch model of a network is built, a data center added as a heat source, and scenarios compared against a no-recovery baseline [195,198,199,200,201,205,206,210]; these span campus to city scale and four network generations. A second works at the thermodynamic cycle: high-temperature heat pump configurations and refrigerant screening [203], an ejector-expansion heat pump for low-temperature networks [210], an adsorption-chiller retrofit paying back in a modeled 285 to 379 days [208], and a combined cooling-and-power cycle driven jointly by geothermal heat and a liquid-cooled return loop [202]. A third addresses the mismatch between a constant source and a seasonal demand through storage design and control: borehole storage and water tanks [195,199], seasonal thermochemical storage [200], a computational-fluid-dynamics-optimized latent-heat device [89], and a revenue-based dispatch strategy [207]. A fourth screens and ranks rather than designs: waste-to-energy corridors for AI campuses, twenty-six building types, and an analytic hierarchy process with a practitioner survey [94,197,211]. A fifth explores couplings beyond district heat: a biomass and anaerobic-digestion nexus in a rural microgrid [209], and thermal-aware workload allocation in an edge facility [204], the cluster’s only experimental study.
What the numbers say. The most useful synthesis across the new simulations is that the share of network demand a data center covers is governed by the source-to-network capacity ratio, not by the recovery technology. All against no-recovery baselines, the modeled envelope runs from 3.0% of annual demand for a 500 kW facility on a 9.3 MW city network in Varna [200], through 9% rising to 26% by 2030 for a planned 21 MW facility on the roughly 500 GWh/a Seinäjoki network [198], to 12.5% for a 100 kW and 58.6% for a 500 kW facility on the same 14,488 MWh Calenzano network [205], and 69–74% at the Göttingen north campus, plus 21–25% more with borehole storage [195]; Kera reports 38.8% with heat pumps and 9% without [210]. Instantaneous coverage runs far higher, ref. [200] reporting 22.4% of load at that 3.0% annual share. Economics divide by temperature grade and by scale. At Göttingen the levelized cost of heat falls from 124 to 88 EUR/MWh as the design supply temperature falls from 120 to 48 °C, against a district heating price of 145.2 EUR/MWh [195]; at HPC Bura, modeled fifth- and fourth-generation integration pays back in under a year on EUR 15,000–20,000 while third-generation integration needing high-temperature heat pumps takes 14 years on EUR 110,000–140,000, at modeled primary energy and CO2 savings of 88%, 86% and 68%, respectively [206]. One framework has a 100 MW facility in Espoo discounting back in seven years while a 21 MW facility in Seinäjoki never recovers within its 25-year lifetime [201]. Carbon results are positive but need their counterfactuals stated. A simulated 1 MW high-temperature heat pump on Frontier’s waste heat avoids 33,100–33,200 tCO2 a year, 85.4–85.6% of the 38,700 tCO2 attributed to an equivalent gas boiler [203]. Seinäjoki is the corrective: at least 69% of that network’s 2019–2030 emission reduction comes from biomass boilers, an electric boiler and storage without any data center, and the largest increment attributable to the waste heat is 9.8 ktCO2 a year, or 16% [198]. The counter-entry is electricity. Storage raises campus electricity use by 12% for a water tank, 30% for borehole storage and 40% for both [199]; heat pump electricity at Göttingen is 2.2–4.6 GWh/a for high-temperature against 0.8–1.7 GWh/a for low-temperature supply, needing 0.5–2.8 MW of extra grid capacity [195]; and the integrated heat pump EER falls to 0.6–2.6 against 4.5–13.0 for the non-integrated plant [205]. The quantitative claims in [94] are unsourced and of low confidence, and its “up to 25 and 30 percent” savings are taken from reviewed cases, not measured there; none should be carried forward.
What the new evidence changes. The enlarged cluster confirms the first-pass synthesis’s judgment that waste heat recovery is the corpus’s most consistently positive pathway and that capture temperature is decisive, and it now quantifies that gradient in cost and efficiency terms [195,205,206]. It qualifies the district heating emphasis in three ways. First, the coverage figures the first-pass synthesis read as evidence of a large share of district demand follow from the source-to-network ratio: the same technology yields 3.0% or 58.6% on that ratio alone [200,205]. Second, the first-pass synthesis did not price the electricity counter-entry; recovery shifts load onto the grid, substantially where storage is used [195,199,200]. Third, the first-pass synthesis named the barrier as institutional only in general terms, whereas [201] quantifies it as a market artifact: roughly 2900 h a year in Espoo and 2000 in Seinäjoki when selling waste heat would be profitable for the operator while the network declines to buy it, and a Finnish electricity tax class that alone moves the recovered share from 60% to 66% and from 56% to 63%—the corpus’s clearest quantification of the split-incentive problem the first-pass synthesis identified qualitatively. Two new couplings extend the option space without yet being demonstrated: waste-to-energy plants supplying grade-matched absorption cooling, modeled at 116.9–264.4 MW of net grid relief for a 1 GW campus but needing 3 to 148 plants [197], and anaerobic-digester coupling modeled to cut PUE from 1.73 to 1.24 and operating cost by 37.4% (whose abstract reports 36.06%) [209]. Nothing here overturns the first-pass synthesis.
Measured versus modeled. Only one new study carries a testbed setting: [204], whose conjugate heat transfer model of a single-rack building-integrated edge facility is validated against measured water outlet temperatures from four tests at 2.2–3.5 kW, at a maximum error of 10.37% and RMSE of 1.44 °C. Its headline results—up to 17.1% more recovered heat than random workload allocation and up to 53.2% cooling-load reduction from flow optimization—are simulation outputs of that validated model, not measurements. Four further studies carry measured facility data inside otherwise modeled work. Ref. [196] reports twelve months at the NREL ESIF HPC data center: a mean annual liquid-cooled return temperature of 36.6 °C, a monthly standard deviation always below 1 °C, and roughly 1 MW of recoverable heat—the cluster’s only measured evidence that liquid cooling delivers a stable, high-grade source. Ref. [203] characterizes Frontier at ORNL over twelve months: 2–14 MW of waste heat in 151–378 kg/s of coolant removing 97–99% of it. Ref. [199] uses measured 2017–2018 campus data to establish the seasonal mismatch it then addresses, and [206] calibrates to hourly 2023 measurements at a normalized mean bias error of 1%. The cluster rests on one testbed and four partially measured facilities against fourteen wholly modeled studies; every figure above is simulated or analytically derived unless identified here as measured.
4.7. T6: Renewable Integration, Storage, and Integrated Energy Systems (RQ4)
The final cluster treats the data center as an energy hub. Microgrid dispatch studies apply stochastic model predictive control to data center microgrids under renewable and workload uncertainty [213] and jointly optimize operational cost and carbon across multiple data center microgrids under carbon taxation [214]. Wang D. et al. schedule a data center with energy nets including combined cooling, heating, and power (CCHP) and demand response [212]; Yang D. et al. generalize to a computing–electricity–cooling–heating coupled system optimized for economy, flexibility, and user satisfaction [19]. Wang Y. et al. consolidate the data center integrated energy system (DC-IES) concept—generalization, approaches, methods, and perspectives—as the cluster’s reference framework [27]. Asset-level studies cover deep-learning-based battery energy storage scheduling against real-time market signals and AI load forecasts [90], hybrid PV–BESS–UPS–grid–diesel architectures for medium-to-large facilities [91], and techno-economic feasibility of dedicated 60 MW wind supply for Indonesian data centers [216]. Ayyildiz et al. contribute a siting methodology that co-optimizes renewable resource availability with data center location decisions [215].
Across T6, three results recur: co-optimization of IT load with local generation and storage reduces cost and carbon simultaneously (typically 10–30% cost and 20–40% carbon in reported simulations; no field measurement exists in this cluster) [19,212,213,214]; storage is the pivot asset converting intermittent renewables into firm compute capacity [90,91]; and siting is a first-order sustainability decision that locks in grid impact for decades [215,216]. Table 13 collects the representative facility-level technologies of T4–T6 with their reported performance indicators.
Evidence added in the second retrieval pass: methodological families. T6 grew from nine studies to forty-five, the largest proportional expansion in the corpus, and the thirty-six additions resolve a thin cluster into five method families. The dominant family, about half the new material, is mathematical-programming dispatch and capacity planning of data center microgrids: deterministic and stochastic mixed-integer formulations of day-ahead operation [49,221,224,227,234,235], two-stage robust planning under renewable and load uncertainty [92,228,238,245], cluster-level formulations coupling facilities through shared storage or certificate markets [93,225], and learning-based controllers—multi-agent reinforcement learning [49] and variational quantum circuit surrogates [229]—substituted for the optimizer in the same architecture. A second family is techno-economic feasibility assessment of on-site or behind-the-meter supply [48,217,219,220,236,242,246], extended by siting and layout optimization that makes location the decision variable [223,244]. A third is thermodynamic cycle design with energy, exergy and economic analysis: compressed-CO2 storage with a CO2 heat pump [232], solar power-tower combined cooling and power [241], parabolic-trough cogeneration [239] and cold-energy storage coupled to pumped hydro [221]. A fourth family is new to the cluster: power-electronics and power-quality analysis of grid-forming storage as a line-interactive uninterruptible supply [233], superconducting magnetic storage for voltage-sag ride-through [222] and short-circuit behavior in an islanded microgrid [242]. The fifth is secondary synthesis: four reviews [47,54,230,231] and a system-dynamics scenario model [240].
What the numbers say. The most consequential new result is the quantification of the autonomy penalty, and it is unfavorable. Simulating data centers of 10 to 8000 servers over a year, ref. [217] finds that a photovoltaic plant sized to cover full annual demand from renewables meets only 35.9–37.7% of consumption directly, exports 62.8–64.1% of generation (whose abstract reports a single 63.1% figure absent from the results), and peaks at 3.4 to 4.9 times nominal facility power; full autonomy costs a simulated 1.115 $/kWh with batteries alone, falling to 0.450 $/kWh when hydrogen storage is added at the price of roughly doubling the photovoltaic field. The off-grid hyperscale assessment in [220] is more favorable but structurally identical: across five European sites a 50 MW constant load is served at a simulated levelized cost of utilized energy of 70–102 GBP/MWh with emissions of 0.021–0.074 tCO2eq/MWh, but battery capacity exceeds 80% of daily demand and the approach may roughly double developer capital expenditure. Grid-tied portfolios fare better: in an ERCOT scenario study [236] blended costs range from 64.50 to 94.20 $/MWh against a pure-grid baseline of 75.00 $/MWh.
The co-optimization results form a wide envelope whose width is explained almost entirely by the choice of baseline. Against the authors’ own optimized schedule without the studied mechanism, simulated daily cost reductions cluster between 5 and 26%: 5.21% from vehicle-to-grid coupling and 22.80% from computing–task transfer [227], 6.08% from thermal and batch-load flexibility [218], 8% from computing–electricity coupling [238], 11.7% from heat-determined computing under tiered carbon trading [224], 11.6% from multi-agent over independent reinforcement learning [49] and 25.7% from workload shifting [234]. Against a no-storage, no-response or grid-only baseline the same class of model returns 66.48% [225], 67.05% [93] and 37.3% annually [243]. Carbon reductions behave identically: 3.0% [224], 6.9% [229] and 16.74% [227] against optimized baselines but 58% [243] and 70.00% [225] against unoptimized ones. All are simulation results on twenty-four-hour or typical-day horizons. A distinct and better-founded finding is that flexibility substitutes for storage: demand response cuts the battery needed for an 85% carbon-free success rate from 9721 to 3734 kWh, saving 7.3% of initial cost [226]; computing–electricity coupling cuts configured storage by 58% [238]; and thermal and batch flexibility cut cooling capacity by 56.7% [218]. Robustness is priced the other way: hedging against ±20% uncertainty at a conservatism parameter of sixteen raises daily operating cost by 31.4% [92], whose abstract presents that cost as a saving, while frontier-model scaling uncertainty widens the 2030 peak-load boundary of a single AI facility from 82.7 to 185.4 MW between P50 and P99 [237]. Siting is quantified for the first time: moving a facility within 10, 25 and 100 km yields modeled chiller energy savings of 9.12%, 17.47% and 37.35% [244]; regional rather than centralized deployment meets a 2040 net-zero target at 18–23% lower system cost in Japan [48], and energy-constrained layout optimization cuts lifecycle cost by 15.0–16.3% [223]. Thermodynamic designs return round-trip efficiencies of 56.94% and 55.85% with paybacks of 12.71 and 11.19 years [232]. Grid-forming storage cuts simulated one-cycle active-power excursions at the interconnection by 89.14% [233]. The consumption, PUE and conversion-loss figures quoted in the new reviews [47,230,231] are secondary material, not findings of those papers.
What the new evidence changes. The first-pass synthesis concluded that co-optimizing IT load with local generation and storage cuts cost and carbon simultaneously, typically by 10–30% and 20–40% in simulation, that storage is the pivot asset, and that siting is a first-order decision. The enlarged cluster confirms all three and sharpens the first: the first-pass range is an artifact of mixed baselines, and the evidence now supports two tiers—roughly 5–26% cost and 3–17% carbon against an optimized counterfactual, rising to 37–70% only where the comparator is unoptimized grid-only supply. The storage claim is qualified rather than confirmed, because three studies show flexibility and storage to be substitutes rather than complements [218,226,238]. Siting is confirmed and quantified [48,223,244]. Two findings are new. First, grid dependency is structural rather than transitional: refs. [217,220] establish that renewables-only autonomy is achievable but expensive, storage-heavy and export-intensive, reframing on-site renewables from a decarbonization endpoint into a grid-interaction problem. Second, the cluster has acquired an electrical-reliability dimension absent from the first-pass synthesis, whose object of study is the AI load’s ramp rate and ride-through behavior rather than energy cost [222,233,236,237].
Measured versus modeled. One of the thirty-six new studies carries an evaluation setting of testbed and none carries production or field. That study is [222], which built a kW-class superconducting magnetic energy storage prototype operated at 77 K, measured a critical current of 123.8 A against 102.3 A for the original coil, and held load voltage at its rated value through four sag and swell cases on a 24 V and 48 V DC test system. Its device- and network-scale results, including the 11.06, 6.44 and 4.54-year paybacks for a 3 MW installation and the fall in harmonic distortion from 14.41% to 3.95%, are analytical and Simulink outputs. Two studies use measured data only as model input: [217] parameterizes its servers from wattmeters on the Grid’5000 Nova cluster at 79 W idle and 145 W at full CPU load, and [238] takes its load profile from a National Supercomputing Center branch facility. The measured share of T6 therefore moves from none in nine to one laboratory testbed in forty-five, and the first-pass synthesis’s finding that the cluster holds no field measurement stands with only that qualification.
5. Discussion
5.1. Cross-Cutting Synthesis: Three Integration Pathways, One System
Read together, the six clusters describe three integration pathways that the literature studies separately even though they are physically one system. The computational pathway (T2) treats workload as the thing to control: shift it in time, move it in space, cap its power. The electrical pathway (T3, T6) turns the facility’s electrical assets—UPS, batteries, on-site generation—into grid resources. The thermal pathway (T4, T5) treats heat as a product instead of a waste stream. What emerges most clearly from the corpus is how much these pathways feed one another. Liquid cooling raises the value of captured heat and adds thermal inertia that demand response can use [18,25,88]. Shifting workload changes when and where heat appears, which reshapes district heating supply profiles [30,193]. A battery sized for grid services also firms renewable self-supply [17,90]. And yet few included studies model more than one pathway at once—the DC-IES papers [19,27,212], the computing–electricity–heat co-optimization studies recovered in the second pass [218,224,227,238], and the joint IT–cooling work [18,29,186] are the exceptions. Optimizing one pathway alone leaves cross-pathway value uncollected at best; at worst it works against itself, as when aggressive server consolidation undermines a heat-supply commitment.
Table 14 restates the headline benefits of Section 4 with the reference case against which each was computed and the setting in which it was validated. Read down the table, the width of each reported range is explained largely by the baseline and the setting rather than by the technology: the same class of microgrid model returns 5–26% or 37–70% cost reduction depending on whether its comparator is an optimized schedule or unoptimized grid-only supply, and the same cooling-control mechanism returns 32–37.5% in simulation and 2.6% in the field. Benefits quoted without their reference case are therefore not comparable, and the table is the basis on which the strategy comparison of Table 15 judges practical applicability.
Table 14.
Headline benefit envelopes by integration pathway, with the reference case and validation setting behind each. Ranges are as reported by the cited studies; none is a pooled estimate.
5.2. A Strategy–Opportunity Framework
The evidence supports a compact framework mapping strategies to the smart-grid opportunities they unlock. Demand shaping (carbon-/price-aware scheduling, migration [8,13,14,30,32,117,119]) unlocks renewable absorption, curtailment reduction, and peak shaving—and is deployable now on standard orchestrators [13]. Asset flexibility (UPS/BESS dispatch, power reshaping [15,17,33,90]) unlocks frequency and regulation markets, with the highest value in low-inertia, renewable-rich systems [15]; outside the data center literature, market selection has been shown to be a design variable in its own right for battery storage revenue [248]. Thermal integration (liquid cooling plus WHR [20,21,34,88,189]) unlocks sector coupling revenues and community-level decarbonization. System co-design (DC-IES, siting [19,27,215,216]) unlocks long-run alignment of digital growth with grid development. Crucially, the T1 evidence shows these opportunities will not be captured by default: organizational silos, uptime-dominated risk culture, and missing measurement infrastructure [6,7] must be addressed through governance instruments—disclosure, tariffs, contracted flexibility, heat off-take frameworks [57,58,142,144]. Figure 5 summarizes this strategy–opportunity mapping.
Figure 5.
Strategy–opportunity framework for sustainable data center integration. The framework links four key strategies to enabling technologies, the smart-grid opportunities they unlock, and the resulting sustainability outcomes across computational, electrical, and thermal dimensions. Supporting references: demand shaping [8,13,14,30,32,117,119], including orchestrator-level implementations [13,50]; asset flexibility [15,17,33,90], with the highest value in low-inertia systems [15]; thermal integration [20,21,34,88,189]; system co-design [19,27,215,216]; barriers [6,7]; governance instruments [57,58,142,144].
Figure 5 maps strategies to opportunities; Table 15 subjects the same strategies to a critical comparison—advantages, limitations, and the conditions of scale, workload, and grid under which the evidence supports each—together with the maturity of that evidence. Three regularities follow from it. Scale: demand shaping and cooling measures apply at any scale, whereas electrical-asset flexibility, heat export, and microgrid co-design require megawatt-class facilities with a UPS fleet, a nearby heat network, or land for generation. Workload: computational strategies are worth only the delay-tolerant share of the workload—empirically a fifth to a third of window energy at more than an hour’s notice [147]—so they suit training, batch, and HPC loads and not latency-bound inference, whereas thermal and electrical strategies are workload-agnostic. Grid: asset flexibility is most valuable in low-inertia, renewable-rich, or congested systems [15,156]; demand shaping needs intra-day carbon or price variance to act on; and on-site renewables are economic only grid-tied, since autonomy is storage-heavy and export-intensive [217,220].
5.3. Barriers
The same four barrier classes keep surfacing, cluster after cluster. Institutional and organizational barriers come first: split incentives between IT and facilities teams, procurement inertia, a reliability culture that treats any deviation as risk [6,7], and—for heat recovery—the slow work of negotiating off-takers and network access [20,87]. Informational barriers follow: public operational data are scarce. Of the 228 appraised studies, 126 release neither data nor code, and a recurring pattern in the recovered literature is the case study whose facility is unnamed and whose data are declared confidential. The field leans on a handful of aging workload traces, and commercial secrecy keeps models from being validated [1,16,115]. Economic barriers are real but narrower: flexibility revenues are thin or closed to loads in many markets, heat recovery economics hinge on heat prices and pipe distance [10,20], and liquid-cooling retrofits are capital-hungry [25]. Only last come the technical barriers: QoS risk from aggressive load shaping [13,33], the seasonal and diurnal mismatch between heat supply and demand [193], and forecasting error on both the renewable side and the AI-workload side [90,213]; renewable forecasting error is likewise a recognized constraint on microgrid operation more generally [249]. On the supply side, machine-learning parameter prediction for photovoltaic generation, for instance autoencoder-based prediction of solar power system parameters in a smart grid [250], is one route to reducing that forecasting error, and it illustrates that the renewable-forecasting barrier is being addressed in the grid literature outside the data center corpus.
Technical challenges in detail. Five technical challenges deserve separate statement because they are where the corpus is thinnest. Grid stability: the controllability that makes a data center a flexibility resource also makes it a disturbance. In electromagnetic-transient simulation of a 1.1 GW facility on an 8 GW system, a load trip drives frequency to 61.22 Hz and UPS reconnection to a 54.33 Hz nadir without grid-forming storage [153]; frontier-model scaling widens one facility’s 2030 peak from 82.7 to 185.4 MW between P50 and P99 [237]; and ERCOT’s loss-of-load expectation exceeds the NERC reference under data-center growth [156]. Only a handful of included studies treat dynamics at all. Power quality: sub-second accelerator ramps (25.7 to 91 W per device [149]) aggregate into megawatt-scale fluctuations, and the power-electronic remedies—grid-forming line-interactive UPS cutting one-cycle active-power excursions by 89% [233] and superconducting storage for sag ride-through [222]—are evaluated in Simulink or at kilowatt scale. Interoperability: no included study implements a standard interface between workload schedulers and grid operators (IEC 61850, OpenADR, or an orchestrator-to-market signal path); carbon-intensity signals arrive through proprietary interfaces, and RG3 (a standard flexibility metric) is the consequence. Cybersecurity: a load that follows external price or carbon signals can be driven by a corrupted signal. The resonance-forcing study [159] shows deliberate 200–300 MW modulation producing frequency deviations below 0.07 Hz on full-model benchmarks—reassuring for the grid—but it is the corpus’s only analysis of adversarial load behavior, and apart from one security–sustainability co-design framework [121] no study addresses the security of the signal chain or of the operator-to-aggregator link. Demand response challenges: the empirical deferability ceiling of a fifth to a third of window energy, available only with more than an hour’s notice [147]; post-event rebound of 1.4–4.4% [147]; counterfactuals taken from calibrated models rather than measured control periods [151]; and field response magnitudes that reach the literature only through a secondary source [146]. Together these mean that demand response products for data centers are being designed on simulated supply curves.
Cooling flexibility and grid resilience. The thermal inertia that liquid cooling, chilled-water storage, and phase-change materials add to a facility [18,188,195] is the same resource that the resilience literature on other building types has learned to dispatch. In electricity–transportation networks, Li et al. coordinate the response of buildings, whose thermal mass provides deferrable heating and cooling load, with electric buses acting as mobile energy support, and solve the restoration problem asynchronously and decentrally so that participants need not share a single model [251]. The data center analog is direct, but the operating requirements differ in three ways. First, the thermal envelope is narrower: the recommended server-inlet band is 18–27 °C, and the measured demand response events in the corpus accept at most a 0.1 °C indoor rise [151], against several kelvin of comfort tolerance in occupied buildings, so the cooling energy deferrable per event is minutes rather than hours (26.8–31.1% of cooling load for two short events [151]) unless thermal storage is added. Second, the mobile-storage counterpart is on site rather than in the road network: UPS fleets and backup generation, whose ride-through dynamics [153,233] and diesel emissions [12] the corpus documents, but whose coordination with cooling pre-conditioning has not been studied. Third, the objective is inverted: buildings and buses are coordinated to restore grid load, whereas a data center must remain served, so its contribution to resilience is to reduce the restoration burden—by islanding, by shedding cooling for a bounded interval while thermal storage discharges, and by migrating workload away from the affected region [155], a resource with no building-sector equivalent. The building–E-bus formulation is therefore a template for the decision structure rather than for its parameters, and its solution method is the part most directly transferable, as discussed next.
Stakeholder coordination. The corpus treats coordination almost entirely as a two-party problem—a data center and a retailer or system operator [42,142,144]—and solves it centrally, which presumes that the operator shares its workload model and the utility its network model. Neither is realistic: operational data are confidential (Section 5.3) and network models are protected. Asynchronous decentralized optimization addresses exactly this. Li et al. coordinate building response, electric-bus scheduling, and road repair after a disruption through an asynchronous decentralized scheme in which each stakeholder solves its own subproblem on its own clock and exchanges only boundary information, so that convergence requires neither a central coordinator nor waiting for the slowest participant [252]. For resilient data center integration the implication is a coordination architecture with four parties—the facility operator (workload and cooling), the distribution operator (network constraints), the heat-network operator (off-take), and emergency or mobile-resource managers—each retaining its own model. The asynchronous property matters because these parties act on different time scales: workload schedulers in seconds to minutes, distribution dispatch in minutes to hours, heat networks and repair logistics in hours to days. No included study implements such a scheme; the closest are the cooperative-game [142] and Stackelberg [42] formulations, both centralized and both simulated. Adapting decentralized restoration methods to the data center case—replacing comfort constraints by inlet-temperature and QoS constraints, and bus routing by workload migration—is a concrete and tractable research direction, and it is added to Section 5.6.
5.4. Research Gaps
Eight gaps emerge with sufficient consistency to be considered priorities. RG1—Field validation deficit: the T2/T3 evidence base is overwhelmingly simulation; production-scale, revenue-documented demonstrations of carbon-aware scheduling and grid-service provision are rare [13,16,33]. RG2—Cross-pathway co-optimization: models coupling workload, cooling, storage, and heat export in one decision problem are scarce [18,19,27]. RG3—Standardized flexibility metrics: no accepted unit exists for data center flexibility (MW-shiftable, duration, notice time), impeding market product design [1,30,145]. RG4—AI-era workload characterization: training/inference traces with power labels are not publicly available at scale, so schedulers are tuned to pre-AI workloads [8,32,123]. RG5—Water–energy–carbon co-assessment: water and embodied impacts are rarely co-optimized with operational carbon, though LCA evidence shows rankings can invert [51,97,98,101]. RG6—Socio-technical adoption research: beyond two interview studies [6,7], the human and organizational determinants of adopting grid-interactive operation are unstudied. RG7—Emerging-economy evidence: most quantitative evidence is US/EU/China; tropical-climate cooling, weak-grid integration, and financing contexts of emerging digital economies are underrepresented [58,60,216], although techno-economic and reliability assessments of hybrid microgrids for remote, weak-grid communities offer transferable methods [253]. RG8—Health and community impacts: the single exploratory health assessment [12] needs replication and integration into siting methodologies [215]. Figure 6 consolidates these barriers, gaps, and priorities.
Figure 6.
Barriers, research gaps, and future research priorities for sustainable data center integration with smart grids. The framework connects the principal institutional, informational, economic, and technical barriers to eight identified research gaps and corresponding priorities for advancing data centers from passive loads toward grid-interactive energy hubs. Supporting references—barriers: institutional and organizational [6,7,20,87]; informational [1,16,115]; economic and market [10,20,25]; technical and operational [13,33,90,193,213]. Research gaps: RG1 [13,16,33]; RG2 [18,19,27]; RG3 [1,30,145]; RG4 [8,32,123]; RG5 [51,97,98,101]; RG6 [6,7]; RG7 [58,60,216]; RG8 [12,215]. Priorities: living-lab demonstrations [13,124]; unified facility digital twins [18,19,27]; flexibility product standardization [30,145]; open AI-era datasets [8,32,123]; integrated impact assessment [12,97,98,215,216].
Basis for prioritization. The eight gaps were ranked by three criteria that can be read from the evidence table rather than from the authors’ judgment alone. The first is the share of the corpus’s quantitative evidence that the gap conditions: RG1 conditions the 95% of the 1317 own-result claims produced outside production or field settings, and RG2 conditions the roughly ten studies that model more than one pathway, and therefore every statement in Section 5.1 about cross-pathway value. The second is recurrence: RG1, RG3, and RG4 are identified in the syntheses of at least three clusters (Section 4.3, Section 4.4, Section 4.5, Section 4.6 and Section 4.7), whereas RG5–RG8 arise in one or two clusters each. The third is dependency: RG3 (a flexibility unit) and RG4 (AI-era traces with power labels) are prerequisites for closing RG1 at scale, because field demonstrations cannot be compared without a common unit or reproduced without public traces. RG1–RG4 are therefore placed first because they bear on the validity of the field’s central quantitative claims; RG5–RG8 follow because they widen the system boundary—water and embodied impacts [101], organizational adoption [6,7], emerging-economy settings [58,60,216], and health [12]—and each rests at present on one to three studies. Candidate gaps that did not meet these criteria were not prioritized: embodied carbon of IT hardware is partly covered by the life-cycle evidence [101], and quantum and cryogenic facilities [71] are a single-study special case.
5.5. Implications for Practice and Policy
The evidence supports distinct, actionable guidance for four stakeholder groups, each facing its own adoption barrier.
Data center and cloud operators. The near-term portfolio comprises the following actions: instrument facilities for energy visibility as the precondition for everything else [99,100]; deploy carbon-aware scheduling on existing orchestrators for delay-tolerant workloads, where Kubernetes-level implementations already exist [13]; evaluate UPS/BESS participation in reserve and regulation markets where products are open to loads [15,17]; and, in heat-market geographies, treat liquid cooling and heat export as a joint investment case rather than separate projects [20,88]. The principal barrier is organizational—split incentives between IT and facilities teams and uptime-dominated risk culture [6,7]—which argues for making energy and flexibility explicit line items in service-level objectives.
Software and platform developers. Carbon awareness should move down the stack: orchestrators, schedulers, and database engines can expose delay tolerance and carbon budgets as first-class workload attributes [13,124], and AI frameworks can pair training-schedule flexibility with model-efficiency techniques [123]. The barrier is the absence of standardized carbon-intensity and flexibility interfaces; contributing to open scheduling benchmarks and power-labeled trace releases (RG4) is the highest-leverage single action this group can take.
Grid operators and regulators. The evidence supports creating load-side flexibility products with QoS-compatible specifications and notice periods that match workload physics [1,30,33]; recognizing data center flexibility in reliability and adequacy assessment [145]; mandating consumption and water disclosure to correct the information asymmetry documented in the assessment literature [57,98]; and integrating data center siting into joint grid and heat-network planning [215,216]. The barrier is product design under uncertainty about deliverability, which the missing standardized flexibility metrics (RG3) perpetuate—regulators can break this circularity by piloting products with measurement-and-verification requirements.
Policymakers and investors. Tariff structures, disclosure mandates, and heat off-take frameworks determine whether the technical potential documented here is monetizable [57,58,142,144]; financing conditions determine whether emerging digital economies leapfrog to grid-interactive designs or lock in passive ones [58,60,216]. For the research community, finally, the gaps in Section 5.4 define an agenda whose common denominator is validation in the field, integration across pathways, and measurement standards.
5.6. Future Research Directions
Translating the gaps of Section 5.4 into researchable designs suggests five concrete directions. First, living-lab demonstrations: multi-month deployments of carbon-aware scheduling on production Kubernetes clusters with audited carbon and QoS accounting would convert RG1 from a credibility deficit into a benchmark literature; the experimental precedents in the corpus [13,124] show the template is feasible. Second, unified facility digital twins: co-simulation environments coupling workload traces, thermoelectric cooling models, storage dispatch, and heat-network interfaces would enable the cross-pathway optimization of RG2 to be studied reproducibly, extending the DC-IES formalism [19,27] with the joint IT–cooling boundary of [18]. Third, flexibility product standardization: joint work between power-system researchers and cloud operators to define measurable flexibility attributes (shiftable megawatts, sustainable duration, notice period, rebound profile) would give RG3 an engineering object, building on the elastic-space and migration-potential formalisms [30,145]. Fourth, open AI-era datasets: publishing anonymized power-labeled traces of training and inference clusters—analogous to the role earlier cloud traces played for T2—is likely the single highest-leverage enabler for RG4 [8,32,123]. Fifth, integrated impact assessment: extending siting and planning models [215,216] with water stress, health, and community indicators [12,97,98] would operationalize RG5 and RG8 in the decisions where they matter most. Each direction is interdisciplinary by construction; the corpus shows that the discipline boundaries—computer science, electrical engineering, thermal engineering, and social science—are precisely where the unexploited value of data center grid integration now lies. Sixth, decentralized multi-stakeholder coordination: adapting the asynchronous decentralized restoration methods developed for buildings, electric buses, and road repair in electricity–transportation networks [251,252] to the operator–utility–heat-network–emergency-resource case of Section 5.3, with inlet-temperature and QoS constraints in place of comfort constraints and workload migration in place of vehicle routing, would supply the first resilience-oriented coordination model in which no party must disclose its internal model.
5.7. Limitations of This Review
Five limitations qualify the findings. First, retrieval. The first retrieval pass failed to obtain 439 of the 595 reports that passed screening and attributed the failure to the literature’s licensing; the second pass showed that 224 of those reports were openly accessible, recovered 191 of them, and thereby changed the rank order of four of the six clusters (Section 3.6 and Section 3.7). The 248 reports that remain unretrieved concentrate in a small set of subscription titles (Energy, Applied Energy, Energy and Buildings, Energy Conversion and Management, Renewable Energy), so the residual retrieval bias has a known shape—it under-samples established electrical- and thermal-engineering journals—but it cannot be corrected without institutional access, and the cluster proportions in Section 4 should be read as those of the openly accessible literature. Second, the 144 studies added in the second pass were screened, clustered, appraised and extracted with assistance from a large language model (LLM) working from the retrieved full text, under the same criteria and rubric as the first pass but without a second independent assessor. Every decision is released with the passage of text it rests on (S8), which makes the procedure auditable but not independently validated; readers who wish to work only from the manually assessed subset can reconstruct it, because the 98 studies of the first pass are tagged in S4 and the third sensitivity check of Section 3.7 reports the cluster distribution of that subset. Third, title/abstract screening used a keyword gate and full-text adjudication was performed by a single assessor in each pass. The gate’s false-exclusion rate was not quantified against an independent screen, so the number of eligible studies lost at the title/abstract stage is unknown. Its design makes that risk structurally uneven rather than uniform: a record carrying no abstract can pass only on a title term, and only 759 of the 2026 Crossref records in the pool carry an abstract at all, so eligible studies whose titles omit explicit data center terminology are the most likely to have been missed. Dual independent human screening was not performed at any stage, and no inter-rater agreement statistic is reported for screening or for full-text adjudication; in their place, the complete decision trail released in Supplementary Materials S4, S5 and S9 leaves every individual screening, exclusion and retrieval decision auditable and contestable. Fourth, the corpus’s methodological heterogeneity precluded meta-analysis; quantitative figures cited are as reported by authors, under evaluation conditions that vary widely, and should not be compared as like-for-like—the more so because 94 of the 144 recovered studies carry an integrity flag (Section 3.9). Fifth, the field’s velocity—one article that had passed screening was retracted after the search date and was excluded when its retraction notice was identified (Section 3.4)—means the evidence base is unusually dynamic; the search cut-off of August 2026 necessarily truncates an accelerating literature. Beyond these, three boundaries are stated rather than discovered: the protocol was not prospectively registered (Section 3.1), a deviation from PRISMA 2020 item 24a; the review covers the openly accessible literature (Section 3.4); and venue indexing is reported as a sensitivity analysis (Section 3.7) rather than used to exclude studies. Finally, the appraisal rubric of Section 3.5 is bespoke and was applied by a single assessor in each pass, so its scores should be read as a structured reading aid rather than a validated instrument.
Reliability and reproducibility of the assisted procedure. The second and third limitations deserve a statement of their likely direction of effect. LLM-assisted extraction affects reliability in two ways. It was run under a fixed prompt and rubric, so every decision is auditable against that prompt and the passage it cites; but the model’s outputs are not deterministic on re-execution, so reproducibility is claimed only in the sense that the prompt, the passages, and every decision are released, not in the sense that a re-run would return identical scores. The procedure is also sensitive to the retrieved rendering of a report (tables can be lost from scanned or HTML-rendered texts) and inclined to accept a paper’s abstract at face value; the integrity check of Section 3.9, which found 94 recovered studies contradicting their own abstracts, was applied to counter the second tendency. Its measurable consequences are the fourteen studies for which no rubric score was produced (Section 3.5) and the 172 recycled figures that had to be tagged as secondary (Section 3.8). The single-assessor design means that no inter-rater statistic bounds the error of screening, clustering, or appraisal; the internal-consistency statistics of Section 3.5 (α = 0.68) bound the rubric’s coherence but not its agreement with a second reader. Two features limit the damage. First, the decisions most exposed to assessor error—cluster assignment and rubric item scores—were tested for sensitivity (Section 3.7, and the bounds in Section 3.5), and no headline finding changes under the alternatives. Second, every decision cites the passage it rests on, which converts an unverified judgment into a checkable one. What the design cannot do is estimate how many eligible studies a second screener would have found, and that number should be assumed to be non-zero; a dual-screened replication of the title/abstract stage is the single most valuable methodological follow-up to this review.
6. Conclusions
This systematic review, reported according to PRISMA 2020, synthesized 242 openly accessible studies from 2021 to 2026 on the integration of data centers into smart grids across six thematic clusters, extracted all 1489 quantitative claims they make, and appraised the reporting quality of every study. Four findings carry the weight. First, the evidence base is predominantly simulated: 54% of studies rest on modeling or simulation, 5% of own-result claims come from production or field deployment, and the headline envelopes—15–35% energy and 20–45% carbon for computational demand shaping, 5–26% cost and 3–17% carbon for microgrid co-optimization against optimized baselines, 3–74% of district heat demand covered by recovered heat—are model outputs; where the same mechanism has been measured, the result is an order of magnitude smaller (1.3% carbon for carbon-aware Kubernetes scheduling, 2.6% PUE for field AI cooling control). Second, the reported range of each benefit is explained largely by its reference case and validation setting (Table 14), not by the technology, so benefits quoted without their baseline are not comparable. Third, the three integration pathways—computational, electrical, and thermal—are physically one system but scientifically siloed: about ten studies co-optimize more than one pathway, and the enlarged corpus shows the thermal and electrical pathways to be at least as large as the computational one. Fourth, the AI-era literature has moved the problem from efficiency toward interconnection risk, adequacy, and dynamic stability, where the corpus holds only a handful of studies.
For practice, three priorities follow. Operators should instrument facilities so that savings can be measured rather than modeled; deploy carbon-aware scheduling where delay-tolerant workload exists, with expectations set by the measured single-digit gains rather than the simulated envelope; and treat cooling choice as a grid and heat-market decision, since outlet temperature and thermal inertia precondition both flexibility and heat reuse (Table 15). For policy, flexibility products need notice periods matched to the empirical deferability ceiling—a fifth to a third of window energy at more than an hour’s notice—and heat off-take frameworks need to resolve the split incentive that the Finnish cases quantify.
For research, three directions are specific enough to be funded: multi-month living-lab deployments of carbon-aware scheduling on production clusters with audited carbon and QoS accounting (RG1); coupled workload–cooling–storage–heat-export models validated against an instrumented facility (RG2); and asynchronous decentralized coordination of operators, distribution utilities, heat networks, and emergency resources for resilient integration (Section 5.3 and Section 5.6). A methodological conclusion stands apart: a review that gates on open access should measure what its gate missed. This review did so, found 224 openly accessible reports that its first pass had overlooked, and reports the consequence in full—a result that bears on every open-access-weighted evidence synthesis, not only this one.
Supplementary Materials
The following supporting information can be downloaded at: https://www.mdpi.com/article/10.3390/en19225576/s1, S1: PRISMA 2020 Checklist; S2: PRISMA 2020 for Abstracts Checklist; S3: Full search strategies (PRISMA-S); S4: Characteristics of the 242 included studies (cluster, venue, indexing tier, evaluation setting, rubric items, integrity flags, retrieval pass) (spreadsheet); S5: Reports excluded at full-text assessment with reasons (n = 105) (spreadsheet); S6: Reports identified but not retrieved (n = 248) (spreadsheet); S7: Paywalled reports recovered from repositories in the first pass (n = 19) (spreadsheet); S8: Per-study evidence extraction table (1489 quantitative claims, each with its verbatim supporting quotation) (spreadsheet); S9: Retrieval audit of the second pass—open-access census result, retrieval route and outcome for each of the 439 re-sought reports (spreadsheet); record-level screening ledger (ledger.csv and ledger.json) with data dictionary.
Author Contributions
Conceptualization, investigation, formal analysis and writing—original draft preparation, S.M.W.D.G. and W.N.; formal analysis and investigation, S.J.R.; supervision and writing—review and editing, M.J. All authors have read and agreed to the published version of the manuscript.
Funding
This research received no external funding.
Data Availability Statement
The complete record-level screening ledger, the per-study classification and quality-appraisal data (S4), the full-text exclusion log (S5), the retrieval accounting (S6, S7, S9), and the 1489-row evidence extraction table (S8) are provided as Supplementary Materials accompanying this article, together with a data dictionary for the ledger. The search, screening, census and figure scripts are available from the corresponding author.
Acknowledgments
During the preparation of this manuscript, the authors used Claude (Opus 4.8) and Grammarly Premium to assist with drafting and language refinement. All outputs were critically reviewed and edited by the authors, who take full responsibility for the final content.
Conflicts of Interest
The authors declare no conflicts of interest.
Abbreviations
The following abbreviations are used in this manuscript:
| Abbreviation | Meaning |
| AI | Artificial intelligence |
| API | Application programming interface |
| BESS | Battery energy storage system |
| CCHP | Combined cooling, heating, and power |
| COP | Coefficient of performance |
| CRAC | Computer room air conditioner |
| CVaR | Conditional value at risk |
| DC | Data center |
| DC-IES | Data center integrated energy system |
| DID | Difference-in-differences |
| DL | Deep learning |
| DOAJ | Directory of Open Access Journals |
| DR | Demand response |
| DSM | Demand-side management |
| EER | Energy efficiency ratio |
| EMS | Energy management system |
| EMT | Electromagnetic transient |
| ESS | Energy storage system |
| FCFS | First-come, first-served (scheduling) |
| FCR-D | Frequency containment reserve for disturbances |
| GHG | Greenhouse gas |
| GPU | Graphics processing unit |
| GWP | Global warming potential |
| HPC | High-performance computing |
| IEA | International Energy Agency |
| IES | Integrated energy system |
| IoT | Internet of Things |
| LCA | Life cycle assessment |
| LLM | Large language model |
| LSTM | Long short-term memory |
| mFRR | Manual frequency restoration reserve |
| ML | Machine learning |
| OCR | Optical character recognition |
| PCM | Phase change material |
| PRISMA | Preferred Reporting Items for Systematic Reviews and Meta-Analyses |
| PUE | Power usage effectiveness |
| PV/T | Photovoltaic–thermal |
| QoS | Quality of service |
| RL | Reinforcement learning |
| SARSA | State–action–reward–state–action (reinforcement learning) |
| SJF | Shortest job first (scheduling) |
| SMPC | Stochastic model predictive control |
| TE | Techno-economic (evaluation) |
| UPS | Uninterruptible power supply |
| VM | Virtual machine |
| WHR | Waste heat recovery |
| WUE | Water usage effectiveness |
References
- Nautiyal, A. Green Data Center: Reduced Energy Consumption During Peak Load. Int. J. Sci. Technol. 2026, 17, 11007. [Google Scholar] [CrossRef] [Scilit]
- International Energy Agency. Energy and AI; IEA: Paris, France, 2025; Available online: https://www.iea.org/reports/energy-and-ai (accessed on 4 August 2026).
- Koot, M.; Wijnhoven, F. Usage impact on data center electricity needs: A system dynamic forecasting model. Appl. Energy 2021, 291, 116798. [Google Scholar] [CrossRef] [Scilit]
- Katal, A.; Dahiya, S.; Choudhury, T. Energy efficiency in cloud computing data centers: A survey on software technologies. Clust. Comput. 2022, 26, 1845–1875. [Google Scholar] [CrossRef] [Scilit] [PubMed]
- Patel, Y.S.; Townend, P.; Singh, A.; Östberg, P.-O. Modeling the Green Cloud Continuum: Integrating energy considerations into Cloud–Edge models. Clust. Comput. 2024, 27, 4095–4125. [Google Scholar] [CrossRef] [Scilit]
- Hanus, N.; Newkirk, A.; Stratton, H. Organizational and psychological measures for data center energy efficiency: Barriers and mitigation strategies. Energy Effic. 2023, 16, 1. [Google Scholar] [CrossRef] [Scilit]
- Newkirk, A.C.; Hanus, N.; Payne, C.T. Expert and operator perspectives on barriers to energy efficiency in data centers. Energy Effic. 2024, 17, 63. [Google Scholar] [CrossRef] [Scilit]
- Chen, Y.; Chen, Z. Multi-Objective Deep Reinforcement Learning for Carbon-Aware Spatiotemporal Workload Scheduling in Geo-Distributed Data Centers. J. Adv. Comput. Syst. 2025, 5, 18–30. [Google Scholar] [CrossRef] [Scilit]
- Shehabi, A.; Smith, S.J.; Hubbard, A.; Newkirk, A.; Lei, N.; Siddik, M.A.B.; Holecek, B.; Koomey, J.; Masanet, E.; Sartor, D. 2024 United States Data Center Energy Usage Report; LBNL-2001637; Lawrence Berkeley National Laboratory: Berkeley, CA, USA, 2024. [Google Scholar]
- Gibbons, L.; Persoons, T.; Alimohammadi, S. Techno-Economic and Sustainability Analysis of Potential Cooling Methods in Irish Data Centres. J. Electron. Cool. Therm. Control 2021, 10, 35–54. [Google Scholar] [CrossRef]
- Central Statistics Office. Data Centres Metered Electricity Consumption 2023; CSO: Cork, Ireland, 2024. [Google Scholar]
- Gour, N.; Ortiz, L.; Maibach, E. Health implications of the rapid rise of data centers in Virginia: An exploratory assessment. Front. Clim. 2026, 8, 1648912. [Google Scholar] [CrossRef] [Scilit]
- Piontek, T.; Haghshenas, K.; Aiello, M. Carbon emission-aware job scheduling for Kubernetes deployments. J. Supercomput. 2023, 80, 549–569. [Google Scholar] [CrossRef] [Scilit]
- Fridgen, G.; Körner, M.-F.; Walters, S.; Weibelzahl, M. Not All Doom and Gloom: How Energy-Intensive and Temporally Flexible Data Center Applications May Actually Promote Renewable Energy Sources. Bus. Inf. Syst. Eng. 2021, 63, 243–256. [Google Scholar] [CrossRef] [Scilit]
- Al Kez, D.; Foley, A.M.; Ahmed, F.W.; O’Malley, M.; Muyeen, S.M. Potential of data centers for fast frequency response services in synchronously isolated power systems. Renew. Sustain. Energy Rev. 2021, 151, 111547. [Google Scholar] [CrossRef] [Scilit]
- Crozier, C. The Potential of Data Center Energy Demand to Provide Grid Balancing Services. Curr. Sustain. Renew. Energy Rep. 2025, 12, 12. [Google Scholar] [CrossRef] [Scilit]
- Zhang, Y.; Tang, H.; Li, H.; Wang, S. Unlocking the flexibilities of data centers for smart grid services: Optimal dispatch and design of energy storage systems under progressive loading. Energy 2025, 316, 134511. [Google Scholar] [CrossRef] [Scilit]
- Hu, K.; Guo, P.; Yan, C.; Deng, T.; Li, D.; Zhuang, C. Joint IT-Cooling System Optimization for Data Center Energy Efficiency: A Critical Review. Energy Use 2025, 1, 100020. [Google Scholar] [CrossRef] [Scilit]
- Yang, D.; Fan, J.; Li, Q.; Zhang, Y.; Du, R.; Wang, J. Multi-Objective Optimization of Data Center Computing-Electricity-Cooling-Heating Coupled System Considering Economy, Flexibility, and User Satisfaction. Energy Eng. 2026, 1–10. [Google Scholar] [CrossRef] [Scilit]
- Jürgens, B.; Zipplies, J.; Sauer, C.; Kusyy, O.; Orozaliev, J.; Jordan, U.; Vajen, K. Covering District Heating Demand with Waste Heat from Data Centres. Int. J. Sustain. Energy Plan. Manag. 2024, 41, 58–70. [Google Scholar] [CrossRef] [Scilit]
- Yuan, X.; Liu, J.; Sun, S.; Lin, X.; Fan, X.; Zhao, W.; Kosonen, R. Data center waste heat for district heating networks: A review. Renew. Sustain. Energy Rev. 2025, 219, 115863. [Google Scholar] [CrossRef] [Scilit]
- Zhang, L.; Zhao, Z.; Chen, B.; Zhao, M.; Chen, Y. Zero-Carbon Development in Data Centers Using Waste Heat Recovery Technology: A Systematic Review. Sustainability 2025, 17, 10101. [Google Scholar] [CrossRef] [Scilit]
- Panwar, S.S.; Rauthan, M.M.S.; Barthwal, V. A systematic review on effective energy utilization management strategies in cloud data centers. J. Cloud Comput. 2022, 11, 95. [Google Scholar] [CrossRef] [Scilit]
- Buyya, R.; Ilager, S.; Arroba, P. Energy-Efficiency and Sustainability in New Generation Cloud Computing: A Vision and Directions for Integrated Management of Data Centre Resources and Workloads. Softw. Pract. Exp. 2023, 54, 24–38. [Google Scholar] [CrossRef] [Scilit]
- Şen, O.; Onsomu, O.N.; Yeşilata, B. Sustainable and Efficient Energy Use in Data Center Cooling: Techniques and Innovations. New Energy Exploit. Appl. 2025, 4, 263–282. [Google Scholar] [CrossRef] [Scilit]
- Yuan, X.; Liang, Y.; Hu, X.; Xu, Y.; Chen, Y.; Kosonen, R. Waste heat recoveries in data centers: A review. Renew. Sustain. Energy Rev. 2023, 188, 113777. [Google Scholar] [CrossRef] [Scilit]
- Wang, Y.; Han, Y.; Shen, J.; Han, K.; Li, J.; Ji, W.; Li, H.; Jing, R.; Hua, H.; Wang, D.; et al. Data center integrated energy system for sustainability: Generalization, approaches, methods, techniques, and future perspectives. Innov. Energy 2024, 1, 100014. [Google Scholar] [CrossRef] [Scilit]
- Ewim, D.R.E.; Ninduwezuor-Ehiobu, N.; Orikpete, O.F.; Egbokhaebho, B.A.; Fawole, A.A.; Onunka, C. Impact of Data Centers on Climate Change: A Review of Energy Efficient Strategies. J. Eng. Exact Sci. 2023, 9, 16397-01e. [Google Scholar] [CrossRef] [Scilit]
- Gupta, R.; Asgari, S.; Moazamigoodarzi, H.; Down, D.G.; Puri, I.K. Energy, exergy and computing efficiency based data center workload and cooling management. Appl. Energy 2021, 299, 117050. [Google Scholar] [CrossRef] [Scilit]
- Zhu, L.; Wu, S.; Liu, H.; Wang, Q.; Tang, Y. Spatio-temporal load migration potential of data centers: Evaluation and application. Front. Energy Res. 2023, 11, 1289275. [Google Scholar] [CrossRef] [Scilit]
- Yousif, H.A.; Salman, A.S.; Toygonbaevna, T.S.; Ahmed, R.K.A.; Alsammarraie, R.M. Achieving Sustainability in Computing by Minimizing Data Center Carbon Footprints. Iran. J. Inf. Process. Manag. 2025, 40, e727936. [Google Scholar] [CrossRef]
- Weng, H.; Li, X. Renewable-Aware Cooperative Scheduling for Distributed AI Training Across Geo-Distributed Data Centers. Artif. Intell. Mach. Learn. Rev. 2024, 5, 91–100. [Google Scholar] [CrossRef] [Scilit]
- Jahanshahi, A.; Yu, N.; Wong, D. PowerMorph: QoS-Aware Server Power Reshaping for Data Center Regulation Service. ACM Trans. Archit. Code Optim. 2022, 19, 36. [Google Scholar] [CrossRef] [Scilit]
- Zhang, Y.; Fan, C.; Li, G. Discussions of Cold Plate Liquid Cooling Technology and Its Applications in Data Center Thermal Management. Front. Energy Res. 2022, 10, 954718. [Google Scholar] [CrossRef] [Scilit]
- Page, M.J.; McKenzie, J.E.; Bossuyt, P.M.; Boutron, I.; Hoffmann, T.C.; Mulrow, C.D.; Shamseer, L.; Tetzlaff, J.M.; Akl, E.A.; Brennan, S.E.; et al. The PRISMA 2020 statement: An updated guideline for reporting systematic reviews. BMJ 2021, 372, n71. [Google Scholar] [CrossRef] [Scilit] [PubMed]
- Öztaş, S. Harnessing High-Altitude Advantages: Sustainable Data Center Site Selection in Ski Resort Regions for Optimized Energy Efficiency. Sustainability 2025, 17, 3494. [Google Scholar] [CrossRef] [Scilit]
- Alex, M.; Ojo, S.O.; Awuor, F.M. Carbon-Aware, Energy-Efficient, and SLA-Compliant Virtual Machine Placement in Cloud Data Centers Using Deep Q-Networks and Agglomerative Clustering. Computers 2025, 14, 280. [Google Scholar] [CrossRef] [Scilit]
- Dao, T.K.; Nguyen, T.T. Carbon-Aware VM Placement via Surrogate-Guided Adaptive Swarm Optimization in Green Cloud Data Centers. Sustainability 2026, 18, 6092. [Google Scholar] [CrossRef] [Scilit]
- Malik, N.; Sardaraz, M.; Tahir, M.; Shah, B.; Ali, G.; Moreira, F. Energy-Efficient Load Balancing Algorithm for Workflow Scheduling in Cloud Data Centers Using Queuing and Thresholds. Appl. Sci. 2021, 11, 5849. [Google Scholar] [CrossRef] [Scilit]
- Shaukat, M.; Alasmary, W.; Alanazi, E.; Shuja, J.; Madani, S.A.; Hsu, C.H. Balanced Energy-Aware and Fault-Tolerant Data Center Scheduling. Sensors 2022, 22, 1482. [Google Scholar] [CrossRef] [Scilit] [PubMed]
- Dinesh Reddy, V.; Rao, G.S.V.R.K.; Aiello, M. Energy efficient resource management in data centers using imitation-based optimization. Energy Inform. 2024, 7, 106. [Google Scholar] [CrossRef] [Scilit]
- Li, Q.; Liu, S.; Zou, B.; Jin, Y.; Ge, Y.; Li, Y.; Chen, Q.; Du, X.; Li, F.; Zheng, C. A Stackelberg Game for Co-Optimization of Distribution System Operator Revenue and Virtual Power Plant Costs with Integrated Data Center Flexibility. Energies 2025, 18, 4123. [Google Scholar] [CrossRef] [Scilit]
- Li, X.; Zhao, Z.; Jiang, X.; Chen, Y.; He, R. A Review on AI-Driven Optimization of Data Center Energy Efficiency and Thermal Management. Int. J. Appl. Sci. 2025, 8, 108. [Google Scholar] [CrossRef] [Scilit]
- Yuan, H.; Zhang, Z.; Yang, D.; Xue, T.; Wen, D.; Yao, G. An Intelligent Thermal Management Strategy for a Data Center Prototype Based on Digital Twin Technology. Appl. Sci. 2025, 15, 7675. [Google Scholar] [CrossRef] [Scilit]
- Wei, Q.; Lu, J.; Xia, X.; Zhang, B.; Ying, X.; Li, L. Performance and Applicability Analysis of Indirect Evaporative Cooling Units in Data Centers Across Various Humidity Regions. Buildings 2024, 14, 3623. [Google Scholar] [CrossRef] [Scilit]
- Ma, K.; Lv, J.; Zhang, J. Research on air-water coordinated operation of water side free cooling system based on improved particle swarm optimization algorithm. E3S Web Conf. 2022, 356, 01057. [Google Scholar] [CrossRef] [Scilit]
- Ziaei, P.; Husev, O.; Rabkowski, J. Data Centers as a Driving Force for the Renewable Energy Sector. Energies 2025, 19, 236. [Google Scholar] [CrossRef] [Scilit]
- Toyohara, J.; Zhou, W. Cost-Optimal Decarbonization Pathways for Data Centers in Japan: A Bottom-Up Model Integrating Location, Energy Systems, and Carbon Pricing. Energies 2026, 19, 2485. [Google Scholar] [CrossRef] [Scilit]
- Chang, W.; Liu, C.; Ren, G.; Wan, J. Energy Management for Distributed Carbon-Neutral Data Centers. Energies 2025, 18, 2861. [Google Scholar] [CrossRef] [Scilit]
- Kumar Movva, D. Energy-Efficient Kubernetes Scheduling for Green Cloud Computing: A Carbon-Aware Workload Placement Framework. Int. J. Sci. Res. 2026, 15, 1222–1228. [Google Scholar] [CrossRef] [Scilit]
- Sidorkin, A. Environmental Impact of Generative AI: Carbon and Water Footprint. AI-EDU Arxiv 2025. [Google Scholar] [CrossRef] [Scilit]
- Yang, W.; Tang, R. Optimization of Data Center Cooling Systems through Artificial Intelligence. Mitt. Klosterneubg. 2025, 50, 20–30. [Google Scholar] [CrossRef] [Scilit]
- Chidolue, O.; Ohenhen, P.E.; Umoh, A.A.; Ngozichukwu, B.; Fafure, A.V.; Ibekwe, K.I. Green Data Centers: Sustainable Practices for Energy-Efficient IT Infrastructure. Eng. Sci. Technol. J. 2024, 5, 99–114. [Google Scholar] [CrossRef] [Scilit]
- Alex, A. Sustainable energy strategies for data centers in the AI era. World J. Adv. Eng. Technol. Sci. 2025, 15, 1–7. [Google Scholar] [CrossRef] [Scilit]
- De Brito, J.L.R.; Matai, P.H.l.d.S.; Dos Santos, M.R. Data Center e Eficiência Energética. Braz. J. Bus. 2023, 5, 786–795. [Google Scholar] [CrossRef] [Scilit]
- Dong, P. Research on the Construction of Green and Low-Carbon Water Conservancy Data Center. J. Big Data Comput. 2023, 1, 13–15. [Google Scholar] [CrossRef] [Scilit]
- Romano, M.; Logue, K.; Tipping, M.; McLane, A.; Hunnewell, R.; Kaura, D.; Kanny, R. The Resource-Draining Origins of Our AI Assistants: Potential Policy Solutions to the Unregulated Growth of Georgia’s Data Center Industry. J. Sci. Policy Gov. 2025, 26, jspg260110. [Google Scholar] [CrossRef] [Scilit]
- Syamsuri, L.M.; Pakartipangi, W. Challenges and Opportunities in Implementing Green Data Centers in Indonesia Toward Sustainable Digital Infrastructure. J. Penelit. Pendidik. IPA 2025, 11, 104–118. [Google Scholar] [CrossRef] [Scilit]
- Crovato, D.; Rosania, J. Artificial Intelligence and Energy Overconsumption: Data Center Electricity Demand, Cooling Burdens, and Regional Sustainability Constraints. Energy Power Eng. 2026, 18, 168–202. [Google Scholar] [CrossRef]
- Shrivastava, V. Estimating India’s Digital Carbon Footprint: A Preliminary Assessment of Data Centres, Mobile Data Use and Climate Policy. Int. J. Sci. Res. 2026, 15, 1574–1579. [Google Scholar] [CrossRef] [Scilit]
- Maji, D.; Hanafy, W.A.; Wu, L.; Irwin, D.; Shenoy, P.; Sitaraman, R.K. Data Centers Carbon Emissions at Crossroads: An Empirical Study. ACM SIGEnergy Energy Inform. Rev. 2025, 5, 48–55. [Google Scholar] [CrossRef] [Scilit]
- Billah, W.; Suarez, J.; Wolters, E. Is Power Usage Effectiveness (PUE) Still Fit for Purpose? An Integrative Review of Data Center Metrics for Assessing the Environmental Impact of Modern AI Infrastructure. J. Sci. Policy Gov. 2026, 28, jspg280101. [Google Scholar] [CrossRef]
- Alorf, A. Edge-Cloud Computing for Scheduling the Energy Consumption in Smart Grid. Comput. Syst. Sci. Eng. 2023, 46, 273–286. [Google Scholar] [CrossRef] [Scilit]
- Anasuri, S.; Pappula, K.K. Green HPC: Carbon-Aware Scheduling in Cloud Data Centers. Int. J. Emerg. Res. Eng. Technol. 2023, 4, 106–114. [Google Scholar] [CrossRef] [Scilit]
- Arvindhan, M.; Kumar, D.R. Adaptive Resource Allocation in Cloud Data Centers using Actor-Critical Deep Reinforcement Learning for Optimized Load Balancing. Int. J. Recent Innov. Trends Comput. Commun. 2023, 11, 310–318. [Google Scholar] [CrossRef] [Scilit]
- Tanneru, V. Predictive Workload Migration Using Federated Learning for Energy-Aware Multi-Site Data Center Management. Int. J. Comput. Exp. Sci. Eng. 2023, 9. [Google Scholar] [CrossRef] [Scilit]
- Lavanya, V. SARSA-Based Reinforcement Learning Framework for Energy-Aware and Makespan-Optimized Workload Scheduling in Cloud Computing. J. Inf. Syst. Eng. Manag. 2024, 10, 198–209. [Google Scholar] [CrossRef] [Scilit]
- Oloruntoba, O. Green cloud computing: AI for sustainable database management. World J. Adv. Res. Rev. 2024, 23, 3242–3257. [Google Scholar] [CrossRef] [Scilit]
- Raghavasamy, T.; Ashok, M.; Ramasamy, K. Mitigating Carbon Footprint through Green Software: A Comprehensive Framework for Energy-Efficient Data Centers and User-Friendly Carbon Footprint Calculation. J. Artif. Intell. Syst. 2024, 6, 59–75. [Google Scholar] [CrossRef] [Scilit]
- Kadam, S.R.; Devaseelan, S.; Nithya Jenev, A. Reinforcement Learning and Genetic Algorithm-Based Approach for Load Balancing and Resource Optimization in Cloud Data Centers. Int. J. Sci. Technol. 2025, 16, 1624. [Google Scholar] [CrossRef] [Scilit]
- Heidary, S.; Dehghanian, S.A.; Aslani, R.S.; Zahedi, R. Carbon-Aware Machine Learning for Energy-Efficient Quantum Data Centers: Joint Optimization of Workload Scheduling and Cooling. Glob. Environ. Eng. 2025, 12, 61–81. [Google Scholar] [CrossRef] [Scilit]
- PrakashPatel, P.J. Integrated Green Cloud Framework using Virtualization, Carbon-Aware Workload Migration, and Simulation for Sustainable Data Centers. J. Recent Innov. Sci. Technol. 2025, 1, 54–69. [Google Scholar] [CrossRef] [Scilit]
- Pal, S.K. AI-Driven Dynamic VM Consolidation and Renewable-Aware Scheduling for Reducing Carbon Footprint in Cloud Data Centers. Int. J. Appl. Math. 2025, 38, 83–105. [Google Scholar] [CrossRef] [Scilit]
- Ullah, A.; Razak, S.F.A.; Mrhari, A.; Yogarayan, S.; Kazmi, S.H.M. Improving Load Balancing Efficiency in Cloud Data Centers Through Hybrid Grey Wolf with Cat Swarm Optimization. Informatica 2025, 49, 121–136. [Google Scholar] [CrossRef] [Scilit]
- Kirupavathy, P.; Hareeni, C.; Jaya Varshini, K.; Terry Jemsy, S. Carbon-aware Cloud Resource Scheduling Using Reinforcement Learning for Energy Efficiency Data Centers. J. Ubiquitous Comput. Commun. Technol. 2026, 8, 233–247. [Google Scholar] [CrossRef] [Scilit]
- Om Priya, V.; Uma Nandhini, D. Carbon-Aware Intelligent Scheduling Framework for Energy-Efficient Green Cloud Computing. Int. J. Multidiscip. Res. 2026, 8, 79043. [Google Scholar] [CrossRef]
- Anderson, T.; Belay, A.; Chowdhury, M.; Cidon, A.; Zhang, I. Treehouse: A Case For Carbon-Aware Datacenter Software. ACM SIGEnergy Energy Inform. Rev. 2023, 3, 64–70. [Google Scholar] [CrossRef] [Scilit]
- Birahim, S.A. A net-grid-benefit test for interconnecting AI data centres. npj Environ. Soc. Sci. 2026, 1, 8. [Google Scholar] [CrossRef] [Scilit]
- Chauhan, M. Geothermal Energy Integration in Data Centers: A Pathway to Carbon-Neutral and AI-Optimized Cooling Systems. Int. J. Sci. Res. 2025, 14, 1701–1704. [Google Scholar] [CrossRef] [Scilit]
- Shah, D.; Vora, H. Green Data Centers: Merging IT Innovation with Energy-Efficient Cooling and Renewable Power. Int. J. Mech. Eng. Technol. 2025, 16, 132–160. [Google Scholar] [CrossRef] [Scilit]
- Vora, H. Evolving Cooling Strategies for Next—Generation Data Center Workloads. Int. J. Sci. Res. 2025, 14, 1882–1888. [Google Scholar] [CrossRef] [Scilit]
- Boafo, N.L.; Boahen, S.; Choi, J.M. Performance optimization and energy analysis of a proposed data center dual-mode air source cooling system on the mode change temperature. Case Stud. Therm. Eng. 2025, 74, 106957. [Google Scholar] [CrossRef] [Scilit]
- Lu, H.; Zhang, F.; Qian, C.; Wang, J.; Shang, M.; Shi, J.; Chen, J.; Lin, Z. Thermal-hydraulic performance of a cylindrical Diamond-TPMS heat exchanger for secondary-side data center liquid cooling. Case Stud. Therm. Eng. 2026, 83, 108164. [Google Scholar] [CrossRef] [Scilit]
- Dai, Y.; Liu, J.; Zou, S. Energy-saving and economic analysis of the data center cooling system using magnetic bearing chillers under different climate conditions. Case Stud. Therm. Eng. 2024, 61, 104915. [Google Scholar] [CrossRef] [Scilit]
- Wang, W.; Li, Y.; Lee, K. Effects of airflow distribution changes on the thermal environment of IT equipment in data centers. Case Stud. Therm. Eng. 2025, 73, 106604. [Google Scholar] [CrossRef] [Scilit]
- Heydari, A.; Gharaibeh, A.R.; Tradat, M.; Soud, Q.; Manaserh, Y.; Radmard, V.; Eslami, B.; Rodriguez, J.; Sammakia, B. Parameters of performance: A deep dive into liquid-to-air CDU assessment. Case Stud. Therm. Eng. 2024, 64, 105461. [Google Scholar] [CrossRef] [Scilit]
- Pakere, I.; Gončarovs, K.; Grāvelsiņš, A. Evaluation of the Data Centre Waste Heat Potential in District Heating in Latvia. CONECT. Int. Sci. Conf. Environ. Clim. Technol. 2023, 24. [Google Scholar] [CrossRef] [Scilit]
- Cai, W.; Li, H.; Zhai, C.; Li, D. Heat Recovery and Heating System for Liquid-Cooled Data Center: Energy, Economic, and Environmental Analysis. Clean Energy Sci. Technol. 2026, 4, 630. [Google Scholar] [CrossRef] [Scilit]
- Li, P.; Chen, M.; Liu, S.; Wang, S.; Liu, J.; Deng, Z. Optimization of a latent heat thermal energy storage device for waste heat recovery in data center campus. Case Stud. Therm. Eng. 2026, 80, 107898. [Google Scholar] [CrossRef] [Scilit]
- Khan, M.N.M.; Papia, S.K. Deep Learning Based Optimal Scheduling of Battery Energy Storage Systems Using Real-Time Market Signals and AI Data Center Load Forecasts. Energy Environ. Econ. 2024, 2, 10482. [Google Scholar] [CrossRef] [Scilit]
- Vijayakumar, R.M. Renewable Energy Integrated Hybrid Power Architecture for Sustainable Data Centers. Glob. J. Eng. Technol. Res. 2026, 2, 283–286. [Google Scholar] [CrossRef] [Scilit] [PubMed]
- He, Y.; Fan, J.; Lin, J.; Li, Z.; Zhang, J.; Tang, W.; Yang, Q. Two-stage robust planning of data center microgrid considering batch load flexibility and multi-energy complementarity. Energy Convers. Manag. X 2025, 28, 101266. [Google Scholar] [CrossRef] [Scilit]
- Bian, Y.; Xie, L.; Ma, L.; Zhang, H. A novel two-stage energy sharing method for data center cluster considering ‘Carbon-Green Certificate’ coupling mechanism. Energy 2024, 313, 133991. [Google Scholar] [CrossRef] [Scilit]
- Alawadhi, M.K.; Hadj-Alouane, A.B.; Said, Z. Techno-Economic Assessment of Waste Heat Recovery from Data Centres for District Energy Integration. Procedia Comput. Sci. 2026, 277, 2775–2784. [Google Scholar] [CrossRef] [Scilit]
- Lai, Y.; Fang, X.; Han, R.; Xuan, Y.; Huang, J. Design and key technology of the energy consumption management system for the liquid cooling data center. Energy Sci. Eng. 2023, 11, 1284–1293. [Google Scholar] [CrossRef] [Scilit]
- Uanov, R.; Begimbetova, A.S. Analysis of methods for assessing the energy efficiency of data centers using the power usage effectiveness method. IOP Conf. Ser. Mater. Sci. Eng. 2022, 1216, 012014. [Google Scholar] [CrossRef] [Scilit]
- Siddik, M.A.B.; Shehabi, A.; Marston, L. The environmental footprint of data centers in the United States. Environ. Res. Lett. 2021, 16, 064017. [Google Scholar] [CrossRef] [Scilit]
- Mytton, D. Data centre water consumption. npj Clean Water 2021, 4, 11, Correction in npj Clean Water 2021, 4, 49. [Google Scholar] [CrossRef] [Scilit]
- Chinnici, A.; Ahmadzada, E.; Kor, A.L.; De Chiara, D.; Domínguez-Díaz, A.; de Marcos Ortega, L.; Chinnici, M. Towards Sustainability and Energy Efficiency Using Data Analytics for HPC Data Center. Electronics 2024, 13, 3542. [Google Scholar] [CrossRef] [Scilit]
- Milić, V. Next-generation data center energy management: A data-driven decision-making framework. Front. Energy Res. 2024, 12, 1449358. [Google Scholar] [CrossRef] [Scilit]
- Alissa, H.; Nick, T.; Raniwala, A.; Arribas Herranz, A.; Frost, K.; Manousakis, I.; Lio, K.; Warrier, B.; Oruganti, V.; DiCaprio, T.J.; et al. Using life cycle assessment to drive innovation for sustainable cool clouds. Nature 2025, 641, 331–338. [Google Scholar] [CrossRef] [Scilit] [PubMed]
- Stacciarini, J.H.S.; Gonçalves, R.J.A.F. Data Centers, Critical Minerals, Energy, and Geopolitics: The Foundations of Artificial Intelligence. Soc. Nat. 2025, 37, e77215. [Google Scholar] [CrossRef] [Scilit]
- Fan, Y.V.; Wilson, C.; Kamiya, G.; Mastrucci, A. Data centre energy demand projections within shared socioeconomic pathways. Energy Clim. Change 2026, 7, 100253. [Google Scholar] [CrossRef] [Scilit]
- Mishchenko, V.; Naumenkova, S.; Mishchenko, S.; Tishchenko, I. An integrated approach to assessing data center efficiency: The Ukrainian context. Probl. Perspect. Manag. 2026, 24, 670–685. [Google Scholar] [CrossRef] [Scilit]
- Chountalas, P.T.; Chrysikopoulos, S.K.; Agoraki, K.K.; Chatzifoti, N. Modeling Critical Success Factors for Green Energy Integration in Data Centers. Sustainability 2025, 17, 3543. [Google Scholar] [CrossRef] [Scilit]
- Safari, A.; Sorouri, H.; Rahimi, A.; Oshnoei, A. A Systematic Review of Energy Efficiency Metrics for Optimizing Cloud Data Center Operations and Management. Electronics 2025, 14, 2214. [Google Scholar] [CrossRef] [Scilit]
- Song, Z.; Chen, L.; Jia, M. Toward a sustainable energy future: Can green data center construction promote energy efficiency? Energy Rep. 2026, 15, 109166. [Google Scholar] [CrossRef] [Scilit]
- Wang, Y.; Lei, H.; Zhang, W.; Jia, E.; Guo, F. Analysis of China’s power development and the impact of data center energy consumption. Front. Energy Res. 2026, 14, 1774740. [Google Scholar] [CrossRef] [Scilit]
- Surjandari, I.; Sinaga, E.J.; Bahri, C. Digital carbon footprint assessment of Universitas Indonesia data center based on the GHG protocol. Discov. Sustain. 2026, 7, 892. [Google Scholar] [CrossRef] [Scilit]
- Setyo, Z.G.M.; Rijal, H.B.; Aqilah, N.; Abdullah, N. Energy Efficiency Measurement Method and Thermal Environment in Data Centers—A Literature Review. Energies 2025, 18, 3689. [Google Scholar] [CrossRef] [Scilit]
- Wang, L.; Shao, J. The impact of data center green transformation on energy efficiency: A quasi-natural experiment based on national green data center pilot. Environ. Dev. Sustain. 2026. [Google Scholar] [CrossRef] [Scilit]
- Flores-Martin, D.; Lemus-Prieto, F.; Rico-Gallego, J.A. PULSE: A modular framework for predictive energy efficiency in heterogeneous data centers. SoftwareX 2025, 31, 102313. [Google Scholar] [CrossRef] [Scilit]
- Mytton, D.; Ashtine, M.; Wheeler, S.; Wallom, D. Stretched grid? Managing data center energy demand and grid capacity. Oxf. Open Energy 2023, 2, oiad014. [Google Scholar] [CrossRef] [Scilit]
- Chatlatanagulchai, W.; Chantrapornchai, C. Energy consumption data collection: Case study on data center in a Thai University. Energy Inform. 2024, 7, 26. [Google Scholar] [CrossRef] [Scilit]
- Muraña, J. Empirical power consumption characterization and energy aware scheduling in data centers. CLEI Electron. J. 2021, 24, 3:1–3:28. [Google Scholar] [CrossRef] [Scilit]
- Haruna, A.A.; Muhammad, L.J.; Abubakar, M. An Expert Green Scheduling System for Saving Energy Consumption. Artif. Intell. Appl. 2022, 4, 18–25. [Google Scholar] [CrossRef]
- Osnes, I.; Yazidi, A.; Jacobsen, H.-A.; Eliassen, F.; Sartori, S. Harnessing Task Usage Prediction and Latency Sensitivity for Scheduling Workloads in Wind-Powered Data Centers. Energies 2022, 15, 4469. [Google Scholar] [CrossRef] [Scilit]
- Adamuthe, A.C.; Kupwade, V.D. Optimizing Energy Efficiency in Cloud Data center using an Enhanced Dualist Algorithm with Improved Exploration. EAI Endorsed Trans. Energy Web 2024, 11, e3498. [Google Scholar] [CrossRef] [Scilit]
- Miao, Z.; Liu, L.; Nan, H.; Li, W.; Pan, X.; Yang, X.; Yu, M.; Chen, H.; Zhao, Y. Energy and carbon-aware distributed machine learning tasks scheduling scheme for the multi-renewable energy-based edge-cloud continuum. Sci. Technol. Energy Transit. 2024, 79, 82. [Google Scholar] [CrossRef] [Scilit]
- Lavanya, V.; Saravanan, M. Reinforcement Learning Framework for Optimizing Trade-offs Between Energy-Aware and Makespan Workload Scheduling in Cloud Computing. J. Internet Serv. Inf. Secur. 2025, 15, 647–660. [Google Scholar] [CrossRef] [Scilit]
- Gayathri, A.; Hussain, M.M.; Srinivasan, V.; Ambeth Raja, A.; Jayanthi, R. An Optimized Intelligent Framework for Sustainable and Energy-Efficient Data Center Operations Using SecureSustainNet. Kufa J. Eng. 2026, 17, 73–95. [Google Scholar] [CrossRef] [Scilit]
- Mamodiya, U.; Kishor, I.; Mudholkar, P.; Alqutaish, A.; Alradwan, G.; Obeidat, M. A Robust Smart Grid-Aware Cloud Computing Framework for Sustainable Energy Management. Int. J. Adv. Soft Comput. Appl. 2026, 18, 396–433. [Google Scholar] [CrossRef] [Scilit]
- Agrawal, R.; Sudeshna; Sharma, R.; Kumar, P. Sustainable AI Computing through Dynamic Workload Scheduling and Carbon-Aware Neural Network Optimization. Int. J. Comput. Inf. Syst. Ind. Manag. Appl. 2026, 18, 407–418. [Google Scholar] [CrossRef] [Scilit]
- Tantoun, S. Workload-Aware Energy-Efficient Query Scheduling for Cloud Database Systems: Experimental Study. AlQalam J. Med. Appl. Sci. 2026, 9, 441–447. [Google Scholar] [CrossRef] [Scilit]
- Zhao, D.; Zhou, J. An energy and carbon-aware algorithm for renewable energy usage maximization in distributed cloud data centers. J. Parallel Distrib. Comput. 2022, 165, 156–166. [Google Scholar] [CrossRef] [Scilit]
- Zhao, D.; Zhou, J.T.; Li, K. CFWS: DRL-Based Framework for Energy Cost and Carbon Footprint Optimization in Cloud Data Centers. IEEE Trans. Sustain. Comput. 2025, 10, 95–107. [Google Scholar] [CrossRef] [Scilit]
- Khalil, M.I.K.; Shah, S.A.A.; Taj, A.; Shiraz, M.; Alamri, B.; Murawwat, S.; Hafeez, G. Renewable-Aware Geographical Load Balancing Using Option Pricing for Energy Cost Minimization in Data Centers. Processes 2022, 10, 1983. [Google Scholar] [CrossRef] [Scilit]
- Han, J.; Tong, N.; Lin, J.; Han, Y.; Wang, Y.; Han, K.; Li, Y. Distributionally robust co-optimization of computing workloads and renewable energy uncertainties in geo-distributed data centers considering multi-element influences. Energy Convers. Manag. X 2026, 29, 101432. [Google Scholar] [CrossRef] [Scilit]
- Mondal, S.; Faruk, F.B.; Rajbongshi, D.; Efaz, M.M.K.; Islam, M.M. GEECO: Green Data Centers for Energy Optimization and Carbon Footprint Reduction. Sustainability 2023, 15, 15249. [Google Scholar] [CrossRef] [Scilit]
- Danach, K.; Hamze, K.; Harb, H.; Kanj, H. Carbon-Aware Scheduling in Cloud Computing Operations: A Multi-Objective Optimisation Approach. IET Smart Grid 2026, 9, e70056. [Google Scholar] [CrossRef] [Scilit]
- Kahil, H.; Sharma, S.; Välisuo, P.; Elmusrati, M. Reinforcement learning for data center energy efficiency optimization: A systematic literature review and research roadmap. Appl. Energy 2025, 389, 125734. [Google Scholar] [CrossRef] [Scilit]
- Bu, X.; Sun, H.; Tian, F.; Li, X. A Two-Stage VM Migration Framework for Power-Constrained Data Center Load Scheduling. Sensors 2026, 26, 4041. [Google Scholar] [CrossRef] [Scilit] [PubMed]
- Zhao, J.; Zhang, Z.; Huang, K.; Xu, B.; Gao, Y. Low-carbon data center optimization considering aggregated utilization of fragmented resources. Int. J. Electr. Power Energy Syst. 2026, 178, 111949. [Google Scholar] [CrossRef] [Scilit]
- Ammari, A.C.; Labidi, W.; Al-Hmouz, R. Adaptive Multi-Objective Firefly Optimization for Energy-Efficient and QoS-Aware Scheduling in Distributed Green Data Centers. Energies 2025, 18, 2940. [Google Scholar] [CrossRef] [Scilit]
- Arshad, U.; Aleem, M.; Srivastava, G.; Lin, J.C.W. Utilizing power consumption and SLA violations using dynamic VM consolidation in cloud data centers. Renew. Sustain. Energy Rev. 2022, 167, 112782. [Google Scholar] [CrossRef] [Scilit]
- Rjeib, H.D.; Kecskemeti, G. VMP-ER: An Efficient Virtual Machine Placement Algorithm for Energy and Resources Optimization in Cloud Data Center. Algorithms 2024, 17, 295. [Google Scholar] [CrossRef] [Scilit]
- Jamal, M.H.; Chaudhry, M.T.; Tahir, U.; Rustam, F.; Hur, S.; Ashraf, I. Hotspot-Aware Workload Scheduling and Server Placement for Heterogeneous Cloud Data Centers. Energies 2022, 15, 2541. [Google Scholar] [CrossRef] [Scilit]
- Ismail, L.; Materwala, H. PowerGen: Resources Utilization and Power Consumption Data Generation Framework for Energy Prediction in Edge and Cloud Computing. Procedia Comput. Sci. 2024, 238, 385–395. [Google Scholar] [CrossRef] [Scilit]
- Rahmani, R.; Moser, I.; Cricenti, A.L. Inter-continental Data Centre Power Load Balancing for Renewable Energy Maximisation. Electronics 2022, 11, 1564. [Google Scholar] [CrossRef] [Scilit]
- Bayati, L. Greedy window stochastic optimization algorithm for reducing data center energy consumption. Flex. Serv. Manuf. J. 2025. [Google Scholar] [CrossRef] [Scilit]
- Li, Z.; Lin, K.; Cheng, S.; Yu, L.; Qian, J. Energy-Efficient and Load-Aware VM Placement in Cloud Data Centers. J. Grid Comput. 2022, 20, 39. [Google Scholar] [CrossRef] [Scilit]
- Ye, G. Coordinated Optimization Scheduling of Data Center and Electricity Retailer Based on Cooperative Game Theory. CPSS Trans. Power Electron. Appl. 2022, 7, 273–282. [Google Scholar] [CrossRef] [Scilit]
- Saleem, M.; Shakir, M.; Usman, M.; Bajwa, M.; Shabbir, N.; Shams Ghahfarokhi, P.; Daniel, K. Integrating Smart Energy Management System with Internet of Things and Cloud Computing for Efficient Demand Side Management in Smart Grids. Energies 2023, 16, 4835. [Google Scholar] [CrossRef] [Scilit]
- Zhang, P.; Yang, P.; Zhao, Z.; Lai, C.S.; Lai, L.L.; Shahidehpour, M. A Framework for Several Electricity Retailers Cooperatively Implement Demand Response to Distributed Data Center. IEEE Trans. Smart Grid 2023, 14, 277–289. [Google Scholar] [CrossRef] [Scilit]
- Zhang, S.; Gao, J.; Qian, H.; Yu, J.; Luo, S.; Guo, Q. Power system operational reliability assessment based on the data center energy consumption elastic space. Front. Energy Res. 2024, 12, 1370861. [Google Scholar] [CrossRef] [Scilit]
- Takci, M.T.; Qadrdan, M.; Summers, J.; Gustafsson, J. Data centres as a source of flexibility for power systems. Energy Rep. 2025, 13, 3661–3671. [Google Scholar] [CrossRef] [Scilit]
- Caprara, A.; Yu, Y.; Teng, F.; Junyent-Ferré, A.; Bullich-Massagué, E.; Aragüés-Peñalba, M. Data center workload flexibility for power system demand response: Evidence from Alibaba traces. Int. J. Electr. Power Energy Syst. 2026, 178, 111940. [Google Scholar] [CrossRef] [Scilit]
- Zhang, Y.; Wilson, D.C.; Paschalidis, I.C.; Coskun, A.K. HPC Data Center Participation in Demand Response: An Adaptive Policy With QoS Assurance. IEEE Trans. Sustain. Comput. 2022, 7, 157–171. [Google Scholar] [CrossRef] [Scilit] [PubMed]
- Ginzburg-Ganz, E.; Lifshits, P.; Machlev, R.; Belikov, J.; Krieger, Z.; Levron, Y. Technical Challenges of AI Data Center Integration into Power Grids—A Survey. Energies 2026, 19, 137. [Google Scholar] [CrossRef] [Scilit]
- Jiang, C.; Tseng, C.L.; Wang, Y.; Lan, Z.; Wen, F.; Chen, F.; Liang, L. Optimal Pricing Strategy for Data Center Considering Demand Response and Renewable Energy Source Accommodation. J. Mod. Power Syst. Clean Energy 2023, 11, 345–354. [Google Scholar] [CrossRef] [Scilit]
- Aneli, S.; Tina, G.M.; Gagliano, A. Modelling and experimental surveys on the energy consumption of a small-scale data center. Energy Effic. 2025, 18, 67. [Google Scholar] [CrossRef] [Scilit]
- Ghobadi, K.; Khan, A.A. Using spatial-temporal flexibility of data center building in energy management of distribution grid coupled with multi-energy hubs and energy storage. Energy Rep. 2025, 14, 4477–4491. [Google Scholar] [CrossRef] [Scilit]
- Ross, B.A.; Lyu, X.; Nwaneto, U.C.; Mohiuddin, S.M.; Nassif, A.B. Using Grid-Forming Energy Storage Systems to Provide Dynamic Active Power Support for Hyperscale Data Center. IEEE Access 2026, 14, 29250–29259. [Google Scholar] [CrossRef] [Scilit]
- Wang, Z.; Zhang, J.; Liu, J.; Huang, J.; Zhu, G.; Yu, C.; Zhou, H. Data association load uncertainty and risk aversion in electricity markets with data center participation in the demand response. Energy Rep. 2024, 11, 483–497. [Google Scholar] [CrossRef] [Scilit]
- Wang, Q.; Zhang, Z.; Yu, C.; Wu, S.; Hu, J.; Tang, Y.; Zhang, M. Source–Grid–Load Coordinated Resilience Enhancement for Distribution Networks Considering the Flexibility of Data Centre Resources Under Fault Conditions. IET Smart Grid 2026, 9, e70088. [Google Scholar] [CrossRef] [Scilit]
- Chen, C.; Nyangon, J.; Ibrahim, T.; Ali, T. Probabilistic resource adequacy assessment of ERCOT under high data center load growth and high renewable energy potential through 2050. Environ. Res. Energy 2026, 3, 035005. [Google Scholar] [CrossRef] [Scilit]
- Gyang, P.; Chakraborty, P.; Meegahapola, L.; Yu, X. Grid-Integrated Data Centers: Architectures, Modeling, Interconnection Requirements, Challenges, and Opportunities. IEEE Open J. Ind. Electron. Soc. 2026, 7, 1080–1112. [Google Scholar] [CrossRef] [Scilit]
- Wang, Y.; Jia, L.; Zhao, J.; Zhang, H.; Zhu, Y.; Guo, Y. A Risk-Aware Coordinated Optimisation Scheduling Method for Coupled Power-Computing-Network-Storage Systems in Remote Data Centres Based on Graph Attention, Green Affinity and CVaR. Energies 2026, 19, 2892. [Google Scholar] [CrossRef] [Scilit]
- Shamseldein, M. Deep Reinforcement Learning-Based Load-Side Resonance Forcing via Hyper-Scale Data Center Load Modulation. IET Smart Grid 2026, 9, e70083. [Google Scholar] [CrossRef] [Scilit]
- Kumar, R.; Khatri, S.K.; Diván, M.J. Power Usage Efficiency (PUE) Optimization with Counterpointing Machine Learning Techniques for Data Center Temperatures. Int. J. Math. Eng. Manag. Sci. 2021, 6, 1594–1611. [Google Scholar] [CrossRef] [Scilit]
- Agung Pambudi, N.; Muhamad Yusuf, A.; Sarifudin, A. The Use of Single-Phase Immersion Cooling by Using Two Types of Dielectric Fluid for Data Center Energy Savings. Energy Eng. 2022, 119, 275–286. [Google Scholar] [CrossRef] [Scilit]
- Yu, H.; Zhang, T.; Chen, L.; Tao, W.Q. Refrigeration equipment model construction based in data center cooling station. Int. J. Green Energy 2023, 20, 1741–1749. [Google Scholar] [CrossRef] [Scilit]
- Zhou, C.; Hu, Y.; Liu, R.; Liu, Y.; Wang, M.; Luo, H.; Tian, Z. Energy Performance Study of a Data Center Combined Cooling System Integrated with Heat Storage and Waste Heat Recovery System. Buildings 2025, 15, 326. [Google Scholar] [CrossRef] [Scilit]
- Tareen, M.S.; Zueter, A.F.; Zolfagharroshan, M.; Xu, M.; Sasmito, A.P. Seasonal ground cold energy storage potential for data center cooling using thermosyphon: A comparative study of five cities in Canada for carbon footprint reduction. J. Energy Storage 2024, 84, 111486. [Google Scholar] [CrossRef] [Scilit]
- Li, X.; Xu, Z.; Liu, S.; Zhang, X.; Sun, H. Server performance optimization for single-phase immersion cooling data center. Appl. Therm. Eng. 2023, 224, 120080. [Google Scholar] [CrossRef] [Scilit]
- Li, X.; Guo, S.; Sun, H.; Liu, S.; Wang, X.; Wang, L. Comprehensive assessment of coolants used single-phase immersion cooling data center. Energy 2025, 340, 139240. [Google Scholar] [CrossRef] [Scilit]
- Huang, X.; Yan, J.; Zhou, X.; Wu, Y.; Hu, S. Cooling Technologies for Internet Data Center in China: Principle, Energy Efficiency, and Applications. Energies 2023, 16, 7158. [Google Scholar] [CrossRef] [Scilit]
- Cáceres González, R.; Díaz, A.J.; Rojas, O.D.; Sarmiento-Laurel, C. Assessing solar absorption chillers for data center cooling across diverse climatic conditions. Energy Build. 2025, 331, 115376. [Google Scholar] [CrossRef] [Scilit]
- Xin, Y.; Yu, D.; Ren, X. Research on Design and Optimization of Economic Operation for Indirect Liquid Cooling System in Data Center Servers. Energies 2026, 19, 3068. [Google Scholar] [CrossRef] [Scilit]
- Li, Y.; Zhu, C.; Li, X.; Yang, B. A Review of Non-Uniform Load Distribution and Solutions in Data Centers: Micro-Scale Liquid Cooling and Large-Scale Air Cooling. Energies 2025, 18, 149. [Google Scholar] [CrossRef] [Scilit]
- Liu, J.; Fan, R.; Li, Z.; Harnpornchai, N.; Qian, J. Proactive Cooling Control Algorithm for Data Centers Based on LSTM-Driven Predictive Thermal Analysis. Appl. Syst. Innov. 2026, 9, 21. [Google Scholar] [CrossRef] [Scilit]
- Alkasmoul, F.S.; Almogbel, A.M.; Shahzad, M.W.; Al-damook, A.J. Thermal performance and optimum concentration of different nanofluids in immersion cooling in data center servers. Results Eng. 2025, 25, 103699. [Google Scholar] [CrossRef] [Scilit]
- Kim, J.H.; Shin, D.U.; Kim, H. Data Center Energy Evaluation Tool Development and Analysis of Power Usage Effectiveness with Different Economizer Types in Various Climate Zones. Buildings 2024, 14, 299. [Google Scholar] [CrossRef] [Scilit]
- Borkowski, M.; Piłat, A.K. Customized data center cooling system operating at significant outdoor temperature fluctuations. Appl. Energy 2022, 306, 117975. [Google Scholar] [CrossRef] [Scilit]
- Hnayno, M.; Chehade, A.; Klaba, H.; Polidori, G.; Maalouf, C. Experimental investigation of an optimized indirect free cooling system including a dry cooler equipped with evaporative cooling pads for data center. Energy Rep. 2023, 9, 460–469. [Google Scholar] [CrossRef] [Scilit]
- Chang, Q.; Huang, Y.; Liu, K.; Xu, X.; Wan, T.; Li, C.; Zhao, Y.; Pan, S. Dynamic Optimization of a Liquid-Cooled Data Center Based on Hourly Outdoor Air Temperature and Humidity Using a Variable-Frequency Water Pump. IEEE Access 2026, 14, 20639–20658. [Google Scholar] [CrossRef] [Scilit]
- Zhu, H.; Yu, J. Numerical investigation of thermal environment in data centers based on fluid flow analysis. Int. J. Fluid Eng. 2026, 3, 033904. [Google Scholar] [CrossRef] [Scilit]
- Wu, Y.; Yan, J.; Zhou, X. Optimization of Airflow Organization in Bidirectional Air Supply Data Centers in China. Appl. Sci. 2025, 15, 5711. [Google Scholar] [CrossRef] [Scilit]
- Xu, S.; Zhang, H.; Wang, Z. Thermal Management and Energy Consumption in Air, Liquid, and Free Cooling Systems for Data Centers: A Review. Energies 2023, 16, 1279. [Google Scholar] [CrossRef] [Scilit]
- Chen, H.; Li, D.; Wang, S.; Chen, T.; Zhong, M.; Ding, Y.; Li, Y.; Huo, X. Numerical Investigation of Thermal Performance with Adaptive Terminal Devices for Cold Aisle Containment in Data Centers. Buildings 2023, 13, 268. [Google Scholar] [CrossRef] [Scilit]
- Borkowski, M.; Piłat, A.K. Energy Efficiency Increase Achieved by Dedicated Rule-Based Control of Chillers Operating in the Data Center. Energies 2022, 15, 2419. [Google Scholar] [CrossRef] [Scilit]
- Wu, X.; Shao, S.; Akkurt, N. Investigation on application of plate-tube evaporative condensating technology for data centres in the northwest of China. Energy Rep. 2023, 9, 4713–4720. [Google Scholar] [CrossRef] [Scilit]
- Huang, N.; Li, X.; Xu, Q.; Chen, R.; Chen, H.; Chen, A. Artificial Intelligence-Based Temperature Twinning and Pre-Control for Data Center Airflow Organization. Energies 2023, 16, 6063. [Google Scholar] [CrossRef] [Scilit]
- Zhang, Z.; Ling, L.; He, J.; Yang, H. A Bayesian-Optimized LightGBM Approach for Reliable Cooling Load Prediction. Buildings 2026, 16, 1357. [Google Scholar] [CrossRef] [Scilit]
- Liu, H.; Aljbri, A.; Song, J.; Jiang, J.; Hua, C. Research Advances on AI-Powered Thermal Management for Data Centers. Tsinghua Sci. Technol. 2022, 27, 303–314. [Google Scholar] [CrossRef] [Scilit]
- Chi, C.; Ji, K.; Song, P.; Marahatta, A.; Zhang, S.; Zhang, F.; Qiu, D.; Liu, Z. Cooperatively Improving Data Center Energy Efficiency Based on Multi-Agent Deep Reinforcement Learning. Energies 2021, 14, 2071. [Google Scholar] [CrossRef] [Scilit]
- Hao, G.; Jin, J.; Zhong, C. Topology Optimization and Material Selection of Cooling Fin Structure in Submarine Data Center. J. Phys. Conf. Ser. 2022, 2247, 012007. [Google Scholar] [CrossRef] [Scilit]
- Ljungdahl, V.; Jradi, M.; Veje, C. A decision support model for waste heat recovery systems design in Data Center and High-Performance Computing clusters utilizing liquid cooling and Phase Change Materials. Appl. Therm. Eng. 2021, 201, 117671. [Google Scholar] [CrossRef] [Scilit]
- Al-Sayyab, A.K.S.; Navarro-Esbrí, J.; Barragán-Cervera, A.; Mota-Babiloni, A. Techno-economic analysis of a PV/T waste heat–driven compound ejector-heat pump for simultaneous data centre cooling and district heating using low global warming potential refrigerants. Mitig. Adapt. Strateg. Glob. Change 2022, 27, 43. [Google Scholar] [CrossRef] [Scilit]
- Lu, T.; Lü, X.; Välisuo, P.; Zhang, Q.; Clements-Croome, D. Innovative approaches for deep decarbonization of data centers and building space heating networks: Modeling and comparison of novel waste heat recovery systems for liquid cooling systems. Appl. Energy 2023, 357, 122473. [Google Scholar] [CrossRef] [Scilit]
- Montagud-Montalvá, C.; Navarro-Peris, E.; Gómez-Navarro, T.; Masip-Sanchis, X.; Prades-Gil, C. Recovery of waste heat from data centres for decarbonisation of university campuses in a Mediterranean climate. Energy Convers. Manag. 2023, 290, 117212. [Google Scholar] [CrossRef] [Scilit]
- Terenius, P.; Garraghan, P.; Harper, R. A material social view on data center waste heat: Novel uses and metrics. Front. Sustain. 2023, 3, 1008583. [Google Scholar] [CrossRef] [Scilit]
- Pakere, I.; Goncarovs, K.; Grāvelsiņš, A.; Zirne, M.A. Dynamic Modelling of Data Center Waste Heat Potential Integration in District Heating in Latvia. Energies 2024, 17, 445. [Google Scholar] [CrossRef] [Scilit]
- Yoon, S.; Kang, S.; Seok, S.; Moon, J.; An, S. Improving Smart Farm Heating Performance and Energy Efficiency by Means of AI Data Center Waste-Heat Recovery. Hortic. Sci. Technol. 2025, 44, 224–235. [Google Scholar] [CrossRef] [Scilit]
- Romanov, D.; Chakraborty, I.; Holler, S. Comparative analysis of scenarios of data center waste heat utilization for district heating networks of different generations. Energy Convers. Manag. 2025, 334, 119856, Correction in Energy Convers. Manag. 2027, 372, 122260. [Google Scholar] [CrossRef] [Scilit]
- Murphy, M.D.; Allen, A.; Henze, G.P.; Long, N.L. Optimal environmental and economic performance trade-offs for fifth generation district heating and cooling network topologies with waste heat recovery. Energy Convers. Manag. 2024, 309, 118322. [Google Scholar] [CrossRef] [Scilit]
- He, Q.; Qu, C.; Zuo, W. Planning Waste-to-Energy-Coupled AI Data Centers Through Grade-Matched Cooling and Corridor Screening. Thermo 2026, 6, 28. [Google Scholar] [CrossRef] [Scilit]
- Tervo, S.; Syri, S.; Hiltunen, P. Reducing district heating carbon dioxide emissions with data center waste heat—Region perspective. Renew. Sustain. Energy Rev. 2025, 208, 114992. [Google Scholar] [CrossRef] [Scilit]
- Li, H.; Hou, J.; Hong, T.; Ding, Y.; Nord, N. Energy, economic, and environmental analysis of integration of thermal energy storage into district heating systems using waste heat from data centres. Energy 2021, 219, 119582. [Google Scholar] [CrossRef] [Scilit]
- Verzino, A.; Talluri, L.; Rocchetti, A.; Socci, L. Smart Reuse of Waste Heat from Data Centres: Energy and Exergy Analysis for a District-Heating Network in Bulgaria. Energies 2026, 19, 800. [Google Scholar] [CrossRef] [Scilit]
- Tervo, S.; Hiltunen, P.; Syri, S. Data center waste heat utilization in district heating in a volatile low-carbon electricity market. Clean. Environ. Syst. 2025, 19, 100373. [Google Scholar] [CrossRef] [Scilit]
- Chen, Z.; Wu, X.; Tan, Z.; Xiao, J.; Wang, N. Techno-Economic Analysis and Multi-Objective Optimization of a Novel Combined Cooling and Power System Driven by Geothermal Source and Waste Heat From Data Center. Energy Sci. Eng. 2026, 14, 4300–4315. [Google Scholar] [CrossRef] [Scilit]
- Wang, P.; Kowalski, S.; Gao, Z.; Sun, J.; Yang, C.M.; Grant, D.; Boudreaux, P.; Huff, S.; Nawaz, K. District heating utilizing waste heat of a data center: High-temperature heat pumps. Energy Build. 2024, 315, 114327. [Google Scholar] [CrossRef] [Scilit]
- Kuzay, M.; Demirel, E.; Yilmaz, C.; Koirala, B.P.; Heer, P. Maximizing waste heat recovery from a building-integrated edge data center. Sci. Rep. 2025, 15, 38724. [Google Scholar] [CrossRef] [Scilit] [PubMed]
- Socci, L.; Rocchetti, A.; Verzino, A.; Zini, A.; Talluri, L. Enhancing third-generation district heating networks with data centre waste heat recovery: Analysis of a case study in Italy. Energy 2024, 313, 134013. [Google Scholar] [CrossRef] [Scilit]
- Požgaj, D.; Delač, B.; Pavković, B.; Medica-Viola, V. Energy Efficiency Through Waste-Heat Recovery: Hybrid Data-Centre Cooling in District Heating Applications. Appl. Sci. 2025, 16, 323. [Google Scholar] [CrossRef] [Scilit]
- Shen, R.; Zheng, R. An improved control method of district heating system based on waste heat utilization in data center. J. Phys. Conf. Ser. 2025, 2975, 012004. [Google Scholar] [CrossRef] [Scilit]
- Gupta, R.; Puri, I.K. Waste heat recovery in a data center with an adsorption chiller: Technical and economic analysis. Energy Convers. Manag. 2021, 245, 114576. [Google Scholar] [CrossRef] [Scilit]
- Wang, P.; Pan, L.; He, G.; Li, G.; Song, J.; Zhou, M.; Wang, J. Constructing a Biomass-Data Center Nexus for Circular Economy-Based Energy Systems Integration. IEEE Open Access J. Power Energy 2025, 12, 270–283. [Google Scholar] [CrossRef] [Scilit]
- Khosravi, A.; Laukkanen, T.; Vuorinen, V.; Syri, S. Waste heat recovery from a data centre and 5G smart poles for low-temperature district heating network. Energy 2021, 218, 119468. [Google Scholar] [CrossRef] [Scilit]
- Chicherin, S. Evaluating Waste Heat Potential for Fifth Generation District Heating and Cooling (5GDHC): Analysis Across 26 Building Types and Recovery Strategies. Processes 2025, 13, 1730. [Google Scholar] [CrossRef] [Scilit]
- Wang, D.; Xie, C.; Wu, R.; Lai, C.S.; Li, X.; Zhao, Z.; Wu, X.; Xu, Y.; Lai, L.L.; Wei, J. Optimal Energy Scheduling for Data Center With Energy Nets Including CCHP and Demand Response. IEEE Access 2021, 9, 6137–6151. [Google Scholar] [CrossRef] [Scilit]
- Zhu, Y.; Wang, J.; Bi, K.; Sun, Q.; Zong, Y.; Zong, C. Energy Optimal Dispatch of the Data Center Microgrid Based on Stochastic Model Predictive Control. Front. Energy Res. 2022, 10, 863292. [Google Scholar] [CrossRef] [Scilit]
- Hao, X.; Liu, P.; Deng, Y. Joint optimization of operational cost and carbon emission in multiple data center micro-grids. Front. Energy Res. 2024, 12, 1344837. [Google Scholar] [CrossRef] [Scilit]
- Ayyildiz, E.; Yildirim, B.; Aydin, N. Location selection methodology for data center with renewable energy integration. Renew. Energy 2025, 250, 123270. [Google Scholar] [CrossRef] [Scilit]
- Fatah, I.; Hakam, D.F.; Nugraha, D.B. Techno-Economic Feasibility and Emission Reduction of 60 MW Wind Power Plants for Data Center in West Java Indonesia Using RETScreen. Indones. J. Urban Environ. Technol. 2025, 8, 157–176. [Google Scholar] [CrossRef] [Scilit]
- Gnibga, W.E.; Blavette, A.; Orgerie, A.C. Renewable Energy in Data Centers: The Dilemma of Electrical Grid Dependency and Autonomy Costs. IEEE Trans. Sustain. Comput. 2024, 9, 315–328. [Google Scholar] [CrossRef] [Scilit]
- Cui, Y.; Cheng, Y.; Zhu, H.; Zhao, Y.; Zhong, W. Stochastic optimization for capacity configuration of data center microgrid thermal energy management equipment considering flexible resources. Int. J. Electr. Power Energy Syst. 2024, 160, 110132. [Google Scholar] [CrossRef] [Scilit]
- Amin, S.M.M.; Hossain, N.; Lipu, M.S.H.; Urooj, S.; Akter, A. Development of a PV/Battery Micro-Grid for a Data Center in Bangladesh: Resilience and Sustainability Analysis. Sustainability 2023, 15, 15691. [Google Scholar] [CrossRef] [Scilit]
- Rollinson, W.; Urquhart, A.; Thomson, M. Technoeconomic Feasibility of Wind and Solar Generation for Off-Grid Hyperscale Data Centres. Energies 2025, 18, 382. [Google Scholar] [CrossRef] [Scilit]
- Wang, Y.; Liu, S.; Liu, S.; Liu, L. Electricity-computility integration of data centers and pumped storage driven by cold energy storage in China. Energy Rep. 2025, 14, 4068–4085. [Google Scholar] [CrossRef] [Scilit]
- Chen, X.; Zhang, M.; Jiang, S.; Gou, H.; Zhou, P.; Yang, R.; Shen, B. Energy reliability enhancement of a data center/wind hybrid DC network using superconducting magnetic energy storage. Energy 2023, 263, 125622. [Google Scholar] [CrossRef] [Scilit]
- Liang, J.; Chen, D.; Xu, S. Energy-Constrained Optimization of Data Center Layouts: An Integer Linear Programming Approach. Energies 2025, 18, 5040. [Google Scholar] [CrossRef] [Scilit]
- Ma, L.; Shi, H.; Liu, G.; Lu, W.; Gu, N. Low-Carbon Economic Dispatch of Data Center Microgrids via Heat-Determined Computing and Tiered Carbon Trading. Energies 2026, 19, 699. [Google Scholar] [CrossRef] [Scilit]
- Chu, X.; Wang, P.; Zhao, R. Optimal Scheduling of Data Center Clusters with Distributed and Shared Energy Storage Under a Carbon Trading Mechanism. Sustainability 2026, 18, 7359. [Google Scholar] [CrossRef] [Scilit]
- Kontani, R.; Tanaka, K. Integrating variable renewable energy and diverse flexibilities: Supplying carbon-free energy from a wind turbine to a data center. Urban Clim. 2024, 54, 101843. [Google Scholar] [CrossRef] [Scilit]
- Chu, X.; Yin, L. Collaborative Optimal Scheduling of Hybrid Energy System for Data Center and Electric Vehicles Based on Computing Tasks Transferring Under Carbon Trading Mechanism. Energies 2026, 19, 1138. [Google Scholar] [CrossRef] [Scilit]
- Lian, Y.; Li, Y.; Zhao, Y.; Yu, C.; Zhao, T.; Wu, L. Robust multi-objective optimization for islanded data center microgrid operations. Appl. Energy 2023, 330, 120344. [Google Scholar] [CrossRef] [Scilit]
- Ajagekar, A.; You, F. Variational quantum circuit learning-enabled robust optimization for AI data center energy control and decarbonization. Adv. Appl. Energy 2024, 14, 100179. [Google Scholar] [CrossRef] [Scilit]
- Mohammadi, S.; Wang, W.; Wada, M.C.I.; Haghighi, R.; Hassan, A.; Liu, H.; Bhatnagar, A.; Chen, A.; Su, W. Grid integration of AI data centers: A critical review of energy storage solutions. Adv. Appl. Energy 2026, 23, 100291. [Google Scholar] [CrossRef] [Scilit]
- Khosravi, A.; Sandoval, O.R.; Taslimi, M.S.; Sahrakorpi, T.; Amorim, G.; Garcia Pabon, J.J. Review of energy efficiency and technological advancements in data center power systems. Energy Build. 2024, 323, 114834. [Google Scholar] [CrossRef] [Scilit]
- Li, F.; Xing, L.; Su, W.; Lin, X.; Liang, Y.; Shi, W. An idea to construct integrated energy systems of data center by combining CO2 heat pump and compressed CO2 energy storage. J. Energy Storage 2024, 75, 109581. [Google Scholar] [CrossRef] [Scilit]
- Azizi, A.; Morovati, S.; Zamani, A.; Piruzza, J.; Guo, D.; Liu, Z.; Taimela, P. Strengthening Data Center Operations Using Grid-Forming Battery Energy Storage as a Line-Interactive Uninterruptible Power Supply. Int. J. Electr. Power Energy Syst. 2026, 175, 111638. [Google Scholar] [CrossRef] [Scilit]
- Liu, L.; Shen, X.; Chen, Z.; Sun, Q.; Wennersten, R. Optimal Energy Management of Data Center Micro-Grid Considering Computing Workloads Shift. IEEE Access 2024, 12, 102061–102075. [Google Scholar] [CrossRef] [Scilit]
- Liang, S. Research on data center load simulation and optimization of integrated energy system. AIP Adv. 2025, 15, 085003. [Google Scholar] [CrossRef] [Scilit]
- Jones, E.C. Megawatts to Zettaflops: A Techno-Economic Framework for Grid-Tied Behind-the-Meter Architectures in AI Data Centers. Electricity 2026, 7, 43. [Google Scholar] [CrossRef] [Scilit]
- Wang, Q.; Huang, T.; Liu, Q.; Na, J. Power-infrastructure expansion planning for training-oriented AI data centers under large-model scaling uncertainty. Energy AI 2026, 25, 100840. [Google Scholar] [CrossRef] [Scilit]
- Yang, H.; Si, Y.; Liu, Y.; Mu, S.; Huang, J.; Luo, Y. Capacity optimization of data center microgrid coupling computing-power and electricity consumption. Glob. Energy Interconnect. 2026. [Google Scholar] [CrossRef] [Scilit]
- Alipour, M.; Deymi-Dashtebayaz, M.; Asadi, M. Investigation of energy, exergy, and economy of co-generation system of solar electricity and cooling using linear parabolic collector for a data center. Energy 2023, 279, 128076. [Google Scholar] [CrossRef] [Scilit]
- Jang, K.B.; Woo, T.H. A system dynamics (SD) analysis of Small Modular Reactors (SMRs) for data center power demand management and climate mitigation. Discov. Sustain. 2026, 7, 712. [Google Scholar] [CrossRef] [Scilit]
- Liang, Y.; Lin, X.; Su, W.; Xing, L.; Li, W.; Wang, B. Preliminary design and optimization of a solar-driven combined cooling and power system for a data center. Energy Convers. Manag. X 2023, 20, 100409. [Google Scholar] [CrossRef] [Scilit]
- Kim, B.; Kim, I. A case study of stand-alone hybrid power systems for a data center using HOMER and DIgSILENT. Energy Rep. 2023, 9, 1136–1143. [Google Scholar] [CrossRef] [Scilit]
- Liu, Y.; Chen, G.; Liu, C. Optimization design of integrated energy system for data center based on particle swarm-mixed integer linear programming. Energy Rep. 2026, 15, 109388. [Google Scholar] [CrossRef] [Scilit]
- Turek, D.; Radgen, P. Optimized data center site selection—Mesoclimatic effects on data center energy consumption and costs. Energy Effic. 2021, 14, 33. [Google Scholar] [CrossRef] [Scilit]
- Yang, X.; Ye, X.; Li, Z.; Wang, X.; Song, X.; Liao, M.; Liu, X.; Guo, Q. Hybrid energy storage configuration method for wind power microgrid based on EMD decomposition and two-stage robust approach. Sci. Rep. 2024, 14, 2733. [Google Scholar] [CrossRef] [Scilit] [PubMed]
- Yu, J.; Yan, Y.; Jiang, Y.; Ge, J. Renewable energy configuration scheme of data center in cold area. A case study. Int. J. Low-Carbon Technol. 2022, 17, 411–420. [Google Scholar] [CrossRef] [Scilit]
- Raza, B.; Kumar, Y.J.; Malik, A.K.; Anjum, A.; Faheem, M. Performance prediction and adaptation for database management system workload using Case-Based Reasoning approach. Inf. Syst. 2018, 76, 46–58. [Google Scholar] [CrossRef] [Scilit]
- Khan, I.U.; Jamil, M. Energy Arbitrage Analysis for Market-Selection of a Battery Energy Storage System-Based Venture. Energies 2025, 18, 4245. [Google Scholar] [CrossRef] [Scilit]
- Patel, V.; Cakar, H.; Jamil, M. Short-Term Solar and Wind Power Forecasting Using Machine Learning Algorithms for Microgrid Operation. Energies 2026, 19, 550. [Google Scholar] [CrossRef] [Scilit]
- Zafar, A.; Che, Y.; Faheem, M.; Abubakar, M.; Ali, S.; Bhutta, M.S. Machine learning autoencoder-based parameters prediction for solar power generation systems in smart grid. IET Smart Grid 2024, 7, 328–350. [Google Scholar] [CrossRef] [Scilit]
- Li, Z.; Sun, H.; Xue, Y.; Li, Z.; Jin, X.; Wang, P. Resilience-Oriented Asynchronous Decentralized Restoration Considering Building and E-Bus Coresponse in Electricity-Transportation Networks. IEEE Trans. Transp. Electrif. 2025, 11, 11701–11713. [Google Scholar] [CrossRef] [Scilit]
- Li, Z.; Zhai, X.; Li, Z.; Xue, Y.; Jin, X.; Wang, P.; Sun, H. Asynchronous Decentralized Coordinated Restoration for Integrated Electricity and Transportation System Considering Building Response and Road Repair. IEEE Trans. Transp. Electrific. 2026. Early access. [Google Scholar] [CrossRef] [Scilit]
- Jamil, M.; Li, M.; Etminan, A. Techno-Economic and Operational Reliability Assessment of an AC-Coupled Hybrid Distribution Microgrid for Remote Communities in Canada. Appl. Sci. 2026, 16, 4327. [Google Scholar] [CrossRef] [Scilit]
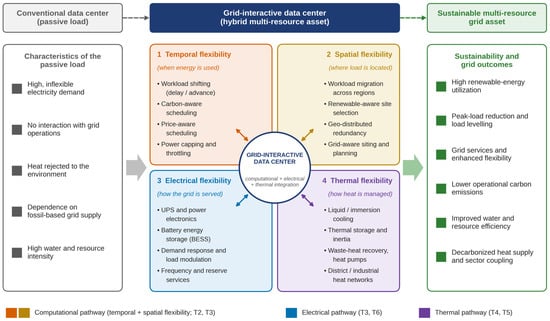
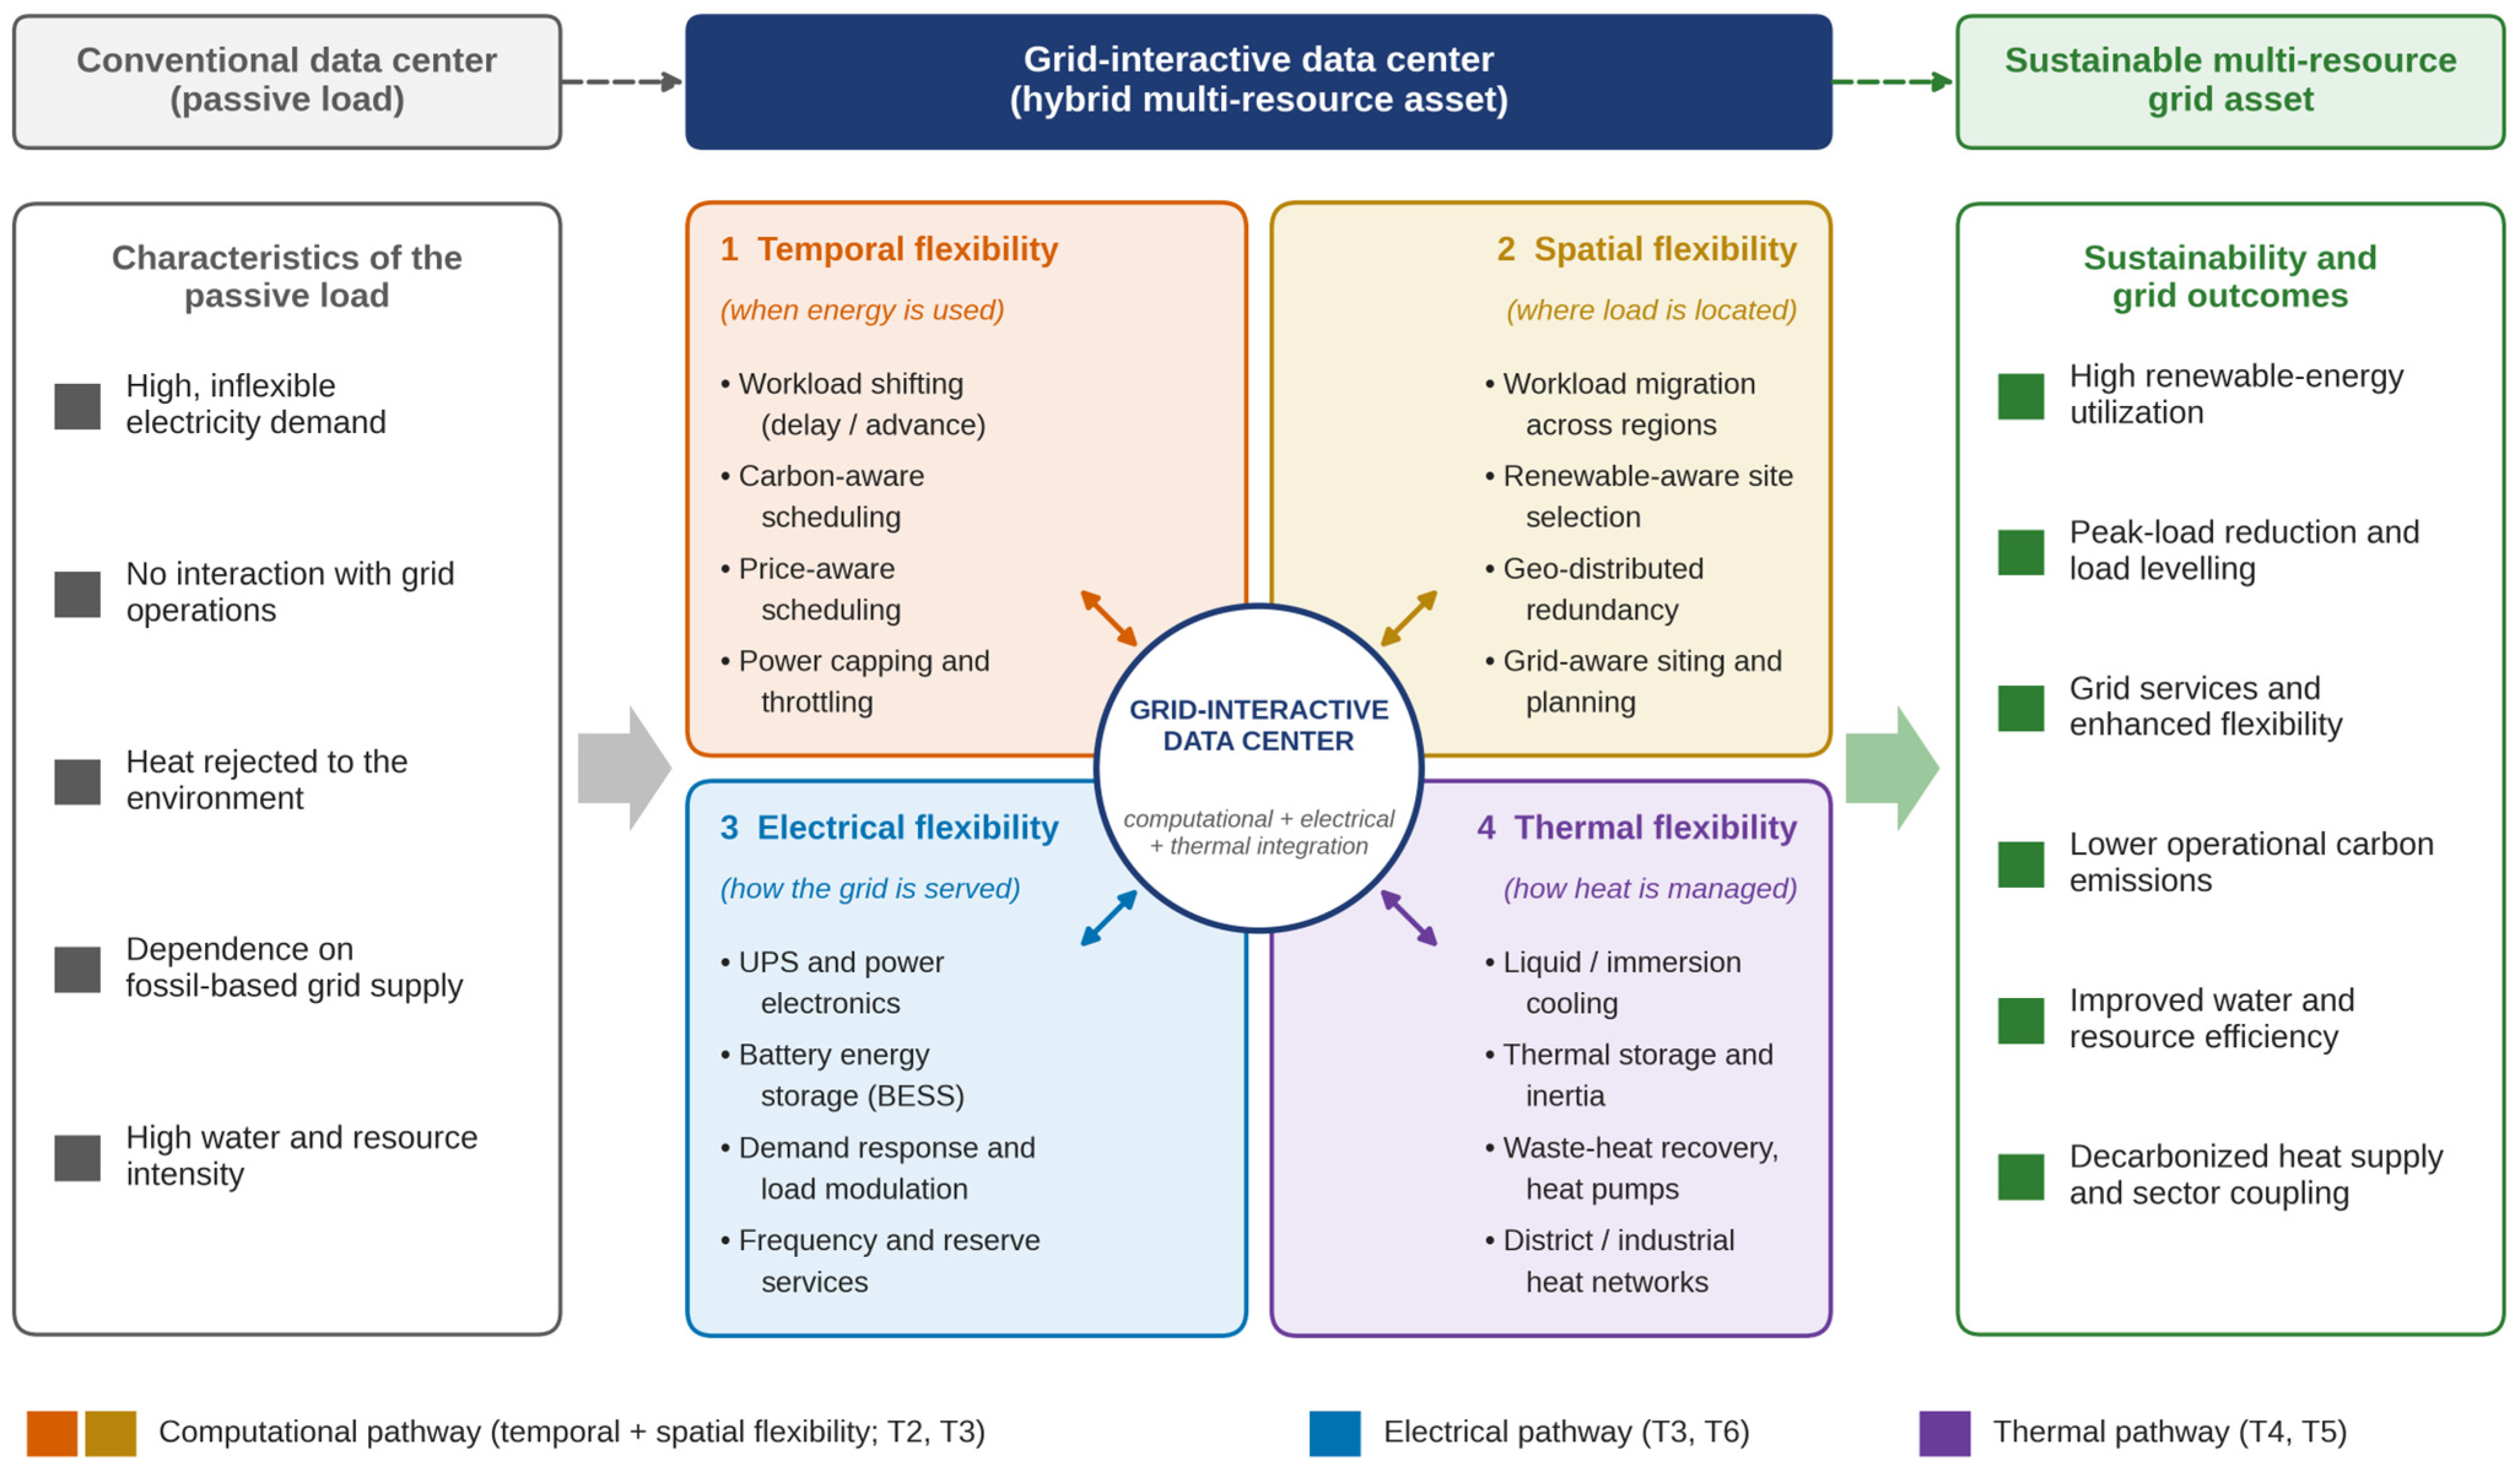
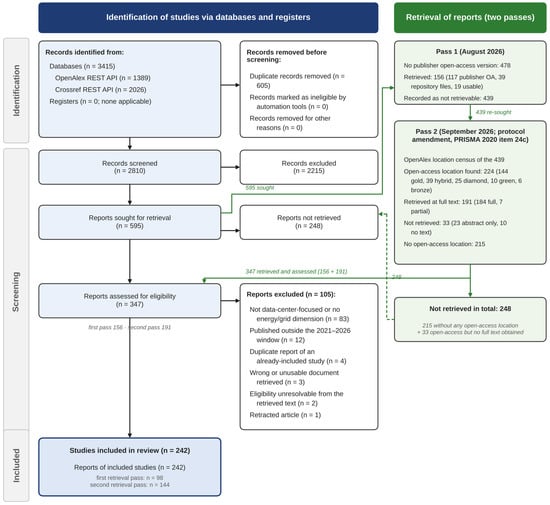
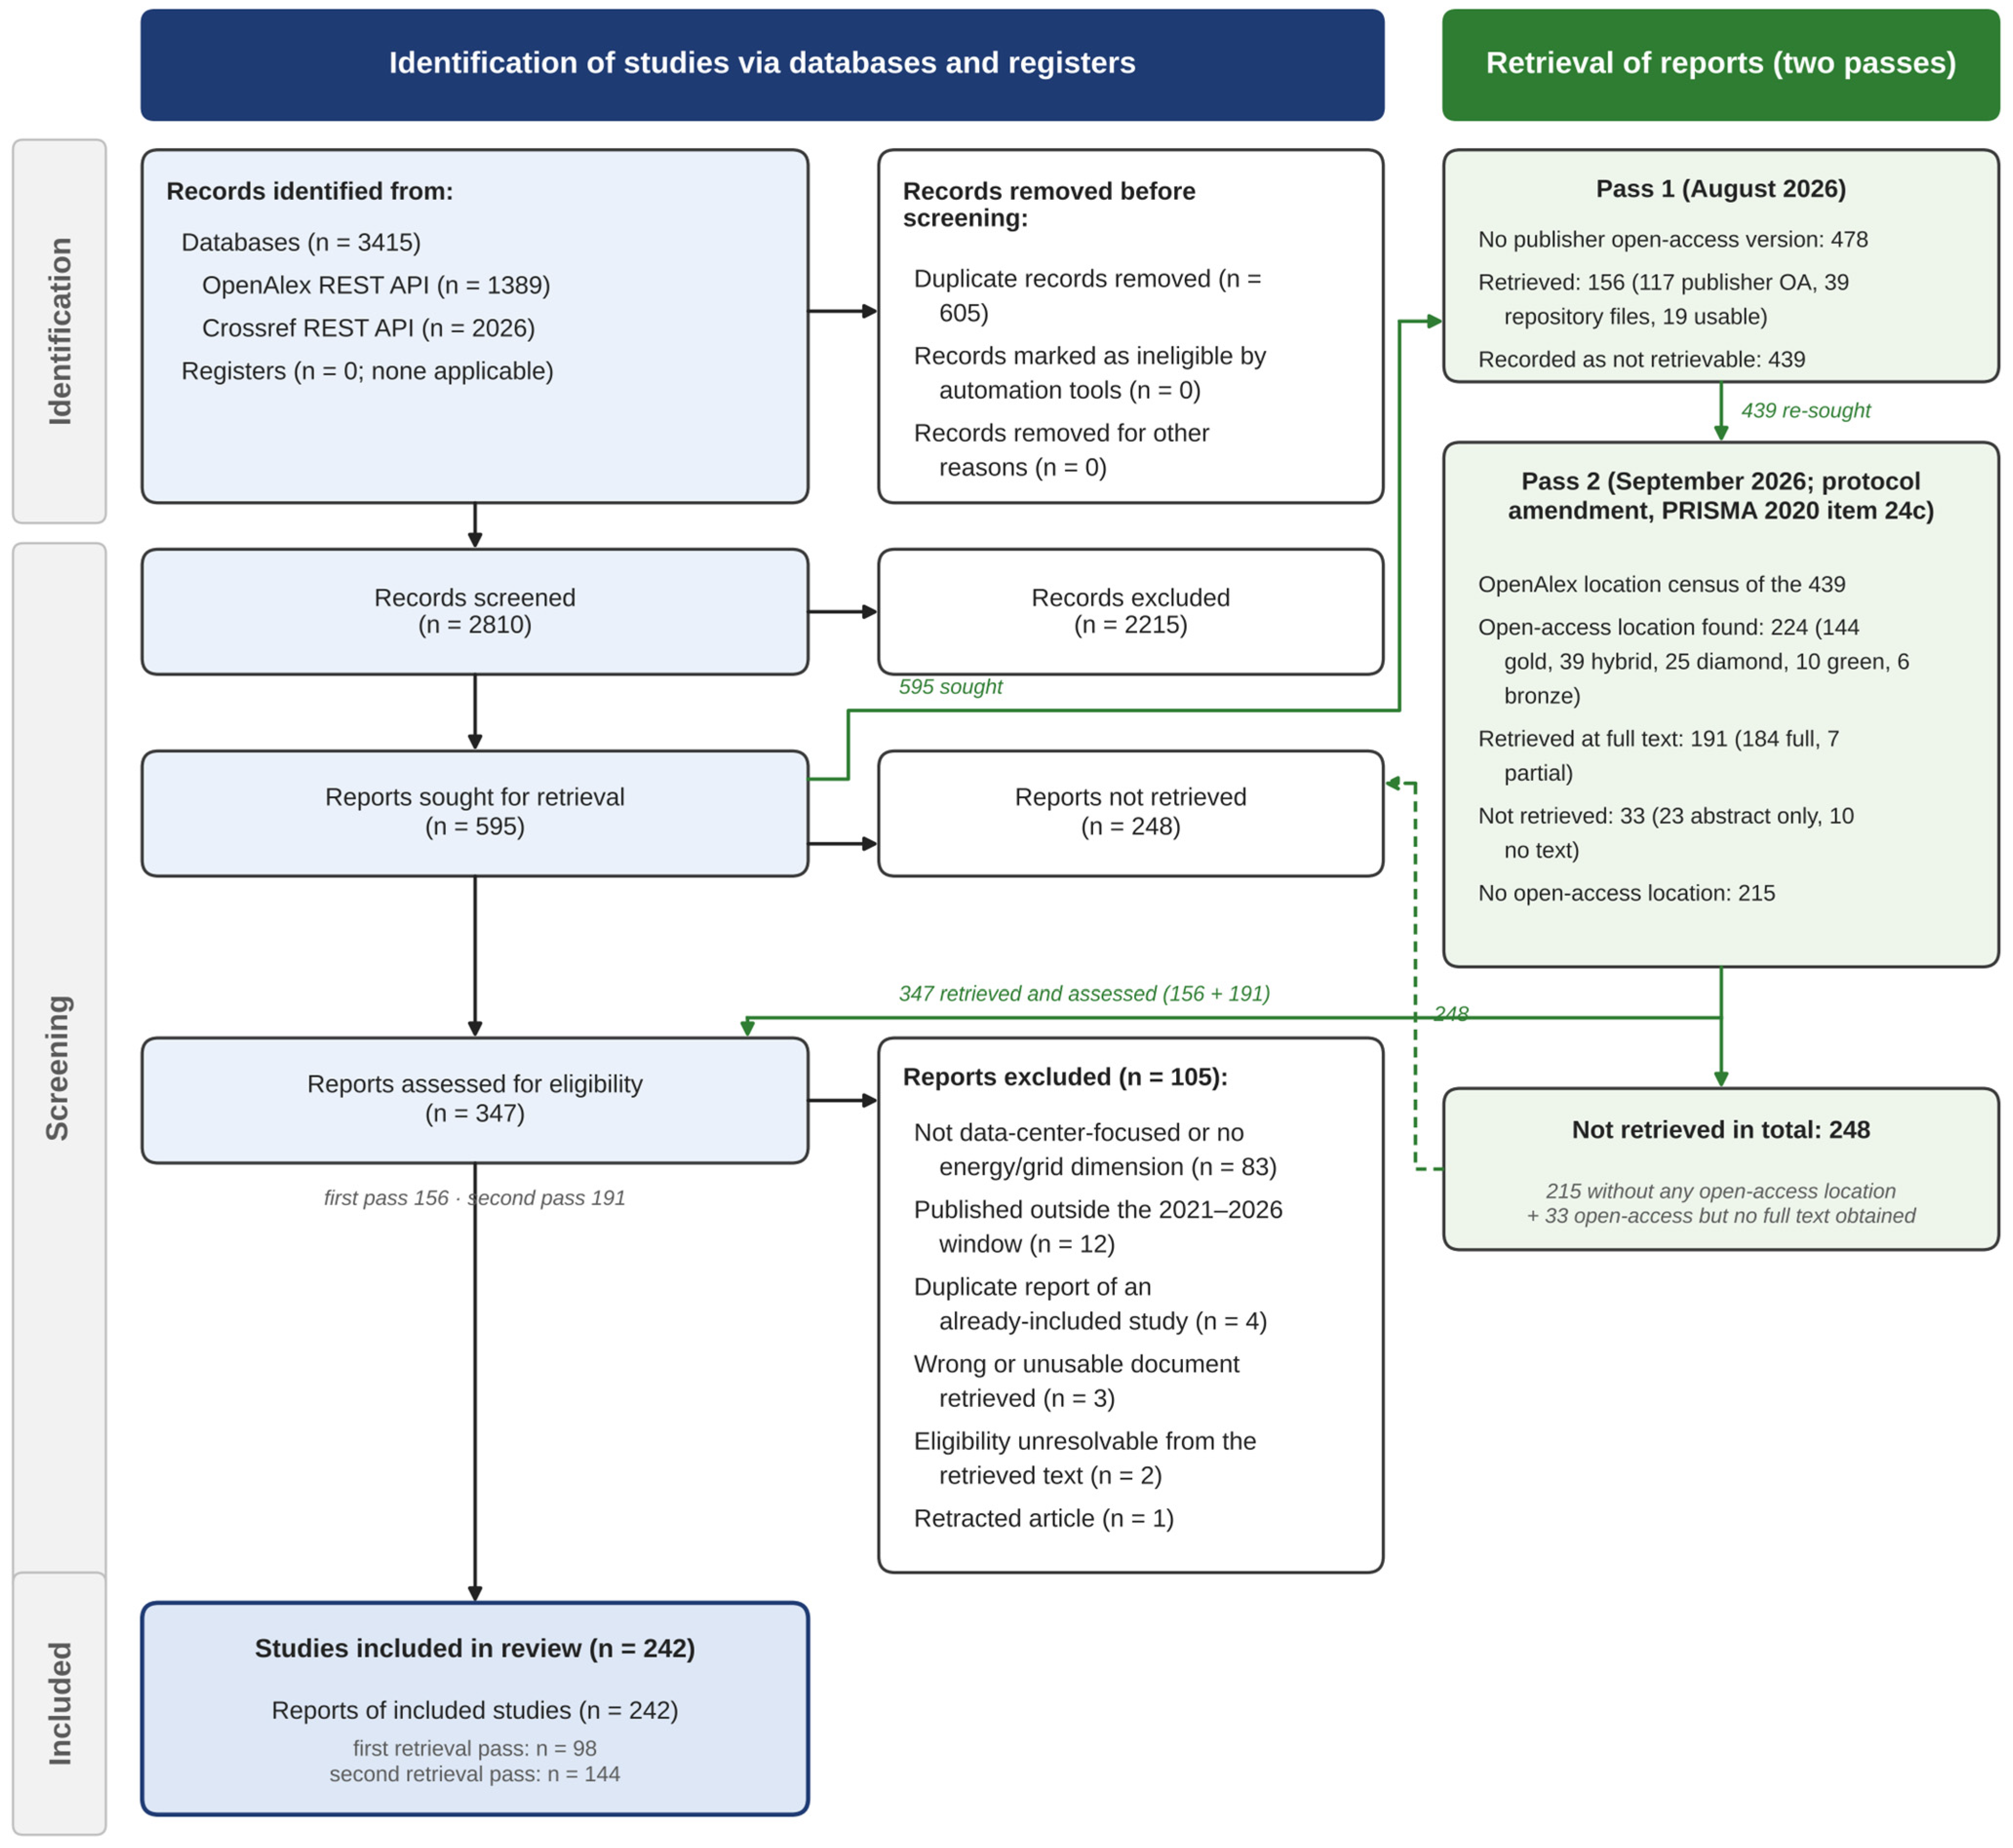
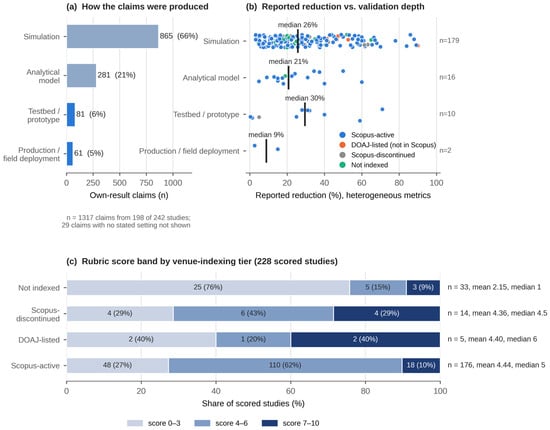
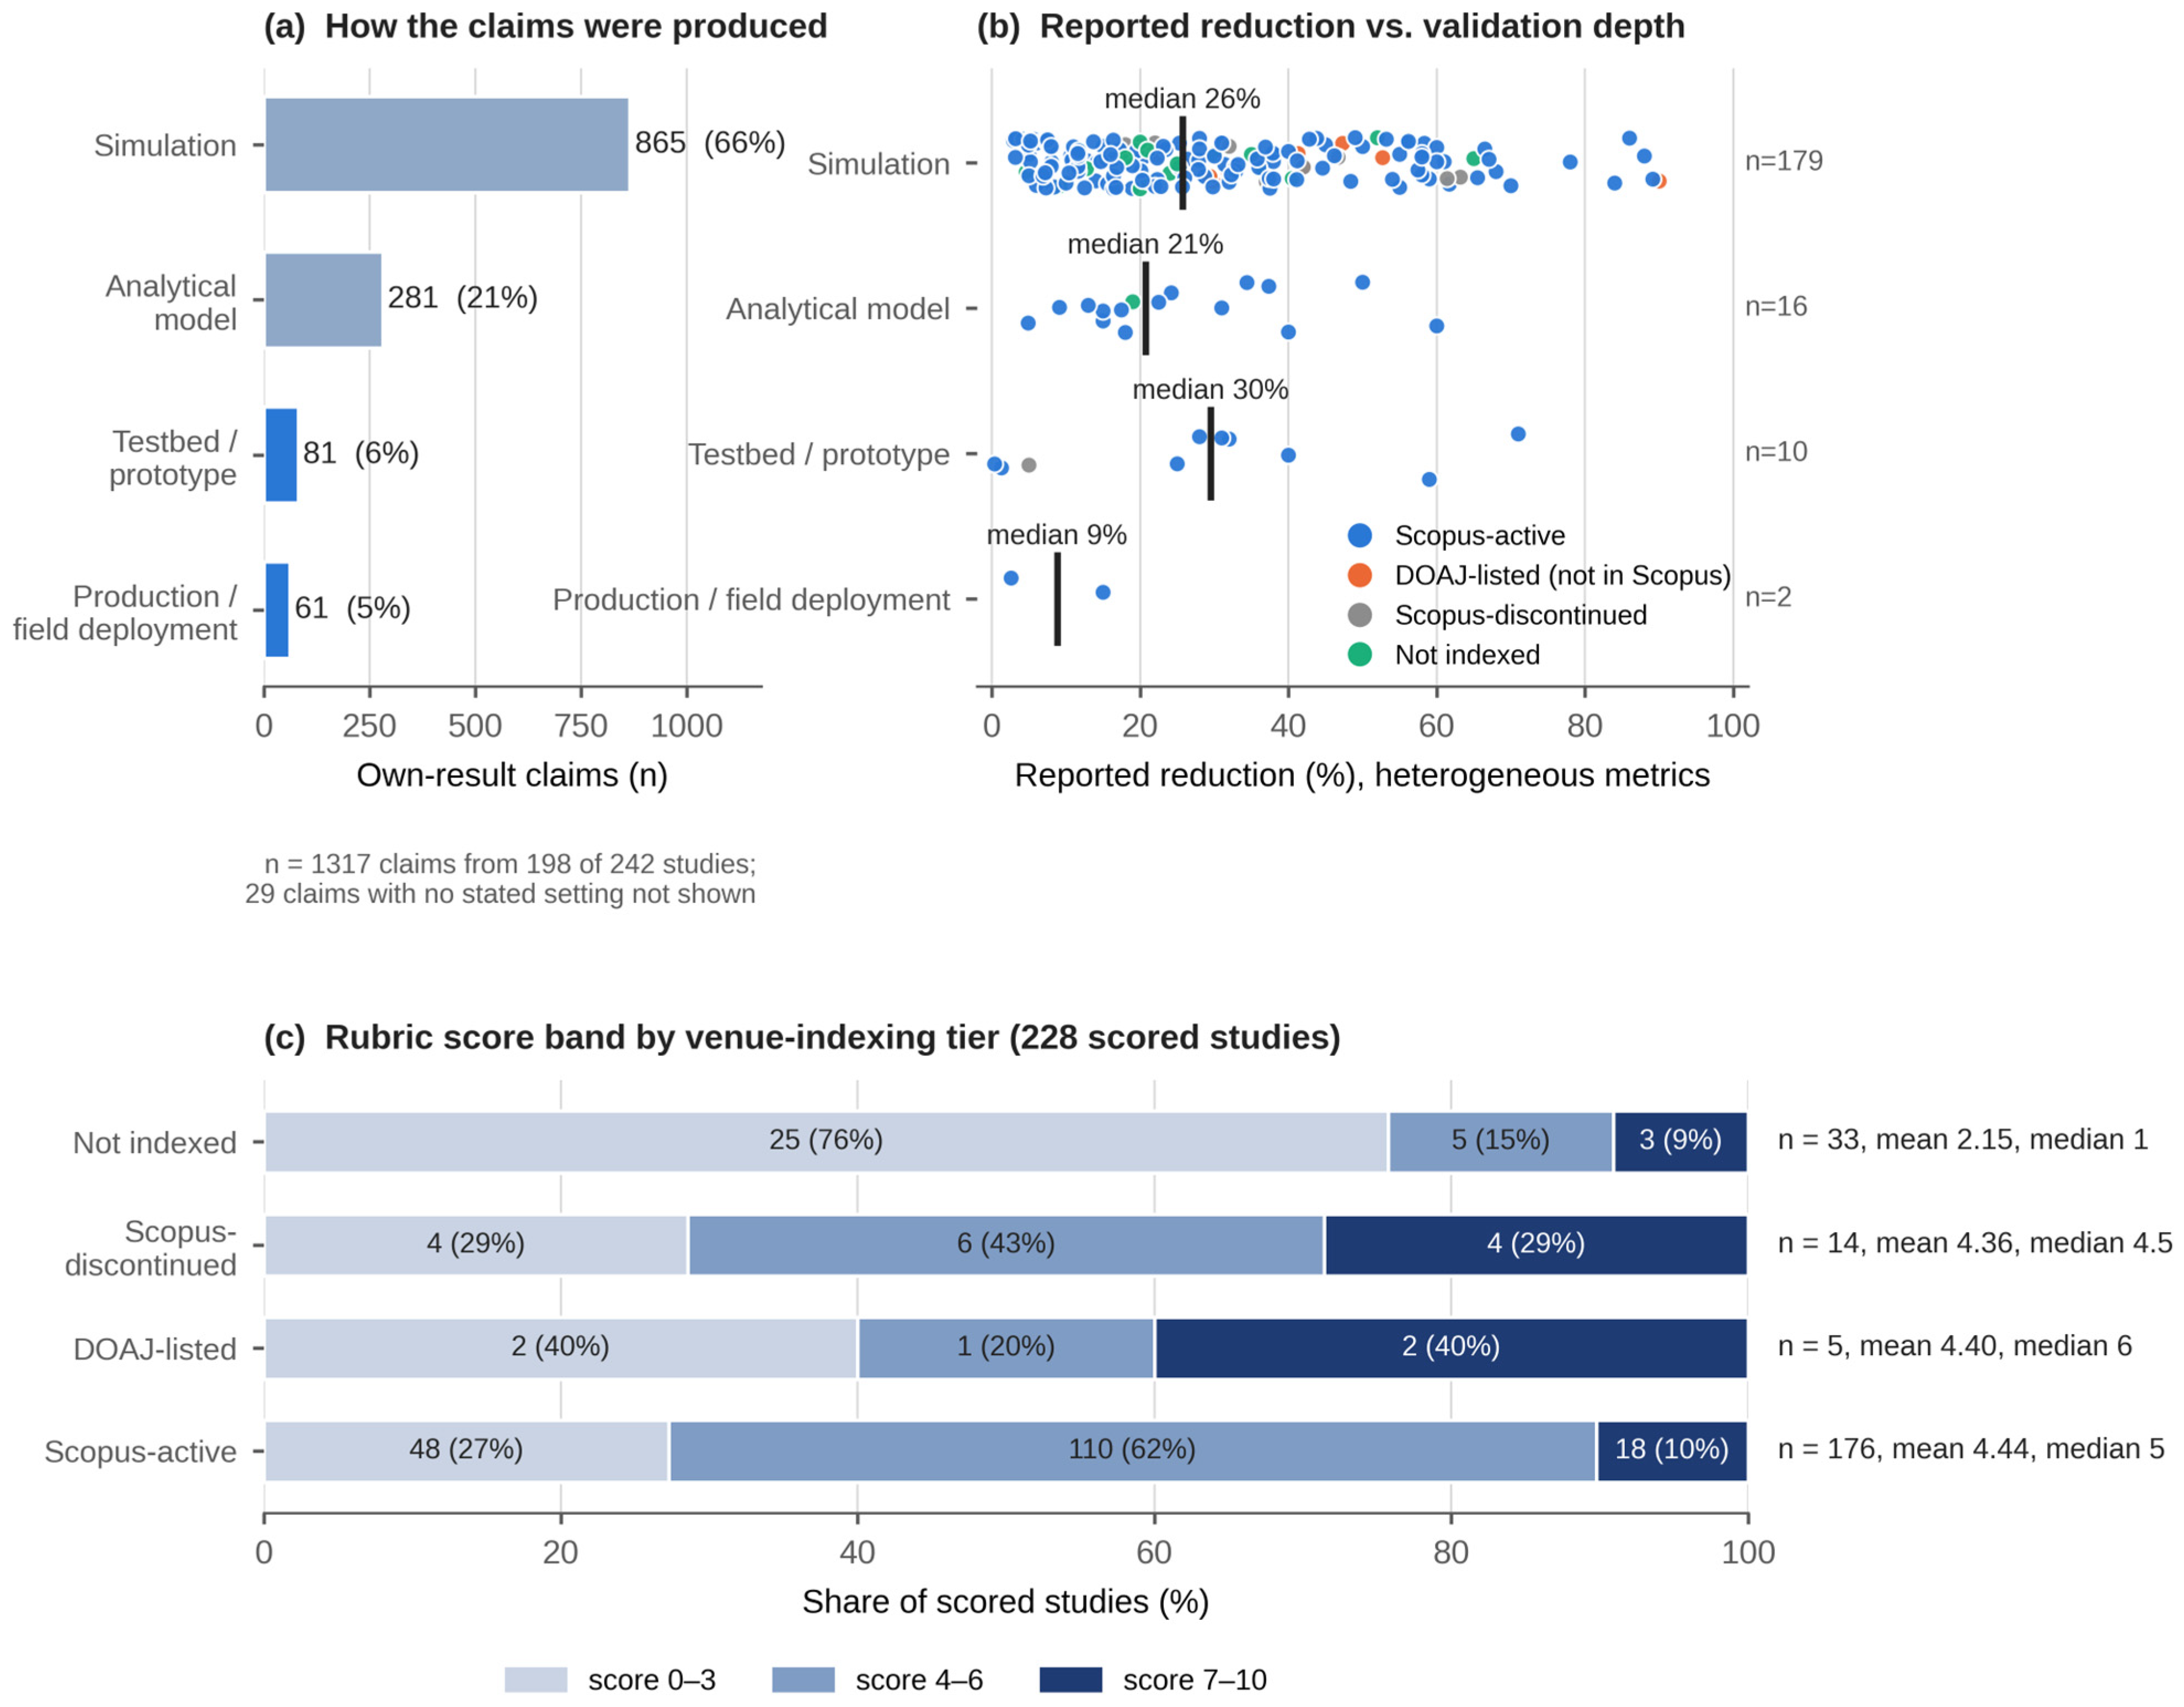
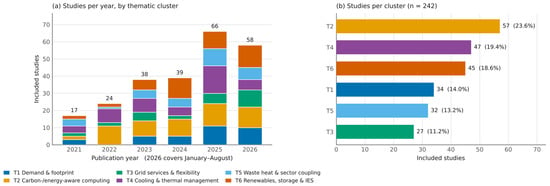
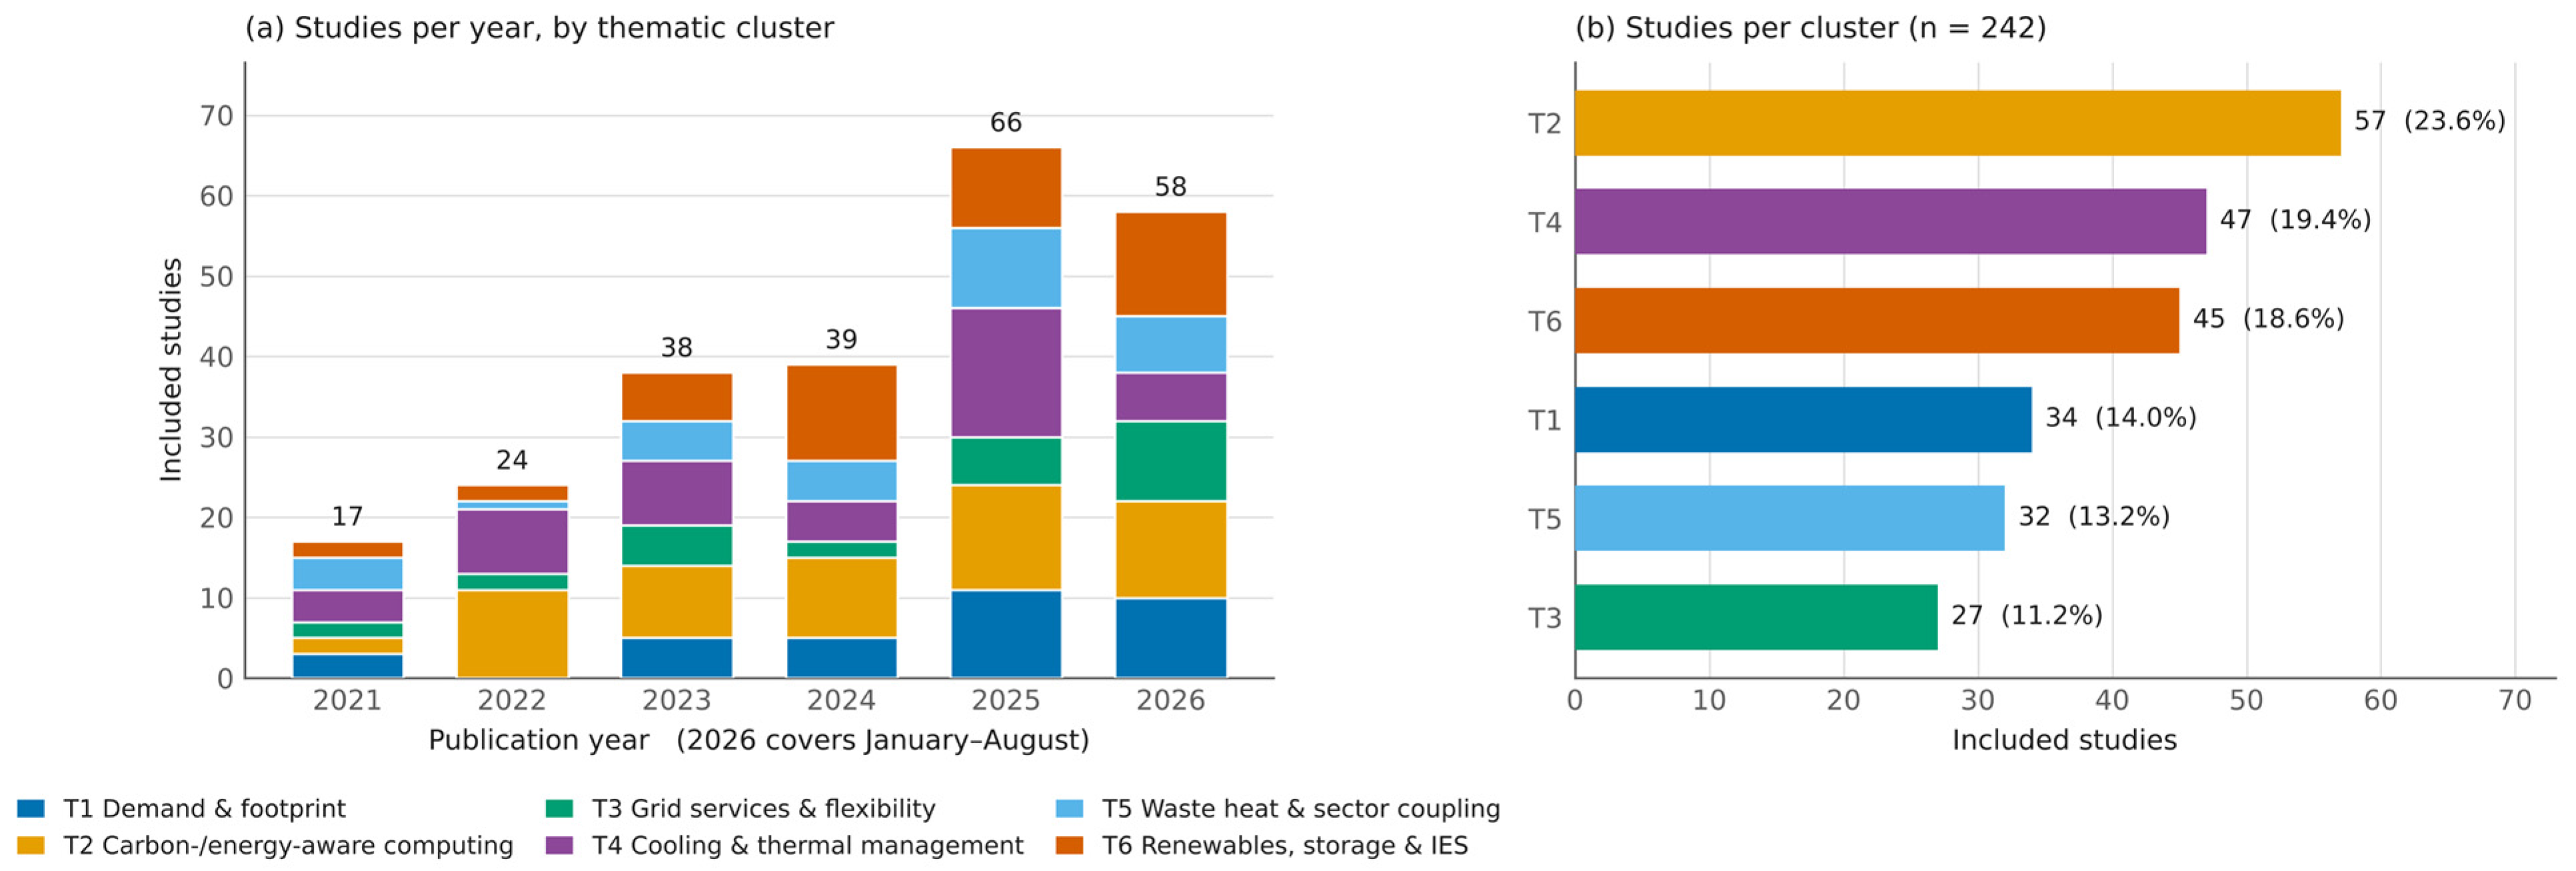
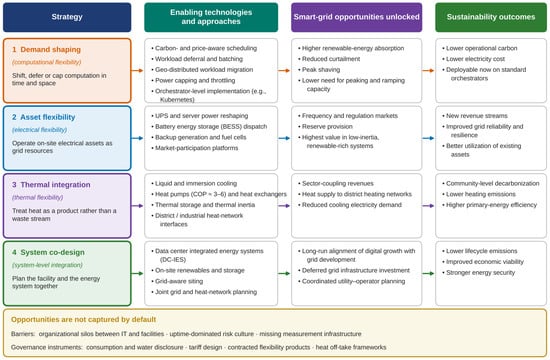
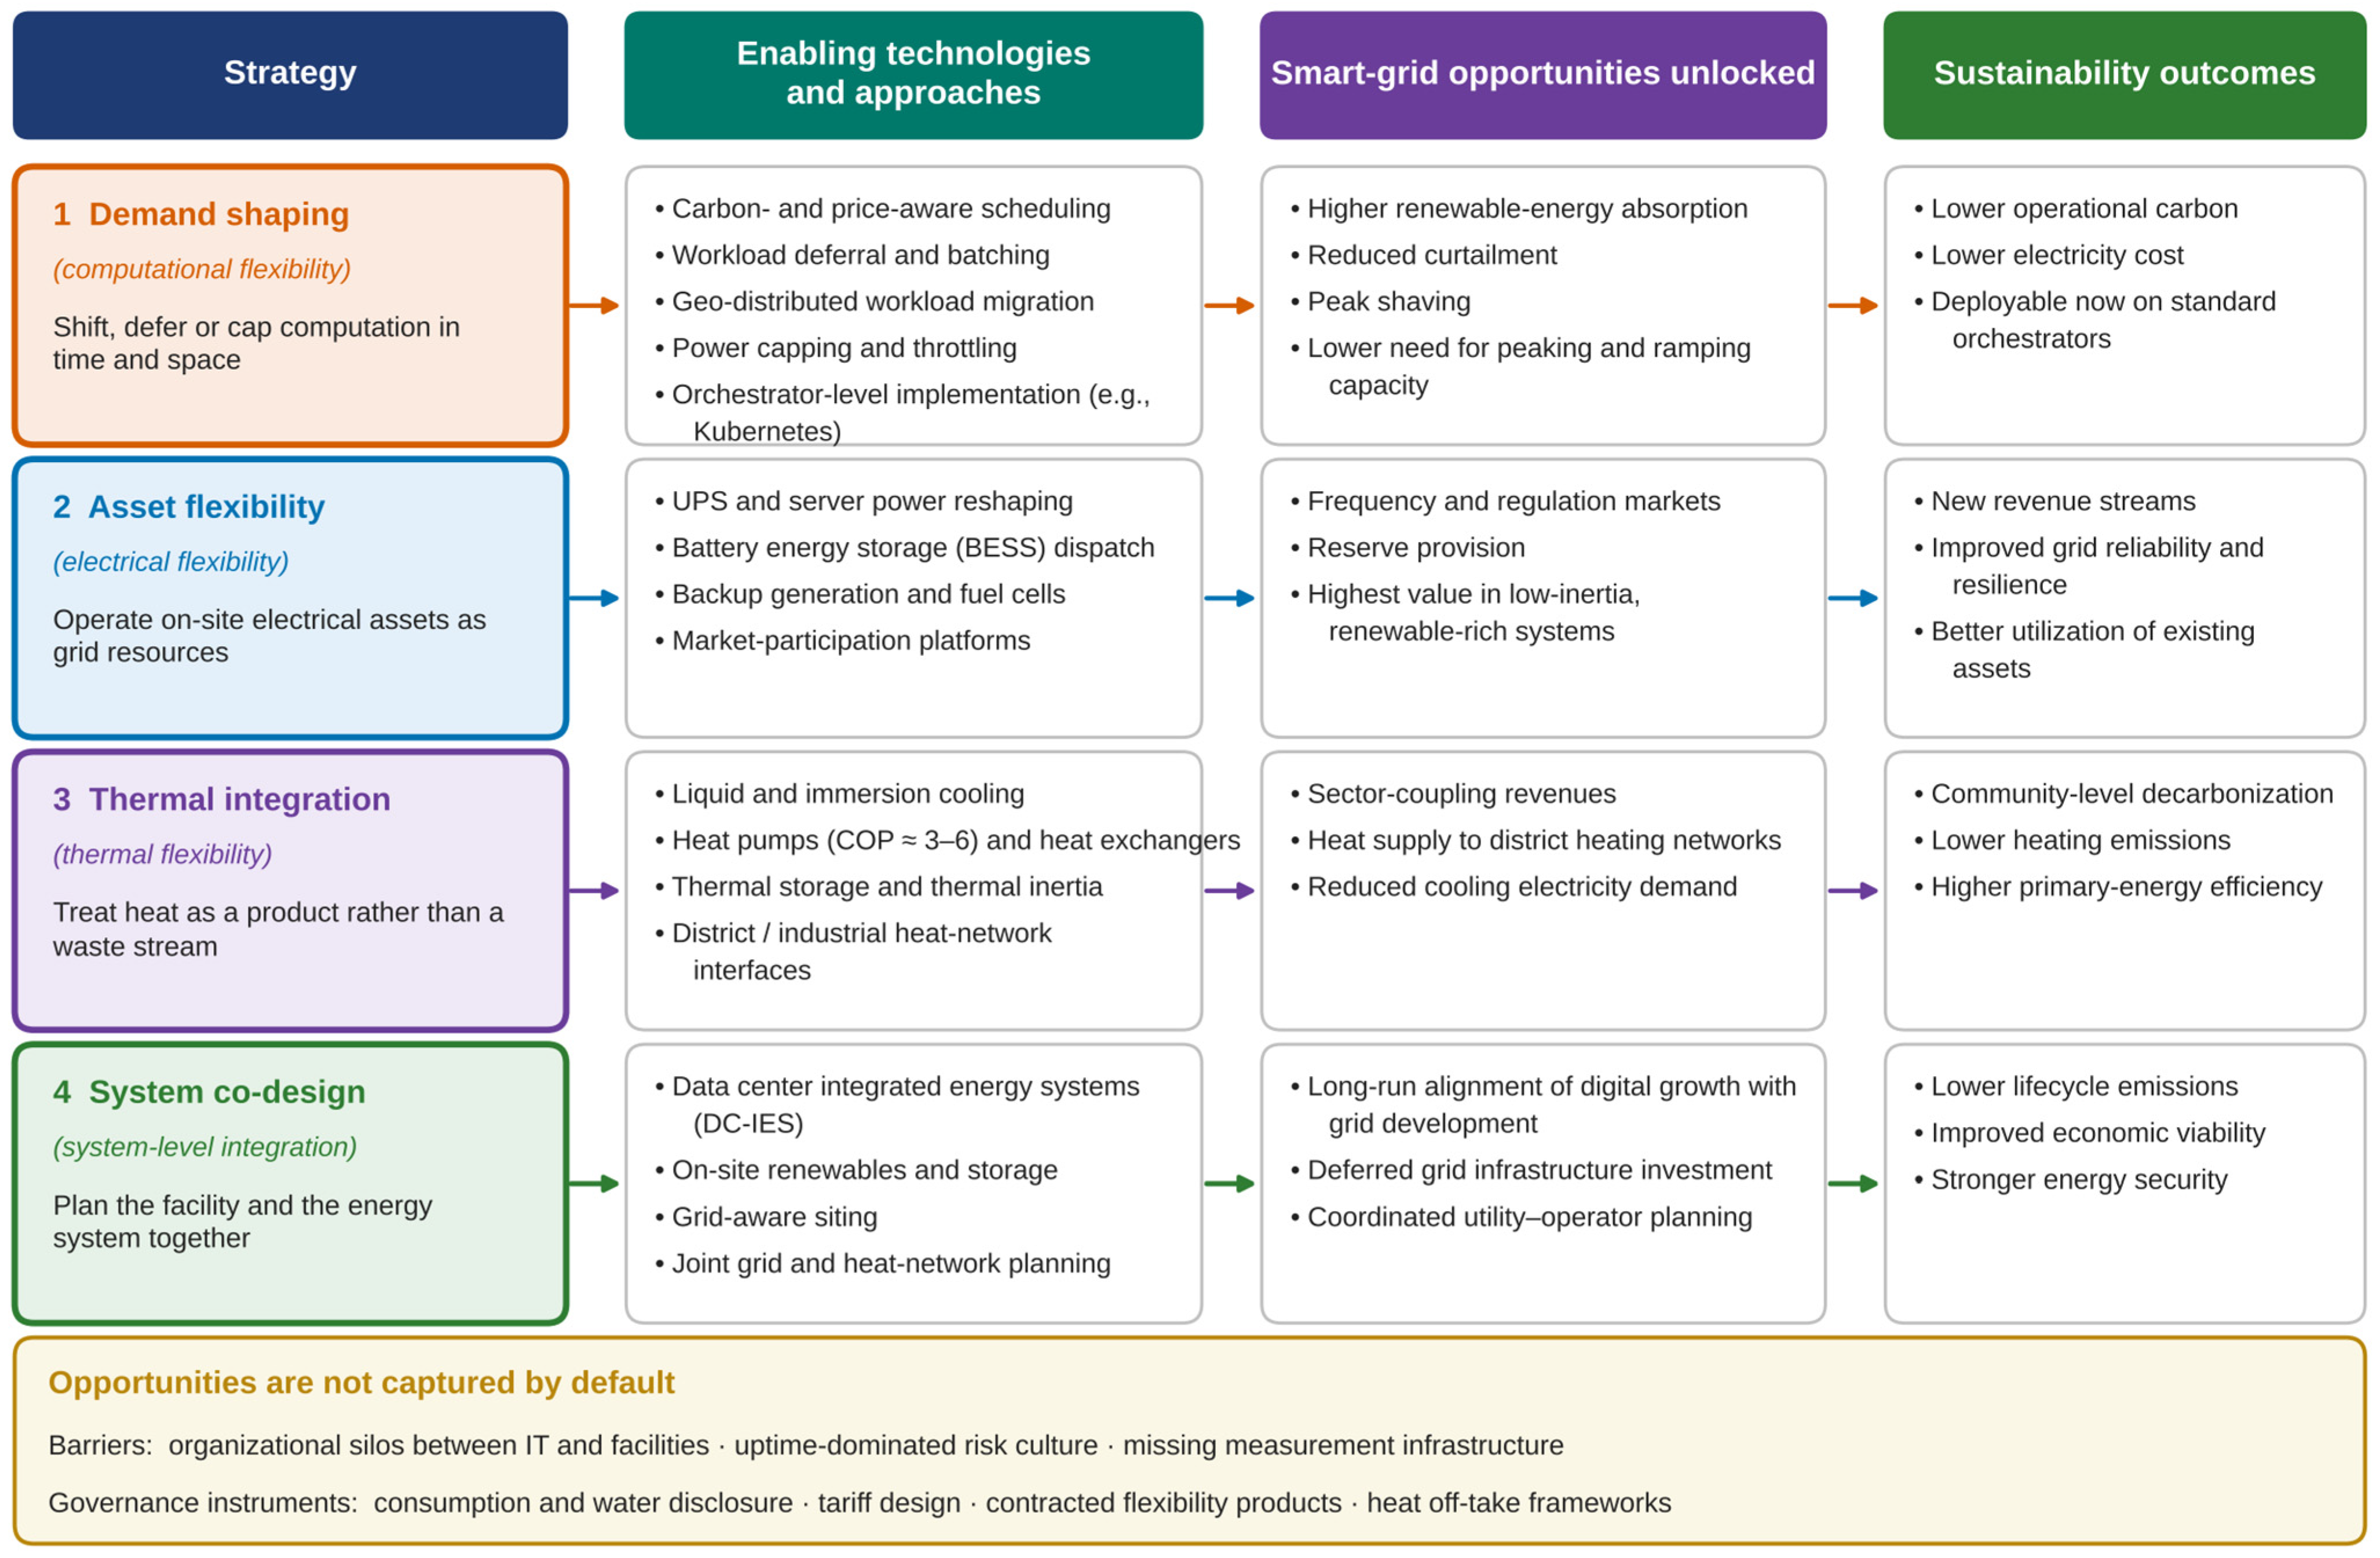
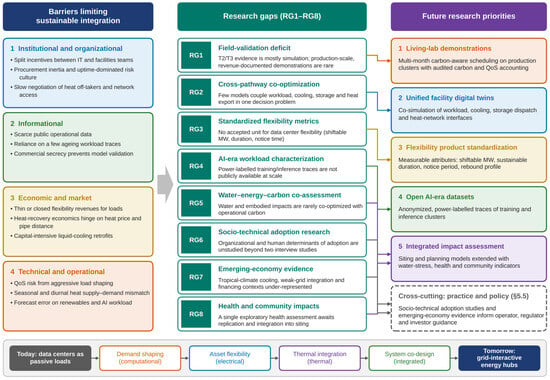
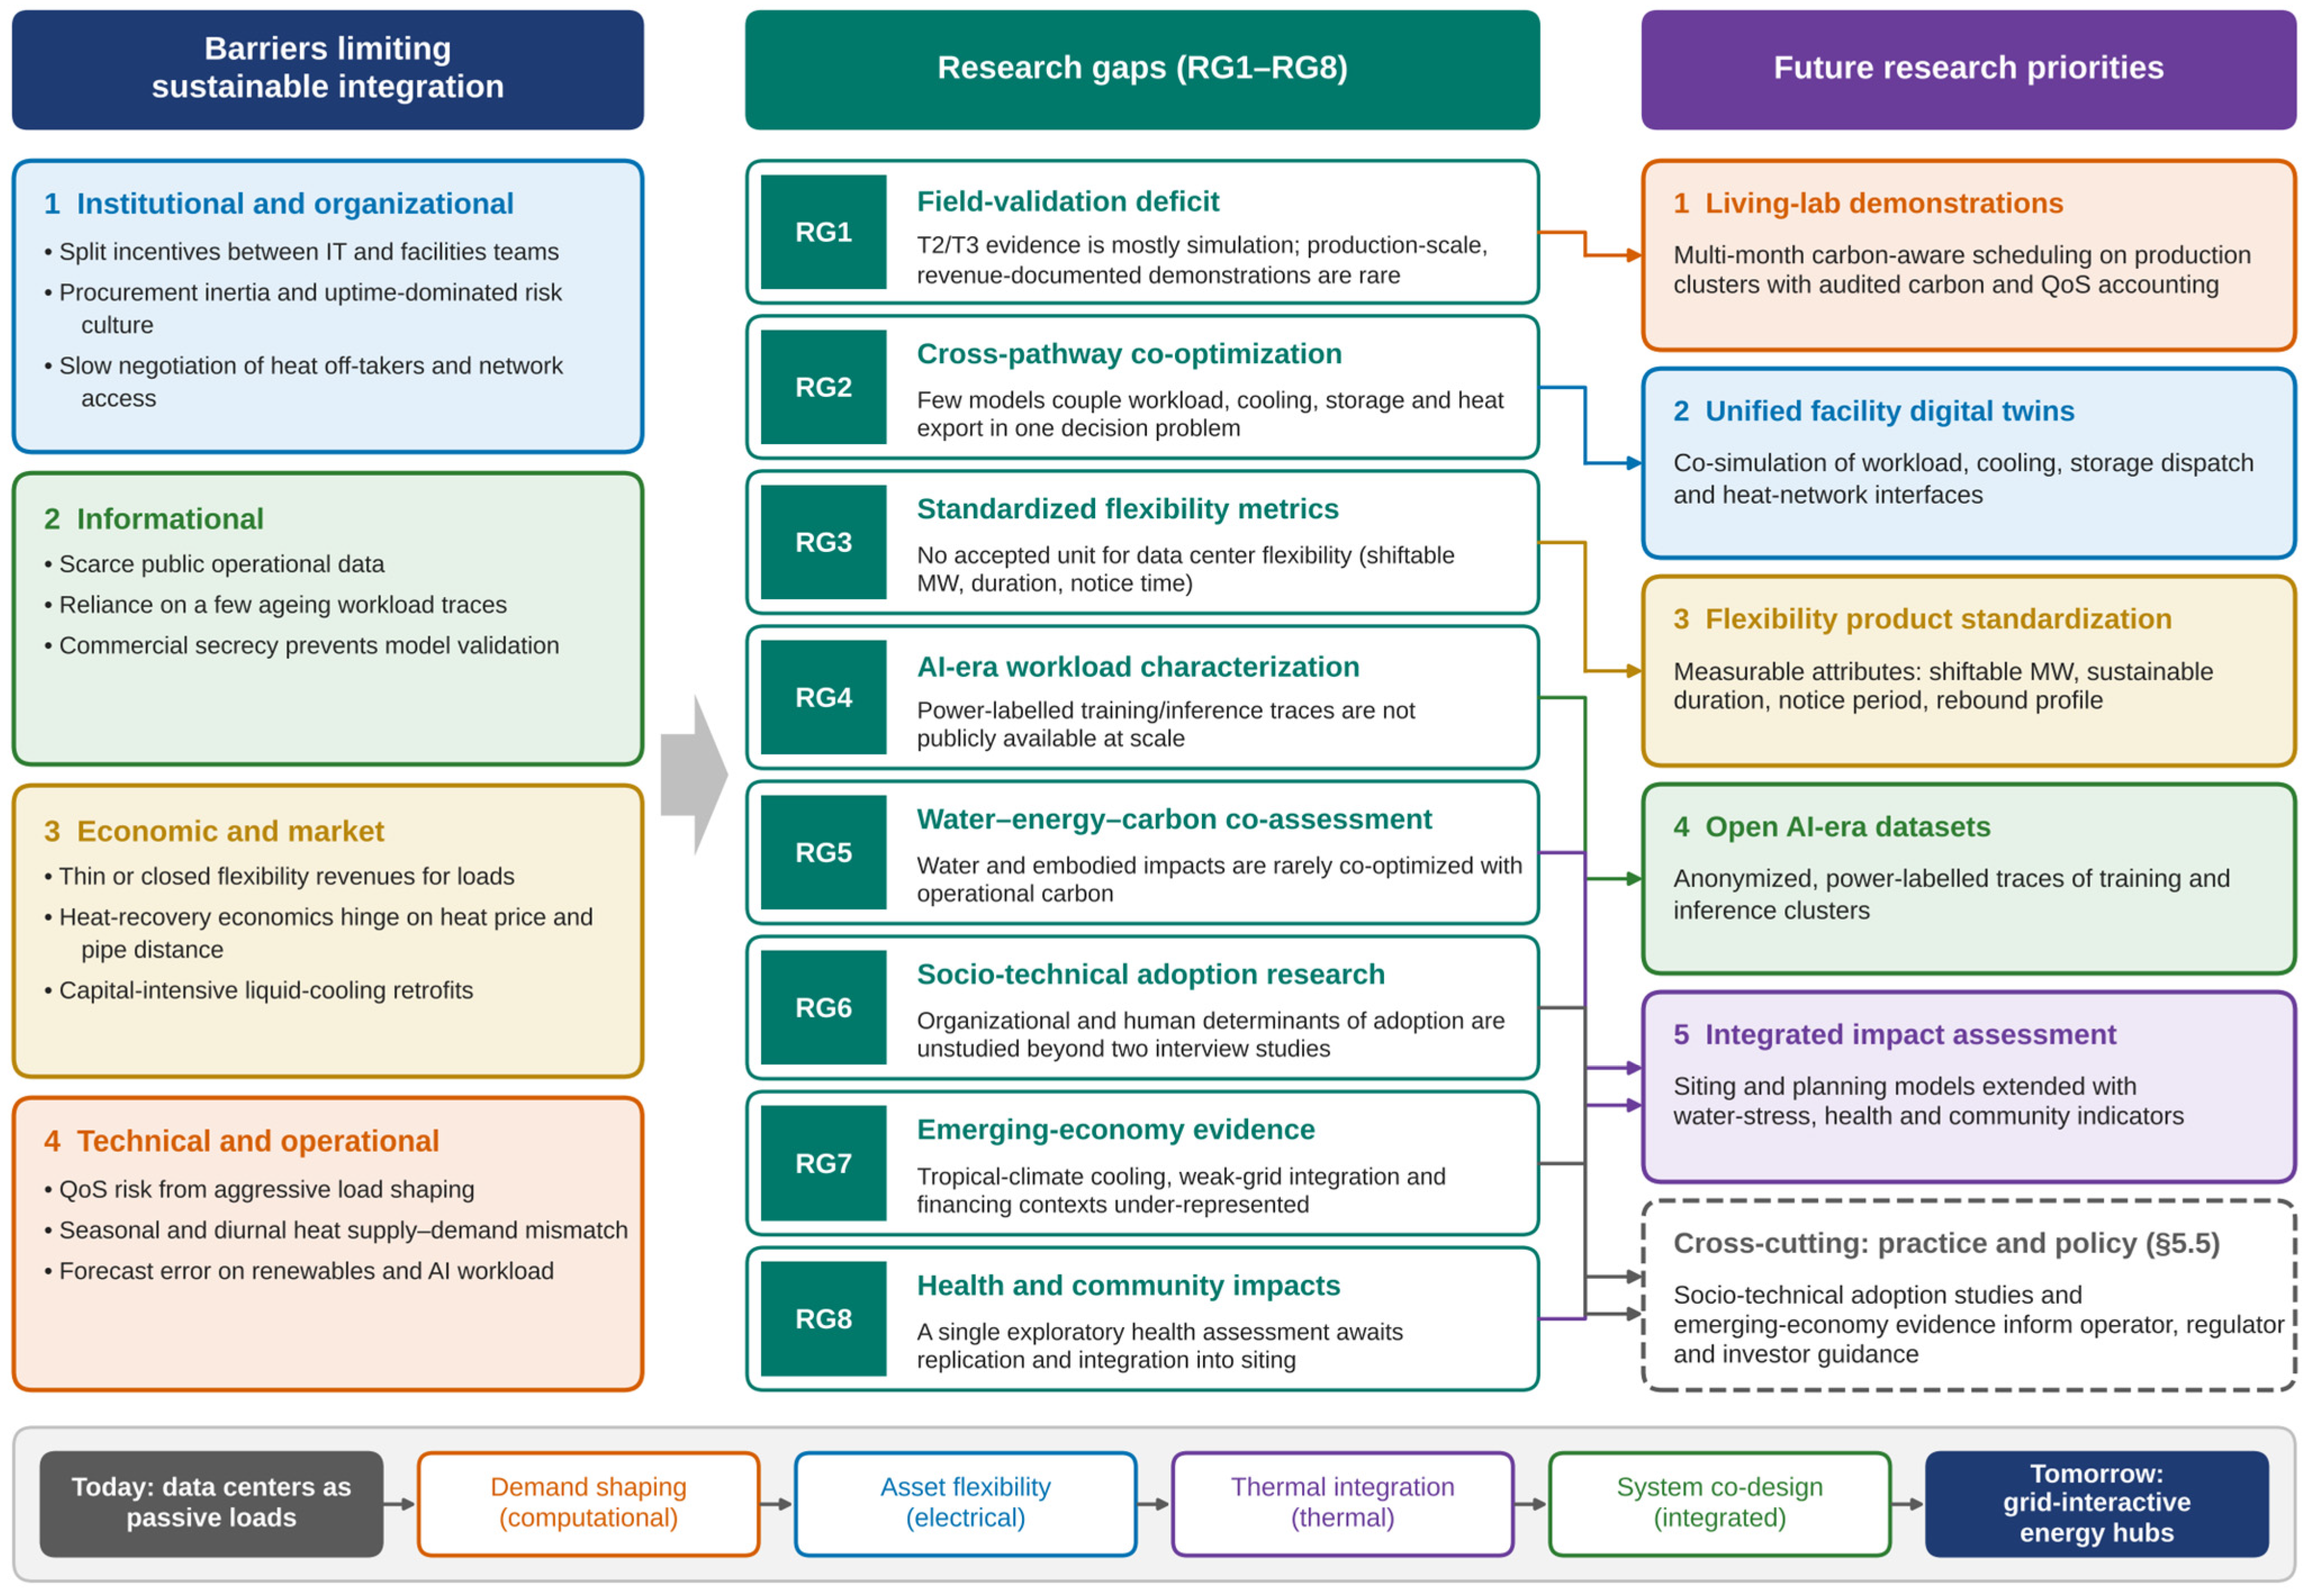

Disclaimer/Publisher’s Note: The statements, opinions and data contained in all publications are solely those of the individual author(s) and contributor(s) and not of MDPI and/or the editor(s). MDPI and/or the editor(s) disclaim responsibility for any injury to people or property resulting from any ideas, methods, instructions or products referred to in the content. |
© 2026 by the authors. Licensee MDPI, Basel, Switzerland. This article is an open access article distributed under the terms and conditions of the Creative Commons Attribution (CC BY) license.