


Abstract
This study developed a game-theoretic pricing framework for two competing electric vehicle (EV) fast-charging operators by integrating a multinomial logit (MNL) station-choice model with an M/M/4 queue at each station. Each station comprises four parallel chargers, each with a service rate of 2 EV/h, resulting in an aggregate service capacity of 8 EV/h. For each candidate price pair, a damped fixed-point algorithm jointly determines station-choice probabilities, arrival rates, and expected queueing delays. Operators subsequently update their prices through discrete best responses, while potential equilibrium outcomes are evaluated using unilateral-deviation regret. In the illustrative high-demand scenario with a total potential arrival rate of 6 EV/h, the representative base-grid pricing outcome is USD 0.45/kWh for Operator A and USD 0.42/kWh for Operator B. The corresponding arrival rates are 3.080 and 2.920 EV/h, and the expected queueing waits are 0.985 and 0.811 min, respectively. The demand-weighted average waiting time decreases from 1.030 min under fixed pricing to 0.900 min under strategic pricing. The combined daily gross contribution increases from USD 1404 to approximately USD 3082. Additional analyses examine demand levels from 1 to 8 EV/h, sensitivity to the MNL price coefficient, and the inclusion of an outside option. Exhaustive searches identify one candidate on the USD 0.01/kWh grid and two candidates on the finer USD 0.005/kWh grid; therefore, equilibrium uniqueness is not established. Since demand, travel distances, choice coefficients, and procurement costs are illustrative assumptions and the payoff excludes capital and other operating costs, the findings represent numerical insights under the specified assumptions rather than empirically validated corridor outcomes.
1. Introduction
The global transportation sector is undergoing a major transformation driven by the electrification of road vehicles and the need to reduce greenhouse gas emissions. Electric vehicles (EVs) have become an increasingly important component of this transition because of their energy efficiency and potential to reduce transport-related emissions, particularly when supplied by low-carbon electricity [1]. Their growing adoption, supported by technological developments, declining battery costs, environmental regulations, and policy incentives, is increasing the demand for accessible and reliable public charging infrastructure [2]. Consequently, the planning and operation of charging networks have become important challenges for the development of sustainable transportation systems [3].
Among different charging technologies, public DC fast-charging stations play a particularly important role in supporting long-distance travel and reducing range anxiety. Unlike residential or workplace charging, fast-charging infrastructure is designed to provide high-power charging within short time periods, enabling EV users to recharge their vehicles during intercity trips and high-mobility travel scenarios. However, the rapid growth of EV adoption has also introduced substantial operational challenges for charging network operators. One of the most important challenges is charging congestion, especially during peak traffic periods and at highly utilized charging corridors [4]. Long waiting times, queue formation, charger unavailability, and uneven utilization of charging stations can negatively affect customer satisfaction and reduce the operational efficiency of charging infrastructure.
The operation of fast-charging stations is also associated with considerable economic and technical complexity [5,6]. Charging operators must balance electricity procurement costs, infrastructure investment costs, power demand charges, charger utilization rates, and customer expectations while remaining competitive in an increasingly crowded market. Since electricity prices and charging demand vary significantly over time, conventional fixed pricing mechanisms may not be sufficient for efficient infrastructure management [7]. Static pricing schemes often fail to reflect real-time market conditions, resulting in inefficient charger utilization, congestion during high-demand periods, and reduced profitability for operators [8].
To address these challenges, dynamic pricing has recently attracted significant attention in the field of EV charging infrastructure [9,10,11,12]. Dynamic pricing refers to pricing strategies in which charging prices vary according to factors such as electricity spot prices, station congestion, waiting times, time-of-use conditions, or local demand levels. By adjusting charging prices dynamically, operators may incentivize users to shift charging behavior toward less congested periods or alternative charging stations. This can help reduce peak demand, improve charger utilization, minimize queue formation, and enhance system efficiency. Furthermore, dynamic pricing may allow charging operators better to manage operational costs under volatile electricity market conditions.
In parallel with the growth of public charging infrastructure, competition among charging point operators (CPOs) has intensified. In many regions, multiple charging providers operate within the same transportation corridors and urban areas, leading to increasingly competitive pricing environments. Since electricity supplied at public charging stations is largely a homogeneous product, pricing strategies have become one of the primary competitive instruments among operators. EV users may choose charging stations based on charging price, expected waiting time, charging speed, station accessibility, and service quality. Consequently, pricing decisions made by one operator may directly influence the demand and profitability of competing operators. Understanding these strategic interactions is therefore essential for designing economically sustainable charging markets [13,14].
Existing research has examined EV charging pricing, charging demand management, station-selection behavior, and queueing effects using a variety of optimization, simulation, and behavioral modeling approaches. Agent-based and discrete-choice models, for example, can represent differences in user preferences and the way charging demand is distributed among available facilities. Queueing models provide a complementary means of representing the relationship between station arrivals, service capacity, and waiting times. Game-theoretic approaches, meanwhile, offer a framework for analyzing decision-making among competing operators whose outcomes depend on one another’s strategies. Nevertheless, these modeling perspectives are not always integrated within a single competitive pricing framework. In particular, there is a need to examine how price-sensitive and waiting-time-sensitive station choice interacts with finite charging capacity and strategic price decisions by competing operators. Considering these mechanisms jointly is important because a price change can affect not only an operator’s revenue but also its arrival rate, queueing performance, and relative attractiveness to EV users [15,16].
To address this issue, this study developed a non-cooperative game-theoretic framework for analyzing strategic pricing between two competing public EV fast-charging operators. The framework combines a multinomial logit (MNL) station-choice model with an M/M/4 queueing model at each station. The MNL model represents users’ probabilistic choices based on charging price, expected queue waiting time, and access distance. Each station is represented by four parallel chargers, with an assumed service rate of 2 EV/h per charger. For each candidate pair of operator prices, a damped fixed-point procedure jointly determines station-choice probabilities, station-specific arrival rates, and expected queueing delays. The operators then select prices through discrete best responses, and candidate equilibrium outcomes are assessed by examining the profitability of unilateral price deviations over the tested strategy grid. The numerical analysis considers an illustrative two-station competition scenario motivated by the context of the Istanbul–Ankara highway corridor in Türkiye. The corridor provides a geographical context for the charging competition problem; however, the numerical experiments do not constitute an empirically calibrated representation of all charging stations or actual traffic flows along the corridor. The model uses assumed values for potential EV arrival rates, station access distances, user-choice coefficients, and electricity procurement costs. Accordingly, the numerical results are intended to demonstrate the behavior of the proposed framework under specified assumptions rather than to estimate actual market outcomes of existing charging operators. The concept of the proposed framework is illustrated in Figure 1, which summarizes the interactions among EV users, charging operators, electricity markets, congestion, and dynamic pricing decisions.
Figure 1.
Proposed game-theoretic EV charging market framework.
The main contributions of this study are as follows.
- An integrated competitive pricing framework: A non-cooperative game-theoretic model is developed to examine strategic price decisions by two competing EV fast-charging operators while accounting for the interdependence between operator decisions and customer demand allocation.
- Congestion-sensitive station choice: An MNL model incorporating charging price, expected queue waiting time, and access distance is coupled with an M/M/4 queueing model for each station. This structure captures the feedback between user choices, station arrivals, and queueing delays.
- A numerical assessment of strategic pricing outcomes: Fixed-price and best-response pricing outcomes are compared under different potential demand levels. The analysis examines their implications for station-specific arrivals, waiting times, utilization rates, and operator gross contributions.
- Robustness and sensitivity analysis: The framework is examined under alternative price-grid resolutions, initial price conditions, waiting-time-sensitivity coefficients, price-sensitivity coefficients, and the inclusion of an outside charging alternative. These tests help assess how the selected pricing outcomes depend on key modeling assumptions.
The remainder of the paper is organized as follows. Section 2 reviews the literature on EV charging pricing, dynamic pricing, queueing theory, game theory, and competition among charging operators. Section 3 presents the system model and mathematical formulation, including the user-choice model, queueing model, and strategic pricing procedure. Section 4 describes the numerical implementation and scenario design. Section 5 presents and discusses the numerical results and sensitivity analyses. Finally, Section 6 summarizes the findings, discusses the limitations of the study, and identifies directions for future research.
2. Literature Review
2.1. EV Charging Pricing
The expansion of electric vehicle adoption has increased the need for charging infrastructure that is both operationally efficient and economically sustainable [6]. Pricing mechanisms at public charging stations influence user decisions, charging demand, and the revenues generated by charging point operators (CPOs) [17]. Unlike conventional fuel retailing, EV charging services involve additional operational considerations, including electricity procurement costs, charging duration, grid constraints, and charger occupancy [18]. Consequently, the design of charging tariffs is an important component of charging station management.
Public EV charging services generally employ three main pricing structures: time-based pricing, energy-based pricing, and hybrid pricing models [19]. Under time-based pricing, users are charged according to the duration of their charging sessions, typically on a per-minute basis. This structure can encourage users to release charging equipment promptly and may improve station turnover. However, the relationship between charging duration and the energy delivered can vary with battery state of charge, battery characteristics, charging power limitations, and environmental conditions. These variations may make the final charging cost less predictable for users [20].
Energy-based pricing charges customers according to the amount of electricity consumed, usually expressed in USD/kWh or another currency per kilowatt-hour [4]. This approach provides a direct relationship between the energy delivered and the amount paid, making the tariff relatively straightforward to communicate. However, energy-based pricing alone does not necessarily discourage vehicles from occupying chargers after their charging sessions have effectively ended. Under congested conditions, prolonged occupancy can reduce the availability of charging equipment for arriving users.
Hybrid pricing models [19] combine energy-based charging with additional time-based penalties or idle fees after charging completion. These approaches aim to improve charger availability while maintaining transparent energy pricing. In recent years, several charging operators have introduced congestion fees, idle fees, or peak-hour surcharges to manage charging demand more effectively.
Charging prices can also influence the distribution of demand among alternative stations. Previous studies have identified price as an important factor in EV users’ charging station selection [19,21]. Users who are more sensitive to price may select a less expensive station even when reaching it requires additional travel, whereas other users may place greater importance on convenience or service conditions. Pricing decisions can consequently affect not only the revenue received by an individual operator but also station arrivals, utilization, and the distribution of charging demand across a network. This relationship provides the economic motivation for examining pricing decisions together with user choice and queueing performance.
2.2. Dynamic Pricing in EV Charging Infrastructure
Dynamic pricing has emerged as a promising strategy for improving the operational efficiency of public charging infrastructure [10]. In contrast to static pricing schemes, dynamic pricing allows charging prices to vary according to real-time or forecasted system conditions, including electricity spot prices, local demand levels, congestion intensity, renewable energy availability, and grid loading conditions [11].
The primary objective of dynamic pricing is to align charging demand with infrastructure capacity and electricity market conditions. During periods of high congestion or elevated electricity prices, higher charging prices may discourage non-essential charging demand and reduce queue formation. Conversely, lower prices during off-peak periods may incentivize users to shift charging sessions to less congested time intervals. As a result, dynamic pricing can contribute to peak shaving, load balancing, and improved charger utilization.
Several studies [10,11,12] have demonstrated that dynamic pricing can improve both economic and operational performance in charging systems. Time-of-use pricing schemes have been shown to reduce peak demand and flatten charging load profiles. Real-time pricing approaches further enhance system responsiveness by continuously adapting prices according to instantaneous market conditions. Demand-based pricing models, on the other hand, incorporate local charger occupancy and queue conditions into pricing decisions.
Despite these advantages, dynamic pricing implementation introduces several challenges. Frequent price fluctuations may reduce customer acceptance and create perceptions of unfairness among users. Behavioral economics studies suggest that customers react more negatively to price increases than positively to equivalent price reductions, which may affect long-term customer loyalty. Furthermore, excessive pricing volatility may reduce pricing transparency and increase uncertainty for EV users [22]. Another important challenge involves competitive market dynamics. In markets with multiple charging operators, dynamic pricing decisions by one operator may directly affect the demand and profitability of competing stations [17]. Therefore, pricing optimization cannot be analyzed independently from market competition, highlighting the need for strategic interaction models such as game theory.
Recent studies have also explored individualized pricing through learning-based control. Bae, Kulcsár, and Gros develop a personalized dynamic-pricing policy for EVs using reinforcement learning, providing a complementary data-driven perspective to the equilibrium-based approach used here [23]. Dynamic charging guidance has also been studied using hierarchical games: Tan and Wang formulate real-time navigation to fast-charging stations as a hierarchical game, emphasizing the strategic interaction between charging guidance and station decisions [24]. These studies address different decision structures from the present work. Here, the focus is on a two-operator non-cooperative pricing game in which the expected queueing delay is linked to probabilistic station choice and is recalculated for each candidate price pair. Thus, the model investigates strategic price selection under congestion-sensitive demand allocation rather than continuous real-time tariff adaptation.
2.3. Queueing Theory in EV Charging Systems
Public fast-charging stations can be represented as service systems in which EVs arrive and compete for a limited number of charging resources. Queueing theory provides analytical tools for examining the relationship between arrival rates, service capacity, queue formation, and waiting times. These performance measures are relevant to charging station operation because users may consider expected waiting time when deciding whether to use a particular facility.
Different queueing structures have been used to represent EV charging systems. Recent work has considered more general arrival and service-time processes, including an MAP/PH/c formulation for EV charging stations [25]. Other studies have investigated charging station dynamics using queueing-based approaches [26], while stochastic modeling and queueing analysis have also been applied to the control and operation of EV charging facilities [27]. These studies demonstrate the relevance of queueing methods for representing congestion and evaluating charging infrastructure performance.
The appropriate queueing structure depends on the assumptions made about vehicle arrivals, charging service times, and the number of parallel chargers. In the present study, each station is represented by an M/M/4 queue. This model assumes Poisson arrivals, exponentially distributed service times, and four parallel chargers operating independently at the same service rate. It therefore allows multiple EVs to be charged simultaneously rather than representing the entire station as a single-server facility.
For an M/M/c system, the stability condition requires the total arrival rate to remain below the aggregate service capacity, expressed as λ < cμ, where λ is the station arrival rate, (c) is the number of parallel chargers, and μ is the service rate of an individual charger. Station utilization is defined as . The Erlang-C formulation can then be used to calculate the probability that an arriving EV must wait and the expected queueing delay. The mean queue length can be obtained consistently with the expected waiting time using Little’s law. The mathematical expressions and their implementation in the four-charger station model are presented in Section 3.
Queueing performance is particularly important when station utilization becomes high. As arrival rates approach aggregate service capacity, waiting times can increase substantially, even when the station remains mathematically stable. Consequently, a pricing policy that attracts additional demand may increase an operator’s sales while also increasing the expected waiting time experienced by its customers. This trade-off is important when queueing delay is included in the station-choice process.
Queueing models have also been combined with optimization and pricing approaches to investigate the effects of congestion on system decisions [28]. In the context of EV charging, highway charging station configuration has been examined using queueing-network-based optimization [28]. More generally, incorporating expected waiting time into a user-choice model provides a mechanism through which congestion can influence demand allocation. In the present framework, this connection is established by feeding the expected waiting time from each station’s M/M/4 model into the MNL utility function. Consequently, station arrivals and queueing delays are mutually dependent and must be determined consistently for each candidate price pair.
2.4. Game Theory in Energy Systems
Game theory provides a framework for analyzing decision-making among participants whose outcomes depend on the strategies selected by other participants. It has been applied to a range of energy-system problems involving independent decision-makers, competing objectives, and interdependent economic outcomes [29]. In these settings, game-theoretic models can be used to examine strategic behavior and identify conditions under which participants have no incentive to change their decisions unilaterally.
Non-cooperative games are relevant when participants make their own decisions while accounting for the actions of their competitors. In a pricing game, for example, each operator selects a price to improve its own payoff, taking the competing operator’s price into account. A Nash equilibrium is a strategy profile in which no player can improve its payoff through a unilateral deviation, provided the other players retain their selected strategies. This concept provides a natural basis for analyzing price competition between charging operators. A different structure is represented by Stackelberg games, in which decision-making is hierarchical. A leader selects a strategy while anticipating the response of one or more followers. Stackelberg formulations have been used in energy applications such as electricity pricing, demand response, and distributed energy trading [30]. The choice between a simultaneous non-cooperative game and a hierarchical game therefore depends on the decision structure being represented and on whether one participant is assumed to act as a leader.
The increasing digitalization and decentralization of energy systems have further expanded the relevance of game-theoretic methods. Smart charging systems [31], vehicle-to-grid (V2G) integration [32], distributed renewable generation [33], and peer-to-peer energy trading [34] all involve strategic interactions among multiple actors with potentially conflicting objectives [35]. As a result, game theory has emerged as a powerful framework for designing efficient and economically stable energy management strategies.
Within EV charging research, game theory has been applied to problems including competition between charging and parking facilities [15], charging management under non-ideal user behavior [16], and charging optimization using distributed or cooperative game-theoretic formulations [36,37,38]. These studies show that game-theoretic modeling is not limited to conventional electricity markets and can also represent interactions involving EV users, charging infrastructure, and energy-system participants. The present study builds on this body of work by focusing specifically on the price decisions of two competing fast-charging operators, with user demand allocation and queueing delays jointly incorporated into the payoff evaluation.
2.5. Competition Among EV Charging Operators
The expansion of public charging infrastructure has increased the potential for competition among charging point operators. In urban areas and along major transportation corridors, EV users may have access to more than one charging provider. Operators may therefore compete through charging prices, charging power, service quality, network accessibility, and the convenience of their locations. The extent of competition depends on the availability of alternative stations and the preferences of EV users.
Although electricity is the principal product delivered by public charging stations, charging services are not necessarily identical from the user’s perspective. Stations may differ in their prices, charging speeds, accessibility, reliability, and expected waiting times. The station-selection decision can therefore involve a trade-off between the monetary cost of charging and the time or distance required to obtain the service. Research on EV user charging patterns and station selection has examined the factors that influence these decisions [39]. Studies of charging operators have also considered the competitive implications of charging services and business strategies [40,41].
Competition can generate interdependent pricing decisions. A reduction in one operator’s price may attract users from a competing station, changing the arrival rates and queueing conditions at both facilities. However, the additional demand attracted by a lower price may also increase the waiting time at the station offering that price. Conversely, a higher-priced operator may retain or attract customers if its station offers a sufficiently favorable combination of accessibility and expected waiting time. Pricing, station choice, and congestion are therefore connected through a feedback mechanism rather than operating as independent decisions.
Recent studies have explicitly examined strategic interactions in EV charging markets. For example, Dong et al. investigated charging pricing strategies for operators considering dual business modes using a non-cooperative game [40]. Other research has considered competitive advantages and business strategies associated with EV charging stations [41], as well as charging guidance and user decision-making in broader charging-system settings [42]. These contributions demonstrate the relevance of competition and strategic decision-making in EV charging. However, the specific modeling choices differ across studies in terms of the operators and users represented, the decision variables considered, and the treatment of congestion. Beyond retail competition, EV charging infrastructure may also participate in electricity markets through demand flexibility and vehicle-to-grid services, as discussed by Ahmed et al. [43].
The framework developed in this study focuses on the interaction between two competing charging operators whose prices influence user choices and consequently station-specific arrival rates. Unlike a pricing analysis that treats demand as independent of waiting time, the proposed model incorporates expected queueing delay into the MNL station-choice utility. Each station is represented by an M/M/4 queue, and the resulting arrival rates and waiting times are determined jointly through a damped fixed-point procedure for each candidate price pair. The operators then select prices through discrete best responses, and candidate outcomes are evaluated using unilateral-deviation regret on the tested price grid. The contribution is therefore the integrated numerical treatment of strategic pricing, congestion-sensitive station choice, and multi-server queueing within a common two-operator framework. The analysis is intended as an illustrative numerical investigation under explicitly stated assumptions, rather than an empirically calibrated estimate of competition along a specific corridor.
3. Methodology
3.1. System Model
This study considers a public EV fast-charging system consisting of two competing charging stations operated by independent charging point operators (CPOs), denoted i ∈ {A,B}. Each operator independently selects a retail charging price to maximize its own economic payoff. Both stations provide DC fast-charging services and are assumed to have identical charging technology and service capacity.
The proposed framework combines three interacting components: (i) EV users who select a charging station based on its price, expected queue waiting time, and access distance; (ii) charging stations whose service performance depends on the arrival rate and the number of available chargers; and (iii) competing operators who determine their retail prices strategically. Figure 2 illustrates the interaction among these components. Operators select prices, users allocate themselves probabilistically between the two stations, and the resulting arrival rates determine the queueing performance of each station. Expected waiting times are then incorporated into the station-choice model, creating a feedback relationship between demand and congestion.
Figure 2.
The system architecture adopted in this study.
Let Λ denote the total potential EV arrival rate, measured in vehicles per hour (EV/h). The station-choice model allocates this demand between the two operators, such that:
where λi is the arrival rate at station (i). The two stations are assumed to have four parallel chargers, each with an individual service rate of μ = 2 EV/h. Thus, the aggregate service capacity of each station is cμ = 8 EV/h, where (c = 4).
Each station (i) is characterized by its retail price pi, access distance di, arrival rate λi, and expected queue waiting time Wq,i. The baseline numerical experiment assumes a constant electricity procurement cost of USD 0.15/kWh for both operators. Wholesale electricity price variations and time-dependent procurement costs are not modeled. Retail prices are selected from a discrete strategy set, and the demand–queue interaction is solved for each candidate price vector.
3.2. User Choice and Utility Model
EV users are assumed to evaluate competing charging stations based on charging price, expected queue waiting time, and access distance. Their choices are represented by a probabilistic discrete-choice model rather than a deterministic maximum-utility allocation rule. The charging station selection mechanism is illustrated in Figure 3. Each arriving EV user evaluates the available alternatives using the modeled prices, expected waiting times, and access distances. The resulting station-choice probabilities determine the allocation of arrivals between the two stations. The resulting demand affects queue waiting times, which subsequently influence user utilities and operators’ pricing decisions.
Figure 3.
User utility-based charging station selection mechanism.
The systematic utility of each charging station is defined in Equation (1). For operator i, the systematic utility is:
where pi is the retail price (USD/kWh), Wi is the expected queue wait (min), and di is the modeled access distance (km). The baseline illustrative calibration uses the following coefficients:
θp = 8.0 kWh/USD
θw = 0.04 min−1
θd = 0.15 km−1
The modeled access distances are dA = 2 km and dB = 4 km. These coefficients and distances are illustrative assumptions; they have not been estimated from observed or stated-preference data for Turkish EV users. Their effects are therefore examined through sensitivity analyses rather than interpreted as empirically calibrated behavioral estimates. The probability that an arriving EV selects station (i) is calculated using the MNL expression:
With total corridor arrival rate Λ, the station-specific arrival rate is:
Accordingly, PA + PB = 1 and . The baseline model does not include an outside option. Thus, all modeled potential arrivals are allocated between the two charging stations. The inclusion of an outside charging alternative is examined separately as a sensitivity analysis.
3.3. M/M/4 Queueing Model and Demand–Queue Fixed Point
Each charging station is represented by an M/M/4 queue, assuming Poisson EV arrivals, exponentially distributed charging service times, and four parallel chargers with identical service rates. The individual charger service rate is μ = 2 EV/h corresponding to a mean service time of . With c = 4 parallel chargers, the aggregate service capacity of each station is:
The queue stability condition for station i is therefore:
The station utilization rate and offered load are defined, respectively, as:
The probability that all four chargers are idle is calculated using the M/M/4 normalization expression:
The Erlang-C probability that an arriving EV must wait before beginning its charging session is:
The expected queue waiting time is then obtained from:
and the expected number of EVs waiting in the queue is calculated using Little’s law:
In Equations (6) and (7), Wq,i is expressed in hours when λi is expressed in EV/h. For use in the MNL utility function and for reporting purposes, the waiting time is converted into minutes:
A demand–queue feedback arises because station arrivals depend on the expected waiting times, while the waiting times depend on the station-specific arrival rates. Specifically, the arrival rates determine the queueing delays through the M/M/4 model, and these delays affect the systematic utilities and MNL choice probabilities in Equation (2). Therefore, the station-choice probabilities, arrival rates, and expected waiting times must be determined consistently for each candidate price vector.
To solve this coupled relationship, a damped fixed-point procedure is applied. For a given price vector, the algorithm initializes the station waiting times, calculates the MNL probabilities and corresponding arrival rates, and then updates the queueing measures. The waiting-time update is damped according to:
where k denotes the iteration index, is the waiting time calculated from the updated arrival rate, and δ is the damping factor. The baseline damping factor is:
The iteration continues until the changes in waiting times and station arrival rates satisfy their respective convergence tolerances. The baseline numerical settings are:
for waiting-time convergence and:
for arrival-rate convergence, subject to a maximum of:
fixed-point iterations. The queue stability condition is checked before evaluating the Erlang-C expressions. If a station violates the stability condition, the corresponding queueing evaluation is treated as infeasible rather than assigning an artificial finite waiting time. Once convergence is achieved, the market allocation and queueing measures are re-evaluated at the terminal solution.
3.4. Operator Payoff and Scope of the Economic Model
The economic objective of each operator is to maximize its gross contribution from energy sales. The daily gross contribution of operator (i) is calculated using the payoff expression in Equation (9). This quantity accounts for charging revenue net of the assumed electricity procurement cost, but excludes capital expenditure, fixed and variable operating costs, demand charges, taxes, and financing costs. The assumed mean energy delivered per charging session is:
For a stationary hourly arrival rate λi, the daily gross contribution is:
with units of:
where the illustrative electricity procurement cost is:
Here, pi and are expressed in USD/kWh, and λi is expressed in EV/h. The factor of 24 converts hourly arrivals into daily arrivals under the stationary-demand assumption, while the mean session energy converts arrivals into energy sales. The expression excludes CAPEX, fixed and variable O&M, demand charges, land and grid-connection costs, taxes, financing, degradation, and any lost-sales penalty. These excluded costs are not optimized in the present game. The model also excludes potential conflicts between public and private stakeholder interests, which have been investigated in other energy applications [44]. Accordingly, results are described as gross contribution rather than net profit, and the earlier claims about effective cost, profit margin, investment recovery, and lifecycle economic superiority are withdrawn. A full techno-economic extension would add these cost terms explicitly and re-solve the pricing game.
3.5. Pricing Game and Numerical Equilibrium Verification
The two charging operators are modeled as players in a non-cooperative pricing game. Each operator selects a retail price from a finite discrete strategy set and seeks to maximize its own daily gross contribution, taking the competitor’s current price into account. For a given price pair, the MNL demand allocation and M/M/4 queueing measures are resolved through the fixed-point procedure described in Section 3.3 before the operators’ payoffs are evaluated. Let Si denote the feasible discrete price set of operator i. The best-response function of operator i is defined as:
where p−i denotes the price selected by the competing operator, and denotes the daily gross contribution of operator i. Si represents the operator’s set of pricing strategies. In the numerical procedure, operators update their prices sequentially using their respective best-response functions. At each update, the demand–queue fixed point is resolved for the candidate price before its payoff is evaluated. Sequential updates continue until the price vector no longer changes within the specified price tolerance or the maximum number of best-response iterations is reached.
The base scenario runs use the price grid specified in Table 1, whereas the expanded USD 0.10–1.0/kWh range is used for the exhaustive equilibrium-resolution checks and the relevant sensitivity analyses. The finer grid is used to examine whether the numerical equilibrium candidates depend on the price-grid resolution. Convergence of the sequential best-response procedure is not, by itself, sufficient to establish a Nash equilibrium. Therefore, candidate price vectors are evaluated separately using unilateral-deviation regret. For operator i, the regret at a candidate price vector:
is defined as:
Table 1.
Simulation parameters used in the case study.
This expression measures the maximum payoff improvement that operator i could obtain by changing its own price while the competitor retains its candidate price. A candidate is accepted as a numerical discrete-grid Nash equilibrium only if neither operator can improve its payoff by more than the prescribed regret tolerance:
In addition to sequential best-response calculations, exhaustive price-pair enumeration is performed under the high-demand setting to cross-check the candidate outcomes. The exhaustive searches evaluate unilateral deviations over the specified discrete strategy sets and identify all candidates satisfying the regret criterion. If multiple candidates satisfy this condition on a finer grid, they are reported separately rather than interpreted as evidence of a unique equilibrium.
The numerical verification is therefore conditional on the assumed demand model, queueing parameters, procurement cost, feasible price grids, and convergence criteria. It does not establish the existence or uniqueness of a pure-strategy Nash equilibrium in the continuous-price game. Figure 4 summarizes the computational procedure, including MNL demand allocation, M/M/4 queue evaluation, fixed-point iteration, sequential best-response updates, and unilateral-deviation verification.
Figure 4.
Flowchart of the proposed non-cooperative game-theoretic pricing algorithm.
The operators’ payoffs are defined in terms of modeled daily gross contribution rather than full net profit. Accordingly, the resulting prices represent equilibrium outcomes of the specified pricing game and should not be interpreted as fully cost-optimal prices for real-world charging operators without further techno-economic calibration, including fixed operating costs, capital expenditures, demand charges, and other relevant cost components.
4. Case Study
4.1. Study Area
The proposed game-theoretic pricing framework is evaluated through an illustrative numerical case motivated by the Istanbul–Ankara highway corridor, one of Türkiye’s major intercity transportation routes. Connecting the country’s two largest metropolitan areas, this corridor provides a relevant geographical context for examining the interactions between public EV charging demand, station accessibility, congestion, and competition among charging point operators (CPOs).
Several public DC fast-charging locations operated by different CPOs are distributed along the E80 highway corridor. Figure 5 illustrates five charging locations to provide geographical context for the application. These locations are not treated as five individual stations in the numerical experiments. Instead, the mathematical model represents two competing charging operators, denoted A and B, as a simplified two-player market.
Figure 5.
Geographical context of the E80 highway corridor and illustrative charging station locations in Türkiye. The numerical case study considers two representative competing charging station operators; the five locations shown on the map do not correspond to five stations explicitly modeled in the numerical experiments.
The geographical illustration helps contextualize the role of station accessibility in EV users’ charging decisions. In the numerical model, however, the access distances assigned to the two operators are illustrative assumptions rather than distances measured from the five mapped locations. These distances enter the multinomial logit (MNL) utility function described in Section 3.2 and are not intended to reproduce the exact spatial choice behavior of drivers traveling along the corridor.
Accordingly, the corridor serves as the motivating geographical setting rather than an empirically calibrated case study. The numerical experiments are designed to demonstrate the proposed framework under controlled assumptions, and their results should not be interpreted as measured operating outcomes or forecasts for the actual charging locations.
4.2. Charging Network Configuration
The numerical model represents two competing charging stations, each operated by a separate CPO. The two-operator configuration provides a tractable setting for investigating strategic price competition while retaining the interaction between user choice and queueing congestion. Although the Istanbul–Ankara corridor motivates the application, the numerical arrivals, station access distances, MNL utility coefficients, and electricity procurement costs are illustrative assumptions rather than measurements from identified operating sites.
Each station is equipped with four parallel DC fast chargers. The service rate of each charger is assumed to be 2 EV/h, corresponding to a mean charging service duration of 30 min. Thus, the aggregate service capacity of each station is:
where c = 4 is the number of parallel chargers and μ = 2 EV/h is the service rate of an individual charger. The resulting queueing system is represented by an M/M/4 model, as formulated in Section 3.3. Potential EV arrivals are represented by an exogenous Poisson arrival process. The total potential arrival rate, denoted Λ, is set to 3 EV/h in the low-demand case and 6 EV/h in the high-demand case:
cμ = 8 EV/h
The MNL model allocates this potential demand between the two stations according to their respective prices, expected waiting times, and access distances. Consequently, the station-specific arrival rates are endogenous to the pricing and user-choice interaction, whereas the total potential arrival rate is an exogenous scenario parameter. For the baseline numerical experiments, both operators are assigned a constant illustrative electricity procurement cost of USD 0.15/kWh. The procurement cost is identical across operators and remains constant throughout each simulation. The model therefore does not represent time-varying wholesale electricity prices or time-dependent procurement-cost optimization.
4.3. Simulation Parameters
The parameters summarized in Table 1 are illustrative assumptions and have not been calibrated against data from any specific Turkish charging site. They are used to demonstrate the behavior of the proposed game-theoretic framework under controlled numerical conditions.
4.4. Simulation Procedure
For a given pair of retail prices, the model iteratively updates the MNL station-choice probabilities, the resulting station-specific arrival rates, and the expected waiting times obtained from the M/M/4 queueing model. This inner demand–queue calculation continues until the prescribed convergence criteria for waiting times and arrival rates are satisfied or the maximum number of iterations is reached.
In the strategic pricing cases, each operator subsequently evaluates the available retail price grid and selects a best response to the rival operator’s current price. The operators update their prices sequentially, and the process continues until the price pair no longer changes or the specified iteration limit is reached. Price convergence and equilibrium verification are treated as separate computational checks. In particular, convergence of the sequential price updates does not by itself establish a Nash equilibrium; the latter is assessed by evaluating unilateral deviations over the tested discrete price grid.
Six controlled scenarios are considered, as summarized in Table 2. These scenarios distinguish between low and high demand, fixed and strategic pricing, and the inclusion or exclusion of waiting-time disutility in the MNL choice model. In the fixed-price scenarios, both operators retain the same opportunity to attract users through the MNL choice model, but their retail prices are held constant at USD 0.28/kWh.
Table 2.
Simulation scenarios considered in the case study.
In the congestion-choice ablation scenarios, the waiting-time term is removed from the MNL utility function by setting θw = 0. Importantly, the M/M/4 queueing calculations are retained in these cases; only the influence of waiting time on users’ station-choice decisions is disabled. The computational procedure is illustrated in Figure 6. It summarizes the sequence of demand allocation, queueing analysis, strategic price updating, and discrete-grid equilibrium verification.
Figure 6.
Simulation workflow of the proposed game-theoretic EV charging model.
The simulation records the resulting retail prices, station-specific arrival rates, expected waiting times, average queue lengths, station utilization rates, and operator gross contributions. These outputs are used in Section 5 to compare the fixed-price and strategic-pricing outcomes and to examine the effects of demand and user-choice assumptions.
4.5. Simulation Scenarios
Six cases are used to separate demand level, strategic price optimization, and the role of congestion-sensitive station choice. Fixed-price cases hold both retail prices at USD 0.28/kWh while retaining competition for users; strategic cases use sequential best responses. The high-demand ablation with θw = 0 removes waiting-time disutility from MNL choice while keeping the physical M/M/4 queue model, allowing its effect on prices and demand allocation to be isolated.
4.6. Performance Evaluation Metrics
To evaluate the effectiveness of the proposed game-theoretic pricing framework, several technical and economic performance indicators are considered. These indicators quantify the impacts of charging prices on congestion management, charging station utilization, and operator profitability.
Average Queue Length
The average queue length indicates the congestion level at each charging station and is obtained from the M/M/4 queueing model introduced in Section 3.3. Lower queue lengths indicate improved service quality and shorter customer waiting times.
Average Waiting Time
The expected queueing waiting time, Wq,i, measures the average time an EV spends waiting before charging service begins at station i. It is obtained from the M/M/4 model and is also incorporated into the MNL utility function when θw > 0. Waiting time is therefore both a queueing performance indicator and a determinant of station attractiveness in the baseline user-choice model.
Station Utilization Rate
The station utilization rate is defined as the ratio of the station-specific arrival rate to its aggregate service capacity:
Here, λi is the arrival rate at station i, c = 4 is the number of parallel chargers, and μ = 2 EV/h is the service rate of each charger.
Charging Demand Allocation
Charging demand allocation represents the proportion of total EV charging demand served by each competing charging operator. This indicator reflects the influence of pricing strategies and customer preferences on market share.
System-Wide Demand-Weighted Average Waiting Time
To distinguish changes in individual station congestion from changes in user experience, the system-wide demand-weighted average waiting time is calculated as:
This measure accounts for both the waiting time at each station and the number of EVs arriving there. It is therefore used to assess whether a pricing strategy improves the aggregate waiting experience, rather than relying only on station-specific waiting times. A reduction in the system-wide weighted average does not necessarily imply that waiting time decreases at both individual stations.
Nash Equilibrium Convergence
The convergence behavior of the proposed iterative pricing algorithm is evaluated by monitoring successive charging price updates. Faster convergence indicates improved computational efficiency and greater pricing stability.
Customer Utility
Customer utility represents the relative attractiveness of each charging station based on retail price, expected waiting time, and access distance. In the MNL formulation, a higher deterministic utility corresponds to a more attractive alternative and, all else being equal, a higher choice probability. The systematic utility is expressed as:
Because the utility is specified as a systematic component of a probabilistic choice model, it should not be interpreted as a directly observed measure of customer satisfaction.
4.7. Assumptions and Limitations
The proposed game-theoretic pricing framework is developed under several simplifying assumptions that facilitate analytical modeling while maintaining practical relevance.
First, total corridor arrivals are assumed to follow a Poisson process and are allocated between stations using MNL probabilities. Service times are assumed exponential with per-charger rate μ = 2 EV/h; each station has c = 4 parallel chargers, yielding an M/M/4 queue with stability condition λi < 8 EV/h.
Second, user choice is represented probabilistically through an MNL model based on price, expected waiting time, and access distance. The coefficients and distances are assumed for this illustrative experiment and have not been estimated from observed or stated-preference charging-choice data. Other behavioral factors, such as charging-network loyalty, reservations, and individual heterogeneity, are not explicitly modeled.
Third, charging operators are assumed to possess complete market information, including competitor charging prices and estimated customer demand. Although real-world information may be imperfect, this assumption enables the formulation of a tractable non-cooperative pricing game.
Fourth, each charging station is assumed to provide identical DC fast-charging technology and charging power. Differences in charger reliability, maintenance schedules, battery charging characteristics, and weather conditions are neglected.
Finally, the case study focuses on two representative competing operators in an illustrative market motivated by the Istanbul–Ankara corridor. Although the proposed methodology can be extended to larger charging networks with multiple operators, increasing the number of players may require more advanced equilibrium computation techniques.
5. Results and Discussion
5.1. Queue Stability and Congestion Under M/M/4
For four parallel chargers with μ = 2 EV/h each, the stability condition is λi < 8 EV/h at each station. At the high-demand equilibrium candidate pA = 0.45 and pB = 0.42 USD/kWh, the MNL fixed point assigns 3.0796 and 2.9204 EV/h to Operators A and B. Corresponding utilizations are 0.3849 and 0.3651, expected queue waits are 0.9850 and 0.8113 min, and mean queue lengths are 0.05055 and 0.03949 vehicles. Both stations therefore operate within the stability region, with their arrival rates remaining substantially below the aggregate service capacity of 8 EV/h. These results indicate that the modeled high-demand equilibrium candidate does not approach queue saturation under the assumed service and demand parameters. The corresponding queueing performance across the modeled pricing conditions is illustrated in Figure 7.
Figure 7.
Queueing performance of the two charging stations under the modeled pricing conditions.
5.2. Fixed Pricing and Congestion-Sensitive Competitive Pricing
At low demand (Λ = 3 EV/h), fixed prices of USD 0.28/kWh produce station arrivals of 1.7210 and 1.2790 EV/h, queue waits of 0.1176 and 0.0391 min, utilization of 0.2151 and 0.1599, and daily gross contributions of USD 402.72 and USD 299.28. Allowing both operators to choose best-response prices gives USD 0.42 and USD 0.39/kWh, arrivals of 1.5445 and 1.4555 EV/h, waits of 0.0788 and 0.0632 min, utilization of 0.1931 and 0.1819, and gross contributions of USD 750.64 and USD 628.77/day. These figures describe gross contribution only and do not include fixed or investment costs.
At high demand (Λ = 6 EV/h), fixed prices of USD 0.28/kWh produce arrivals of 3.3952 and 2.6048 EV/h, utilization of 0.4244 and 0.3256, and gross contributions of USD 794.47 and USD 609.53/day. Under congestion-sensitive best-response pricing, the selected prices are USD 0.45 and USD 0.42/kWh. The corresponding arrivals are 3.0796 and 2.9204 EV/h, queue waits are 0.9850 and 0.8113 min, and gross contributions are USD 1662.96 and USD 1419.33/day. The comparison shows that the model’s payoff-maximizing prices can raise gross contribution under the assumed demand and cost parameters; it does not establish net profitability or universal superiority in a real market. Figure 8 summarizes station utilization under the modeled pricing conditions, while Figure 9 compares the operators’ daily gross contributions; these payoffs should not be interpreted as net profit.
Figure 8.
Station utilization rates at the two charging stations under the modeled pricing scenarios.
Figure 9.
Daily gross contribution of the two charging operators under the modeled pricing scenarios.
5.3. Controlled Test Without Congestion-Sensitive User Choice
To isolate the contribution of the waiting-time term in user choice, the high-demand game was recomputed with the waiting-time coefficient set to zero (θw = 0), while retaining the M/M/4 queueing model for performance evaluation. Under best-response pricing, the resulting station prices are USD 0.41 and USD 0.39/kWh, with arrival rates of 3.2097 and 2.7903 EV/h, waiting times of 1.1464 and 0.6871 min, utilizations of 0.4012 and 0.3488, and gross contributions of USD 1502.12 and USD 1205.43/day, respectively. For comparison, under fixed prices of USD 0.28/kWh with θw = 0, the corresponding arrival rates are 3.4467 and 2.5533 EV/h, waiting times are 1.4909 and 0.4974 min, utilizations are 0.4308 and 0.3192, and gross contributions are USD 806.52 and USD 597.48/day. These results indicate that removing the waiting-time term affects both strategic pricing outcomes and demand allocation, supporting the limited conclusion that queue-sensitive choice materially influences the numerical outcomes under the assumed coefficients.
The comparative results for all six simulation scenarios are summarized in Table 3. The table reports the selected charging prices, station-specific arrival rates, queueing performance, station utilization rates, and daily gross contributions under fixed pricing, best-response pricing, and the high-demand ablation cases. This comparison provides a consistent basis for assessing the effects of demand intensity, strategic price optimization, and congestion-sensitive station choice within the M/M/4 framework.
Table 3.
Comparative performance of the six simulation scenarios under the M/M/4 queueing model.
5.4. Sensitivity Analysis: Pricing, Gross Contribution, and System-Wide Waiting Time
The demand-sensitivity analysis examines how changes in the total potential EV arrival rate affect strategic prices, station utilization, queueing performance, and daily gross contribution. The total potential arrival rate is varied from 1 to 8 EV/h in increments of 1 EV/h, while the number of chargers, per-charger service rate, MNL coefficients, access distances, and economic assumptions are kept unchanged. Under fixed pricing, both operators charge USD 0.28/kWh. Under strategic pricing, each operator selects a price from the expanded discrete grid between USD 0.10 and USD 1.0/kWh, with an increment of USD 0.005/kWh. This expanded grid is used for the demand-sensitivity analysis and should be distinguished from the baseline price grid used in the six scenarios in Table 3. The input parameters for this analysis are summarized in Table 4.
Table 4.
Input parameters for the demand-sensitivity analysis.
The demand-dependent pricing and economic outcomes are presented in Figure 10. The strategic prices increase with total potential demand, from USD 0.410 and USD 0.385/kWh at 1 EV/h to USD 0.510 and USD 0.485/kWh at 8 EV/h for Operators A and B, respectively. The price difference between the two operators remains USD 0.025/kWh across the examined demand levels. The combined daily gross contribution under fixed pricing increases from USD 234 at 1 EV/h to USD 1872 at 8 EV/h. Under strategic pricing, the corresponding combined gross contribution increases from USD 446.62 to USD 5010.43/day. Thus, strategic pricing produces a higher combined gross contribution at every tested demand level. The ratio of strategic to fixed-price gross contribution ranges from approximately 1.91 to 2.68 across the examined demand levels. These results indicate that the economic effect of strategic price optimization becomes more pronounced as potential demand increases within the modeled parameter range.
Figure 10.
Relationship between station utilization and daily gross contribution under fixed and game-theoretic pricing strategies.
The station-level congestion response is not symmetric. Strategic pricing redistributes arrivals between the two operators, reducing Operator A’s arrival rate and utilization while increasing those of Operator B relative to the fixed-price case. At a total potential arrival rate of 8 EV/h, for example, the utilization rate decreases from approximately 0.553 to 0.518 at Station A, whereas it increases from approximately 0.447 to 0.482 at Station B. The corresponding expected waiting times change from approximately 3.87 to 2.99 min at Station A and from 1.71 to 2.27 min at Station B. Consequently, strategic pricing does not reduce waiting time at every station. It changes the distribution of congestion between the competing stations.
To evaluate the aggregate user experience, the demand-weighted average waiting time is compared under fixed and strategic pricing. Table 5 reports the resulting prices, combined daily gross contributions, and system-wide demand-weighted waiting times across all tested demand levels.
Table 5.
Demand-sensitivity results under fixed and strategic pricing.
The demand-weighted waiting time is lower under strategic pricing at every tested demand level. For example, at 6 EV/h, it decreases from 1.0301 to 0.9101 min, while at 8 EV/h it decreases from 2.9023 to 2.6414 min. This aggregate improvement occurs despite the increase in waiting time at Station B in the 8 EV/h example. The result highlights the distinction between station-level congestion and system-wide user experience: a pricing strategy can redistribute congestion between operators while reducing the average waiting time experienced by the modeled arrivals as a whole.
The results also show that the economic and congestion effects of strategic pricing are related, but not interchangeable. Higher gross contribution does not necessarily imply lower utilization or shorter waiting times at every individual station. The demand-weighted measure is therefore important for evaluating the congestion outcome alongside operator-level economic performance.
5.5. Sensitivity to Price Coefficient and Outside Option
Two additional sensitivity analyses are conducted to examine the influence of user price sensitivity and the availability of an alternative outside option. These tests extend the baseline MNL formulation and assess whether the strategic pricing outcomes are strongly dependent on the assumed user-choice specification.
5.5.1. Sensitivity to the Price Coefficient
The baseline price-sensitivity coefficient is θp = 8 USD/kWh. To examine its influence, the coefficient is varied across 4, 8, 12, and 16 while the other baseline assumptions are retained. A lower value of θp represents weaker sensitivity to price differences, whereas a higher value represents stronger price sensitivity.
At θp = 8, the expanded-grid strategic outcome is USD 0.445 and USD 0.420/kWh. Increasing the coefficient to 12 and 16 results in lower selected prices of USD 0.345/0.330 and USD 0.300/0.285 per kWh, respectively. This pattern is consistent with the increased influence of price in the MNL choice probabilities: when users become more sensitive to price differences, the operators have a stronger incentive to moderate their retail prices.
At θp = 4, extending the upper price bound to USD 1.00/kWh resulted in equilibrium candidate prices of USD 0.740/kWh for Operator A and USD 0.690/kWh for Operator B. Both prices are interior to the expanded price interval of USD 0.10–1.00/kWh, indicating that the previous boundary-constrained outcome was caused by the narrower search range. The price iteration and demand–queue fixed-point calculation converged, and the maximum unilateral regret was zero within the numerical precision of the reported results. Thus, this sensitivity case satisfies the adopted discrete-grid equilibrium criterion over the expanded price interval. The equilibrium outcomes for all four price-sensitivity coefficients are summarized in Table 6.
Table 6.
Sensitivity of strategic pricing outcomes to the MNL price coefficient.
The sensitivity results demonstrate that the selected prices depend on the assumed price coefficient. In particular, stronger price sensitivity leads to lower strategic prices in the tested cases. The results also indicate that the economic outputs cannot be interpreted independently of the behavioral assumptions embedded in the MNL model. Because the coefficients are illustrative rather than empirically estimated, this analysis should be understood as a parameter-sensitivity test, not as an estimate of actual consumer price responsiveness.
5.5.2. Sensitivity to an Outside Charging Option
The baseline MNL model allocates all potential demand between the two modeled operators. To examine the effect of relaxing this assumption, an outside alternative is introduced. This alternative represents the possibility that an EV user does not select either modeled station, for example, because another charging location or a different travel decision is preferred. The outside option is represented by an additional utility term in the MNL denominator. Its utility is varied across illustrative values of −3.5, −2.8, and −2.2, while the two modeled operators retain their original utility specifications. These values are scenario assumptions rather than empirically estimated outside-option preferences.
As the outside option becomes more attractive, a larger share of potential demand is allocated away from the two modeled operators. Under the baseline case without an outside option, the two stations capture all potential demand. At outside-option utility −3.5, the outside share increases to approximately 28.2%; at −2.8, it increases to 40.6%; and at −2.2, it reaches approximately 51.8%. The lower station arrivals reduce queueing delays and the gross contributions of both operators. The strategic pricing outcomes under the baseline and outside-option scenarios are summarized in Table 7.
Table 7.
Sensitivity of strategic pricing outcomes to the outside-option utility.
The outside-option analysis shows that the assumption of complete market capture has a material influence on the modeled outcomes. As the outside alternative becomes more attractive, fewer EVs select either modeled operator, resulting in lower station utilization, shorter waiting times, and lower gross contributions. This behavior illustrates why an outside alternative can be important when applying the framework to markets in which EV users have access to competing charging locations beyond the two modeled operators.
Taken together, the price-coefficient and outside-option analyses demonstrate that strategic prices and operator gross contributions are sensitive to the assumed user-choice structure. Empirical estimation of these behavioral parameters would therefore be necessary before using the framework to make site-specific pricing recommendations.
5.6. Discrete-Grid Equilibrium and Robustness Checks
The convergence of sequential best-response updates is recorded separately from the numerical equilibrium verification. To examine unilateral deviations more systematically, exhaustive price-pair evaluations are performed over two discrete grids covering USD 0.10–1.0/kWh. On the USD 0.01/kWh grid, the exhaustive search evaluates 91 × 91 = 8281 price pairs and identifies one high-demand discrete-grid candidate at (0.45,0.42) USD/kWh. The corresponding daily gross contributions are USD 1662.96 and USD 1419.33 for Operators A and B, respectively. Both operators have zero unilateral-deviation regret on the tested grid. On the finer USD 0.005/kWh grid, the exhaustive search evaluates 181 × 181 = 32,761 price pairs. Two candidates are identified: (0.445, 0.420) and (0.450, 0.425) USD/kWh. Both candidates satisfy the adopted discrete-grid regret criterion, with zero reported unilateral regret. The identification of two candidates on the finer grid means that the results do not support a uniqueness claim.
No fixed-point failures or queue-unstable price pairs were observed in the reported exhaustive searches. Initial-price tests also converged to nearby outcomes for the tested starting points. These findings support the numerical repeatability of the implemented procedure under the tested configurations, but they do not establish global convergence for arbitrary initial conditions.
The effect of waiting-time sensitivity on strategic prices is examined by multiplying the baseline coefficient by 0.5, 1, and 2. With θw = 0.02, 0.04, and 0.08 min−1, respectively, the reported price pairs are USD 0.425/0.400, USD 0.445/0.420, and USD 0.475/0.450 per kWh. These results indicate that the selected prices respond to the assumed importance of waiting time in station choice. The high-demand equilibrium search and sensitivity analysis results are summarized in Table 8.
Table 8.
High-demand discrete-grid equilibrium search and sensitivity checks.
The sequential best-response price trajectory for a representative strategic run is shown in Figure 11. The figure illustrates the numerical price-update process, whereas the exhaustive search and unilateral-regret calculations provide the separate discrete-grid equilibrium diagnostics.
Figure 11.
Sequential best-response price convergence for the representative pricing-game run.
5.7. Interpretation and Limitations
The main methodological contribution is the explicit coupling of an MNL station-choice model, an M/M/4 queue, and a two-player discrete pricing game, with a fixed-point solver inside each payoff evaluation and exhaustive unilateral-deviation checks on finite price grids. The individual ingredients are established techniques; novelty is claimed for their integrated and transparently verified application to competing highway charging stations, not for a new general theorem in queueing theory or game theory.
The case study is designed to demonstrate the applicability of the proposed framework under a set of explicitly defined assumptions. The total arrival rates, access distances, procurement costs, and MNL coefficients are assumed inputs and have not been calibrated against observed station-level data for the Istanbul–Ankara highway corridor. The payoff represents gross contribution before accounting for capital expenditures (CAPEX), operating and maintenance (O&M) costs, demand charges, taxes, financing, and other relevant expenses. Therefore, the results should be interpreted as an assessment of the strategic interactions between competing charging stations under the specified assumptions, rather than as estimates of net profit, lifecycle cost, investment payback, or economic viability.
6. Conclusions
This study developed a game-theoretic pricing framework for two competing EV fast-charging operators by integrating a multinomial logit (MNL) station-choice model, an M/M/4 queue at each station, and a discrete non-cooperative pricing game. A damped fixed-point procedure was used to resolve the interaction between station-choice probabilities, arrival rates, and expected queueing delays for each candidate price pair. Numerical equilibrium candidates were assessed using unilateral-deviation regret, rather than relying on price convergence alone.
The numerical analysis demonstrated that incorporating congestion-sensitive station choice can affect both pricing decisions and the distribution of charging demand between competing operators. In the illustrative high-demand scenario, with a total potential arrival rate of 6 EV/h, the base-grid strategic pricing outcome yielded prices of USD 0.45/kWh and USD 0.42/kWh for Operators A and B, respectively. The corresponding arrival rates were 3.080 and 2.920 EV/h, while the expected queueing waits were 0.985 and 0.811 min. Both stations remained within the M/M/4 stability region. Compared with the fixed-price benchmark, the strategic pricing outcome increased the combined daily gross contribution from approximately USD 1404 to USD 3082. This improvement should be interpreted as a result under the assumed demand, choice, and cost parameters rather than as an estimate of realized operator profitability.
The demand-sensitivity analysis, covering potential arrival rates from 1 to 8 EV/h, further showed that strategic pricing produced a lower demand-weighted system-wide waiting time than fixed pricing at every examined demand level. At a potential arrival rate of 6 EV/h, for example, the weighted average waiting time decreased from approximately 1.030 min under fixed pricing to 0.910 min under the strategic pricing outcome reported in the demand-sensitivity analysis. This system-level measure is important because changes in competitive prices may redistribute arrivals between stations: an individual operator’s waiting time may increase even when the aggregate, demand-weighted waiting time decreases. The results therefore suggest that the congestion implications of competitive pricing should be assessed at both the station and system levels.
The controlled comparison without waiting-time sensitivity in the MNL utility also produced a different strategic pricing outcome, with prices of USD 0.41/kWh and USD 0.39/kWh. This finding indicates that the representation of congestion in users’ station-choice decisions can influence equilibrium candidates and demand allocation. Additional sensitivity analyses examined the price-sensitivity coefficient and the availability of an outside charging alternative. These analyses showed that the resulting prices, station arrivals, waiting times, and gross contributions depend on the assumed choice structure. In particular, introducing an outside option reduced the share of potential demand captured by the two modeled operators, illustrating the importance of accounting for alternatives beyond the competing stations.
The equilibrium diagnostics also highlight the importance of distinguishing numerical convergence from equilibrium verification. Exhaustive searches identified one equilibrium candidate on the USD 0.01/kWh price grid and two candidates on the finer USD 0.005/kWh grid. The candidate outcomes satisfied the specified discrete unilateral-deviation regret criterion. However, these findings do not establish uniqueness, prove convergence for arbitrary initial conditions, or demonstrate the existence of an equilibrium in the continuous-price game. They instead provide numerical evidence of equilibrium candidates within the examined finite strategy sets.
Several limitations should be considered when interpreting these findings. The corridor demand levels, station access distances, MNL choice coefficients, and electricity procurement costs are illustrative assumptions and have not been calibrated against observed station-level data. Similarly, the Istanbul–Ankara corridor provides geographical motivation for the numerical example; the analysis does not constitute an empirical validation of an operating corridor network. The queueing analysis uses the M/M/4 assumptions of Poisson arrivals, exponential service times, and four parallel chargers at each station. The numerical model allocates mean arrival rates through the MNL choice probabilities rather than reproducing individual vehicle trajectories or stochastic arrival events. Furthermore, the modeled economic payoff represents daily gross contribution after electricity procurement costs, but before capital expenditure, fixed operating and maintenance costs, demand charges, taxes, financing costs, and other expenses. Consequently, the reported values should not be interpreted as net profit or evidence of site-specific investment viability.
Future research should prioritize calibration and validation using observed charging-station demand, access distances, user-choice data, and operator service records. Further extensions could examine time-dependent demand, larger networks with more than two competing operators, heterogeneous charging technologies, and continuous-strategy equilibrium methods. These developments would help establish the empirical relevance, economic completeness, and practical applicability of the proposed framework in real-world competitive EV charging markets.
Author Contributions
Conceptualization, H.H.C. and W.L.; methodology, H.H.C. and W.L.; software, H.H.C. and W.L.; validation, H.H.C. and W.L.; formal analysis, H.H.C., P.M. and W.L.; investigation, H.H.C. and W.L.; resources, H.H.C. and P.M.; data curation, H.H.C. and W.L.; writing—original draft preparation, H.H.C., P.M. and W.L.; writing—review and editing, H.H.C. and W.L.; visualization, H.H.C. and W.L.; supervision, H.H.C. and W.L.; project administration, H.H.C. and W.L.; funding acquisition, W.L. All authors have read and agreed to the published version of the manuscript.
Funding
This research received no external funding.
Data Availability Statement
Data are contained within the article.
Conflicts of Interest
The authors declare no conflicts of interest.
References
- Longo, M.; Foiadelli, F.; Yaïci, W. Electric Vehicles Integrated with Renewable Energy Sources for Sustainable Mobility. In New Trends in Electrical Vehicle Powertrains; IntechOpen: London, UK, 2019. [Google Scholar] [CrossRef] [Scilit]
- International Energy Agency. Global EV Outlook 2024. 2024. Available online: https://www.iea.org/reports/global-ev-outlook-2024 (accessed on 22 July 2026).
- Mohan, A.; Pal, K.; Meena, H.K. Comprehensive review of electric vehicle charging infrastructure: Technologies, standards, and smart energy management. Future Batter. 2026, 10, 100177. [Google Scholar] [CrossRef] [Scilit]
- Kınay, Ö.B.; Gzara, F.; Alumur, S.A. Charging Station Location and Sizing for Electric Vehicles Under Congestion. Transp. Sci. 2023, 57, 1403–1719. [Google Scholar] [CrossRef] [Scilit]
- Korkas, C.D.; Baldi, S.; Michailidis, P.; Kosmatopoulos, E.B. A cognitive stochastic approximation approach to optimal charging schedule in electric vehicle stations. In Proceedings of the 2017 25th Mediterranean Conference on Control and Automation (MED); IEEE: New York, NY, USA, 2017; pp. 484–489. [Google Scholar] [CrossRef] [Scilit]
- Mohammed, A.; Saif, O.; Abo-Adma, M.; Fahmy, A.; Elazab, R. Strategies and sustainability in fast charging station deployment for electric vehicles. Sci. Rep. 2024, 14, 283. [Google Scholar] [CrossRef] [Scilit]
- Mahavir Varma, S.; Castro, F.; Theja Maguluri, S. Electric Vehicle Fleet and Charging Infrastructure Planning. Manag. Sci. 2025, 72, 6433–7379. [Google Scholar] [CrossRef] [Scilit]
- Kazemtarghi, A.; Mallik, A.; Chen, Y. Dynamic pricing strategy for electric vehicle charging stations to distribute the congestion and maximize the revenue. Int. J. Electr. Power Energy Syst. 2024, 158, 109946. [Google Scholar] [CrossRef] [Scilit]
- Michailidis, P.; Michailidis, I.; Kosmatopoulos, E. Reinforcement Learning for Electric Vehicle Charging Management: Theory and Applications. Energies 2025, 18, 5225. [Google Scholar] [CrossRef] [Scilit]
- Cui, L.; Wang, Q.; Qu, H.; Wang, M.; Wu, Y.; Ge, L. Dynamic pricing for fast charging stations with deep reinforcement learning. Appl. Energy 2023, 346, 121334. [Google Scholar] [CrossRef] [Scilit]
- Amin, A.; Tareen, W.U.K.; Usman, M.; Ali, H.; Bari, I.; Horan, B.; Mekhilef, S.; Asif, M.; Ahmed, S.; Mahmood, A. A Review of Optimal Charging Strategy for Electric Vehicles under Dynamic Pricing Schemes in the Distribution Charging Network. Sustainability 2020, 12, 10160. [Google Scholar] [CrossRef] [Scilit]
- Zulfiqar, M.; ul Abdeen, Z.; Kamran, M. Optimizing electric vehicle charging scheduling using enhanced multi-agent neural networks with dynamic pricing. J. Energy Storage 2024, 99, 113317. [Google Scholar] [CrossRef] [Scilit]
- Yang, D.; Sarma, N.J.S.; Hyland, M.F.; Jayakrishnan, R. Dynamic modeling and real-time management of a system of EV fast-charging stations. Transp. Res. Part C Emerg. Technol. 2021, 128, 103186. [Google Scholar] [CrossRef] [Scilit]
- Karlsson, J.; Grauers, A. Agent-Based Investigation of Competing Charge Point Operators for Battery Electric Trucks. Energies 2024, 17, 2901. [Google Scholar] [CrossRef] [Scilit]
- Jiang, M.; Chen, T.; Gao, C.; Ma, R.; Su, W.; Kavousi-Fard, A. A Game-Theoretic Approach to Solve Competition between Multi-Type Electric Vehicle Charging and Parking Facilities. World Electr. Veh. J. 2023, 14, 59. [Google Scholar] [CrossRef] [Scilit]
- Mediwaththe, C.P.; Smith, D.B. Game-Theoretic Electric Vehicle Charging Management Resilient to Non-Ideal User Behavior. IEEE Trans. Intell. Transp. Syst. 2018, 19, 3486–3495. [Google Scholar] [CrossRef] [Scilit]
- Lai, S.; Qiu, J.; Tao, Y.; Zhao, J. Pricing for Electric Vehicle Charging Stations Based on the Responsiveness of Demand. IEEE Trans. Smart Grid 2023, 14, 530–544. [Google Scholar] [CrossRef] [Scilit]
- Ikhajangbe, O.E.; Dhulipati, H.; Liu, S. Economic Impacts and Mitigation for the Grid Connected Electric Vehicle Charging: A Technical and Operational Overview. IEEE Access 2026, 14, 60099–60121. [Google Scholar] [CrossRef] [Scilit]
- Bakhtiari, A.; Zaman Patwary, A.U.; Ciari, F.; Moeini, A.; Hajebrahimi, A. A Comparative Analysis of Time-Based and Hybrid Pricing Models for Electric Vehicle Charging. Procedia Comput. Sci. 2024, 238, 757–762. [Google Scholar] [CrossRef] [Scilit]
- Li, W.; Yanyachi, A.; Xia, J.; Kuppan, S.; Zhou, J.; Wang, Y.; Li, Y.; Pianetta, P.; Zhao, K.; Mitlin, D.; et al. Mechanistic Considerations for Battery Charging Protocol Design. Adv. Energy Mater. 2026, 16, e04499. [Google Scholar] [CrossRef] [Scilit]
- Yang, F.; Yu, S.; Meng, C.; Cong, D.; Huang, Y.; Yu, C. A three-stage optimization of charging scheduling of electric vehicles considering electricity price and user selection. Electr. Eng. 2024, 106, 4737–4746. [Google Scholar] [CrossRef] [Scilit]
- Bambauer-Sachse, S.; Young, A. Consumers’ Intentions to Spread Negative Word of Mouth About Dynamic Pricing for Services: Role of Confusion and Unfairness Perceptions. J. Serv. Res. 2024, 27, 364–380. [Google Scholar] [CrossRef] [Scilit]
- Bae, S.; Kulcsár, B.; Gros, S. Personalized dynamic pricing policy for electric vehicles: Reinforcement learning approach. Transp. Res. Part C Emerg. Technol. 2024, 161, 104540. [Google Scholar] [CrossRef] [Scilit]
- Tan, J.; Wang, L. Real-Time Charging Navigation of Electric Vehicles to Fast Charging Stations: A Hierarchical Game Approach. IEEE Trans. Smart Grid 2015, 8, 846–856. [Google Scholar] [CrossRef] [Scilit]
- Soufiani, E.; Almehdawe, E.; Tang, Y. A realistic MAP/PH/c queuing model for electric vehicle charging stations: Theoretical development and real-world case study. Transp. B Transp. Dyn. 2026, 14, 2642261. [Google Scholar] [CrossRef] [Scilit]
- Masrur, H.; Al-Awami, A.T. Dynamics of an EV Charging Station considering Queuing Theory. Transp. Res. Procedia 2025, 84, 434–439. [Google Scholar] [CrossRef] [Scilit]
- Varshney, S.; Panda, K.P.; Shah, M.; Srinivas, B.A.; Deshmukh, A.; Choudhary, K.K.; Bajaj, M.; Prokop, L.; Rubanenko, O. Novel control strategies for electric vehicle charging stations using stochastic modeling and queueing analysis. Sci. Rep. 2025, 15, 21391. [Google Scholar] [CrossRef] [Scilit]
- Li, H.; Zhao, B.; Yao, Z.; Jiang, Y. A Queuing-Network-Based Optimization Model for EV Charging Station Configuration in Highway Service Areas. Modelling 2026, 7, 46. [Google Scholar] [CrossRef] [Scilit]
- Cheng, L.; Li, M.; Tan, C.; Huang, P.; Zhang, M.; Sun, R. Computational Game-Theoretic Models for Adaptive Urban Energy Systems: A Comprehensive Review of Algorithms, Strategies, and Engineering Applications. Arch. Comput. Methods Eng. 2026, 33, 2037–2114. [Google Scholar] [CrossRef] [Scilit]
- Yu, J.; Wang, Q.; Zhang, X.; Liu, C. Optimizing photovoltaic energy sharing: A novel framework based on Stackelberg games in distribution networks. Renew. Energy 2026, 256, 123870. [Google Scholar] [CrossRef] [Scilit]
- Dahiwale, P.V.; Rather, Z.H.; Mitra, I. A Comprehensive Review of Smart Charging Strategies for Electric Vehicles and Way Forward. IEEE Trans. Intell. Transp. Syst. 2024, 25, 10462–10482. [Google Scholar] [CrossRef] [Scilit]
- Dong, S.; Guo, S. Advancements, Challenges, and Future Trends of Vehicle-to-Grid Technologies: A Review. Energy Technol. 2025, 13, 2500481. [Google Scholar] [CrossRef] [Scilit]
- Wang, B.; Evergreen, S.; Forest, J. Game Theory in Smart Grids: Strategic decision-making for renewable energy integration. Sustain. Cities Soc. 2024, 108, 105480. [Google Scholar] [CrossRef] [Scilit]
- Islam, S.N. A Review of Peer-to-Peer Energy Trading Markets: Enabling Models and Technologies. Energies 2024, 17, 1702. [Google Scholar] [CrossRef] [Scilit]
- Wu, J.; Sun, Q.; Li, C.; Tang, W.; Zhang, H.; Tang, R.; Han, C. Analysis of vehicle-to-grid economy based on sustainable development grounded in game theory. Sustain. Energy Technol. Assess. 2025, 73, 104087. [Google Scholar] [CrossRef] [Scilit]
- Huang, G.; Mu, L.; Fang, C. Low-carbon collaborative scheduling method for EV charging stations based on robust optimization and cooperative game theory. Electr. Power Syst. Res. 2025, 249, 112046. [Google Scholar] [CrossRef] [Scilit]
- Dixit, A.C.; B, H.; K N, P. A Game Theory Approach to Optimizing Electric Vehicle Charging Infrastructure in Urban Areas. E3S Web Conf. 2025, 619, 01004. [Google Scholar] [CrossRef] [Scilit]
- Yan, A.; Chen, X. Optimizing EV Charging in Real-Time with a Distributed Game-Theoretic Framework. IEEE Access 2025, 13, 131128–131140. [Google Scholar] [CrossRef] [Scilit]
- Chen, B.; Guo, H.; Zhou, F.; Hu, Z.; Huang, J.S.; Wu, K.; Meroux, D.; Bao, S. Electric vehicle users’ charging patterns and selection considerations at public charging stations. Transp. Res. Part D Transp. Environ. 2025, 149, 105081. [Google Scholar] [CrossRef] [Scilit]
- Dong, X.; Si, Q.; Yu, X.; Mu, Y.; Ren, Y.; Dong, X. Charging Pricing Strategy of Charging Operators Considering Dual Business Mode Based on Noncooperative Game. IEEE Trans. Transp. Electrif. 2025, 11, 7334–7345. [Google Scholar] [CrossRef] [Scilit]
- Grzesiak, S.S.; Sousa, B. EV Charging Stations as a Competitive Advantage and New Business Strategy. In Organisational Behaviour and Design; Springer: Cham, Switzerland, 2025; pp. 213–225. [Google Scholar] [CrossRef] [Scilit]
- Wang, Y.; Fan, X.; Jiang, W.; Bi, X.; Ameer, H.; Chen, X. Perspectives on electric vehicle charging guidance based on virtual power plant. eTransportation 2026, 28, 100580. [Google Scholar] [CrossRef] [Scilit]
- Ahmed, S.; Ahmed Ansari, J.; Memon, M.; Shaikh, M.F.; Ali, Q.; Shaikh, A.M.; Ahmed, A.; Minelli, F. Distributed energy resources in the electricity supply market: Participation pathways, applications, challenges, and key recommendations—A European perspective. Front. Energy Res. 2026, 14, 1832115. [Google Scholar] [CrossRef] [Scilit]
- D’Agostino, D.; Minelli, F.; Minichiello, F. HVAC System Energy Retrofit for a University Lecture Room Considering Private and Public Interests. Energies 2025, 18, 1526. [Google Scholar] [CrossRef] [Scilit]
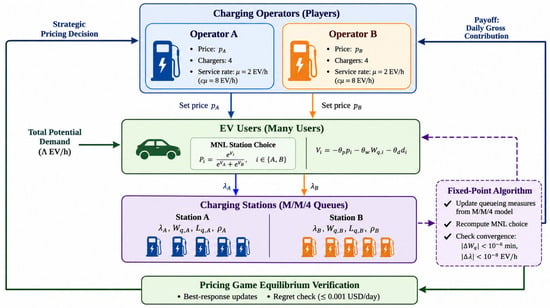
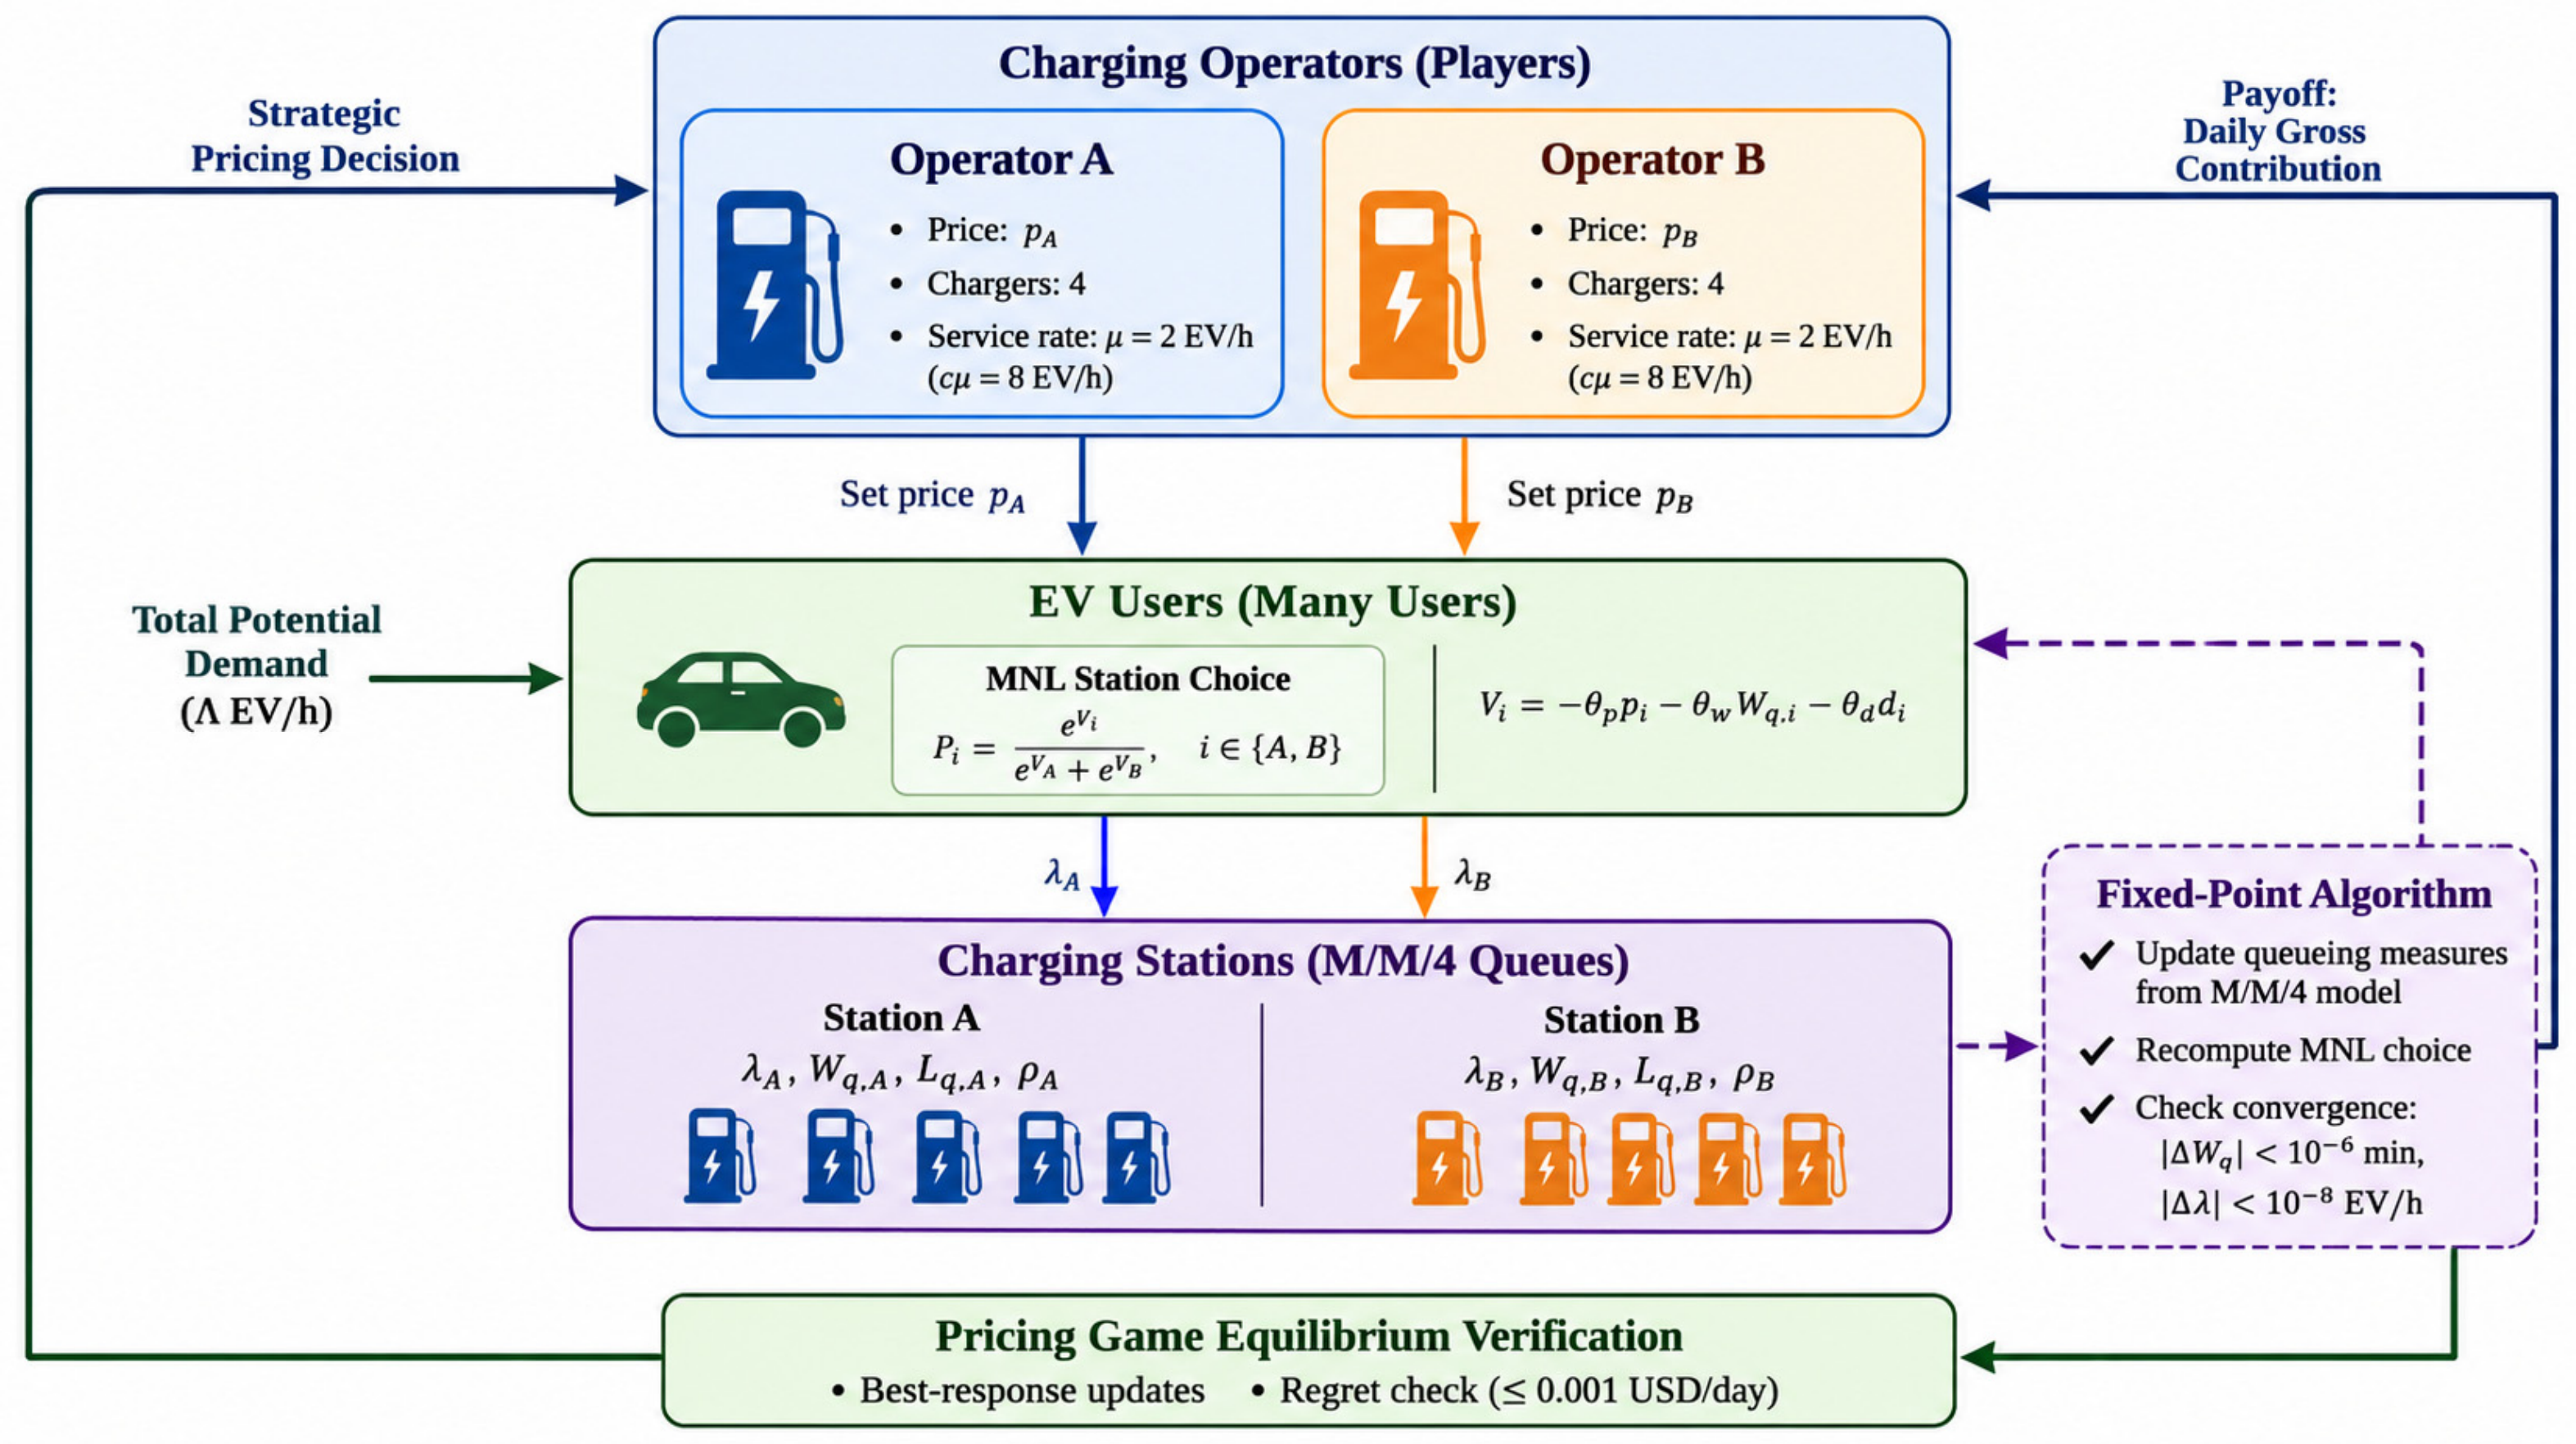
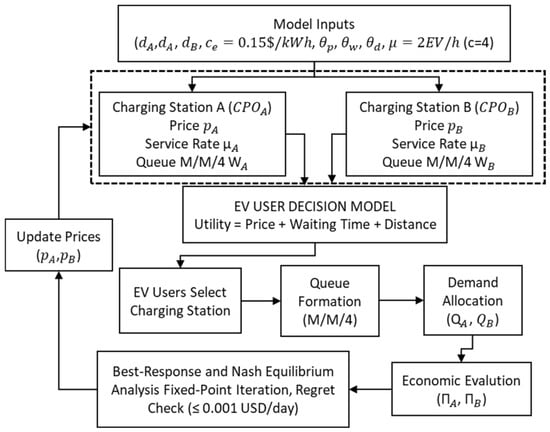
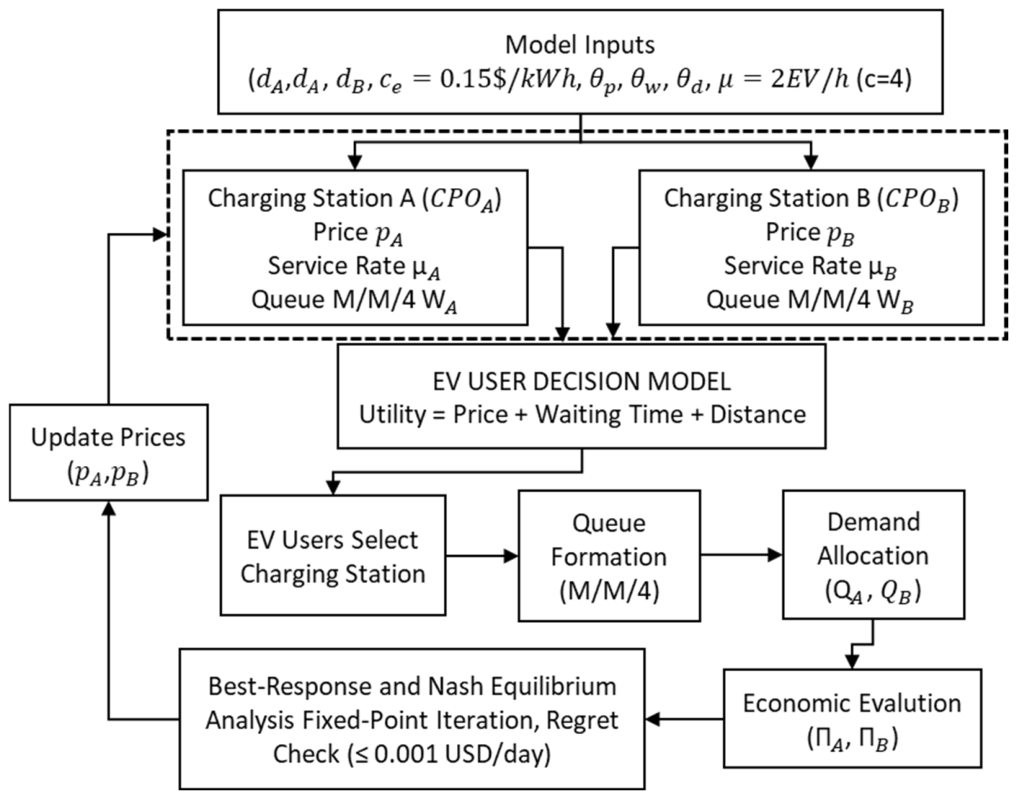
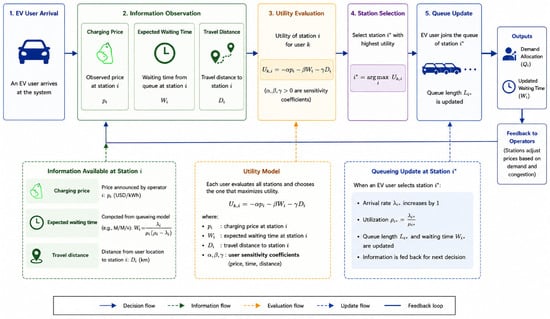
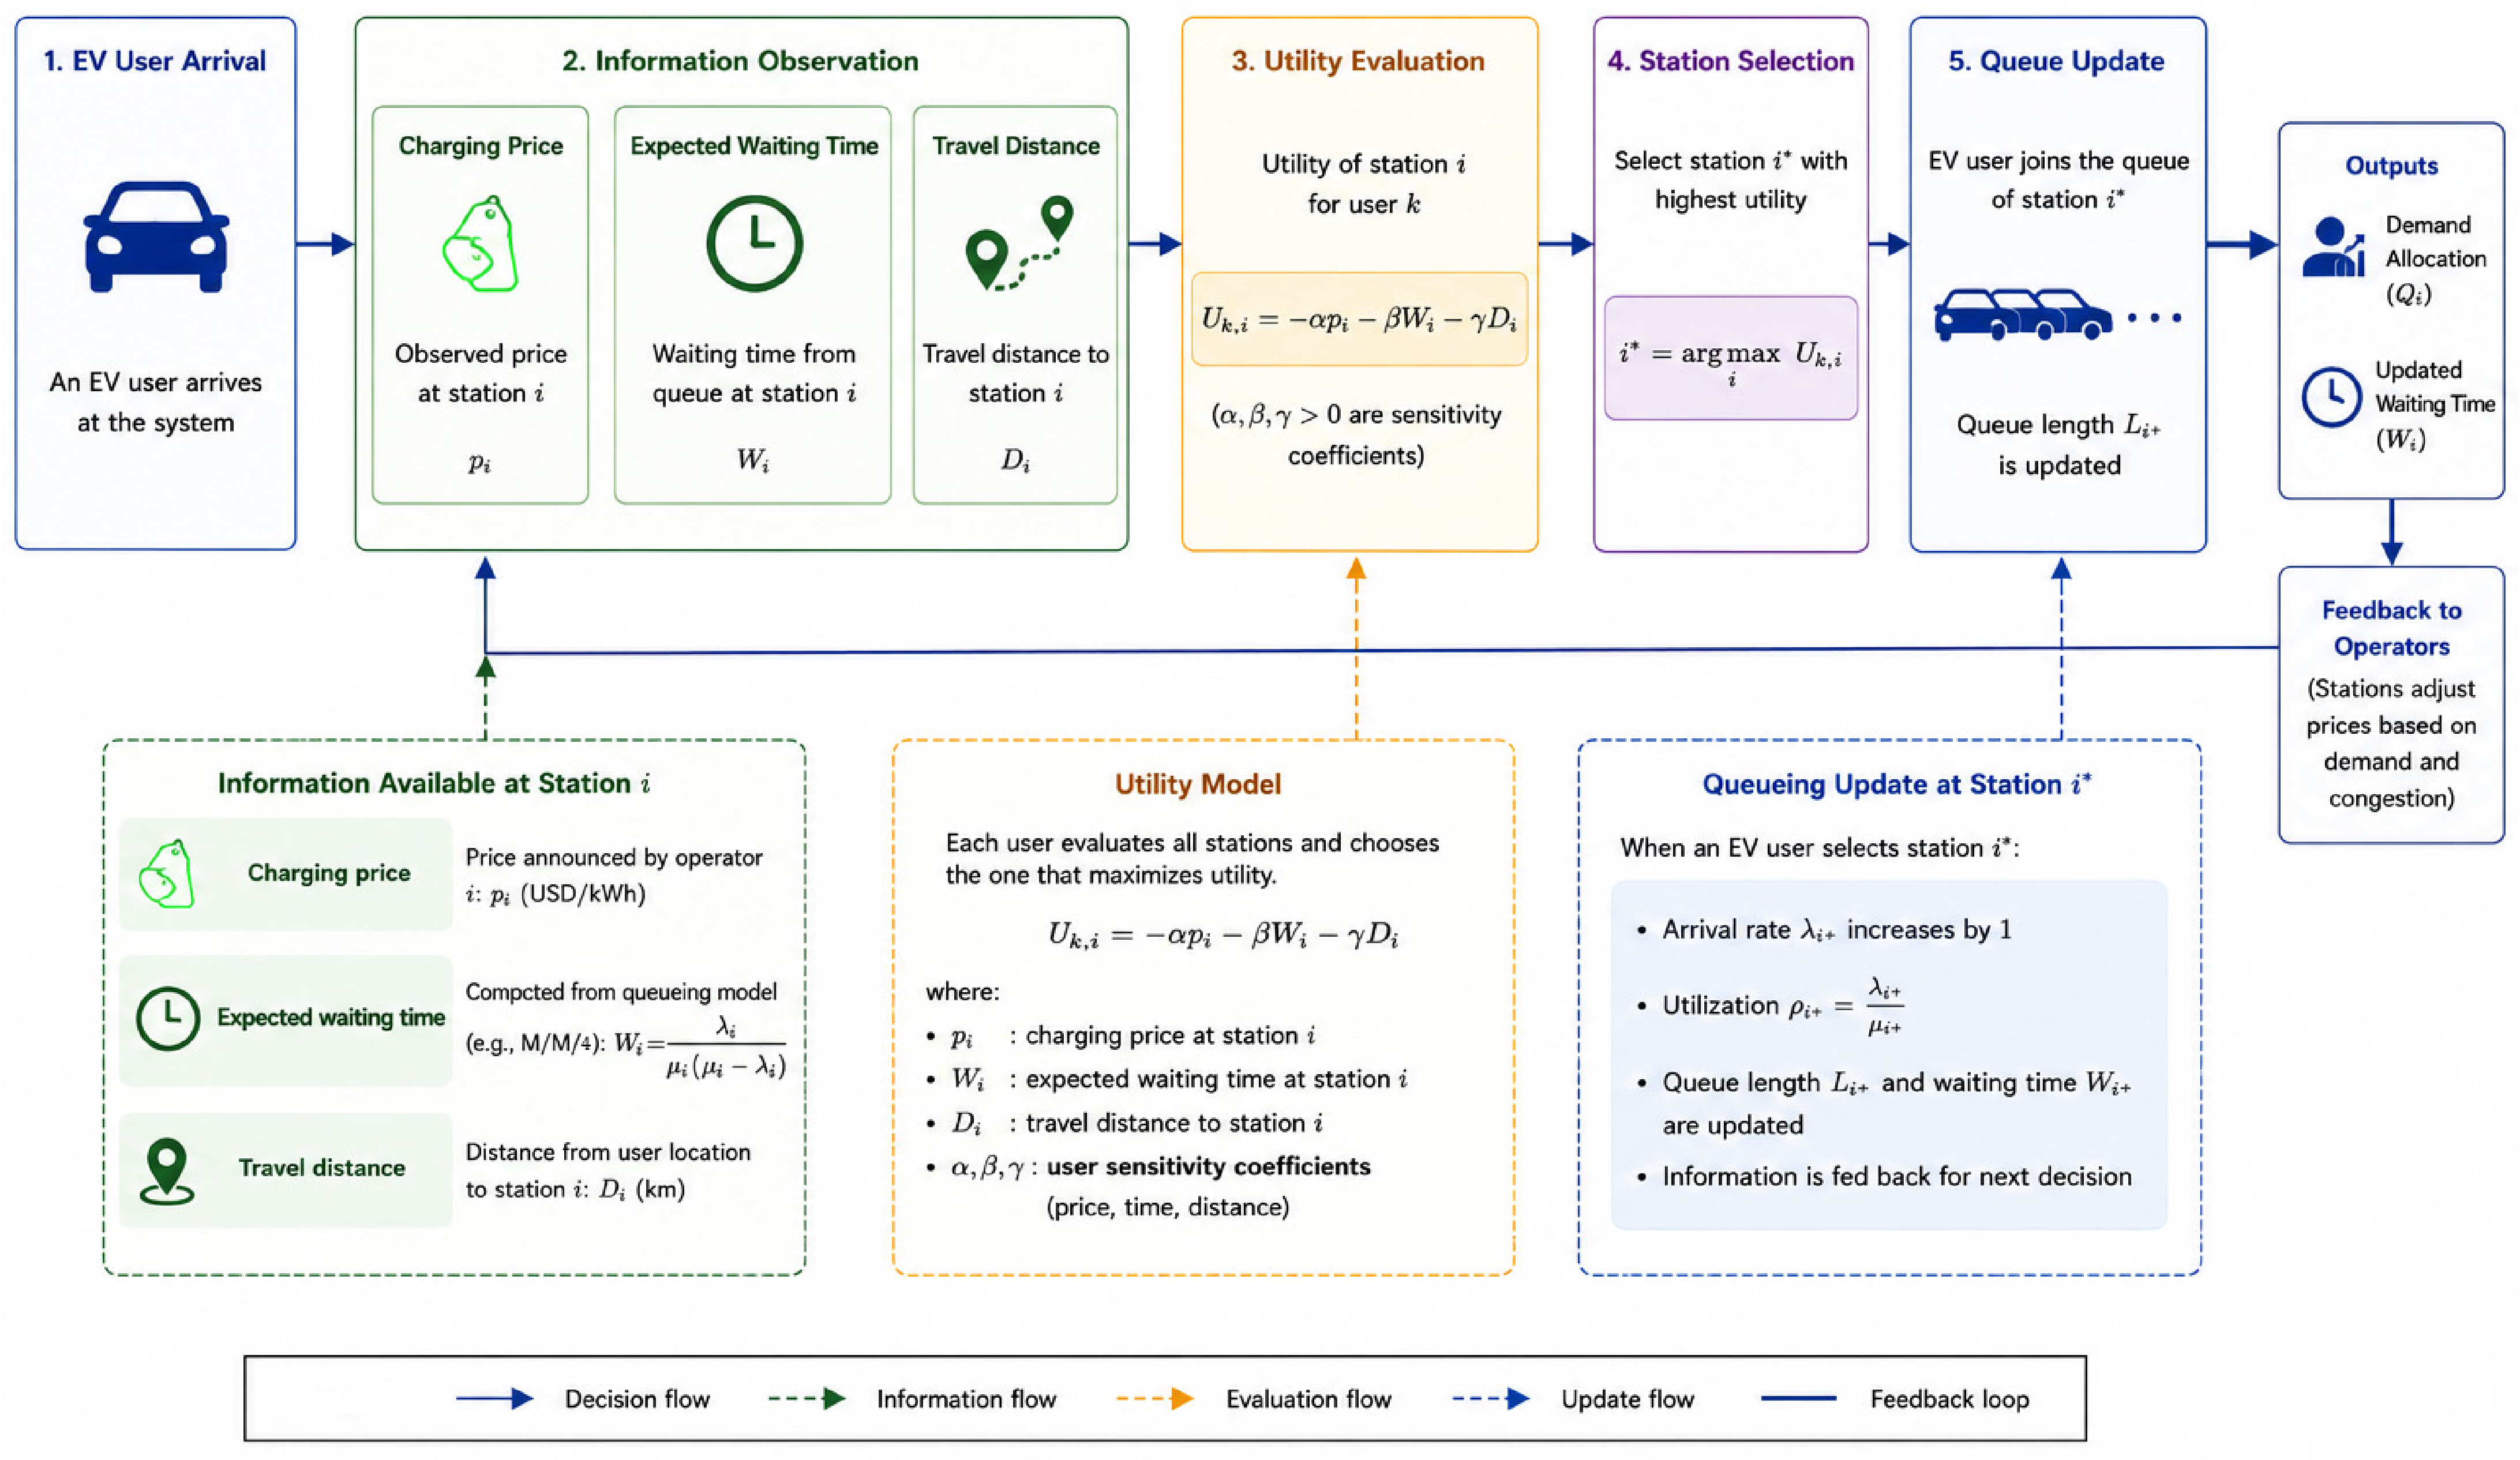
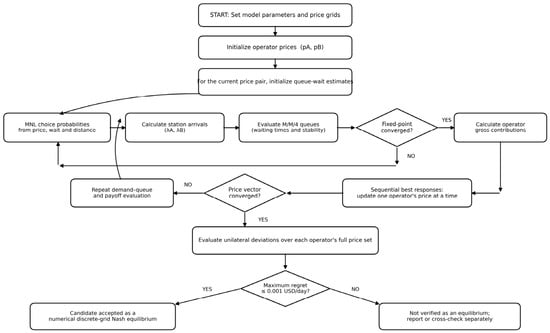
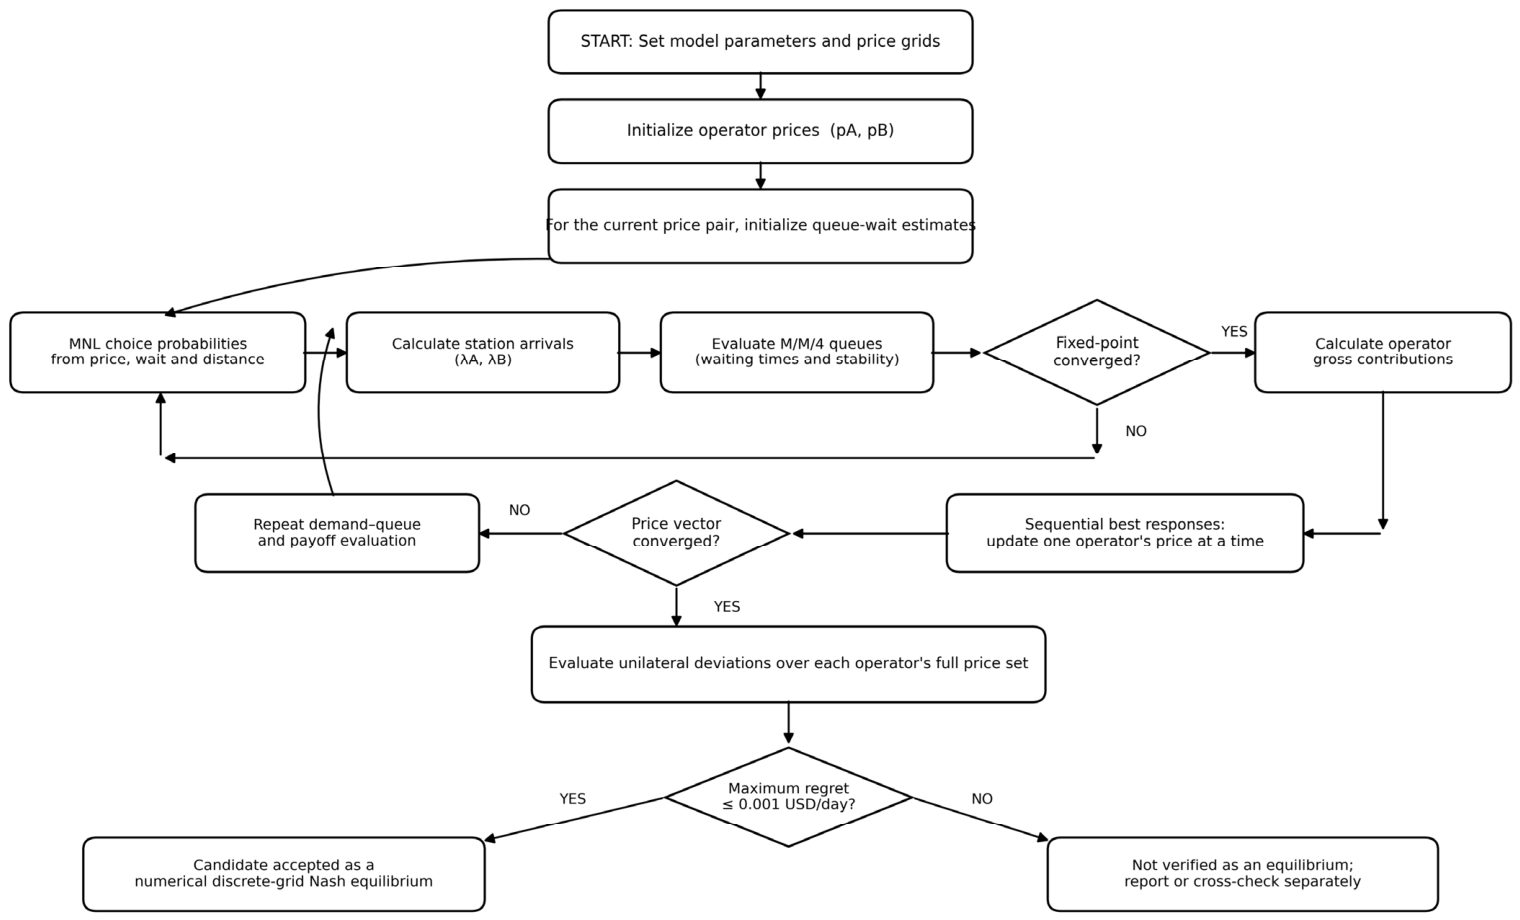
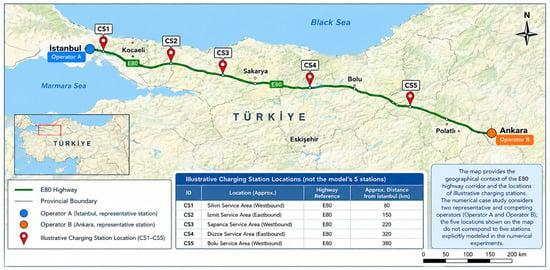
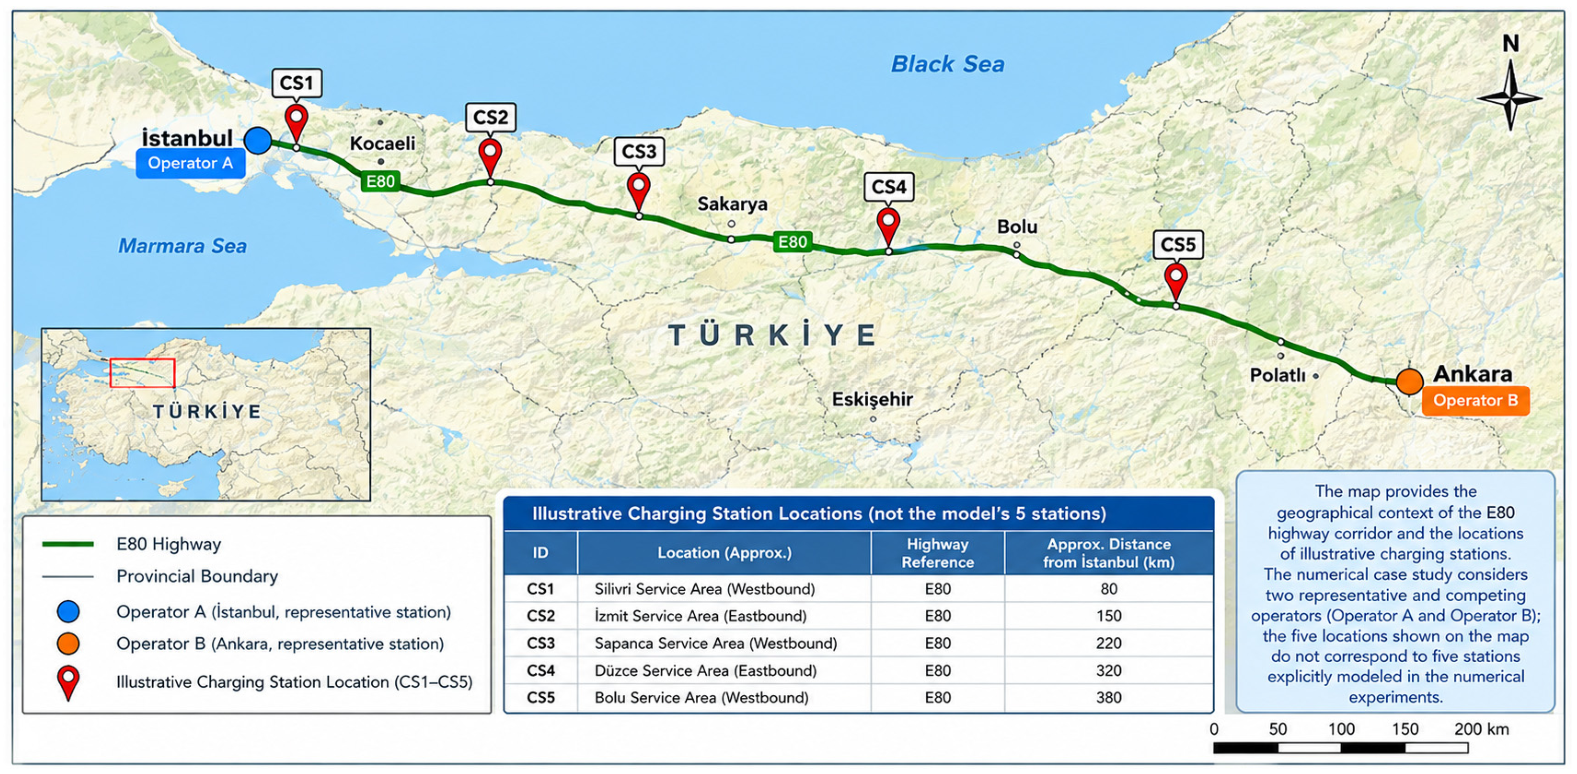


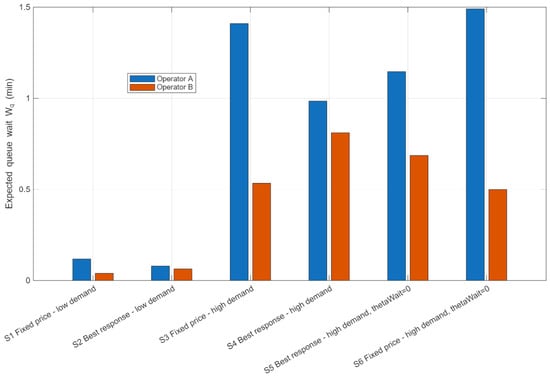
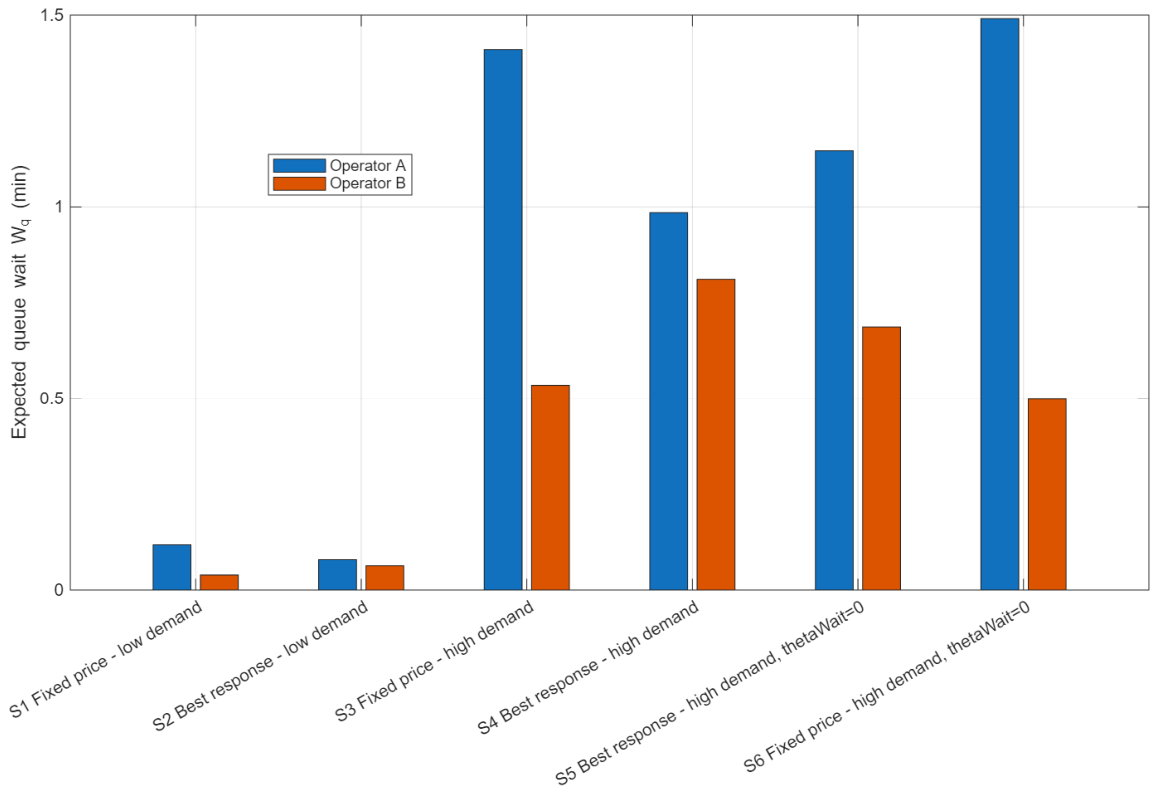
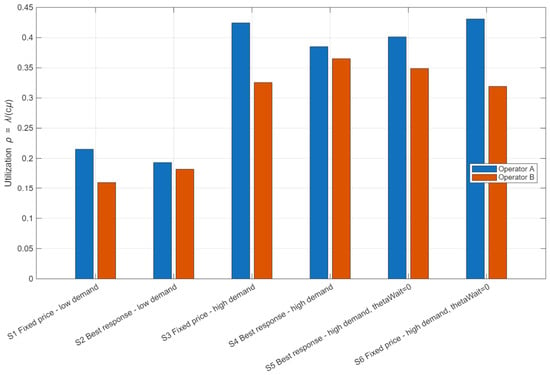
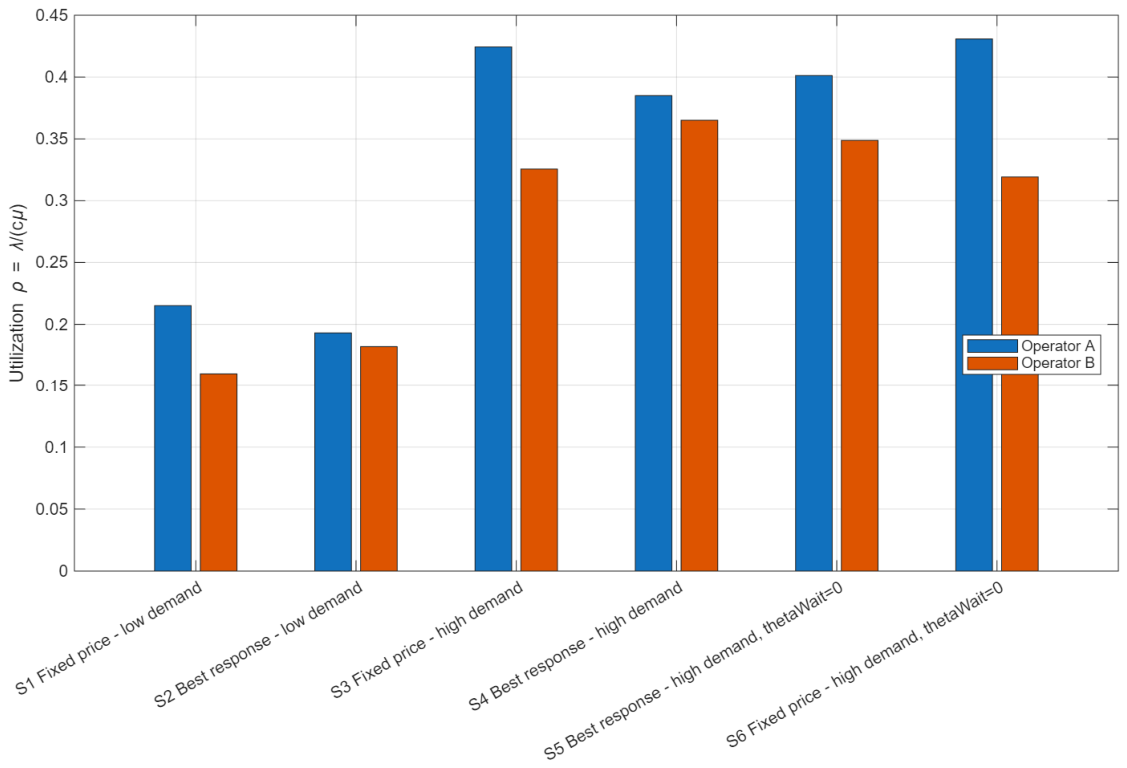
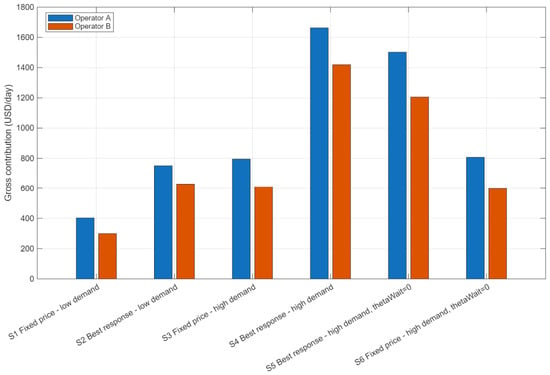
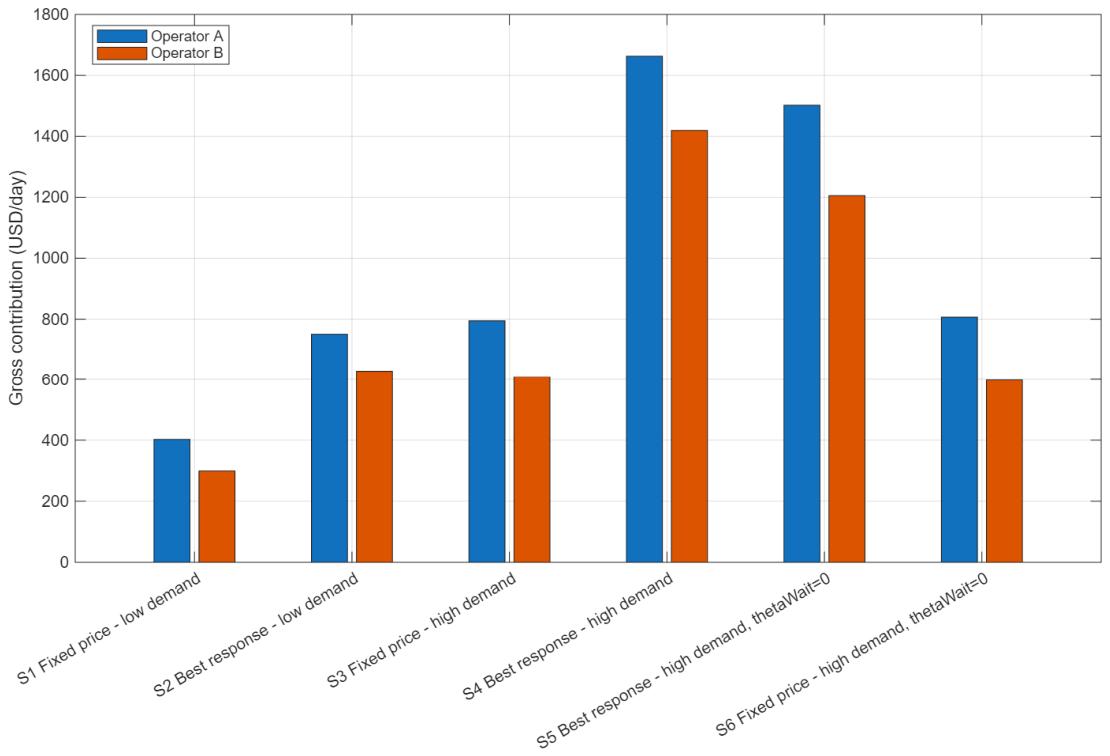
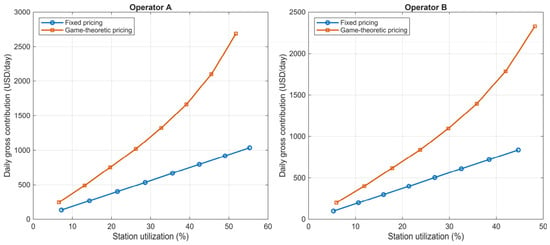
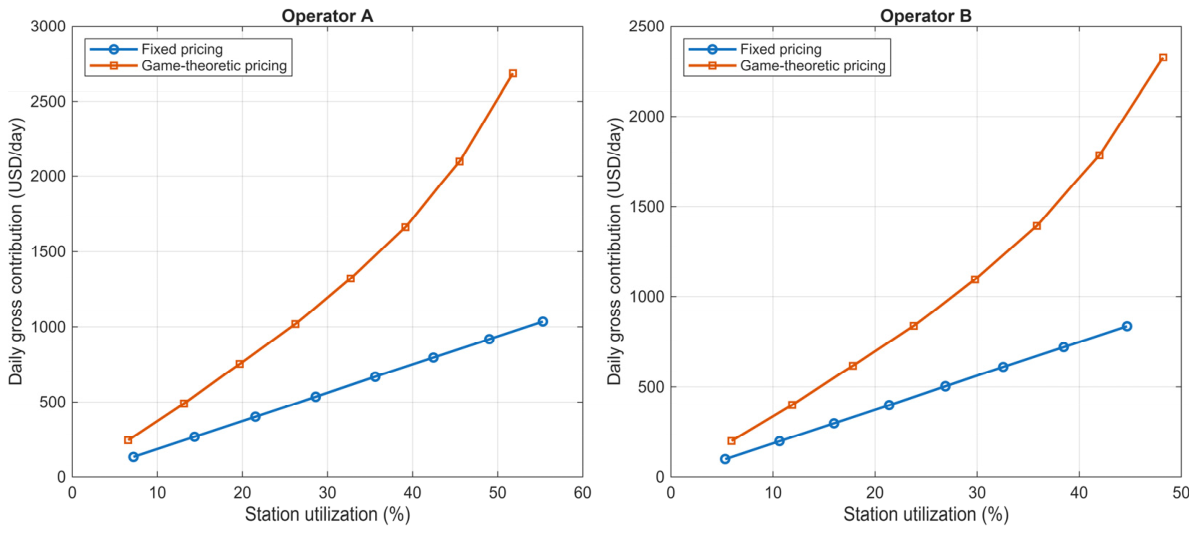
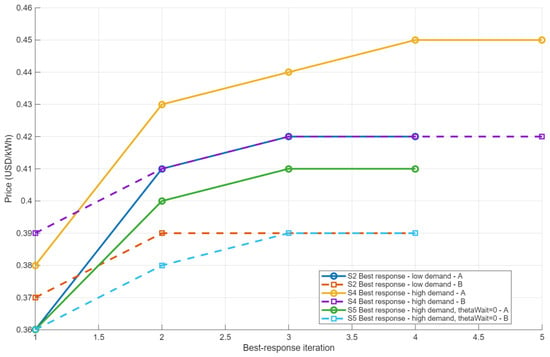
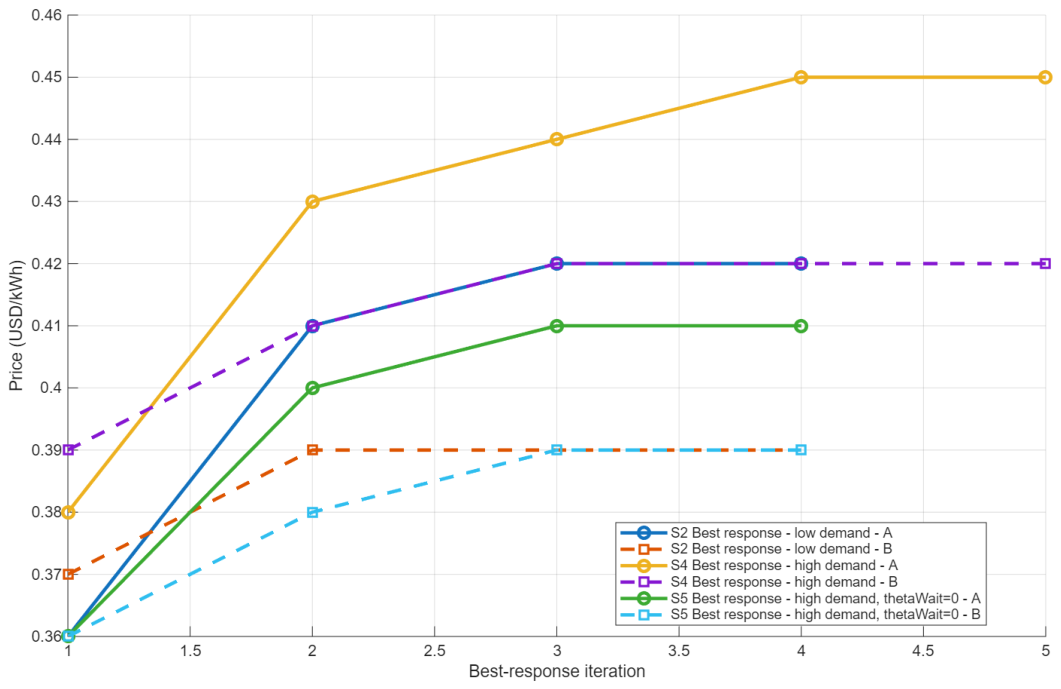

Disclaimer/Publisher’s Note: The statements, opinions and data contained in all publications are solely those of the individual author(s) and contributor(s) and not of MDPI and/or the editor(s). MDPI and/or the editor(s) disclaim responsibility for any injury to people or property resulting from any ideas, methods, instructions or products referred to in the content. |
© 2026 by the authors. Licensee MDPI, Basel, Switzerland. This article is an open access article distributed under the terms and conditions of the Creative Commons Attribution (CC BY) license.