


Abstract
China expanded population access to clean fuels and technologies for cooking from approximately 40.3% in 2000 to 88.7% in 2023. Nevertheless, the national-level health returns from this transition for population mortality remain unestimated. This study examines the long-run relationship between energy poverty, proxied by access to clean fuels and technologies, and three health outcomes in China: infant mortality, under-five mortality, and life expectancy. The study uses data from 2000 to 2024 and employs the Fully Modified Ordinary Least Squares (FMOLS), Canonical Cointegrating Regression (CCR), and Dynamic Ordinary Least Squares (DOLS) for the analysis. The results are considered robust only if consistent across all three estimators. A 1% increase in clean fuels and technologies access is associated with long-run declines of about 2.10% in infant mortality and 1.93% in under-five mortality, significant at the 1% level across all specifications. In addition, clean fuels and technologies exhibits a positive impact on life expectancy at 1% significance. Likewise, primary education negatively and significantly affects infant and under-five mortality; however, it does not significantly affect life expectancy. Fertility rate shows a positive and significant impact on infant and under-five mortality. To reduce early-life mortality, the findings support treating clean fuel access for rural households that rely on solid fuels as a distinct health policy objective, although its returns relative to conventional healthcare spending require cost-effectiveness evidence beyond the scope of this study.
1. Introduction
Energy poverty is now firmly on the agenda of the major international institutions. The United Nations and the International Energy Agency both treat universal access to affordable, reliable, and clean energy as a core development priority [1,2], and Sustainable Development Goal 7 commits member states to close the access gap by 2030 [3,4]. Energy poverty has been defined as the condition in which households are unable to secure materially and socially necessitated energy services [5]; the concept is conventionally traced to the capabilities approach to welfare, and in developing countries it manifests primarily as a lack of access to basic clean energy for cooking, heating, and lighting, often forcing reliance on firewood, crop residue, and coal [6,7]. Its consequences are wide-ranging. Energy poverty degrades living standards and undermines mental and physical health [8,9,10], and it interacts with inequality, because the burden of deficient access falls hardest on lower-income households [11,12,13]. Among these consequences, the most severe is also the least studied in the Chinese context: premature death. This paper asks a precise question: what is the mortality burden of energy poverty in China?
The premise that household energy deprivation kills is established in the burden-of-disease literature, which places household air pollution among the leading global causes of premature death [14]. Current estimates attribute approximately 3.2 million deaths per year to household air pollution, including 237,000 children under five, with roughly 2.3 billion people still cooking with polluting fuels [15], alongside 666 million people without electricity in 2023 [1,3,15]. What is missing is a credible estimate of this burden’s magnitude in China. Following this literature, mortality burden in this study refers to the change in mortality associated with energy poverty, expressed in health units rather than monetary terms [16]. Such burden estimates supply the health component of cost–benefit and cost-effectiveness assessments of household energy interventions, in which avoided illness and deaths are weighed against program costs [17,18,19].
Three mechanisms connect energy poverty to mortality, and they frame the interpretation of the results rather than enter the empirical model as tested pathways. The first is household air pollution: combustion of biomass, coal, and kerosene in poorly ventilated spaces exposes household members, especially women and young children, to fine particulate matter and carbon monoxide, with documented consequences for childhood pneumonia, stroke, chronic obstructive pulmonary disease, and birth outcomes [15,20]. The second is thermal stress: inadequate heating and cooling capacity raises vulnerability to temperature-related mortality. The third is indirect, operating through household budgets and the health system: energy-constrained households may forgo care, while energy access enables refrigeration of medicines, safe lighting, and information. Of the three, household air pollution is the channel most closely aligned with the cooking-based access indicator used in this study. The empirical analysis estimates the long-run association between access and mortality and does not test any of the three mechanisms directly, so thermal stress and the budgetary channel serve an interpretative function only. Section 2 reviews the evidence behind each channel.
The Chinese setting makes these mechanisms urgent rather than academic. China has achieved near-universal electrification [21], yet energy poverty persists and exhibits marked spatial disparities, with higher levels concentrated in western and less-developed regions, while rural households remain substantially more energy-poor than their urban counterparts [22]. When there is a clearer understanding of whether, and to what extent, residual deficits in access to clean fuels and technologies continue to extract a demographic toll in China, it will therefore be both a scientific question and a policy imperative.
Research on energy poverty and health has developed unevenly across regions. Globally, the burden-of-disease literature attributes a large share of premature deaths to household air pollution from solid fuels [14,16]. Macro-econometric studies of energy access and mortality are concentrated in sub-Saharan Africa, where Owili [23] and Byaro [24] associate clean cooking fuels with lower child mortality. Banerjee [9] extend the evidence to a broader set of developing countries but examine health and education outcomes rather than mortality. In China, research has focused on specific policies or on household-level health. Chen [25] and Ebenstein [26] use the Huai River heating boundary to show that sustained exposure to coal-based heating reduced life expectancy, while Lee [27] and Wen [28] evaluate clean heating programs in Beijing and rural China. Qin [29] and Xu [30] document the effects of energy poverty on the physical and mental health of Chinese households. None of these studies estimates the national long-run relationship between clean cooking access and mortality in China.
Notably, the recent empirical literature on energy access and mortality, reviewed in Section 2, is geographically narrow and rests largely on cross-sectional surveys or short panels; it has not been extended to China. Three problems follow, and they define the gaps this study fills. First, few studies have estimated the relationship for China, the world’s most populous country and its largest energy consumer. Second, existing studies estimate one outcome at a time, so nothing is known about whether the energy–mortality relationship is symmetric across infant mortality, under-five mortality, and life expectancy. Third, because access and mortality are non-stationary, jointly trending processes, evidence from levels regressions on short panels risks spurious inference, and the cointegration methods suited to this problem have not been applied to Chinese long-run data.
This study addresses these gaps directly. Using Chinese annual data spanning several decades, and estimating with three complementary cointegration estimators, Fully Modified Ordinary Least Squares (FMOLS), Canonical Cointegration Regression (CCR), and Dynamic Ordinary Least Squares (DOLS), we seek to answer four questions. (1) Does access to clean fuels and technologies have a long-run cointegrating relationship with infant mortality in China? (2) Is the same relationship present for under-five mortality? (3) Does access to clean fuels translate into gains in life expectancy, the positive counterpart of the mortality margin? (4) Are the estimates robust across three estimators that correct for non-stationarity and endogeneity in different ways?
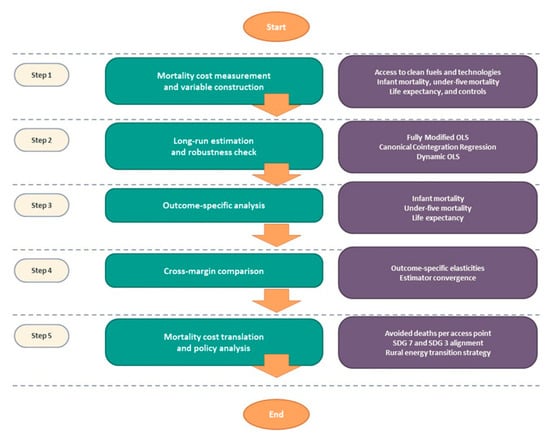
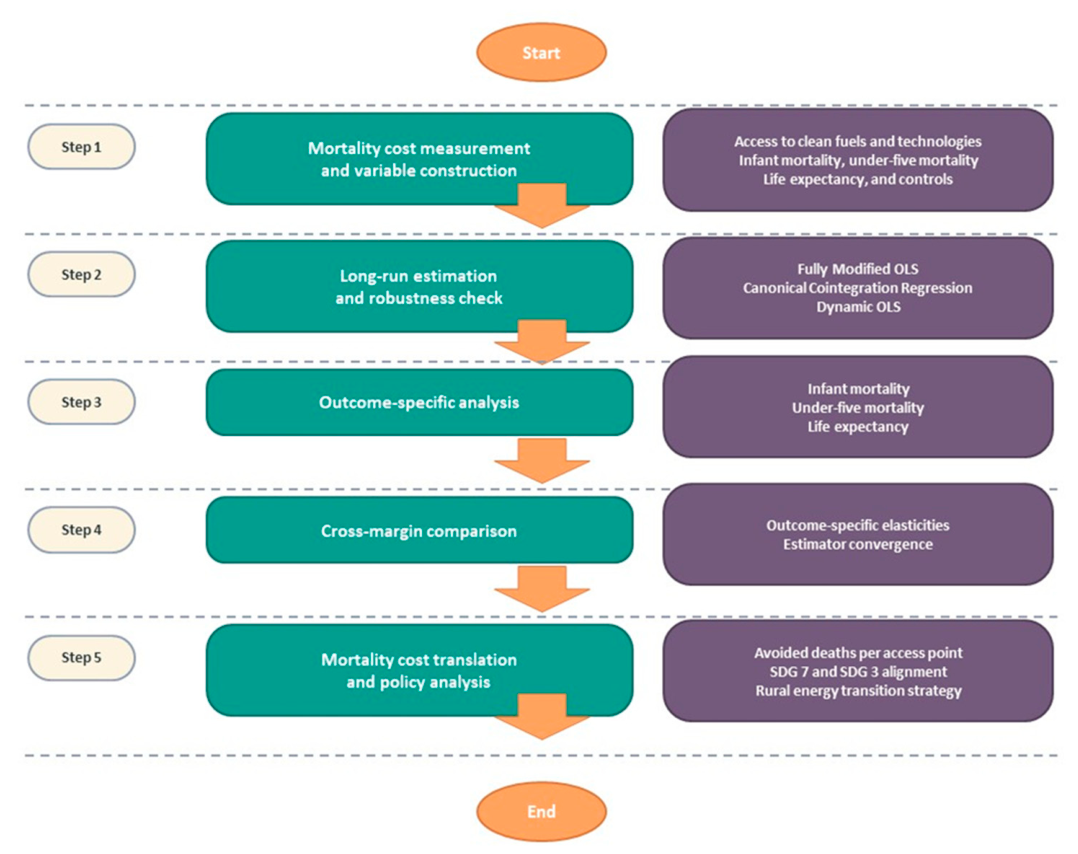
Figure 1 illustrates the research framework of this paper. We find that access to clean fuels and technologies is associated with significantly lower infant and under-five mortality in the long run, and that this negative relationship is consistent across all three cointegration estimators. The estimated elasticities are outcome-specific, declining from infant mortality through under-five mortality to life expectancy. Finally, the estimated elasticities can be translated into implied changes in mortality that can inform future cost-effectiveness assessments.
Figure 1.
Study framework.
The contributions of the paper are specific, and they correspond to what the analysis establishes rather than to general claims of relevance. First, the paper provides the first long-run cointegration estimates of the energy access–mortality relationship for China, a country for which the global evidence base on household energy and death is effectively silent, even though China accounted for a large share of the global population cooking with solid fuels over much of the sample period (Stoner [31]). Second, the paper demonstrates that the relationship is outcome-specific rather than uniform: access to clean fuels exhibits a robust negative long-run association with both infant and under-five mortality, while its association with life expectancy, although positive, is quantitatively smaller and carried almost entirely by the access margin rather than by the covariates, a pattern with direct implications for how the mortality burden of energy poverty should be aggregated across age groups. Third, the paper shows that the estimates survive triangulation across FMOLS, CCR, and DOLS, whose corrections for serial correlation, endogeneity, and short-run dynamics operate through different channels; the convergence of the three estimators constitutes evidence that the long-run elasticities are not artifacts of a single specification. Fourth, the paper expresses the relationship as implied proportional changes in mortality, which situates energy policy within the health accounting used by the Global Burden of Disease framework [16] and which future cost-effectiveness studies can combine with program cost data.
2. Literature Review
2.1. Literature on Energy Poverty: Measurement and Socio-Economic Impacts
The academic treatment of energy poverty began with measurement, because the concept resists a single-threshold definition. The foundational contribution is Nussbaumer [32], who drew on the Alkire-Foster method of multidimensional poverty analysis [33] to construct the Multidimensional Energy Poverty Index, in which a household is energy-poor when it is deprived in several of six energy-related capabilities at once [32]. Hills [34] proposed the low-income high-costs indicator, which identifies fuel poverty by the intersection of high energy costs and low residual income, and Thomson and Snell [35] compared the properties of these competing approaches in the European setting. This measurement literature established two durable conclusions. First, energy poverty is not reducible to income poverty, since a household can be income-poor but energy-sufficient, or the reverse [6]. Second, measurement choices shape policy targeting, which is why Al Kez [5] argues that indicator systems must differ between developing and developed countries, and why Jones and Reyes [7] identify indicator design as one of the persistent themes of the field.
The Chinese measurement literature followed this multidimensional logic with local adaptations. Zhang [36] examined the determinants of energy poverty in China, emphasizing the combined role of income, fuel availability, and infrastructure. Wang [22] construct a multidimensional measure of energy poverty for China and document pronounced spatio-temporal disparities, with deprivation concentrated in the western and inland provinces. These studies supply the descriptive backdrop for the present paper, but they stop at measurement and mapping; neither quantifies the demographic consequences of the deprivation they measure.
Beyond measurement, a second strand documents the socio-economic costs of energy poverty. Thomson [8] showed across 32 European countries that energy-poor households report systematically worse health and lower life satisfaction. Banerjee [9] extended the evidence to the developing world, finding that energy poverty depresses health and education outcomes in developing-country households. The inequality dimension is equally established: the burden of deficient access falls disproportionately on lower-income households [37], and Song [13] confirms this pattern across 77 countries at different stages of economic development, where energy poverty and income inequality move together. Li [12] adds a household-level perspective showing that energy poverty and inequality jointly condition China’s progress toward the Sustainable Development Goals. For China specifically, Qin [30] documents the harm to farmers’ health in mountainous regions, and Xu [31] shows the erosion of mental and physical health capital among energy-poor rural residents. What this strand shares is an outcome set dominated by well-being, morbidity, and self-reported health; mortality appears only rarely and indirectly.
Therefore, this study investigates the impact of energy poverty, proxied by access to clean fuels and technologies for cooking, on mortality.
2.2. The Literature on Energy Access and Mortality
The claim that household energy deprivation kills rests on the mature burden-of-disease literature. Smith [38] first placed indoor smoke from solid fuels among the largest environmental risk factors globally, and Smith [14] consolidated the Global Burden of Disease evidence establishing household air pollution as a leading cause of lost healthy life years. The causal chain from exposure to death runs through fine particulate matter and carbon monoxide. Europe [20] set indoor guideline values for carbon monoxide, and its later guidelines on household fuel combustion set emission targets for household stoves [21].
Intervention studies complicate this chain in instructive ways. Hanna [39] found that one of the largest improved stove programs in history produced almost no measurable health improvement, demonstrating that the mortality returns to energy access depend on adoption, stacking, and behavior rather than on hardware alone. In the Chinese setting, Chen [26] and Ebenstein [27] exploited the Huai River heating policy boundary to show that sustained exposure to coal-based heating raised cardiopulmonary mortality, establishing thermal stress as a mortality channel independent of cooking fuel. Lee [28] provided quasi-experimental evidence that the coal-to-clean heating transition reduced acute myocardial infarction in Beijing, and Wen [29] documented multidimensional health gains from clean residential heating in rural China. These studies establish that energy transitions can move mortality, but they are localized in place, period, or population, and none speaks to the national long-run relationship.
The macro-econometric literature on energy access and mortality is younger and concentrated in sub-Saharan Africa. Byaro [24] used panel quantile regressions to show that electricity access and clean cooking fuels reduce infant, child, and maternal mortality across the distribution of African countries. Owili [24] drew on demographic and health survey data from 23 Sub-Saharan African countries to show that cooking fuel type is significantly associated with under-five mortality. Sen [40] applied machine-learning-augmented econometrics to energy poverty and newborn mortality. These studies share two limitations relevant here: they are geographically confined to Africa, and they estimate one outcome at a time, leaving open whether the relationship is symmetric across mortality margins. Early comparative cointegration work spanning Africa and Asia reaches the same substantive conclusion and confirms that long-run estimation is essential in this domain, but it too excludes China.
The emerging-economy evidence broadens this picture in three directions. Hayford [41] shows that clean cooking technologies, combined with information and communication technology, generate measurable environmental benefits in developing countries, indicating that the clean cooking transition interacts with other infrastructure in ways single-outcome studies miss. In the BRICS nations clean energy deployment can deliver joint progress across the social, economic, and environmental pillars of the Sustainable Development Goals, which supports the co-benefit framing that motivates treating energy access as a health-relevant intervention rather than an energy-sector objective alone [42]. Gyimah [43] provides country-level evidence from Ghana that renewable energy consumption moves together with economic growth, reinforcing the expectation that access expansion and development reinforce each other over the long horizon that this paper estimates.
A related but distinct tradition treats longevity itself as the outcome. In the health-production-function literature, life expectancy is modeled as the output of income, education, health system capacity, and nutrition, with the robust finding that national income improvements translate into survival gains, summarized in the result that the wealthier are healthier [44,45]. This tradition identifies the standard covariates of mortality analysis but has rarely incorporated household energy conditions into the production function. As a result, the longevity margin of the energy–mortality relationship remains thinly studied.
The econometric tools suited to this problem are well established, even if they have not been applied to Chinese energy–mortality data. Fully Modified Ordinary Least Squares, developed by Phillips and Hansen [46], corrects Ordinary Least Squares for both serial correlation and endogeneity in cointegrated systems through a semi-parametric correction. Canonical Cointegration Regression, proposed by Park [47], achieves stationarity of the regression error through a transformation of the cointegrating space, and Dynamic Ordinary Least Squares, introduced by Stock and Watson [48], augments the levels regression with leads and lags of the differenced regressors to absorb short-run dynamics. Because the three estimators correct for non-stationarity through different mechanisms, their convergence on a common long-run elasticity is itself informative evidence, a logic widely used in the energy-growth nexus literature. Their joint application to access, mortality, and longevity in China is what this paper adds.
2.3. Literature Gaps
The literature leaves four main gaps. First, the mortality evidence base has a China-shaped hole: the burden-of-disease literature aggregates China into global totals, the intervention literature examines specific cities or programs, and the macro-econometric literature covers Africa and Asia. Few studies estimate the long-run relationship between access to clean fuels and technologies and mortality for China as a whole. Second, outcomes are studied in isolation, so the symmetry of the relationship is unknown; whether one access elasticity describes infant mortality, under-five mortality, and life expectancy, or whether the relationship is outcome-specific, has rarely been tested within a single framework. Third, the estimation technique is underdeveloped for the problem: most evidence rests on cross-sectional surveys or short panels, yet access and mortality are non-stationary processes whose relationship can only be credibly recovered within a cointegration framework. Fourth, the framing is incomplete: the literature expresses results as associations or program effects, and few studies translate elasticities into the implied mortality burden of energy poverty for China.
The specification is completed by covariates drawn from the health-production tradition: primary education and health expenditure proxy human capital and health system capacity [45,49], fertility captures demographic structure [50], and economic growth absorbs the wealthier-is-healthier channel [44]. These controls allow the estimated access elasticities to be interpreted as the association of energy poverty with mortality net of general development.
This paper addresses all four gaps by estimating FMOLS, CCR, and DOLS cointegrating relationships between access to clean fuels and technologies and each of the three outcomes in Chinese long-run data, and by expressing the results as implied changes in mortality.
3. Methodology
3.1. Model
To investigate the impact of energy poverty on mortality in China, this study employs the FMOLS, CCR, and DOLS estimators to investigate the long-run relationships between the variables. Several studies have used these estimators for long-run analyses [51,52,53,54,55]. The estimators address issues of small sample bias and serial correlation [56]. Moreover, these econometric techniques handle the problem of endogeneity [57].
The analyses of the study are grouped into three; first, the study investigates the long-run impact of energy poverty on infant mortality and it has been illustrated in Equation (1). Second, the study investigates the impact of energy poverty on under-five mortality and it has been shown in Equation (2). Third, the study examines the impact of energy poverty on life expectancy and it has been presented in Equation (3).
lninit = α0 + α1lnacit + α2lnprit + α3lnfrit + α4lnheit + α5lnecit + εit
lnufit = α0 + α1lnacit + α2lnprit + α3lnfrit + α4lnheit + α5lnecit + εit
lnleit = α0 + α1lnacit + α2lnprit + α3lnfrit + α4lnheit + α5lnecit + εit
In Equations (1)–(3), lnac denotes access to clean fuels and technologies, lnuf denotes under-five mortality, lnin denotes infant mortality, lnle denotes life expectancy, lnpr denotes primary education, lnfr denotes fertility, lnhe denotes health expenditure, lnec denotes economic growth, α0 − α5 denotes coefficients, t denotes time, i denotes country, and ε denotes error term.
3.2. Data
This study uses data from the World Bank’s World Development Indicators from 2000 to 2024 which covers 25 annual observations. The period for the data is based on data availability. A small sample size might present econometric challenges, so we analyzed and interpreted the findings cautiously. The data covers eight variables, three dependent variables, one independent variable, and four control variables. The dependent variables are infant mortality, under-five mortality, and life expectancy. The independent variable is access to clean fuels and technologies for cooking, which is a proxy for energy poverty. The control variables are primary education, fertility rate, health expenditure, and economic growth. Access to clean fuels and technologies is a composite indicator rather than a measure of a single fuel. Under the World Health Organization definition, electricity, natural gas, liquefied petroleum gas, biogas, solar and alcohol fuels all count as clean [15], so the access series moved with several structural changes in China’s energy system. The use of mortality and life expectancy as the indicators of health is based on previous studies such as [58,59]. The three health indicators mainly focus on reducing mortality and prolonging human life. The definition and measurement of each variable are presented in Table 1. GPD per capita growth proxy for economic growth was transformed using the natural logarithm.
Table 1.
Variable definition.
Table 2 shows the outcome of the descriptive statistics. The results show that primary education has the highest mean and maximum values of 4.6193 and 4.7513, respectively, with a minimum value of 4.5679. Access to clean fuels and technologies has a mean value of 4.1133, maximum value of 4.4853, and minimum value of 3.6964. Infant mortality has a mean value of 2.3750, maximum value of 3.3979, and minimum value of 1.4110. Under-five mortality has a mean value of 2.6309, maximum value of 3.6001, and minimum value of 1.7405. Life expectancy has a mean value of 4.3288, a maximum value of 4.3593, and minimum value of 4.2807.
Table 2.
Descriptive statistics.
The results in Table 3 are the outcome of the correlation analysis. The results reveal that access to clean fuels and technologies for cooking as a proxy for energy poverty has a strong and negative correlation with infant mortality (−0.9966). Similarly, access to clean fuels and technologies has a negative strong correlation with under-five mortality. However, it has a positive and strong correlation with life expectancy (0.9907). This implies that increasing access to clean fuels and technologies has a positive association with reducing mortality in China.
Table 3.
Correlation.
The Augmented Dickey–Fuller test is employed to test for the unit root among the variables. The outcome of the test is presented in Table 4. The Schwarz Info Criterion with maximum lag 5 and the deterministic components of intercept, trend and intercept, and none are used. The deterministic component is chosen based on the variable. The condition for the test is that the null hypothesis suggests there is a unit root and the alternative hypothesis suggests there is no unit root. For this condition to be met, at levels the variables should not be stationary and at first difference the variables should be stationary. The results show that at levels all the variables are not significant, meaning the variables are not stationary. Nevertheless, at first difference all the variables are stationary. The test reveals that the variables are non-stationary at levels but stationary at first differences; therefore, they are classified as I(1). The outcome supports proceeding with the Johansen cointegration test.
Table 4.
Unit root test outcome.
To investigate the long-term relationship among variables, the variables must be cointegrated. Therefore, the Johansen cointegration is employed to test for cointegration among the variables. The cointegration used allows for linear deterministic trend in data with an intercept (no trend) in CE and test VAR deterministic trend assumption. The Eviews used the Schwarz Information Criterion (SIC) to select the VAR lag, and then the selected VAR order by the SIC was translated into the corresponding Johansen lag interval. The test is in three groups, first, infant mortality and other variables, second, under-five mortality and other variables, and third, life expectancy and other variables. The results are presented in Table 5. The results for all the three groups indicate that the variables are cointegrated and their long-term effect can be investigated.
Table 5.
Cointegration test outcome.
4. Empirical Results
4.1. Access to Fuels and Technologies and Infant Mortality
We present the long-run estimates for infant mortality in Table 6. The three columns correspond to the three cointegration estimators: Fully Modified Ordinary Least Squares (FMOLS), Canonical Cointegration Regression (CCR), and Dynamic Ordinary Least Squares (DOLS). The choice of estimator procedure follows the logic of the non-stationarity problem established in Section 2: because access and mortality are jointly trending processes, conventional levels regression risks spurious inference, and each estimator corrects for this through a different mechanism, namely a semi-parametric correction for serial correlation and endogeneity in FMOLS, a transformation of the cointegrating space in CCR [47], and leads and lags of the differenced regressors in DOLS [48]. We therefore read the estimates as robust only where all three estimators agree, and we report the full triangulation rather than selecting a single preferred column.
Table 6.
Access to clean fuels and technologies and infant mortality.
Three findings stand out. First, access to clean fuels and technologies carries a large, precisely estimated negative long-run association with infant mortality. The FMOLS coefficient is −2.0983, the CCR coefficient is −2.0990, and the DOLS coefficient is −2.0211, all significant at the 1 percent level. In logarithmic terms, the FMOLS estimate implies that a one percent increase in access to clean fuels and technologies is associated with a long-run decline of approximately 2.10 percent in infant mortality. The above results are consistent in sign with the entire preceding literature, but the design differs from that literature in a way that explains the magnitude. Byaro [24] estimated the relationship from a panel of African countries using quantile regressions and found that electricity access and clean cooking fuels reduce infant mortality across the distribution of countries, with magnitudes on the order of two tenths of one percent. Sen [40] used machine-learning-augmented econometrics to study newborn mortality in energy-poor settings and reached the same directional conclusion. Both studies identify short-to medium-run effects from cross-sectional and panel variation; the present estimates capture the long-run cointegrating relationship within a single country that expanded access from roughly 39 to 88% of its population in two decades, and therefore embed the full adjustment of household behavior and fuel substitution that shorter windows cannot observe. The gap between the magnitudes is a decomposition, not a contradiction: the African estimates approximate the short-run return, and the estimates in this study approximate the total return to a sustained national transition.
Second, the covariates behave in line with the health-production logic reviewed in Section 2, and each one can be placed against its source literature. The primary education coefficient has a negative and significant association with infant mortality at the 5% level in FMOLS and CCR and at the 10% level in DOLS, which agrees with Caldwell [50], who identified education as a factor in mortality decline, a channel that the cross-country studies in this literature could not separate from the energy channel the present specification controls directly. The fertility coefficient shows a positive and significant association with infant mortality at the 1% level across all three estimators, consistent with the demographic transition tradition in which high-fertility settings face elevated child mortality risk, and this finding notably recurs in the household-level evidence on cooking fuel and under-five mortality Owili [24]. Health expenditure exhibits a negative association with 10% significance in FMOLS and CCR but loses significance in DOLS, which agrees with Filmer and Pritchett [45], who found health system capacity protective across countries; economic growth has a negative association with infant mortality at 5% significance in FMOLS alone.
4.2. Access to Fuels and Technologies and Under-Five Mortality
Table 7 repeats the estimation for under-five mortality and confirms the infant mortality result while revealing its outer boundary. The access to clean fuels and technologies coefficient remains negative and significant at the 1 percent level under all three estimators: −1.9278 (FMOLS), −1.9327 (CCR), and −1.8419 (DOLS). The association with infant mortality reduction of 2.10 percent is consistent with the greater vulnerability of infants to household air pollution, and it is consistent with Owili [24], whose household-level comparison of cooking fuels in 23 Sub-Saharan African countries links fuel type to under-five mortality risk. What the present estimates add to that micro evidence is the national long-run magnitude: Owili [24] compared fuel types within households at a point in time and could not observe the decades over which access expanded in China, whereas the cointegrating relationship here prices the full transition.
Table 7.
Access to clean fuels and technologies and under-five mortality.
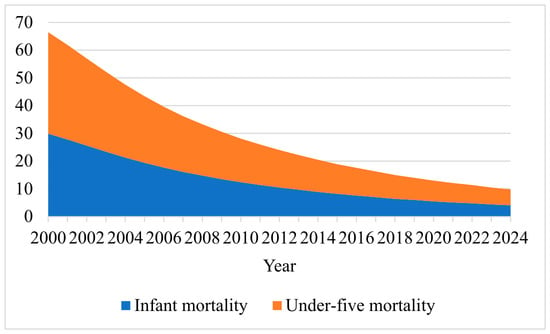
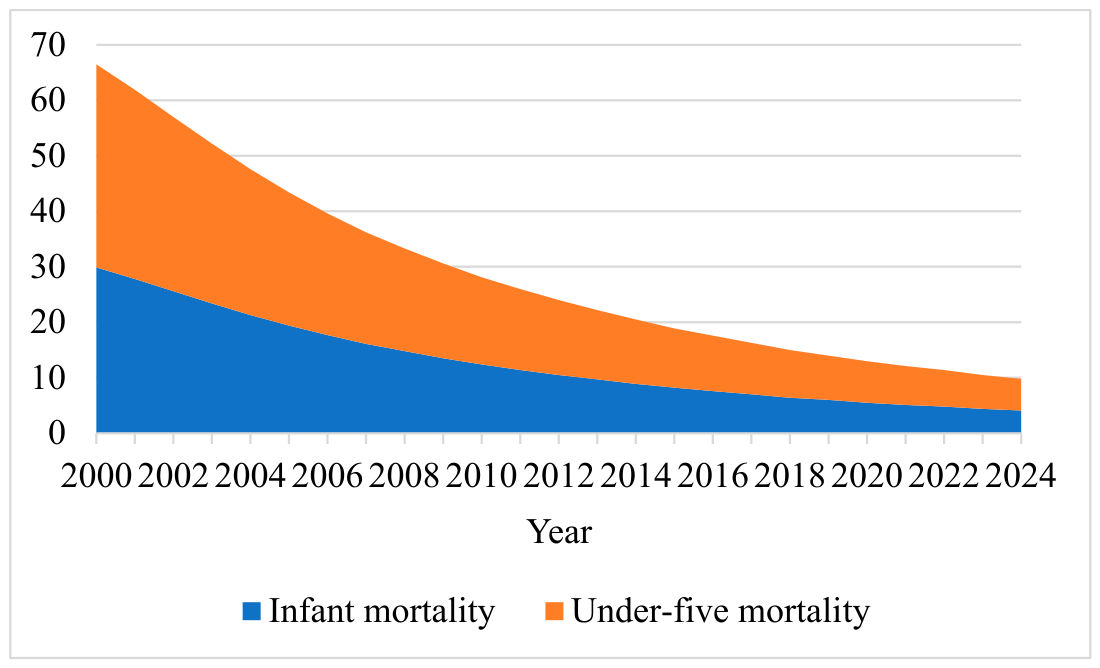
The covariates replicate the infant mortality equation. The primary education coefficient shows a negative and significant association in all three specifications, again in agreement with Filmer and Pritchett [45]. Fertility has a positive and significant association with under-five mortality at the 1% level in FMOLS and CCR and at the 5% level in DOLS, which fits the Caldwell [50] tradition and connects to the microdata studies: Banerjee [9] found that energy poverty depresses health and education outcomes in developing-country households, and the positive fertility coefficient here captures the demographic dimension of that pattern at the national level. Health expenditure exhibits a negative association with under-five mortality at 5% significance in FMOLS and CCR, and economic growth shows a negative association with under-five mortality at 5% significance in FMOLS alone. Figure 2 illustrates the trend of infant and under-five mortality in China.
Figure 2.
Infant and under-five mortality.
4.3. Access to Fuels and Technologies and Life Expectancy
Table 8 turns to the longevity margin, and the contrast with the mortality equations is sharp. The access to clean fuels and technologies coefficient exhibits a positive and significant association at the 1% level under all three estimators: 0.0914 (FMOLS), 0.0915 (CCR), and 0.0886 (DOLS). The point estimates imply that a one percent increase in access to clean fuels and technologies is associated with a long-run increase of about 0.09 percent in life expectancy. Coefficient convergence across estimators is again tight.
Table 8.
Access to clean fuels and technologies and life expectancy.
Two features distinguish this equation from the mortality equations, and both can be read against the literature. First, the elasticity is an order of magnitude smaller than the mortality elasticities. This is mechanically expected, because life expectancy aggregates survival across the entire age structure and dilutes the concentrated effect that access exerts on infant and child deaths. Second, nearly every covariate loses significance. Primary education, health expenditure, and economic growth are all statistically indistinguishable from zero, and fertility is significant only in FMOLS and CCR, at the 10% and 5% levels, respectively. This is where the present results diverge most visibly from the health-production canon: Pritchett and Summers [44] and Filmer and Pritchett [45] established income and health expenditure as the central determinants of longevity, but they worked in cross-country panels in which household energy conditions were unmeasured. Entering access explicitly into the production function, as this study does, leaves access as the sole surviving long-run determinant in the Chinese life expectancy equation. The contrast refines rather than overturns the canon: over the sample period, access co-trended with income and health spending closely enough to absorb much of their explanatory power.
The longevity margin is also where the Chinese intervention literature is silent in a way that matters. Chen [26] and Ebenstein [27] demonstrated mortality effects of heating policy through the Huai River boundary, and Lee [28] showed cardiovascular gains from Beijing’s coal-to-clean transition, but these designs are localized in place and population and stop at specific causes of death rather than national longevity. Wen [29] documented multidimensional health gains from clean residential heating in rural China, again program-specific. No study in this literature asks whether access to clean fuels and technologies is associated with life expectancy independently of income and health expenditure for China as a whole, which is the question Table 8 addresses.
4.4. Robustness Checks
To ensure our findings are robust and address a concern that may arise from common long-term trends, a first difference Ordinary Least Squares is conducted and the results are presented in Table 9. The estimation is an additional sensitivity check and the results exhibit coefficient directions and statistical significance consistent with the findings obtained for access to clean fuels and technologies, infant mortality, under-five mortality, and life expectancy from the FMOLS, CCR, and DOLS estimators. The consistency in the findings provides evidence that the observed associations are not solely attributable to shared trends in the level variables. However, this estimation captures short-run associations rather than long-run equilibrium relationships. Therefore, the findings are interpreted as supplementary evidence of robustness rather than definitive evidence.
Table 9.
Robustness check using alternative estimation method.
The findings in Table 10 are the outcome of the sensitivity analyses to provide additional evidence to support the main results, particularly on the relationship between access to clean fuels and technologies, infant mortality, under-five mortality, and life expectancy. The table comprises five different estimations where access to clean fuels and technologies remains constant and the results capture its relationship with the dependent variables. The results show a significant and negative impact of access to clean fuels and technologies on infant and under-five mortality across all the estimations and a positive and significant effect on life expectancy across all the estimations. The consistency of the results across all the estimations when a selected control variable is excluded suggests that the estimated relationships are not unduly dependent on the inclusion of these particular controls. The robustness checks strengthen confidence in the consistency of the findings; however, the sample of 25 annual observations and the absence of formal structural stability tests remain limitations. Accordingly, the long-run estimates should be interpreted within the context of these limitations.
Table 10.
Sensitivity analysis using alternative model specification.
5. Discussion
5.1. Synthesis of Findings Against the Research Questions
The results answer the four research questions posed in the Introduction, and the pattern across the three outcome tables is coherent enough to state as a single claim. Access to clean fuels and technologies has a long-run cointegrating relationship with infant mortality in China (question 1), and the same relationship holds for under-five mortality at a slightly attenuated magnitude (question 2); access to clean fuels and technologies is associated with gains in life expectancy that are positive but more than an order of magnitude smaller and carried almost entirely by the access margin (question 3), and the estimates converge across three estimators that correct for non-stationarity through different mechanisms, so the long-run elasticities are not artifacts of one specification (question 4). The four contributions promised at the outset are therefore delivered together rather than separately: the first China-specific long-run estimates, the demonstration that the relationship is outcome-specific, the estimator triangulation, and the translation of the relationship into implied mortality changes. The literature has treated access to clean fuels and technologies as one development milestone among many; the evidence here suggests it is better understood as a health input whose association with mortality is strongest in the first year of life.
The access series reflects several structural changes in China’s energy system. Access rose from 40.3 percent in 2000 to 88.7 percent in 2023. Over the same period, national coal consumption rose 3.1-fold, driven largely by power generation, while households’ share of national coal use fell from about 7 percent in 2000 to less than 2 percent by 2019 [60]. Natural gas consumption rose 15.3-fold between 2000 and 2022 [61], and the share of gas in rural household fuel energy rose from about 3 percent in 2012 to 11 percent in 2017 [62]. Wind and solar generation increased from 0.61 to 1836 terawatt-hours between 2000 and 2024. Electricity from all sources supplied about 20 percent of rural household energy by 2017 [62], and renewable electricity also reached rural households directly through the photovoltaic poverty alleviation program, which reached 4.15 million households by 2019 [63]. The estimated elasticities therefore reflect the joint long-run association of these fuel transitions with mortality, and part of the estimated return to access reflects the substitution of gas and electricity for household coal and biomass.
5.2. The Mortality Burden of Energy Poverty
The direction of the estimated relationships agrees with the existing evidence, while the design of this study explains where the outcome patterns differ. The negative association between clean cooking access and child mortality is consistent with evidence from sub-Saharan Africa, where Byaro [24] finds that clean cooking fuels reduce infant and child mortality and Owili [23] links cooking fuel type to under-five mortality. The present estimates differ from those studies in two respects. First, they capture a long-run cointegrating relationship within one country rather than cross-sectional or short-panel variation, and therefore embed the adjustment of household fuel use over two decades. Second, they estimate infant mortality, under-five mortality and life expectancy within one framework, which shows that the association weakens as the outcome moves from early-life survival to longevity. The weaker and less-stable coefficients on health expenditure and economic growth depart from the health-production literature, in which income and public health spending are central determinants of mortality [44,45]. This divergence is consistent with the close co-movement of access, income and health spending in China over the sample period, and does not imply that these factors are unimportant. The results also complement the Chinese quasi-experimental evidence, which links coal-based heating to lower life expectancy [25,26] and documents health gains from clean heating programs [28,29]. The present estimates extend this evidence from place-specific heating policies to the national cooking transition. The null health effect of improved stoves reported by Hanna [39] is consistent with the interpretation that the associations estimated in this study reflect sustained fuel switching rather than the distribution of cooking hardware.
Notably, the analysis in this study supports three levels of inference, each resting on progressively weaker evidence. At the first level, the estimates document a stable long-run statistical relationship: access to clean fuels and technologies is cointegrated with the mortality outcomes, and the FMOLS, CCR, and DOLS coefficients agree in sign, significance, and magnitude. At the second level, household air pollution emerges as the most plausible mechanism, given that the access indicator captures cooking fuels and that the association is strongest for infants, who face the greatest exposure to indoor smoke. The model does not test this mechanism directly, however. At the third level, identifying a causal effect of the kind needed to evaluate specific policies would require exogenous variation in access to clean fuels and technologies, which national time-series data cannot provide. Accordingly, the calculations below describe the mortality change implied by the long-run association rather than the effect of any intervention.
Because all variables are measured in natural logarithms, the access coefficients can be read directly as long-run elasticities. The ratio of the new to the initial level of an outcome therefore equals the ratio of new to initial access to clean fuels and technologies raised to the power of the estimated coefficient, with other regressors held constant. Over the full sample period, access to clean fuels and technologies rose from 40.3 percent in 2000 to 88.7 percent in 2023. These are ceteris paribus implications of the association rather than attributable effects, because access to clean fuels and technologies co-moved with income, health expenditure, and education throughout the period. Converting them into numbers of deaths would additionally require multiplying each rate change by the number of live births.
Throughout the paper, mortality burden denotes these implied proportional changes in mortality, not a monetary cost. Framing the relationship in this way leaves it ready to be paired with program cost data in future cost-effectiveness analyses, but the present study performs no such valuation and offers no conclusions about the economic efficiency of specific interventions or about regional variation in benefits.
6. Conclusions
This study examined the long-run relationship between energy poverty, proxied by access to clean fuels and technologies for cooking, and three health outcomes in China between 2000 and 2024. Using FMOLS, CCR and DOLS, it finds that access to clean fuels and technologies has a significant negative long-run association with infant and under-five mortality across all three estimators. A 1 percent increase in access to clean fuels and technologies corresponds to long-run declines of about 2.1 percent in infant mortality and 1.9 percent in under-five mortality. Access to clean fuels and technologies also has a significant positive association with life expectancy, but this association is considerably smaller. These associations remain significant after controlling for education, fertility, health expenditure and economic growth, while the health expenditure and growth coefficients are weaker and less stable across estimators. The results therefore indicate that access to clean fuels and technologies for cooking is closely associated with improvements in child survival in China and should be treated as a health-relevant objective of energy policy.
The findings are relevant beyond China because the clean cooking transition that China has largely completed remains incomplete in much of the developing world. About 2.3 billion people still cook with polluting fuels, and household air pollution causes an estimated 3.2 million deaths a year, including 237,000 children under five [15]. China is one of the few national cases in which clean fuels and technologies for cooking access expanded from a minority to a large majority of the population within about two decades. Its long-run elasticities therefore provide a benchmark for countries at earlier stages of the same transition, particularly in sub-Saharan Africa and South Asia, where the concentration of the association in early-life mortality suggests the largest potential health returns. These elasticities should not, however, be transferred mechanically, because China’s transition occurred alongside rapid income growth and large investment in gas and electricity infrastructure. Applying the same framework to other countries with long national time series would test whether the outcome-specific pattern identified here generalizes.
Three implications follow for China’s clean energy transition and rural revitalization strategy. First, the access to clean fuels and technologies margin remains significant across all three estimators after controlling for every covariate in the mortality equations, which supports prioritizing the completion of clean fuel access in the residual energy-poor regions. These estimates do not, however, establish that clean fuel access yields greater health gains than additional healthcare expenditure, because such a comparison requires program cost data beyond the scope of this study. The concentration of residual deprivation in the western and less-developed regions suggests that the final segment of access expansion can be geographically targeted. Second, the primary education result, negative and significant in both mortality equations, is consistent with a complement rather than a substitute: energy access and education appear to operate through different channels, which suggests that pairing clean fuel rollout with schooling and human capital investment in the same counties may be beneficial, although the present specification does not test their interaction. Third, the fragility of the health expenditure and growth coefficients is a warning against treating energy poverty as a by-product of general development that growth will resolve on its own. Over the sample period, growth did not independently close the mortality gap once access was controlled, which supports treating clean fuel access as a distinct policy objective under SDG 7 rather than as a dividend of SDG 8.
This study has several limitations. First, the estimates are long-run associations within one country and cannot eliminate omitted variable bias or identify the micro-level behavioral pathways through which access affects health. Second, the estimates are long-run elasticities and should not be extrapolated to short-horizon evaluation. Third, the access indicator bundles natural gas, liquefied petroleum gas and electricity, so the analysis cannot separate the mortality effect of each fuel. Fourth, the indicator covers cooking only and does not capture space heating or ambient pollution from coal use in power and industry. Fifth, the short national time series does not allow the effects of urbanization to be separated from those of access. Finally, the national aggregation conceals regional differences in energy poverty and mortality. Future research using provincial or household panel data could address these limitations and produce region-specific estimates.
Author Contributions
Conceptualization, Y.L., Z.W. and J.G.; Methodology, Y.L. and J.G.; Validation, Y.L., Z.W. and L.H.; Formal analysis, Y.L., Z.W. and J.G.; Investigation, Y.L. and Z.W.; Data curation, Y.L. and J.G.; Writing–original draft, Z.W., J.G. and L.H.; Writing–review & editing, Y.L., Z.W., J.G. and L.H.; Visualization, Z.W. and L.H.; Supervision, Y.L.; Funding acquisition, Y.L. All authors have read and agreed to the published version of the manuscript.
Funding
This research was funded by Construction of the Belt and Road International Student Recruitment Network.
Data Availability Statement
Data will be made available upon request.
Conflicts of Interest
The authors declare no conflict of interest.
References
- Dechamps, P. The IEA World Energy Outlook 2022—A brief analysis and implications. Eur. Energy Clim. J. 2023, 11, 100–103. [Google Scholar] [CrossRef] [Scilit]
- International Energy Agency. World Energy Outlook 2022; International Energy Agency: Paris, France, 2022; p. 17. [Google Scholar]
- International Energy Agency; International Renewable Energy Agency; United Nations Statistics Division; World Bank; World Health Organization. Tracking SDG 7: The Energy Progress Report 2025; World Bank: Washington, DC, USA, 2025. [Google Scholar]
- United Nations. Transforming Our World: The 2030 Agenda for Sustainable Development; United Nations: New York, NY, USA, 2015. [Google Scholar]
- Al Kez, D.; Foley, A.; Lowans, C.; Del Rio, D.F. Energy poverty assessment: Indicators and implications for developing and developed countries. Energy Convers. Manag. 2024, 307, 118324. [Google Scholar] [CrossRef] [Scilit]
- Day, R.; Walker, G.; Simcock, N. Conceptualising energy use and energy poverty using a capabilities framework. Energy Policy 2016, 93, 255–264. [Google Scholar] [CrossRef] [Scilit]
- Jones, E.C., Jr.; Reyes, A. Identifying themes in energy poverty research: Energy justice implications for policy, programs, and the clean energy transition. Energies 2023, 16, 6698. [Google Scholar] [CrossRef] [Scilit]
- Thomson, H.; Snell, C.; Bouzarovski, S. Health, well-being and energy poverty in Europe: A comparative study of 32 European countries. Int. J. Environ. Res. Public Health 2017, 14, 584. [Google Scholar] [CrossRef] [Scilit] [PubMed]
- Banerjee, R.; Mishra, V.; Maruta, A.A. Energy poverty, health and education outcomes: Evidence from the developing world. Energy Econ. 2021, 101, 105447. [Google Scholar] [CrossRef] [Scilit]
- Khandker, S.R.; Barnes, D.F.; Samad, H.A. Are the energy poor also income poor? Evidence from India. Energy Policy 2012, 47, 1–12. [Google Scholar] [CrossRef] [Scilit]
- Sovacool, B.K.; Upham, P.; Martiskainen, M.; Jenkins, K.E.; Torres Contreras, G.A.; Simcock, N. Policy prescriptions to address energy and transport poverty in the United Kingdom. Nat. Energy 2023, 8, 273–283. [Google Scholar] [CrossRef] [Scilit]
- Li, C.; Li, M.; Zhang, L.; Li, Q.; Zheng, H.; Feldman, M.W. Energy–poverty–inequality SDGs: A large-scale household analysis and forecasting in China. Proc. Natl. Acad. Sci. USA 2025, 122, e2408167121. [Google Scholar] [CrossRef] [Scilit] [PubMed]
- Song, Y.; Gao, J.; Zhang, M. Study on the impact of energy poverty on income inequality at different stages of economic development: Evidence from 77 countries around the world. Energy 2023, 282, 128816. [Google Scholar] [CrossRef] [Scilit]
- Smith, K.R.; Bruce, N.; Balakrishnan, K.; Adair-Rohani, H.; Balmes, J.; Chafe, Z. Millions dead: How do we know and what does it mean? Methods used in the comparative risk assessment of household air pollution. Annu. Rev. Public Health 2014, 35, 185–206. [Google Scholar] [CrossRef] [Scilit] [PubMed]
- World Health Organization. Household Air Pollution. Available online: https://www.who.int/en/news-room/fact-sheets/detail/household-air-pollution-and-health (accessed on 15 December 2023).
- GBD Risk Factors Collaborators. Global burden and strength of evidence for 88 risk factors in 204 countries and 811 subnational locations, 1990–2021: A systematic analysis for the Global Burden of Disease Study 2021. Lancet 2024, 403, 2162–2203. [Google Scholar] [CrossRef] [Scilit] [PubMed]
- Jeuland, M.A.; Pattanayak, S.K. Benefits and costs of improved cookstoves: Assessing the implications of variability in health, forest and climate impacts. PLoS ONE 2012, 7, e30338. [Google Scholar] [CrossRef] [Scilit] [PubMed]
- Ma, T.; Zhang, S.; Xiao, Y.; Liu, X.; Wang, M.; Wu, K.; Shen, G.; Huang, C.; Fang, Y.R.; Xie, Y. Costs and health benefits of the rural energy transition to carbon neutrality in China. Nat. Commun. 2023, 14, 6101. [Google Scholar] [CrossRef] [Scilit] [PubMed]
- Das, I.; Lewis, J.J.; Ludolph, R.; Bertram, M.; Adair-Rohani, H.; Jeuland, M. The benefits of action to reduce household air pollution (BAR-HAP) model: A new decision support tool. PLoS ONE 2021, 16, e0245729. [Google Scholar] [CrossRef] [Scilit] [PubMed]
- WHO Regional Office for Europe. WHO Guidelines for Indoor Air Quality: Selected Pollutants; WHO Regional Office for Europe: Copenhagen, Denmark, 2010. [Google Scholar]
- International Energy Agency. World Energy Outlook 2020; International Energy Agency: Paris, France, 2020. [Google Scholar]
- Wang, F.; Geng, H.; Zha, D.; Zhang, C. Multidimensional Energy Poverty in China: Measurement and Spatio-Temporal Disparities Characteristics. Soc. Indic. Res. 2023, 15, 1–34. [Google Scholar] [CrossRef] [Scilit] [PubMed]
- Owili, P.O.; Muga, M.A.; Pan, W.-C.; Kuo, H.-W. Cooking fuel and risk of under-five mortality in 23 Sub-Saharan African countries: A population-based study. Int. J. Environ. Health Res. 2017, 27, 191–204. [Google Scholar] [CrossRef] [Scilit] [PubMed]
- Byaro, M.; Mmbaga, N.F.; Mafwolo, G. Tackling energy poverty: Do clean fuels for cooking and access to electricity improve or worsen health outcomes in sub-Saharan Africa? World Dev. Sustain. 2024, 4, 100125. [Google Scholar] [CrossRef] [Scilit]
- Chen, Y.; Ebenstein, A.; Greenstone, M.; Li, H. Evidence on the impact of sustained exposure to air pollution on life expectancy from China’s Huai River policy. Proc. Natl. Acad. Sci. USA 2013, 110, 12936–12941. [Google Scholar] [CrossRef] [Scilit] [PubMed]
- Ebenstein, A.; Fan, M.; Greenstone, M.; He, G.; Zhou, M. New evidence on the impact of sustained exposure to air pollution on life expectancy from China’s Huai River Policy. Proc. Natl. Acad. Sci. USA 2017, 114, 10384–10389. [Google Scholar] [CrossRef] [Scilit] [PubMed]
- Lee, M.; Chang, J.; Deng, Q.; Hu, P.; Bixby, H.; Harper, S.; Shen, G.; Tao, S.; Guo, M.; Lu, F. Effects of a coal to clean heating policy on acute myocardial infarction in Beijing: A difference-in-differences analysis. Lancet Planet. Health 2024, 8, e924–e932. [Google Scholar] [CrossRef] [Scilit] [PubMed]
- Wen, H.-X.; Nie, P.-Y.; Liu, M.; Peng, R.; Guo, T.; Wang, C.; Xie, X.-B. Multi-health effects of clean residential heating: Evidences from rural China’s coal-to-gas/electricity project. Energy Sustain. Dev. 2023, 73, 66–75. [Google Scholar] [CrossRef] [Scilit]
- Qin, J.; Li, W.; Zhang, J. How can energy poverty affect farmers’ health? Evidence from mountainous areas in China. Energy 2024, 290, 130074. [Google Scholar] [CrossRef] [Scilit]
- Xu, W.; Xie, B.; Lou, B.; Wang, W.; Wang, Y. Assessing the effect of energy poverty on the mental and physical health in China—Evidence from China family panel studies. Front. Energy Res. 2022, 10, 944415. [Google Scholar] [CrossRef] [Scilit]
- Stoner, O.; Lewis, J.; Lucio Martínez, I.; Gumy, S.; Economou, T.; Adair-Rohani, H. Household cooking fuel estimates at global and country level for 1990 to 2030. Nat. Commun. 2021, 12, 5793. [Google Scholar] [CrossRef] [Scilit] [PubMed]
- Nussbaumer, P.; Bazilian, M.; Modi, V. Measuring energy poverty: Focusing on what matters. Renew. Sustain. Energy Rev. 2012, 16, 231–243. [Google Scholar] [CrossRef] [Scilit]
- Alkire, S.; Foster, J. Counting and multidimensional poverty measurement. J. Public Econ. 2011, 95, 476–487. [Google Scholar] [CrossRef] [Scilit]
- Hills, J. Getting the Measure of Fuel Poverty; Department of Energy and Climate Change: London, UK, 2012.
- Thomson, H.; Snell, C. Quantifying the prevalence of fuel poverty across the European Union. Energy Policy 2013, 52, 563–572. [Google Scholar] [CrossRef] [Scilit]
- Zhang, J.; Raza, S.M.F.; Huang, Y.; Wang, C. What affect energy poverty in China? A path towards sustainable development. Econ. Res.-Ekon. Istraž. 2023, 36, 2111316. [Google Scholar] [CrossRef] [Scilit]
- Sovacool, B.K. The political economy of energy poverty: A review of key challenges. Energy Sustain. Dev. 2012, 16, 272–282. [Google Scholar] [CrossRef] [Scilit]
- Smith, K.R.; Mehta, S.; Maeusezahl-Feuz, M. Indoor air pollution from household use of solid fuels. In Comparative Quantification of Health Risks: Global and Regional Burden of Disease Attributable to Selected Major Risk Factors; Ezzati, M., Lopez, A.D., Rodgers, A., Murray, C.J.L., Eds.; World Health Organization: Geneva, Switzerland, 2004; Volume 2, pp. 1435–1493. [Google Scholar]
- Hanna, R.; Duflo, E.; Greenstone, M. Up in smoke: The influence of household behavior on the long-run impact of improved cooking stoves. Am. Econ. J. Econ. Policy 2016, 8, 80–114. [Google Scholar] [CrossRef] [Scilit]
- Sen, K.K.; Chapman, A.J.; Saha, B.B. Analyzing the influence of energy poverty on newborn mortality through econometric and machine learning approaches. Renew. Sustain. Energy Rev. 2025, 217, 115785. [Google Scholar] [CrossRef] [Scilit]
- Hayford, I.S.; Ofori, E.K.; Gyamfi, B.A.; Gyimah, J. Clean cooking technologies, information, and communication technology and the environment. Environ. Sci. Pollut. Res. 2023, 30, 105646–105664. [Google Scholar] [CrossRef] [Scilit] [PubMed]
- Ofori, E.K.; Hayford, I.S.; Nyantakyi, G.; Tergu, C.T.; Opoku-Mensah, E. Synerging Sustainable Development Goals: Can clean energy (green) deliver UN-SDG geared towards socio-economic-environment objectives in emerging BRICS? Environ. Sci. Pollut. Res. 2023, 30, 98470–98489. [Google Scholar] [CrossRef] [Scilit] [PubMed]
- Gyimah, J.; Yao, X.; Tachega, M.A.; Hayford, I.S.; Opoku-Mensah, E. Renewable energy consumption and economic growth: New evidence from Ghana. Energy 2022, 248, 123559. [Google Scholar] [CrossRef] [Scilit]
- Pritchett, L.; Summers, L.H. Wealthier is healthier. J. Hum. Resour. 1996, 31, 841–868. [Google Scholar] [CrossRef] [Scilit]
- Filmer, D.; Pritchett, L. The impact of public spending on health: Does money matter? Soc. Sci. Med. 1999, 49, 1309–1323. [Google Scholar] [CrossRef] [Scilit] [PubMed]
- Phillips, P.C.B.; Hansen, B.E. Statistical inference in instrumental variables regression with I(1) processes. Rev. Econ. Stud. 1990, 57, 99–125. [Google Scholar] [CrossRef] [Scilit]
- Park, J.Y. Canonical cointegrating regressions. Econometrica 1992, 60, 119–143. [Google Scholar] [CrossRef] [Scilit]
- Stock, J.H.; Watson, M.W. A simple estimator of cointegrating vectors in higher order integrated systems. Econometrica 1993, 61, 783–820. [Google Scholar] [CrossRef] [Scilit]
- Andrieu, B.; Marrauld, L.; Vidal, O.; Egnell, M.; Boyer, L.; Fond, G. Health-care systems’ resource footprints and their access and quality in 49 regions between 1995 and 2015: An input-output analysis. Lancet Planet. Health 2023, 7, e747–e758. [Google Scholar] [CrossRef] [Scilit] [PubMed]
- Caldwell, J.C. Education as a factor in mortality decline: An examination of Nigerian data. Popul. Stud. 1979, 33, 395–413. [Google Scholar] [CrossRef] [Scilit]
- Khan, M.T.I.; Yaseen, M.R.; Ali, Q. Nexus between financial development, tourism, renewable energy, and greenhouse gas emission in high-income countries: A continent-wise analysis. Energy Econ. 2019, 83, 293–310. [Google Scholar] [CrossRef] [Scilit]
- Cui, L.; Weng, S.; Nadeem, A.M.; Rafique, M.Z.; Shahzad, U. Exploring the role of renewable energy, urbanization and structural change for environmental sustainability: Comparative analysis for practical implications. Renew. Energy 2022, 184, 215–224. [Google Scholar] [CrossRef] [Scilit]
- Ngoma, J.B.; Yang, L. Does economic performance matter for forest conversion in Congo Basin tropical forests? FMOLS-DOLS approaches. For. Policy Econ. 2024, 162, 103199. [Google Scholar] [CrossRef] [Scilit]
- Fatima, N.; Xuhua, H.; Alnafisah, H.; Akhtar, M.R. Synergy for climate actions in G7 countries: Unraveling the role of environmental policy stringency between technological innovation and CO2 emission interplay with DOLS, FMOLS and MMQR approaches. Energy Rep. 2024, 12, 1344–1359. [Google Scholar] [CrossRef] [Scilit]
- Merlin, M.L.; Chen, Y. Analysis of the factors affecting electricity consumption in DR Congo using fully modified ordinary least square (FMOLS), dynamic ordinary least square (DOLS) and canonical cointegrating regression (CCR) estimation approach. Energy 2021, 232, 121025. [Google Scholar] [CrossRef] [Scilit]
- Sulaiman, C.; Abdul-Rahim, A.S.; Ofozor, C.A. Does wood biomass energy use reduce CO2 emissions in European Union member countries? Evidence from 27 members. J. Clean. Prod. 2020, 253. [Google Scholar] [CrossRef] [Scilit]
- Liu, Y.; Hao, Y. The dynamic links between CO2 emissions, energy consumption and economic development in the countries along “the Belt and Road. Sci. Total Environ. 2018, 645, 674–683. [Google Scholar] [CrossRef] [Scilit] [PubMed]
- Islam, N.; Jdanov, D.A.; Shkolnikov, V.M.; Khunti, K.; Kawachi, I.; White, M.; Lewington, S.; Lacey, B. Effects of covid-19 pandemic on life expectancy and premature mortality in 2020: Time series analysis in 37 countries. BMJ 2021, 375, e066768. [Google Scholar] [CrossRef] [Scilit] [PubMed]
- Sokhanvar, A.; Çiftçioğlu, S.; Lee, C.-C. The effect of energy price shocks on commodity currencies during the war in Ukraine. Resour. Policy 2023, 82, 103571. [Google Scholar] [CrossRef] [Scilit]
- Zhou, N.; Khanna, N.; Zhang, J.; Lu, H.; Price, L.; Fridley, D.; Ke, J.; Feng, W.; Shen, B.; Lin, J. China Energy Outlook 2022; Lawrence Berkeley National Laboratory (Forthcoming): Berkeley, CA, USA, 2022.
- Energy Institute. Statistical Review of World Energy 2025; Energy Institute: London, UK, 2025. [Google Scholar]
- Shen, G.; Xiong, R.; Tian, Y.; Luo, Z.; Jiangtulu, B.; Meng, W.; Du, W.; Meng, J.; Chen, Y.; Xue, B. Substantial transition to clean household energy mix in rural China. Natl. Sci. Rev. 2022, 9, nwac050. [Google Scholar] [CrossRef] [Scilit] [PubMed]
- Li, Y.; Chen, K.; Ding, R.; Zhang, J.; Hao, Y. How do photovoltaic poverty alleviation projects relieve household energy poverty? Evidence from China. Energy Econ. 2023, 118, 106514. [Google Scholar] [CrossRef] [Scilit]

Disclaimer/Publisher’s Note: The statements, opinions and data contained in all publications are solely those of the individual author(s) and contributor(s) and not of MDPI and/or the editor(s). MDPI and/or the editor(s) disclaim responsibility for any injury to people or property resulting from any ideas, methods, instructions or products referred to in the content. |
© 2026 by the authors. Licensee MDPI, Basel, Switzerland. This article is an open access article distributed under the terms and conditions of the Creative Commons Attribution (CC BY) license.