


Abstract
Proton exchange membrane fuel-cell (PEMFC) systems in plateau regions face reduced electrochemical performance because of lower oxygen partial pressure, while radiator heat rejection can be weakened by lower air density. This study compares an 80 kW class liquid-cooled PEMFC system in Wuhan (~0 m, 101.3 kPa) and Kunming (nominal 2000 m test condition, 80.1 kPa), using GB/T 24554-2022 as the test-method reference, and develops a model-based altitude-adaptive liquid–air-cooling strategy. At the end point of the steady-state current sweep, the highest recorded stack power decreases from 93.98 to 84.0 kW (−10.6%), maximum net power in rated-power tests decreases from 82 to 72 kW (−12.2%), load-up time increases by 33%, and unloading time decreases by 20%; in the Kunming load sweep, the parasitic share rises from 9.2% to 18.2% as net demand increases from 10 to 80 kW. A thermal sweep in which the recorded excess-air ratio falls from 5.63 at 10 kW to 2.18 at 80 kW reaches 80 kW net while maintaining the coolant outlet temperature at 78–86 °C. Under idealized International Standard Atmosphere (ISA) conditions, the modeled radiator air-side coefficient falls to 85.4% and 72.5% of its sea-level value at 2000 and 4000 m, respectively; inverse-density fan scaling restores the modeled coefficient at a fan-power cost proportional to 1/K(z)2. Unlike previous altitude studies focused on stack electrochemistry, the results indicate coupled air-supply constraints and modeled air-side heat-rejection sensitivity. These results support altitude-adaptive thermal management of high-power PEMFC systems. No 4000 m stack-power projection is reported: the apparent pressure ratio that would be required at that altitude to reproduce the cathode-inlet pressure recorded at the 80 kW point of Campaign B (3.23) is beyond the 2.48 reached in the tests, so the 4000 m analysis is restricted to that pressure-ratio requirement and to the idealized air-side coefficient of the radiator.
1. Introduction
Proton exchange membrane fuel cells (PEMFCs) are a key enabling technology for the low-carbon transition of transportation and distributed power generation, owing to their high efficiency, fast start-up, low operating temperature and zero tailpipe emissions [1,2]. PEMFC systems are being evaluated for plateau operation, including expander-based compressor energy recovery [3]. Applications in plateau regions may encounter elevations of 2000–4000 m, where low ambient temperatures further complicate fuel-cell start-up [4]. At 2000 m, ambient pressure is roughly 20% below its sea-level value; at 4000 m, it is about 40% lower. The associated reduction in air density and oxygen partial pressure affects PEMFC system operation [5,6].
The influence of altitude on PEMFC performance has been documented for more than two decades. Hordé et al. [7] measured PEMFC stacks at altitudes of 200–2200 m and found that the maximum operable current shrinks markedly with altitude, especially at low air stoichiometry; even at a stoichiometry of 2.5, the power loss at 2200 m still reached 8%. González-Espasandín et al. [8] compared air-breathing hydrogen PEMFCs and passive DMFCs under atmospheric flight conditions. Pratt et al. [9] reported similar losses for air-breathing stacks under simulated high-altitude conditions. For air-cooled stacks, Shi et al. [10] found that the effect of cathode-air pre-heating depends on altitude and humidity, while Miao et al. [11] studied operating characteristics in high-altitude environments. More recently, Zhou et al. [12] showed that a high oxygen-excess-ratio design can improve the altitude tolerance of air-cooling PEMFC stacks for unmanned aerial vehicles. At the system level, Haraldsson and Alvfors [13] demonstrated that the air-compressor energy consumption grows rapidly with altitude and can absorb up to 40% of the system net output, while Saleh et al. [14] modeled reactant-supply demand and flow control for fuel-cell unmanned aerial systems at altitude. Willich et al. [15] tested a commercial 100 kW PEM fuel-cell system in a low-pressure chamber at 750–940 mbar and found that below 867 mbar, the compressor can no longer deliver the air mass flow required for the maximum rated current, so that a current-limiting strategy had to be implemented; Graf et al. [16] demonstrated that direct battery hybridization can stabilize the system voltage under low ambient pressure; and Li et al. [17] simulated a fuel-cell vehicle over the 0–4000 m altitude range and identified the compressor operating boundaries as a key constraint on plateau performance. A recent review by Chen et al. [18] summarized these plateau-adaptation studies and pointed out that most of them remain limited to single cells or small air-cooled systems below 10 kW and to altitudes below 4000 m.
Two mitigation philosophies have emerged. Structure-oriented approaches, such as two-stage boosting, cathode pre-heating and exhaust-energy recovery with expanders [3], can recover part of the lost oxygen partial pressure but add hardware complexity and cost. Strategy-oriented approaches instead adapt the reactant supply and the operating point to the ambient conditions: coordinated power distribution among multiple stacks improved simulated hydrogen economy at high altitude in the study by Wang et al. [19], and our previous campaign on a 95 kW water-cooled stack reported compressor operation closer to the surge region at altitude [20]. Compressor-level analyses confirm that altitude narrows the efficient operating window of the air-supply system and that the growing compressor parasitic share ultimately caps the achievable net power [21].
Thermal management under plateau conditions, however, has received far less attention, even though it can markedly amplify the altitude penalty. Cooling techniques for PEMFC stacks have been reviewed [1,22,23], and liquid cooling is widely adopted for automotive-scale stacks because of its superior heat capacity and temperature uniformity. In the investigated vehicle-type system, the liquid loop ultimately rejects heat to ambient air through a radiator and is thus, in essence, a liquid–air coupled system. At altitude the air-side convective resistance increases sharply because the air density—and thus the mass flow at a given fan speed—drops, while at the same time, the stack heat load increases: the reduced cell voltage forces higher currents for the same power, the excess-air ratio must be raised to avoid oxygen starvation, and increased compressor work can add to the system heat load and the cathode-inlet thermal burden [24]. Aviation and aerospace reviews also discuss the challenges of integrating hydrogen fuel cells into complete power systems [25]. Plateau-bus studies have discussed thermal-management [26] and air-supply [27] challenges, and simulation work indicates that the stack temperature at altitude may drift above its setpoint, accelerating catalyst and membrane degradation [1,23].
Despite these observations, three gaps remain. First, published altitude studies concentrate on low-power air-cooled stacks; quantitative experimental evidence on the cooling-loop behavior of a commercial high-power (>50 kW) liquid-cooled system under altitude conditions—coolant temperatures, temperature rise, heat load and parasitic energy—is scarce. Second, the few plateau thermal-management studies treat the liquid loop and the air side separately, and the coupled heat-rejection chain from the stack to the ambient air has not been modeled explicitly as a function of altitude. Third, recent thermal-management control studies—such as model-based decoupling control of the coolant circuit [28] and system-level control strategies for liquid-cooled stacks [29]—have improved temperature tracking and reduced parasitic consumption, but their reported cases emphasize temperature feedback at the tested operating conditions; pressure-based feedforward control may help when radiator air-side performance changes with altitude. Given the pressure and air-supply constraints discussed for plateau applications [18,30], ambient-pressure-based feedforward control is a candidate for PEMFC cooling, but its benefit at altitude has not been sufficiently validated.
The present work makes three contributions. (i) Comparative experiments on a commercial-scale 80 kW class, 370-cell liquid-cooled PEMFC system are reported for two altitudes (~0 m and ~2000 m), covering steady-state, rated-power and dynamic loading tests with GB/T 24554-2022 [31] as the test-method reference, together with a full load sweep of the thermal-management variables at 2000 m. (ii) The liquid–air heat-rejection chain is formulated as an altitude-dependent thermal-resistance network, estimating the change in the radiator air-side coefficient under an idealized density scaling. (iii) A model-based altitude-adaptive feedforward–feedback compensation framework is developed, in which the fan-speed command is scaled inversely with the air-density ratio K(z) while a proportional–integral (PI) feedback loop trims the coolant flow, and its idealized air-side and fan-power trade-off is calculated over 0–5000 m without hardware validation and compared with the alternative hardware routes (additional radiator area and additional compression stage); the fan and area routes are compared at equal air-side heat-transfer capacity, whereas the compression route addresses the air-supply requirement and does not restore that capacity. The remainder of this paper is organized as follows: Section 2 describes the experimental system and the models; Section 3 presents and discusses the results; Section 4 concludes the paper.
2. Materials and Methods
2.1. Fuel-Cell System and Coupled Cooling Architecture
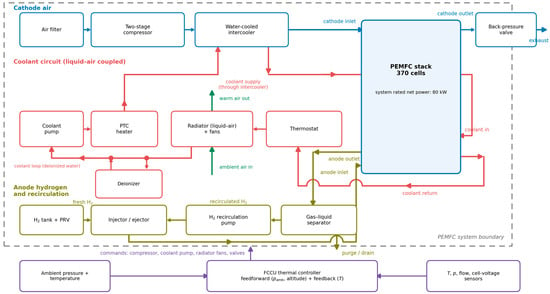
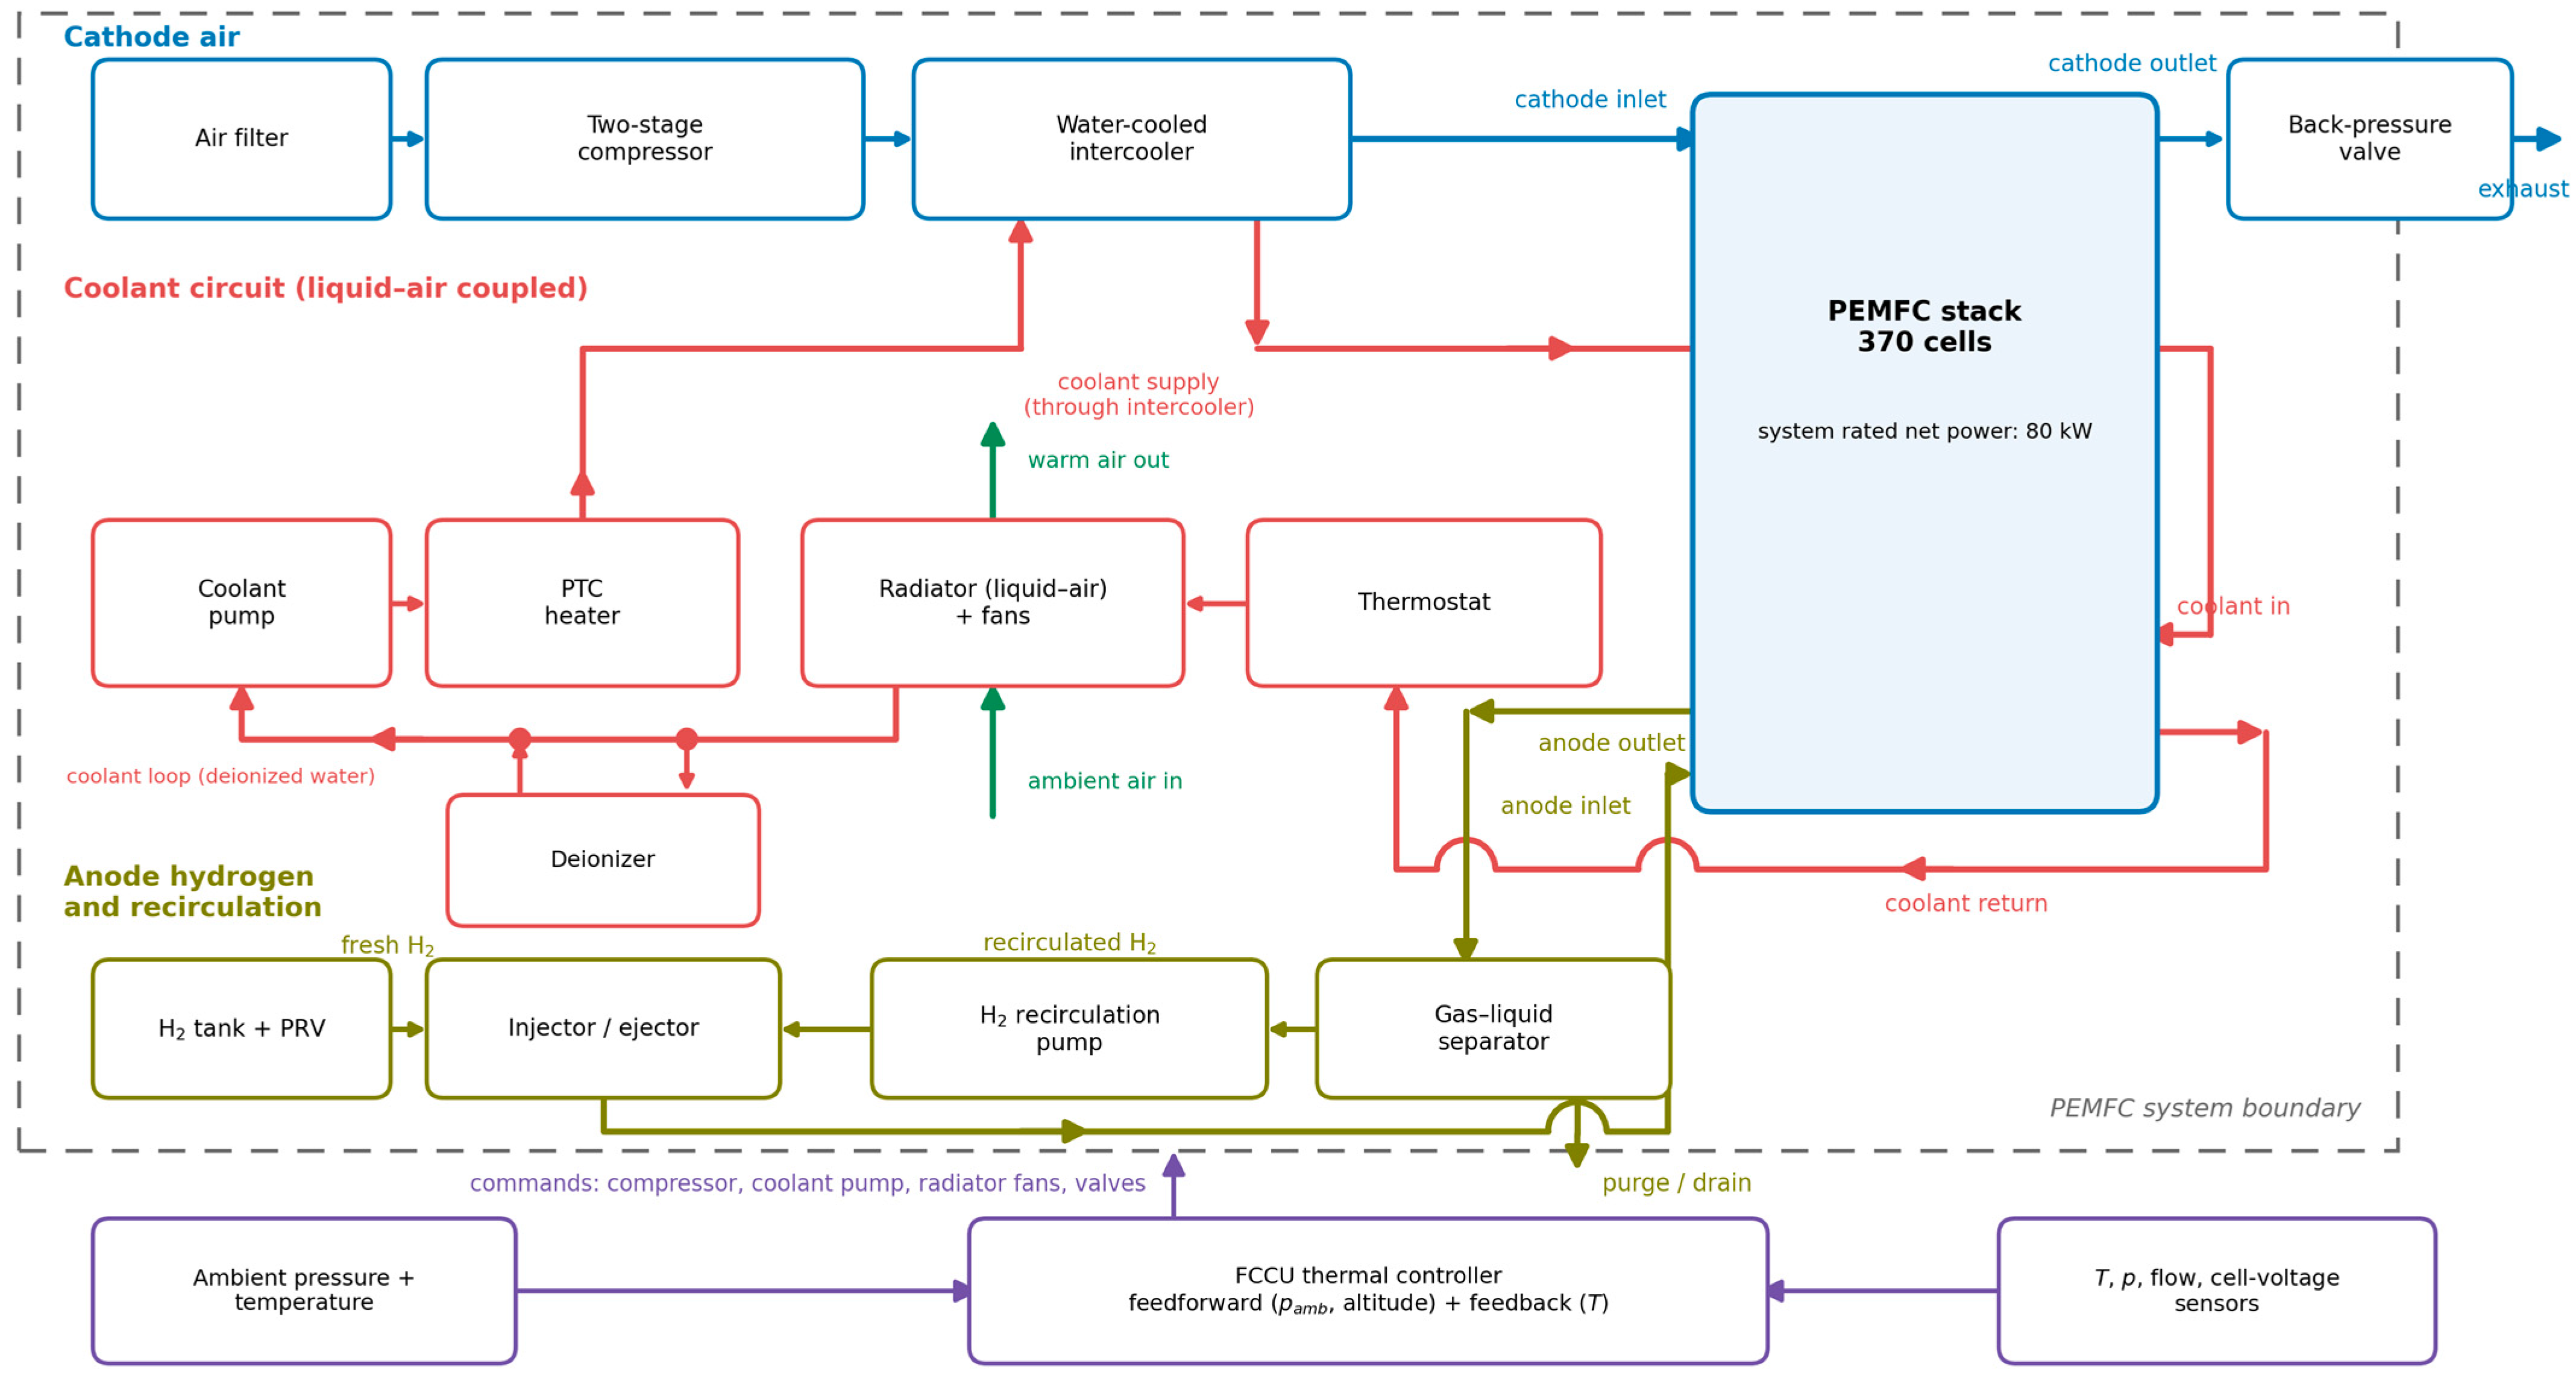
The experimental object is a commercial liquid-cooled PEMFC system (Wuhan Troowin Power System Technology Co., Ltd., Wuhan, Hubei, China) whose main parameters are listed in Table 1. The stack consists of 370 cells with an active area of 266 cm2 connected in series, delivering a rated net power of 80 kW within a voltage window of 200–400 V. As illustrated in Figure 1, the system comprises four subsystems. In the air subsystem, ambient air passes through a filter, a two-stage centrifugal compressor (Southern Pump Industry Co., Ltd., Hangzhou, Zhejiang) and a water-cooled intercooler (Yangzhou Asmo Technology Co., Ltd., Yangzhou, Jiangsu, China) before entering the cathode; the cathode back-pressure is regulated by a back-pressure valve (Shanghai Wangrun High-Tech Co., Ltd., Shanghai, China). The hydrogen subsystem adopts a closed-loop configuration with a gas–liquid separator (Wuhan Xinrong Zhizao Technology Co., Ltd., Wuhan, Hubei, China) and a recirculation pump (Suzhou Ruiqi Electric Technology Co., Ltd., Suzhou, Jiangsu, China) to recover unreacted hydrogen. The cooling subsystem—the focus of this work—circulates deionized water (conductivity ≤ 5 μS/cm maintained by a deionizer) through the stack cooling channels, an electronic thermostat and a radiator equipped with speed-controlled fans (Yangzhou Jiahe New Energy Technology Co., Ltd., Yangzhou, Jiangsu, China); a positive temperature coefficient (PTC) heater (Shanghai Moheng Electric Heating Appliance Co., Ltd., Shanghai, China) assists cold starts. The fuel-cell control unit (FCCU) (Shanghai Haineng Automotive Electronics Co., Ltd., Shanghai, China) acquires temperatures, pressures, mass flows and all single-cell voltages, and commands the compressor, the coolant pump, the fans and the valves.
Table 1.
Main specifications of the PEMFC system. The 72–86 °C range is the allowable stack operating-temperature window; the 78–86 °C coolant outlet band used as the control target in the load sweeps is a subset of that window and is defined in Section 3.3.
Figure 1.
Schematic of the PEMFC system with the coupled liquid–air-cooling architecture. PEMFC, proton exchange membrane fuel cell; FCCU, fuel-cell control unit; PTC, positive temperature coefficient; PRV, pressure relief valve. The diagram uses different colors to distinguish the cathode-air path, liquid-coolant circuit, hydrogen circuit, ambient radiator-air path, and control/sensing connections.
Functionally, the cooling system is a coupled liquid–air architecture: the liquid loop extracts heat from the stack with high uniformity and is essentially insensitive to ambient pressure, whereas the air side of the radiator performs the final heat rejection to the environment and is directly exposed to the altitude-dependent air density. The two sides are linked by the radiator (a liquid–air heat exchanger) and coordinated by the FCCU, so the heat-absorption rate of the liquid loop and the heat-rejection rate of the air side must be matched continuously.
2.2. Test Sites and Experimental Procedure
Comparative tests were carried out at Wuhan (nominal altitude, ~0 m; reported ambient pressure, 101.3 kPa) and Kunming (reported ambient pressure, 80.1 kPa; Table 2). The plateau site itself lies at approximately 1800 m, and “2000 m” is retained as the nominal condition label; the ambient pressure actually recorded there (80.1 kPa) is used for all calculations, so the comparison rests on the ambient pressure recorded at each site rather than on either nominal figure. Representative air temperatures of 17 °C and 15 °C are used for the density estimate and, in Section 3.3, for the mass-flow correction, because test-day temperature and relative humidity were not continuously logged. A warmer representative temperature for Wuhan is examined as a sensitivity case: at 25 °C the site-to-site density ratio would be 0.82 instead of 0.80, which does not alter any conclusion. These inputs yield approximate air densities of 1.22 and 0.97 kg/m3 and a site-to-site density ratio of 0.80; they do not isolate the effect of altitude from other environmental differences. The oxygen volume fraction is approximately constant over this altitude range, whereas oxygen mass flow at a fixed volumetric flow scales with air density.
Table 2.
Environmental conditions of the two test sites.
Two complementary test campaigns are reported. Campaign A applied national standard GB/T 24554-2022 “Performance test methods for fuel cell system” [31] at both sites, including steady-state characteristic, rated-power and dynamic loading/unloading tests; cold-start measurements are outside the scope of this paper and are not reported. In the steady-state test, the net power demand was stepped from 10% to 90% of the rated power in 10% increments. The rated-power and peak-power points were assessed separately, with the current limited at altitude; the standard specifies a 63 min rated-power run, of which the final 60 min define the measured rated power, with the output required to remain within 97–103% of its 60 min mean. The standard is used here as a reference for the test method and for the definition of the rated-power quantity. In Wuhan the rated-power test covering the 60 min measurement window required by the standard was completed; the length of the overall bench run beyond that window is not recorded in the material available to us. In Kunming the stack was shut down after 17.4 min of sustained high-power operation because the remaining hydrogen inventory was insufficient to continue testing; the hydrogen supply remained normal up to the shutdown. The 17.4 min duration therefore reflects a test-resource constraint rather than a demonstrated system endurance limit, and the Kunming results characterize performance within the recorded interval only; they do not establish 60 min continuous rated-power capability. Accordingly, the values in Table 3 are the maximum net powers recorded during the rated-power tests—neither 60 min means nor 17.4 min averages—and no standard-compliance claim is made for the plateau site. Campaign B was a thermal-management load sweep performed at the Kunming site, in which the net power demand was stepped from 10 kW to 80 kW. The excess-air ratio in Campaign B is not constant: the recorded value falls from 5.63 at 10 kW to 2.18 at 80 kW, i.e., the recorded stoichiometry is the highest at part load and lowest at full load, so that a decreasing value corresponds to an increasing load. Whether these are values scheduled by the control unit or values computed from the recorded air flow (Air flow meter Alicat Scientific, Tucson, AZ, USA) is not stated in the test sheets (Section 3.3). Campaign B therefore characterizes the coupled cooling system over the widest possible load range. The excess-air ratio of Campaign A was not recorded, so the two air supplies cannot be compared quantitatively. Because the two campaigns differ in air-supply calibration, their results are reported separately (Section 3.1, Section 3.2 and Section 3.3, respectively) and peak values are not mixed. Before and after each test, the pipelines were purged with 99.99% nitrogen (30 L/min, 10 min) (Messer Group, Bad Soden, Germany).
Table 3.
Recorded system performance in Wuhan and Kunming (Campaign A, GB/T 24554-2022). Net-power entries are maxima within the rated-power tests, not 60 min means or independently established continuous ratings.
Because the comparison uses two real sites rather than a pressure-controlled chamber, pressure, temperature and humidity were not independently controlled, and the latter two were not continuously logged, so the measurements cannot isolate altitude from other environmental differences. These limitations are discussed in Section 3.6.
2.3. Air-Supply and Heat-Generation Models
Two auxiliary models are used in the remainder of this work: the isentropic work of the air-supply compressor, which provides the physical relation between pressure ratio and compressor work, and the stack heat generation, which is obtained from the measured cell voltage rather than from an electrochemical model.
The air supply is provided by a two-stage centrifugal compressor modeled with the standard mass-flow/pressure-ratio map approach [32], in which the isentropic specific compression work reads
where k = 1.4 is the specific-heat ratio, T1 the inlet temperature, π the pressure ratio and Rair = 287 J/(kg·K) the specific gas constant of air; the compressor power is obtained by multiplying the specific work by the air mass flow and dividing by the isentropic efficiency ηis = 0.75, a representative value for two-stage centrifugal machines of this class; the installed compressor efficiency was not measured, so no compressor-power prediction is derived from it here. Equation (1) shows that specific compression work increases with pressure ratio at fixed inlet temperature. Compressor electrical demand also depends on air flow and efficiency, while the thermal contribution requires a system heat balance. The hydrogen path is described by mass-balance and partial-pressure equations following the control-oriented modeling practice by Pukrushpan et al. [32]. The heat generation of the stack is estimated from the energy balance
with N = 370 the cell count, I the stack current, the measured average cell voltage and 1.25 V the thermoneutral voltage evaluated on the lower heating value (LHV) basis, i.e., assuming that the product water leaves the stack as vapor [24]. On the higher heating value (HHV) basis, corresponding to liquid product water, the thermoneutral voltage is about 1.48 V, and replacing 1.25 V with 1.48 V in Equation (2) yields the HHV-based upper bound; Equation (2) as printed gives the LHV-based lower bound. The LHV basis is adopted throughout this work, as is common practice in control-oriented PEMFC thermal modeling; the actual value lies between the two bounds depending on the liquid-to-vapor split of the product water, and the HHV-based upper bound is therefore also reported where the heat load is discussed (Section 3.3 and Section 4). Equation (2) returns watts for N, I and V_cell in SI units; heat rates are reported in kilowatts throughout this paper. A substantial fraction of Qgen is removed through the coolant, while the remainder leaves through the exhaust and external heat losses [1]; the partition was not directly measured here.
2.4. Altitude-Dependent Thermal-Resistance Model of the Heat-Rejection Chain
The heat path from the stack to the ambient air is represented by three resistance terms in series:
where Rth,cond is the conduction resistance of the plates and radiator structure, Rth,liq is the liquid-side convective resistance and Rth,air is the air-side convective resistance. For typical automotive radiators, the air side dominates the total resistance. Equation (3) is a steady-state, lumped and equivalent representation: the transport delay along the coolant loop, the distributed liquid-side temperature profile, the temperature variation across the radiator core and any bypass flow are neglected, and Q is in watts when R_total is in K/W. No coolant-loop flow rate, no radiator-side air flow rate and no absolute thermal resistance were measured, so the resistance chain cannot be validated as a whole; what is evaluated in Section 3.5 is the idealized ratio h_air/h_air,0 of Equation (4), not the heat-rejection performance of the complete system. The air-side heat-transfer coefficient scales approximately with the 0.8 power of the air mass flux [33], so that at a constant fan speed,
with the air-density ratio being obtained from the equation of state for air
where Rair = 287 J/(kg·K) is the specific gas constant of air and ρ0 = 1.225 kg/m3 is the sea-level reference density. For a specified atmospheric state, the density ratio must be evaluated from pressure and temperature together; the widely used exponential form exp(−z/8430 m) approximates only the pressure ratio of the standard atmosphere and would overestimate the density loss. For the standard atmosphere, Equation (5) gives K(2000 m) = 0.822 and K(4000 m) = 0.669, corresponding through Equation (4) to h_air/h_air,0 ≈ 0.85 and 0.73 at a fixed fan speed, under the stated idealized coefficient scaling. At the reported Kunming pressure of 80.1 kPa and the representative temperature assumption of 15 °C, the estimated density is 0.969 kg/m3 (K ≈ 0.79 relative to the sea-level standard density); the corresponding idealized air-side coefficient ratio is approximately 0.83, distinct from the International Standard Atmosphere (ISA) [34] value of 0.854 at 2000 m.
2.5. Altitude-Adaptive Feedforward–Feedback Control Strategy
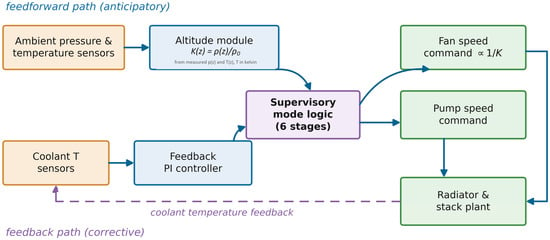
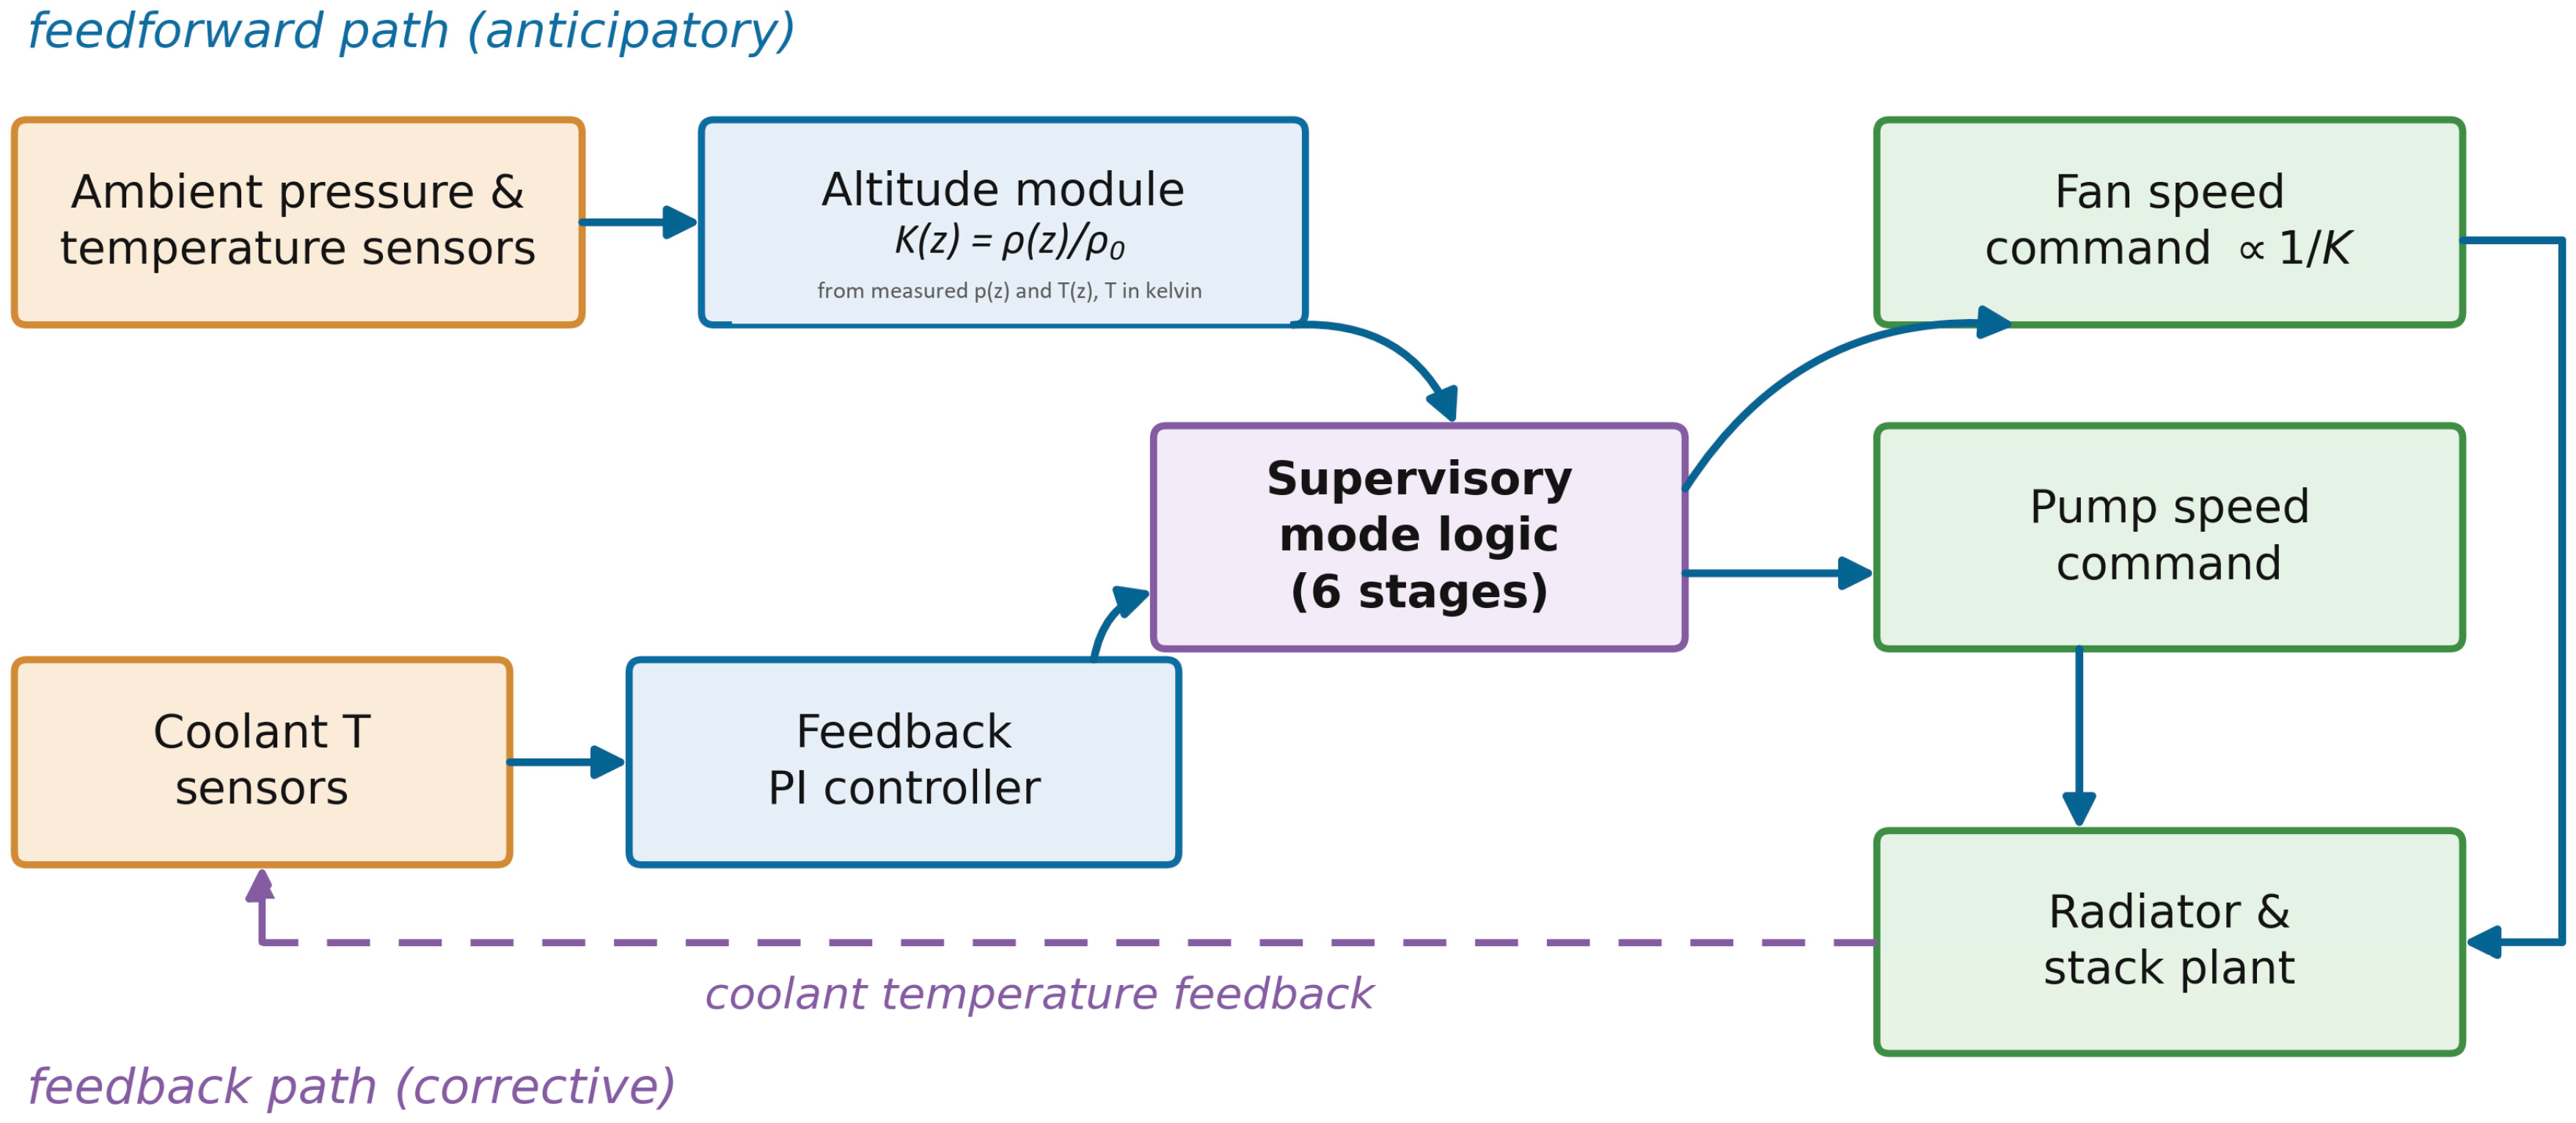
To counteract this degradation, a model-based altitude-adaptive feedforward–feedback compensation framework is proposed for the FCCU (Figure 2). The strategy combines two paths. In the feedforward path, the ambient-pressure and ambient-temperature measurements continuously provide the air-density ratio K(z) through Equation (5), and the fan-speed command is pre-scaled inversely with K(z),
which is intended to recover approximately the air mass flux and the modeled air-side heat-transfer coefficient under the idealized fan-scaling assumption, subject to fan-map and speed limits; the coolant-flow setpoint is simultaneously raised by approximately 10%; this increment is a design assumption rather than a measured optimum and is retained as a tunable parameter of the framework. In the feedback path, a PI controller trims the pump and fan speeds using the measured coolant inlet/outlet temperatures and is intended to reduce the residual errors caused by load transients, ambient-temperature drift and model inaccuracies. A supervisory state machine divides the operation into six modes—cold-start warm-up, low load, rated load, high load, over-temperature protection and shutdown aftercooling—and blends the two paths with mode-dependent gains; e.g., the feedforward action is suppressed during warm-up to shorten the heat-up time, whereas at rated and high load the altitude-dependent fan compensation determined by Equation (6) is fully active. The over-temperature mode additionally derates the stack power to bound the heat generation. The framework is a proposed control architecture rather than an implemented algorithm: it has not been commissioned on the tested system, and the measured thermal behavior of Section 3.3 was produced by the production controller. The controlled variables, the error definitions, the way the PI output is blended with the feedforward term, the output limits, the anti-windup provision and the mode-transition conditions are not specified here, so the architecture as described is not sufficient to reproduce a controller.
Figure 2.
Block diagram of the altitude-adaptive feedforward–feedback compensation framework. The figure distinguishes sensor inputs, computational and feedback-control elements, supervisory control, and controlled actuators. The dashed connection represents the feedback path.
3. Results and Discussion
3.1. Performance Degradation at 2000 m
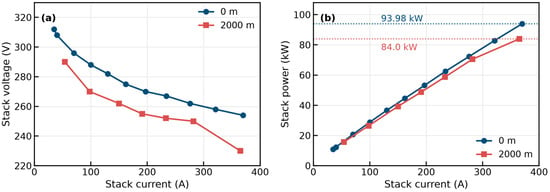
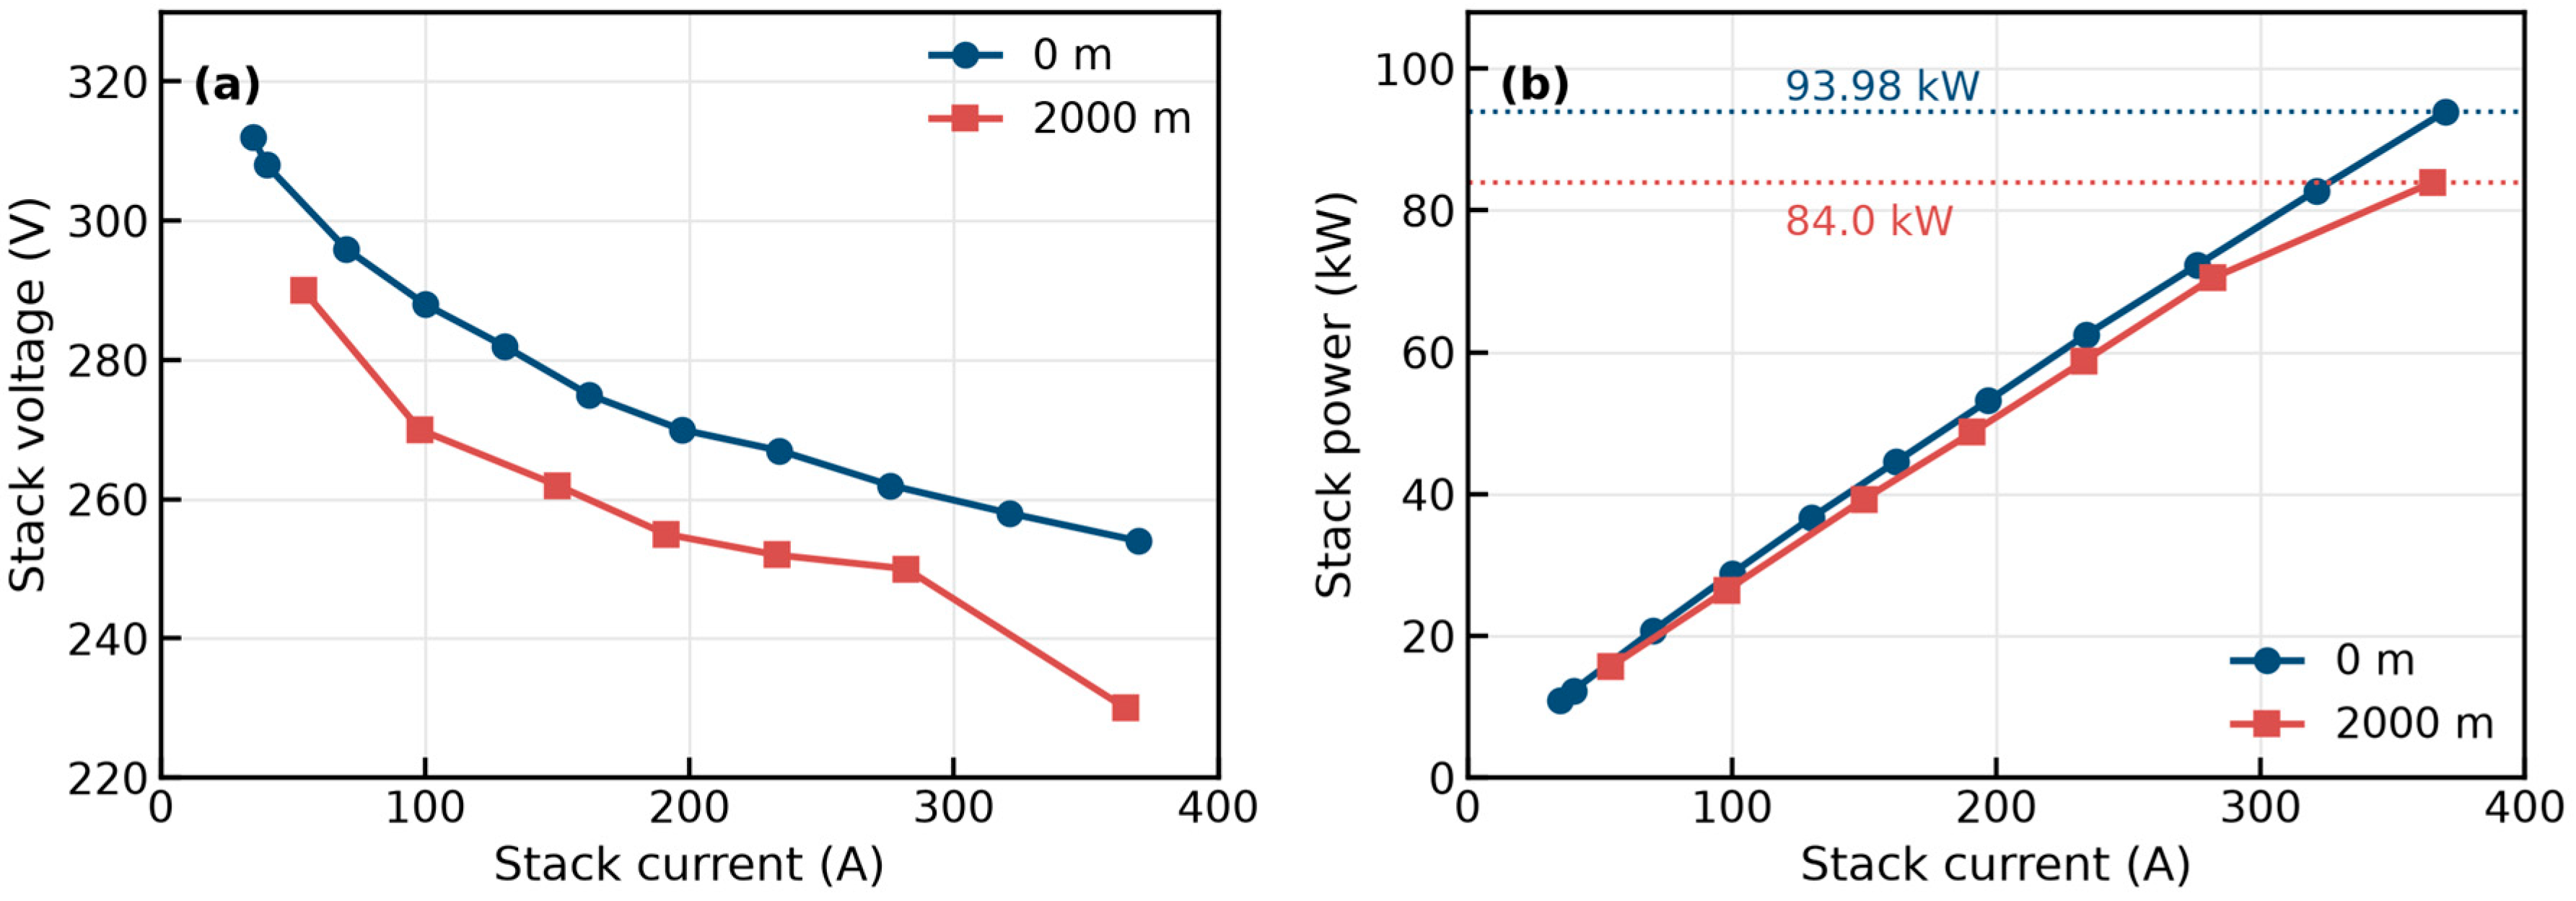
Figure 3 compares the measured polarization and power curves at the two altitudes. The system under test is an 80 kW class unit rated by its net output power; the stack gross power exceeds 90 kW under peak conditions. In Wuhan the steady-state sweep ends at 370 A, where the stack delivers 93.98 kW; in Kunming the same sweep ends at 365 A, with 84.0 kW, a reduction of 10.6% between the two end points. Neither value is the peak-power rating of the system; both are the highest values recorded in the sweeps used here. The dedicated peak-power test on the same system [20] reached 114.92 kW in Wuhan (461.3 A, 249.0 V) and 85.17 kW in Kunming (365.0 A, 233.3 V), with peak net powers of 92.57 and 66.39 kW, and the limiting current fell from 500 A in Wuhan to 365 A in Kunming. The two datasets therefore describe different test items: the steady-state sweeps analyzed here stop at 370 and 365 A, whereas the peak-power test reports both a maximum-power point and a limiting current: in Wuhan the maximum power occurs at 461.3 A, below the 500 A limiting current, and in Kunming, the two coincide at 365 A. Whether the 500 A figure is a set limit or an attained termination current is not stated in the data available to us. In this standard-based campaign (Campaign A; Section 2.2), the Kunming sweep was stopped at 365 A. The surge line was not measured here, and the system-level data do not establish why the sweep ended at that current, so the 84.0 kW value is the end point of this sweep rather than the thermodynamic ceiling of the stack. In the separate thermal load sweep of Campaign B, performed under a different air-supply calibration, the tested stack reached 97.9 kW at 419 A at a sampled operating point (Section 3.2); the two campaigns differ in calibration and in the current limit applied, and the records available to us do not establish which of these differences allowed for the higher current. The two curves are not uniformly offset. By interpolating the sea-level curve onto the plateau current grid and expressing the difference relative to the interpolated sea-level voltage, the deficits are 4.1% at 54 A, 6.4% at 98 A, between 4.4% and 5.9% from 150 to 282 A, and 9.6% at the 365 A end point. This non-uniformity is consistent with a mixture of activation-related losses at low-to-moderate current and a stronger mass-transport contribution at the highest current, but the present two-site system data cannot separate these mechanisms quantitatively; a similar earlier onset of oxygen-transport limitation at altitude was observed in our previous high-altitude campaign [20]. No 4000 m curve is plotted in Figure 3; the 4000 m case is treated in Section 3.4 as a bounded scenario whose required pressure ratio is quantified against the highest apparent pressure ratio reached in the tests.
Figure 3.
Measured (a) polarization and (b) power curves of the stack at 0 m and 2000 m. No 4000 m curve is shown, because the pressure ratio that it would require exceeds the highest apparent pressure ratio reached in the tests; the 4000 m case is treated as a bounded scenario in Section 3.4.
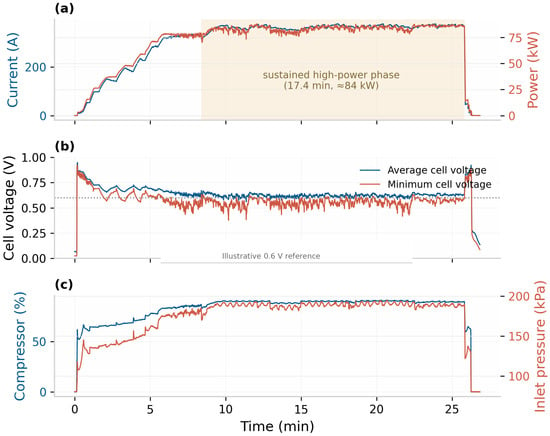
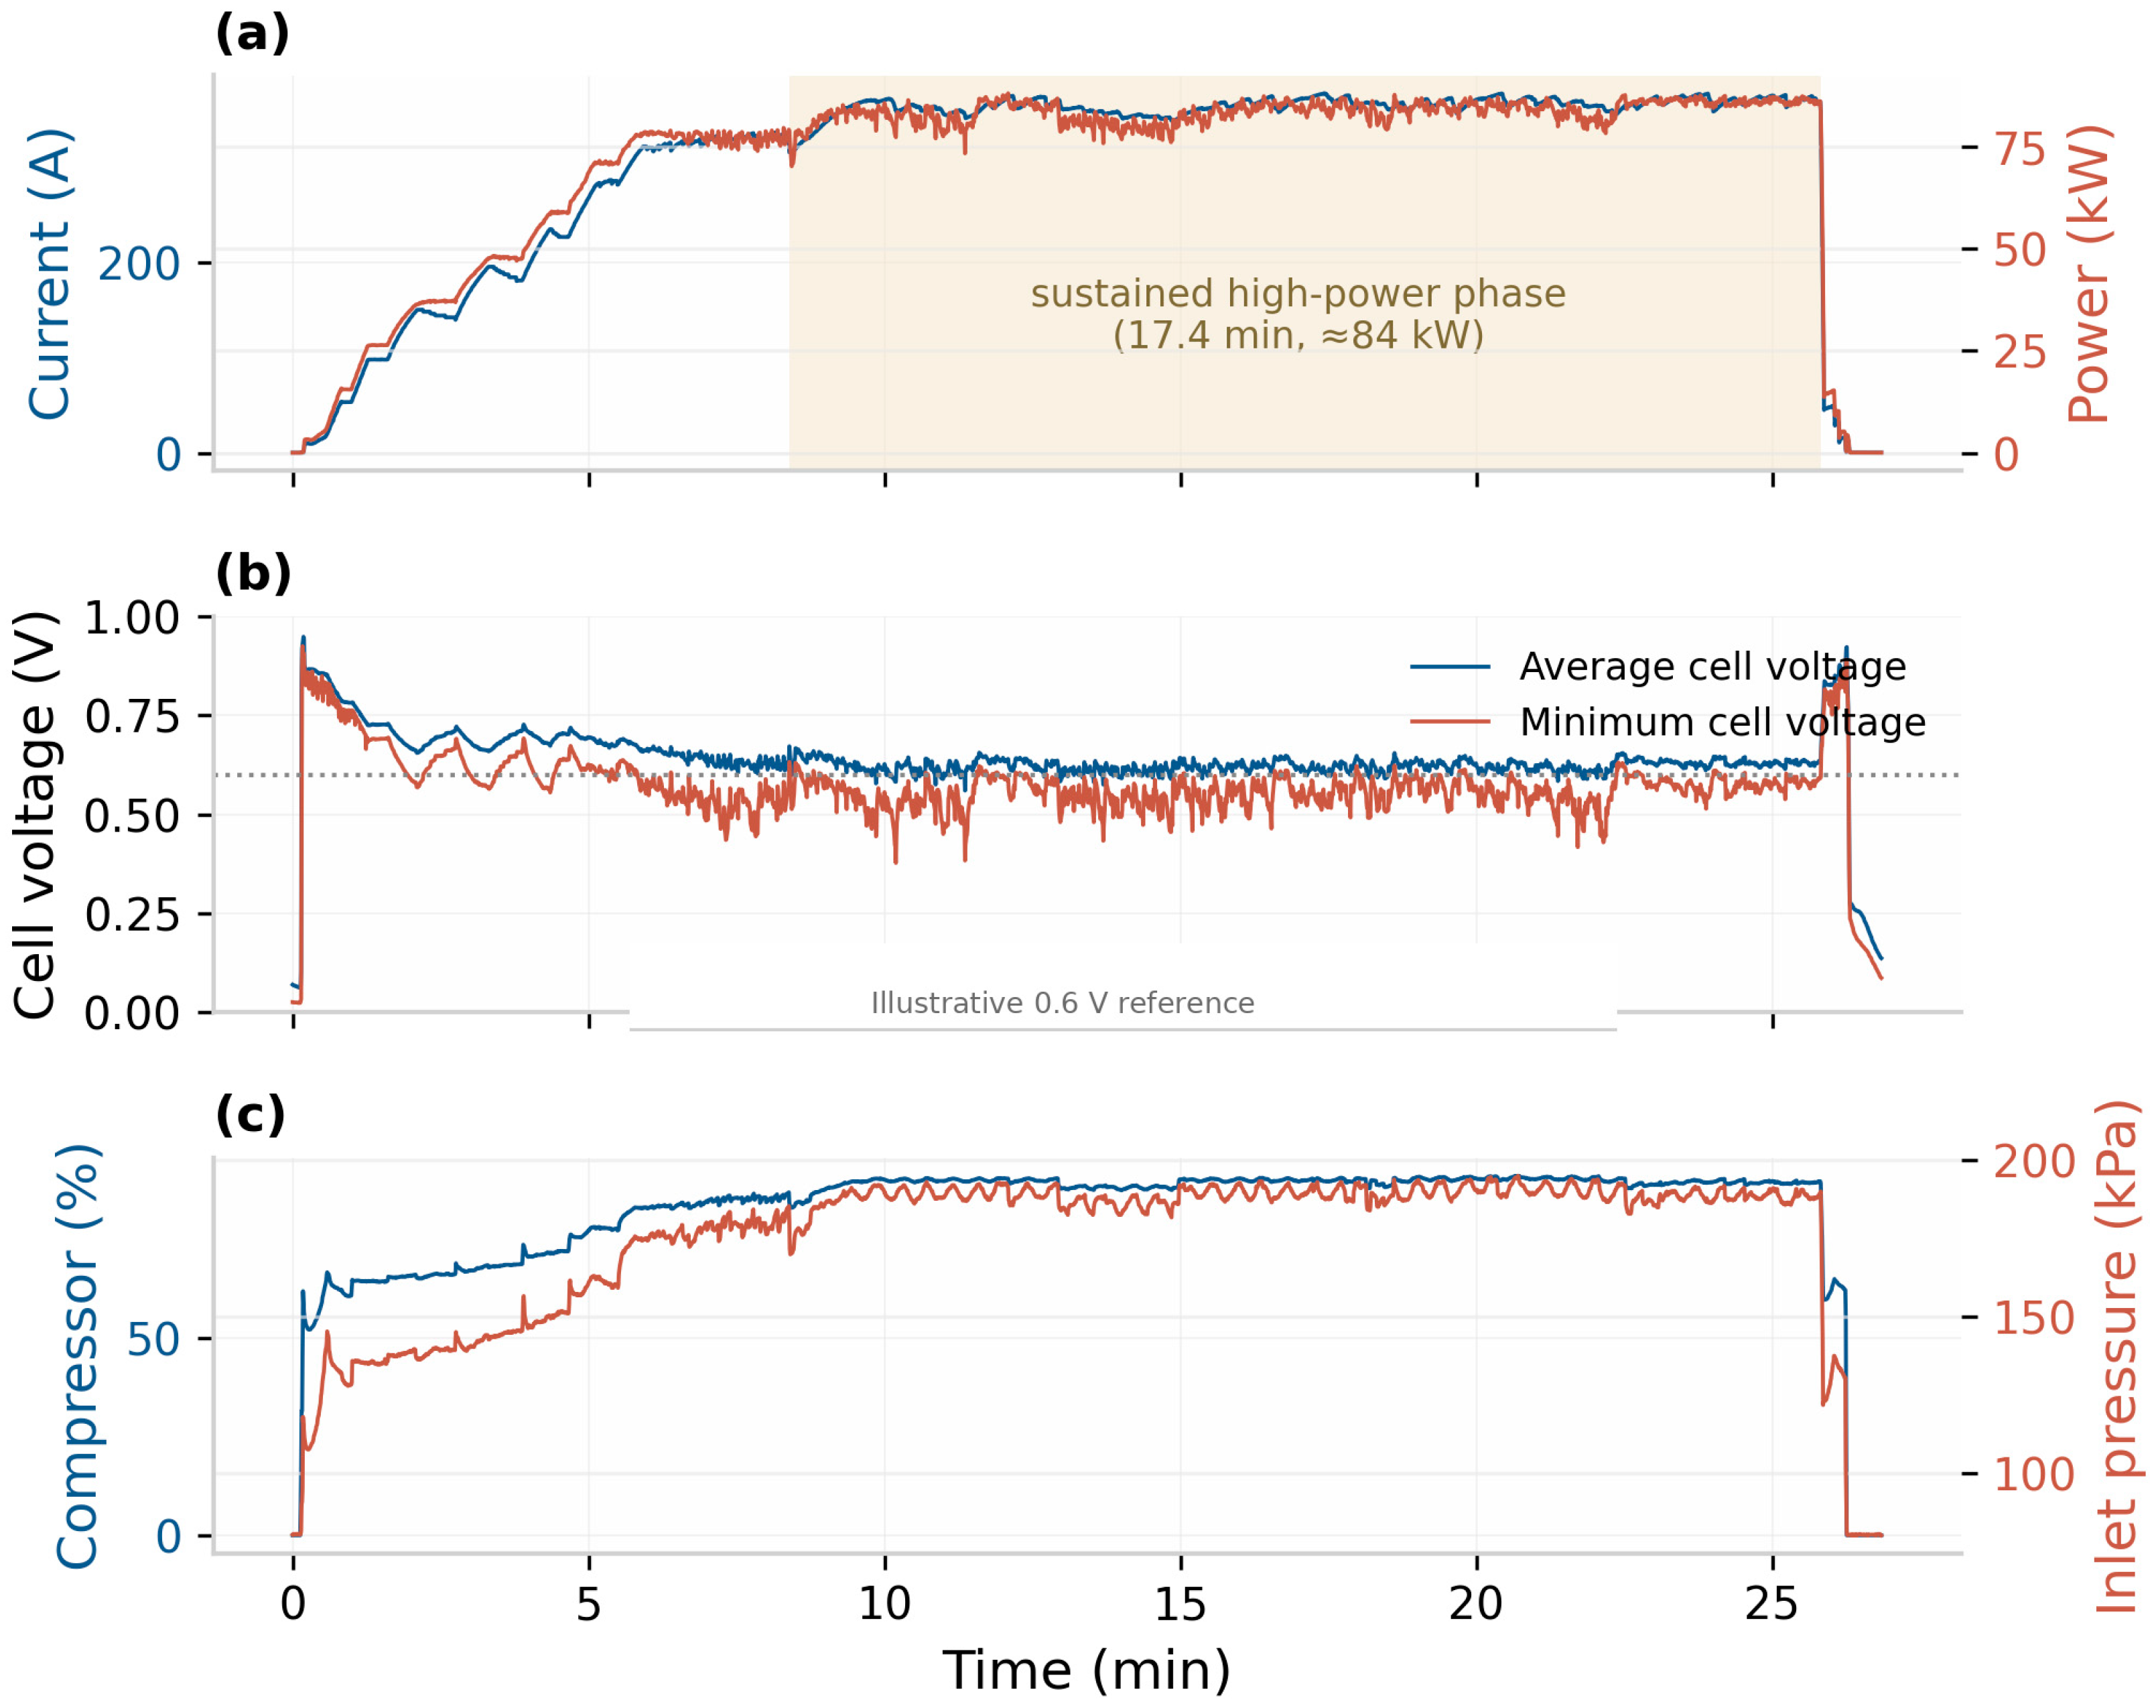
The system-level test results are summarized in Table 3. The largest net-power values reported within the rated-power tests are 82 kW in Wuhan and 72 kW in Kunming, a difference of 12.2%; these reported maxima must not be interpreted as 60 min mean power values or independently established continuous ratings (Section 2.2). Campaign B reached 80 kW net at a recorded load point under a different air-supply calibration, but its 60 min endurance at that calibration was not established. Figure 4 shows the recorded operating sequence in Kunming, in which the shaded 17.4 min high-power phase held the stack gross power at approximately 84 kW (316–377 A); over that phase, the average cell voltage had a mean of ≈0.62 V; brief excursions down to ≈0.56 V occurred during the load transients, while the minimum-cell voltage showed transient minima of ≈0.38 V. The hydrogen supply to the stack remained normal throughout this record (Section 2.2), so the excursions are not explained by an interruption of the fuel supply, although local maldistribution of reactant within the stack cannot be excluded from system-level measurements. The average load-up time from 10% to 90% of rated power increased from 24 s to 32 s (+33%), while unloading shortened from 5 s to 4 s (−20%). The efficiency and stack-voltage fluctuation figures reported in the original test campaign are not discussed here, because their calculation boundaries, curve windows and hydrogen-consumption basis are not documented in the records available to us; we prefer to omit them rather than present values that cannot be recomputed. Because the window is shorter than the 60 min interval specified by GB/T 24554-2022 and because the run ended when the remaining hydrogen inventory was insufficient to continue the test rather than at a limit imposed by the system, the 17.4 min record is reported as an observation within the recorded interval and is not offered as evidence of 60 min stability compliance; a complete 60 min rated-power test at altitude remains to be performed.
Figure 4.
Recorded operating sequence in Kunming (gross stack power ≈ 84 kW in the shaded phase): (a) stack current and gross stack power; (b) average and minimum-cell voltages, with an illustrative 0.6 V reference line that is not attributed here to GB/T 24554-2022; (c) recorded compressor speed and cathode-inlet pressure. The shaded sustained high-power phase lasts 17.4 min and lies within a longer recorded sequence that also contains the load-up and the unloading, so 17.4 min is the duration of that phase, not of the whole record. The run ends because the remaining hydrogen inventory was insufficient to continue the test, not at a system-imposed limit; it therefore documents behavior within the recorded interval and does not establish a 60 min continuous rating.
3.2. Parasitic Power and Voltage Uniformity
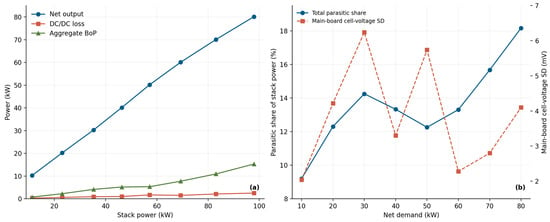
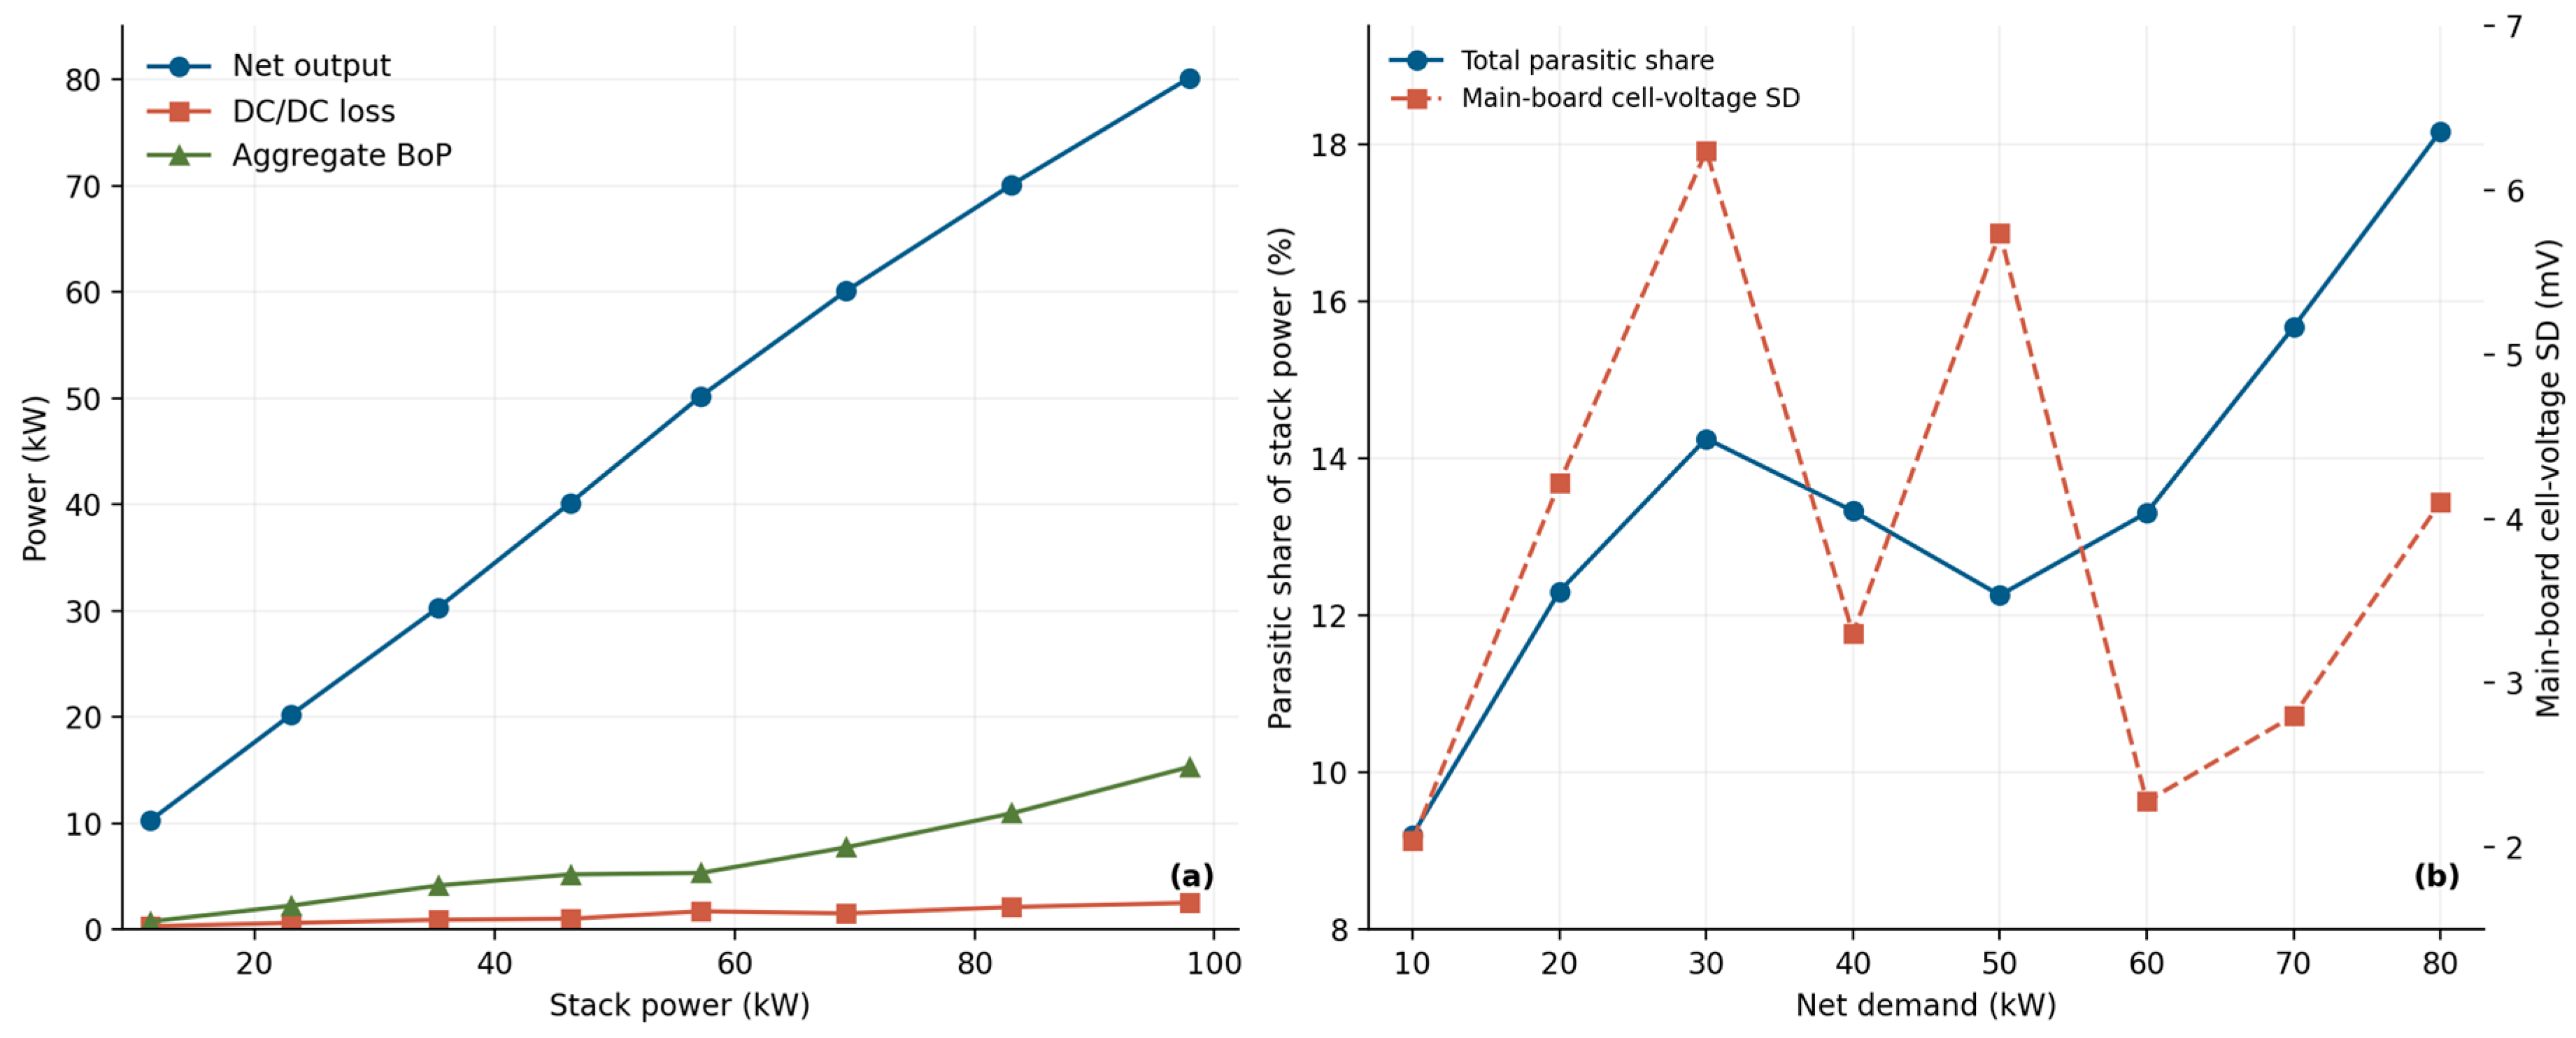
Figure 5a decomposes the stack power at 2000 m into the net output, the DC/DC conversion loss (Shenzhen Sinexcel Electric Co., Ltd., Shenzhen, Guangdong, China) and the balance-of-plant (BoP) parasitic consumption (aggregate auxiliary demand). The parasitic part grows non-linearly with load, from about 1 kW at 10 kW net power to 15 kW at 80 kW, while the DC/DC conversion loss increases only moderately with load, reaching 2.5 kW at the 80 kW operating point. At that point, 80 kW is the commanded setpoint, the gross stack power is 97.9 kW, and the listed components give 97.9 − 15.28 − 2.50 = 80.12 kW ≈ 80.1 kW, which closes the balance against the setpoint to within 0.2%; the shares quoted below are computed from these component values, and a share computed from the rounded 80.0 kW would differ by 0.1 percentage point. The total parasitic share of the stack power, defined here as and thus comprising both the BoP auxiliaries and the DC/DC conversion loss, rises from 9.2% at 10 kW to 18.2% at 80 kW (Figure 5b); at the highest load, for instance, (15.28 + 2.50)/97.9 ≈ 18.2%. A separately reported high-altitude study by the team [20] found an increase in the compressor-power share of the stack gross power from 19.43% at sea level to 22.05% at the reported Kunming site, together with a migration of the compressor operating point toward the surge line; the present sweep quantifies the aggregate parasitic demand at altitude but does not independently isolate the compressor, pump, and fan contributions.
Figure 5.
(a) Measured power balance versus gross stack power and (b) total parasitic share and main-board cell-voltage standard deviation versus net power demand at 2000 m. Aggregate BoP demand is the DC/DC output minus net output; DC/DC loss is gross stack power minus DC/DC output.
Voltage uniformity is a sensitive indicator of possible reactant maldistribution, but it is not a unique diagnostic of oxygen starvation. At 2000 m the recorded main-board cell-voltage standard deviation ranges from approximately 2.0 to 6.2 mV over the load sweep (Figure 5b), and the minimum-cell voltage rises monotonically as the load decreases, from 0.620 V at the steady-state 80 kW point (excess-air ratio of 2.18) to 0.771 V at 10 kW (excess-air ratio of 5.63). Low minimum-cell voltages are not unique to one operating condition: values near 0.38 V appear in the peak-power test of [20] and at isolated points of the 17.4 min record in Figure 4b, while the 0.620 V value corresponds to a steady-state point held for several minutes at an excess-air ratio of 2.18. These are observations in different operating states rather than contradictory readings of a single state; the test records available to us do not identify the exact moment at which each minimum occurred. The minimum-cell voltage is a tail statistic of the cell-voltage distribution and is sensitive to cell-to-cell non-uniformity and to the operating state rather than to the bulk stack average; local maldistribution of reactant within the stack cannot, however, be resolved from system-level measurements. In the present sweep the minimum-cell voltage falls from 0.771 V at 10 kW to 0.620 V at 80 kW as the excess-air ratio falls from 5.63 to 2.18, but current density and cathode pressure change over the same range, so these data do not isolate the effect of stoichiometry. For the same reason the 0.30 V maximum-to-minimum spread reported at altitude in [20] is not by itself evidence of steady-state degradation: attributing it to a particular operating state would require the full time series, which was not available to us. The different recorded behavior may additionally reflect differences in equipment and test conditions, whose separate contributions cannot be isolated across studies.
3.3. Thermal Behavior of the Coupled Cooling System at 2000 m
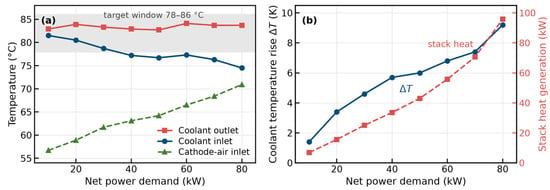
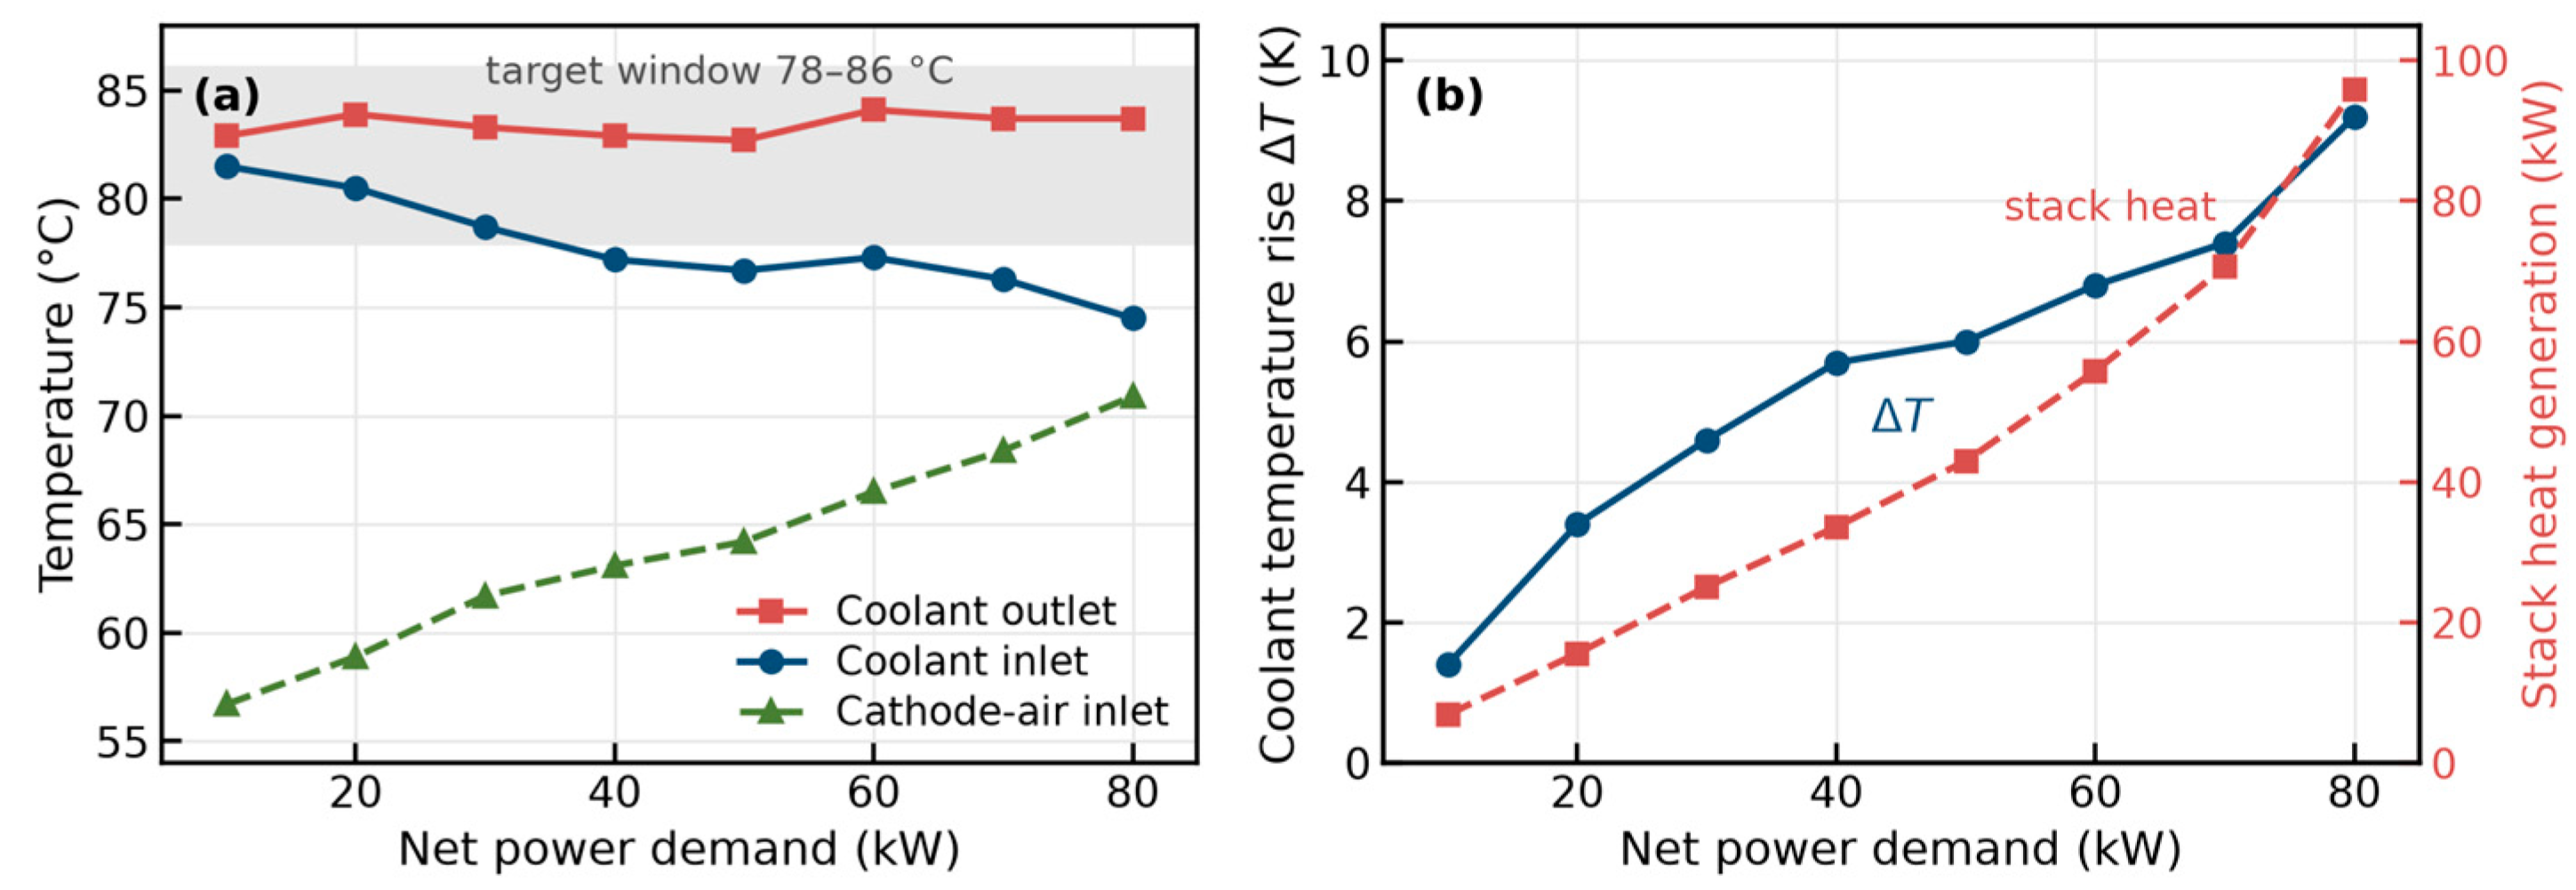
Figure 6a shows the measured coolant and cathode-air temperatures across the load range at 2000 m; these were obtained with the system’s production controller, not with the strategy proposed in Section 2.5. The coolant outlet temperature, which directly reflects the stack thermal state, stays within the 78–86 °C band adopted as the control target for the load sweeps at all operating points. This band lies within the 72–86 °C allowable stack window given in Table 1 and is the outlet-temperature setpoint used throughout the load sweeps. The observed inlet temperature decreases from 81.5 °C at 10 kW to 74.5 °C at 80 kW. The coolant temperature rise grows monotonically to 9.2 K at 80 kW (Figure 6b), close to the 10 K design limit. The stack heat generation estimated with Equation (2) reaches approximately 96 kW on the LHV basis at the 80 kW point, comparable to but slightly lower than the stack electrical output of 97.9 kW; thus, nearly half of the LHV chemical-energy input appears as estimated stack heat leaving via the coolant, exhaust and external heat losses. The corresponding HHV-based upper bound is approximately 132 kW.
Figure 6.
(a) Coolant inlet/outlet and cathode-air inlet temperatures, the gray shaded band in panel (a) indicates the 78–86 °C coolant-outlet temperature control target.and (b) coolant temperature rise and stack heat generation at 2000 m; the heat is the LHV estimate of Equation (2) evaluated with the measured cell voltage.
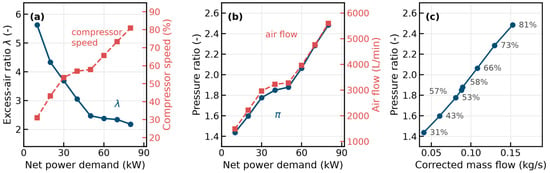
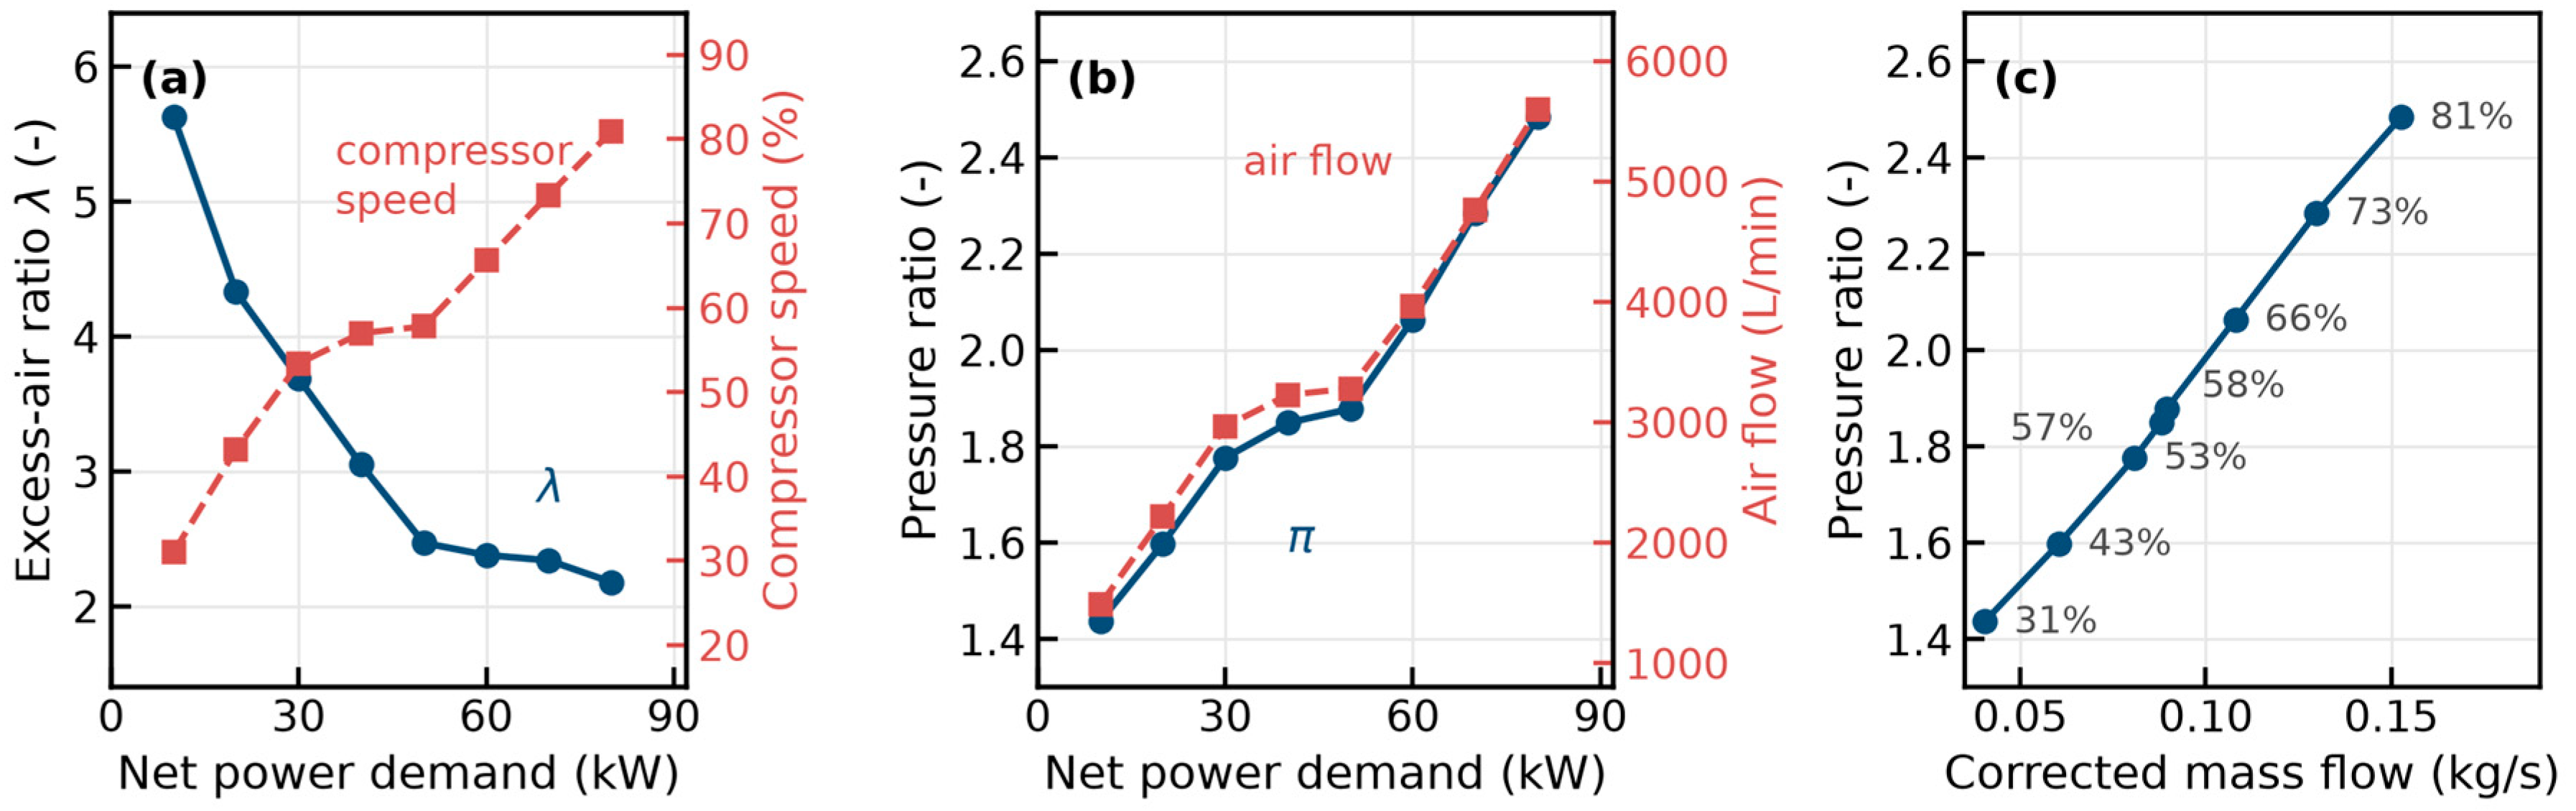
The air-path operating parameters explain how this thermal state is achieved (Figure 7). At 2000 m the recorded excess-air ratio is 2.18 at 80 kW and rises to 5.63 at 10 kW; i.e., the ratio decreases monotonically as the load increases, so that the recorded excess-air ratio is the highest at part load and the lowest at full load (2.18 as recorded); the expression “raised air-supply margins” used for Campaign B refers to the higher recorded excess-air ratios at part load, not to an increase in the stoichiometry at full load. The test sheets do not state whether the excess-air ratio is the value scheduled by the control unit or a value computed by the experimenters from the recorded air flow, and the two possibilities are not distinguished here. The recorded compressor speed ranges from 31% to 81% of its maximum and the apparent pressure ratio from 1.44 at 10 kW to 2.48 at 80 kW (Figure 7b). Reference [20] reports operation close to surge at altitude; the present data do not establish the surge margin of the Campaign B operating point, and the apparent pressure ratio of panel (b) is not a position on the manufacturer (Manufacturer, City, Country) ’s map; the operating line of Figure 7c alone cannot establish the surge margin, because the manufacturer’s surge and speed lines are not available. The operating points reconstructed from the records are plotted in Figure 7c against the corrected mass flow, with the shaft speed annotated. Two definitions have to be stated before panels (b) and (c) are read. First, the ordinate is not the compressor total-to-total pressure ratio used in a manufacturer’s map: it is the system-level apparent pressure ratio, the cathode-inlet pressure divided by the ambient pressure (Section 3.4); it therefore excludes the intercooler and duct losses. Second, the test sheets give the air flow in L/min without stating its reference state, so the mass flow is not a directly measured quantity. The interpretation that reproduces panel (c) is that these are standard-state volumes at 0 °C and 101.3 kPa. The test sheets do not document the reference state of the meter, so this is an inference from the agreement between the panels rather than a recorded convention. Under this assumed standard-state convention, the mass flow is calculated as follows, the mass flow is ṁ = ρ_std·Q_v, with ρ_std = 1.292 kg/m3, and it is corrected to 288 K and 101.3 kPa using the reported ambient pressure and the assumed inlet temperature as ṁ_corr = ṁ·(T/T_ref)^0.5/(p/p_ref), with both pressures absolute and both temperatures in kelvin. For example, the 5600 L/min recorded at the highest load, with the representative inlet temperature of 15 °C adopted in Section 2.2 (the compressor-inlet temperature at that point is not separately logged), corresponds to 0.121 kg/s at standard density and to a corrected mass flow of 0.15 kg/s at the 80.1 kPa inlet, which is the highest point of panel (c). Treating the same reading instead as an inlet-state volume would give about 25% less and would not reproduce the panel. Because the reference state is not documented, panel (c) is a conditional reconstruction: it is consistent with the figure and with the stated interpretation, but it does not establish what the meter actually reported. Panel (c) is therefore an operating line derived under that stated convention, not a measured compressor map. The manufacturer’s compressor map is proprietary and could not be reproduced, so no point of panel (c) is claimed to lie at a specific position on it. The compressed air enters the stack at up to 70.9 °C despite intercooling. This is below the recorded coolant inlet (74.5 °C) and outlet (83.7 °C) temperatures at the same load point, so the cathode-inlet temperature does not by itself reduce the heat-rejection temperature difference, which is set by the coolant and ambient-air temperatures. The cathode-inlet temperature does affect the sensible-heat exchange of the reactant gas, but its net effect on the system heat balance would require the gas flow rate, humidity and outlet state, and it is not separated here.
Figure 7.
(a) Excess-air ratio and compressor speed, (b) system-level apparent pressure ratio (cathode-inlet pressure over ambient pressure) and air flow rate versus net power demand at 2000 m (Campaign B), and (c) the operating points reconstructed from the records in the plane of apparent pressure ratio against corrected mass flow, with the shaft speed annotated. The mass flow is derived from the recorded L/min and corrected to 101.3 kPa and 288 K under the assumption stated in the text, not measured directly; the ordinate of panels (b,c), labeled “pressure ratio” in the figure, is this system-level apparent ratio, which excludes intercooler and duct losses. The sampled net-power setpoints were 10–80 kW. The manufacturer’s compressor map is proprietary, so panel (c) shows a conditional reconstruction of the operating line under the standard-state interpretation stated in the text, not a measured operating line and not a position on that map.
The cooling loop met the outlet-temperature target at 2000 m with a coolant-pump speed of 75.6% at the 80 kW net operating point (Table 4), a speed-command margin of 24.4 percentage points, which is only the unused command range and not a quarter of the remaining hydraulic or thermal capacity; the coolant temperature rise of 9.2 K stayed within the 10 K design limit. The supplied test sheet records neither the radiator-fan speed nor the coolant volumetric flow, and it contains no matching sea-level thermal load sweep; the remaining fan-speed reserve and the change in cooling actuation between sites therefore cannot be quantified. The altitude-adaptive control law in Section 2.5 is a model-based proposal that remains to be tested with recorded fan and coolant-flow data.
Table 4.
Measured and estimated thermal operating quantities at approximately 80 kW net output in Kunming (Campaign B). Stack heat generation is calculated on the LHV basis; fan speed was not recorded.
3.4. Bounded Scenario at 4000 m
The air-side demand at 4000 m can be stated without reference to a stack model. Maintaining, at that altitude, the cathode-inlet pressure recorded at the 80 kW point of Campaign B (198.9 kPa absolute) gives 198.9/61.6 = 3.23. This is a system-level apparent pressure-rise ratio and an idealized lower bound, because intercooler and duct losses are neglected; the actual compressor requirement would be higher. It is also 30% above the 2.48 reached at 2000 m with the compressor already at 81% of its maximum speed (Figure 7c). That ratio was not verified in these tests: whether the installed compressor can deliver 3.23 must be established from the manufacturer’s map or from dedicated tests. Delivering the required air mass flow at 4000 m may require a higher compressor speed or a different operating point; the resulting pressure ratio, flow capability and surge margin must be established from the manufacturer’s map or from dedicated tests. Independently of the air supply, the idealized air-side coefficient of the radiator falls to 72.5% of its sea-level value at 4000 m (Section 3.5). Whether the air-supply capability and the heat-rejection capacity would each be sufficient at that altitude must therefore be evaluated separately before any control adaptation or hardware reinforcement is decided, and no stack-power prediction for 4000 m is reported here, because neither the compressor capability nor the stack behavior at that altitude has been measured.
3.5. Altitude-Adaptive Compensation: Benefit and Cost
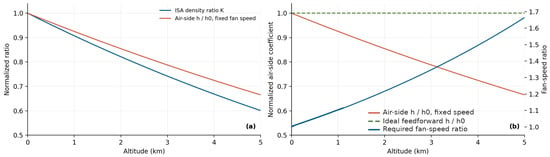
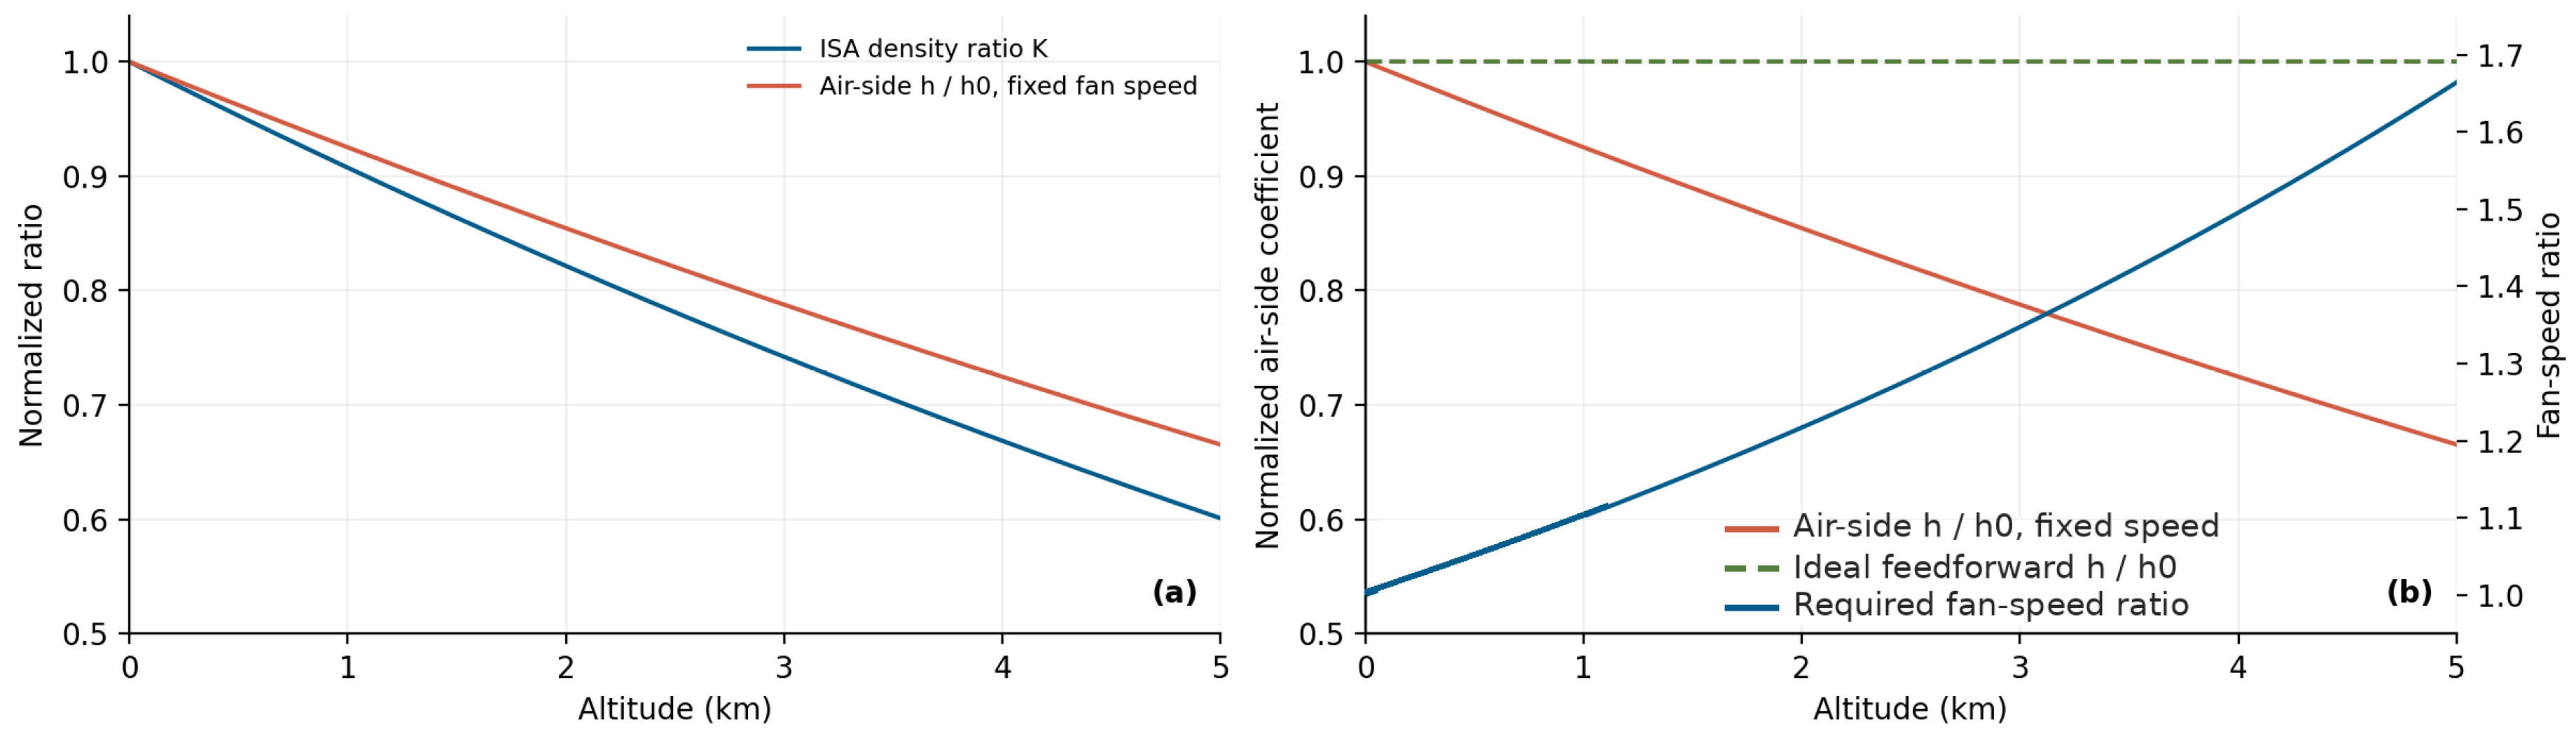
Figure 8a plots the relative air density and the resulting air-side heat-transfer coefficient against altitude according to Equations (4) and (5). The altitude sweep in Figure 8 is evaluated under ISA conditions; the site-specific Kunming density ratio (K ≈ 0.79) is reported separately in Section 2.4. Without compensation, the idealized normalized air-side heat-transfer coefficient falls to 92.5%, 85.4%, 78.8% and 72.5% of the sea-level value at 1000, 2000, 3000 and 4000 m, respectively. Figure 8b shows the effect of the proposed feedforward law of Equation (6): raising the fan speed inversely with K(z)—by 10% at 1000 m, 22% at 2000 m, 35% at 3000 m and 50% at 4000 m—restores the modeled air-side coefficient to its sea-level value if the required speed is attainable, because the air mass flux, and hence h, is brought back to its sea-level value. The proposed scaling is selected to compensate the first-order reduction in radiator air-side mass flux rather than to maximize fan efficiency. No measured fan map, fan-speed reserve, or full-radiator heat balance is available to infer an operating-temperature guarantee from this scaling alone. The proposed feedforward law requires further experimental validation.
Figure 8.
(a) ISA density ratio and idealized air-side heat-transfer coefficient at fixed fan speed; (b) fixed-speed coefficient, ideal inverse-density fan-speed requirement, and the resulting idealized compensated coefficient. These curves do not quantify full-radiator heat rejection or hardware-feasible fan operation.
The benefit carries a parasitic cost: by the fan affinity laws, the fan power scales with the density and the cube of the speed, , so fan consumption grows by a factor of about 1.5 at 2000 m and 2.2 at 4000 m; cooling-system control studies likewise identify the radiator fan as the dominant cooling parasitic cost source [35]. The absolute additional consumption cannot be evaluated here, because the installed fan power was not measured; expressed as a ratio, the fan power would rise by the factors given above, which for an 80 kW class system is not negligible but cannot be converted into kW without that measurement. The altitude at which the existing fan reaches its limit cannot be determined without the fan map and the installed speed reserve; hardware reinforcement such as enlarged radiator area or revised air handling should be evaluated against those measured limits [3]. The proposed supervisory logic of Section 2.5 includes an over-temperature derating mode; it has not been demonstrated on the tested hardware.
The three compensation routes available to a system integrator are compared by physical target and normalized requirement in Table 5, not by a common cost basis. Restoring the air-side coefficient by fan speed alone requires n/n0 = 1/K(z) (Equation (6)) and, through the density-corrected affinity law, P/P0 = 1/K(z)2, i.e., +48% fan power at 2000 m and +123% at 4000 m. These are normalized ratios; the absolute fan power cannot be given, because the installed fan consumption was not measured. Restoring the same air-side conductance hA by heat-exchange area alone requires A/A0 = 1/[h(z)/h0] = K(z)−0·8, i.e., +17% core area at 2000 m and +38% at 4000 m, under the idealized assumption that the air-side coefficient is unchanged by the new core geometry; this carries the corresponding mass, package-volume and cost penalties, while its effect on fan power cannot be quantified without the resistance of the revised core and the resulting fan operating point. Neither route addresses the air-supply limitation: at 4000 m the pressure ratio that would restore the cathode-inlet pressure recorded at the 80 kW point is 3.23, whereas the highest apparent pressure ratio recorded in the tests is 2.48, so the capability of the compressor at 3.23 is unverified; if the installed compressor cannot deliver that ratio, the air-supply system would have to be reconsidered, and a further compression stage is one of the candidates, together with a different compressor, a revised operating point or a reduced output target. The three routes differ in kind rather than in a cost that could be ranked from the present data: the fan route needs no hardware change but is bounded by the fan map, the motor rating and noise; the sizing route also raises the steady-state thermal limit, but at the cost of mass, volume and cost, and the fan operating point changes with the new core; and of the three routes considered, an additional compression stage is the one that addresses the air-supply pressure requirement; its effectiveness and implementation complexity remain to be evaluated. Which route is preferable therefore depends on the fan reserve, the package volume and cost data that were not available to this study. The proposed logic of Section 2.5 corresponds to the first route and is bounded by the installed fan map, which must be measured before deployment.
Table 5.
Comparison of the three routes available to a system integrator. The first two restore the air-side heat-transfer capacity of the radiator by different means; the third does not restore that capacity and instead addresses the air-supply limitation, so the three are not equivalent in target and are not ranked by cost. The fan route corresponds to the control strategy of Section 2.5. The fan speed and fan power follow from the fan affinity laws, the area ratio from the idealized hA relation of Section 3.5, and the pressure ratio from the 4000 m requirement; all are normalized ratios, because neither the installed fan power nor the installed air-side flow was measured.
3.6. Comparison with Previous Studies and Limitations
The 10.6% stack-power loss measured here at 2000 m is consistent with the 8% loss reported by Hordé et al. [7] at 2200 m for a smaller stack at high stoichiometry; the operating points and stack designs differ. Studies of air-cooled PEMFCs [11] address additional operating-condition dependencies and do not provide a directly matched numerical comparison. The novelty of the present work lies less in the degradation values themselves than in (i) the quantitative characterization of the thermal load and cooling response of a commercial-scale liquid-cooled system at altitude and (ii) the model-based indication that feedforward control based on ambient pressure and temperature sensing can potentially compensate for the air-side degradation of the radiator over the investigated 0–5000 m range. Four limitations qualify these findings. First, the 4000 m results are bounded scenarios derived from the air supply and from the idealized air-side coefficient of the radiator; they remain to be validated in an altitude-simulation chamber, and the stack behavior at that altitude has not been measured. Second, the compensation analysis assumes ideal fan behavior; the actual achievable speed ratio is bounded by the fan map, noise constraints and motor rating, which will be addressed in the ongoing hardware-in-the-loop campaign. Third, the two-site comparison cannot fully separate the altitude effect from the accompanying differences in ambient temperature and humidity, and the datasets lack repeatability statistics: the reported quantities include sampled steady-state values, recorded maxima and transient metrics, as specified in the corresponding sections. The sensor accuracy, sampling rates and repeatability of the two test benches were not documented in the datasets available to us, and the reference state of the volumetric-flow record behind Figure 7 is likewise undocumented, so no uncertainty budget can be attached to the reported values, and the robustness of the conclusions to measurement uncertainty cannot be quantified here; replicated measurements with sensor-level uncertainty quantification are planned as part of the altitude-chamber validation. Fourth, no electrochemical impedance spectroscopy was available on the installed system, so the activation, ohmic and mass-transport contributions to the altitude penalty cannot be separated experimentally, and impedance measurements at both sites are planned. Such a decomposition would also allow for the heat-generation partition among catalyst, membrane and cell hardware to be checked against the lumped energy balance of Equation (2).
4. Conclusions
This work experimentally characterized the electrical performance of a commercial 80 kW class liquid-cooled PEMFC system at two sites and its thermal-management operation in Kunming and modeled the altitude sensitivity of the radiator air side together with an altitude-adaptive liquid–air-cooling compensation framework. The main conclusions are as follows.
(1) Between the end points of the steady-state current sweeps, the highest recorded stack power decreases by 10.6% (93.98 kW to 84.0 kW), and the largest reported net-power values in the rated tests differ by 12.2% (82 kW to 72 kW); under a different air-supply calibration (Campaign B), the stack reached 97.9 kW and the system 80 kW net at 2000 m at a sampled operating point, although the available records do not separate the effect of that calibration from that of the current limit applied; the Kunming high-power test ended after 17.4 min because the remaining hydrogen inventory was insufficient to continue the test, with the hydrogen supply to the stack being normal up to shutdown, so that 60 min continuous capability is not established at the plateau site. The average load-up time increased by 33%, and the unloading time decreased by 20%. Interpolated onto a common current grid, the measured polarization curves are lower at 2000 m by 4.1–6.4% over most of the range and by 9.6% at the 365 A end point, and the Campaign A sweep ended at 365 A.
(2) The total parasitic share of the stack power (BoP auxiliaries plus DC/DC conversion loss) rises from 9.2% to 18.2% across the load range at 2000 m, while the individual auxiliary contributions remain unquantified in the present load sweep; the apparent pressure ratio reaches 2.48 at the highest load. The recorded minimum-cell voltage ranged from 0.771 V at 10 kW (excess-air ratio of 5.63) to 0.620 V at 80 kW (excess-air ratio of 2.18), with a main-board cell-voltage standard deviation of at most 6.2 mV, while increased air supply can add to compressor electrical demand and heat load.
(3) The coupled liquid–air-cooling system keeps the coolant outlet temperature within the 78–86 °C window over the full load range at 2000 m, with a maximum coolant temperature rise of 9.2 K against an estimated heat generation of ~96 kW (LHV basis; ~132 kW on the HHV basis) at 80 kW net output; the coolant-pump speed reaches 75.6%, while fan-speed reserve and further-altitude thermal margins remain unmeasured.
(4) The thermal-resistance analysis identifies the radiator air side as an altitude-sensitive link, its heat-transfer coefficient falling to 72.5% of the sea-level value at 4000 m. The proposed feedforward law—fan speed inversely proportional to the air-density ratio K(z), trimmed by coolant-temperature feedback—recovers the modeled air-side coefficient if the idealized fan-speed scaling remains feasible, at a fan-power cost that follows the density-corrected fan affinity law, P/P0 ≈ 1/K(z)2 (~1.5× at 2000 m, ~2.2× at 4000 m). These are normalized ratios, because the installed fan power was not measured. Restoring the same air-side performance by radiator area alone would require +17% and +38% of core area, and the apparent pressure ratio needed at 4000 m (3.23) is 30% above the highest value recorded in the tests (2.48), so whether air supply or cooling reinforcement is the binding constraint at that altitude cannot be decided without the compressor map and the fan power.
Practically, a hardware-feasible operating envelope must be established from the fan map, motor limit, coolant-flow capacity, and full heat balance; the available data do not support a numerical 2500–3000 m control-only cutoff. Future work will validate the 4000 m air-supply and heat-rejection requirements in an altitude-simulation chamber, extend the strategy toward predictive, model-based thermal control using real-time altitude and load-preview information, and conduct hardware-in-the-loop validation of the proposed feedforward–feedback compensation framework before on-engine deployment.
Author Contributions
Conceptualization, S.H. and G.W.; methodology, S.H. and J.Z.; validation, J.L.; formal analysis, S.H. and Y.L. (Yi Liu); investigation, S.H.; resources, J.Z. and J.L.; data curation, S.H. and Y.L. (Ying Li); writing—original draft preparation, S.H.; writing—review and editing, G.W.; supervision, G.W.; funding acquisition, G.W. All authors have read and agreed to the published version of the manuscript.
Funding
This research was funded by the Yunnan Provincial Major Science and Technology Special Project, grant number 202402AG050005.
Institutional Review Board Statement
Not applicable.
Informed Consent Statement
Not applicable.
Data Availability Statement
The data supporting the figures and tables are available from the corresponding author upon reasonable request. Data processing and figure preparation were performed in Python (version 3.10; Python Software Foundation, Wilmington, DE, USA).
Conflicts of Interest
The authors declare no conflicts of interest.Employment and Company InvolvementAuthors Jie Zhou and Julong Liu are test engineers employed by Kunming Yunnei Power Co., Ltd. (Kunming, China). The experiments reported in this study were performed by these two authors in their capacity as company test engineers, using the company's test facilities. The company did not provide any funding for this study. The company did not participate in data interpretation, the writing of the manuscript, or the decision to submit the article for publication, and no company representative reviewed or approved the manuscript prior to submission. The authors declare that they have no known competing financial interests or personal relationships that could have appeared to influence the work reported in this paper. The employment relationship described above is fully disclosed and did not influence the design, execution, analysis, or reporting of this study. All authors have read and approved the final manuscript and agree with its submission to Energies.
Nomenclature
| Symbol | Description | Unit |
| A | Active area; heat-transfer area | cm2, m2 |
| h | Convective heat-transfer coefficient | W/(m2·K) |
| h_air | Air-side convective coefficient of the radiator | W/(m2·K) |
| I | Stack current | A |
| K(z) | Air-density ratio relative to sea level | – |
| z | Altitude | m |
| ṁ_air | Air mass flow | kg/s |
| W_comp | Compressor power | W |
| T1 | Compressor inlet temperature | K |
| η_is | Isentropic efficiency of the compressor | – |
| n_fan, n_fan,0 | Fan speed and its sea-level reference | rpm, % |
| Q_gen | Stack heat generation, Equation (2) | W in Equation (2); reported in kW |
| P_BoP | Balance-of-plant power | kW |
| P_DC/DC,loss | Converter loss | kW |
| P_stack | Stack gross power | kW |
| η_par | Parasitic share of the stack power | – |
| k | Ratio of specific heats of air (1.4) | – |
| N | Number of cells in series (370) | – |
| P, P0 | Power; sea-level reference value | kW, W |
| p | Pressure | kPa, atm |
| Q | Heat flow rate (stack heat generation, heat rejection) | W in Equation (3); reported in kW |
| R_air | Specific gas constant of air (287) | J/(kg·K) |
| R_total | Total thermal resistance of the heat-rejection chain | K/W |
| R_th,cond, R_th,liq, R_th,air | Conduction, liquid-side and air-side thermal resistance terms | K/W |
| T | Temperature | K, °C |
| T_stack | Stack temperature | °C |
| T_amb | Ambient temperature | °C |
| V_cell | Single-cell voltage | V |
| w_is | Isentropic specific compression work | J/kg |
| ΔT | Coolant temperature rise | K |
| η | Efficiency | – |
| π | Compressor pressure ratio in Equation (1); system-level apparent pressure ratio (cathode-inlet over ambient) in Figure 7 | – |
| ρ, ρ0 | Air density; sea-level reference density (1.225) | kg/m3 |
| BoP | Balance of plant (all auxiliary consumers) | – |
| DC/DC | Converter between the stack and the high-voltage bus | – |
| EIS | Electrochemical impedance spectroscopy | – |
| FCCU | Fuel-cell control unit | – |
| HHV/LHV | Higher/lower heating value | – |
| ISA | International Standard Atmosphere | – |
| PTC | Positive temperature coefficient (heater) | – |
| ṁ | Mass flow derived from the reported volumetric-flow record (Section 3.3) | kg/s |
| ṁ_corr | Corrected mass flow (Figure 7c) | kg/s |
| Q_v | Volumetric air flowrate reported in the test sheet; reference state not documented | L/min, m3/s |
| ρ_std | Air density at the assumed standard state (0 °C, 101.3 kPa) | kg/m3 |
| T_ref, p_ref | Reference temperature and pressure of the flow correction (288 K, 101.3 kPa) | K, kPa |
| Subscripts | 0, sea level; cell, per cell; in/out, inlet/outlet; air, air-side | – |
References
- Chen, Q.; Zhang, G.; Zhang, X.; Sun, C.; Jiao, K.; Wang, Y. Thermal management of polymer electrolyte membrane fuel cells: A review of cooling methods, material properties, and durability. Appl. Energy 2021, 286, 116496. [Google Scholar] [CrossRef] [Scilit]
- Olabi, A.G.; Wilberforce, T.; Abdelkareem, M.A. Fuel cell application in the automotive industry and future perspective. Energy 2021, 214, 118955. [Google Scholar] [CrossRef] [Scilit]
- Ma, T.C.; Xu, Z.S.; Liu, W.; Qi, J.X.; Gu, Z.H.; Li, R.T.; Lin, W.K.; Li, C.J. Energy recovery and efficiency improvement method of proton exchange membrane fuel cell system by applying the expander in plateau environment. J. Power Sources 2024, 613, 234903. [Google Scholar] [CrossRef] [Scilit]
- Luo, Y.; Jiao, K. Cold start of proton exchange membrane fuel cell. Prog. Energy Combust. Sci. 2018, 64, 29–61. [Google Scholar] [CrossRef] [Scilit]
- Wang, H.L.; Feng, J.X.; Li, L.Y.; Tu, Z.K.; Zhou, B.; Wang, G.Q.; Xu, Q.S.; Xu, J.P.; Gao, J.H. Study on environmental adaptability of metal plate fuel cell. J. Phys. Conf. Ser. 2021, 2108, 012084. [Google Scholar] [CrossRef] [Scilit]
- Wang, B.; Zhao, D.; Li, W.X.; Wang, Z.Y.; Huang, Y.; You, Y.C.; Becker, S. Current technologies and challenges of applying fuel cell hybrid propulsion systems in unmanned aerial vehicles. Prog. Aerosp. Sci. 2020, 116, 100620. [Google Scholar] [CrossRef] [Scilit]
- Hordé, T.; Achard, P.; Metkemeijer, R. PEMFC application for aviation: Experimental and numerical study of sensitivity to altitude. Int. J. Hydrogen Energy 2012, 37, 10818–10829. [Google Scholar] [CrossRef] [Scilit]
- González-Espasandín, Ó.; Leo, T.J.; Raso, M.A.; Navarro, E. Direct methanol fuel cell (DMFC) and H2 proton exchange membrane fuel (PEMFC/H2) cell performance under atmospheric flight conditions of unmanned aerial vehicles. Renew. Energy 2019, 130, 762–773. [Google Scholar] [CrossRef] [Scilit]
- Pratt, J.; Brouwer, J.; Samuelsen, G. Experimental performance of an air-breathing PEM fuel cell at high altitude conditions. In Proceedings of the 43rd AIAA Aerospace Sciences Meeting and Exhibit, Reno, NV, USA, 10–13 January 2005. AIAA Paper 2005-953. [Google Scholar] [CrossRef] [Scilit]
- Shi, Q.Q.; Liu, H.B.; Qin, J.; Liu, H.D.; Shen, Y.L.; Xie, J.L. Performance analysis of air-cooled proton exchange membrane fuel cell at high altitude environment. Acta Energiae Solaris Sin. 2025, 46, 345–352. [Google Scholar] [CrossRef]
- Miao, Y.H.; Xing, L.; Cheng, W.J.; Ni, H.Y.; Tu, Z.K. Study on the operating characteristics of air-cooled PEMFC in high-altitude areas. Chin. J. Power Sources 2021, 45, 1023–1026. [Google Scholar] [CrossRef]
- Zhou, K.; Liu, Z.; Zhang, X.; Liu, H.; Meng, N.; Bai, H.F.; Huang, J.M.; Qi, M.J.; Song, X.Z.; Yan, X.J. Effect of the high oxygen excess ratio design on the performance of air-cooling polymer electrolyte membrane fuel cells for unmanned aerial vehicles. J. Power Sources 2023, 571, 233082. [Google Scholar] [CrossRef] [Scilit]
- Haraldsson, K.; Alvfors, P. Effects of ambient conditions on fuel cell vehicle performance. J. Power Sources 2005, 145, 298–306. [Google Scholar] [CrossRef] [Scilit]
- Saleh, I.; Ali, R.; Zhang, H. Environmental impact of high altitudes on the operation of PEM fuel cell based UAS. Energy Power Eng. 2018, 10, 87–105. [Google Scholar] [CrossRef]
- Willich, C.; Frank, D.; Graf, T.; Wazlawik, S.; Brandao, S.; Bauer, C. High-altitude operation of a commercial 100 kW PEM fuel cell system. Energies 2024, 17, 6309. [Google Scholar] [CrossRef] [Scilit]
- Graf, T.; Fonk, R.; Paessler, S.; Kallo, J.; Bauer, C.; Willich, C. Low pressure influence on a direct fuel cell battery hybrid system for aviation. Int. J. Hydrogen Energy 2024, 50, 672–681. [Google Scholar] [CrossRef] [Scilit]
- Li, M.Y.; Zhu, X.L.; Shi, M.J.; Jia, B.J.; Zhao, X.J.; Pan, F.W. Simulation analysis of the effect of variable altitude environment on fuel cell performance. Automot. Eng. 2025, 47, 2141–2149. [Google Scholar] [CrossRef]
- Chen, J.Z.; He, H.W.; Yue, H.W. A review of plateau environmental adaptation for proton exchange membrane fuel cells. Int. J. Hydrogen Energy 2024, 50, 744–764. [Google Scholar] [CrossRef] [Scilit]
- Wang, Y.M.; Chen, W.R.; Li, Q.; Han, Y.; Guo, A.; Wang, T.H. Coordinated optimal power distribution strategy based on maximum efficiency range of multi-stack fuel cell system for high altitude. Int. J. Hydrogen Energy 2024, 50, 374–387. [Google Scholar] [CrossRef] [Scilit]
- He, S.C.; Chen, M.L.; Liu, E.J.; Lei, J.L.; Zhou, J.; Liu, Y. The high-altitude performance of high-power hydrogen fuel cells. Chin. Intern. Combust. Engine Eng. 2026, 47, 28–36. [Google Scholar] [CrossRef]
- Piqueras, P.; de la Morena, J.; Sanchis, E.J.; Saadouni, I. An analysis of the altitude impact on Roots compressor operation for a fuel cell system. Appl. Sci. 2025, 15, 5513. [Google Scholar] [CrossRef] [Scilit]
- Zhang, G.; Kandlikar, S.G. A critical review of cooling techniques in proton exchange membrane fuel cell stacks. Int. J. Hydrogen Energy 2012, 37, 2412–2429. [Google Scholar] [CrossRef] [Scilit]
- Huang, Y.; Xiao, X.; Kang, H.; Lv, R.; Zeng, R.; Shen, J. Thermal management of polymer electrolyte membrane fuel cells: A critical review of heat transfer mechanisms, cooling approaches, and advanced cooling techniques analysis. Energy Convers. Manag. 2022, 254, 115221. [Google Scholar] [CrossRef] [Scilit]
- O’Hayre, R.; Cha, S.W.; Colella, W.; Prinz, F.B. Fuel Cell Fundamentals, 3rd ed.; John Wiley & Sons: Hoboken, NJ, USA, 2016. [Google Scholar] [CrossRef] [Scilit]
- Baroutaji, A.; Wilberforce, T.; Ramadan, M.; Olabi, A.G. Comprehensive investigation on hydrogen and fuel cell technology in the aviation and aerospace sectors. Renew. Sustain. Energy Rev. 2019, 106, 31–40. [Google Scholar] [CrossRef] [Scilit]
- Yang, H. Research on Thermal Management Strategies for Fuel Cells in Buses in Plateau Areas. Master’s Thesis, Guizhou University, Guiyang, China, 2024. [Google Scholar]
- Wu, J.Y. Research on Control Strategies for Fuel Cell Bus Air Supply Systems in Plateau Areas. Master’s Thesis, Guizhou University, Guiyang, China, 2024. [Google Scholar]
- Liu, Z.; Chen, J.; Kumar, L.; Jin, L.; Huang, L. Model-based decoupling control for the thermal management system of proton exchange membrane fuel cells. Int. J. Hydrogen Energy 2023, 48, 19196–19206. [Google Scholar] [CrossRef] [Scilit]
- Yu, Y.; Chen, M.; Zaman, S.; Xing, S.; Wang, M.; Wang, H.J. Thermal management system for liquid-cooling PEMFC stack: From primary configuration to system control strategy. eTransportation 2022, 12, 100165. [Google Scholar] [CrossRef] [Scilit]
- Wang, J.H.; Wen, M.; Yang, L. Research on the adaptability of vehicle fuel cell systems in plateau environments. Auto Manuf. Eng. 2024, 10, 15–18. [Google Scholar] [CrossRef]
- GB/T 24554-2022; Performance Test Methods for Fuel Cell System. Standards Press of China: Beijing, China, 2022.
- Pukrushpan, J.T.; Stefanopoulou, A.G.; Peng, H. Control of Fuel Cell Power Systems: Principles, Modeling, Analysis and Feedback Design; Springer: London, UK, 2004. [Google Scholar] [CrossRef] [Scilit]
- Incropera, F.P.; DeWitt, D.P.; Bergman, T.L.; Lavine, A.S. Fundamentals of Heat and Mass Transfer, 7th ed.; John Wiley & Sons: Hoboken, NJ, USA, 2011. [Google Scholar]
- Standard’s ISO 2533:1975; Standard Atmosphere the Reference Numbering and In-Text Citations Should Be Updated Accordingly. ISO: Geneva, Switzerland, 1975.
- Han, J.; Park, J.; Yu, S. Control strategy of cooling system for the optimization of parasitic power of automotive fuel cell system. Int. J. Hydrogen Energy 2015, 40, 13549–13557. [Google Scholar] [CrossRef] [Scilit]

Disclaimer/Publisher’s Note: The statements, opinions and data contained in all publications are solely those of the individual author(s) and contributor(s) and not of MDPI and/or the editor(s). MDPI and/or the editor(s) disclaim responsibility for any injury to people or property resulting from any ideas, methods, instructions or products referred to in the content. |
© 2026 by the authors. Licensee MDPI, Basel, Switzerland. This article is an open access article distributed under the terms and conditions of the Creative Commons Attribution (CC BY) license.