


Abstract
The transition to low-carbon energy systems depends on national innovation systems generating climate mitigation technologies. This study examines how environmental policy stringency and trade openness shape green patenting (IPC/CPC class Y02), using a balanced panel of 40 economies (25 OECD, 15 emerging, including BRIICS) observed from 1990 to 2020, combining OECD and World Bank indicators. The country and year fixed-effects panel models and PPML estimate the determinants of green patenting, complemented by convergence tests on green specialization. The GDP per capita is the most robust predictor. Policy stringency is positively associated with green patenting under pooled and fixed-effects models but not once the year effects absorb the post-2005 clean patent boom; PPML recovers significance when total patenting is entered as a covariate but not as an offset, while EPS remains significant under linear green-share and Revealed Technological Advantage specifications. The EPS–trade openness interaction is negative and significant, suggesting trade moderates the domestic innovation response to regulation, especially in closed economies. A beta-convergence analysis reveals convergence in green specialization over 2000–2020, at a similar speed across groups, though concentrated during 2000–2010 with no separate significance for 2010–2020. While the absolute patenting gap remains wide, the relative composition of patent portfolios is converging, with implications for energy, environmental, and trade policy design.
1. Introduction
The transition to a low-carbon economy depends, to a large extent, on the capacity of national innovation systems to generate and diffuse clean technologies. Patents in climate change mitigation technologies, classified under the joint IPC/CPC scheme as class Y02 (“technologies or applications for mitigation or adaptation against climate change”), are the most widely used indicator in the environmental innovation economics literature to approximate this process, since they capture inventions with effective legal protection in renewable energy, energy efficiency, clean transport, carbon capture and storage, and waste management, among other domains. A substantial share of these technologies pertains directly to energy systems, spanning renewable power generation, energy storage, smart grids, and energy efficiency, which places green patenting at the core of the broader energy transition, that is, the shift from fossil fuel-based to low-carbon energy systems, a process that historical evidence shows as unfolding over decades and that is shaped jointly by relative prices, technology performance, and public policy [1,2,3].
Two structural forces have dominated the academic and policy debates on the determinants of these inventions. The first is the stringency of domestic environmental regulation, whose effect on innovation has been the subject of the so-called Porter hypothesis [4]: stricter environmental standards can induce compensatory innovation that simultaneously improves environmental performance and firm competitiveness, in line with the broader literature on innovation induced by regulation and relative prices [5]. Early large-sample panel evidence found only a weak link between compliance costs and patenting [6], and subsequent reviews have distinguished several versions of the hypothesis, ranging from a weak form, under which regulation induces innovation, to a strong form, under which regulation also improves competitiveness, with empirical support concentrated on the weaker forms [7,8,9]. A complementary theoretical strand has modeled environmental policy as one of several forces, alongside market size and the relative price of clean and dirty inputs, that direct the rate and bias of technical change [10,11,12].
The second structural force is trade openness, whose role is ambivalent. Trade can act as a channel for the international diffusion of clean technology, allowing firms to adopt foreign innovations rather than develop them domestically [13,14], and economies that combine environmental regulation with innovative capacity have been found to export relatively more in green product categories [15]. Alternatively, trade can facilitate the relocation of pollution-intensive industries toward jurisdictions with laxer regulations, the so-called pollution haven hypothesis [16,17], although the cross-country evidence on trade and pollution outcomes is mixed and sensitive to how the scale, composition, and technique effects are separated [18]. The net effect of trade openness on domestic patenting in clean technologies is therefore ambiguous a priori.
A large empirical literature, recently synthesized through main path citation analysis [19] and a decade-long review [20], documents a broadly positive association between policy stringency and green innovation, measured through patents at both the firm level [21] and the country level, in domains ranging from renewable energy [22,23] to environmental taxation [24], although the reported magnitudes vary substantially with the policy instrument, sector, and lag structure considered, and the choice of policy instrument itself shapes cost-effectiveness [25]. Patent-based indicators, built on the OECD’s methodology for identifying environment-related technologies [26], which underlies the Y02 classification used in this study, have become the standard empirical proxy in this literature given their availability, international comparability, and correspondence to legally protected inventions [27].
A separate but related literature applies the concepts of beta convergence (economies with lower initial levels grow faster) and sigma convergence (cross-country dispersion narrows over time), originally developed for income convergence [28], to the technological domain, asking whether emerging economies are closing the green innovation capability gap relative to developed economies. This study applies both concepts to each country’s share of Y02 patents in its total patent portfolio, an index of technological specialization analogous to the Revealed Technological Advantage measure proposed by Soete [29], evaluating whether this specialization converges across country groups. Recent work has likewise emphasized the moderating role that trade and technology variables play in shaping environmental outcomes across heterogeneous groups of economies [30], reinforcing the relevance of jointly considering regulatory and trade channels rather than treating them in isolation.
This article contributes quantitative empirical evidence to this debate by combining three public data sources from the OECD (environmental patents and environmental policy stringency) and the World Bank (trade and macroeconomic indicators), in a balanced panel of 40 countries spanning three decades (1990–2020). Relative to prior country-level studies, which have typically examined either the regulation–innovation link or technological convergence in isolation, this study’s contribution is to estimate both within a single harmonized panel and to test explicitly whether their interaction with trade openness, and heterogeneity between country groups, shapes the pattern of green technological specialization, rather than relying on average effects alone. The analysis pursues two objectives. The first is to estimate the association between environmental policy stringency and trade openness, including their interaction, and the generation of Y02 patents, using fixed-effects panel methods and a Poisson pseudo-maximum likelihood estimator suited to the fractional count nature of patent families. The second is to characterize patterns of green technological convergence between developed and emerging economies, assessing whether the latter are closing the gap in clean energy technology specialization.
Research question: How does the stringency of environmental policy and trade openness influence the generation of patents oriented toward clean technologies (IPC/CPC class Y02)?
Building on this framework, four testable hypotheses are proposed.
H1.
Environmental policy stringency (EPS) is positively associated with the generation of Y02 patents, controlling for economic development and market size (the Porter hypothesis, or induced innovation).
H2.
The effect of environmental policy on green patenting depends on the economy’s degree of trade openness (an EPS-by-trade-openness interaction).
H3.
The responsiveness of green patenting to regulatory stringency differs between developed and emerging economies. This prediction is tested formally in Section 4.2 as an equality of coefficients between groups, rather than assumed a priori to hold in a particular direction.
H4.
Green technological specialization converged, in the beta and/or sigma sense, between emerging and developed economies over 2000–2020.
2. State of the Art
The direction of causality between trade and environmental policy itself remains debated. Using dynamic panel methods for OECD countries over 1990–2015, Kim and Lin [31] show that trade openness does not have a uniform effect on environmental policy stringency: trade with advanced economies is associated with looser standards, while trade with developing economies is associated with tighter ones, and the sign of the relationship further depends on a country’s baseline stringency regime. This evidence of a bidirectional, regime-dependent trade–stringency relationship reinforces, rather than substitutes for, this study’s focus on the forward channel, how a given level of policy stringency and trade openness jointly shape green patenting, and it motivates treating trade openness as an effect modifier rather than a simple additive control in the empirical strategy adopted below.
A second line of recent research refines how environmental patenting translates into realized sustainable development outcomes. Patent-based indicators, such as the OECD Y02 classification, remain the dominant proxy for inventive activity in climate change mitigation technologies [13,14,26], but Saidi, Ozturk and Hakimi [32], using a panel and method-of-moments quantile regression for 1990–2020, show that the positive association between environment-related patenting and sustainable development is strongest within the overall sample and among OECD countries, and that climate finance both directly supports sustainable development outcomes and strengthens the patenting–sustainability link. This evidence of a developed country advantage in converting green invention into sustainable development outcomes reinforces the relevance of the developed-versus-emerging-economy heterogeneity analysis conducted below.
The relationship between trade openness, growth and environmental outcomes has also been revisited with contemporary econometric and machine learning tools outside the largely OECD-weighted samples that dominate this literature. Classic contributions on trade and the environment [16,17,18,19] have been complemented by longitudinal evidence from small, trade-dependent emerging economies: for Honduras, Ramirez, Muñoz Tabora and Melgar-Dominguez [33] combined a machine learning and econometric decoupling analysis to show that CO2 emissions began to decouple from GDP growth only partially and unevenly over 1990–2023. This suggests that the pace of green structural change documented for the OECD-weighted sample used in the present study cannot be assumed to be generalizable to smaller, resource-dependent economies outside it.
On the convergence side, the classical beta- and sigma-convergence framework [28] and early work relating technological specialization to trade patterns [29] have recently been extended explicitly to environmental outcomes. Using a panel quantile regression for OECD countries over 1994–2023, Mehmood and Kaewsaeng-on [34] found that green innovation and trade openness are the two most consistent levers reducing carbon emissions across almost the entire emissions distribution, while information globalization and financial depth show smaller, quantile-dependent effects that fade at higher emissions levels. This distributional view of how green innovation and trade openness jointly shape environmental outcomes complements the single-indicator, Revealed Technological Advantage-based convergence tests conducted later in this study.
A complementary and still comparatively underexplored strand links environmental and innovation outcomes to institutional quality and governance capacity. Using a panel of 72 countries over 1996–2017 and a threshold regression design, Chen, Pinar and Román-Collado [35] show that green innovation reduces energy intensity only once a country’s institutional quality surpasses a specific threshold, so that formally similar green innovation effort can translate into very different real-world energy outcomes depending on the strength of domestic institutions. This pattern directly anticipates the governance effectiveness heterogeneity documented in Section 4.4 below, where the association between policy stringency and green patenting is detectable only in lower-governance countries, and it motivates the inclusion of institutional quality proxies as a priority direction for future extensions of the present model, as discussed in Section 5 below.
Methodologically, the present study engages with two further strands of this literature more systematically. On policy endogeneity, Belazreg, Mtar and Smondel [36] applied a system GMM estimator, designed to address the endogeneity of environmental policy stringency itself, to 25 OECD countries and found a positive effect of policy stringency on green innovation that survived this stricter identification strategy, a result that this study’s two-way fixed-effects and PPML specifications are directionally consistent with, though without the same endogeneity correction, a limitation noted in Section 5 below. On convergence methodology, Pinar [37] applied the Phillips–Sul log-t club-convergence algorithm to renewable energy innovation across 90 countries over 1993–2018 and found no single global convergence club, but two separate clubs of more and less innovative countries, a result that qualifies the simple beta-convergence findings of the kind reported in Section 4.6 below and supports club-convergence testing as a direction for future work on this panel, as discussed in Section 5 below. On the choice of dependent variable for patent-based innovation measures, Sterlacchini [38] studied the determinants of energy patent counts across 19 OECD countries using negative binomial and Poisson fixed-effects models, distinguishing between each country’s own EPS score and an EPS index averaged across all OECD countries; the OECD-average index is a robust, significant predictor of energy patenting under both count specifications, while the country-level index is weakly significant at best. The study reports, without detailed estimates, the same pattern for a robustness check using the share of energy patents in each country’s total patent applications—the same dependent-variable strategy adopted later in this study (Section 4.2)—with the OECD-average index remaining significant and the country-level index not.
Taken together, this literature points to three gaps that the present study addresses jointly rather than separately: (i) the conditional, rather than strictly additive, interaction between environmental policy stringency and trade openness in shaping green patenting; (ii) the use of long, harmonized panel data (1990–2020) to test both the level effects and the convergence dynamics of green technological specialization within a single empirical framework; and (iii) explicit attention to the developed-versus-emerging-economy divide, which the climate finance and institutional quality literature reviewed above suggests is unlikely to be a matter of degree alone.
3. Materials and Methods
Figure 1 summarizes the overall research workflow followed in this study, from the construction of the country–year panel through the empirical estimation strategy to the study’s key results and policy implications. The diagram was generated with the assistance of a generative AI tool (Claude, Sonnet 5, Anthropic); the authors specified its content and structure and reviewed and edited the output, taking full responsibility for its content.
Figure 1.
Graphical research workflow, from data construction to the empirical strategy, key results, and policy implications.
3.1. Data and Sample
The panel combines three publicly available international sources, accessed through the official data portals of the OECD (OECD Data Explorer, SDMX API) and the World Bank (World Bank Open Data API).
- Climate change mitigation patents (Y02): The OECD “Environment-related technologies patents” database (agency OECD.STI.PIE) [39], built from PATSTAT/EPO data following the OECD’s patent-based methodology for identifying environmentally related inventions [26], using search strategies over more than 200,000 IPC/CPC classification symbols. The “Climate change mitigation” technology domain (equivalent to class Y02) is used, measured as the fractional IP5 patent families by inventor country of residence and priority date (the date of first filing), which avoids double counting and bias toward the office of destination. Across the panel, 4.9% of country–year observations have exactly zero Y02 patents and 7.1% are below one patent family in a given year, concentrated among smaller economies and the earliest sample years; these fractional, near-zero values motivate both the log(Y02 + 1) transformation used in the baseline specification and the Poisson pseudo-maximum likelihood estimator in Section 3.3, which handles zeros without an ad hoc additive transformation.
- Total patents: The same data domain, node “Total patents” (all technology fields), is used as the denominator to construct the green technological specialization index (the Y02 share of total patents) and the Revealed Technological Advantage (RTA) index.
- Environmental policy stringency: The OECD composite Environmental Policy Stringency (EPS) index [40], an update of [41], which summarizes 13 climate and air pollution policy instruments on a scale from 0 (least stringent) to 6 (most stringent), available for 40 countries between 1990 and 2020.
- Trade openness: The total trade (exports plus imports) as a percentage of GDP (World Bank World Development Indicators, indicator NE.TRD.GNFS.ZS) [42].
- Macroeconomic controls: The GDP per capita at constant 2015 prices (NY.GDP.PCAP.KD) and total population (SP.POP.TOTL), both from the World Bank [42].
The final sample comprises 40 economies: 25 long-standing OECD members (the “Developed” group) and 15 economies classified as “Emerging” in this study, namely the BRIICS bloc (Brazil, Russia, India, Indonesia, China, and South Africa) plus nine OECD economies that underwent income-convergence processes during much of the sample period (Chile, Mexico, Türkiye, Poland, Hungary, the Slovak Republic, Slovenia, Czechia, and Estonia), observed over 1990–2020, for 1240 country–year observations before lag construction. The rate of missing values is marginal (9 trade openness observations, 0.7% of the panel, corresponding to the early transition years of post-communist economies). The developed/emerging classification follows an explicit, reproducible two-part rule: a country is classified as developed if it was an OECD member with continuous 1990–2020 data coverage across all five source series, and as emerging otherwise, comprising the BRIICS bloc plus the nine OECD member countries that the World Bank classified as middle-income economies at the start of the sample period (1990). The regression sample used in Section 4.2 onward (N = 1156) is smaller than the nominal 1240-observation panel for two reasons: the 9 missing trade openness observations noted above, and the loss of the first two country–years per country once the EPS is lagged two years (2 × 40 = 80 observations); because 5 of the missing trade observations fall within a country’s own first two sample years, the two sources of attrition overlap partially, leaving 1240 − 84 = 1156 complete-case observations. The full country list and the developed/emerging classification are provided in Supplementary Note S1.
3.2. Panel Fixed-Effects Models
All data processing and econometric estimation were performed in R (version 4.3.3), using the plm package [43] for panel models, the MASS and stats packages for count models, the sandwich and lmtest packages for cluster-robust standard errors, and ggplot2 for visualization. The Poisson pseudo-maximum likelihood models (Section 3.3) and the panel autoregressive robustness check reported in Section 4.6 were estimated separately in Python (version 3.13), using statsmodels (version 0.15.0) and linearmodels (version 7.0), respectively, as described in those sections.
The following general equation is estimated on the logarithm of Y02 patents (plus one, to accommodate zero-valued observations):
where γi denotes the country fixed effects, controlling for time-invariant unobserved heterogeneity, such as institutional endowment or baseline scientific capacity, and δt denotes the year fixed effects, controlling for common global technology shocks, such as the worldwide renewable energy boom after 2005. The EPS index is lagged two years to reflect the maturation time between policy adoption and its translation into patent applications, with robustness checks using one- and three-year lags. The incremental specifications are estimated: pooled ordinary least squares, country fixed effects only, and country and year (“twoways”) fixed effects, along with specifications including EPS-by-trade-openness and EPS-by-emerging-group interactions. All standard errors are heteroskedasticity-robust and clustered by country. The pairwise correlations among all explanatory variables are reported in Supplementary Table S1; no evidence of problematic multicollinearity is found among the regressors entering the same specification.
log(Y02it + 1) = β1 EPSi,t−2 + β2 Opennessit + β3 log(GDPpcit) + β4 log(Populationit) + γi + δt + εit
3.3. Poisson Pseudo-Maximum Likelihood Model
Because IP5 patent families are fractional count variables (non-integer, owing to the weighting applied across patent offices), the log-linear model is complemented with a Poisson pseudo-maximum likelihood (PPML) estimator with country and year fixed effects, following [44,45]. The PPML estimator is consistent under correct specification of the conditional mean even when the dependent variable is neither strictly integer-valued nor Poisson-distributed, and it handles zero values appropriately without requiring a logarithmic transformation. The model is estimated as a Poisson generalized linear model (Python’s statsmodels GLM, Poisson family) with the country and year fixed effects included as categorical dummy variables, and standard errors clustered by country via a cluster-robust (sandwich) covariance estimator; the share/offset specification (Table 5, specification B) additionally enters the log(total patents) as a formal offset term, so that this offset is the only element distinguishing it from the level specification (Table 5, specification A). Both specifications converge without evidence of perfect separation.
3.4. Convergence Analysis
Each country i’s green technological specialization index in year t is constructed as the share of Y02 patents in that country’s total patents, and its Revealed Technological Advantage (RTA) is defined as the ratio of this share to the equivalent world share in the same year (an RTA above 1 indicates relative specialization). This “world share” is computed as the aggregate Y02 share across the 40 countries in this sample for each year, not an external, all-country global total; the RTA values in this study are therefore interpreted relative to this sample’s own aggregate green patenting intensity, a scope restriction stated explicitly here as a limitation on the external validity of the RTA and sigma-convergence results (see the sample coverage caveat in Section 5 below). The sigma convergence is assessed through the evolution of the coefficient of variation of RTA within each country group, and the beta convergence through a cross-sectional regression of the logarithmic growth of the Y02 share between 2000 and 2020 on its initial 2000 level, with and without an interaction by country group (developed or emerging).
4. Results
4.1. Descriptive Statistics and Geographic Patterns
Table 1 summarizes the main variables by country group. Developed economies register, on average, 552.12 Y02 patent families per country–year versus 84.52 in emerging economies, a 6.5-fold gap. However, the relative share of Y02 patents in the total patents is nearly identical between groups (8% in both cases), suggesting that the absolute green patenting gap mainly reflects differences in the overall innovation capacity rather than in the degree of technological specialization toward clean technologies. The average EPS index is higher in developed economies (2.08 out of 6) than in emerging economies (1.27), consistent with historically stricter environmental regulation in the former group.
Table 1.
Descriptive statistics by country group, 1990–2020 (N = 1240 country–year observations; 40 countries).
Figure 2 and Figure 3 map these patterns geographically for the most recent decade of the sample (2010–2020 averages). Environmental policy stringency and green patent specialization are both concentrated in North America, Western Europe, Japan, Korea, and Australia (Figure 2), while the Revealed Technological Advantage in green technology is more evenly distributed across a wider set of countries, including several emerging economies, and trade openness is highest among small and mid-sized European economies (Figure 3). Read together, the four maps illustrate that policy stringency and absolute innovation capacity cluster geographically in high-income economies, whereas relative green specialization, captured by the RTA, is a less geographically concentrated phenomenon, foreshadowing the convergence results reported below.
Figure 2.
Geography of environmental policy stringency (A) and green patent specialization (B), 2010–2020 averages. Grey indicates countries not included in the sample. Note: Color scales are continuous rather than discrete class intervals (panel (A): sample minimum–maximum EPS score, 0–6 scale; panel (B): sample minimum–maximum Y02 share of total patents, %). Source: OECD Environmental Policy Stringency Index and OECD Data Explorer environment-related-technologies patent statistics, 2010–2020 averages. A graticule-based scale bar (accurate at the Equator) and a north arrow are added to both panels; the legend distinguishes countries outside the 40-country sample (grey) from within-sample missing data—for the variables mapped here, no sampled country has a missing 2010–2020 average, so all grey areas correspond exclusively to countries outside the sample.
Figure 3.
Geography of green technological advantage (A) and trade openness (B), 2010–2020 averages. Grey indicates countries not included in the sample. Note: Color scales are continuous: panel (A) (Revealed Technological Advantage) is shown on a log10 scale to accommodate its right-skewed distribution; panel (B) (trade openness) spans the sample minimum to maximum, in percent of GDP. Source: OECD Data Explorer (panel (A), derived from Y02 and total patent counts) and World Bank World Development Indicators, indicator NE.TRD.GNFS.ZS (panel (B)), 2010–2020 averages. A graticule-based scale bar (accurate at the Equator) and a north arrow are added to both panels; as in Figure 2, grey marks countries outside the 40-country sample rather than within-sample missing data—no sampled country is missing a 2010–2020 average for the variables shown here.
4.2. Determinants of Green Patents: Panel Fixed-Effects Models
Table 2 reports the panel model results for log(Y02 + 1). The lagged EPS coefficient is positive and highly significant under pooled OLS (0.474, p < 0.01) and country fixed effects (0.265, p < 0.01). However, once the year fixed effects are introduced, which absorb the global technological trends common to all countries, such as the worldwide clean patent boom after 2005 visible in Figure 4, the coefficient falls to 0.105 and loses conventional statistical significance (p = 0.22). This pattern indicates that a substantial part of the raw association between regulatory stringency and green patenting reflects a common time trend rather than a country-specific causal effect. The GDP per capita, by contrast, is the most robust determinant across all specifications, with elasticities between 1.7 and 2.4 and significance at the 1% level throughout, confirming that the baseline economic and scientific capacity is the dominant enabling condition for clean technology innovation.
Table 2.
Determinants of log(Y02 patents + 1). Country-clustered robust standard errors are in parentheses. Dependent variable: log(Y02 IP5 patent families + 1).
Figure 4.
Trends in Y02 patent families (A) and environmental policy stringency (B) by country group, 1990–2020.
The interaction between EPS and trade openness (Model 4) is negative and highly significant (−0.0026, p < 0.01): the marginal effect of environmental policy stringency on green patenting is larger in relatively closed economies and is attenuated, and can even reverse, in economies that are highly open to trade. A reading consistent with this evidence is that, in open economies, the availability of imported clean energy technology reduces the incentive or need for additional domestic patenting induced by environmental policy, in line with the international diffusion channel documented in [13,14]. Alternatively, this pattern is consistent with competitive pressure through trade limiting the capacity of firms to translate regulation into protected domestic innovation. Both readings are mechanisms consistent with the observed interaction, not mechanisms tested directly in this study, and they are presented here as candidate hypotheses for future firm- or technology-level research rather than as demonstrated channels.
Because Model 4 is estimated with trade openness in its raw scale, the reported EPS(t − 2) coefficient (0.346) corresponds formally to the marginal effect of policy stringency at a trade openness value of exactly zero, a value outside the observed range of the sample (minimum 24.9% of GDP) and therefore not directly interpretable. To address this, trade openness is re-centered at its sample mean (80.6% of GDP) and Model 4 is re-estimated; the marginal effect of EPS(t − 2) is then recovered at representative, observed percentiles of the trade openness distribution, with delta-method standard errors and 95% confidence intervals (Table 3).
Table 3.
Marginal effect of EPS(t − 2) on log(Y02 patents + 1) at representative observed values of trade openness (Model 4 re-estimated with trade openness centered at its sample mean). Delta-method standard errors, country-clustered.
The marginal effect of EPS on green patenting is positive and statistically distinguishable from zero only at relatively low levels of trade openness (P10–P25); it declines monotonically as trade openness rises, becomes indistinguishable from zero around the sample median, and is no longer positive at the P90 level of trade exposure. This confirms, with the appropriate statistical uncertainty, the qualitative reading given above: the domestic innovation response to environmental policy stringency is concentrated in relatively closed economies and is not detectable in highly trade-open ones, rather than reflecting a fixed, uniform effect of EPS evaluated at an out-of-sample trade openness value of zero.
Trade openness is also decomposed into its export and import components, to test whether the direction of trade, rather than its overall volume, drives the interaction above. Replacing trade openness with exports (% GDP) and imports (% GDP) separately leaves both individually insignificant, as is the combined trade openness term; adding the EPS(t − 2) interactions with each component separately, neither the EPS × exports interaction (p = 0.82) nor the EPS × imports interaction (p = 0.39) is statistically significant. This indicates there is no evidence that the direction of trade exposure, the export versus import intensity, differentially moderates the policy-stringency–green-patenting relationship documented above; the moderating role of trade openness (Model 4) appears to operate through overall exposure rather than through a specific trade composition channel.
The EPS-by-emerging-group interaction (Model 5) is not statistically significant (p = 0.63), so the hypothesis that the average sensitivity of green patenting to regulatory stringency is equal between developed and emerging economies cannot be rejected. Given the smaller number of emerging economies with long patenting series, however, this result should be interpreted with caution (see the heterogeneity results below).
The specification diagnostics support the use of fixed effects. The F-test strongly rejects the pooled model in favor of two-way fixed effects (F = 72.29, p < 0.01), and the Hausman test rejects the random-effects model in favor of fixed effects (chi-squared = 31.38, df = 4, p < 0.01), indicating a correlation between the unobserved country effects and the regressors, consistent with persistent institutional heterogeneity correlated with the level of development.
A further concern is that log(Y02 + 1), the dependent variable used throughout Table 2, is an absolute count that is mechanically influenced by a country’s overall patenting capacity; controlling for the GDP per capita and population, as Model 3 does, may not fully isolate the propensity to patent specifically in green technologies. To verify whether the EPS result is an artifact of this functional-form choice, Model 3 is re-estimated twice more, replacing log(Y02 + 1) with the y02_share (the share of Y02 patents in each country’s total patent portfolio) and with the RTA (Revealed Technological Advantage in green technology, Section 3.4), both of which net out the overall patenting capacity by construction.
Under both share-based specifications, EPS(t − 2) is positive and significant at the 1% level—in contrast to its non-significant coefficient under the absolute-count specification in Table 2. This indicates that once a country’s overall patenting capacity is netted out of the dependent variable itself, rather than only partialed out through the GDP per capita and population controls, the association between policy stringency and green specialization strengthens rather than disappears. The log(Y02 + 1) specification is retained as the primary model throughout this article, both for comparability with the prior literature’s predominant use of patent counts and because it supports the Poisson-based robustness check in Section 4.3, but the share- and RTA-based results in Table 4 indicate that the attenuation documented in Table 2 (Model 3) reflects the absorption of a common time trend in the count model specifically, rather than a genuine absence of association between regulatory stringency and green technological specialization.
Table 4.
Robustness of the EPS(t − 2) coefficient to the choice of dependent variable. Two-way fixed-effects models, country-clustered robust standard errors in parentheses.
4.3. Poisson Pseudo-Maximum Likelihood Results
Because the log-linear specification can understate statistical significance in the presence of fractional counts and zeros, a PPML model with the same country and year fixed effects is estimated (Table 5, specification A). Under this specification, theoretically more appropriate for the nature of the dependent variable [44,45], the lagged EPS coefficient regains statistical significance (0.096, p = 0.015), reinforcing hypothesis H1, of a positive association between regulatory stringency and green patenting once the heteroskedasticity inherent to count data is correctly accounted for. Trade openness and population are not significant in this specification, while the GDP per capita retains a high and highly significant elasticity (2.35, p < 0.01).
To support this preference for PPML over the log-linear specification with a formal diagnostic, rather than by assertion alone, a Breusch–Pagan test and a Ramsey RESET test are run on an ordinary least squares equivalent of the two-way fixed-effects log-linear model (country and year dummies in place of the within transformation). Both tests strongly reject the log-linear specification: the Breusch–Pagan test rejects homoskedasticity (LM = 282.8, p < 0.001), and the Ramsey RESET test rejects the correct functional form (F = 62.2, p < 0.001). These diagnostics provide formal statistical support for preferring the Poisson pseudo-maximum likelihood estimator, which does not assume homoskedastic, normally distributed errors, over the log-linear specification for this fractional, right-skewed count variable.
This specification, however, still treats the total patenting capacity only indirectly, through the GDP per capita and population controls, raising the same concern noted in Section 4.2 for the log-linear model: that the EPS coefficient could partly reflect a country’s general propensity to patent rather than a green-specific response. To address this directly within the PPML framework, the log(total patents) is entered as a formal offset (its coefficient fixed at one), so that the model explains the Y02 share of each country’s own patenting rather than its absolute level (Table 5, specification B). Under this more demanding specification, EPS(t − 2) is no longer statistically significant and its point estimate is small and of the opposite sign (−0.015, p = 0.78). The trade openness, log(GDP per capita), and log(Population) all change magnitude and, for GDP per capita, significance level between the two specifications, confirming that the offset materially changes what the model is estimating rather than merely rescaling it.
Taken together with the share- and RTA-based linear models in Table 4, this comparison indicates that the association between policy stringency and green patenting is not uniformly robust across every plausible way of accounting for a country’s overall patenting capacity: it is positive and significant under the two linear share/RTA models (Table 4) and under the PPML level specification (Table 5, specification A), but not under the PPML share/offset specification (Table 5, specification B). The honest summary is that EPS is associated with a larger green share of patenting activity in linear models, but this association is sensitive to the nonlinear functional form and to whether the total patenting capacity is modeled as a covariate or as a formal offset; hypothesis H1 should accordingly be read as receiving conditional, specification-dependent support rather than uniform support across all estimators, and this qualification is carried through to Section 5 and Section 6 below.
Table 5.
Poisson pseudo-maximum likelihood (PPML) models with country and year fixed effects, estimated two ways: with total patents entered only indirectly, through the GDP per capita and population controls (specification A, Level), and with the log(total patents) entered as a formal offset, so the model explains the green share of a country’s own patenting rather than its absolute level (specification B, Share/Offset).
4.4. Heterogeneity: Developed Versus Emerging Economies
When the fixed-effects model is estimated separately by subsample (Table 6), the EPS coefficient is positive in both groups and of similar magnitude (0.128 in developed economies, 0.085 in emerging economies), with no statistically distinguishable difference between them, corroborating the non-significant interaction found in Model 5. The most pronounced heterogeneity is observed in the market-size variable (log of population): its coefficient is positive and highly significant in emerging economies (3.73, p < 0.01), but negative and marginally significant in developed economies (−1.53, p = 0.067), suggesting that the domestic market size is a far more decisive enabler of green patenting capacity in emerging economies, where it likely proxies for internal market scale and total scientific resources, than in developed economies, where the innovation capacity is already consolidated independently of population scale.
Table 6.
Country and year fixed-effects models estimated by subsample. Country-clustered robust standard errors in parentheses.
Because this population effect in the emerging economies subsample is the most striking heterogeneous result in Table 6, its sensitivity to individual large countries is examined directly: re-estimating the emerging economies model after excluding China and India (Table 7; reducing the subsample from 15 to 13 countries) causes the population coefficient to collapse from 3.73 (p < 0.01) to 1.55 (p = 0.33), and is no longer statistically significant. This confirms that the striking market-size effect in Table 6 is substantially driven by these two large-population outliers rather than reflecting a population effect general to emerging economies; by contrast, the EPS coefficient is not driven by these two countries and, if anything, strengthens somewhat in their absence (0.145, p = 0.071 versus 0.085, p = 0.17 in the full emerging subsample).
Table 7.
Emerging economies subsample model, with and without China and India. Country-clustered robust standard errors in parentheses.
A further dimension of heterogeneity, beyond the developed/emerging split, is institutional quality. Interacting EPS(t − 2) with each country’s time-averaged government effectiveness score (World Bank Worldwide Governance Indicators, 0–100 scale, 1996–2020 coverage) yields a negative, marginally significant interaction (coefficient −0.0065, p = 0.051), indicating that the positive EPS–patenting association is stronger in countries with weaker governance effectiveness. A median-split subsample analysis (Table 8) corroborates this: EPS(t − 2) is not statistically significant in the high-governance effectiveness subsample (coefficient 0.096, p = 0.27; 20 countries) but is significant in the low-governance effectiveness subsample (coefficient 0.173, p = 0.044; 20 countries; split at a median country-average score of 75.9). This suggests that the innovation response to environmental policy stringency is concentrated in countries where institutions and enforcement capacity are comparatively weaker, and is statistically indistinguishable from zero where governance quality is already high.
Table 8.
Interaction between EPS and government effectiveness; subsample split at the median governance effectiveness score. Country-clustered robust standard errors in parentheses.
The sharply contrasting, opposite-signed log(Population) coefficients across the two subsamples in Table 6 (−1.530, p < 0.10, developed; +3.732, p < 0.01, emerging) warrant cautious interpretation rather than a substantive reading. The population changed slowly within each country over the sample period, so its within-country, two-way fixed-effects coefficient is weakly identified and can absorb other slow-moving, country-specific trends correlated with group membership (for example, differential institutional or structural change across developed and emerging economies), rather than isolating a population effect specifically; these coefficients should accordingly not be interpreted as evidence of a genuine, opposite-signed population effect on green patenting between the two groups.
4.5. Robustness to Lag Structure
The EPS coefficient is stable in sign and magnitude (between 0.075 and 0.110) as the lag is varied between one and three years, without reaching conventional statistical significance in any of the three log-linear specifications with two-way fixed effects (Supplementary Table S2). This is consistent with the attenuation documented in Table 2 and with the significance recovered under PPML in Table 5, underscoring the sensitivity of inference to the functional form chosen to model a fractional count variable. This recovery of significance, however, holds only when the total patenting capacity enters the PPML model indirectly via covariates; it does not hold when the total patenting capacity is modeled as a formal offset (Table 5, specification B), so this robustness check should be read as specification-dependent rather than unconditional.
Four additional robustness checks are conducted beyond this lag-length variation (summarized in Table 9). First, re-estimating the main specification (Table 2, Model 3) with the Y02 share of total patents as the dependent variable, in place of log(Y02 + 1), both EPS(t − 2) (coefficient 0.0116, p = 0.0075) and trade openness (coefficient −0.0002, p = 0.0076) become statistically significant, a cleaner result than under the count-based specification. Second, excluding China from the panel leaves the EPS(t − 2) coefficient essentially unchanged (0.103, p = 0.23 versus 0.105, p = 0.22 in the full sample), indicating the result is not an artifact of China’s well-documented patenting surge. Third, restarting the beta-convergence window in 1995 rather than 2000 (Section 4.6) yields a nearly identical result (coefficient −0.945, p < 0.001, N = 34 versus −0.932, p < 0.001, N = 39), indicating the convergence finding is not sensitive to the chosen start year. Fourth, the standard errors throughout the PPML specification (Table 5) are clustered by country, as for all other models reported in this study.
Table 9.
Summary of additional robustness checks beyond lag-length variation. Country-clustered robust standard errors in parentheses, except where noted.
4.6. Technological Convergence in Green Patenting
Figure 4 shows the evolution of the absolute volume of Y02 patents by group (panel A): most of global green patenting is concentrated in developed economies, with a marked acceleration after 2005, while emerging economies, led by China, show a later but very pronounced increase after 2015. Figure 4 also documents the trajectory of the average EPS index by group (panel B), revealing a persistent regulatory gap with some convergence toward 2020, driven in particular by China.
The technological specialization indicator, Revealed Technological Advantage in Y02, offers a complementary and more nuanced picture (Figure 5, panel A). During the 1990s and much of the 2000s, emerging economies exhibited episodes of RTA well above one (particularly India and Brazil in specific years), reflecting high volatility typical of small patenting bases rather than sustained structural specialization. After 2008, both trajectories converged toward values close to one, and since then developed economies showed, on average, a slightly higher RTA than emerging economies, that is, a marginally greater relative specialization toward green technology within their own patent portfolios, even as the absolute volume gap (Figure 4, panel A) persisted. The full country-level RTA and Y02 share values underlying this figure are reported in Supplementary Table S3.
Figure 5.
Revealed Technological Advantage (A) and sigma convergence (B) in green patenting, 1990–2020. The dashed horizontal line in panel (A) marks RTA = 1, the threshold above which a country group is relatively specialized in green technologies; as defined in Section 3.4, the reference (“world”) share is the aggregate Y02 share of the 40 sample countries.
A formal test of this sigma-convergence pattern, regressing the coefficient of variation of RTA on year separately by country group, confirms a statistically significant downward trend in both groups: for developed economies, coefficient on year = −0.0058, p = 0.004, and R-squared = 0.26, and for emerging economies, coefficient = −0.0362, p < 0.001, and R-squared = 0.72, with the emerging economies converging roughly six times faster. This formalizes, with an explicit significance test, the sigma-convergence pattern visible in Figure 5, panel B.
The formal beta-convergence test (Table 10, full sample of 39 countries with valid data in 2000 and 2020) yields a negative and highly significant coefficient (−0.932, p < 0.01, R-squared = 0.49): the countries with a lower initial Y02 share in their patent portfolio in 2000 experienced proportionally greater growth in that share by 2020 (Figure 6, panel B), consistent with a process of green technological convergence (within this sample), the main scientific contribution of this study. This convergence pattern is documented within the 40-country, predominantly OECD-weighted sample analyzed here (Section 3.1); it is described as a form of convergence in the sense of spanning both developed and emerging economies within this sample, not as a claim covering the full population of the world’s economies, most of which lie outside the sample (see the sample coverage caveat in Section 5 below). A rising Y02 share is also mechanically ambiguous: it can reflect green patenting growth in absolute terms; non-green patenting falling or growing more slowly; or, for countries with a small total patenting base, year-to-year volatility in a low-count denominator or numerator (Section 3.1). The convergence result is accordingly read as convergence in the composition of patent portfolios rather than as unambiguous evidence of converging green technological capability in an absolute sense. When a country–group interaction is introduced, neither the interaction term (p = 0.42) nor the intercept difference (p = 0.34) is statistically significant, so there is no evidence that the speed of convergence differs systematically between emerging and developed economies: the convergence process in green technological specialization appears to operate relatively homogeneously in both groups, even though the starting points, that is, specialization levels in 2000, are heterogeneous within each group. Figure 6, panel A, further shows that the positive cross-sectional association between EPS and green patenting holds within each group across the full panel. This panel displays the raw, unconditional bivariate pattern, without country or year fixed effects, and should be read as descriptive visual evidence of the association rather than as a substitute for the fixed-effects estimates in Table 2; the two are complementary, not interchangeable, sources of evidence.
Table 10.
Beta-convergence regressions: logarithmic growth of the Y02/total share on its initial level (OLS, classical standard errors). Panel A reports the full-sample and group-interaction specifications for the 2000–2020 window (39 countries); Panel B reports the window-sensitivity checks using the same full-sample specification over alternative start/end years.
Figure 6.
Policy stringency and green patenting (A) and beta convergence in green specialization, 2000–2020 (B). Note: Panel (B) plots growth against the initial (2000) level by construction, so part of the downward slope reflects mechanical regression to the mean rather than substantive convergence alone; the panel/AR(1) check and the window-sensitivity results reported above and in Table 10 are the basis for treating the pattern as more than a purely mechanical artifact, though they cannot entirely rule out some mechanical contribution. A 95% confidence band around the fitted regression line is added to panel (B), consistent with the band shown for each group’s fitted line in panel (A). Dots show individual country–year observations in panel (A) and individual countries in panel (B), colored by country group; the solid lines in panel (A) are group-specific linear fits, the dashed line in panel (B) is the pooled linear fit, and the shaded areas are 95% confidence bands.
As a further check on whether this two-point (2000 vs. 2020) design is itself generating convergence mechanically through regression to the mean, a complementary panel specification regresses log(y02 share) on its own calendar-year lag with country and year fixed effects, using the available within-country variation across the panel rather than a single start/end comparison. Because the logarithm is undefined for the 61 country–years (4.92% of the panel) with zero or undefined Y02 patent shares, these observations are excluded from this specific check; all 40 sampled countries remain represented, though the year coverage per country is uneven as a result (9 to 30 of the 31 sample years; mean 28), with the shortest coverage concentrated in a handful of smaller or later-industrializing economies (Iceland, Estonia, Indonesia, the Slovak Republic, Slovenia, and Türkiye). On this sample (N = 1121), the specification yields a persistence coefficient of 0.217 (clustered SE 0.049, p < 0.001), implying substantial within-country mean reversion year over year and an implied convergence speed of 0.78 per year. This result is not an artifact of how the zero-share observations are treated: re-estimating the same specification on the full panel (N = 1200) with a small additive constant in place of dropping the zero shares (log(share + 0.0001)) yields a materially similar persistence coefficient of 0.253 (clustered SE 0.082, p = 0.002). The panel estimate is therefore directionally consistent with convergence under both treatments of the zero-share observations, but autoregressive within-fixed-effects estimators of this kind are known to be biased in short panels (the Nickell bias), so it is reported here as a directional corroboration of the cross-sectional beta-convergence result rather than as an unbiased estimate of convergence speed in its own right.
A complementary beta-convergence test is also run on the absolute Y02 patent counts, rather than the Y02/total patents share used above, over the same 2000–2020 window: the coefficient on log(2000 level) is −0.131 (p = 0.063, N = 39), indicating only marginal convergence, in contrast to the strong and highly significant convergence found above in relative specialization (Table 10; coefficient −0.932, p < 0.001). This contrast indicates that the convergence process documented in this study is one of relative technological specialization, that is, countries closing the gap in the share of their innovation portfolio devoted to green technologies, rather than of absolute innovation volume: the wide gap in raw patenting output evident in Figure 4, panel A, is not closing at a comparable pace.
5. Discussion
Read against the literature reviewed in Section 1 and Section 2, these results combine confirmation and divergence, attributable mainly to the specification choices rather than to the country sample. The positive, within-country association between policy stringency and green patenting under pooled and country fixed-effects specifications confirms the weak form of the Porter hypothesis reported in prior firm- and country-level studies [7,8,9,19,20,21,22,23,24,25]. The study diverges from part of that literature once the year fixed effects are introduced, since the EPS coefficient then loses conventional significance; this divergence is attributable to the estimator rather than the sample, because the same lagged EPS variable recovers significance under the Poisson pseudo-maximum likelihood specification applied to the identical panel (Section 4.3), indicating that part of the raw association documented elsewhere reflects a common global technological trend, such as the post-2005 clean energy boom (Figure 4), rather than a purely country-specific regulatory effect. The negative, significant EPS-by-trade-openness interaction (H2) also diverges from studies that emphasize trade mainly as a diffusion channel reinforcing domestic green innovation [13,14]; because this interaction is rarely estimated jointly with policy stringency in the literature reviewed above, the divergence is best attributed to this specification choice itself, rather than to the country sample, whose OECD- and BRIICS-weighted composition is comparable to that used in related studies.
The results qualify a simplistic reading of the Porter hypothesis. The robust positive association between GDP per capita and green patenting across all specifications confirms that the baseline scientific and economic capacity remains the dominant structural condition for clean innovation, in line with the classical national innovation systems literature. Environmental policy stringency shows a positive association with green patenting that is sensitive to its functional form: it is attenuated in log-linear models with two-way fixed effects, which absorb global technological trends, such as the post-2005 renewable energy boom evident in Figure 4, but it reappears as significant under PPML, the estimator theoretically better suited to fractional count data with zeros. This significance, however, holds only under the PPML specification that treats the total patenting capacity indirectly through covariates (Table 5, specification A); it does not survive when the total patenting capacity is instead modeled as a formal offset (Table 5, specification B), so the PPML evidence for Hypothesis H1 is best read as conditional on functional-form choices rather than as uniformly robust, even though it is corroborated by the share- and RTA-based linear models in Table 4. This pattern echoes the weak empirical link between compliance costs and patent counts first documented in [6], and the broader conclusion of subsequent reviews that empirical support for the Porter hypothesis is strongest in its weak form, that regulation induces innovation, rather than in its strong form, that this induced innovation also improves competitiveness [8]. This methodological sensitivity is, in itself, a relevant finding for the applied literature, since underestimating the role of estimator choice can lead to contradictory conclusions about the effectiveness of environmental policy as a lever for innovation, a concern also raised in firm-level European evidence on the Porter hypothesis [9].
The negative and significant interaction between EPS and trade openness (H2) is the most novel result of the analysis with respect to the research question. As in Section 4.2 above, the following explanations are presented as candidate hypotheses rather than as mechanisms tested directly in this study. A reading consistent with this evidence is that international trade may moderate the domestic link between regulation and patenting, possibly because openness enables access to foreign clean energy technology, substituting for some of the domestic innovation that regulation would otherwise induce, or because international competitive pressure limits the capacity of firms to translate compliance costs into patent-protected innovation. This result is consistent with the coexistence, documented in the literature, of a technology diffusion channel [13,14], an export competitiveness channel through which regulation and innovation jointly shape green trade performance [15], and a relocation or competition channel [16,18], and it suggests that environmental and energy policy design should take an economy’s degree of trade openness into account when calibrating instruments meant to stimulate domestic clean innovation.
Regarding H3, the lack of significance of the EPS-by-emerging-group interaction and the similarity of subsample coefficients do not support the conclusion that emerging economies respond differently to regulatory stringency. A structurally relevant difference is identified, however, in the role of market size (population), which is far more decisive in emerging economies. This finding is consistent with the directed technical change framework, in which the size of the market for a given technology is itself a determinant of the direction and pace of innovation alongside policy [10,11], and with the broader literature on research and development scale economies in developing countries, where the domestic market size acts as a precondition for reaching a critical mass of innovation.
Finally, the beta-convergence evidence (H4) provides a direct quantitative answer to the objective of identifying the clean technological convergence patterns between emerging and developed economies. Relative specialization in Y02 technologies converged within this sample between 2000 and 2020, with no significant difference in speed between groups. This suggests that, while the absolute gap in green patenting volume between developed and emerging economies remains wide (Figure 4, panel A), reflecting differences in total innovation capacity, the relative structure of both groups’ technology portfolios is becoming more similar, a pattern compatible with international technology diffusion processes and with the recent rise of China as a major patenting power in clean energy technologies. This convergence result, however, is concentrated in the first half of the sample period: the window-sensitivity checks (Section 4.6) show significant convergence for 2000–2010 but no statistically detectable convergence for 2010–2020 alone, so describing beta convergence as the study’s single most robust finding overstates what the most recent decade of data, on its own, supports. This convergence finding should be interpreted strictly as convergence in inventive specialization. Patents capture invention, not the subsequent deployment, diffusion, or adoption of clean technologies, nor do they measure realized reductions in greenhouse gas emissions; an economy can specialize increasingly in Y02 invention while its energy system remains carbon-intensive if deployment, infrastructure, and demand-side conditions lag behind the pace of invention. The convergence in green patent specialization documented here should therefore not be read as evidence of convergence in actual decarbonization outcomes, which would require complementary evidence on technology deployment and emissions trajectories, such as the partial and uneven CO2-GDP decoupling documented for a small emerging economy in [33].
These results are also subject to several limitations. On identification, lagging policy stringency by one to three years reduces but does not eliminate the risk of reverse causality, since stronger green innovators could lobby for stricter regulation, and trade openness and stringency may be jointly determined [31]; the estimates reported throughout this study should accordingly be read as robust, lagged associations rather than identified causal effects. On measurement, the composite EPS index aggregates instruments, such as taxes, standards, and subsidies, that plausibly have heterogeneous effects on innovation, and the sub-indicators needed to decompose it are not available for a panel of this scope. Separately, measuring Y02 patents by IP5 family under-counts domestic-only filings, which likely biases the convergence coefficient toward overstating convergence if emerging economies’ propensity to file internationally has risen over the sample period, as China’s patenting surge suggests. On coverage, the 40-country panel is weighted toward OECD and BRIICS economies and excludes most low-income countries, so the findings characterize middle- and high-income, data-rich economies rather than generalizing beyond them. Future work could pursue instrumental-variable identification, decompose the EPS index by instrument type, replicate the convergence tests on a domestic-inclusive patent measure, expand the emerging economy sample to increase power for the group heterogeneity tests, and disaggregate convergence by Y02 technology subdomain.
6. Conclusions
This study provides panel evidence for 40 countries over three decades on the determinants of patenting in climate change mitigation technologies (Y02), the large majority of which are directly tied to the global energy transition. Four central findings emerge. First, economic development, measured by GDP per capita, is the most robust and stable predictor of green patenting across all specifications, underscoring the importance of baseline scientific and technological development policy as a precondition for clean innovation. Second, environmental policy stringency shows a positive association with green patenting, whose statistical significance depends on econometric specification: it is attenuated in log-linear models with global time effects but robust under a Poisson pseudo-maximum likelihood estimator suited to the count nature of the variable, which counsels methodological care when evaluating the effectiveness of regulatory instruments on innovation. This PPML-based robustness, however, holds only when the total patenting capacity is treated as a covariate rather than as a formal offset, so EPS’s effect should be read as conditional on its specification rather than as uniformly robust across every count data estimator. Third, trade openness negatively moderates the effect of environmental policy on domestic patenting, a result with direct implications for policy design: in highly open economies, environmental and energy policy instruments aimed at stimulating domestic innovation may need to be complemented with mechanisms for technological appropriability or direct research and development support, since the regulatory signal alone appears to translate into less additional local patenting as trade exposure increases. Fourth, this study documents beta convergence in green technological specialization between 2000 and 2020, with no significant difference in speed between developed and emerging economies, suggesting that relative clean technology specialization gaps are narrowing within the sample even as substantial differences in absolute innovation volume persist. This convergence pattern is concentrated in the 2000–2010 period; the window-sensitivity checks do not detect statistically significant convergence within 2010–2020 alone, so the finding should be read as characterizing the two-decade period as a whole rather than as an ongoing, undiminished trend, and, as emphasized throughout this study, as applying to this 40-country, predominantly OECD-weighted sample rather than to the global population of economies.
From a policy perspective, the estimated associations suggest three lines of action, offered as implications consistent with the results rather than as effects demonstrated by a causal identification strategy. The first is to sustain and deepen stringent environmental policies as a lever for energy innovation, evaluating their effect with econometric methods appropriate to the count nature of patent data. The second is to design complementary instruments, such as research and development tax incentives and public science and technology financing, for highly trade-open economies, where the induced effect of environmental regulation alone on domestic patenting appears weaker. The third is to support the consolidation of national innovation systems in emerging economies, since the documented convergence process suggests a window of opportunity to close the clean energy technology gap if conditions of access to scale markets and increasing regulatory stringency are sustained.
Differentiating these recommendations by trade openness and development level, as the EPS-by-trade interaction (H2) suggests is warranted, implies distinct instrument mixes. In highly trade-open, developed economies, where the domestic innovation response to regulation is most strongly moderated by openness, environmental and energy policy should pair stringency instruments, such as carbon pricing or emissions performance standards, with direct appropriability-enhancing measures, for example patent-box regimes for clean technologies, targeted research and development tax credits, and public co-funding of pre-commercial demonstration projects, so that compliance costs translate into protected domestic invention rather than purely into imported technology adoption. In less trade-open, emerging economies, where market size (population) is a comparatively stronger determinant of green patenting (Section 5), policy should prioritize scaling the domestic market for clean technologies, for example through public procurement of clean energy equipment, renewable portfolio standards, and green industrial policy instruments that build scale ahead of further tightening stringency, since regulation absent a sufficiently large addressable market is less likely to induce patentable domestic innovation. In both groups, since the convergence documented in Section 4.6 is observed in relative technological specialization rather than in absolute innovation volume, instruments aimed explicitly at building emerging-economy research and development capacity, such as international technology transfer partnerships and co-investment in clean energy research infrastructure, remain warranted to translate specialization convergence into a narrowing of the absolute innovation gap.
Supplementary Materials
The following supporting information can be downloaded at: https://www.mdpi.com/article/10.3390/en19215294/s1, Table S1: Pairwise correlation matrix of key panel variables (1240 country–year observations, pairwise-complete observations); Table S2: Robustness of the lagged EPS coefficient to alternative lag lengths. Country and year fixed-effects models; dependent variable log(Y02 patents + 1). Country-clustered robust standard errors in parentheses. Trade openness, log(GDP per capita), and log(Population) are included as controls in every model but omitted from the table for brevity (full output available from the corresponding author). The full specification, including these control coefficients, model N, and within R2, is reported directly below in Table S2 (continued). The coefficients on the control variables omitted from Table S2 above (trade openness, log(GDP per capita), log(Population)), for the same three lag-length specifications of the EPS coefficient, together with model N and within R2. Estimated in Python (linearmodels PanelOLS, country and year two-way fixed effects, country-clustered standard errors) as an independent cross-check of the original R specification reported in Table S2; this Python implementation reproduces the original EPS-lag coefficients and standard errors in Table S2 to within the small numerical differences ordinarily seen between R’s and Python’s cluster-robust variance estimators (documented in the R and Python analysis scripts referenced in Note S1). The complete model code and output underlying both tables are available from the corresponding author upon reasonable request, consistent with the manuscript’s Data Availability Statement; Table S3: Revealed Technological Advantage (RTA) in Y02 patenting and Y02 share of total patents by country, 2010–2020 averages, ranked from highest to lowest RTA. RTA above 1 indicates specialization relative to the aggregate Y02 share of the 40 sample countries (the “world” share defined in Section 3.4 of the main manuscript). “Developed” and “Emerging” group assignments match Section 3.1 of the main manuscript; Note S1: Data construction and country classification.
Author Contributions
Conceptualization, L.L.-B., D.R. and M.M.; methodology, D.R. and K.F.-N.; software, D.R.; validation, L.L.-B., M.M., D.R. and K.F.-N.; formal analysis, L.L.-B., D.R. and M.M.; investigation, L.L.-B., M.M. and D.R.; resources, L.L.-B.; data curation, D.R.; writing—original draft preparation, D.R. and K.F.-N.; writing—review and editing, L.L.-B., M.M., D.R. and K.F.-N.; visualization, K.F.-N.; supervision, L.L.-B. and D.R.; project administration, L.L.-B. All authors have read and agreed to the published version of the manuscript.
Funding
This research received no external funding. The APC was funded by the National Autonomous University of Honduras (UNAH).
Institutional Review Board Statement
Not applicable. This study did not involve humans or animals; it relies exclusively on secondary, publicly available country-level statistics.
Informed Consent Statement
Not applicable.
Data Availability Statement
The datasets analyzed in this study are derived from publicly available sources: the OECD Data Explorer (https://data-explorer.oecd.org, accessed on 1 September 2026) dataflows “Environment-related technologies patents” (agency OECD.STI.PIE) and “OECD Environmental Policy Stringency Index” (agency OECD.ECO.MAD), and the World Bank Open Data API (https://data.worldbank.org, accessed on 1 September 2026) indicators NE.TRD.GNFS.ZS, NY.GDP.PCAP.KD, and SP.POP.TOTL. The compiled country–year panel dataset, the full R and Python analysis scripts, and all Supplementary Tables are available from the corresponding author upon reasonable request.
Acknowledgments
The authors thank the OECD and the World Bank for maintaining open, publicly accessible data infrastructures that make this study possible. The authors gratefully acknowledge the support provided by the National Autonomous University of Honduras (UNAH). During the preparation of this manuscript, the authors used Claude (Anthropic, Sonnet 5) for editorial assistance, English-language refinement, and to generate the graphical research workflow diagram in Figure 1; and Grammarly for grammar checking. All statistical analyses, and all figures and tables other than Figure 1, were produced independently by the authors in R. The authors have reviewed and edited the output and take full responsibility for the content of this publication.
Conflicts of Interest
The authors declare no conflicts of interest.
Abbreviations
The following abbreviations are used in this manuscript:
| BRIICS | Brazil, Russia, India, Indonesia, China, and South Africa |
| EPS | Environmental Policy Stringency |
| FE | Fixed Effects |
| GDP | Gross Domestic Product |
| IP5 | Five Largest Patent Offices (USPTO, EPO, JPO, KIPO, CNIPA) |
| OECD | Organization for Economic Co-operation and Development |
| PPML | Poisson Pseudo-Maximum Likelihood |
| RTA | Revealed Technological Advantage |
| Y02 | IPC/CPC Class for Climate Change Mitigation Technologies |
References
- Fouquet, R. Historical energy transitions: Speed, prices and system transformation. Energy Res. Soc. Sci. 2016, 22, 7–12. [Google Scholar] [CrossRef] [Scilit]
- Popp, D.; Newell, R.G.; Jaffe, A.B. Energy, the Environment, and Technological Change. In Handbook of the Economics of Innovation; Elsevier: Amsterdam, The Netherlands, 2010; Volume 2, pp. 873–937. [Google Scholar] [CrossRef] [Scilit]
- Sovacool, B.K. How long will it take? Conceptualizing the temporal dynamics of energy transitions. Energy Res. Soc. Sci. 2016, 13, 202–215. [Google Scholar] [CrossRef] [Scilit]
- Porter, M.E.; van der Linde, C. Toward a new conception of the environment-competitiveness relationship. J. Econ. Perspect. 1995, 9, 97–118. [Google Scholar] [CrossRef] [Scilit]
- Popp, D. Induced innovation and energy prices. Am. Econ. Rev. 2002, 92, 160–180. [Google Scholar] [CrossRef] [Scilit]
- Jaffe, A.B.; Palmer, K. Environmental regulation and innovation: A panel data study. Rev. Econ. Stat. 1997, 79, 610–619. [Google Scholar] [CrossRef] [Scilit]
- Lanoie, P.; Laurent-Lucchetti, J.; Johnstone, N.; Ambec, S. Environmental policy, innovation and performance: New insights on the Porter hypothesis. J. Econ. Manag. Strategy 2011, 20, 803–842. [Google Scholar] [CrossRef] [Scilit]
- Ambec, S.; Cohen, M.A.; Elgie, S.; Lanoie, P. The Porter hypothesis at 20: Can environmental regulation enhance innovation and competitiveness? Rev. Environ. Econ. Policy 2013, 7, 2–22. [Google Scholar] [CrossRef] [Scilit]
- Rubashkina, Y.; Galeotti, M.; Verdolini, E. Environmental regulation and competitiveness: Empirical evidence on the Porter hypothesis from European manufacturing sectors. Energy Policy 2015, 83, 288–300. [Google Scholar] [CrossRef] [Scilit]
- Acemoglu, D.; Aghion, P.; Bursztyn, L.; Hemous, D. The environment and directed technical change. Am. Econ. Rev. 2012, 102, 131–166. [Google Scholar] [CrossRef] [Scilit] [PubMed]
- Aghion, P.; Dechezlepretre, A.; Hemous, D.; Martin, R.; Van Reenen, J. Carbon taxes, path dependency, and directed technical change: Evidence from the auto industry. J. Polit. Econ. 2016, 124, 1–51. [Google Scholar] [CrossRef] [Scilit]
- Calel, R.; Dechezlepretre, A. Environmental policy and directed technological change: Evidence from the European carbon market. Rev. Econ. Stat. 2016, 98, 173–191. [Google Scholar] [CrossRef] [Scilit]
- Dechezlepretre, A.; Glachant, M.; Hascic, I.; Johnstone, N.; Meniere, Y. Invention and transfer of climate change mitigation technologies: A global analysis. Rev. Environ. Econ. Policy 2011, 5, 109–130. [Google Scholar] [CrossRef] [Scilit]
- Verdolini, E.; Bosetti, V. Environmental policy and the international diffusion of cleaner energy technologies. Environ. Resour. Econ. 2017, 66, 497–536. [Google Scholar] [CrossRef] [Scilit]
- Costantini, V.; Mazzanti, M. On the green and innovative side of trade competitiveness? The impact of environmental policies and innovation on EU exports. Res. Policy 2012, 41, 132–153. [Google Scholar] [CrossRef] [Scilit]
- Copeland, B.R.; Taylor, M.S. Trade, growth, and the environment. J. Econ. Lit. 2004, 42, 7–71. [Google Scholar] [CrossRef] [Scilit]
- Grossman, G.M.; Krueger, A.B. Economic growth and the environment. Q. J. Econ. 1995, 110, 353–377. [Google Scholar] [CrossRef] [Scilit]
- Antweiler, W.; Copeland, B.R.; Taylor, M.S. Is free trade good for the environment? Am. Econ. Rev. 2001, 91, 877–908. [Google Scholar] [CrossRef] [Scilit]
- Barbieri, N.; Ghisetti, C.; Gilli, M.; Marin, G.; Nicolli, F. A survey of the literature on environmental innovation based on main path analysis. J. Econ. Surv. 2016, 30, 596–623. [Google Scholar] [CrossRef] [Scilit]
- Popp, D. Environmental Policy and Innovation: A Decade of Research; NBER Working Paper No. 25631; National Bureau of Economic Research: Cambridge, MA, USA, 2019. [Google Scholar] [CrossRef] [Scilit]
- Wagner, M. On the relationship between environmental management, environmental innovation and patenting: Evidence from German manufacturing firms. Res. Policy 2007, 36, 1587–1602. [Google Scholar] [CrossRef] [Scilit]
- Johnstone, N.; Hascic, I.; Popp, D. Renewable energy policies and technological innovation: Evidence based on patent counts. Environ. Resour. Econ. 2010, 45, 133–155, Erratum in Environ. Resour. Econ. 2017, 68, 441–444. [Google Scholar] [CrossRef] [Scilit]
- Nesta, L.; Vona, F.; Nicolli, F. Environmental policies, competition and innovation in renewable energy. J. Environ. Econ. Manag. 2014, 67, 396–411. [Google Scholar] [CrossRef] [Scilit]
- Franco, C.; Marin, G. The effect of within-sector, upstream and downstream environmental taxes on innovation and productivity. Environ. Resour. Econ. 2017, 66, 261–291. [Google Scholar] [CrossRef] [Scilit]
- Fischer, C.; Newell, R.G. Environmental and technology policies for climate mitigation. J. Environ. Econ. Manag. 2008, 55, 142–162. [Google Scholar] [CrossRef] [Scilit]
- Hascic, I.; Migotto, M. Measuring Environmental Innovation Using Patent Data; OECD Environment Working Papers No. 89; OECD Publishing: Paris, France, 2015. [Google Scholar] [CrossRef]
- WIPO. World Intellectual Property Indicators 2024; World Intellectual Property Organization: Geneva, Switzerland, 2024. [Google Scholar] [CrossRef]
- Barro, R.J.; Sala-i-Martin, X. Convergence. J. Polit. Econ. 1992, 100, 223–251. [Google Scholar] [CrossRef] [Scilit]
- Soete, L. The impact of technological innovation on international trade patterns: The evidence reconsidered. Res. Policy 1987, 16, 101–130. [Google Scholar] [CrossRef] [Scilit]
- Li, S.; Du, Z. Moderating roles of green technologies and trade diversification in resource-driven ecological pressures: Evidence from G-20 economies using a panel MMQR approach. Front. Environ. Sci. 2026, 13, 1705449. [Google Scholar] [CrossRef] [Scilit]
- Kim, D.-H.; Lin, S.-C. Trade openness and environmental policy stringency: Quantile evidence. Sustainability 2022, 14, 3590. [Google Scholar] [CrossRef] [Scilit]
- Saidi, H.; Ozturk, I.; Hakimi, A. Patents on environment-related technologies, research and development, and sustainable development: Investigating the moderating role of climate finance in OECD and non-OECD countries. Financ. Res. Lett. 2025, 86, 108646. [Google Scholar] [CrossRef] [Scilit]
- Ramirez, D.; Muñoz Tabora, J.; Melgar-Dominguez, O.D. Decoupling economic growth from CO2 emissions in Honduras: A longitudinal machine-learning and econometric assessment of low-carbon development, 1990–2023. Sustainability 2026, 18, 7726. [Google Scholar] [CrossRef] [Scilit]
- Mehmood, S.; Kaewsaeng-on, R. Can OECD countries lead the green transition? Leveraging green innovation, trade openness, information globalization and financial depth for environmental sustainability. J. Clean. Prod. 2026, 538, 147244. [Google Scholar] [CrossRef] [Scilit]
- Chen, C.; Pinar, M.; Román-Collado, R. Green innovation and energy efficiency: Moderating effect of institutional quality based on the threshold model. Environ. Resour. Econ. 2024, 87, 3063–3094. [Google Scholar] [CrossRef] [Scilit]
- Belazreg, W.; Mtar, K.; Smondel, A. The impact of policy stringency on green innovation and environmental performance: A system GMM analysis of 25 OECD countries. Environ. Econ. 2026, 17, 81–95. [Google Scholar] [CrossRef] [Scilit]
- Pinar, M. Convergence in renewable energy innovation and factors influencing convergence club formation. Renew. Energy 2024, 220, 119607. [Google Scholar] [CrossRef] [Scilit]
- Sterlacchini, A. Trends and determinants of energy innovations: Patents, environmental policies and oil prices. J. Econ. Policy Reform 2020, 23, 49–66. [Google Scholar] [CrossRef] [Scilit]
- OECD. Environment-Related Technologies Patents [Dataset]; OECD Data Explorer, OECD.STI.PIE; OECD: Paris, France, 2024; Available online: https://data-explorer.oecd.org (accessed on 1 September 2026).
- Kruse, T.; Dechezlepretre, A.; Saffar, R.; Robert, L. Measuring Environmental Policy Stringency in OECD Countries: An Update of the OECD Composite EPS Indicator; OECD Economics Department Working Papers No. 1703; OECD Publishing: Paris, France, 2022. [Google Scholar] [CrossRef]
- Botta, E.; Kozluk, T. Measuring Environmental Policy Stringency in OECD Countries: A Composite Index Approach; OECD Economics Department Working Papers No. 1177; OECD Publishing: Paris, France, 2014. [Google Scholar] [CrossRef]
- World Bank. World Development Indicators [Dataset]; Indicators NE.TRD.GNFS.ZS, NY.GDP.PCAP.KD, SP.POP.TOTL; World Bank: Washington, DC, USA, 2024; Available online: https://data.worldbank.org (accessed on 1 September 2026).
- Croissant, Y.; Millo, G. Panel data econometrics in R: The plm package. J. Stat. Softw. 2008, 27, 1–43. [Google Scholar] [CrossRef] [Scilit]
- Wooldridge, J.M. Distribution-free estimation of some nonlinear panel data models. J. Econom. 1999, 90, 77–97. [Google Scholar] [CrossRef] [Scilit]
- Santos Silva, J.M.C.; Tenreyro, S. The log of gravity. Rev. Econ. Stat. 2006, 88, 641–658. [Google Scholar] [CrossRef] [Scilit]
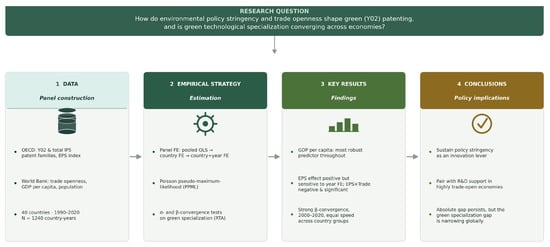
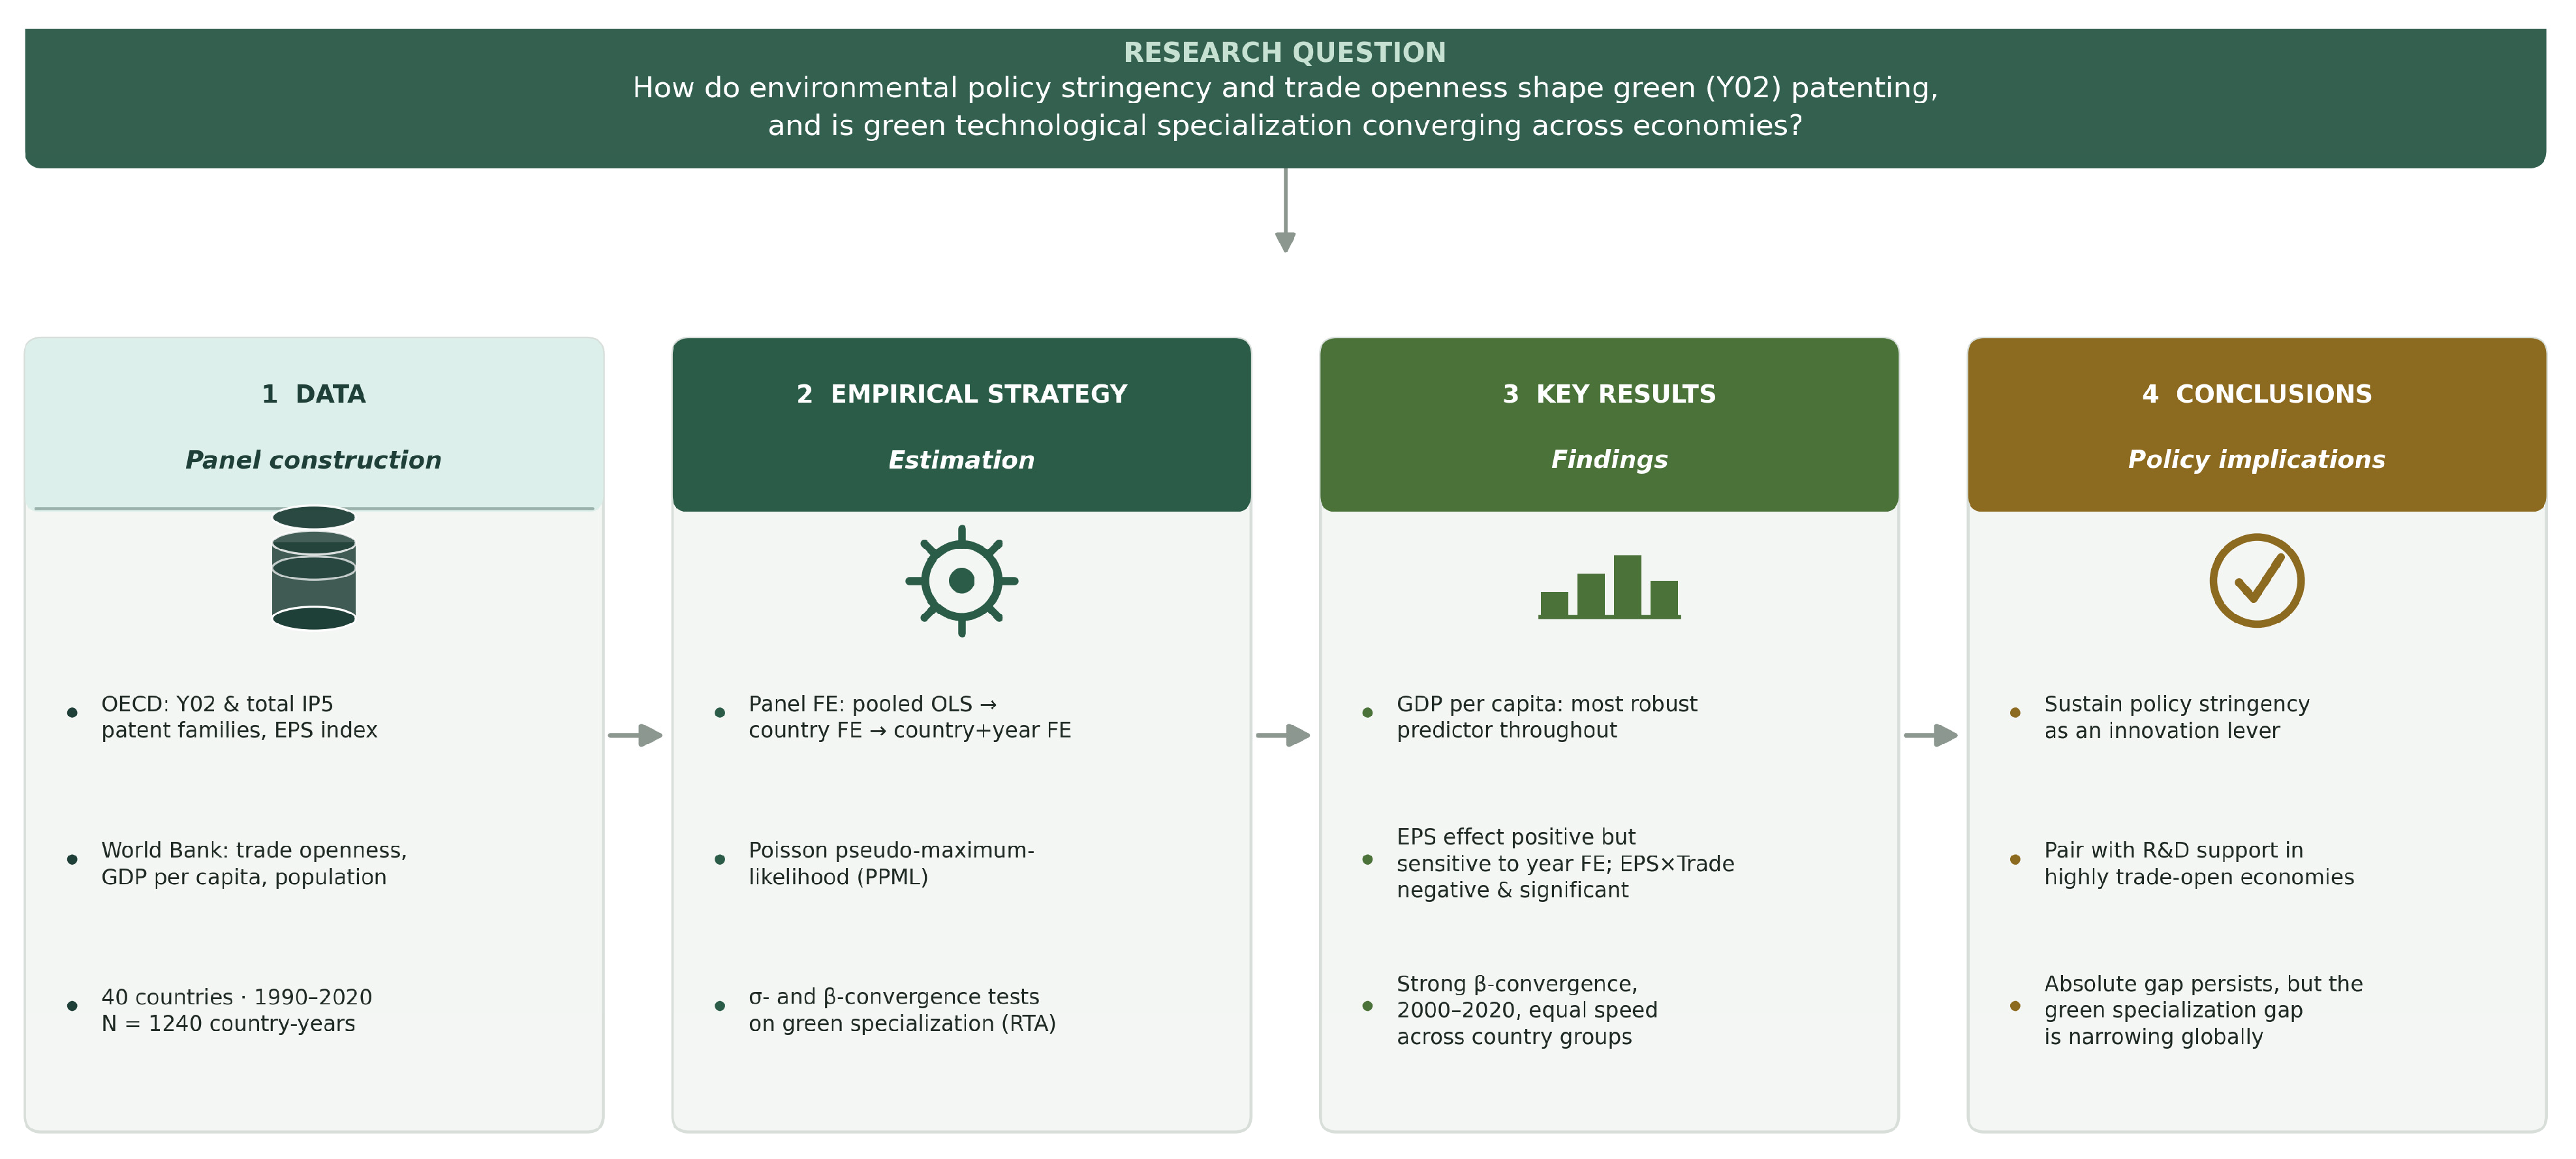
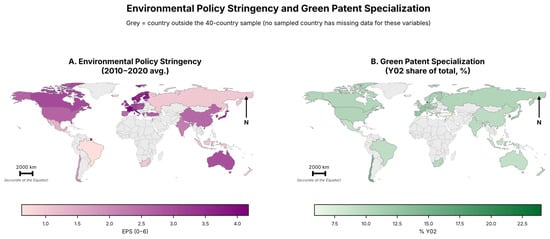
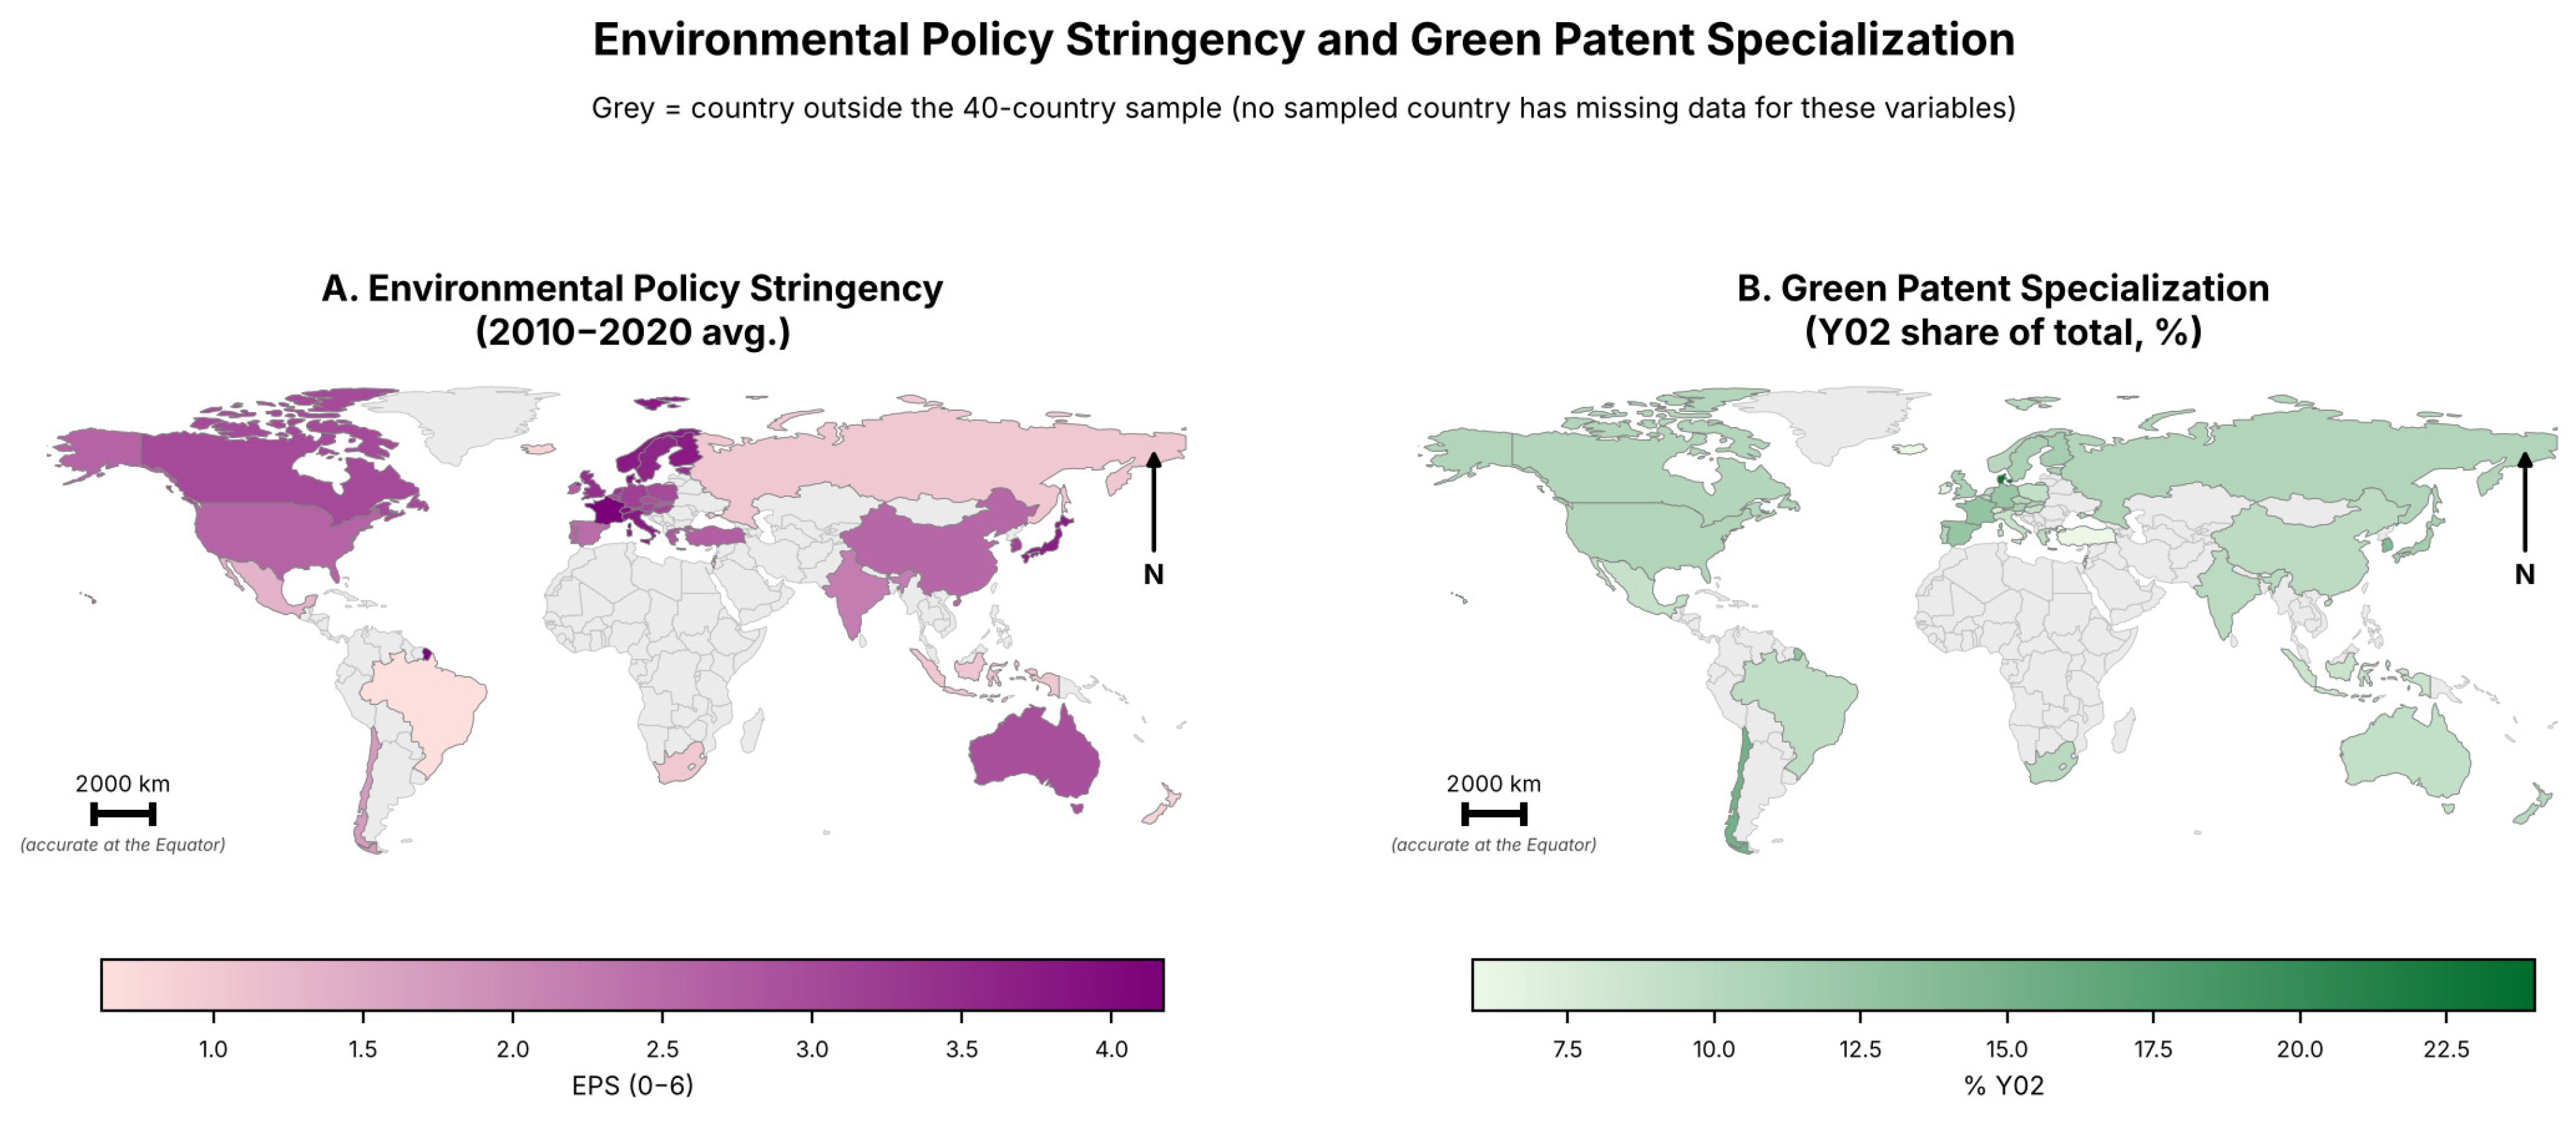
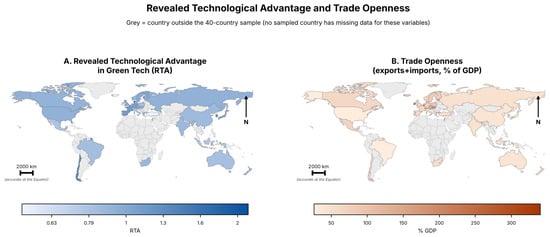
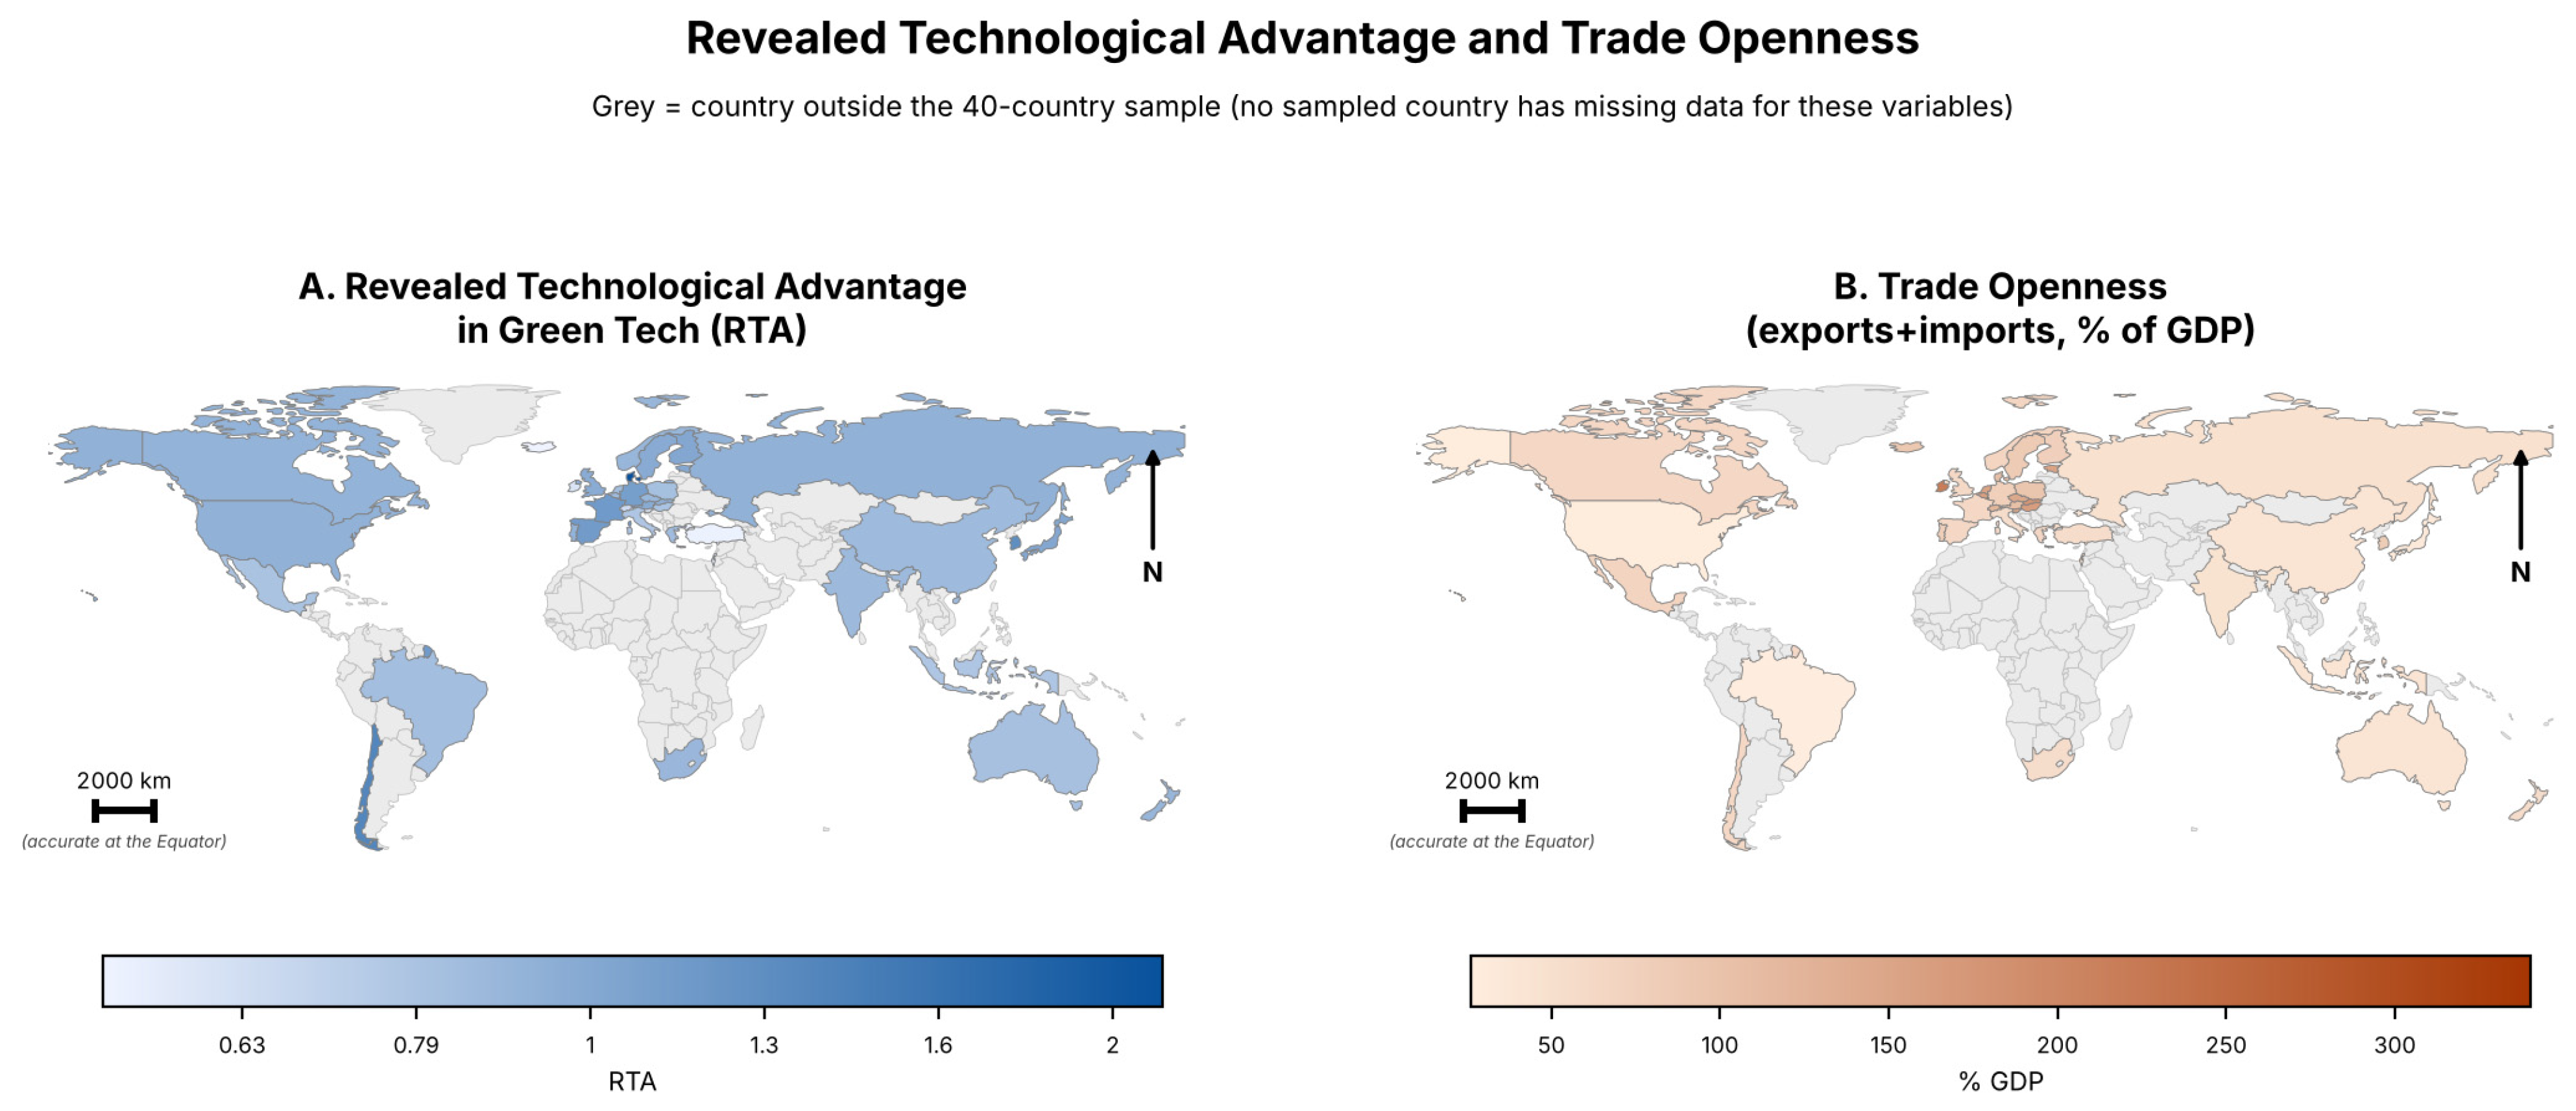
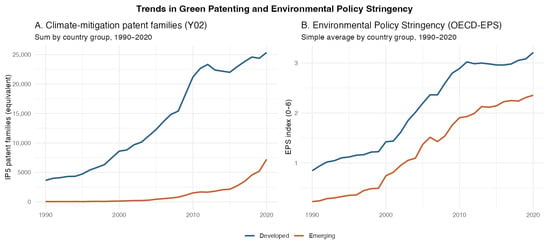
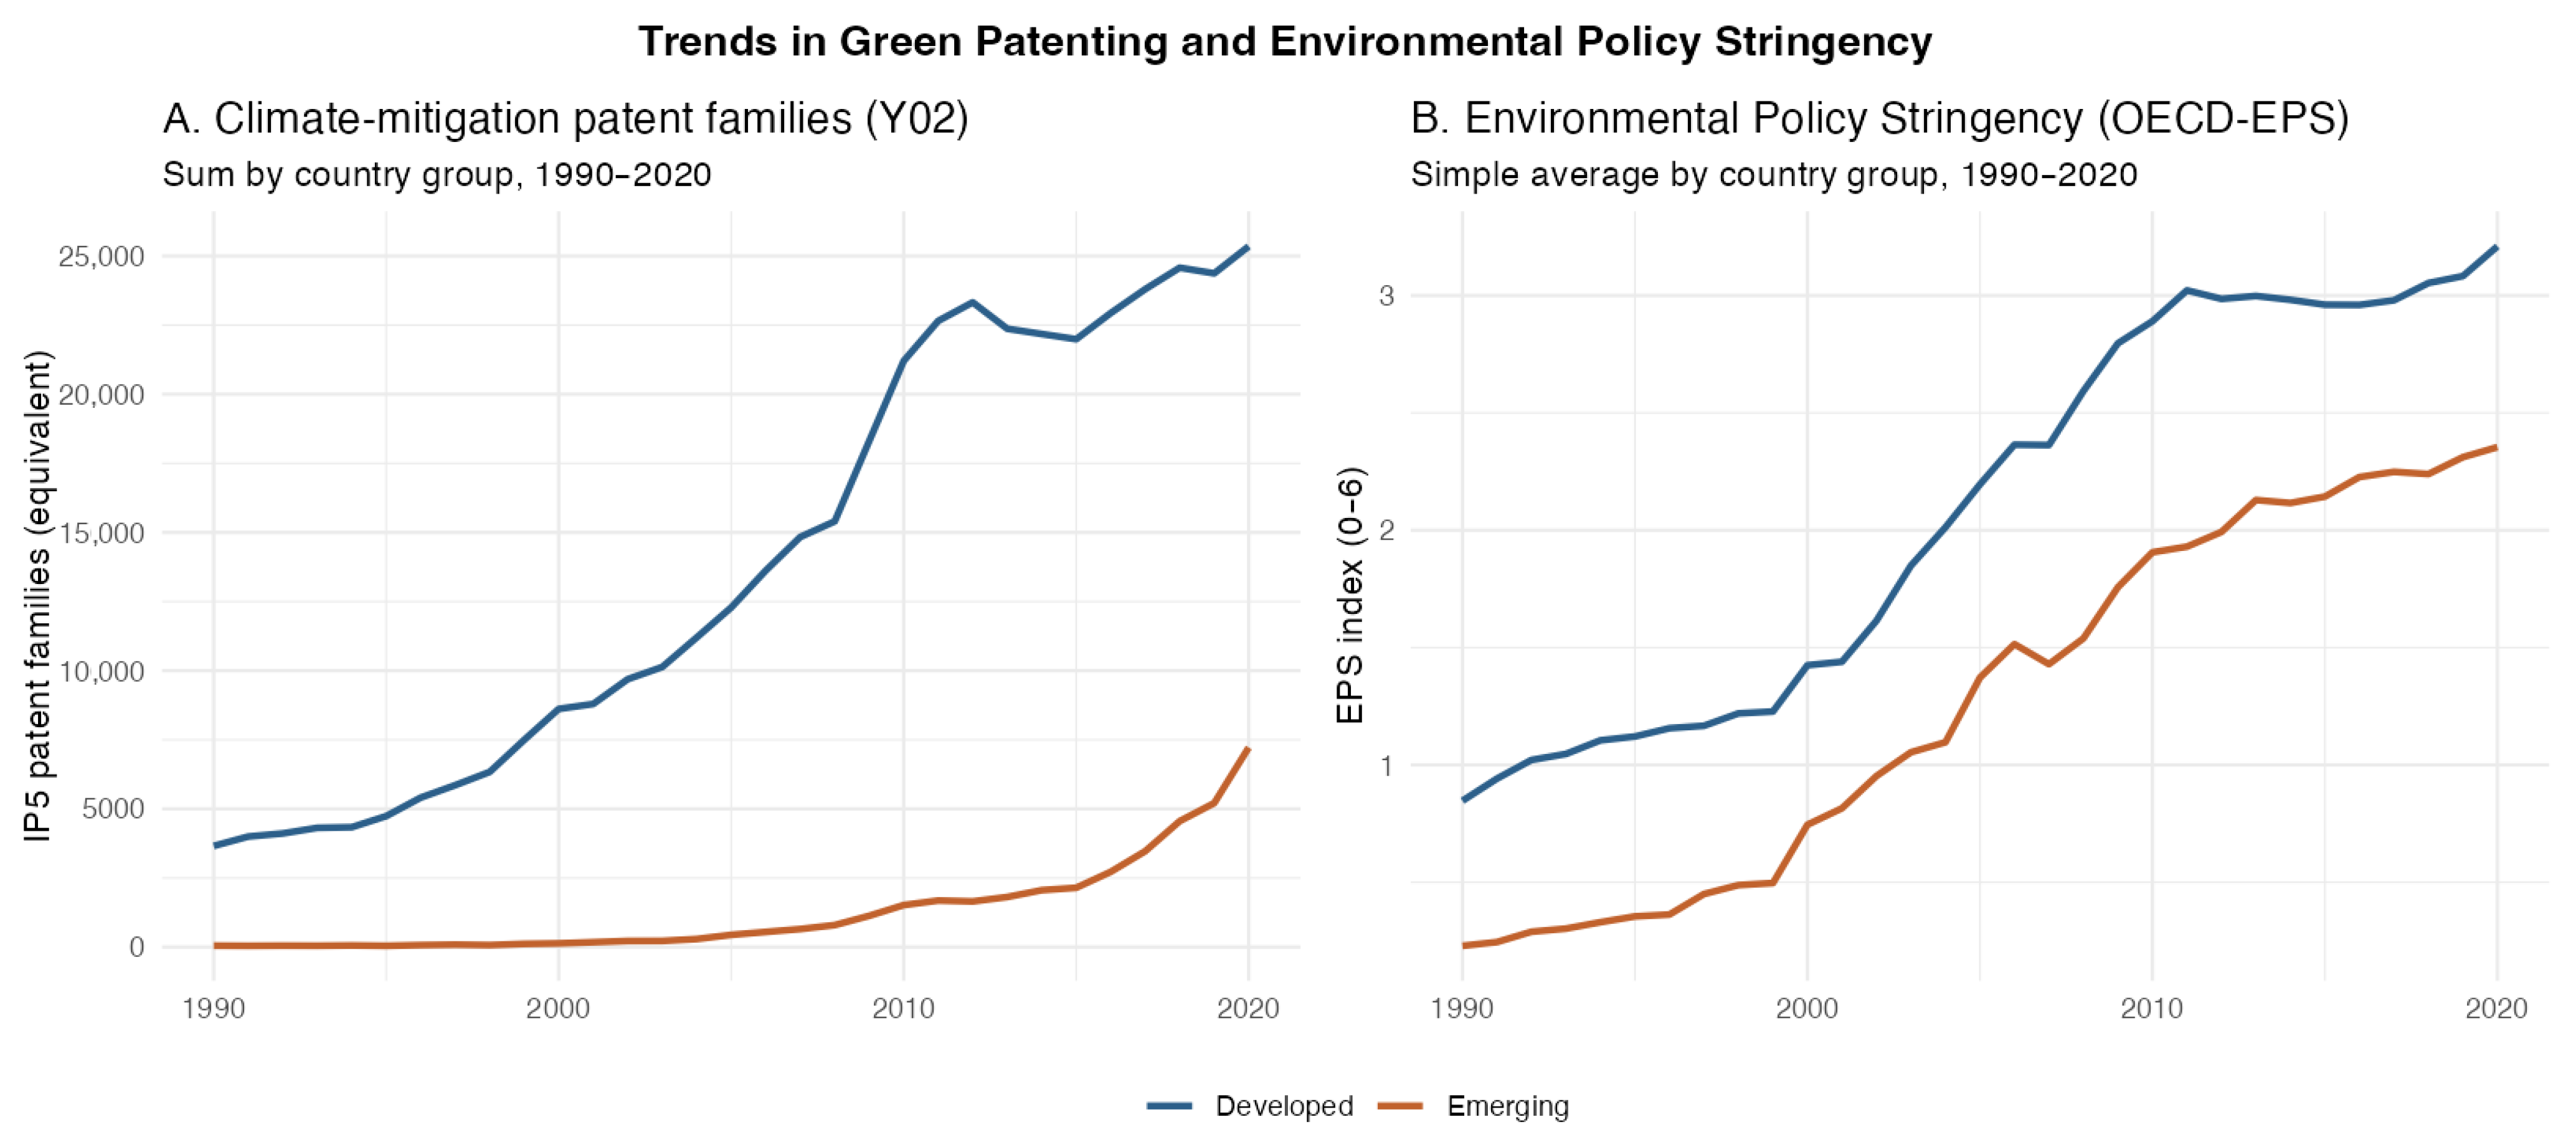
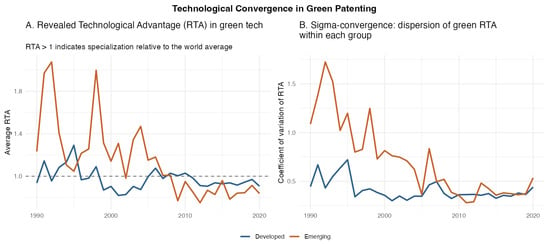
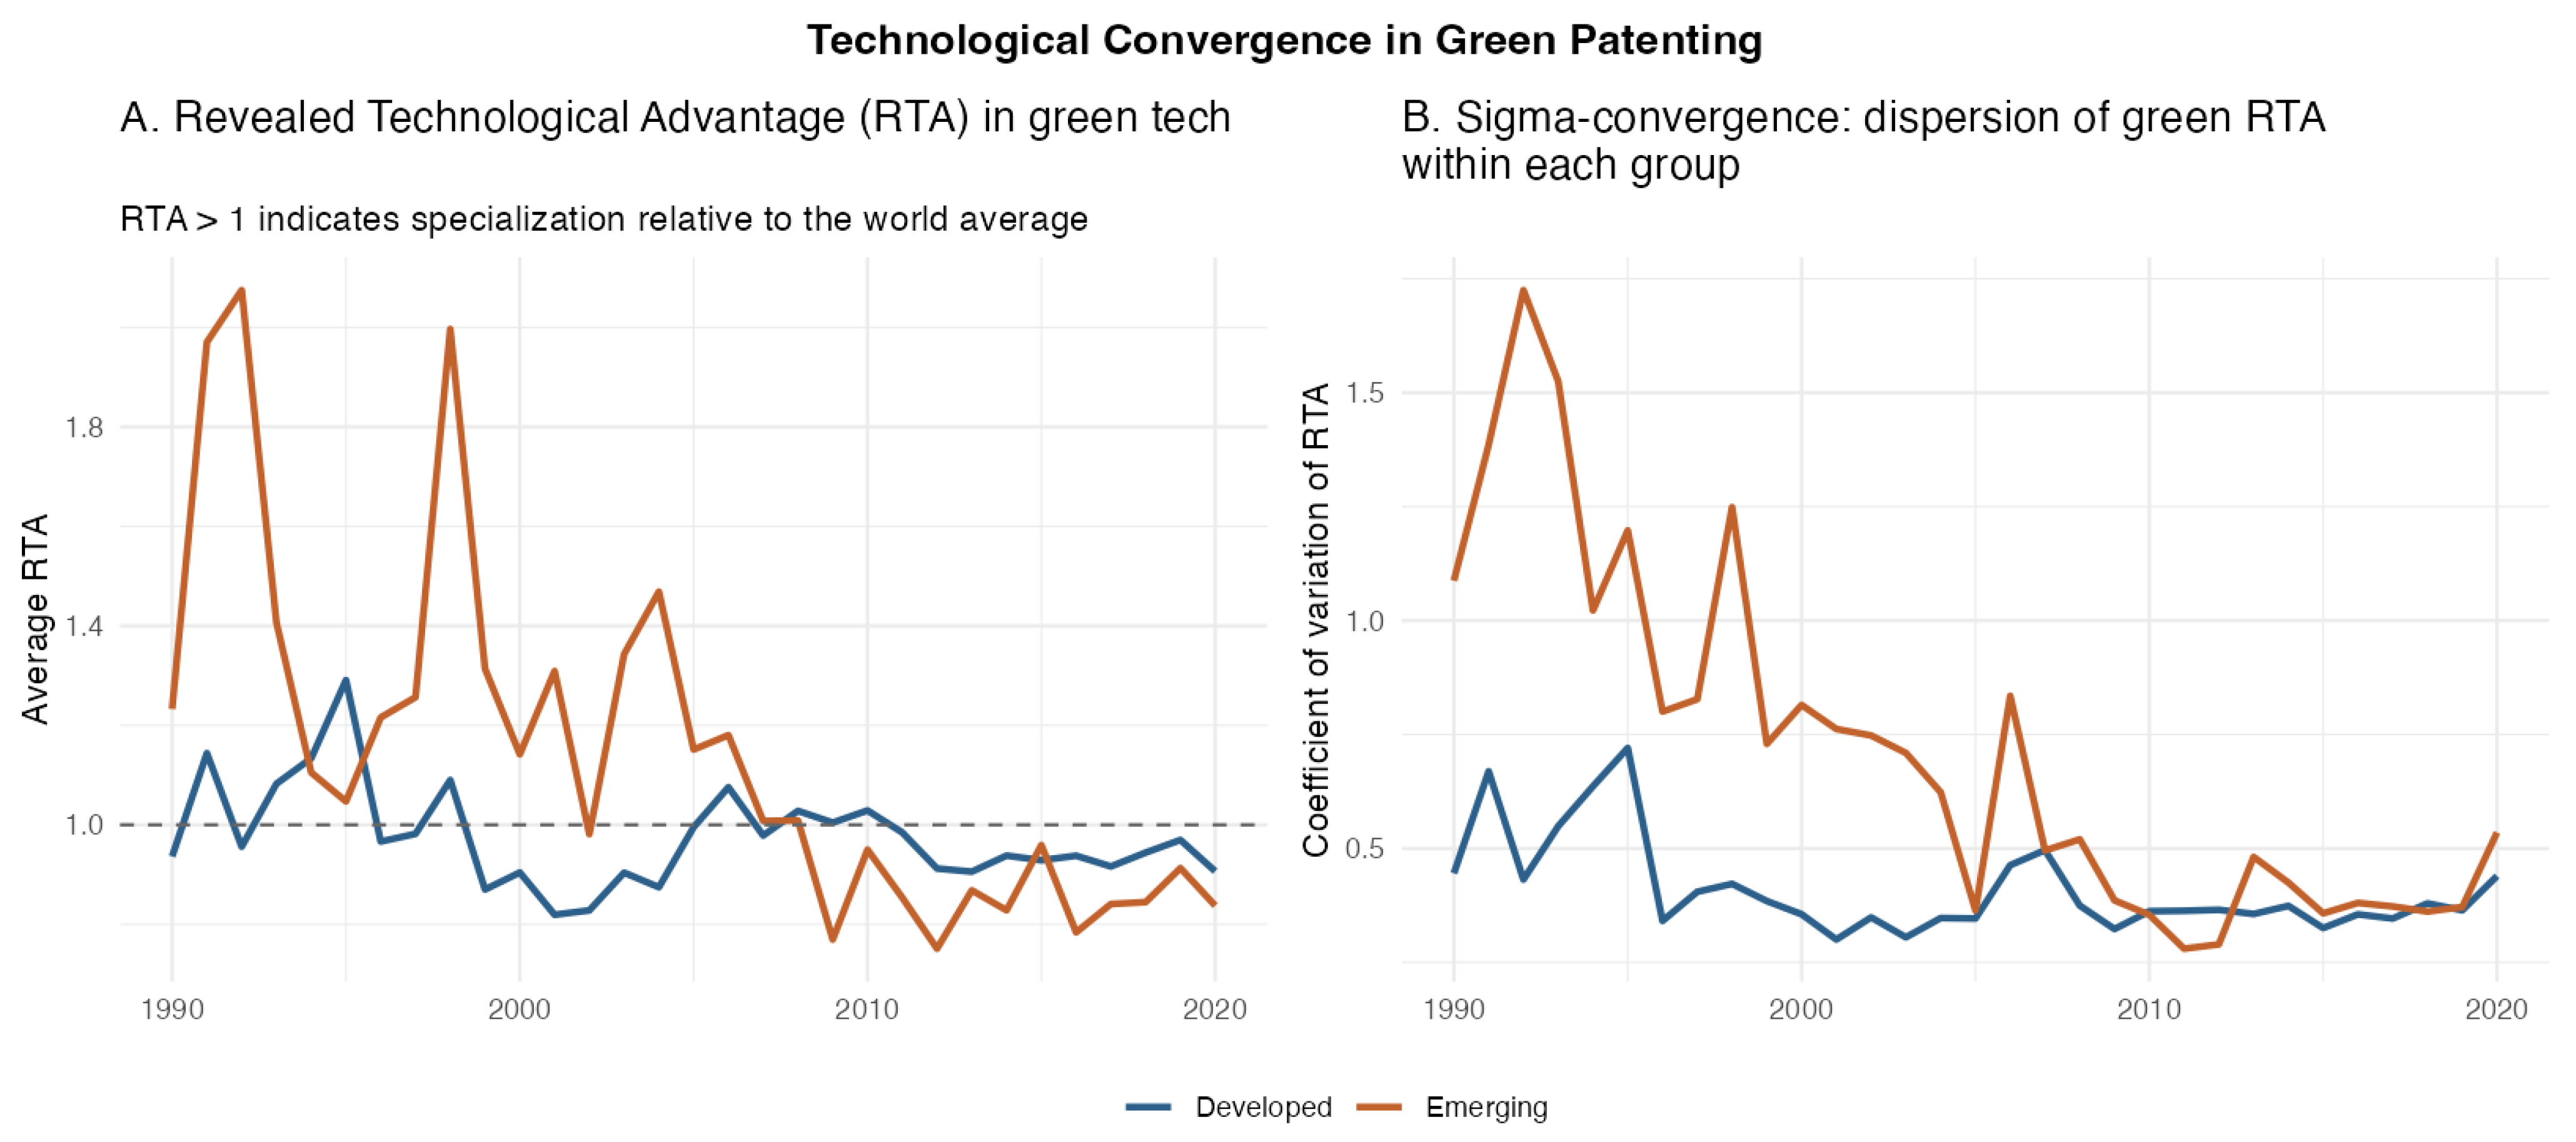
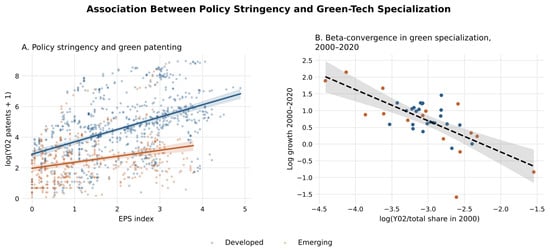
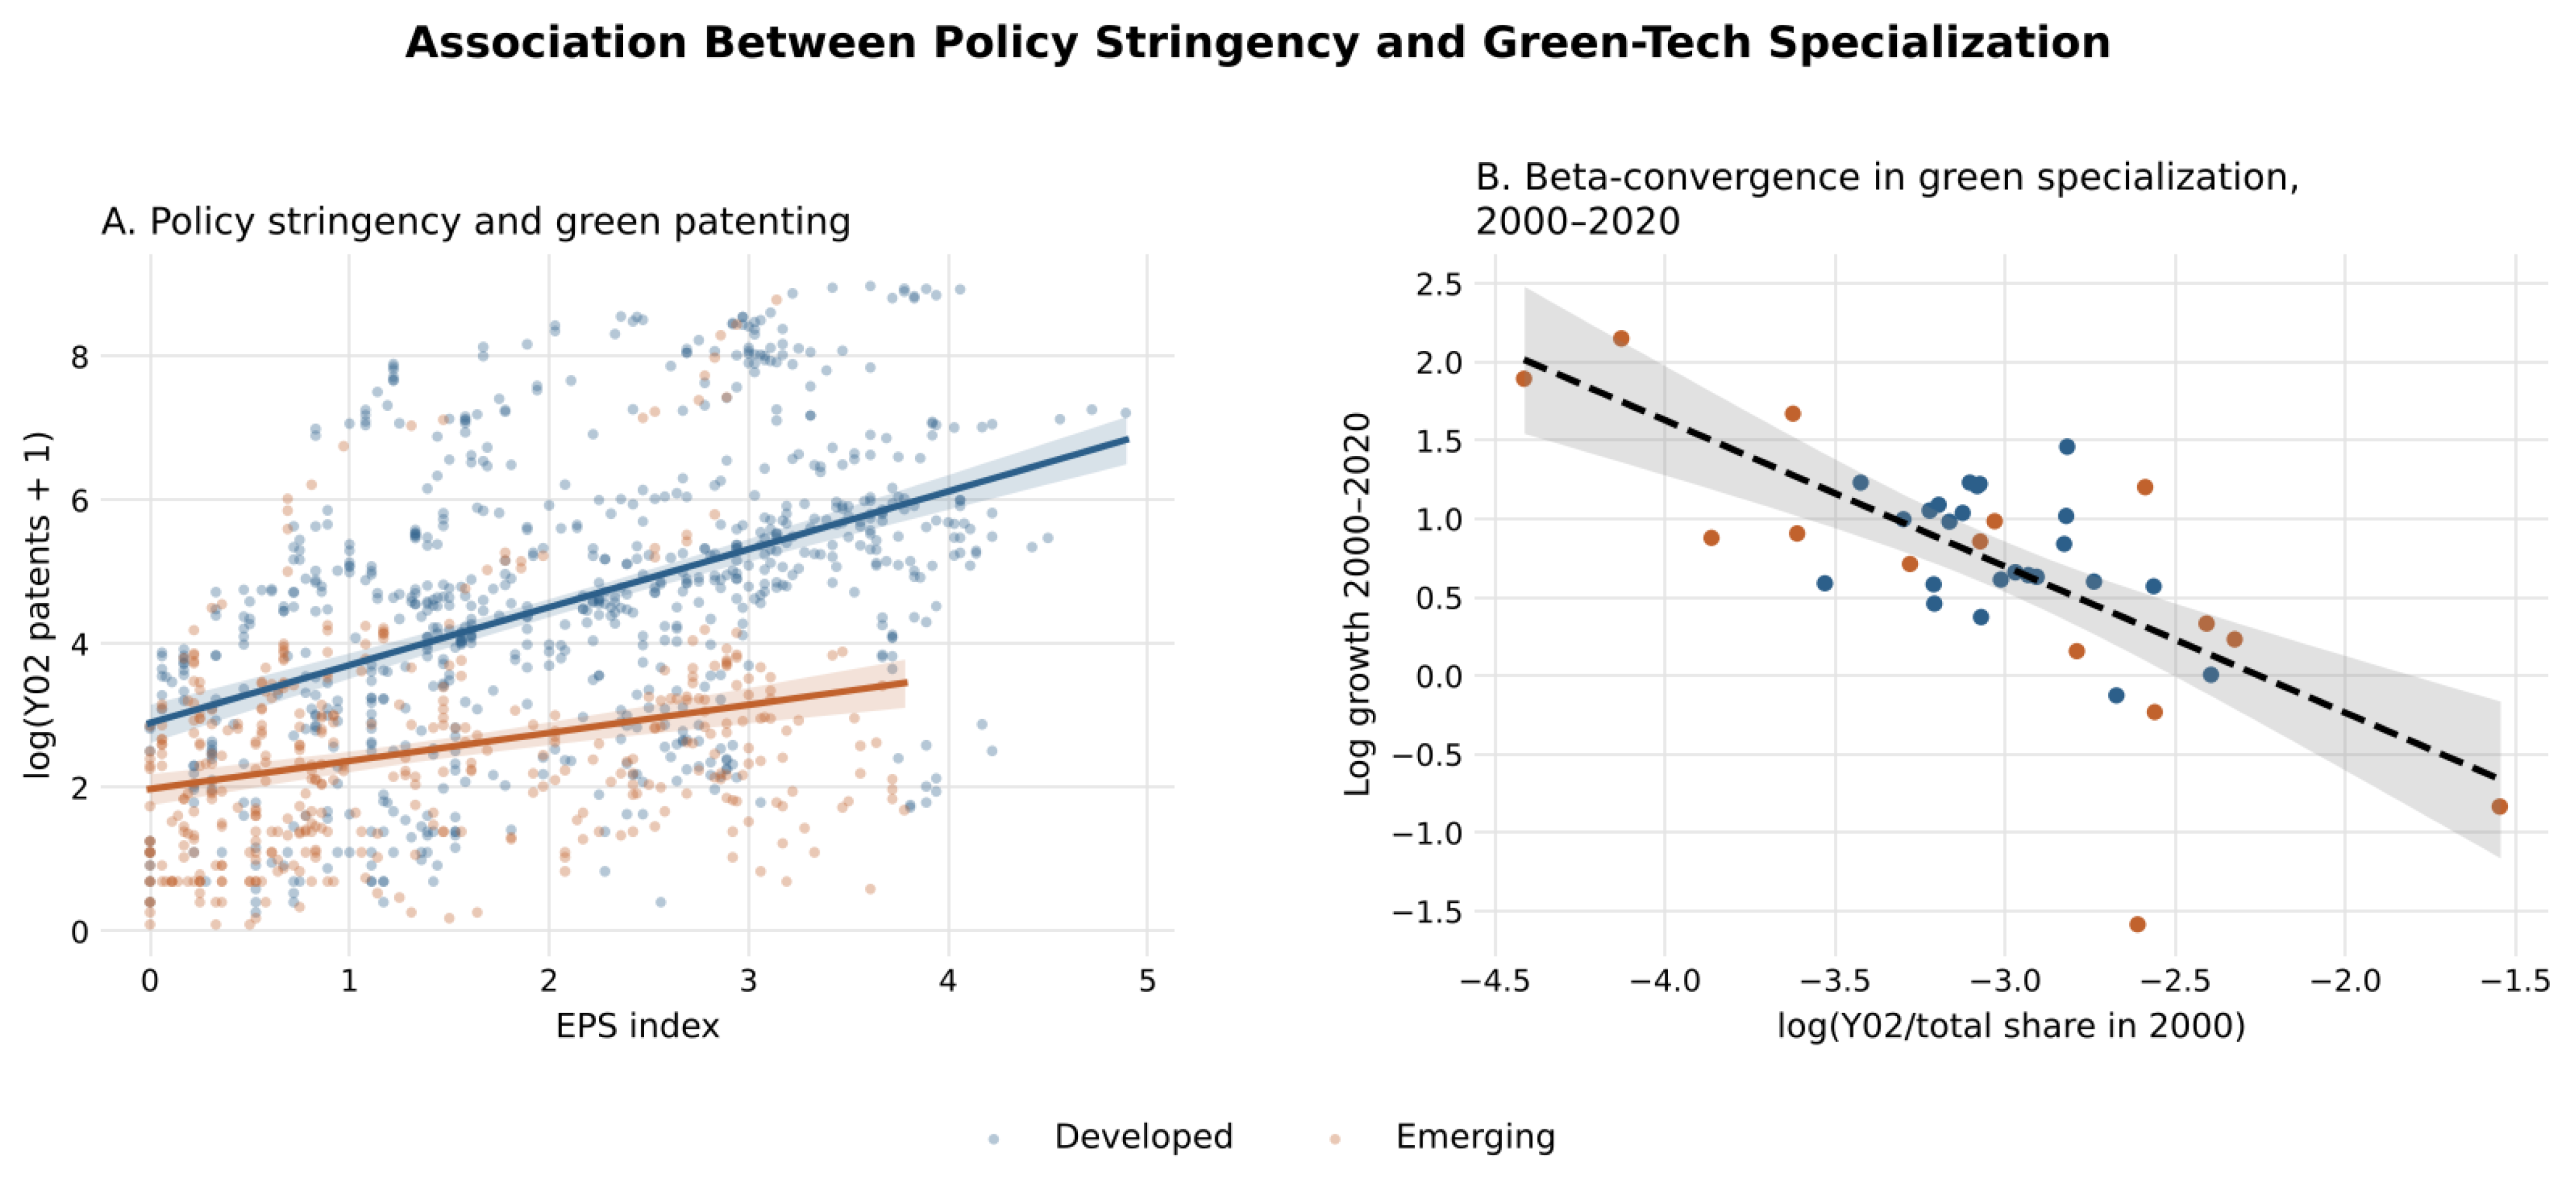

Disclaimer/Publisher’s Note: The statements, opinions and data contained in all publications are solely those of the individual author(s) and contributor(s) and not of MDPI and/or the editor(s). MDPI and/or the editor(s) disclaim responsibility for any injury to people or property resulting from any ideas, methods, instructions or products referred to in the content. |
© 2026 by the authors. Licensee MDPI, Basel, Switzerland. This article is an open access article distributed under the terms and conditions of the Creative Commons Attribution (CC BY) license.