


Abstract
Energy security assessment must connect threats to supply and affordability with consequences for a country’s economy and population. This critical comparative review examines how quantitative approaches support that task and where integration can add value. A purposively selected baseline of 154 publications retrieved through Scopus and Web of Science, supplemented by targeted comparisons, was examined by scope, outcome, uncertainty, valuation, and decision use. Existing models connect energy carriers, infrastructure, economic responses, and protective actions. However, broad coverage, monetary valuation, and probability do not necessarily describe the same outcome. Nine baseline publications provide monetary distributional constructions, spanning different loss, payment, valuation, and strategy-cost accounts rather than comparable measures of total risk. The synthesis supports testing scenario-based models that produce a common monetary loss distribution, expressed as a loss-exceedance curve, within explicit boundaries and with justified scenario probabilities. A hypothetical example illustrates non-overlapping loss accounting, scenario integration, and protection of vulnerable users and critical services. Where probabilities cannot be defended, stress tests and robust decision comparisons remain informative. The research priority is to determine when integration improves estimates or protective choices, while preserving decomposition and information on consequences that monetary aggregation can obscure.
1. Introduction
How well are a country’s economy and population protected against adverse changes in the conditions under which energy is obtained and used? The answer depends on what is measured. The share of imports describes a different property from the probability of a shortage, and the cost of an interruption is not the cost of maintaining reserves. A country may reduce one dependency while increasing another. The central question therefore concerns not only risks within individual domains, but also whether their combined consequences for the economy and population can be assessed.
Assessment at this scale encompasses fuel supplies, infrastructure, the economy, and living conditions, extending beyond equipment reliability or continuity of electricity supply [1,2]. The vital energy systems perspective takes socially important functions and their vulnerability to disruption as its point of reference [3]. A numerical outcome, however, may describe either the conditions underlying security or the consequences of disruptions. Understanding its contribution to national or regional risk assessment requires connecting the study’s scope with the meaning of its outcome and its treatment of uncertainty.
Existing reviews provide a basis for this comparison. Conceptual studies connect research traditions with sovereignty, technical robustness, and resilience [4], and explain how the boundaries of energy security affect the measurement of supply continuity [5]. Reviews of quantitative methods [2] and of definitions and indices [1,6] demonstrate the diversity of approaches and the implications of metric design. Application-oriented reviews examine risk in planning [7], the fit between interruption valuation and analytical purpose [8], and energy transition risks [9].
For comprehensive assessment, it is particularly important to connect these approaches with risk analysis and decision-makers’ needs. Axon and Darton identify weaknesses in the treatment of risk in energy security assessments and argue for drawing on the established body of risk analysis [10]. Macmillan and colleagues connect decision-makers’ questions with the valuation of prolonged interruptions, regional impacts, and the distribution of costs across population groups [11].
This review develops that perspective through a comparison of final outcomes across energy security domains. This is not the first outcome-oriented assessment: Månsson and colleagues distinguish threats, system impacts, and societal consequences, while Ioannou and colleagues explicitly compare risk measures and method outputs [2,7]. The present synthesis extends that comparison to recent applications and asks whether coverage, valuation, and probability describe the same outcome. An index, a conditional consequence, and a probability distribution answer different questions even when they concern the same system. The reference point is an explicit definition of system boundaries and threats, not an assumption that a common outcome must cover every possible event.
The main objective is to summarize, analyze, and synthesize research on quantitative assessment of energy security risk in countries and regions, with particular attention to the prospects for comprehensive measurement. It comprises three tasks:
- Organize the domains, methods, and types of outcomes;
- Compare how uncertainty, consequences, and protective measures are represented;
- Identify achievements and limitations in deriving a common risk outcome, and prospects for integration.
These tasks are addressed through five research questions:
- Q1.
- How do studies operationalize energy security and risk at the scale of countries, regions, and their populations?
- Q2.
- Which methods and data do they use, and what do their outcomes actually measure?
- Q3.
- How do they represent uncertainty, dependencies, and dynamics, and assess the credibility of their estimates?
- Q4.
- To what extent do they provide a common risk outcome, including a monetary outcome, across multiple important domains?
- Q5.
- How do the findings support protective decisions, and which problems remain unresolved?
The review methodology and conceptual framework are followed by a synthesis that moves from supply dependencies to consequences and protection. A comparison of assessment scopes and final outcomes then provides the basis for discussing comprehensive assessment. The article evaluates existing approaches; the research directions it identifies are not a proposal for a new model.
2. Review Methodology
2.1. Review Design and Scope
A critical comparative review with documented purposive selection and descriptive statistics was conducted to identify how existing approaches contribute to national or regional risk assessment. The comparison considered the functions being protected, modeling scope, the meaning of outcomes, and decision uses. Shortage probability, output loss, welfare, and strategy cost measure different quantities. The synthesis therefore focused on explaining their relationship to energy security assessment rather than aggregating non-comparable effects.
The scope covers countries, cross-border systems, and regions with a defined population, economy, or energy system, including entire metropolitan areas. Household and business studies were considered when they described consequences for a population or supported a territorial interpretation. The location of an installation alone does not meet the macro-scale criterion. Fuels, electricity, heat, energy affordability, and transition-related dependencies were examined. Exposure, scenarios, and consequences were considered alongside probabilistic risk assessments to include quantitative inputs to such assessments. Supporting examples of analytical tools served a separate illustrative purpose.
2.2. Search and Selection
Searches in Scopus and the Web of Science Core Collection covered energy security, adequacy, monetary consequences, fuel supply, and critical transition inputs. Territorial relevance was assessed during screening, including for broad queries without macro-scale search terms. Table 1 separates the search frame, screening panel, and synthesis material. The panel combined 819 non-random entries with 600 records from each of two query-broadening increments, stratified by search profile and database provenance. Selection within strata used a deterministic SHA-256 ranking with a seed fixed before drawing.
Table 1.
Sources and units used at successive stages of the review. The search frame and screening panel are distinct from the studies selected for synthesis.
All 2019 panel titles and abstracts were screened. Synthesis selection was then purposive, comparing functions, outcomes, boundaries, and applications, including counterexamples. The 46,497 records outside the panel were not screened for substantive eligibility. The design was not prospectively registered and did not involve uniform full-text eligibility assessment, a numerical stopping target, or demonstrated thematic saturation. The study-level selection register preserves screening histories and citation roles: non-citation is not an exclusion.
An author-led audit sampled 30 initially ambiguous uncited records and 30 other uncited records, adding 16 comparisons after adjudication. Its yield differed by screening history: 6 of 7 previously retained records were added, compared with 10 of 30 ambiguous records and none of 23 recorded exclusions. This prompted a rereading of all 143 remaining retained, uncited abstracts under the same broad criteria. Of these, 135 were judged thematically relevant and 8 unresolved. Fourteen were selected to extend specific comparisons; the other 121 relevant records remain documented but uncited. Theoretical regional models were not excluded merely for using test systems. This improves comparative coverage without establishing completeness.
The descriptive baseline remains 154 publications: 129 from the non-random panel component and 25 from its random component, both subsequently selected purposively. Counts describe this selected material, not field prevalence; sampling weights were therefore not applied. The 30 additional comparisons are documented separately.
First-online dates determined time-window eligibility; earlier studies supplied context. Targeted checks were not a complete database update. PRISMA 2020 and PRISMA-S informed reporting [16,17]; PRESS informed an internal search check, not independent search peer review [18].
2.3. Extraction, Synthesis, and Credibility Checks
Extraction covered scale, threats, data, outcomes, units, horizons, dependencies, valuation, validation, and decision use. The codebook was developed after initial literature examination. Each baseline publication received one primary domain according to its dominant question and one outcome scale; methods and assessment functions could overlap. “Actions and strategies” denotes the primary domain of protective-action assessment, while comparison of actions is also a cross-cutting function. Publications, rather than independent samples or models, are the counting units.
Sensitivity analyses examined domain assignment, outcome definition, source access, panel origin, and publication relationships. All 26 action-assessment publications were alternatively assigned to substantive domains. Documented model/database links and uncertain candidate links were examined separately; shared authorship alone did not establish a link. Grouped counts retain supported member attributes but do not establish independent studies.
Valuation and particular modeling tools were comparative attributes, not inclusion criteria. Broad economic coding includes monetary amounts, relative output or welfare changes, and action costs. A second register links valuation and probability to the same named output, distinguishing distributions, expectations, conditional scenarios, survey heterogeneity, and unresolved representations. This prevents a stochastic input or a method’s name from being mistaken for a probabilistic economic result. Conditional and population distributions remain informative even when disruption occurrence is not modeled.
The author checked all 154 first-pass descriptions, then reassessed 46 publications using packets without earlier codes or rationales: 16 targeted cases and 30 stratified random cases. Twenty-two records differed in at least one of four labels, seven only in domain; adjudication corrected eight mappings and clarified the remaining boundaries. Original responses and comparisons are preserved. The short interval permits recall, and the minimum interval cannot be verified for every record. These checks improve traceability but are neither independent duplicate review nor inter-rater reliability.
Synthesis combined baseline descriptive statistics with qualitative comparison of assessment tasks, outcomes, integration, and reported checks. Confirmed attributes were distinguished from attributes not established by the available evidence, without maturity scores or claims of exhaustive method coverage.
At the baseline, 60 of 179 references relied on abstracts; within the descriptive set, 57 relied on abstracts, 96 included article-text evidence, and one used an executive summary. Lack of full-text access did not exclude a study. Targeted source checks and a common-field examination of 12 article-text cases were complemented by complete stored-abstract readings for the remaining 136 baseline publications. Subsequent source acquisitions are reported separately, preserving the baseline access sensitivity. These are specified-passage checks, not uniform full-text appraisal or model reproduction. Visualizations used R/ggplot2 and Tableau palettes from ggthemes (v5.2.0) [19,20].
3. Conceptual Framework for Quantitative Assessment of Energy Security Risk
Comparing methods requires a shared point of reference: whose security is being assessed, which functions are being protected, and what the outcome means. These distinctions connect the research task with the information needed to assess a country or region.
3.1. Energy Security as an Object of Assessment
Energy security concerns the maintenance of functions important to the economy and population. Cherp and Jewell define it in terms of the low vulnerability of vital energy systems, connecting exposure with resilience and the values being protected [3]. In this review, that perspective encompasses fuel supplies, electricity and heat, energy affordability, and the ability to sustain activity during a crisis.
The significance of a disruption depends on territorial, population, and temporal boundaries. A system may compensate for a local failure, whereas the loss of a shared bottleneck may affect several regions. Supply continuity and the ability to afford energy also describe different conditions of security. Technical reliability is therefore one component of energy security; macro-scale assessment relates infrastructure performance to the functions available to users.
Connecting a threat with its consequences requires identifying exposure and vulnerability. Exposure means being subject to a risk source; vulnerability describes the extent to which that source affects the system; and resilience encompasses the ability to maintain or restore functions [21]. For example, dependence on a gas supplier at risk of disruption determines exposure, while alternative routes, inventories, and substitution shape the consequences of an interruption. These properties explain why similar shocks can lead to different losses.
3.2. From Risk Identification to Protective Decisions
Defining what is to be protected makes it possible to formulate the risk problem. In the terminology of the International Organization for Standardization (ISO), risk concerns the effect of uncertainty on objectives [22]. The focus here is on adverse consequences for energy security. Their significance depends on the party concerned: the same change in prices or supplies may affect an importer, a producer, and a household differently.
In the gas example, risk identification establishes possible disruptions, while risk analysis connects supply and demand conditions with shortages, consequences, and uncertainty. Comparing the outcome with criteria for significance or acceptability constitutes risk evaluation. Together, these tasks form risk assessment [22]. The Society for Risk Analysis (SRA) also recognizes broader uses of the term risk analysis [21]; a study’s contribution is therefore determined by the task it performs, not its terminology alone.
Choosing a storage facility then requires comparing avoided losses with investment costs and assessing feasibility. Risk management also encompasses implementation of protective measures, communication, and monitoring [22]. Optimization supports the choice of an action, whereas evaluation of an implemented policy examines its actual performance. Distinguishing these functions clarifies which decision or further analysis an outcome can support.
3.3. Scope and Meaning of Quantitative Outcomes
Quantitative risk assessment (QRA) connects adverse consequences with a quantitative description of their occurrence or uncertainty. The SRA distinguishes risk from its representations, including scenarios with probabilities and consequences [21]. A physical measure may address unmet demand, while a monetary measure addresses economic loss. The choice of measure follows from the function being protected and the purpose of the assessment.
Studies also provide components of such an assessment. An index describes exposure, and an import-cutoff scenario allows conditional consequences and resilience to be assessed; estimating expected loss over a period additionally requires information on event occurrence. Figure 1 organizes five assessment functions, distinguishing objects of assessment from cross-cutting functions. State or exposure, physical shortfall, and consequences indicate what a study describes; probabilistic representation and comparison of actions can apply to different objects. A probabilistic shortfall estimate may thus support reserve selection. These functions can coexist without forming a quality hierarchy or a mandatory sequence.
Figure 1.
Objects of assessment and cross-cutting functions in quantitative analyses. The layout distinguishes the content of an outcome from its probabilistic representation and decision use. WTP denotes willingness to pay; LOLE, loss of load expectation; and EENS, expected energy not supplied. LOLE and EENS are expectation-based shortfall metrics, combining a physical object with a probabilistic summary. LOLE uses study-specific time units. LEC denotes a loss-exceedance curve.
Interpretation further requires separating assessment scope, a common outcome, and probabilistic representation. Scope defines the threats and consequences covered; a common outcome brings them together within specified boundaries; and probabilistic representation describes uncertainty in a particular variable. The outcome may be a number or a distribution. Comprehensiveness means covering the relevant risk sources, functions, and dependencies within a defined territory and horizon. These distinctions structure the synthesis of domains and the subsequent comparison of integration possibilities.
4. Quantitative Approaches to Energy Security Assessment: Scope, Outcomes, and Applications
The literature provides quantitative answers to questions about supply dependencies, the ability to meet demand, the consequences of disruptions, and the choice of protection. The synthesis below compares the achievements of these research streams, focusing on the meaning of their outcomes. It first describes the selected material and the connections between domains, then examines how studies move from identifying exposure to assessing the functioning of the energy system, economy, and population.
4.1. Characteristics of the Selected Literature
Table 2 organizes the 154 publications by their primary object of assessment. Assigning one domain describes the material without excluding links to others: a gas analysis may include the economy’s response and a reserve decision. Outcome scales comprise 62 national publications, 34 covering multiple countries or cross-border systems, 32 regional studies, 23 concerning user populations, and 3 using stylized models. Outcome scale does not determine data representativeness.
Table 2.
Characteristics of the baseline 154 publications by primary domain. Broad publication attributes and the representation of the selected output are reported separately. Categories overlap; the 30 additional comparisons are outside this denominator.
The main contrast concerns outcome construction. The broad probabilistic attribute occurs in 30/36 adequacy studies and 2/45 consequence studies; explicit probabilistic representation of the selected output gives 19/36 and 6/45. Including conditional monetary and survey distributions therefore reduces, but does not reverse, the contrast. Reassigning action-assessment studies to substantive domains gives 34/41 versus 3/49 under the broad definition and 20/41 versus 6/49 under the selected-output definition. Economic valuation in the consequence domain changes from 44/45 to 48/49. These definition-sensitive patterns describe complementary capabilities, not the relative quality of domains or the prevalence of complete monetary risk models.
Figure 2 adds method families to this description. System operation models are associated mainly with adequacy, while economic models and consumer valuation are associated with consequences. Multiple coding preserves combinations of tools rather than reducing them to a single “hybrid” category. Method and outcome codes answer different questions: a probabilistic tool can describe a physical shortfall, a valuation, or a strategy cost. Survey-based monetary distributions and cost quantiles also contribute to consequence assessment [23,24,25]. Their separate treatment in Section 5.2 makes the numerical contrast between domains dependent on the coding boundary, not a ranking of their ability to analyze uncertainty.
Figure 2.
Method families across the five domains of the baseline 154 publications. Each cell gives the number of confirmed publications relative to the domain total; shading represents the proportion. Families can coexist. Zero means that no example was confirmed in the material used, not that the method is absent.
4.2. Connections Between Domains and the Structure of the Synthesis
Figure 3 organizes relationships within the energy system and its economy; Figure 4 later maps the research questions used to study those relationships. Supply changes act through physical availability, prices, or both, while substitution, trade, and user responses shape their consequences. The same exposure can therefore produce different consequences, and uninterrupted supply does not rule out deteriorating affordability. Protective measures, in turn, affect the occurrence of disruptions, their impacts, and the capacity to recover.
Figure 3.
Macro-scale connections structuring the review. Arrows denote analytical relationships, not estimated effect sizes or a new causal model. Feedback covers exposure, system and user responses, and both groups of consequences within the shared outline. Economic and social impacts may overlap; they are not mutually exclusive components of total loss. GDP denotes gross domestic product.
Figure 4.
Research domains, assessment questions, and outcomes in quantitative energy security analysis. Numbers refer to Section 4.3, Section 4.4, Section 4.5, Section 4.6 and Section 4.7; topics and outcomes synthesize the studies discussed there. Solid arrows indicate selected ways in which analyses can inform one another; the dashed path shows feedback from protective action. These are analytical links, not estimated causal effects or a mandatory modeling sequence. Outcomes are illustrative, may overlap across domains, and are not additive components of total loss.
The synthesis follows these connections without treating them as mandatory stages of every model. Fuel studies may include economic responses, adequacy models may value shortfalls, and optimization may connect several domains. The division helps identify the task performed by each analysis. Within each stream, the measurement capabilities obtained are considered alongside the decisions that the outcome can support.
4.3. Supply Dependencies and Response Capacity
Supply studies identify sources of exposure and assess how diversification, infrastructure, and inventories change the consequences of disruptions. Their common concern is a country’s or region’s vulnerability to changing conditions of energy procurement. Their outcomes nevertheless take different forms: a security profile, unmet demand, economic loss, or a comparison of protective options. The value of this research becomes clear when the description of supply conditions is connected to the ability to sustain the functions being protected.
4.3.1. Identifying and Tracking Exposure
Composite indicators allow multiple system attributes and their changes to be considered together. The 4As framework combines Delphi with the analytic hierarchy process (AHP) [26], while an EU gas ranking uses AHP and the technique for order preference by similarity to an ideal solution (TOPSIS) [27]. A European cloud model extends this perspective to uncertainty in category assignment [28]. A Chinese gas-security index similarly tracks supply, consumption, and trade [29]. These approaches support monitoring and agreement on assessment criteria. The resulting ranking depends on attribute selection, normalization, and weighting; it does not itself determine interruption frequencies.
Dynamic models also examine changes in the state defined by such measures. A Chinese dynamic Bayesian network (DBN) represents security categories [30], while a Markov regime model describes the dynamics of the energy trilemma [31]. A combination of quantile regression, a Bayesian network (BN), and multicriteria regret extends assessment of a resilience index for import-dependent countries [32]. The authors attribute positive index values in the combined-crisis years to the 2021–2022 post-pandemic rebound rather than benefits from the shocks. Distributions of classes and indices enrich the description of system state, but measure a different object from loss distributions.
Diversification assessments move from monitoring to comparing supply structures. A comparison of China, Japan, the USA, and the EU relates import shares to country risk and export potential [33]; an examination of index construction shows how weights affect rankings [34]. Multicriteria assessment of gas options orders preferences [35], while portfolio and optimization models select supply shares according to specified cost and risk criteria [36,37]. These approaches inform import policy, with interpretation depending on the definition and calibration of risk.
Network and temporal analyses help identify the mechanisms behind exposure. Removing a country from a trade network reveals changes in connections [38,39]; mixed-data sampling (MIDAS) relates geopolitical risk to security over time [40]; and Hassani et al. represent risk-matrix intervals through a Monte Carlo distribution [41]. Topology, covariation, and expert assessments provide different information. Estimating a shortfall additionally requires volumes, capacities, and the possibilities for replacing a lost supplier.
4.3.2. Connecting Supply with Economic Consequences
Consequence models establish what a disruption means for the economy being protected. An assessment of Italian supply corridors connects country and segment indices with a gross domestic product (GDP) equivalent based on energy intensity [42]. Sanctuary et al. relate Swedish GDP losses to annual probabilities of oil disruptions [43]. The latter outcome therefore retains information on different losses and their probabilities rather than only their mean. Section 5 compares the basis and scope of these two constructions.
Representing economic responses makes it possible to move beyond a simple conversion of lost imports into losses. E3ME captures connections among trade, production, consumption, and investment under restrictions on Russian gas [44]. ThreeME examines how the response to a gas shock changes during the Dutch transition [45]. Analyses of the Strait of Malacca and China’s oil system extend the treatment of loss propagation over time and future paths of demand and system capacity [46,47]. They allow the consequences of a similar shock to be examined under different economic conditions.
Valuation also reveals the importance of the financial perspective. A US assessment distinguishes narrow external costs from a broader account of oil-supply risk [48]. A Chinese analysis separates potential output losses from redistribution associated with oil-price changes [49]. In the Southern Cone, the cost of cross-border electricity imports depends on exchange-rate movements between invoicing and payment [50]. Gülpınar and Katata find stronger dependence between financial losses than between volume losses from oil and gas disruptions in Nigeria [15]. A common monetary unit therefore requires both a defined loss boundary and a representation of additional variability.
4.3.3. Infrastructure, Inventories, and Cooperation
Modeling physical delivery capabilities connects exposure with available protection. Praks et al. use Monte Carlo simulation and graph theory on a reference network based on European gas transmission to assess node reliability and the importance of new connections [51]. Its outcome concerns service to consumers rather than country rankings; interpreting it as a forecast additionally requires calibration of failure frequencies and disruption assumptions.
Inventory studies demonstrate different ways of assessing the same resource. A Chinese analysis of oil reserves and alternative fuels identifies a combination that depends on disruption size [52]. The newsvendor model of Kosowski and Kosowska infers shortage cost from storage capacity, provided that capacity reflects the modeled choice rather than only geology or investment history [53]. A Bayesian gas model instead estimates the conditional inventory state after winter for specified consumption, liquefied natural gas (LNG), and generation [54]. These outcomes respectively concern protection selection, valuation implied by a decision, and depletion assessment.
Cooperation and connections between energy carriers expand protective options. An EU model compares joint and national gas protection under alternative winter-demand scenarios, using a non-delivery penalty as an optimization criterion [55]. A scenario of interrupted pipeline gas from Central Asia examines responses to coal-to-gas heating conversion in Jing–Jin–Ji, with LNG providing supplementary peak supply [56]. A Lithuanian OSeMOSYS model links fuel disruptions with heat and electricity [57], while an analysis of four countries in the Baltic region evaluates security under the implementation of optimal measures [58]. This body of work thus includes multi-carrier systems; the benefits depend on whether the assumed cooperation and policies can be implemented.
4.3.4. The Energy Transition and Changing Sources of Exposure
The transition perspective extends assessment from continuity of current supplies to the resources needed for future supplies. Polish development pathways account for macroeconomic effects [59], while Kenyan transport scenarios consider both fuels and battery materials [60]. This wider boundary makes it possible to assess changing resource requirements rather than interpreting lower fuel use as a complete measure of security. Chinese analyses of scarcity-weighted interprovincial fossil-energy flows [61] and of self-sufficiency, technology, and the environment [62] likewise show that the assessment depends on which dependencies are counted.
Probabilistic comparison of European battery demand and domestic cell production extends this analysis to industrial capacity: production shortfalls can be assessed without translating them directly into electricity shortages or monetary damage [63]. The object represented by a probability is therefore as important as the use of a probabilistic model.
These dependencies matter because they affect the functions that the transition is intended to secure. Battery-material recovery and mineral imports describe upstream supply conditions [64,65]; a multilayer cobalt network further models country-level risk propagation and recovery, without establishing monetary losses or scenario probabilities [66]. Electricity access, clean cooking, and EU transport security instead describe functions available to the population [67,68]. This distinction matters when interpreting proxies: a BRICS+ analysis labels the renewable-to-fossil energy consumption ratio renewable energy poverty, rather than directly measuring household deprivation [69]. Analyses of renewable-energy consumption efficiency under crises and geopolitical risk [70], and energy foresight for Ukraine [71], add conditions under which those functions may develop. Together, these perspectives connect resource requirements with social purposes. Whether available resources can meet demand during a disruption then depends on the system’s physical capacity to compensate, which is the focus of the next group of studies.
4.4. System Adequacy and Resilience to Disruptions
Adequacy studies assess whether available supply and compensating resources can meet demand. They provide direct measures of shortfall frequency, duration, or size, as well as comparisons of system development options. Their relevance to macro-scale assessment lies in representing interactions among resources: the loss of one component may be compensated for, but shared adverse conditions can limit several safeguards simultaneously.
4.4.1. Measuring Shortfalls and Resource Contributions
System operation models translate uncertain supply and demand conditions into delivery outcomes. Monte Carlo simulation for Taiwan estimates loss of load expectation (LOLE), while an analysis of Spain reports means and quantiles under random demand, availability, and generation [72,73]. Such outcomes distinguish the average extent of the problem from the adverse part of the distribution, rather than evaluating the system solely by installed capacity.
The assessment of a resource nevertheless depends on the chosen metric and operating conditions. A study of PJM Interconnection (PJM) demonstrates the importance of the metric and dependent outages when retiring coal capacity [74]. A separate approach includes seasonality and temperature-dependent failure rates and infers a value of lost load from the capacity actually procured [75]. A Korean comparison further explains that daily and hourly LOLE use different definitions of a shortfall period and cannot be converted by multiplying by 24 [76]. Measurement perspective also matters: a comparison in Indonesia places provincial and national utility interruption indices alongside users’ reported experience in three cities [77]. The city sample is not nationally representative, and its willingness-to-pay responses cannot be combined with national interruption frequencies without a matched exposure model. Comparisons therefore require consistent definitions, populations, and operating conditions.
Effective load carrying capability (ELCC) and equivalent firm capacity (EFC) assess a technology’s contribution through its interaction with demand and other resources. Studies of photovoltaics in Korea [78] and of renewables and capacity location in the USA [79,80] illustrate these applications. A Chinese approach adds forecasting and external power delivery [81], while a Polish comparison shows that estimates depend on the method and year [82]. These measures support resource portfolio planning; transferring them requires retaining information about system conditions.
4.4.2. Common Causes and Event Chronology
Dependence models explain when nominally available reserves or assistance from neighboring systems may be insufficient. An analysis of Great Britain and Ireland uses extreme value theory and copulas [83], while a North American study represents dependent unit outages [84]. European semi-Markov models capture the duration of availability states and expected energy not supplied (EENS) [85]. A comparison of coordinated and national reliability relates reliability standards to capacity and shortage costs [86]. Accounting for dependencies shifts assessment from the properties of an individual resource to the conditions under which the system operates as a whole.
Chronology is particularly important for storage and hydropower. An Icelandic hydrological tree and an analysis of Spanish flexibility represent constraints across successive periods [87,88]. The latter extends an earlier Spanish adequacy model [73]; these are complementary developments, not independent model origins. Regional Norwegian stochastic scheduling additionally links hydropower environmental constraints with limited transmission and reserve capacity [89]. Its expected operating cost, including penalties, supports operational comparison but is not a measure of total social damage. Simulation outcomes remain tied to the window considered: the absence of shortfalls in the Spanish sample does not establish that they are impossible outside it [90]. A nuclear shutdown scenario in Kansai and near-optimal Java–Bali portfolios serve a different purpose: they compare the consequences of a specified shock or explore the decision space without determining the frequency of future crises [91,92].
Weather studies develop a joint representation of supply, demand, and infrastructure. JERICHO compares German system configurations across weather years [93], while an analysis of British offshore wind describes the spatial conditions of low production [94]. Models of New England and Texas account for demand, location, and transmission [95]. An analysis of the Electric Reliability Council of Texas (ERCOT) system includes data-center load and reports a reconstruction of Winter Storm Uri in 2021 [96]. These approaches connect a hazard with a specific system configuration, although reconstructing a crisis and demonstrating validity under new conditions remain separate tests.
A stress test of a selected portfolio provides another type of information. A Western European model uses 16 climate realizations of 30 years each, optimizing the portfolio for average conditions and then assessing selected favorable and unfavorable years [97]. The unfavorable year was chosen for the lowest variable renewable output in the ensemble; the authors note agreement with an earlier study of the same climate data. This tests the portfolio under adverse conditions without assigning a probability to the selected year. Perfect foresight further makes the result a benchmark rather than necessarily an achievable operational benefit.
4.4.3. Hazards, Recovery, and Infrastructure Interdependencies
Hazard models extend shortfall assessment to prevention and restoration. A Bayesian network of wildfires in the western USA supports grid and storage planning; a cold-weather analysis in Xinjiang links storage duration with curtailment cost; and climate scenarios for the western USA include EENS and nodal prices [98,99,100]. A study of hurricanes and PJM offshore wind connects a synthetic event catalog with preventive shutdowns, inspections, and repairs [101]. The outcome thus also depends on how the hazard is managed.
Identifying a local mechanism can support assessment of a wider territory. A Russian wind study describes regional outages probabilistically [102], while a Finnish study relates interruption frequency to wind and soil frost [103]. A comparison of historical and stronger Finnish storms uses return periods to characterize extreme conditions [104], although their link to event losses and applicable cost rates for an annual monetary account could not be established from the material examined. An Italian resilience framework connects hazard probabilities, component vulnerability, cascading failures, and EENS, comparing predicted failure return periods with observed faults [105]. This is a concrete check of a model component, rather than validation of every downstream consequence.
Infrastructure interdependencies make recovery a system-wide problem. Separating electricity and refinery shocks in the USA distinguishes disruption channels [106]; a Singapore bottleneck model [107] and joint electricity and water restoration in Shelby County [108] bring connected services into the assessment. They broaden the question from whether a component works to which functions can be restored together. A Chinese cyber-physical model estimates provincial load loss using Monte Carlo simulation and Markov states [109]; modeling attack strategy would additionally require representing the attacker’s choices. Probabilistic district heating assessment in Kaunas [110] and nationwide vehicle-charging analysis in Italy [111] show how local resolution contributes to a territorial assessment. Establishing the significance of the resulting shortfalls then requires considering the activities affected and users’ capacity to adapt.
4.5. Consequences for the Economy and Population
Consequence studies explain how an energy disruption translates into lost activity, reduced welfare, and effects on people’s lives. Their central contribution is to account for user responses and economic interconnections. Energy not supplied then becomes one input to loss assessment, with the size of the loss also depending on substitutes, adjustment time, and territorial boundaries. Economic models and consumer valuations capture different parts of these consequences.
4.5.1. Economic Propagation and Adaptation
Production and flow models trace how disruption spreads beyond the energy sector. A European analysis of gas restrictions accounts for production and substitution, while a dynamic model of a Chinese oil shock includes interindustry flows, reserves, and recovery [112,113]. Their outcomes describe the size and trajectory of losses under the scenario considered. Such a trajectory captures adjustment over time but does not itself determine the probability of exceeding a given monetary amount.
Including shortage allocation, prices, and substitution explains why similar deficits can produce different losses. Rationing in metropolitan Shanghai and heat waves in China are analyzed alongside interregional and environmental connections [114,115]. Computable general equilibrium (CGE) models compare the boundaries of the Bay Area and California [116] and the effects of oil reserves in China [117]. An adaptive regional input–output (ARIO) model instead traces the economic consequences of compound drought and heat in Sichuan, including losses from power deficits [118]. Production, GDP, welfare, and adaptation cost are related measures of these responses, not mutually exclusive loss components.
Applications to crises allow the importance of model assumptions to be compared. Slovakia’s 2009 gas shortage was assessed using CGE [119]; an analysis of electricity outages caused by the 2008 Hunan snowstorms compares CGE with input–output (IO) modeling, highlighting the role of substitution and prices [14]. A dynamic CGE model for China extends the allocation of oil-shock consequences between the country as a whole and urban and rural households [120]. An economy-wide perspective can therefore coexist with an examination of differences between groups. Attribution remains a separate challenge: Japanese regional analysis seeks to distinguish the electricity-supply consequences of the 2011 disaster from the disaster itself [121]. The inspected counterfactual forecasts were not statistically distinguishable from observed outcomes, limiting the inference of a separate supply effect in that comparison.
These models also explain shortages arising from economic operating conditions. Ou et al. distinguish “hard” capacity constraints from “soft” shortages arising from operating incentives in China’s energy sector and connect them with price regulation [122]. Other studies of Chinese oil and gas imports combine indices with regression, cointegration, or cost and flow accounting [123,124]. Import exposure can thus be considered alongside production incentives and available supply rather than treating all three as equivalent.
4.5.2. Territory, Time, and Valuation Resolution
Regional analyses show how outcomes change when sectoral connections and adjustment time are included. A German study of 51 sectors compares an account without interdependencies with a Ghosh-type IO model, assigning them different temporal applications [125]. A Scottish dynamic inoperability model includes households and demonstrates a difference between rankings based on relative disruption and monetary loss [126]. In South Africa, consumer costs are compared with dynamic IO; cost quantiles arise from survey responses for specified two-hour interruptions, not from sampling the duration of future interruptions [25]. Each approach provides information on consequences, but their different accounting bases do not justify simple addition.
Finer resolution identifies where and when losses arise. German region–sector–hour valuation reveals variation within the territory, while an analysis of Uri in Texas estimates indirect GDP losses caused by electricity interruptions [127,128]. The latter concerns a specific channel of storm impacts, not all storm damage or average annual loss. Transferring a valuation therefore depends on the concentration of the disruption and opportunities to shift activity.
Microeconomic data complement this picture with observations of behavior. A study of restaurants in Guayaquil uses a quasi-experiment to assess sales, while an analysis of firms in seven Asian countries considers interruptions and backup generation [129,130]. Connecting these findings with the economy requires accounting for firm selection, substitution, and relationships with other entities. Lost sales in the sampled firms are not a direct measure of a region’s lost GDP.
Household responses reveal further adjustment channels. During Zambia’s energy crisis, a survey of 261 households in four provinces documented fuel switching, load shifting, and higher expenditure and energy use [131]. In rural Guatemala, poor reliability reduces the likelihood of grid connection [132]; in six Indian states, improved reliability is linked to adoption of liquefied petroleum gas for cooking [133]. These outcomes concern coping and technology choice. Connection or adoption probabilities are not probabilities of a future supply disruption, and sample expenditure changes do not by themselves establish national damage.
4.5.3. The Value of Supply Continuity to Users
Household studies extend valuation to activities and functions not reflected in market output. A Norwegian analysis of prolonged interruptions examines household functioning [134], while a Californian study values advance warning [135]. A study covering urban Mekelle and rural Ashegoda relates blackouts to household welfare [136]. Household production and expenditure across US states [137], together with a simplified production-based valuation for non-residential users [138], provide alternatives to stated survey responses. These studies connect an interruption with a specific function that is lost.
The choice of method reflects the kind of value needed for the decision. Willingness to pay (WTP) in Senegal, a Korean comparison of WTP with value added, and the marginal cost of reducing interruptions in China measure different aspects of continuity [139,140,141]. A meta-regression transferring the value of lost load (VoLL) to Korea develops the transfer of valuation functions [142]. As Gorman explains, the usefulness of VoLL depends on whether the application concerns investment or allocation [8].
Method comparisons demonstrate the importance of these definitions. In Sue Wing and Rose, CGE welfare losses are much smaller than the outcome obtained by scaling individual WTP values to the population; the authors point to substitution and accounting boundaries and also consider survey bias [116]. A divergence between production-based and contingent valuation approaches also appears in a Korean study [143]. These findings support comparing what is valued before interpreting a larger or smaller amount as more accurate.
Measurement conditions matter as well: a comparison across 27 EU countries finds that Internet and telephone survey modes can affect responses differently across research contexts [144]. Differences in reported values can therefore reflect elicitation as well as differences in the consequences being valued.
Interruption conditions and the choice setting explain further variation. Advance notice, season, and backup supply change adaptation by households in Japan and the EU and by businesses [23,145,146]. Valuation of household production and leisure concerns lost activity, while comparing payment with compensation captures the framing of the choice [147,148]. Only after the consequence has been defined in this way can it be connected with the frequency and duration of future interruptions, as in US projections [149].
Studies of heterogeneity preserve differences among users. Nepalese studies estimate post-crisis WTP and VoLL [150], and compare coping behavior with WTP checked against consumption changes after reliability improves [151]. Korean studies compare contingent valuation with leisure costs and examine protest responses [152], or contrast contingent valuation with choice experiments [153]. Unresolved sample overlap within these pairs limits their treatment as independent corroboration. Bayesian Tobit quantile regression describes conditional variation in valuation [24]. These analyses identify whose continuity is valued and how; annual loss assessment additionally requires the events those users experience.
4.5.4. Social Impacts and Accounting Boundaries
Access and affordability link energy conditions with health. Indian panel data relate household energy transitions to women’s respiratory health and labor productivity [154], while US survey data associate energy hardship with anxiety and depression [155]. These modeled health outcomes broaden the assessment beyond output loss without establishing monetary damage or, by association alone, causation. A thermal-stress study in Western Macedonia uses the upper quartile of its index to identify highly stressed households [156]; that relative classification is not an externally calibrated hazard threshold.
Consequences beyond lost production broaden both the object of protection and the accounting problem. A study of rationing in Ecuador records self-reported loss intervals alongside health and social functioning [157]. It identifies impacts that a production-only account would miss, although online recruitment and the predominance of the Highland region limit national generalization. Comparing severe accidents with attacks on energy infrastructure reveals a different contrast: their frequency, severity, and concentration differ [158]. These event damages and the consequences of interrupted supply belong to distinct channels; integrating them requires tracing which impacts arise directly from the event and which from the loss of energy services.
The economic and social literature thus provides consequence functions that account for adaptation, interconnections, and differences among users. It shows for whom a shortage is severe and how loss changes after adjustment. The outcome depends on the activity being protected and the perspective adopted. Price changes can be equally important: they may worsen users’ circumstances even when physical supply remains uninterrupted.
4.6. Price Risk and Economic Stabilization
Price studies examine security through the cost of obtaining energy and its transmission to the economy. They trace market interdependencies, the consequences of shocks, and the effects of intervention. Together, these tasks show the path from price variability to the assessment of a country and its energy users, without requiring a preceding physical shortage.
4.6.1. Market Variability and Importer Exposure
Modeling the joint dynamics of US oil and gas prices through a Kalman filter, random coefficients, and time-varying variance identifies periods of market coupling and decoupling [159]. This information supports the assessment of hedging options. Its significance for a country or its energy users then depends on consumption, income, contracts, and adjustment possibilities.
Connecting quantity with price is also important when evaluating import policy. An Indonesian biodiesel model propagates structural and parameter uncertainty through system dynamics and Monte Carlo simulation to import requirements [160]. It shows an improvement relative to the baseline scenario even as import volumes increase. Distinguishing change relative to an alternative from the absolute level clarifies what the policy achieves; assessing the burden on users additionally requires their economic exposure to those imports.
4.6.2. Shock Transmission and the Distribution of Consequences
Macroeconomic models connect an energy shock with variables describing the economy. A Chinese Bayesian structural vector autoregression (SVAR) separates oil-shock components and represents the right tail of inflation [161]. A Chinese conditional value-at-risk (CoVaR) network instead captures financial tail interdependencies [162]. The distribution of inflation and financial co-risk describe different consequences; translating them into a national loss requires specifying the party affected and the valuation boundary.
Combining empirical oil-supply risk with a US dynamic general equilibrium model enables counterfactual assessment of monetary policy. Liu and Shi find different effects on households and entrepreneurs despite an improvement in aggregate welfare [163]. The theoretical model of Eichner and Pethig, in turn, shows that an uncertain fuel price, under specified prudence and risk aversion, may justify taxing rather than subsidizing green energy [164]. These approaches connect an instrument with the mechanism through which risk is distributed; the recommendation remains conditional on that mechanism.
4.6.3. Empirical Evaluation of Oil-Market Interventions
Studies of the Strategic Petroleum Reserve (SPR) assess market responses to actual interventions. Stevens and Zhang find no measurable price effect of unexpected releases in their SVAR, while identifying an increase following purchases [165]. Their executive summary also describes an identification strategy based on predetermined purchase schedules and a separate analysis of futures prices within 30 min of release announcements. These approaches distinguish unexpected interventions from anticipated policy rather than treating every reserve movement as the same shock.
Kilian and Zhou examine the cumulative effect of historical interventions. In their estimates, releases following the 1990 invasion of Kuwait jointly reduced the real price by USD 2 per barrel after seven months; emergency releases generally reduce prices, whereas exchanges may increase them over the longer term [166]. The working-paper version details the monthly global market model, identification of supply, current-demand, and inventory-demand shocks through sign, zero, and narrative restrictions, and accumulation of shocks along individual paths before calculating the median [167]. The two references document versions of the same study, not independent evidence.
Comparing these studies explains why effectiveness must be related to the definition of the intervention, the horizon, and the reference point. The comparison does not isolate the cause of the difference in findings, but separates a surprise effect from the effect of a sequence of actions. Price research thus provides both a description of threats and an empirical test of protection. Policy selection additionally requires balancing avoided consequences against implementation costs.
4.7. Actions and Strategies: Assessment and Selection of Protection
Decision studies connect adverse consequences with the choice of an action: changing the energy mix, expanding infrastructure, maintaining a reserve, or selecting a rule for its use. Their contribution is to compare feasible alternatives under specified information and an objective criterion. The documented use of economic valuation and probabilistic outcomes in this selected group (Table 2) motivates a closer question: which consequences enter the criterion used to choose protection?
4.7.1. Comparing System Development Options
Development models compare protection with the costs and constraints of providing it. An integrated Lithuanian assessment connects disruptions, energy not supplied, and cost, while an analysis of interconnections and LNG uses expert parameters in Bayesian indicator distributions [168,169]. System dynamics combined with Markov modeling describes the demand and capacity mix; deterministic mixed-integer linear programming (MILP) addresses ERCOT expansion; and an econometric model of coal-plant retirement probabilities examines PJM capacity prices [170,171,172]. These outcomes represent different sources of uncertainty and selection criteria.
Distinguishing the role of a tool helps establish the basis of such comparisons. Supporting Monte Carlo applications concern uncertainty in the geothermal resource of Cornwall and Devon and reliability and network optimization in Wolaita Sodo [12,13]. They illustrate methods here rather than assess an entire country or region. Randomness in resources and participant behavior must also be distinguished from randomness in a solution-search algorithm: the use of a stochastic tool alone does not determine how policy risk should be interpreted.
Including a cost distribution allows strategies to be compared under adverse realizations as well. Japanese Monte Carlo analysis covers discounted social costs under uncertain fuel and technology prices and deterministic development of the mix; strategies are compared using the median and standard deviation [173]. In Chile, conditional value at risk (CVaR), a tail-mean cost measure, is related to fuel and hydrological uncertainty and to reserve, inertia, and demand constraints [174]. Both concern strategy costs rather than disruption losses alone; the precise investment and operating-cost boundaries must be established before comparing their monetary outcomes.
4.7.2. Rules for Action over Time
Sequential models address how actions should change with the system state and information obtained. A Markov decision process (MDP) connects state, action, transition, and cost or reward. A Chinese oil model uses this structure with discounted costs, while a European hydrogen model uses multistage stochastic programming with illustrative transition probabilities [175,176]. The outcome is an action rule whose predictive interpretation depends on the justification for the transitions and the information available when the decision is made.
Extensions cover different sources of uncertainty and protective resources. Dynamic programming for coal capacity represents demand [177]; reserve models for the Association of Southeast Asian Nations (ASEAN) include price, imports, production, and economic consequences [178]; and further MDPs for China and the USA address rules for acquiring, releasing, and replenishing inventories [179,180]. Option valuation of strategic inventories instead uses risk-neutral probabilities [181]. These are appropriate for the financial valuation adopted but do not represent the frequencies of real crises. Transferring a recommendation requires transitions, costs, and available actions consistent with the institution managing the resource.
The objective function also shapes stockpiling advice. A Chinese dynamic programming model includes acquisition and holding costs, consumer surplus, and endogenous effects on world oil prices [182]. It connects reserve management with market consequences, but these accounting components are not interchangeable with a probabilistic measure of disruption damage.
A game between China and India accounts for other actors’ responses, while dynamic stochastic general equilibrium (DSGE) and CGE models connect reserves with the economy’s response [117,183,184]. They extend assessment beyond a technical storage rule. The meaning of a shortage cost or penalty still requires economic justification, because the same rule may affect the resource operator and the protected economy differently.
Markov-switching DSGE analysis also connects anticipated geopolitical disruptions with output, welfare, and state-dependent subsidy policy [185]. Regime uncertainty can change behavior before a crisis, while a stochastic macroeconomic model need not report its result as an aggregate monetary loss distribution.
4.7.3. Protection Costs, Incentives, and Effectiveness
Assessing investment and resource maintenance connects the costs of protection with the consequences it is intended to reduce. Strategic reserves of coal-fired units in eastern China are evaluated by cost per unit of avoided EENS [186], while a PJM operating-reserve analysis includes temperature-dependent failure rates [187]. Storage siting on the stylized RTS-GMLC test system distinguishes private investors’ objectives from system-wide benefits [188]. Separately, contracts in Guangdong examine coordination under uncertain demand [189]. A favorable system outcome therefore also requires incentives to implement the selected solution. Regional load-shedding control in Tamil Nadu illustrates the distinction between reduced disconnected load and operator revenue [190]; revenue retained is not total social loss avoided. Distributed demand response scaled to Poland’s national load curve provides another protective mechanism [191], but randomized device control alone does not establish a shortage-loss distribution.
Broadening the account can change the basis for choosing protection. Estonian infrastructure maintenance connects failures, repairs, and VoLL, while a Nepalese privatization analysis separates production and tariff effects [192,193]. A Swedish model linking transmission with regional IO shows that higher-order impacts can reach twice the first-order impacts [194]. These models connect technical protection with consequences beyond the infrastructure itself; the discussion examines what this extension means for rankings of actions.
Protection itself may have economic consequences before an event occurs. US Gulf Coast refinery data identify losses associated with anticipatory hurricane responses, including storms that do not make landfall [195]. German municipal planning likewise shows that spatial and temporal VoLL assumptions affect both system cost and the distribution of curtailed supply [196]. An Ebro Basin analysis makes the allocation problem explicit by comparing probabilistic trade-offs among energy, agriculture, and urban water users [197]. These cases show why a lower total cost and acceptable protection for each group are separate decision criteria.
Empirical policy evaluation provides a separate test of benefits. An analysis of the US SPR compares actual costs with counterfactual benefits and finds an unfavorable balance for the historical policy, conditional on assumptions and release coordination [198]. Considered alongside optimization models, it highlights that deriving a rule and evaluating an implemented action answer different questions. Decision research supports the selection of options, rules, and instruments, but the meaning of a recommendation depends on the consequences covered and the conditions of implementation.
Across the five domains, the review therefore identifies complementary measurement capabilities: from supply dependencies and physical shortfalls, through consequences and price transmission, to protection assessment. Figure 4 maps the questions and representative outcomes within these domains, together with selected links between analyses. Some studies already connect these tasks. The next step is to compare how much of the risk a common outcome covers and whether it retains the information needed for a comprehensive national or regional assessment.
5. Opportunities and Limits of Comprehensive Risk Assessment
The domain synthesis establishes the analytical tasks that existing methods support. Table 3 now compares specific forms of integration by coverage, final outcome, and uncertainty. It is not a quality hierarchy: a narrower study may be sufficient for a given decision.
Table 3.
Scope of integration and outcome form in selected approaches. The comparison distinguishes documented achievements from the limits of their interpretation; it does not assess the completeness of the entire literature. DBN: dynamic Bayesian network; IO: input–output; CGE: computable general equilibrium; GDP: gross domestic product.
5.1. Assessment Scope and a Common Outcome
Composite indicators summarize multiple dimensions in one number, but its meaning depends on variable selection, normalization, and weights [6]. Probabilistic security classification in the Chinese DBN also provides a common description, but concerns index classes rather than the value of aggregate losses [30]. A single outcome may therefore simplify communication without determining the likely consequences for the whole economy.
A Lithuanian research line connects stochastic fuel disruptions, electricity, and heat with system operation [57,168]. One formulation combines energy-cost increases and unserved energy into a dimensionless energy-security coefficient averaged across scenarios and time [199]. The 2017 framework retains the disturbance and system models but replaces that weighted coefficient with separate unserved-energy and cost-increase indicators, explicitly citing the subjectivity of component weights [168]. A subsequent four-country application uses a coefficient derived from those consequences alongside system optimization [58]. These are related formulations with different aggregation choices, not independent tests of one unchanged metric. They establish multi-carrier integration while illustrating why the meaning of its common outcome requires examination.
The extension may also concern consequences themselves. Swedish transmission–IO modeling captures interruption effects, while Bay Area and California CGE includes substitution and trade [116,194]. A UK framework combines flood exposure, electricity failures, and economic propagation across 37 regions [200]. A Chinese agent-based supply-chain model follows direct and cascading losses from repeated outages over a year, reporting losses equivalent to 0.49% of GDP, with a range of 0.32–0.63% [201]. That range alone does not establish a predictive annual loss distribution. These applications demonstrate substantial integration; threat coverage, loss accounting, and the interpretation of uncertainty remain separate questions.
5.2. Monetary Valuation and Probabilistic Representation of Risk
The outcome-focused register identifies nine monetary distributional constructions in the baseline 154 publications. Five concern GDP losses, event damage, exchange-rate-related payment exposure, and strategy costs [43,50,173,174,202]. Three report a willingness-to-pay distribution, conditional quantiles of WTP-based outage costs, and survey-cost quantiles scaled to sector totals [23,24,25]. In the South African application, the latter are weekly trade and manufacturing costs in million rand at 2017 prices; their survey basis does not make them merely unit preference values. Another publication reports proportions of respondents in monetary loss bands during blackouts [157]. Neither a fixed disruption scenario nor survey-based estimation invalidates a conditional distribution; interpretation requires identifying whose losses vary and how they are aggregated. The nine therefore represent different constructions, not nine comparable models of total risk. The register also distinguishes explicit probabilistic outcomes whose valuation units remain unresolved [41,158].
Within the same baseline set, six further selected outputs explicitly report monetary expectations without an established reported distribution. For example, expected unserved energy multiplied by a constant value of lost load remains an expected cost [188]; the operator’s net benefit is a separate, broader outcome. The distinction concerns the output being counted, not whether a model is stochastic. The supplementary cross-tabulation links each valuation account to its probability representation and retains unresolved attributes.
Restricting the nine distributional constructions to the 96 publications with evidence from article text retains four: GDP loss, event damage, payment exposure, and the South African sector-cost quantiles. Within the original five-case definition, three remain; both strategy-cost cases rely on abstracts. This access restriction is not a uniform full-text reappraisal or evidence that other studies contain no distributions. The substantive finding is the diversity of outcome accounts and probability meanings, rather than a definition-independent count of monetary risk models.
Sanctuary et al. connect a national GDP-loss function with annual probabilities of global oil-supply disruptions [43]. The probabilities originate in expert assessments by Beccue and Huntington as adapted by Brown [203]. Relating losses to probabilities constructs a discrete distribution for one threat channel. Three printed probabilities differ from Brown’s table beyond rounding, as documented in the Supplementary Materials. The review retains the distributional construction without silently correcting or reproducing its monetary estimates.
A loss-exceedance curve (LEC) gives the probability of exceeding successive loss thresholds. For aggregate random loss over horizon T, its probability form is
where ℓ is the loss threshold. Equivalent information may appear in a table, as in Sanctuary et al., without the term LEC being used. The curve may describe one channel or several connected sources of loss, depending on how is constructed.
The aggregation horizon also matters. An outcome for the entire period differs from the severity of an individual event and from the frequency of events exceeding a threshold. Moving between these representations requires an event-occurrence process, dependencies, and an aggregation rule. Spada and colleagues apply value at risk (VaR), expected shortfall (ES), and spectral measures to energy accidents; the German gas subset measures property damage per event [202]. In the Southern Cone, Monte Carlo quantiles describe local-currency payment exposure over a 30-day invoicing lag, not an absolute maximum loss or ES [50]. Neither outcome is automatically an annual distribution of economy-wide disruption losses.
The object of valuation establishes another boundary. Strategy costs discussed in Section 4.7 describe economic performance under uncertain conditions, rather than an account restricted to disruption losses [173,174]. They support policy comparison, but their components require examination before being used in a common loss account. Gülpınar and Katata, in turn, model dependencies between financial and volume losses from oil and gas disruptions [15]. Their multivariate representation provides a basis for joint exposure assessment; constructing an economy-wide loss curve would additionally require a common account of consequences.
These applications also require different credibility checks, matched to the consequence, horizon, and intended use of the outcome.
5.3. Credibility of Outcomes from Broader Assessments
Table 4 examines eight purposively selected applications spanning all five primary domains and contrasting outcome constructions: an exposure-based supply measure, physical shortfall, security classes, conditional economic consequences, transferred interruption values, event-loss tails, annual GDP losses, and sequential policy cost. The cases illustrate differences in interpretation and checking, not the most successful models or a representative sample of each method. Each is compared on the same four dimensions: uncertainty and time, outcome and valuation, decision use, and the checks identifiable in the evidence examined. “Not established” refers to that evidence boundary, not proof that the original study performed no validation.
Table 4.
Meaning of outcomes and identifiable checks in eight contrasting applications. The final column records checks described in the evidence examined, not independent validation performed by this review or overall model-quality scores (see Section 2).
In the Italian corridor assessment, a rescaled country index serves as a probability, and segment success is aggregated multiplicatively [42]. Interpretation as an interruption frequency requires calibration and justification of independence between segments exposed to common geopolitical conditions.
Model fit is also task-specific. The Great Britain and Ireland analysis checks tail fit and dependencies, but rescales demand to a specified LOLE and assumes independent conventional capacities in the two systems [83]. This compares model behavior within a specified construction rather than providing an unconditional forecast of joint shortfalls. The Chinese DBN tests class accuracy on random data splits, not calibration of monetary-loss probabilities [30]. Jin’s VoLL meta-regression examines fit and variants of transfer across populations; validity for new users requires a separate test [142].
The meaning of loss is equally important. Welfare after economic adjustment and accident-related property damage have different boundaries from the cost of a reserve policy [116,175,202]. Numerical checks also differ from empirical validation: Spada et al. examine convergence of risk-measure integration, while Bai et al. examine policy sensitivity to prices, disruption probabilities and demand elasticity. In Bai et al., Table 1 gives supply shocks of 10% and 20%, whereas Tables 2 and 3 and the case-study text give 1% and 2%. This reporting discrepancy requires clarification for replication; it does not establish which values the code used or invalidate the sequential approach. Credibility therefore depends on checks matched to the intended outcome and decision, not complexity alone.
6. Discussion
6.1. What the Literature Achieves and Why a Comprehensive Perspective Matters
The review shows that quantitative energy security research provides complementary information about the conditions under which a country or region functions. In answer to Q1, studies operationalize security through supply dependencies, the ability to meet demand, economic and social functioning, affordability, and available protection. In answer to Q2, their results quantify exposure, shortfalls, consequences, or the costs and benefits of actions. These quantities serve different purposes: information on threats becomes meaningful for the protected population when linked to compensating resources, disruption impacts, and feasible responses.
The selected set illustrates why these capabilities need to be aligned (Table 2). Adequacy studies more often provide explicit probabilistic outputs, whereas consequence studies more often value economic effects. The contrast is smaller when the same-output register includes conditional monetary and survey distributions. This is a difference in what is represented, not a ranking of research quality. Connecting physical uncertainty with consequences remains a distinct task even when both components are well developed.
The contribution is a cross-domain comparison, not a new definition of risk or aggregation formula. Earlier reviews already connect methods with consequences, uncertainty, and decision use [2,7,8]. Reviews of index construction, risk-assessment consistency, prolonged outages, and transition risks establish complementary requirements [6,9,10,11]. The present comparison shows where those requirements coincide in specific reported outcomes and where a further analytical link is needed. The multi-carrier security coefficient demonstrates that aggregation across disturbances and consequences is already possible [199]. Its dimensionless outcome also shows why broad coverage and monetary loss representation remain distinct. Strategy-cost distributions, conditional outage valuations, and event-loss distributions likewise cannot be treated as interchangeable evidence of comprehensive risk. Scenario mixing and loss accounting are established principles; their application here clarifies the conditions for connecting these different contributions, without demonstrating that a broader model necessarily improves decisions.
Related publications also qualify the breadth of support. Grouping documented model and database links changes the inherited probabilistic count from 69/154 publications to 66/151 units; including candidate links gives 59/138. The nine distributional constructions remain in separate units in both variants. Thus, identified overlap does not explain away their diversity, although neither grouping establishes completeness or independent evidence. The supplement preserves the uncertain links and member contributions.
6.2. Why a Domain-Specific Assessment Does Not Determine Aggregate Risk
Separate assessments identify mechanisms that can disappear in an aggregate outcome, but individually they do not establish the overall balance of protection. Transition examples show changes in dependencies among fuels, materials, and functions available to the population [60,64,65]. Lower exposure in one part of the system may coexist with higher exposure elsewhere. For comprehensive assessment, the important issue is whether likely consequences for the protected population change, not merely whether a single indicator improves. This does not imply that the transition only transfers risk; it establishes the need to assess its overall effects within consistent boundaries.
At the level of consequences, adaptation helps determine that balance. Gas and CGE models show that loss depends on shortages, substitution, and trade [112,116]. Relocating production may reduce losses in the wider economy while leaving a loss in the affected region, and mitigation itself consumes resources [116]. Valuing energy not supplied, production maintained, or stated WTP therefore captures different parts of the account [8,140]. A comprehensive model needs an explicit reference point to avoid treating lost sales, output, and welfare as independent, additive losses.
The answer to Q3 also concerns common causes and time. Dependent shortfalls and failures limit assistance from neighboring systems, while a sequence of adverse periods may deplete storage [83,84,87]. Technical restoration and the recovery of economic activity may occur at different times [113]. An aggregate assessment must represent these relationships over its reporting horizon, including the availability of protection during a crisis and the consequences of successive events.
6.3. The Value of a Common Probabilistic and Monetary Outcome
A common outcome can help decision-makers compare protection against fuel shortages, electricity interruptions, and the consequences of price increases. Monetary valuation relates these different threats to consequences for the protected economy or population, provided that the perspective and horizon are consistent. GDP-loss distributions and models of dependent oil and gas losses offer concrete foundations for this direction [15,43]. Physical measures remain necessary to assess the functions that protection is intended to maintain.
Policy comparison also depends on the information that aggregation retains beyond the mean. Tail measures of losses and strategy costs allow rare, large consequences to be considered [174,202]. Two strategies with similar average costs may warrant different assessments if their extreme losses differ. An LEC can support this comparison by presenting an entire exceedance profile rather than a single value. Its usefulness comes from information about the distribution of a properly defined loss, not from the graphical format itself.
The accounting perspective must be chosen before aggregation: an operator’s financial loss, national value-added loss, and a population’s welfare loss are not interchangeable. Protective expenditure and ordinary system costs should be distinguished from disruption losses [173,174]. Output losses must likewise be separated from redistribution [49]. For example, an additional payment from a domestic consumer to a domestic producer is not, by itself, a net loss for their combined account; payments abroad, resource costs, and welfare changes require treatment consistent with the chosen boundary. Output loss and consumers’ willingness to pay should not simply be added where they value overlapping consequences [8].
Household studies and equilibrium models also show why the incidence of loss matters [134,137,163]. A consistent monetary account should retain results by user group and be accompanied by physical indicators or constraints for essential services. If distributional weights are applied to value losses borne by different groups differently, these are normative choices, distinct from scenario probabilities. An equity-weighted outcome should be reported separately from an unweighted monetary loss. Where consequences cannot credibly be monetized, explicit service constraints or a multi-criteria comparison are more informative than assigning an unsupported monetary value.
Empirical comparisons explain what these safeguards preserve. Los Angeles County households’ WTP and reported unhappiness respond differently to short interruptions [204]; national US data identify distinct vulnerability and preparedness profiles among households using electricity-dependent medical equipment [205]. A common monetary total cannot substitute for those differences in essential needs and capacity to cope.
6.4. Integrating Scenarios While Retaining Decomposition
In answer to Q4, the examined literature already combines carriers, infrastructure, economic propagation, and protective decisions, and some applications provide common monetary or probabilistic outcomes. The material examined does not establish a single validated monetary loss distribution spanning all important energy-security domains within one national or regional boundary. This is an evidence-bounded finding, not proof that such a model is absent from the literature. The useful next step is to connect and test existing contributions, rather than assume that integration starts from an empty methodological base.
This synthesis supports a direction for further research: developing and testing scenario-based models that estimate a common distribution of monetary losses within explicit boundaries. A single model or connected modules should represent threats, exposed functions, and system responses. Expressing the outcome as an LEC then requires distinguishing the integration of alternative scenarios from the aggregation of losses that may occur together.
Within each scenario, co-occurring losses must first be modeled jointly. A fuel disruption, an electricity-price increase, and reduced production may be parts of the same sequence. Marginal curves do not identify dependencies, and adding them does not produce the exceedance curve of the sum. Accounting categories must also avoid overlap, because increased expenditure, lower profit, and lost output can partly describe the same consequence. Identifying common causes and overlapping losses establishes the basis for aggregation.
If scenarios s are mutually exclusive and collectively exhaustive over the possibilities considered for horizon T, the aggregate LEC is then a mixture of conditional curves:
Here, is the scenario probability and the conditional exceedance function. The expression follows the law of total probability. The partition includes a no-disruption state if it belongs to the event space considered. A scenario can retain internal uncertainty; it need not determine the entire history. The loss model must account for the occurrence and consequences of multiple events over the period. Without justified weights, scenario curves remain conditional outcomes, useful for stress testing rather than estimating unconditional exceedance probabilities over horizon T.
Figure 5 organizes these relationships: a joint consequence model provides conditional outcomes and information for decomposition, while justified scenario probabilities support the transition to an aggregate curve.
Figure 5.
Relationships between joint consequence modeling (A), a scenario mixture (B), and model-based decomposition (C). The diagram explains a research direction arising from the synthesis; it does not present a new method or empirical results. The mixture corresponds to Equation (2); decomposition uses the retained model and an allocation rule, not the final curve alone. LEC denotes a loss-exceedance curve.
Retaining the underlying model then allows risk to be decomposed by scenario, sector, territory, or user group. The final LEC alone cannot recover these contributions. Nor does a component that dominates mean loss necessarily dominate the tail. Decomposition requires an explicit rule for allocating shared consequences and costs; combining curves does not replace that rule.
A Hypothetical Illustration of Accounting and Policy Choice
Table 5 illustrates the calculation for one region over one year. All probabilities, losses, and interventions are hypothetical, not estimates from the reviewed studies or a validation of integrated assessment. Three mutually exclusive scenarios have probabilities 0.80, 0.15, and 0.05. The two disruption scenarios retain conditional uncertainty. Loss means foregone regional value added, in millions of constant-price currency units; ordinary costs common to all options are omitted. Protection is assumed to change consequences, not scenario probabilities. Its expenditure represents an incremental real resource cost borne by the region and excluded from residual losses; the combined criterion is not presented as a complete welfare account.
Table 5.
Hypothetical annual loss calculation. is the scenario probability; q is the probability of the indicated outcome conditional on that scenario. Entries under the policy columns are residual losses, excluding protection expenditure.
For the severe compound disruption without protection, suppose the accounts contain 25 units of fuel-only loss, 20 of electricity-only loss, and 15 attributable to their shared effect. Separate fuel and electricity estimates would then be 40 and 35; adding them would count the shared 15 twice. The non-overlapping account gives , not 75. Identifying this overlap requires the underlying consequence model; it cannot be inferred from the two marginal LECs.
For no action, Equation (2) gives and . Expected loss is . A minimizes expected loss plus protection expenditure among the three options, but B eliminates losses above 40 in the assumed states. Thus a mean-cost ranking and a tail comparison need not favor the same action.
Suppose policy additionally requires no more than two hours of interruption to the designated critical service and 25,000 household-hours without essential energy services among vulnerable households in any modeled state. In the severe compound state, no action leaves 12 critical-service hours and 100,000 household-hours, A leaves eight hours and 80,000 household-hours, and B leaves two hours and 20,000 household-hours. B also meets both limits in the other states. It is then the only feasible option, despite its higher expected monetary total. These physical indicators constrain the choice rather than being added to value-added losses. The example shows how a common loss account can support comparison without replacing the protection objectives that aggregation might otherwise conceal.
6.5. Research Gaps and Decision Usefulness
The comparison identifies specific limits of applications: index-class accuracy tests a different property from monetary-loss calibration, and valuing a specified shock leaves its probability to be estimated separately (Section 5). Table 6 turns these distinctions into testable questions about the value of integration. Following the evidence rules in Section 2, the questions concern documented capabilities and unresolved conditions of transfer, rather than a presumed absence of methods.
Table 6.
Literature achievements and testable questions arising from the comparisons. Proposed checks concern the cited applications and conditions of transfer, not a demonstrated absence of methods.
Validation should match what the outcome is intended to support. Tail fit and dependence checks [83], classification accuracy [30], transferability of valuation functions [142], and crisis reconstruction [96] test different properties. Probability calibration is a further requirement when the intended use is forecasting loss exceedances. A model for a changed energy mix needs checks relevant to that change; testing an extreme weather year provides a resilience benchmark [97].
Structural assumptions can be consequential even within one assessment function: alternative transmission representations materially change European resource-adequacy metrics [206]. Testing parameter uncertainty while fixing an unsuitable network representation would miss that source of error.
Uncertainty in scenario probabilities should be distinguished from uncertainty within the consequence model and disagreement about its structure. Where defensible probability ranges exist, varying the weights while preserving their sum, together with consequence parameters and alternative dependency structures, can show the stability of exceedance estimates and policy rankings. These variations are sensitivity ranges, not confidence intervals unless an inferential basis is supplied. Assigning precise probabilities merely to obtain one curve would hide rather than resolve uncertainty. When probabilities cannot be justified, conditional stress tests can assess whether critical functions survive specified adverse conditions. Robust comparisons can instead seek actions that satisfy constraints across plausible states or limit worst-case loss or regret, with the chosen criterion made explicit. An aggregate probabilistic LEC is then not a prerequisite for a useful protective decision.
Applications illustrate this alternative. Western US planning tested against 100 climate realizations identifies a higher-cost pathway without adequacy failures within the examined ensemble [207]. Accra’s energy-system options are compared using regret under fuel, hydrological, demand, outage, and currency uncertainties [208]. These are bounded robustness results, not guarantees against unexamined futures.
The answer to Q5 shows that the value of broader scope also depends on the decision. In the Swedish transmission–IO model, higher-order impacts changed the identification of critical components more strongly than the ranking of expansion options [194]. Modeling entails costs in data and assumptions, as Nolting and Praktiknjo show for supply-security assessments in Germany [209]. Further comparisons should therefore separate the effect of extending a model from changes in horizon, population, or scenario. A common reference point makes it possible to assess whether additional coverage changes the estimate and protective choice; a larger loss estimate alone does not establish greater accuracy.
For sequential decisions, the information actually available at the time of action and the feasibility of implementation also matter [55,175,176]. An outcome obtained under perfect foresight is not automatically an achievable operational benefit. Empirical SPR studies, in turn, demonstrate the importance of reference points, horizons, and coordination, including an unfavorable balance for historical policy [165,166,167,198]. Integrated assessment should therefore compare residual loss after protection and the cost of implementation, not only identify an optimal rule within the model.
6.6. Limitations of the Synthesis
The review identifies constructions and contrasts within a purposively selected set, not method prevalence or complete geographical and threat coverage. Retrieval was limited to two databases and their indexed content; relevant regional or non-indexed literature may therefore be underrepresented. Studies may share data or a modeling lineage, and earlier examples such as dependent oil and gas losses are contextual antecedents rather than additional independent observations [15]. Content access also varied, and the panel did not undergo uniform full-text eligibility assessment (Section 2); this particularly limits negative claims and fine-grained comparisons of validation. Single-author selection and coding retain a risk of interpretive and selection bias, and agreement among tools would not establish correctness. Within these boundaries, the synthesis identifies foundations and requirements for comprehensive assessment, while leaving its comparative performance to be tested.
7. Conclusions
Quantitative energy security assessment provides complementary information on supply dependencies, physical adequacy, economic and social consequences, prices, and protection. The baseline comparison of 154 publications and 30 additional comparisons shows that the central challenge is to connect these capabilities within the same consequence account, population, and horizon. Counting valuation and probabilistic methods separately cannot establish how comprehensively risk is assessed.
Integration already exists across carriers, infrastructure, economic responses, and protective actions. The review’s contribution is to distinguish its coverage from the meaning and uncertainty of the common outcome. The examined material supports components of comprehensive monetary risk assessment, but does not establish one validated loss distribution spanning all important domains. This bounded conclusion identifies a task for further research without implying that specialized models are inadequate for their intended decisions.
Scenario-based monetary loss models merit development and testing where consistent accounting and defensible probabilities are possible. Joint consequences must be modeled within scenarios before alternative scenarios are integrated into an overall LEC. Retaining the model and allocation rules enables decomposition; preserving physical and population-specific indicators prevents a common monetary total from concealing critical needs. Where probabilities cannot be justified, conditional stress tests and robust comparisons provide a useful alternative.
The decisive test is whether wider integration improves an estimate or a protective choice relative to a simpler assessment under comparable boundaries and information. Such comparisons should evaluate residual loss, implementation cost, dependencies, and uncertainty, rather than reward model size or larger loss totals. The resulting research direction is therefore both ambitious and testable: national or regional risk assessment with explicit assumptions, traceable sources of loss, and demonstrated decision value.
Supplementary Materials
The following supporting information can be downloaded at: https://www.mdpi.com/article/10.3390/en19215247/s1. The accompanying Supplementary Materials provide the search and selection documentation, publication-level coding and source-access records.
Funding
This research received no external funding.
Data Availability Statement
Native database exports, complete database abstracts, and source-publication files are not redistributed because of licensing restrictions. The supplied code reproduces checks from the released derived records; it does not reconstruct licensed database retrieval or independently validate source-study models.
Acknowledgments
During preparation and revision, the author used OpenAI Codex (Astra 6) to assist with source organization, screening, extraction, coding and code harmonization, analytical scripts, and translation. Claude Code (Opus 5.5) assisted with selected source checks and manuscript audits. The tools were used under the author’s oversight, and the author takes full responsibility for the final content.
Conflicts of Interest
The author declares no conflicts of interest.
Abbreviations
| AHP | Analytic hierarchy process |
| ARIO | Adaptive regional input–output |
| ASEAN | Association of Southeast Asian Nations |
| BN/DBN | Bayesian network/dynamic Bayesian network |
| CGE | Computable general equilibrium |
| CoVaR | Conditional value at risk in dependence analysis |
| CVaR | Conditional value at risk (tail-mean risk measure) |
| DSGE | Dynamic stochastic general equilibrium |
| EENS | Expected energy not supplied |
| EFC | Equivalent firm capacity |
| ELCC | Effective load carrying capability |
| ERCOT | Electric Reliability Council of Texas |
| ES | Expected shortfall |
| EVT | Extreme value theory |
| GDP | Gross domestic product |
| IO | Input–output |
| ISO | International Organization for Standardization |
| LEC | Loss-exceedance curve |
| LNG | Liquefied natural gas |
| LOLE | Loss of load expectation (with study-specific time units) |
| MDP | Markov decision process |
| MIDAS | Mixed-data sampling |
| MILP | Mixed-integer linear programming |
| PJM | PJM Interconnection |
| QRA | Quantitative risk assessment |
| SPR | Strategic Petroleum Reserve |
| SRA | Society for Risk Analysis |
| SVAR | Structural vector autoregression |
| TOPSIS | Technique for order preference by similarity to an ideal solution |
| VaR | Value at risk |
| VoLL | Value of lost load |
| WTP | Willingness to pay |
References
- Ang, B.W.; Choong, W.L.; Ng, T.S. Energy security: Definitions, dimensions and indexes. Renew. Sustain. Energy Rev. 2015, 42, 1077–1093. [Google Scholar] [CrossRef] [Scilit]
- Månsson, A.; Johansson, B.; Nilsson, L.J. Assessing energy security: An overview of commonly used methodologies. Energy 2014, 73, 1–14. [Google Scholar] [CrossRef] [Scilit]
- Cherp, A.; Jewell, J. The concept of energy security: Beyond the four As. Energy Policy 2014, 75, 415–421. [Google Scholar] [CrossRef] [Scilit]
- Cherp, A.; Jewell, J. The three perspectives on energy security: Intellectual history, disciplinary roots and the potential for integration. Curr. Opin. Environ. Sustain. 2011, 3, 202–212. [Google Scholar] [CrossRef] [Scilit]
- Winzer, C. Conceptualizing energy security. Energy Policy 2012, 46, 36–48. [Google Scholar] [CrossRef] [Scilit]
- Gasser, P. A review on energy security indices to compare country performances. Energy Policy 2020, 139, 111339. [Google Scholar] [CrossRef] [Scilit]
- Ioannou, A.; Angus, A.; Brennan, F. Risk-based methods for sustainable energy system planning: A review. Renew. Sustain. Energy Rev. 2017, 74, 602–615. [Google Scholar] [CrossRef] [Scilit]
- Gorman, W. The quest to quantify the value of lost load: A critical review of the economics of power outages. Electr. J. 2022, 35, 107187. [Google Scholar] [CrossRef] [Scilit]
- Zhou, P.; Wan, G.X.; Wen, W.; Zhu, Q. Energy Transition Risk Assessment: Concepts, Indicators, and Methodological Issues. Engineering 2025, 65, 62–73. [Google Scholar] [CrossRef] [Scilit]
- Axon, C.J.; Darton, R.C. Sustainability and risk—A review of energy security. Sustain. Prod. Consum. 2021, 27, 1195–1204. [Google Scholar] [CrossRef] [Scilit]
- Macmillan, M.; Wilson, K.; Baik, S.; Carvallo, J.P.; Dubey, A.; Holland, C.A. Shedding light on the economic costs of long-duration power outages: A review of resilience assessment methods and strategies. Energy Res. Soc. Sci. 2023, 99, 103055. [Google Scholar] [CrossRef] [Scilit]
- Tantu, A.T.; Biramo, D.B. Power flow control and reliability improvement through adaptive PSO based network reconfiguration. Heliyon 2024, 10, e36668. [Google Scholar] [CrossRef] [Scilit] [PubMed]
- Turan, A.; Brown, C.S.; Shail, R.; Sass, I. Probabilistic assessment of deep geothermal resources in the Cornubian Batholith and their development in Cornwall and Devon, United Kingdom. Geothermics 2024, 122, 103081. [Google Scholar] [CrossRef] [Scilit]
- Hu, A.; Xie, W.; Li, N.; Xu, X.; Ji, Z.; Wu, J. Analyzing regional economic impact and resilience: A case study on electricity outages caused by the 2008 snowstorms in southern China. Nat. Hazards 2014, 70, 1019–1030. [Google Scholar] [CrossRef] [Scilit]
- Gülpınar, N.; Katata, K. Modelling oil and gas supply disruption risks using extreme-value theory and copula. J. Appl. Stat. 2014, 41, 2–25. [Google Scholar] [CrossRef] [Scilit]
- Page, M.J.; McKenzie, J.E.; Bossuyt, P.M.; Boutron, I.; Hoffmann, T.C.; Mulrow, C.D.; Shamseer, L.; Tetzlaff, J.M.; Akl, E.A.; Brennan, S.E.; et al. The PRISMA 2020 statement: An updated guideline for reporting systematic reviews. BMJ 2021, 372, n71. [Google Scholar] [CrossRef] [Scilit] [PubMed]
- Rethlefsen, M.L.; Kirtley, S.; Waffenschmidt, S.; Ayala, A.P.; Moher, D.; Page, M.J.; Koffel, J.B.; PRISMA-S Group. PRISMA-S: An extension to the PRISMA Statement for Reporting Literature Searches in Systematic Reviews. Syst. Rev. 2021, 10, 39. [Google Scholar] [CrossRef] [Scilit] [PubMed]
- McGowan, J.; Sampson, M.; Salzwedel, D.M.; Cogo, E.; Foerster, V.; Lefebvre, C. PRESS Peer Review of Electronic Search Strategies: 2015 Guideline Statement. J. Clin. Epidemiol. 2016, 75, 40–46. [Google Scholar] [CrossRef] [Scilit] [PubMed]
- Wickham, H. ggplot2: Elegant Graphics for Data Analysis, 2nd ed.; Springer: Cham, Switzerland, 2016. [Google Scholar] [CrossRef] [Scilit]
- Arnold, J.B.; Daroczi, G.; Werth, B.; Weitzner, B.; Kunst, J.; Auguie, B.; Rudis, B.; Wickham, H.; Talbot, J.; London, J. ggthemes: Extra Themes, Scales and Geoms for ggplot2, R Package Version 5.2.0. 2025. Available online: https://cran.r-project.org/package=ggthemes (accessed on 30 September 2026).
- Society for Risk Analysis. Society for Risk Analysis Glossary; Technical Report; Society for Risk Analysis: Herndon, VA, USA, 2018. [Google Scholar]
- ISO 31000:2018; Risk Management—Guidelines. International Organization for Standardization: Geneva, Switzerland, 2018.
- Matsubara, M.; Mae, M.; Matsuhashi, R. Investigation of Residential Value of Lost Load and the Importance of Electric Loads During Outages in Japan. Energies 2025, 18, 2060. [Google Scholar] [CrossRef] [Scilit]
- Kim, M.S.; Lee, B.S.; Lee, H.S.; Lee, S.H.; Lee, J.; Kim, W. Robust estimation of outage costs in South Korea using a machine learning technique: Bayesian Tobit quantile regression. Appl. Energy 2020, 278, 115702. [Google Scholar] [CrossRef] [Scilit]
- Akpeji, K.O.; Olasoji, A.O.; Gaunt, C.; Oyedokun, D.T.; Awodele, K.O.; Folly, K.A. Economic impact of electricity supply interruptions in South Africa. SAIEE Afr. Res. J. 2020, 111, 73–87. [Google Scholar] [CrossRef] [Scilit]
- Ye, R.; Zhou, Y.; Chen, J.; Tu, K. Natural gas security evaluation from a supply vs. demand perspective: A quantitative application of four As. Energy Policy 2021, 156, 112425. [Google Scholar] [CrossRef] [Scilit]
- Zeng, F.; Li, J. Study on comprehensive evaluation and countermeasures of natural gas safety in EU. Energy Strategy Rev. 2023, 49, 101167. [Google Scholar] [CrossRef] [Scilit]
- Zeng, F.; Li, J. Research on EU natural gas security and countermeasures based on two-dimensional cloud model. Energy 2024, 305, 132196. [Google Scholar] [CrossRef] [Scilit]
- Li, J.; Zhou, N.; Wu, Q. Natural gas resources security analysis in China. China Min. Mag. 2021, 30, 10–14. (In Chinese) [Google Scholar] [CrossRef]
- Zhang, M.; Zhou, S.; Wang, Q.; Liu, L.; Zhou, D. Will the carbon neutrality target impact China’s energy security? A dynamic Bayesian network model. Energy Econ. 2023, 125, 106850. [Google Scholar] [CrossRef] [Scilit]
- Shirazi, M. Dynamic policy pathfinding for balanced growth of energy trilemma: Evidence from the world’s large energy-consuming economies. Renew. Sustain. Energy Rev. 2025, 214, 115493. [Google Scholar] [CrossRef] [Scilit]
- Mizrak, F.; Canturk, S. Shock-Responsive Energy Security Management and Macroeconomic Resilience in Import-Dependent Economies: A Hybrid Panel Quantile and Regret-Based Decision Framework. Energies 2026, 19, 3032. [Google Scholar] [CrossRef] [Scilit]
- Yang, Y.; Li, J.; Sun, X.; Chen, J. Measuring external oil supply risk: A modified diversification index with country risk and potential oil exports. Energy 2014, 68, 930–938. [Google Scholar] [CrossRef] [Scilit]
- Iqbal, W.; Fatima, A.; Yumei, H.; Abbas, Q.; Iram, R. Oil supply risk and affecting parameters associated with oil supplementation and disruption. J. Clean. Prod. 2020, 255, 120187. [Google Scholar] [CrossRef] [Scilit]
- Devaraj, D.; Syron, E.; Donnellan, P. Diversification of gas sources to improve security of supply using an integrated Multiple Criteria Decision Making approach. Clean. Responsible Consum. 2021, 3, 100042. [Google Scholar] [CrossRef] [Scilit]
- Wang, J.; Sun, X.; Li, J.; Chen, J.; Liu, C. Has China’s oil-import portfolio been optimized from 2005 to 2014? A perspective of cost-risk tradeoff. Comput. Ind. Eng. 2018, 126, 451–464. [Google Scholar] [CrossRef] [Scilit]
- Kong, Z.; Lu, X.; Jiang, Q.; Dong, X.; Liu, G.; Elbot, N.; Zhang, Z.; Chen, S. Assessment of import risks for natural gas and its implication for optimal importing strategies: A case study of China. Energy Policy 2019, 127, 11–18. [Google Scholar] [CrossRef] [Scilit]
- Wang, M.; Tian, L.; Du, R. Research on the interaction patterns among the global crude oil import dependency countries: A complex network approach. Appl. Energy 2016, 180, 779–791. [Google Scholar] [CrossRef] [Scilit]
- Wei, N.; Xie, W.J.; Zhou, W.X. Robustness of the international oil trade network under targeted attacks to economies. Energy 2022, 251, 123939. [Google Scholar] [CrossRef] [Scilit]
- Gong, X.; Sun, Y.; Du, Z. Geopolitical risk and China’s oil security. Energy Policy 2022, 163, 112856. [Google Scholar] [CrossRef] [Scilit]
- Hassani, H.; Danesh, M.A.; Javan, A.; Pospiech, R.; Odulaja, A. A statistics-based approach for crude oil supply risk assessment. OPEC Energy Rev. 2017, 41, 187–200. [Google Scholar] [CrossRef] [Scilit]
- Bompard, E.; Carpignano, A.; Erriquez, M.; Grosso, D.; Pession, M.; Profumo, F. National energy security assessment in a geopolitical perspective. Energy 2017, 130, 144–154. [Google Scholar] [CrossRef] [Scilit]
- Sanctuary, M.; Fagerström, A.; Feiz, R.; Lönnqvist, T.; Lindfors, A. The fuel security and climate policy nexus. Energy Strategy Rev. 2025, 62, 101942. [Google Scholar] [CrossRef] [Scilit]
- Hartvig, Á.D.; Kiss-Dobronyi, B.; Kotek, P.; Takácsné Tóth, B.; Gutzianas, I.; Zareczky, A.Z. The economic and energy security implications of the Russian energy weapon. Energy 2024, 294, 130972. [Google Scholar] [CrossRef] [Scilit]
- Boonman, H.; Rodriguez, M. Mitigating foreign fossil fuel shocks: The role of renewable energy and industrial electrification in The Netherlands. Econ. Model. 2025, 151, 107138. [Google Scholar] [CrossRef] [Scilit]
- Chen, H.; Zhang, W.; Huang, X.; Wang, X. Estimating the dynamic economic impacts of oil supply disruptions on China: A case study of Malacca Strait block. Resour. Policy 2024, 98, 105376. [Google Scholar] [CrossRef] [Scilit]
- Tang, X.; Ren, K.; Wang, J.; Zhang, L.; Ding, Y.; Jiang, Y.; Ma, Z.; Ji, H.; Feng, C.; Höök, M. Assessing Oil Security and System Resilience under China’s Low-carbon Energy Transition. Engineering 2026, 65, 86–99. [Google Scholar] [CrossRef] [Scilit]
- Brown, S.P.A.; Huntington, H.G. Evaluating U.S. oil security and import reliance. Energy Policy 2015, 79, 9–22. [Google Scholar] [CrossRef] [Scilit]
- Chen, Z.M.; Zeng, S.; Lester, L.; Zhang, L.T.; Xia, X.; Xu, S.; Alsaedi, A.; Hayat, T. Economic cost of China’s oil import: Welfare estimation for 2001–2015. Resour. Conserv. Recycl. 2018, 132, 158–167. [Google Scholar] [CrossRef] [Scilit]
- Alvarez, J.M.; Fernandez-Vazquez, S.; Macedo, S.V.; Ortega-Andrade, A. Enhancing energy security and efficiency through a regional integration policy: The case of the Southern Cone. Energy Policy 2024, 195, 114384. [Google Scholar] [CrossRef] [Scilit]
- Praks, P.; Kopustinskas, V.; Masera, M. Probabilistic modelling of security of supply in gas networks and evaluation of new infrastructure. Reliab. Eng. Syst. Saf. 2015, 144, 254–264. [Google Scholar] [CrossRef] [Scilit]
- Guo, X.; Hao, C.; Niu, S. Analysis of Oil Import Risk and Strategic Petroleum Reserve: The Case of China. Sustainability 2020, 12, 3723. [Google Scholar] [CrossRef] [Scilit]
- Kosowski, P.; Kosowska, K. Valuation of Energy Security for Natural Gas—European Example. Energies 2021, 14, 2678. [Google Scholar] [CrossRef] [Scilit]
- Kosowski, P.; Kosowska, K.; Nawalaniec, W. Application of Bayesian Networks in Modeling of Underground Gas Storage Energy Security. Energies 2022, 15, 5185. [Google Scholar] [CrossRef] [Scilit]
- Mannhardt, J.; Gabrielli, P.; Sansavini, G. Collaborative and selfish mitigation strategies to tackle energy scarcity: The case of the European gas crisis. iScience 2023, 26, 106750. [Google Scholar] [CrossRef] [Scilit] [PubMed]
- Zhao, X.; Wang, J.; Lei, S. Does regional natural gas supply produce a shortfall under transition from coal to gas? Case study in Jing-Jin-Ji Region. Energy Policy 2023, 174, 113438. [Google Scholar] [CrossRef] [Scilit]
- Martišauskas, L.; Augutis, J.; Krikštolaitis, R. Methodology for energy security assessment considering energy system resilience to disruptions. Energy Strategy Rev. 2018, 22, 106–118. [Google Scholar] [CrossRef] [Scilit]
- Galinis, A.; Martišauskas, L.; Jääskeläinen, J.; Olkkonen, V.; Syri, S.; Avgerinopoulos, G.; Lekavičius, V. Implications of carbon price paths on energy security in four Baltic region countries. Energy Strategy Rev. 2020, 30, 100509. [Google Scholar] [CrossRef] [Scilit]
- Antosiewicz, M.; Nikas, A.; Szpor, A.; Witajewski-Baltvilks, J.; Doukas, H. Pathways for the transition of the Polish power sector and associated risks. Environ. Innov. Soc. Transit. 2020, 35, 271–291. [Google Scholar] [CrossRef] [Scilit]
- Cervantes Barron, K.; Dixon, J.; Oduor, J.; Kemei, D.; Maranga, I.; Mwanzia, P.; Pierard, E.; Brand, C.; Afifah, F.; Cullen, J.M. Critical and bulk material considerations for designing low-carbon transport-energy pathways in Kenya. Energy Strategy Rev. 2026, 66, 102291. [Google Scholar] [CrossRef] [Scilit]
- Wang, H.; Wang, G.; Qi, J.; Schandl, H.; Li, Y.; Feng, C.; Yang, X.; Wang, Y.; Wang, X.; Liang, S. Scarcity-weighted fossil fuel footprint of China at the provincial level. Appl. Energy 2020, 258, 114081. [Google Scholar] [CrossRef] [Scilit]
- Zhang, C.; Yang, S. The synergy effect of energy security and carbon-haze collaborative management: From the perspective of biased technological progress. Environ. Res. 2024, 252, 118741. [Google Scholar] [CrossRef] [Scilit] [PubMed]
- Link, S.; Schneider, L.; Stephan, A.; Weymann, L.; Plötz, P. Feasibility of meeting future battery demand via domestic cell production in Europe. Nat. Energy 2025, 10, 526–534. [Google Scholar] [CrossRef] [Scilit]
- Silvestri, L.; Forcina, A.; Silvestri, C.; Traverso, M. Circularity potential of rare earths for sustainable mobility: Recent developments, challenges and future prospects. J. Clean. Prod. 2021, 292, 126089. [Google Scholar] [CrossRef] [Scilit]
- Mariev, O.; Islam, M.M. Europe’s extra-territorial mineral trade and clean energy metamorphosis in a landscape of multifaceted risks. J. Environ. Manag. 2025, 375, 124123. [Google Scholar] [CrossRef] [Scilit] [PubMed]
- Sun, H.; Chen, L.; Gao, R.; Gu, L.; Yuan, Z. Modeling resilience dynamics of cobalt supply chains for clean energy: A multi layer network approach integrating risk propagation and recovery. Miner. Econ. 2026. [Google Scholar] [CrossRef] [Scilit]
- Ullah, F.; Lu, Q.; Jie, C.; Iftikhar, K.; Ma, D. Navigating energy poverty under policy uncertainty: The interaction of geopolitical risk and energy transition. Energy Policy 2026, 213, 115185. [Google Scholar] [CrossRef] [Scilit]
- Gökgöz, F.; Yalçın, E. Evaluating energy security efficiency in the EU transportation sector: A multi-stage efficiency analysis. Transp. Policy 2026, 178, 103982. [Google Scholar] [CrossRef] [Scilit]
- Lee, W.H.; Husaini, D.H.; Lean, H.H.; Lim, G.T. The role of critical mineral prices and geopolitical risk in shaping renewable energy poverty. Discov. Sustain. 2025, 6, 623. [Google Scholar] [CrossRef] [Scilit]
- Boffardi, R.; D’Alessandro, C.; De Simone, L.; Szopik-Depczynska, K. How to promote green energy transition in the age of geopolitical crises and international shocks: Evidence from the EU-27. Environ. Sci. Policy 2025, 164, 104007. [Google Scholar] [CrossRef] [Scilit]
- Kharazishvili, Y.; Bilan, Y.; Sukhodolia, O.; Grishnova, O.; Mishchuk, H. Scientific and strategic foresighting: The trajectory of sustainable development (on the example of Ukraine’s energy security). Sustain. Futur. 2025, 9, 100580. [Google Scholar] [CrossRef] [Scilit]
- Yu, H.H.; Chang, K.H.; Hsu, H.W.; Cuckler, R. A Monte Carlo simulation-based decision support system for reliability analysis of Taiwan’s power system: Framework and empirical study. Energy 2019, 178, 252–262. [Google Scholar] [CrossRef] [Scilit]
- Abadie, L.M.; Chamorro, J.M. Physical adequacy of a power generation system: The case of Spain in the long term. Energy 2019, 166, 637–652. [Google Scholar] [CrossRef] [Scilit]
- Lueken, R.; Apt, J.; Sowell, F. Robust resource adequacy planning in the face of coal retirements. Energy Policy 2016, 88, 371–388. [Google Scholar] [CrossRef] [Scilit]
- Murphy, S.; Lavin, L.; Apt, J. Resource adequacy implications of temperature-dependent electric generator availability. Appl. Energy 2020, 262, 114424. [Google Scholar] [CrossRef] [Scilit]
- Lee, Y.; Oh, U.; Choi, J.; Cha, J.; Choi, H.; Jeon, D. Conversion Function and Relationship of Loss of Load Expectation Indices on Two Kinds of Load Duration Curve. Trans. Korean Inst. Electr. Eng. 2017, 66, 475–485. [Google Scholar] [CrossRef] [Scilit][Green Version]
- Kunaifi; Reinders, A. Perceived and Reported Reliability of the Electricity Supply at Three Urban Locations in Indonesia. Energies 2018, 11, 140. [Google Scholar] [CrossRef] [Scilit]
- Paik, C.; Chung, Y.; Kim, Y.J. ELCC-based capacity credit estimation accounting for uncertainties in capacity factors and its application to solar power in Korea. Renew. Energy 2021, 164, 833–841. [Google Scholar] [CrossRef] [Scilit]
- Ssengonzi, J.; Johnson, J.X.; DeCarolis, J.F. An efficient method to estimate renewable energy capacity credit at increasing regional grid penetration levels. Renew. Sustain. Energy Transit. 2022, 2, 100033. [Google Scholar] [CrossRef] [Scilit]
- Bromley-Dulfano, I.; Florez, J.; Craig, M.T. Reliability benefits of wide-area renewable energy planning across the Western United States. Renew. Energy 2021, 179, 1487–1499. [Google Scholar] [CrossRef] [Scilit]
- Wang, R.; Xie, Y.; Wang, S.; Geng, G.; Jiang, Q.; Liu, C.; Wang, B. Capacity credit assessment of regional renewable generation considering multi-time-scale forecast errors. Energy 2025, 331, 136806. [Google Scholar] [CrossRef] [Scilit]
- Pluta, M.; Wyrwa, A. Quantifying the Capacity Credits of Intermittent Renewables: Implications for Power System Planning. Energies 2025, 18, 5636. [Google Scholar] [CrossRef] [Scilit]
- Sanchez, N.; Dent, C.J.; Wilson, A. Statistical modelling of dependence between net demands and deficits in two area power systems. Sustain. Energy Grids Netw. 2023, 36, 101151. [Google Scholar] [CrossRef] [Scilit]
- Murphy, S.; Apt, J.; Moura, J.; Sowell, F. Resource adequacy risks to the bulk power system in North America. Appl. Energy 2018, 212, 1360–1376. [Google Scholar] [CrossRef] [Scilit]
- Spilger, M.; Schneider, D.; Weber, C. Uncertainty characterization for generation adequacy assessments—Including an application to the recent European energy crisis. Energy Econ. 2025, 144, 108304. [Google Scholar] [CrossRef] [Scilit]
- Astier, N.; Ovaere, M. Reliability standards and generation adequacy assessments for interconnected electricity systems. Energy Policy 2022, 168, 113131. [Google Scholar] [CrossRef] [Scilit]
- Duenas, P.; Ramos, A.; Tapia-Ahumada, K.; Olmos, L.; Rivier, M.; Pérez-Arriaga, J.I. Security of supply in a carbon-free electric power system: The case of Iceland. Appl. Energy 2018, 212, 443–454. [Google Scholar] [CrossRef] [Scilit]
- Abadie, L.M.; Chamorro, J.M.; Huclin, S.; van de Ven, D.J. On flexible hydropower and security of supply: Spain beyond 2020. Energy 2020, 203, 117869. [Google Scholar] [CrossRef] [Scilit]
- Schäffer, L.E.; Korpås, M.; Bakken, T.H. Implications of environmental constraints in hydropower scheduling for a power system with limited grid and reserve capacity. Energy Syst. 2023. [Google Scholar] [CrossRef] [Scilit]
- Orive, P.; Blanco, C. A stochastic policy assessment of Spain’s 81% renewable electricity target for 2030. Energy Sustain. Dev. 2026, 94, 102068. [Google Scholar] [CrossRef] [Scilit]
- Kosai, S.; Unesaki, H. Quantitative analysis on the impact of nuclear energy supply disruption on electricity supply security. Appl. Energy 2017, 208, 1198–1207. [Google Scholar] [CrossRef] [Scilit]
- Tanoto, Y.; Haghdadi, N.; Bruce, A.; MacGill, I. Clustering based assessment of cost, security and environmental tradeoffs with possible future electricity generation portfolios. Appl. Energy 2020, 270, 115219. [Google Scholar] [CrossRef] [Scilit]
- Nolting, L.; Praktiknjo, A. Can we phase-out all of them? Probabilistic assessments of security of electricity supply for the German case. Appl. Energy 2020, 263, 114704. [Google Scholar] [CrossRef] [Scilit]
- Potisomporn, P.; Vogel, C.R. Spatial and temporal variability characteristics of offshore wind energy in the United Kingdom. Wind Energy 2022, 25, 537–552. [Google Scholar] [CrossRef] [Scilit]
- Qiu, L.; Khorramfar, R.; Wang, S.; Amin, S.; Howland, M.F. Climate change reshapes resource adequacy risks and optimal renewable energy siting in wind and solar energy systems. Nat. Energy 2026, 11, 1449–1458. [Google Scholar] [CrossRef] [Scilit]
- Chen, C.; Nyangon, J.; Ibrahim, T.; Ali, T. Probabilistic resource adequacy assessment of ERCOT under high data center load growth and high renewable energy potential through 2050. Environ. Res. Energy 2026, 3, 035005. [Google Scholar] [CrossRef] [Scilit]
- van Zuijlen, B.; Zappa, W.; Turkenburg, W.; van der Schrier, G.; van den Broek, M. Cost-optimal reliable power generation in a deep decarbonisation future. Appl. Energy 2019, 253, 113587. [Google Scholar] [CrossRef] [Scilit]
- Oikonomou, K.; Maloney, P.R.; Bhattacharya, S.; Holzer, J.T.; Anderson, O.; Ke, X.; Westman, J.; Burleyson, C.D.; Datta, S.; Twitchell, J.B.; et al. Energy storage planning for enhanced resilience of power systems against wildfires and heatwaves. J. Energy Storage 2025, 119, 116074. [Google Scholar] [CrossRef] [Scilit]
- Zhao, C.; Zhou, M.; Chen, X.; Wu, W.; Zheng, Y.; Wu, Z. Planning multi-duration energy storage for power system resilience enhancement under extreme cold weather. Int. J. Electr. Power Energy Syst. 2026, 175, 111665. [Google Scholar] [CrossRef] [Scilit]
- Akdemir, K.Z.; Mongird, K.; Bracken, C.; Burleyson, C.D.; Kern, J.D.; Oikonomou, K.; Thurber, T.B.; Vernon, C.R.; Voisin, N.; Zhao, M.; et al. Evaluating grid stress and reliability in future electricity grids across a range of demand, generation mix, and weather trends. Adv. Appl. Energy 2025, 20, 100249. [Google Scholar] [CrossRef] [Scilit]
- Mehrtash, M.; Ravajiri, E.S.; Khanal, S.; Dvorkin, Y.; Hallowell, S.T.; Hobbs, B.F. High-Fidelity Resource Adequacy Study Considering Hurricane-Driven Offshore Wind Outages: A PJM Case Study. IEEE Trans. Ind. Appl. 2026, 62, 5182–5191. [Google Scholar] [CrossRef] [Scilit]
- Klimenko, V.; Kondratieva, O.; Loktionov, O.; Fedotova, E. Impact of Changing Wind Loads on the Reliability of Power Transmission Lines in Different Regions of Russia. Dokl. Phys. 2022, 67, 173–179. [Google Scholar] [CrossRef] [Scilit]
- Haakana, J.; Räisänen, O.; Karhunen, M.; Láng-Ritter, I.; Lassila, J. Impact of wind speed and soil frost on electricity distribution system reliability. Heliyon 2024, 10, e40846. [Google Scholar] [CrossRef] [Scilit] [PubMed]
- Jasiūnas, J.; Láng-Ritter, I.; Heikkinen, T.; Lund, P.D. Case beyond historical severity: Winds, faults, outages, and costs for electric grid. Appl. Energy 2024, 373, 123884. [Google Scholar] [CrossRef] [Scilit]
- Ciapessoni, E.; Cirio, D.; Pitto, A.; Carlini, E.M.; Marzullo, F.; Casulli, S.; Lazzarini, A.; Falorni, F.; Scavo, F.; Berrettoni, G.; et al. An innovative methodology for risk-based resilience assessment to prioritize grid interventions against natural threats in the Italian power system. Environ. Syst. Decis. 2026, 46, 4. [Google Scholar] [CrossRef] [Scilit]
- Chopra, S.S.; Khanna, V. Interconnectedness and interdependencies of critical infrastructures in the US economy: Implications for resilience. Phys. A Stat. Mech. Its Appl. 2015, 436, 865–877. [Google Scholar] [CrossRef] [Scilit]
- Baghersad, M.; Zobel, C.W. Economic impact of production bottlenecks caused by disasters impacting interdependent industry sectors. Int. J. Prod. Econ. 2015, 168, 71–80. [Google Scholar] [CrossRef] [Scilit]
- Huang, X.; Wang, N. Post-disaster restoration planning of interdependent infrastructure Systems: A framework to balance social and economic impacts. Struct. Saf. 2024, 107, 102408. [Google Scholar] [CrossRef] [Scilit]
- Cai, Y.; Zhan, W.; Shi, X.; Tang, L.; Tang, X.; Cao, Y. Reliability analysis of power cyber-physical systems based on cross-domain fault interface matrices. Sustain. Energy Grids Netw. 2025, 44, 102058. [Google Scholar] [CrossRef] [Scilit]
- Augutis, J.; Matuzienė, V.; Urbonas, R. Probabilistic energy security analysis for development of the energy system. Energy Sources Part B Econ. Plan. Policy 2016, 11, 118–123. [Google Scholar]
- Rancilio, G.; Cortazzi, A.; Viganò, G.; Bovera, F. Assessing the Nationwide Benefits of Vehicle–Grid Integration during Distribution Network Planning and Power System Dispatching. World Electr. Veh. J. 2024, 15, 134. [Google Scholar] [CrossRef] [Scilit]
- Di Bella, G.; Flanagan, M.; Foda, K.; Maslova, S.; Pienkowski, A.; Stuermer, M.; Toscani, F. Natural gas in Europe: The potential impact of disruptions to supply. Energy Econ. 2024, 138, 107777. [Google Scholar] [CrossRef] [Scilit]
- Wan, K.; Liu, B.Y.; Fan, Y.; Ikonnikova, S.A. Modelling and assessing dynamic energy supply resilience to disruption events: An oil supply disruption case in China. Energy Econ. 2024, 140, 108013. [Google Scholar] [CrossRef] [Scilit]
- Liang, Z.; Tian, Z.; Sun, L.; Feng, K.; Zhong, H.; Gu, T.; Liu, X. Heat wave, electricity rationing, and trade-offs between environmental gains and economic losses: The example of Shanghai. Appl. Energy 2016, 184, 951–959. [Google Scholar] [CrossRef] [Scilit]
- Zhou, L.; Li, Y.; Sun, Y.; Hu, L.; Li, A. Transboundary cascading economic impacts and efficiency dynamics of power shortages induced by extreme heatwaves: An integrated weather-shock input-output data envelopment analysis framework for China. Environ. Impact Assess. Rev. 2027, 122, 108670. [Google Scholar] [CrossRef] [Scilit]
- Sue Wing, I.; Rose, A.Z. Economic consequence analysis of electric power infrastructure disruptions: General equilibrium approaches. Energy Econ. 2020, 89, 104756. [Google Scholar] [CrossRef] [Scilit]
- Long, H.; Wang, S.; Wu, W.; Zhang, G. The economic influence of oil shortage and the optimal strategic petroleum reserve in China. Energy Rep. 2022, 8, 9858–9870. [Google Scholar] [CrossRef] [Scilit]
- Li, J.; Wu, J.; Yang, Y.; Tang, R. Economic consequences of compound drought-heatwave induced power deficits: Evidence from Sichuan’s 2022 power crisis. Sustain. Cities Soc. 2025, 130, 106639. [Google Scholar] [CrossRef] [Scilit]
- Fašungová, L.; Radvanský, M. Economic impact of natural gas supply disruptions—Case of Slovakia. Ekon. Čas. 2014, 2, 167–184. [Google Scholar]
- Xue, M.M.; Wu, G.; Wang, Q.; Yao, Y.F.; Liang, Q.M. Socioeconomic impacts of a shortage in imported oil supply: Case of China. Nat. Hazards 2019, 99, 1415–1430. [Google Scholar] [CrossRef] [Scilit]
- Evgenidis, A.; Hamano, M.; Vermeulen, W.N. Economic consequences of follow-up disasters: Lessons from the 2011 Great East Japan Earthquake. Energy Econ. 2021, 104, 105559. [Google Scholar] [CrossRef] [Scilit]
- Ou, P.; Huang, R.; Yao, X. Economic Impacts of Power Shortage. Sustainability 2016, 8, 687. [Google Scholar] [CrossRef] [Scilit]
- Sun, M.; Gao, C.; Shen, B. Quantifying China’s oil import risks and the impact on the national economy. Energy Policy 2014, 67, 605–611. [Google Scholar] [CrossRef] [Scilit]
- Dong, X.; Kong, Z. The impact of China’s natural gas import risks on the national economy. J. Nat. Gas Sci. Eng. 2016, 36, 97–107. [Google Scholar] [CrossRef] [Scilit]
- Praktiknjo, A. The Value of Lost Load for Sectoral Load Shedding Measures: The German Case with 51 Sectors. Energies 2016, 9, 116. [Google Scholar] [CrossRef] [Scilit]
- Poudineh, R.; Jamasb, T. Electricity Supply Interruptions: Sectoral Interdependencies and the Cost of Energy Not Served for the Scottish Economy. Energy J. 2017, 38, 51–76. [Google Scholar] [CrossRef] [Scilit]
- Growitsch, C.; Malischek, R.; Nick, S.; Wetzel, H. The Costs of Power Interruptions in Germany: A Regional and Sectoral Analysis. Ger. Econ. Rev. 2015, 16, 307–323. [Google Scholar] [CrossRef] [Scilit]
- Bhattacharyya, A.; Hastak, M. Indirect Cost Estimation of Winter Storm–Induced Power Outage in Texas. J. Manag. Eng. 2022, 38, 04022057. [Google Scholar] [CrossRef] [Scilit]
- Zambrano-Monserrate, M.A. The economic impact of power outages in developing countries: A quasi-experimental analysis. Energy Econ. 2026, 153, 109063. [Google Scholar] [CrossRef] [Scilit]
- Shehzadi, A.; Wetzel, H. Self-generation and outage losses: A firm-level analysis for emerging and developing Asian countries. Energy Rep. 2024, 11, 2832–2840. [Google Scholar] [CrossRef] [Scilit]
- Ngoma, R.; Tambatamba, A.; Oyoo, B.; Mulongoti, D.; Kumwenda, B.; Louie, H. How households adapted their energy use during the Zambian energy crisis. Energy Sustain. Dev. 2018, 44, 125–138. [Google Scholar] [CrossRef] [Scilit]
- Accursi, F.M. Quality Matters: Power Reliability and Grid Connection in Rural Guatemala. Econ. Energy Environ. Policy 2024, 13. [Google Scholar] [CrossRef] [Scilit]
- Akter, S.; Mathew, N.M.; Fila, M.E. The impact of an improvement in the quality and reliability of rural residential electricity supply on clean cooking fuel adoption: Evidence from six energy poor Indian states. World Dev. 2023, 172, 106366. [Google Scholar] [CrossRef] [Scilit]
- Vennemo, H.; Rosnes, O.; Skulstad, A. The cost to households of a large electricity outage. Energy Econ. 2022, 116, 106394. [Google Scholar] [CrossRef] [Scilit]
- Gorman, W.; Callaway, D. Do notifications affect households’ willingness to pay to avoid power outages? Evidence from an experimental stated-preference survey in California. Electr. J. 2024, 37, 107385. [Google Scholar] [CrossRef] [Scilit]
- Aweke, A.T.; Navrud, S. Valuing energy poverty costs: Household welfare loss from electricity blackouts in developing countries. Energy Econ. 2022, 109, 105943. [Google Scholar] [CrossRef] [Scilit]
- Woo, C.; Tishler, A.; Zarnikau, J.; Chen, Y. Average residential outage cost estimates for the lower 48 states in the US. Energy Econ. 2021, 98, 105270. [Google Scholar] [CrossRef] [Scilit]
- Woo, C.; Tishler, A.; Zarnikau, J.; Chen, Y. A back of the envelope estimate of the average non-residential outage cost in the US. Electr. J. 2021, 34, 106930. [Google Scholar] [CrossRef] [Scilit]
- Deutschmann, J.W.; Postepska, A.; Sarr, L. Measuring willingness to pay for reliable electricity: Evidence from Senegal. World Dev. 2021, 138, 105209. [Google Scholar] [CrossRef] [Scilit]
- Her, Y.; Jin, T. Rethinking value of lost load in high-reliability electricity systems: Methodological challenges and policy implications. Energy Strategy Rev. 2026, 63, 102061. [Google Scholar] [CrossRef] [Scilit]
- Chen, H.; Chen, X.; Niu, J.; Xiang, M.; He, W.; Kufeoglu, S. Estimating the marginal cost of reducing power outage durations in China: A parametric distance function approach. Energy Policy 2021, 155, 112366. [Google Scholar] [CrossRef] [Scilit]
- Jin, T. A meta-analysis of outage cost for value-based reliability planning. Energy Strategy Rev. 2025, 62, 101975. [Google Scholar] [CrossRef] [Scilit]
- Jin, T.; Lee, T.E.; Kim, D. Value of lost load estimation for the South Korea’s manufacturing sector—finding the gap between the supply and demand side. Renew. Sustain. Energy Rev. 2023, 187, 113753. [Google Scholar] [CrossRef] [Scilit]
- Cohen, J.J.; Reichl, J. Comparing Internet and phone survey mode effects across countries and research contexts. Aust. J. Agric. Resour. Econ. 2022, 66, 44–71. [Google Scholar] [CrossRef] [Scilit]
- Cohen, J.; Moeltner, K.; Reichl, J.; Schmidthaler, M. Effect of global warming on willingness to pay for uninterrupted electricity supply in European nations. Nat. Energy 2018, 3, 37–45. [Google Scholar] [CrossRef] [Scilit]
- Kim, K.; Cho, Y. Estimation of power outage costs in the industrial sector of South Korea. Energy Policy 2017, 101, 236–245. [Google Scholar] [CrossRef] [Scilit]
- Shivakumar, A.; Welsch, M.; Taliotis, C.; Jakšić, D.; Baričević, T.; Howells, M.; Gupta, S.; Rogner, H. Valuing blackouts and lost leisure: Estimating electricity interruption costs for households across the European Union. Energy Res. Soc. Sci. 2017, 34, 39–48. [Google Scholar] [CrossRef] [Scilit]
- Meles, T.H.; Mekonnen, A.; Beyene, A.D.; Hassen, S.; Pattanayak, S.K.; Sebsibie, S.; Klug, T.; Jeuland, M. Households’ valuation of power outages in major cities of Ethiopia: An application of stated preference methods. Energy Econ. 2021, 102, 105527. [Google Scholar] [CrossRef] [Scilit]
- Larsen, P.H.; Boehlert, B.; Eto, J.; Hamachi-LaCommare, K.; Martinich, J.; Rennels, L. Projecting future costs to U.S. electric utility customers from power interruptions. Energy 2018, 147, 1256–1277. [Google Scholar] [CrossRef] [Scilit] [PubMed]
- Alberini, A.; Steinbuks, J.; Timilsina, G. How Valuable is the Reliability of Residential Electricity Supply in Low-Income Countries? Evidence from Nepal. Energy J. 2022, 43, 1–26. [Google Scholar] [CrossRef] [Scilit]
- Hashemi, M. The economic value of unsupplied electricity: Evidence from Nepal. Energy Econ. 2021, 95, 105124. [Google Scholar] [CrossRef] [Scilit]
- Jin, T. Evaluating the value of lost load to South Korea’s residential electricity consumers by stated and revealed preference methods. Util. Policy 2025, 97, 102072. [Google Scholar] [CrossRef] [Scilit]
- Jin, T. An empirical analysis of electricity outage cost for the residential sector in South Korea using stated-preference methods. Energy Environ. 2025, 0958305X251367119. [Google Scholar] [CrossRef] [Scilit]
- Maji, P.; Mehrabi, Z.; Kandlikar, M. Incomplete transitions to clean household energy reinforce gender inequality by lowering women’s respiratory health and household labour productivity. World Dev. 2021, 139, 105309. [Google Scholar] [CrossRef] [Scilit]
- Cello, M.; Laird, J.; Hernández, D. Energy Insecurity and Mental Health: Exploring the Links Between Energy Hardships and Anxiety and Depression. Sustainability 2025, 17, 9807. [Google Scholar] [CrossRef] [Scilit]
- Migkos, S.P.; Katarachia, A.; Farmaki, P.M. Thermal Stress, Energy Anxiety, and Vulnerable Households in a Just Transition Region: Evidence from Western Macedonia, Greece. World 2026, 7, 8. [Google Scholar] [CrossRef] [Scilit]
- Villacreses-Brito, L.C.; Ortiz-Prado, E.; Vasconez-Gonzalez, J.; Gaibor-Pazmino, A.; Salazar-Santoliva, C.; Paz Cadena-Padilla, M.; Suarez-Sangucho, I.A.; Izquierdo-Condoy, J.S. Living in the dark: Self-perceived health and social impacts of nationwide electricity rationing in Ecuador. BMJ Glob. Health 2026, 11, e020612. [Google Scholar] [CrossRef] [Scilit] [PubMed]
- Burgherr, P.; Giroux, J.; Spada, M. Accidents in the Energy Sector and Energy Infrastructure Attacks in the Context of Energy Security. Eur. J. Risk Regul. 2015, 6, 271–283. [Google Scholar] [CrossRef] [Scilit]
- Gatfaoui, H. On the relationship between U.S. crude oil and natural gas for economic resilience prospects. Ann. Oper. Res. 2026, 363, 1673–1700. [Google Scholar] [CrossRef] [Scilit]
- Prima, A.; Satiyawira, B.; Pramadika, H.; Nauw, D.A.; Samura, L.; Maulani, M.; Rosyidan, C.; Djumantara, M.; Wibowo, D.A.; Dahani, W.; et al. A System Dynamics Approach to Analyze Biodiesel Production and Oil Import Dependency in Indonesia. Sci. Contrib. Oil Gas 2026, 49, 335–351. [Google Scholar] [CrossRef]
- Liu, H.; Tian, F.; Zhao, T.; Liu, D. International crude oil price shocks and inflation tail risk tracing: New interpretation from four-component decomposition. Energy Econ. 2026, 159, 109403. [Google Scholar] [CrossRef] [Scilit]
- Tao, M.; Roubaud, D.; Grebinevych, O. A systematic risk spillover perspective for modelling China’s energy security: Firm-level evidence. J. Environ. Manag. 2025, 373, 123650. [Google Scholar] [CrossRef] [Scilit] [PubMed]
- Liu, Z.; Shi, W. Global oil supply risk and macroeconomic dynamics: Can monetary policy mitigate the risk and welfare loss? N. Am. J. Econ. Finance 2026, 85, 102641. [Google Scholar] [CrossRef] [Scilit]
- Eichner, T.; Pethig, R. Efficient Management of Insecure Fossil Fuel Imports through Taxing Domestic Green Energy? J. Public Econ. Theory 2015, 17, 724–751. [Google Scholar] [CrossRef] [Scilit]
- Stevens, R.B.; Zhang, J.Y. Buyer Beware: The Asymmetric Impact of the Strategic Petroleum Reserve on Crude Oil Prices. Energy J. 2021, 42, 69–90. [Google Scholar] [CrossRef] [Scilit]
- Kilian, L.; Zhou, X. Does drawing down the US Strategic Petroleum Reserve help stabilize oil prices? J. Appl. Econom. 2020, 35, 673–691. [Google Scholar] [CrossRef] [Scilit]
- Kilian, L.; Zhou, X. Does Drawing Down the U.S. Strategic Petroleum Reserve Help Stabilize Oil Prices? Working Paper 1916; Federal Reserve Bank of Dallas: Dallas, TX, USA, 2019. [Google Scholar] [CrossRef] [Scilit]
- Augutis, J.; Krikštolaitis, R.; Martišauskas, L.; Pečiulytė, S.; Žutautaitė, I. Integrated energy security assessment. Energy 2017, 138, 890–901. [Google Scholar] [CrossRef] [Scilit]
- Augutis, J.; Krikštolaitis, R.; Pečiulyte, S.; Žutautaite, I. Dynamic model based on Bayesian method for energy security assessment. Energy Convers. Manag. 2015, 101, 66–72. [Google Scholar] [CrossRef] [Scilit]
- Jin, H.; Guo, J.; Tang, L.; Du, P. Long-term electricity demand forecasting under low-carbon energy transition: Based on the bidirectional feedback between power demand and generation mix. Energy 2024, 286, 129435. [Google Scholar] [CrossRef] [Scilit]
- Li, C.; Conejo, A.J.; Liu, P.; Omell, B.P.; Siirola, J.D.; Grossmann, I.E. Mixed-integer linear programming models and algorithms for generation and transmission expansion planning of power systems. Eur. J. Oper. Res. 2022, 297, 1071–1082. [Google Scholar] [CrossRef] [Scilit]
- Fleten, S.E.; Fram, B.P.; Ullrich, C.J. The reliability pricing model and coal-fired generators in PJM. Energy Econ. 2024, 134, 107543. [Google Scholar] [CrossRef] [Scilit]
- Leibowicz, B.D. Evaluation of post-Fukushima Japanese electricity strategies: A stochastic simulation model. Int. J. Energy Res. 2014, 38, 1578–1598. [Google Scholar] [CrossRef] [Scilit]
- Inzunza, A.; Moreno, R.; Bernales, A.; Rudnick, H. CVaR constrained planning of renewable generation with consideration of system inertial response, reserve services and demand participation. Energy Econ. 2016, 59, 104–117. [Google Scholar] [CrossRef] [Scilit]
- Bai, Y.; Zhou, P.; Tian, L.; Meng, F. Desirable Strategic Petroleum Reserves policies in response to supply uncertainty: A stochastic analysis. Appl. Energy 2016, 162, 1523–1529. [Google Scholar] [CrossRef] [Scilit]
- Blanchard, A. Strategic investments: Electrolysis vs. storage for Europe’s energy security in the hydrogen era. Energy Policy 2024, 195, 114371. [Google Scholar] [CrossRef] [Scilit]
- Yang, Q.; Zhang, L.; Zou, S.; Zhang, J. Intertemporal optimization of the coal production capacity in China in terms of uncertain demand, economy, environment, and energy security. Energy Policy 2020, 139, 111360. [Google Scholar] [CrossRef] [Scilit]
- Oliveira, F.; Zahur, N.B.; Wu, F. Analysis of the optimal policy for managing strategic petroleum reserves under long-term uncertainty: The ASEAN case. Comput. Ind. Eng. 2023, 175, 108834. [Google Scholar] [CrossRef] [Scilit]
- Bai, Y.; Zhou, P.; Zhou, D.; Meng, F.; Ju, K. Desirable policies of a strategic petroleum reserve in coping with disruption risk: A Markov decision process approach. Comput. Oper. Res. 2016, 66, 58–66. [Google Scholar] [CrossRef] [Scilit]
- Liu, J.; Hou, M.; Liu, C.; Jia, X. A Markov Decision Process-based model analysis for China’s strategic petroleum reserve. China Min. Mag. 2025, 34, 126–138. (In Chinese) [Google Scholar] [CrossRef]
- Haar, L.; Haar, L.N. A financial option perspective on energy security and strategic storage. Energy Strategy Rev. 2019, 25, 65–74. [Google Scholar] [CrossRef] [Scilit]
- Bai, Y.; Dahl, C.; Zhou, D.; Zhou, P. Stockpile strategy for China’s emergency oil reserve: A dynamic programming approach. Energy Policy 2014, 73, 12–20. [Google Scholar] [CrossRef] [Scilit]
- Zhang, X.B.; Qin, P.; Chen, X. Strategic oil stockpiling for energy security: The case of China and India. Energy Econ. 2017, 61, 253–260. [Google Scholar] [CrossRef] [Scilit]
- Chan, Y.T.; Ji, Q.; Zhang, D. The Macroeconomics of Strategic Petroleum Reserve. Int. Rev. Econ. Finance 2025, 99, 103997. [Google Scholar] [CrossRef] [Scilit]
- Chan, Y.T.; Punzi, M.T.; Zhao, H. Navigating geopolitical crises for energy security: Evaluating optimal subsidy policies via a Markov switching DSGE model. J. Environ. Manag. 2024, 349, 119619. [Google Scholar] [CrossRef] [Scilit] [PubMed]
- Zhang, J.; Huang, Y.; Liu, Y.; Yang, N.; Yuan, J. Optimizing the strategic reserves of coal-fired power units to balance reliability and cost in China’s clean energy transition. Util. Policy 2025, 96, 101991. [Google Scholar] [CrossRef] [Scilit]
- Lavin, L.; Murphy, S.; Sergi, B.; Apt, J. Dynamic operating reserve procurement improves scarcity pricing in PJM. Energy Policy 2020, 147, 111857. [Google Scholar] [CrossRef] [Scilit]
- Fida, K.; Imran, K.; Mehmood, K.K.; Bano, P.; Abusorrah, A.; Janjua, A.K. Optimal battery energy storage system deployment from perspectives of private investors and system operators for enhancing power system reliability. J. Energy Storage 2023, 69, 107882. [Google Scholar] [CrossRef] [Scilit]
- Tian, X.; Chen, W.; Hu, J. Game-theoretic modeling of power supply chain coordination under demand variation in China: A case study of Guangdong Province. Energy 2023, 262, 125440. [Google Scholar] [CrossRef] [Scilit]
- Paul Joshua, K.; Mohanalin, J.; Jaya Christa, S.T. Adaptive neuro-fuzzy inference system based under-frequency load shedding for Tamil Nadu. J. Supercomput. 2020, 76, 4184–4198. [Google Scholar] [CrossRef] [Scilit]
- Benysek, G.; Jarnut, M.; Werminski, S.; Bojarski, J. Distributed active demand response system for peak power reduction through load shifting. Bull. Pol. Acad. Sci. Tech. Sci. 2016, 64, 925–936. [Google Scholar] [CrossRef] [Scilit][Green Version]
- Manninen, H.; Kilter, J.; Landsberg, M. A holistic risk-based maintenance methodology for transmission overhead lines using tower specific health indices and value of loss load. Int. J. Electr. Power Energy Syst. 2022, 137, 107767. [Google Scholar] [CrossRef] [Scilit]
- Hashemi, M.; Jenkins, G. Can privatization of distribution substations improve electricity reliability for non-residential customers? An application to Nepal. Util. Policy 2022, 74, 101331. [Google Scholar] [CrossRef] [Scilit]
- Svegrup, L.; Johansson, J.; Hassel, H. Integration of Critical Infrastructure and Societal Consequence Models: Impact on Swedish Power System Mitigation Decisions. Risk Anal. 2019, 39, 1970–1996. [Google Scholar] [CrossRef] [Scilit] [PubMed]
- Chen, Y.; Deng, X.; Fei, C.J.; McCarl, B.A.; Xu, Y. Forecast-based disruptions in the energy sector: Economic impacts of anticipatory hurricane responses in US Gulf Coast refineries. Environ. Res. Lett. 2025, 20, 114025. [Google Scholar] [CrossRef] [Scilit]
- Kachirayil, F.; Huckebrink, D.; Bertsch, V.; McKenna, R. Trade-offs between system cost and supply security in municipal energy system design: An analysis considering spatio-temporal disparities in the Value of Lost Load. Appl. Energy 2025, 381, 124896. [Google Scholar] [CrossRef] [Scilit]
- Baccour, S.; Tilmant, A.; Albiac, J.; Espanmanesh, V.; Kahil, T. Probabilistic Trade-Offs Analysis for Sustainable and Equitable Management of Climate-Induced Water Risks. Water Resour. Res. 2025, 61, e2024WR038514. [Google Scholar] [CrossRef] [Scilit]
- Bai, Y.; Dahl, C. Evaluating the management of U.S. Strategic Petroleum Reserve during oil disruptions. Energy Policy 2018, 117, 25–38. [Google Scholar] [CrossRef] [Scilit]
- Augutis, J.; Martišauskas, L.; Krikštolaitis, R. Energy mix optimization from an energy security perspective. Energy Convers. Manag. 2015, 90, 300–314. [Google Scholar] [CrossRef] [Scilit]
- Koks, E.; Pant, R.; Thacker, S.; Hall, J.W. Understanding Business Disruption and Economic Losses Due to Electricity Failures and Flooding. Int. J. Disaster Risk Sci. 2019, 10, 421–438. [Google Scholar] [CrossRef] [Scilit]
- Wang, Q.; Zhou, Q.; Lin, J.; Guo, S.; She, Y.; Qu, S. Risk assessment of power outages to inter-regional supply chain networks in China. Appl. Energy 2024, 353, 122100. [Google Scholar] [CrossRef] [Scilit]
- Spada, M.; Paraschiv, F.; Burgherr, P. A comparison of risk measures for accidents in the energy sector and their implications on decision-making strategies. Energy 2018, 154, 277–288. [Google Scholar] [CrossRef] [Scilit]
- Brown, S.P. New estimates of the security costs of U.S. oil consumption. Energy Policy 2018, 113, 171–192. [Google Scholar] [CrossRef] [Scilit]
- Stock, A.; Davidson, R.A.; Kendra, J.; Martins, V.N.; Ewing, B.; Nozick, L.K.; Starbird, K.; Leon-Corwin, M. Household impacts of interruption to electric power and water services. Nat. Hazards 2023, 115, 2279–2306. [Google Scholar] [CrossRef] [Scilit]
- Dean, M.D.; Asmussen, K.E. Classifying energy insecurity among households with medical devices through latent class analysis. Environ. Res. Health 2026, 4, 015014. [Google Scholar] [CrossRef] [Scilit]
- Borbáth, T.; Van Hertem, D. Appropriate transmission grid representation for European resource adequacy assessments. Appl. Energy 2024, 355, 122378. [Google Scholar] [CrossRef] [Scilit]
- Sundar, S.; Lehner, F.; Voisin, N.; Craig, M.T. Identifying Robust Decarbonization Pathways for the Western U.S. Electric Power System Under Deep Climate Uncertainty. Earth’s Future 2024, 12, e2024EF004769. [Google Scholar] [CrossRef] [Scilit]
- Yazdanie, M.; Dramani, J.B.; Orehounig, K. Strengthening energy system resilience planning under uncertainty by minimizing regret. Renew. Sustain. Energy Transit. 2025, 6, 100093. [Google Scholar] [CrossRef] [Scilit]
- Nolting, L.; Praktiknjo, A. The complexity dilemma—Insights from security of electricity supply assessments. Energy 2022, 241, 122522. [Google Scholar] [CrossRef] [Scilit]
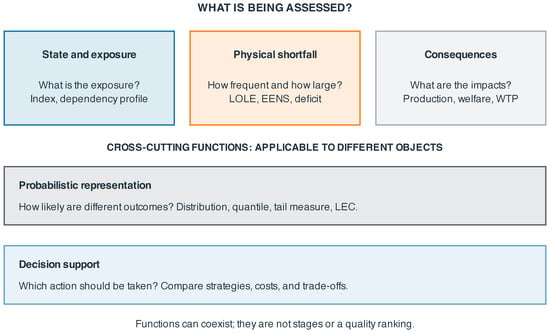
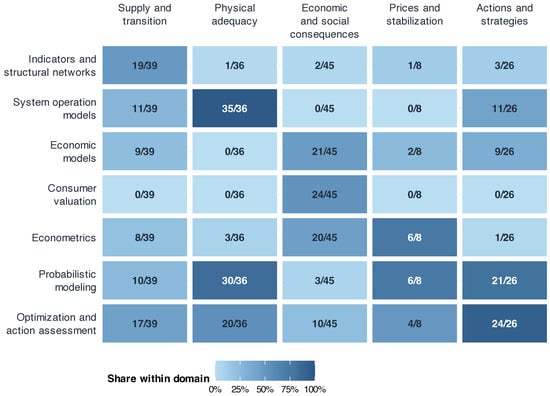
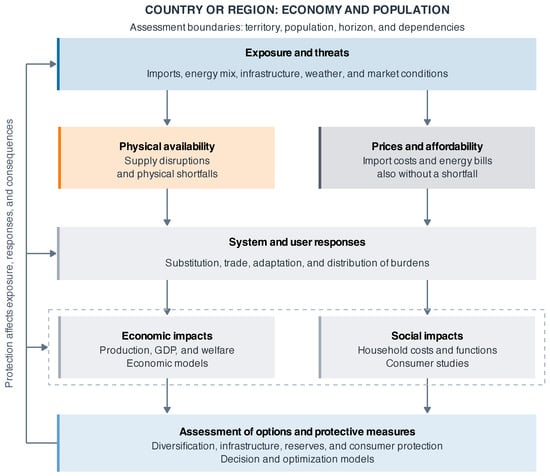
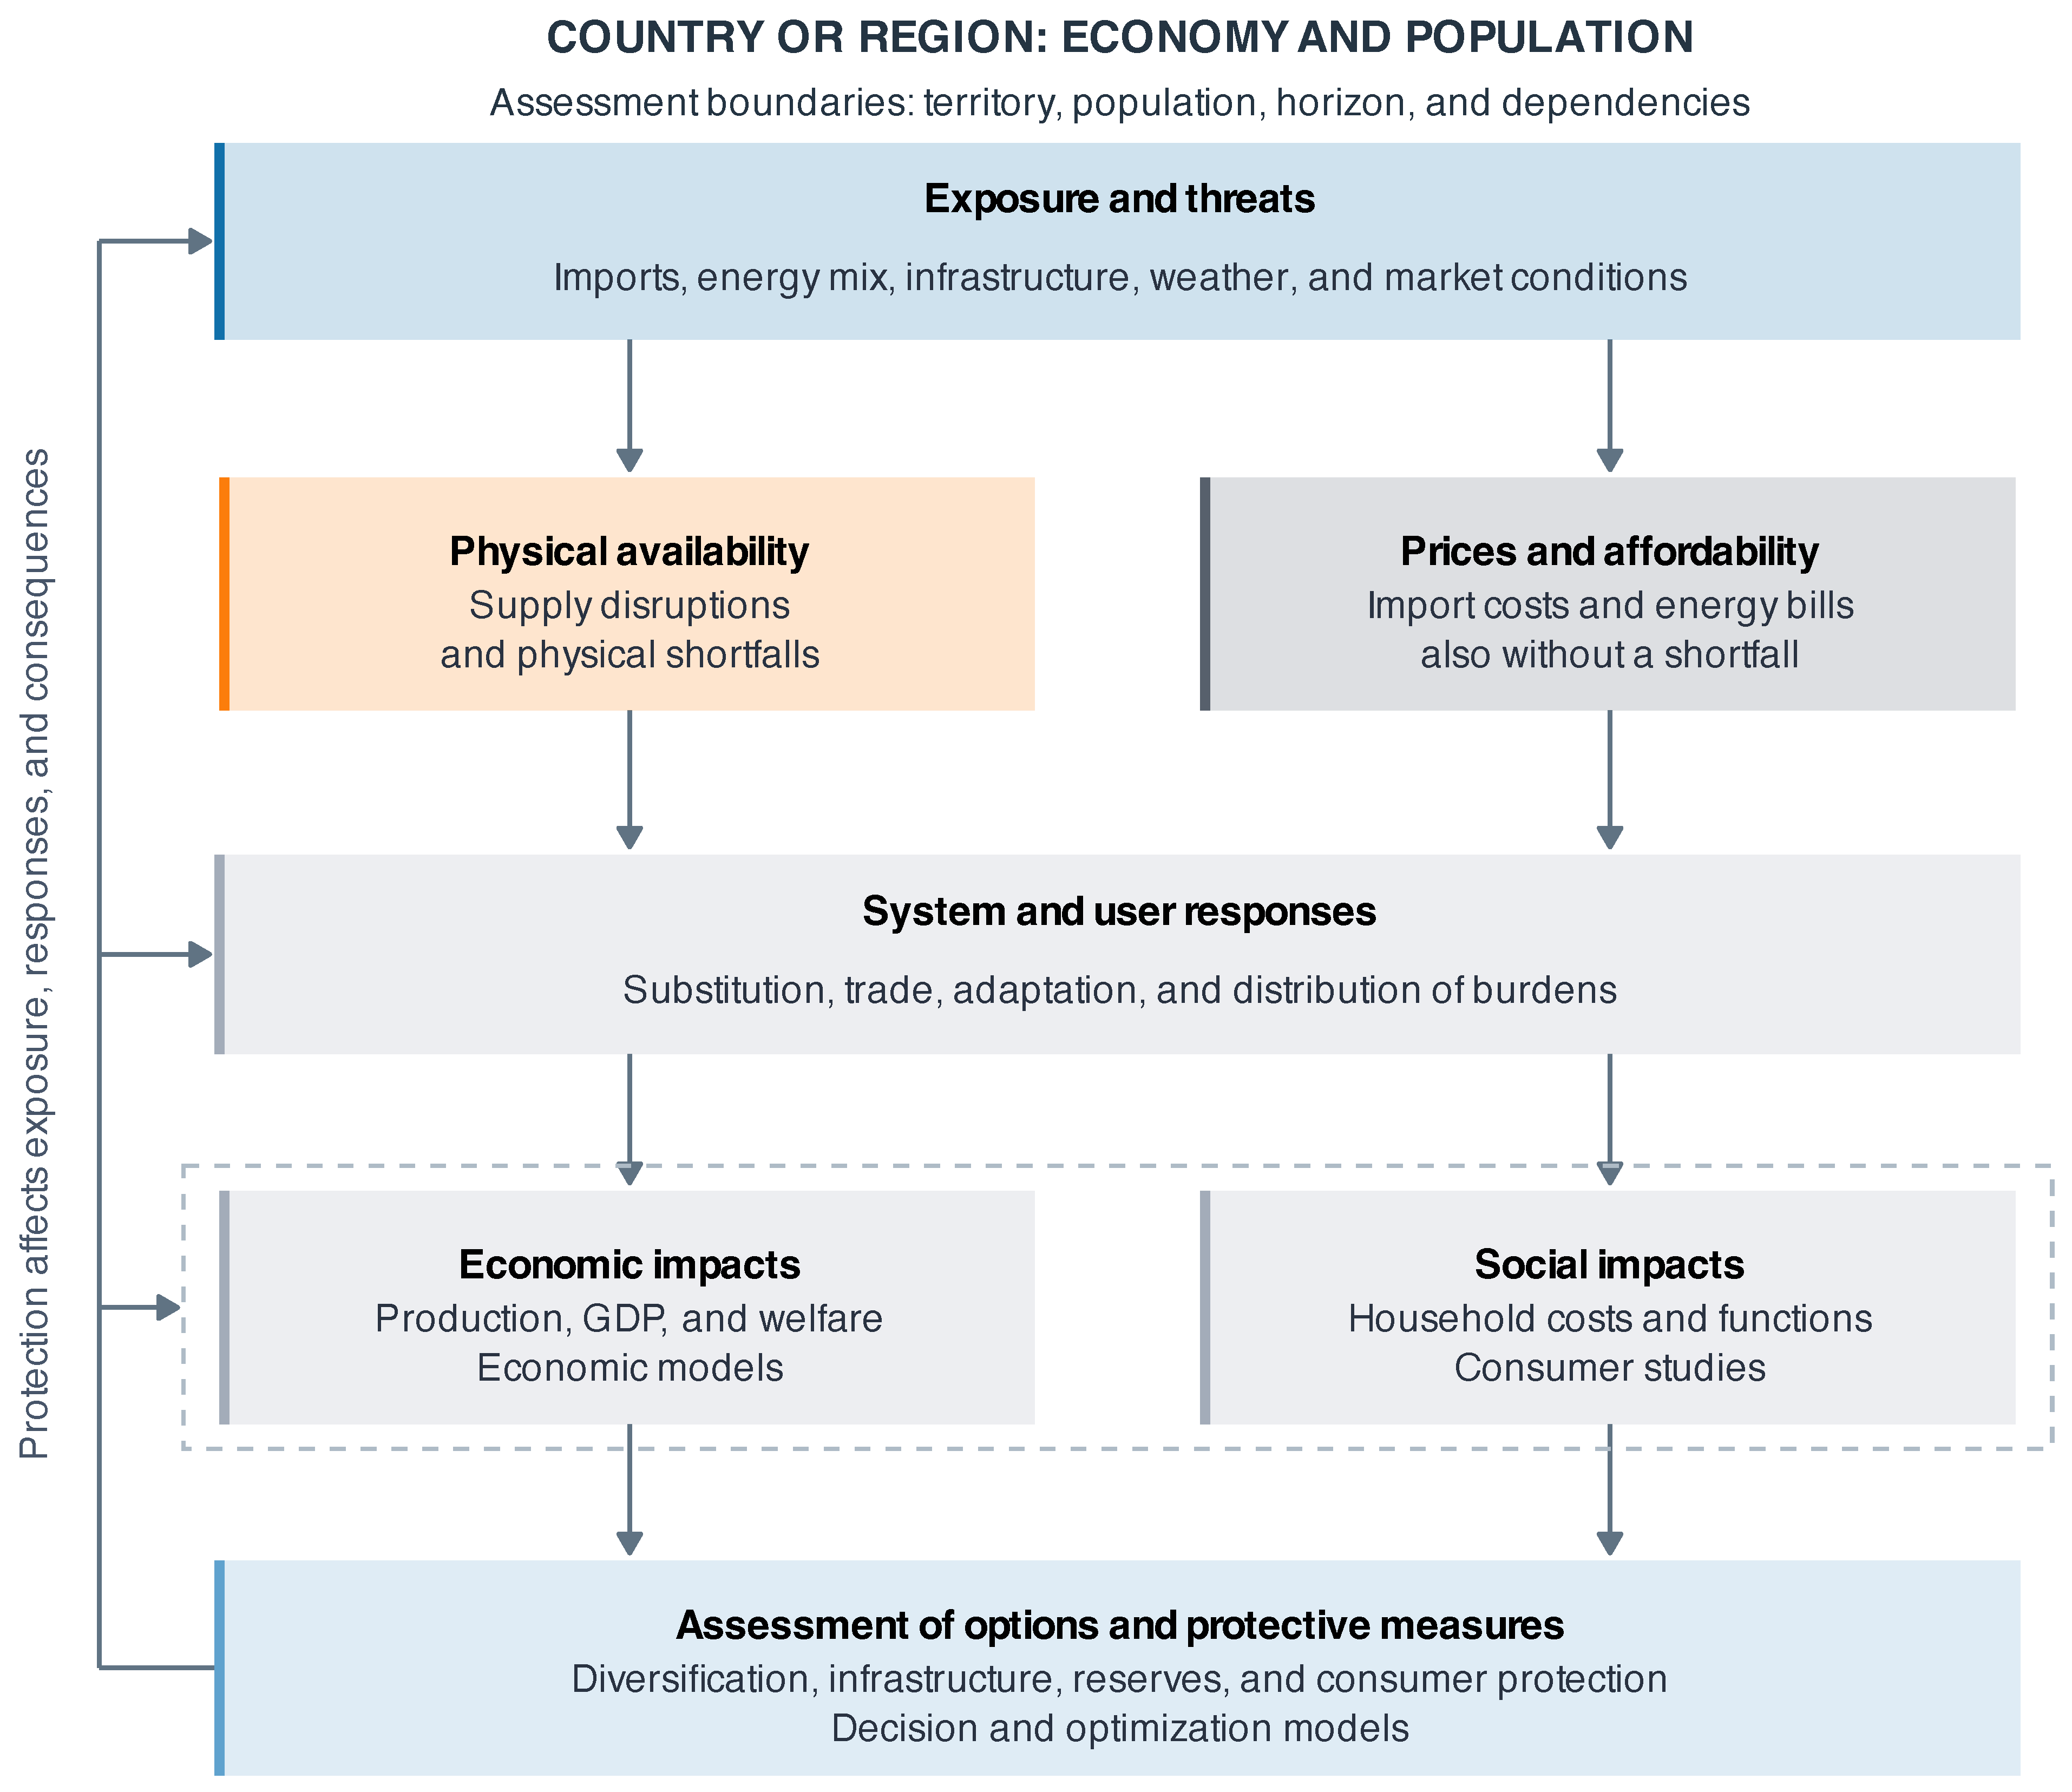
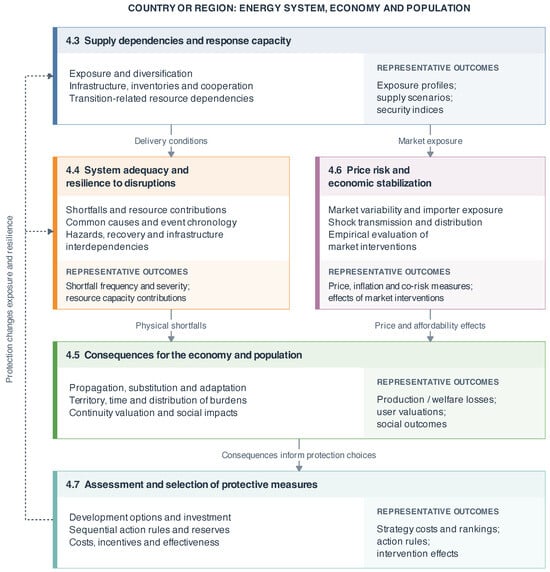
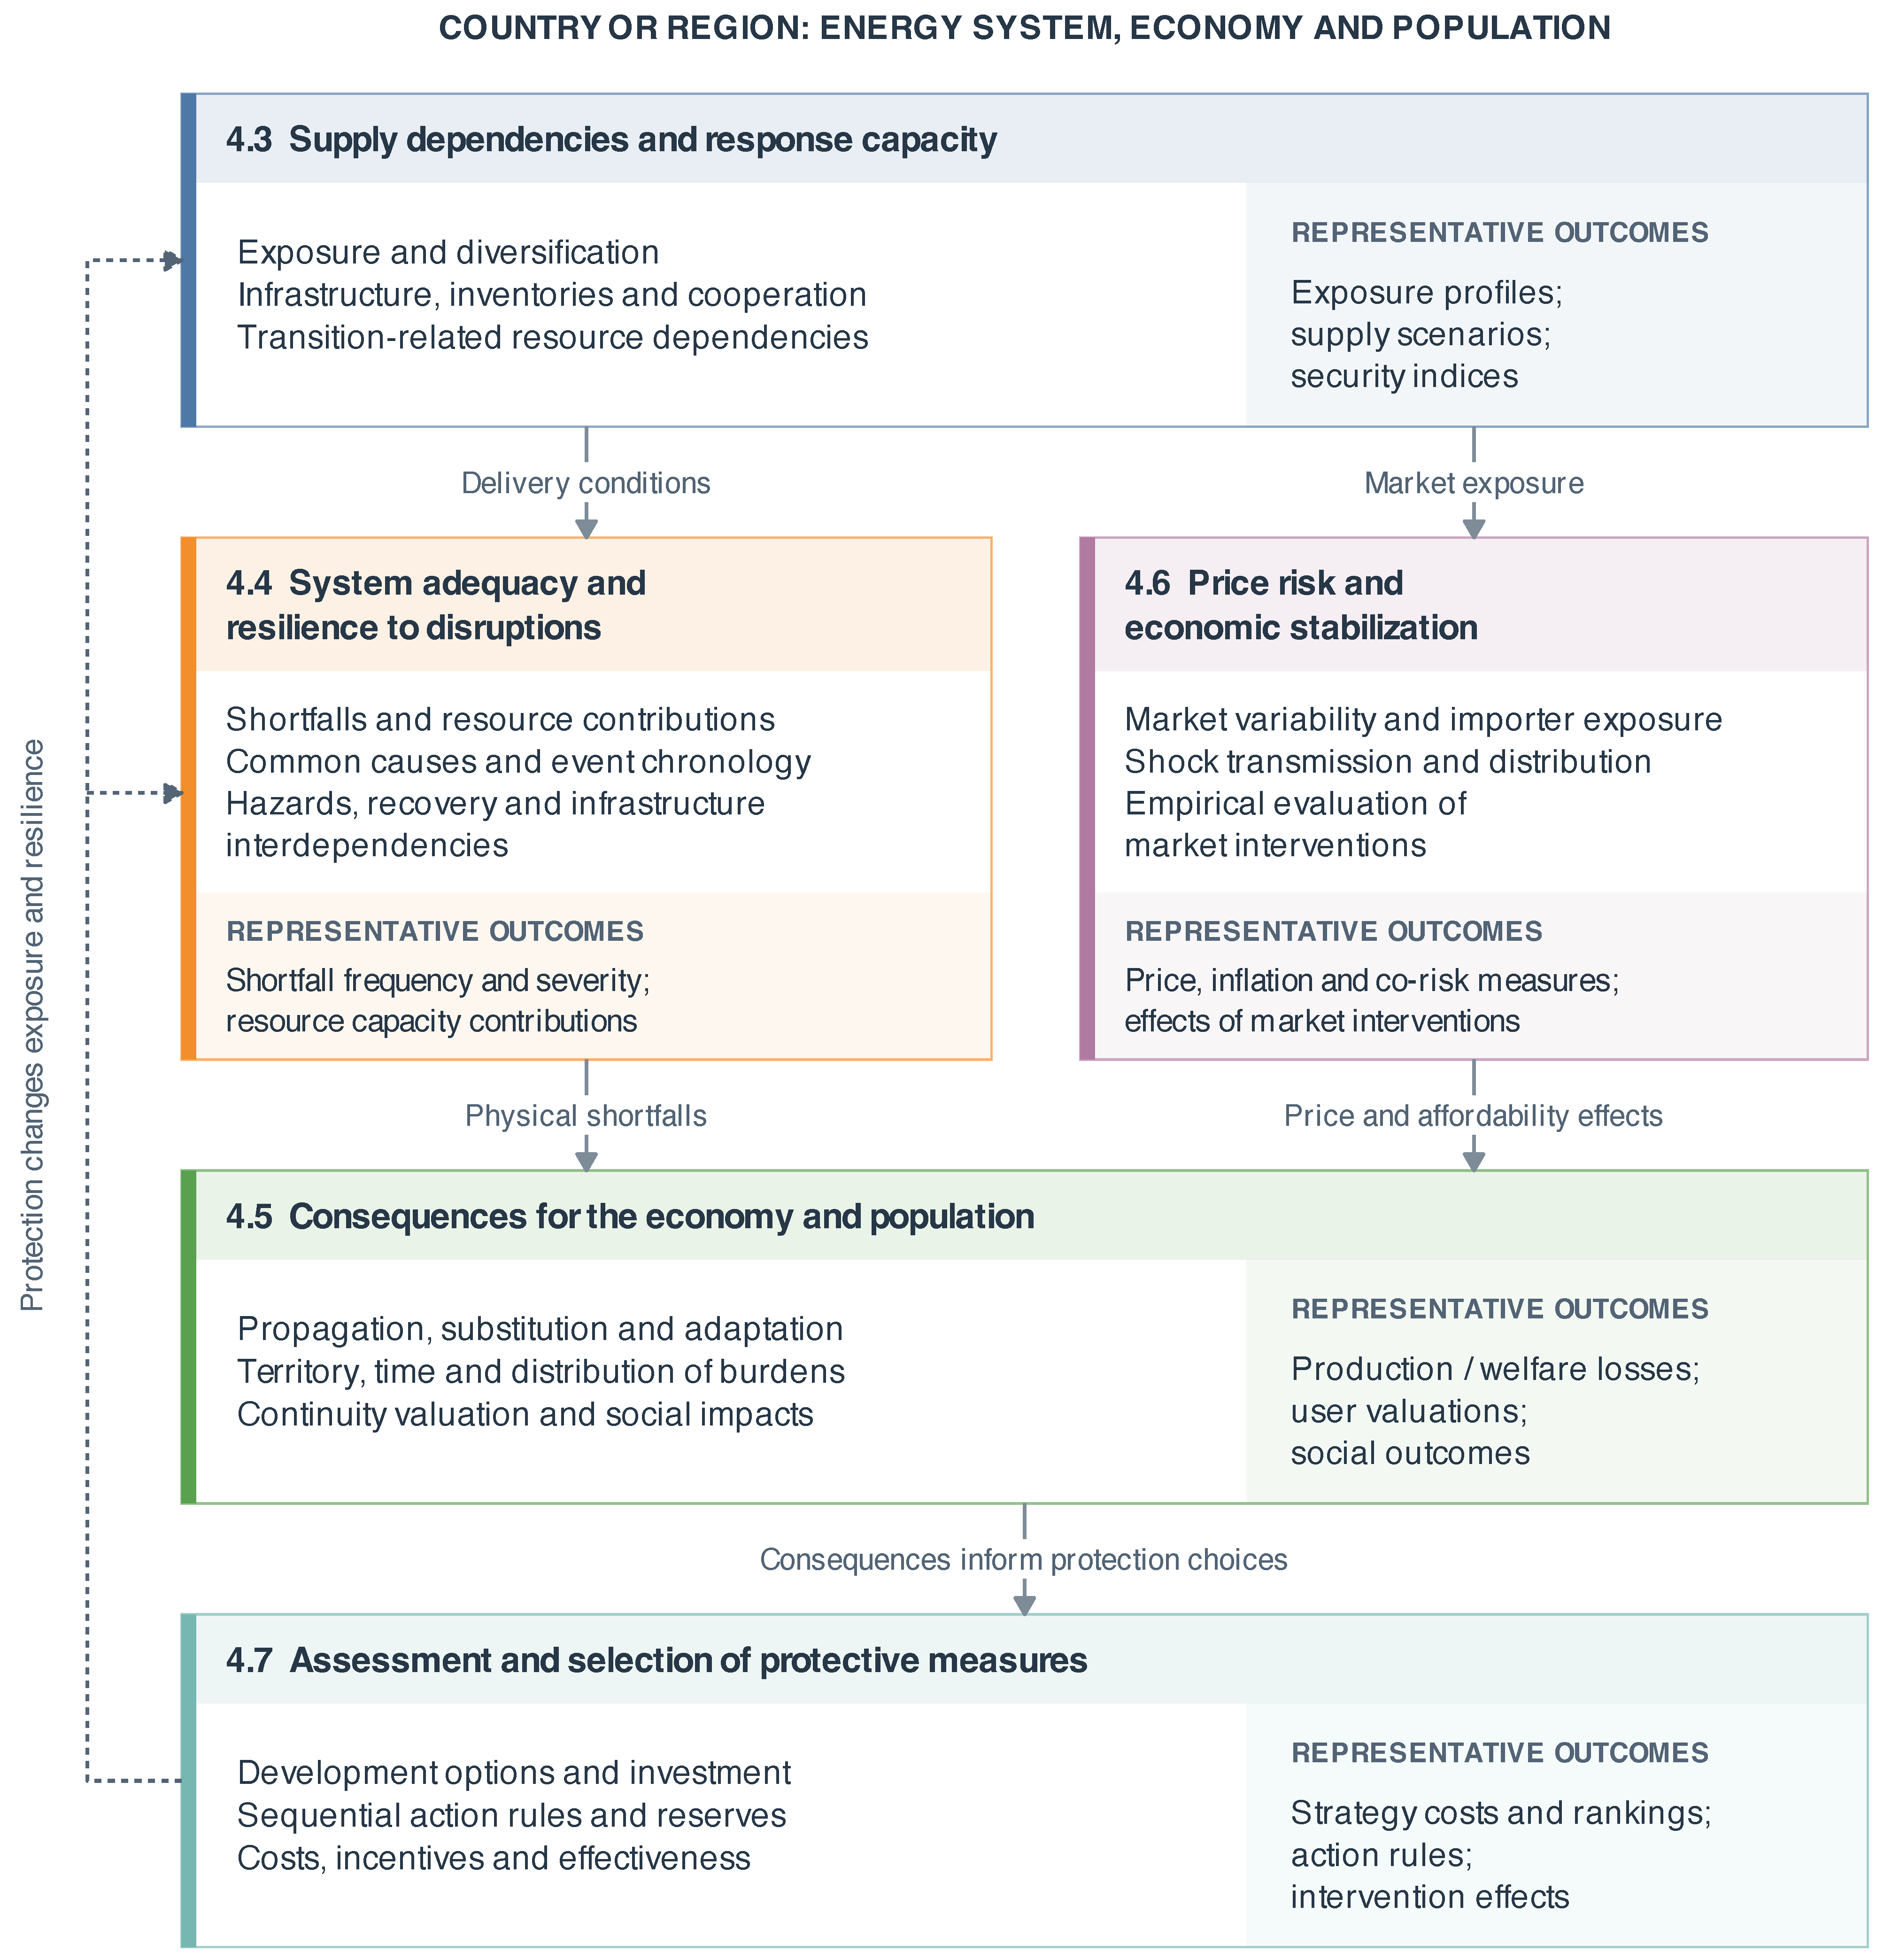
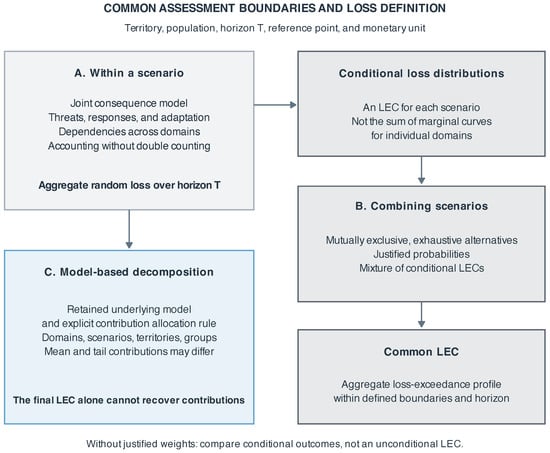
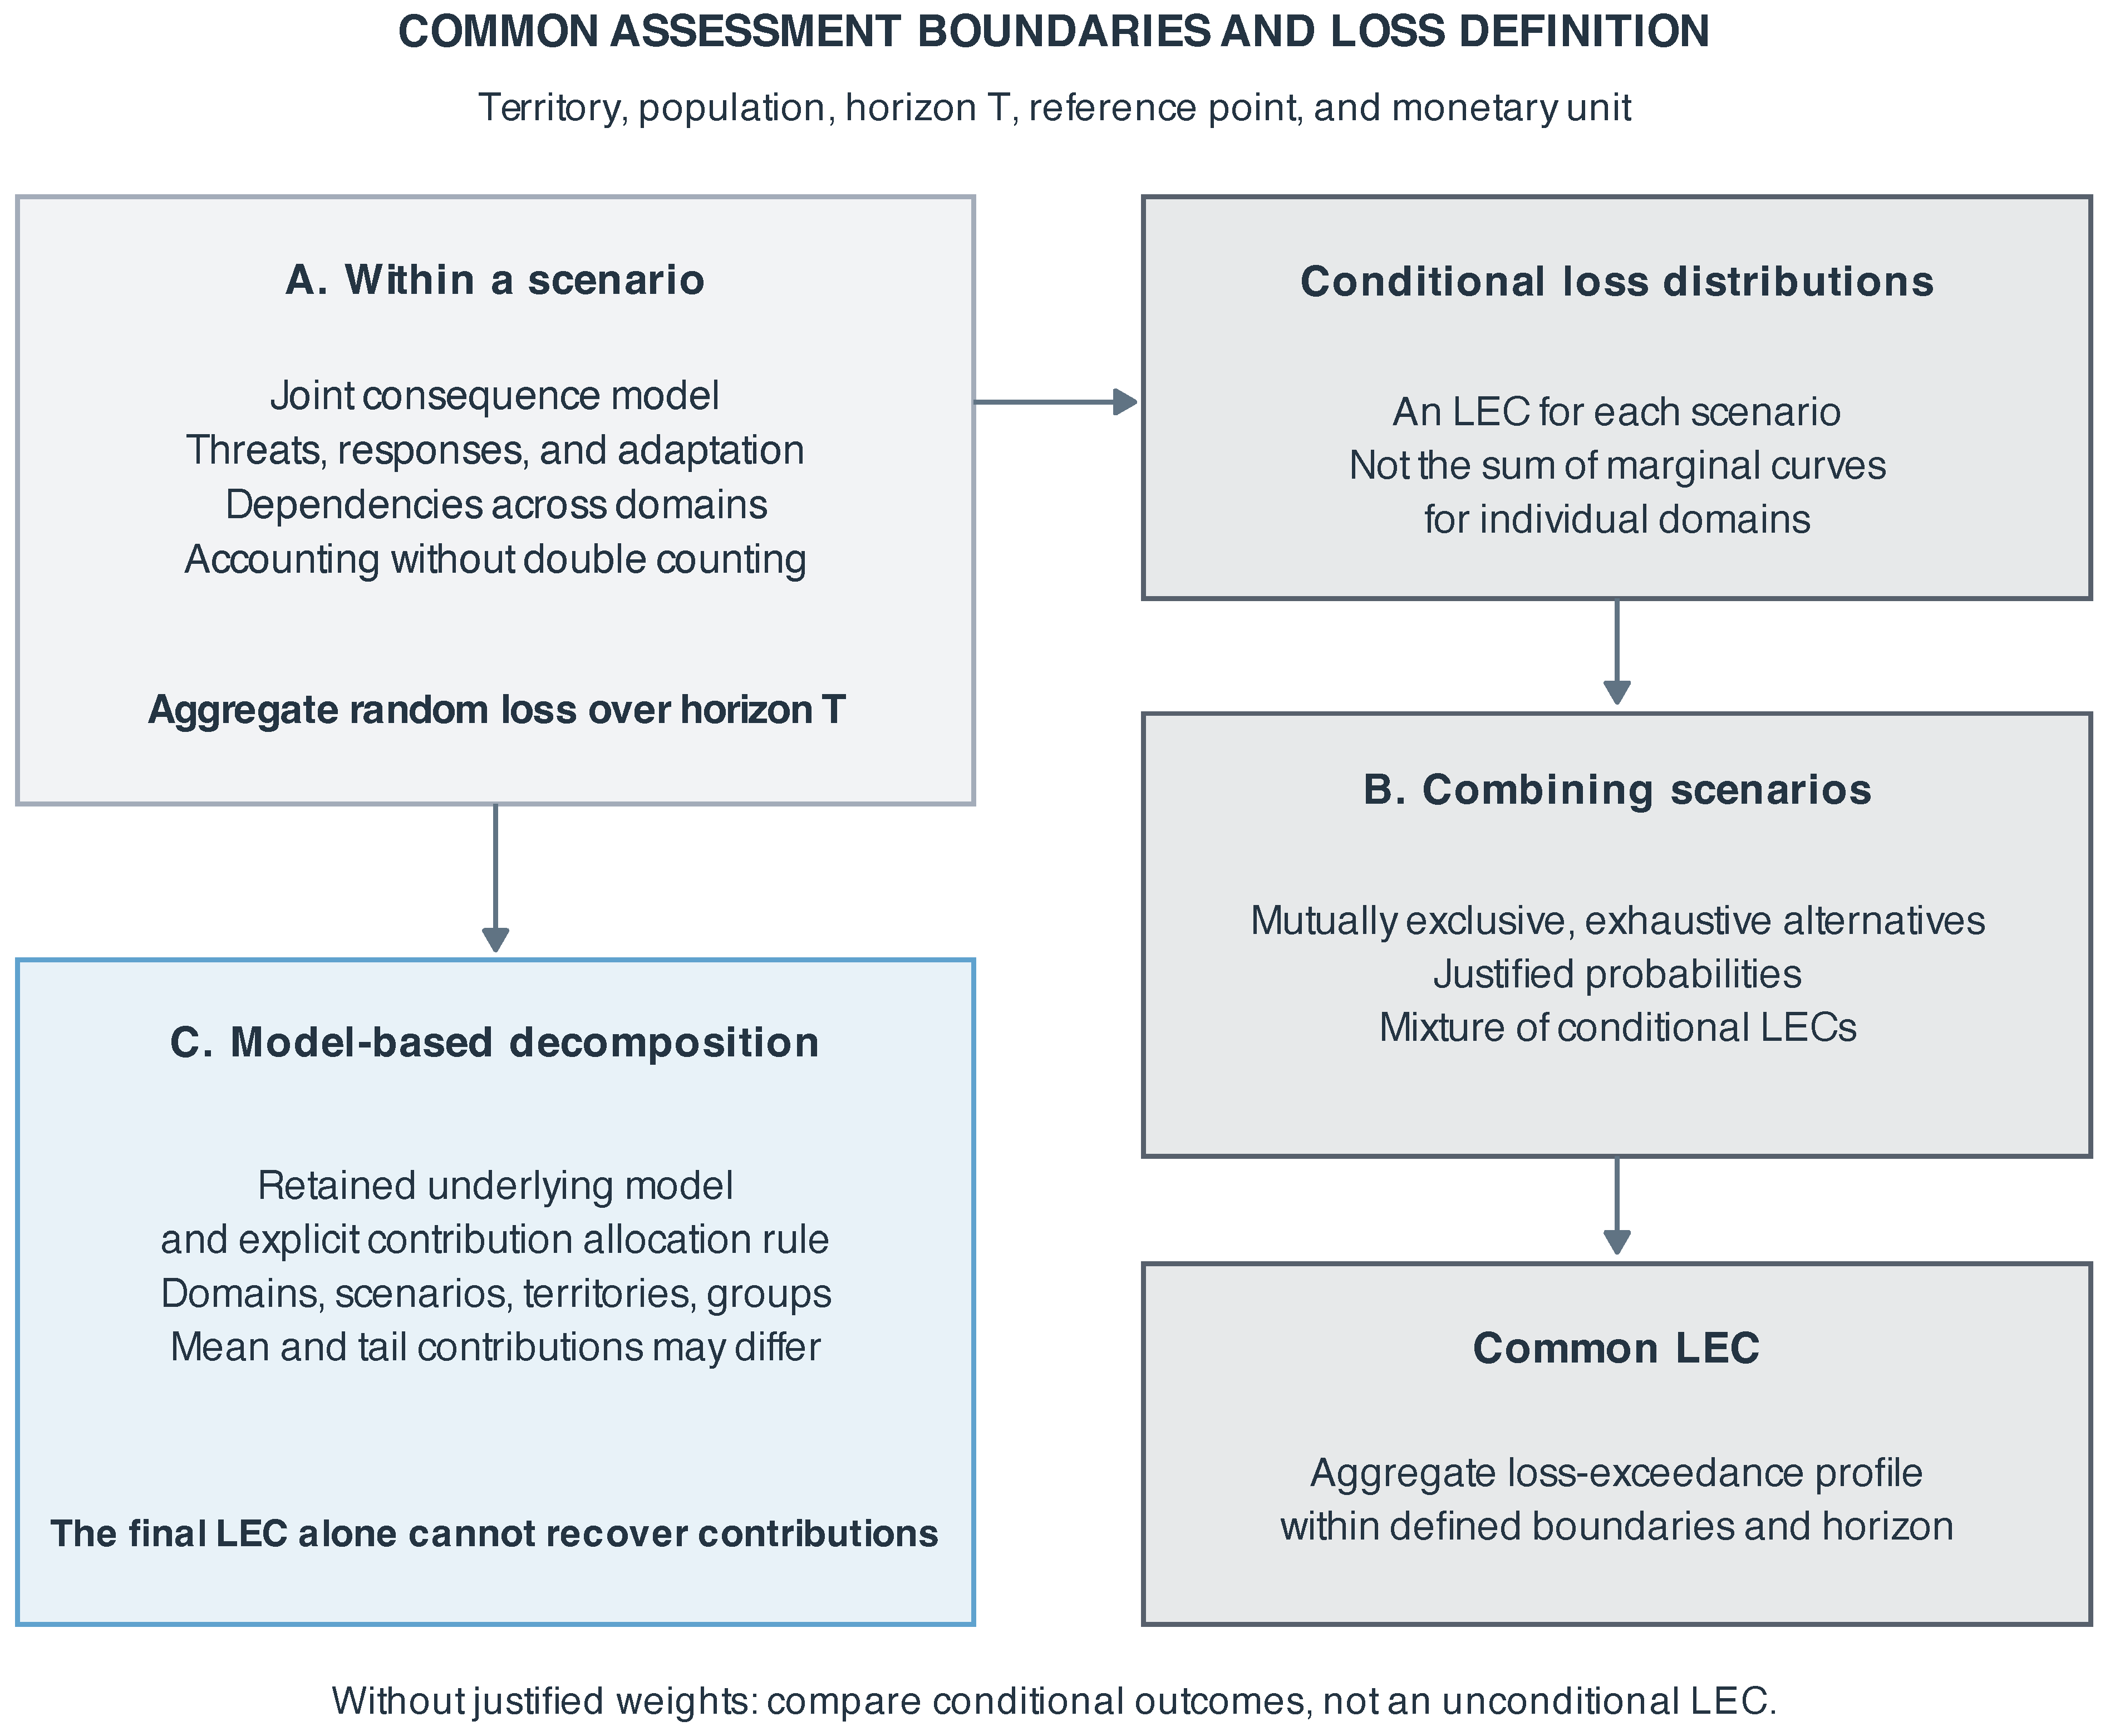

Disclaimer/Publisher’s Note: The statements, opinions and data contained in all publications are solely those of the individual author(s) and contributor(s) and not of MDPI and/or the editor(s). MDPI and/or the editor(s) disclaim responsibility for any injury to people or property resulting from any ideas, methods, instructions or products referred to in the content. |
© 2026 by the author. Licensee MDPI, Basel, Switzerland. This article is an open access article distributed under the terms and conditions of the Creative Commons Attribution (CC BY) license.