


Abstract
Ammonia (NH3) is a carbon-free fuel with growing potential for decarbonizing power generation, but single-cycle combustion faces inherent efficiency limits. This study evaluates a dual-role combined cycle in which ammonia serves as both the Brayton-cycle fuel and the working fluid of a bottoming Rankine cycle, coupling one-dimensional (1D) GT-SUITE system analysis with three-dimensional (3D) CONVERGE CFD analysis of the waste-heat-recovery (WHR) evaporator. Across 15 combinations of Rankine pressure (PR = 15–55 bar) and evaporator tube count (Nt = 40, 70, 100), valid Rankine output required working-fluid evaporation, and system efficiency reached a maximum of 31.98% (Nt = 100, PR = 55 bar), a 4.32-percentage-point gain over gas-turbine-only operation. Component-wise exergy destruction analysis shows combustion irreversibility dominates system losses, with the WHR evaporator as the second-largest contributor, explaining the modest Rankine work output. CFD results reveal a design-critical boundary between PR = 35 and 45 bar, where shell-side flow non-uniformity roughly doubles the tube-to-tube outlet temperature spread (38 K → 74–78 K) and risks a pinch-point violation; a single baffle removes the pinch violation but not the temperature spread, pointing to shell geometric asymmetry as the cause. Integrating the 1D and 3D results, we present a design operating-envelope map and recommend an operating point (Nt ≥ 70, PR ≈ 35 bar) balancing efficiency, stability, and heat-transfer-area economy, identifying the WHR evaporator as the key constraint for future design work.
1. Introduction
Since the Industrial Revolution, ever-increasing reliance on fossil fuels across the power generation, industrial, and transportation sectors has resulted in substantial emissions of carbon dioxide (CO2), a major driver of global warming and the climate crisis [1,2,3]. Such greenhouse-gas (GHG) emissions not only add to the global environmental burden but also weaken energy security and heighten resource-price volatility because of continued fossil-fuel dependence. In particular, the power generation sector, which accounts for approximately 35.5% of national GHG emissions, is the single largest emission source, making its decarbonization a core task for achieving carbon neutrality [4]. Gas-turbine-based power generation systems have contributed to grid stability through high power density and operational flexibility, yet they continue to face structural limitations arising from fossil-fuel combustion [5]. Because a substantial fraction of the enthalpy in gas-turbine exhaust is not recovered under simple-cycle operation, this waste heat represents a significant opportunity for efficiency improvement. Actively recovering it is therefore essential to maximizing overall system efficiency [6]. Power generation technologies capable of utilizing carbon-free fuels while achieving high-efficiency energy conversion are therefore essential for simultaneously reducing GHG emissions in the industrial sector and improving energy self-sufficiency.
Carbon-free fuels are generally classified into hydrogen (H2), ammonia (NH3), and synthetic fuels. Among these, ammonia is a representative carbon-free fuel that contains no carbon in its molecular structure and therefore does not directly emit CO2 upon combustion. Because ammonia can be liquefied at around 9 bar at room temperature and can make use of existing LPG infrastructure, it is regarded as a promising hydrogen carrier for long-distance transport and large-scale storage, offering an alternative to hydrogen, which suffers from low volumetric energy density and high liquefaction and storage costs [7,8,9,10]. Beyond its role in power generation, ammonia is increasingly studied as a low-carbon energy carrier that links renewable electricity, hydrogen, and end-use sectors through power-to-ammonia pathways, with waste heat recovered from ammonia synthesis and co-firing processes contributing directly to overall system efficiency [11]. Ammonia has also been broadly reviewed as a power-generation fuel in its own right, spanning direct combustion, co-firing, and fuel-cell pathways [12]. The International Energy Agency (IEA) projects that, under its 2050 carbon-neutrality scenario, demand for direct combustion and co-firing of ammonia in the power sector will increase substantially [13], and demonstrations of 100% ammonia-fired gas turbines together with related commercialization efforts are already being actively pursued both domestically and internationally [14,15,16,17]. Nevertheless, ammonia has a very low laminar flame speed (about 7 cm/s at room temperature and pressure) [18,19,20,21] and a strong tendency toward fuel-derived NOx formation [22], which impose structural constraints on flame stability and exhaust treatment when it is applied as a power-generation fuel. In terms of demonstrated performance, standalone ammonia-fueled Brayton cycles have been reported to reach a net electrical efficiency of approximately 36%, with waste-heat-recovery-augmented configurations raising this by a further 20.6 percentage points [23]; at smaller scale, direct ammonia combustion has been experimentally confirmed to be feasible in a 100 kW-class micro gas turbine. For the bottoming cycle, standalone ammonia(-water)-based Rankine cycles for low-to-moderate-temperature waste-heat and geothermal sources have been shown to achieve competitive power output per unit working-fluid mass flow relative to steam, motivating their consideration as a bottoming-cycle working fluid in the present study [24]. Furthermore, whereas hydrogen has relatively well-established utilization pathways such as fuel cells, ammonia still lacks an adequate integrated power generation system, so its potential as an energy resource remains underexploited. Consequently, developing a power generation technology capable of stably combusting and converting ammonia while simultaneously recovering waste heat to maximize overall system efficiency is regarded as a key technical element for the commercialization of carbon-free power generation.
Existing technologies proposed for ammonia-based power generation include direct gas-turbine combustion, solid oxide fuel cells (SOFC), and gas-turbine bottoming-cycle combined generation. Direct gas-turbine combustion can reuse existing gas-turbine infrastructure, offering a low barrier to commercialization and the capability for large-capacity operation; however, it requires injection and co-firing strategies to address the combustion-stabilization difficulties arising from the low flame speed and to suppress NOx, and because it is a single-cycle configuration, a large fraction of the exhaust waste heat is released to the atmosphere unrecovered, resulting in low overall efficiency. Ammonia SOFC systems, by contrast, can achieve high unit efficiency through efficient electrochemical conversion, but the high cost of cell materials, slow load response, and lifetime limitations due to cell degradation make the system complex and require considerable time to reach large-capacity, commercial-scale deployment. Both approaches have the advantage of a relatively simple system structure based on a single conversion device, but they face limitations in the output scale and efficiency required for practical power-generation applications. Gas-turbine–Rankine combined generation, on the other hand, recovers gas-turbine exhaust waste heat in a bottoming Rankine cycle to obtain additional output without any extra fuel input [6], and allows the system efficiency to be tuned over a wide range depending on the choice of working fluid [25,26]. These characteristics make the gas-turbine–Rankine combined cycle a promising alternative for high-efficiency, low-emission ammonia-based power generation.
However, even though the gas-turbine–Rankine combined generation approach is applicable, several technical limitations remain in implementing an actual ammonia-based system. These include the sensitivity of efficiency to the choice of bottoming-cycle working fluid, the narrow evaporation-temperature window and shell-side flow non-uniformity inside the waste-heat-recovery (WHR) evaporator, and outlet-end temperature reversal caused by pinch-point violations. To address these limitations, prior studies have investigated working-fluid selection, cycle operating-condition optimization [27], and heat-exchanger component design improvements. Chen et al. [28] broadly compared candidate working fluids for organic Rankine cycles (ORC) used to recover low-grade heat sources, showing that working-fluid selection is a key variable determining system efficiency, while Bao and Zhao [29] systematically organized ORC working-fluid and expander-type selection to provide cycle-design guidelines. Zhang et al. [30] quantitatively characterized the boiling heat transfer and flow visualization of R717 (ammonia) in horizontal tubes, clarifying its evaporation characteristics and flow behavior, and Pamuk [31] performed a 3D CFD analysis of a shell-and-tube heat exchanger to analyze the effects of shell-side flow structure and baffle geometry on heat-transfer performance. Bozorgan et al. [32] quantified the effects of tube arrangement, pitch, and baffle spacing on pressure drop and heat transfer through thermo-hydraulic optimization of a shell-and-tube heat exchanger. However, such prior studies have generally focused on either the cycle level or the component level individually, and studies that integrate a dual-role combined cycle—in which ammonia serves simultaneously as fuel and as working fluid—at both the system and component levels remain very limited. In particular, a 1D cycle analysis alone cannot capture component-level phenomena such as flow non-uniformity, local under-evaporation, and pinch-point violation inside a shell-and-tube evaporator, making it difficult to assess the gap between the thermodynamically optimal design point and the actual heat-exchanger behavior.
Accordingly, this study targets a combined power generation system in which ammonia is used simultaneously as the Brayton-cycle fuel and as the bottoming Rankine-cycle working fluid, applying a multiscale approach that links one-dimensional (1D) system analysis with three-dimensional (3D) CFD component analysis to (i) quantitatively verify the operational feasibility of the dual-role configuration, (ii) identify the critical design conditions of the WHR evaporator, and (iii) derive design guidelines that ensure stable operation. By setting the Rankine high-side pressure (PR) and the WHR evaporator tube count (Nt) as the primary design variables, this study quantitatively characterizes the system-level output, efficiency, and heat-recovery trends (1D) together with the local flow and heat-transfer behavior inside the evaporator (3D), providing a quantitative starting point for the design of high-efficiency, high-reliability ammonia-based combined power generation systems.
2. System Configuration and Analysis Methods
2.1. Ammonia-Based Brayton–Rankine Combined Power Generation System
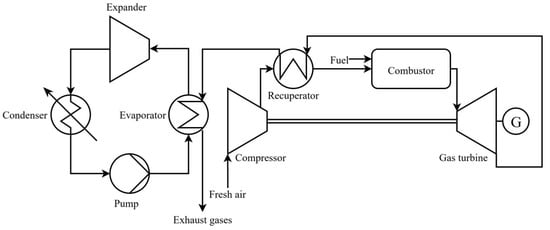
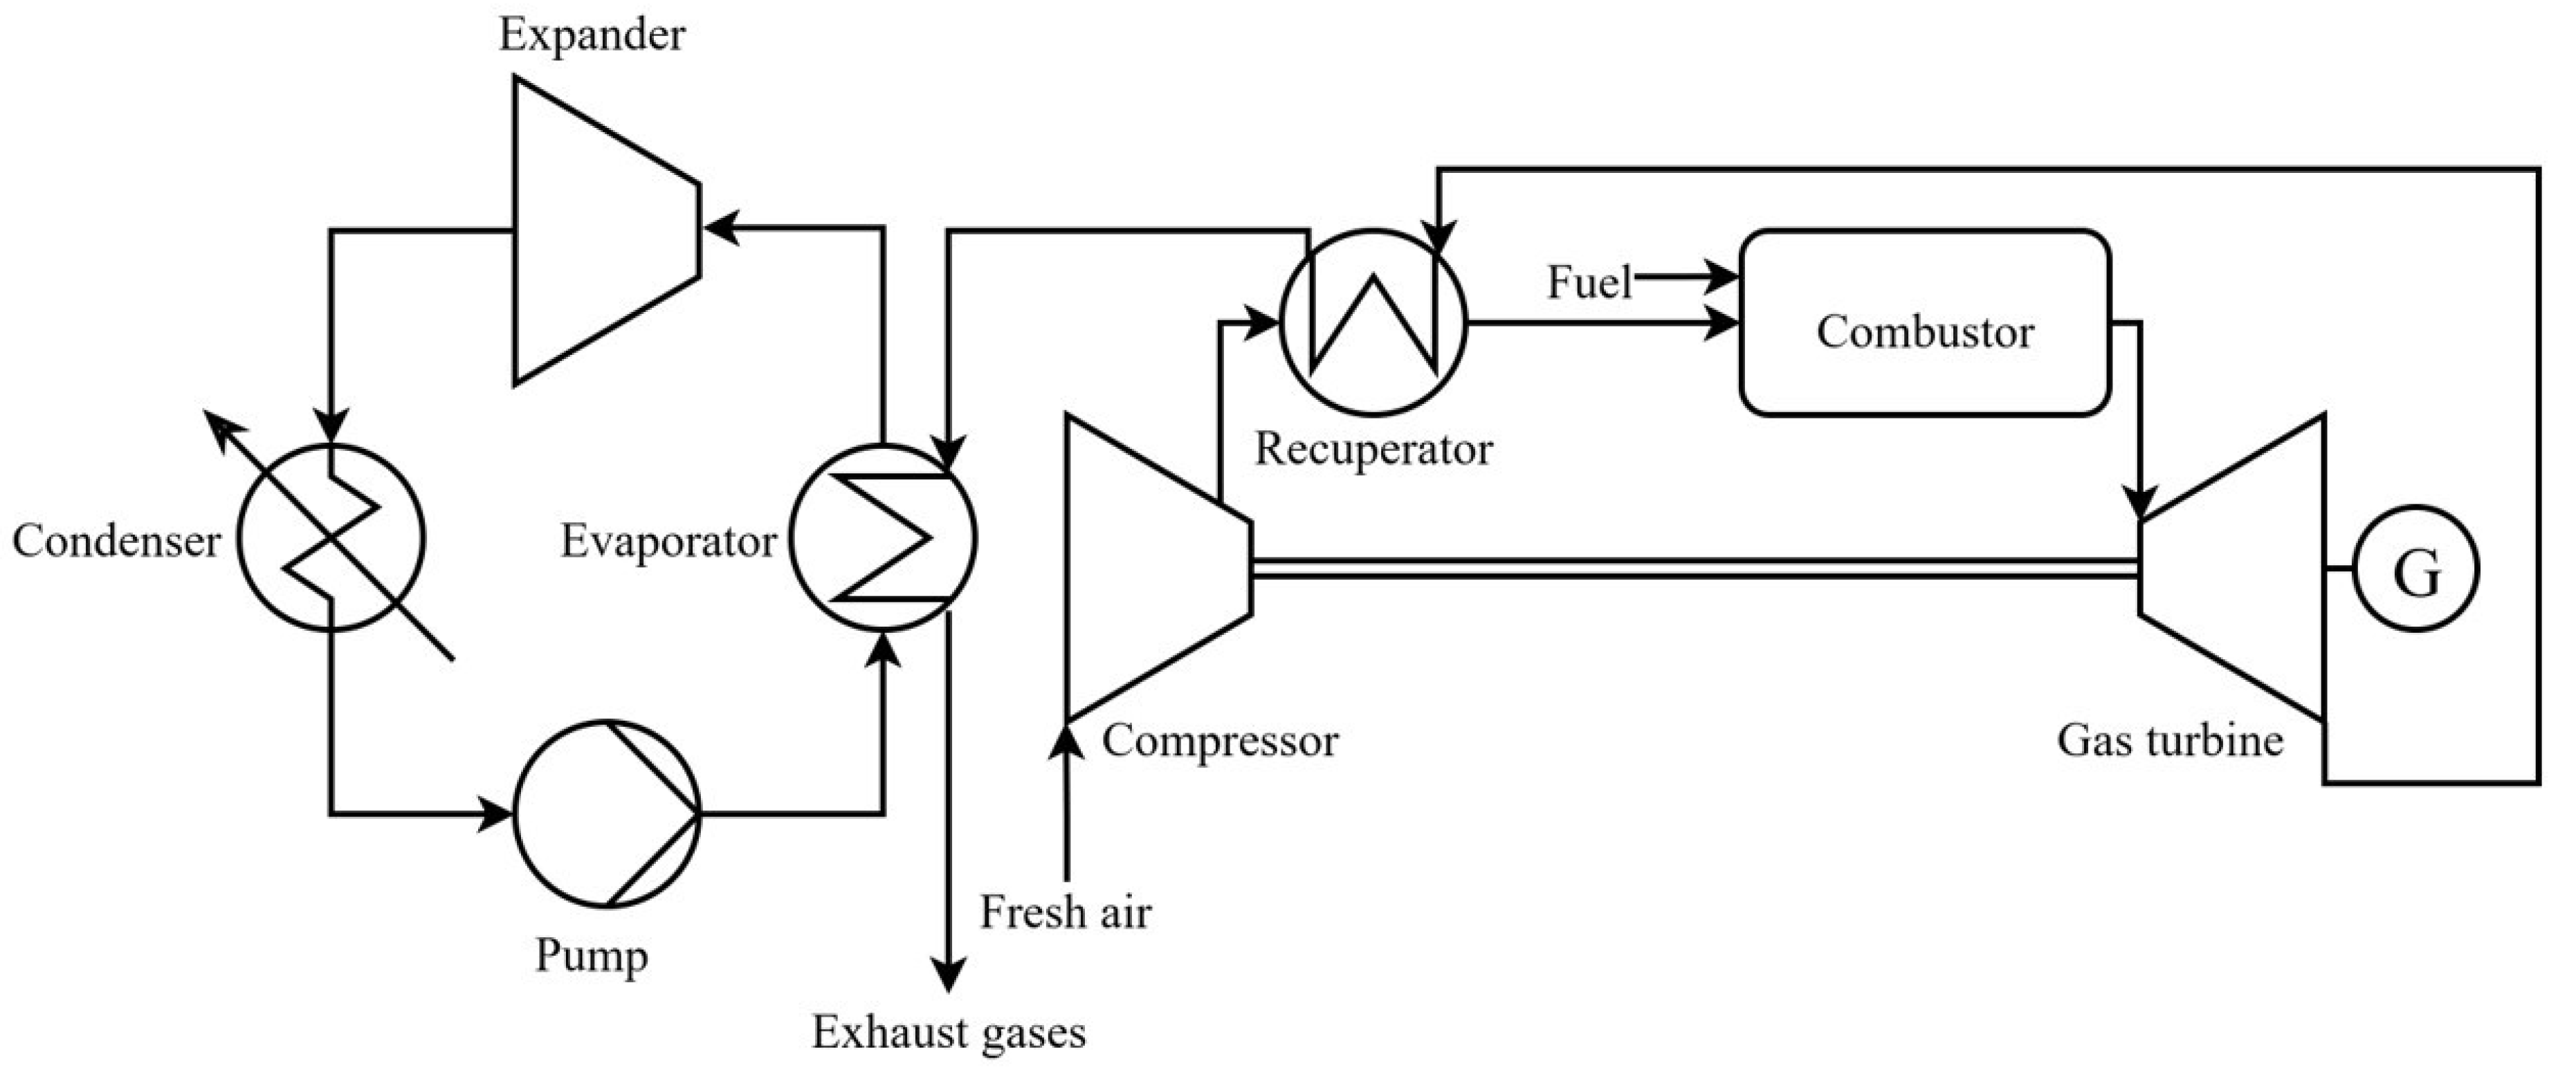
Figure 1 shows a schematic diagram of the ammonia-based combined power generation system considered in this study. The system couples a gas-turbine Brayton cycle that uses ammonia as fuel with a Rankine cycle that uses the same ammonia as its working fluid, based on the concept of unifying the fuel and the working fluid into a single medium so as to eliminate carbon emissions at the source and simplify the energy-conversion structure.
Figure 1.
Schematic diagram of the ammonia-fueled Brayton–Rankine combined cycle.
The Brayton cycle consists of a compressor, an air preheater (recuperator), a combustor, and a turbine. External air is compressed in the compressor, has its temperature raised as it passes through the recuperator, and then enters the combustor, where it is mixed and combusted with ammonia fuel; the resulting high-temperature combustion gas produces mechanical output in the turbine. The Rankine cycle consists of a WHR evaporator, an expander [33], a condenser, and a pump, and uses the waste heat of the Brayton-cycle exhaust gas as its heat source. Beyond its commonality with the Brayton-cycle fuel, ammonia offers several thermophysical characteristics that support its selection as the Rankine-cycle working fluid. Its large latent heat of vaporization and favorable transport properties give it a heat-transfer performance in shell-and-tube evaporators comparable to, or better than, common organic Rankine cycle (ORC) working fluids [30]. As a natural refrigerant, ammonia has zero ozone-depletion potential and a global-warming potential of essentially zero, unlike many synthetic ORC fluids. Its moderate critical pressure (113.6 bar) keeps the WHR evaporator in a subcritical, moderate-pressure regime, in contrast to CO2-based bottoming cycles, which typically require transcritical operation above 74 bar to achieve comparable cycle efficiency [7,8,9,10]. Relative to a steam bottoming cycle, ammonia’s higher saturation pressure at ambient condenser temperatures avoids the deep sub-atmospheric condensing pressures that steam cycles require at this waste-heat temperature range, which would otherwise increase turbine specific volume and condenser size. These properties, together with the operational simplicity of using a single working substance for both the topping and bottoming cycles, motivate the present dual-role configuration. In this system, the turbine exhaust gas is first used in the recuperator to preheat the compressed air, after which the remaining heat is supplied to the WHR evaporator to heat, evaporate, and superheat the Rankine working fluid.
This study sets the Rankine-cycle high-side pressure PR as the primary design variable. PR is both the pump outlet pressure and the WHR evaporator inlet pressure, and it determines the evaporation temperature and the expander inlet state. With the condenser pressure held constant at 10 bar, PR was varied over 15, 25, 35, 45, and 55 bar, while the WHR evaporator tube count Nt was varied over 40, 70, and 100 to evaluate the effect of heat-transfer area. The Brayton-cycle operating parameters listed in Table 1 (pressure ratio, turbine-inlet temperature, and component isentropic efficiencies) were held fixed across all 15 operating conditions and were selected to be representative of small-scale recuperated industrial gas turbines; this fixed Brayton definition isolates the effect of the WHR/Rankine-side design variables, Nt and PR, which are the focus of this study. The main system operating parameters are summarized in Table 1.
Table 1.
Summary of system operating parameters.
2.2. Multiscale Analysis Strategy
The analysis in this study consists of a two-stage multiscale approach comprising (i) 1D system analysis based on GT-SUITE and (ii) 3D CFD component analysis based on CONVERGE. The 1D analysis quantifies the overall system energy balance and output/efficiency to evaluate macroscopic behavior as a function of the design variables, while the 3D analysis verifies, at the component level, the operating conditions derived from the 1D analysis and quantifies local phenomena inside the shell-and-tube evaporator, such as flow non-uniformity, pinch points, and tube-to-tube temperature spread. The two analyses share their operating and boundary conditions, allowing a quantitative assessment of the gap between the system-optimal design point and the actual component behavior; deriving, on this basis, design guidelines that ensure stable operation constitutes the purpose of this multiscale approach.
2.3. 1D System Analysis
1D analysis of the integrated Brayton–Rankine system was performed in the GT-SUITE v2024 environment linked with the NIST REFPROP property library. GT-SUITE is a thermodynamics-based simulation platform that models energy-system components such as gas turbines, heat exchangers, pumps, and turbines as 1D network components, and the state-dependent properties of the working fluid (NH3) and the exhaust gas are computed at every sub-volume through a direct interface between the GT-SUITE solver and REFPROP. For pure ammonia, REFPROP evaluates properties using the Helmholtz-energy-explicit equation of state of Tillner-Roth, Harms-Watzenberg, and Baehr [34].
The schematic structure of the 1D system network constructed in this study is shown in Figure 1. The Brayton cycle is composed of a compressor, recuperator, combustor, and turbine, and the Rankine cycle of a pump, WHR evaporator, expander, and condenser; the two cycles are coupled through counter-flow heat exchange between the shell-side exhaust gas and the tube-side NH3 in the WHR evaporator. The compressor and turbine were modeled as performance-map components based on isentropic efficiency, and the pump and expander as rotating-machinery components taking isentropic efficiency as an input; the efficiency and operating parameters of each component are summarized in Table 1. The entire system was solved at steady state using GT-SUITE’s explicit solver, simultaneously satisfying control-volume-based mass, energy, and momentum conservation equations.
Because the WHR evaporator is the key component determining system efficiency in the 1D analysis, the model discretizes it into multiple sub-volumes along its length and applies different heat-transfer correlations region by region according to the local fluid state (Table 2). The Dittus–Boelter correlation was applied to the single-phase tube-side regions, the Shah (1982) correlation [35] to the evaporating region, the Shah (1979) correlation [36] to the condensing region, and the Colburn j-factor correlation to the shell-side external cross-flow region. The overall heat-transfer coefficient U is determined as the series sum of the tube-inside, wall, and shell-side resistances:
where hi and ho are the tube inside/outside convective heat-transfer coefficients (W/m2·K), and tw and kw are the tube wall thickness (m) and the thermal conductivity of the wall material (W/m·K), respectively.
Table 2.
Heat-transfer correlations used in the 1D sizing.
The design-variable range of the WHR evaporator was determined through log-mean-temperature-difference (LMTD)-based sizing, following geometry ranges reported for shell-and-tube waste-heat-recovery exchangers in the literature (tube diameter ≈ 8–25 mm, tube length ≈ 0.5–2.0 m) [31,32,37,38,39,40]. Under the reference operating condition, the recoverable waste-heat quantity is about 270 kW, and applying the literature range of overall heat-transfer coefficients for shell-and-tube evaporators (U = 200–300 W/m2·K) gives a required heat-transfer area of about 5.9–8.9 m2. On this basis, Nt = 70 (A = 5.28 m2) and Nt = 100 (A = 7.54 m2) were selected as the primary comparison cases, and Nt = 40 (A = 3.02 m2) was selected as the lower bound for evaluating performance limits under an insufficient-heat-transfer-area condition.
Nt is not merely a geometric variable but a key design variable in which the local heat-transfer coefficient and the heat-transfer area act in opposite directions. Under the same NH3, increasing Nt reduces the per-tube mass flux G = NH3/(Nt·Ac), lowering the Reynolds number (Re = G·di/μ) and the tube-inside heat-transfer coefficient (hi ∝ Re0.8), while the heat-transfer area A = Nt·π·do·L increases in proportion to Nt. This study varied Nt to quantitatively evaluate this trade-off behavior. The ranges of the operating pressure PR and Nt, together with the resulting 15 analysis conditions, are summarized in Table 3.
Table 3.
1D analysis conditions.
2.4. 3D CFD Component Analysis (CONVERGE)
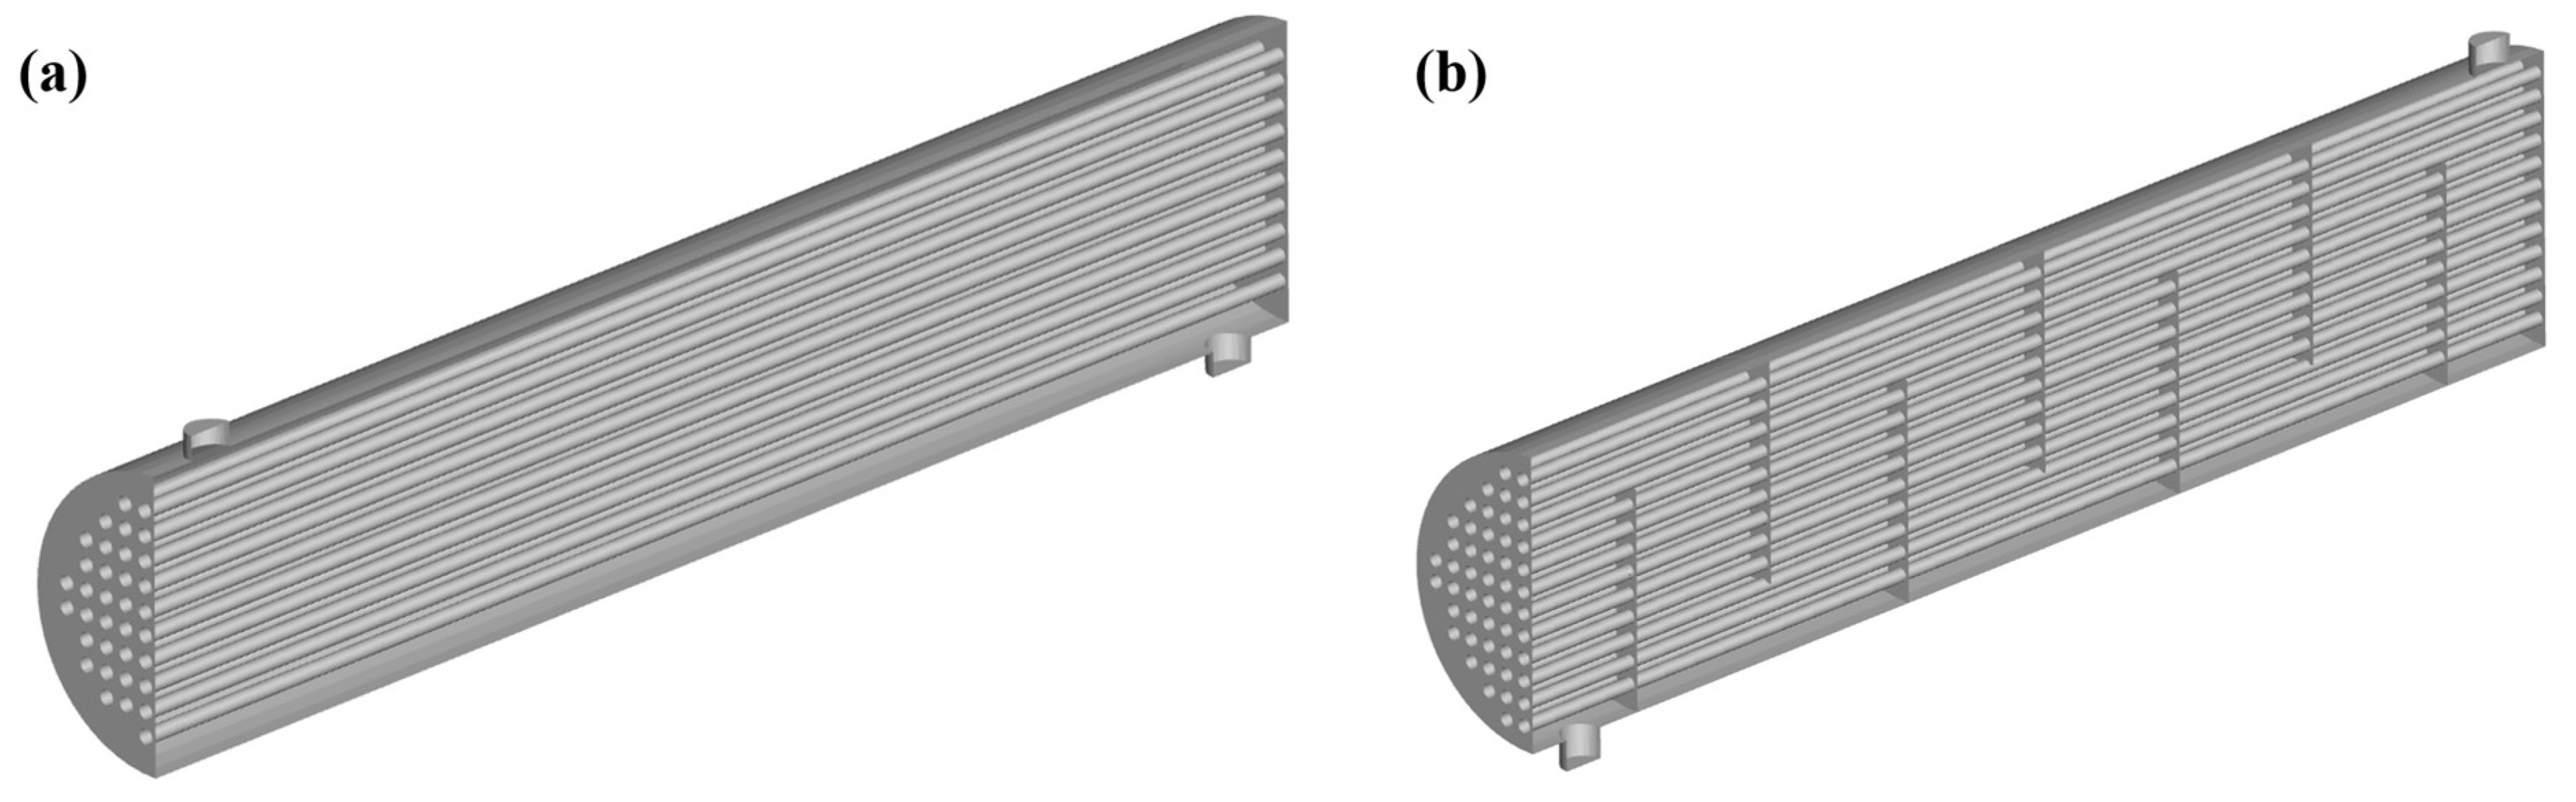
The flow and heat-transfer behavior inside the WHR evaporator was analyzed in three dimensions at steady state using CONVERGE v4.1.2. The steady-state approach was adopted because the objective of the CFD analysis is component-level thermal-hydraulic characterization at fixed operating points already established by the 1D system analysis, rather than the transient system response to load changes; this is consistent with the scope of the present study, which targets feasibility and bottleneck identification at defined operating points rather than dynamic control behavior. This approach does not capture start-up, load-transient, or partial-load dynamic behavior, and the steady-state stability boundary identified here (Section 3.4) should accordingly be interpreted as a necessary, not sufficient, condition for stable operation under real transient loading; a transient CFD or reduced-order dynamic analysis, noted as future work in the Conclusions, would be required to establish sufficiency. The configuration is a counter-flow arrangement with exhaust gas on the shell side and NH3 working fluid on the tube side; the shell-side and tube-side regions were defined as separate fluid domains within the same model, with conjugate heat transfer occurring through zero-thickness tube walls. Because the unit-area conduction thermal resistance of the SUS304 tubes (t/k ≈ 1.25 × 10⁻⁴ m2·K/W) amounts to only 1–2% of the shell-side convective thermal resistance, neglecting the wall thickness was judged to have a negligible effect. A half-model exploiting longitudinal symmetry was adopted, reducing the number of tubes analyzed to Nt/2. Two model configurations were analyzed in this study (Figure 2): a baseline model without a baffle (Figure 2a), used for a systematic evaluation at four operating pressures (PR = 25, 35, 45, 55 bar), and a comparison model with seven single-segmental baffles (25% cut) (Figure 2b), used only at the representative operating point PR = 55 bar to evaluate the demonstrative effect of the baffle. The geometric parameters of the heat exchanger used in the CFD model are summarized in Table 4.
Table 4.
CFD geometry parameters.
The shell-side and tube-side boundary conditions were specified independently for each side based on the 1D analysis results. Detailed boundary conditions are summarized in Table 5, and the corresponding solver, turbulence model, and convergence settings are summarized in Table 6.
Table 5.
CFD boundary conditions (Nt = 100).
Table 6.
CFD numerical settings.
Figure 2.
Computational domain of the shell-and-tube WHR evaporator (half-model): (a) baseline model without baffles; (b) comparison model with seven single-segmental baffles (25% cut).
3. Results and Discussion
3.1. System Operational Feasibility and Efficiency Improvement
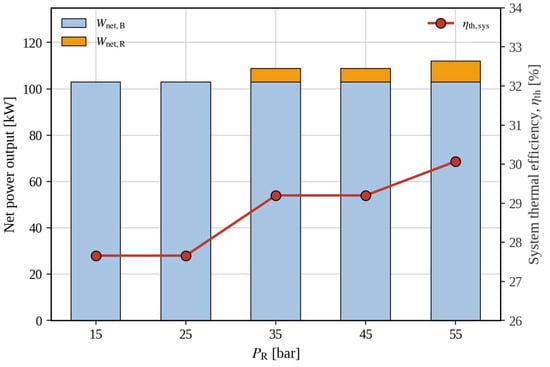
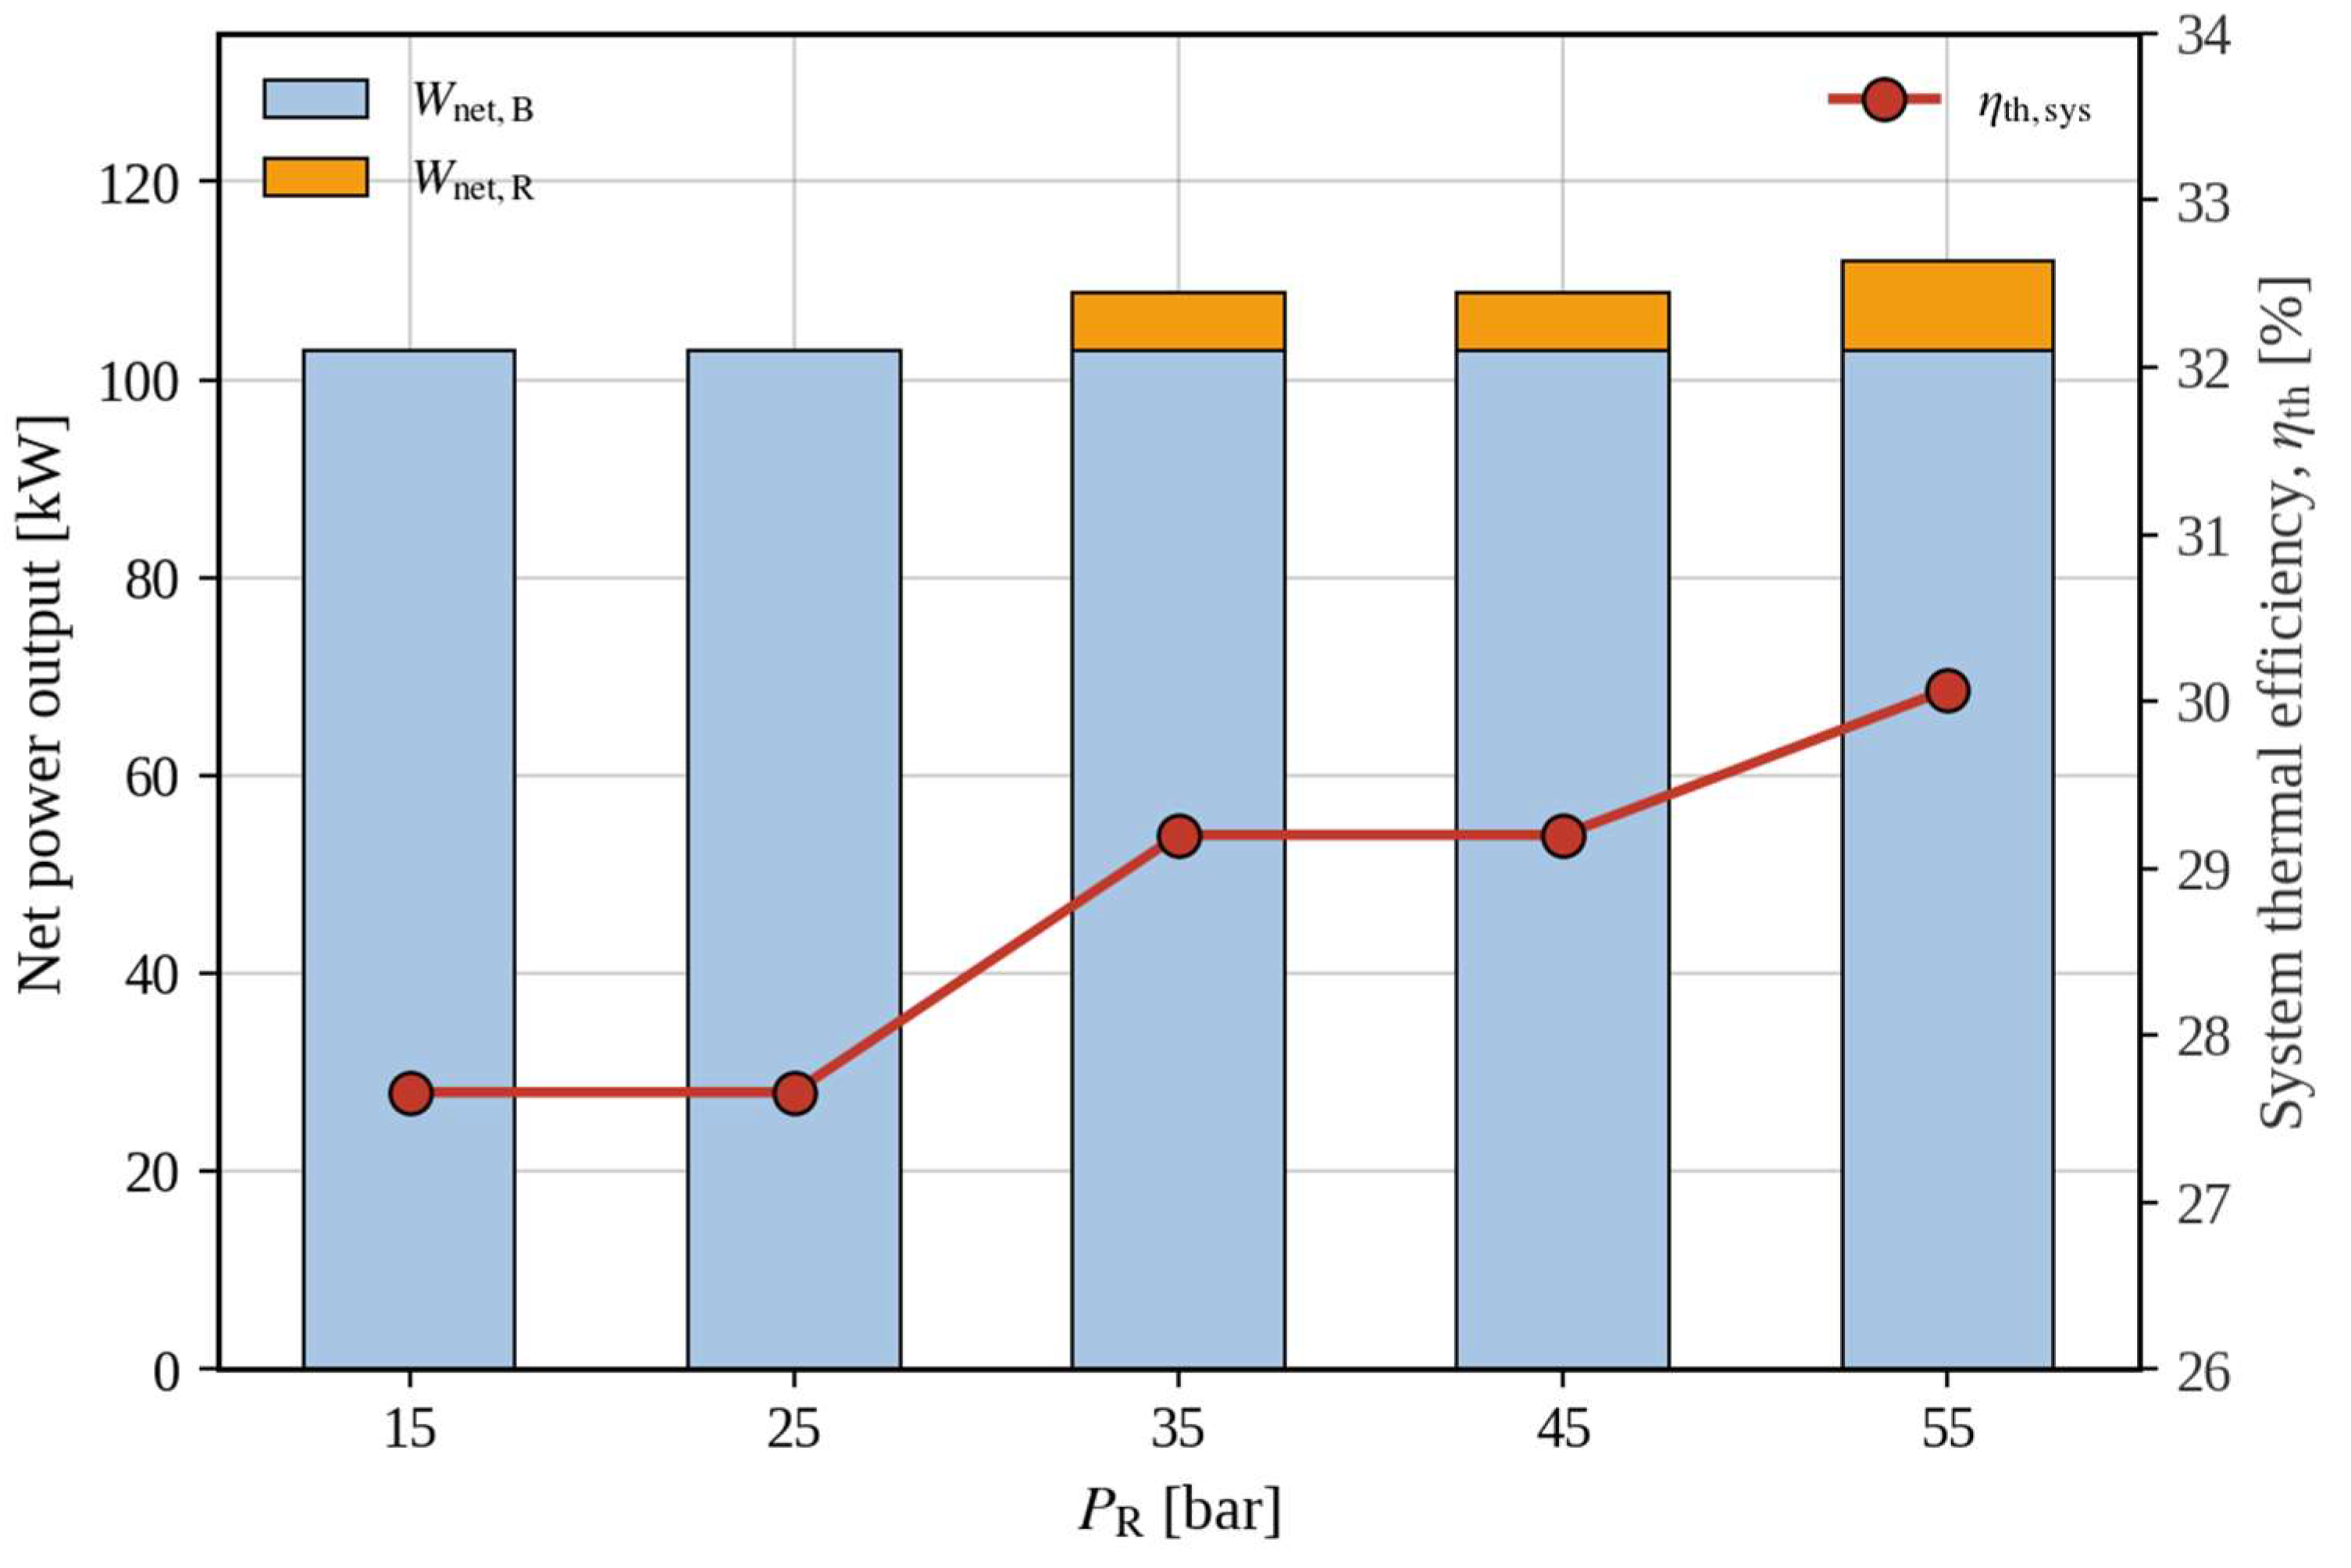
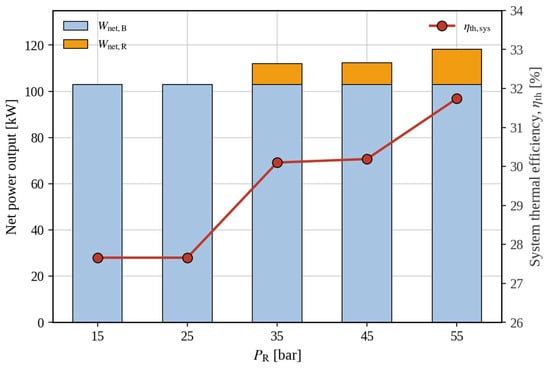
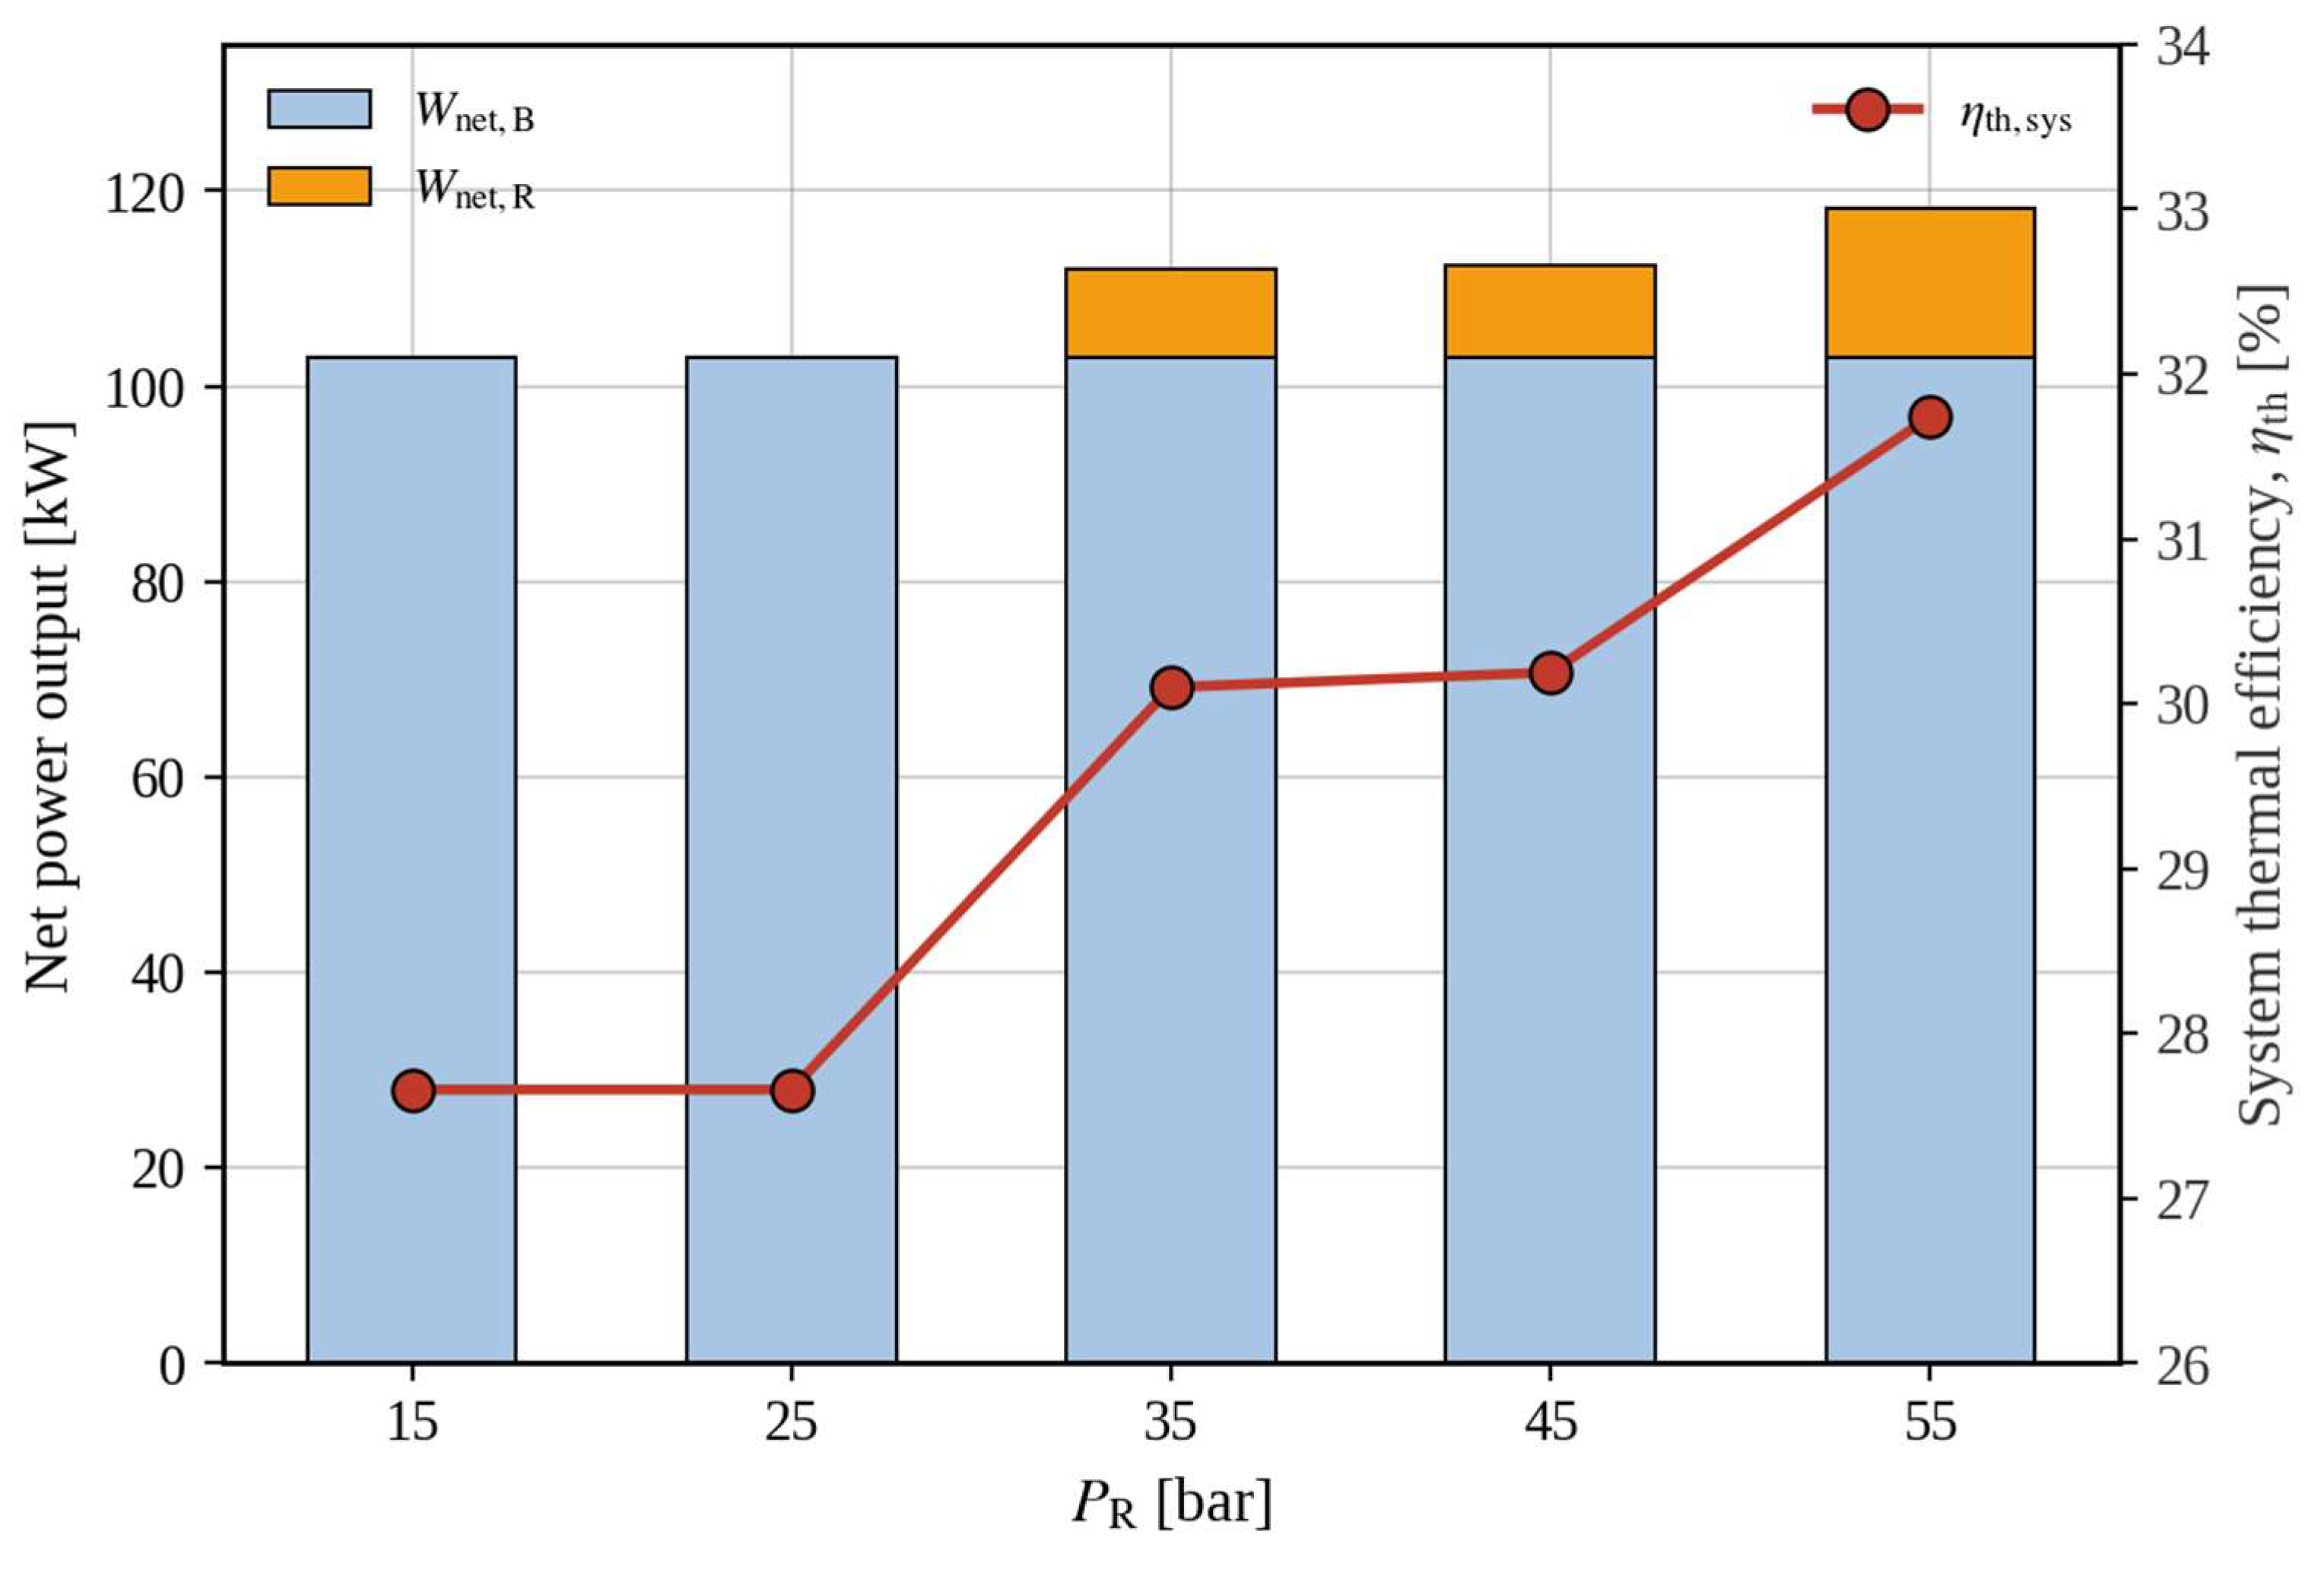
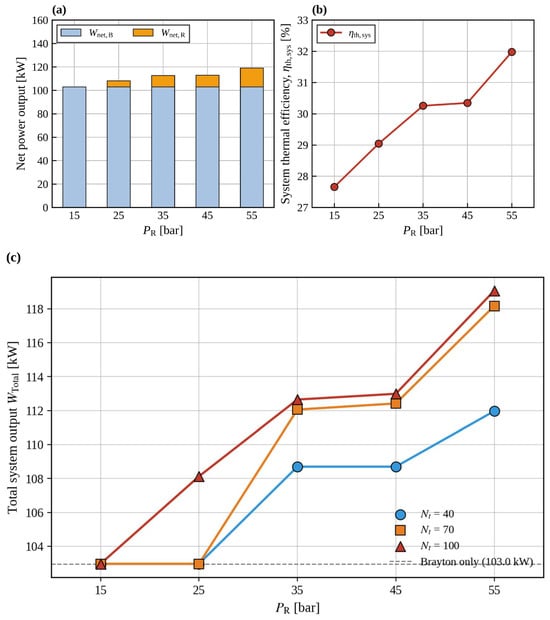
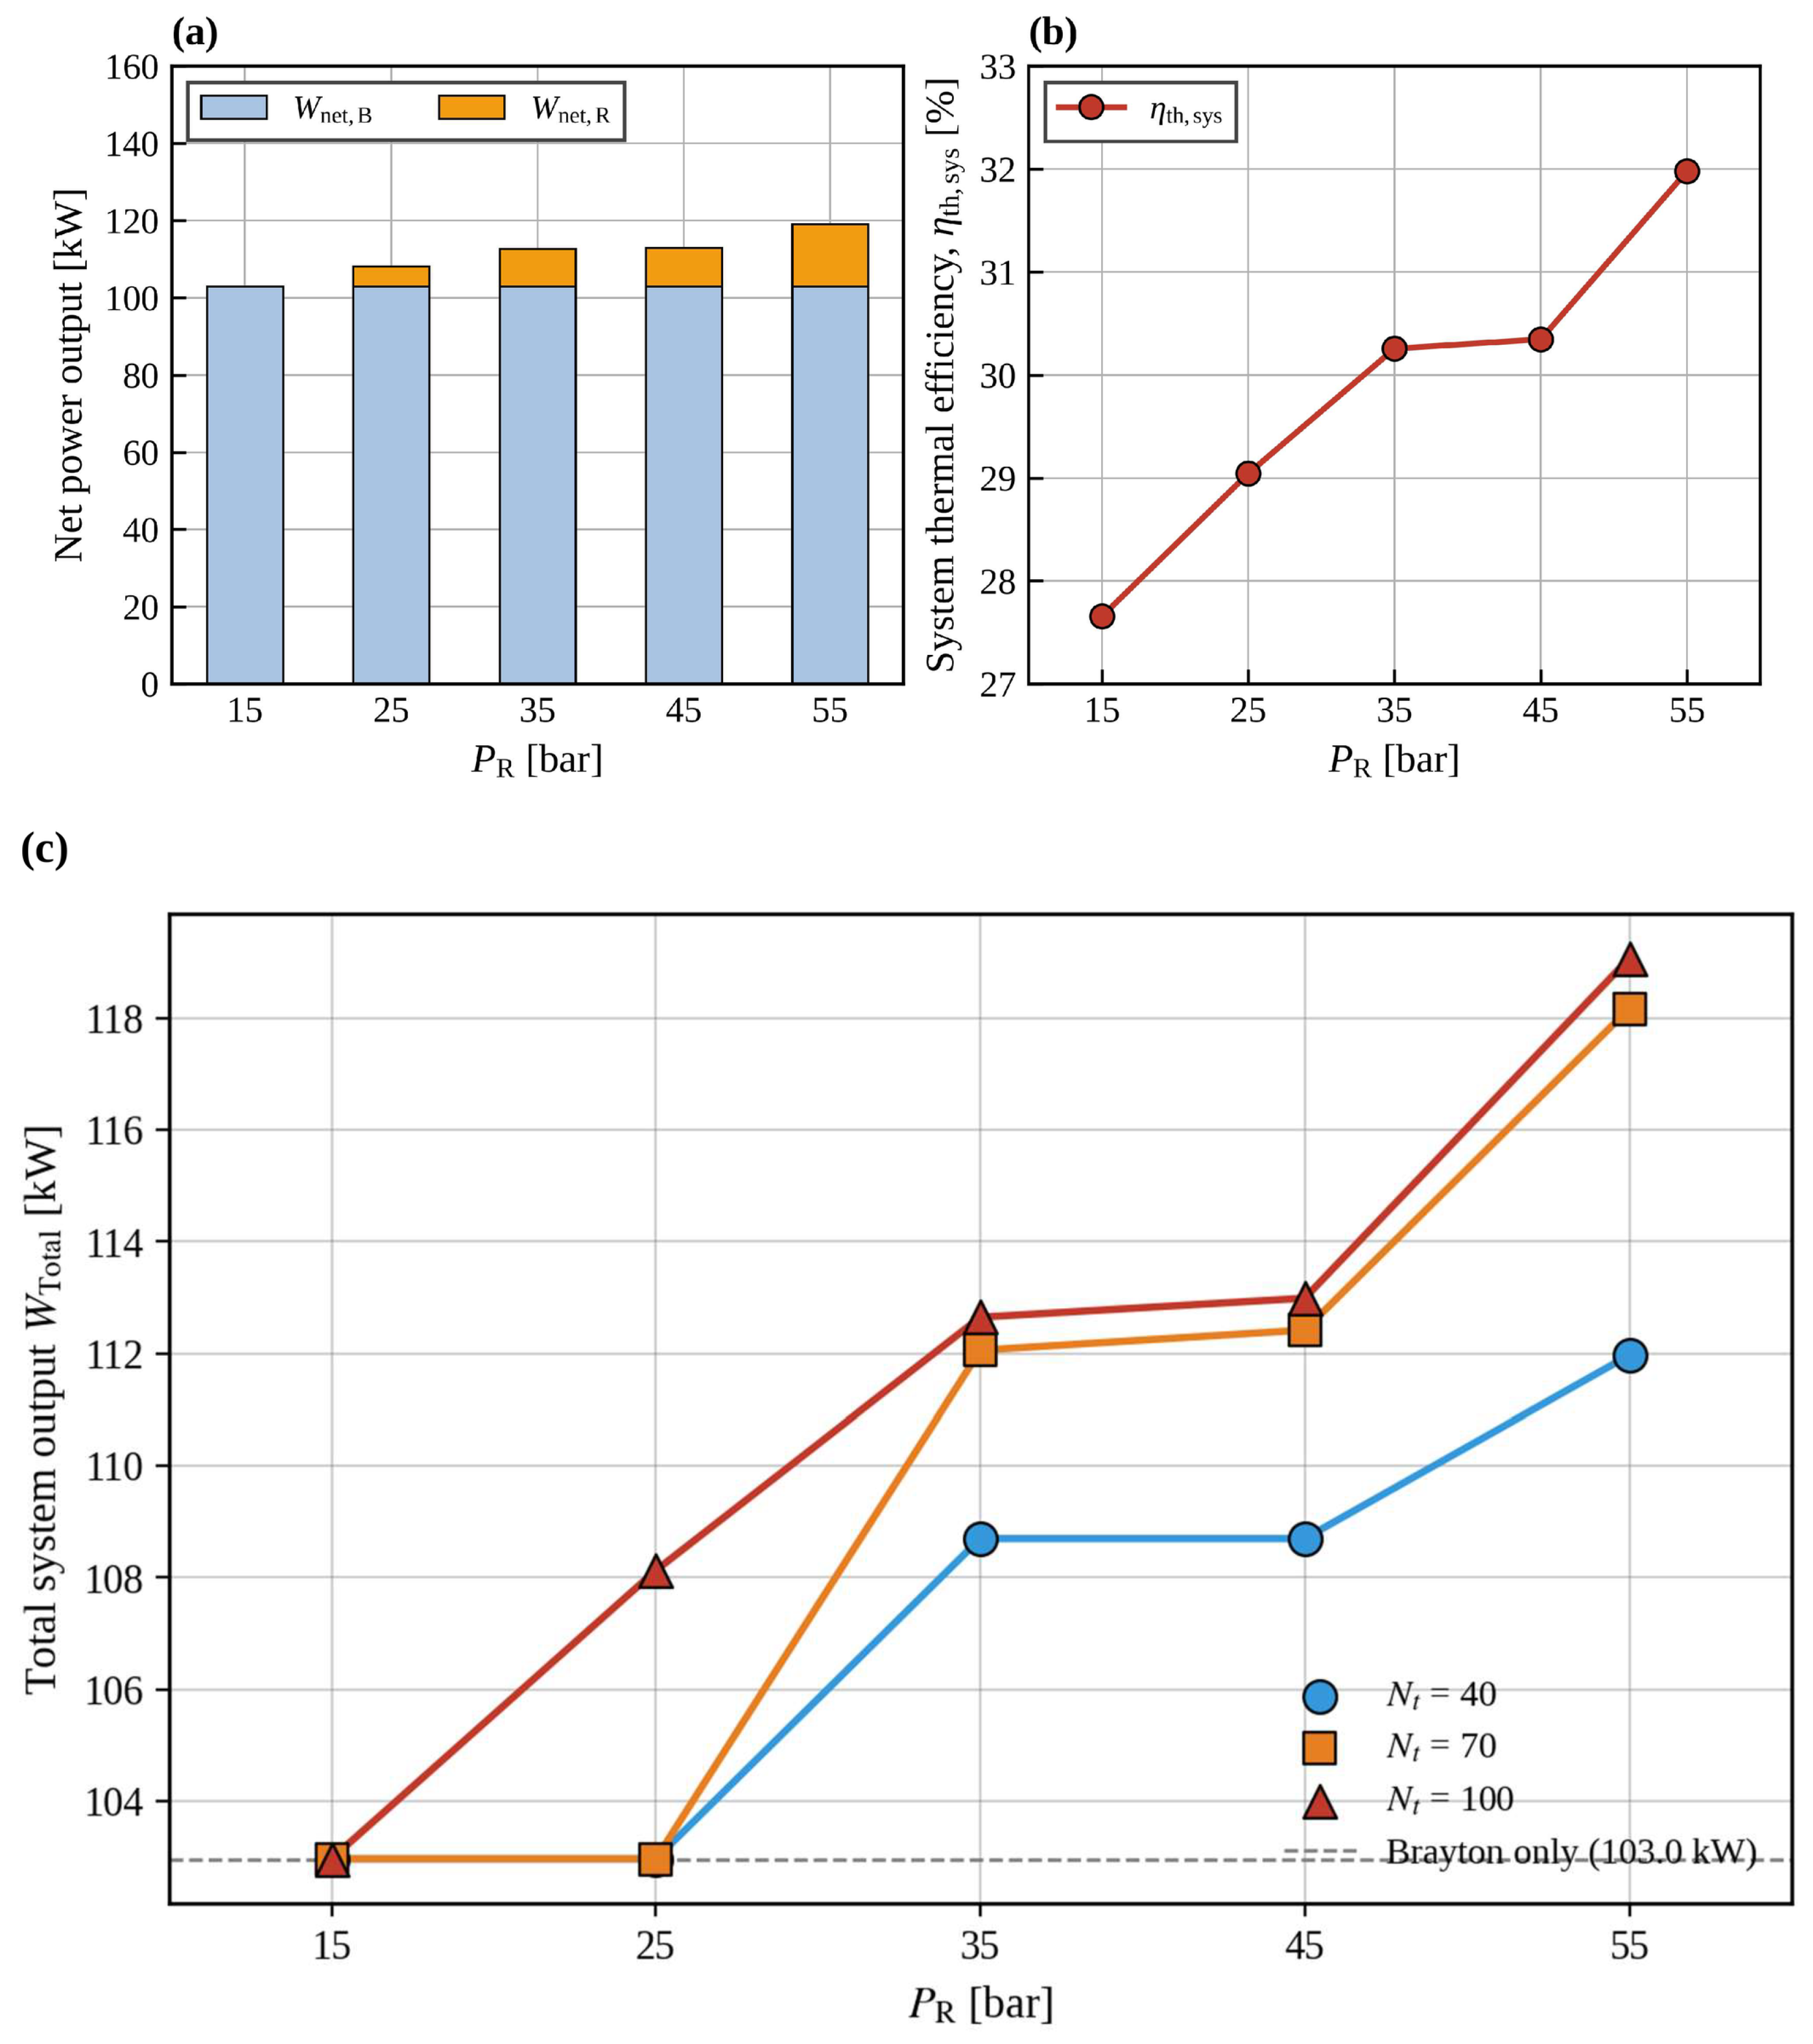
Computation converged stably for all 15 operating conditions examined in the 1D analysis (PR = 15–55 bar × Nt = 40, 70, 100). However, under some low-pressure, low-heat-transfer-area conditions, evaporation of the working fluid was not sufficiently achieved, resulting in a net Rankine output of zero (Table 7); a valid Rankine output was obtained only under conditions where evaporation was ensured. Relative to gas-turbine-only operation (Wnet,B = 102.97 kW, η = 27.66%), the system thermal efficiency improved under conditions where evaporation occurred, and the maximum efficiency of 31.98% (+4.32 percentage points) was achieved at Nt = 100, PR = 55 bar. This shows that, in the operating region where working-fluid evaporation is ensured, a meaningful output gain can be obtained through waste-heat recovery alone, without any additional fuel input. Figure 3, Figure 4 and Figure 5 summarize the changes in Brayton/Rankine output composition and system efficiency as a function of PR for each value of Nt.
Table 7.
Comprehensive 1D performance results.
Figure 3.
System output and thermal efficiency (Nt = 40).
Figure 4.
System output and thermal efficiency (Nt = 70).
Figure 5.
System output and thermal efficiency (Nt = 100): (a) net power output; (b) system thermal efficiency (c) Total system output WTotal versus PR for Nt = 40, 70, 100.
3.2. Effect of Design Variables and Saturation of Marginal Benefit
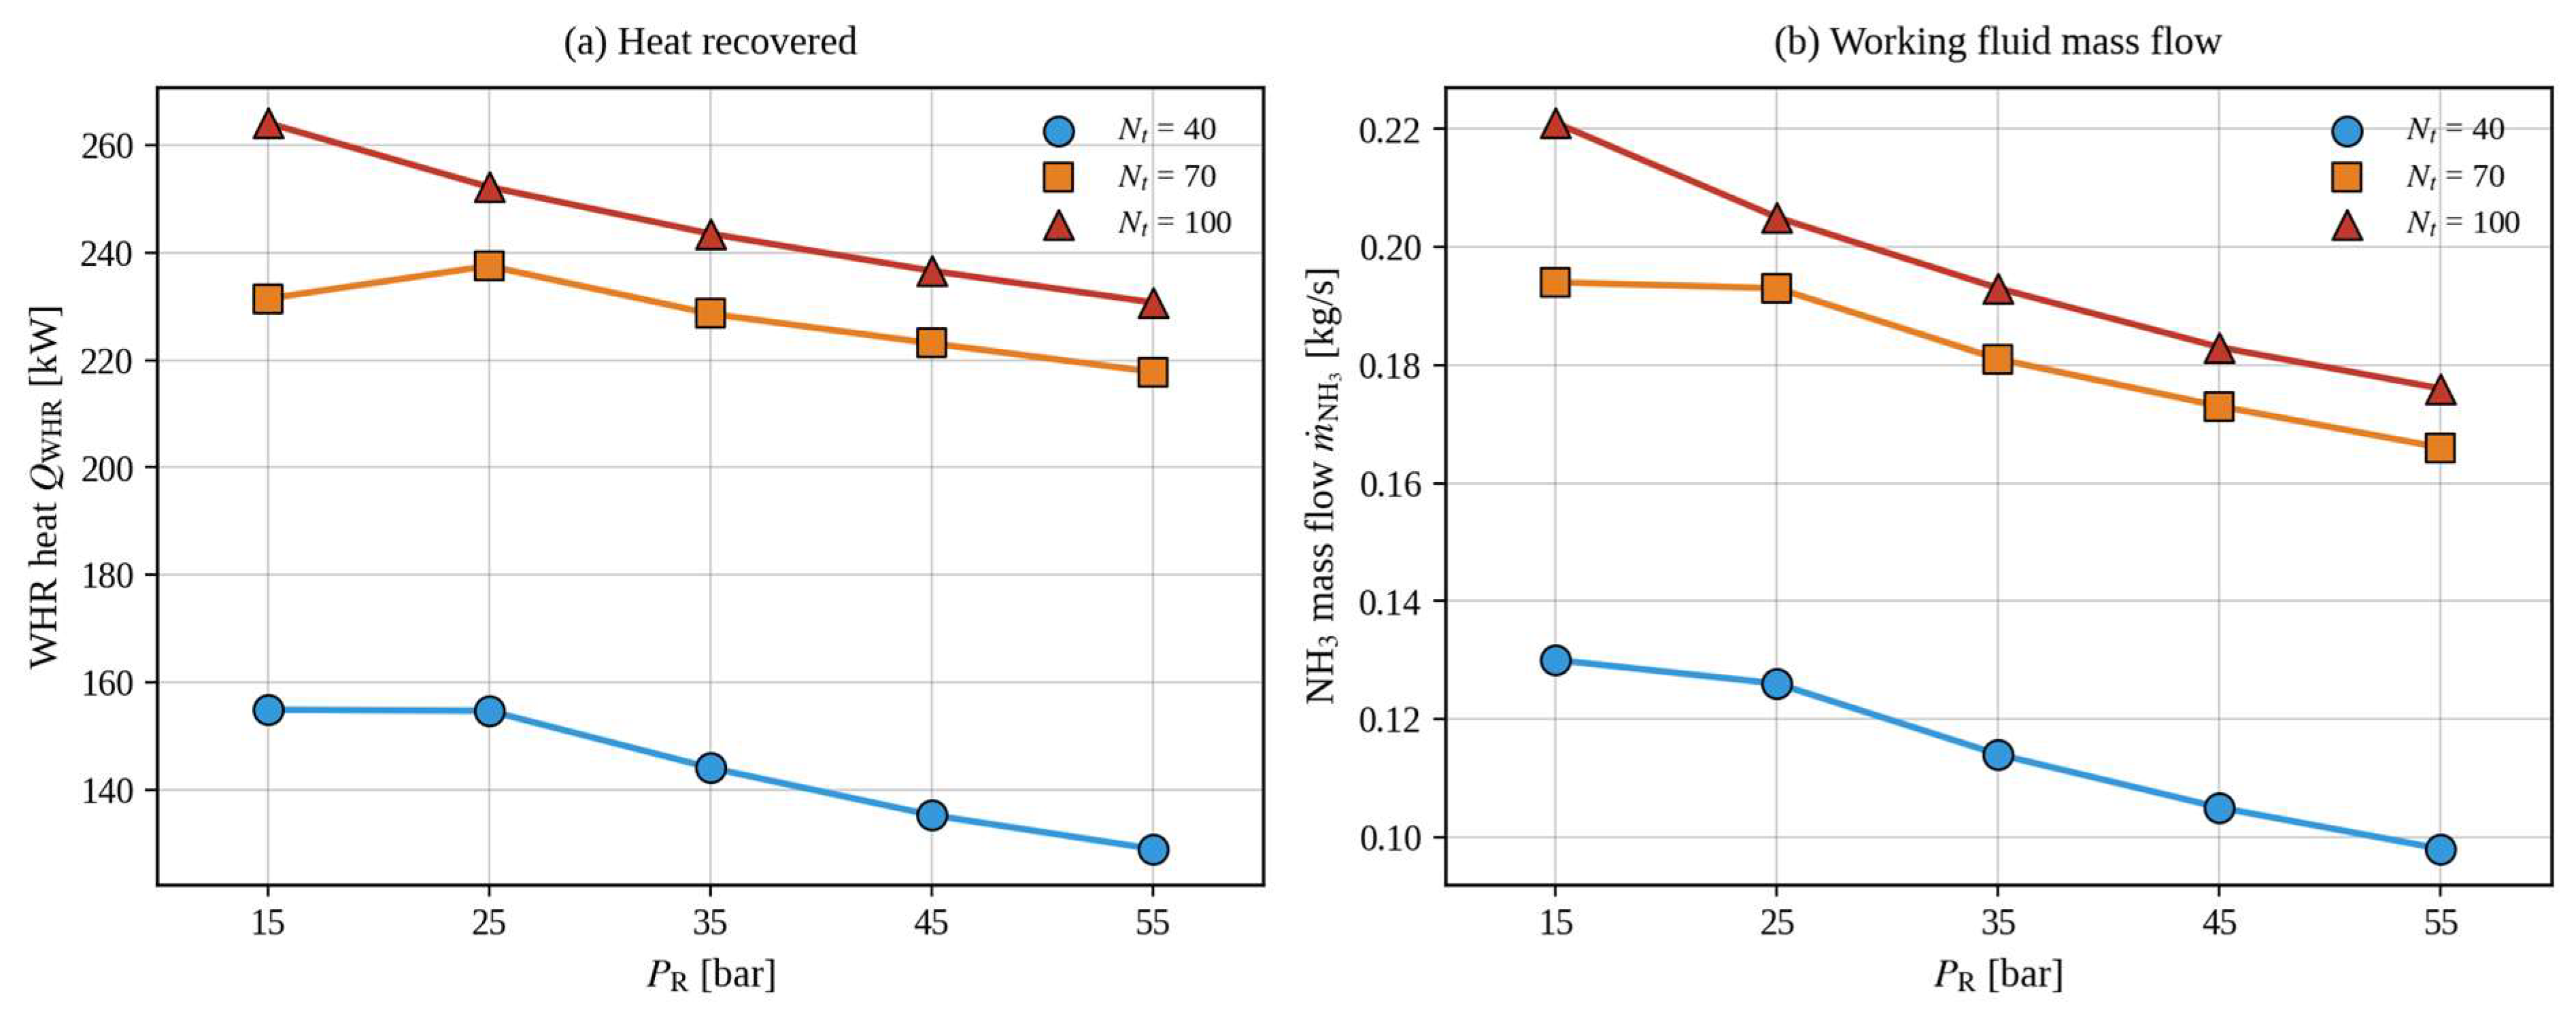
In terms of design variables, Nt acted as the strongest variable determining the evaporator heat absorption QWHR (Figure 5). Increasing Nt from 40 to 100 increased QWHR by more than about 70% at the same PR, and the working-fluid mass flow rate NH3 increased proportionally as well, forming the basis of the Rankine output (Figure 6). The effect of PR, by contrast, showed a trend opposite to that of Nt. As PR increases, QWHR and NH3 decrease, but the thermodynamic efficiency of the Rankine cycle itself improves, so the total output WTotal is maximized at PR = 55 bar. An interesting result is that, at Nt = 100, the evaporation-onset pressure drops from 35 bar to 25 bar. This indicates that, when sufficient heat-transfer area is secured, the system can operate over a wider pressure range, which can be interpreted as an additional benefit of increasing Nt in terms of operating flexibility.
Figure 6.
(a) WHR heat recovered QWHR and (b) NH3 mass flow NH3 versus PR.
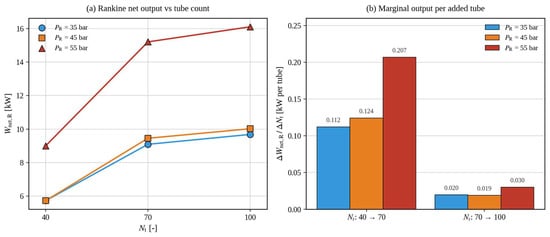
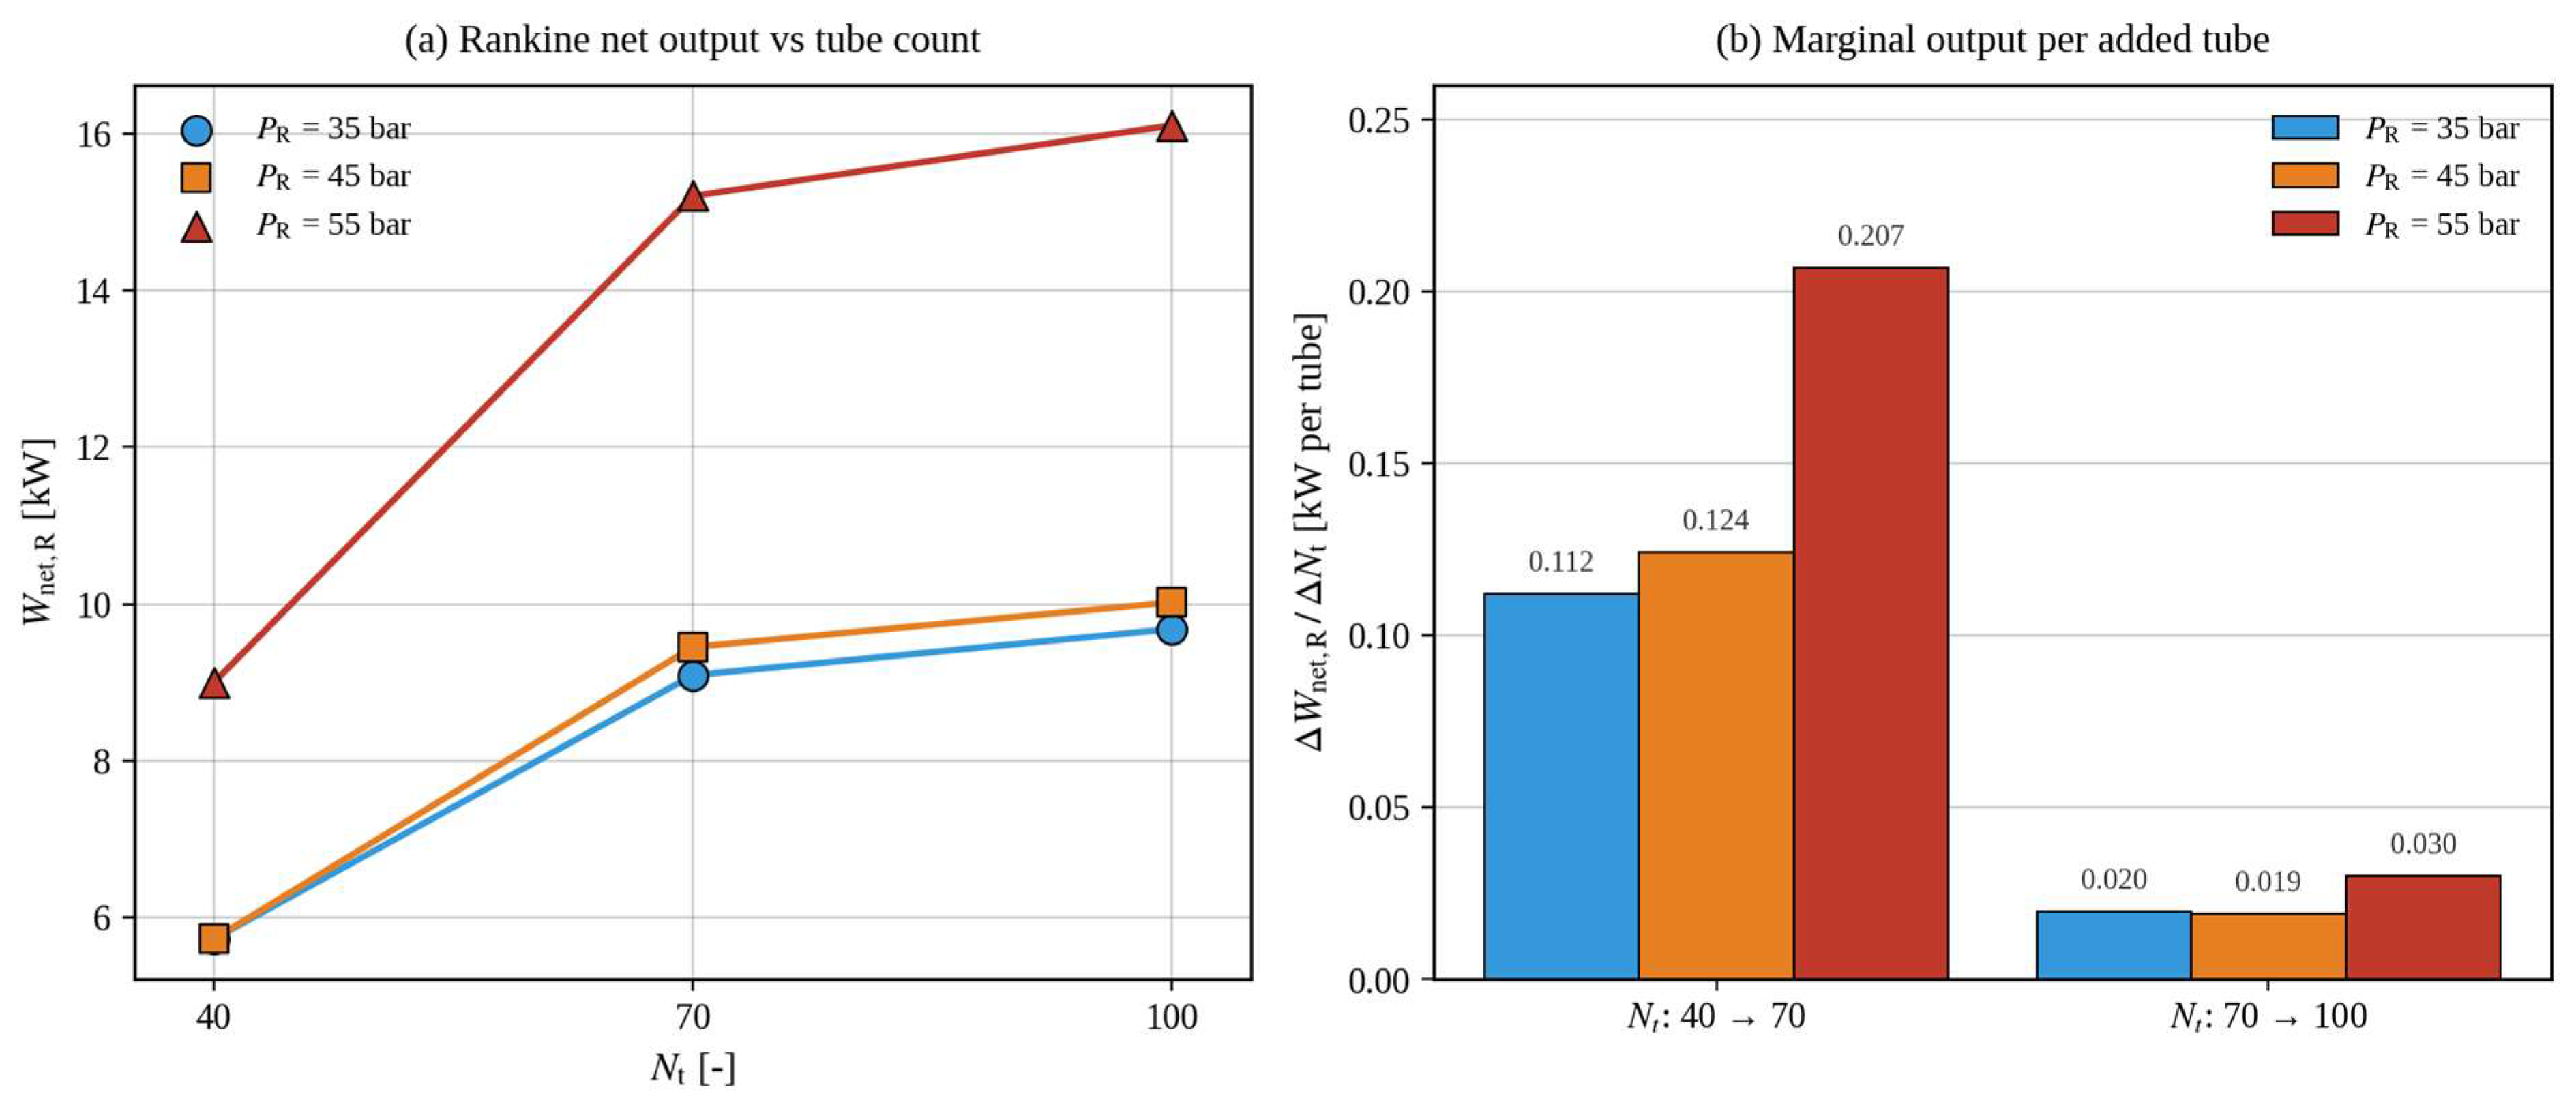
However, the effect of increasing Nt did not accumulate monotonically. Figure 7 summarizes the additional output obtained when Nt is increased in steps: in the Nt 40 → 70 range, an output gain of about 0.11–0.21 kW per added tube was obtained, whereas in the 70 → 100 range this fell to only 0.02–0.03 kW, a roughly 6–10-fold decrease in marginal benefit. This indicates a clear saturation point in the design near Nt ≈ 70. In other words, a strategy of simply increasing the tube count experiences a sharp decline in cost-effectiveness beyond a certain point, and in practical design a trade-off with other variables (PR, shell geometry, baffles, etc.) is required within the Nt = 70–100 range. This result provides the first design implication: a simple Nt-expansion strategy cannot be an intrinsic means of improving efficiency.
Figure 7.
Diminishing returns of increasing Nt: (a) Rankine net output Wnet,R versus Nt for selected PR; (b) marginal output per added tube. The marginal benefit drops by ~6–10× between the 40 → 70 and 70 → 100 segments.
In summary, the 1D analysis results converge on the conclusion that the dual-role combined cycle operates successfully at the system level, with the most favorable thermodynamic operating point located in the high-pressure, high-heat-transfer-area region (PR = 55 bar, Nt = 100). However, (i) the saturation of the marginal benefit shows that a simple Nt-expansion strategy cannot be an intrinsic means of improving efficiency, and (ii) whether this region remains equally stable at the actual evaporator component level cannot be determined from the 1D analysis alone. The next section directly examines this second question through 3D CFD analysis.
3.3. Component-Level CFD Verification
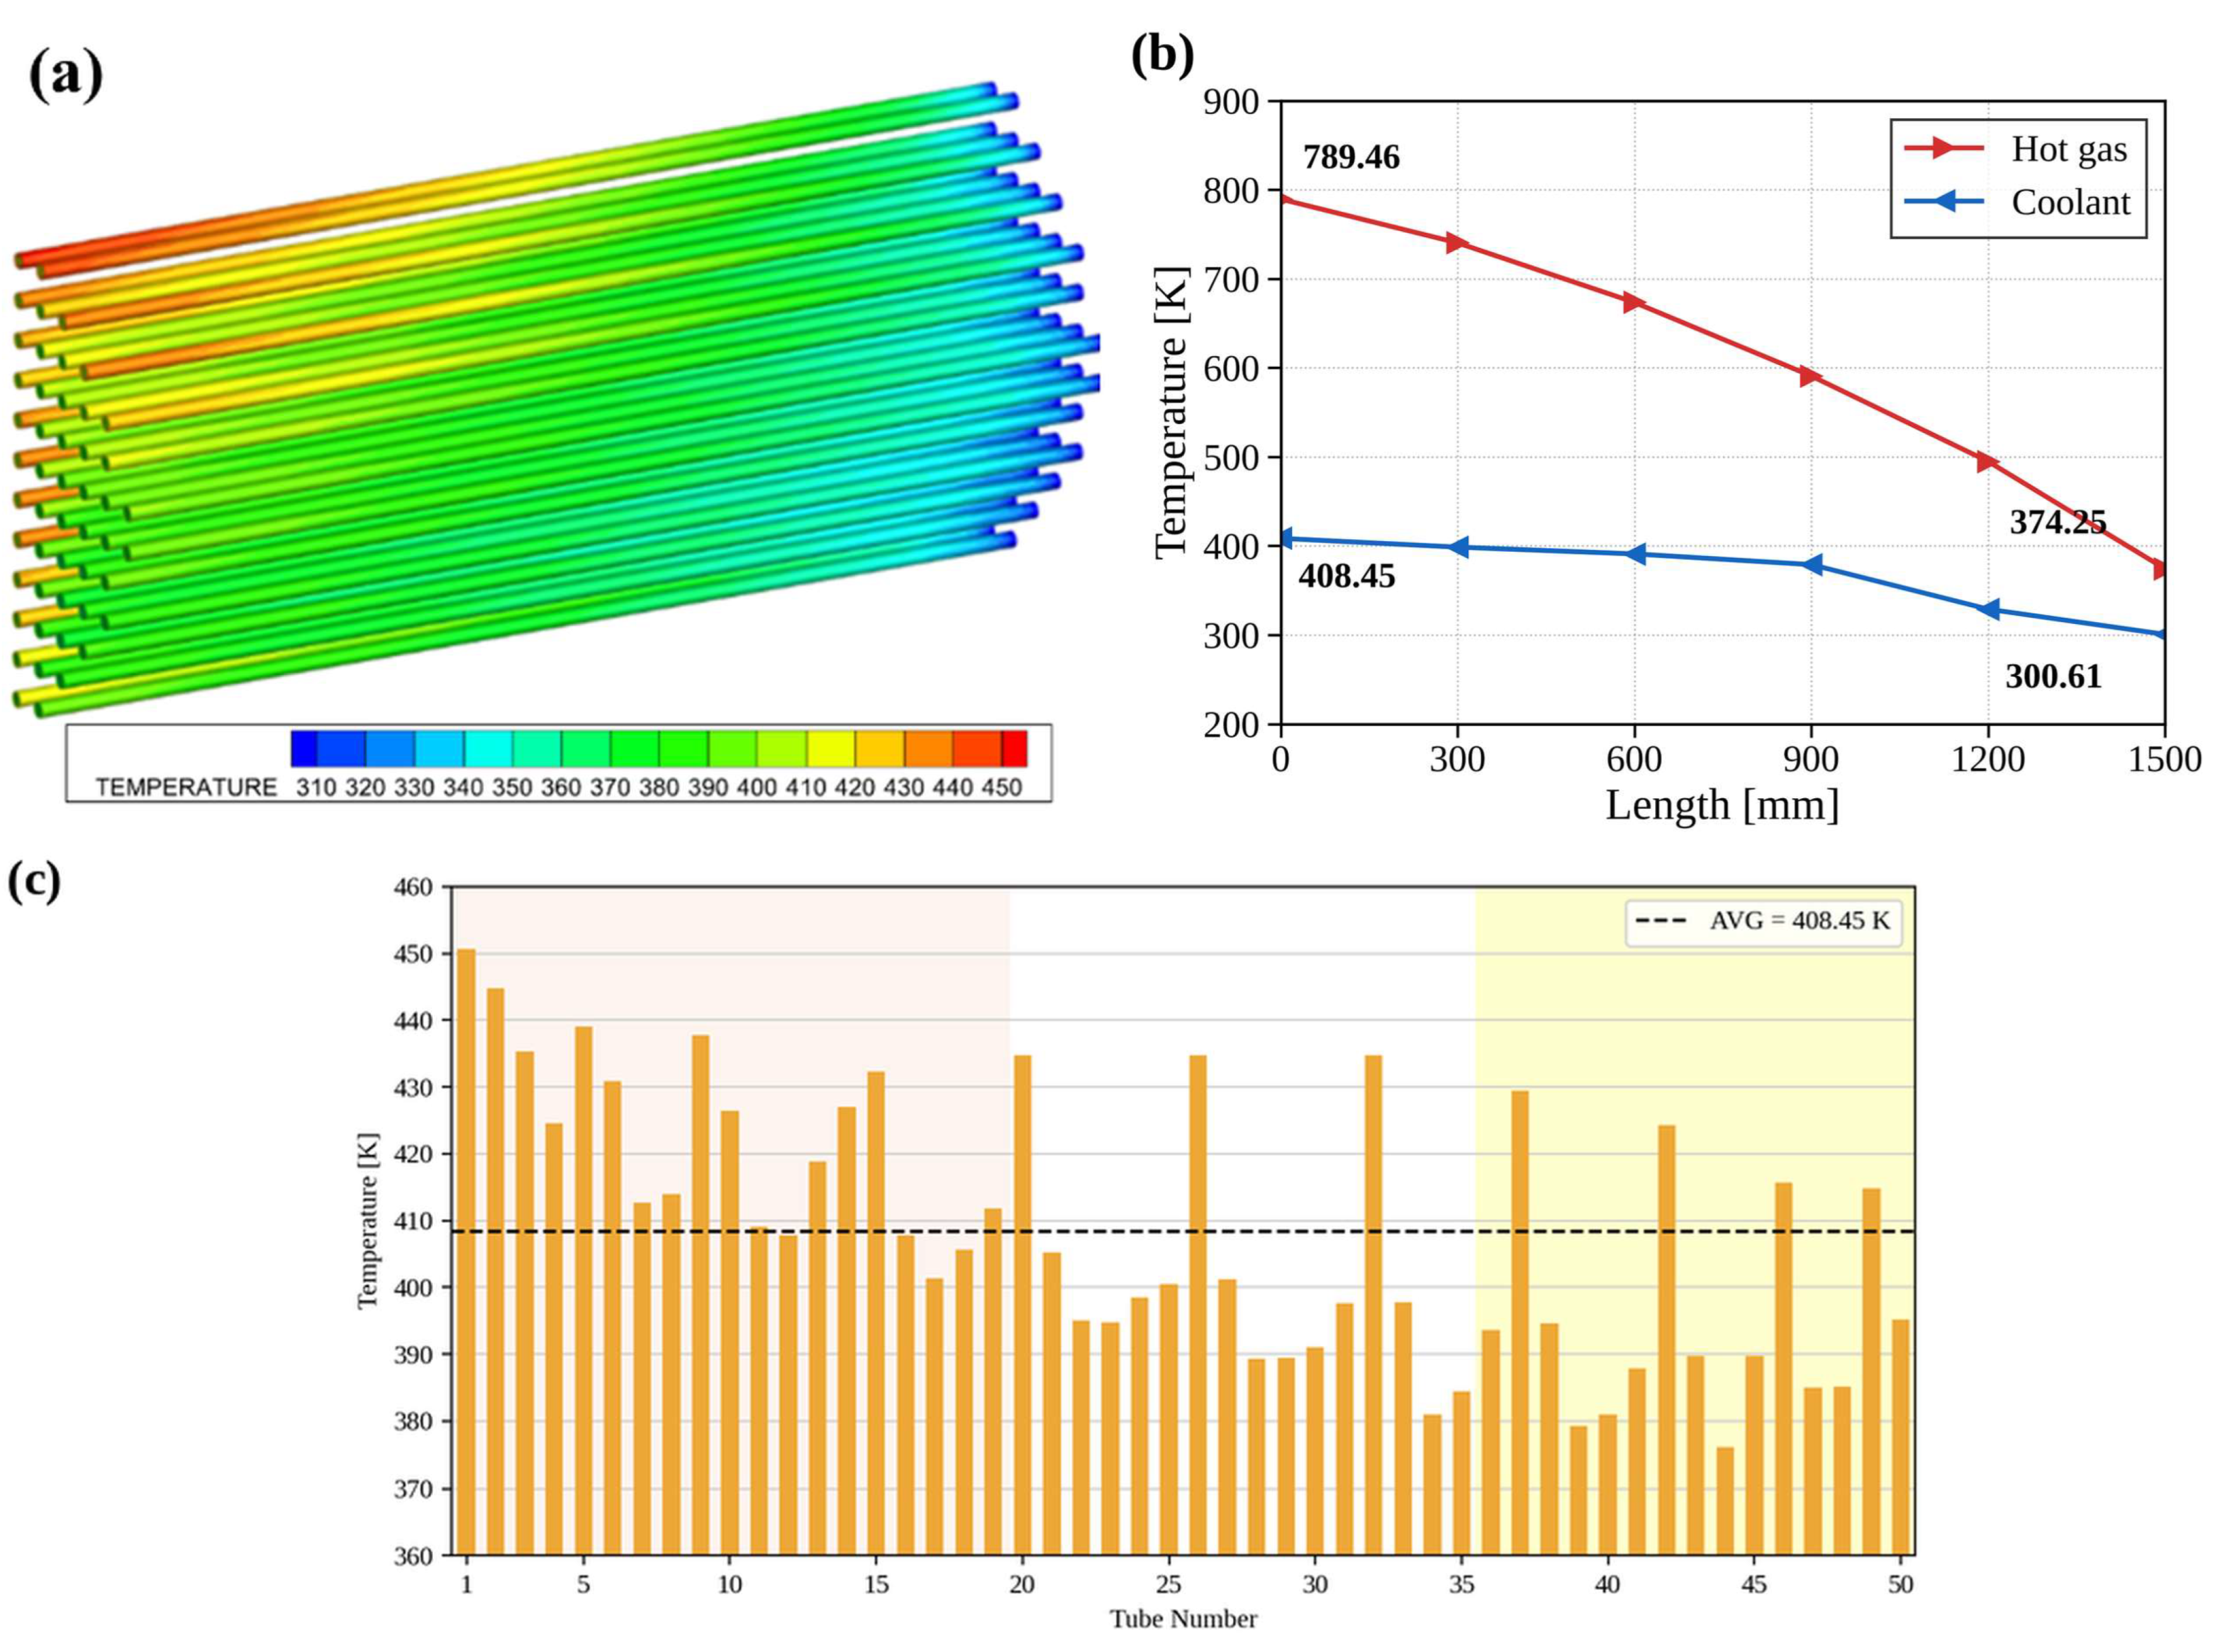
3D CFD analysis was performed for four cases, PR = 25, 35, 45, and 55 bar, at Nt = 100, the condition that showed the highest efficiency in the 1D analysis. The gas-side inlet temperature was fixed at 789.46 K for all cases, while the shell-side outlet gas temperature and the tube-side working-fluid outlet temperature showed clearly different behavior depending on PR (Table 8).
Table 8.
CFD temperature results (Nt = 100, gas inlet T = 789.46 K).
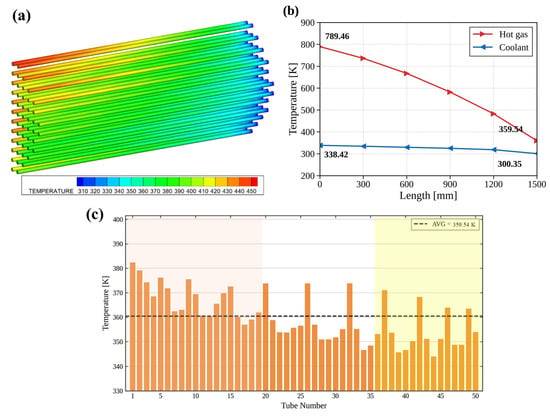
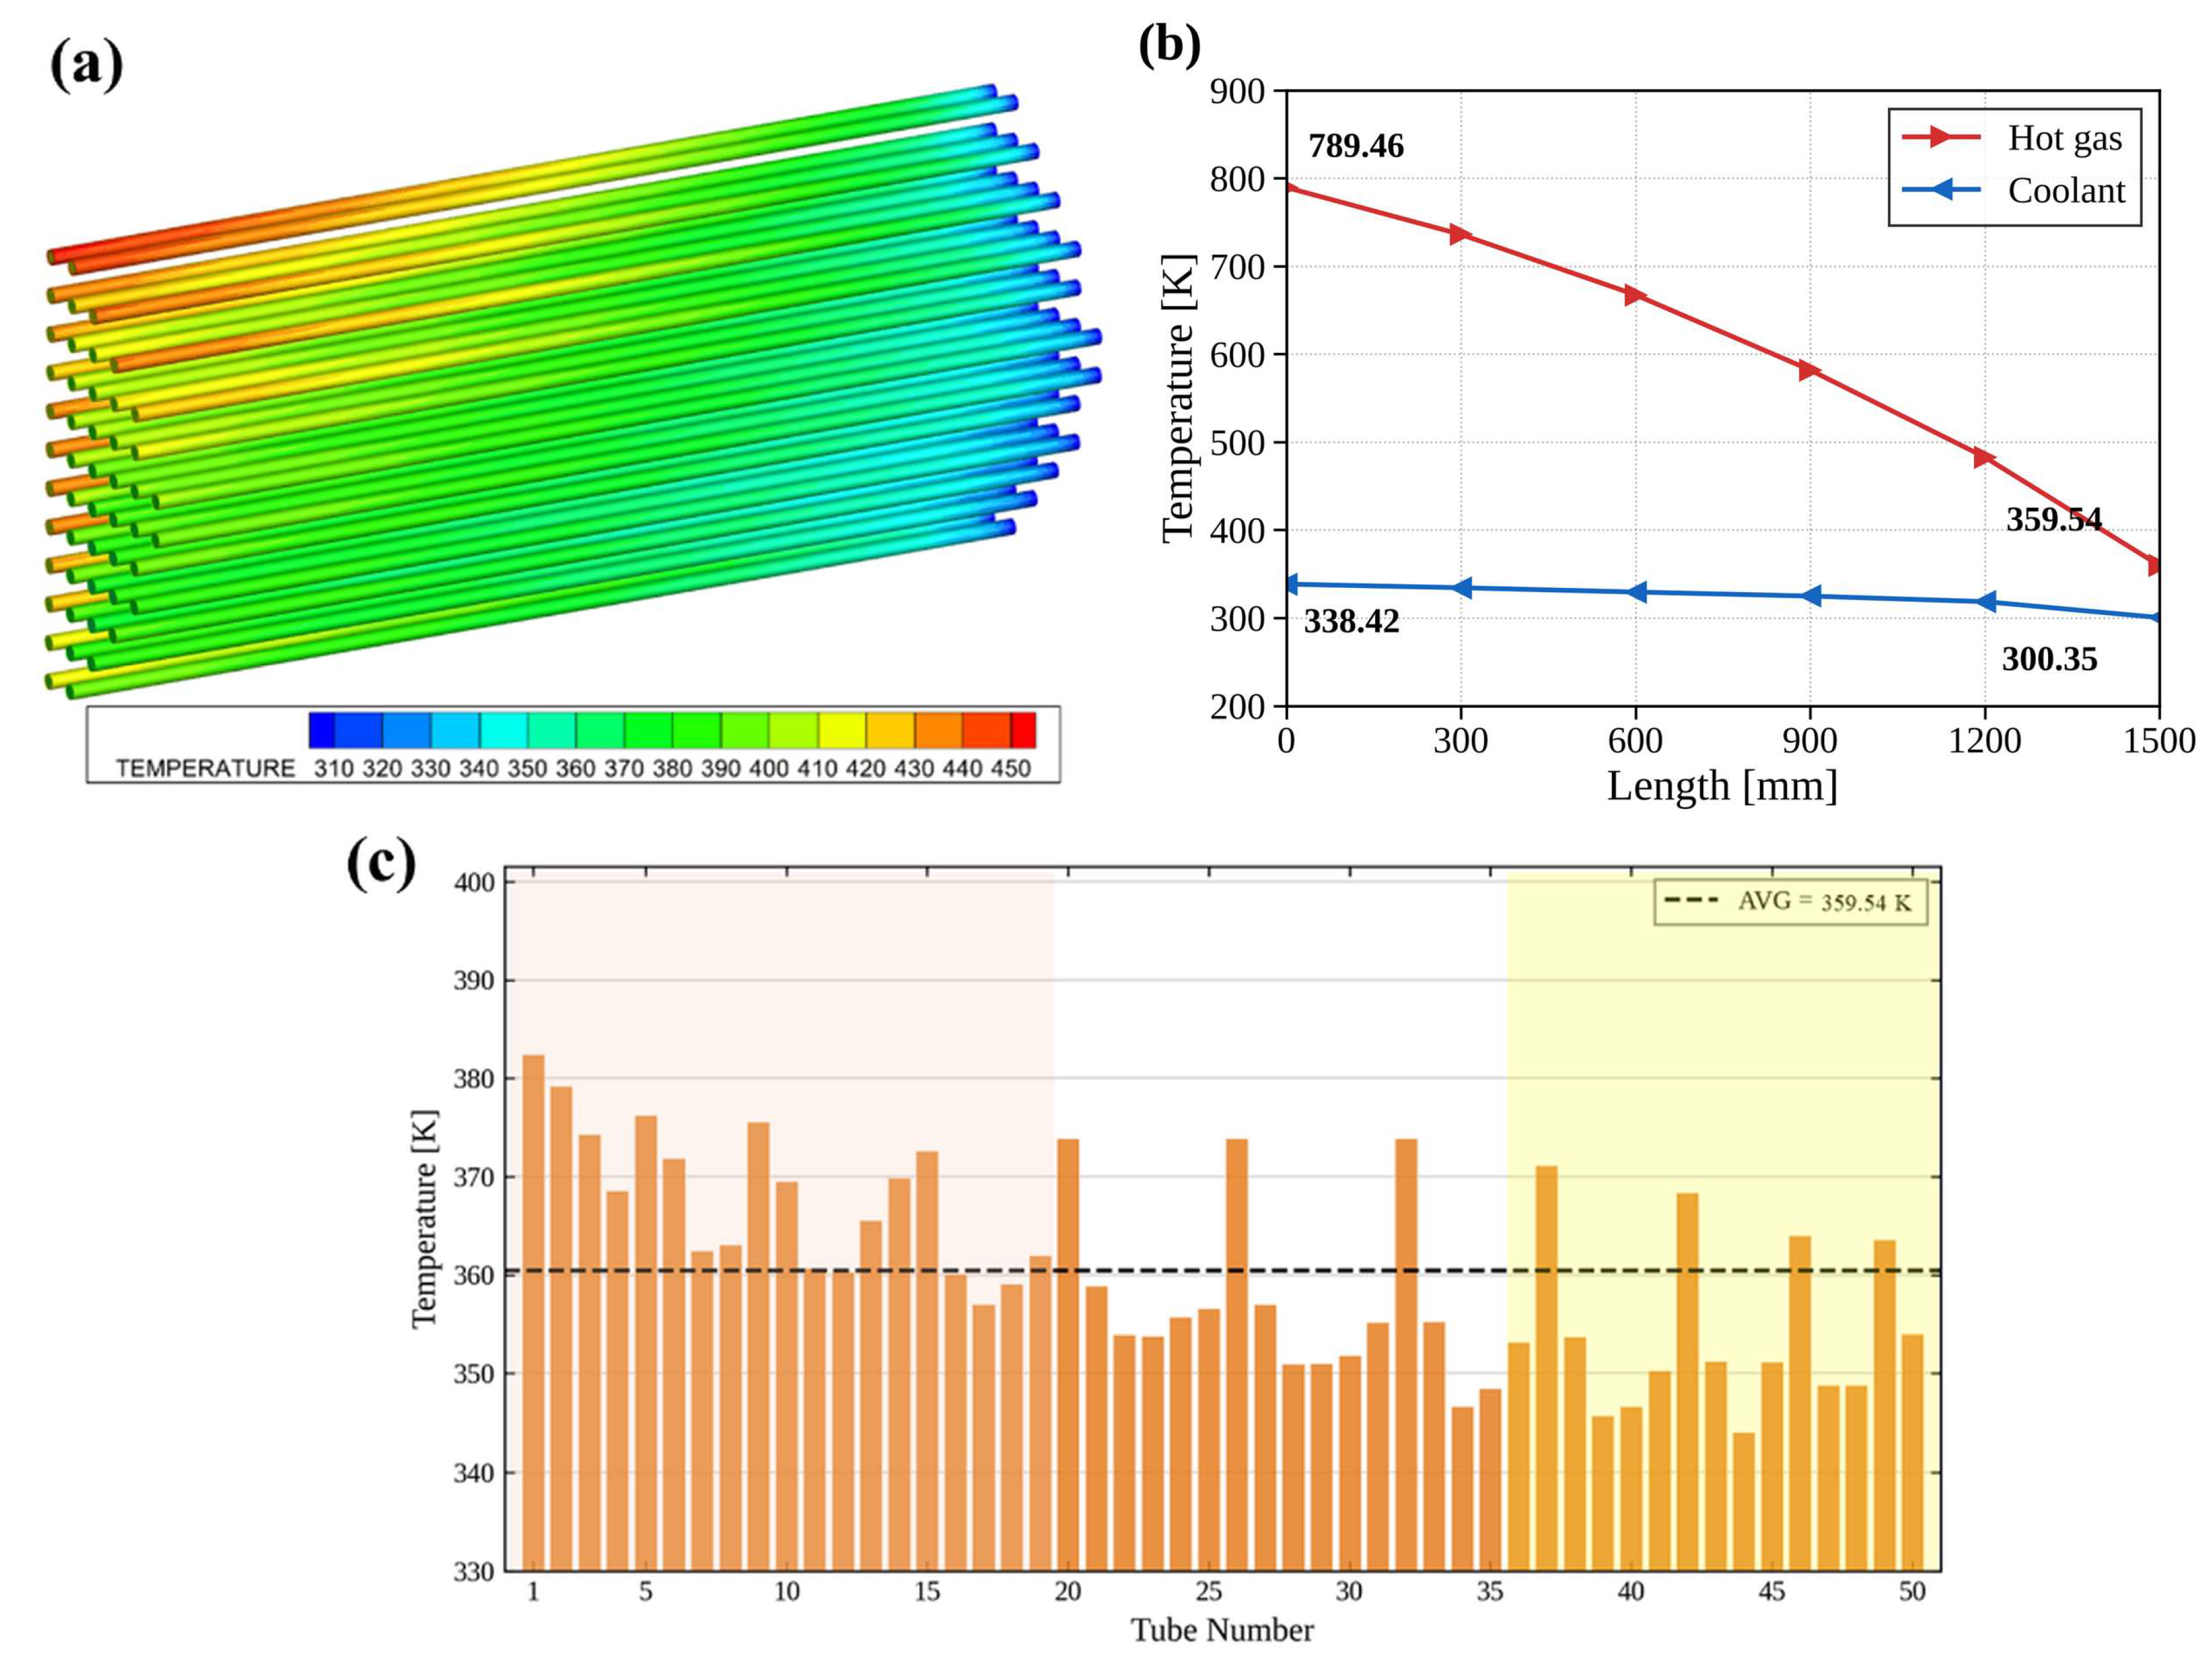
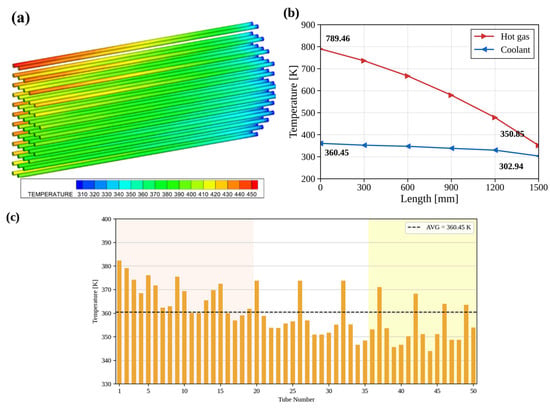
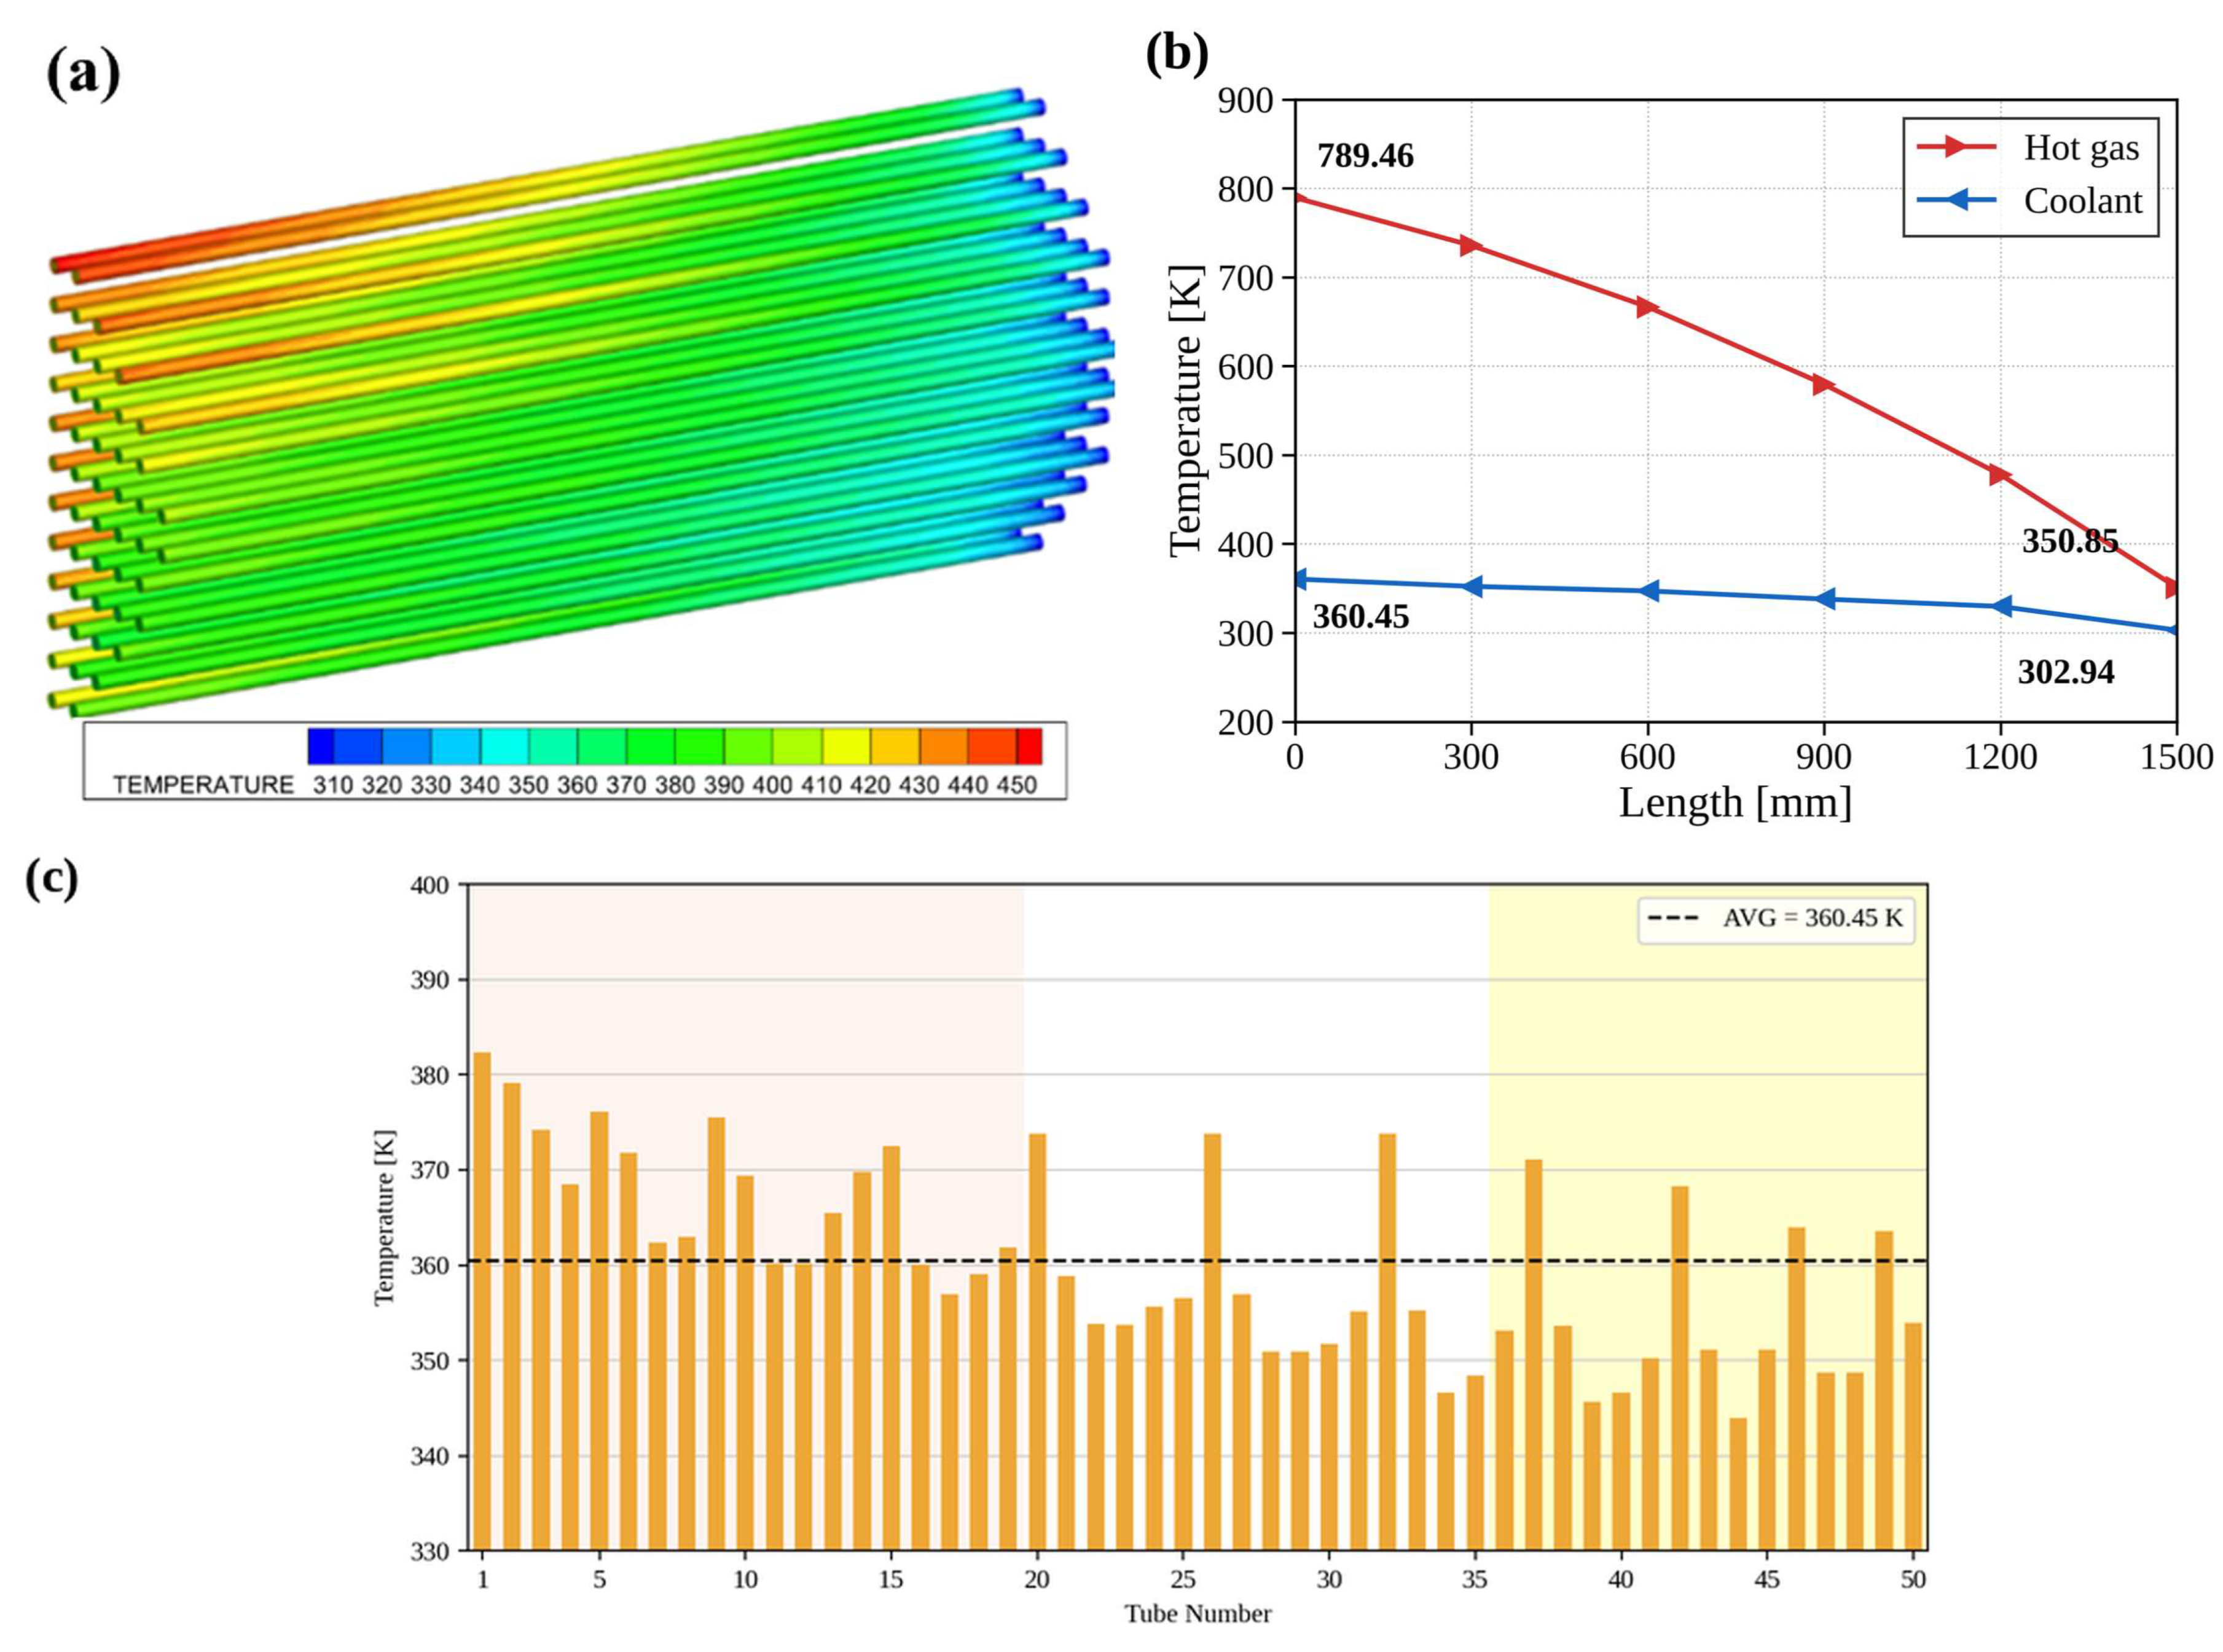
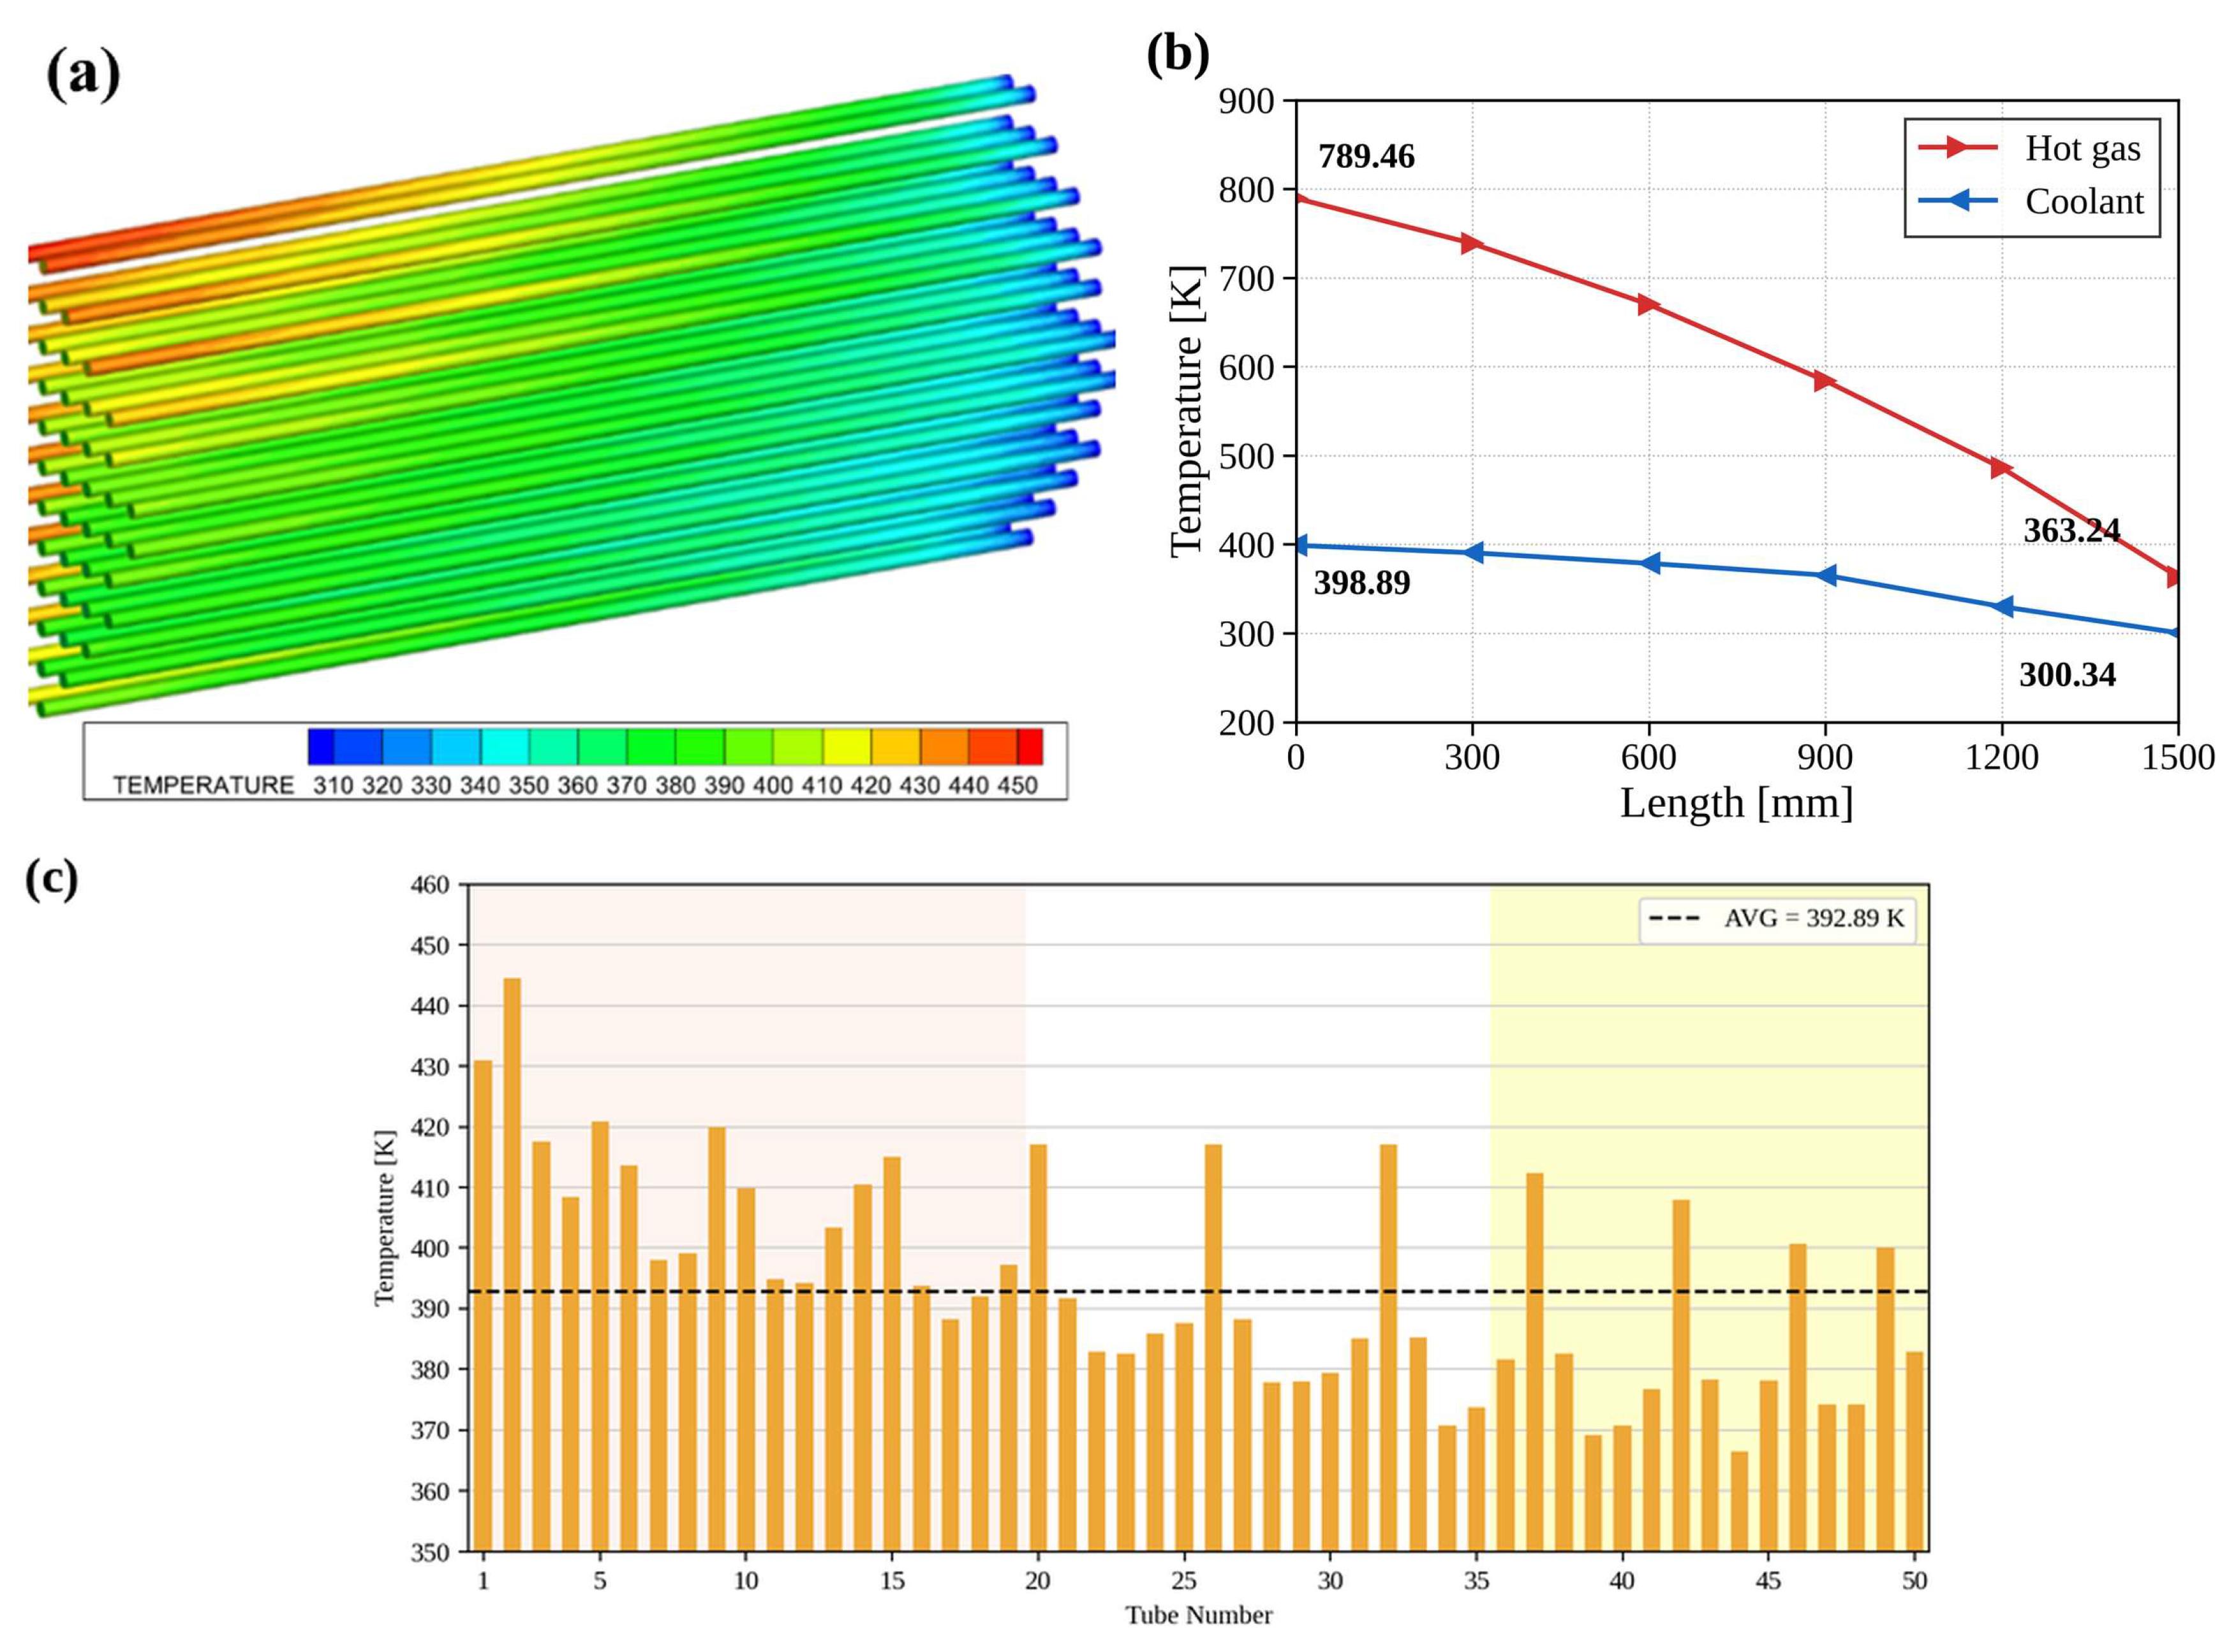
At PR = 25 bar (Figure 8), the gas outlet temperature (359.5 K) was clearly higher than the working-fluid outlet temperature (338.4 K), maintaining a positive temperature difference at the outlet end. At PR = 35 bar (Figure 9), the working-fluid outlet temperature exceeded the gas outlet temperature by about 9.6 K, showing marginal behavior at the onset of outlet-end temperature reversal; however, the tube-to-tube outlet temperature spread remained at about 38 K, nearly identical to the 25 bar case, indicating no abrupt collapse of the flow/heat-transfer structure. When PR reaches 45 bar (Figure 10), however, the working-fluid outlet temperature exceeds the gas outlet temperature by 35.6 K, making a violation of the minimum temperature-difference requirement clearly possible, and the tube-to-tube outlet temperature spread also roughly doubles, to 78.0 K. At PR = 55 bar (Figure 11), this same behavior intensifies further, with the working-fluid outlet temperature approaching the ammonia critical temperature (~405.5 K). That is, a qualitative change in behavior occurs between 35 and 45 bar, suggesting a structural transition rather than a simple, gradual deterioration.
Figure 8.
CFD temperature distribution at PR = 25 bar (Nt = 100): (a) temperature contour of the tube bundle; (b) axial temperature profiles of the hot gas and coolant; (c) tube-wise outlet temperature distribution, with the dashed line indicating the average value.
Figure 9.
CFD temperature distribution at PR = 35 bar (Nt = 100): (a) temperature contour of the tube bundle; (b) axial temperature profiles of the hot gas and coolant; (c) tube-wise outlet temperature distribution, with the dashed line indicating the average value.
Figure 10.
CFD temperature distribution at PR = 45 bar (Nt = 100): (a) temperature contour of the tube bundle; (b) axial temperature profiles of the hot gas and coolant; (c) tube-wise outlet temperature distribution, with the dashed line indicating the average value.
Figure 11.
CFD temperature distribution at PR = 55 bar (Nt = 100): (a) temperature contour of the tube bundle; (b) axial temperature profiles of the hot gas and coolant; (c) tube-wise outlet temperature distribution, with the dashed line indicating the average value.
3.4. Stability Indicator
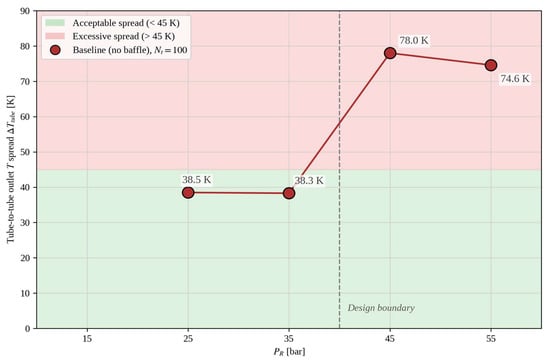
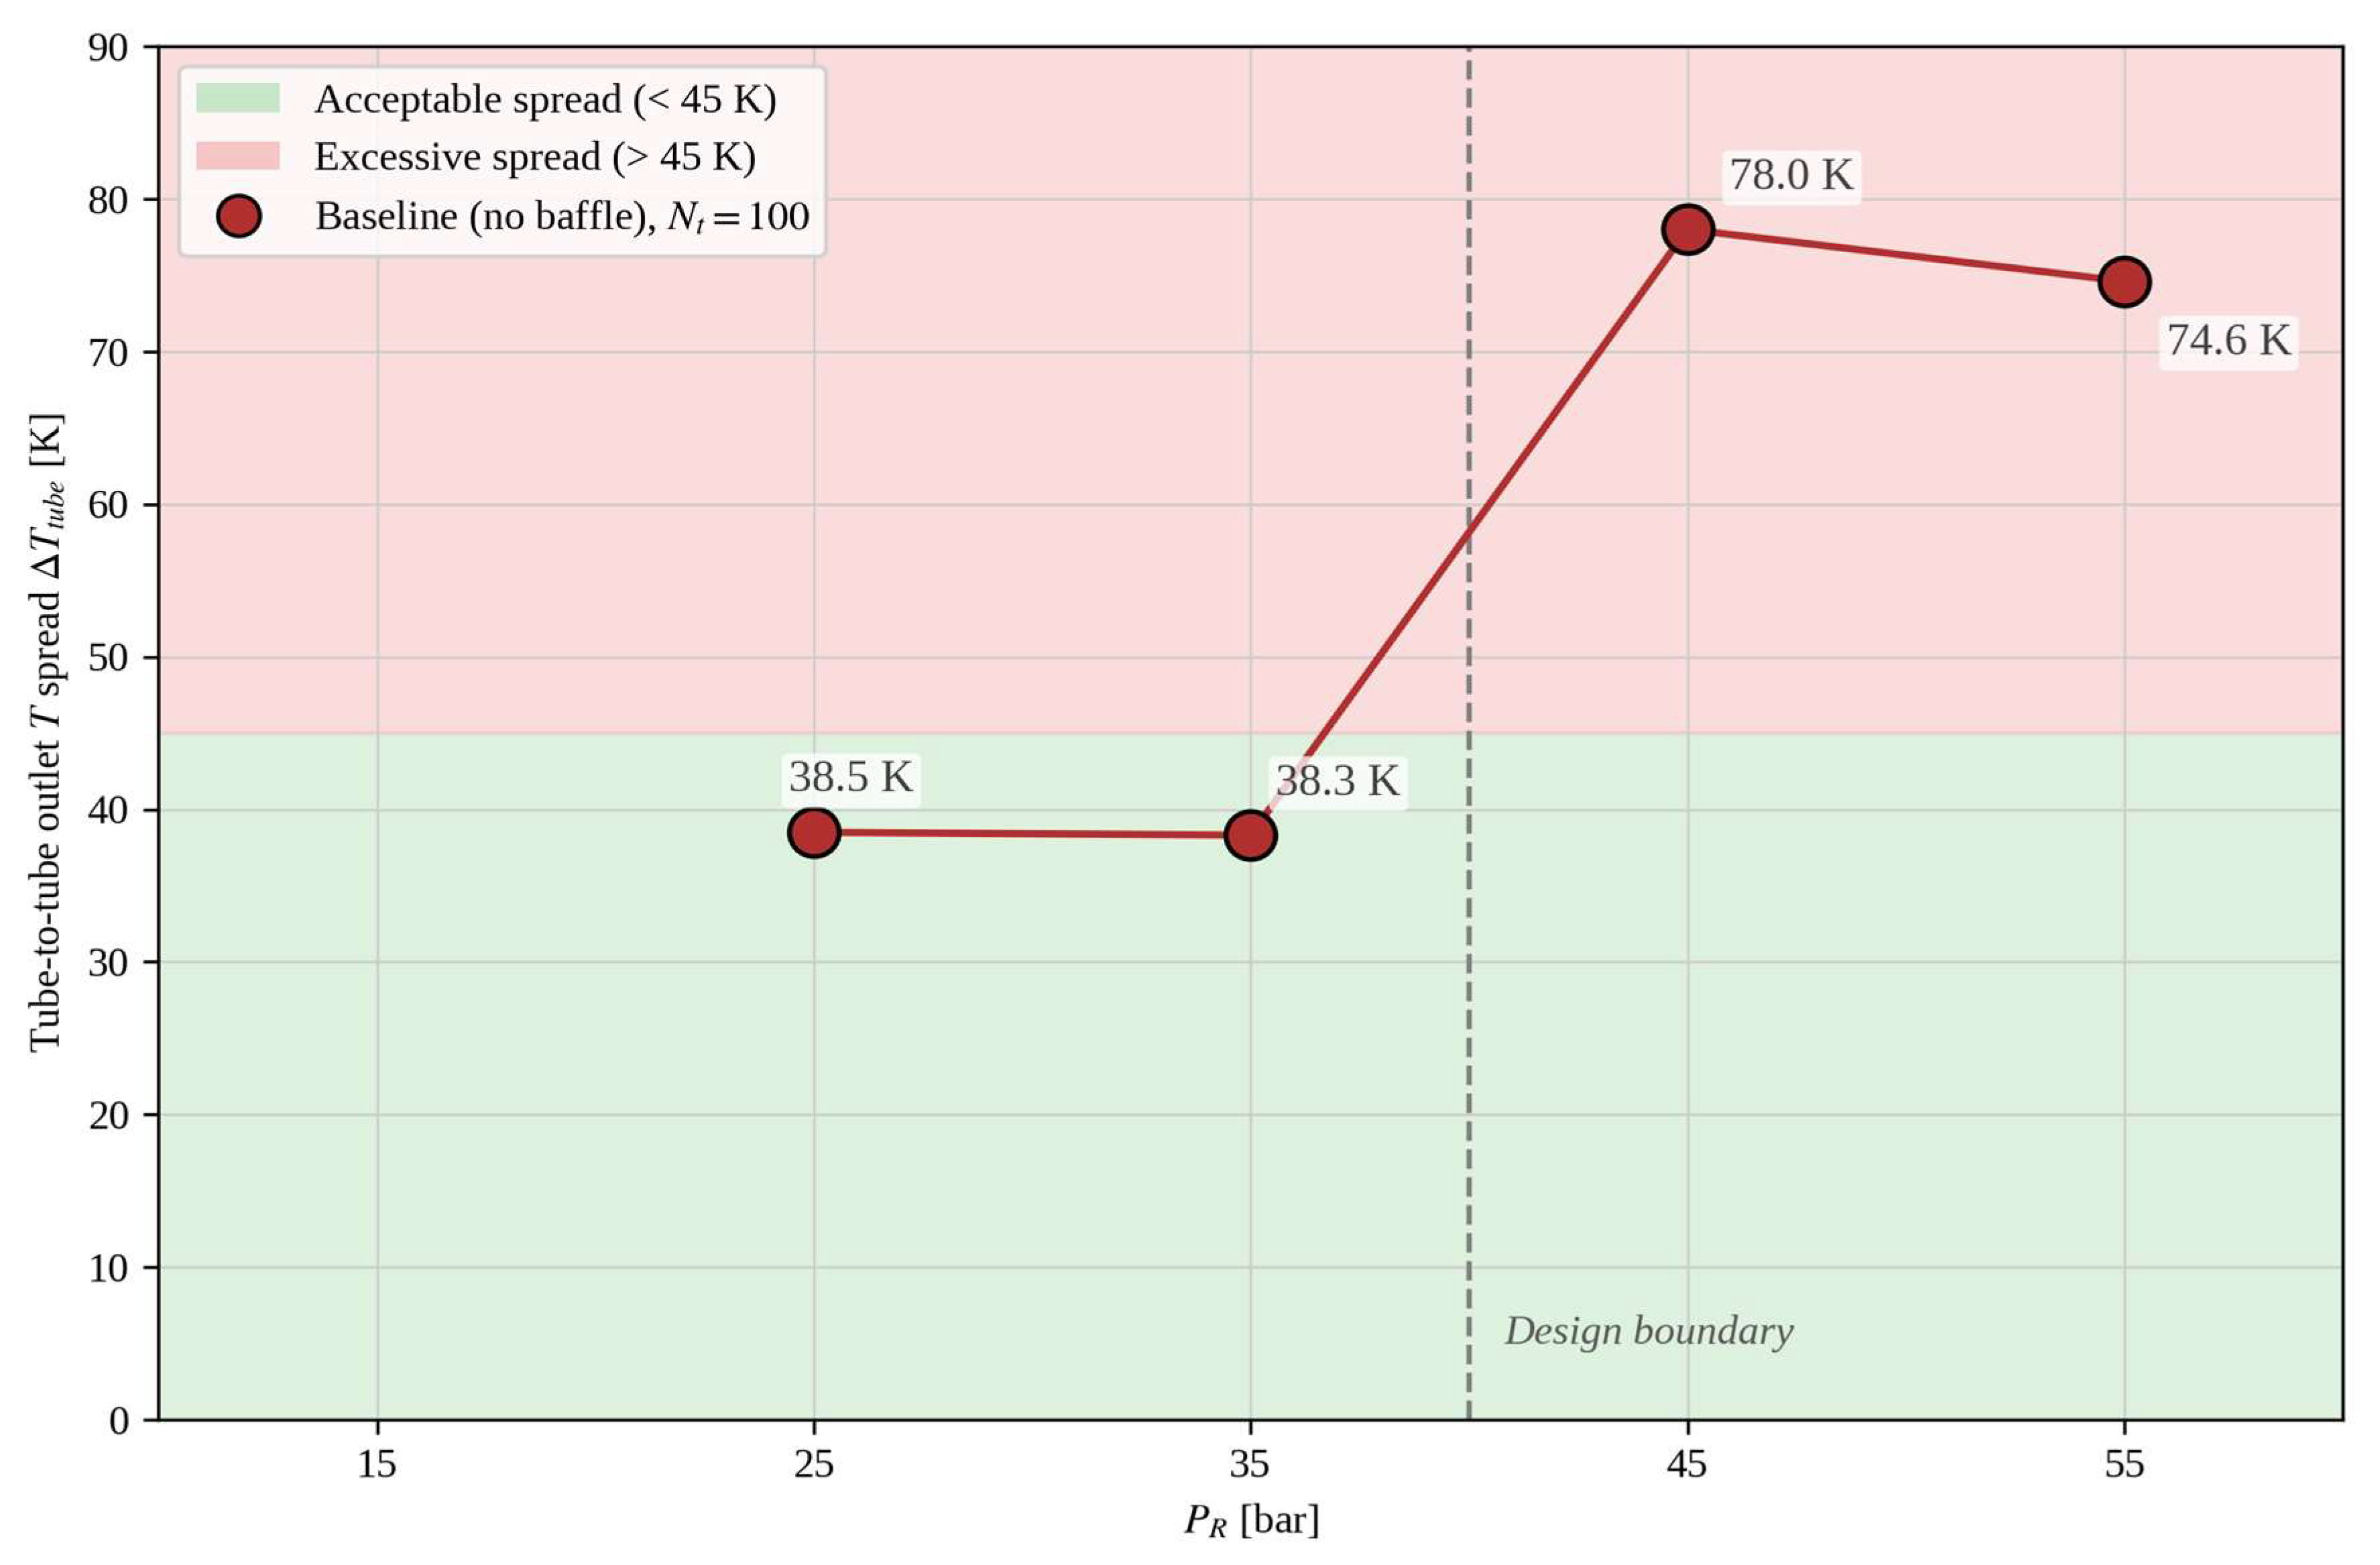
The tube-to-tube outlet temperature spread is the quantitative indicator that most directly reflects the effect of shell-side flow non-uniformity on component performance. Figure 12 summarizes the tube-to-tube outlet temperature spread (ΔTtube = max − min) as a function of PR at Nt = 100. At 25 and 35 bar, a spread of about 38 K is maintained stably, but at 45 bar the spread jumps to 78 K, a roughly two-fold, step-like transition. At 55 bar it remains at a nearly identical level of 74.6 K, confirming that this behavior is not a monotonic increase but a new steady state established after crossing a critical boundary.
Figure 12.
Tube-to-tube outlet temperature spread (ΔTtube) versus PR at Nt = 100.
The physical mechanism underlying this behavior can be interpreted as follows. As PR increases, (i) the saturation temperature Tsat of the working fluid rises, reducing the driving temperature difference between the gas and the working fluid; (ii) simultaneously, the latent heat of evaporation decreases, so the same heat input is absorbed by a smaller amount of liquid-to-vapor phase change; and (iii) these effects of (i) and (ii) combine with the intrinsic shell-side flow non-uniformity (inlet jets, stagnation regions) already present, amplifying the spread in heat absorption among tubes. Below 35 bar, the sufficient driving temperature difference and latent-heat margin buffer the effect of flow non-uniformity, but above 45 bar this buffering effect disappears and the tube-to-tube outlet temperature spread expands structurally. As a result, PR ≈ 40 bar is identified as the component-level design-critical boundary of this system.
3.5. Effect and Limitations of Baffle Design
To examine the engineering mitigation potential of the identified instability region through a representative case, an additional analysis was performed with seven single-segmental baffles (25% cut) applied, limited to the most unstable operating point, Nt = 100, PR = 55 bar. The results of this section are not a sensitivity analysis of the baffle effect across the full pressure range but a demonstrative evaluation of baffle applicability in the identified critical region; a systematic sensitivity evaluation across multiple pressure conditions is left for future work. Introducing the baffle converted the shell-side flow into forced cross-flow, substantially enhancing gas-to-tube heat exchange. As a result, the gas outlet temperature decreased by about 64 K, from 374.3 K to 310.2 K, and the working-fluid outlet temperature increased by 23.6 K (about 5.8%), from 408.5 K to 432.1 K, eliminating the outlet-end temperature reversal. In other words, the baffle can be interpreted as an engineering means of mitigating the instability in terms of the mean temperature difference.
However, the tube-to-tube outlet temperature spread remained essentially unchanged even after the baffle was introduced. This suggests that the tube-to-tube spread is not simply a matter of average velocity distribution but arises from intrinsic geometric asymmetry, such as the shell-inlet jet, the stagnation region outside the tube bundle, and the gap between the shell and the tube bundle. In other words, a baffle can control the mean temperature gradient but cannot control the spread in the local distribution. Securing stable operation in the high-pressure region therefore requires not merely adding a single baffle but a structural approach combining multi-baffle optimization, asymmetry correction of the shell geometry, and redesign of the tube arrangement. The single-baffle case presented here is a demonstrative evaluation at one operating point, not a systematic sensitivity or optimization study; baffle count, cut ratio, spacing, and shell-bundle clearance together constitute a multidimensional design space whose interactions cannot be inferred from a single configuration. Characterizing this space rigorously requires a dedicated parametric or optimization study spanning multiple baffle geometries and operating points, which is outside the scope of the present feasibility-and-bottleneck-identification study and is identified as a priority for follow-up work.
3.6. Synthesis of Design Guidelines: Operating-Envelope Map and Recommended Operating Point
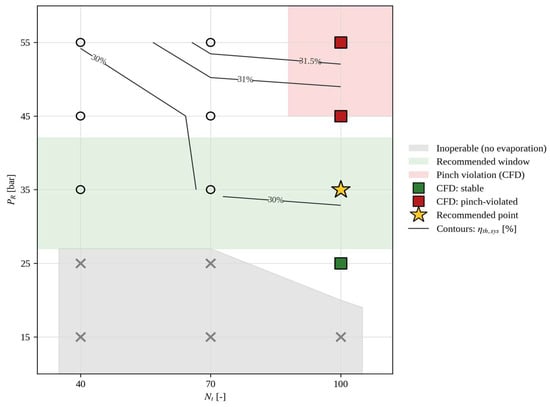
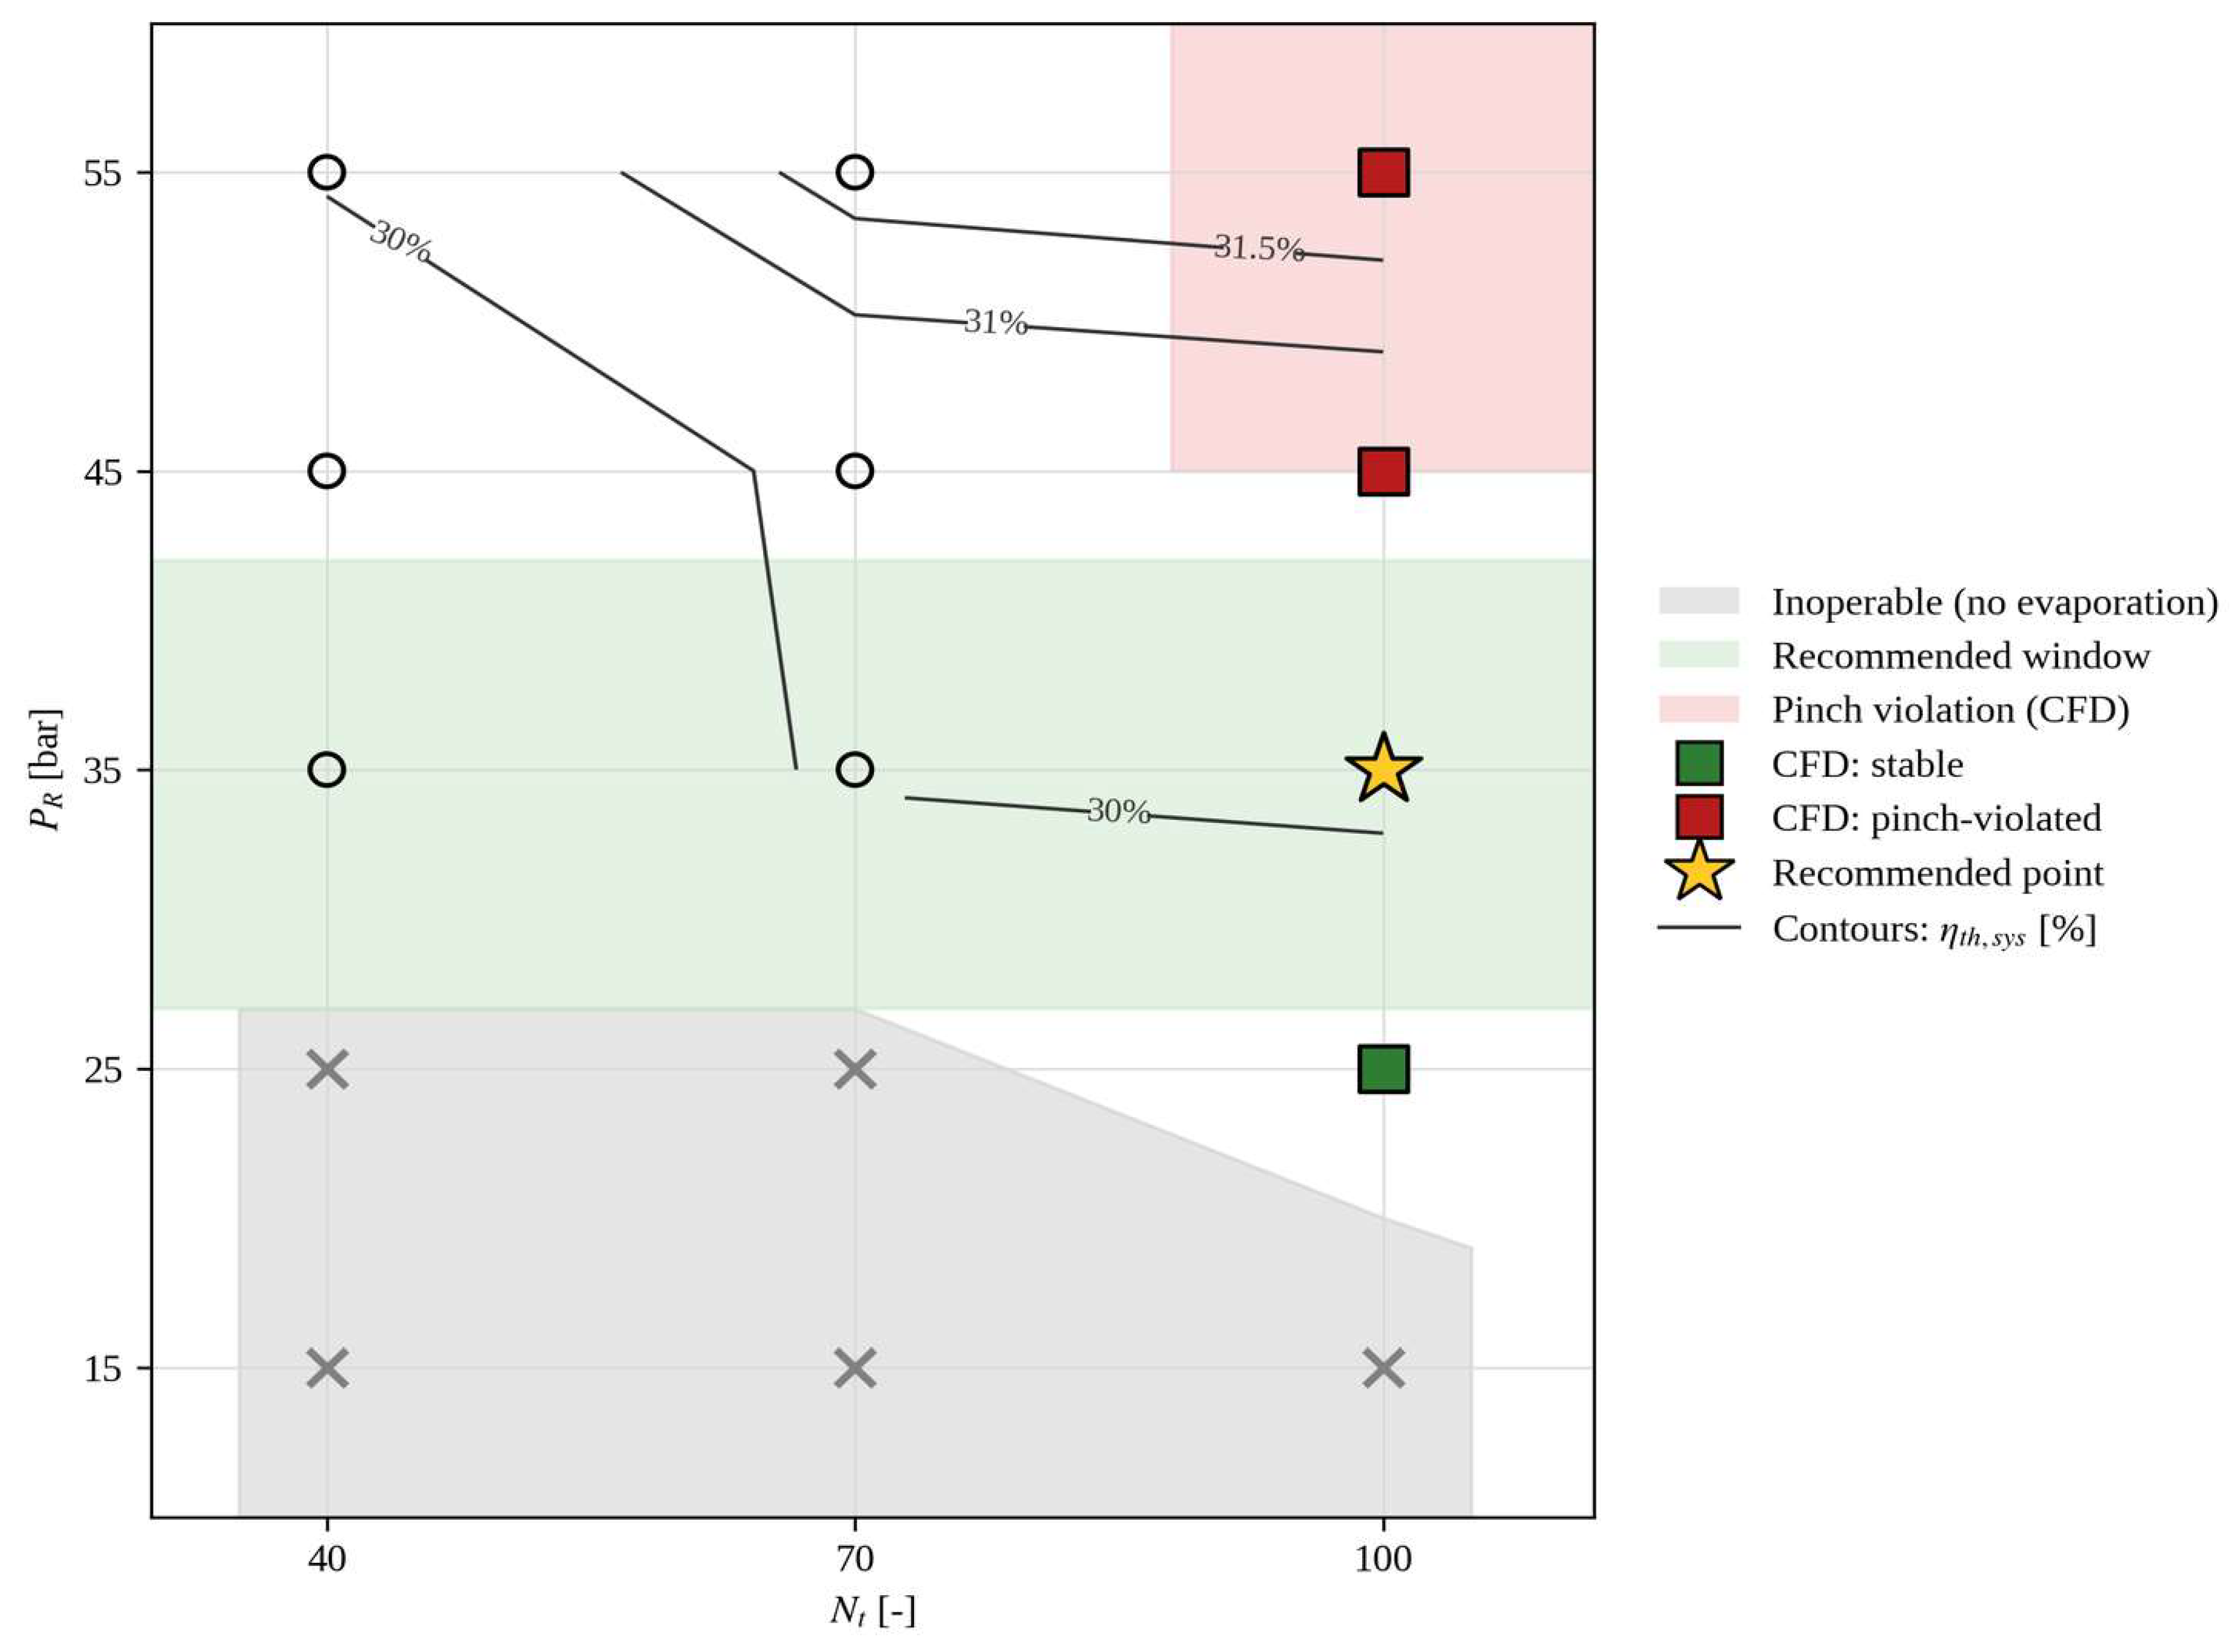
Integrating the 1D and 3D analysis results over the PR × Nt design space yields the operating-envelope map shown in Figure 13. This map clearly distinguishes three regions. First, the non-evaporation region (gray) is established from the 1D analysis and corresponds to conditions where the heat-transfer area is insufficient for the working fluid to evaporate, giving Wnet,R = 0; this corresponds to PR ≤ 25 bar at Nt = 40 and 70, and PR = 15 bar at Nt = 100. Second, the recommended operating region (green) is where the working fluid evaporates stably while the possibility of outlet-end temperature reversal and minimum-temperature-difference violation remains limited; the 1D and CFD results of this study show that this region lies approximately in the range PR ≈ 27–42 bar. Third, the temperature-difference-constraint-violation region (red) is identified from the CFD analysis and corresponds to PR ≥ 45 bar at Nt = 100. Along the Nt = 100 line, the efficiency contours rise most steeply, and within the recommended operating region at Nt = 100, ηth,sys ≈ 30.3% is stably achieved, corresponding to an efficiency improvement of about +2.6 percentage points over gas-turbine-only operation.
Figure 13.
Design operating-envelope map of the ammonia dual-role combined cycle.
From these results, the recommended operating point is derived as (Nt ≥ 70, PR ≈ 35 bar). This operating point simultaneously satisfies three requirements: (i) In terms of efficiency, ηth,sys ≈ 30.1–30.3% is stably achieved, an improvement of +2.4 to +2.6 percentage points over gas-turbine-only operation. (ii) In terms of stability, no pinch-point violation occurs, and the tube-to-tube outlet temperature spread is kept below 40 K. (iii) In terms of design efficiency, the point lies near the critical point where the marginal benefit of Nt begins to saturate, giving a relatively favorable balance between added heat-transfer area and output gain. By contrast, the thermodynamically optimal point derived from the 1D analysis alone (Nt = 100, PR = 55 bar) has the highest efficiency but lacks component-level stability; this result shows that, without multiscale analysis, deciding the design based solely on 1D results is likely to lead to reliability problems in actual operation.
3.7. Component-Wise Exergy Destruction Analysis
To clarify the thermodynamic mechanism underlying the comparatively small Rankine-cycle work output reported in Table 7, a component-wise exergy destruction analysis was performed for the Nt = 100 condition, following the same physical-exergy formulation used in the thesis-stage 0D analysis (e = (h − h0) − T0(s − s0)) but evaluated directly from the 1D thermodynamic state points, with the dead state taken as the actual 1D compressor-inlet condition (T0 = 292.57 K, P0 = 0.908 bar). The ammonia fuel chemical exergy (19.9 MJ/kg) and lower heating value (LHV = 18.6 MJ/kg) follow the values established in the thesis-stage analysis. Component-wise exergy destruction rates are reported in Table 9, following an energy–exergy–economy–environment evaluation framework consistent with that applied to other Brayton-cycle waste-heat-recovery systems [41].
Table 9.
Component-wise exergy destruction rate [kW] (Nt = 100).
The combustor is the dominant source of irreversibility across all conditions, accounting for approximately 40% of the total fuel chemical-exergy input (398.3 kW) regardless of PR, consistent with the fixed Brayton-cycle definition. The WHR evaporator is the second-largest contributor, and its exergy destruction decreases monotonically with PR (121.7 kW at 15 bar to 73.8 kW at 55 bar), mirroring the trend already observed for QWHR in Section 3.2. Because a large share of the exergy carried by the recovered exhaust heat is destroyed by heat-transfer irreversibility within the evaporator itself—before that heat ever reaches the expander—the exergy budget actually available for Rankine work extraction is inherently limited. This directly explains why the Rankine-cycle thermal efficiency remains modest (ηth,R = 3–7% in Table 7) even though QWHR itself is substantial: the low conversion is a consequence of where the available exergy is consumed within the cycle, not of an error in the Rankine-side modeling.
3.8. Trade-Off and Sensitivity of Design Variables
Nt and PR were varied independently in this study, but their effects on system performance and evaporator stability are not independent in practice. Using the full 15-condition 1D sweep (Table 7) together with the CFD-derived tube-to-tube outlet temperature spread (Table 8), the resulting trade-off between system thermal efficiency and evaporator stability risk can be summarized as follows. Increasing Nt from 40 to 100 raises ηth,sys by up to 1.9 percentage points at fixed PR, while increasing PR from 15 to 55 bar raises ηth,sys by up to 4.3 percentage points at fixed Nt; however, the latter gain is not free of cost—beyond PR ≈ 42 bar, each additional percentage point of efficiency coincides with a disproportionate increase in tube-to-tube outlet temperature spread (from about 38 K to 74–78 K), rather than a proportional one. This asymmetry indicates that PR is the primary lever for efficiency gain, while Nt is the primary lever for extending the stable operating range, and that pursuing efficiency through PR alone past the identified design-critical boundary trades a small efficiency gain for a disproportionate stability penalty. This sensitivity ranking is derived directly from the existing dataset and is not intended as a formal variance-based sensitivity analysis (e.g., Sobol indices), which would require a substantially larger design-of-experiments sweep beyond the scope of the present study.
3.9. Validation of Computational Results
Calculation accuracy in this study is assessed through three independent, complementary checks rather than a single objective function, addressing numerical convergence, the fidelity of the adopted thermodynamic sub-models, and cross-scale consistency between the 1D and 3D analyses.
First, numerical convergence of both the 1D and 3D solvers was enforced to a tight iterative tolerance (residuals < 1 × 10⁻⁴, Table 6), ensuring that the discretized mass, momentum, and energy conservation equations are satisfied to a level far below the magnitude of the reported performance differences between operating conditions.
Second, the heat-transfer correlations underlying the 1D WHR evaporator sizing (Table 2) are not derived in this study but adopted from established, independently benchmarked correlations: the Shah (1982) flow-boiling correlation [35] reports a mean deviation of approximately 17.5% against a validation database of 1960 data points spanning 30 fluids, and the Shah (1979) condensation correlation [36] reports a mean deviation of approximately 15–17% against 474 data points from 21 independent experimental studies. These published accuracy bounds define the expected uncertainty envelope of the 1D heat-transfer coefficients used in this work.
Third, cross-scale consistency between the 1D system boundary conditions and the resolved 3D CFD temperature field was checked by comparing the representative tube-side outlet temperature used to couple the CFD results back into the 1D cycle against the CFD-resolved tube-average outlet temperature (Figure 9, Figure 10 and Figure 11c) at the three CFD-analyzed pressure conditions where both values are available. At PR = 35 and 55 bar, the two values agree to within 0.1% (360.45 vs. 360.45 K, and 408.45 vs. 408.45 K, respectively); at PR = 45 bar, a modest 1.5% difference is found (398.89 K representative vs. 392.89 K tube-averaged), attributable to the more pronounced tube-to-tube non-uniformity developing near the internal-pinch-point condition identified in Section 3.4. This level of agreement supports the internal consistency of the multiscale coupling between the 1D and 3D analyses, and the combination of the three checks above—iterative residual convergence, the published validation accuracy of the adopted correlations, and 1D–3D cross-scale agreement—is the basis on which the calculation accuracy of the computational results in this study is assessed.
3.10. Mesh Independence Checking
The WHR evaporator CFD mesh uses a 2 mm uniform Cartesian base grid with local fixed embedding (embedding scale 2, 1 embedding layer) applied at the tube walls, refining the near-wall cell size to 0.5 mm (Table 6). Relative to the tube outer diameter (do = 20 mm) and the minimum inter-tube shell-side flow gap (tube pitch—tube outer diameter = 5 mm), this resolution corresponds to approximately 40 cells across each tube diameter and about 10 cells across the narrowest inter-tube gap, consistent with the grid densities reported as adequate for resolving tube-wall thermal gradients in comparable shell-and-tube CFD studies [31,32]. The near-wall embedding specifically targets the velocity and thermal boundary layers on the tube walls, where the steepest gradients driving the tube-to-tube heat-transfer non-uniformity reported in Section 3.4 develop; coarsening this region would be expected to under-resolve precisely the tube-to-tube spread that is a central quantitative result of this study.
A formal, multi-level grid-convergence-index (GCI) study—systematically repeating the CFD analysis at coarser and finer base-grid resolutions and quantifying the resulting change in QWHR and tube-to-tube spread—was not performed for the present dataset, since it would require additional CFD runs beyond the scope of the present analysis; the local embedding strategy described above was instead applied uniformly across all reported cases, following practice established in [31,32] for comparable tube-bank geometries. Carrying out a systematic grid-refinement study is identified as a priority item for follow-up work, together with the other items noted in Section 3.11.
3.11. Limitations
Several limitations of the present study should be acknowledged beyond those already discussed in Section 3.9 and Section 3.10. First, component-level hydraulic pressure drop across the shell side and tube side of the WHR evaporator was not captured as an independent CFD output in the present dataset; consequently, the net benefit of increasing Nt and PR reported in this study does not include the associated auxiliary pumping-power penalty, which is expected to grow with both variables. Second, quantitative NOx prediction was outside the scope of the present non-reacting CFD and 1D thermodynamic analysis. Finally, while the reported system-efficiency improvement (+2.4 to +2.6 percentage points within the recommended operating region, up to +4.3 percentage points at the thermodynamically optimal condition) is systematic and monotonic across the full 15-condition sweep rather than a single-point result, a formal propagated-uncertainty quantification accounting for component isentropic-efficiency tolerances was not performed. Addressing these three limitations—evaporator-side pressure drop and pumping power, quantitative NOx prediction, and formal uncertainty quantification—together with the multi-level grid-convergence-index study identified in Section 3.10, is identified as a priority for follow-up work.
3.12. Preliminary Economic Assessment
An order-of-magnitude economic assessment was performed to contextualize the incremental cost of increasing WHR evaporator heat-transfer area against the associated output gain. Shell-and-tube heat-exchanger equipment cost was estimated using the module-costing approach of Turton et al. [42], and the incremental Rankine-side equipment (expander, pump, and condenser) was estimated using specific-cost benchmarks reported for small-scale ORC-type bottoming cycles (of order 1500–2500 USD per kWe of Rankine net output) [43]. Applying these correlations to the heat-transfer areas already reported in this study (A = 3.02, 5.28, and 7.54 m2 for Nt = 40, 70, and 100) and the corresponding net power outputs in Table 7 indicates that increasing Nt from 40 to 100 raises estimated capital cost predominantly through the added heat-exchanger area, while the corresponding gain in WTotal (approximately 7 kW at PR = 55 bar) yields a simple payback on the order of several years at typical industrial electricity values, consistent with the diminishing marginal benefit of tube-count expansion already identified in Section 3.2. This assessment is presented as a preliminary, order-of-magnitude estimate rather than a detailed techno-economic or levelized-cost-of-electricity analysis, which is identified as a priority for follow-up work.
3.13. Materials, Corrosion, and Safety Considerations
High-pressure, high-temperature ammonia service imposes material-compatibility and safety requirements beyond those of the thermodynamic and fluid-dynamic analysis presented above. Copper, copper alloys, and other materials susceptible to ammonia-induced stress-corrosion cracking are unsuitable for wetted components in this system; the SUS304 stainless-steel tube material already adopted for the WHR evaporator in this study is consistent with established practice for ammonia service, though susceptibility to chloride-assisted stress-corrosion cracking under combined high-pressure, high-temperature, and cyclic-loading conditions should be evaluated during detailed design. Ammonia’s toxicity and flammability characteristics further require leak-detection, ventilation, and emergency-response provisions consistent with relevant ammonia-handling and pressure-equipment standards. A full materials-qualification and safety-case study was outside the scope of the present feasibility-and-bottleneck-identification study and is identified as a necessary step prior to detailed design.
4. Conclusions
This study applied a multiscale approach linking GT-SUITE-based 1D system analysis with CONVERGE-based 3D CFD component analysis to a dual-role combined power generation system in which ammonia is used simultaneously as the Brayton-cycle fuel and the bottoming Rankine-cycle working fluid, and quantitatively derived (i) the system operational feasibility, (ii) the critical design conditions of the WHR evaporator, and (iii) design guidelines for stable operation. The main findings are summarized below.
(1) Computation converged stably for all 15 operating conditions examined in the 1D analysis, and a valid Rankine output was obtained only under conditions where working-fluid evaporation was ensured. The system thermal efficiency reached a maximum of 31.98% at Nt = 100, PR = 55 bar, a 4.32-percentage-point improvement over gas-turbine-only operation (27.66%).
(2) Nt and PR have opposing effects in terms of heat absorption and cycle efficiency, respectively, and the marginal benefit of Nt saturates sharply near Nt ≈ 70, showing that a simple tube-count-expansion strategy cannot be an intrinsic means of improving efficiency.
(3) In the 3D CFD analysis, the PR = 25 bar condition showed stable operating behavior, while PR = 35 bar appeared as a marginal condition at the onset of outlet-end temperature reversal. At PR = 45 and 55 bar, however, a possible violation of the minimum temperature-difference condition occurred together with a roughly two-fold increase in the tube-to-tube outlet temperature spread (38 K → 74–78 K), identifying a component-level design-critical boundary near PR ≈ 40 bar for this system.
(4) Applying a single segmental baffle mitigated the outlet-end temperature reversal, but the tube-to-tube outlet temperature spread remained largely unchanged, suggesting that shell geometric asymmetry is the structural cause. Securing stable high-pressure operation therefore requires not simple baffle addition but a structural approach involving multi-baffle optimization, asymmetry correction of the shell geometry, and redesign of the tube arrangement.
(5) Integrating the 1D and 3D results into an operating-envelope map yielded a recommended operating point (Nt ≥ 70, PR ≈ 35 bar), which simultaneously satisfies the requirements of efficiency, stability, and design efficiency. At this operating point, the system efficiency is about 30.1–30.3%, a stable improvement of about +2.4 to +2.6 percentage points over gas-turbine-only operation, avoiding both temperature-difference-constraint violation and excessive tube spread.
(6) The thermodynamically optimal point derived from the 1D analysis alone (Nt = 100, PR = 55 bar) has the highest efficiency but lacks component-level stability; this study quantitatively showed that deciding the design based on 1D cycle analysis alone is likely to cause reliability problems in actual operation. A reliable design of ammonia-based combined cycles therefore requires multiscale analysis linking the system and component levels.
Future work should address (i) redesign of the evaporator structure, including asymmetry correction of the shell geometry and multi-baffle optimization, together with its CFD verification; (ii) evaluation of dynamic stability under partial-load and transient operating conditions; (iii) integrated optimization with ammonia combustor NOx-reduction strategies; and (iv) extension of this multiscale approach to other low-carbon fuels or working fluids.
Author Contributions
Writing—original draft, Y.A.; Writing—review & editing, J.P. All authors have read and agreed to the published version of the manuscript.
Funding
This work was supported by the Korea Institute of Energy Technology Evaluation and Planning (KETEP) and the Ministry of Trade, Industry & Energy (MOTIE) of the Republic of Korea (No. RS-2024-00397362).
Data Availability Statement
The data presented in this study are available within the article.
Conflicts of Interest
The authors declare no conflicts of interest.
Abbreviations
The following abbreviations are used in this manuscript:
| CFD | Computational Fluid Dynamics |
| GHG | Greenhouse Gas |
| LHV | Lower Heating Value |
| LMTD | Log Mean Temperature Difference |
| NOx | Nitrogen Oxides |
| ORC | Organic Rankine Cycle |
| RANS | Reynolds-Averaged Navier–Stokes |
| WHR | Waste Heat Recovery |
References
- UNFCCC. Paris Agreement; United Nations Framework Convention on Climate Change: Paris, France, 2015. [Google Scholar]
- IPCC. Global Warming of 1.5 °C: IPCC Special Report on Impacts of Global Warming of 1.5 °C Above Pre-Industrial Levels, 1st ed.; Cambridge University Press: Cambridge, UK, 2022. [Google Scholar] [CrossRef] [Scilit]
- Shukla, P.R.; Skea, J.; Reisinger, A.R. (Eds.) Climate Change 2022: Mitigation of Climate Change; IPCC: Geneva, Switzerland, 2022. [Google Scholar]
- Greenhouse Gas Inventory and Research Center of Korea (GIR). 2024 National Greenhouse Gas Inventory Report of Korea; GIR: Sejong, Republic of Korea, 2025. [Google Scholar]
- Schnellmann, M.A.; Chyong, C.K.; Reiner, D.M.; Scott, S.A. Deploying gas power with CCS: The role of operational flexibility, merit order and the future energy system. Int. J. Greenh. Gas. Control 2019, 91, 102838. [Google Scholar] [CrossRef] [Scilit]
- Pierobon, L.; Benato, A.; Scolari, E.; Haglind, F.; Stoppato, A. Waste heat recovery technologies for offshore platforms. Appl. Energy 2014, 136, 228–241. [Google Scholar] [CrossRef] [Scilit]
- Cui, J.; Aziz, M. Techno-economic analysis of hydrogen transportation infrastructure using ammonia and methanol. Int. J. Hydrogen Energy 2023, 48, 15737–15747. [Google Scholar] [CrossRef] [Scilit]
- Negro, V.; Noussan, M.; Chiaramonti, D. The Potential Role of Ammonia for Hydrogen Storage and Transport: A Critical Review of Challenges and Opportunities. Energies 2023, 16, 6192. [Google Scholar] [CrossRef] [Scilit]
- Giddey, S.; Badwal, S.P.S.; Munnings, C.; Dolan, M. Ammonia as a Renewable Energy Transportation Media. ACS Sustain. Chem. Eng. 2017, 5, 10231–10239. [Google Scholar] [CrossRef] [Scilit]
- Zamfirescu, C.; Dincer, I. Ammonia as a green fuel and hydrogen source for vehicular applications. Fuel Process. Technol. 2009, 90, 729–737. [Google Scholar] [CrossRef] [Scilit]
- Zhou, J.; Fan, F.; Ye, X.; Wang, Z.; Xu, J.; Zhang, H.; Jiang, J.; Xue, R.; Sun, C.; Song, K.; et al. Power-to-hydrogen-ammonia coordination and planning for integrated energy systems with ammonia co-firing and waste heat recovery. Appl. Energy 2026, 406, 127258. [Google Scholar] [CrossRef] [Scilit]
- Valera-Medina, A.; Xiao, H.; Owen-Jones, M.; David, W.I.F.; Bowen, P.J. Ammonia for power. Prog. Energy Combust. Sci. 2018, 69, 63–102. [Google Scholar] [CrossRef] [Scilit]
- International Energy Agency. Ammonia Technology Roadmap: Towards More Sustainable Nitrogen Fertiliser Production; OECD: Paris, France, 2021. [Google Scholar] [CrossRef] [Scilit]
- Gas Turbine Power Generation with a Methane-Ammonia Gas Mixture and 100% Ammonia; National Institute of Advanced Industrial Science and Technology (AIST): Tsukuba, Japan, 2016. Available online: https://www.aist.go.jp/aist_e/list/latest_research/2016/20160412/en20160412.html (accessed on 5 October 2026).
- CO2-Free Power Generation Achieved with the World’s First Gas Turbine Using 100% Liquid Ammonia; IHI Corporation: Tokyo, Japan, 2022; Available online: https://www.ihi.co.jp/en/all_news/2022/resources_energy_environment/1197938_3488.html (accessed on 5 October 2026).
- GE and IHI Sign Memorandum of Understanding to Develop Gas Turbines That Can Operate on 100% Ammonia; IHI Corporation: Tokyo, Japan, 2022; Available online: https://www.ihi.co.jp/en/all_news/2022/resources_energy_environment/1198148_3488.html (accessed on 5 October 2026).
- Baker Hughes and Hanwha Announce Partnership to Develop Small-Size Ammonia Turbines; Baker Hughes Company: Houston, TX, USA, 2025; Available online: https://investors.bakerhughes.com/news-releases/news-release-details/baker-hughes-and-hanwha-announce-partnership-develop-small-size (accessed on 5 October 2026).
- Yang, X.; Xiao, Z.; Hu, R.; Feng, D. A Review on Laminar Burning Velocity of Ammonia Flames. Energies 2025, 18, 6000. [Google Scholar] [CrossRef] [Scilit]
- Vagelopoulos, C.M.; Egolfopoulos, F.N. Direct experimental determination of laminar flame speeds. Symp. (Int.) Combust. 1998, 27, 513–519. [Google Scholar] [CrossRef] [Scilit]
- Verhelst, S.; Wallner, T. Hydrogen-fueled internal combustion engines. Prog. Energy Combust. Sci. 2009, 35, 490–527. [Google Scholar] [CrossRef] [Scilit]
- Hayakawa, A.; Goto, T.; Mimoto, R.; Arakawa, Y.; Kudo, T.; Kobayashi, H. Laminar burning velocity and Markstein length of ammonia/air premixed flames at various pressures. Fuel 2015, 159, 98–106. [Google Scholar] [CrossRef] [Scilit]
- Kobayashi, H.; Hayakawa, A.; Somarathne, K.D.K.A.; Okafor, E.C. Science and technology of ammonia combustion. Proc. Combust. Inst. 2019, 37, 109–133. [Google Scholar] [CrossRef] [Scilit]
- Shen, Y.; Nazir, S.M.; Zhang, K.; Duwig, C. Waste heat recovery optimization in ammonia-based gas turbine applications. Energy 2023, 280, 128079. [Google Scholar] [CrossRef] [Scilit]
- Wagar, W.R.; Zamfirescu, C.; Dincer, I. Thermodynamic performance assessment of an ammonia-water Rankine cycle for power and heat production. Energy Convers. Manag. 2010, 51, 2501–2509. [Google Scholar] [CrossRef] [Scilit]
- Sánchez, F.D.; Barba Salvador, J.; Mata Montes, C. Organic Rankine Cycle System Review: Thermodynamic Configurations, Working Fluids, and Future Challenges in Low-Temperature Power Generation. Energies 2025, 18, 6561. [Google Scholar] [CrossRef] [Scilit]
- Reshaeel, M.; Javed, A.; Jamil, A.; Ali, M.; Mahmood, M.; Waqas, A. Multiparametric optimization of a reheated organic Rankine cycle for waste heat recovery based repowering of a degraded combined cycle gas turbine power plant. Energy Convers. Manag. 2022, 254, 115237. [Google Scholar] [CrossRef] [Scilit]
- Pierobon, L.; Nguyen, T.-V.; Larsen, U.; Haglind, F.; Elmegaard, B. Multi-objective optimization of organic Rankine cycles for waste heat recovery: Application in an offshore platform. Energy 2013, 58, 538–549. [Google Scholar] [CrossRef] [Scilit]
- Chen, H.; Goswami, D.Y.; Stefanakos, E.K. A review of thermodynamic cycles and working fluids for the conversion of low-grade heat. Renew. Sustain. Energy Rev. 2010, 14, 3059–3067. [Google Scholar] [CrossRef] [Scilit]
- Bao, J.; Zhao, L. A review of working fluid and expander selections for organic Rankine cycle. Renew. Sustain. Energy Rev. 2013, 24, 325–342. [Google Scholar] [CrossRef] [Scilit]
- Zhang, R.; Liu, J.; Zhang, L. Boiling Heat Transfer and Visualization for R717 in a Horizontal Smooth Mini-tube. Int. J. Refrig. 2021, 131, 275–285. [Google Scholar] [CrossRef] [Scilit]
- Pamuk, M.T. CFD Simulation of a Shell and Tube Heat Exchanger. In Proceedings of the 6th World Congress on Mechanical, Chemical, and Material Engineering (MCM’20), Virtual, 16–18 August 2020. [Google Scholar] [CrossRef] [Scilit]
- Bozorgan, N.; Ghafouri, A.; Assareh, E.; Mohammad, S.A.S. Design and thermal-hydraulic optimization of a shell and tube heat exchanger using bees algorithm. Therm. Sci. 2022, 26, 693–703. [Google Scholar] [CrossRef] [Scilit]
- Qiu, G.; Liu, H.; Riffat, S. Expanders for micro-CHP systems with organic Rankine cycle. Appl. Therm. Eng. 2011, 31, 3301–3307. [Google Scholar] [CrossRef] [Scilit]
- Tillner-Roth, R.; Harms-Watzenberg, F.; Baehr, H.D. Eine neue Fundamentalgleichung für Ammoniak. DKV-Tagungsbericht 1993, 20, 167–181. [Google Scholar]
- Shah, M.M. Chart correlation for saturated boiling heat transfer: Equations and further study. ASHRAE Trans. 1982, 88, 185–196. [Google Scholar]
- Shah, M.M. A general correlation for heat transfer during film condensation inside pipes. Int. J. Heat Mass Transf. 1979, 22, 547–556. [Google Scholar] [CrossRef] [Scilit]
- Ponce Arrieta, F.R.; Santos, J.D.S.; Saldanha, W.H. Calculation of the Heat Transfer Surface Area of Heat Exchangers for Waste Heat Recovery with the Kalina Cycle. IJAERS 2018, 5, 13–16. [Google Scholar] [CrossRef] [Scilit]
- Bull, J.; Buick, J.M.; Radulovic, J. Heat Exchanger Sizing for Organic Rankine Cycle. Energies 2020, 13, 3615. [Google Scholar] [CrossRef] [Scilit]
- Pili, R.; Spliethoff, H.; Wieland, C. Dynamic Simulation of an Organic Rankine Cycle—Detailed Model of a Kettle Boiler. Energies 2017, 10, 548. [Google Scholar] [CrossRef] [Scilit]
- Calise, F. Design and Parametric Optimization of an Organic Rankine Cycle Powered by Solar Energy. Am. J. Eng. Appl. Sci. 2013, 6, 178–204. [Google Scholar] [CrossRef] [Scilit]
- Xin, Q.; Wang, J.; Mei, J.; Li, Z.; Tolj, I.; Korpebayev, D.; Bai, X.; Sun, C. Comprehensive performance analysis and optimization of the closed Brayton cycle for waste heat recovery and cooling in hydrogen aeroengines. Energy 2026, 349, 140647. [Google Scholar] [CrossRef] [Scilit]
- Turton, R.; Bailie, R.C.; Whiting, W.B.; Shaeiwitz, J.A.; Bhattacharyya, D. Analysis, Synthesis, and Design of Chemical Processes, 4th ed.; Prentice Hall: Upper Saddle River, NJ, USA, 2012. [Google Scholar]
- Li, Y.; Tang, T. Performance Analysis and Optimization of a Series Heat Exchangers Organic Rankine Cycle Utilizing Multi-Heat Sources from a Marine Diesel Engine. Entropy 2021, 23, 906. [Google Scholar] [CrossRef] [Scilit] [PubMed]

Disclaimer/Publisher’s Note: The statements, opinions and data contained in all publications are solely those of the individual author(s) and contributor(s) and not of MDPI and/or the editor(s). MDPI and/or the editor(s) disclaim responsibility for any injury to people or property resulting from any ideas, methods, instructions or products referred to in the content. |
© 2026 by the authors. Licensee MDPI, Basel, Switzerland. This article is an open access article distributed under the terms and conditions of the Creative Commons Attribution (CC BY) license.