


Abstract
Wind–photovoltaic (PV) modular-multilevel-converter-based high-voltage direct-current (MMC-HVDC) collection systems have limited inherent inertia and are vulnerable to frequency disturbances caused by renewable power fluctuations. Moreover, frequency deterioration and recovery impose different and partially conflicting requirements on virtual inertia and damping. To address this problem, an asymmetric Gaussian fuzzy coordination method is proposed for the virtual synchronous generator (VSG)-controlled sending-end MMC. A low-frequency model is first established to characterize the effects of wind–photovoltaic power variations on the collection-bus frequency. The frequency deviation and rate of change of frequency (RoCoF) are then used to identify the frequency-evolution state and generate coupled adjustments of virtual inertia and damping. Nonuniform and asymmetric Gaussian membership functions enhance sensitivity near the nominal operating point and distinguish the regulation requirements during deterioration and recovery. Simulations under three representative disturbance cases show that the proposed method reduces the maximum frequency deviation by 19.4–28.6% and shortens the recovery time by 17.5–24.4% compared with fixed-parameter control. The alternating-current voltage and current and direct-current-link voltage remain within acceptable ranges. Furthermore, 20 randomized tests demonstrate consistent frequency performance without current or voltage-limit violations.
1. Introduction
The increasing penetration of converter-interfaced renewable energy is fundamentally reshaping the frequency characteristics of modern power systems. Unlike synchronous generators, wind and photovoltaic (PV) units interfaced through power electronic converters do not inherently provide rotational inertia or damping. Consequently, sudden mismatches between renewable generation and transmitted power may lead to a high rate of change of frequency (RoCoF), a large frequency excursion, and increased synchronization stress [1,2,3,4]. These issues are particularly relevant to large wind–PV collection systems, where renewable power varies with wind speed and solar irradiance and may exhibit synchronous, asynchronous, or complementary fluctuations.
Grid-forming control has emerged as a promising solution for establishing voltage and frequency references in converter-dominated systems [5,6]. Among the available grid-forming approaches, the virtual synchronous generator (VSG) emulates the swing and damping characteristics of a synchronous generator through converter control [7,8,9]. By introducing virtual inertia J and damping D, a VSG-controlled converter can provide inertial frequency support and attenuate power and frequency oscillations. However, the dynamic performance of a VSG strongly depends on these two parameters. A parameter combination that provides strong support immediately after a disturbance may result in a slower response or excessive control effort during the subsequent recovery stage [10,11,12,13]. Therefore, fixed values of J and D cannot simultaneously guarantee satisfactory RoCoF suppression, frequency-nadir improvement, and rapid restoration under varying operating conditions.
Adaptive VSG control has therefore received considerable attention. Adaptive virtual inertia methods based on frequency deviation, RoCoF, or power imbalance have been proposed to improve transient frequency regulation [14,15], while other studies have extended the adaptation to both inertia and damping [16,17,18]. However, many existing methods rely on linear, piecewise-linear, threshold-based, or separately designed parameter mappings. Ref. [14], for example, mainly adapts virtual inertia, whereas the coordinated strategies in refs. [16,17,18] generally regulate J and D through predefined relationships rather than a unified coupled mechanism. Consequently, the different requirements of inertia and damping during frequency deterioration and recovery are not explicitly distinguished.
The frequency response following a power disturbance is inherently stage dependent. During rapid frequency deterioration, increased inertia is beneficial for suppressing RoCoF, while additional damping helps limit the frequency excursion. Near the frequency extreme, further increasing inertia provides limited benefit, whereas sufficient damping remains necessary. During recovery, excessive inertia may delay restoration, while damping should remain active to suppress residual oscillations. Therefore, different stages of the transient impose partially conflicting requirements on J and D.
Fuzzy control provides a practical way to represent such nonlinear and stage-dependent relationships without relying on an exact high-order system model. Fuzzy VSG controllers have been applied to improve inertia emulation and transient performance in converter-interfaced microgrids [19,20]. However, conventional fuzzy designs commonly employ uniformly distributed or mirror-symmetric membership functions, implicitly assigning similar regulation characteristics to positive and negative frequency states of equal magnitude. This assumption does not fully reflect the asymmetric control requirements during frequency deterioration and recovery. Moreover, inertia and damping are often generated by separate fuzzy regulators, which may lead to inconsistent adjustments when reduced inertia and sustained damping are simultaneously required. In contrast, a unified two-input–two-output fuzzy structure can coordinate J and D according to both the magnitude and the evolution direction of the frequency response.
These challenges become more pronounced in a wind–PV modular multilevel converter based high-voltage direct-current (MMC-HVDC) collection system. Grid-following wind and PV converters inject power into the sending-end alternating-current collection bus, while the sending-end MMC acts as the principal grid-forming unit and establishes the collection-bus frequency. Renewable-power fluctuations therefore directly disturb the active-power balance observed by the VSG-controlled MMC, the frequency dynamics of which are further coupled with converter phase-locked loops, the alternating-current network, MMC internal energy, and direct-current-link power transfer. Existing studies on grid-forming MMC-HVDC systems have mainly addressed internal-energy regulation, direct-current voltage control, offshore wind-farm integration, small-signal stability, power sharing, and receiving-grid frequency support [21,22,23,24,25,26,27]. However, synchronous wind–PV power reductions can produce a rapid active-power deficit, asynchronous recovery can generate a multistage frequency response, and complementary variations can repeatedly change the magnitude and direction of the power imbalance [28,29]. Although coordinated VSG control has been investigated for microgrids, parallel converters, and PV-battery systems [30,31], the stage-dependent coordination of sending-end MMC inertia and damping under these wind–PV power trajectories has received comparatively less attention.
The central issue addressed in this paper is therefore not simply the online adjustment of VSG parameters, but the coordinated regulation of two parameters, the preferred values of which vary with the frequency-evolution stage. To address this issue, an asymmetric Gaussian fuzzy method is proposed for the coordinated regulation of virtual inertia and damping in a VSG-controlled wind–PV MMC-HVDC collection system. The frequency deviation and RoCoF are jointly used to characterize both the severity and the evolution direction of the frequency response. Nonuniform and asymmetric Gaussian membership functions are then employed to distinguish the different regulation requirements during frequency deterioration and recovery, while a unified two-input–two-output fuzzy inference structure generates coupled adjustments of J and D. In this way, the proposed controller increases inertia support when the frequency rapidly deteriorates, reduces excessive inertia during recovery, and retains sufficient damping when a considerable frequency deviation or residual oscillation remains.
The main contributions of this paper are summarized as follows.
- A hierarchical frequency-dynamics model of the wind–PV MMC-HVDC collection system is established to characterize how renewable-power fluctuations affect the active-power-frequency response of the VSG-controlled sending-end MMC while retaining the principal effects of converter synchronization, MMC AC power, and DC-link dynamics.
- An asymmetric Gaussian fuzzy controller with a unified two-input-two-output inference structure is developed to coordinate virtual inertia and damping according to the combined frequency deviation and RoCoF. The attainable fuzzy-output ranges, output scaling factors, and a sufficient stability condition are further analyzed.
- The proposed method is validated under synchronous, asynchronous, and complementary wind–PV disturbances and compared with fixed-parameter and representative adaptive VSG methods. Randomized disturbance and measurement-noise sensitivity tests are further used to assess robustness and implementation sensitivity without case-dependent retuning.
2. Modeling of the Wind and PV MMC-HVDC Collection System
2.1. System Configuration and Control Roles
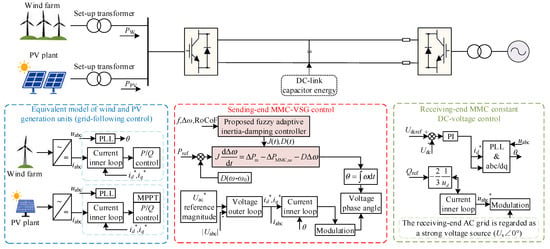
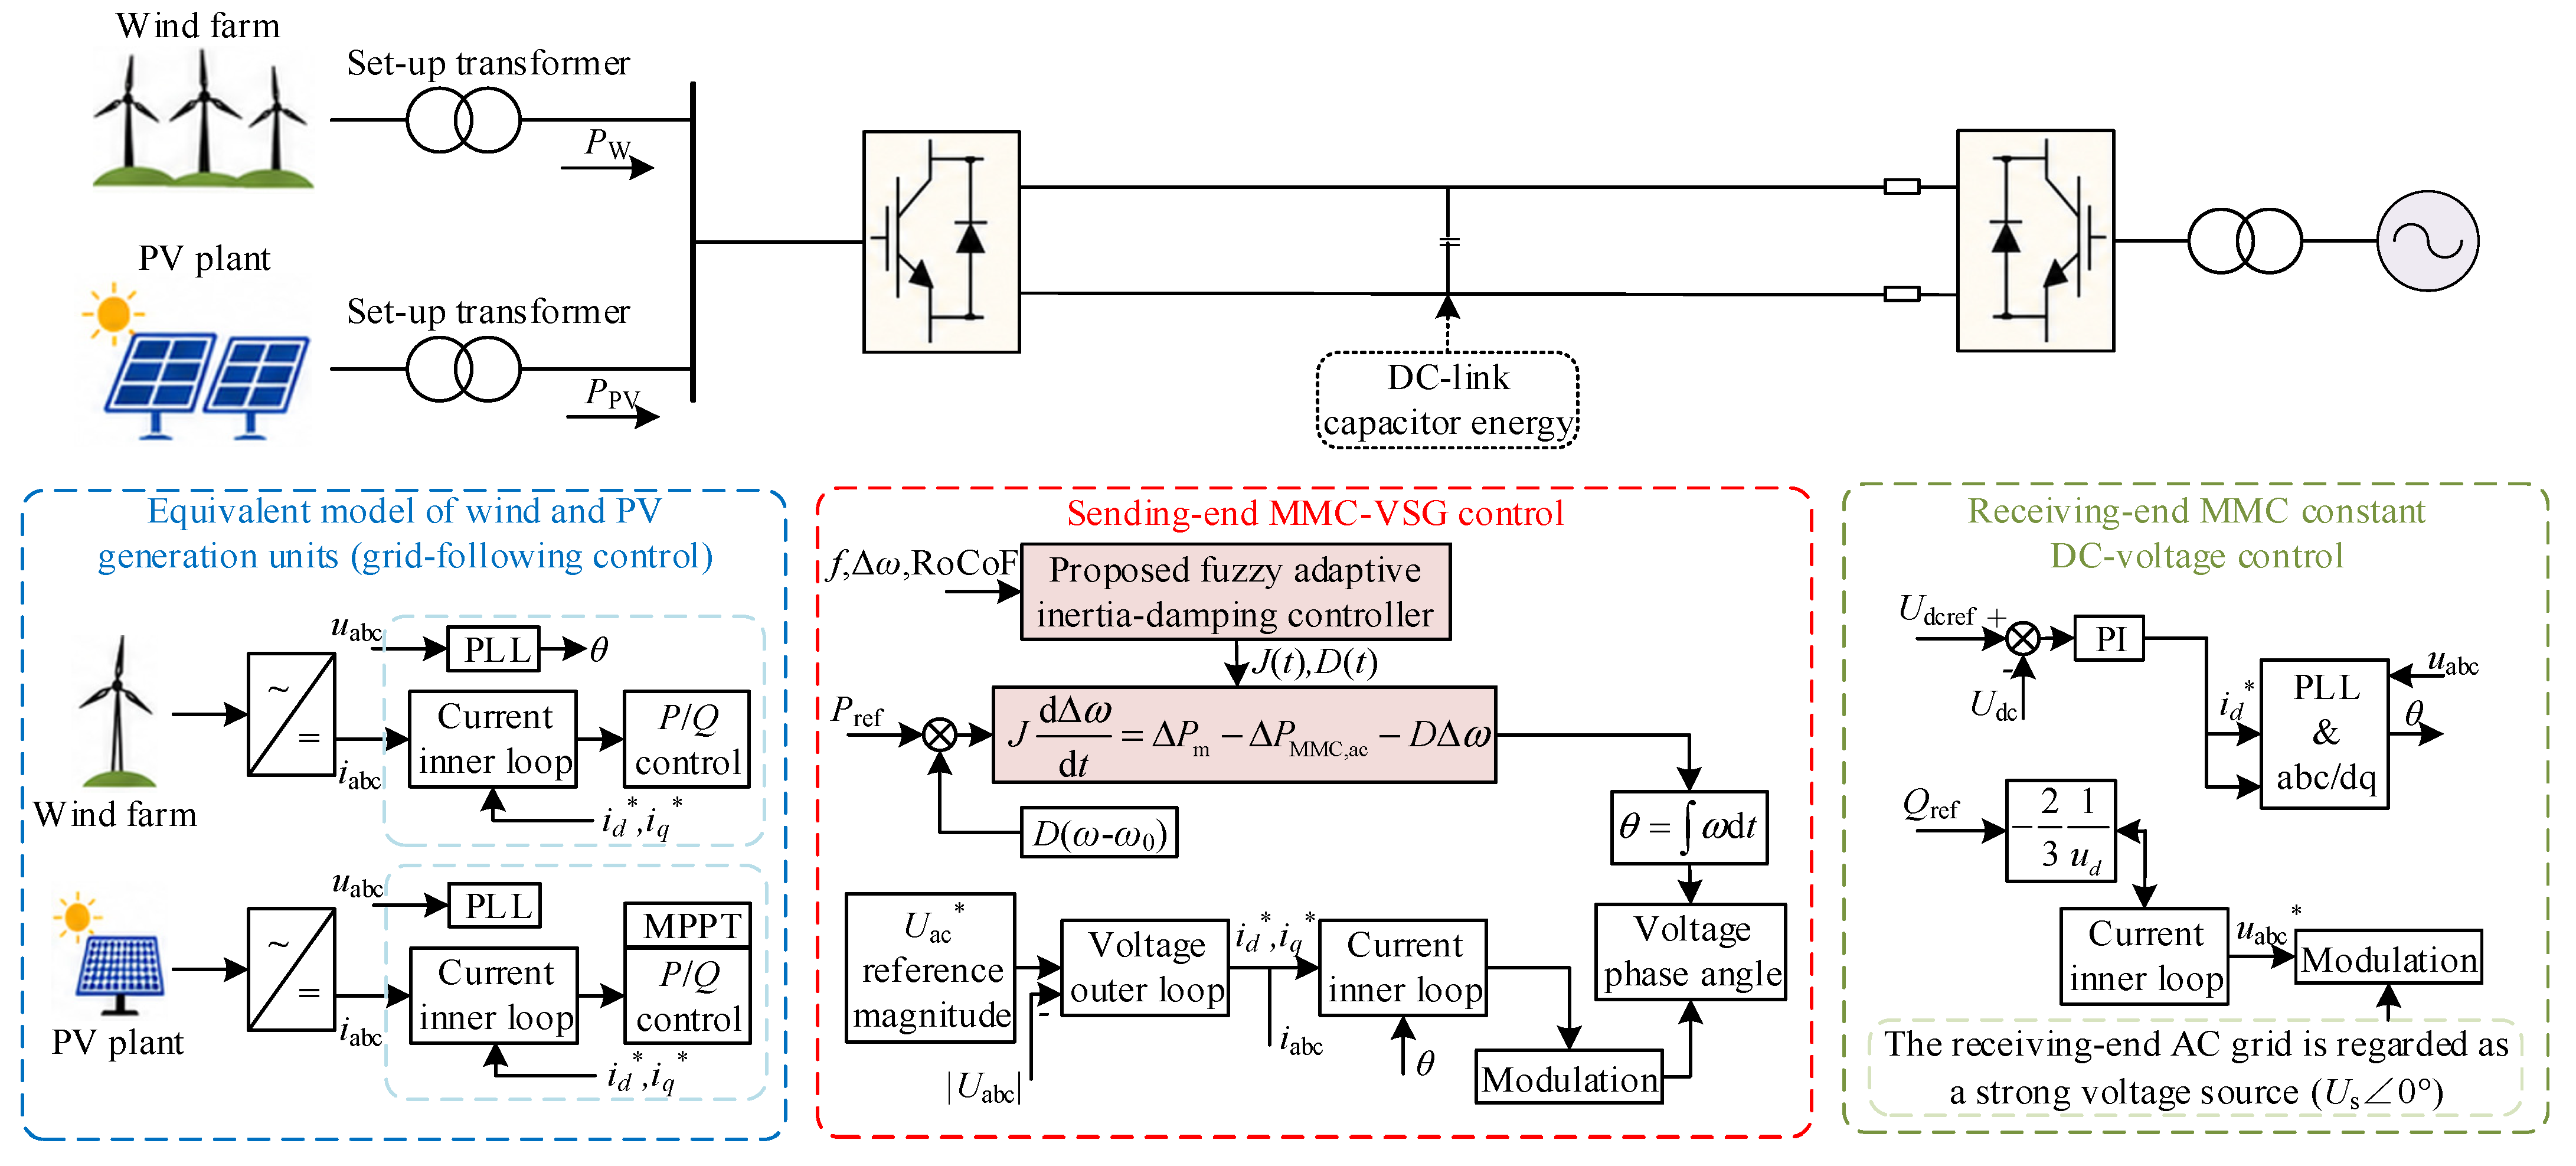
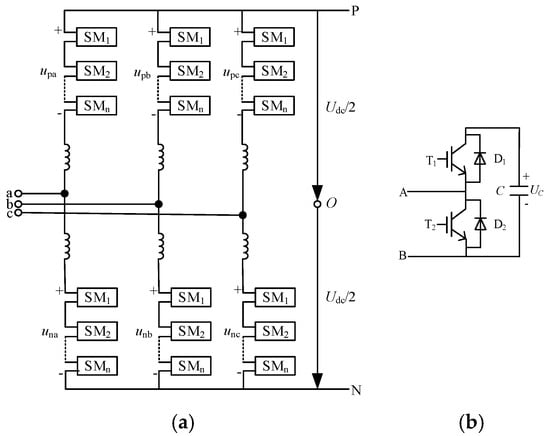
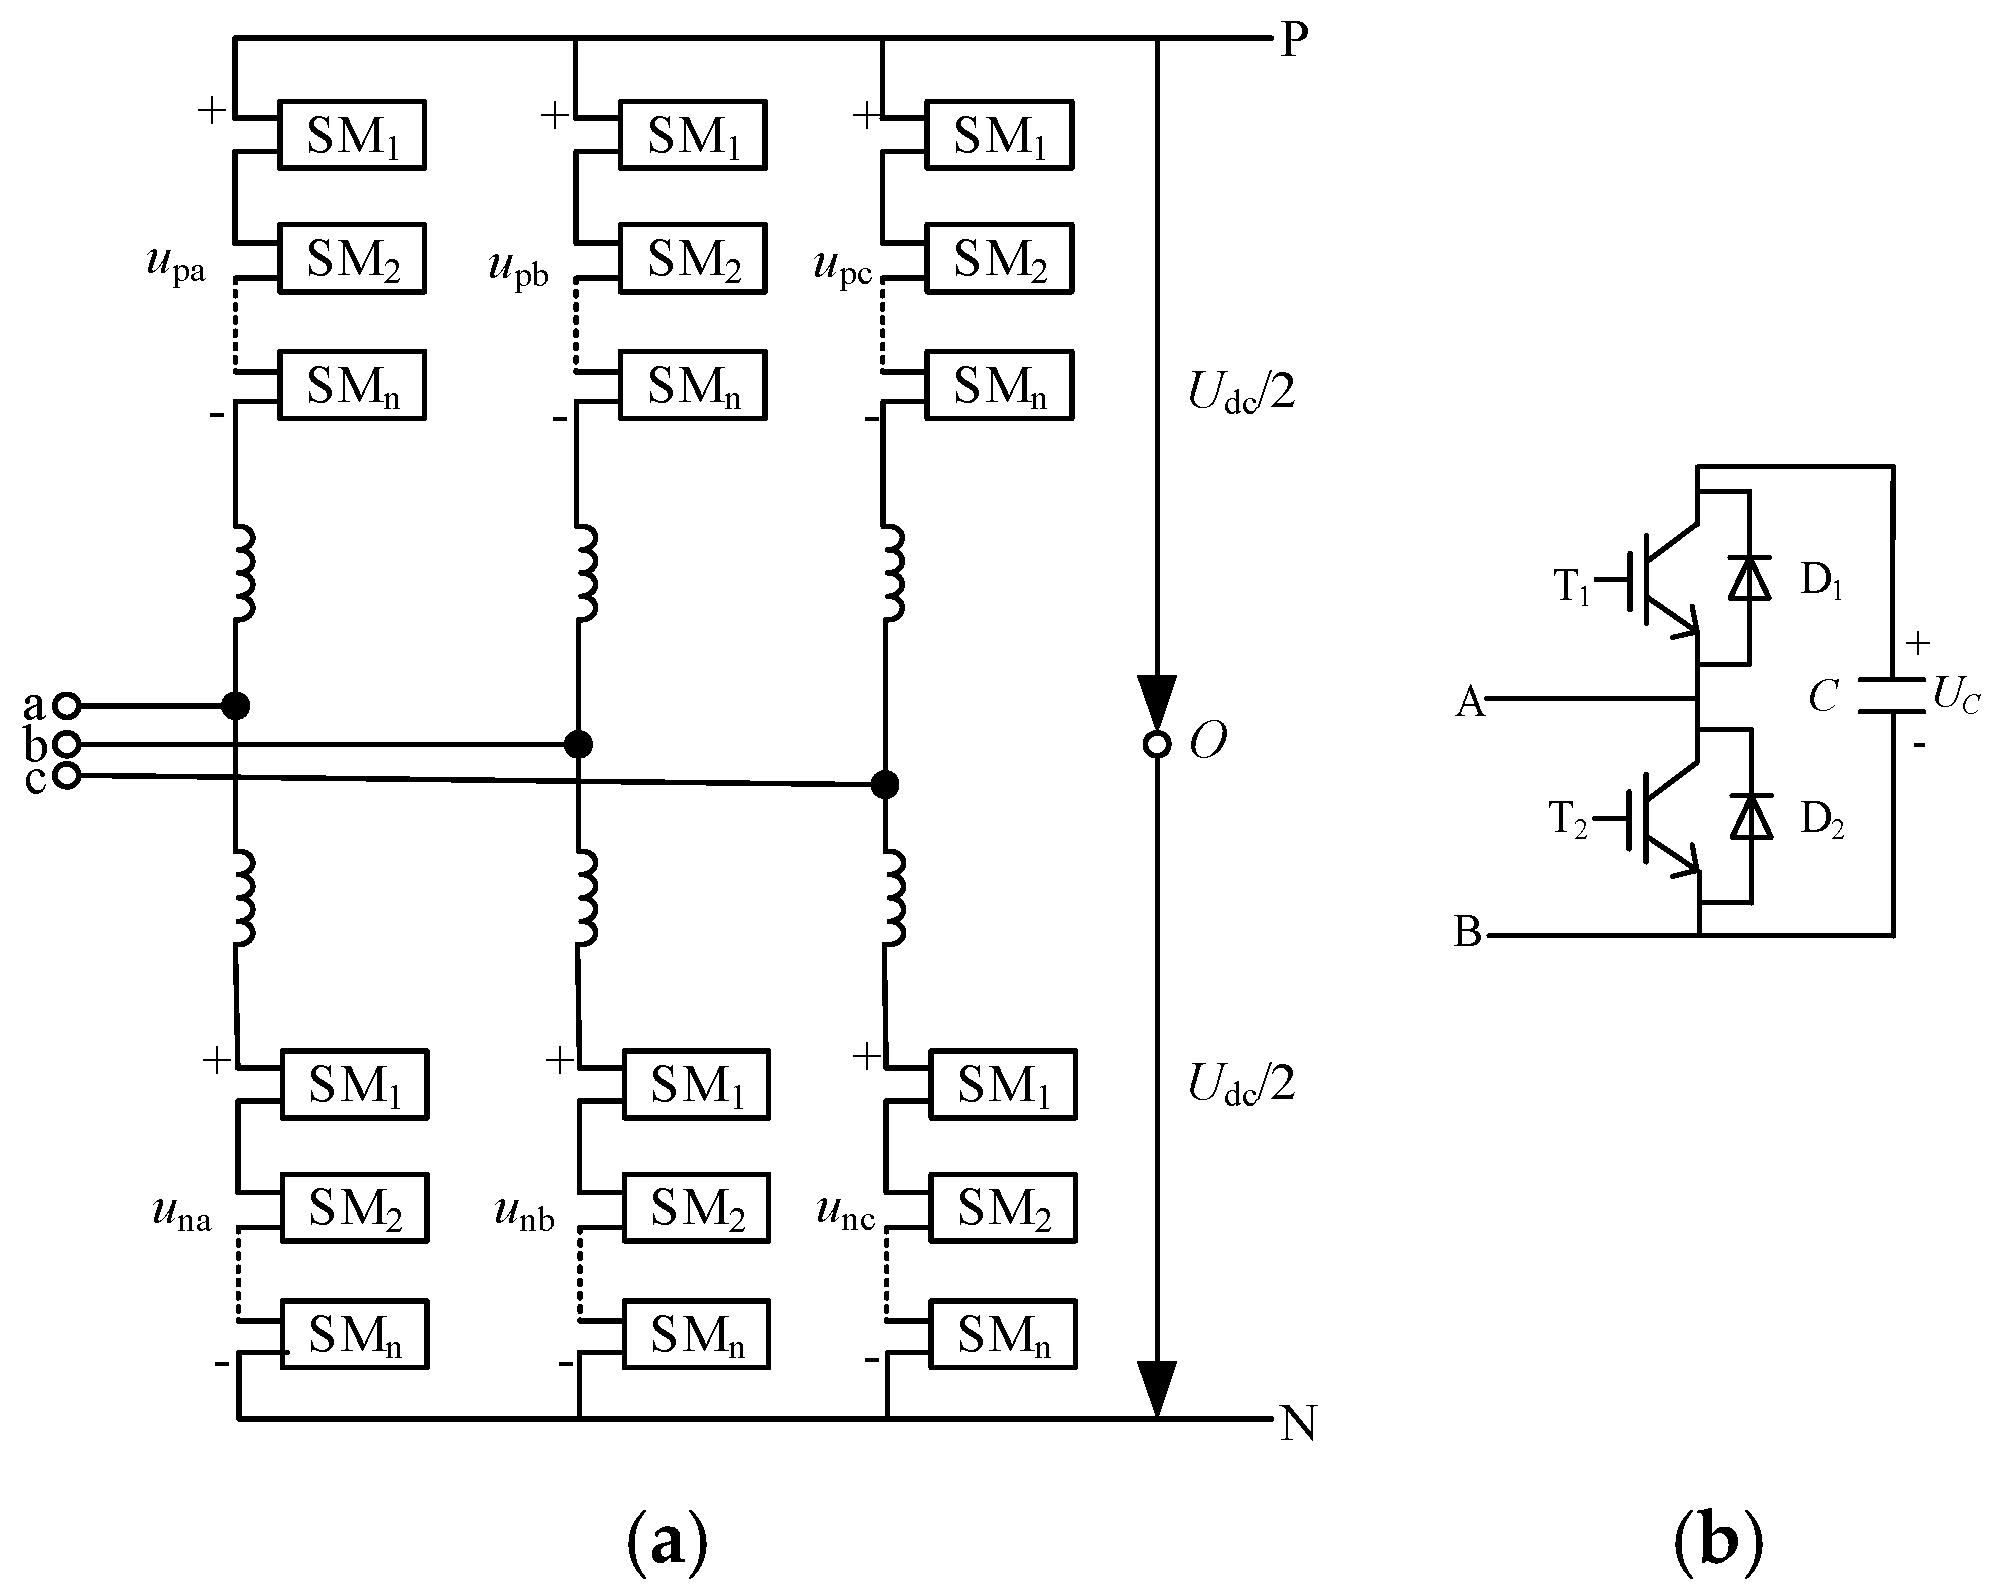
The studied system consists of wind farms, PV plants, a sending end AC collection bus, a sending end MMC, an HVDC transmission link, a receiving end MMC, and a receiving end AC grid, as shown in Figure 1. The wind and PV units are connected to the collection bus through grid-following (GFL) converters. It should be noted that the PV plant in Figure 1 represents the AC-side equivalent of the complete PV generation unit, including the DC-AC grid-connected converter; therefore, the power supplied from the PV plant to the step-up transformer is already in AC form. The sending-end MMC adopts VSG control to establish the voltage and frequency of the collection-side AC system, whereas the receiving-end MMC regulates the DC link voltage and transfers the collected renewable power to the receiving-end grid. The MMC topology adopted in the HVDC system is shown in Figure 2.
Figure 1.
System topology and control structure of the wind and PV MMC-HVDC collection system.
Figure 2.
MMC topology adopted in the HVDC system: (a) three-phase MMC structure; (b) half-bridge submodule.
The PI gains of the cascaded control loops are selected according to the conventional bandwidth-separation principle, with the inner current loops tuned faster than the outer voltage and DC-voltage loops, and the resulting parameters are verified through time-domain simulations.
The wind and PV converters inject active power according to the available wind speed, solar irradiance, and their power control references. Because these converters operate in GFL mode, they track the voltage phase established at the collection bus through phase-locked loops (PLLs) but do not independently determine the bus frequency. Consequently, the collection side frequency is governed primarily by the VSG-controlled sending-end MMC.
The total active power injected by the wind and PV units is expressed as
where PPV and Pw are the active power outputs of the PV plant and wind farm, respectively. The renewable power disturbance is defined as
where Pre,0 is the renewable power at the initial operating point. Variations in wind speed and solar irradiance therefore appear as active power disturbances at the collection bus and alter the power balance of the sending end MMC.
The modeling framework used in this paper contains two levels. A reduced-order model is used to describe the dominant active power and frequency dynamics and to derive the regulation requirements for virtual inertia and damping. The detailed simulation model retains the wind and PV converters, PLLs, MMC inner control loops, DC link dynamics, filters, transformers, and line impedances. The reduced-order model is therefore used for controller interpretation and design, whereas the complete model is used for performance evaluation.
2.2. Dominant Frequency Dynamics of the Sending End MMC-VSG
The sending end MMC uses VSG control to reproduce the dominant frequency response of a synchronous generator. Around an operating point, its active power and frequency dynamics can be written as
where Δω is the angular-frequency deviation of the collection bus, J and D are the virtual inertia and damping, respectively, ΔPm is the equivalent input power variation associated with the active power reference and renewable power disturbance, and ΔPMMC,ac is the variation in the AC side active power of the sending end MMC.
Equation (3) shows that virtual inertia directly affects the initial rate of frequency change, whereas virtual damping affects the attenuation of the subsequent frequency response. Immediately after a power disturbance, the frequency deviation is small. The initial rate of change of frequency can therefore be approximated as
where ΔPeq denotes the equivalent power imbalance immediately after the disturbance. A larger J consequently reduces the initial rate of change of frequency.
The AC-side active power of the sending end MMC is calculated from the measured AC voltage and current as
where vsd, vsq, isd, and isq are the dq axis components of the MMC AC-side voltage and current.
Unlike a conventional AC-side VSG, the sending-end MMC is also coupled to the DC link through its internal energy balance. Neglecting higher order losses, the DC-side power balance can be expressed as
where Cdc is the equivalent DC capacitance, Vdc is the DC voltage, Pdc,out is the power transmitted through the DC link, and Ploss represents the equivalent converter and transmission losses. Thus, variations in MMC AC-side power influence both the collection-side frequency and the DC voltage.
For the design of the inertia and damping coordination strategy, the dominant low-frequency variation in the MMC AC-side power is approximated as
where Δδ is the VSG phase-angle deviation, Kδ is the equivalent synchronizing power coefficient, Kω represents the equivalent frequency-dependent power feedback, and ΔPc contains the aggregated effects of the DC link, PLLs, converter inner loops, renewable power variations, and unmodeled higher order dynamics. The phase angle and frequency deviations satisfy
Substituting (7) and (8) into (3) gives the dominant low frequency model of the sending-end MMC-VSG,
where
For a given operating point, the natural angular frequency and damping ratio of the dominant mode are
When a small error band is used to evaluate frequency recovery, the approximate settling time is
Equations (4), (11), and (12) clarify the different roles of virtual inertia and damping. Increasing J suppresses the initial rate of frequency change but may slow down the subsequent recovery. Increasing D enhances the attenuation of frequency deviations and oscillations, although excessive damping may also produce an unnecessarily conservative response. Therefore, fixed values of J and D cannot provide the most appropriate dynamic response during all stages of a wind and PV power disturbance.
These relationships provide the physical basis for the adaptive coordination strategy developed in Section 3. During a frequency deterioration stage with a large rate of change in frequency, stronger inertia support is required. During the recovery stage, the inertia should be reduced appropriately to avoid delayed restoration, while sufficient damping should be retained to suppress secondary oscillations. The complete converter, PLL, inner loop, and DC link dynamics are retained in the detailed simulation model used to evaluate the proposed strategy.
3. Proposed Asymmetric Fuzzy Coordination of Virtual Inertia and Damping
The frequency response of VSG is simultaneously affected by the virtual inertia and damping coefficients. A large virtual inertia suppresses the initial rate of frequency change, whereas sufficient damping reduces the frequency excursion and attenuates oscillations. However, maintaining large values of both parameters throughout the entire transient process may lead to a slow frequency recovery and unnecessary control effort. Therefore, the two parameters should be coordinated according to the instantaneous frequency state.
In this study, an asymmetric Gaussian fuzzy controller is developed to generate coupled adjustments of the virtual inertia and damping coefficients. The controller uses the frequency deviation and the rate of change of frequency (RoCoF) as its inputs. Compared with a conventional uniformly distributed fuzzy controller, the proposed design uses nonuniform centers and widths for the Gaussian membership functions. Consequently, the controller provides high sensitivity around the normal operating point while retaining a sufficiently wide adjustment range under severe frequency disturbances.
3.1. Frequency-State-Based Coordination Principle
The frequency deviation is defined as
where ω and ω0 are the measured and nominal angular frequencies, respectively. The RoCoF is expressed as
In the simulation implementation, the angular-frequency deviation and RoCoF signals are sampled through zero-order-hold blocks with a sampling interval of 0.01 s before being supplied to the fuzzy controller. The RoCoF is obtained by direct differentiation of the measured angular frequency. Since the nominal angular frequency is constant, dΔω/dt = dω/dt, and the implemented derivative is therefore consistent with (14). The electromagnetic simulation is executed with a discrete step of 5 × 10⁻⁶ s, whereas the frequency-state inputs of the fuzzy controller are updated every 0.01 s.
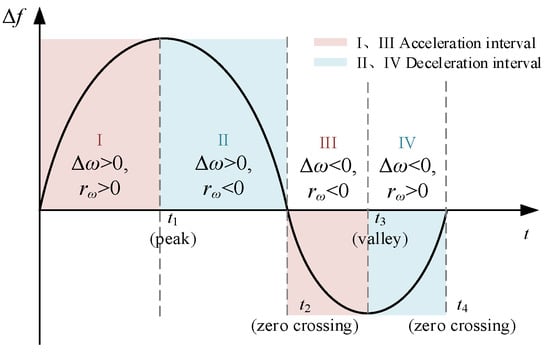
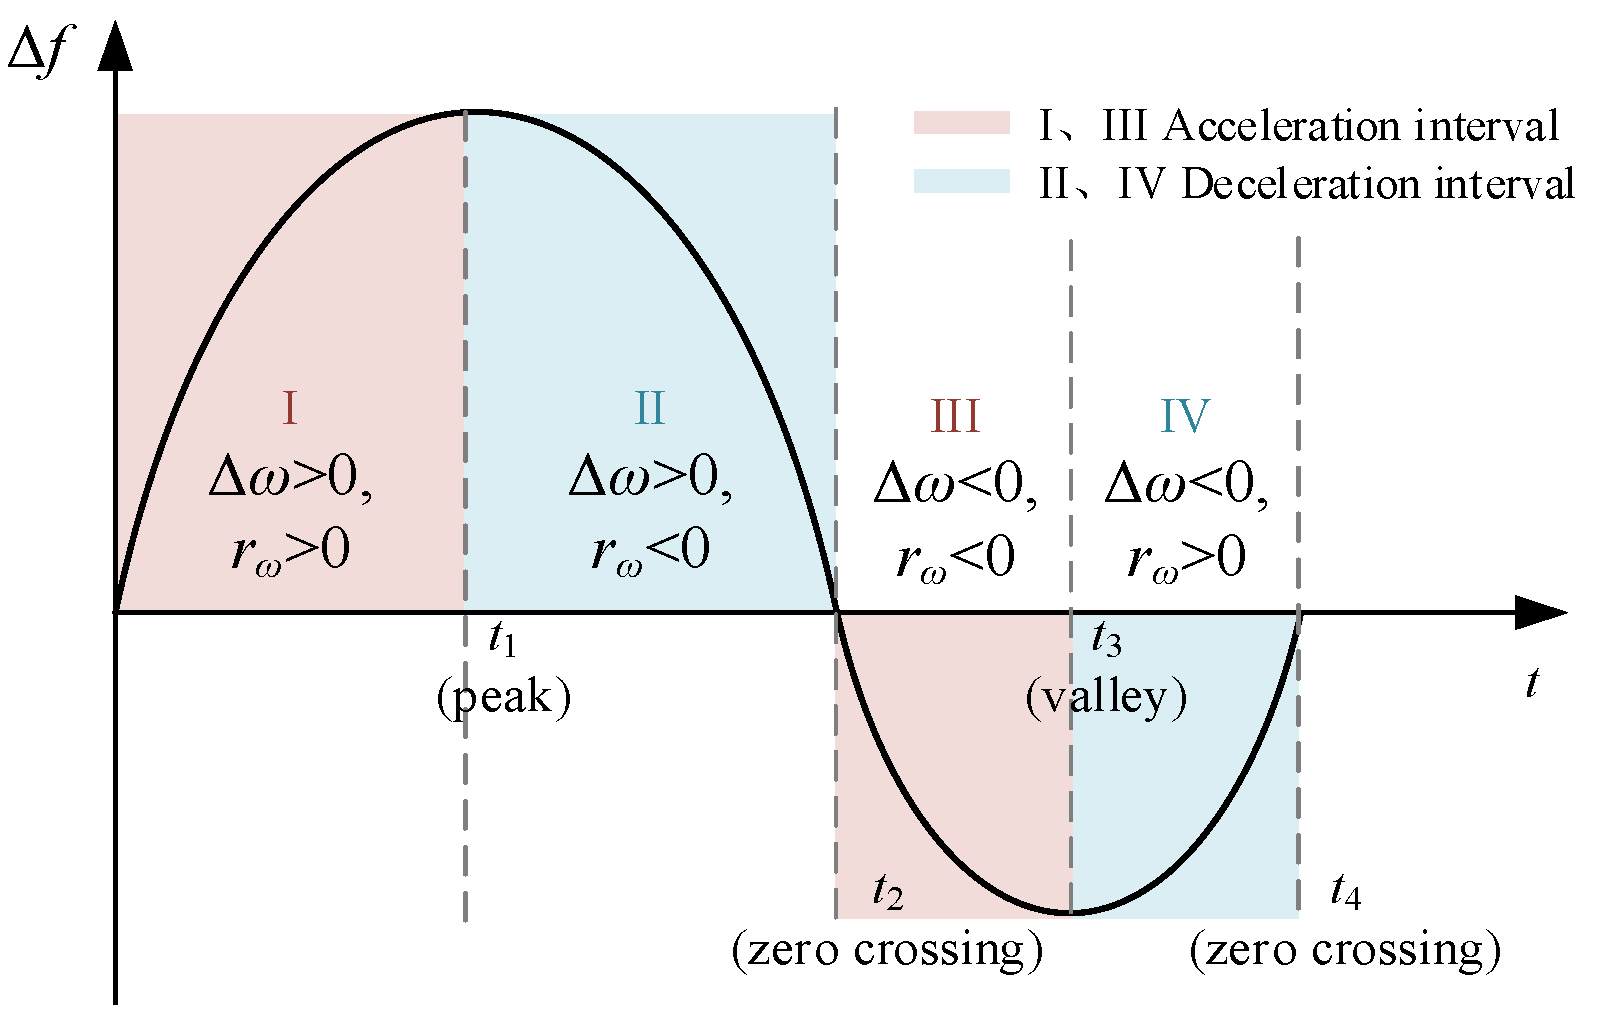
The signs of Δω and rω describe the evolution of the frequency transient. Their relationship can therefore be used to determine the required adjustment directions of the virtual inertia J and damping coefficient D. The frequency response after a disturbance is divided into four representative stages, as illustrated in Figure 3.
Figure 3.
Frequency-response stages and the corresponding coordination requirements for virtual inertia and damping.
During Stage I, the frequency begins to move away from its nominal value. The frequency deviation remains relatively small, whereas the RoCoF is large. A large virtual inertia is required at this stage to oppose the rapid frequency variation. The damping coefficient should also be increased to attenuate the developing frequency excursion.
During Stage II, the frequency continues to move away from the nominal value, but the magnitude of the RoCoF gradually decreases. The frequency approaches its maximum deviation or frequency nadir. The inertia support can therefore be gradually reduced, while sufficient damping should be retained to restrict the maximum frequency deviation.
During Stage III, the frequency starts to return toward its nominal value. The frequency deviation and RoCoF have opposite signs. Maintaining excessive virtual inertia at this stage may oppose the recovery process and increase the settling time. Therefore, the virtual inertia should be reduced, whereas the damping coefficient should remain sufficiently large to suppress oscillations.
During Stage IV, both the frequency deviation and RoCoF become small. The system approaches its normal operating state, and large parameter adjustments are no longer required. The controller outputs should consequently approach their steady-state levels.
In Figure 2, the required inertia adjustment is primarily determined by the RoCoF and the direction of frequency evolution. The damping adjustment is mainly associated with the magnitude of the frequency excursion and the need for oscillation attenuation. This stage-based analysis provides the physical foundation for constructing the fuzzy rule bases.
It should be noted that the stages shown in Figure 2 are used to explain the control mechanism rather than to construct a hard switching controller. The proposed method does not explicitly detect or switch between the four stages. Instead, the Gaussian membership functions provide smooth transitions among the corresponding control actions.
3.2. Asymmetric Gaussian Fuzzy Coordination Controller
3.2.1. Controller Structure
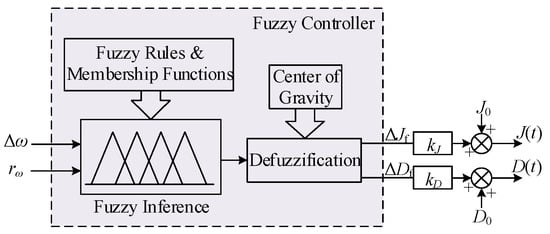
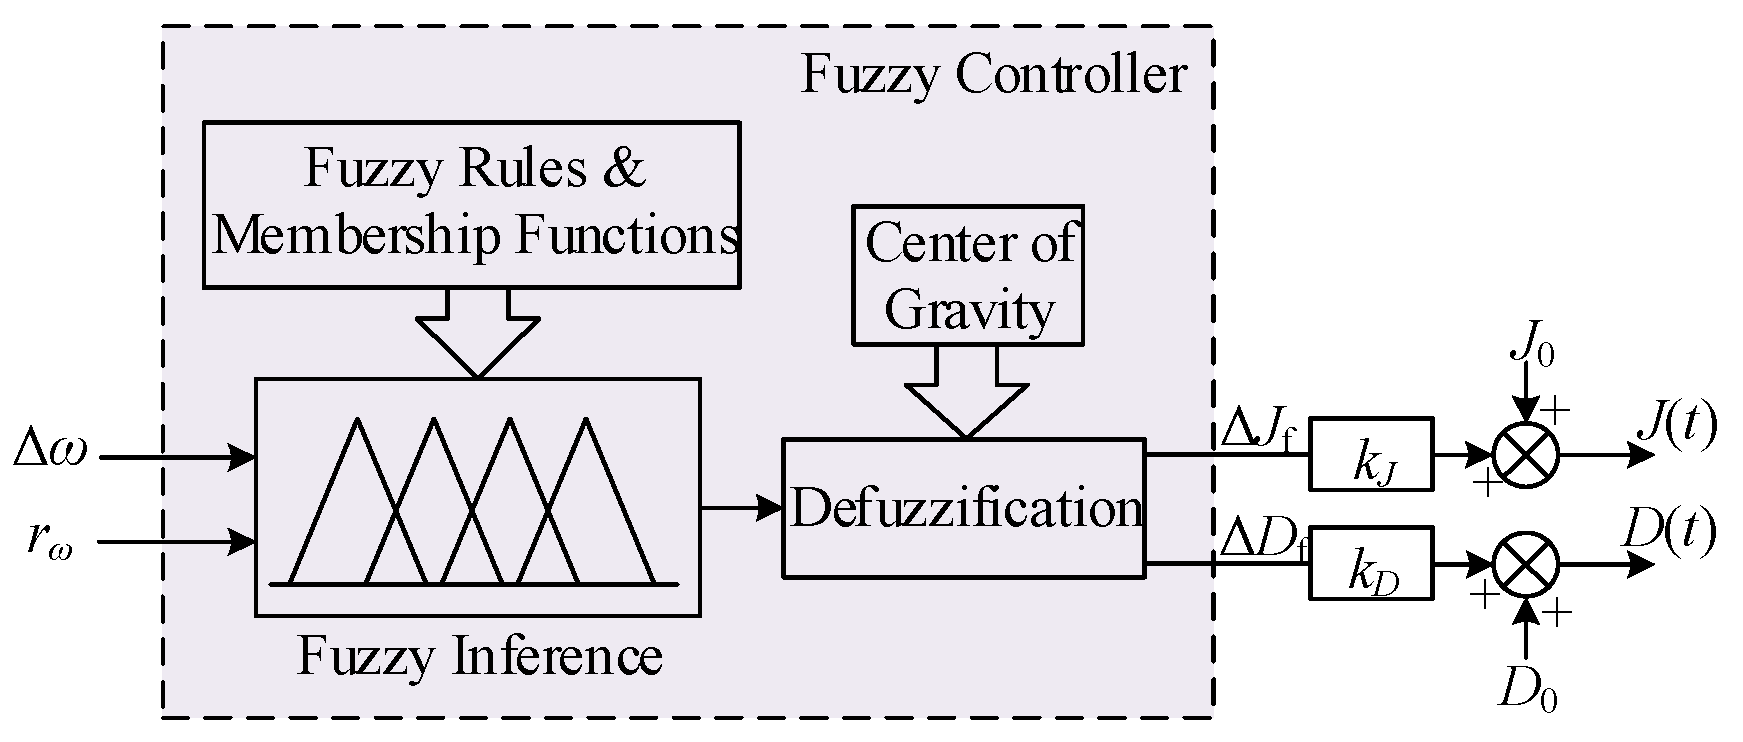
The structure of the proposed asymmetric Gaussian fuzzy controller is shown in Figure 4. The frequency deviation Δω and RoCoF rω are supplied to a two-input–two-output fuzzy inference system. The controller simultaneously produces the normalized inertia adjustment ΔJf and damping adjustment ΔDf.
Figure 4.
Structure of the proposed adaptive inertia and damping controller.
In Figure 4, the measured frequency is first used to calculate Δω and rω. These two variables are fuzzified through the asymmetric Gaussian membership functions. The activated rules are then evaluated using the two coupled rule bases. After centroid defuzzification, the normalized outputs ΔJf and ΔDf are multiplied by the output scaling factors kJ and kD, respectively. The resulting adjustments are added to the initial values J0 and D0 to obtain the time-varying parameters J(t) and D(t).
The controller uses a Mamdani inference structure. The minimum operator is used for rule implication, the maximum operator is applied for rule aggregation, and the centroid method is adopted for defuzzification.
The two input variables and two output variables are described by seven linguistic terms, {NB, NM, NS, ZO, PS, PM, PB}, where NB, NM, NS, ZO, PS, PM, and PB denote negative big, negative medium, negative small, zero, positive small, positive medium, and positive big, respectively.
Unlike two independent single-output fuzzy regulators, the proposed controller calculates ΔJf and ΔDf from the same frequency state. Therefore, the inertia and damping adjustments are coordinated during the complete frequency transient.
3.2.2. Asymmetric Gaussian Membership Functions
A Gaussian membership function is adopted because it provides a smooth and continuously differentiable transition between adjacent linguistic regions. The membership degree of the i-th linguistic variable is given by
where ci is the center of the membership function and σi determines its width.
In a conventional symmetric fuzzy controller, the membership-function centers are usually uniformly distributed, and the membership functions on the positive and negative sides have mirrored parameters. Such a configuration is simple but cannot fully reflect the direction-dependent characteristics of the frequency response.
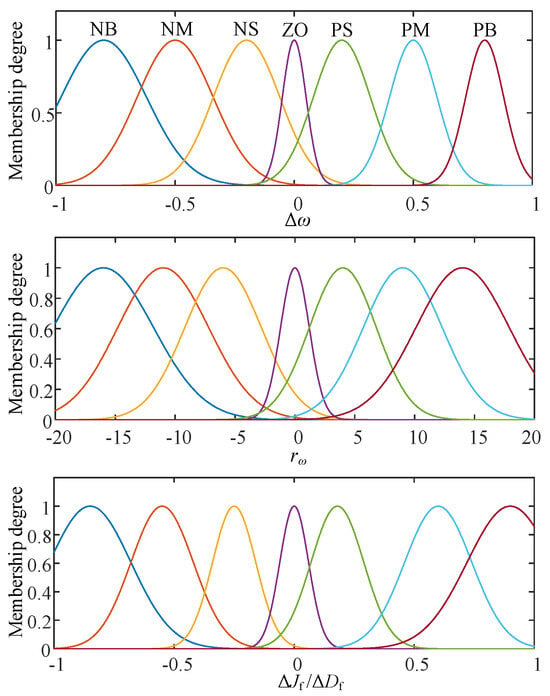
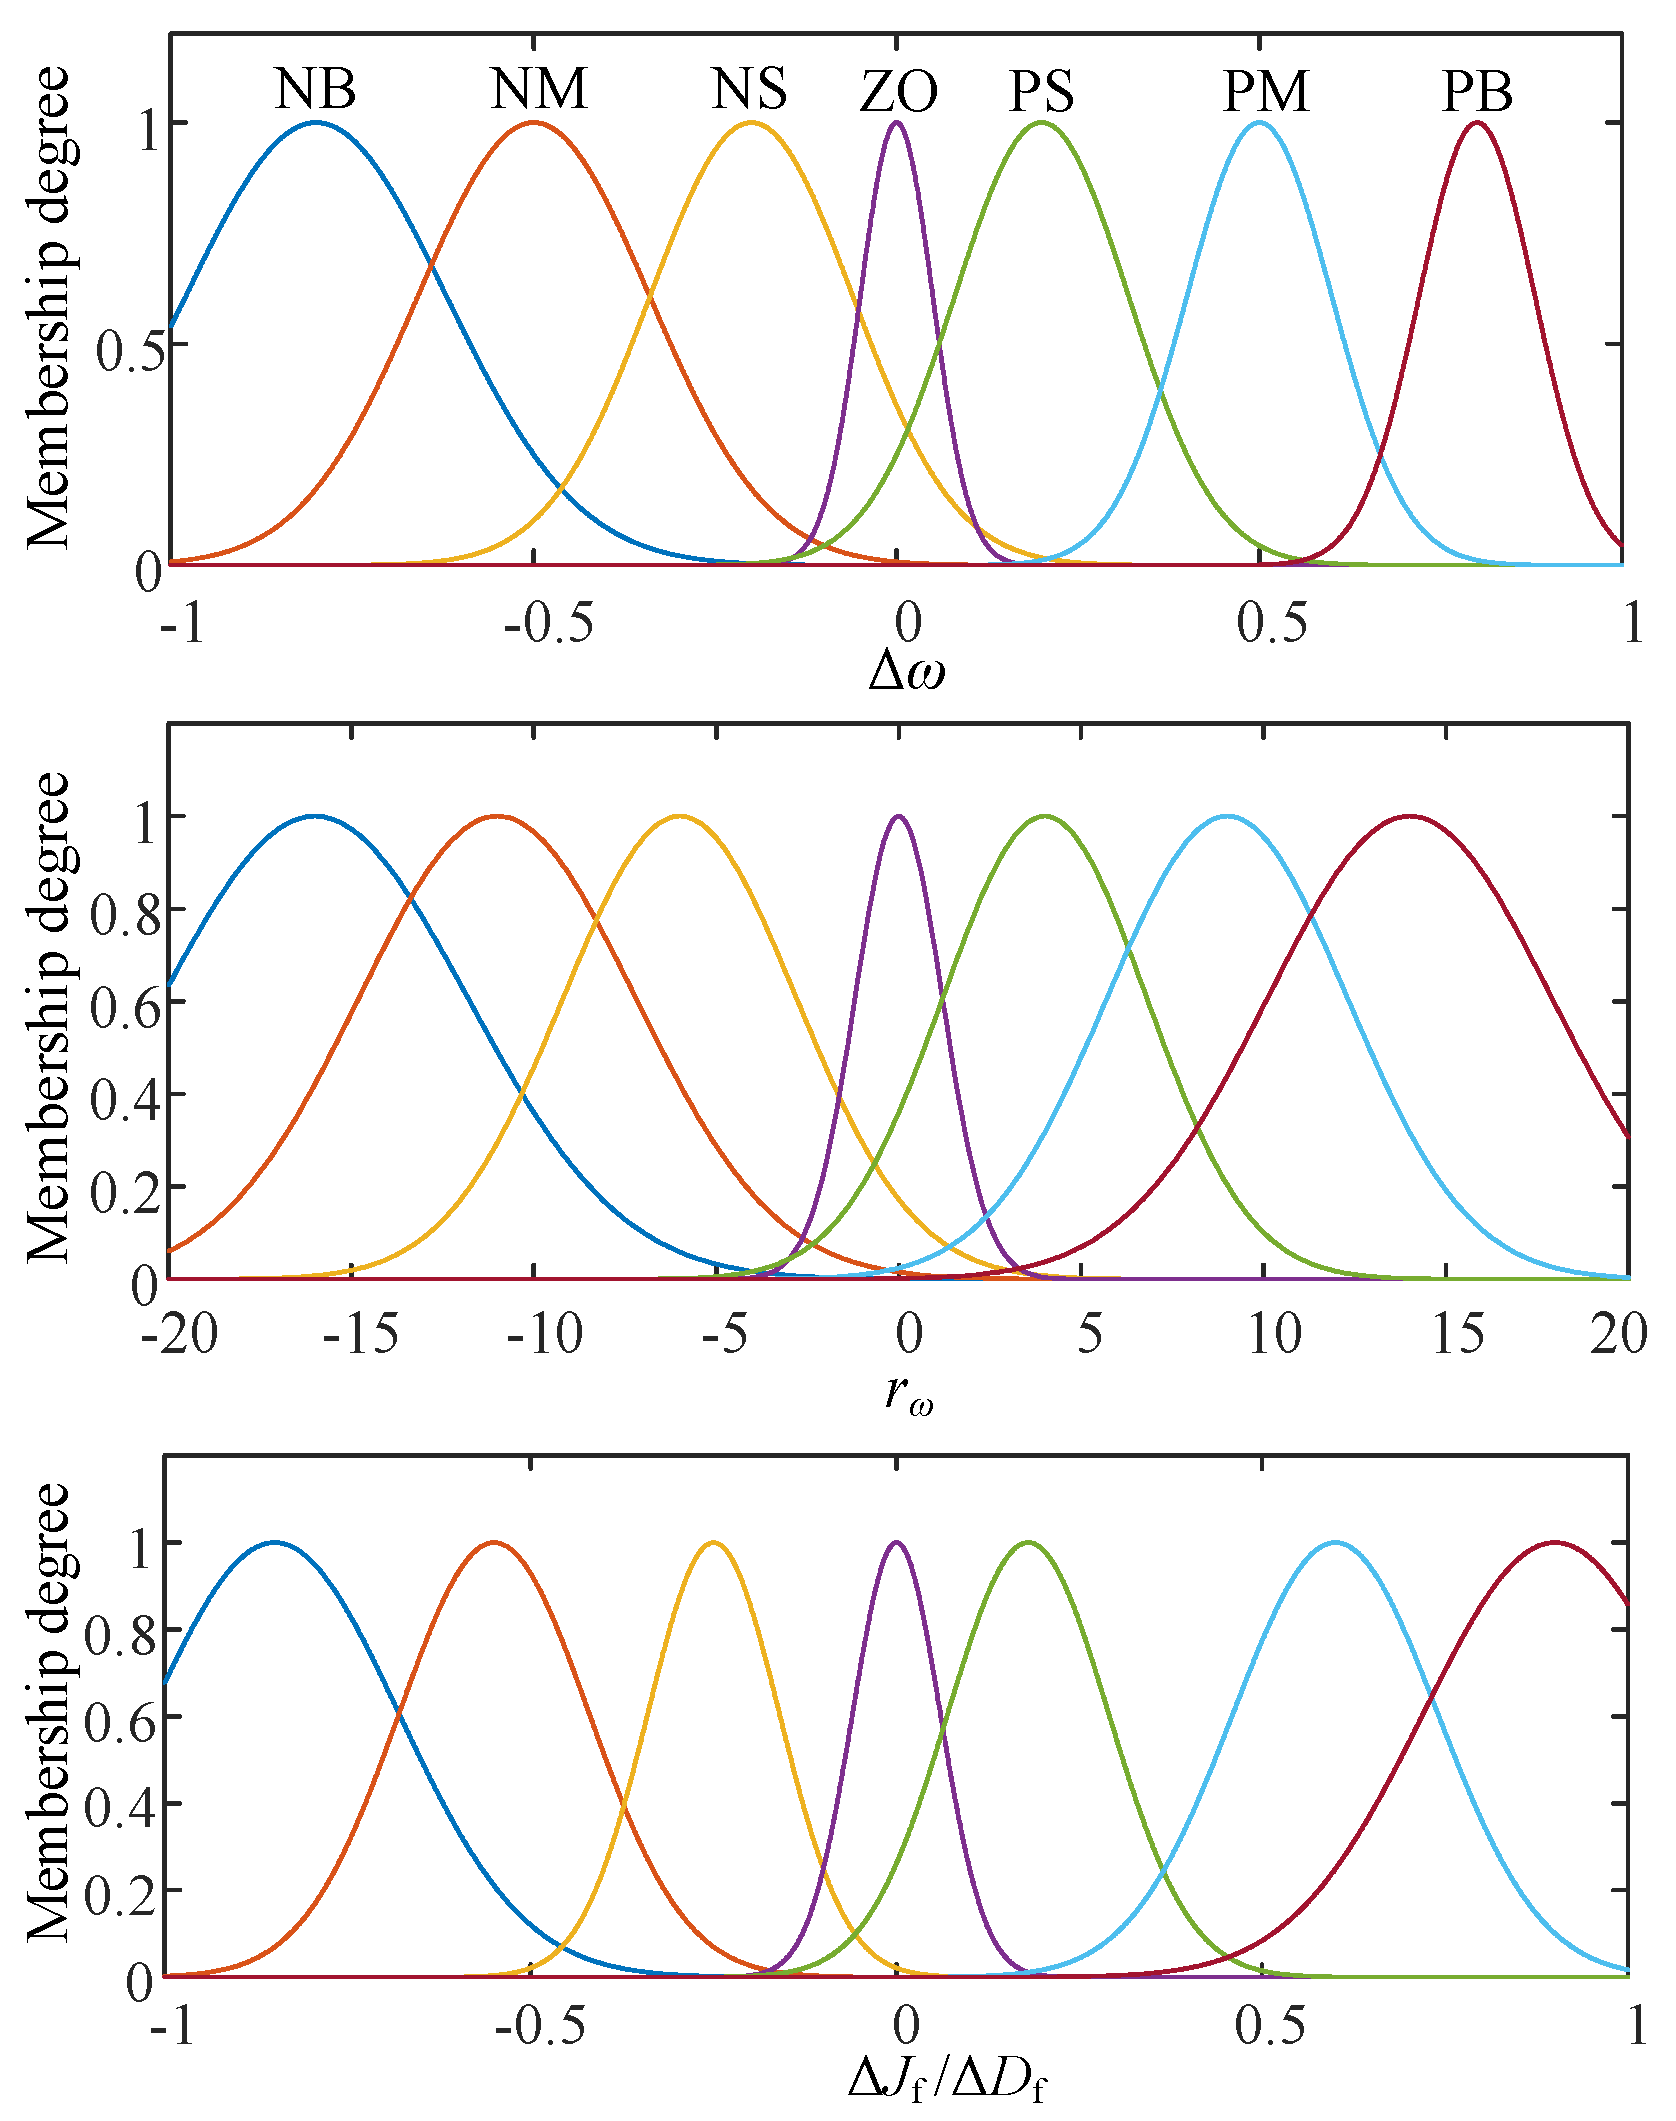
In the proposed controller, the membership-function parameters are determined using a physics-guided offline design procedure rather than an independent numerical optimization algorithm. The design is based on the frequency-evolution characteristics described in Section 3.1. The universes of discourse of Δω and rω are selected to cover the frequency-deviation and RoCoF ranges encountered in the considered transient operating conditions. Within these ranges, the membership-function centers are distributed nonuniformly, with a denser arrangement around the nominal operating point to enhance sensitivity to small frequency variations and larger spacing toward the outer regions to cover severe disturbances. The widths are selected to provide sufficient overlap between adjacent linguistic regions and thus maintain smooth transitions of the fuzzy outputs.
The positive and negative regions are not constrained to be mirror-symmetric. Instead, their centers and widths are specified independently according to the different regulation requirements associated with the magnitude and evolution direction of the frequency response. Relatively narrow membership functions are used around the ZO region to improve the resolution of small frequency variations, whereas wider functions are used toward the NB and PB regions to maintain adequate coverage under larger disturbances. The resulting membership-function distributions are shown in Figure 5, and the corresponding centers and widths are listed in Table 1.
Figure 5.
Asymmetric Gaussian membership-function distributions of the frequency deviation, RoCoF, and fuzzy outputs.
Table 1.
Parameters of the asymmetric Gaussian membership functions.
Although ΔJf and ΔDf use the same output membership-function distributions, they are governed by different rule bases. Therefore, the two parameters exhibit different adjustment characteristics under the same frequency state.
3.2.3. Coupled Fuzzy Rule Design
The fuzzy rules are constructed according to the frequency-response stages described in Section 3.1. Each combination of Δω and rω simultaneously generates an inertia adjustment and a damping adjustment.
A general fuzzy rule can be expressed as follows:
where Am, Bn, Cmn, and Emn denote the corresponding linguistic variables.
If Δω is Am and rω is Bn, then ΔJf is Cmn and ΔDf is Emn,
The rule base for the virtual inertia adjustment is presented in Table 2.
Table 2.
Fuzzy rule base for ΔJf.
When the frequency deviation and RoCoF indicate that the frequency is rapidly moving away from its nominal value, a positive inertia adjustment is generated to suppress the frequency variation. When the frequency begins to recover, the inertia adjustment is reduced or becomes negative to prevent a large inertia from delaying frequency restoration.
The rule base for the damping adjustment is presented in Table 3.
Table 3.
Fuzzy rule base for ΔDf.
The damping adjustment remains relatively large when either the frequency excursion or the RoCoF is large. This regulation strategy improves oscillation attenuation and limits the maximum frequency deviation. Near the nominal operating point, the damping adjustment decreases to avoid unnecessary control action.
For each activated rule, the firing strength is calculated by
The activated output membership functions are aggregated using the maximum operator. The centroid method is subsequently used to obtain the normalized crisp outputs:
where μJ(z) and μD(z) are the aggregated output membership functions, and ΩJ and ΩD are the corresponding output domains.
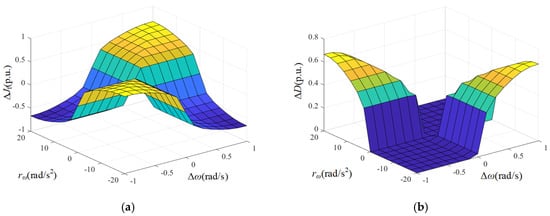
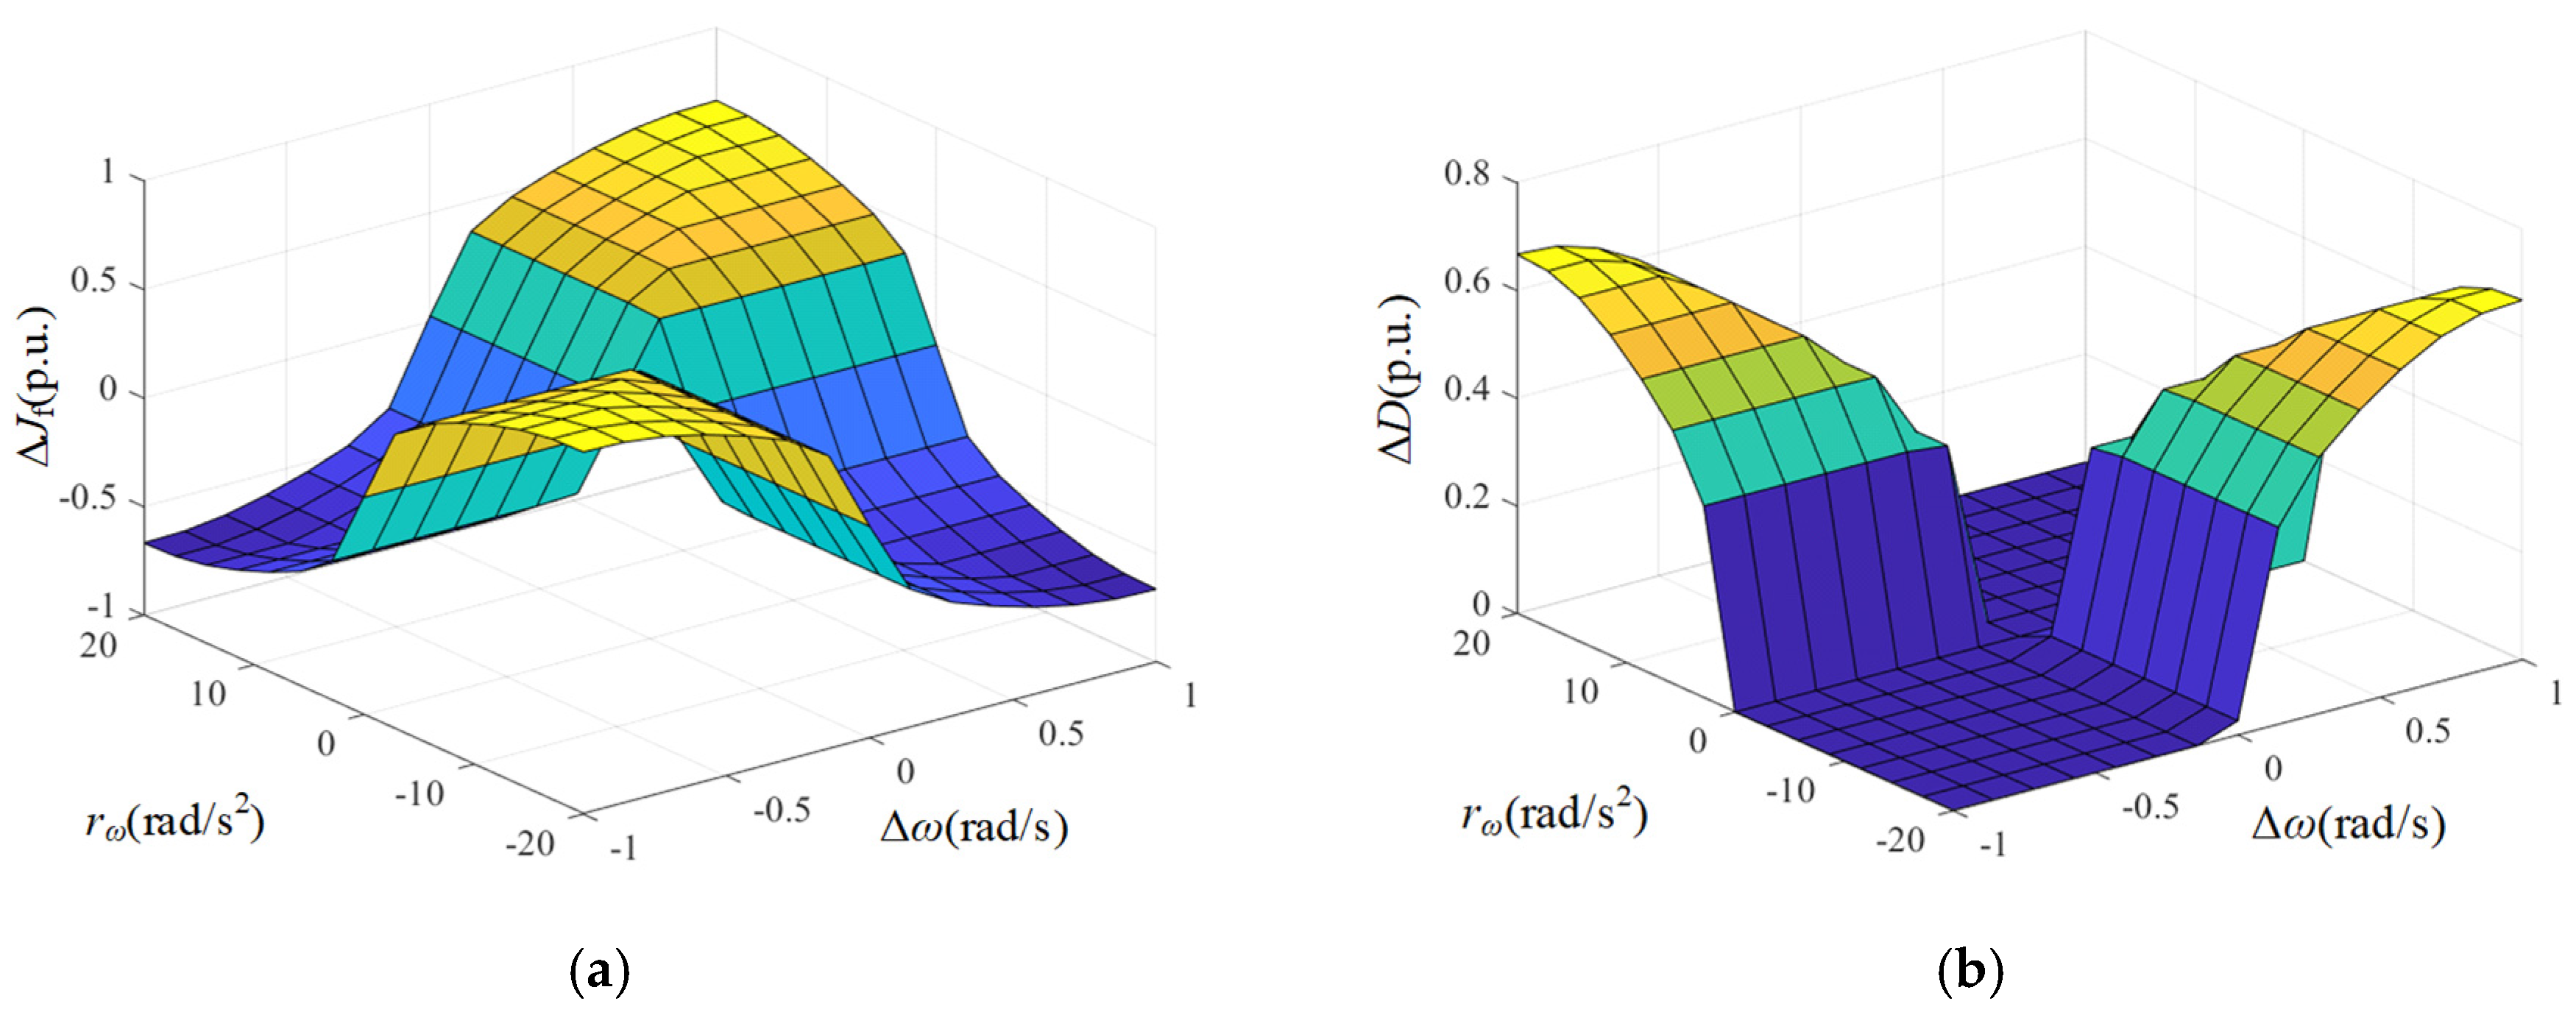
The obtained fuzzy-control surfaces should be presented in Figure 6.
Figure 6.
Fuzzy output surfaces of the normalized virtual inertia and damping adjustments: (a) ΔJf; (b) ΔDf.
The nonlinear surfaces in Figure 5 reflect the coupled relationship among the frequency deviation, RoCoF, virtual inertia adjustment, and damping adjustment. The smooth variation in the surfaces also demonstrates that the Gaussian membership functions prevent abrupt parameter switching.
3.2.4. Selection of kJ and kD
The fuzzy outputs ΔJf and ΔDf are normalized quantities and therefore cannot be directly regarded as the actual virtual inertia and damping coefficients. The output scaling factors kJ and kD are introduced to convert these normalized outputs into physical parameter adjustments:
where J0 and D0 are the initial virtual inertia and damping coefficients, respectively. The scaling factors determine the adjustment ranges and sensitivity of the adaptive controller. A large kJ provides stronger inertial support but may produce excessive inertia and delay frequency recovery, whereas increasing kD improves oscillation attenuation but may cause larger converter power variations. The two scaling factors should therefore provide sufficient transient support while maintaining positive and practically acceptable values of J(t) and D(t).
The extrema of ΔJf and ΔDf are not independently prescribed. They are jointly determined by the asymmetric Gaussian membership functions, fuzzy rule bases, inference operators, and centroid defuzzification. To determine their attainable limits, the complete input domains specified in Table 1 are evaluated on a dense two-dimensional grid. At each combination of Δω and rω, the two fuzzy outputs are calculated using the adopted Mamdani inference system. The minimum and maximum values of the resulting output surfaces are then obtained as
Although the output universes of discourse are defined as [−1,1], the defuzzified outputs do not necessarily reach these boundaries. Their attainable extrema depend on the overlap among the output membership functions and the simultaneous activation of multiple fuzzy rules. The full-domain evaluation of the proposed fuzzy controller gives
For specified initial values and scaling factors, the corresponding physical parameter ranges can be calculated from
The output scaling factors kJ and kD should be selected by considering both the attainable ranges of the adaptive parameters and their influence on the transient frequency response. According to (21) and (22), the scaling factors must maintain positive and practically acceptable values of J(t) and D(t) over the complete fuzzy input domain. For the parameter set J0 = 5, D0 = 15, kJ = 5, and kD = 10, the corresponding ranges are 1.04 ≤ J(t) ≤ 9.07 and 16.17 ≤ D(t) ≤ 23.13, indicating that both adaptive parameters remain within acceptable bounds.
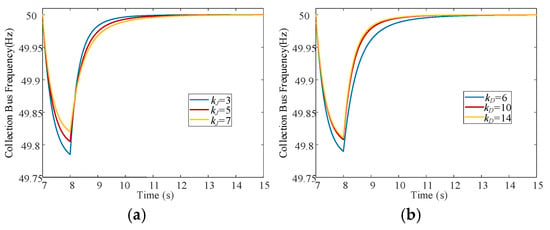
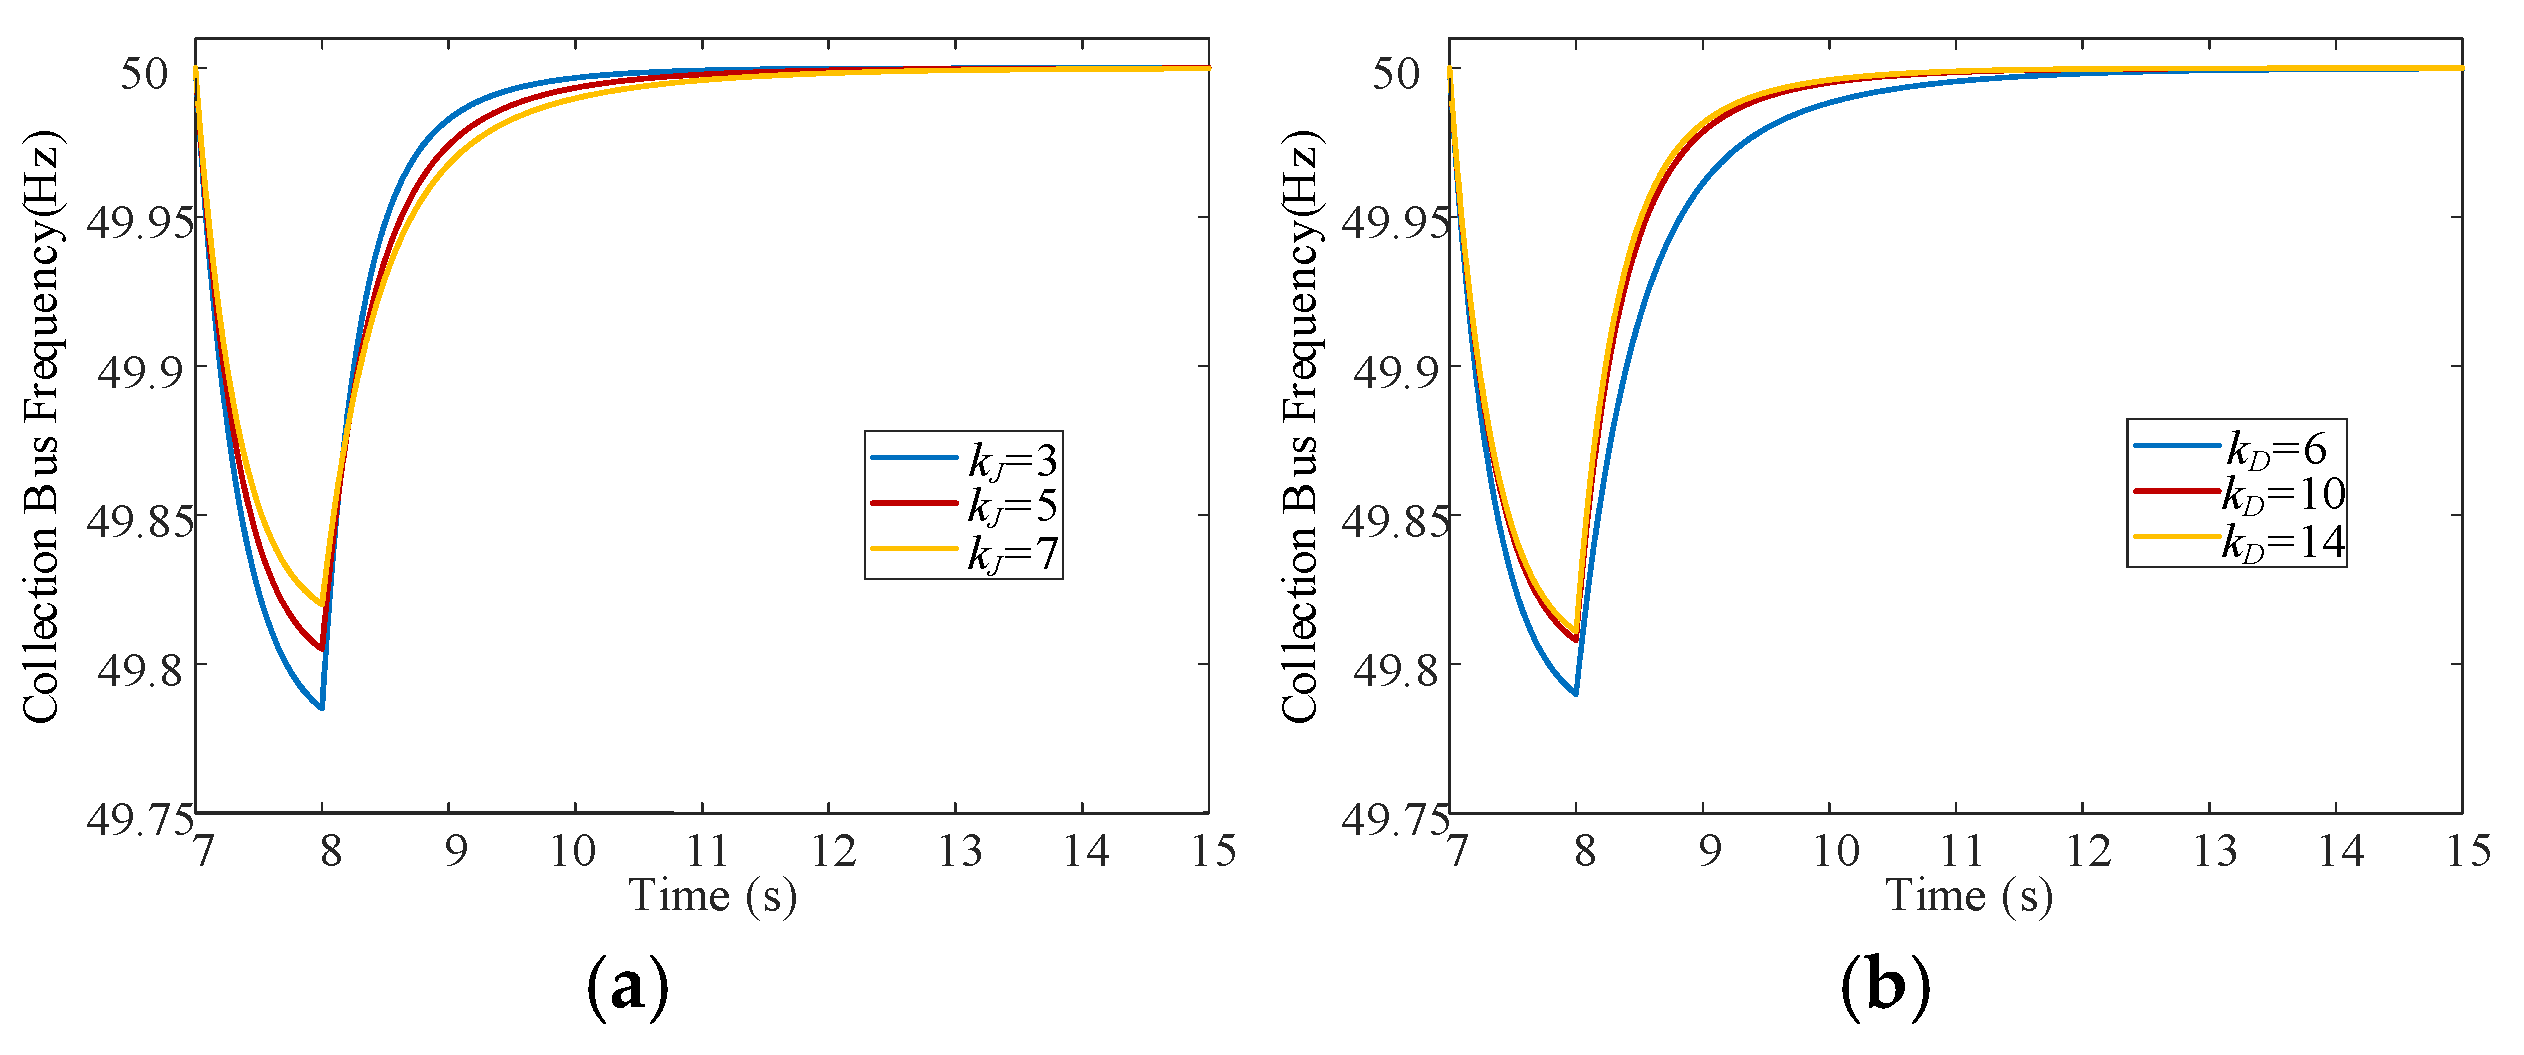
To further examine the dynamic influence of the two scaling factors, a one-factor-at-a-time sensitivity analysis is conducted using the synchronous wind–PV power disturbance in Section 4.1 as the representative operating condition. When evaluating kJ, kD is fixed at its nominal value of 10 and kJ is varied among 3, 5, and 7. Similarly, when evaluating kD, kJ is fixed at 5 and kD is varied among 6, 10, and 14. The corresponding collection-bus frequency responses are shown in Figure 7.
Figure 7.
Sensitivity of the collection-bus frequency response to the output scaling factors: (a) varia-tion of kJ with kD = 10; (b) variation in kD with kJ = 5.
As shown in Figure 7a, increasing kJ improves the frequency nadir during the initial power deficit because a larger inertia scaling factor produces a stronger virtual-inertia adjustment. However, the subsequent frequency restoration becomes slower as kJ increases. This behavior is consistent with the dominant-frequency analysis in Section 2.2, where a larger virtual inertia suppresses the initial frequency variation but may delay the subsequent recovery. Therefore, a relatively small kJ provides insufficient transient frequency support, whereas an excessively large kJ prolongs the recovery process. The value kJ = 5 is therefore selected as a compromise between frequency-support capability and recovery speed.
Figure 7b shows that increasing kD from 6 to 10 produces a clear improvement in both the frequency nadir and the subsequent restoration process. A further increase from 10 to 14 yields only a limited additional improvement, indicating the diminishing sensitivity of the frequency response to kD at higher values. Since an excessively large kD may also lead to larger converter power variations, as discussed above, kD = 10 is selected to provide sufficient damping support without unnecessarily increasing the control effort.
Based on the attainable parameter ranges and the above sensitivity analysis, kJ = 5 and kD = 10 are adopted for the proposed controller. These values are used unchanged in all subsequent simulation cases, without case-dependent retuning.
3.3. Stability Considerations
To investigate the influence of the time-varying parameters, the dominant frequency dynamics derived in Section 2 can be written as
where
Here, x1 represents the small-signal power-angle deviation, x2 represents its derivative, ΔPeq is the equivalent disturbance, and Kδ and Kω are the equivalent synchronizing and damping coefficients, respectively.
Consider the following Lyapunov candidate:
Because J(t) > 0 and Kδ, V is positive definite. Differentiating (26) along the trajectories of (23) and (24) gives
For the disturbance-free system, a sufficient condition for the non-increase in V is
Equation (28) indicates that the virtual inertia should not increase excessively rapidly relative to the available equivalent damping. According to (18),
If the rate of variation in the fuzzy inertia output is bounded by
a conservative sufficient condition can be expressed as
where Deq,min is the minimum equivalent damping coefficient over the considered operating range.
The damping scaling factor kD does not introduce an additional parameter-derivative term into (27). Its primary requirements are to maintain positive equivalent damping and prevent excessive control action. As shown in Section 3.2.4, the adopted damping rule base and kD maintain D(t) > 0 over the complete fuzzy input domain. The adaptive damping therefore contributes positively to the dissipation term in (27).
The above analysis provides a sufficient stability condition for the reduced dominant-frequency model rather than a global stability proof for the complete nonlinear MMC-HVDC system. The reduced-order model is intended to characterize the dominant active-power-frequency dynamics and to provide a physically interpretable condition for the time-varying inertia and damping parameters. In the complete system, additional dynamics associated with the wind and PV converters, PLLs, MMC inner and outer control loops, internal capacitor-energy dynamics, and the DC link may introduce higher-order interactions that are not explicitly represented in the analytical condition. Therefore, the condition derived above should be interpreted as a sufficient design guideline for the dominant frequency mode, rather than as a rigorous stability guarantee for all states of the full-order system.
The applicability of the proposed controller to the complete nonlinear model is therefore assessed through the detailed time-domain simulations presented in Section 4.
4. Simulation Results and Analysis
A detailed wind–PV MMC-HVDC collection system is established in MATLAB/Simulink R2024b to evaluate the proposed control strategy. The simulation model retains the wind and PV converters, phase-locked loops, MMC inner and outer control loops, AC collection network, submodule capacitors, arm inductors, and DC-link dynamics. The sending-end MMC operates under VSG control and establishes the voltage and frequency of the collection-side AC bus, whereas the receiving-end MMC regulates the DC-link voltage and transfers the collected renewable power to the receiving-end AC system.
The proposed asymmetric Gaussian fuzzy coordination method is compared with conventional VSG control using fixed virtual inertia and damping and with the adaptive control method reported in Ref. [14], and the fuzzy adaptive VSG method reported in ref. [19]. The initial virtual inertia and damping coefficients are J0 = 5 and D0 = 15, respectively, while the output scaling factors of the proposed controller are kJ = 5 and kD = 10. The same controller parameters are used in all cases without case-dependent retuning. The main simulation parameters are listed in Table 4.
Table 4.
Main parameters of the simulated wind–PV MMC-HVDC system.
The maximum frequency deviation (MFD), maximum absolute RoCoF, and recovery time are adopted as the principal performance indices. The MFD is defined as the maximum absolute difference between the measured frequency and its nominal value. The recovery time is measured from the disturbance instant until the frequency returns to and remains within the prescribed neighborhood of the nominal frequency.
Three representative cases are considered to investigate the controller performance under synchronous, asynchronous, and complementary wind–PV power variations. The corresponding electrical responses and an additional set of 20 randomized disturbance tests are subsequently examined to evaluate the operating constraints and robustness of the proposed method.
4.1. Case 1: Synchronous Wind–PV Power Decrease
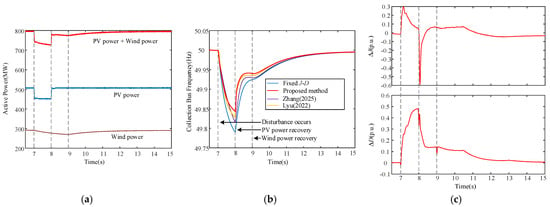
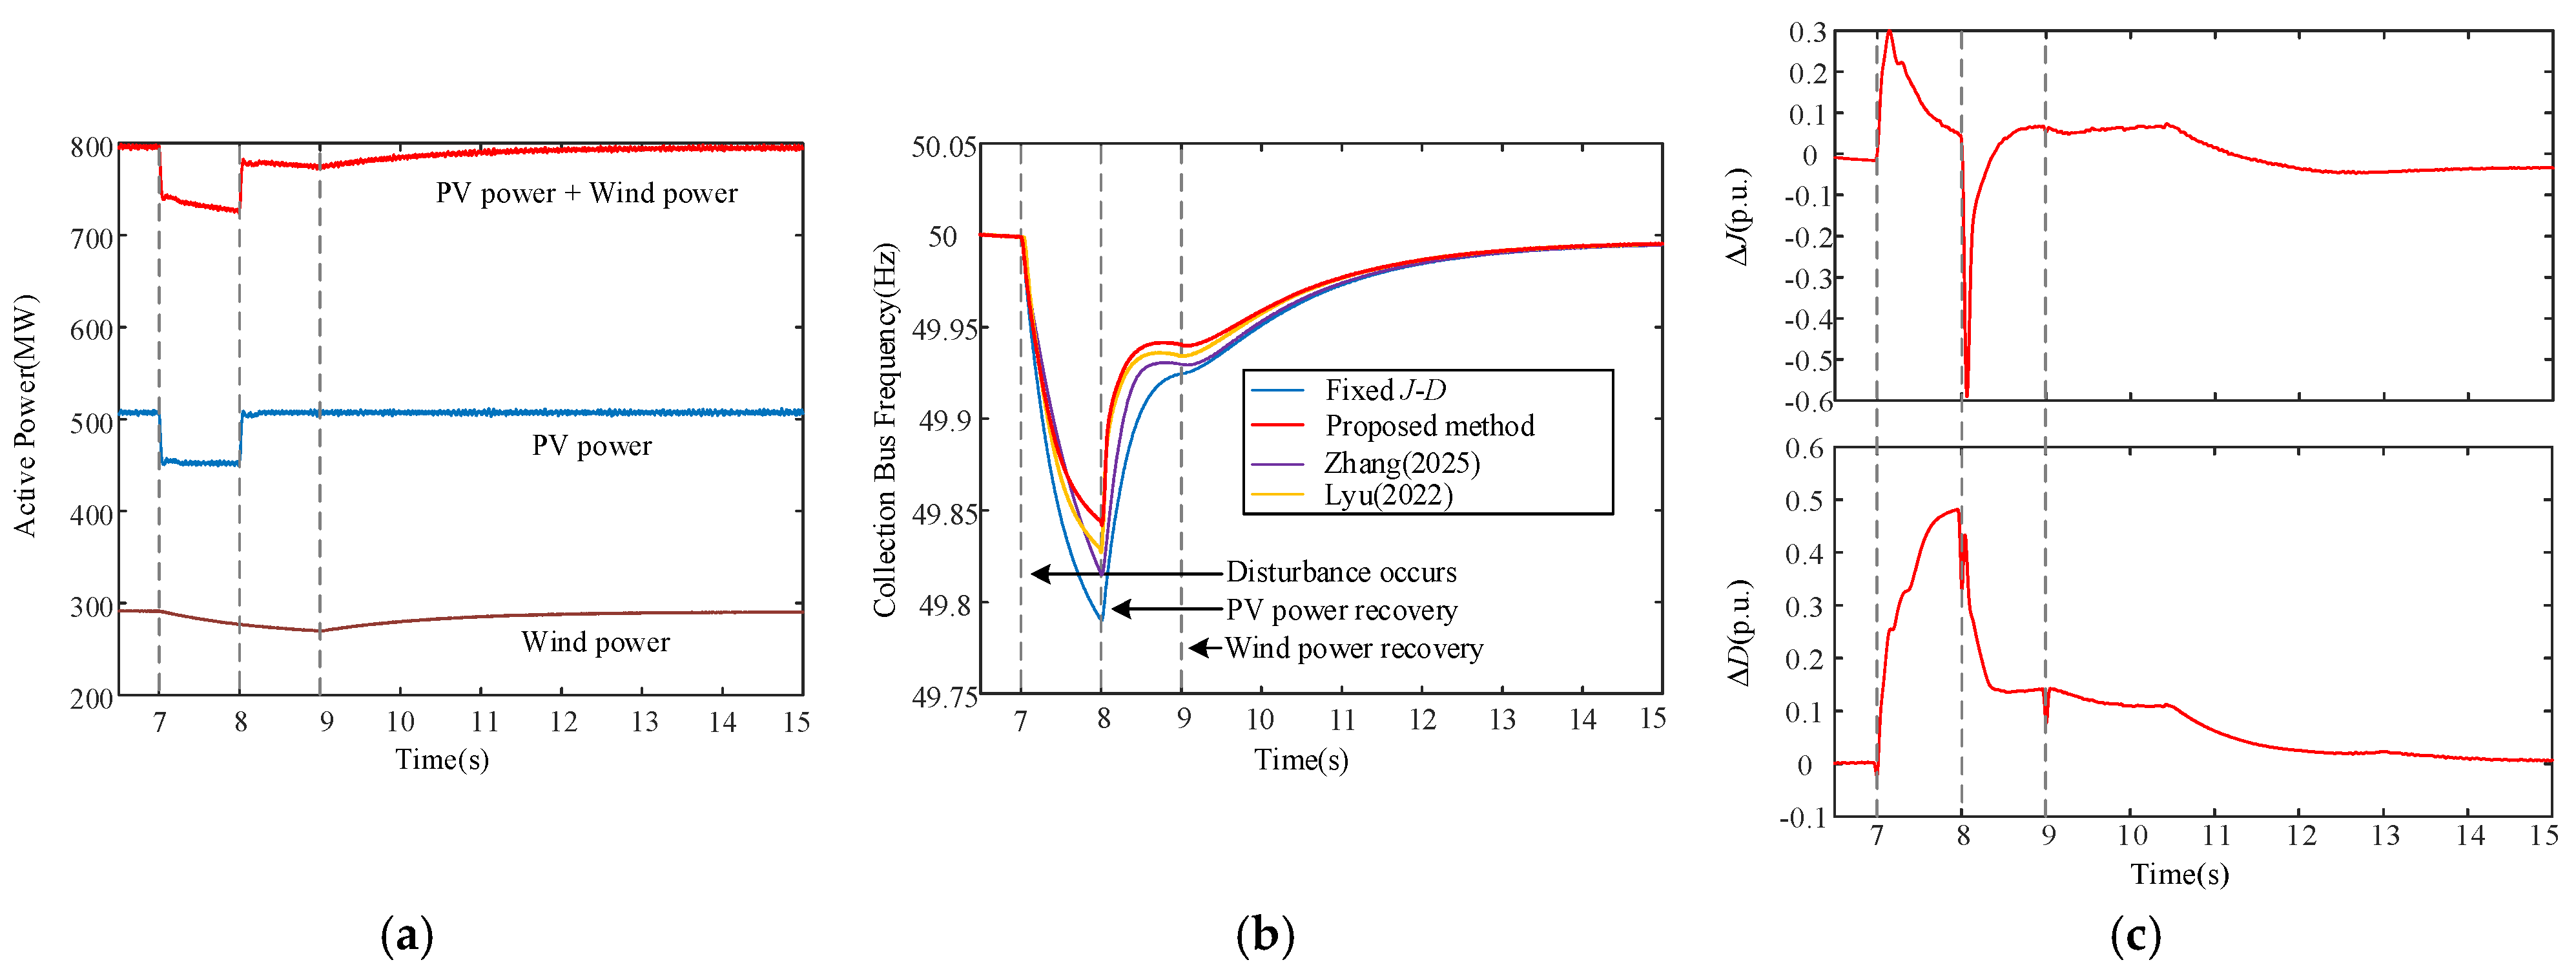
In Case 1, the wind and PV outputs decrease simultaneously at t = 7 s, producing an abrupt active-power deficit at the sending-end collection bus. The renewable power begins to recover at t = 8 s. This case represents an operating condition in which similar meteorological variations affect the two renewable sources during the same period.
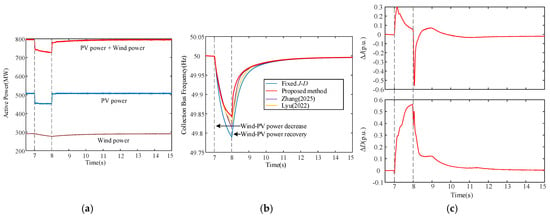
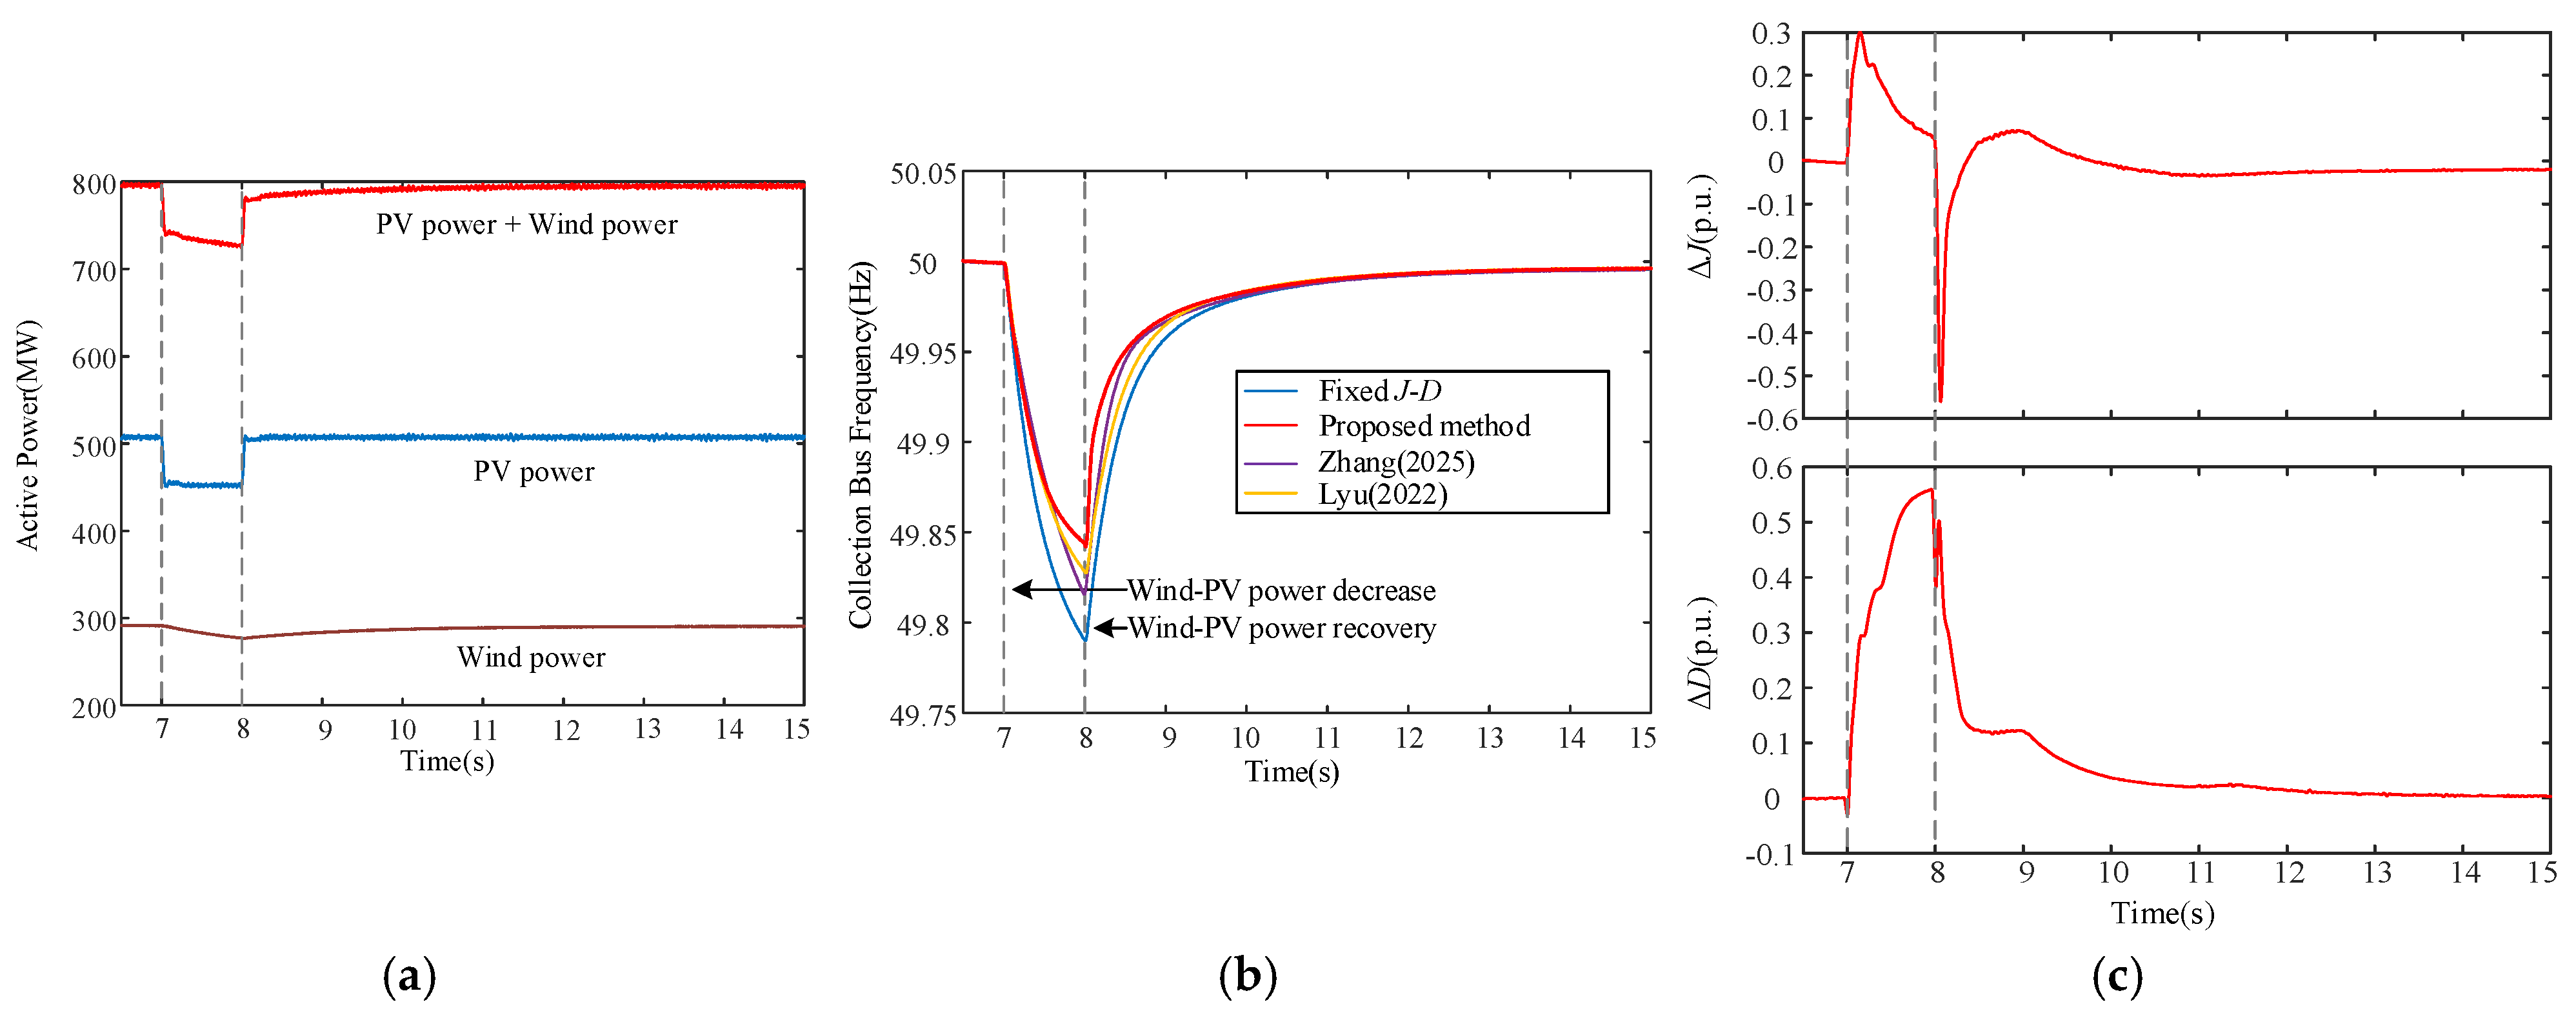
The active-power, frequency, and adaptive-parameter responses are shown in Figure 8. As shown in Figure 8a, the simultaneous reduction in wind and PV generation causes the aggregated renewable power to decrease rapidly. The resulting active-power deficit leads to a frequency decline at the collection bus. As shown in Figure 8b, the simultaneous reduction in wind and PV generation causes a rapid decrease in the collection-bus frequency. The fixed J-D controller produces the deepest frequency nadir of approximately 49.79 Hz, corresponding to an MFD of approximately 0.21 Hz. Ref. [14] improves the nadir to approximately 49.82 Hz, while the fuzzy adaptive method in ref. [19] further raises it to approximately 49.83 Hz. The proposed method achieves the highest frequency nadir of approximately 49.85 Hz and limits the MFD to approximately 0.15 Hz.
Figure 8.
Dynamic responses under a synchronous wind–PV power decrease: (a) wind, PV, and aggregated renewable power; (b) collection-bus frequency under different control methods, including the methods reported in Refs. [14,19]; (c) normalized inertia and damping adjustments of the proposed method.
The maximum absolute RoCoF values obtained with the fixed J-D, refs. [14,19], and proposed methods are approximately 0.29, 0.25, 0.23, and 0.21 Hz/s, respectively. The corresponding frequency recovery times are approximately 4.5, 4.0, 3.7, and 3.4 s. Thus, although both adaptive benchmark methods improve the transient response compared with the fixed-parameter controller, the proposed method provides a further reduction in the initial frequency variation and a faster restoration toward the nominal frequency.
The parameter trajectories in Figure 8c explain this improvement. Immediately after the renewable-power reduction, the proposed controller increases the virtual inertia to suppress the initial RoCoF while simultaneously increasing the damping support to limit the frequency excursion. When renewable generation begins to recover, the inertia adjustment is reduced to avoid delaying frequency restoration, while sufficient damping is retained during the remaining transient process.
4.2. Case 2: Asynchronous Wind–PV Power Recovery
In Case 2, wind and PV generation initially decrease simultaneously at t = 7 s. PV generation recovers at t = 8 s, whereas the recovery of wind generation is delayed. Consequently, the aggregated renewable power undergoes multistage recovery rather than immediately returning to its initial value. This case is used to evaluate the controller under different recovery rates of wind and PV generation.
The corresponding dynamic responses are presented in Figure 9. As shown in Figure 9a, the early recovery of PV generation only partially compensates for the renewable power deficit because wind generation remains below its initial level. The frequency response therefore contains multiple deterioration and recovery stages.
Figure 9.
Dynamic responses under a asynchronous wind–PV power decrease: (a) wind, PV, and aggregated renewable power; (b) collection-bus frequency under different control methods, including the methods reported in Refs. [14,19]; (c) normalized inertia and damping adjustments of the proposed method.
As shown in Figure 9b, the asynchronous recovery of wind and PV generation produces a multistage frequency response. The fixed J-D controller exhibits the deepest frequency nadir of approximately 49.79 Hz. Ref. [14] improves the nadir to approximately 49.82 Hz, while ref. [19] further increases it to approximately 49.83 Hz. The proposed method achieves a nadir of approximately 49.84 Hz and limits the MFD to approximately 0.16 Hz.
The maximum absolute RoCoF values obtained with the fixed J-D, refs. [14,19], and proposed methods are approximately 0.28, 0.25, 0.23, and 0.21 Hz/s, respectively. Their corresponding recovery times are approximately 4.7, 4.2, 4.0, and 3.7 s. After PV generation recovers at t = 8 s, all adaptive methods mitigate the remaining frequency deviation while wind generation is still below its initial level. The proposed method maintains a slightly higher frequency during this intermediate stage and provides the fastest final restoration after the delayed wind-power recovery.
As shown in Figure 9c, the inertia and damping adjustments increase rapidly following the initial power reduction. When PV generation begins to recover, the proposed controller modifies the two parameters according to the changed frequency deviation and RoCoF. The inertia adjustment is progressively reduced to avoid delaying the multistage restoration, while sufficient damping is maintained until the delayed wind-power recovery is completed.
4.3. Case 3: Complementary Wind–PV Disturbance
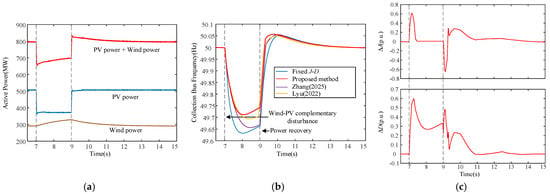
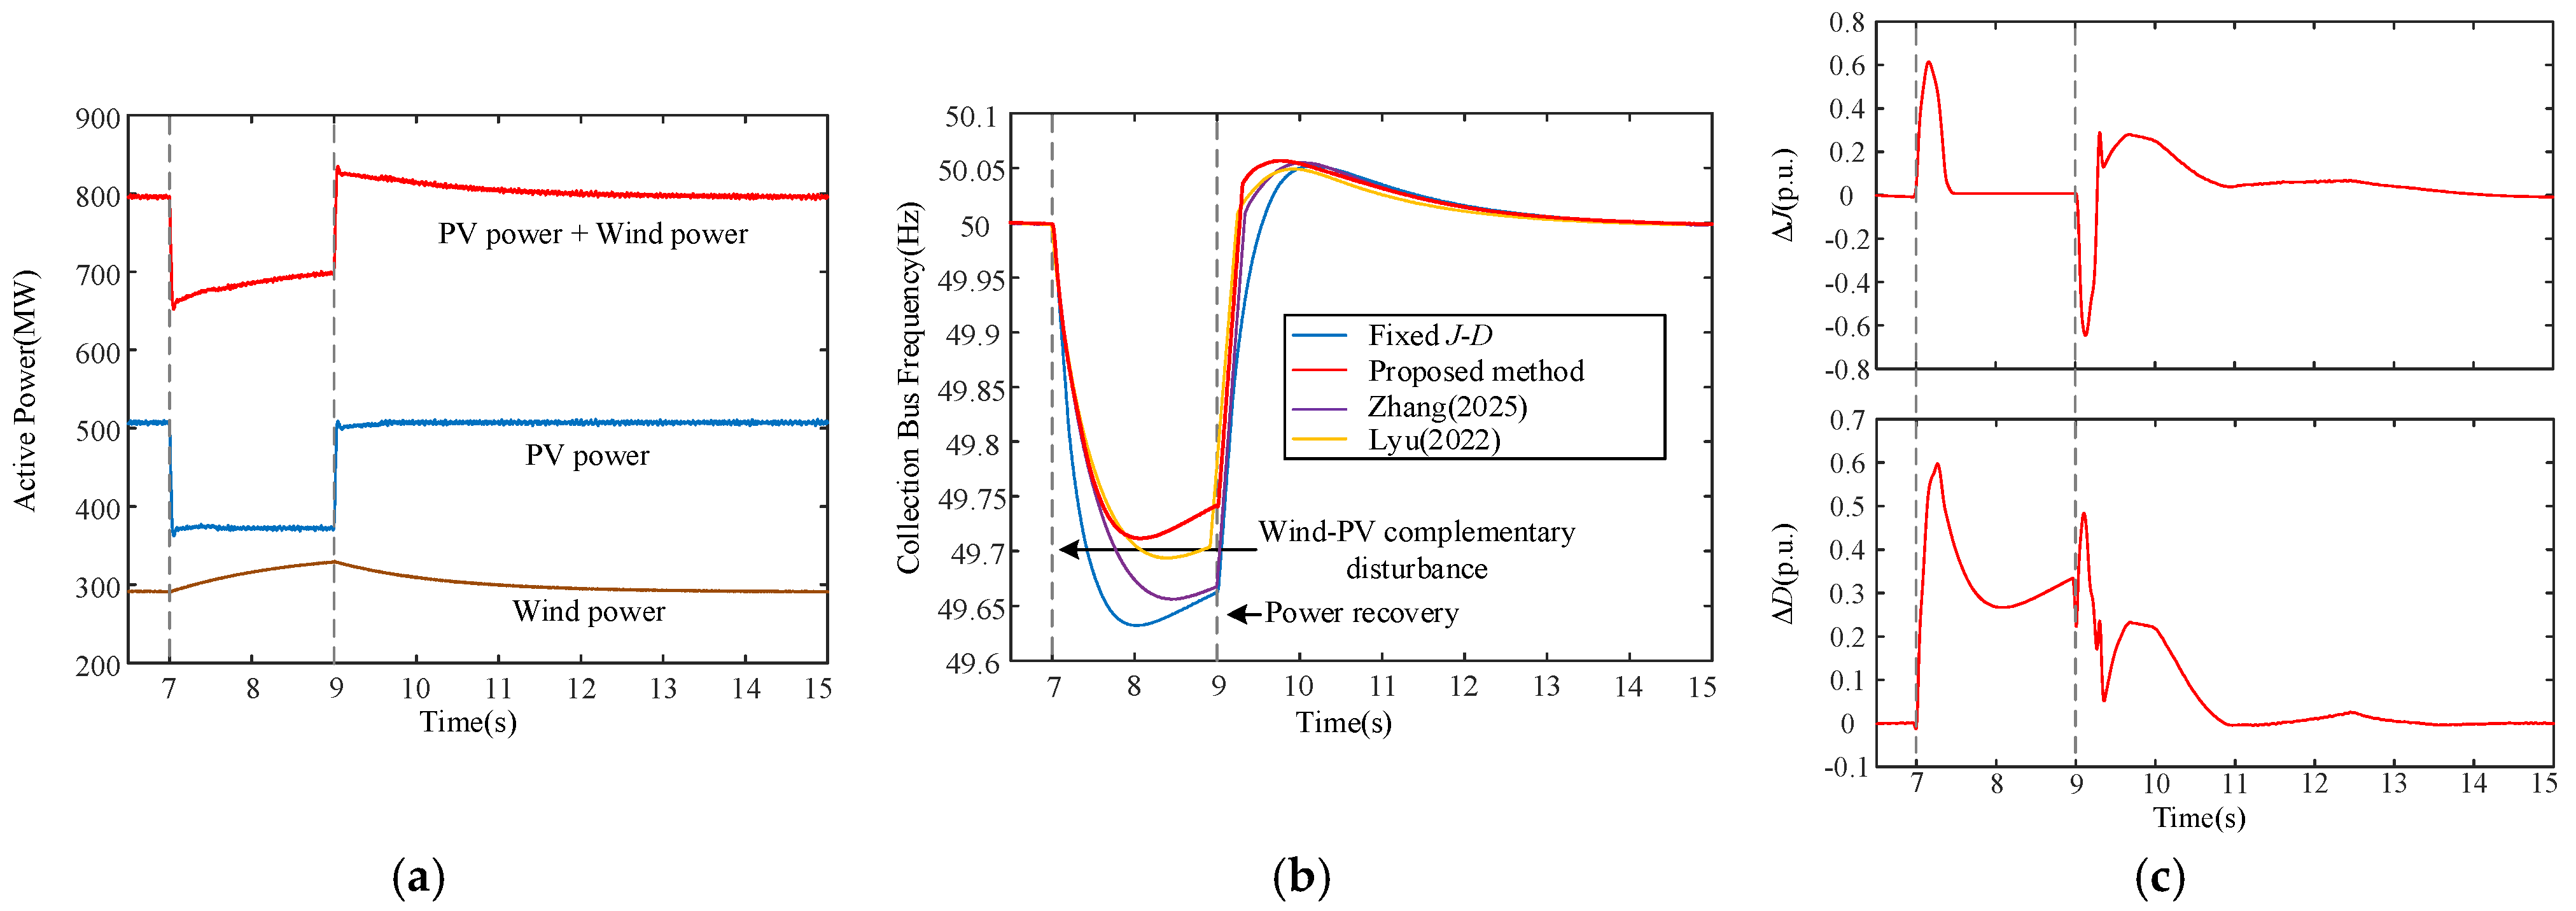
Case 3 considers a complementary disturbance in which PV generation decreases while wind generation increases. Although the changes in the two renewable sources partially compensate for each other, their magnitudes and recovery instants are different. The aggregated renewable power therefore undergoes a pronounced multistage variation. The initial disturbance occurs at t = 7 s, and the subsequent power transition occurs at approximately t = 9 s.
The corresponding dynamic responses are shown in Figure 10. Compared with Cases 1 and 2, the complementary disturbance produces a larger and more complex frequency excursion. As shown in Figure 10b, the fixed J-D controller reaches the lowest frequency nadir of approximately 49.64 Hz, corresponding to an MFD of approximately 0.36 Hz. Ref. [14] improves the frequency nadir to approximately 49.66 Hz and reduces the MFD to approximately 0.34 Hz, while the fuzzy adaptive method in ref. [19] further increases the nadir to approximately 49.69 Hz and limits the MFD to approximately 0.31 Hz. The proposed method achieves the highest frequency nadir of approximately 49.71 Hz, corresponding to an MFD of approximately 0.29 Hz.
Figure 10.
Dynamic responses under a complementary wind–PV disturbance: (a) wind, PV, and aggregated renewable power; (b) collection-bus frequency under different control methods, including the methods reported in Refs. [14,19]; (c) normalized inertia and damping adjustments of the proposed method.
The maximum absolute RoCoF values obtained with the fixed J-D, refs. [14,19], and proposed methods are approximately 0.67, 0.60, 0.52, and 0.43 Hz/s, respectively. Thus, both existing adaptive methods improve the initial frequency response compared with the fixed-parameter controller, while the proposed method provides a further reduction in the rate of frequency variation under the complementary power disturbance.
The corresponding frequency recovery times are approximately 4.0, 3.8, 3.6, and 3.3 s, respectively. After the subsequent power transition at approximately t = 9 s, the collection-bus frequency rises temporarily above its nominal value before gradually returning to the steady-state operating point. The proposed method provides the fastest overall restoration among the four control strategies while maintaining a well-damped frequency response during the secondary transition.
The adaptive parameter responses in Figure 10c exhibit more pronounced variations than those observed in Cases 1 and 2, which is consistent with the stronger multistage characteristics and the changing direction of the power imbalance. During the initial frequency deterioration, the proposed controller increases the virtual inertia and damping support to suppress RoCoF and limit the frequency excursion. As the frequency begins to recover, the inertia adjustment is subsequently reduced to avoid delaying restoration, while sufficient damping is retained to suppress the remaining transient oscillations. This stage-dependent coordination limits the frequency nadir and facilitates rapid recovery under the complementary wind–PV disturbance.
The principal frequency-response indices obtained in the three cases are summarized in Table 5.
Table 5.
Comparison of frequency-response performance under the three cases.
The results in Table 5 show that all three adaptive control methods improve the frequency response compared with the fixed J-D controller, while the proposed method consistently provides the highest frequency nadir, the lowest maximum RoCoF, and the shortest recovery time under all three disturbance patterns. Ref. [19] also exhibits better overall frequency regulation than ref. [14], confirming the effectiveness of fuzzy adaptation for VSG parameter regulation. Nevertheless, the proposed asymmetric coordination strategy retains an additional performance advantage, particularly under the complementary disturbance in Case 3, where the direction of the renewable-power imbalance changes during the transient process. These results indicate that explicitly coordinating inertia and damping according to the frequency-evolution state is beneficial under both simple and multistage wind–PV disturbances.
4.4. Robustness and Noise-Sensitivity Validation
To further evaluate the robustness of the proposed controller, 20 randomized wind–PV disturbance tests are performed. For each test, the magnitudes and recovery instants of the wind- and PV-power variations are independently randomized within ranges consistent with the three representative cases. Specifically, the wind-power variation is sampled within approximately −0.25 to +0.15 p.u., while the PV-power variation is sampled within approximately −0.30 to 0 p.u. relative to their respective pre-disturbance operating points. The initial disturbance occurs at t = 7 s, and the recovery or subsequent transition instants are independently varied within 8.0–9.0 s. Uniform random sampling is adopted for the disturbance magnitudes and transition instants. The controller parameters, membership functions, fuzzy rule bases, and output scaling factors are kept unchanged in all randomized tests.
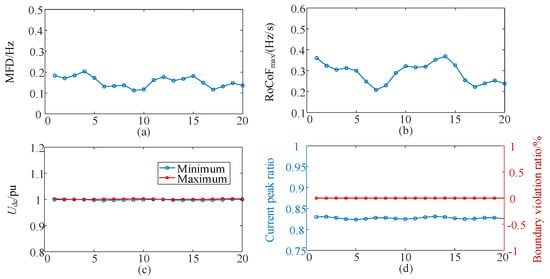
As shown in Figure 11a, the MFD varies within approximately 0.11–0.20 Hz across the 20 randomized tests, while Figure 11b shows that the maximum absolute RoCoF remains within approximately 0.20–0.37 Hz/s. Although the disturbance magnitudes and recovery processes differ among the tests, no abrupt deterioration is observed in either frequency-response index. To provide a more quantitative assessment, the mean, minimum, maximum, and standard deviation of the MFD, maximum absolute RoCoF, and recovery time are summarized in Table 6.
Figure 11.
Performance of the proposed controller in 20 randomized wind–PV disturbance tests: (a) maximum frequency deviation; (b) maximum absolute RoCoF; (c) minimum and maximum DC-link voltages; (d) converter-current peak ratio and boundary violation ratio.
Table 6.
Statistical summary of frequency-response performance under 20 randomized disturbance tests.
The statistical results further confirm the consistency of the frequency response under randomized wind–PV power variations. The MFD has a mean value of approximately 0.153 Hz with a standard deviation of 0.026 Hz, while the maximum absolute RoCoF has a mean value of approximately 0.284 Hz/s with a standard deviation of 0.050 Hz/s. The recovery time ranges from approximately 3.20 to 3.80 s, with a mean value of 3.47 s and a standard deviation of 0.17 s. The relatively limited dispersion of these indices indicates that the proposed controller maintains similar frequency-support performance across the considered randomized disturbance conditions.
Figure 11c shows that the minimum and maximum DC-link voltages remain close to 1 p.u. throughout the randomized tests. The limited voltage variation indicates that the adaptive frequency-support action does not introduce an excessive energy imbalance into the HVDC link.
As shown in Figure 11d, the converter-current peak ratio remains below unity in all tests, while the boundary violation ratio remains zero. Thus, none of the randomized disturbances causes converter overcurrent or violation of the monitored operating limits.
Together with the three representative cases, the randomized tests demonstrate that the proposed controller maintains stable frequency-support performance while satisfying the considered electrical operating constraints under different wind–PV power variations. Moreover, the same controller parameters are retained for all tests without prior identification of the disturbance type or case-dependent retuning, supporting the applicability of the proposed method to uncertain renewable-power operating conditions.
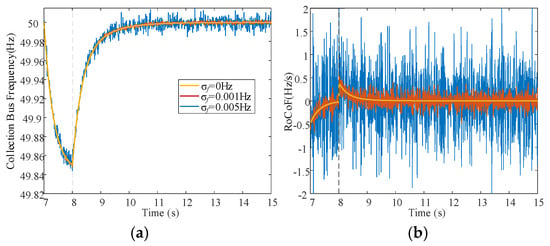
Because the RoCoF input is obtained from the derivative of the measured frequency, measurement noise may be amplified by the differentiation process. To evaluate the sensitivity of the proposed controller to this effect, additional simulations are performed by superimposing zero-mean Gaussian noise on the measured frequency signal. Three representative noise levels, with standard deviations of σf = 0, 0.001, and 0.005 Hz, are considered. The controller structure, membership functions, rule bases, scaling factors, and sampling interval are kept unchanged in all tests. The corresponding collection-bus frequency and RoCoF responses are shown in Figure 12.
Figure 12.
Frequency and RoCoF responses under different frequency-measurement noise levels: (a) collection-bus frequency; (b) RoCoF.
As shown in Figure 12a, the collection-bus frequency responses under the three noise levels remain close to each other throughout the disturbance and recovery process. The frequency nadir and the overall restoration trajectory are only slightly affected as the measurement-noise level increases. This indicates that the proposed adaptive controller retains its principal frequency-support behavior under the considered measurement perturbations.
In contrast, Figure 12b shows that the RoCoF signal becomes increasingly oscillatory as the measurement-noise level increases. This behavior results from the derivative operation, which amplifies the high-frequency components contained in the measured frequency signal. Nevertheless, the underlying transient trend of the RoCoF remains identifiable, and the increased measurement fluctuations do not lead to an evident deterioration of the collection-bus frequency response within the considered noise range.
5. Conclusions
This paper proposes an asymmetric Gaussian fuzzy method for the coordinated regulation of virtual inertia and damping in a VSG-controlled wind–PV MMC-HVDC collection system. The main conclusions are as follows.
- (1)
- The proposed controller adjusts virtual inertia and damping according to the frequency deviation and RoCoF. The asymmetric Gaussian membership functions distinguish between frequency deterioration and recovery, thereby coordinating RoCoF suppression, oscillation damping, and frequency restoration
- (2)
- Under three representative wind–PV disturbance cases, the proposed method provides a higher frequency nadir, a lower RoCoF, and a shorter recovery time than the comparative methods. Compared with fixed J-D control, the maximum frequency deviation is reduced by 19.4–28.6%, and the recovery time is shortened by 17.5–24.4%
- (3)
- The AC voltage, AC current, and DC-link voltage remain within acceptable ranges. The 20 randomized tests show consistent frequency performance without current or voltage-limit violations, demonstrating robustness to uncertain wind–PV power variations.
Author Contributions
Conceptualization, L.W., R.L. and R.S.; methodology, L.W. and R.L.; software, L.W.; validation, L.W., R.L., Y.D. and W.Y.; formal analysis, L.W. and R.L.; investigation, L.W., Y.D. and W.Y.; resources, R.L., Y.D., W.Y., R.S. and L.Q.; data curation, L.W.; writing—original draft preparation, L.W.; writing—review and editing, R.L., Y.D., W.Y., R.S. and L.Q.; visualization, L.W.; supervision, R.S. and L.Q.; project administration, L.Q.; funding acquisition, L.Q. All authors have read and agreed to the published version of the manuscript.
Funding
This research was funded by China Yangtze Power Co., Ltd., grant number ZSF2502001. The APC was funded by the same grant.
Data Availability Statement
The data supporting the findings of this study are available from the corresponding author upon reasonable request. The data are not publicly available due to intellectual property considerations and their continued use in ongoing research.
Acknowledgments
All technical content, results, and conclusions were independently verified by the authors, who take full responsibility for the publication.
Conflicts of Interest
Authors Lei Wang and Rui Lyu was employed by China Yangtze Power Co., Ltd. Authors Youhan Deng and Weiwei Yao were employed by China Three Gorges Corporation. Their scientific contributions are described in the Author Contributions Section. The remaining authors declare no conflicts of interest. All authors were informed of and agreed to the submission and publication of this manuscript. The authors declare that this study received funding from China Yangtze Power Co., Ltd. The funder had no role in the decision to publish the results.
Abbreviations
The following abbreviations are used in this manuscript:
| AC | Alternating current |
| DC | Direct current |
| GFL | Grid-following |
| HVDC | High-voltage direct current |
| MFD | Maximum frequency deviation |
| MMC | Modular multilevel converter |
| VSG | Virtual synchronous generator |
| PLL | Phase-locked loop |
| RoCoF | Rate of change of frequency |
| PV | Photovoltaic |
| J | Virtual inertia coefficient |
| D | Virtual damping coefficient |
| J0 | Initial virtual inertia coefficient |
| D0 | Initial virtual damping coefficient |
| ω | Measured angular frequency |
| ω0 | Nominal angular frequency |
| Δω | Angular-frequency deviation of the collection bus |
| rω | Rate of change of angular frequency |
| ΔPm | Equivalent input-power variation |
| ΔPMMC,ac | Variation in the AC-side active power of the sending-end MMC |
| ΔPeq | Equivalent power imbalance |
| Vdc | DC-link voltage |
| Cdc | Equivalent DC capacitance |
| ΔJf | Normalized fuzzy output for virtual-inertia adjustment |
| ΔDf | Normalized fuzzy output for damping adjustment |
| kJ | Output scaling factor for virtual inertia |
| kD | Output scaling factor for damping |
References
- Gu, Y.; Green, T.C. Power system stability with a high penetration of inverter-based resources. Proc. IEEE 2023, 111, 832–853. [Google Scholar] [CrossRef] [Scilit]
- He, C.; He, X.; Geng, H.; Sun, H.; Xu, S. Transient stability of low-inertia power systems with inverter-based generation. IEEE Trans. Energy Convers. 2022, 37, 2903–2912. [Google Scholar] [CrossRef] [Scilit]
- Carrasco, J.M.; Franquelo, L.G.; Bialasiewicz, J.T.; Galván, E.; Portillo Guisado, R.C.; Prats, M.A.M.; León, J.I.; Moreno-Alfonso, N. Power-electronic systems for the grid integration of renewable energy sources: A survey. IEEE Trans. Ind. Electron. 2006, 53, 1002–1016. [Google Scholar] [CrossRef] [Scilit]
- Delille, G.; François, B.; Malarange, G. Dynamic frequency control support by energy storage to reduce the impact of wind and solar generation on isolated power system’s inertia. IEEE Trans. Sustain. Energy 2012, 3, 931–939. [Google Scholar] [CrossRef] [Scilit]
- Zhang, H.; Xiang, W.; Lin, W.; Wen, J. Grid-forming converters in renewable energy sources dominated power grid: Control strategy, stability, application, and challenges. J. Mod. Power Syst. Clean Energy 2021, 9, 1239–1256. [Google Scholar] [CrossRef] [Scilit]
- Rathnayake, D.B.; Akrami, M.; Phurailatpam, C.; Me, S.P.; Hadavi, S.; Jayasinghe, G.; Zabihi, S.; Bahrani, B. Grid-forming inverter modeling, control, and applications. IEEE Access 2021, 9, 114781–114807. [Google Scholar] [CrossRef] [Scilit]
- Lin, J.; Liu, S.; Wang, G. Performance improvement of VSG dynamic frequency considering DC-side voltage stability. CSEE J. Power Energy Syst. 2026, 12, 864–877. [Google Scholar] [CrossRef] [Scilit]
- Yang, Y.; Wu, Z.; Quan, X.; Hu, Q.; Huang, R.; Li, M.; Hu, W. Impact of VSC-ESS with VSG control of SSR on nearby synchronous machine. CSEE J. Power Energy Syst. 2026, 12, 1411–1420. [Google Scholar] [CrossRef] [Scilit]
- Cheema, K.M. A comprehensive review of virtual synchronous generator. Int. J. Electr. Power Energy Syst. 2020, 120, 106006. [Google Scholar] [CrossRef] [Scilit]
- D’Arco, S.; Suul, J.A.; Fosso, O.B. Small-signal modeling and parametric sensitivity of a virtual synchronous machine in islanded operation. Int. J. Electr. Power Energy Syst. 2015, 72, 3–15. [Google Scholar] [CrossRef] [Scilit]
- Soni, N.; Doolla, S.; Chandorkar, M.C. Improvement of transient response in microgrids using virtual inertia. IEEE Trans. Power Deliv. 2013, 28, 1830–1838. [Google Scholar] [CrossRef] [Scilit]
- Alipoor, J.; Miura, Y.; Ise, T. Power system stabilization using virtual synchronous generator with alternating moment of inertia. IEEE J. Emerg. Sel. Top. Power Electron. 2015, 3, 451–458. [Google Scholar] [CrossRef] [Scilit]
- Xiong, X.; Wu, C.; Cheng, P.; Blaabjerg, F. An optimal damping design of virtual synchronous generators for transient stability enhancement. IEEE Trans. Power Electron. 2021, 36, 11026–11030. [Google Scholar] [CrossRef] [Scilit]
- Zhang, H.; Zhu, H.; Zhang, Z.; Gong, X. Adaptive inertia control for virtual synchronous generators to enhance response performance of a wind-solar-storage combined power generation system. CSEE J. Power Energy Syst. 2025, 11, 1358–1368. [Google Scholar] [CrossRef] [Scilit]
- Hou, X.; Sun, Y.; Zhang, X.; Lu, J.; Wang, P.; Guerrero, J.M. Improvement of frequency regulation in VSG-based AC microgrid via adaptive virtual inertia. IEEE Trans. Power Electron. 2020, 35, 1589–1602. [Google Scholar] [CrossRef] [Scilit]
- Wang, F.; Zhang, L.; Feng, X.; Guo, H. An adaptive control strategy for virtual synchronous generator. IEEE Trans. Ind. Appl. 2018, 54, 5124–5133. [Google Scholar] [CrossRef] [Scilit]
- Yang, Y.; Mei, F.; Zhang, C.; Miao, H.; Chen, H.; Zheng, J. Coordinated adaptive control strategy of rotational inertia and damping coefficient for virtual synchronous generator. Electr. Power Autom. Equip. 2019, 39, 125–131. [Google Scholar]
- Zhang, X.; Mao, F.; Xu, H.; Liu, F.; Li, M. An optimal coordination control strategy of micro-grid inverter and energy storage based on variable virtual inertia and damping of VSG. Chin. J. Electr. Eng. 2017, 3, 25–33. [Google Scholar] [CrossRef] [Scilit]
- Lyu, L.; Wang, X.; Zhang, L.; Zhang, Z.; Koh, L.H. Fuzzy control-based virtual synchronous generator for self-adaptative control in hybrid microgrid. Energy Rep. 2022, 8, 12092–12104. [Google Scholar] [CrossRef] [Scilit]
- Andalib-Bin-Karim, C.; Liang, X.; Zhang, H. Fuzzy-secondary-controller-based virtual synchronous generator control scheme for interfacing inverters of renewable distributed generation in microgrids. IEEE Trans. Ind. Appl. 2018, 54, 1047–1061. [Google Scholar] [CrossRef] [Scilit]
- Yang, R.; Shi, G.; Zhang, C.; Li, G.; Cai, X. Internal energy based grid-forming control for MMC-HVDC systems with wind farm integration. IEEE Trans. Ind. Appl. 2023, 59, 503–512. [Google Scholar] [CrossRef] [Scilit]
- Leon, A.E.; Mauricio, J.M. Virtual synchronous generator for VSC-HVDC stations with DC voltage control. IEEE Trans. Power Syst. 2023, 38, 728–738. [Google Scholar] [CrossRef] [Scilit]
- Pan, R.; Liu, D.; Liu, S.; Yang, J.; Kou, L.; Tang, G. Stability comparison between grid-following- and grid-forming-based wind farms integrated with MMC-HVDC. J. Mod. Power Syst. Clean Energy 2023, 11, 1341–1355. [Google Scholar] [CrossRef] [Scilit]
- Zhang, H.; Wang, X.; Wen, J. Dual grid-forming control with energy regulation capability of MMC-HVDC system integrating offshore wind farms and weak grids. IEEE Trans. Power Syst. 2024, 39, 261–272. [Google Scholar] [CrossRef] [Scilit]
- Pan, Y.; Zhang, F.; Quan, X.; Zhang, Y. DC line power flow coordinated control of MMC-MTDC with virtual synchronous generator. Int. J. Electr. Power Energy Syst. 2025, 173, 111416. [Google Scholar] [CrossRef] [Scilit]
- Wang, W.; Li, Y.; Cao, Y.; Hager, U.; Rehtanz, C. Adaptive droop control of VSC-MTDC system for frequency support and power sharing. IEEE Trans. Power Syst. 2018, 33, 1264–1274. [Google Scholar] [CrossRef] [Scilit]
- Du, W.; Tuffner, F.; Schneider, K.P.; Lasseter, R.H.; Xie, J.; Chen, Z.; Bhattarai, B.P. Modeling of grid-forming and grid-following inverters for dynamic simulation of large-scale distribution systems. IEEE Trans. Power Deliv. 2021, 36, 2035–2045. [Google Scholar] [CrossRef] [Scilit]
- Morshed, M.J.; Fekih, A. A novel fault ride-through scheme for hybrid wind/PV power generation systems. IEEE Trans. Sustain. Energy 2020, 11, 2427–2436. [Google Scholar] [CrossRef] [Scilit]
- Liu, Y.; Wang, Y.; Wang, M.; Xu, Z.; Peng, Y.; Li, M. Coordinated VSG control of photovoltaic/battery system for maximum power output and grid supporting. IEEE J. Emerg. Sel. Top. Circuits Syst. 2022, 12, 301–309. [Google Scholar] [CrossRef] [Scilit]
- Breesam, W.; Alamian, R.; Tashakor, N.; Youcefa, B.E.; Goetz, S.M. Frequency control in microgrids: A fuzzy neural network-based adaptive virtual synchronous generator. IEEE Trans. Smart Grid 2026, 17, 1782–1793. [Google Scholar] [CrossRef] [Scilit]
- Alsiraji, H.A.; Guerrero, J.M. A new hybrid virtual synchronous machine control structure combined with voltage source converters in islanded AC microgrids. Electr. Power Syst. Res. 2021, 193, 106976. [Google Scholar] [CrossRef] [Scilit]

Disclaimer/Publisher’s Note: The statements, opinions and data contained in all publications are solely those of the individual author(s) and contributor(s) and not of MDPI and/or the editor(s). MDPI and/or the editor(s) disclaim responsibility for any injury to people or property resulting from any ideas, methods, instructions or products referred to in the content. |
© 2026 by the authors. Licensee MDPI, Basel, Switzerland. This article is an open access article distributed under the terms and conditions of the Creative Commons Attribution (CC BY) license.