


Highlights
- Five ethanol-based pairs are compared for sub-zero adsorption ice-making from 65–160 °C.
- KOH4-PR/ethanol leads SCP from 85 °C upward; working capacity governs performance, not saturation uptake W0.
- Dual-optimum cycle map: COP-optimal at 1800 s, SCP-optimal shifts with Thw.
- Source-driven design framework links Thw to pair, cycle, and sorbent sizing.
Abstract
Thermally driven adsorption refrigeration offers a compressor-free pathway to sub-zero ice production from low-grade heat. Systematic design guidance for the 65–160 °C range remains limited: existing comparative studies lack consistent system-level constraints, rarely treat cycle time as a coupled variable, and have not addressed the thermodynamic penalties of sub-zero evaporator operation. This study presents a transient lumped-parameter model of a two-bed adsorption ice-making system comparing five ethanol-based working pairs: four activated carbon variants (Maxsorb III, ACF(A-20), KOH4-PR, KOH6-PR) and the metal–organic framework MIL-101(Cr). The Dubinin–Astakhov parameters of all five pairs reproduce the equilibrium measurements of their source studies, with a pooled coefficient of determination of 0.979 over 146 points. At the cycle level, the model reproduces two published chillers: MIL-101(Cr)/ethanol within 4.1% in coefficient of performance (COP) and 7.3% in specific cooling power (SCP), and ACF(A-20)/ethanol within 6.2% in cooling capacity and 5.5% in COP. Performance is mapped across a two-dimensional design space of regeneration temperature and adsorption half-cycle time. KOH4-PR/ethanol delivers the highest specific cooling power from 85 °C upward, reaching 136 W/kg at 160 °C, while Maxsorb III/ethanol activates from 65 °C and performs within 6% of KOH4-PR in SCP at 100 °C. A dual-optimum structure is identified. COP is maximized at long half-cycles and peaks at 0.541 across the swept temperature range, while the SCP-optimal half-cycle shortens as source temperature rises. At the 100 °C design point, the COP-optimal half-cycle of 1800 s gives COP = 0.535 and SCP = 104 W/kg, and the SCP-optimal half-cycle of 1200 s gives COP = 0.495 and SCP = 110 W/kg. The corresponding sorbent sizing for KOH4-PR/ethanol is 5.1 and 4.5 kg/kW. The combined results form a source-driven design framework that translates an imposed source temperature into a complete preliminary configuration: working pair, half-cycle time, expected ice production, and adsorbent inventory.
1. Introduction
In response to the growing demand for energy, recent focus has shifted toward utilizing energy that would otherwise be wasted as heat. This shift has made the utilization of low-grade thermal energy increasingly important, as thermal energy in the range of 65–160 °C is abundantly available from various sources. Solar thermal collectors, industrial waste heat, geothermal wells, engine exhaust, and combined heat and power plants all reject heat within this range, highlighting the need for technologies that can use it efficiently [1,2,3]. The International Energy Agency has estimated that industrial waste heat alone accounts for more than 30% of total industrial energy input, with the majority rejected at temperatures below 200 °C [4]. Currently, most of this heat is dissipated into the environment because it falls below the threshold required for efficient electricity generation using conventional steam Rankine cycles. The introduction of the organic Rankine cycle (ORC) has enabled the utilization of these low-temperature sources; however, net thermal efficiencies at small scales remain modest, approximately 3–6% for sources below 100 °C, 5–8% for the 100–120 °C range, and 7–13% for 120–150 °C. Additionally, capital costs remain high, around $3500–5000 per kW for small systems below 100 kW [5,6]. An alternative approach is the direct use of heat rather than converting it into electricity. Avoiding the 3–13% conversion efficiency typical of small-scale ORC and the parasitic compressor power of vapor compression cooling, thermally driven refrigeration converts the available heat directly into a cooling effect, which can improve overall viability for applications where cooling, rather than electricity, is the end use.
Adsorption refrigeration is a thermally driven technology that exploits the reversible physisorption of refrigerant vapor onto a microporous solid adsorbent to produce a cooling effect without a mechanical compressor. In a two-bed adsorption chiller, one bed adsorbs refrigerant vapor from the evaporator while the other bed is simultaneously heated to desorb its refrigerant load into the condenser. The beds alternate roles at regular intervals to provide quasi-continuous cooling [7]. Because the cycle is driven entirely by heat, the only electrical input is a small circulation pump, and the refrigerant can be a natural working fluid such as water, methanol, or ethanol, all of which have zero ozone depletion potential (ODP) and much lower global warming potential (GWP) than conventional synthetic HFC refrigerants used in vapor compression systems [8]. These characteristics distinguish adsorption systems from vapor compression chillers, which require high-GWP synthetic refrigerants and significant electrical power, and from absorption systems, which require corrosive working fluids such as lithium bromide solutions and have difficulty operating below 0 °C [9,10]. The combination of mechanical simplicity and environmental compatibility makes adsorption systems particularly attractive wherever low-grade heat is available and conventional refrigeration infrastructure is impractical or unsustainable.
Ice production is one application particularly well suited to direct heat-to-cooling conversion. It is an energy-intensive industrial process of global importance to fisheries preservation, food cold chains, concrete curing, and pharmaceutical logistics, and ice itself functions as a thermal storage medium that can shave peak cooling loads and reduce demand charges in humid climates [11]. Conventional ice plants rely on grid electricity to run vapor compression refrigeration (VCR), consuming 90–130 kWh of electrical energy per ton of ice [12]. In regions with limited grid access or under decarbonization mandates, mechanical refrigeration can impose both economic and environmental burdens. Consequently, thermally driven alternatives have attracted significant research interest.
Solar-driven ice production systems have shown promise. A hybrid concentrated photovoltaic–thermal (CPV/T) configuration combining adsorption and vapor compression subsystems produced 494 kg of ice per day, although the thermal adsorption subsystem contributed only about 15% of the total output [13]. A simulated solar adsorption ice maker produced up to 22 kg of ice per day, with a cycle COP of 0.367 and a solar COP of 0.26 [14]. These prototypes confirm that thermally driven sub-zero ice-making is feasible, yet their COP values cluster well below 0.4 across diverse hardware. Part of that spread is attributable to configuration rather than to the cycle itself. The ice maker runs one intermittent cycle per day with a single adsorption reactor and no heat or mass recovery, which forgoes the largest single efficiency gain available to this cycle. A continuously driven two-bed configuration with mass and heat recovery, referenced to the heat delivered to the bed, operates on a different basis and reaches a correspondingly higher COP. This pattern suggests that performance is limited not by the cycle thermodynamics but by working pair selection and cycle configuration; the gap addressed by the present parametric study. The key parameter for the adsorption refrigeration cycle is the uptake swing Δw. Δw is defined as the difference between the equilibrium uptake at adsorption conditions and the equilibrium uptake at desorption conditions. A large Δw indicates more refrigerant is cycled per kilogram of adsorbent per cycle. This directly increases both the coefficient of performance (COP) and the specific cooling power (SCP). The equilibrium uptake is determined by the adsorption isotherm, while the rate at which the bed approaches equilibrium is determined by mass transfer kinetics. The isotherm is a material-specific relationship between uptake, pressure, and temperature, and the mass transfer kinetics are described by the linear driving force (LDF) model [15,16]. For sub-zero ice-making applications, the evaporator must operate below 0 °C, which depresses the evaporator pressure and thereby reduces the equilibrium uptake during adsorption. This narrowing of Δw at low evaporator temperatures is the fundamental thermodynamic penalty that makes adsorption ice production more challenging than conventional air-conditioning applications, and it places a premium on adsorbent materials with inherently large uptake capacity and steep isotherms in the relevant pressure–temperature window [17,18].
The choice of an adsorbent–refrigerant working pair determines both the operating temperature envelope and the achievable performance. Water-based pairs such as silica gel water and zeolite water are the most widely studied in the adsorption cooling literature, achieving COP values of 0.3–0.7 at driving temperatures of 55–95 °C [9,19]. Water, however, freezes at 0 °C, ruling these pairs out for sub-zero evaporator operation and, therefore, for ice production. Activated carbon paired with methanol (freezing point −98 °C) or ethanol (freezing point −114 °C) overcomes this limitation. Frazzica et al. [17] built and tested a 0.5 kW activated carbon ethanol prototype that achieved an evaporator temperature of −7 °C with regeneration at 110 °C, reporting COP values of 0.09–0.125 and SCP of 50 W/kg under refrigeration conditions, a 47% SCP reduction relative to air-conditioning mode. Lache et al. [18] demonstrated sub-zero operation for a water-based system by adding 14 mol% ethanol as an antifreeze, reaching −5 °C but with a 45% COP penalty and a 42% SCP penalty due to impaired mass transfer and heat transfer in the evaporator.
Metal–organic frameworks (MOFs) represent a newer class of adsorbents with exceptional surface areas and tunable pore structures that offer substantially higher uptake capacities than conventional activated carbons. MIL-101(Cr) is among the most studied MOFs for adsorption cooling, with ethanol uptake capacities exceeding 1.0 g/g in powder form, roughly two to three times that of conventional activated carbons [20,21]. Liu et al. [21] confirmed pure MIL-101(Cr) ethanol uptake of approximately 1.1 kg/kg at 303 K, while Kummer et al. [22] reported methanol loading of up to 1.22 g/g for MIL-101(Cr) with excellent cycling stability over 1000 adsorption–desorption cycles. Rezk et al. conducted the most directly relevant study, developing and validating a lumped-parameter simulation of a two-bed MIL-101(Cr)/ethanol adsorption chiller with a six-phase cycle incorporating mass and heat recovery, demonstrating sub-zero evaporator temperatures at 90 °C driving temperature [23]. Shen et al. provided the most comprehensive recent review of engineered nanoporous frameworks for adsorption cooling, noting that while MOFs offer superior uptake, challenges remain in cost, scalability, and the translation from material-level characterization to system-level performance [20]. Critically, Henninger et al. conducted the most systematic model-based comparison of refrigerants and adsorbents for sub-zero chilling but did not include MIL-101(Cr) among the evaluated materials, leaving its sub-zero performance uncharacterized in the comparative literature [24].
Lumped-parameter modeling is the established simulation approach for adsorption chillers. Each component, i.e., the adsorbent bed, the evaporator, and the condenser, is treated as a single thermal node governed by ordinary differential energy and mass balance equations [25,26,27]. Makahleh et al. [25] developed a 10th-order ODE system for an activated carbon–methanol chiller with 9.1% overprediction of cooling capacity relative to experiment. He et al. [19] proposed a three-dimensional model for a two-bed chiller with combined heat and mass recovery, reporting that heat recovery improves COP by approximately 20% while the marginal benefit of adding mass recovery is approximately 1%. Lee et al. [26] compared three adsorbent materials (silica gel, aluminum fumarate, FAM-Z01) in the same physical system, finding that FAM-Z01 achieves the best performance at 60 °C driving temperature (cooling capacity 5.13 kW, COP 0.47) owing to its S-shaped isotherm. However, each of these studies employs a single isotherm formulation hardcoded for the specific working pair under investigation, and validation is performed against a single experimental dataset. Amin [27] attempted a multi-pair comparison using the same system dimensions, finding Maxsorb III/methanol 12% superior to ACF–ethanol in COP at 85 °C, but each pair required its own hardcoded isotherm and kinetic parameters. The sensitivity of downstream COP predictions to isotherm model selection has been demonstrated to reach 30% for silica gel systems when an inappropriate isotherm formulation is applied [16].
Table 1 summarizes the ethanol-based systems most directly comparable to the present work. Two features recur: the experimentally characterized systems operate almost entirely above 0 °C, having been built for air-conditioning or chilled-water duty, and the multi-pair comparisons are made at the material level through isotherms or ideal cycles rather than through a common transient system model.
Table 1.
Ethanol-based adsorption cooling systems reported in the literature compared with the present study.
Three gaps in the existing literature motivate the present study. First, most parametric studies of adsorption systems target air-conditioning duty with evaporator temperatures above 0 °C. The parametric studies that address sub-zero ice production each examine a single working pair, varying cycle time, bed design, or collector conditions. None compare several working pairs under common hardware and operating constraints across a wide source temperature range, with half-cycle time treated as a variable coupled to source temperature. Under sub-zero duty, the reduced evaporator pressure imposes a strong thermodynamic penalty and alters the optimal operating behavior, so conclusions drawn at above-zero duty or for a single pair do not transfer directly.
Second, prior comparisons of adsorbent refrigerant pairs are rarely performed under consistent system-level constraints. Many works focus on maximum uptake or material-level performance, without considering whether the available regeneration temperature is sufficient to utilize that capacity in practice. For low-grade heat sources in the range of 60–160 °C, this becomes critical, as material performance is strongly limited by achievable desorption conditions. A controlled comparison of multiple working pairs under identical assumptions for sub-zero operation remains limited.
Third, cycle time is treated as an independent or fixed design parameter. However, cycle time should depend on regeneration temperature since heat and mass transfer processes require finite time and their rates vary with temperature. So, the optimal cycle time is coupled with the heat source condition. This interaction has not been systematically explored or quantified in existing studies, particularly for ice-making applications.
This study addresses these gaps through a parametric optimization framework for adsorption-based ice production. The analysis considers sub-zero evaporator operation and spans the full low-grade heat range of 65–160 °C. Cycle time and regeneration temperature are treated as coupled variables, and their combined effect on COP and SCP is mapped across the full operating space. Five ethanol-based working pairs are evaluated under identical system assumptions to enable a fair comparison. The output is a coupled set of design charts—pair ranking, dual-optimum cycle map, deployment condition sensitivities, and sorbent-sizing curves—that allows a designer to start from an imposed source temperature and arrive at a preliminary system configuration without iterating between material-level and system-level analyses. Each of the five pairs has been characterized previously, and the lumped-parameter formulation follows established practice. The contribution is their joint evaluation under sub-zero ice-making duty at a common hardware specification, with cycle time coupled to source temperature, and the translation of that evaluation into a selection procedure for an imposed thermal source.
2. System Description
2.1. Two-Bed Adsorption Chiller: System Layout and Operating Principle
The system studied is a two-bed adsorption chiller configured for sub-zero ice production, shown schematically in Figure 1, and comprises four principal heat-exchanging components, two adsorbent beds, a condenser, and an evaporator, which are connected by refrigerant vapor lines with directional check valves and served by three external fluid circuits. In brief, the cycle operates as follows. At the start of a half-cycle, one bed is connected to the evaporator and cooled by the cooling water circuit. The adsorbent in this bed attracts refrigerant vapor from the evaporator, causing liquid refrigerant in the evaporator to evaporate and absorb heat from the chilled fluid loop. This evaporation produces the useful cooling effect. Simultaneously, the second bed is connected to the condenser and heated by the hot water circuit. The heat drives refrigerant vapor out of the adsorbent and into the condenser, where it liquefies and drains back to the evaporator. After a set half-cycle time, the beds swap roles. Brief mass recovery and heat recovery phases between each swap transfer refrigerant vapor and thermal energy between the beds, improving efficiency. The net result is quasi-continuous cooling output driven entirely by the heat input, with no mechanical compressor. Each component is described below in terms of its physical construction, its role in the refrigeration cycle, and the governing energy flows.
Figure 1.
Schematic of the two-bed adsorption chiller with mass and heat recovery phases.
Each adsorbent bed consists of a finned-tube heat exchanger packed with granular or pelletized adsorbent material. The adsorbent, a porous solid with an exceptionally large internal surface area, fills the space between the fins, and refrigerant vapor has access to the adsorbent surface through the inter-particle void space. A heat transfer fluid, typically water or a water–glycol mixture, flows through the tubes embedded within the adsorbent packing. This fluid serves two roles depending on the cycle phase: during desorption, hot water from the low-grade heat source flows through the tubes, heating the adsorbent and driving off the previously captured refrigerant; during adsorption, cooling water flows through the same tubes, removing the exothermic heat of adsorption and maintaining the bed at a temperature low enough for the adsorbent to continue capturing vapor.
The thermal capacity of each bed plays a substantial role in the system’s energy balance. It comprises three contributions: the metallic mass of the heat exchanger, the dry adsorbent mass, and the adsorbed-phase refrigerant. As the bed temperature swings between the adsorption temperature (set by Tcw, with a typical operating range of 25–35 °C and a baseline value of 30 °C used in this study) and the desorption temperature (approaching Thw = 65–160 °C), this entire thermal mass must be heated and cooled each half-cycle. The energy consumed in reheating the metal and adsorbent mass, which produces no useful refrigeration, is the sensible heat penalty.
2.1.1. Condenser
The condenser receives superheated refrigerant vapor released from the desorbing bed. As this vapor contacts the condenser surfaces, which are cooled by an external cooling water circuit, it first loses sensible superheat and then undergoes phase change to liquid. The condensation releases the latent heat of vaporization, approximately 927 kJ/kg for ethanol at typical condenser conditions near 30 °C (rising to ~975 kJ/kg at 0 °C; see Section 3.4), which must be rejected to the cooling water [32]. The liquid condensate collects in the condenser and drains by gravity through an expansion device, typically a capillary tube or throttling valve, into the evaporator. The condenser operates at a pressure determined by the cooling water temperature, Pcond = Psat(Tcond), where Psat is the saturation pressure of the refrigerant at the condenser temperature.
2.1.2. Evaporator
The evaporator produces a useful cooling effect. It contains a pool of liquid refrigerant at low pressure and temperature. As the adsorbing bed pulls vapor out of the evaporator, driven by the adsorbent’s affinity for the refrigerant molecules, liquid refrigerant evaporates to replace the departing vapor. This evaporation absorbs the latent heat of vaporization from the remaining liquid pool and from the chilled fluid circulating through the evaporator’s heat exchanger coil, thereby cooling the chilled fluid.
The evaporator temperature is not a fixed setpoint but an emergent system variable that results from the dynamic balance between two competing energy flows. On one side, the chilled fluid loop continuously delivers heat into the evaporator as the warm return fluid from the ice-making load enters the coil. On the other side, the evaporation of refrigerant continuously removes heat from the evaporator as latent energy carried away by the departing vapor. When the adsorption rate is strong, because the bed is cool, the adsorbent has available capacity, and the kinetics are fast, the evaporation rate is high, and the evaporator temperature drops. When adsorption slows, as the bed approaches equilibrium or heats up from the exothermic process, less vapor is pulled out, the evaporation rate falls, and the evaporator temperature rises toward the chilled fluid inlet temperature.
Water freezes at 0 °C, so ice can form only when the cycle-averaged evaporator temperature lies below 0 °C. This study applies a stricter threshold, Tth = −2 °C. Ice is credited only for the part of the evaporator duty that cools the chilled glycol below −2 °C (Equation (18)), which also requires the cycle-averaged evaporator temperature to lie below −2 °C. The 2 K margin below the freezing point is a driving force buffer for the ice bank heat exchanger, and the same criterion is used throughout the paper. Evaporator temperature is a free variable of the solution, so the threshold does not change the computed COP, SCP, or evaporator temperature. It does change the ice production estimate and the boundary of the ice-capable region: for KOH4-PR/ethanol at 100 °C and tads = 600 s, moving the threshold by 1 K changes the ice production rate by about 9%. Two additional energy flows influence the evaporator temperature: the sensible heat of condensate returning from the condenser, which is warmer than the evaporator and, therefore, adds a small heating load, and the parasitic heat leak from the ambient environment through imperfect insulation. Both of these flows oppose the cooling effect and raise the minimum achievable evaporator temperature.
2.1.3. External Fluid Circuits
Three external fluid circuits serve the system. The hot water circuit delivers thermal energy from the low-grade heat source, such as a geothermal well, solar collector, or waste heat stream, to the desorbing bed. The hot water enters the bed heat exchanger at Thw and exits at a lower temperature, having transferred a portion of its enthalpy to the adsorbent. The temperature drop across the bed depends on the flow rate and the bed’s instantaneous heat demand.
The cooling water circuit serves two functions: it removes the heat of adsorption from the adsorbing bed and rejects the condensation heat from the condenser. In many practical installations, the same cooling water loop serves both components in series, with heat ultimately rejected to the environment via a cooling tower or dry cooler. The cooling water temperature Tcw sets the lower bound for both the bed temperature during adsorption and the condenser temperature and thereby establishes the condenser pressure Pcond = Psat(Tcw).
The chilled fluid circuit carries the useful cooling output from the evaporator to the ice-making load. For sub-zero applications, this circuit uses a propylene glycol–water solution rather than water to prevent freezing within the circuit. The simulation uses a 30% propylene glycol mass fraction, yielding a specific heat of 2500 J/(kg·K) (Section 3.6). The chilled fluid enters the evaporator heat exchanger at a temperature of 0 °C, which is adopted as a conservative simulation boundary condition representing the return fluid temperature from an ice-making load operating at the freezing point. This assumption fixes the sensible load on the evaporator at its maximum value for ice production. The ice-making process extracts the sensible and latent heat from water at 0 °C to produce ice, requiring approximately 334 kJ/kg of latent heat removal.
2.2. Thermodynamic Cycle and the Clapeyron Diagram
The adsorption refrigeration cycle can be represented on a Clapeyron diagram, which plots the natural logarithm of pressure (ln P) against the negative reciprocal of temperature (−1/T), as shown in Figure 2. On this diagram, lines of constant uptake (isosteres) appear as approximately straight lines, and the saturation curve of the refrigerant forms a single boundary line. The ideal adsorption cycle traverses four processes that form a closed quadrilateral on the Clapeyron diagram. Figure 2 shows both the conceptual four-process cycle (solid path) and the six-phase cycle actually implemented in the present simulation (dashed path), which incorporates mass recovery (MR) and heat recovery (HR) phases between each main half-cycle. The four-process description below establishes the underlying thermodynamics.
Figure 2.
Clapeyron diagram (ln P vs. −1/T) showing the ideal four-process adsorption cooling cycle.
Process 1 → 2 (isosteric heating): The saturated bed, at the end of adsorption, is isolated from the evaporator by closing the check valve. The hot water circuit is connected, and the bed temperature rises. Because no vapor can enter or leave, the uptake w remains constant (isosteric), but the bed’s equilibrium pressure rises along the isostere until it reaches the condenser pressure. At this point, the check valve to the condenser opens and desorption begins. On the Clapeyron diagram, this process traces the wmax isostere from (Tads, Pevap) to (Tdes,start, Pcond).
Process 2 → 3 (isobaric desorption): With the bed connected to the condenser at pressure Pcond, continued heating drives refrigerant vapor out of the adsorbent. The uptake decreases from wmax to wmin as the bed temperature rises toward Thw. The released vapor flows to the condenser, where it liquefies. This process traces a horizontal line at Pcond on the Clapeyron diagram.
Process 3 → 4 (isosteric cooling): The regenerated bed is isolated from the condenser, and the cooling water circuit is connected. The bed temperature drops, and because no vapor can enter or leave, the equilibrium pressure falls along the isostere corresponding to wmin until it reaches the evaporator pressure. This process traces the wmin isostere from (Tdes, Pcond) to (Tads,start, Pevap).
Process 4 → 1 (isobaric adsorption): The check valve to the evaporator opens, exposing the bed to Pevap. The cooled adsorbent has strong affinity for the refrigerant at this low temperature, and vapor flows from the evaporator into the bed. As each molecule adsorbs, it releases the heat of adsorption, approximately 1000–1400 kJ/kg for ethanol on MOF adsorbents [33], which must be continuously removed by the cooling water to prevent the bed from heating up and stalling. The uptake increases from wmin back to wmax. This process traces a horizontal line at Pevap on the Clapeyron diagram. The vapor departing the evaporator causes liquid refrigerant to evaporate, absorbing latent heat and producing the cooling effect.
The difference Δw = wmax − wmin is the uptake swing, which represents the mass of refrigerant cycled per kilogram of adsorbent per cycle. The cooling output per cycle is directly proportional to the uptake swing multiplied by the latent heat of vaporization of the refrigerant:
where hfg is evaluated at the evaporator temperature. (This is a conceptual scaling relation; the full energy balance used in the simulation appears as Equations (1)–(18) in Section 3.1.1.)
Qcool = Mads·Δw · hfg
Because two beds operate in alternation, one adsorbing while the other desorbs, the system produces quasi-continuous cooling output. The full cycle duration is 2 × tads for a simple two-phase cycle, or 2 × (tads + tMR + tHR) when mass recovery and heat recovery phases are included.
2.3. Adsorption Equilibrium and Isotherm Behavior
The equilibrium uptake weq, the amount of refrigerant that an adsorbent holds at a given pressure and temperature when given infinite time to equilibrate, is described by the adsorption isotherm. The isotherm is the most fundamental material property governing adsorption chiller performance, because it determines both the maximum possible uptake swing Δw and the shape of the uptake-versus-pressure curve within the cycle’s operating window.
Several isotherm models have been developed to describe the equilibrium relationship. The Langmuir isotherm assumes monolayer adsorption on a surface with a fixed number of identical, independent sites:
where b(T) is the temperature-dependent affinity coefficient. It produces a Type I isotherm that rises sharply at low pressures and asymptotically approaches wsat at high pressures. While mathematically simple and physically intuitive, the Langmuir model assumes energetic homogeneity: all adsorption sites are identical, which is rarely true for the heterogeneous micropore structures of activated carbons and MOFs.
The Dubinin–Astakhov (D-A) isotherm is grounded in Polanyi’s micropore volume-filling theory and accounts for the energetic heterogeneity of real adsorbents through a distribution parameter n. The D-A equation takes the form:
where W0 is the maximum micropore uptake capacity [kg/kg], E is the characteristic energy of the sorbent–sorbate interaction [J/mol], n is the heterogeneity parameter, and A is the adsorption potential [J/mol]. The ratio A/E is, therefore, dimensionless, as required by the exponential argument. A is defined as:
where R is the universal gas constant [J/(mol·K)], T is the absolute temperature of the adsorbent bed [K], Ps is the saturation pressure of the refrigerant at temperature T [kPa], and P is the actual vapor pressure of the refrigerant at the bed conditions [kPa]. The ratio Ps/P is always greater than unity during adsorption, ensuring A is positive, and the argument A/E is positive definite as required by the D-A equation. The D-A model has been shown to provide the best overall fit across the full pressure range for microporous carbons and silica gels, outperforming Freundlich and Tóth formulations particularly at low relative pressures below 0.15, which is precisely the regime relevant to sub-zero evaporator operation [16].
A = RTln(Ps/P)
The Tóth and Sips isotherms are extensions of the Langmuir model that introduce an additional heterogeneity parameter to stretch or compress the isotherm shape. While these models can fit certain datasets more closely than Langmuir, they lack the micropore-filling physical foundation of the D-A model and have been shown to predict the isosteric heat of adsorption less accurately. This is a critical deficiency because the isosteric heat directly enters the bed energy balance and affects COP predictions by up to 30%, even when the uptake fit appears adequate [16,34].
Figure 3 compares the Dubinin–Astakhov equilibrium isotherms at 30 °C for the five ethanol working pairs. The curves show substantial variation in equilibrium uptake and isotherm shape. KOH6-PR/ethanol exhibits the highest saturation capacity, approaching 1.98 kg/kg, whereas ACF(A-20)/ethanol shows the lowest maximum loading, near 0.80 kg/kg. MIL-101(Cr)/ethanol and Maxsorb III/ethanol fall in the intermediate range, while KOH4-PR/ethanol also shows relatively high loading over much of the pressure range. These differences indicate that adsorbent selection strongly affects equilibrium refrigerant capacity. However, cycle performance depends on the uptake swing Δw between adsorption and desorption states rather than on maximum loading alone; a distinction that produces a counterintuitive performance ranking, demonstrated quantitatively in Section 4.2. The relevant segment of each isotherm is narrow. At the sub-zero duty considered here, the bed swings between a desorption state near P/Ps = 0.046 and an adsorption state near P/Ps = 0.130, so the working capacity is set by isotherm behavior within this window and is insensitive to capacity held outside it.
Figure 3.
Dubinin–Astakhov adsorption isotherms at 30 °C for multiple working pairs.
The adsorption isotherm describes where the system wants to go, meaning the equilibrium target weq, but the mass transfer kinetics describe how fast it gets there. In a real adsorbent bed, the rate at which refrigerant molecules migrate from the vapor phase into the micropore interior is finite, governed by a cascade of resistances: external film diffusion around the particle, macropore diffusion through the inter-crystalline void space, and micropore diffusion within the adsorbent’s internal pore network [15].
The linear driving force (LDF) approximation collapses this cascade into a single overall mass transfer coefficient ks, as formulated in Equation (7) (Section 3.1.1). This formulation has a critical physical consequence: the adsorption rate is fastest at the beginning of each half-cycle, when the gap between w and weq is largest, and decelerates exponentially as the bed approaches equilibrium. A bed that is 90% of the way to equilibrium after five minutes might take an additional five minutes to cover the remaining 10% because each incremental approach shrinks the driving force.
This exponential slowdown is the fundamental reason that cycle time optimization matters. Cutting the cycle short at 90% completion sacrifices a small amount of COP, because slightly less refrigerant is cycled per unit of heat input, but it nearly doubles the SCP because the same adsorbent mass produces cooling almost twice as fast by staying in the high-productivity regime rather than the asymptotic tail. Conversely, running the cycle to near completion maximizes COP at the expense of SCP. The optimal trade-off depends on the design objective and the available driving temperature.
2.4. Mass Recovery and Heat Recovery
Two optional recovery phases can be inserted between the main adsorption and desorption half cycles to improve performance. During mass recovery, the two beds are briefly interconnected by opening a vapor transfer line between them. The desorbing bed, which is at higher pressure, releases vapor to the adsorbing bed, which is at lower pressure, until the pressures equalize. This transfer occurs without any heat input or removal and typically completes in 20–40 s. The benefit is twofold: the desorbing bed achieves a lower final uptake, meaning deeper regeneration, and the adsorbing bed starts its next half-cycle with a slightly higher loading, meaning it is pre-charged. Both effects increase the effective Δw per cycle. He et al. demonstrated that mass recovery improves SCP by approximately 1% when added to a system that already has heat recovery, though its standalone benefit at low driving temperatures can be substantially larger, up to 37.5% SCP improvement at 60 °C [19].
During heat recovery, the hot water and cooling water circuits are cross-connected: the hot fluid returning from the desorbing bed (which has cooled from Thw to some lower exit temperature) is routed through the adsorbing bed, and vice versa. This pre-heats the cold bed and pre-cools the hot bed, reducing the amount of external heat and cooling required in the subsequent half-cycle. He et al. also reported that heat recovery improves COP by approximately 20% and that the accumulated regeneration heat saved by heat recovery is approximately double that of mass recovery [19]. For sub-zero ice-making operation, the larger pressure ratio between the desorbing and adsorbing beds (Pcond/Pevap is typically 2–3× greater than in cooling-only operation due to the depressed evaporator pressure) extends the time required to approach pressure equalization. The present simulation, therefore, adopts a longer mass recovery duration of tMR = 60 s compared with the 20–40 s typical of air-conditioning systems. In the model, mass recovery brings the two beds to a common pressure and the uptake of each bed then relaxes toward its new equilibrium at the LDF rate, so tMR sets how far this transfer proceeds. A sweep of tMR at the 100 °C design point (KOH4-PR/ethanol, tads = 600 s, tHR = 60 s) gives a COP of 0.312 without mass recovery, 0.371 at 60 s and 0.375 at 120 s, so 60 s captures about 95% of the attainable gain. SCP peaks at 30–40 s at 95.1 W/kg and is 1.4% lower at 60 s.
3. Methodology
The transient lumped-parameter model couples ordinary differential equations (ODEs) governing the thermal and mass states of the two adsorber beds, the evaporator, and the condenser. The lumped approach is justified for packed beds with metallic fin structures and well-mixed liquid reservoirs in the evaporator and condenser [27,35]. The system state is captured by nine coupled ODEs that are integrated simultaneously in time. The nine state variables are listed in Table 2: bed temperatures Ta and Tb, bed uptakes wa and wb, evaporator temperature Tevap, evaporator refrigerant mass Mref, condenser temperature Tcond, and two cumulative energy accumulators Qheat and Qcool used for performance evaluation. This formulation follows the established modeling framework of Rezk et al. [23] and is consistent with the lumped-parameter approaches employed by Makahleh et al. [25] and He et al. [19].
Table 2.
State variables of the lumped-parameter ODE system.
The following assumptions are adopted throughout the model:
(i) Each system component is treated as a lumped thermal node at uniform temperature; intra-bed thermal gradients are neglected.
(ii) Pressure drops across vapor transfer lines and check valves are neglected; the evaporator and condenser pressures equal the saturation pressure of the refrigerant at the respective component temperatures.
(iii) Adsorption kinetics follow the linear driving force (LDF) approximation with an Arrhenius temperature-dependent mass transfer coefficient.
(iv) Adsorption equilibrium is described by the Dubinin–Astakhov (D–A) isotherm for all working pairs, using the published parameters listed in Section 3.2.
(v) External fluid inlet temperatures and flow rates are constant during each cycle phase.
(vi) Refrigerant vapor behaves as an ideal gas; liquid refrigerant is incompressible.
(vii) Ambient heat leak into the evaporator is included as an additional heat input to the evaporator energy balance, modeled as a UA-based exchange with the surrounding environment at the assumed ambient temperature.
(viii) The sensible heat of liquid condensate returning from the condenser to the evaporator is included in the evaporator energy balance.
(ix) Heat transfer between external fluid circuits and system components follows the NTU effectiveness method.
3.1. Model Structure and Assumptions
3.1.1. Governing Equations During Adsorption and Desorption
During the main operating phases, one bed adsorbs refrigerant vapor from the evaporator while the other desorbs vapor to the condenser. The energy balance for the adsorbing bed is
where Cbed is the total thermal capacity of the bed, ΔHads is the isosteric heat of adsorption (positive), Mads is the adsorbent mass, and the final term accounts for the sensible heat of vapor entering the bed from the evaporator. The sign convention is such that is negative during adsorption (heat removed), and dwads/dt is positive (uptake increasing). The exothermic heat-of-adsorption term ΔHads · Mads · dwads/dt, therefore, adds energy to the bed and must be removed by the cooling water for the bed to remain near Tcw. The bed thermal capacity includes the heat exchanger metal, the dry adsorbent, and the adsorbed-phase refrigerant:
where w is the instantaneous uptake (kg refrigerant per kg adsorbent) and cp,liq is the liquid-phase specific heat of the refrigerant. Mads here refers to the dry adsorbent mass per bed, listed in Section 3.6. The term w·cp,liq accounts for the thermal inertia of the adsorbed-phase refrigerant held within the pores, evaluated at the instantaneous uptake w. The inclusion of the adsorbed-phase contribution w·cp,liq follows the approach of Rezk et al. [23] and accounts for the thermal inertia of the refrigerant held within the adsorbent pores.
Cbed = Mmet cp,met + Mads(cp,ads + w · cp,liq)
The energy balance for the desorbing bed is
Because desorption is endothermic and dwdes/dt is negative, the second term removes energy from the bed. All heat transfer between external fluids and system components is calculated using the NTU effectiveness method:
Equation (5) is the single-stream effectiveness, applicable when the bed thermal capacity is much greater than the heat transfer fluid capacity over a single pass. This holds for the present geometry where Cbed is on the order of 105 J/K and the per-pass fluid capacity ṁ·cp is on the order of 103 J/K.
The instantaneous uptake rate is governed by the linear driving force model:
where weq is the equilibrium uptake from the D–A isotherm at the current bed temperature and the pressure of the connected heat exchanger, and ks is the overall mass transfer coefficient. The temperature dependence of ks follows the Arrhenius equation:
where CLDF is the pre-exponential factor (related to the surface diffusion coefficient and particle geometry), Ea is the activation energy of surface diffusion, and R is the universal gas constant. Directional valve logic is enforced through the connected pressure: during adsorption, the bed sees Pevap and weq is computed at Pevap, so dw/dt is naturally non-negative. During desorption, the bed sees Pcond and dw/dt is naturally non-positive. A clamp on the sign of dw/dt is applied numerically as a safeguard against transient oscillations near phase transitions but does not modify the physical equations.
The evaporator energy balance accounts for heat gained from the chilled fluid, heat removed by evaporation, the sensible heat of returning condensate, and ambient heat leak through the evaporator shell:
with the heat leak modeled as
where Tamb is the ambient temperature surrounding the evaporator shell. is positive when Tamb > Tevap, which is always the case in sub-zero operation, so heat leak acts as a parasitic load that the cycle must overcome to maintain the design evaporator temperature.
The evaporator mass balance is
The condenser energy balance is
where the first term is the latent heat released upon condensation, the second term is the sensible cooling of incoming superheated vapor, and the third term is the heat removed by the cooling water.
3.1.2. Mass Recovery Phase
Between the main half-cycles, a brief mass recovery phase is introduced by interconnecting the two beds through a vapor transfer line. No external fluid flows through either bed; the only driving force is the pressure difference between them. The two beds equilibrate toward a common intermediate pressure, taken as the geometric mean:
Each bed evolves toward its new equilibrium uptake at this pressure via the LDF equation (Equation (7)), with mass conservation enforced: the net mass gained by one bed equals the net mass lost by the other. Bed temperatures change only due to the heat of adsorption and desorption. The evaporator and condenser are isolated during this phase. The mass recovery duration is fixed at tMR = 60 s. This is longer than the 20–40 s typically reported for cooling-only adsorption systems because sub-zero ice-making operates with a larger pressure ratio Pcond/Pevap, which extends the time required for the two beds to approach pressure equalization through the inter-bed vapor line.
3.1.3. Heat Recovery Phase
Following mass recovery, a heat recovery phase cross-connects the hot and cooling water circuits between the two beds. The heat transfer is modeled as a single NTU effectiveness exchange:
The heat recovery effectiveness εhr is computed using Equation (5) with the same UAhex as the main bed exchanger. The cross-connected fluid stream travels through both beds in series, so the effective NTU is reduced compared with single-bed operation. In this study, εhr = 0.30 is used. No mass transfer occurs during heat recovery. The evaporator and condenser remain isolated. The heat recovery duration is fixed at tHR = 60 s.
3.1.4. Cycle Sequence
The complete six-phase cycle proceeds as follows: ADS1, in which Bed A adsorbs and Bed B desorbs for duration tads, is followed by MR1 (duration tMR), HR1 (duration tHR), and then ADS2, MR2, and HR2. The total cycle time is the sum of two complete half-cycles, each consisting of one main half-cycle plus one mass recovery and one heat recovery phase:
tcycle = 2(tads + tMR + tHR)
The two beds alternate roles each half-cycle, producing quasi-continuous cooling output. The adsorption half-cycle time tads is treated as a design variable in the parametric study (Section 3.7), while tMR = tHR = 60 s are held fixed throughout all simulations. At the reference condition of tads = 600 s, the total cycle time is, therefore, tcycle = 2(600 + 60 + 60) = 1440 s.
3.2. Adsorption Equilibrium
The equilibrium adsorbate loading weq is computed from the Dubinin–Astakhov (D-A) isotherm. The D-A model is preferred over Langmuir, Tóth, and Sips formulations for this study because it captures the pore-filling mechanism that governs adsorption in sub-nanometer pores [36]. It reproduces the Type I isotherm behavior characteristic of microporous adsorbents and has been validated extensively for activated carbon–methanol, activated carbon–ethanol, and MOF–alcohol systems [37,38]. Mohammed et al. demonstrated that D–A outperforms alternative models at the low relative pressures (P/Ps < 0.15) that characterize sub-zero evaporator operation and that mismatched isotherm selection can introduce COP prediction errors of up to 30% [16].
The equilibrium uptake for all working pairs is described by the Dubinin–Astakhov (D-A) isotherm introduced in Section 2.3. The D-A parameters for the five ethanol-based working pairs evaluated in this study are listed in Table 3. The D-A isotherm parameters (W0, E, n) and the isosteric heat of adsorption ΔHads for all five pairs were taken from peer-reviewed experimental characterization studies and are used with modification.
Table 3.
Working pair D-A isotherm, kinetic, and thermal parameters.
The five pairs span a meaningful range of material characteristics. The maximum uptake capacity W0 varies by a factor of 2.5, from 0.797 kg/kg for ACF(A-20)/ethanol to 1.98 kg/kg for KOH6-PR/ethanol. The characteristic energy E ranges from 4146 J/mol for KOH6-PR/ethanol to 6527 J/mol for MIL-101(Cr)/ethanol. Higher values of E indicate stronger preferential adsorption at the low pressures characteristic of sub-zero evaporator operation, which is a key material advantage for ice-making applications.
Isotherm Parameter Provenance and Fit Quality
The parameters in Table 3 were determined by the source studies from gravimetric or volumetric equilibrium measurements on the respective adsorbents. Evaluating Equation (1a) at these parameters against the data reported in those studies quantifies how closely the equilibrium sub-model follows each material over the range for which measurements exist. Figure 4 shows the comparison, and Table 4 summarizes it.
Figure 4.
Equilibrium sub-model compared with the source measurements of each working pair. The shaded band marks the idealized relative-pressure window of Section 2.3 (P/Ps = 0.046–0.130).
The source data are the adsorption branches of Figure 4 in Rezk et al. [23] for MIL-101(Cr)/ethanol (42 points, five isotherms at 15–55 °C), Table 1 of El-Sharkawy et al. [30] for Maxsorb III/ethanol (six points on one isobar), Figure 4 of El-Sharkawy et al. [40] for ACF(A-20)/ethanol (13 points on two isobars, 3.1 and 4.3 kPa), and the isotherm data in Figures 3a and 3b of El-Sharkawy et al. [39] for KOH4-PR/ethanol and KOH6-PR/ethanol (40 and 45 points, five isotherms each at 30–70 °C). Figure data were digitized and expressed as uptake in kg/kg against pressure in Pa and temperature in K. For each point, the residual e is the measured uptake minus the D-A uptake at the Table 3 parameters. The root mean square error is RMSE = [Σe2/N]^0.5 in kg/kg, and , with the mean measured uptake of the pair. Pooled values treat all 146 points as one set.
Across the five pairs, the D-A form reproduces 146 published equilibrium points with a pooled coefficient of determination of 0.979 and a root mean square error of 0.062 kg/kg, with four of the five at an R-squared of 0.986 or above. For ACF(A-20)/ethanol, the correspondence runs in both directions: refitting the digitized measurements with the Dubinin–Radushkevich form used by that study returns W0 = 0.793 kg/kg and D = 1.671 × 10⁻⁶ K^−2, within 0.5% and 2.6% of the published values.
Refitting each pair globally across all of its measurement temperatures, by bounded nonlinear least squares (trust region reflective algorithm, SciPy curve_fit, version 1.18.1), also identifies D-A as the closest of the four candidate forms. Langmuir, Toth, and Sips return root mean square errors 1.5 to 14 times higher, although all three carry a van ‘t Hoff temperature term, b = b0 exp(Q/RT), and Toth and Sips carry a fourth parameter. Coefficients and errors for every pair and model are listed in Appendix A, Table A1. Maxsorb III/ethanol is the exception: its source data comprise six points along a single isobar, too few to separate three-parameter from four-parameter forms.
MIL-101(Cr)/ethanol carries the largest residual at R-squared 0.910 and RMSE 0.099 kg/kg, and the deviation is concentrated rather than spread. Five points, one at the lowest measured pressure of each isotherm and all below P/Ps = 0.01, contribute 46% of the total squared error. At these pressures, MIL-101(Cr) adsorbs on coordinatively unsaturated chromium sites, a mechanism outside the micropore volume-filling basis of the D-A equation, which predicts near-zero loading there. These points sit at adsorption potentials of about 14 to 19 kJ/mol. At the 100 °C design point, the MIL-101(Cr)/ethanol cycle stays below about 13 kJ/mol, so the deviation does not affect the design point results. At 130 °C and above, the desorption end of the cycle reaches this range, and MIL-101(Cr)/ethanol results there carry the larger equilibrium uncertainty. Over the remaining points, the root mean square error is 0.078 kg/kg.
Table 4.
DA Equilibrium sub-model against source study measurements.
The mass recovery phase requires the equilibrium pressure of each bed at a known uptake and temperature, rather than the equilibrium uptake at a known pressure. Inverting Equation (1a) gives:
This form is used during the mass recovery phase (Section 3.1.2) to determine the equilibrium pressure in each bed at the moment when the beds are connected.
3.3. Mass Transfer Kinetics
The rate of adsorbate mass transfer between the gas phase and the adsorbent solid is described by the linear driving force (LDF) model, Equation (7), where ks is the overall mass transfer coefficient (s−1), weq is the equilibrium loading from the D-A isotherm, and w is the instantaneous loading [41]. The LDF approximation collapses the cascade of intra-particle resistances (external film, macropore, micropore) into a single lumped coefficient and has been shown to provide adequate accuracy for adsorption chiller simulations when the adsorbent particles are smaller than approximately 2 mm [42]. The temperature dependence of the mass transfer coefficient follows the Arrhenius relationship, Equation (8), where CLDF is the pre-exponential factor, and Ea is the activation energy for surface diffusion. Pair-specific kinetic parameters were used for each working pair rather than applying a single uniform set across all pairs. This preserves the experimentally measured differences in adsorption kinetics among the materials and ensures that each pair is represented by parameters obtained on the same adsorbent batch as its isotherm fit. The values of CLDF and Ea for the five ethanol-based pairs are listed in Table 3. The kinetic parameters in Table 3 are expressed in the direct Arrhenius form of Equation (8). Source papers for the KOH-derived and Maxsorb III pairs report diffusivity in an alternative form that includes an explicit particle geometry factor; these values were converted to the direct Arrhenius form prior to entry in Table 3, and activation energies originally reported in kJ/kg were converted to J/mol using the molar mass of ethanol.
3.4. Refrigerant Properties
Ethanol is well suited to sub-zero ice production. Its saturation pressure at minus 5 °C is approximately 1.6 kPa, which is high enough to sustain an adsorptive driving force at the depressed evaporator pressure but low enough that the adsorption equilibrium remains in the high-uptake region of the D-A isotherm. Its freezing point at minus 114 °C is well below any condition expected in the evaporator pool. Table 5 lists the key thermophysical properties of ethanol used in the simulation.
Table 5.
Thermophysical properties of ethanol [43].
3.5. Performance Metrics
The two primary performance metrics are the COP and the SCP. The COP is the ratio of the total evaporator cooling energy to the total hot water heat input over a complete cycle:
The SCP is the average evaporator cooling power per unit total adsorbent mass:
where Mads,total is the total adsorbent mass of both beds and tcycle is given by Equation (14). Both metrics are evaluated at periodic steady state by averaging over the last three of 25 simulated cycles (see Section 3.7).
The ice production rate accounts for both the sensible cooling of the supply water from its inlet temperature Tsupply to 0 °C and the latent heat of freezing. Only the part of the evaporator duty that cools the chilled glycol below the threshold Tth is credited:
where is set to zero when Tchill,out ≥ Tth, Tf = 0 °C is the freezing point of water, and cp,chill are the chilled-glycol flow rate and specific heat (Section 3.6), Tth = −2 °C is the ice production threshold (Section 2.1.2), and Tchill,out is the glycol outlet temperature, , with εevap from Equation (5) using UAevap and being the cycle-averaged evaporator temperature. Tsupply is the inlet temperature of the supply water, cp,w = 4.18 kJ/(kg·K) is its specific heat, hice = 334 kJ/kg is the latent heat of fusion of water, and ηHX,ice = 0.85 is the effectiveness of the ice-making heat exchanger, which accounts for imperfect thermal contact between the glycol coil and the ice-making load.
3.6. System Hardware and Operating Conditions
All five ethanol-based working pairs are simulated using identical system hardware to isolate the effect of material properties. The hardware geometry and external flow rates follow Rezk et al., whose adsorption chiller parameters were originally established by Rezk and Al-Dadah [23]. Table 6 and Table 7 list the fixed hardware and operating parameters.
Table 6.
System hardware parameters (constant across all working pairs).
Table 6 lists the hardware parameters held constant across all working pairs. Table 7 lists the operating conditions and external fluid flow rates used throughout the parametric study.
Table 7.
Operating conditions and flow rates.
3.7. Parametric Sweep Framework
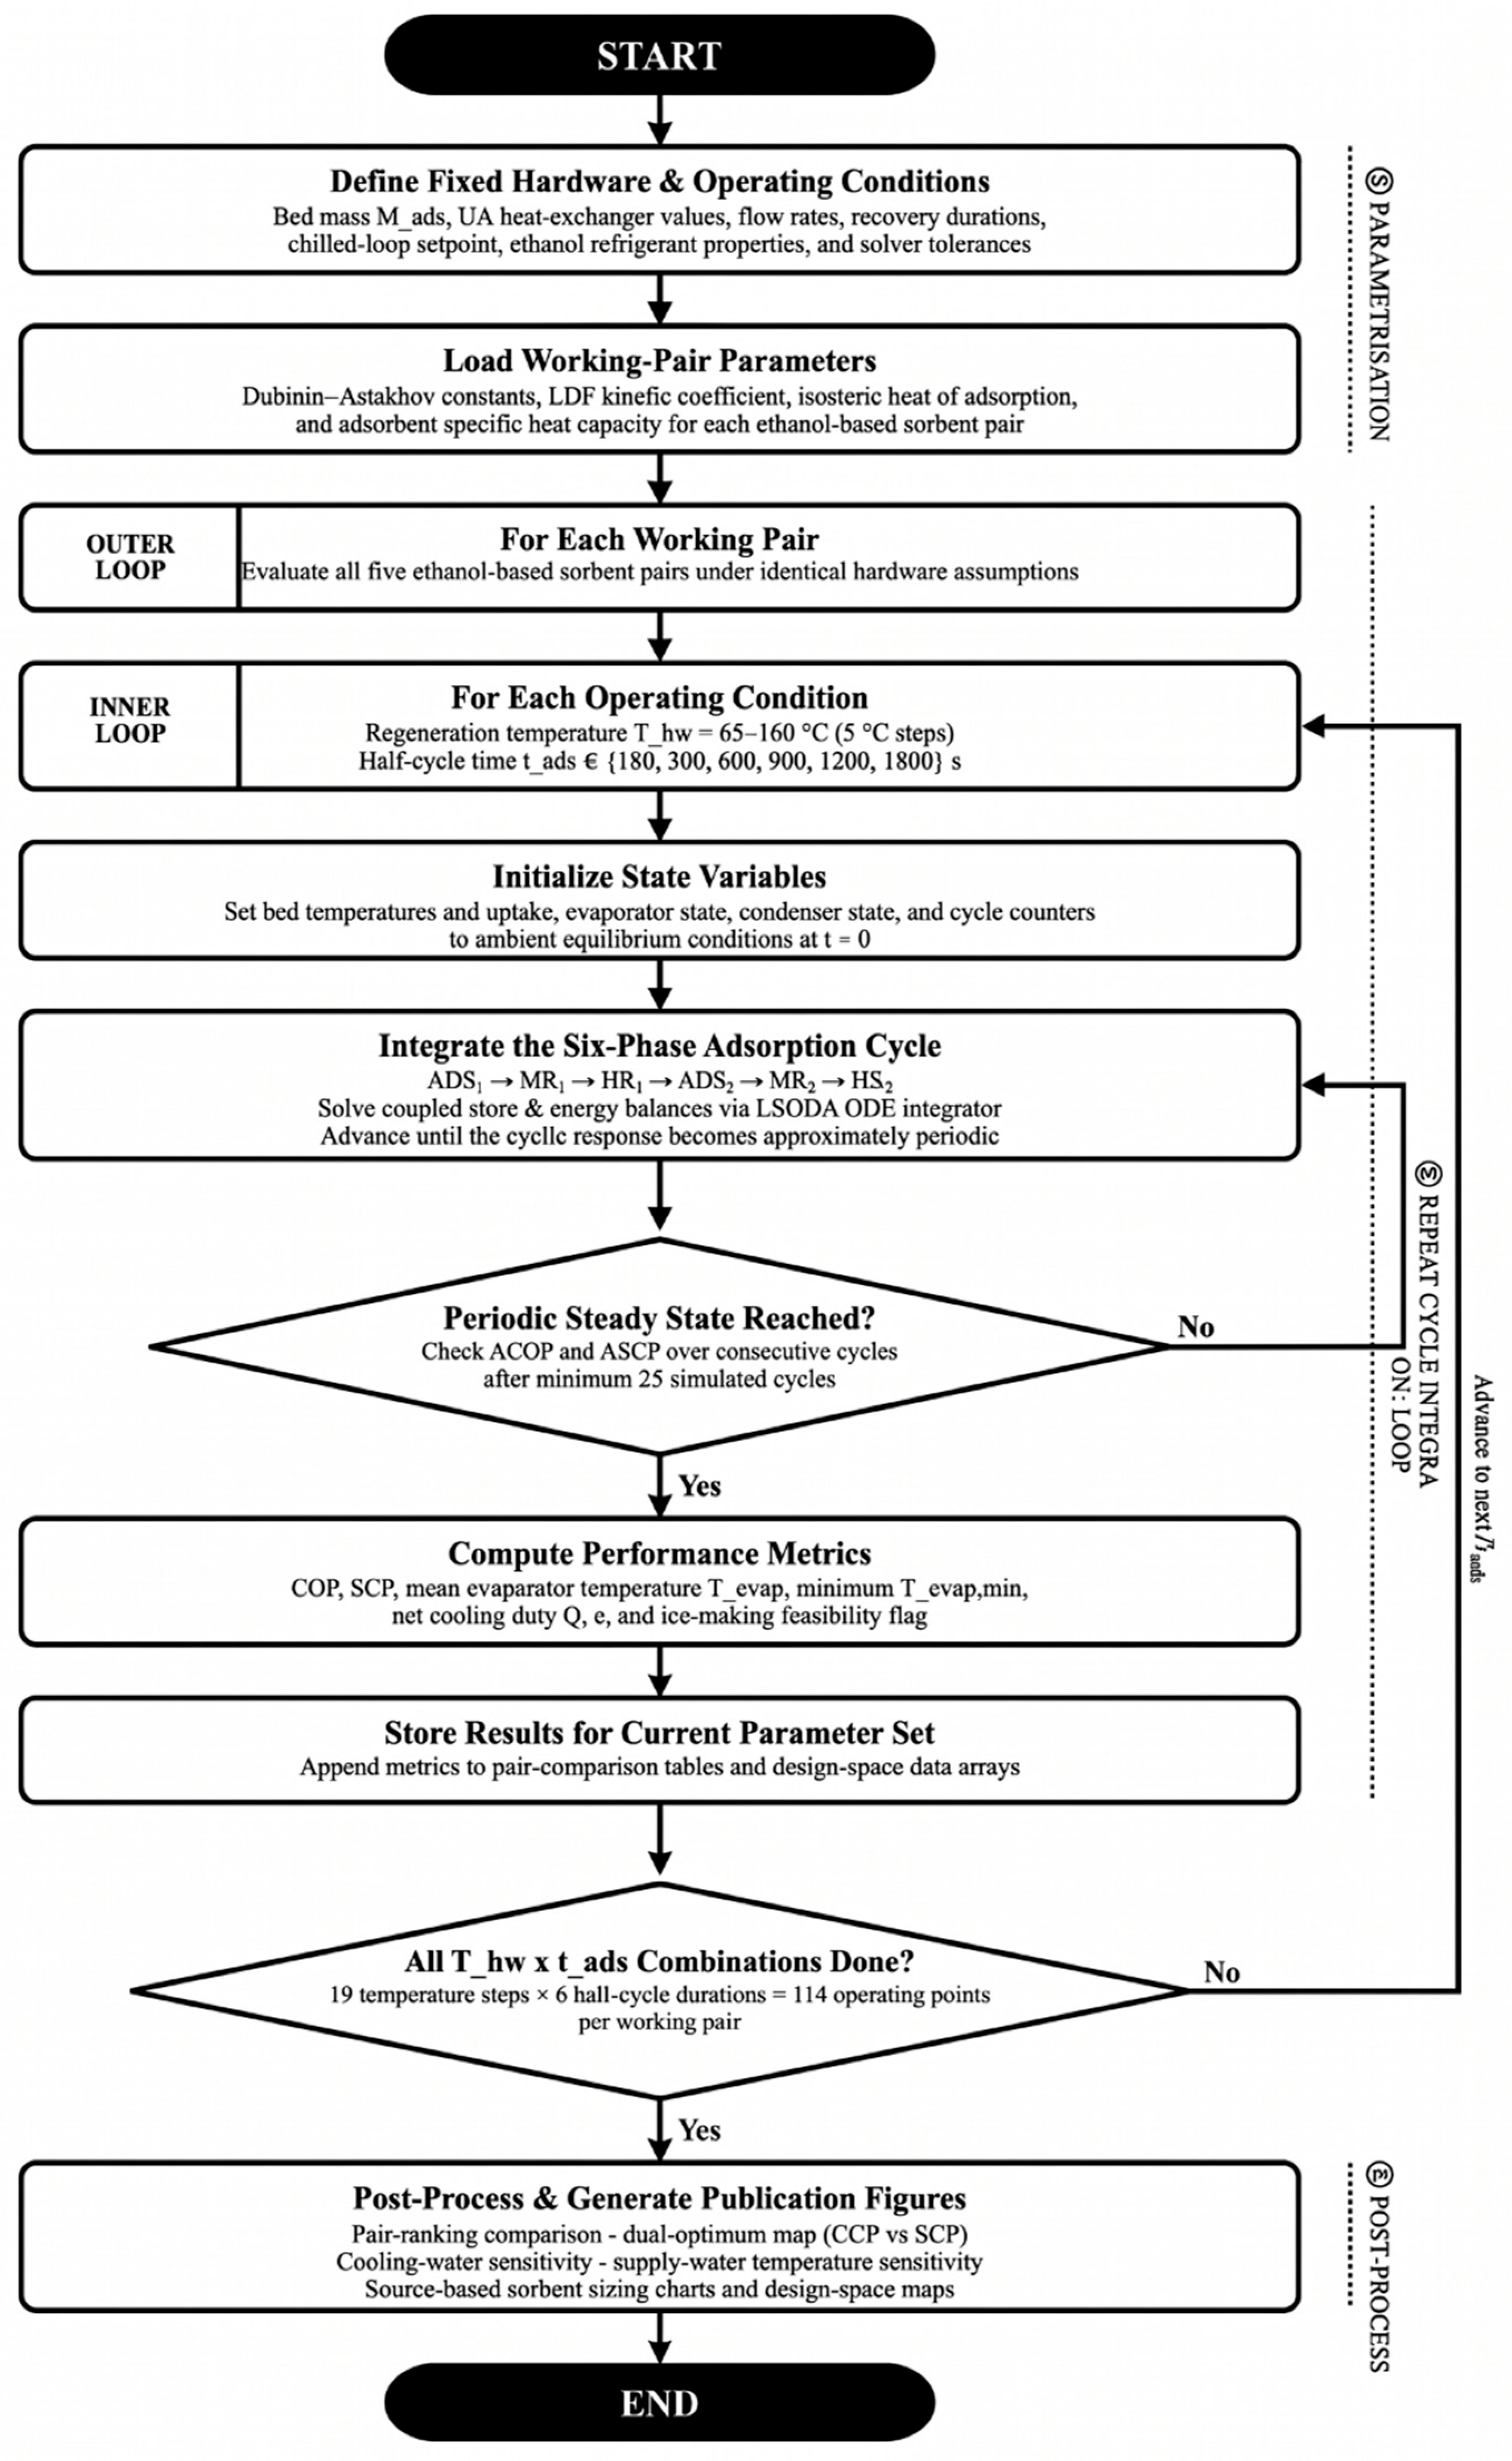
The parametric study maps the performance of each working pair across a two-dimensional design space defined by the regeneration temperature Thw and the adsorption half-cycle time tads. The hot water temperature is swept from 65–160 °C in 5 °C increments. The adsorption half-cycle time is evaluated at six values: 180, 300, 600, 900, 1200, and 1800 s. This fixed-cycle comparison ensures a fair, unconfounded assessment of the effect of material properties on COP and SCP by eliminating cycle-time tuning as a variable. For each simulation point, the ODE system is integrated over 25 complete cycles. The cycle-to-cycle variation in COP and SCP at the end of this window is below 1%, which is the convergence criterion adopted as periodic steady state. Performance metrics are extracted by averaging over the last three cycles. Ice-making feasibility follows the criterion of Section 2.1.2: an operating point is ice-capable when the chilled glycol leaving the evaporator, computed from the cycle-averaged evaporator temperature, falls below Tth = −2 °C. Operating points that fail this criterion produce no ice and are flagged as infeasible in the design maps. The simulation workflow is summarized in Figure 5.
Figure 5.
Simulation flowchart for the parametric sweep.
3.8. Numerical Solution
The ODE system is solved using the LSODA solver as implemented in scipy.integrate.solve_ivp, which automatically switches between stiff (backward differentiation formula) and non-stiff (Adams) methods based on local stiffness detection. The relative and absolute tolerances are set to 10−6 and 10−8, respectively, with a maximum time step of 2.0 s. State variables are clamped to physically meaningful bounds at each evaluation: uptake w is restricted to∈ [10−6, 0.9999 W0] and evaporator refrigerant mass to Mref ≥ 0.5 kg.
4. Results and Discussion
4.1. Model Validation
Validation proceeds from the material level to the system level. The equilibrium parameters of all five working pairs were compared against the measurements reported by their source studies in Section 3.2, which establishes how closely the isotherm sub-model follows each material over the range for which data exist. This section addresses the transient cycle model, first through the qualitative behavior of the simulated cycle and then through quantitative comparison with two independently published chillers operating on different working pairs and different hardware. The lumped-parameter model is validated against the published experimental results of Rezk et al., who built and characterized a two-bed MIL-101(Cr)/ethanol adsorption chiller with a six-phase cycle incorporating mass and heat recovery [23,33]. MIL-101(Cr)/ethanol is one of the five working pairs evaluated in the present parametric study, which makes this a direct and internally consistent validation case. The simulation is run at the operating point reported in [23]: hot water inlet at 90 °C, cooling water inlet at 30 °C, and chilled fluid inlet at 0 °C, with the fluid flow rates and hardware geometry listed in Table 6 and Table 7. The simulation uses pair-specific D-A isotherm parameters and pair-specific LDF kinetic parameters from Table 3, both sourced from the same Rezk et al. [23] study, with no further tuning.
4.1.1. Qualitative Validation
The diagnostic traces from the last three cycles at Thw = 90 °C are shown in Figure 6. Four physically expected behaviors are examined and confirmed.
Figure 6.
Diagnostic traces from the last three cycles of the validation simulation for MIL-101(Cr)/ethanol at Thw = 90 °C, Tcw = 30 °C, and Tchill,in = 0 °C.
First, the bed temperatures follow the expected alternating pattern. While one bed heats toward Thw under hot water supply, the other cools toward Tcw under cooling water, with a visible crossover during the mass recovery and heat recovery phases. Both beds reach near-identical temperature envelopes at periodic steady state, which confirms symmetric cycle convergence. The cycle-to-cycle variation in COP and SCP across the last three simulated cycles is below 1%, which confirms that the averaging window is representative of true periodic operation.
Second, the uptake traces in the second panel of Figure 6 show the decelerating exponential shape predicted by the LDF equation. The adsorbing bed rises from wmin toward wmax, with the rate of uptake gain decelerating in the later portion of each half-cycle as the driving force weq minus w shrinks. The desorbing bed mirrors this behavior in reverse. The uptake swing is consistent across all three plotted cycles, which confirms limit-cycle convergence in the mass state.
Third, the evaporator temperature shown in the third panel of Figure 6 oscillates in a bounded, repeating pattern below 0 °C across all three cycles, which confirms that sub-zero ice-making conditions are sustained at steady state. The condenser temperature remains stable and close to Tcw, as expected for a well-coupled condenser at moderate driving temperature. Fourth, the evaporator refrigerant mass Mref shown in the bottom panel oscillates in a stable limit cycle with no net drift across cycles, which confirms that the evaporator mass balance is conserved.
4.1.2. Quantitative Validation
Table 8 compares the simulated COP and SCP against the values reported by Rezk et al. [23]. The model predicts COP = 0.177 against the reported value of 0.17, a deviation of +4.1%, and SCP = 55.6 W/kg against the reported 60 W/kg, a deviation of −7.3%. Both deviations fall within the 5–15% range typically reported for lumped-parameter adsorption chiller models [25].
Table 8.
Validation against Rezk et al. [23] at Thw = 90 °C, Tcw = 30 °C, Tchill,in = 0 °C, and MIL-101(Cr)/ethanol [23].
Both deviations are small and lie in opposite directions, which indicates that the model carries no systematic bias toward either overprediction or underprediction. The residual +4.1% COP deviation is consistent with the lumped treatment of the bed, which does not resolve intra-bed temperature gradients. In a real packed bed, heat is delivered preferentially to the regions closest to the heat exchanger fins and is delayed reaching the inter-fin core, which lowers the average usable heat input compared with the uniformly distributed assumption used here. The residual −7.3 % SCP deviation reflects the same lumped treatment from the opposite perspective: localized regions of faster uptake adjacent to the fins contribute disproportionately to short-time-scale cooling output, an effect that the uniform-bed model cannot capture. Both deviations are within the band reported for comparable lumped-parameter adsorption models [26,27,44]. The validation against MIL-101(Cr)/ethanol verifies the simulation engine itself rather than any individual working pair. The engine consists of the coupled ODE system, the NTU effectiveness heat transfer treatment, the LDF kinetic formulation, the D-A isotherm, the six-phase cycle implementation, including mass and heat recovery, and the periodic-steady-state extraction procedure. These elements are identical across all five pairs in the present study. Switching from one pair to another only substitutes the parameters, while the governing equations, the cycle logic, and the numerical scheme remain unchanged.
The Rezk et al [23]. case shares the cycle structure and hardware basis used throughout this study, so it tests the parameter set within a familiar configuration. To separate the formulation from that configuration, the model was also applied to the two-bed ACF(A-20)/ethanol chiller of Saha et al. [28], which differs in adsorbent family, heat exchanger conductance, fluid flow rates, adsorbent inventory, cycle structure, and evaporator duty. All hardware and operating values were taken from Part I of that study [29]; the full set is listed in Appendix A, Table A2. The reference values are the cooling capacity of 12.53 kW at the rated conditions in Section 4.1 of [29] (hot water 85 °C, cooling water 30 °C, chilled water 14 °C) and the optimum COP of 0.56 reported for hot water at 85–95 °C and coolant at 30 °C. At the rated conditions, the model returns a cooling capacity of 13.30 kW and a COP of 0.529, with deviations of +6.2% and −5.5%.
Comparison of this kind requires a published system for which the working pair, the heat exchanger conductances, the fluid flow rates, and the operating conditions are all reported in enough detail to reconfigure the model. Among the five pairs studied here, that condition is met by MIL-101(Cr)/ethanol and ACF(A-20)/ethanol. KOH4-PR/ethanol and KOH6-PR/ethanol have been characterized at the material level only, and no chiller has been reported using either. Maxsorb III/ethanol has been modeled at sub-zero ice-making duty in a two-bed system, but with a two-dimensional model of aluminum foam and finned-tube beds that has no direct counterpart in the lumped bed description used here. The remaining three pairs, therefore, enter the comparison through their equilibrium and kinetic parameters, verified in Section 3.2, rather than through an independent cycle-level dataset.
Reproducing two independently published chillers of different adsorbent family and cycle configuration to within 7.3% on every reported metric supports the use of the model for the parametric design-level analysis that follows in Section 4.2, Section 4.3, Section 4.4, Section 4.5 and Section 4.6.
4.2. Working Pair Screening Across the Source Temperature Range
The five ethanol-based working pairs were compared at a fixed adsorption half-cycle time of 600 s over a regeneration temperature range of 65–160 °C. This screening evaluates all candidates under identical hardware, flow rates, and cycle recovery conditions, so any difference in performance is attributable to material properties alone. Figure 7 illustrates that, across the full 65–160 °C range, KOH4-PR/ethanol and Maxsorb III/ethanol emerged as the two strongest performers, occupying complementary operating niches. KOH4-PR/ethanol led SCP from approximately 85 °C upward, reaching 136 W/kg at 160 °C. Maxsorb III/ethanol activated at lower driving temperatures and maintained competitive performance across the entire sweep. At 100 °C and tads = 600 s, KOH4-PR/ethanol delivered COP = 0.371 and SCP = 93.8 W/kg, with Maxsorb III/ethanol and MIL-101(Cr)/ethanol performing within 6% in SCP at this condition. The advantage of KOH4-PR widened at higher driving temperatures; at 160 °C, it reached SCP = 136 W/kg compared with approximately 122 W/kg for Maxsorb III/ethanol and 125 W/kg for MIL-101(Cr)/ethanol. ACF(A-20)/ethanol ranked lowest throughout, as it was constrained by the lowest saturation capacity and the slowest adsorbing-bed kinetics among all five pairs.
Figure 7.
COP and SCP of the five ethanol-based working pairs as a function of hot water regeneration temperature. Conditions: tads = 600 s, Tcw = 30 °C, Tchill,in = 0 °C, and tMR = tHR = 60 s. Equilibrium parameters are verified against source measurements for all five pairs (Table 4); the cycle model is benchmarked for MIL-101(Cr)/ethanol and ACF(A-20)/ethanol against published simulations built on measured isotherm and kinetic data.
The performance ranking does not follow the limiting uptake capacity W0. KOH6-PR/ethanol carries the highest W0 at 1.98 kg/kg yet ranks fourth in SCP across most of the temperature range. The decisive quantity is the working uptake swing Δw realized within the cycle’s actual pressure window, not the saturation capacity. At the operating conditions of the ice-making cycle, KOH6-PR/ethanol achieves a working uptake of 0.169 kg/kg, while KOH4-PR/ethanol achieves 0.255 kg/kg despite a 28% lower W0. The shallow n = 1.5 isotherm of KOH6-PR distributes its capacity across the full relative pressure range, leaving only a small fraction accessible within the sub-atmospheric pressure window of sub-zero ethanol operation. KOH4-PR’s steeper n = 2 isotherm concentrates its capacity precisely in this window, producing a larger Δw per cycle and, therefore, higher SCP. The evaporator temperature trends in Figure 8 reinforce this interpretation. At 100 °C, all pairs sustain sub-zero mean evaporator temperatures, confirming ice-making feasibility across all the pairs. KOH4-PR/ethanol reaches the lowest mean evaporator temperature at this condition, consistent with its highest vapor extraction rate per cycle. KOH4-PR/ethanol is, therefore, selected as the reference pair for the design map and deployment-sensitivity analyses in Section 4.3, Section 4.4, Section 4.5 and Section 4.6.
Figure 8.
Mean evaporator temperature of the five ethanol-based working pairs as a function of hot water regeneration temperature. The dashed line at 0 °C marks the freezing point of water. Ice production is credited only below the −2 °C threshold of Section 2.1.2. Conditions: tads = 600 s, Tcw = 30 °C, and Tchill,in = 0 °C.
The superior SCP of KOH4-PR/ethanol results from three simultaneous material advantages. Its D-A isotherm concentrates working capacity in the sub-atmospheric pressure range corresponding to ice-making evaporator temperatures, producing the highest effective uptake swing at operating conditions. Its moderate isosteric heat of adsorption limits the temperature rise of the adsorbing bed during each half-cycle, sustaining a larger uptake driving force throughout the adsorption phase compared with higher-enthalpy pairs, such as MIL-101(Cr)/ethanol. Finally, its kinetic time constant at adsorbing-bed temperature is the shortest among all five pairs, allowing near-complete uptake utilization within the standard half-cycle time. The interaction of these three factors, isotherm shape, heat of adsorption, and low-temperature kinetics, governs cycle performance more directly than any single material property.
A counterintuitive consequence of the Arrhenius kinetic form is that a large pre-exponential CLDF does not imply fast mass transfer at adsorbing-bed conditions. MIL-101(Cr)/ethanol carries CLDF = 5.275 × 10⁵ s−1, six orders of magnitude larger than KOH4-PR’s 0.1025 s−1, yet its high activation energy Ea = 47,860 J/mol suppresses its rate constant at 30 °C to a value slower than KOH4-PR, whose low Ea = 7463 J/mol yields the fastest adsorbing-bed kinetics in the pair set. MIL-101(Cr)/ethanol’s kinetic advantage emerges only at elevated desorbing-bed temperatures, where its rate constant accelerates sharply; however, desorption kinetics are rarely the bottleneck in the coupled system. The adsorbing half-cycle, conducted near cooling water temperature, limits overall performance, and it is the low-temperature rate constant that governs utilization.
The separations in Figure 7 rest on isotherm parameters that carry their own fit uncertainty, and at the 100 °C design point that uncertainty can be propagated directly. Sampling the D-A parameters of each pair from the covariance of the fits reported in Section 3.2 and rerunning the cycle model gives standard deviations in SCP of 0.15 to 0.98% of the mean across the five pairs, with all 150 runs reaching periodic steady state (Figure 9). The resulting ordering is not uniformly resolved. KOH4-PR/ethanol delivers the highest SCP in every one of the 900 independent cross-pairings against each other pair, so its lead at this condition survives the equilibrium uncertainty intact. The second and third positions do not separate: KOH6-PR/ethanol exceeds Maxsorb III/ethanol in 63% of cross-pairings against a nominal difference of 0.3%, which is not a basis for ranking them. In COP, the two phenol-resin carbons are indistinguishable, 0.371 ± 0.003 for KOH4-PR against 0.371 ± 0.001 for KOH6-PR, so the SCP advantage rather than efficiency is what separates the selected pair at this condition.
Figure 9.
Propagation of the Dubinin–Astakhov parameter uncertainty through the cycle model at Thw = 100 °C. For each working pair, the parameters were drawn from the covariance of the global isotherm fit of Section 3.2, with thirty draws per pair. Points are individual draws, the bar spans the 5th to 95th percentile, and the tick marks the nominal value from Table 3. Other conditions as in Figure 7.
4.3. Design Map and Dual-Optimum Behavior
KOH4-PR/ethanol was swept in two dimensions over regeneration temperature and adsorption half-cycle time to construct a source-driven design map. In most practical installations, the regeneration temperature Thw is imposed by the available heat source, such as a waste heat stream, a low-enthalpy geothermal fluid, or a solar–thermal loop, and cannot be tuned freely by the designer. The useful engineering question is how to configure the adsorption cycle once the Thw is fixed by the application. The dual-optimum curves in Figure 10 and the heat maps in Figure 11 answer that question directly.
Figure 10.
Dual-optimum behavior of the adsorption ice-making system.
Figure 11.
Performance design space for given source temperature.
Two distinct optima emerge from the sweep. The COP-optimal half-cycle time remains at tads = 1800 s across the entire 65–160 °C range within the swept window of 180–1800 s, confirming that thermodynamic efficiency is maximized by long, near-equilibrium half-cycles regardless of source temperature. This monotonic trend is bounded by the upper limit of the sweep and by the modeling assumptions adopted here, which include fixed heat exchanger conductances, ideal valve switching, and zero pump power. Real hardware that incorporates pump parasitic load and finite valve switching loss could display a sharper COP peak located below 1800 s or shifted toward lower source temperatures, particularly at high Thw where the bed is thermally over-driven. The dual-optimum structure and the operating recommendations developed below are not sensitive to this distinction because the COP advantage of the longest cycle diminishes above 125 °C while SCP continues to rise under shorter cycles, so the practical incentive to operate at the upper bound of tads weakens at high source temperatures regardless of the underlying loss model. The SCP-optimal half-cycle time shifts toward shorter cycles as the source temperature rises, following a four-regime pattern shown in Figure 10: 1800 s below 95 °C, 1200 s from 95 to 110 °C, 900 s from 110 to 125 °C, and 600 s above 125 °C. The 100 °C design point illustrates the practical trade-off. The COP-optimal condition at tads = 1800 s yields COP = 0.535 and SCP = 104 W/kg. The SCP-optimal condition at tads = 1200 s yields COP = 0.495 and SCP = 110 W/kg. Moving from COP-optimal to SCP-optimal operation increases SCP by 5.8% at a cost of 7.5% in COP. Both strategies are defensible depending on whether the application prioritizes thermodynamic efficiency or production rate per unit sorbent mass. The dual-optimum figure functions as a decision chart rather than a single-point optimization result. The low-temperature end of the map is also informative. At 65 °C, KOH4-PR/ethanol remains operational but at limited output, with COP = 0.11 and SCP = 5 W/kg. For source temperatures below 85 °C, Maxsorb III/ethanol is the preferred pair because it activates at lower driving temperatures and delivers competitive SCP in this marginal range. Performance for KOH4-PR/ethanol strengthens rapidly between 85 and 105 °C and then separates into the dual-objective regime above 105 °C, where the COP-optimal and SCP-optimal operating points diverge. Above 125 °C, COP no longer improves with increasing Thw, but SCP continues to rise under shorter cycles. For source classes that deliver higher regeneration temperatures, such as mid-temperature waste heat or higher-enthalpy geothermal fluids, the system should be operated at the SCP-optimal cycle time to maximize throughput since additional source temperature beyond 125 °C yields SCP gain without COP gain.
The SCP-optimal half-cycle time for KOH4-PR/ethanol clusters near 600–1200 s across the full temperature range, even though the LDF model predicts that the adsorbing bed reaches near-equilibrium uptake well within this window. This behavior reflects a constraint imposed by the evaporator energy balance rather than by sorbent kinetics. When the half-cycle time is shortened below a threshold set by the evaporator thermal balance, each cycle extracts less vapor from the evaporator. The reduced latent heat demand allows the evaporator to equilibrate at a warmer temperature, which suppresses the equilibrium uptake of the adsorbing bed and reduces the effective uptake swing. For KOH4-PR’s steep isotherm, even a modest rise in evaporator temperature produces a disproportionate reduction in working capacity, so the kinetic benefit of faster cycling is offset by the thermal penalty. This evaporator-governed floor on useful cycle time applies to all five ethanol pairs studied because each pair reaches near-equilibrium uptake within the SCP-optimal window. The relevant kinetic time constants, computed as τkin = 1/ks at the adsorbing-bed temperature of 30 °C using the parameters in Table 3, are compared against the bed thermal time constant τbed = Cbed/(ε · ṁhw · cp,w) = 105 s in Table 9. All five pairs exceed τbed, confirming that bed thermal coupling, not sorbent kinetics, sets the controlling time scale of the cycle.
Table 9.
Linear driving force kinetic time constants at 30 °C compared with the bed thermal time constant.
4.4. Cooling Water Sensitivity and Deployment Implications
The sensitivity of KOH4-PR/ethanol to cooling water inlet temperature was evaluated at Thw = 100 °C under both the COP-optimal and SCP-optimal cycle settings. The results are shown in Figure 12. Under COP-optimal operation at tads = 1800 s, lowering Tcw from 30 to 20 °C raises COP from 0.535 to 0.567 and SCP from 104 to 155 W/kg. Raising Tcw to 40 °C reduces COP to 0.390 and SCP to 65 W/kg. Under SCP-optimal operation at tads = 1200 s, SCP drops from approximately 155 W/kg at Tcw = 20 °C to 40 W/kg at Tcw = 40 °C, a nearly four-fold reduction across a 20 K change in cooling water temperature.
Thw alone does not determine system output. Two installations sharing the same Thw can produce substantially different ice output if their heat rejection conditions differ. The design maps in Section 4.3 must, therefore, be read together with local cooling water availability. Cooler condenser water expands the viable operating envelope, while warmer cooling water compresses it and can push the system toward the ice production threshold. The cooling water sensitivity curves in Figure 12 serve as a correction layer over the source-driven maps developed in Section 4.3
Figure 12.
Sensitivity of performance to cooling water inlet temperature. (KOH4-PR/ethanol, THW = 100 °C). The shaded band marks the baseline Tcw = 30 °C.
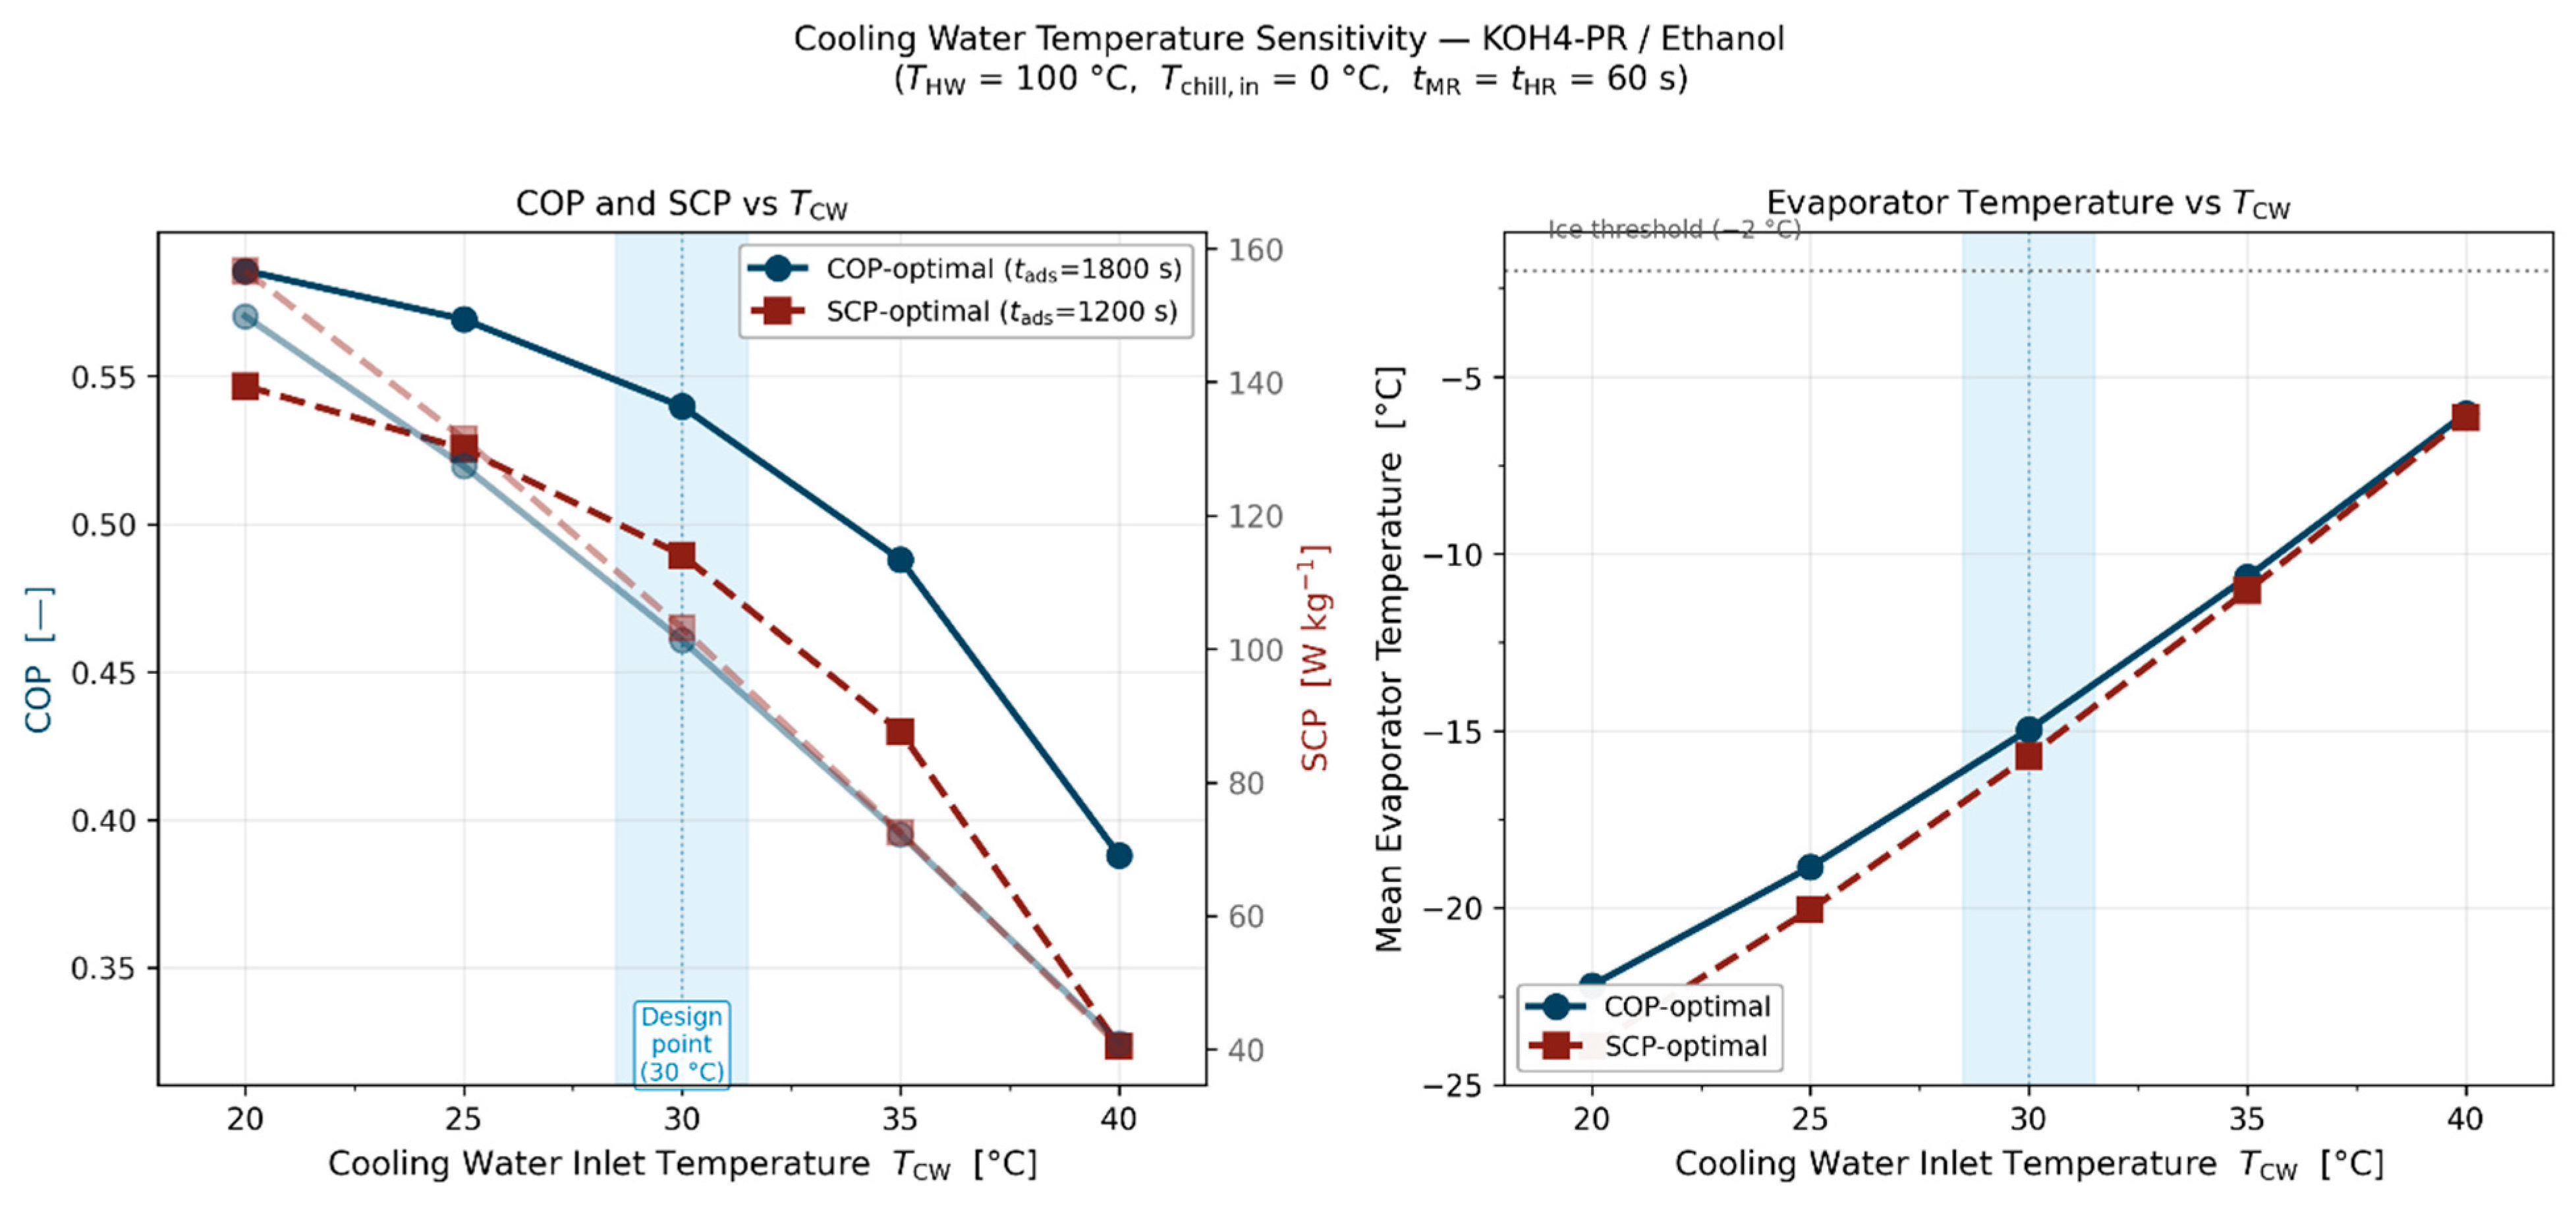
4.5. Influence of Supply Water Temperature on Ice Production Rate
The second deployment variable is the temperature of the supply water entering the evaporator-side loop, which sets the sensible load penalty before phase change begins. For a fixed refrigeration state, hotter supply water requires more sensible cooling per unit mass of water before ice formation, which reduces the net ice production rate. The trend is monotonic across the 10 to 35 °C range considered.
At Thw = 100 °C, the COP-optimal cycle (tads = 1800 s) produces approximately 36 kg/h from 10 °C supply water and 30 kg/h from 35 °C supply water. The SCP-optimal cycle (tads = 1200 s) produces nearly identical output under these conditions, reflecting the small COP penalty associated with the SCP-optimal setting at 100 °C. The gap between operating modes widens at higher source temperatures. At Thw = 130 °C, the COP-optimal cycle produces 42–34 kg/h across the supply water range, while the SCP-optimal cycle (tads = 600 s) produces 55–46 kg/h. At Thw = 160 °C, the SCP-optimal cycle reaches 59 kg/h from 10 °C supply water compared with 44 kg/h under COP-optimal operation under the same conditions. The absolute production level rises with source temperature across all supply water conditions, and the benefit of SCP-optimal operation becomes increasingly significant above 125 °C. That finding in this study is important for interpreting nominal ice production capacity. A system freezing cooler make-up water cannot be compared directly with one processing warmer supply water unless the sensible load penalty is accounted for. The supply water curves in Figure 13 translate thermodynamic cycle output into application-level production guidance. Once the source temperature and preferred operating mode are selected, the expected ice production rate can be corrected for the actual supply water condition. The source temperature map identifies the cycle; the supply water curves translate that cycle into realistic field output.
Figure 13.
Ice production rate as a function of supply water inlet temperature for four representative regeneration temperatures (Thw = 80, 100, 130, and 160 °C).
4.6. Sorbent Sizing and Use of the Paper as a Source-Driven Design Guide
The performance of KOH4-PR/ethanol was translated into sorbent mass per unit source power, Mads/Qsource. This sizing ratio allows the designer to move from cycle performance to hardware sizing without first prescribing a bed mass. The required sorbent inventory decreases as source temperature increases for all pairs, reflecting stronger desorption driving force and improved bed utilization at higher Thw. At the 100 °C design point, KOH4-PR/ethanol requires approximately 5.1 kg/kW under COP-optimal operation and 4.5 kg/kW under SCP-optimal operation, from Mads/Qsource = COP/SCP with the values of Section 4.3. SCP-optimal operation, therefore, needs about 12% less sorbent per kilowatt of source heat, at the cost of a 7.5% lower COP. The remaining pairs require modestly higher sorbent inventories than KOH4-PR/ethanol at equivalent source temperatures, as shown by the reference curves in Figure 14.
Figure 14.
Sorbent sizing requirement expressed as adsorbent mass per unit source power for the five ethanol-based working pairs. Solid and dashed lines: KOH4-PR/ethanol under COP-optimal and SCP-optimal operation; thin grey lines: the other four pairs (COP-optimal); vertical dotted line: 100 °C design point.
These results close the design workflow proposed in the paper. The four-step procedure is:
- Identify the available Thw imposed by the heat source. If Thw is below 85 °C, select Maxsorb III/ethanol as the working pair; above 85 °C, select KOH4-PR/ethanol.
- Decide whether the application prioritizes thermodynamic efficiency (COP-optimal) or ice production rate (SCP-optimal).
- Read Mads/Qsource from Figure 14 at the given Thw and operating mode and then multiply by the available source heat input to obtain the required adsorbent inventory.
The framework, therefore, functions as a practical design guide for systems whose thermal source is fixed by the application, rather than as a single-point optimization.
The results establish a consistent design narrative. KOH4-PR/ethanol is the preferred pair for source temperatures above 85 °C, offering the highest SCP and the lowest sorbent inventory requirement in this range. Maxsorb III/ethanol is preferred for source temperatures below 85 °C, where its lower activation temperature and competitive SCP make it the more robust choice. Long cycles maximize COP across the full operating range. Shorter cycles become increasingly attractive for maximizing ice production rate as Thw rises above 105 °C. Tcw is the output that can be extracted from any given source, and Tsupply determines how refrigeration output converts into actual ice production. Together, the figures form a linked set of design charts that allow the designer to move from an imposed source temperature to a working pair selection, an operating mode, a realistic ice production estimate, and a sorbent inventory, without iterating between material-level and system-level analyses.
5. Conclusions
This study presents a transient lumped-parameter model of a two-bed adsorption ice-making system to evaluate five ethanol-based working pairs over a regeneration temperature range of 65–160 °C. The simulation engine was validated against the published MIL-101(Cr)/ethanol experimental data of Rezk et al. [23], with COP and SCP deviations within the 5–10% band reported for comparable lumped-parameter models, and it was then applied as a fixed numerical platform to the remaining four pairs through parameter substitution.
The major findings are as follows:
- KOH4-PR/ethanol delivers the highest SCP from 85 °C upward, reaching 136 W/kg at 160 °C, while Maxsorb III/ethanol is preferred below 85 °C where KOH4-PR/ethanol remains marginal. At 100 °C, the two pairs perform within 6% of each other in SCP.
- Performance is governed by the realized uptake swing Δw rather than by W0 alone. KOH6-PR/ethanol has the highest W0 in the present pair set at 1.98 kg/kg yet is the weakest performer because its shallow isotherm places most of its capacity outside the sub-atmospheric pressure window of sub-zero ethanol operation; at ice-making conditions, KOH6-PR/ethanol achieves a working uptake of 0.169 kg/kg against 0.255 kg/kg for KOH4-PR/ethanol despite KOH6-PR carrying a 38% higher W0.
- The SCP-optimal half-cycle time follows a four-regime pattern, declining from 1800 s below 95 °C to 600 s above 125 °C. At the 100 °C design point, moving from COP-optimal to SCP-optimal operation increases SCP by 5.8% at a cost of 7.5% in COP.
- At Thw = 100 °C, SCP for KOH4-PR/ethanol varies nearly fourfold across a 20 K change in cooling water temperature, and ice production declines monotonically from 36 to 30 kg/h as supply water temperature rises from 10 to 35 °C.
- Sorbent sizing Mads/Qsource for KOH4-PR/ethanol is approximately 5.1 kg/kW in COP-optimal and 4.5 kg/kW in SCP-optimal operation.
The combined results form a source-driven design framework. Once Thw is fixed by the application, the designer can identify the appropriate operating regime, estimate realistic ice production under site-specific sink and feed conditions, and size the adsorbent inventory accordingly.
The study is computational and reports no measurements of the authors’ own. Equilibrium behavior is verified against source measurements for all five pairs, and the cycle model is reproduced against two published chillers, but direct cycle-level validation at sub-zero duty exists for only one pair, which constrains the absolute confidence of the comparison while preserving its relative validity. Future work will extend the framework to alternative refrigerants, additional adsorbent families, experimentally measured ambient leak conditions across multiple geometries, and economic optimization under source-specific deployment scenarios.
Additionally, the kinetic parameters in Table 3 were obtained from controlled gravimetric measurements on small adsorbent samples and reflect intrinsic material kinetics rather than effective bed-scale mass transfer rates. In a packed-bed hardware configuration, vapor flow resistance through the inter-particle void space and thermal coupling between adsorption heat release and bed temperature are both geometry-dependent, and the relative performance ranking of working pairs may shift under hardware configurations that differ from the fixed parameters of Table 6 and Table 7. Experimental validation of the pair comparison at bed scale remains an important direction for future work. For the same reason, no empirical correction factors for component efficiency, fin contact resistance, or packing quality are applied. Such factors are specific to a particular build and would improve agreement with one system at the cost of the like-for-like basis on which the five pairs are compared, so the absolute values are best read as an upper bound under idealized heat and mass transfer.
Author Contributions
M.M.K.: Conceptualization, methodology, software, validation, formal analysis, investigation, data curation, writing—original draft, writing—review and editing, and visualization. A.M.A.S.: Writing—review and editing and resources. P.Y.: Conceptualization, supervision, resources, writing—review and editing, and project administration. All authors have read and agreed to the published version of the manuscript.
Funding
The authors acknowledge financial support from the U.S. Department of Energy (DOE) under Contract No. DE-EE-0009716 through the Industrial Training and Assessment Center (ITAC) Program. Any opinions, findings, conclusions, or recommendations expressed in this publication are those of the authors and do not necessarily reflect the views of the DOE.
Data Availability Statement
The data that support the findings of this study are available from the corresponding author upon reasonable request.
Acknowledgments
During the preparation of this work, the authors used Anthropic Claude (Sonnet 4.6, claude.ai) to assist with manuscript review and to improve the readability and language of the text. After using this tool, the authors reviewed and edited the content as needed and take full responsibility for the content of the publication. All scientific content, simulation results, validation analysis, and conclusions are the work of the authors.
Conflicts of Interest
The authors declare no conflicts of interest.
Nomenclature
| Symbol | Description | Unit |
| Adsorbent/Bed | ||
| Mads | Adsorbent mass per bed | kg |
| Mmet | Bed heat exchanger metal mass | kg |
| w | Instantaneous adsorbate uptake | kg/kg |
| weq | Equilibrium adsorbate uptake | kg/kg |
| Δw | Uptake swing (wmax − wmin) | kg/kg |
| wmax | Maximum uptake at adsorption conditions | kg/kg |
| wmin | Minimum uptake at desorption conditions | kg/kg |
| W0 | Limiting micropore uptake capacity (D-A) | kg/kg |
| Cbed | Total thermal capacity of bed | J/K |
| UAhex | Bed heat exchanger conductance | W/K |
| Isotherm and Kinetics | ||
| E | Characteristic adsorption energy (D-A) | J/mol |
| n | Structural heterogeneity parameter (D-A) | — |
| A | Adsorption potential | J/mol |
| ks | Overall LDF mass transfer coefficient | s−1 |
| CLDF | LDF pre-exponential factor | s−1 |
| Ea | Activation energy for surface diffusion | J/mol |
| ΔHads | Isosteric heat of adsorption | J/kg |
| Heat Transfer | ||
| UAevap | Evaporator heat exchanger conductance | W/K |
| UAcond | Condenser heat exchanger conductance | W/K |
| UAleak | Evaporator heat leak conductance | W/K |
| ε | NTU effectiveness | — |
| εhr | Heat recovery phase effectiveness | — |
| Qhw | Heat input from hot water to desorbing bed | W |
| Qcw | Heat removed by cooling water from adsorbing bed | W |
| Qchill | Heat gained from chilled fluid in evaporator | W |
| Qcond,cw | Heat rejected from condenser to cooling water | W |
| Qcool | Total cycle cooling energy | J |
| Qheat | Total cycle heat input energy | J |
| Qhr | Heat exchanged during heat recovery phase | W |
| Temperatures | ||
| Thw | Hot water inlet temperature | °C |
| Tcw | Cooling water inlet temperature | °C |
| Tchill | Chilled fluid inlet temperature | °C |
| Tads | Adsorbing bed temperature | °C |
| Tdes | Desorbing bed temperature | °C |
| Tevap | Evaporator temperature | °C |
| Tcond | Condenser temperature | °C |
| Tevap,min | Minimum evaporator temperature at steady state | °C |
| Tamb | Ambient temperature surrounding evaporator shell | °C |
| Pressures | ||
| P | Refrigerant vapor pressure | kPa |
| Psat | Refrigerant saturation pressure | kPa |
| Pevap | Evaporator pressure | kPa |
| Pcond | Condenser pressure | kPa |
| Pavg | Geometric mean pressure during mass recovery | kPa |
| Refrigerant and Mass | ||
| Mref | Liquid refrigerant mass in evaporator | kg |
| Evaporator refrigerant evaporation rate | kg/s | |
| Condenser refrigerant condensation rate | kg/s | |
| Hot water mass flow rate | kg/s | |
| Cooling water mass flow rate | kg/s | |
| Chilled fluid mass flow rate | kg/s | |
| hfg | Latent heat of vaporization of refrigerant | J/kg |
| Performance Metrics | ||
| COP | Coefficient of performance | — |
| SCP | Specific cooling power | W/kg |
| Mads/Qsource | Sorbent sizing ratio | kg/kW |
| Cycle Timing | ||
| tads | Adsorption half-cycle time | s |
| tMR | Mass recovery phase duration | s |
| tHR | Heat recovery phase duration | s |
| tcycle | Total cycle time | s |
| τbed | Bed thermal time constant | s |
| τkin | LDF kinetic time constant | s |
| Fluid Properties | ||
| cp,met | Specific heat of bed metal | J/(kg·K) |
| cp,ads | Specific heat of dry adsorbent | J/(kg·K) |
| cp,liq | Specific heat of liquid refrigerant | J/(kg·K) |
| cp,vap | Specific heat of refrigerant vapor | J/(kg·K) |
| cp,w | Specific heat of water | J/(kg·K) |
| Universal Constants | ||
| R | Universal gas constant | J/(mol·K) |
Appendix A
Table A1.
Global refit of four isotherm forms to the source data of each pair. P in Pa, T in K, and uptake in kg/kg.
Table A2.
Parameters of the ACF(A-20)/ethanol chiller of Saha et al. [29] used in Section 4.1.2 .
References
- Liu, G.; Ji, D.; Markides, C.N. Progress and prospects of low-grade thermal energy utilization technologies. Appl. Therm. Eng. 2024, 254, 123859. [Google Scholar] [CrossRef] [Scilit]
- Zhang, C.; Liu, X. Editorial: Low-grade thermal energy conversion and utilization. Front. Energy Res. 2024, 12, 1429487. [Google Scholar] [CrossRef] [Scilit]
- Al-Sayyab, A.K.S.; Mota-Babiloni, A.; Navarro-Esbrí, J. Renewable and waste heat applications for heating, cooling, and power generation based on advanced configurations. Energy Convers. Manag. 2023, 291, 117253. [Google Scholar] [CrossRef] [Scilit]
- International Energy Agency (IEA). World Energy Outlook 2024. 2024. Available online: www.iea.org/terms (accessed on 5 February 2026).
- Loni, R.; Mahian, O.; Najafi, G.; Sahin, A.Z.; Rajaee, F.; Kasaeian, A.; Mehrpooya, M.; Bellos, E.; le Roux, W.G. A critical review of power generation using geothermal-driven organic Rankine cycle. Therm. Sci. Eng. Prog. 2021, 25, 101028. [Google Scholar] [CrossRef] [Scilit]
- Mana, A.A.; Kaitouni, S.I.; Kousksou, T.; Jamil, A. Enhancing sustainable energy conversion: Comparative study of superheated and recuperative ORC systems for waste heat recovery and geothermal applications, with focus on 4E performance. Energy 2023, 284, 128654. [Google Scholar] [CrossRef] [Scilit]
- Boruta, P.; Bujok, T.; Mika, Ł.; Sztekler, K. Adsorbents, Working Pairs and Coated Beds for Natural Refrigerants in Adsorption Chillers—State of the Art. Energies 2021, 14, 4707. [Google Scholar] [CrossRef] [Scilit]
- Guan, Y.; Chen, Y.; Cao, P.; Song, Z.; Liu, X.; Gani, R. Prediction of binary azeotropes of refrigerant systems through COSMO-based models. AIChE J. 2026, 72, e70232. [Google Scholar] [CrossRef] [Scilit]
- Chauhan, P.R.; Kaushik, S.C.; Tyagi, S.K. Current status and technological advancements in adsorption refrigeration systems: A review. Renew. Sustain. Energy Rev. 2022, 154, 111808. [Google Scholar] [CrossRef] [Scilit]
- Sah, R.P.; Choudhury, B.; Das, R.K. A review on low grade heat powered adsorption cooling systems for ice production. Renew. Sustain. Energy Rev. 2016, 62, 109–120. [Google Scholar] [CrossRef] [Scilit]
- Vivian, J.; Heer, P.; Fiorentini, M. Optimal sizing and operation of seasonal ice thermal storage systems. Energy Build. 2023, 300, 113633. [Google Scholar] [CrossRef] [Scilit]
- Hamid, M.; Mengjie, S.; Hadibi, T.; Mohasan, M.; Uglanov, D.A.; Zekang, Z. Research progress and challenges in the preparation and application of ice-making technology. Renew. Sustain. Energy Rev. 2025, 223, 115996. [Google Scholar] [CrossRef] [Scilit]
- Elsheniti, M.B.; AlRabiah, A.; Al-Ansary, H.; Almutairi, Z.; Orfi, J.; El-Leathy, A. Performance Assessment of an Ice-Production Hybrid Solar CPV/T System Combining Both Adsorption and Vapor-Compression Refrigeration Systems. Sustainability 2023, 15, 3711. [Google Scholar] [CrossRef] [Scilit]
- Abdel-Dayem, A.M.; Baharith, M.A. Numerical Simulation and Optimization of a Solar Adsorption Icemaker. Int. J. Heat Technol. 2022, 40, 1033–1043. [Google Scholar] [CrossRef] [Scilit]
- Muttakin, M.; Pal, A.; Rupa, M.J.; Ito, K.; Saha, B.B. A critical overview of adsorption kinetics for cooling and refrigeration systems. Adv. Colloid Interface Sci. 2021, 294, 102468. [Google Scholar] [CrossRef] [Scilit] [PubMed]
- Mohammed, R.H.; Mesalhy, O.; Abdelkareem, M.; Su, M.; Chow, L.C. Revisiting the adsorption equilibrium equations of silica-gel/water for adsorption cooling applications. Int. J. Refrig. 2018, 86, 40–47. [Google Scholar] [CrossRef] [Scilit]
- Frazzica, A.; Palomba, V.; Dawoud, B.; Gullì, G.; Brancato, V.; Sapienza, A.; Vasta, S.; Freni, A.; Costa, F.; Restuccia, G. Design, realization and testing of an adsorption refrigerator based on activated carbon/ethanol working pair. Appl. Energy 2016, 174, 15–24. [Google Scholar] [CrossRef] [Scilit]
- Lache, M.; Kappelhoff, C.; Seiler, J.; Bardow, A. Water and Ethanol as Refrigerant Mixture Enabling Adsorption Cooling below 0 °C. Energy Technol. 2023, 11, 2201158. [Google Scholar] [CrossRef] [Scilit]
- He, F.; Nagano, K.; Togawa, J. Performance prediction of an adsorption chiller combined with heat recovery and mass recovery by a three-dimensional model. Energy 2023, 277, 127541. [Google Scholar] [CrossRef] [Scilit]
- Shen, J.; Kumar, A.; Wahiduzzaman, M.; Barpaga, D.; Maurin, G.; Motkuri, R.K. Engineered Nanoporous Frameworks for Adsorption Cooling Applications. Chem. Rev. 2024, 124, 7619–7673. [Google Scholar] [CrossRef] [Scilit] [PubMed]
- Liu, Z.; Gao, J.; Qi, X.; Zhao, Z.; Sun, H. Experimental Study on Activated Carbon-MIL-101(Cr) Composites for Ethanol Vapor Adsorption. Materials 2021, 14, 3811. [Google Scholar] [CrossRef] [Scilit] [PubMed]
- Kummer, H.; Baumgartner, M.; Hügenell, P.; Fröhlich, D.; Henninger, S.K.; Gläser, R. Thermally driven refrigeration by methanol adsorption on coatings of HKUST-1 and MIL-101(Cr). Appl. Therm. Eng. 2017, 117, 689–697. [Google Scholar] [CrossRef] [Scilit]
- Rezk, A.; AL-Dadah, R.; Mahmoud, S.; Elsayed, A. Investigation of Ethanol/metal organic frameworks for low temperature adsorption cooling applications. Appl. Energy 2013, 112, 1025–1031. [Google Scholar] [CrossRef] [Scilit]
- Henninger, M.; Engelpracht, M.; Tuchlinski, D.; Ismail, M.; Bardow, A.; Seiler, J. Water, ethanol, or methanol for adsorption chillers? Model-based performance prediction from Infrared–Large-Temperature-Jump experiments. Appl. Therm. Eng. 2024, 236, 121816. [Google Scholar] [CrossRef] [Scilit]
- Makahleh, F.M.; Badran, A.A.; Attar, H.; Amer, A.; Al-Maaitah, A.A. Modeling and Simulation of a Two-Stage Air Cooled Adsorption Chiller with Heat Recovery Part I: Physical and Mathematical Performance Model. Appl. Sci. 2022, 12, 6542. [Google Scholar] [CrossRef] [Scilit]
- Lee, J.-G.; Bae, K.J.; Kwon, O.K. Performance Investigation of a Two-Bed Type Adsorption Chiller with Various Adsorbents. Energies 2020, 13, 2553. [Google Scholar] [CrossRef] [Scilit]
- Amin, M. Modelling and performance assessment of a two-bed adsorption chiller at different operating conditions. Yanbu J. Eng. Sci. 2025, 20, 32–43. [Google Scholar] [CrossRef] [Scilit]
- Saha, B.B.; El-Sharkawy, I.I.; Chakraborty, A.; Koyama, S. Study on an activated carbon fiber-ethanol adsorption chiller: Part II—Performance evaluation. Int. J. Refrig. 2007, 30, 96–102. [Google Scholar] [CrossRef] [Scilit]
- Saha, B.B.; El-Sharkawy, I.I.; Chakraborty, A.; Koyama, S. Study on an activated carbon fiber–ethanol adsorption chiller: Part I—System description and modelling. Int. J. Refrig. 2007, 30, 86–95. [Google Scholar] [CrossRef] [Scilit]
- El-Sharkawy, I.I.; Saha, B.B.; Koyama, S.; He, J.; Ng, K.C.; Yap, C. Experimental investigation on activated carbon–ethanol pair for solar powered adsorption cooling applications. Int. J. Refrig. 2008, 31, 1407–1413. [Google Scholar] [CrossRef] [Scilit]
- Elsheniti, M.B.; Eissa, M.S.; Al-Ansary, H.; Orfi, J.; Elsamni, O.; El-Leathy, A. Examination of Using Aluminum-Foam/Finned-Tube Beds Packed with Maxsorb III for Adsorption Ice Production System. Energies 2022, 15, 2757. [Google Scholar] [CrossRef] [Scilit]
- Chupka, G.M.; Christensen, E.; Fouts, L.; Alleman, T.L.; Ratcliff, M.A.; McCormick, R.L. Heat of Vaporization Measurements for Ethanol Blends Up To 50 Volume Percent in Several Hydrocarbon Blendstocks and Implications for Knock in SI Engines. SAE Int. J. Fuels Lubr. 2015, 8, 251–263. [Google Scholar] [CrossRef] [Scilit]
- Rezk, A.; Al-Dadah, R.; Mahmoud, S.; Elsayed, A. Characterisation of metal organic frameworks for adsorption cooling. Int. J. Heat Mass Transf. 2012, 55, 7366–7374. [Google Scholar] [CrossRef] [Scilit]
- Shabir, F.; Sultan, M.; Niaz, Y.; Usman, M.; Ibrahim, S.M.; Feng, Y.; Naik, B.K.; Nasir, A.; Ali, I. Steady-State Investigation of Carbon-Based Adsorbent–Adsorbate Pairs for Heat Transformation Application. Sustainability 2020, 12, 7040. [Google Scholar] [CrossRef] [Scilit]
- Gibelhaus, A.; Postweiler, P.; Bardow, A. Efficient modeling of adsorption chillers: Avoiding discretization by operator splitting. Int. J. Refrig. 2022, 139, 180–191. [Google Scholar] [CrossRef] [Scilit]
- Hutson, N.D.; Yang, R.T. Theoretical Basis for the Dubinin-Radushkevitch (D-R) Adsorption Isotherm Equation. Adsorption 1997, 3, 189–195. [Google Scholar] [CrossRef] [Scilit]
- Erdem-Şenatalar, A.; Tatller, M.; Sirkecioğlu, A. The relationship of the geometric factor in the Dubinin–Astakhov isotherm equation with the fractal dimension. Colloids Surf. A Physicochem. Eng. Asp. 2000, 173, 51–59. [Google Scholar] [CrossRef] [Scilit]
- Muttakin, M.; Mitra, S.; Thu, K.; Ito, K.; Saha, B.B. Theoretical framework to evaluate minimum desorption temperature for IUPAC classified adsorption isotherms. Int. J. Heat Mass Transf. 2018, 122, 795–805. [Google Scholar] [CrossRef] [Scilit]
- El-Sharkawy, I.I.; Uddin, K.; Miyazaki, T.; Saha, B.B.; Koyama, S.; Kil, H.-S.; Yoon, S.-H.; Miyawaki, J. Adsorption of ethanol onto phenol resin based adsorbents for developing next generation cooling systems. Int. J. Heat Mass Transf. 2015, 81, 171–178. [Google Scholar] [CrossRef] [Scilit]
- El-Sharkawy, I.I.; Kuwahara, K.; Saha, B.B.; Koyama, S.; Ng, K.C. Experimental investigation of activated carbon fibers/ethanol pairs for adsorption cooling system application. Appl. Therm. Eng. 2006, 26, 859–865. [Google Scholar] [CrossRef] [Scilit]
- Rupa, M.J.; Pal, A.; Mitra, S.; Saha, B.B. Time adapted linear driving force model for gas adsorption onto solids. Chem. Eng. J. 2021, 420, 129785. [Google Scholar] [CrossRef] [Scilit]
- El-Sharkawy, I.I. On the linear driving force approximation for adsorption cooling applications. Int. J. Refrig. 2011, 34, 667–673. [Google Scholar] [CrossRef] [Scilit]
- Kyle, B.G. Chemical and Process Thermodynamics; Prentice-Hall: Hoboken, NJ, USA, 1984. [Google Scholar]
- Krishnappa, A.K.; Kapilan, N.; Kasthurirengan, S.; Ashwathnarayana, D.P. Experimental and Simulation Study of a Solar Assisted Two Bed Adsorption Refrigeration System Using Activated Carbon-Methanol. Int. J. Heat Technol. 2023, 41, 293–303. [Google Scholar] [CrossRef] [Scilit]
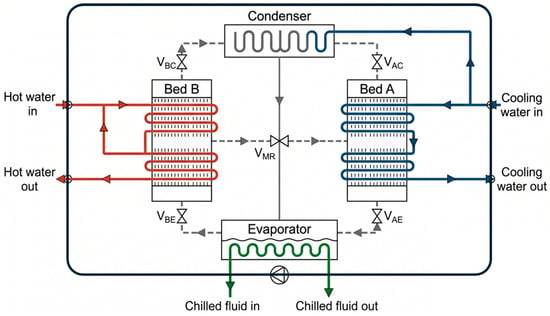
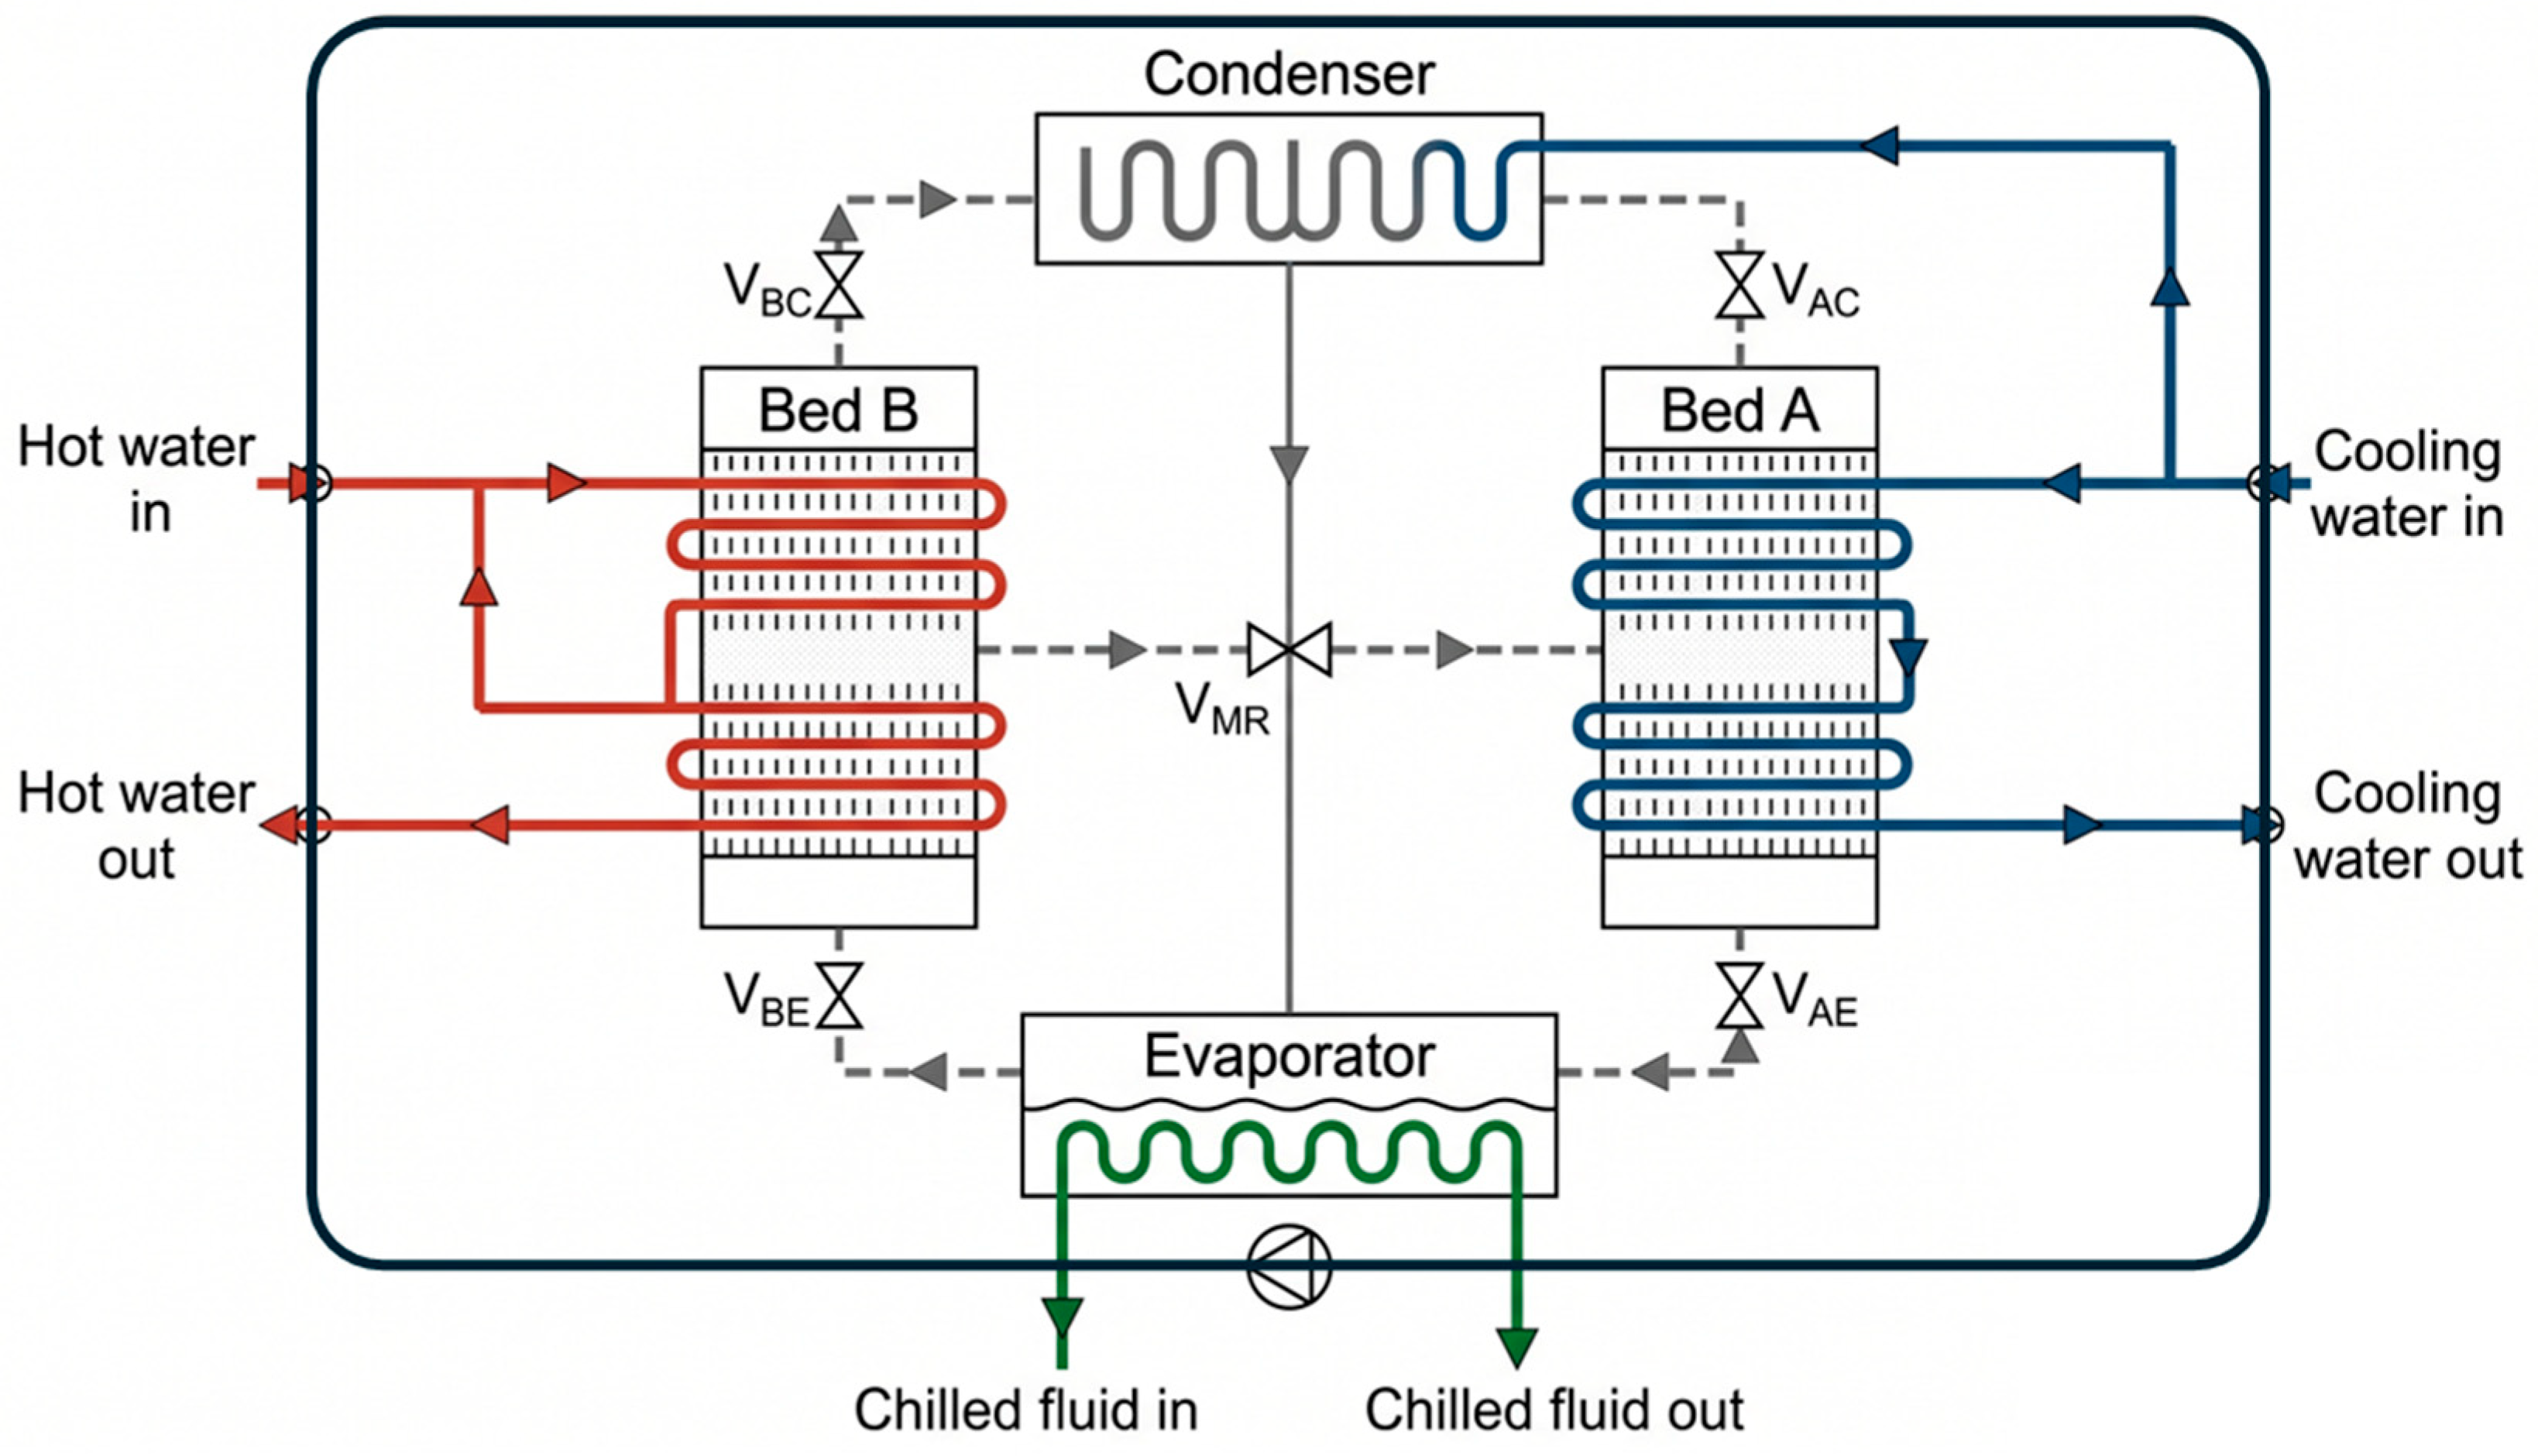
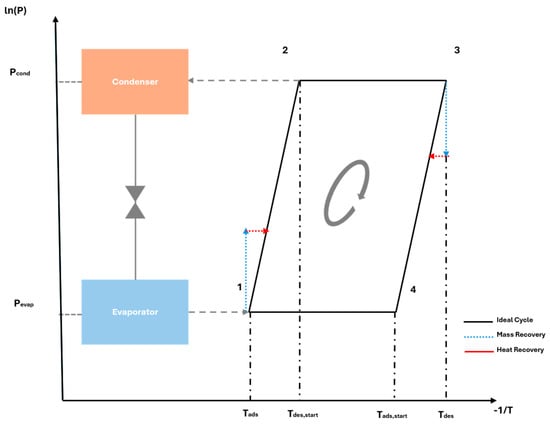
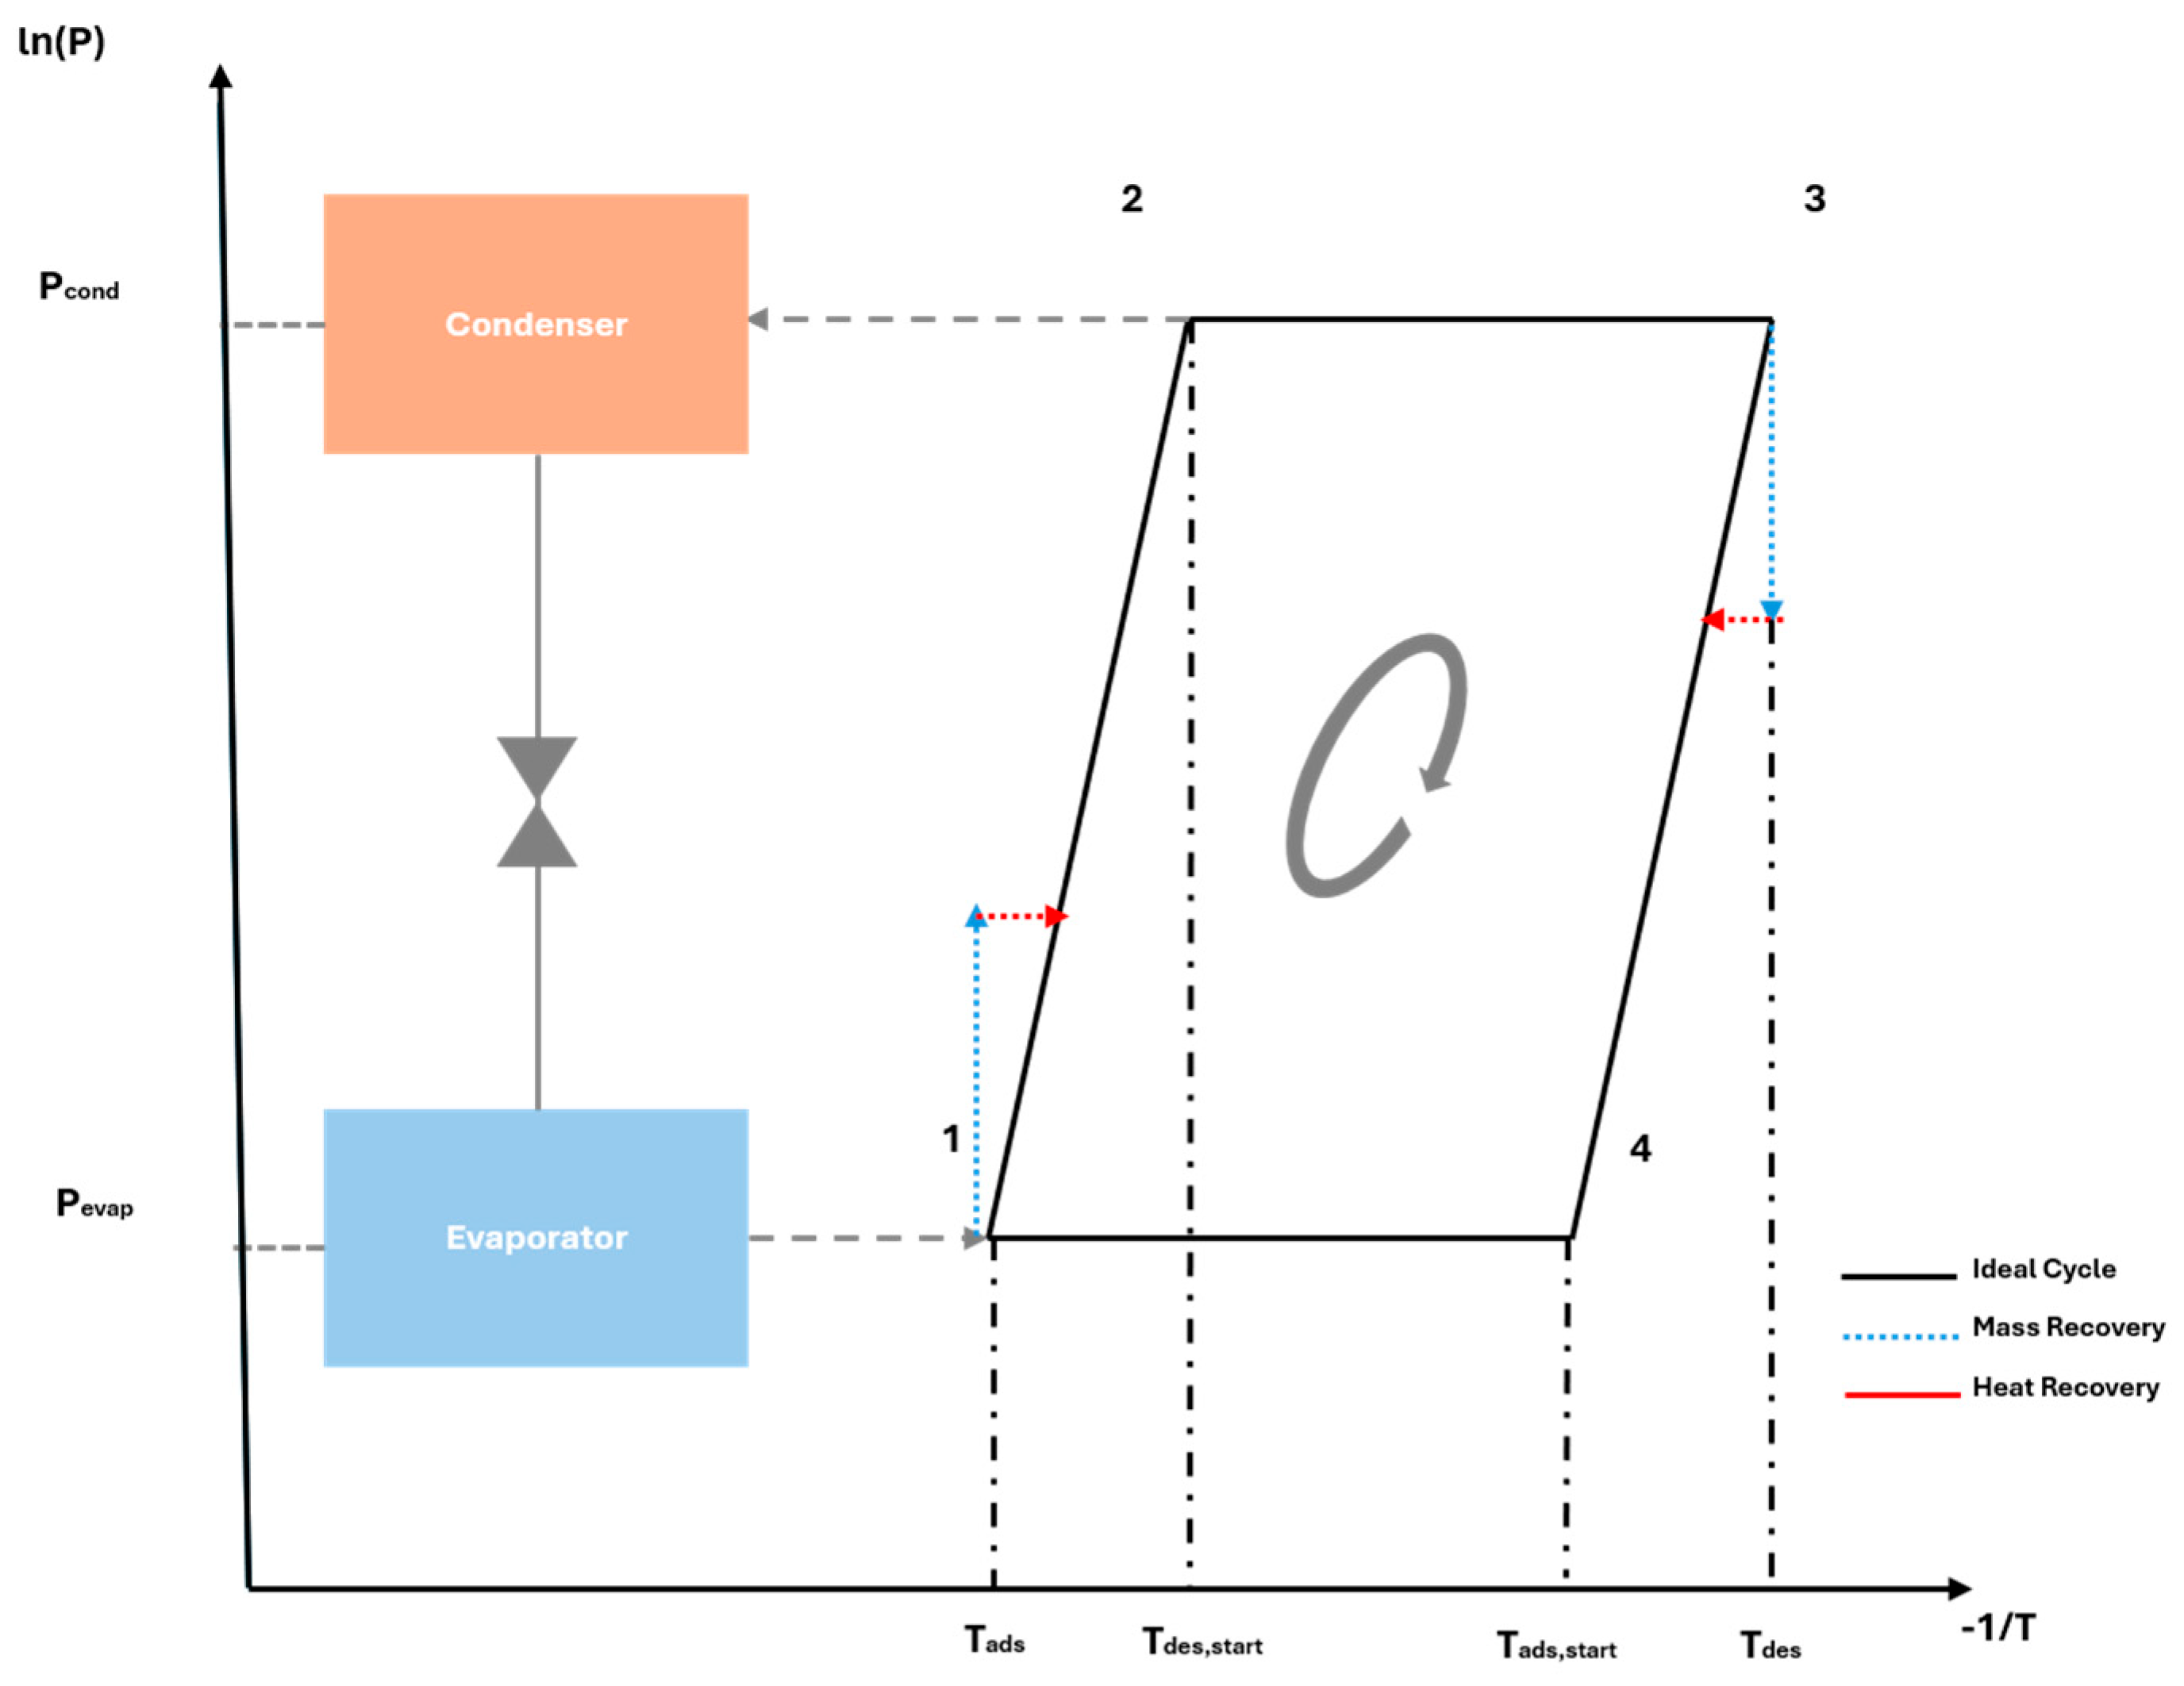
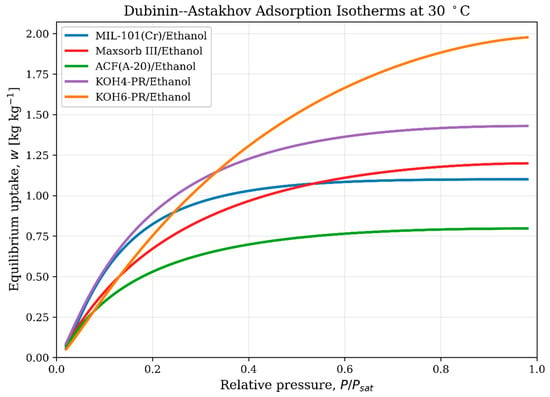
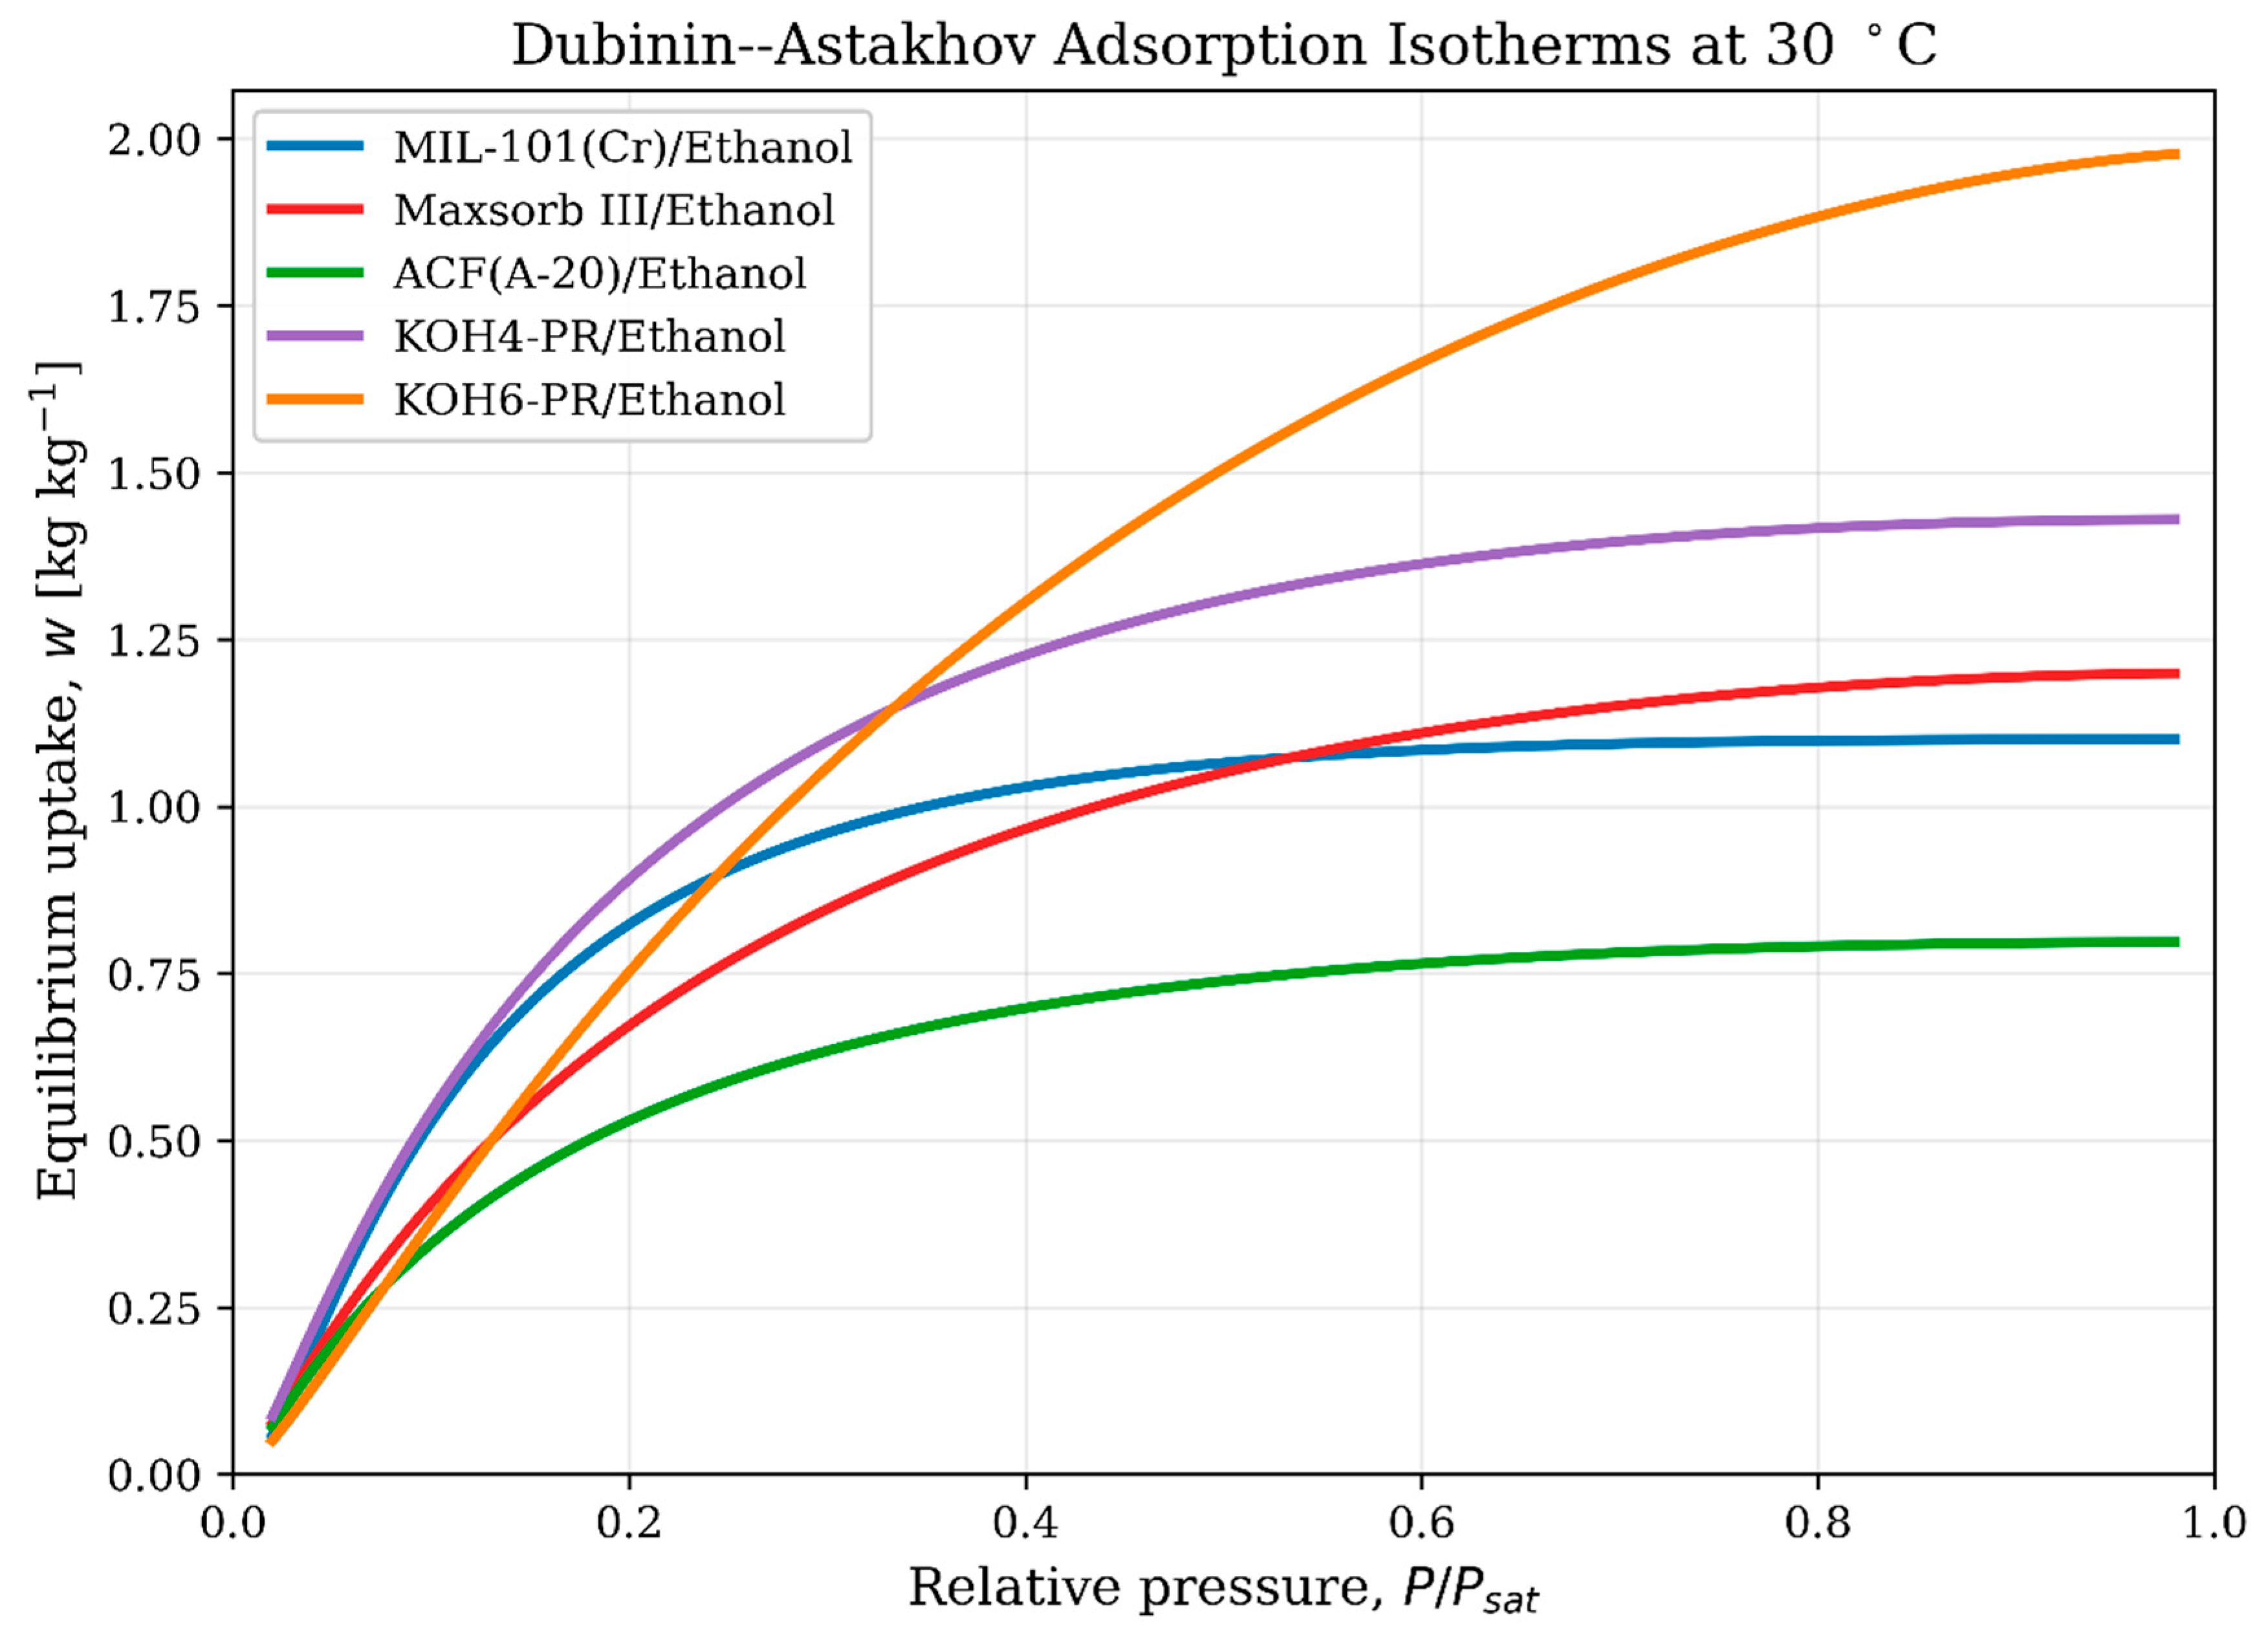
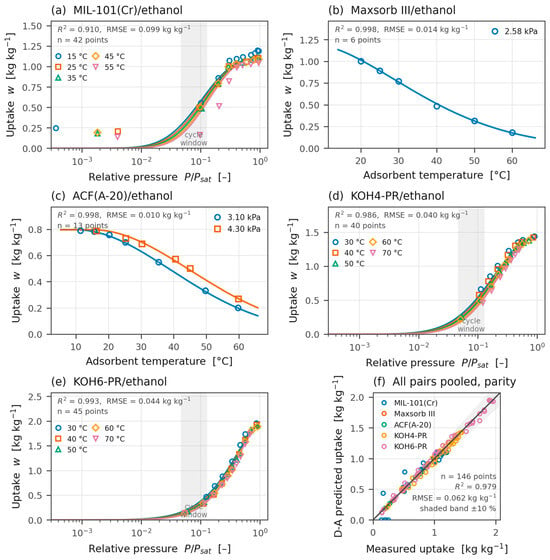
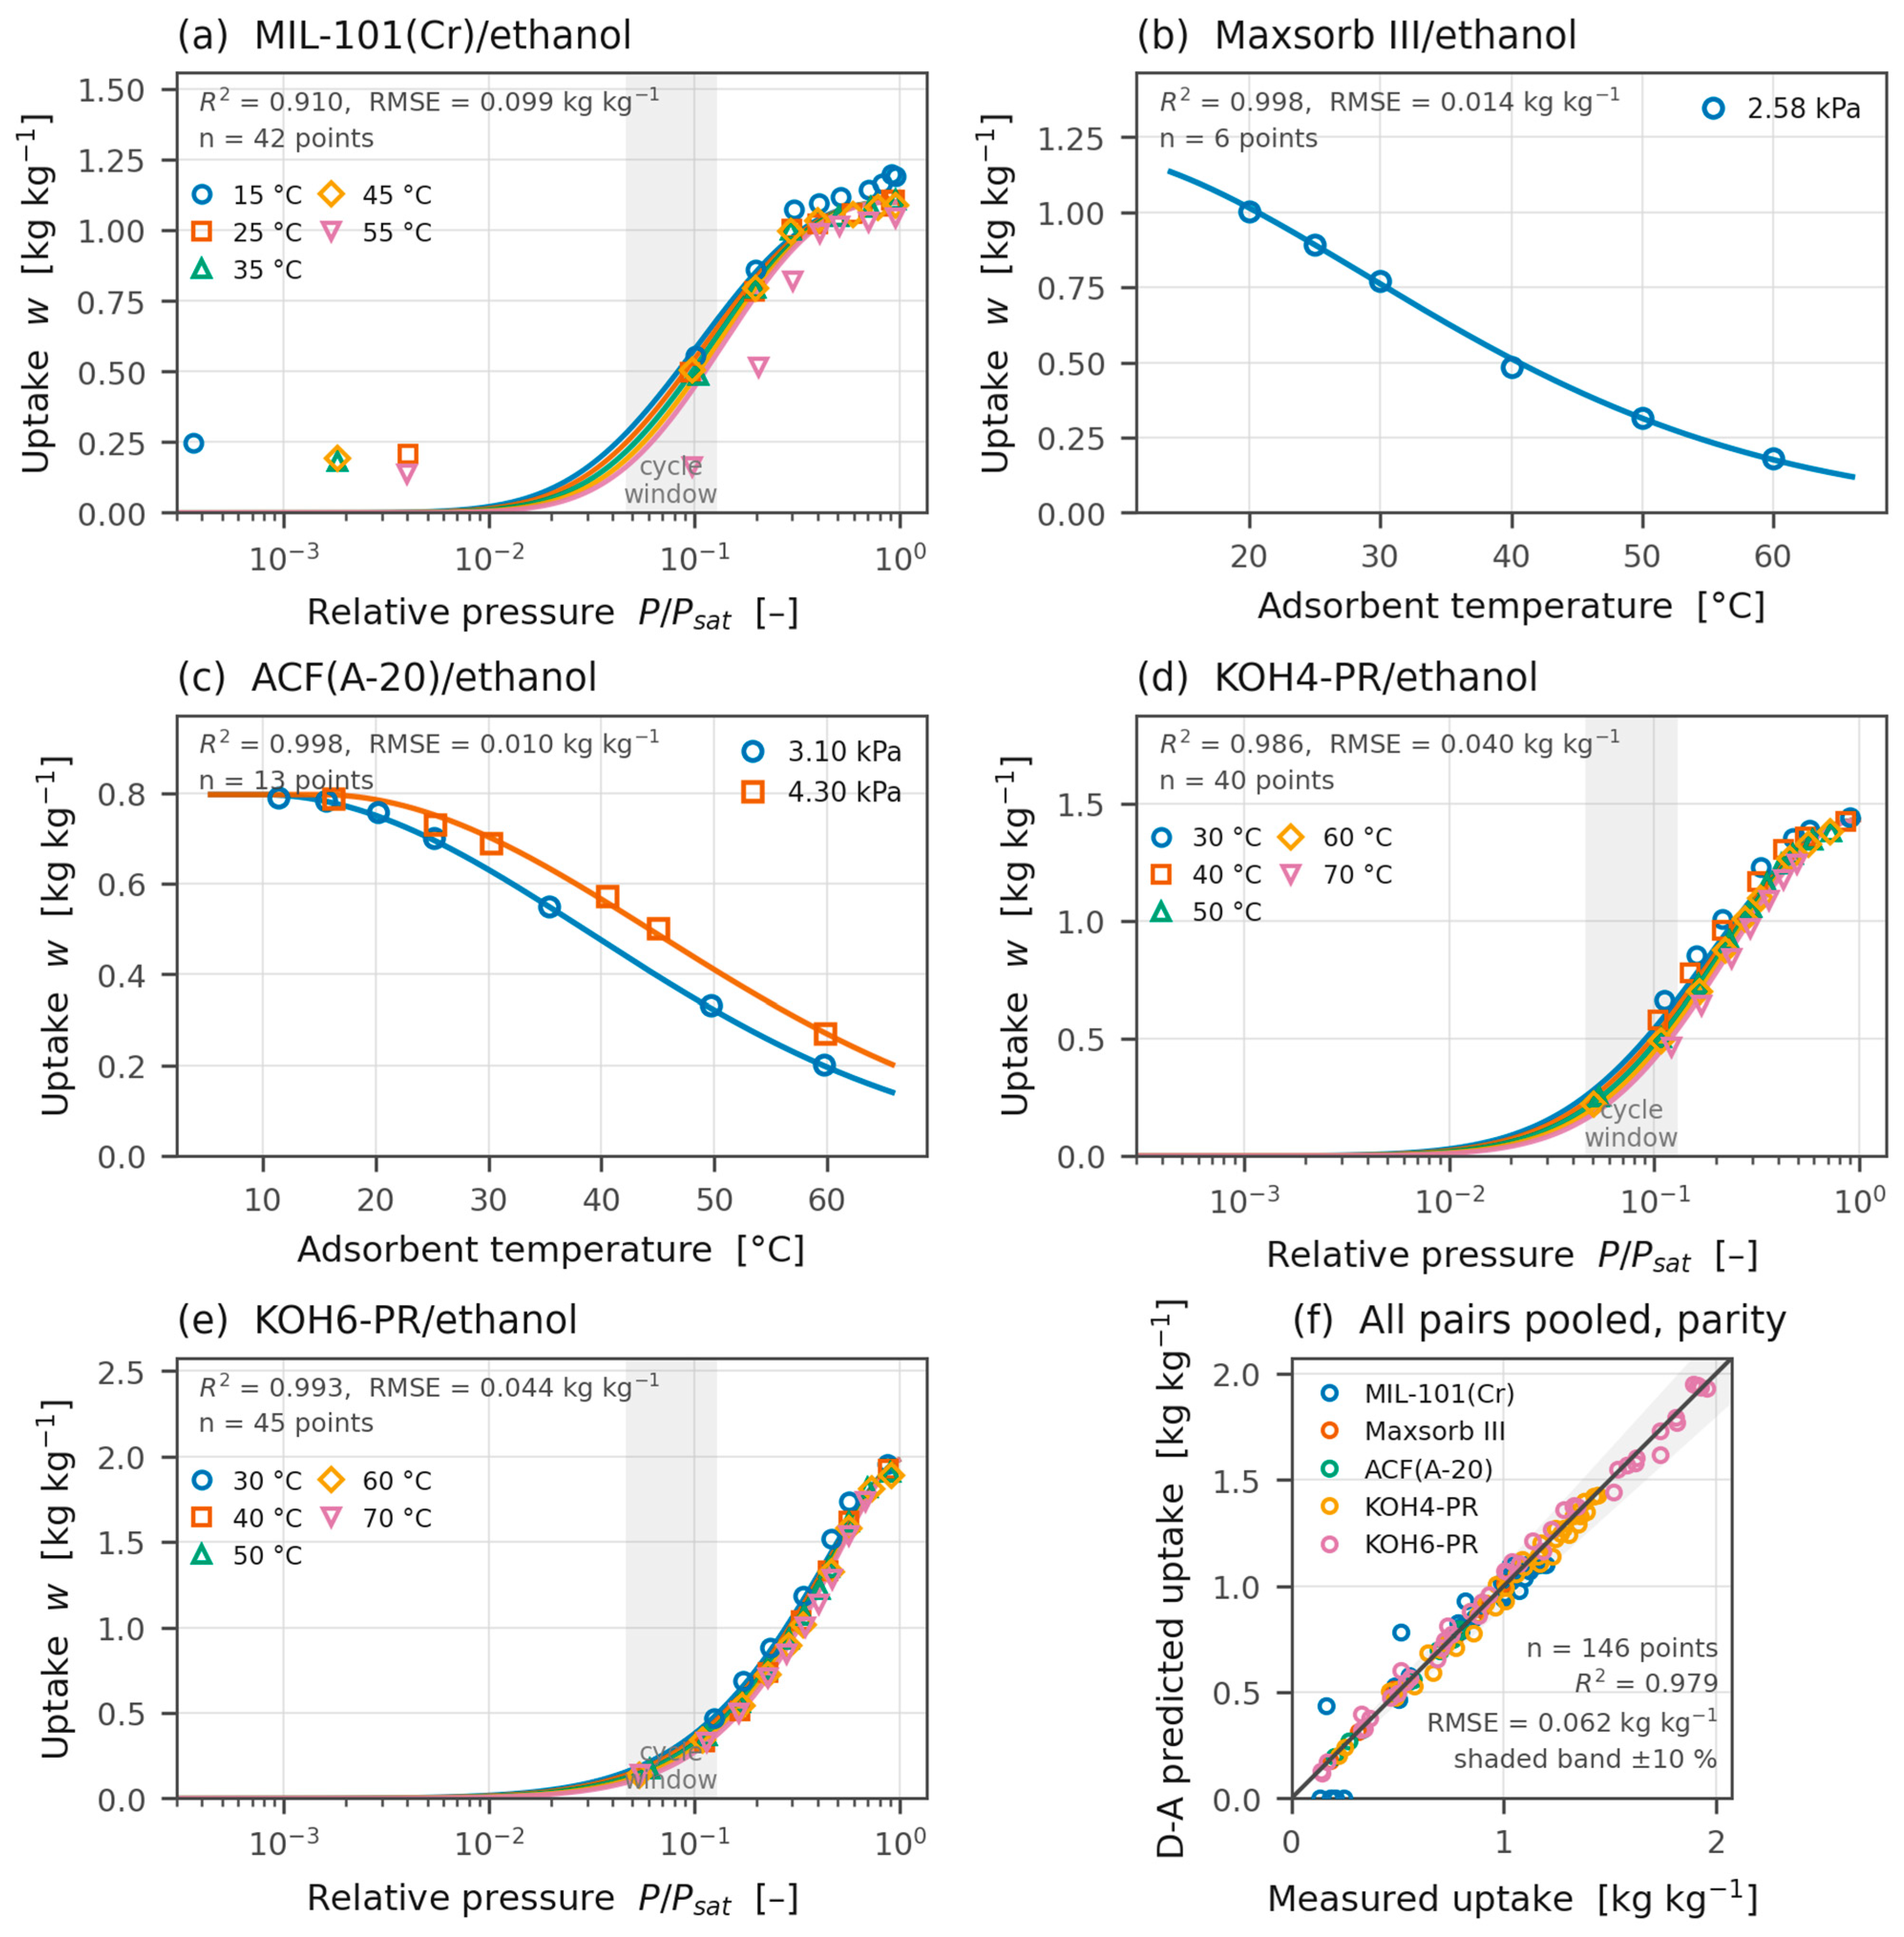
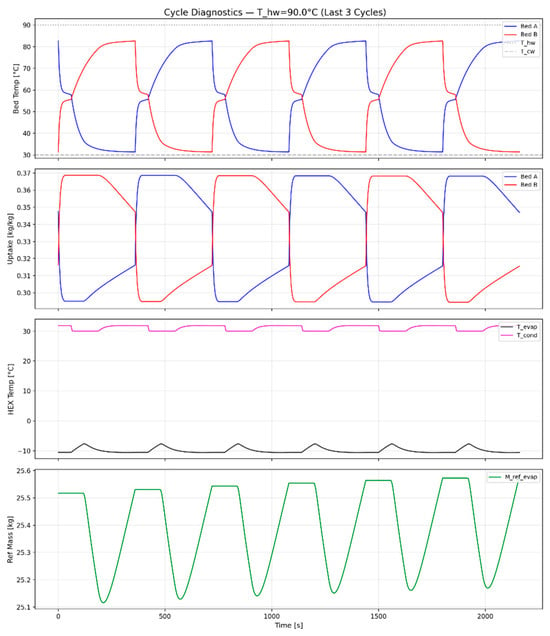
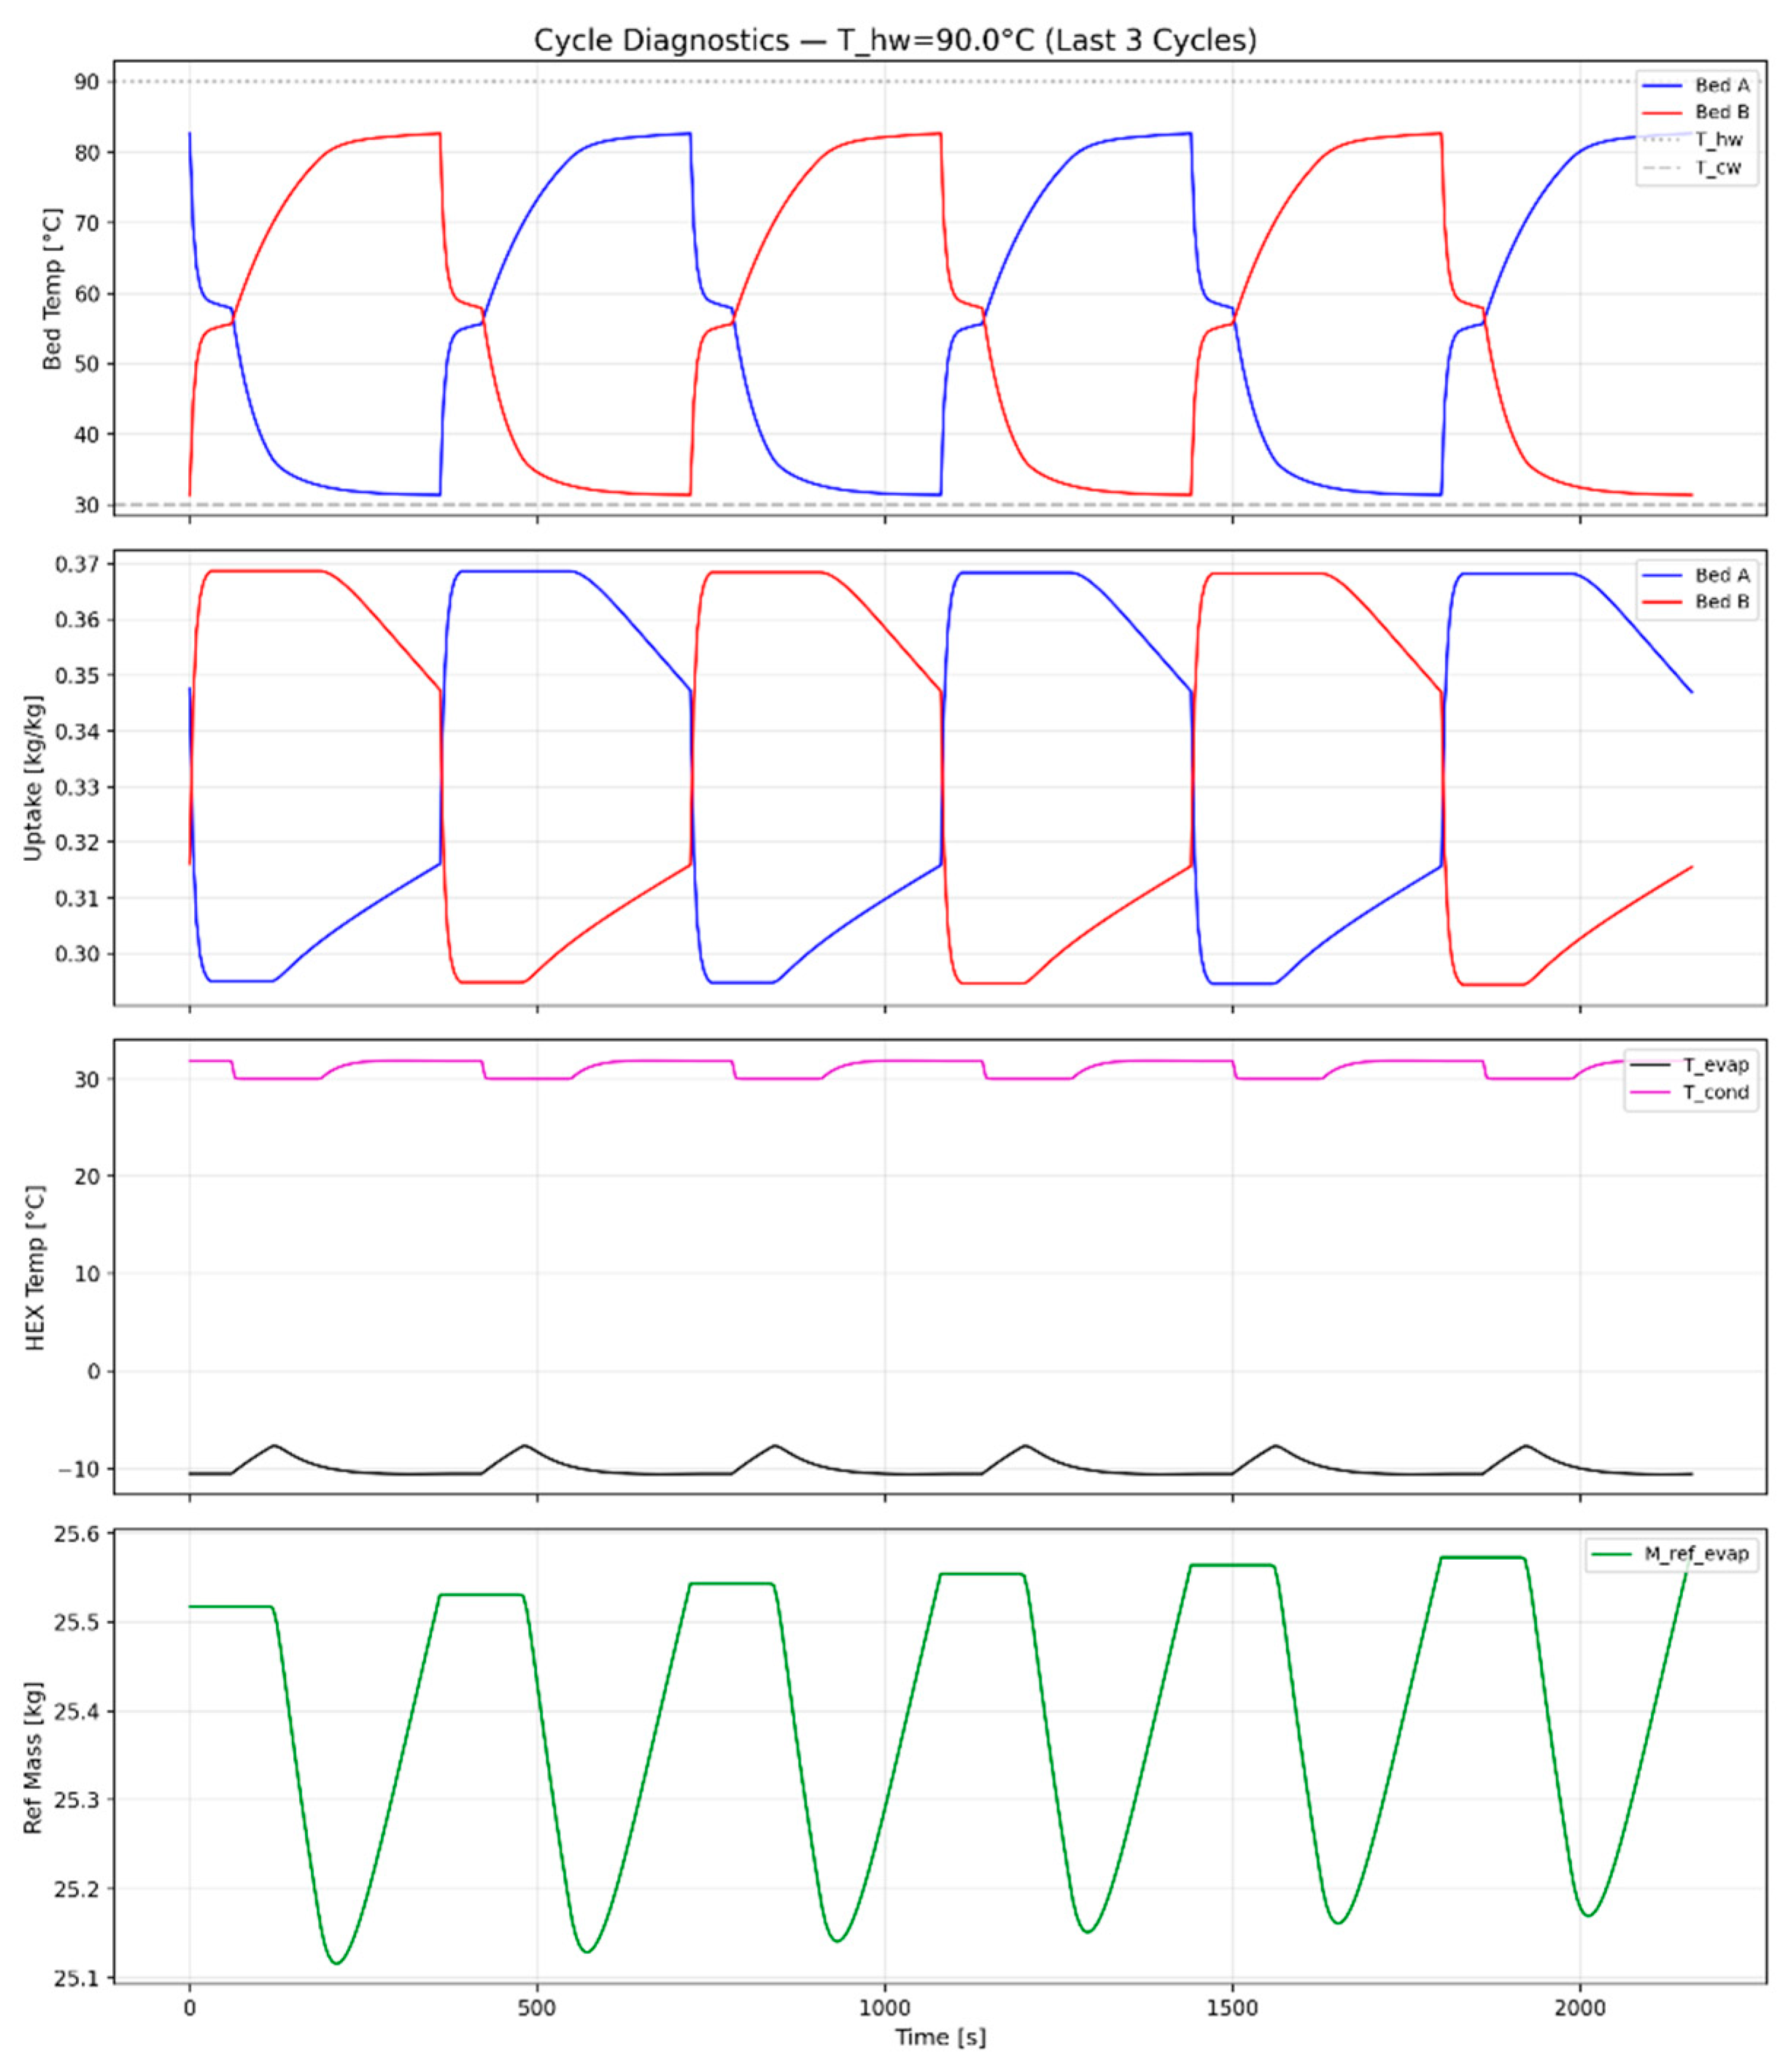
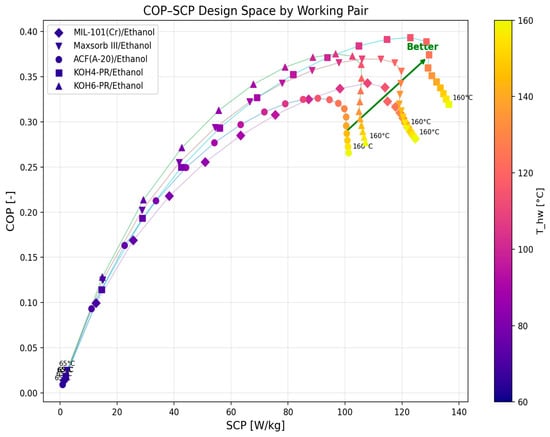
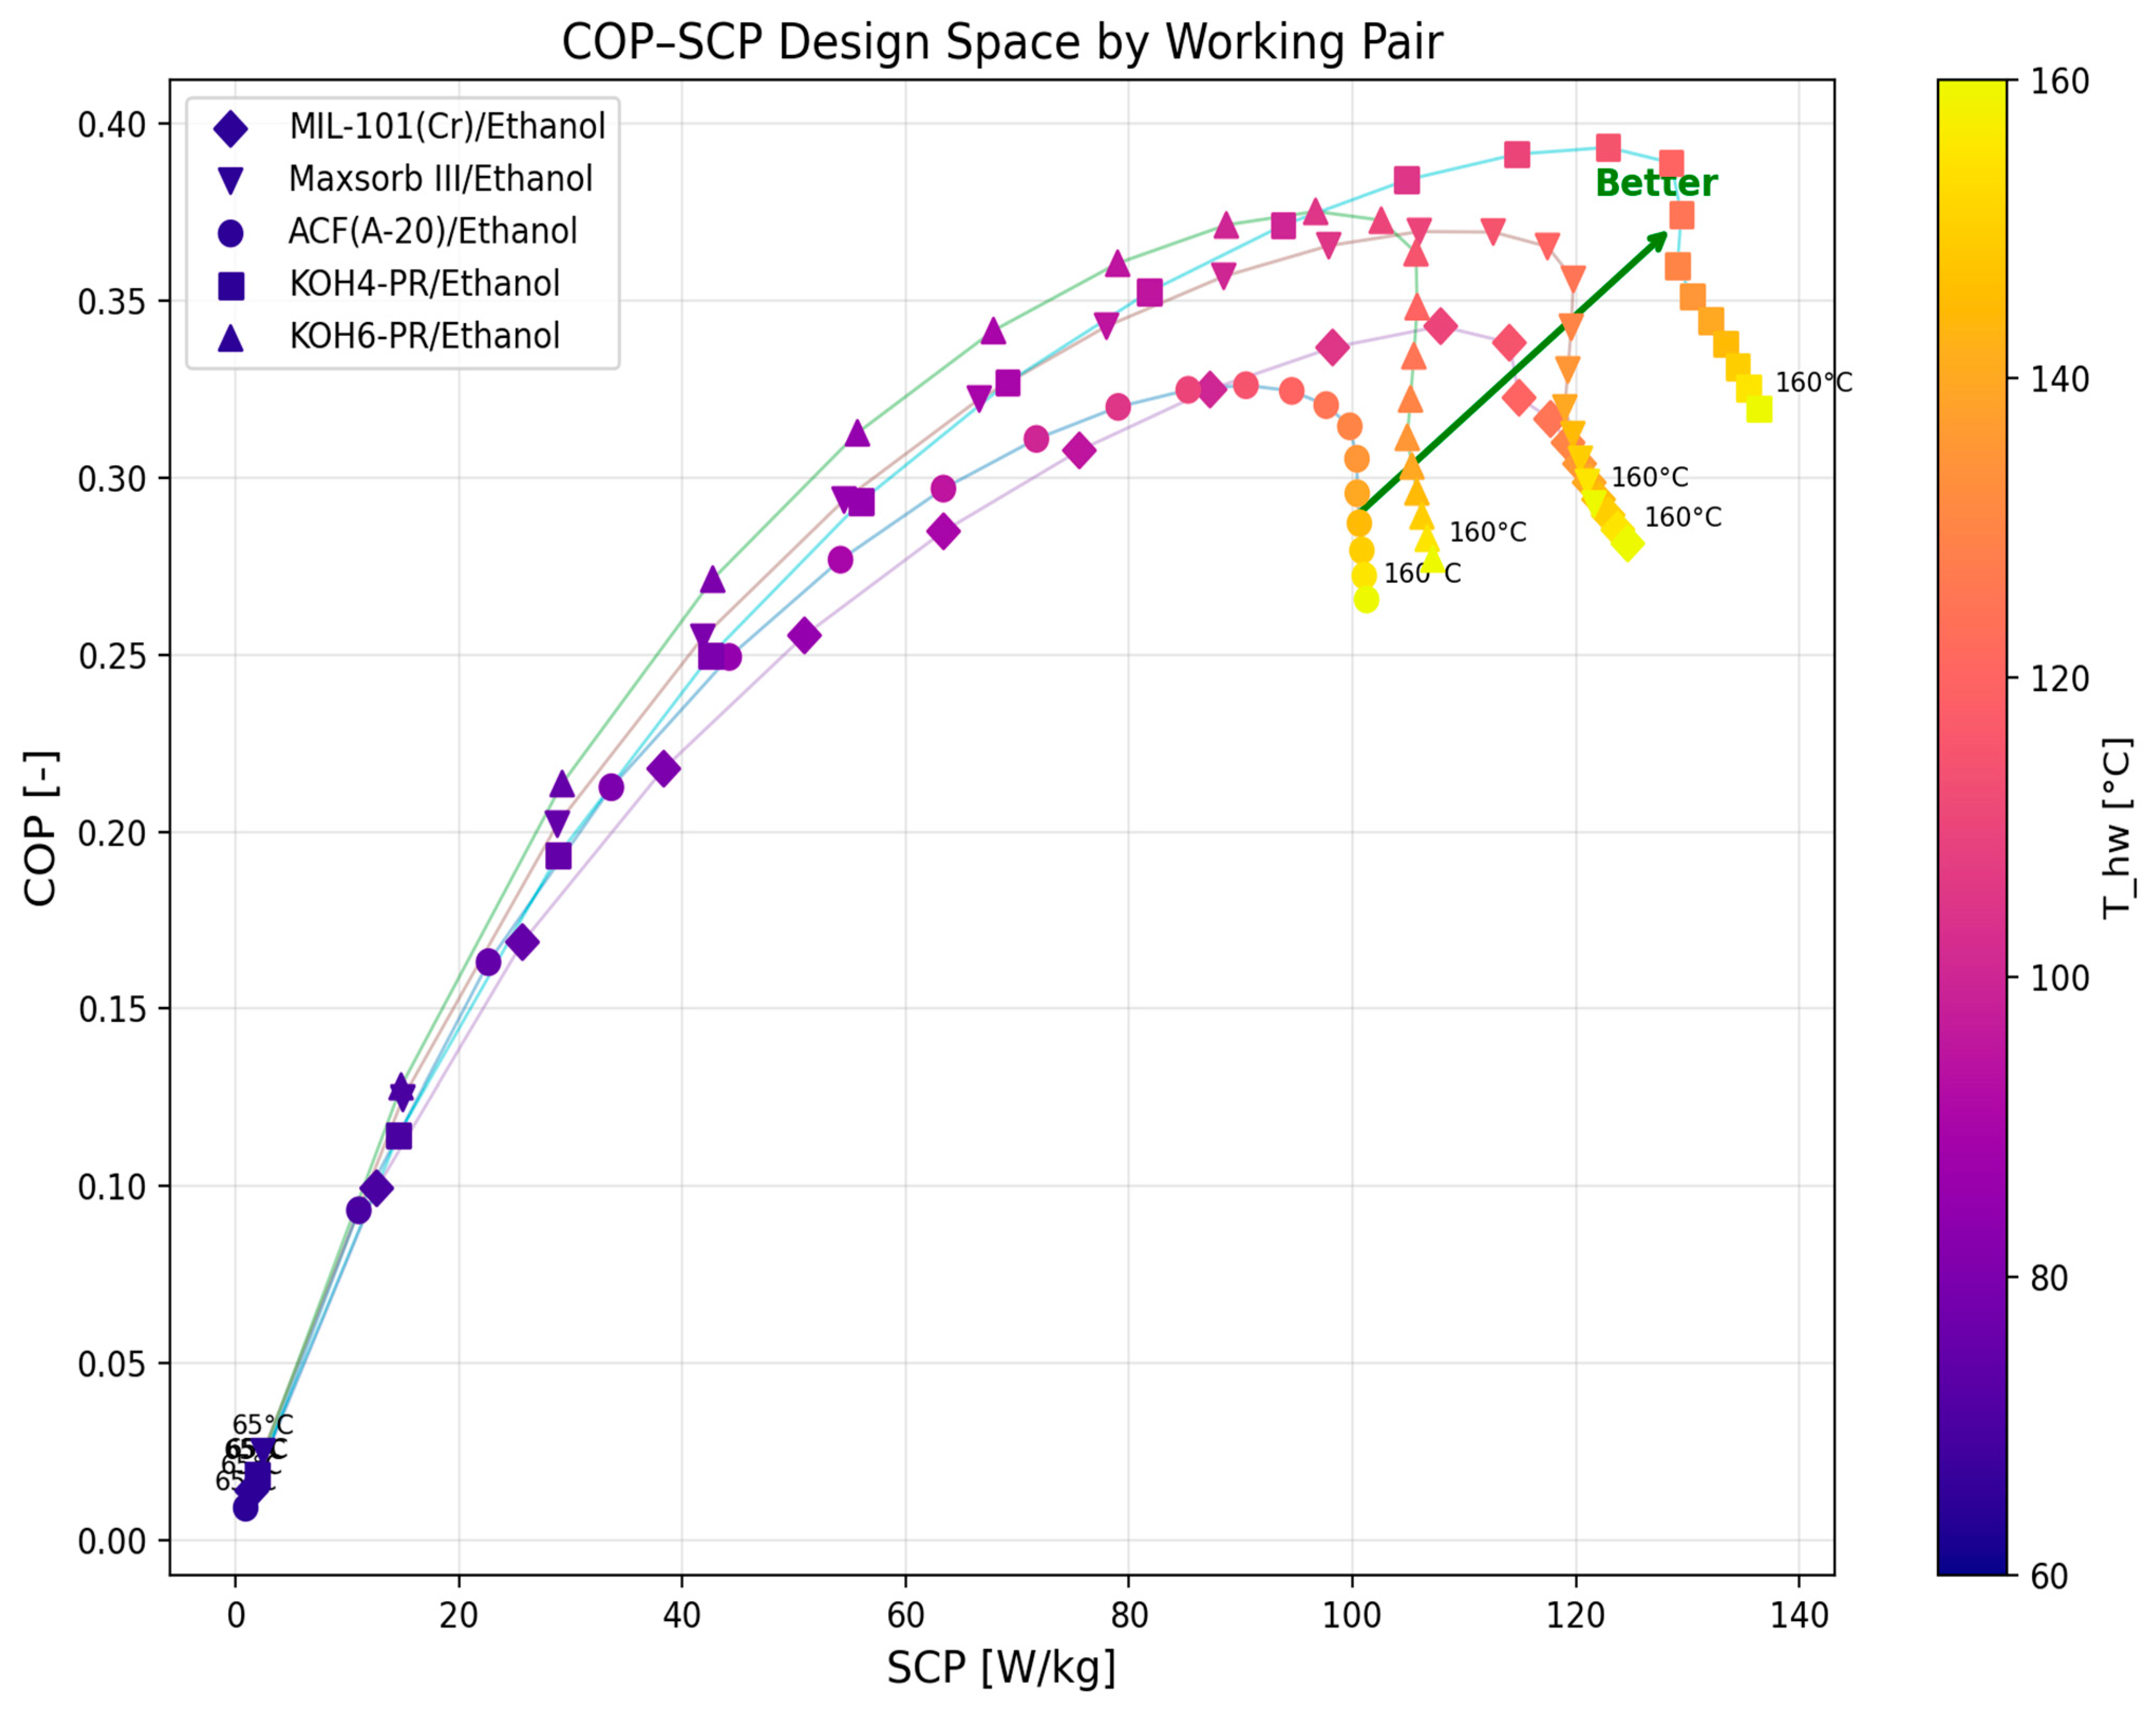
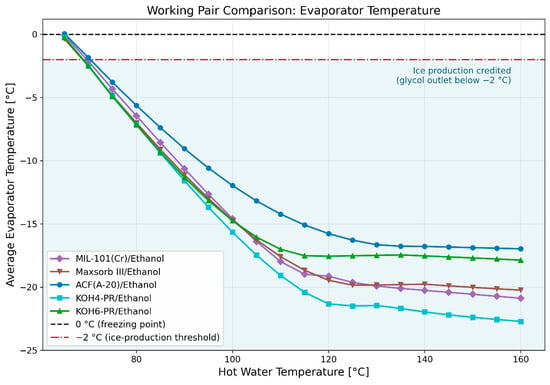
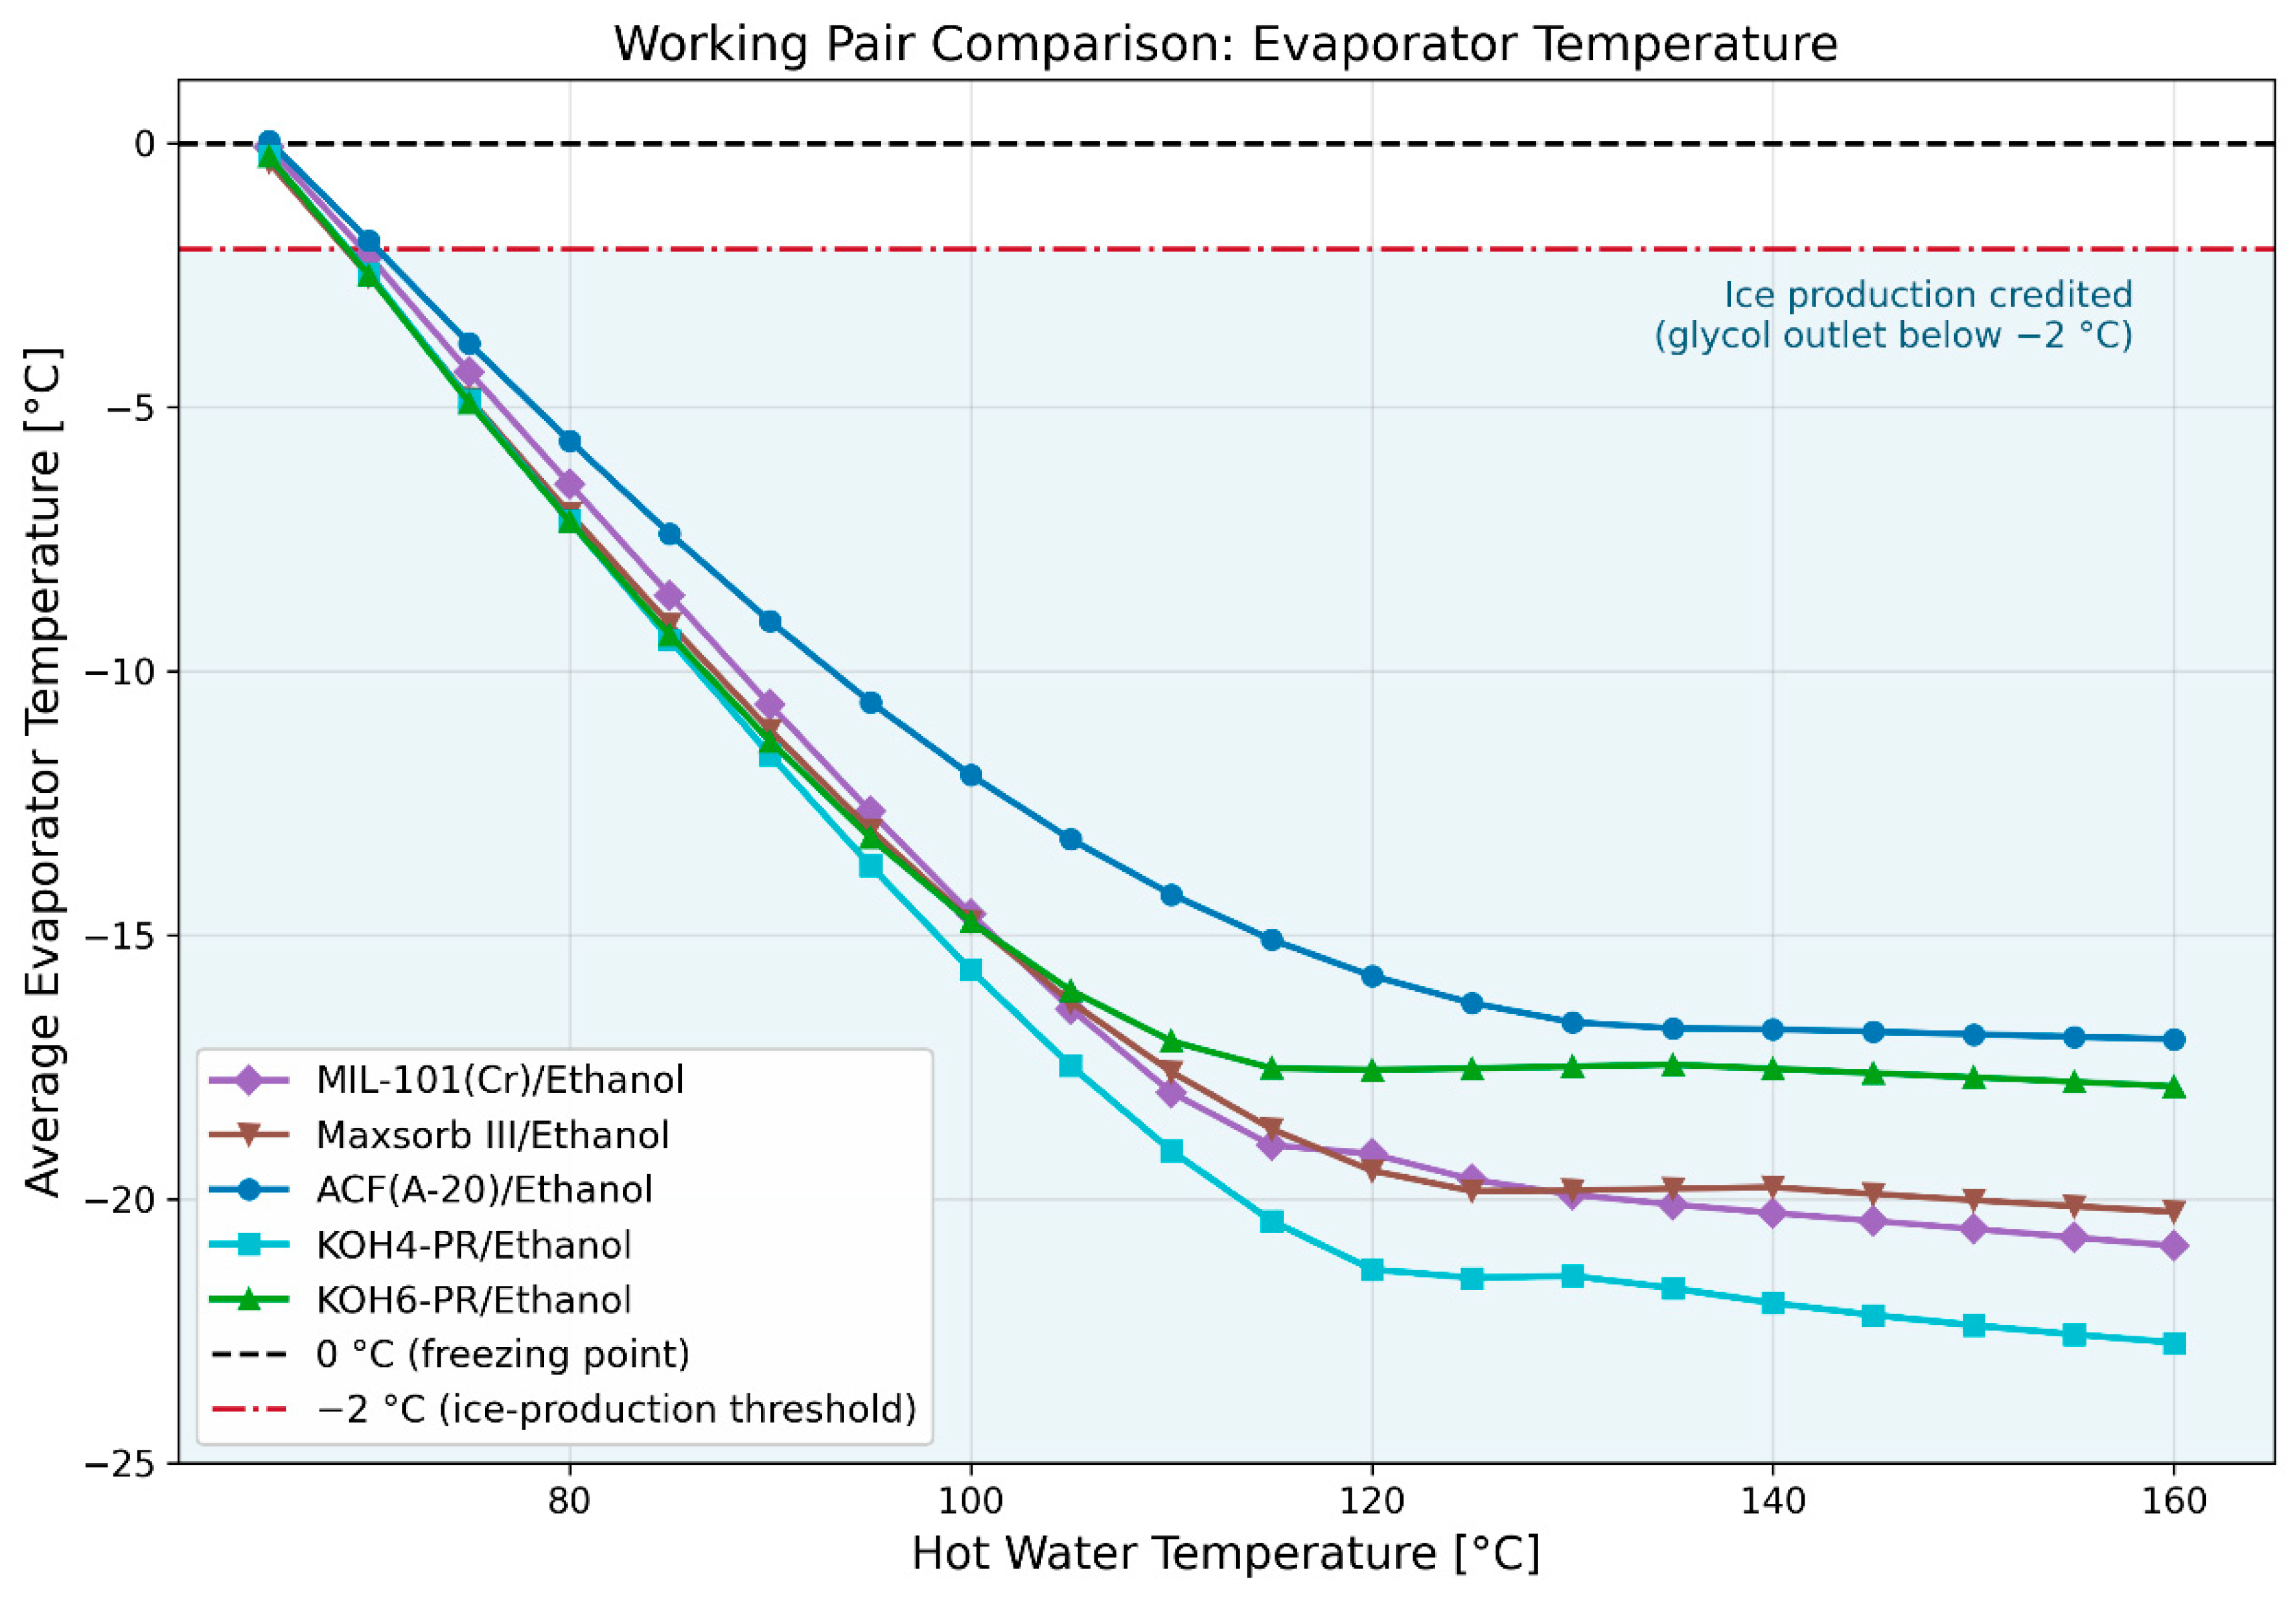
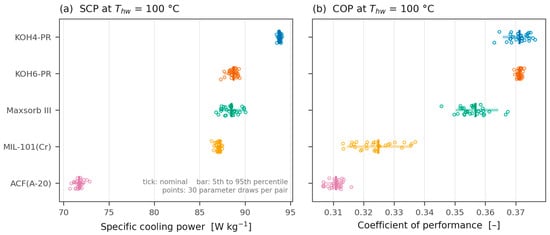
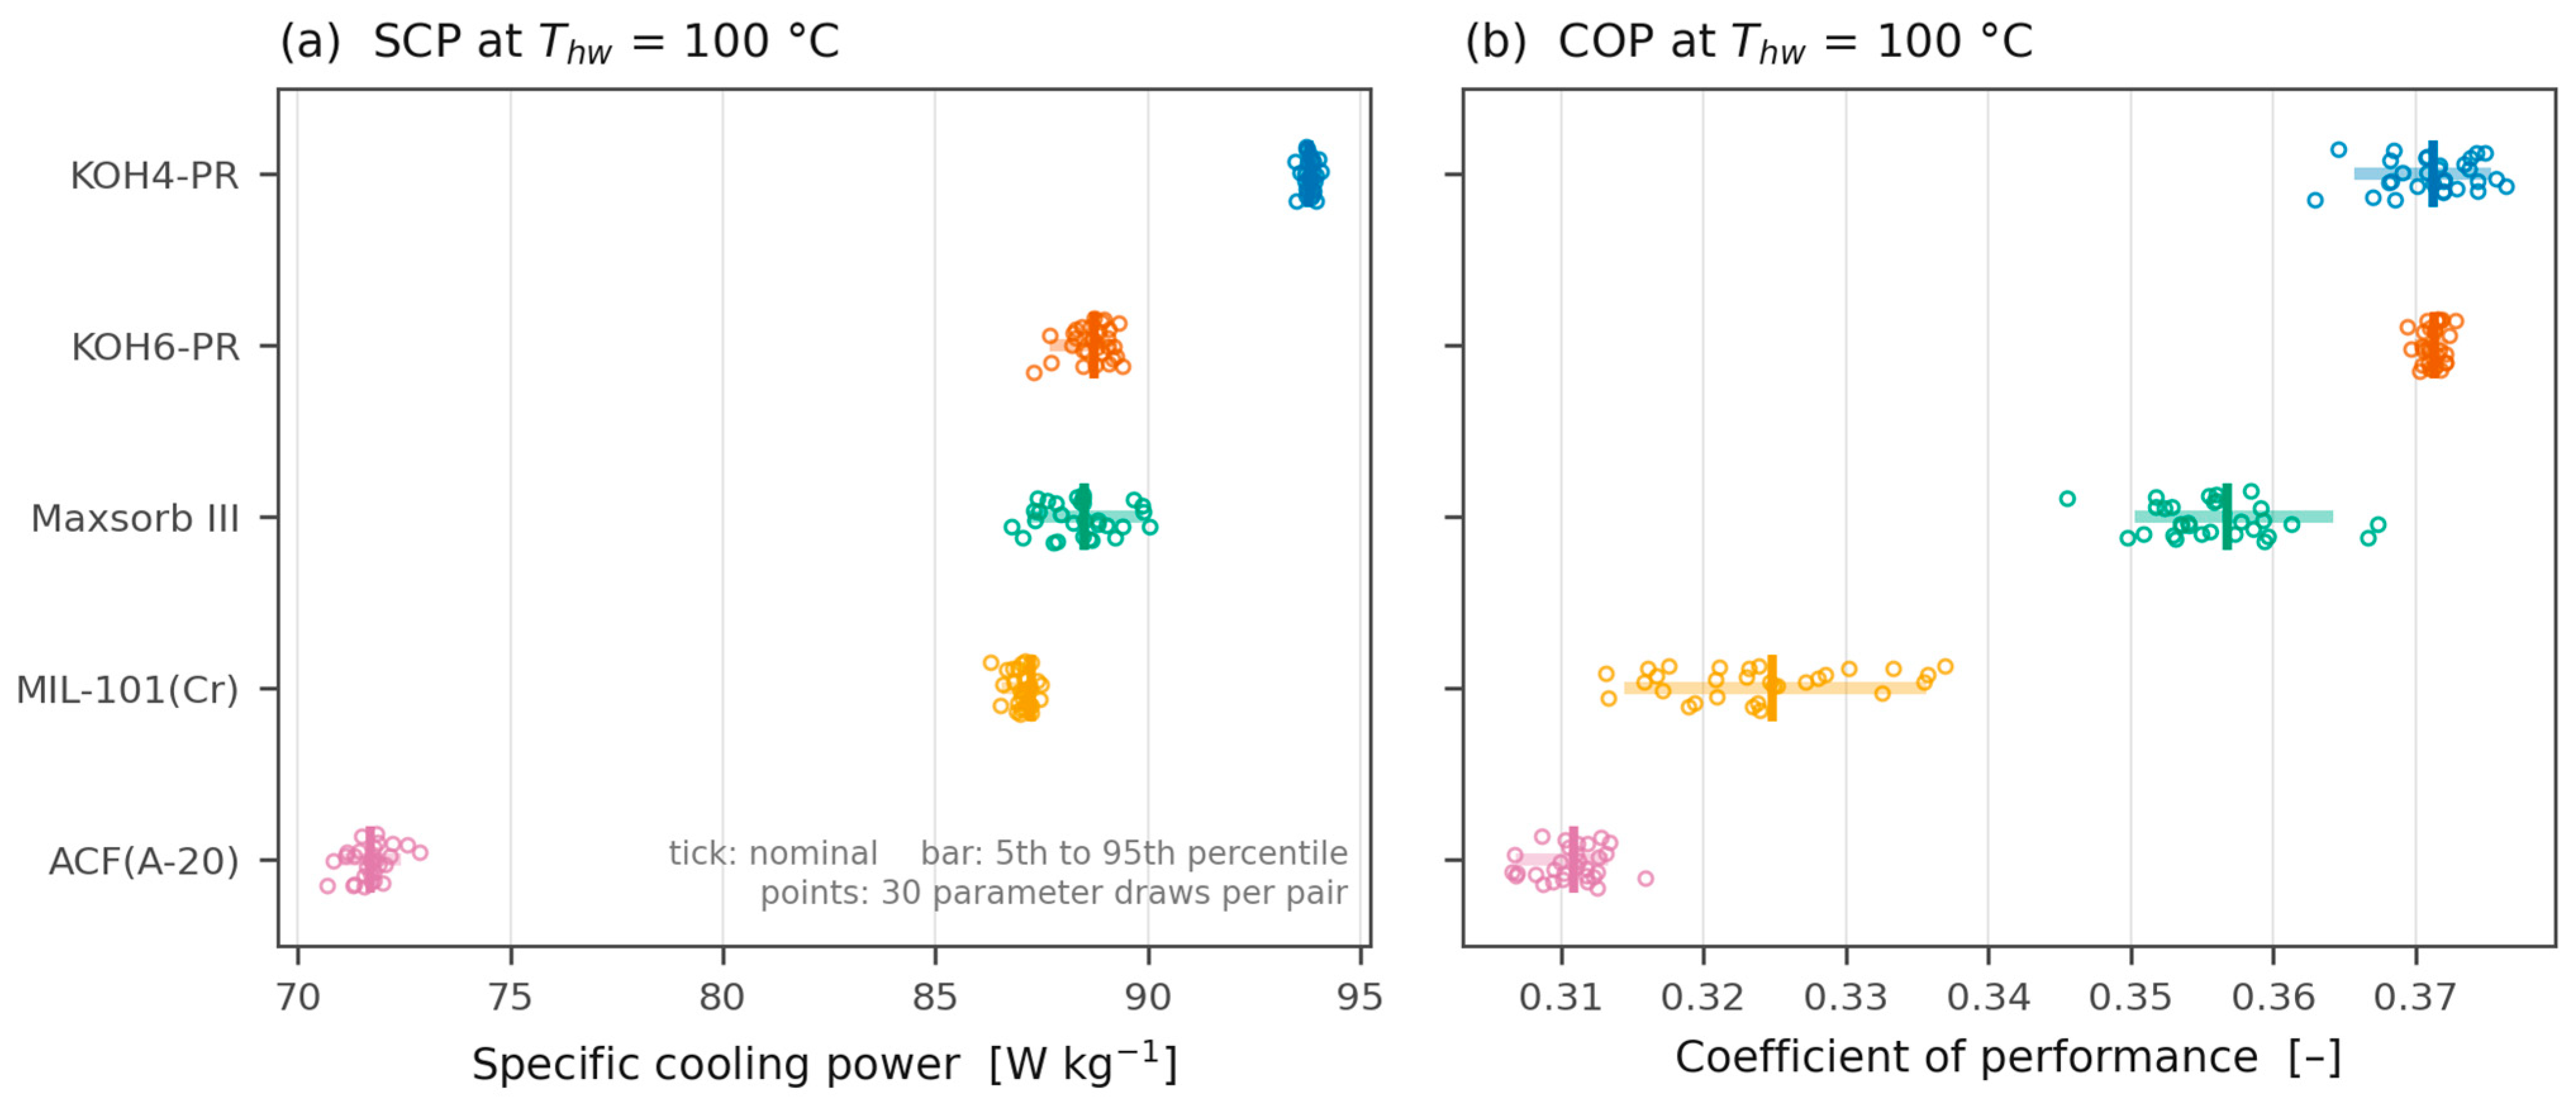
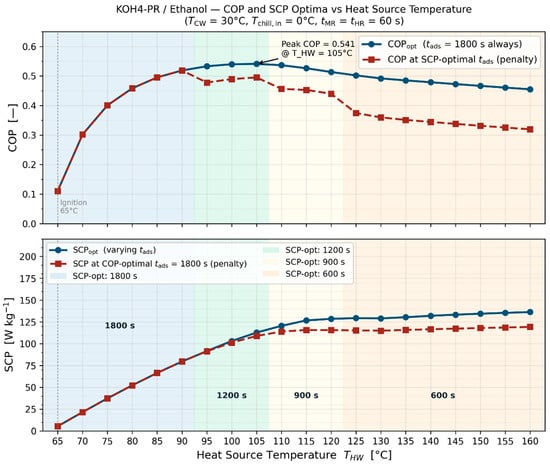
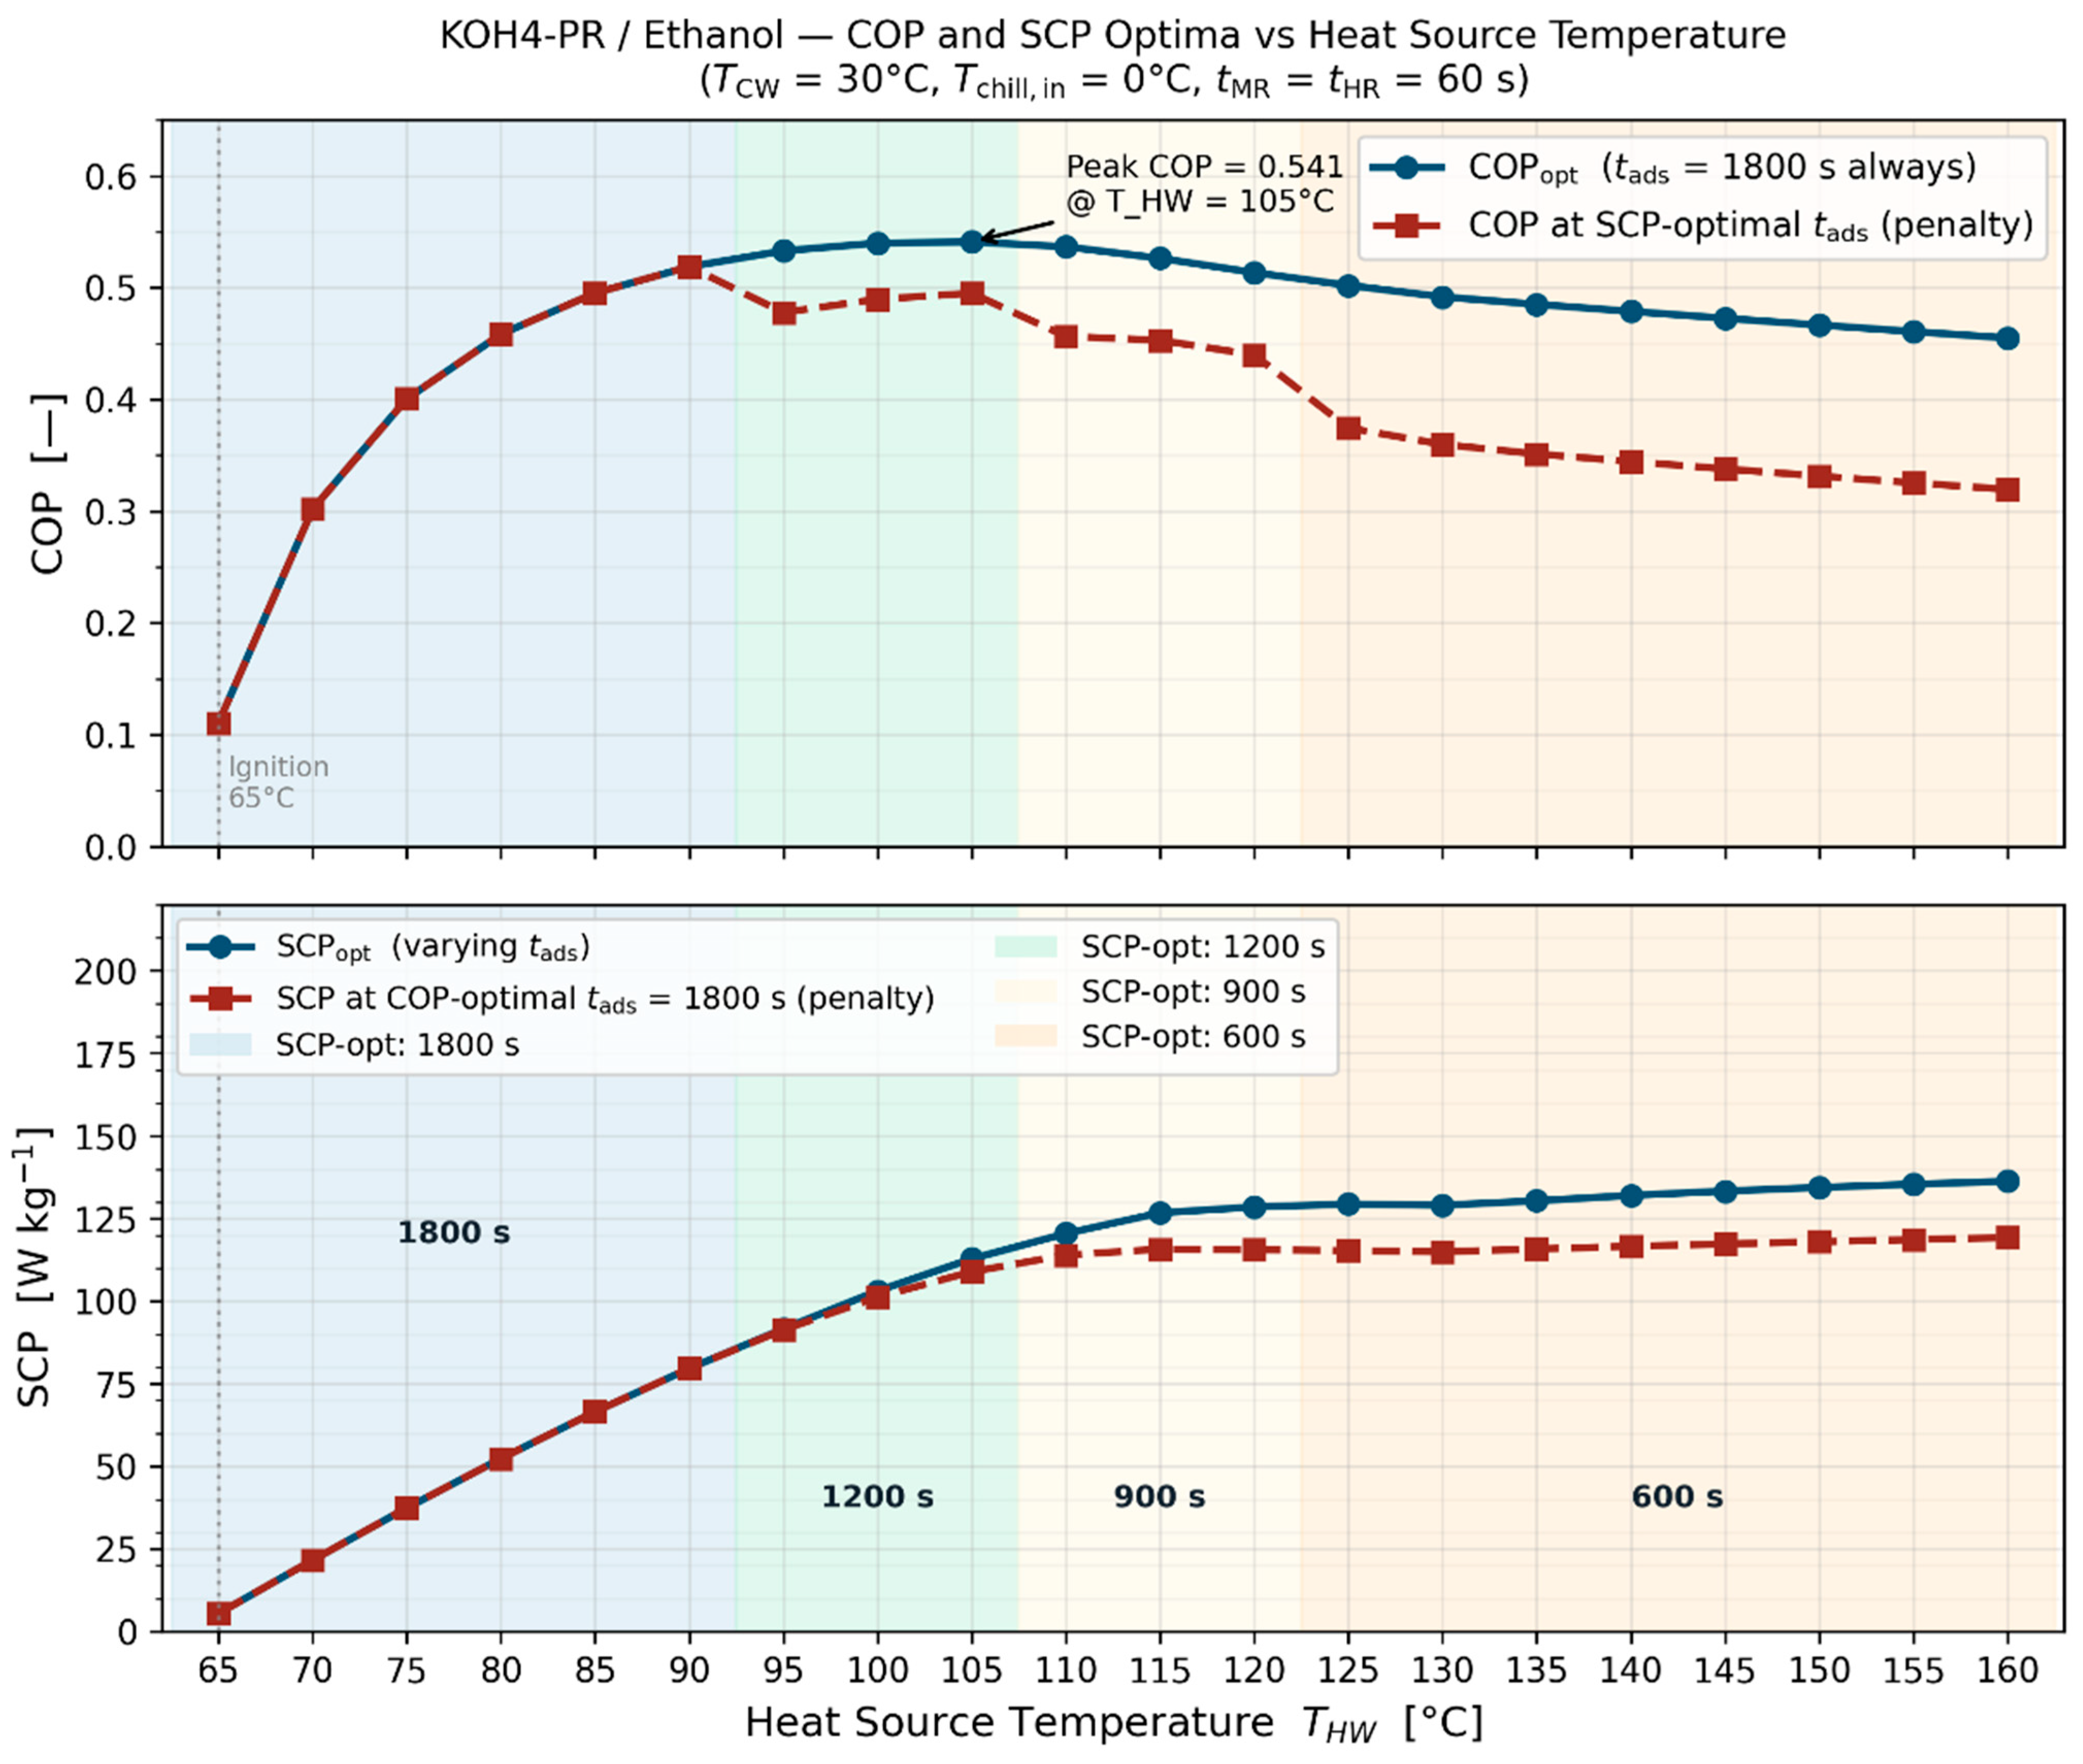
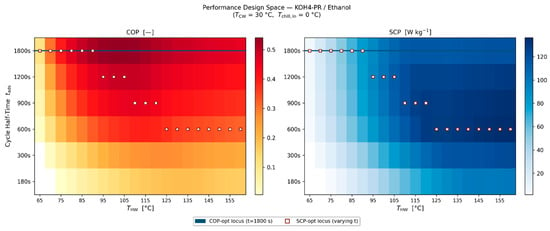
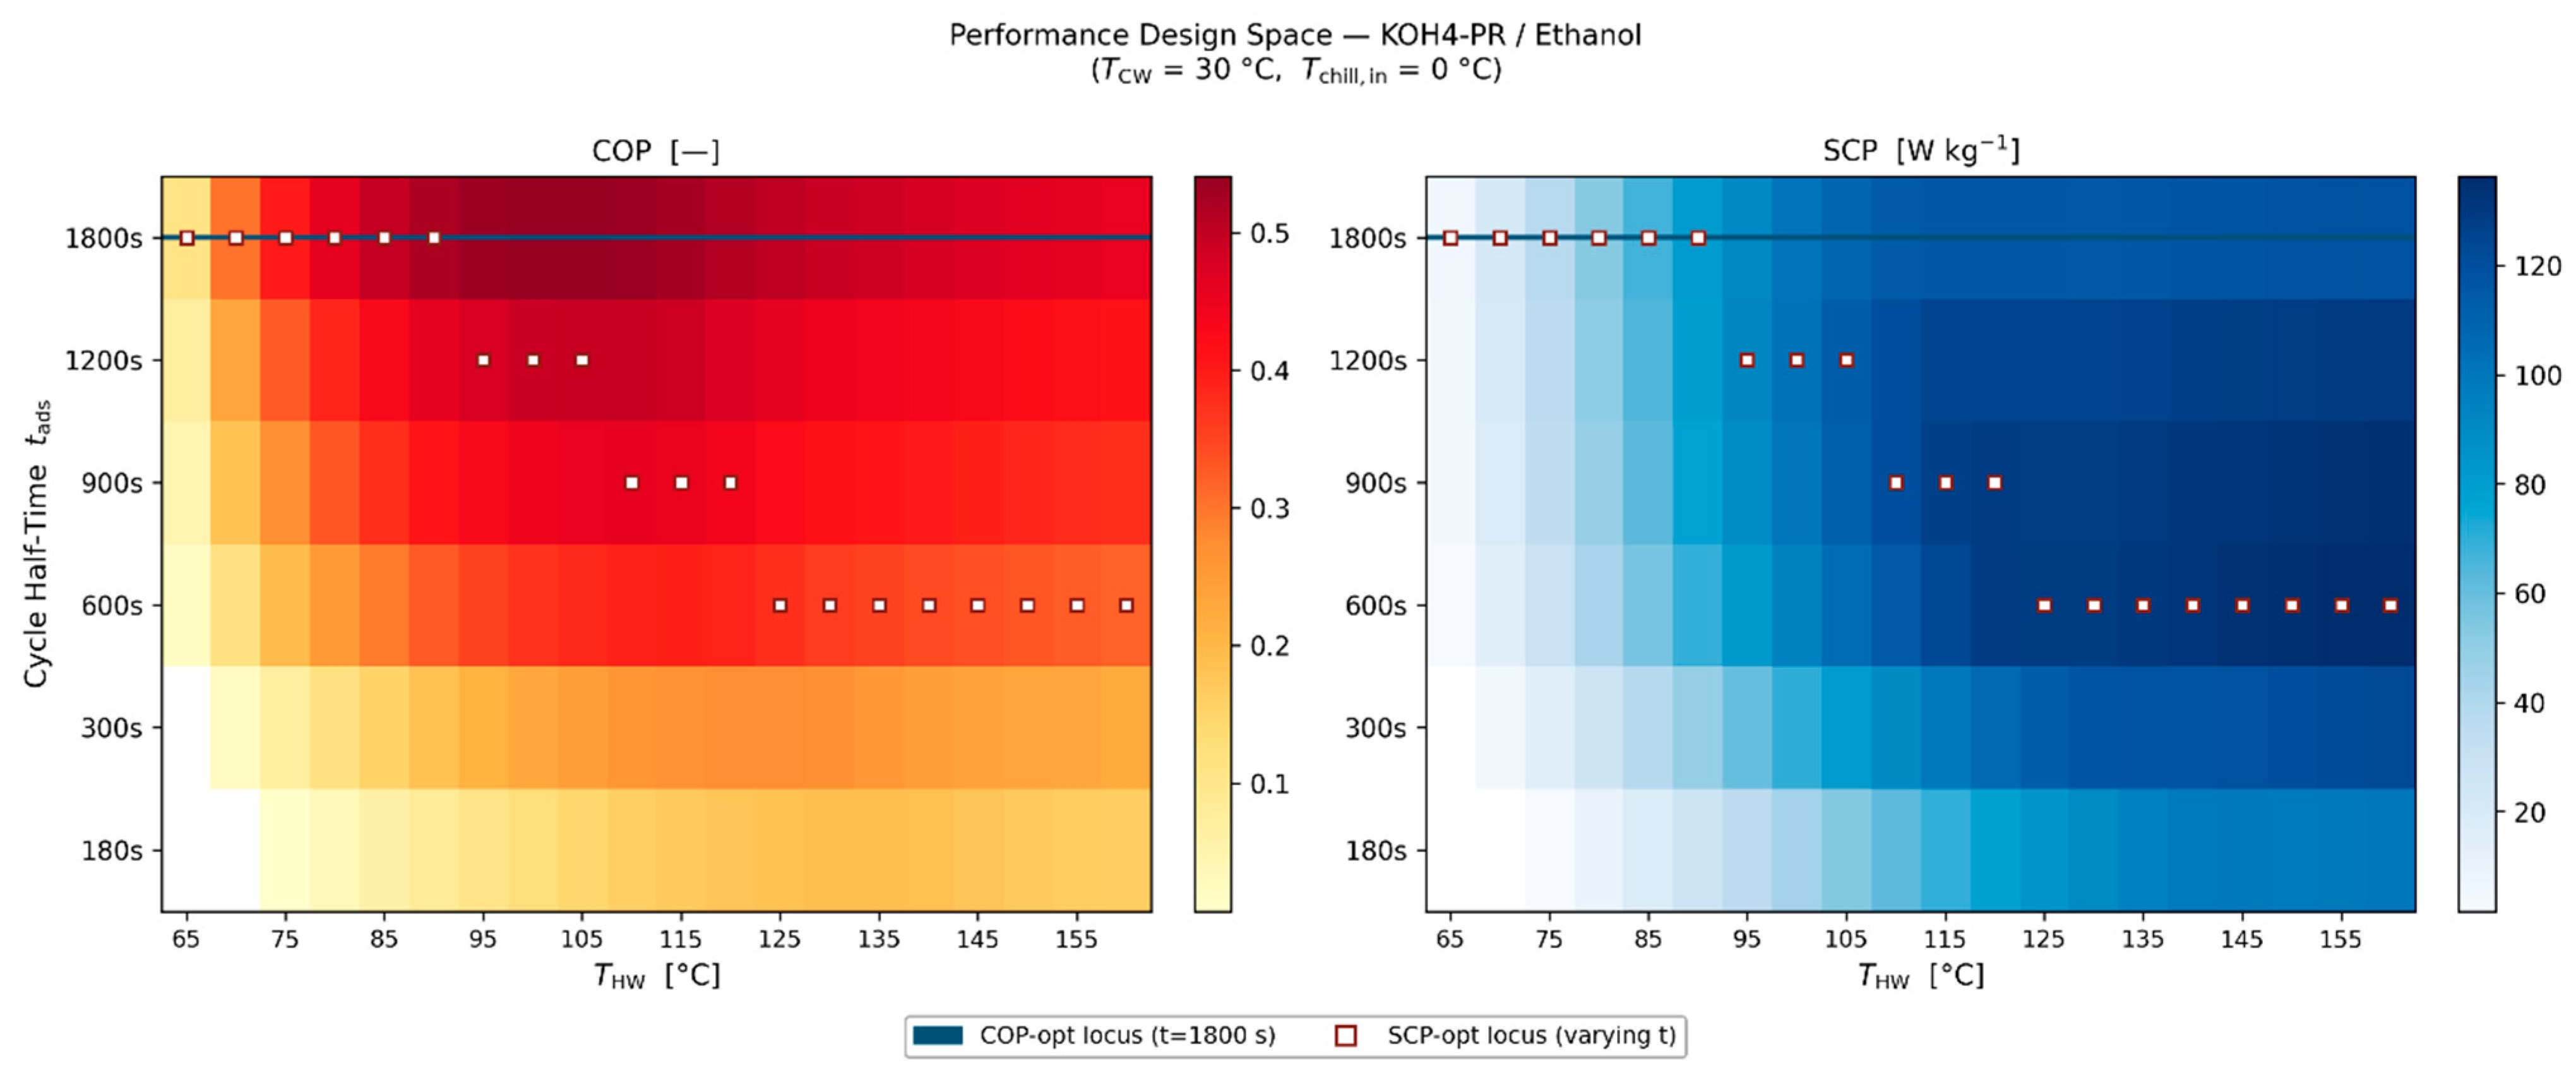
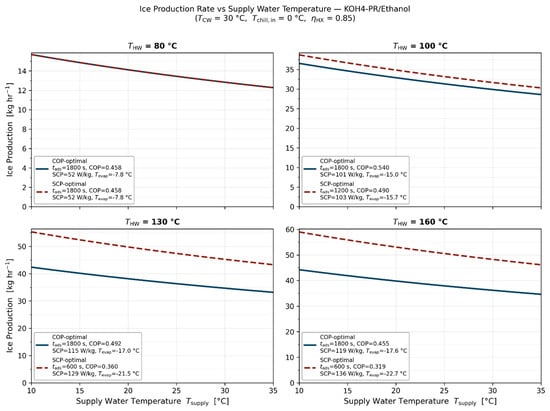
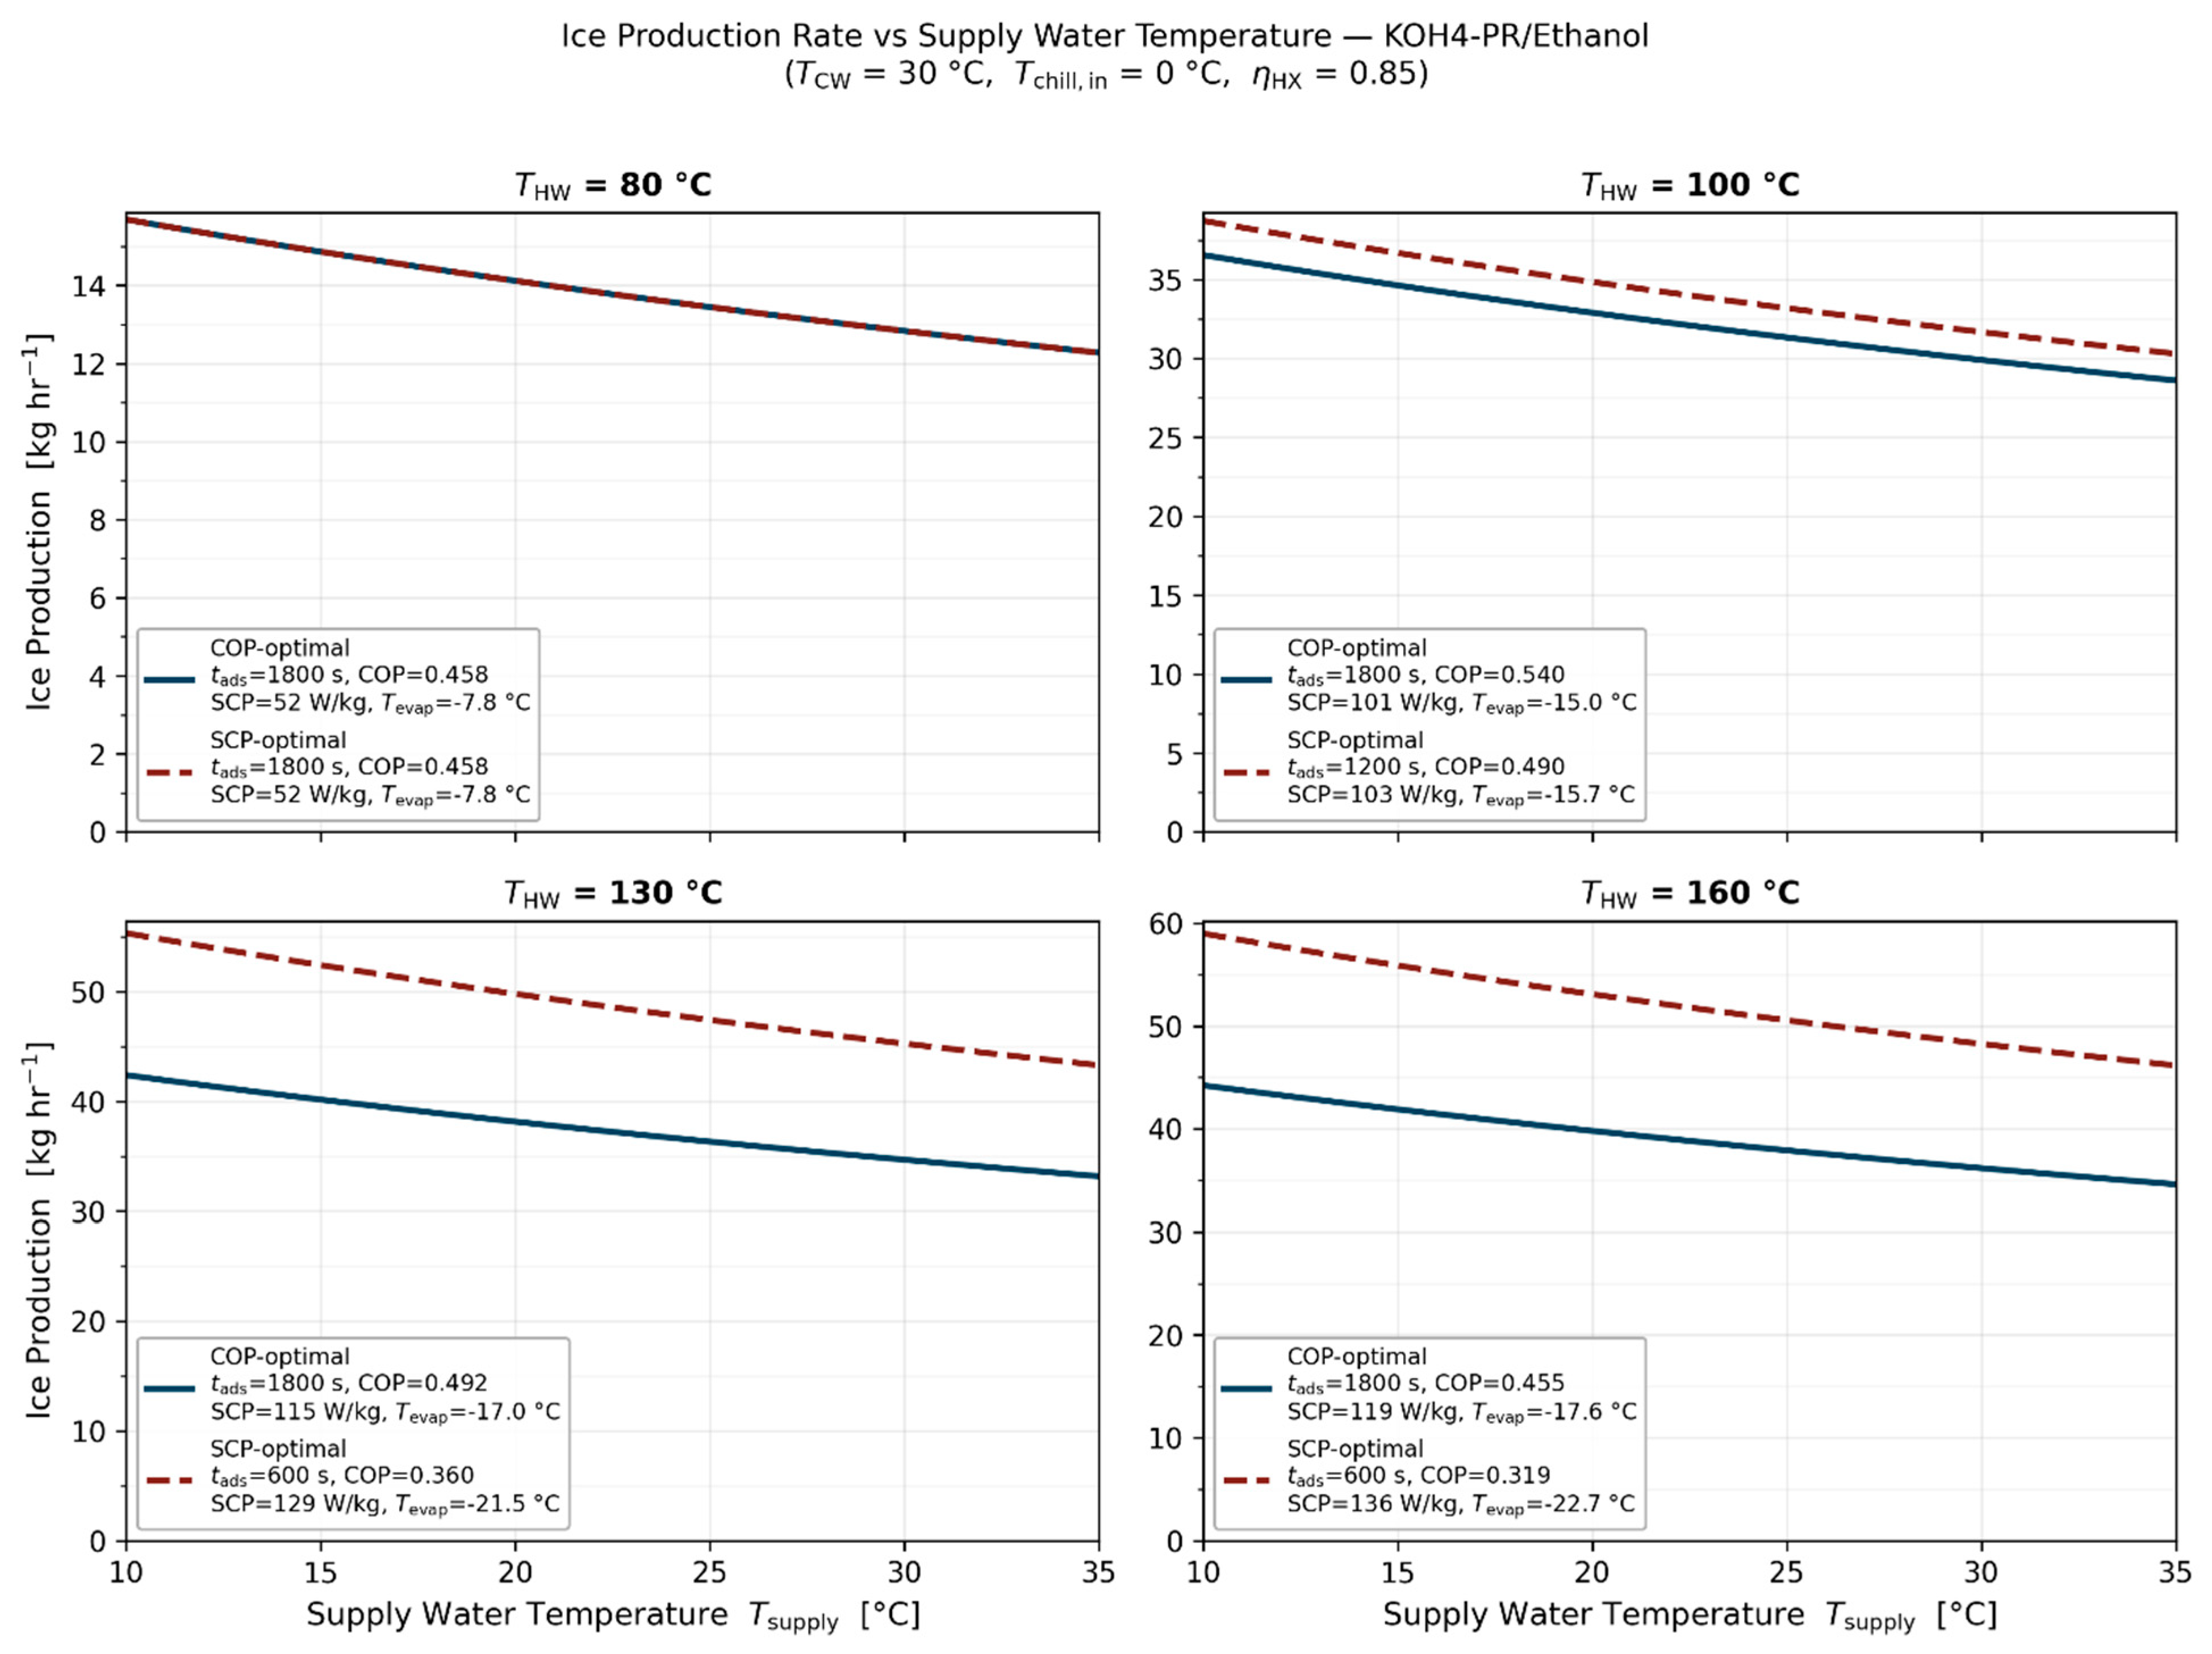
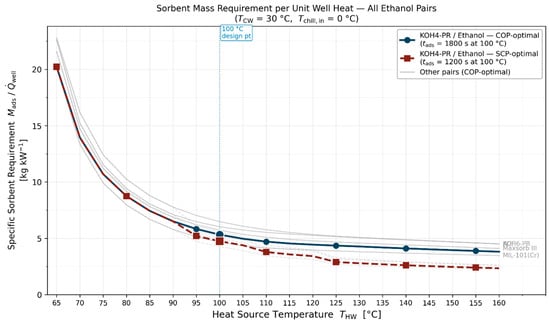
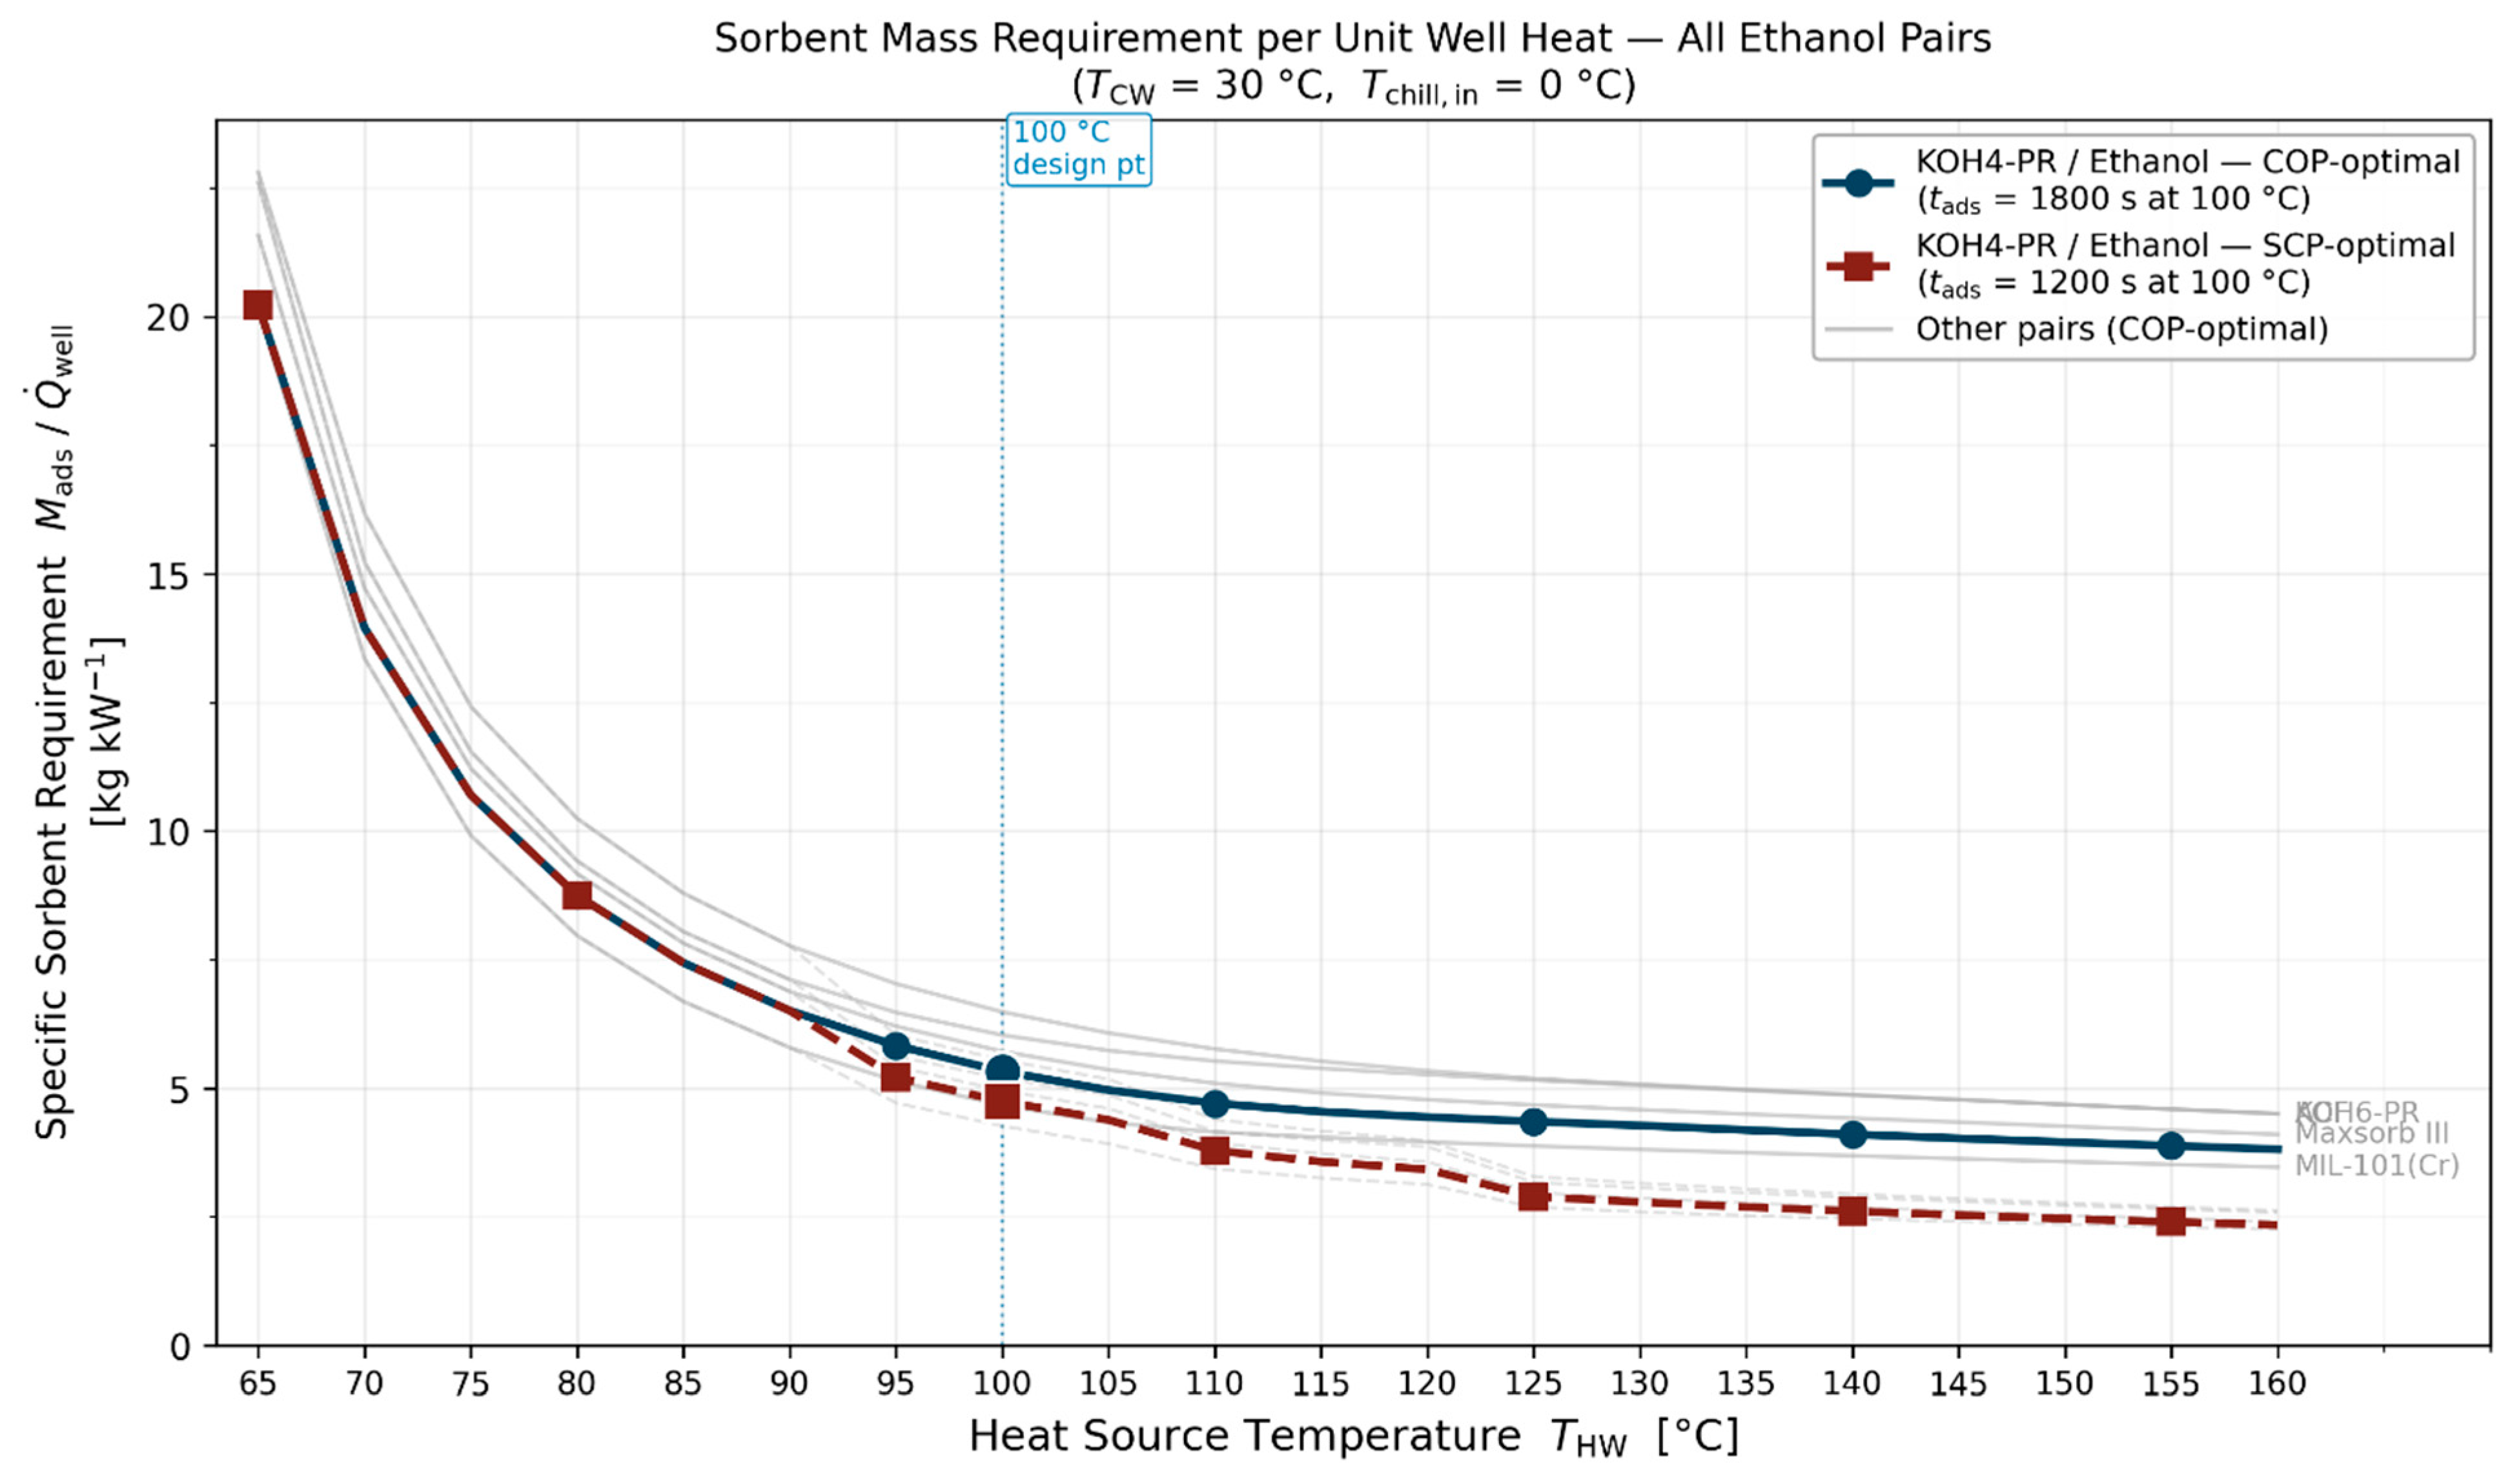

Disclaimer/Publisher’s Note: The statements, opinions and data contained in all publications are solely those of the individual author(s) and contributor(s) and not of MDPI and/or the editor(s). MDPI and/or the editor(s) disclaim responsibility for any injury to people or property resulting from any ideas, methods, instructions or products referred to in the content. |
© 2026 by the authors. Licensee MDPI, Basel, Switzerland. This article is an open access article distributed under the terms and conditions of the Creative Commons Attribution (CC BY) license.