


Abstract
Nanocrystalline soft magnetic cores are promising for medium-frequency transformers. However, accurate prediction of their hysteresis behavior under asymmetric duty-cycle square-wave excitation remains hard because positive and negative magnetization processes are different. This study proposes a dynamic hysteresis and loss prediction method that uses only sinusoidal measurements. Hysteresis loops under square-wave excitation with different duty cycles were first measured. Based on the consistency between loss separation and field separation, the total magnetic field was decomposed into hysteresis, classical eddy current, and excess loss field. The quasi-static hysteresis field was determined using the inverse Preisach model, and the classical eddy-current field was calculated considering the skin effect. An equivalent-frequency method was then developed to calculate the excess loss field during the positive and negative voltage stages. Validation was performed on a nanocrystalline ring core at 2 kHz and 5 kHz over a duty-cycle range of 20–80%. The maximum loss error and normalized dynamic time warping error were 4.767% and 6.113%, respectively. The proposed method accurately predicts asymmetric hysteresis loops and losses without requiring square-wave measurements, thus providing an efficient approach for magnetic material evaluation in medium-frequency transformer design.
1. Introduction
Because of their low high-frequency loss and high saturation flux density, nanocrystalline soft magnetic materials are promising core materials for medium-frequency transformers [1]. Medium-frequency isolated DC–DC converters are increasingly used in solid-state transformers and DC transmission systems. Their key component is a medium-frequency transformer, for which its energy loss and efficiency depend strongly on the magnetic properties of the core material. Dual-active-bridge (DAB) topologies achieve substantially increased power density through multilevel conversion. DAB converters employ phase-shift control. Under the conventional single-phase-shift (SPS) modulation strategy, the duty cycles on both the primary and secondary sides are 50%, producing a square-wave excitation that is symmetric within each period. However, under extended-phase-shift (EPS) and dual-phase-shift (DPS) control, the duty cycles on the primary and secondary sides change. This results in square-wave voltage excitation with an asymmetric duty cycle [2,3]. Under such excitation, the magnetization mechanism and loss characteristics become more complex than under conventional operating conditions [4]. Core loss models can be broadly divided into phenomenological and physical models. Steinmetz established an empirical relationship among power loss density, excitation frequency, and flux density amplitude. Various extensions of the Steinmetz equation have been developed for nonsinusoidal excitation [5,6]. The generalized and improved generalized Steinmetz equations (GSE and iGSE) formulate the loss as a function of the instantaneous dB/dt and flux-density excursion. i2GSE further accounts for relaxation losses during intervals of constant flux [7]. Other approaches, such as the waveform-coefficient Steinmetz equation (WcSE), have also been developed and experimentally evaluated for nanocrystalline materials [8]. In addition, rectangular- and PWM-waveform-based characterization methods have been proposed to predict losses under practical converter excitations [9]. The Revised Generalized Steinmetz Equation (RGSE) provides another approach for estimating losses under nonsinusoidal excitation. It computes instantaneous loss density from the AC flux-density component and Steinmetz parameters and has been used in circuit-level equivalent-resistance models for ferrite inductors under triangular excitation [10]. These approaches are effective for estimating the total core loss, but they generally do not reconstruct the complete dynamic hysteresis loop or explicitly separate the quasi-static hysteresis, classical eddy-current, and excess-loss fields. Moreover, the parameters of waveform-dependent extensions often require measurements under the corresponding excitation conditions. However, accurate measurements under asymmetric duty-cycle voltage are difficult and costly to obtain, especially at medium frequencies. Researchers have developed various advanced techniques for dynamic hysteresis-loop and core-loss measurements under high-frequency and non-sinusoidal excitations. Analog and digital hysteresis measurements have been shown to reduce the waveform distortion associated with conventional analog integration, particularly for nanocrystalline cores [11]. However, even a slight mismatch from reactive voltage cancellation causes significant measurement errors, thus requiring fine-tuning for each testing condition. S. Cabizza and G. Spiazzi combined fast Fourier transforms with the partial cancellation concept adopted for transformer core loss measurements [12]. More recently, platforms have been developed to reproduce multi-level PWM excitations. These platforms need a dedicated power amplifier, PWM waveform generation and control, and corresponding dynamic characteristic verification [13]. These advances show that reliable measurements under complex excitation waveforms generally require specialized excitation, calibration, and signal-processing setups. Therefore, acquiring hysteresis loops over numerous asymmetric duty cycles, voltage levels, frequencies, and flux-density amplitudes is substantially more complex than conventional sinusoidal characterization. For this reason, besides measurement techniques, considerable effort has been devoted to physics-based modeling of hysteresis behavior and iron loss under complex excitations. Statistical loss theory divides iron loss into hysteresis loss, classical eddy-current loss, and excess loss components, thereby providing a physical interpretation of the loss mechanisms. Static hysteresis loss is primarily calculated using various hysteresis models [14,15,16,17]. Conventional methods for calculating dynamic losses assume uniform magnetization and neglect the skin effect [18,19]. Based on Maxwell’s equations, Ji and Zhao derived an analytical method for the eddy-current magnetic field considering the skin effect [20]. However, it may be inaccurate for complex excitations. Moreover, in [21], an improved magnetic circuit model is proposed to include the skin effect in dynamic hysteresis characteristics. This model provides a computationally efficient way to calculate skin effect loss. However, as a lumped-parameter magnetic-circuit model, its accuracy depends on the identified circuit order and frequency range, and it does not explicitly separate the classical eddy current and excess field.
Magnetic properties under complex excitation with a symmetric duty cycle have been studied extensively, whereas accurate methods for analyzing hysteresis loops under square-wave excitation with asymmetric duty cycles remain relatively few. The main difficulties are as follows: First, the voltage slew rates differ during field rise and fall, making the ascending and descending branches of the hysteresis loop asymmetric. This phenomenon differs from DC bias because the volt-second balance constraint keeps the positive and negative flux-density amplitudes equal. Second, within a single excitation period, domain walls move at different velocities during the positive and negative voltages, leading to a complex magnetization mechanism. These factors make it difficult to accurately evaluate the hysteresis and loss characteristics under asymmetric excitation.
In this study, hysteresis loops under square-wave excitation with different duty cycles were first measured using a BROCKHAUS magnetic-characterization system. The hysteresis loops were then analyzed from the microscopic perspective of domain-wall pinning and depinning. The inverse Everett function was identified from quasi-static measurements using the concentric hysteresis-loop method. The parameters of the loss-separation model were subsequently identified from measurements under sinusoidal excitation. To account for the non-50% duty-cycle excitation under DPS and EPS control strategies, we propose an equivalent-frequency method for calculating the excess-loss field. The proposed method predicts hysteresis loops and losses under such modulated waveforms using only sinusoidal measurements. Finally, comparisons with conventional methods and measured hysteresis loops verify the effectiveness and accuracy of the proposed approach, which provides an efficient means of hysteresis characterization.
2. Measurement of the Magnetic Properties of the Nanocrystalline Ring Core
2.1. Experimental Platform
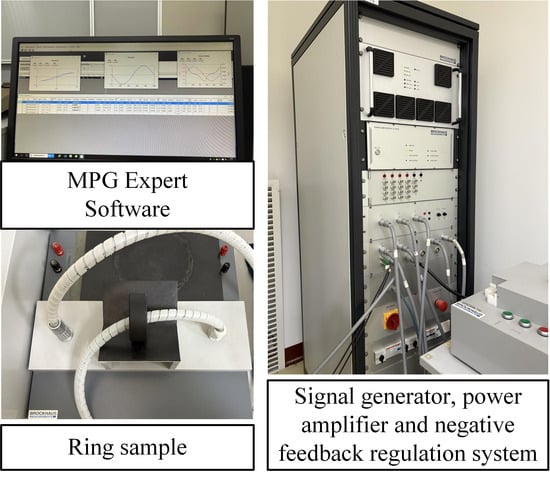
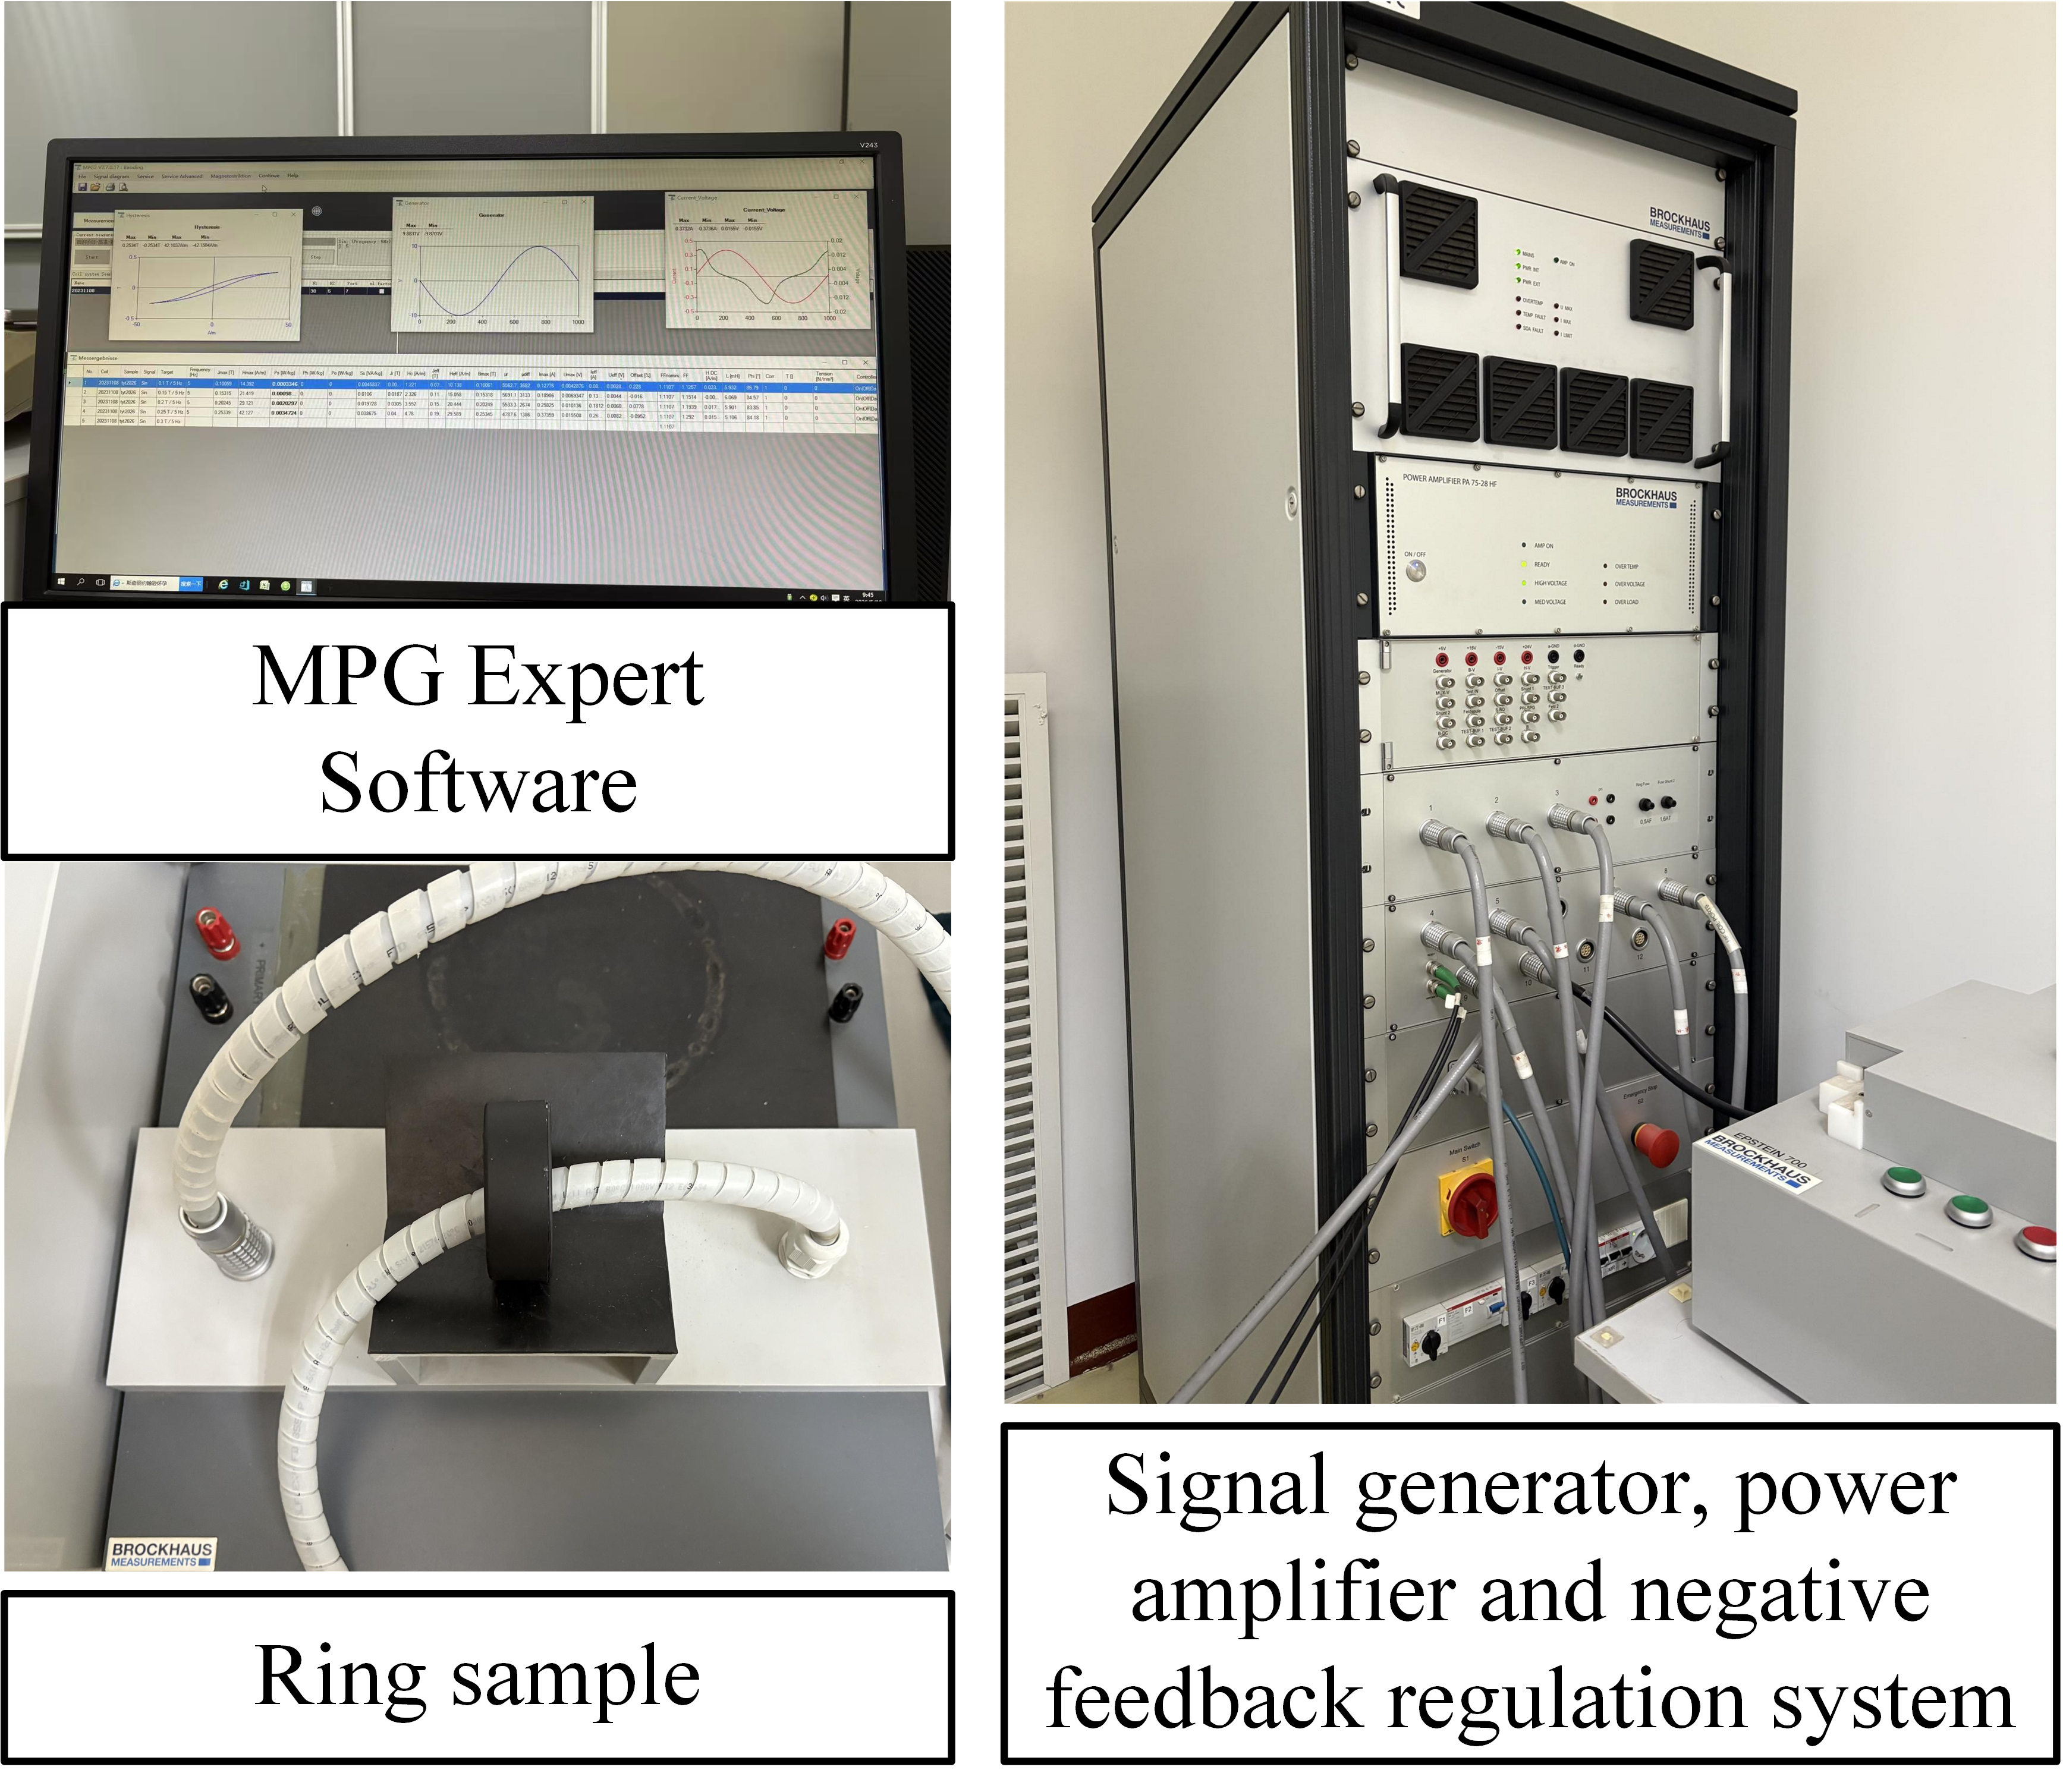
Figure 1 shows the BROCKHAUS platform. Its MPG 200 D Expert software supports customized test configurations for measurement signals with different frequencies, flux density amplitudes, and excitation waveforms. The system can apply sinusoidal, harmonic, and other user-defined complex excitations to the primary winding and measure the corresponding hysteresis losses and hysteresis loops. Its standard frequency range is 3 Hz–20 kHz, with a maximum excitation voltage of 100 V and current of 52 A. The specified repeatability is 0.1%, and the nominal-value adjustment precision is better than 0.1%. Separate acquisition channels simultaneously acquire the magnetic-field and induced-voltage signals [22,23]. The primary and secondary windings consisted of N1 = 5 and N2 = 5 uniformly distributed turns, respectively. We followed the measurement procedure specified in IEC 60404-6 [24].
Figure 1.
BROCKHAUS platform.
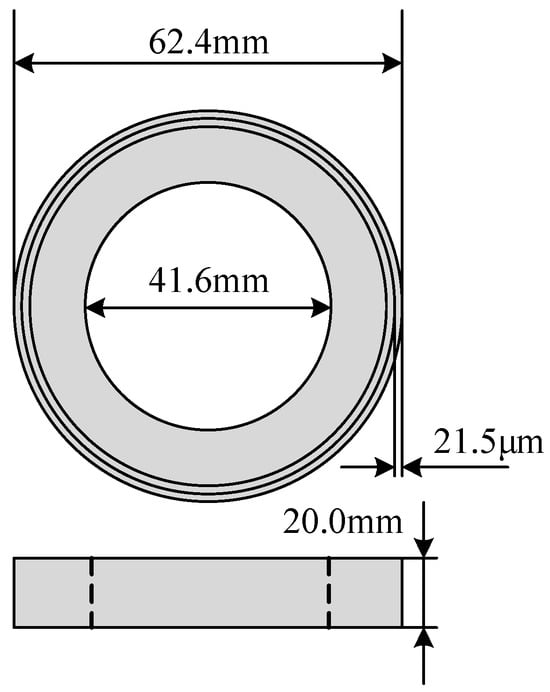
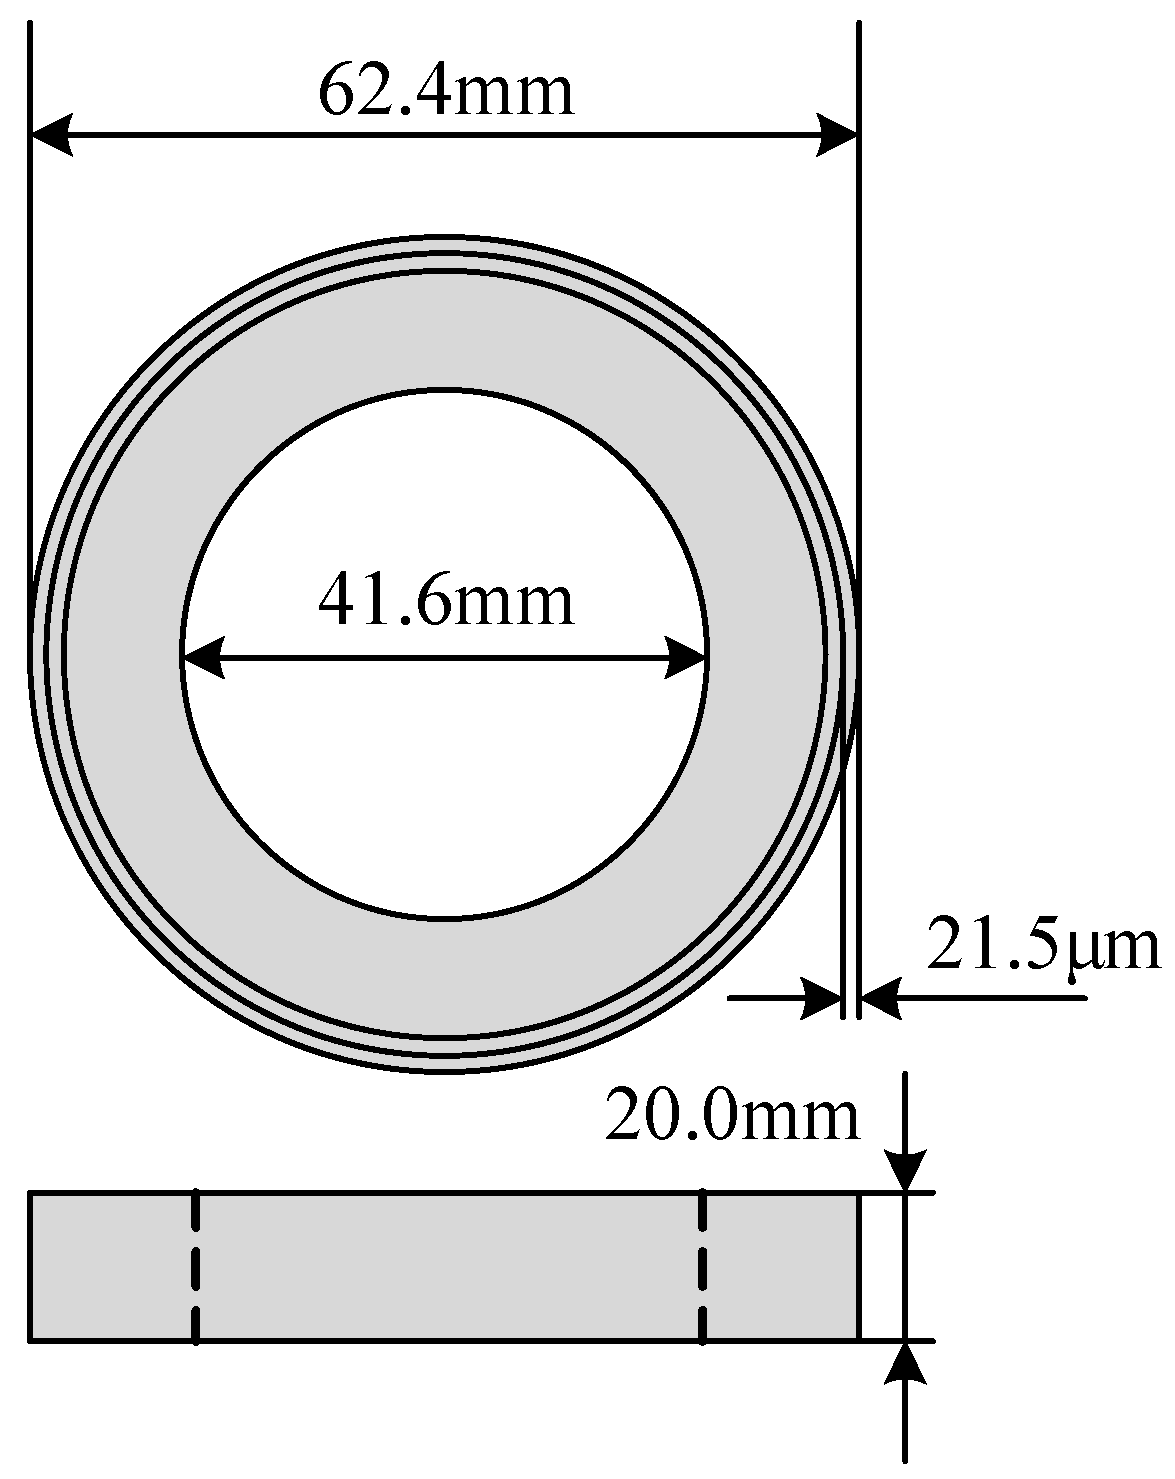
Compared with conventional silicon steel sheets, nanocrystalline materials exhibit lower losses, smaller volume, and lower weight, which are advantageous for increasing transformer power density. They have been widely used in the cores of large electrical equipment, including power transformers and ultrahigh-voltage devices. Therefore, the 1K107 nanocrystalline core shown in Figure 2 was selected as the experimental sample [23]. Table 1 summarizes some key parameters of the nanocrystalline magnetic ring. The magnetic field and flux density were calculated from the excitation current in the primary winding and the induced voltage in the secondary winding, respectively.
Figure 2.
Schematic diagram of the nanocrystalline magnetic ring.
Table 1.
Key parameters of the nanocrystalline magnetic ring.
2.2. Measured Hysteresis Loops Under Square-Wave Excitation with Different Duty Cycles
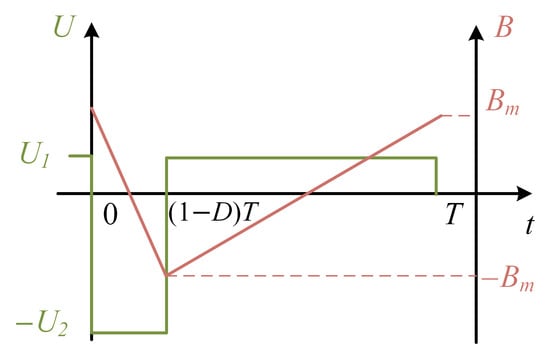
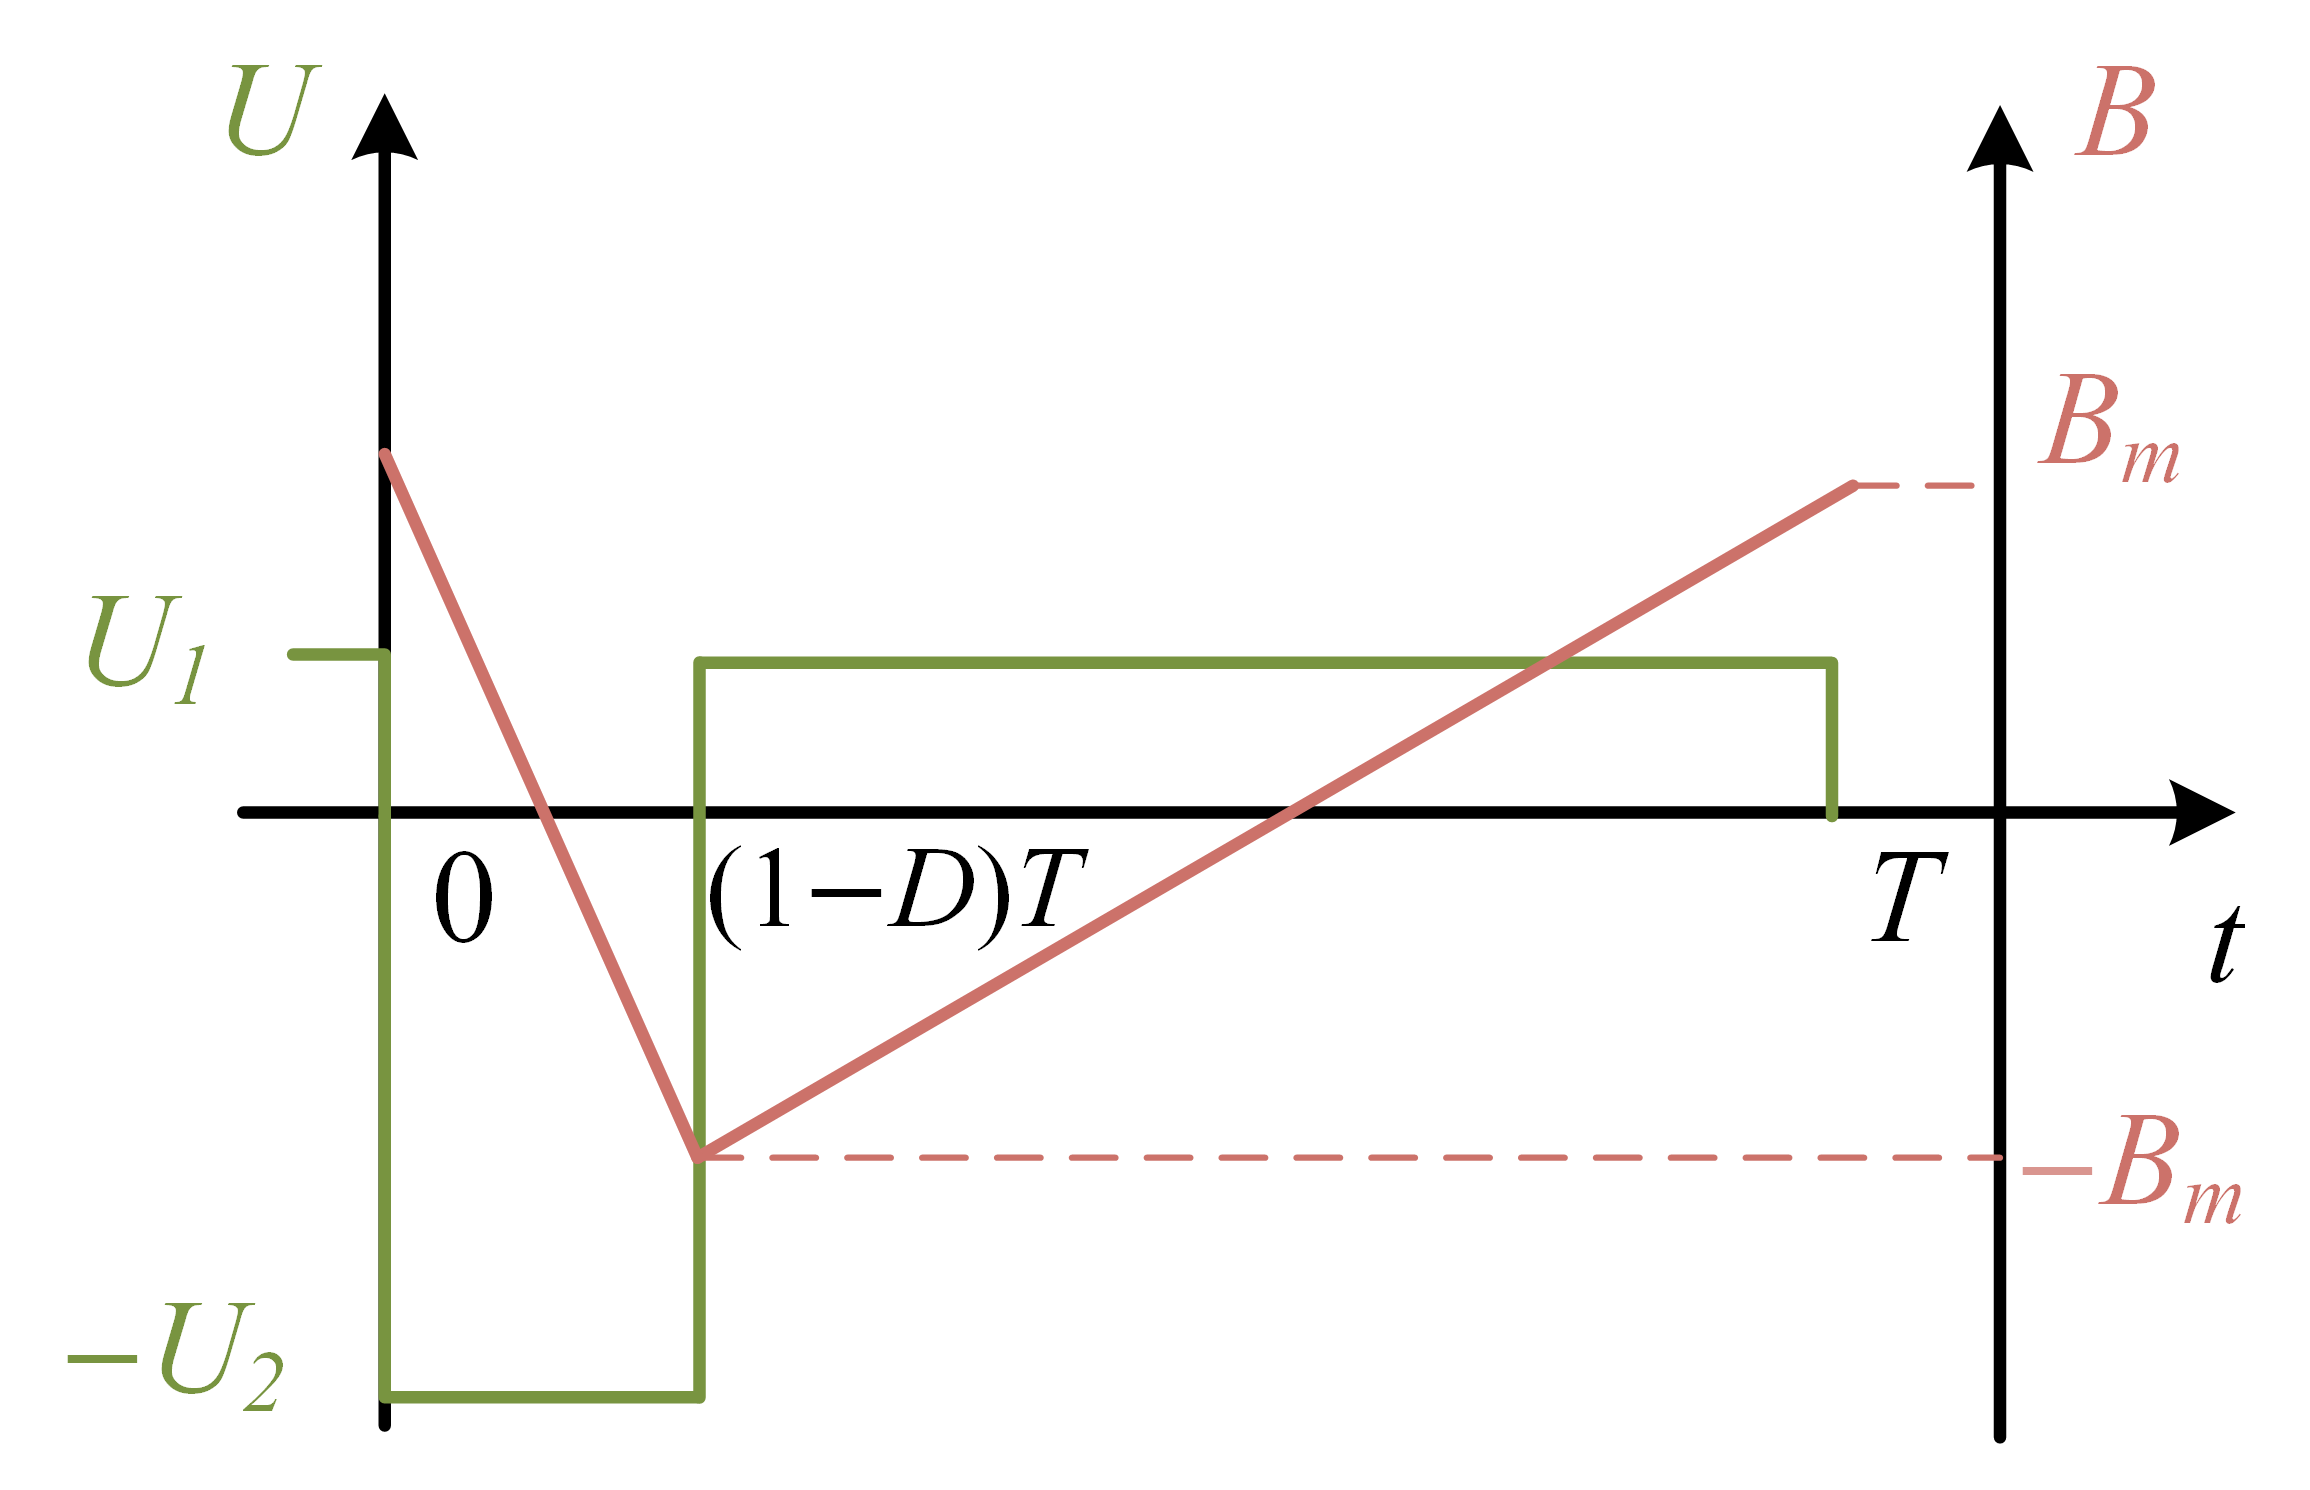
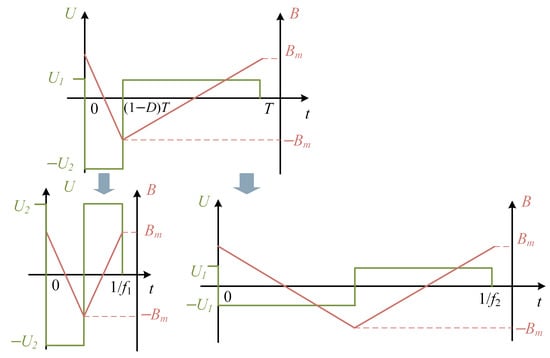
Under the conventional SPS modulation strategy, the excitation voltage is a standard square wave. Under DPS and EPS modulation, however, the converter produces an asymmetric duty-cycle square wave, as shown in Figure 3. Here, U1 and U2 are the maximum positive and negative voltage magnitudes, respectively. Bm is the flux density amplitude, D is the duty cycle; T is the excitation period. These parameters satisfy the volt-second balance constraint U1DT = U2(1 − D)T.
Figure 3.
Schematic diagram of the excitation waveform generated under DPS and EPS modulation.
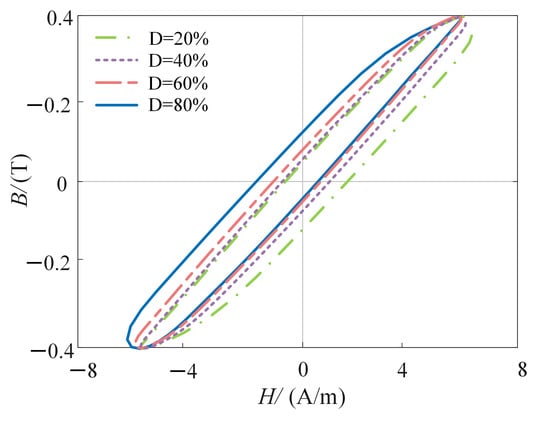
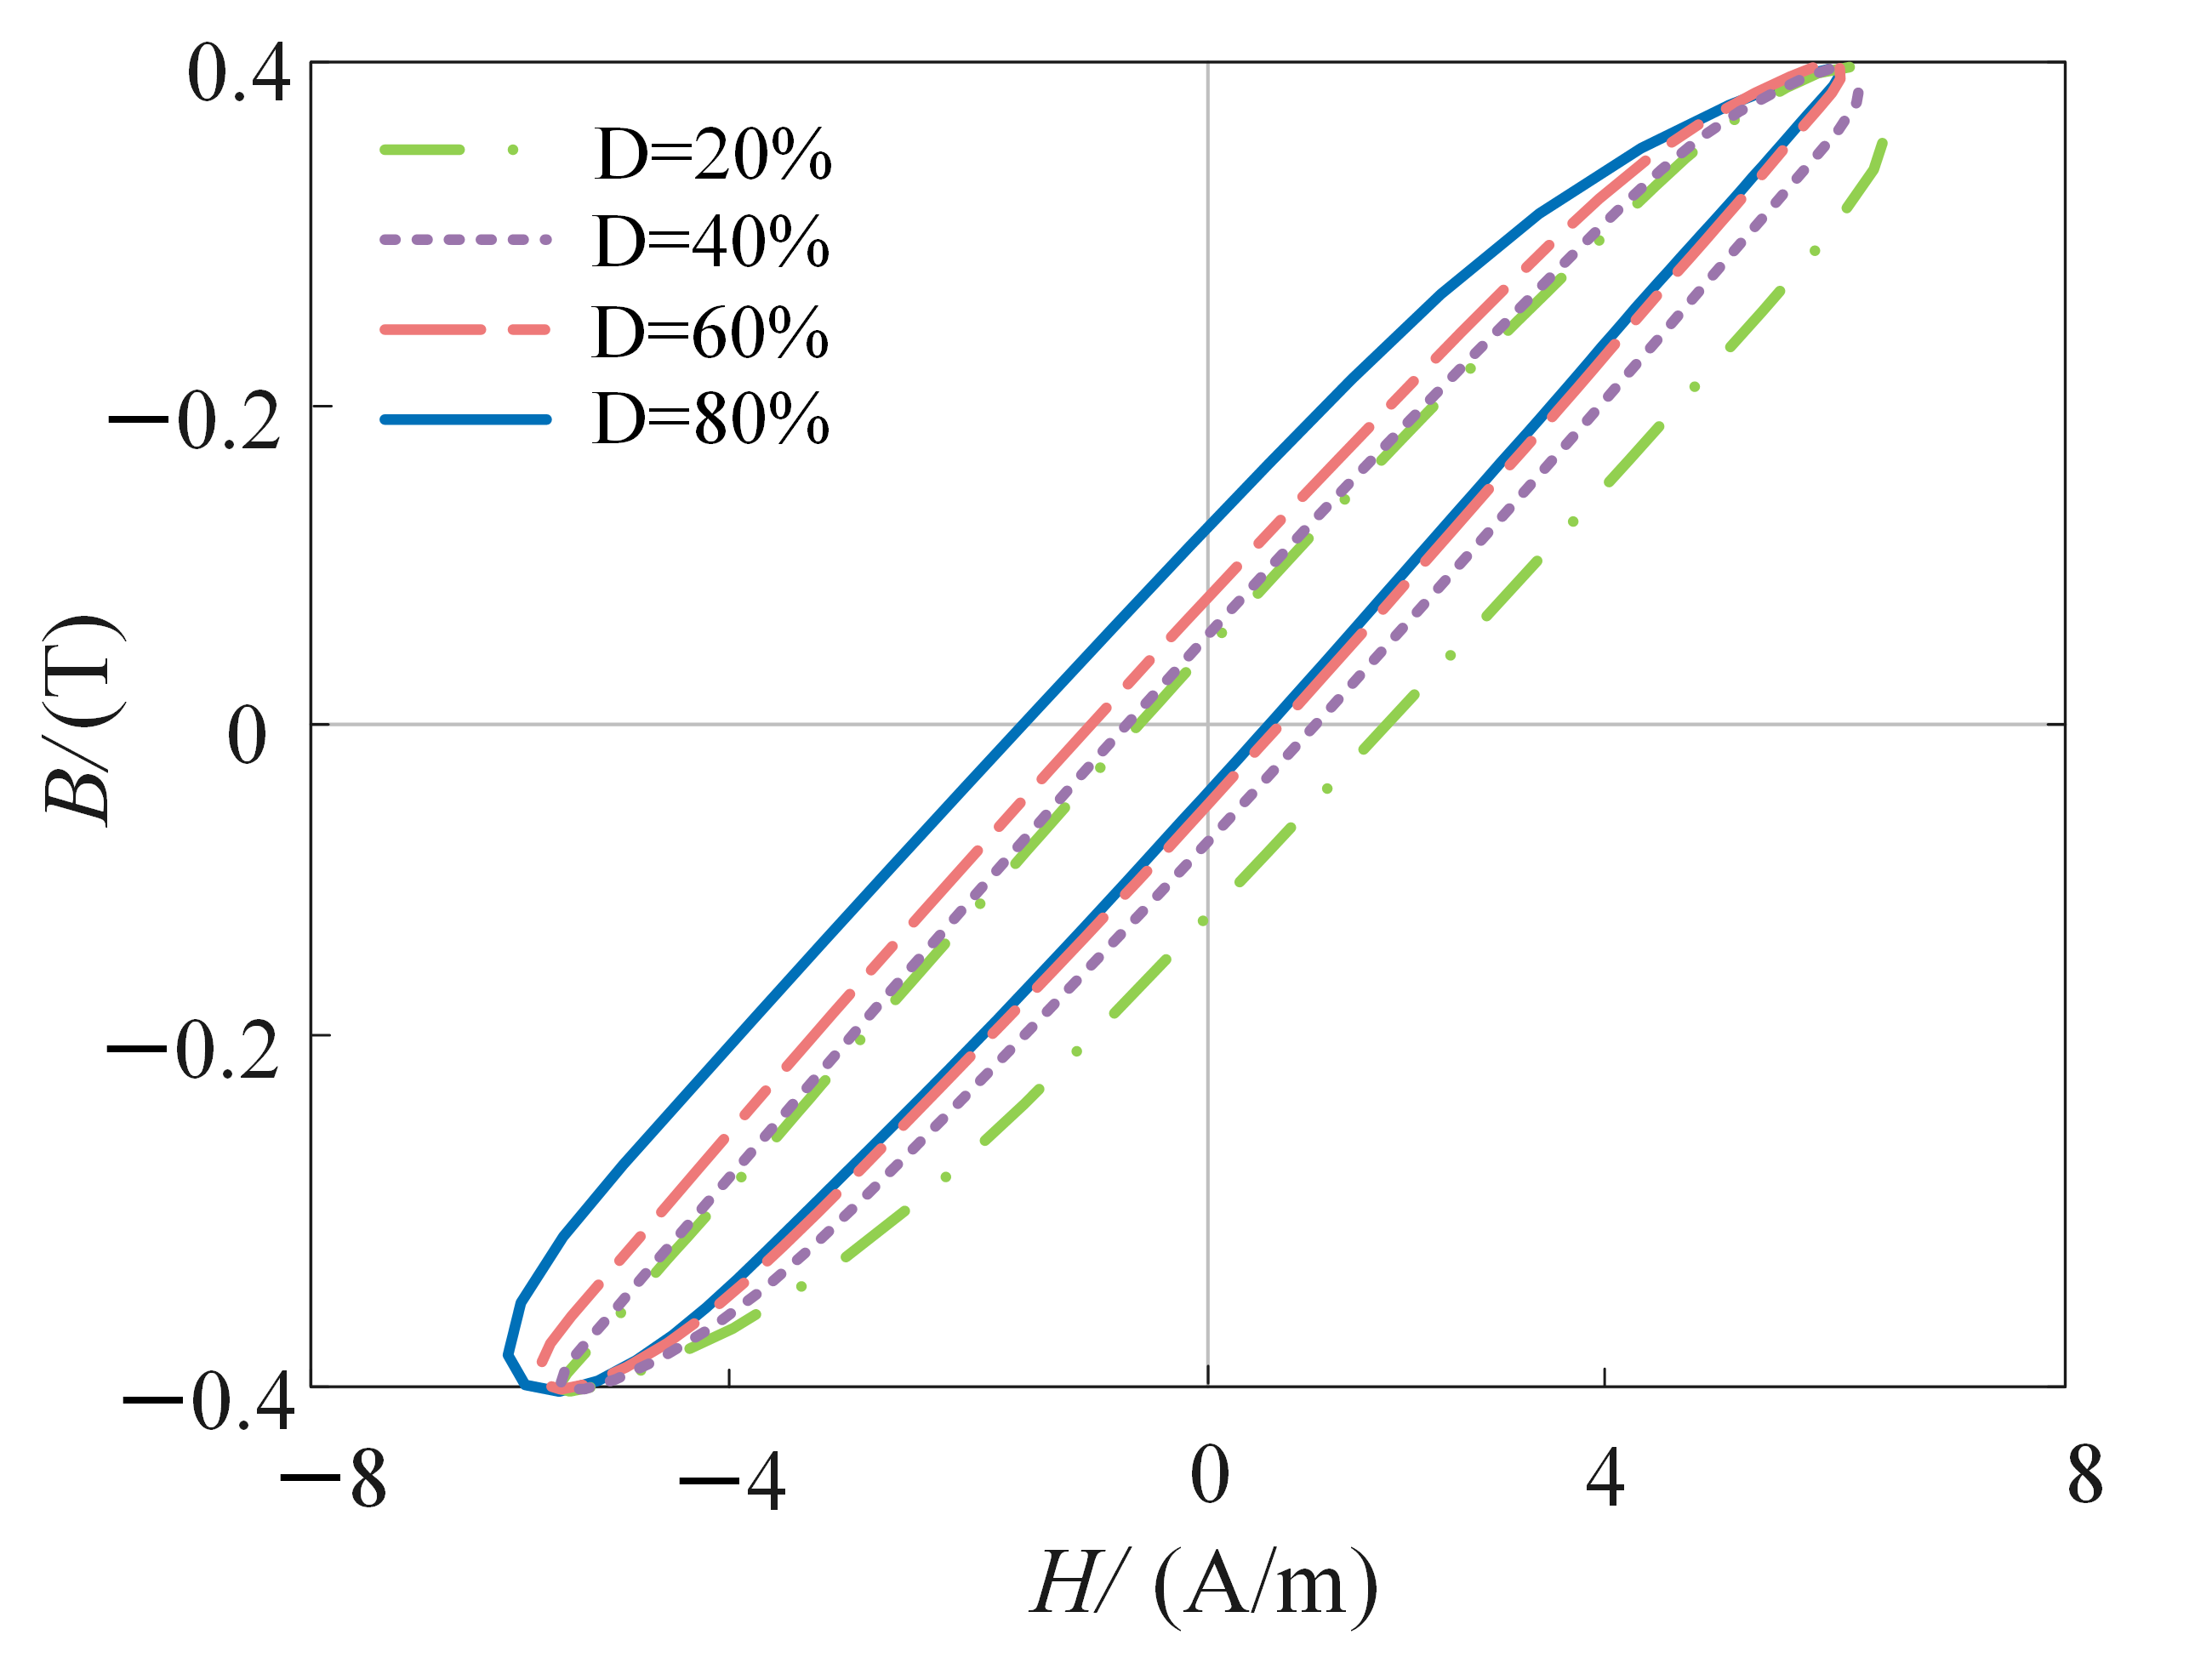
We measured the hysteresis loops under voltage excitation with different duty cycles using the BROCKHAUS system, and Figure 4 shows the results. Nanocrystalline materials consist of nanoscale grains embedded in an amorphous matrix, and domain-wall motion is strongly affected by pinning centers at grain boundaries. Under asymmetric square-wave voltage excitation, the magnetic field changes at different rates during its rising and falling stages. The observed branch asymmetry is consistent with rate-dependent domain-wall motion involving different pinning and depinning dynamics during the two magnetization intervals. Since no direct magnetic-domain imaging was performed, this mechanism is only an interpretation supported by macroscopic hysteresis measurements and research rather than a directly observed microscopic mechanism. The coercive field Hc is the critical field at which domain walls lose stability and undergo abrupt displacement, and the remanent flux density Br depends on the final domain-wall positions at zero field. The measured loops exhibit a clear branch-dependent asymmetry in both Hc and Br, as shown in Table 2. This branch-dependent behavior demonstrates that the forward and reverse magnetization processes are not equivalent under asymmetric-duty-cycle excitation [25].
Figure 4.
Measured hysteresis loops of the nanocrystalline ring core under asymmetric duty-cycle square-wave voltage excitation.
Table 2.
Positive and negative values of Hc and Br.
3. Dynamic Hysteresis Model and Loss Calculation Under Asymmetric Duty-Cycle Square-Wave Excitation
The loss-separation model divides the core loss per cycle W (J/m3) into hysteresis loss Why, classical eddy-current loss Wcl, and excess loss Wex. It is applicable to various magnetic materials and excitation conditions and establishes a link between microscopic mechanisms and macroscopic responses. Based on the consistency between loss separation and field separation, the total dynamic magnetic field H is decomposed as follows [26]:
where Hhy, Hcl, and Hex denote the fields associated with hysteresis loss, classical eddy-current loss, and excess loss, respectively. Preisach model of nanocrystalline materials has previously been investigated by Sergeant and Dupré [27], who combined a rate-independent Preisach description with the principle of loss separation and electromagnetic field diffusion to predict dynamic hysteresis behavior. Our work adopts the same general physical principle of separating the quasi-static and dynamic magnetic fields. However, our focus is on asymmetric duty-cycle excitation. The main extension is the treatment of the dynamic magnetic field.
3.1. Quasi-Static Field Calculation Using the Concentric Hysteresis-Loop Method
The classical inverse Preisach model represents magnetic hysteresis as a weighted superposition of elementary relay operators with different up- and down-switching thresholds and is expressed as [28]
where α and β are the upper and lower switching values, respectively; p(α, β) is the inverse Preisach distribution function; γαβ is a hysteresis operator; and γαβ(B) is its output, which depends on the output at the preceding time instant.
To avoid complex differentiation of experimental data during parameter identification, the Everett function is introduced as follows:
Owing to experimental limitations, measurements on the nanocrystalline ring core under 5 Hz sinusoidal excitation at peak flux densities of Bm = 0.1, 0.2… 1.4, 1.5 T were used to approximate the static hysteresis [28]. The maximum and minimum flux densities of each measured concentric loop were selected as identification nodes. For each flux-density node, the corresponding magnetic-field values on the ascending and descending branches of the remaining concentric loops were obtained by piecewise-linear interpolation. The discrete inverse Everett function was then calculated using the concentric-loop identification method as follows:
where Hα and Hβ are their corresponding magnetic-field values, and at least one of the two flux-density states corresponds to the maximum or minimum flux density of that loop. The normalization factors are defined as follows:
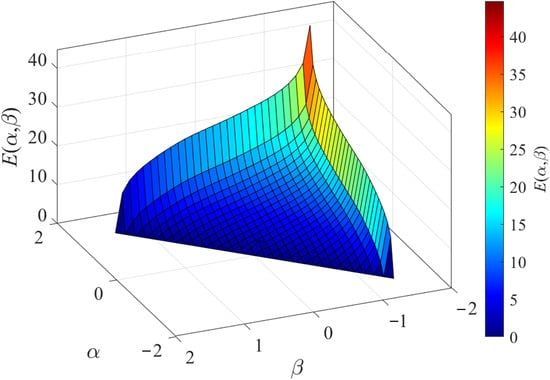
The resulting discrete values form an inverse Everett map defined by the measured reversal flux-density levels, as shown in Figure 5. For the hysteresis calculations, we obtained Everett-function values between measured nodes by piecewise-linear interpolation.
Figure 5.
The result of the Everett function.
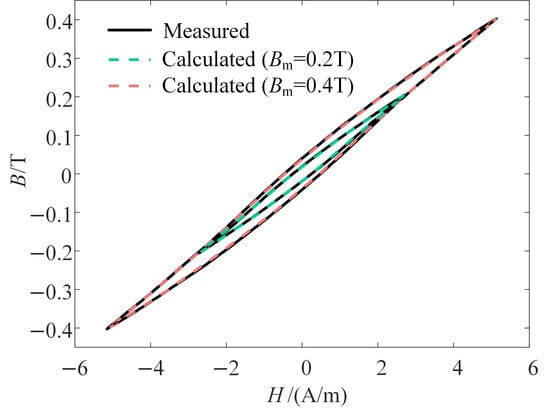
After obtaining the Everett function, the quasi-static hysteresis loop was simulated using the identified parameters. The result is shown in Figure 6.
Figure 6.
Comparison between the predicted and measured quasi-static hysteresis loops of the nanocrystalline ring core.
3.2. Calculation of the Classical Eddy-Current Field Considering the Skin Effect
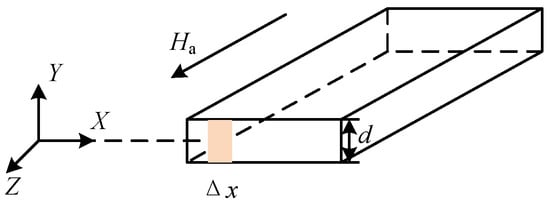
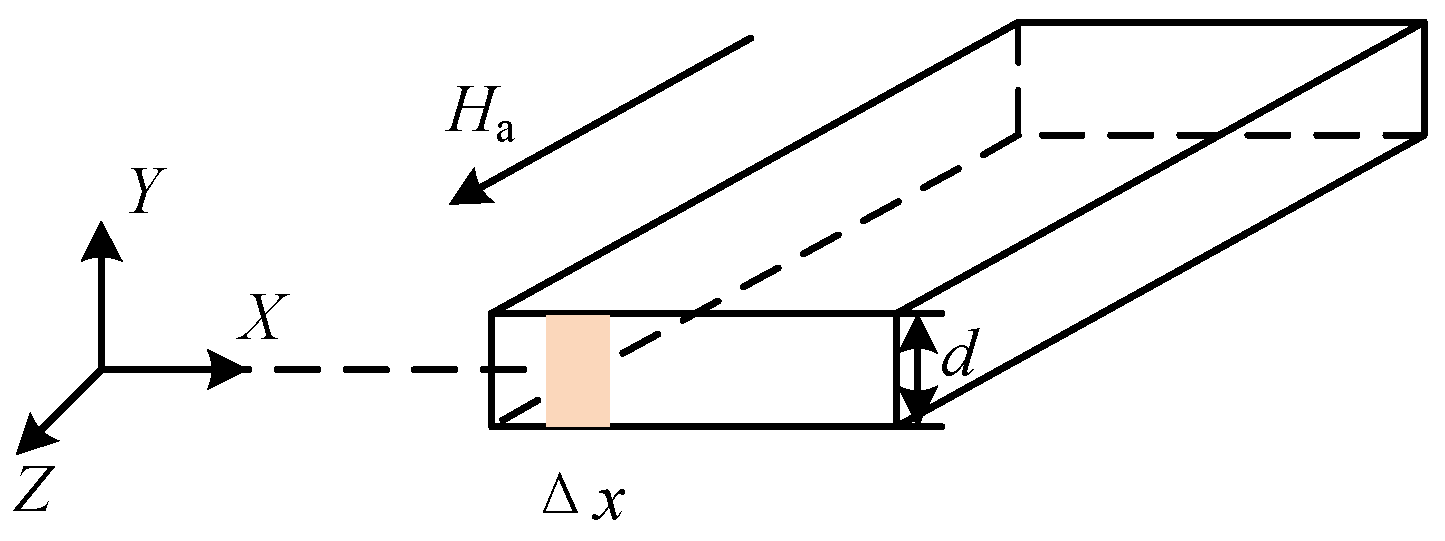
As shown in Figure 7, the thickness of the nanocrystalline strip d is 21.5 μm, and the applied field Ha is oriented along the z-axis. Under single-frequency sinusoidal flux-density excitation, Maxwell’s equations, the magnetic constitutive relation, and the boundary conditions yield the following equations:
where σ is the electrical conductivity, μ is the permeability, ω is the angular frequency, and Ba is the applied flux density. The propagation constant γ is defined as
Figure 7.
Schematic diagram of the nanocrystalline strip.
Using Equation (6), the average magnetic field over an arbitrary interval Δx which marked in Figure 7 is obtained as follows:
The classical eddy-current field is obtained by taking the real part of the difference between the surface magnetic field and the average magnetic field [25]. The magnetic field under single-frequency sinusoidal excitation can thus be calculated as follows:
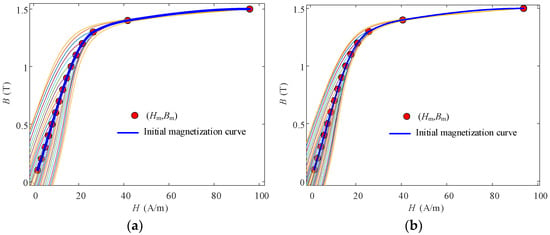
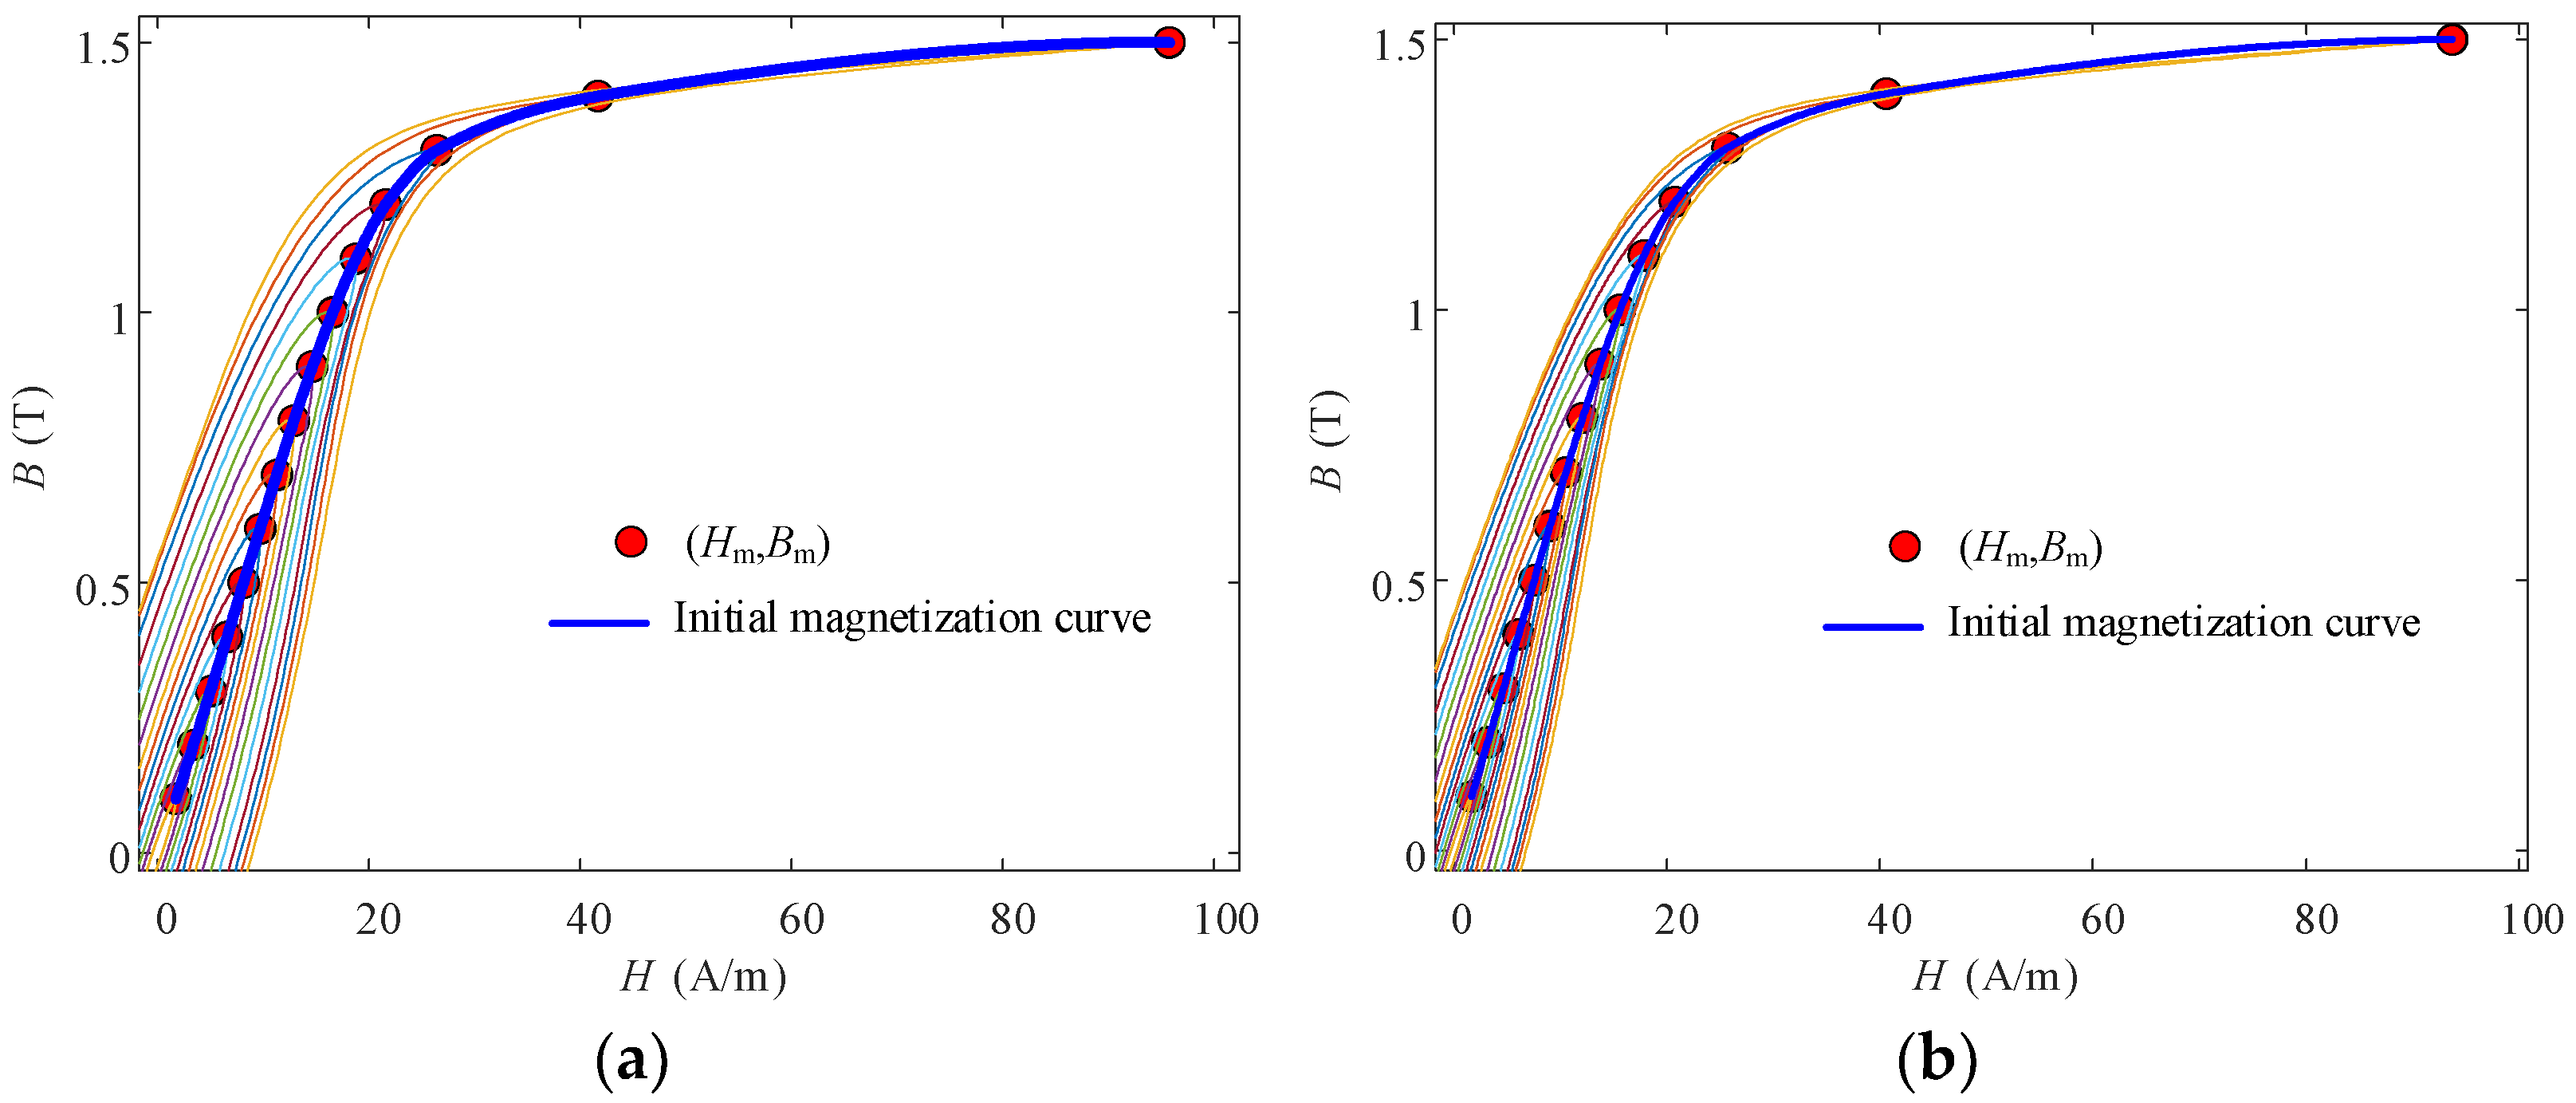
where μ is the permeability. The nonlinear magnetic response using an amplitude-dependent permeability μi (Bm,i) = Bm,i/Hm,i derived from the initial magnetization curve at the fundamental frequency [19]. This is an approximation of the present formulation. And the initial magnetization curves under 2 kHz and 5 kHz are shown in Figure 8. The initial magnetization curves are obtained by connecting the vertices of different loops. For the representative condition of f = 5 kHz and Bm = 0.5 T, the measured amplitude permeability is μ = 0.045 H/m. The calculated skin depth is 42.89 μm, which remains larger than the ribbon thickness at 5 kHz. Since the skin depth decreases with increasing excitation frequencies, it becomes more significant at frequencies higher than those validated in this study. Therefore, the skin effect correction is valuable for improving the potential high-frequency applicability of the proposed model.
Figure 8.
The initial magnetization curves. (a) f = 5 kHz. (b) f = 2 kHz.
According to Fourier decomposition, a non-sinusoidal excitation can be represented as a superposition of multiple single-frequency sinusoidal components:
where Hm,n is the amplitude of the n-th harmonic, φn is its phase angle, and r is the highest harmonic order included in the decomposition (r = 20 in this paper). We evaluated the harmonic-order sensitivity under the most asymmetric condition investigated, D = 20% at 5 kHz. For 10, 20, and 25 retained harmonics, the preserved spectral energy was 99.9960%, 99.99985%, and 99.99999%, respectively. Increasing the truncation order from 20 to 25 produced only a marginal improvement, while introducing additional high-frequency components with very small amplitudes. Therefore, r = 20 is sufficient in the decomposition. The harmonic superposition is not strictly valid for a nonlinear magnetic system. Therefore, this is an equivalent-linear approximation. Accordingly, the classical eddy-current field Hcl,arb under square-wave excitation with an arbitrary duty cycle can be calculated by superimposing the eddy-current-field responses of the harmonic components:
The harmonic superposition used here is an equivalent-linear approximation rather than an exact superposition of a nonlinear magnetic system.
3.3. Calculation of the Excess-Loss Field Using the Equivalent-Frequency Method
During dynamic magnetization, domain-wall motion is not completely independent or random, which gives rise to the excess loss field. Its magnitude is closely related to the number of active magnetic objects:
where HW is the magnetic field corresponding to the hypothetical case in which the flux variation over the entire cross-section is produced by a single 180° domain wall, and n is the number of active magnetic objects:
where G is a geometric factor (G = 0.1356), S is the cross-sectional area of the strip (S = 0.4303 mm2), and n0 and V0 are statistical excess-loss parameters associated with the microscopic grain structure. Solving Equations (13) to (15), the excess loss field can be derived as follows:
The statistical parameters n0 and V0 characterize the collective domain-wall motion in the nanocrystalline material. These phenomenological parameters reflect the behavior of active magnetic objects and depend on the material microstructure and domain configuration. In this study, the corresponding statistical parameters are identified by matching the calculated loss to the measured loss [29]:
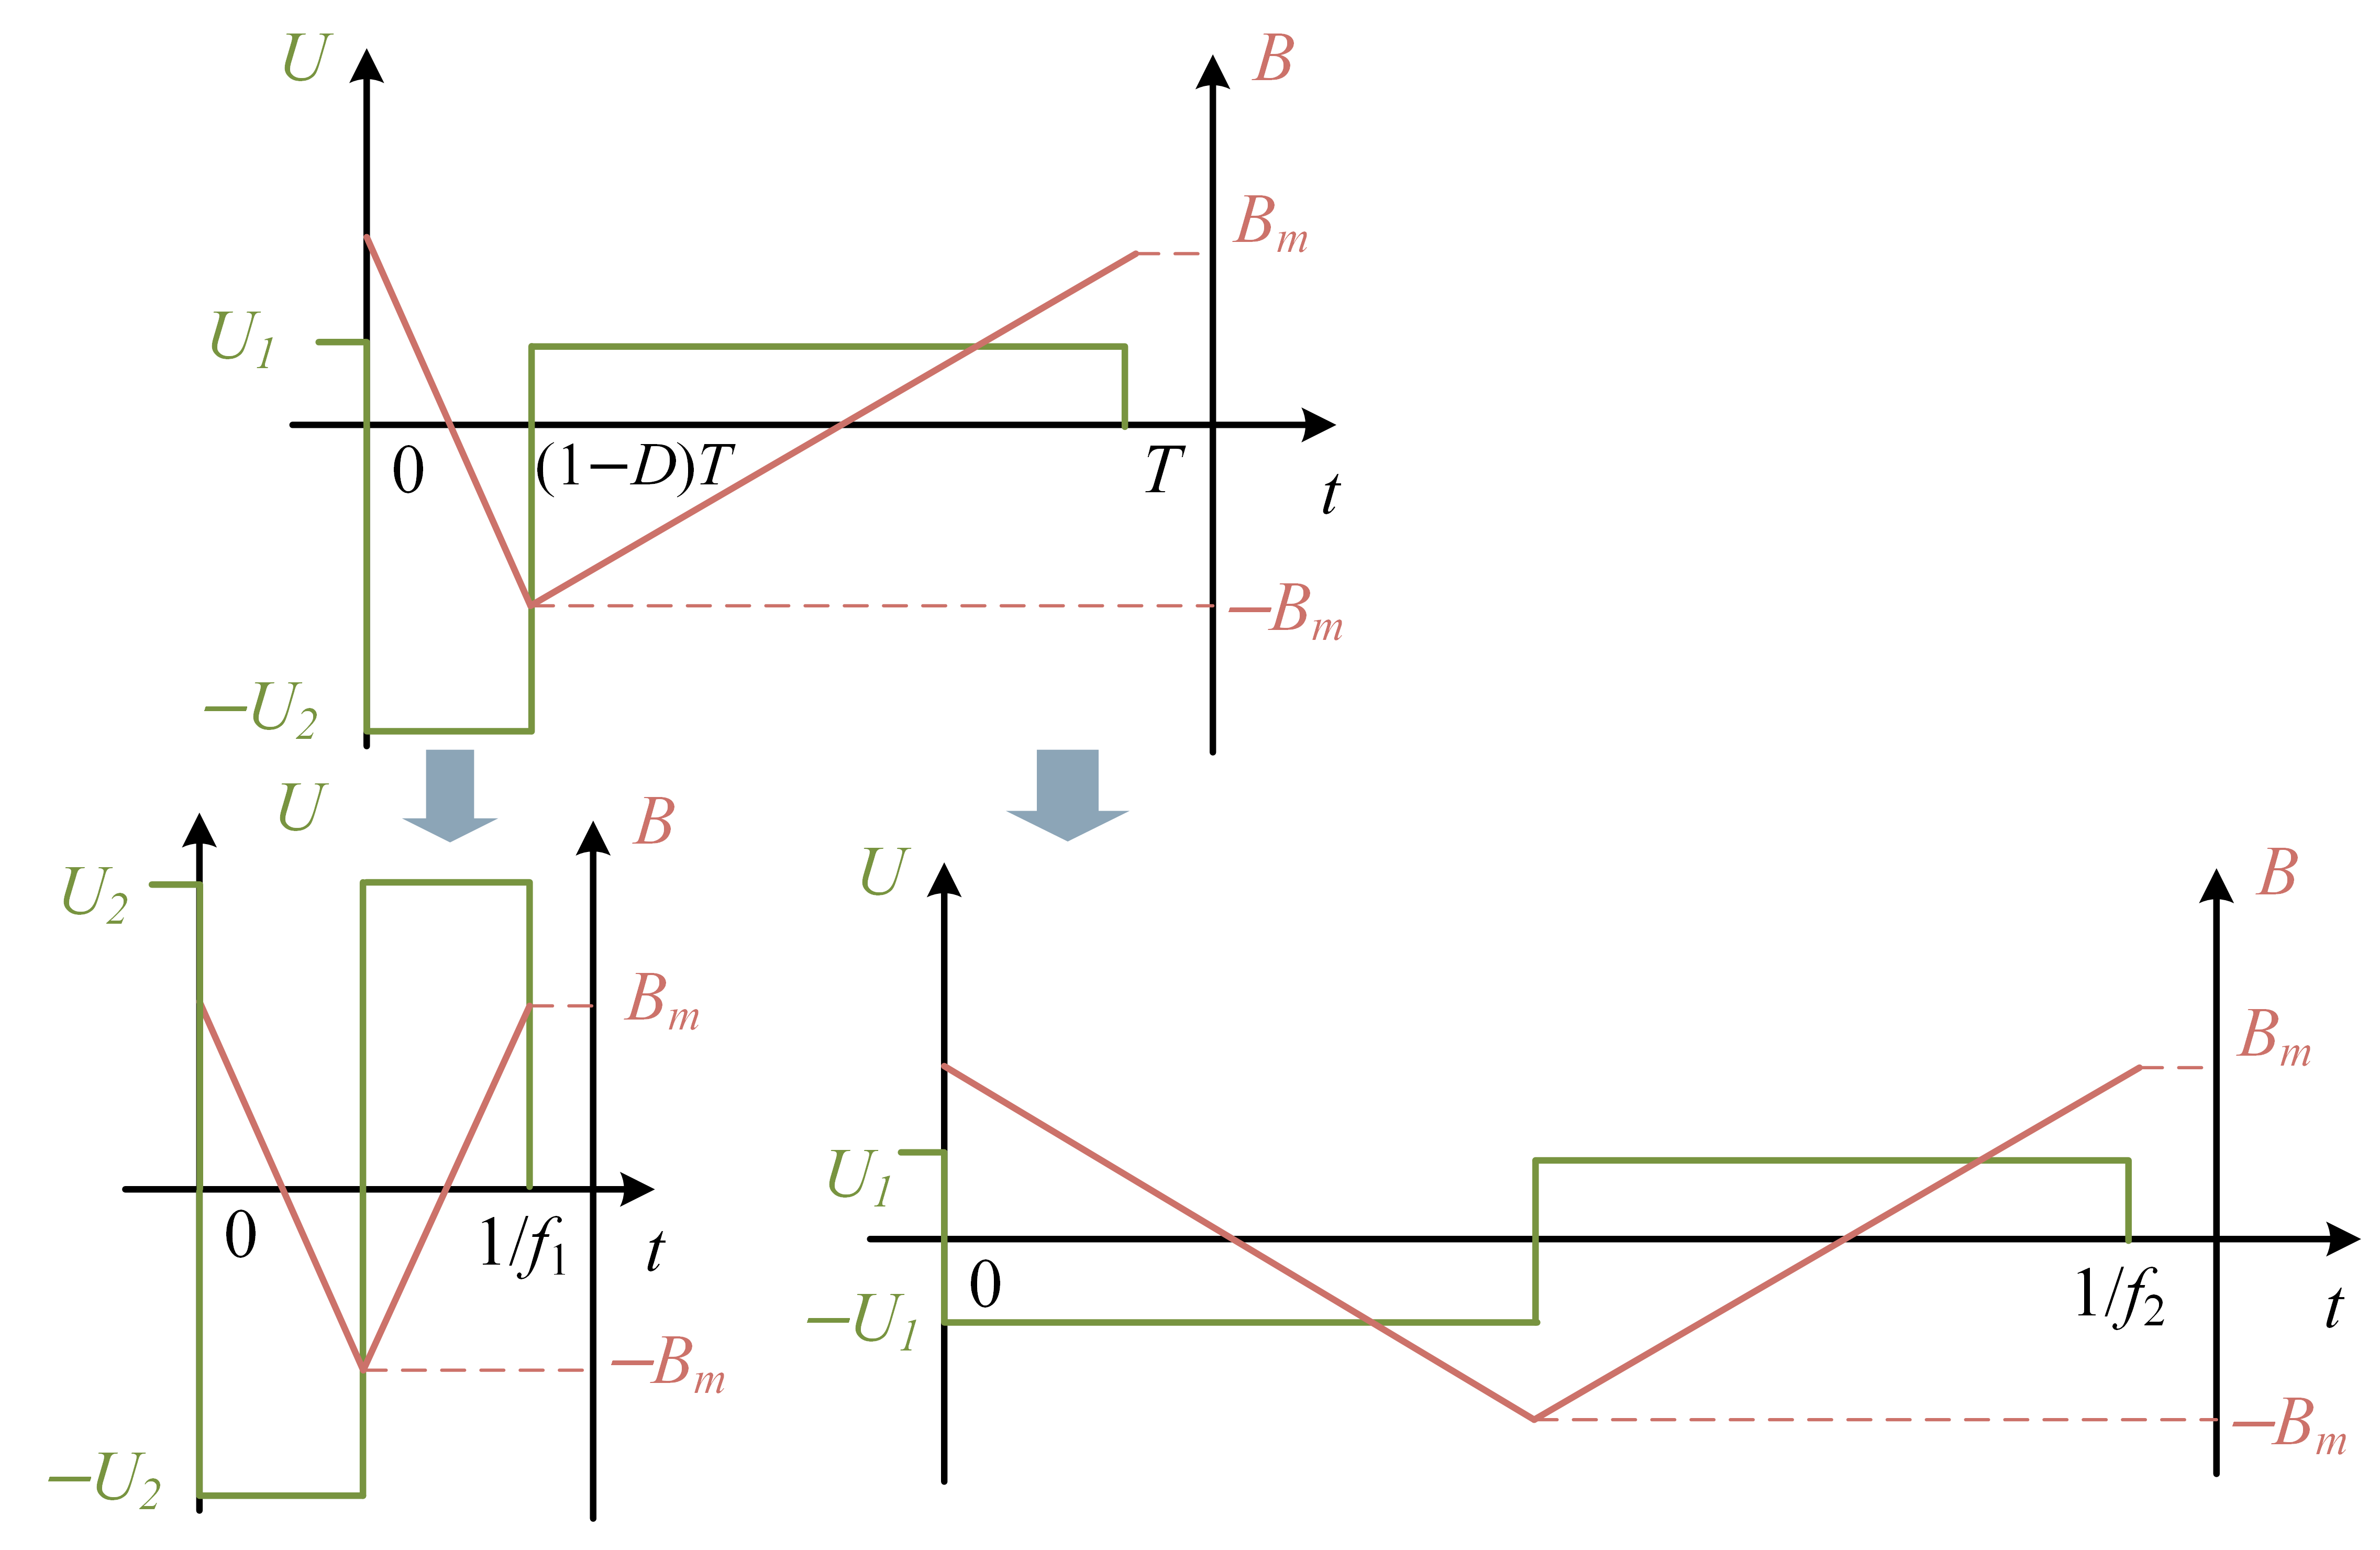
where the loss error tolerance is 10−3 in this paper. During the identification, n0 was constrained to 5 < n0 < 15. Therefore, they are effective parameters that reproduce the measured sinusoidal loss within the prescribed parameter bounds and error tolerance. The sinusoidal measurements used for parameter identification were established over a discrete frequency grid. In addition to the quasi-static reference condition, dynamic measurements were performed at intervals of 0.5 kHz (f = 0.5, 1.0… 12.5, 13 kHz) and Bm = 0.2, 0.5, and 1.0 T. Because no simple analytical relationship between (n0, V0) and frequency was observed, we used linear interpolation to get the parameters for unmeasured frequencies. For an asymmetric duty-cycle square wave, dB/dt differs between the intervals 0 < t < DT and DT < t < T within one period. The number of active magnetic objects consequently changes, which in turn changes the statistical excess-loss parameters n0 and V0. Conventional methods assume constant n0 and V0 over the entire period, which fundamentally limits their accuracy under asymmetric excitation. To model hysteresis loops accurately under asymmetric duty-cycle excitation, we propose an equivalent-frequency method for calculating the excess-loss field, as illustrated in Figure 9. The frequencies of the two equivalent square waves are as follows:
where f1 and f2 are the equivalent square-wave frequencies for the negative- and positive- voltage intervals, respectively.
Figure 9.
Analysis procedure of the equivalent square-wave method.
The excess loss field under asymmetric duty-cycle square-wave excitation is therefore calculated as follows:
where n0,1 and V0,1 are the statistical excess-loss parameters identified under sinusoidal excitation at the equivalent frequency f1, and n0,2 and V0,2 are those identified under sinusoidal excitation at the equivalent frequency f2. Equations (18) and (19) also define the applicable frequency range of the proposed method. As D approaches either 0 or 1, the equivalent frequency increases rapidly, which may require sinusoidal characterization at frequencies substantially higher than the actual operating frequency. Therefore, this method only replaces a large number of asymmetric square-wave measurements of specific waveforms with standardized sinusoidal measurements. The dependence on high-frequency measurements has not been completely eliminated, and this issue is planned to be addressed in the future.
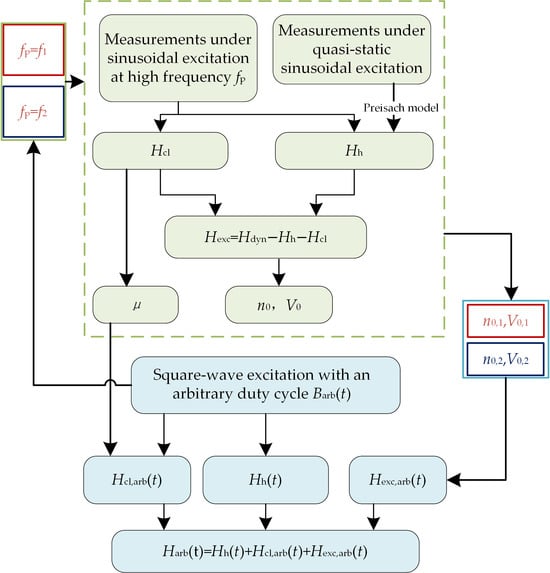
The complete calculation procedure is summarized in Figure 10. Under symmetric square-wave excitation with a 50% duty cycle, the statistical excess-loss parameters are commonly assumed to depend only on the excitation frequency and flux density amplitudes. When the duty cycle deviates from 50%, however, the excitation waveform becomes asymmetric. By accurately representing the domain-wall motion under asymmetric excitation, the proposed method accurately models the resulting hysteresis loops.
Figure 10.
Schematic diagram of the equivalent square-wave method.
4. Analysis of Prediction Results
We selected 2 kHz and 5 kHz to validate the model over the duty-cycle range D = 20% ~ 80% with measurable sinusoidally identified parameters. According to Equation (16), this operating condition requires equivalent frequencies up to 12.5 kHz. Therefore, 5 kHz is only a verification condition of the proposed method rather than as the upper operating-frequency limit of the nanocrystalline material. The identified values of n0,1, V0,1, n0,2, and V0,2 for D < 50% are shown in Table 3. For D > 50%, the values of (n0,1, V0,1) and (n0,2, V0,2) are exchanged.
Table 3.
Results of identified parameters.
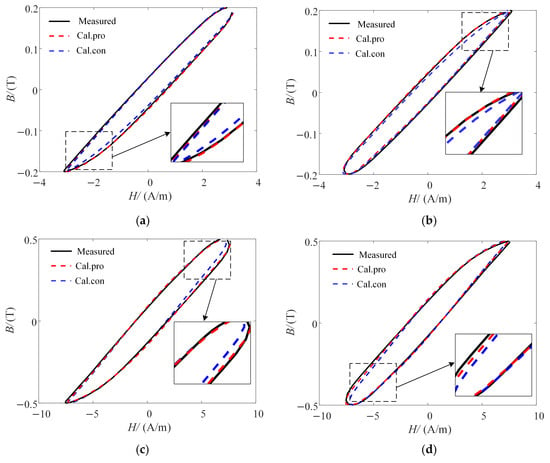
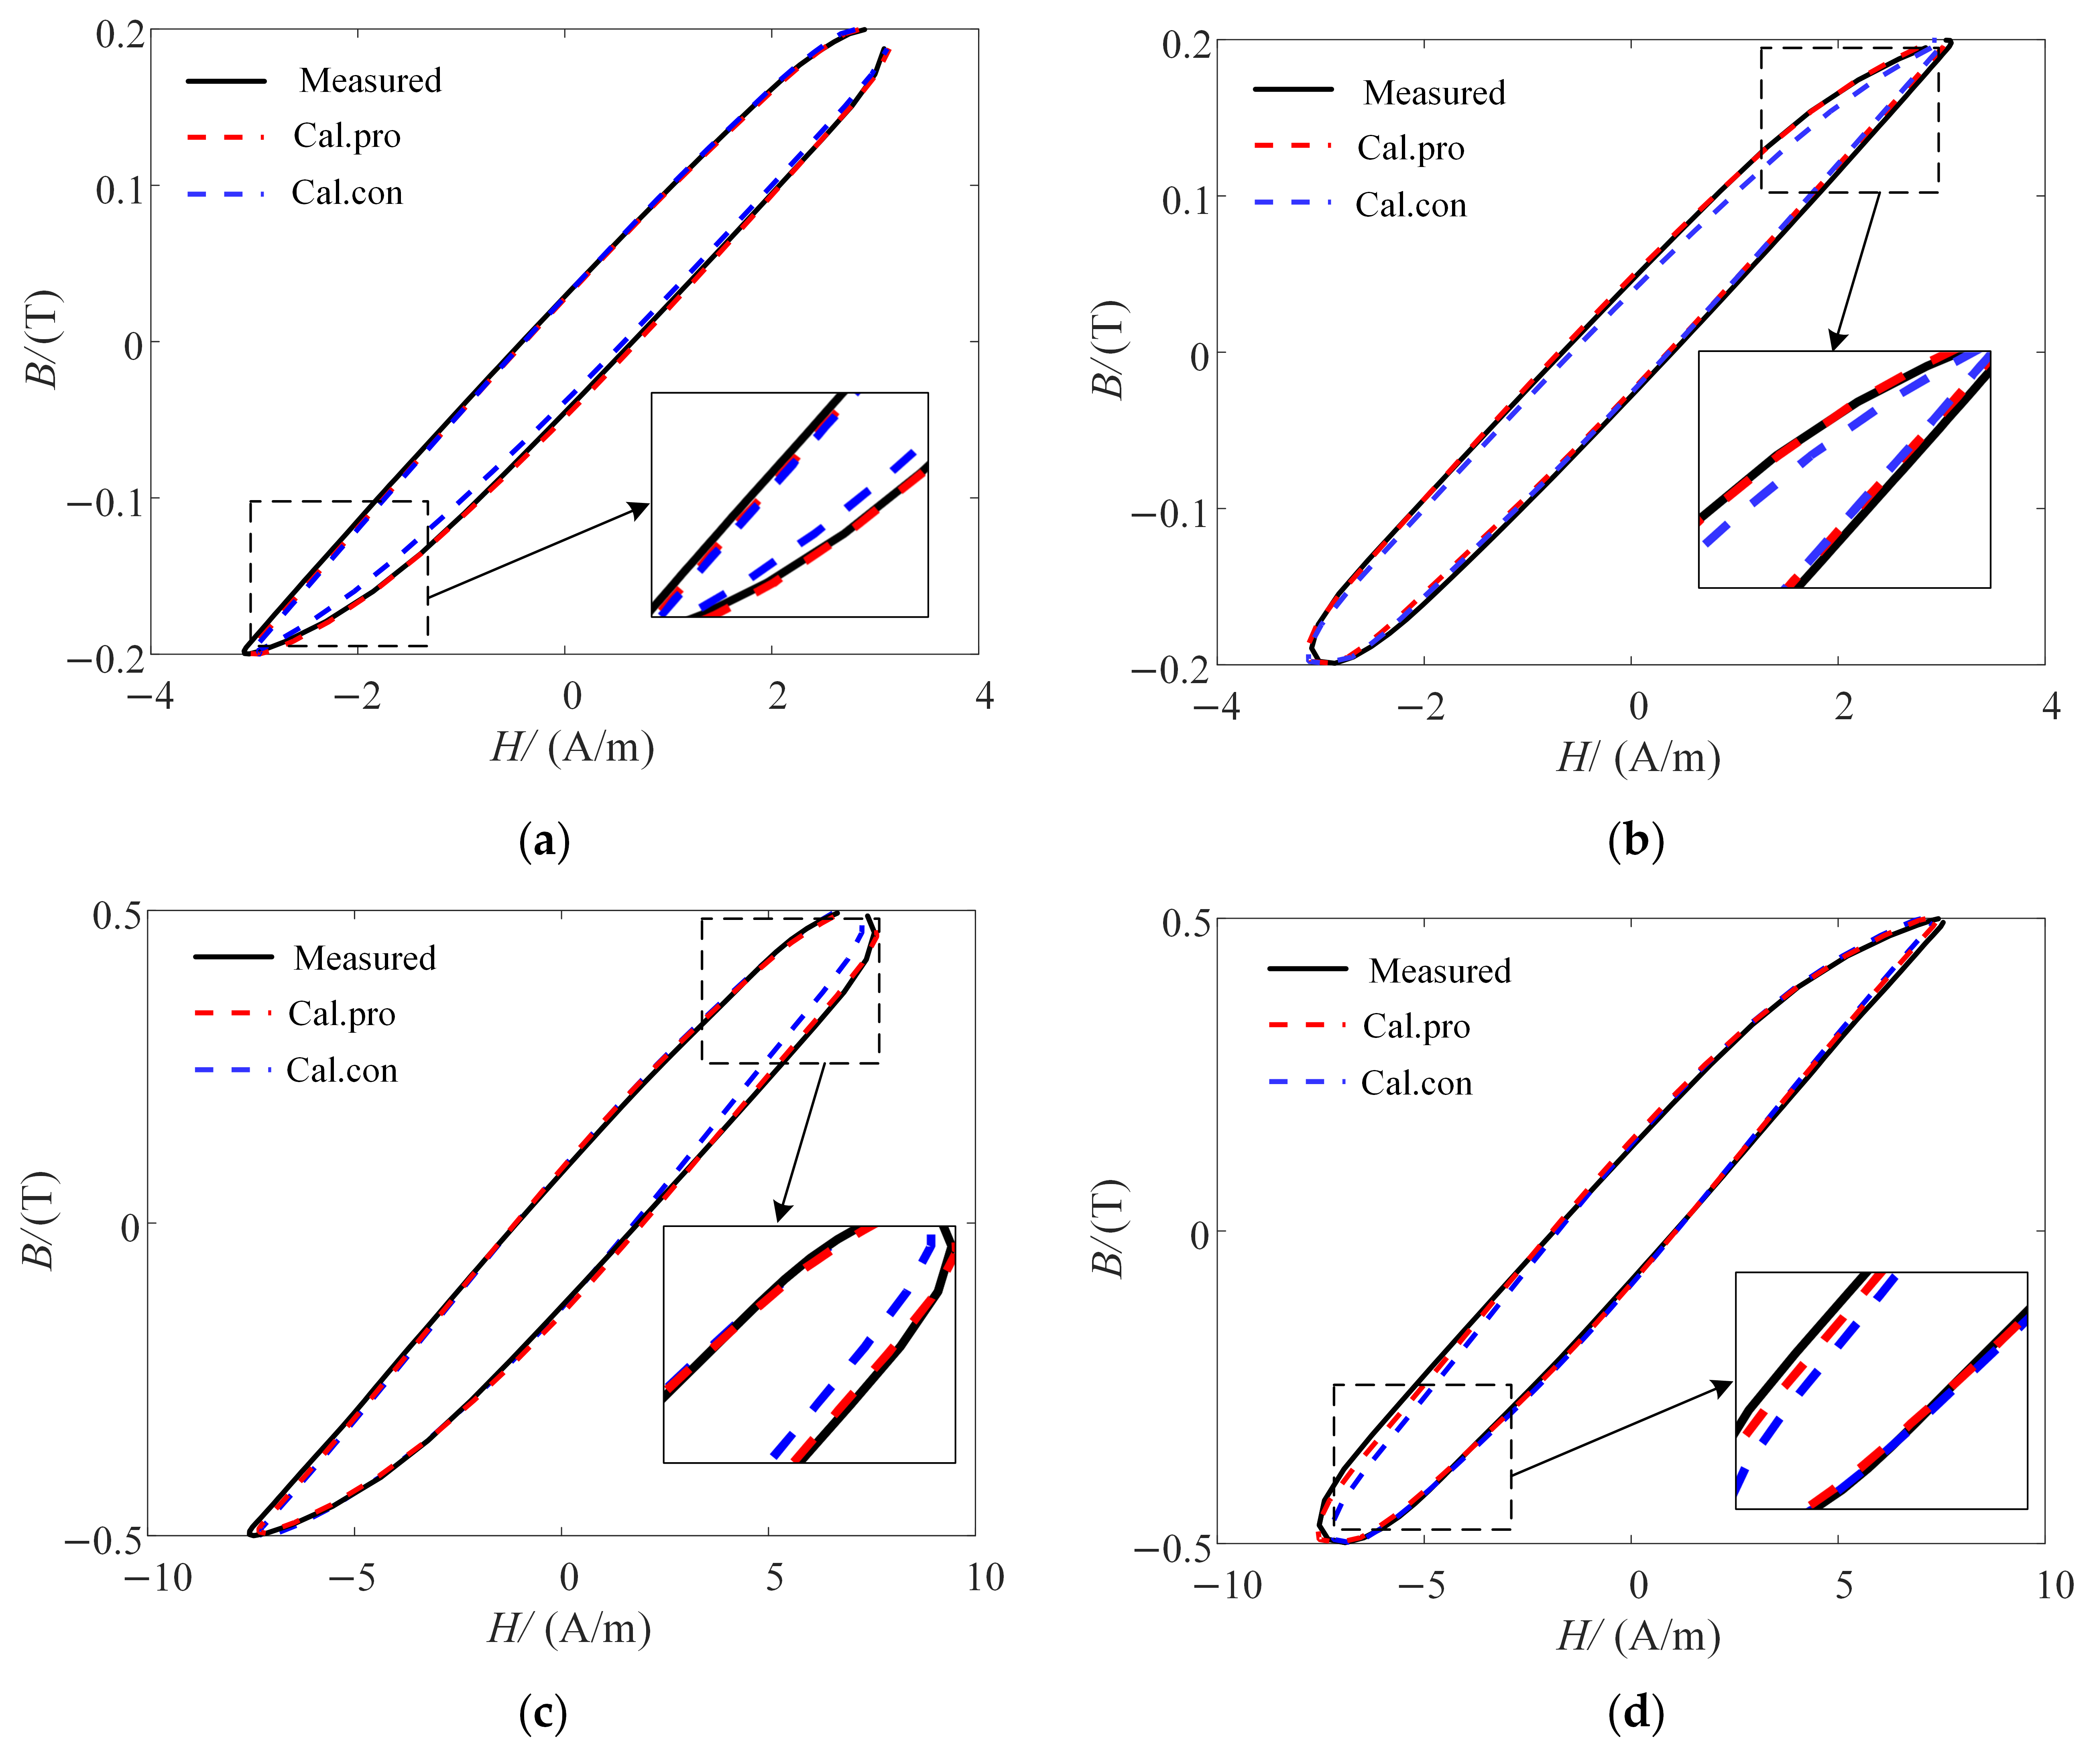
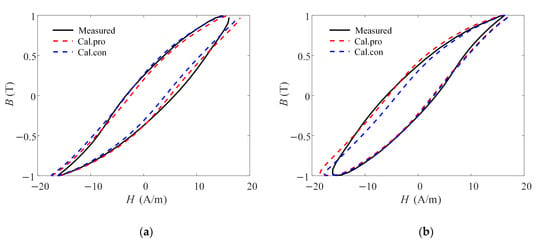
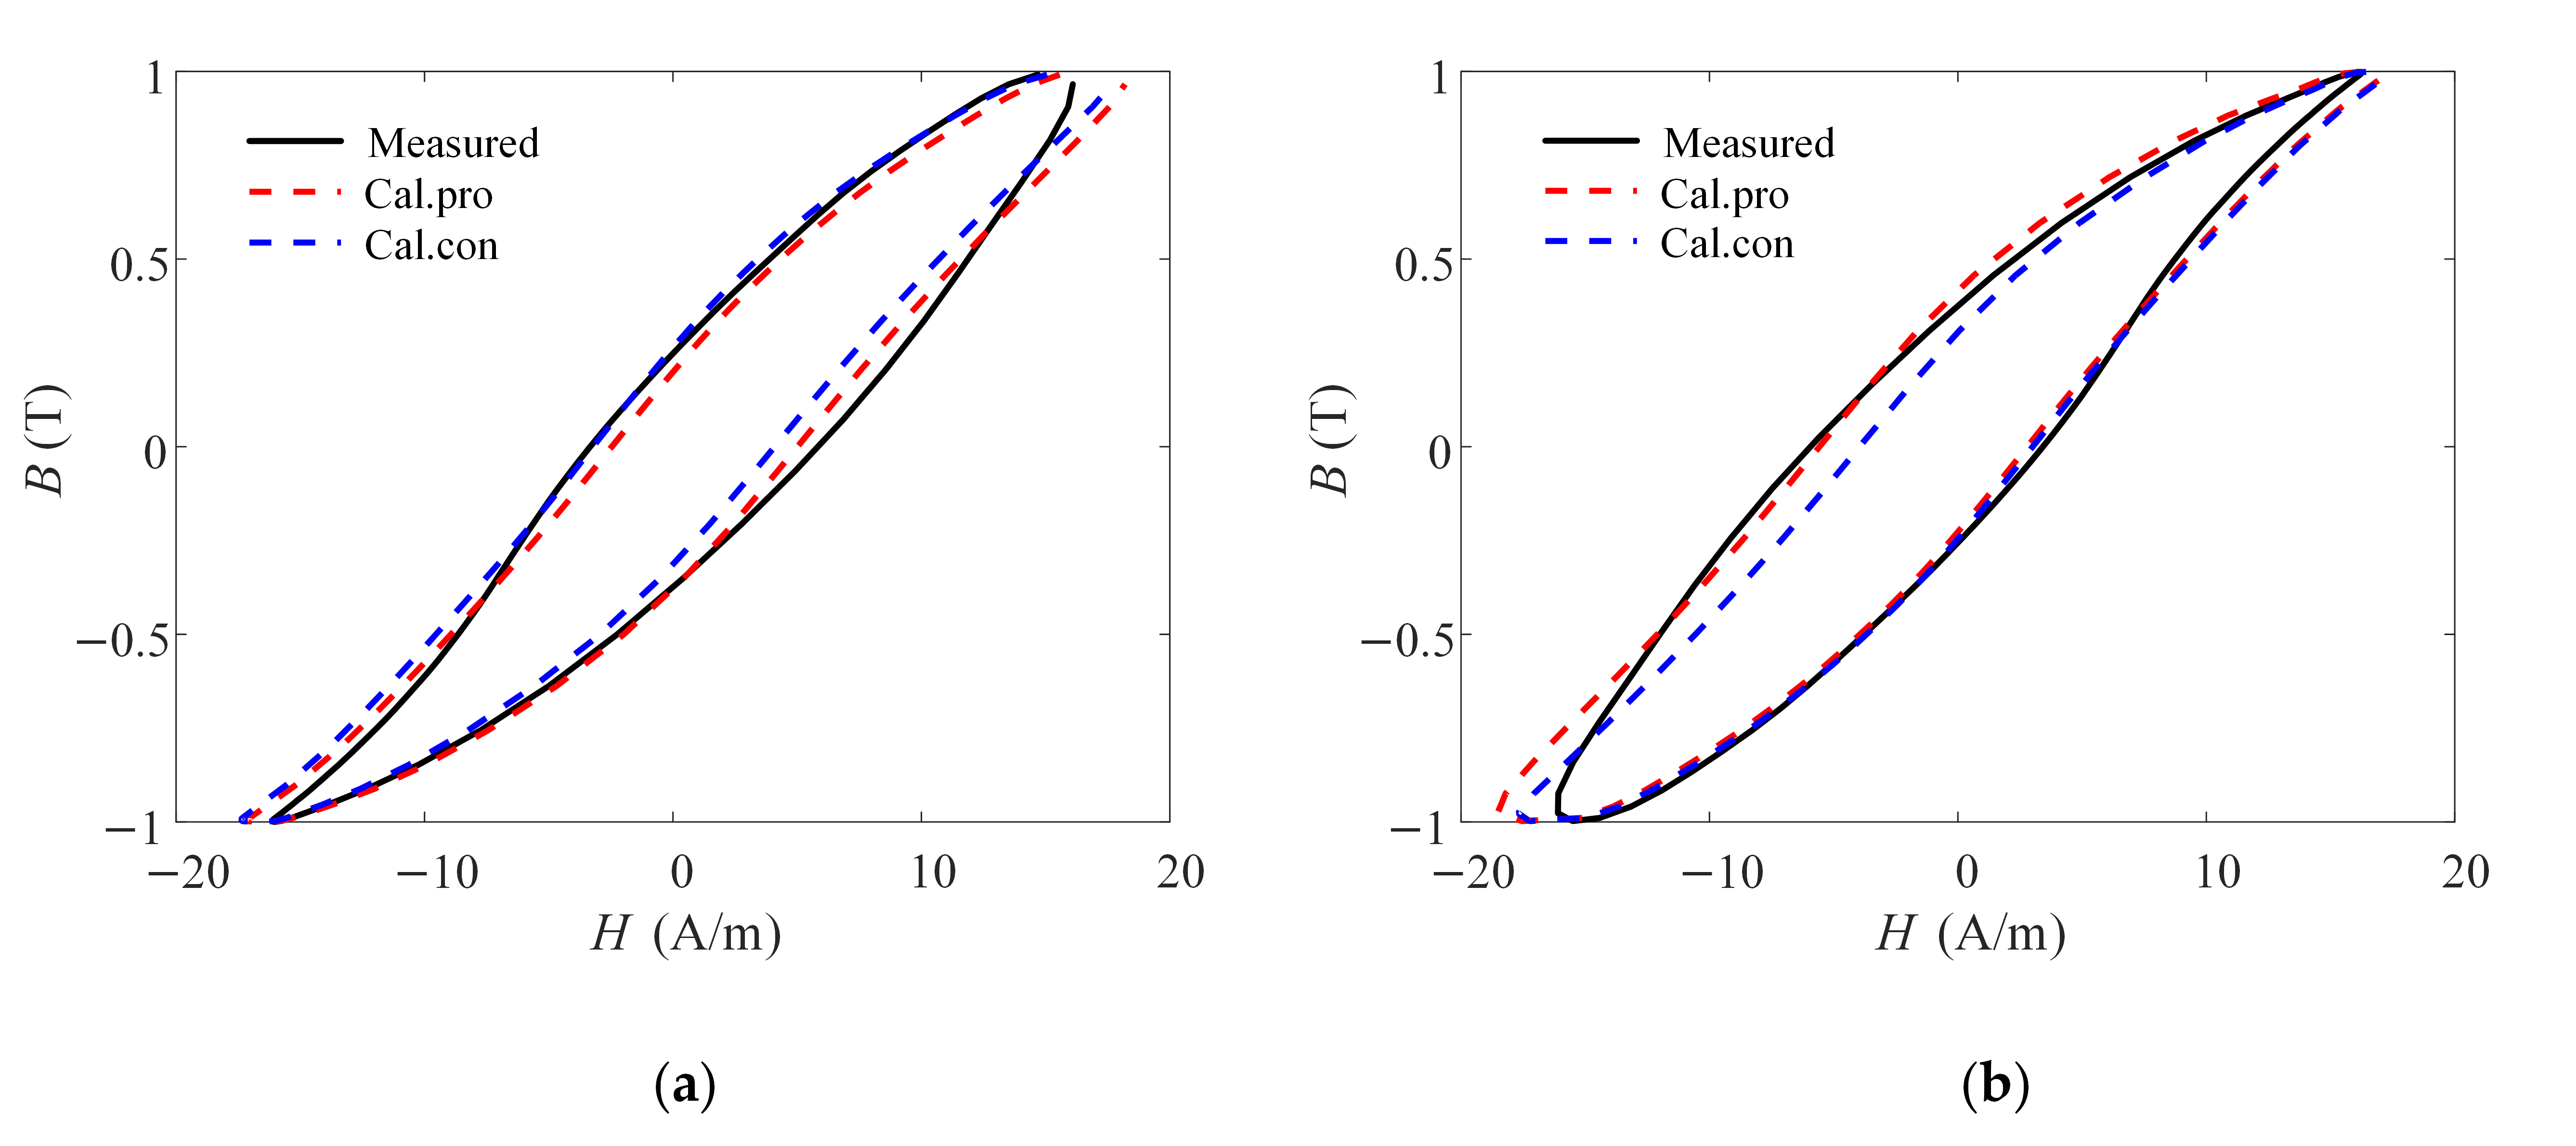
Using the proposed equivalent-frequency method for the excess loss field, we predicted the dynamic magnetic properties under square-wave excitation at 5 kHz and 2 kHz with different duty cycles. We also compared it with those obtained using the conventional method. In the conventional model (Con.), the quasi-static hysteresis field Hhy and the classical eddy-current field Hcl were calculated using the same methods as those employed in the proposed model. However, the excess field Hex was evaluated using a single set of parameters, n0 and V0, identified from sinusoidal measurements at the excitation frequency and the corresponding flux density amplitudes. The results are shown in Figure 11 and Figure 12.
Figure 11.
Predicted and measured hysteresis loops under square-wave excitation with different duty cycles. (a) Bm = 0.2 T, D = 20%. (b) Bm= 0.2 T, D = 80%. (c) Bm = 0.5 T, D = 20%. (d) Bm = 0.5 T, D = 80%.
Figure 12.
Predicted and measured hysteresis loops under square-wave excitation with different duty cycles (f = 2k Hz, Bm = 1.0 T). (a) D = 20%; (b) D = 80%.
The measured and calculated loss values were obtained from the areas enclosed by the corresponding hysteresis loops. The loss error is defined as follows:
where Wmea and Wpre are the measured and predicted losses, respectively. To better evaluate the overall shape of the predicted hysteresis loops, we employed dynamic time warping (DTW) [30]. DTW warps and matches the measured and predicted magnetic-field sequences at different flux-density values, thereby capturing local deviations. A smaller intersequence distance indicates greater similarity between the two curves:
where Di,j is the cumulative DTW distance, N is the number of sampling points, and EDTW is the normalized DTW error. A smaller value indicates greater similarity between the predicted and measured hysteresis loops.
Table 4 lists the loss errors and normalized DTW errors under asymmetric duty-cycle square-wave excitation. When the duty cycle deviates from 50%, the errors of the conventional method increase markedly. In contrast, the loss errors obtained using the equivalent-frequency method are all below 4.767%, and the normalized DTW errors are all below 6.113%, confirming its effectiveness and accuracy in calculating core magnetic properties and losses.
Table 4.
Comparison of predicted values and measured values under different duty cycles of square-wave excitation.
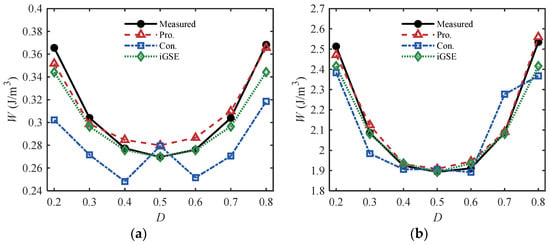
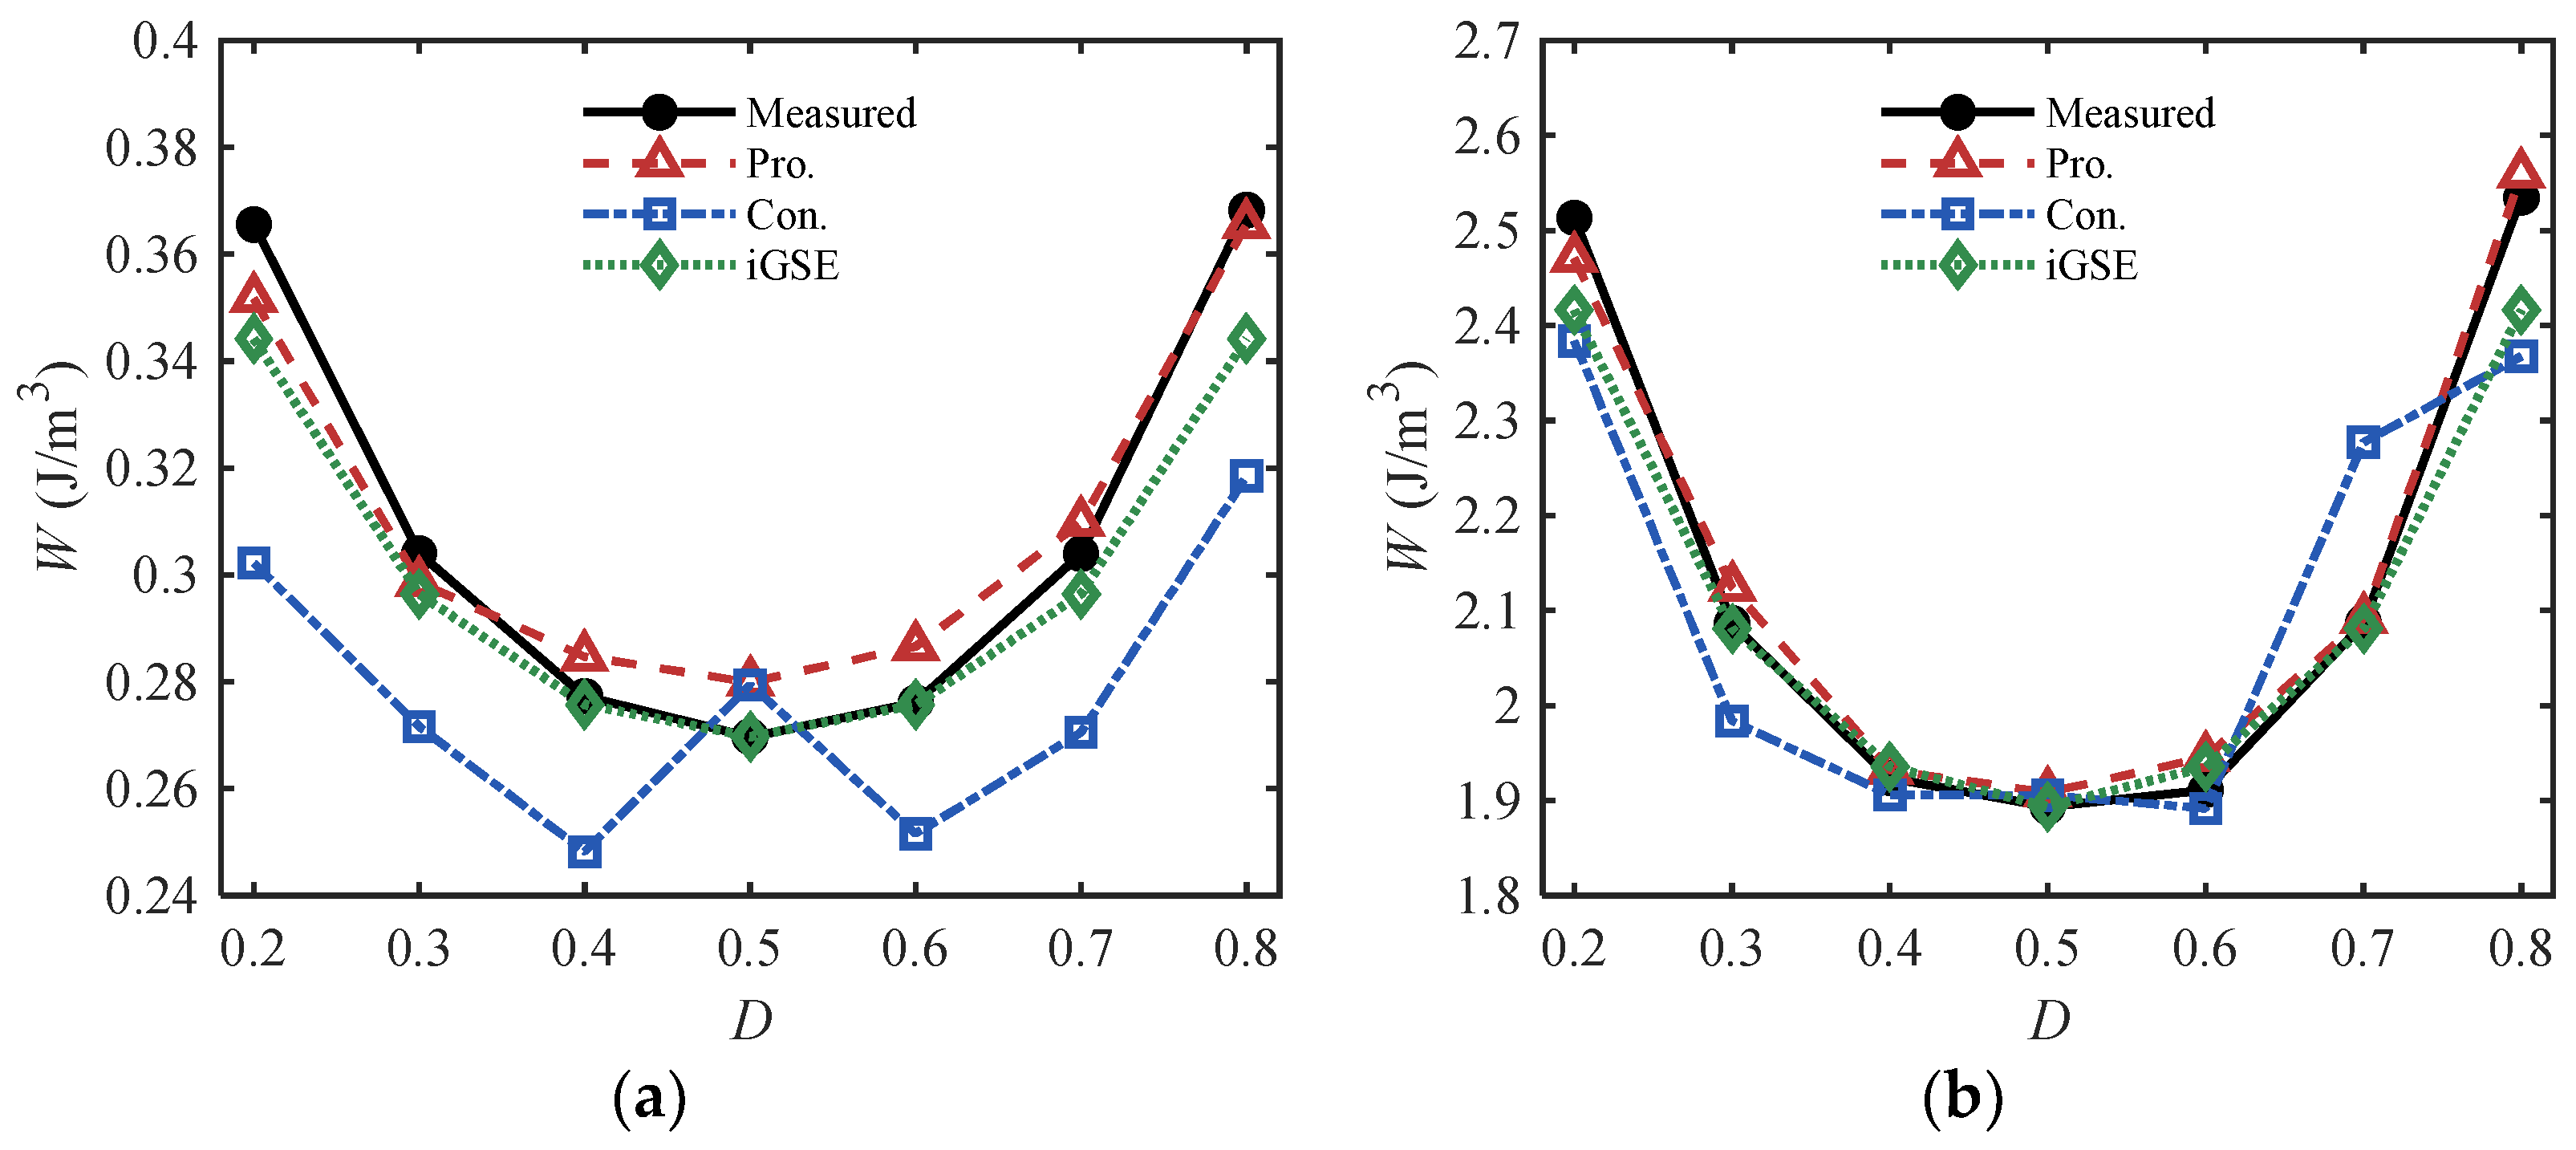
Core loss is minimized at a duty cycle of 50%. As the duty cycle deviates from 50%, the harmonic content and core loss increase, resulting in an overall U-shaped relationship between loss and duty cycle. For further comparison, the loss calculated by iGSE (WiGSE) was implemented:
where PiGSE is the power-loss density, and (k, α, β) are the parameters identified from sinusoidal measurements. In this paper, k = 4.559 × 10⁻⁶, α = 1.653, and β = 2.838.
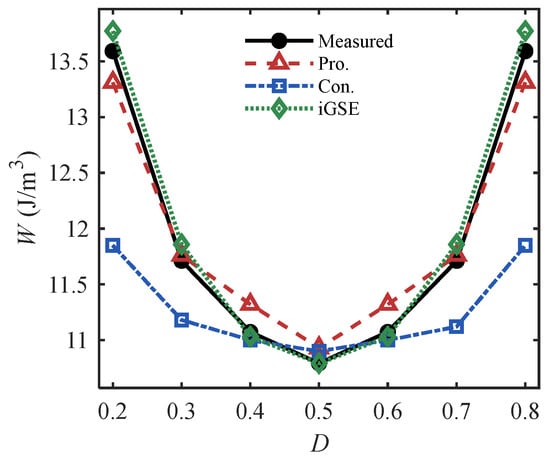
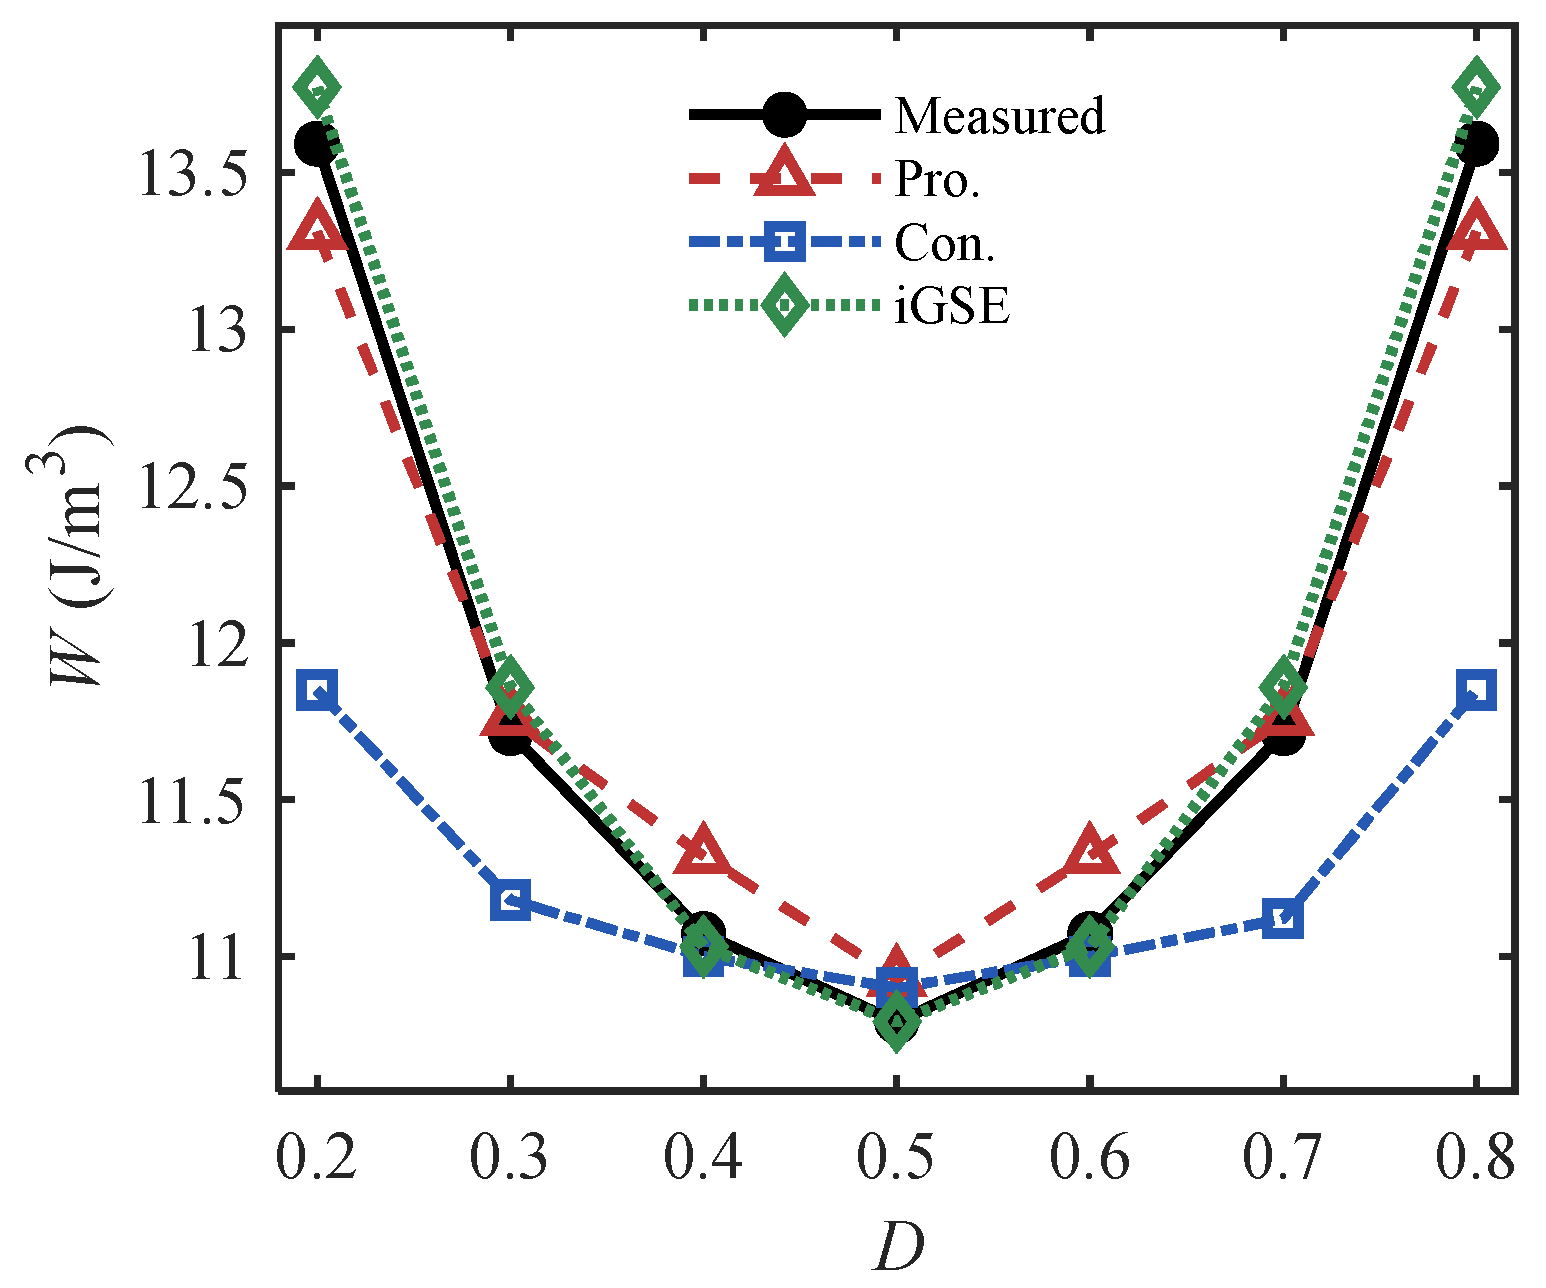
As shown in Figure 13 and Figure 14, both the proposed method and iGSE agree better with measurements than the conventional method. However, iGSE still cannot predict dynamic loops. The proposed dynamic hysteresis model, based on the underlying loss mechanisms, achieves high computational efficiency while maintaining prediction accuracy for dynamic loops and losses.
Figure 13.
Loss prediction results under wave excitation with different duty cycles (f = 5 kHz). (a) Bm = 0.2 T. (b) Bm = 0.5 T.
Figure 14.
Loss prediction results under wave excitation with different duty cycles (f = 2k Hz, Bm = 1.0 T).
5. Conclusions
This study addresses the difficulty of predicting hysteresis loops of the nanocrystalline core under asymmetric duty-cycle square-wave excitation. We interpret the underlying microscopic mechanism in terms of magnetic domains and propose a high-accuracy method for hysteresis modeling and loss calculation. The principal conclusions are as follows.
Experiments show that, when the excitation duty cycle deviates from 50%, the dynamic hysteresis loops exhibit a clear branch-dependent asymmetry in both Hc and Br. This behavior can be explained by an interpretation based on rate-dependent domain-wall motion.
Based on the dependence of the statistical excess-loss parameters on dynamic domain-wall behavior, we propose an equivalent-frequency method that calculates the excess loss field. Validation over a duty-cycle range of 20–80% shows that the loss error and normalized DTW error of the nanocrystalline-core hysteresis loops remained below 4.767% and 6.113%, respectively.
Asymmetric hysteresis loops vary continuously with the duty cycle, creating numerous combinations of operating conditions that impose stringent requirements on measurement equipment and require long test periods. Such testing therefore cannot readily support rapid iteration. The proposed method requires only standard sinusoidal measurements for parameter identification. It can then predict asymmetric hysteresis loops and losses over a wide duty-cycle range. This prediction is valid as long as the corresponding equivalent frequencies remain within the measurable sinusoidal frequency range. The method is therefore suitable for magnetic performance evaluation of nanocrystalline materials.
Author Contributions
Conceptualization, W.H. and P.T.; methodology, W.H. and C.L.; validation, P.T., C.L., and Y.L.; formal analysis, W.H.; investigation, P.T.; resources, W.H.; data curation, P.T. and Y.T.; writing—original draft preparation, W.H. and S.G.; writing—review and editing, P.T. and S.G.; visualization, C.L.; supervision, Y.L.; project administration, Y.L.; funding acquisition, W.H. All authors have read and agreed to the published version of the manuscript.
Funding
This research was funded by the Science and Technology Project of State Grid Hebei Electric Power Company, grant number kj2025-033.
Data Availability Statement
The datasets from this paper are accessible through the corresponding author upon reasonable request.
Acknowledgments
The authors would like to thank the handling editor and anonymous reviewers for their useful comments and constructive suggestions.
Conflicts of Interest
Authors Wei Huo, Peng Tao, Chong Li, and Yuntong Lyu were employed by the Marketing Service Center of State Grid Hebei Electric Power Co., Ltd. The remaining authors declare that the research was conducted in the absence of any commercial or financial relationships that could be construed as a potential conflict of interest. This study received funding from State Grid Hebei Electric Power Co., Ltd. The funder provided financial and technical support for the research. Authors employed by the funder participated in the research activities and preparation of the manuscript in their capacity as authors. The authors were responsible for the analysis and interpretation of the results and for the conclusions presented in this article.
References
- Wang, W.; Fan, J.; Li, C.; Yu, Y.; Wang, A.; Li, S.; Liu, J. Low-Loss Soft Magnetic Materials and Their Application in Power Conversion: Progress and Perspective. Energies 2025, 18, 482. [Google Scholar] [CrossRef] [Scilit]
- Ruiz-Robles, D.; Venegas-Rebollar, V.; Anaya-Ruiz, A.; Moreno-Goytia, E.L.; Rodríguez-Rodríguez, J.R. Design and Prototyping Medium-Frequency Transformers Featuring a Nanocrystalline Core for DC–DC Converters. Energies 2018, 11, 2081. [Google Scholar] [CrossRef] [Scilit]
- Ruiz-Robles, D.; Ortíz-Marín, J.; Venegas-Rebollar, V.; Moreno-Goytia, E.L.; Granados-Lieberman, D.; Rodríguez-Rodríguez, J.R. Nanocrystalline and Silicon Steel Medium-Frequency Transformers Applied to DC–DC Converters: Analysis and Experimental Comparison. Energies 2019, 12, 2062. [Google Scholar] [CrossRef] [Scilit]
- Amoiralis, E.I.; Tsili, M.A.; Kladas, A.G. Transformer Design and Optimization: A Literature Survey. IEEE Trans. Power Deliv. 2009, 24, 1999–2024. [Google Scholar] [CrossRef] [Scilit]
- Steinmetz, C.P. On the law of hysteresis. Proc. IEEE 1984, 72, 197–221. [Google Scholar] [CrossRef] [Scilit]
- Reinert, J.; Brockmeyer, A.; De Doncker, R.W.A.A. Calculation of losses in ferro- and ferrimagnetic materials based on the modified Steinmetz equation. IEEE Trans. Ind. Appl. 2001, 37, 1055–1061. [Google Scholar] [CrossRef] [Scilit]
- Muhlethaler, J.; Biela, J.; Kolar, J.W.; Ecklebe, A. Improved Core-Loss Calculation for Magnetic Components Employed in Power Electronic Systems. IEEE Trans. Power Electron. 2012, 27, 964–973. [Google Scholar] [CrossRef] [Scilit]
- Shen, W.; Wang, F.; Boroyevich, D.; Tipton, C.W. Loss Characterization and Calculation of Nanocrystalline Cores for High-Frequency Magnetics Applications. IEEE Trans. Power Electron. 2008, 23, 475–484. [Google Scholar] [CrossRef] [Scilit]
- Sullivan, C.R.; Harris, J.H.; Herbert, E. Core loss predictions for general PWM waveforms from a simplified set of measured data. In Proceedings of the 2010 Twenty-Fifth Annual IEEE Applied Power Electronics Conference and Exposition (APEC), Palm Springs, CA, USA, 21–25 February 2010; IEEE: New York, NY, USA, 2010; pp. 1048–1055. [Google Scholar]
- Roberto, S.F.; Sciré, D.; Lullo, G.; Vitale, G. Equivalent Circuit Modelling of Ferrite Inductors Losses. In Proceedings of the 2018 IEEE 4th International Forum on Research and Technology for Society and Industry (RTSI), Palermo, Italy, 10–13 September 2018; IEEE: New York, NY, USA, 2018; pp. 1–4. [Google Scholar]
- Górecki, K.; Detka, K. Selected Problems in Measuring Magnetic Hysteresis Loops and Determining Losses per Unit of Volume for Ferrite and Nanocrystalline Cores. Electronics 2026, 15, 758. [Google Scholar] [CrossRef] [Scilit]
- Cabizza, S.; Spiazzi, G. Accurate Magnetic Core Losses Measurement Under Arbitrary Excitation Waveforms. IEEE Trans. Power Electron. 2025, 40, 34–39. [Google Scholar] [CrossRef] [Scilit]
- Colombo, L.; Stahre, P.; Reinap, A.; Fyhr, P.; Alaküla, M. Multi-Level PWM core loss tester employing switch-mode power amplifiers. J. Magn. Magn. Mater. 2026, 647, 174020. [Google Scholar] [CrossRef] [Scilit]
- Preisach, F. Über die magnetische Nachwirkung. Z. Phys. 1935, 94, 277–302. [Google Scholar] [CrossRef] [Scilit]
- Hauser, H. Energetic model of ferromagnetic hysteresis. J. Appl. Phys. 1994, 75, 2584. [Google Scholar] [CrossRef] [Scilit]
- Jiles, D.C.; Atherton, D.L. Theory of ferromagnetic hysteresis. J. Appl. Phys. 1984, 55, 2115–2120. [Google Scholar] [CrossRef] [Scilit]
- Wang, T.; Yuan, J. Improvement on loss separation method for core loss calculation under high-frequency sinusoidal and nonsinusoidal excitation. IEEE Trans. Magn. 2022, 58, 6301109. [Google Scholar] [CrossRef] [Scilit]
- De la Barrière, O.; Ferrara, E.; Magni, A.; Sola, A.; Ragusa, C.; Appino, C.; Fiorillo, F. Skin effect and losses in soft magnetic sheets: From low inductions to magnetic saturation. IEEE Trans. Magn. 2023, 59, 6301211. [Google Scholar] [CrossRef] [Scilit]
- Ji, J.; Zhao, Z. Hysteresis Characteristics Prediction Method of Nanocrystalline and Amorphous Strips Considering Skin Effect and Nonsinusoidal Excitation. IEEE Trans. Power Electron. 2024, 39, 3891–3905. [Google Scholar] [CrossRef] [Scilit]
- Hane, Y.; Nakamura, K. Dynamic Hysteresis Modeling Taking Skin Effect Into Account for Magnetic Circuit Analysis and Validation for Various Core Materials. IEEE Trans. Magn. 2022, 58, 1–12. [Google Scholar] [CrossRef] [Scilit]
- Gzieł, D.; Najgebauer, M.; Mierczak, Ł. Experimental verification of the method for calculating losses in DC/DC converter cores based on sinusoidal excitations. Acta Phys. Pol. A 2024, 146, 59–63. [Google Scholar] [CrossRef] [Scilit]
- Najgebauer, M.; Gzieł, D.; Kalinowski, J.; Koprivica, B. The Estimation of Power Losses in Composite Cores Excited by Harmonic Flux Density Waveforms. Energies 2024, 17, 5865. [Google Scholar] [CrossRef] [Scilit]
- Murugaiyan, P.; Mitra, A.; Roy, R.K.; Panda, A.K. Nanocrystallization and Core-loss properties of Fe-rich FeSiBPNbCu nanocrystalline alloy. J. Magn. Magn. Mater. 2022, 552, 169228. [Google Scholar] [CrossRef] [Scilit]
- IEC 60404-8-6:2016; Magnetic materials - Part 8-6: Specifications for individual materials - Soft magnetic metallic materials. International Electrotechnical Commission (IEC): Geneva, Switzerland, 2016.
- Bertotti, G. Physical interpretation of eddy current losses in ferromagnetic materials. I. Theoretical considerations. J. Appl. Phys. 1985, 57, 2110–2117. [Google Scholar] [CrossRef] [Scilit]
- Cardelli, E.; Torre, E.D.; Tellini, B. Direct and inverse Preisach modeling of soft materials. IEEE Trans. Magn. 2000, 36, 1267–1271. [Google Scholar] [CrossRef] [Scilit]
- Sergeant, P.; Dupre, L. Modeling the Electromagnetic Behavior of Nanocrystalline Soft Materials. IEEE Trans. Magn. 2009, 45, 678–686. [Google Scholar] [CrossRef] [Scilit]
- Messal, O.; Vo, A.-T.; Fassenet, M.; Mas, P.; Buffat, S.; Kedous-Lebouc, A. Advanced approach for static part of loss-surface iron loss model. J. Magn. Magn. Mater. 2020, 502, 166401. [Google Scholar] [CrossRef] [Scilit]
- Gao, S.; Zhao, X.; Zhang, X.; Zhu, W.; Gao, Y.; Muramatsu, K.; Fujiwara, K. Dynamic hysteresis model for predicting hysteresis property and iron loss for various soft magnetic materials under non-sinusoidal excitation. Phys. B Condens. Matter 2025, 699, 416875. [Google Scholar] [CrossRef] [Scilit]
- Yu, Z.; Wang, Z.; Yuan, J.; Pei, H.; Fan, Y.; Li, S. DTW former: A DTW-based transformer for multivariate time series forecasting. IEEE Trans. Big Data 2025, 11, 3158–3169. [Google Scholar] [CrossRef] [Scilit]

Disclaimer/Publisher’s Note: The statements, opinions and data contained in all publications are solely those of the individual author(s) and contributor(s) and not of MDPI and/or the editor(s). MDPI and/or the editor(s) disclaim responsibility for any injury to people or property resulting from any ideas, methods, instructions or products referred to in the content. |
© 2026 by the authors. Licensee MDPI, Basel, Switzerland. This article is an open access article distributed under the terms and conditions of the Creative Commons Attribution (CC BY) license.