


Abstract
Selecting favorable post-mining goaf blocks is an important step in planning surface gas drainage. In this study, a productivity-based relative optimization index was constructed for block-scale screening. The conventional CBM–well productivity relationship was used only as a conceptual reference for organizing the selected evaluation factors. Gas abundance, goaf permeability, and gas pressure were used as the principal screening variables, while water accumulation and seam dip were incorporated as goaf-specific correction factors. Methods for determining the evaluation parameters were established based on mining-induced strata movement, the O-ring theory, gas migration characteristics, and field hydrogeological data. The method was applied to 23 goaf blocks in the No. 10, No. 12, and No. 8 Mines in the eastern Pingdingshan mining area. Sensitivity analysis showed that the elasticities of the optimization index with respect to gas abundance, permeability, and gas pressure were all equal to 1, whereas the effects of water accumulation and seam dip depended on their block-specific values. When the two correction factors were removed, the recalculated and original indices remained strongly correlated (Spearman’s ρ = 0.989, p < 0.001, n = 23), indicating that the correction factors modified the index values and the relative positions of some blocks but did not substantially alter the overall ranking for the present dataset. Using the adopted natural break classification, the 23 blocks were divided into seven Class I favorable blocks, seven Class II potential blocks, and nine Class III relatively unfavorable blocks. Several Class I blocks were located in the central–northern part of the No. 10 Mine. The SKCK-02 surface gas drainage well, located in a Class I block of the No. 10 Mine, is presented as an illustrative field application. It produced 2.40 × 10⁶ m3 of cumulative pure gas over 945 days. Its production record is consistent with the screening result for this block but does not validate the three-class classification. The proposed method provides a relative screening basis for prioritizing candidate blocks before surface-well deployment.
1. Introduction
With the continuous development of coal resources and the strategic adjustment of the energy industrial structure in China, many coal mines have been closed due to resource depletion or as a matter of policy, forming widely distributed, extremely large goafs in these coal mines [1,2]. It is estimated that by 2030, there will be 15,000 abandoned coal mines across the nation [3,4]. These abandoned coal mine goafs and associated fractured zones harbor substantial gas (coalbed methane) resources [5]. The drainage and utilization of this resource have multiple interacting benefits with regard to emission reduction, safety, and environmental protection.
Globally, the extraction of abandoned mine methane has been recognized as a highly valuable practice for energy recovery and greenhouse gas mitigation. Extensive field explorations and theoretical evaluations have been successfully conducted in major coal-producing countries, such as Germany, Romania, France, Australia and the United States [6,7,8,9,10].
Identifying the source and volume of gas in goafs and fractured zones underpins the calculation of resource volume, for which researchers have conducted years of exploration and research [11,12,13,14,15,16]. Mining-induced fractures form the basis for gas occurrence while simultaneously controlling the flow of gas [17]. Researchers from China and abroad have conducted numerous field measurements and theoretical studies regarding the mining-induced strata deformation, movement, and damage [18,19,20,21,22]. They have thus reached a general understanding of the three horizontal zones (natural accumulation area, load-affected zone, and compacted stable zone) and three vertical zones (caving zone, fractured zone, and bending zone) regarding the strata movement and fracture and the distribution of mining-induced fractures in the stope. This provides a theoretical basis for calculation of the gas volume in goafs of abandoned coal mines.
To calculate the gas volume in goafs, researchers have proposed multiple methods of calculation and evaluation: some proposed calculation methods for the gas volume in goafs and gas reserves in closed goafs based on the theory of residual gas pressure therein and the drop-down curves [23,24]. The basic calculation framework for the gas volume in goafs was constructed from the perspectives of the material balance principle and the composition of gas volume [25]. On this basis, theories based upon hydromechanics and geomechanics were introduced to explore the gas migration and distribution behavior and mechanisms for their control [26,27,28]. By being combined with the mining-induced deformation and failure behavior of the overlying strata [29,30], the evolution model and method of calculation for the gas volume in abandoned coal mines were optimized and enriched. Some proposed the method of superposition of gas from different sources for the gas (CBM) volume in a stable mining area and the method of evaluation based on indirect subtraction [13].
Existing favorable block evaluation methods provide useful tools for integrating geological, resource, and engineering information [31,32,33]. Most of these approaches are based on multi-parameter scoring, weighting, or classification [34,35,36,37,38], whereas the evaluation parameters are not necessarily organized around a productivity-related response. For goaf gas extraction, post-mining permeability, gas pressure, water accumulation, and geometric conditions may influence gas migration and drainage. Therefore, organizing these parameters within a productivity-related framework may provide an additional basis for relative favorable block screening.
In this study, a productivity-based relative optimization index is constructed for surface gas drainage from coal mine goafs. Gas abundance, goaf permeability, and gas pressure are used as the principal screening variables, while water accumulation and seam dip are incorporated as goaf-specific correction factors. The method is applied to goafs in three mines in the eastern Pingdingshan mining area to identify relatively favorable blocks for subsequent surface gas drainage.
2. Optimization of Favorable Blocks for Gas Drainage from Goafs
2.1. Evaluation Method of Favorable Blocks for Gas Drainage from Goafs
A conventional productivity relationship for CBM wells is introduced here as a conceptual reference [39,40,41,42]:
where Q is the productivity of CBM wells (m3/d); B denotes the comprehensive engineering coefficient, which takes a value of 1012 t/(d·m3·MPa2) under the adopted unit convention; H represents the effective seam thickness (m); V is the CBM gas content (m3/t); K is the permeability (μm2); p refers to the reservoir pressure (MPa); and p0 is the flowing bottomhole pressure (MPa).
Equation (1) is used here only as a conceptual reference for identifying the principal factors associated with gas deliverability, rather than as a productivity equation that can be directly transferred to a goaf. The general conceptual relationship that drainage potential is associated with gas resource availability, migration capacity, and pressure conditions is retained. In contrast, several assumptions implicit in a conventional CBM productivity formulation are no longer applicable after mining, including an intact coal seam, a relatively continuous reservoir medium, a seam-dominated gas source, and conventional well-flow boundary conditions.
A post-mining goaf differs substantially from an intact coal reservoir in reservoir structure, gas occurrence, and flow conditions. The original coal seam is transformed into a fractured and partially compacted mined-out space, and gas may be supplied by residual coal, coal pillars, surrounding strata, and adjacent seams. Therefore, the original terms in Equation (1) cannot be directly retained in the goaf screening index.
For surface gas drainage from goafs, the relative drainage potential is considered in terms of gas resource conditions, gas migration conditions, and drainage-related geological constraints. Gas resource conditions are represented by gas abundance, which is determined from the estimated gas volume and block area. Gas migration conditions are represented by goaf permeability and gas pressure, whereas water accumulation and seam dip are considered as additional geological constraints on drainage.
Accordingly, gas abundance (Rc) is adopted to characterize the available gas resource at the block scale instead of directly retaining the effective seam thickness (H) and gas content (V). The permeability term (K) is represented by the estimated goaf permeability (Kc) to characterize the gas migration capacity. Gas pressure (pg) is used as a block-scale indicator of the pressure condition, while the water accumulation index (ka) and inclination index (ki) are introduced to account for drainage-related geological constraints.
Importantly, the pressure term in the following index should not be interpreted as an algebraic linearization of the pressure-squared drawdown term () in Equation (1). Consistent flowing-bottomhole-pressure data are unavailable for all investigated goaf blocks; therefore, the complete pressure-squared drawdown term cannot be applied consistently at the block scale. The gas pressure term (pg) does not mathematically replace or approximate (); rather, it is used only to represent relative differences in pressure conditions among the investigated blocks. Consequently, the proposed index does not explicitly describe well-specific pressure drawdown or transient inflow behavior and should not be interpreted as an absolute well-productivity equation.
On this basis, and using the principal factor relationships represented in Equation (1) only as a conceptual reference, a relative productivity-based optimization index for screening favorable blocks for surface gas drainage from goafs is constructed as follows:
where δ is the productivity-based optimization index (dimensionless); Bc is the unit-scaling coefficient for goaf gas drainage (1010/(m3·MPa)); Rc is the gas abundance (108 m3/km2); Kc is the permeability of goafs (μm2); pg represents the gas pressure (MPa); ka is the index of water accumulation in goafs; and ki is the inclination index of goafs. In Equation (2), Rc is entered in units of 108 m3/km2, Kc in μm2, and pg in MPa. Because 108 m3/km2 = 102 m and 1 μm2 = 10−12 m2, the product RcKcpg under the adopted units contains a scale factor of 10−10 m3·MPa. Accordingly, Bc =1010(m3 MPa)−1 is introduced as a unit-scaling coefficient. Both ka and ki are dimensionless; therefore, the resulting δ is dimensionless. The coefficient is kept constant for all blocks and does not affect their relative ranking.
The terms (1 − ka) and (1 − ki) are introduced as first-order correction factors for relative block screening. They should not be interpreted as experimentally calibrated linear relationships between water accumulation or seam dip and absolute gas production. For the water accumulation term, (1 − ka) can be interpreted approximately as the proportion of the goaf volume not occupied by accumulated water. The inclination term is used as a simplified geometric correction within the present screening framework. Further calibration of nonlinear responses would require additional production data from blocks covering a wider range of hydrogeological and structural conditions.
The local sensitivity of the optimization index to each variable input was evaluated using the elasticity Ex = (∂δ/∂x)(x/δ). According to Equation (2), ERc = EKc = Epg = 1, whereas Eka = −ka/(1 − ka) and Eki = −ki/(1 − ki). Therefore, the sensitivities associated with water accumulation and seam dip depend on their actual values in each block.
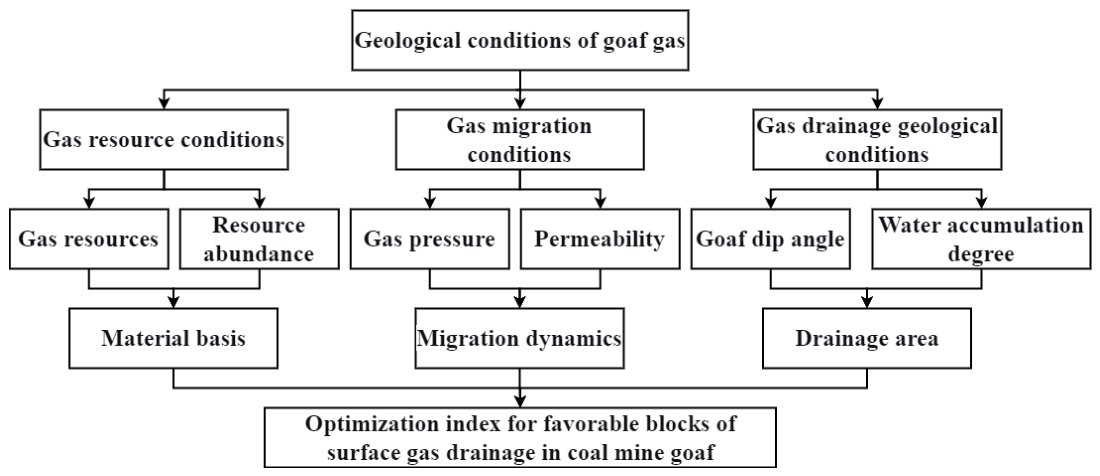
After acquiring the relevant evaluation parameters, Equation (2) is used to calculate the productivity-based optimization index and thereby to distinguish blocks with different levels of relative favorability. The optimization procedure is shown in Figure 1.
Figure 1.
Workflow for selecting favorable blocks for surface gas extraction from coal mine goafs.
The variables in Equation (2) should therefore be interpreted as representative block-scale conditions used for comparative screening. The present formulation does not resolve the transient evolution of gas pressure, permeability, fracture connectivity, or flow during active longwall advance. Its intended use is the relative evaluation of post-mining goaf blocks for which block-scale geological and gas conditions can be reasonably characterized.
2.2. Acquisition of Evaluation Parameters
2.2.1. Gas Resource Conditions
(1) Gas volume
The gas volume in goafs is equal to the sum of the volumes of free gas in the goafs, caving zone, and fractured zone [43], that is,
where Qy is the gas volume in goafs (m3); Qc represents the volume of free gas in goafs (m3); Qm is the volume of free gas in the caving zone (m3); and Ql denotes the volume of free gas in the fractured zone (m3).
Therein, the volume of free gas in goafs is [44]:
where ng is the volume fraction of gas (%); Vg is the volume of goafs (m3); and Ks is the rock bulking coefficient, which is generally between 1.25 and 1.50.
The volume of goafs Vg consists of the volume of the caving zone Vm and that of the fractured zone Vl. Vm and Vl can be approximated as trapezoids. They can be simplified to a rectangle, with the median surface in the vertical direction of the trapezoids as the area of the plane of the caving zone and the heights of the caving and fractured zones as the height.
where Hm is the height of the caving zone (m); Hl represents the height of the fractured zone (m); L and W are respectively the strike and dip lengths of a working face (m); and α and β denote the pressure-relief angles along the strike and dip directions (°), respectively. The heights of the caving and fractured zones can be calculated using formulas specified in Regulations for setting of coal pillars and coal mining below buildings, water bodies, railways and near main roadways.
The volume of free gas in the caving zone is:
where Vmk is the pore volume in the caving zone (m3) and ηm is the volume fraction of gas therein (%).
The pore volume in the caving zone is expressed as:
where Vm is the volume of the caving zone (m3) and φm denotes the porosity of caved bulk rocks therein (%).
The volume of free gas in the fractured zone is:
where Vlk is the pore volume in the fractured zone (m3) and ηl is the volume fraction of gas therein (%).
where Vl is the volume of the fractured zone (m3) and φl is the porosity therein (%).
(2) Gas abundance
The gas abundance represents the gas volume per unit area.
The gas abundance in goafs is written as:
where S is the area of the gas accumulation zones in goafs (m2).
Based on the O-ring theory [45], the length of the working faces and the average width of the O-ring have the following relationship:
where b is the average width of the O-ring (m).
In the present study, Equation (13) is applied as a common first-order engineering approximation for estimating the O-ring width and gas accumulation area of the investigated goafs. The three mines are located within the eastern Pingdingshan mining area and exploit the same II1 coal seam, but complete and consistently documented mine-by-mine data on the working-face geometry and overburden properties are not available for all three mines. Therefore, their local geometric and lithological conditions cannot be assumed to be identical, and Equation (13) is not regarded as a mine-specific calibration of the O-ring geometry.
This simplification introduces uncertainty into the calculated gas accumulation area S. Because the gas abundance is calculated from the gas volume per unit accumulation area, an overestimation of S would lead to an underestimation of Rc, whereas an underestimation of S would increase the calculated Rc. Since Rc enters the optimization index directly, this uncertainty may propagate into the calculated δ values and may affect the relative ranking of some blocks. Accordingly, the O-ring-based area and the resulting Rc are used here only as engineering-scale estimates for relative block screening.
In addition, the O-ring concept represents an idealized mining-induced fracture pattern. Major faults and associated damage zones may distort the geometry and spatial continuity of the high-permeability region. Fault displacement and fault-controlled fracture connectivity are not explicitly represented in Equation (13). Therefore, the calculated O-ring area is used only as an average engineering estimate for block-scale gas abundance calculation and not as a prediction of the exact location of local high-permeability pathways. For candidate well sites close to major faults, additional structural analysis should therefore be considered before final deployment.
2.2.2. Gas Migration Conditions
Gas migration conditions refer to the resistance and driving force for gas migration in coal mine goafs, and they can be represented by the permeability and gas pressure of goafs.
(1) Permeability of goafs
The permeability of goafs mainly means the permeability of two zones (the caving and fractured zones). According to the Kozeny–Carman equation, the porosity–permeability relationship, and the relationship between the bulking coefficient and the vertical stress, the permeability of goafs can be calculated as follows:
where d0 is the effective particle diameter (m), which is generally determined through empirical calculation based on the lithology and macroscopic fragmentation characteristics of the caved rock mass in the field; φ is the porosity (%); Ks denotes the rock bulking coefficient; a and b are constants; and pv denotes the vertical stress.
(2) Gas pressure of goafs
The gas in goafs mainly derives from the desorption and migration from residual coal, coal pillars, surrounding rocks, and adjacent coal seams and exists in a free state. Under the long-term closure condition, the gas pressure in goafs is in a quasi-equilibrium state and can be ascertained based on in situ measurements, with the maximum absolute value not exceeding the static water pressure of the overlying water column.
2.2.3. Drainage and Geological Conditions
The gas drainage and geological conditions in goafs refer to the degree of water accumulation and the dip angle of goafs.
(1) The degree of water accumulation in goafs
The complexity of water accumulation in goafs can be reflected by the index of water accumulation in goafs, expressed as follows:
where ka is the index of water accumulation in goafs; Vw represents the volume of water accumulation in goafs (m3); and Vg is the volume of goafs (m3).
The higher the index of water accumulation in goafs, the less favorable it is to gas migration and accumulation in goafs.
The model for the volume of water accumulation in goafs is expressed as follows:
where Vw is the volume of water accumulation in goafs (m3); θ denotes the dip angle of goafs (°); Hs is the water level (m); and S(z) represents the area of water accumulation that varies with the water level (m2). Considering the highly dynamic nature of water recharge in abandoned mines, the water level data for the No. 10, No. 12, and No. 8 Mines were obtained from field hydrogeological monitoring wells and used to determine the water accumulation index.
(2) Dip angle of goafs
The dip angle of goafs is identical to that of the coal seams, and variations in dip may influence the caving characteristics of the overlying strata and gas migration after coal mining.
Because the coal seam dip varies within an individual goaf block, the arithmetic mean of the maximum and minimum dip angles is used here as a representative block-scale inclination. The sine function converts this representative angle into a dimensionless index ranging from 0 to 1 and preserves its monotonic increase with dip:
where ki is the inclination index of goafs and θmax and θmin represent the maximum and minimum dip angles of coal seams (°), respectively.
This simplified index characterizes the magnitude of the seam inclination only. The azimuthal relationship among the seam dip direction, preferential gas migration pathways, and surface-well location is not explicitly included in the present model and represents a limitation of the current block-scale screening method.
2.3. Optimization of Favorable Blocks
The optimization of favorable blocks for surface gas drainage from goafs should take into account the simplicity, practicability, and economical efficiency of the optimization method. Various physical parameters in the model are calculated according to the prevailing conditions across the target area; productivity-based optimization indices of goafs in different blocks are then computed. Based on productivity-based optimization indices, blocks of coal seam goafs are classified into Class I (favorable blocks), Class II (potential blocks), and Class III (unfavorable blocks). Notably, the size, shape, gas resources, degree of water accumulation, and geological conditions of goafs vary regionally; thus, the productivity-based optimization index is only a relative value, and the favorable blocks divided thereby are relative favorable blocks.
3. Application
3.1. Geological Setting and Distribution of the Investigated Goafs
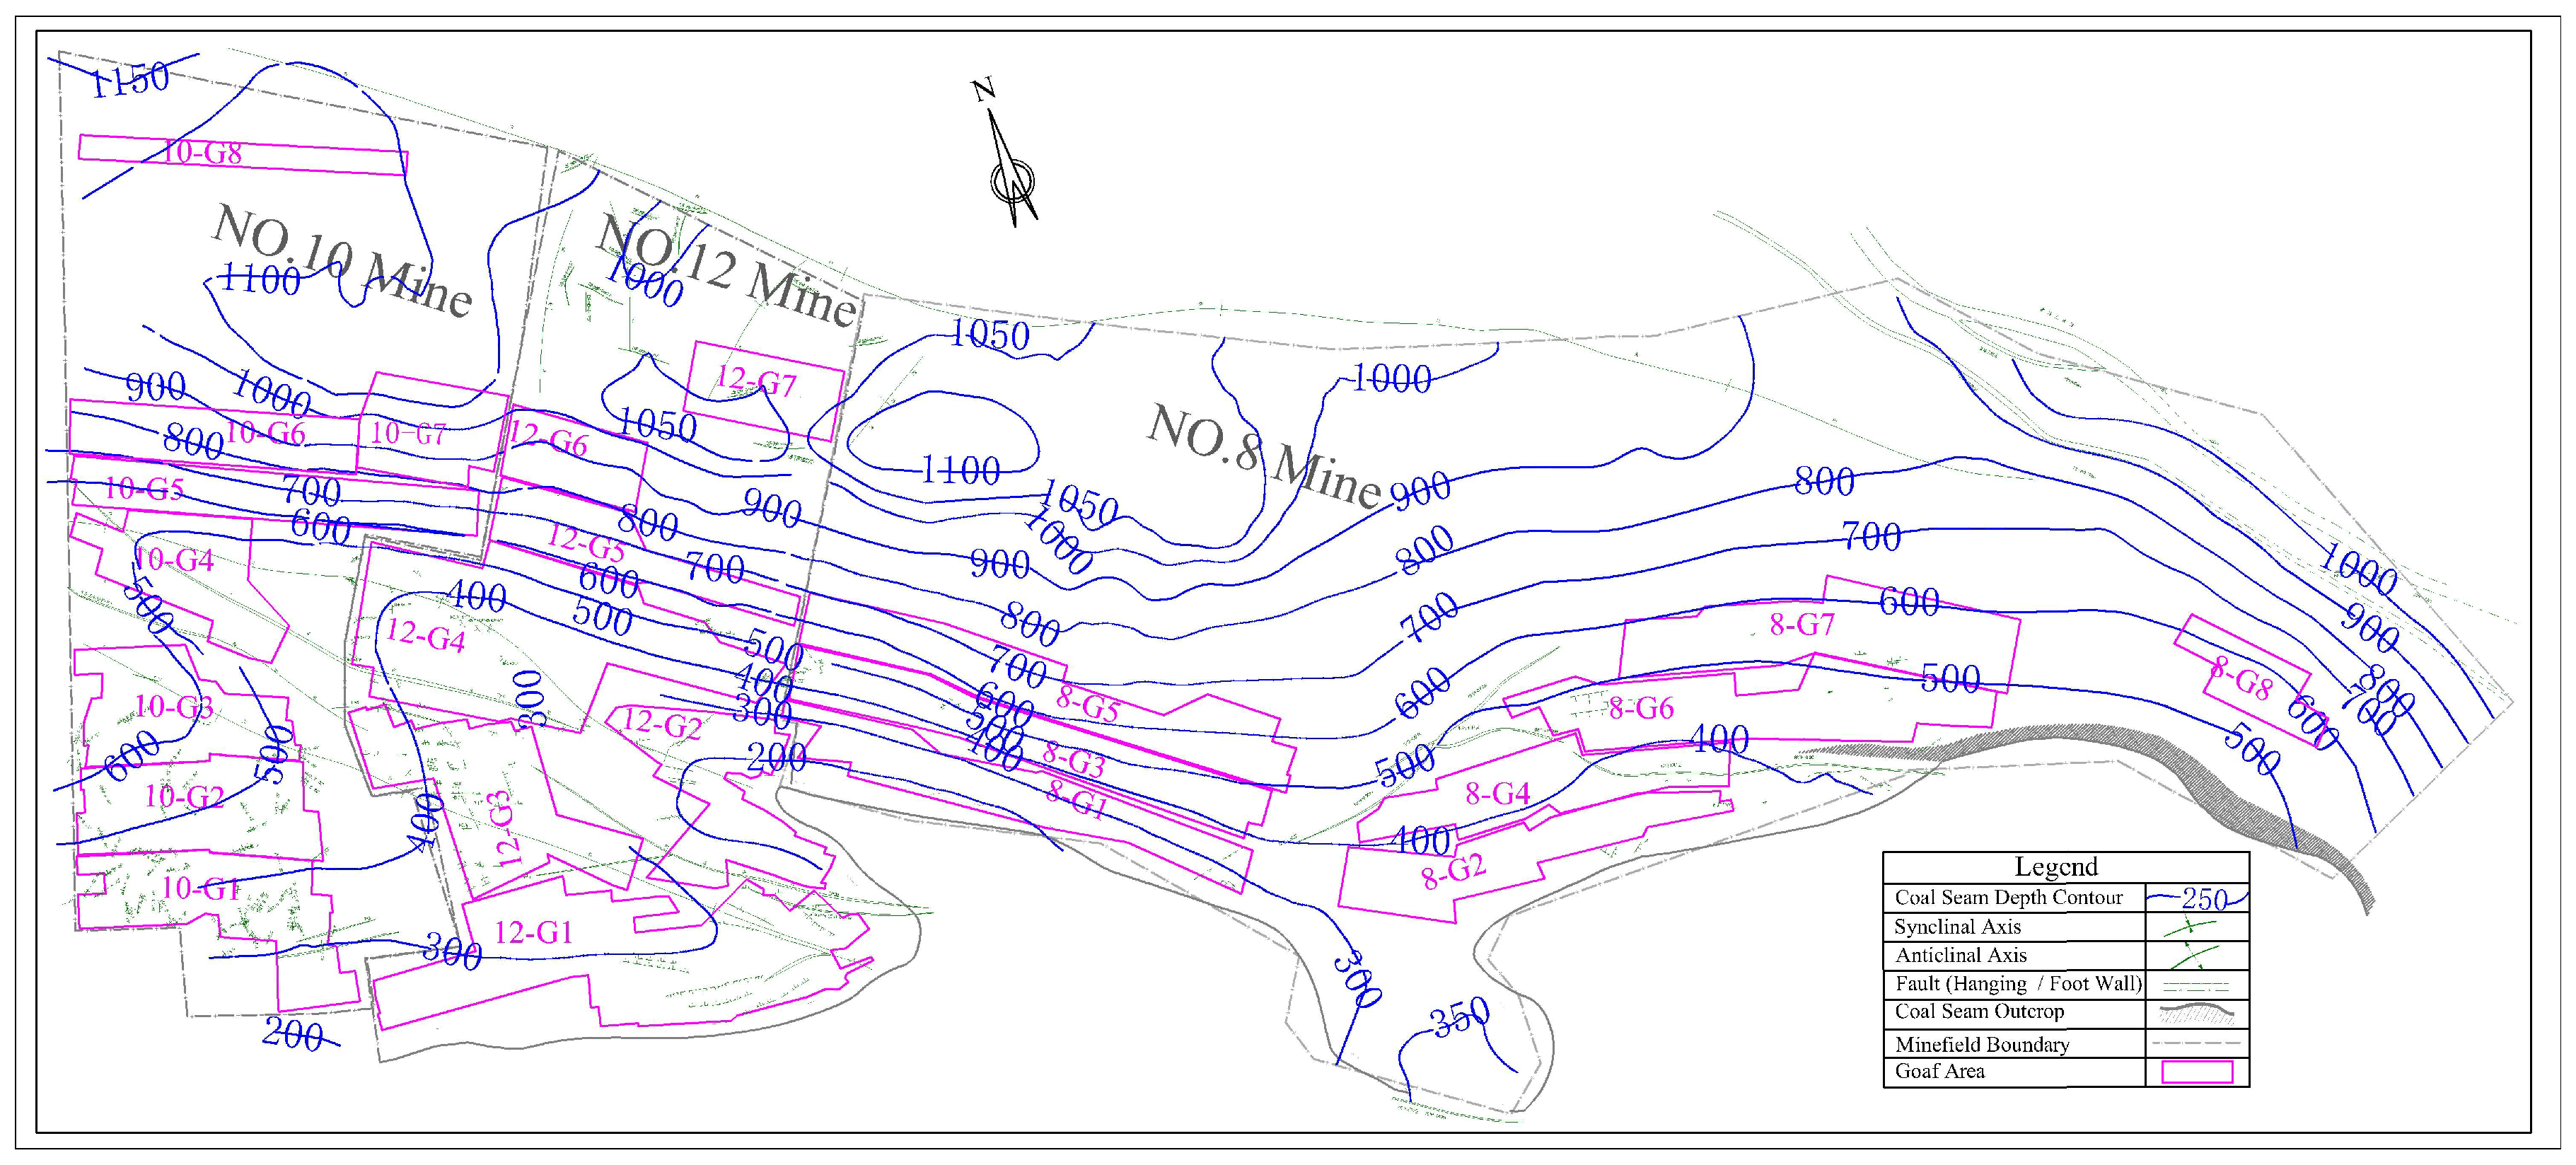
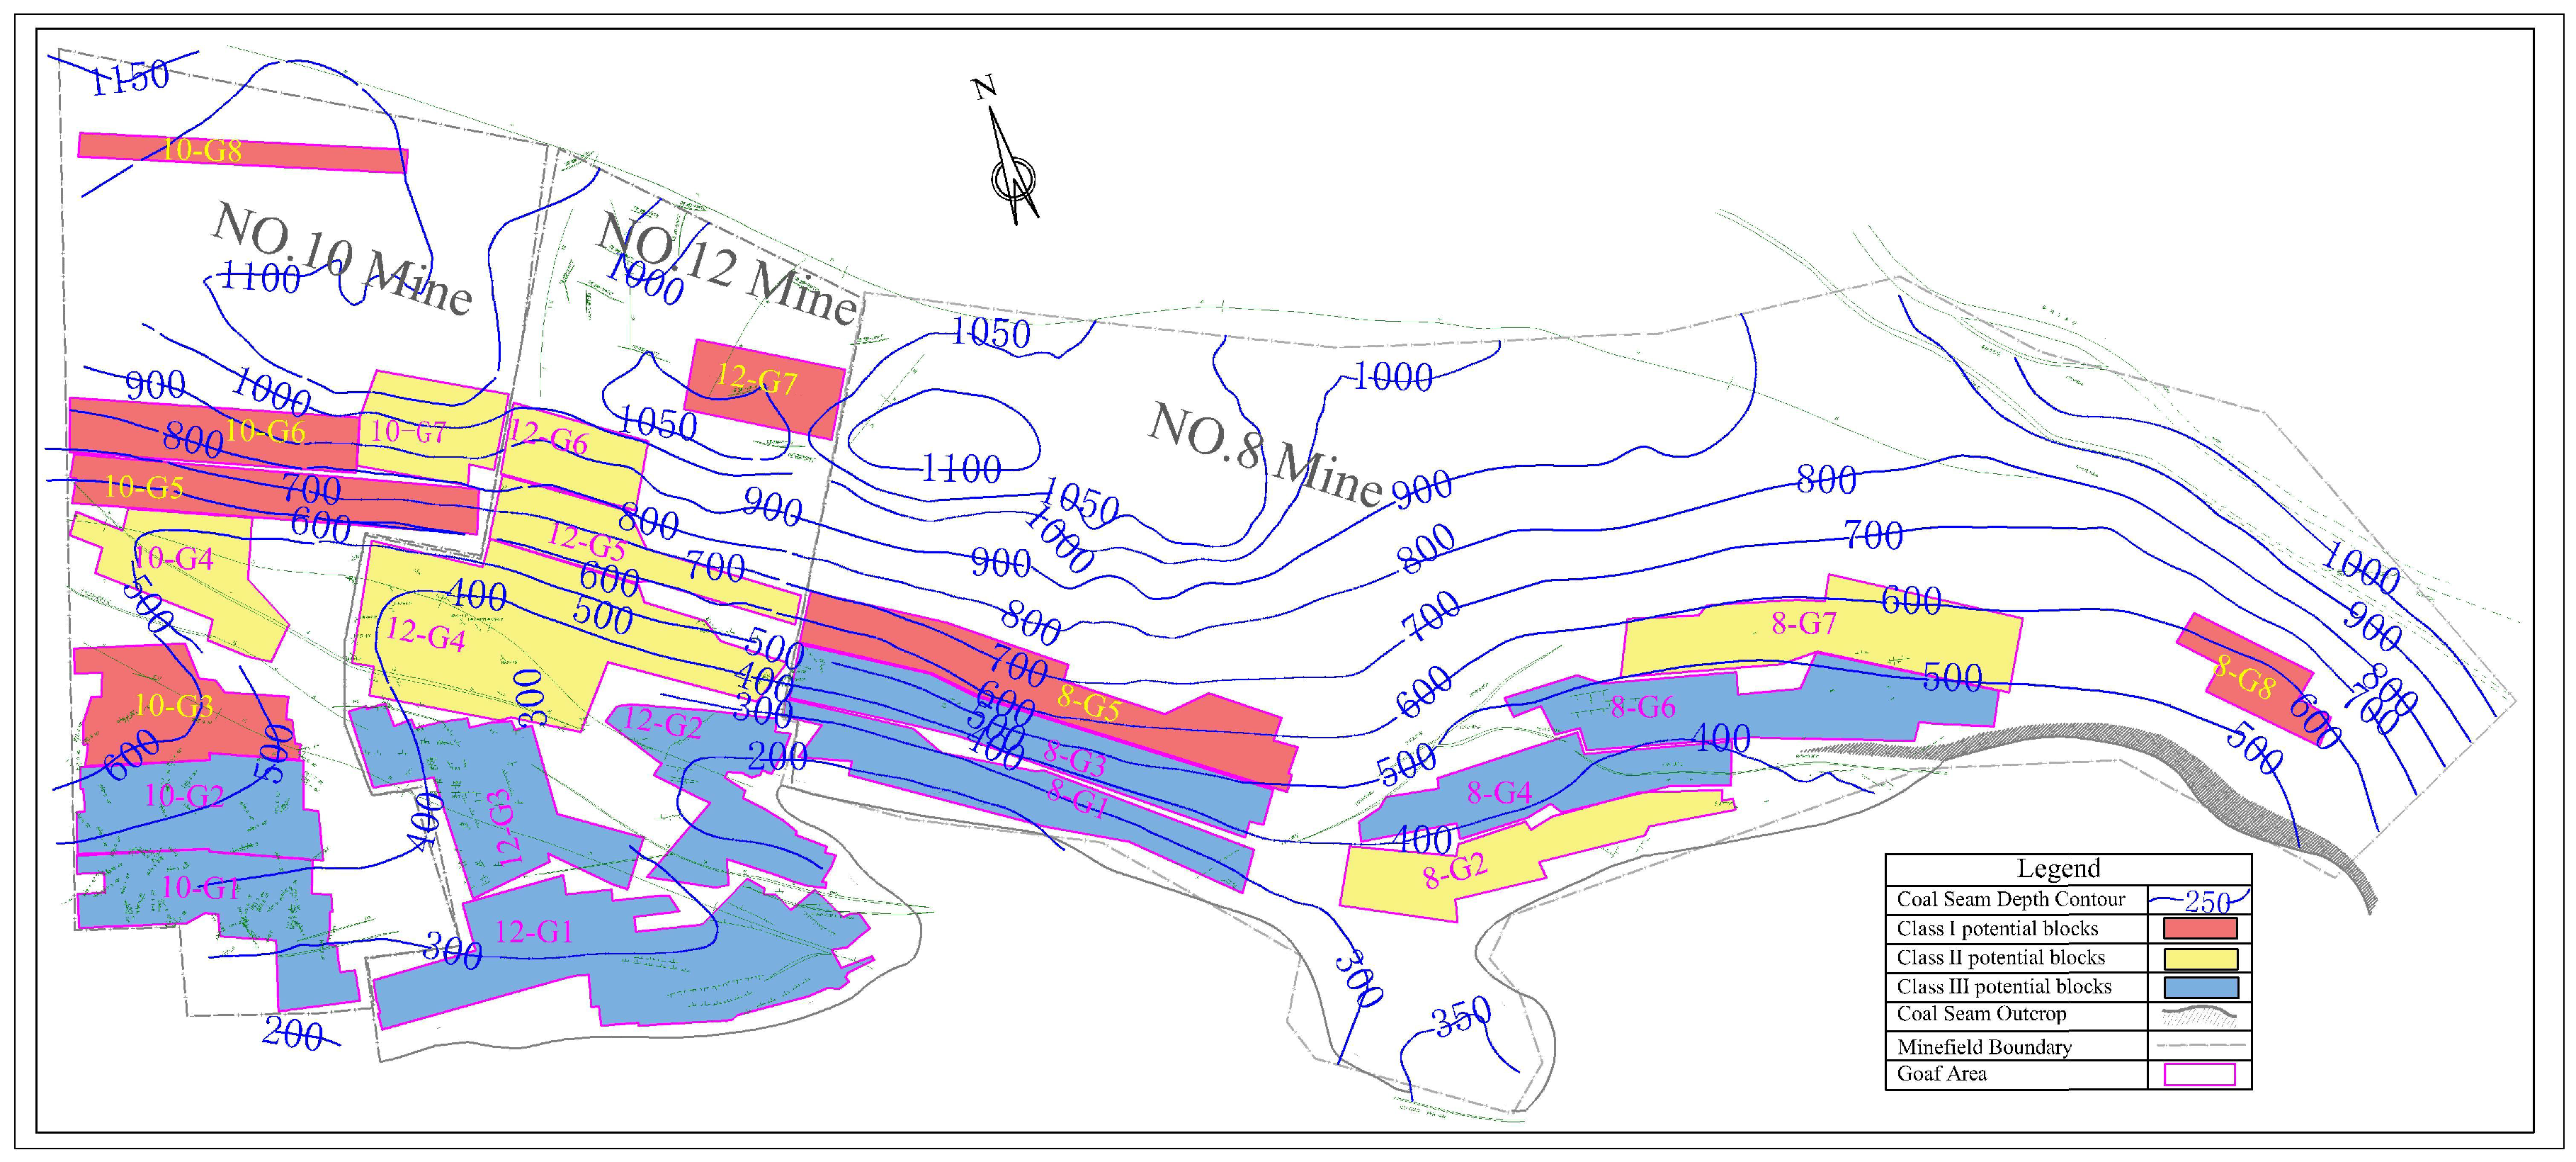
The No. 10, 12 and 8 Mines in the eastern Pingdingshan mining area were taken as research objects and analyzed. The principal structures in the study area are dominated by Likou syncline and NWW-trending anticlines and synclines. The II1 coal seam is the primary mineable seam, with a thickness ranging from 0.83 to 6.7 m and an average thickness of 5.44 m. The burial depth of the coal seam gradually increases from south to north within the range from 290 m to 955 m. The coal seam crops out in the south. Figure 2 depicts the distribution of goafs in the three mines and isolines of the floor of the II1 coal seam. Labels such as 10-G1, 12-G1, and 8-G1 denote individual goaf blocks in No. 10, No. 12, and No. 8 Mines, respectively.
Figure 2.
Distribution map of goafs in three mines in the east of Pingdingshan.
3.2. Characteristics of Evaluation Parameters
3.2.1. Distribution of gas volume and abundance
(1) Gas volume
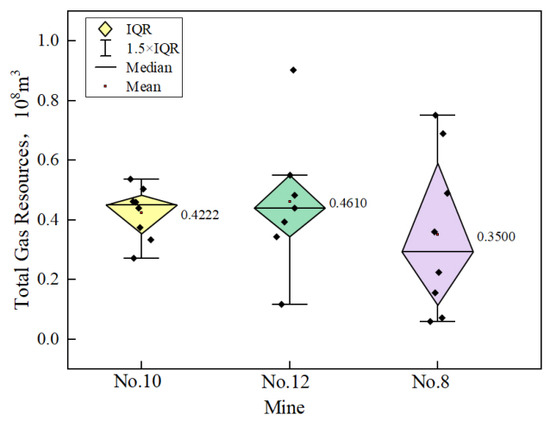
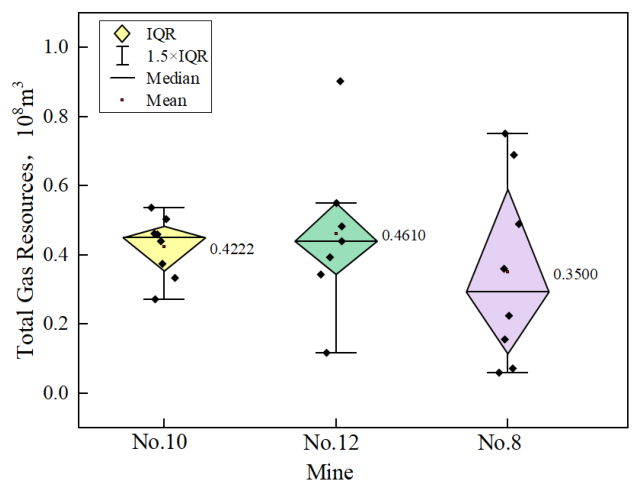
The gas volumes in goafs of the No. 10, No. 12, and No. 8 Mines are calculated using Equations (3)–(7), and results are shown in Figure 3.
Figure 3.
Distribution characteristics of gas resources in goafs of eastern Pingdingshan mining area.
The total gas volumes of the investigated goaf blocks in the No. 10, No. 12, and No. 8 Mines range from 0.2715 to 0.5361 × 10⁸ m3 (0.4222 × 10⁸ m3 on average), 0.1171 to 0.9027 × 10⁸ m3 (0.4610 × 10⁸ m3), and 0.0592 to 0.7509 × 10⁸ m3 (0.3500 × 10⁸ m3), respectively. The No. 12 Mine therefore shows the highest mean gas volume and the largest maximum value but also a relatively wide variation among individual goaf blocks. The No. 10 Mine shows a comparatively narrower range of gas volume among the investigated blocks. Overall, the gas volumes of the investigated goaf blocks in the three mines range from 0.0592 to 0.9027 × 10⁸ m3, with an average volume of 0.4089 × 10⁸ m3.
(2) Gas abundance
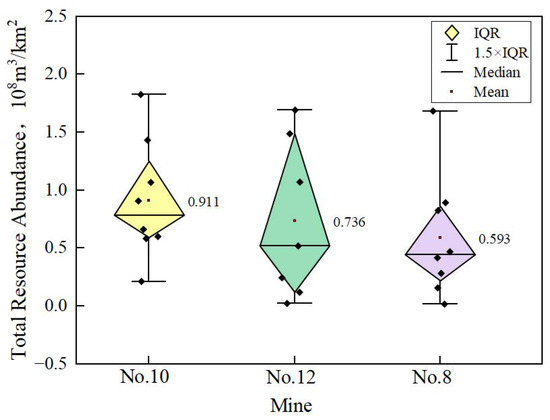
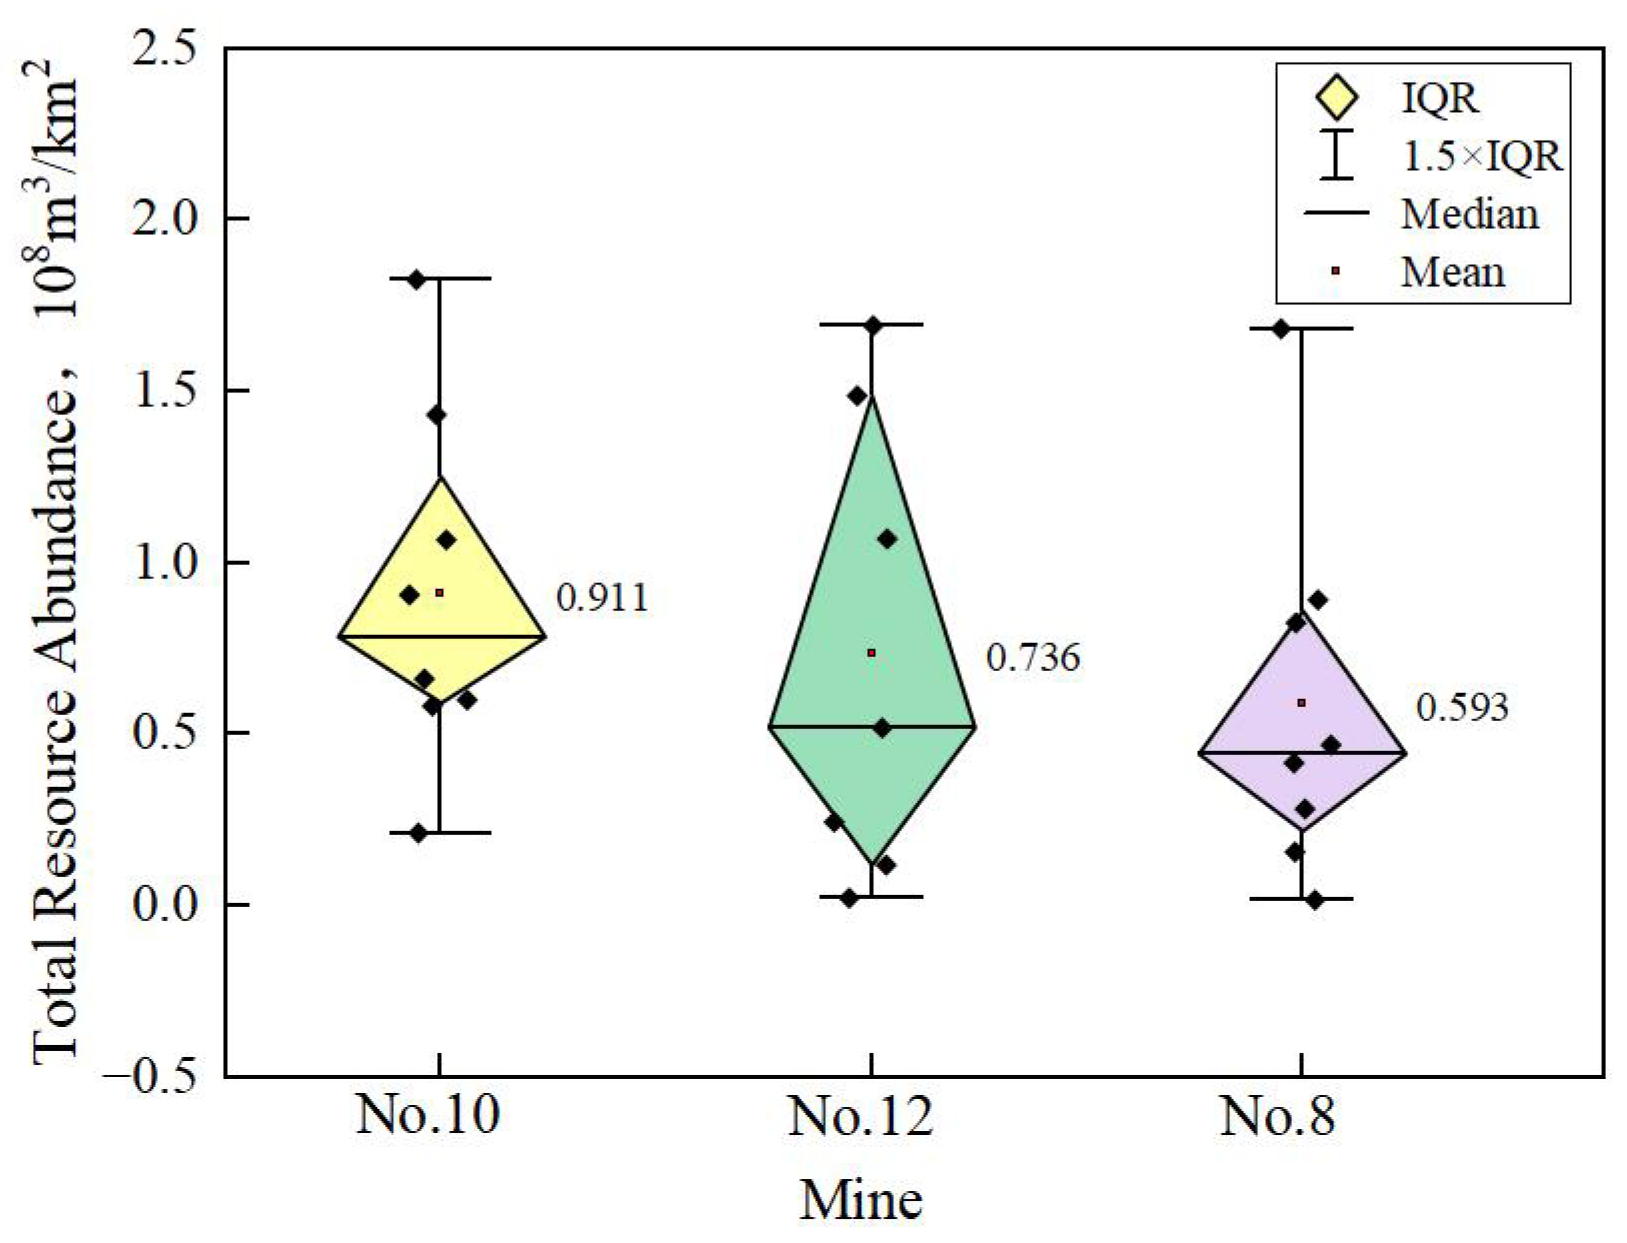
The gas abundance is a key parameter that characterizes the degree of gas accumulation. The No. 10, No. 12, and No. 8 Mines differ greatly in terms of the gas abundance, as shown in Figure 4.
Figure 4.
Distribution characteristics of resource abundance in goafs of eastern Pingdingshan mining area.
The average gas abundances of the No. 10, 12 and 8 Mines are 0.911 × 10⁸ m3/km2, 0.736 × 10⁸ m3/km2, and 0.593 × 10⁸ m3/km2, respectively. Therein, the No. 10 Mine demonstrates the largest gas abundance, with balanced spatial changes; this is followed by the No. 12 Mine, which shows highly heterogeneous abundance; the gas abundance is relatively low in goafs of the No. 8 Mine. Collectively, the gas abundance in goafs of the three mines is 0.017 to 1.826 × 10⁸ m3/km2, with an average value of 0.747 × 10⁸ m3/km2.
Overall, the gas resource analysis provides the material basis for favorable block screening. The total gas volume characterizes the amount of gas potentially available within each goaf, whereas the gas abundance reflects its spatial concentration and is directly incorporated into Equation (2). Therefore, the spatial differences described above are considered together with the gas pressure, permeability, water accumulation, and seam dip in the subsequent block evaluation. Targeted recovery of goaf gas may also contribute to reducing uncontrolled methane release when the recovered gas is effectively utilized; however, the associated emission reduction is not quantitatively evaluated in the present study.
3.2.2. Distribution of gas pressure and permeability
(1) Gas pressure
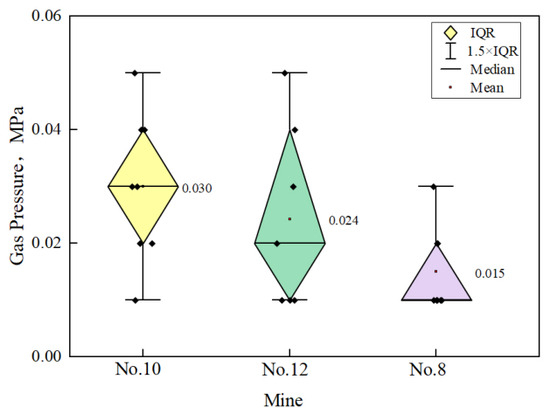
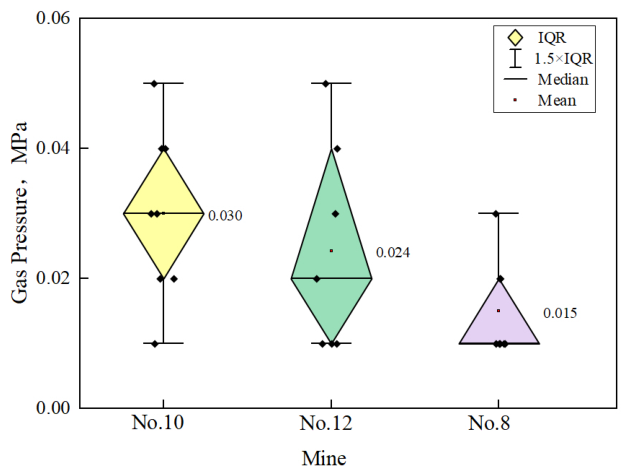
The gas pressure is a key parameter used when characterizing the gas migration capacity in goafs. Differences in gas pressure are observed among the No. 10, No. 12, and No. 8 Mines (Figure 5).
Figure 5.
Characteristics of gas pressure in goafs of eastern Pingdingshan mining area.
The average gas pressures in the No. 10, No. 12, and No. 8 Mines are 0.030 MPa, 0.024 MPa, and 0.015 MPa, respectively. Among the three mines, the No. 10 Mine has the highest average gas pressure, with values ranging from 0.01 to 0.05 MPa. The No. 12 Mine shows a similar pressure range of 0.01–0.05 MPa but a more uneven distribution among the investigated blocks. The No. 8 Mine has the lowest average gas pressure, with values mainly concentrated between 0.01 and 0.03 MPa. Overall, the gas pressures of the 23 investigated goaf blocks range from 0.01 to 0.05 MPa, with an average value of approximately 0.023 MPa.
(2) Permeability distribution
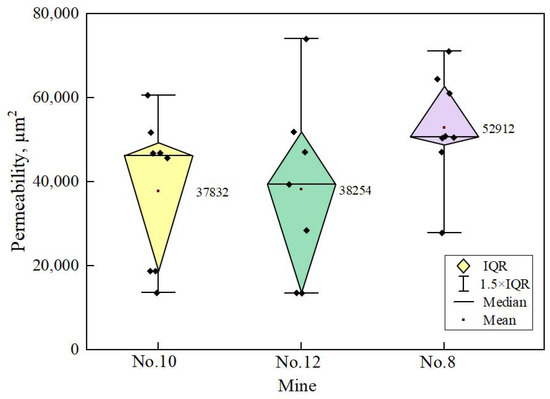
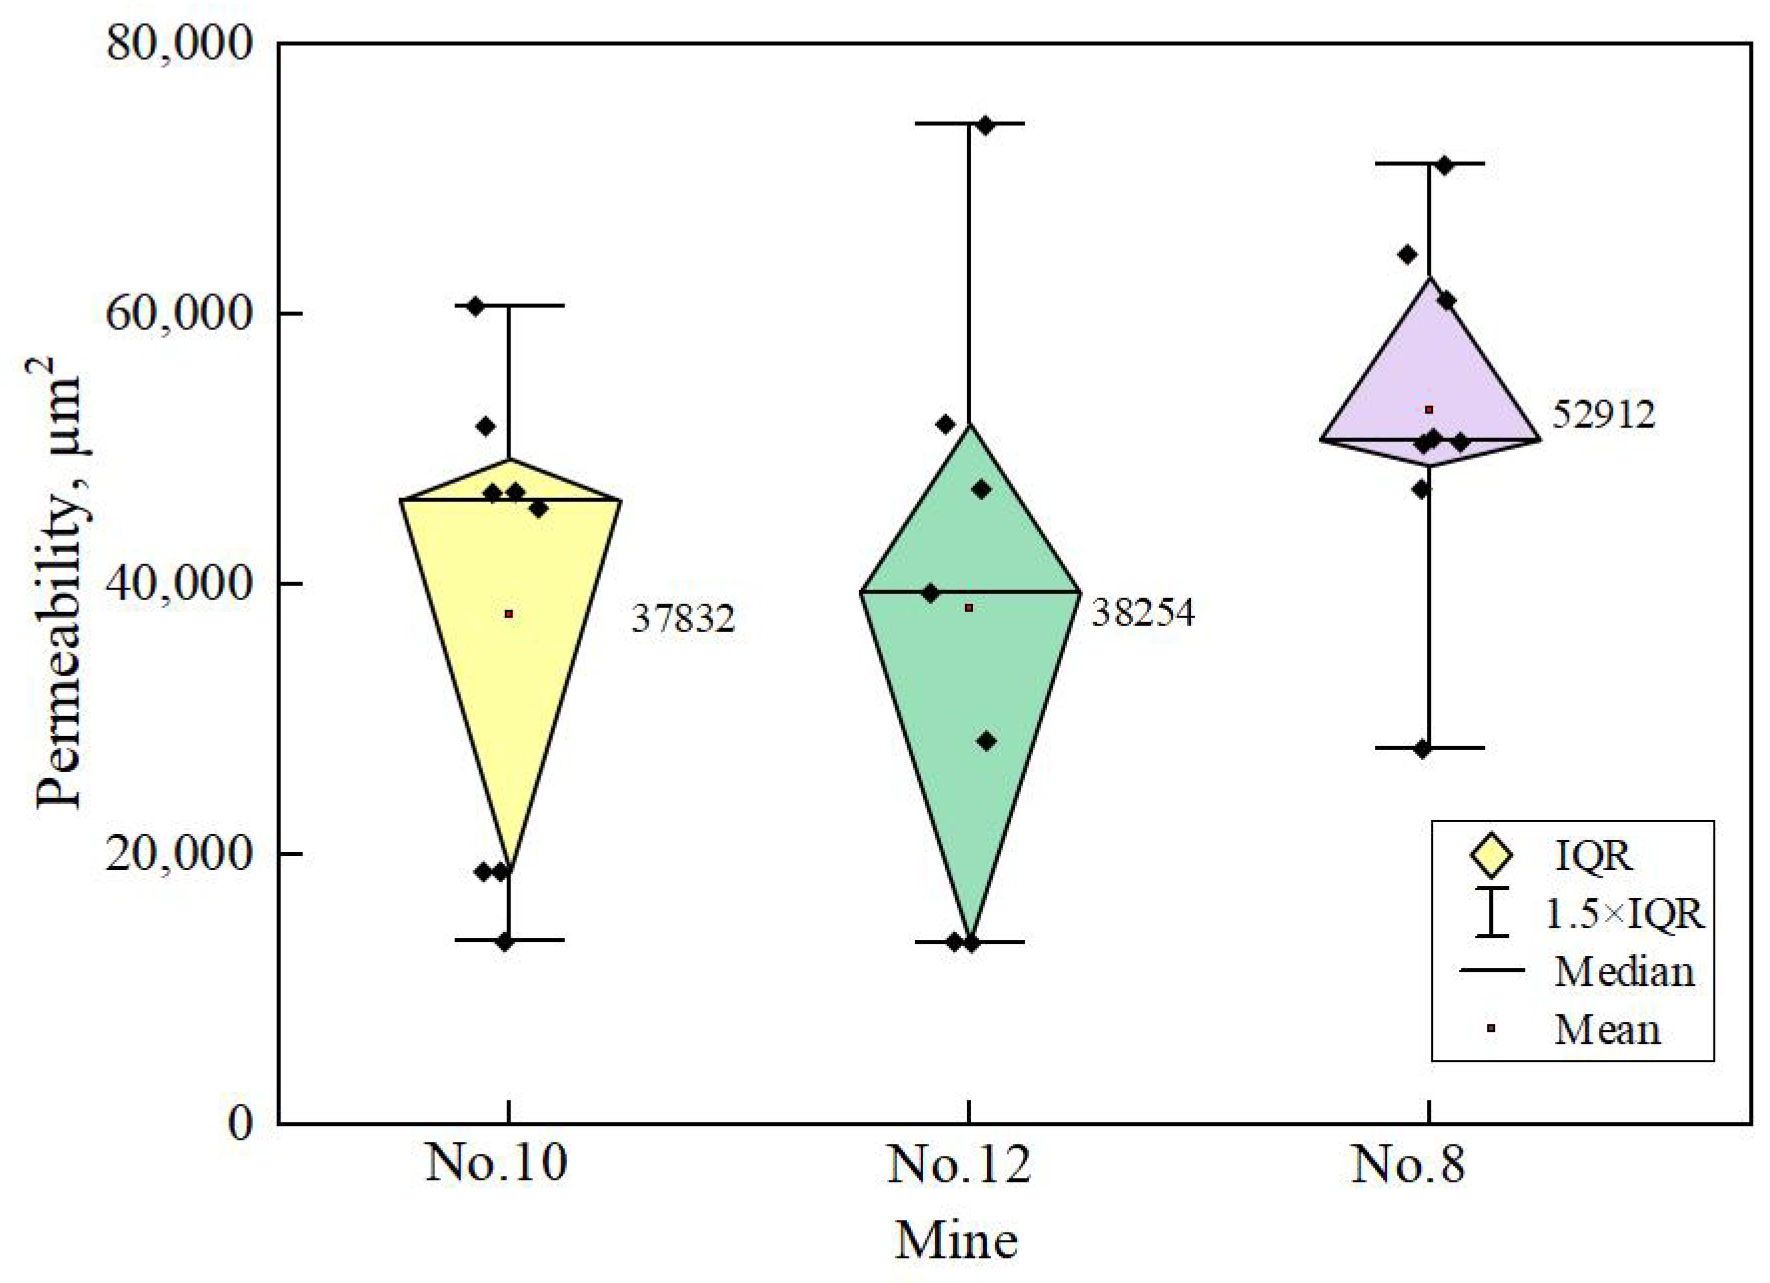
Goaf permeability is an important factor influencing gas migration and surface gas drainage conditions. The three mines show different permeability distributions (Figure 6).
Figure 6.
Permeability distribution characteristics of goafs in Pingdingshan eastern mining area.
The average permeabilities of the No. 10, No. 12, and No. 8 Mines are 37,832 µm2, 38,254 µm2, and 52,911 µm2, respectively. The No. 10 and No. 12 Mines show similar mean permeability values, whereas the No. 8 Mine has a higher mean permeability. Overall, the permeability values of the investigated goaf blocks in the three mines range from 13,568 to 74,011 µm2, with an average value of 43,205 µm2.
3.2.3. Distribution of goaf dip angle and water accumulation index
(1) Dip angle of goafs
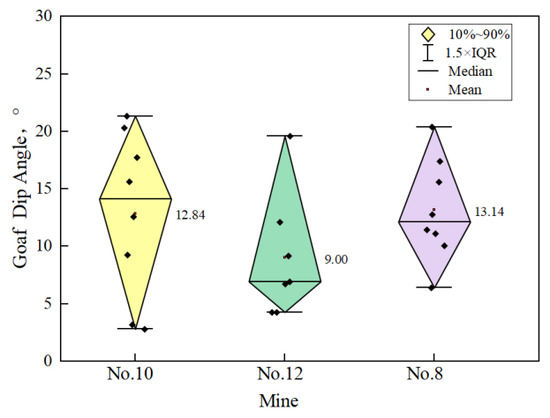
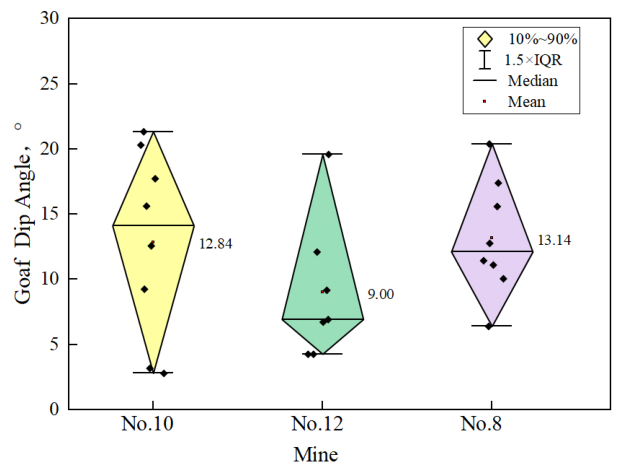
The dip angle of goafs may influence the spatial distribution and volume of water accumulation in goafs. The goaf dip angles vary among the three mines (Figure 7).
Figure 7.
Distribution characteristics of goaf dip angles in Pingdingshan eastern mining area.
The average dip angles of goafs in the No. 10, No. 12, and No. 8 Mines are 12.8°, 9.0°, and 13.1°, respectively. Therein, the dip angle of goafs varies slightly in the No. 8 Mine, it varies over a larger range in the No. 10 Mine, while the dip angle of goafs in the No. 12 Mine covers the largest range and fluctuates greatly on the whole, showing high heterogeneity. In general, the dip angles of goafs in the three mines are within the range from 2.80° to 21.32° (11.78° on average).
(2) Index of water accumulation
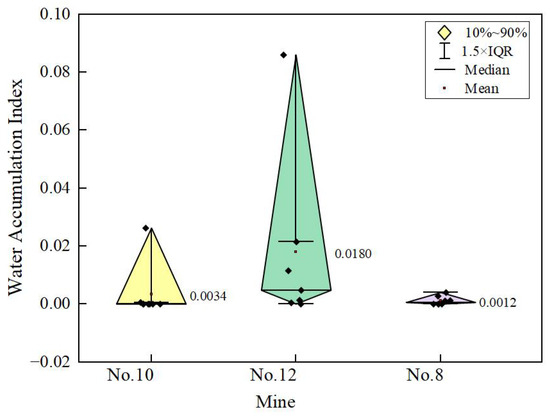
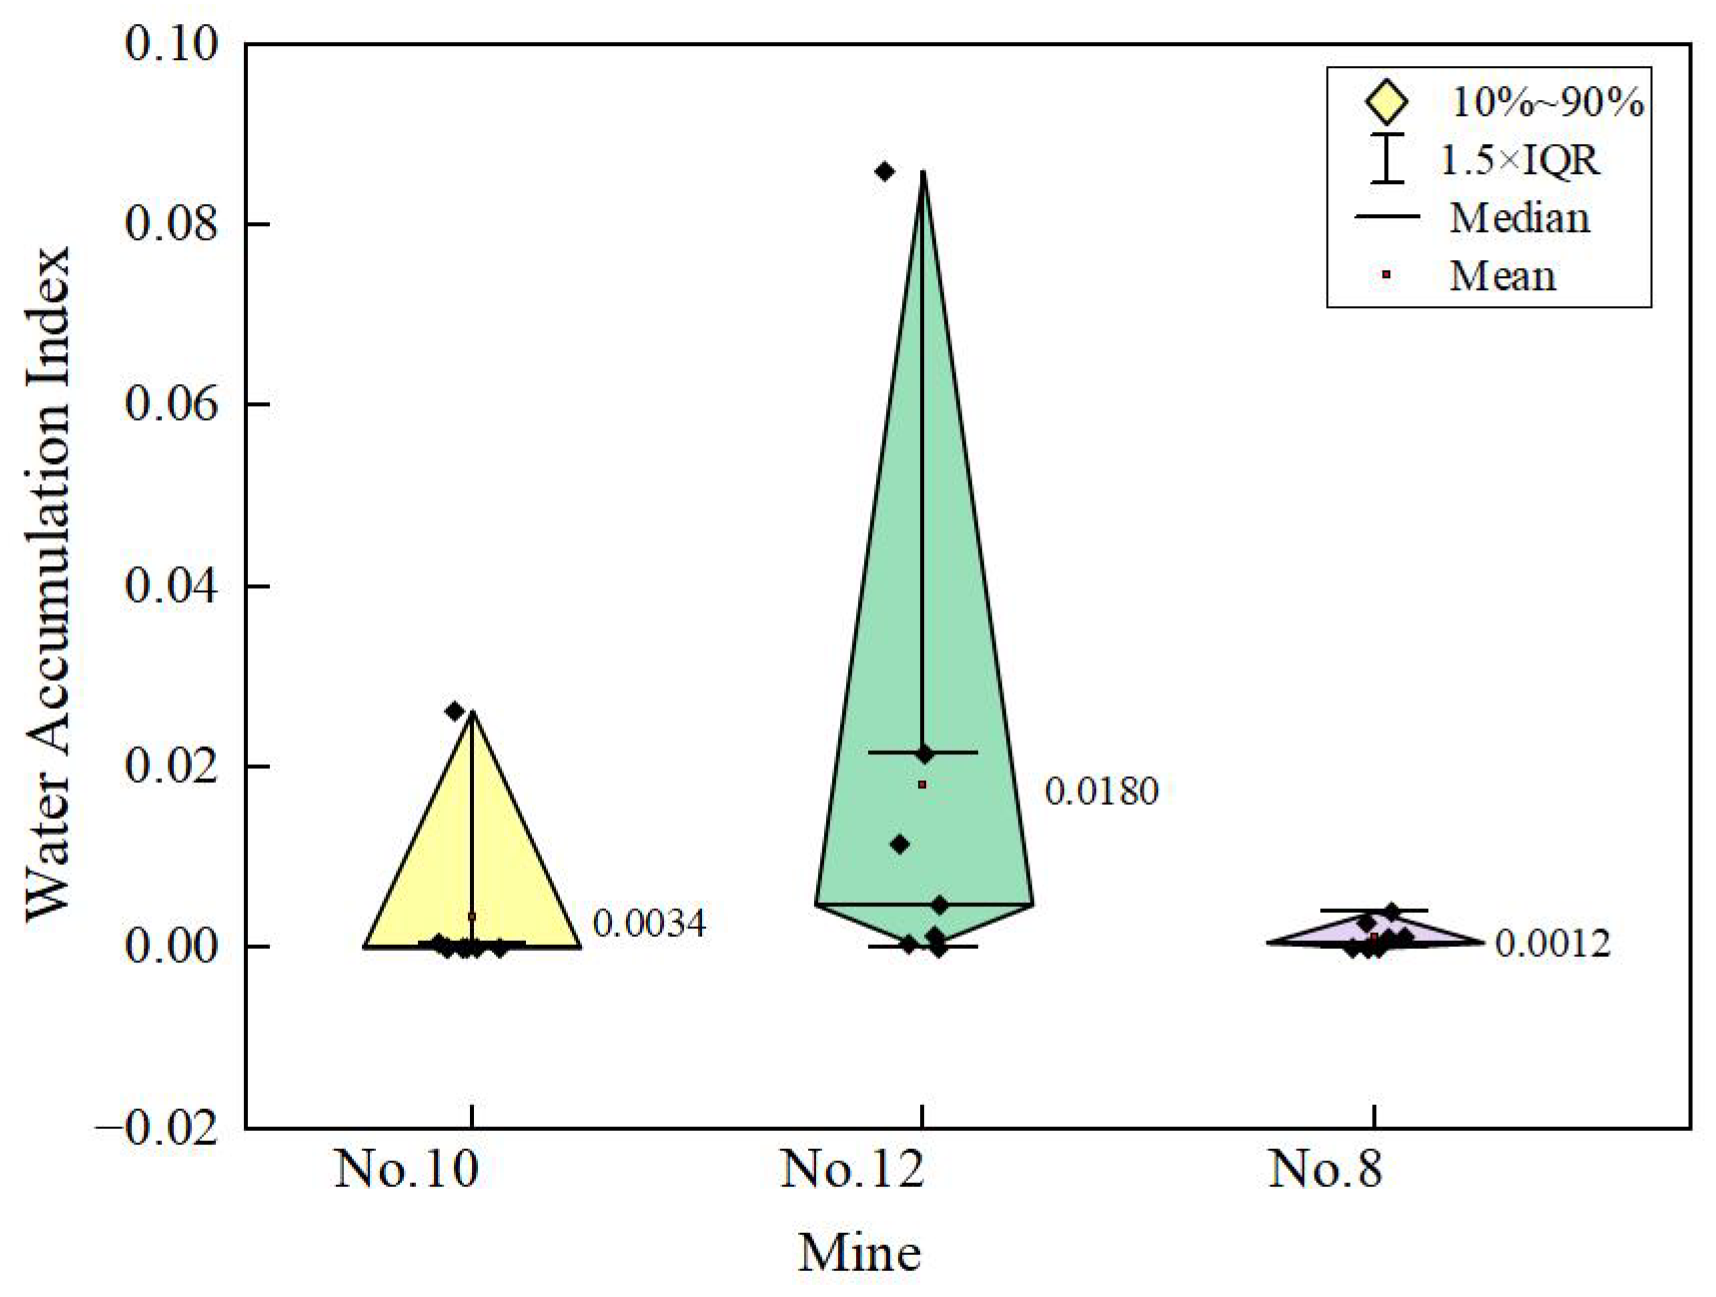
The water accumulation index reflects the degree of water accumulation and is used here as a correction factor for favorable block screening. The water accumulation indices vary among the three mines (Figure 8).
Figure 8.
Distribution characteristics of water accumulation index in goafs of eastern Pingdingshan mining area.
The average indices of water accumulation in the No. 10, No. 12, and No. 8 Mines are 0.0034, 0.0180, and 0.0012, respectively. The No. 12 Mine is found to have the largest index of water accumulation, followed by that in the No. 10 Mine, with the index being lowest in the No. 8 Mine. On the whole, the index of water accumulation varies within the range from 0 to 0.0860 in goafs of the three mines, with an average value of 0.0070.
3.3. Favorable Block Optimization and Field Application
3.3.1. Optimization Results of Favorable Blocks
The gas resource conditions, gas migration conditions, and drainage-related geological conditions of the investigated goaf blocks in the three mines were comprehensively analyzed. Gas abundance, gas pressure, goaf permeability, seam dip, and the water accumulation index were used as the evaluation variables. These parameters were incorporated into the productivity-based relative optimization index, and the calculated results for the 23 investigated blocks are presented in Table 1.
Table 1.
Block-level parameters and productivity-based optimization indices for the 23 investigated goaf blocks.
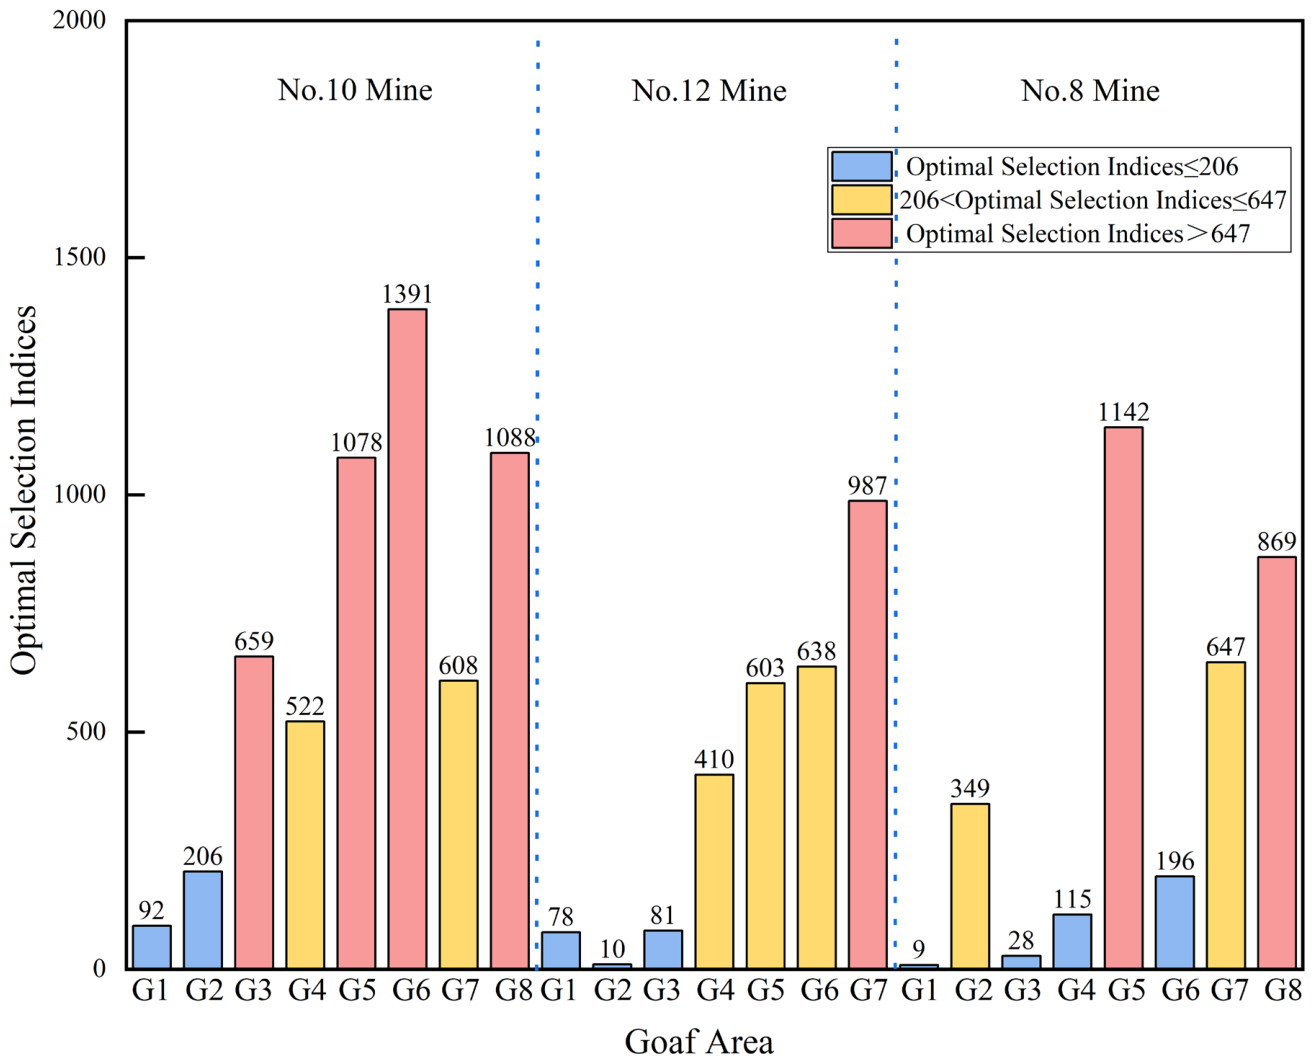
The natural break method was applied to the calculated optimization index values to divide the investigated blocks into three relative classes of favorability. Based on the distribution of the present dataset, blocks with optimization index values below 206, between 206 and 647, and above 647 were classified as Class III, Class II, and Class I, respectively.
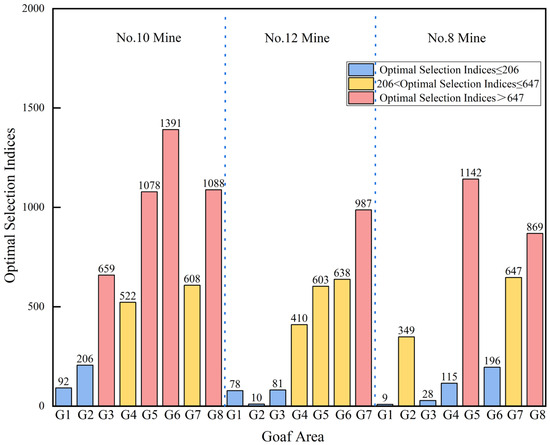
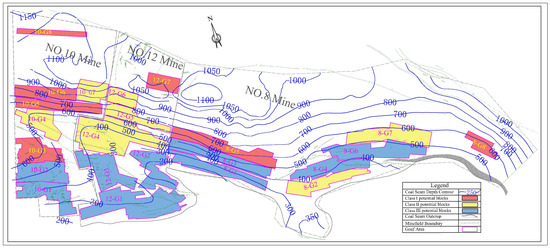
Specifically, Goafs 3, 5, 6, and 8 of the No. 10 Mine; Goaf 7 of the No. 12 Mine; and Goafs 5 and 8 of the No. 8 Mine were classified as Class I favorable blocks. Goafs 4 and 7 of the No. 10 Mine; Goafs 4, 5, and 6 of the No. 12 Mine; and Goafs 2 and 7 of the No. 8 Mine were classified as Class II potential blocks. The remaining blocks were classified as Class III blocks. The spatial distribution of the screening results is shown in Figure 9 and Figure 10.
Figure 9.
Comparison of optimal selection indices for favorable blocks in the goaf area of the study region.
Figure 10.
Favorable block selection of coal measure reservoir goafs in the study area.
The classification integrates the differences in gas abundance, gas pressure, goaf permeability, water accumulation, and seam dip into a common relative screening index and provides a basis for prioritizing candidate blocks for subsequent surface gas drainage deployment.
3.3.2. Illustrative Field Application of SKCK-02
SKCK-02 is a surface gas drainage well intersecting Goaf 5 of the II1 coal seam in the No. 10 Mine of the Pingdingshan mining area. Drilling commenced on 7 September 2022 and was completed on 1 October 2022. Nitrogen-enriched drilling mud was used, and the third-stage interval was completed as an open hole.
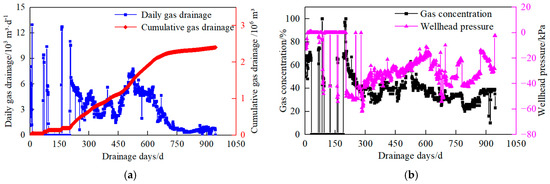
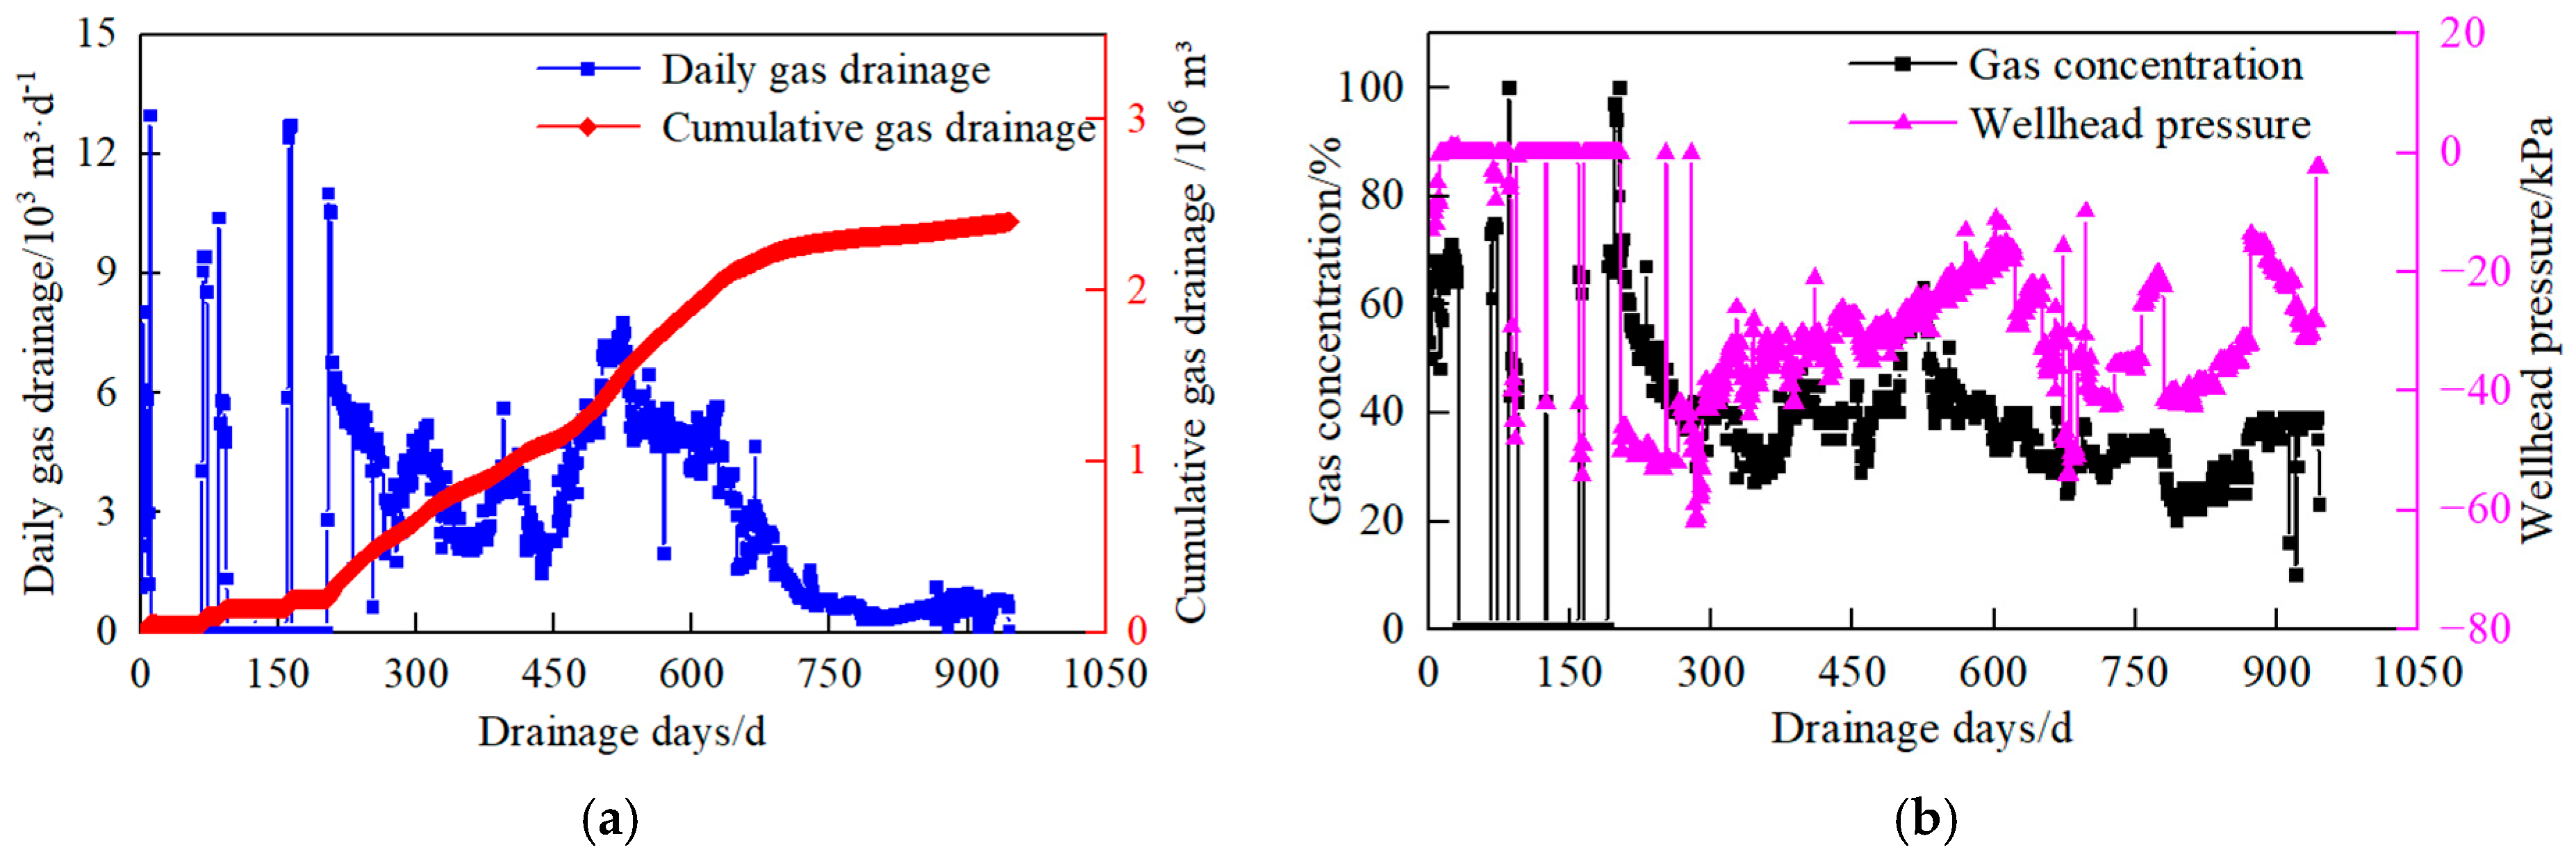
Gas production began on 21 October 2022, and the well was shut down on 22 May 2025 after 945 days of operation. The cumulative pure gas production reached 2.40 × 10⁶ m3. The maximum and average gas production rates were 12,944 m3/d and 2540 m3/d, respectively. During the production period, the average methane concentration was 34.08%, and the average wellhead pressure was −26.46 kPa. The variations in daily and cumulative gas production and methane concentration are shown in Figure 11.
Figure 11.
Gas production and methane concentration records of SKCK-02. (a) Variations in daily and cumulative gas drainage; (b) gas concentration curve.
Given the 945-day operating period, the long-term production of SKCK-02 cannot be attributed uniquely, based on the available data, to gas released from an actively evolving goaf. As described in Section 2.1, the extracted gas may include contributions from residual coal, coal pillars, surrounding strata, and adjacent seams. Source partitioning measurements were not available in the present study; therefore, the relative contributions of these sources cannot be quantified.
SKCK-02 is located within a block classified as Class I by the proposed screening method. Its production history is therefore presented only as an illustrative field record associated with a Class I block. The production record is consistent with the screening result for this block, but it should not be interpreted as quantitative validation of the three-class classification system, because comparable production data from Class II and Class III blocks were not available.
4. Discussion
4.1. Interpretation and Sensitivity of the Optimization Index
The productivity-based optimization index developed in this study is intended for the relative screening of favorable blocks rather than for prediction of the absolute production rate of an individual surface gas drainage well. The index organizes the selected parameters according to gas resource availability, gas migration capacity, pressure conditions, and drainage-related geological constraints. Accordingly, the calculated index should be interpreted as a comparative measure among the investigated blocks under the adopted parameter system.
A further simplification is the use of representative block-scale values of Kc and pg. Both parameters may evolve substantially during and after mining as fractures develop and subsequently compact. The present method does not reproduce this temporal evolution and should therefore not be interpreted as a transient goaf-flow model. Its output represents a relative screening result under the adopted block-scale parameter state.
The sensitivity analysis provides further information on the contributions of the individual variables. Because Equation (2) has a multiplicative form, the elasticities of δ with respect to Rc, Kc, and pg are all equal to 1, whereas the elasticities with respect to ka and ki are −ka/(1 − ka) and −ki/(1 − ki), respectively. For the 23 investigated blocks, Eka ranges from −0.094 to 0, whereas Eki ranges from −0.571 to −0.051. The relatively small magnitude of Eka reflects the generally low water accumulation indices in the present dataset and should not be interpreted as evidence that water accumulation is generally unimportant in other goafs.
When the optimization index was recalculated by setting ka = ki =0, the recalculated and original indices showed a high Spearman rank correlation (ρ = 0.989, p < 0.001, n = 23). Thus, the two correction terms affect the index values and the relative positions of some blocks but do not substantially alter the overall ranking for the present dataset. Water accumulation and seam dip should therefore be regarded as additional goaf-specific correction factors within the present relative screening framework rather than as factors that fundamentally redefine the ranking. In addition, the linear forms (1 − ka) and (1 − ki) are simplified screening corrections and should not be interpreted as physical constitutive relationships describing the reduction in gas flow.
The high rank correlation also indicates that the incremental contribution of ka and ki is limited for the present dataset. In particular, the small ka values observed in most investigated blocks result in only minor corrections to the index. Accordingly, these two variables should not be regarded as dominant controls on the ranking or as the principal source of methodological improvement. They are retained as site-dependent correction terms because water accumulation and seam dip represent drainage-related geological constraints. In the present study, ka and ki were derived from available hydrogeological monitoring data and coal seam dip data rather than from additional dedicated field tests. For mining areas with similarly low water accumulation and limited dip variability, a reduced screening index dominated by Rc, Kc, and pg may yield a similar overall ranking. Whether the two correction terms materially improve discrimination should therefore be assessed according to local conditions.
4.2. Comparison with Existing Approaches and Transferability of the Classification
Existing favorable block evaluation methods provide useful approaches for integrating geological, resource, and engineering information and are commonly based on multi-parameter weighting, scoring, or classification. The present method differs mainly in the way the selected variables are organized within a productivity-related relative screening framework. Gas abundance, goaf permeability, and gas pressure are used as the principal screening variables, whereas water accumulation and seam dip are incorporated as additional goaf-specific correction factors.
A quantitative head-to-head benchmark against a specific conventional favorable block evaluation method using the same dataset was not performed in the present study. Therefore, the present results should not be interpreted as demonstrating superior predictive accuracy over existing methods. Rather, the proposed index represents an alternative organization of the selected variables for relative favorable block screening.
A further source of uncertainty arises from the use of a common O-ring relationship for the three mines. Because a complete mine-by-mine comparison of the working-face geometry and overburden properties was not available, the present study cannot quantify the mine-specific uncertainty associated with Equation (13). This uncertainty mainly affects the estimated gas accumulation area and may therefore propagate through Rc into the optimization index. Accordingly, the resulting classification should be interpreted as a relative screening result rather than a precise delineation of gas enrichment boundaries.
Post-mining history represents an additional source of uncertainty in the present block-scale evaluation. The time elapsed since mining, the degree of subsequent compaction and stabilization, historical ventilation connections, and flooding evolution may affect gas preservation and migration. Complete and consistent records of these variables were not available for all 23 investigated blocks and were therefore not introduced as independent terms in Equation (2). Their effects may be partly reflected in the current gas pressure, estimated permeability, and water accumulation conditions; however, these present-state parameters cannot fully reconstruct the post-mining history of each block. For example, long-term compaction may reduce connected permeability, persistent ventilation or air leakage may reduce the methane concentration and effective gas pressure, and flooding may modify the available gas-filled space and migration pathways. Consequently, blocks with similar optimization index values but substantially different post-mining histories may be ranked with additional uncertainty. This limitation should be considered when applying the present screening results to well deployment.
The classification thresholds also require cautious interpretation. The natural break boundaries of 206 and 647 were derived from the distribution of optimization index values for the 23 investigated blocks. They are therefore empirical and sample-dependent rather than statistically universal thresholds. Their stability may be influenced by the sample distribution and extreme index values. Consequently, these numerical boundaries should be regarded as site-specific to the present dataset in the eastern Pingdingshan mining area. When the method is applied to another mining area or to a substantially expanded dataset, the class boundaries should be recalculated using the corresponding local data.
A simple threshold sensitivity check was further conducted using the 23 block-level optimization indices. The lower and upper class boundaries were perturbed independently by ±5% and ±10%, while the other boundary was kept unchanged. Under the ±5% perturbations, 21–23 of the 23 blocks (91.3–100%) retained their original classifications. Under the ±10% perturbations, 19–23 blocks (82.6–100%) remained unchanged. The reclassified blocks were concentrated near the corresponding class boundaries. These results indicate that the broad three-class pattern is relatively stable within moderate threshold perturbations for the present dataset, although the classification of boundary-adjacent blocks is sensitive to the exact breakpoint values. Therefore, the classes should be interpreted as relative screening categories rather than fixed deterministic boundaries.
4.3. Field Application and Limitations
The present study focuses on favorable block screening before surface-well deployment rather than on stimulation or production enhancement technologies. Because systematic production records from comparable historical wells are not available in the present dataset, the specific causes of previously low-producing wells cannot be quantitatively evaluated. Instead, the proposed method is intended to provide a structured basis for comparing candidate blocks before well deployment by screening candidate blocks according to gas abundance, gas pressure, goaf permeability, water accumulation, and seam dip.
SKCK-02 is presented as an illustrative field application of the screening results. The well is located in a Class I block and produced 2.40 × 10⁶ m3 of cumulative pure gas during 945 days of operation. This production record is consistent with its classification as a relatively favorable block but is not used as an independent validation of the screening system. Because comparable production data from Class II and Class III blocks are unavailable, SKCK-02 cannot validate the three-class classification or its boundaries.
The average methane concentration of SKCK-02 was 34.08%, and the average wellhead pressure was −26.46 kPa. The negative wellhead pressure reflects active suction during gas drainage. Under negative-pressure extraction, air ingress through mining-induced fractures or connected workings may dilute the extracted gas and may partly contribute to variations in the methane concentration. However, the oxygen concentration, air-leakage rate, and related ventilation parameters were not systematically monitored in the present study. Therefore, the contribution of air ingress cannot be quantified using the available data and is considered here only as a possible operational factor.
Comparable production data from Class II and Class III blocks are not available in the present dataset. Therefore, the SKCK-02 production record cannot be used to validate the class boundaries or the overall three-class classification. Further field applications involving blocks from different classes would be required to evaluate the robustness of the classification and, where appropriate, refine the corresponding thresholds.
5. Conclusions
(1) A productivity-based relative optimization index was constructed for favorable block screening of surface gas drainage from coal mine goafs. Gas abundance, goaf permeability, and gas pressure were used as the principal screening variables, while water accumulation and seam dip were incorporated as goaf-specific correction factors. The evaluation parameters were determined using geological, hydrogeological, and mining-related information together with the relevant calculation methods. Analytical sensitivity analysis based on Equation (2) showed that the elasticities of the index with respect to gas abundance, permeability, and gas pressure were all equal to 1. When ka = ki = 0, the recalculated and original indices remained strongly correlated (Spearman’s ρ = 0.989, p < 0.001, n = 23), indicating that the two correction factors affected the index values and the relative positions of some blocks but did not substantially alter the overall ranking for the present dataset.
(2) Application of the optimization index to 23 goaf blocks in the No. 10, No. 12, and No. 8 Mines divided the investigated blocks into seven Class I favorable blocks, seven Class II potential blocks, and nine Class III relatively unfavorable blocks using the adopted natural break classification. Several Class I blocks were concentrated in the central–northern part of the No. 10 Mine. The resulting classes provide a relative basis for prioritizing candidate blocks before surface-well deployment. The class boundaries are derived from the present dataset and should therefore be recalculated when the method is applied to other mining areas or substantially different datasets.
(3) The SKCK-02 surface gas drainage well, located in Goaf 5, a Class I block of the No. 10 Mine, produced 2.40 × 10⁶ m3 of cumulative pure gas over 945 days, with maximum and average gas production rates of 12,944 and 2540 m3/d, respectively. SKCK-02 is presented as an illustrative field application whose production record is consistent with the relative screening result for this block. Because comparable production data from Class II and Class III blocks are unavailable, this case does not validate the three-class classification or its boundaries.
Author Contributions
G.Z.: Conceptualization (equal), Methodology (equal), Visualization (equal), Data curation (equal), Formal analysis (equal), Writing—Original draft (equal). J.Z.: Conceptualization (equal), Methodology (equal), Visualization (equal), Formal analysis (equal), Funding acquisition (equal), Supervision (equal), Writing—Review and editing (equal). R.L.: Methodology (equal), Data curation (equal), Formal analysis (equal). G.Y.: Methodology (equal), Data curation (equal), Formal analysis (equal). X.N.: Visualization (equal), Formal analysis (equal). J.J.: Visualization (equal), Formal analysis (equal). All authors have read and agreed to the published version of the manuscript.
Funding
This research was funded by the National Natural Science Foundation of China (grant number 42302206), the Henan Provincial Science and Technology Research Project (grant number 252102320351), and the Fundamental Research Funds for the Universities of Henan Province (grant number NSFRF2602030).
Data Availability Statement
The block-level derived parameters used to calculate the productivity-based optimization index are provided in Table 1. Additional supporting data are available from the corresponding author upon reasonable request.
Conflicts of Interest
Author Guochuan Zhang was employed by China Pingmei Shenma Group Co., Ltd. and Pingdingshan Tian’an Coal Mining Co., Ltd. Authors Guohe Yang and Jinsheng Jia were employed by Henan Chaolan Energy Technology Co., Ltd. The remaining authors declare that the research was conducted in the absence of any commercial or financial relationships that could be construed as a potential conflict of interest.
References
- He, X.; Wu, G.; Zhu, S.; Qiao, J.; Wang, X. The key directions research and consideration of abandoned coal mines geological work in China. China Min. Mag. 2019, 28, 80–84. (In Chinese) [Google Scholar]
- Younger, P.L. Abandoned coal mines: From environmental liabilities to low-carbon energy assets. Int. J. Coal Geol. 2016, 164, 1–2. [Google Scholar] [CrossRef] [Scilit]
- Yuan, L.; Jiang, Y.; Wang, K.; Zhao, Y.; Hao, X.; Xu, C. Precision exploitation and utilization of closed/abandoned mine resources in China. J. China Coal Soc. 2018, 43, 14–20. (In Chinese) [Google Scholar]
- Yuan, L.; Yang, K. Further discussion on the scientific problems and countermeasures in the utilization of abandoned mines. J. China Coal Soc. 2021, 46, 16–24. (In Chinese) [Google Scholar]
- Liu, Y.; Gao, H.; Yu, Z.; Li, C.; Ren, H.; Zhao, Y.; Huang, F.; Guo, Y.; Wan, M.; Tian, J.; et al. Managing methane emissions in abandoned coal mines: Comparison of different recovery technologies by integrating techno-economic analysis and life-cycle assessment. Environ. Sci. Technol. 2022, 56, 13900–13908. [Google Scholar] [CrossRef] [Scilit]
- Karacan, C.Ö.; Warwick, P.D. Assessment of coal mine methane (CMM) and abandoned mine methane (AMM) resource potential of longwall mine panels: Example from Northern Appalachian Basin, USA. Int. J. Coal Geol. 2019, 208, 37–53. [Google Scholar] [CrossRef] [Scilit]
- Radermacher, L.; Burlacu, A.; Radeanu, C. Managing residual methane from abandoned coal mines in urban areas: A post-mining risk case study from Lupeni, Romania. Processes 2026, 14, 696. [Google Scholar] [CrossRef] [Scilit]
- Lefebvre, C.; Alvis, M.; de Groen, V.; Delamarre, S.; Roy, G. Coalbed methane resources evaluation methodology: An integrated case study in former coal mining basins in France. In Proceedings of the SPE Hydrocarbon Economics and Evaluation Symposium, Paper SPE-162913-MS. Calgary, AB, Canada, 24–25 September 2012. [Google Scholar]
- Qu, Q.; Balusu, R.; Belle, B. Specific gas emissions in Bowen Basin longwall mines, Australia. Int. J. Coal Geol. 2022, 261, 104076. [Google Scholar] [CrossRef] [Scilit]
- Thielemann, T.; Cramer, B.; Schippers, A. Coalbed methane in the Ruhr Basin, Germany: A renewable energy resource? Org. Geochem. 2004, 35, 1537–1549. [Google Scholar] [CrossRef] [Scilit]
- Meng, Z.; Shi, X.; Liu, S.; Tian, Y.; Li, C. Evaluation model of CBM resources in abandoned coal mine and its application. J. China Coal Soc. 2016, 41, 537–544. (In Chinese) [Google Scholar]
- Wen, G.; Sun, H.; Li, R.; Fu, J.; Zhao, X. Assessment method and application of coalbed methane resources in coal mining stability area. J. China Coal Soc. 2018, 43, 160–167. (In Chinese) [Google Scholar]
- Liu, X.; Yan, J.; Liu, C.; Jia, T.; Feng, Z.; Wei, J.; Wei, G. Construction and application of gas resource estimation and evaluation method in abandoned coal mines. Coal Geol. Explor. 2022, 50, 45–51. (In Chinese) [Google Scholar]
- Schatzel, S.J.; Karacan, C.Ö.; Dougherty, H.; Goodman, G.V.R. An analysis of reservoir conditions and responses in longwall panel overburden during mining and its effect on gob gas well performance. Eng. Geol. 2012, 127, 65–74. [Google Scholar] [CrossRef] [Scilit]
- Karacan, C.Ö. Modeling and analysis of gas capture from sealed sections of abandoned coal mines. Int. J. Coal Geol. 2015, 138, 30–41. [Google Scholar] [CrossRef] [Scilit]
- Feng, G.; Hu, S.; Li, Z.; Jiang, H.; Zhang, Y.; Xu, G.; Wang, Z.; Kang, L. Distribution of methane enrichment zone in abandoned coal mine and methane drainage by surface vertical boreholes: A case study from China. J. Nat. Gas Sci. Eng. 2016, 34, 767–778. [Google Scholar] [CrossRef] [Scilit]
- Jia, C.; Fan, C.; Li, S.; Luo, M.; Liu, Z.; Wang, Y.; Li, Y. Fracture-controlled permeability evolution and methane migration pathways in abandoned coal mines: Implications for abandoned mine methane recovery. Fuel 2026, 422, 139102. [Google Scholar] [CrossRef] [Scilit]
- Bai, M.; Elsworth, D. Some aspects of mining under aquifers in China. Min. Sci. Technol. 1990, 10, 81–91. [Google Scholar] [CrossRef] [Scilit]
- Palchik, V. Influence of physical characteristics of weak rock mass on height of caved zone over abandoned subsurface coal mines. Environ. Geol. 2002, 42, 92–101. [Google Scholar] [CrossRef] [Scilit]
- Palchik, V. Formation of fractured zones in overburden due to longwall mining. Environ. Geol. 2003, 44, 28–38. [Google Scholar] [CrossRef] [Scilit]
- Guo, H.; Yuan, L.; Shen, B.; Qu, Q.; Xue, J. Mining-induced strata stress changes, fractures and gas flow dynamics in multi-seam longwall mining. Int. J. Rock Mech. Min. Sci. 2012, 54, 129–139. [Google Scholar] [CrossRef] [Scilit]
- Cheng, G.; Ma, T.; Tang, C.; Liu, H.; Wang, S. A zoning model for coal mining-induced strata movement based on microseismic monitoring. Int. J. Rock Mech. Min. Sci. 2017, 94, 123–138. [Google Scholar] [CrossRef] [Scilit]
- Dougherty, H.N.; Karacan, C.Ö.; Goodman, G.V.R. Reservoir diagnosis of longwall gobs through drawdown tests and decline curve analyses of gob gas venthole productions. Int. J. Rock Mech. Min. Sci. 2010, 47, 851–857. [Google Scholar] [CrossRef] [Scilit]
- Shi, J.Q.; Rubio, R.M.; Durucan, S. An improved void-resistance model for abandoned coal mine gas reservoirs. Int. J. Coal Geol. 2016, 165, 257–264. [Google Scholar] [CrossRef] [Scilit]
- Karacan, C.Ö.; Ruiz, F.A.; Cotè, M.; Phipps, S. Coal mine methane: A review of capture and utilization practices with benefits to mining safety and to greenhouse gas reduction. Int. J. Coal Geol. 2011, 86, 121–156. [Google Scholar] [CrossRef] [Scilit]
- Chen, S.; Sun, L.; Zhang, Y. Research on the distributing law of the gas in the gob area based on flow-tube model. Procedia Eng. 2011, 26, 1043–1050. [Google Scholar] [CrossRef] [Scilit][Green Version]
- Wang, Z.; Xiong, J.; Zhang, Y.; Tao, G.; Pan, J.; Niu, Q. Investigation of permeability stress induced damage evolution of shallow and deep coal reservoirs in the Junggar Basin, China. Rock Mech. Rock Eng. 2026, 59, 5065–5092. [Google Scholar] [CrossRef] [Scilit]
- Xiong, J.; Wang, Z.; Zhao, Y.; Jin, Y.; Pan, J. Contrasting stress sensitivity of natural vs. artificially fractured deep coals: Implications for coalbed methane drainage pressure control. Nat. Resour. Res. 2026, 35, 1229–1257. [Google Scholar] [CrossRef] [Scilit]
- Zhang, Y.; Zhang, S.; Deng, Z.; Wang, R.; Liu, G. A prediction method for coalbed methane development sweet spots based on hierarchical analysis and grey fixed-weight clustering: Taking Shizhuangbei block as an example. Coal Sci. Technol. 2024, 52, 166–175. (In Chinese) [Google Scholar]
- Liu, G.; Liu, H.; Xian, B.; Gao, D.; Wang, X.; Zhang, Z. Fuzzy pattern recognition model of geological sweetspot for coalbed methane development. Pet. Explor. Dev. 2023, 50, 924–933. [Google Scholar] [CrossRef] [Scilit]
- Huang, H.; Wang, B.; Bi, C.; Zhang, H.; Zhang, J.; Huang, Z. Effects of negative pressure variations and intermittent extraction on abandoned gob methane extraction using a surface well in Jixi Basin, China. Pet. Sci. Technol. 2026, 44, 1795–1816. [Google Scholar] [CrossRef] [Scilit]
- Wei, Y.; Zhao, L.; Liu, W.; Zhang, X.; Guo, Z.; Wu, Z.; Yuan, S. Coalbed methane reservoir parameter prediction and sweet-spot comprehensive evaluation based on 3D seismic exploration: A case study in Western Guizhou Province, China. Energies 2023, 16, 367. [Google Scholar] [CrossRef] [Scilit]
- Chen, F.; Jiang, X.; Wu, C.; Zhou, H.; Gao, B.; Zhang, S. Evaluation of coalbed methane resources in Xinjing Baoan block based on PCA, TOPSIS, & MLFM. Energy Explor. Exploit. 2022, 40, 1457–1481. [Google Scholar] [CrossRef] [Scilit]
- Shao, L.; Hou, H.; Tang, Y.; Lu, J.; Qiu, H.; Wang, X.; Zhang, J. Selection of strategic relay areas of CBM exploration and development in China. Nat. Gas Ind. 2015, 35, 1–11. (In Chinese) [Google Scholar]
- Yang, J.; Liu, H.; Hu, C.; Fan, Z.; Liu, J.; Gao, D.; Xu, H.; Ding, H. Evaluation model for CBM development potential in abandoned mines based on combined weighting and fuzzy analysis: A case study of the Huainan–Huaibei coalfield, China. Fuel 2026, 406, 137124. [Google Scholar] [CrossRef] [Scilit]
- Zhang, C.; Wu, C.; Li, T.; Zhang, X. Principal component analysis method applied to evaluation on coalbed methane block selection. Coal Sci. Technol. 2016, 44, 137–142. (In Chinese) [Google Scholar]
- Guo, Z.; Zhao, J.; You, Z.; Li, Y.; Zhang, S.; Chen, Y. Prediction of coalbed methane production based on deep learning. Energy 2021, 230, 120847. [Google Scholar] [CrossRef] [Scilit]
- Zhang, H.; Cai, X.; Ni, P.; Qin, B.; Ni, Y.; Huang, Z.; Xin, F. Prediction of coalbed methane content based on composite logging parameters and PCA-BP neural network. J. Appl. Geophys. 2025, 236, 105681. [Google Scholar] [CrossRef] [Scilit]
- Meng, Z.; Zhang, J.; Liu, H.; Liu, S.; Zhou, X. Productivity model of CBM wells considering the stress sensitivity and its application analysis. J. China Coal Soc. 2014, 39, 593–599. (In Chinese) [Google Scholar]
- Zhou, J.; Liang, G.; Deng, T.; Zhou, S.; Gong, J. Coalbed methane production system simulation and deliverability forecasting: Coupled surface network/wellbore/reservoir calculation. Int. J. Chem. Eng. 2017, 2017, 8267529. [Google Scholar] [CrossRef] [Scilit]
- Meng, Y.; Wang, J.Y.; Li, Z.; Zhang, J. An improved productivity model in coal reservoir and its application during coalbed methane production. J. Nat. Gas Sci. Eng. 2018, 49, 342–351. [Google Scholar] [CrossRef] [Scilit]
- Shi, J.; Jia, Y.; Wu, J.; Xu, F.; Sun, Z.; Liu, C.; Meng, Y.; Xiong, X.; Liu, C. Dynamic performance prediction of coalbed methane wells under the control of bottom-hole pressure and casing pressure. J. Pet. Sci. Eng. 2021, 196, 107799. [Google Scholar] [CrossRef] [Scilit]
- Li, Y. Surface well partition gas extraction technology system and engineering practice. Coal Sci. Technol. 2023, 51, 100–108. (In Chinese) [Google Scholar]
- Li, K. Potential Analysis and Risk Assessment of Gas Resource Development and Utilization in Abandoned Mines. Master’s Thesis, Henan Polytechnic University, Jiaozuo, China, 2022. (In Chinese) [Google Scholar]
- Li, X.; Xu, J.; Wang, F.; Hu, G. The influence laws of working face width on the developmental morphology of mining fissure “O-shaped” circle. Saf. Coal Mines 2012, 43, 34–36. (In Chinese) [Google Scholar]

Disclaimer/Publisher’s Note: The statements, opinions and data contained in all publications are solely those of the individual author(s) and contributor(s) and not of MDPI and/or the editor(s). MDPI and/or the editor(s) disclaim responsibility for any injury to people or property resulting from any ideas, methods, instructions or products referred to in the content. |
© 2026 by the authors. Licensee MDPI, Basel, Switzerland. This article is an open access article distributed under the terms and conditions of the Creative Commons Attribution (CC BY) license.