


Abstract
Methane emission control is an important component of climate action, particularly in China, where coal mining is a major source of methane emissions. Using provincial panel data for 2011–2022 and a difference-in-differences (DID) approach, this study evaluates the 2013 coal mine methane (CMM) reduction policy by exploiting cross-provincial variation in policy exposure. The estimates indicate larger post-policy declines in CMM emissions among provinces with higher policy exposure. Mechanism analyses suggest two potential channels: greater public environmental attention and industrial structure upgrading. The policy is also associated with higher total factor productivity (TFP) and lower GDP-based CMM emission intensity. Estimated emission reductions are more pronounced in coal resource-based regions and provinces with higher GDP levels. These findings support sustained and regionally differentiated implementation of CMM mitigation measures.
1. Introduction
Methane is the second-largest contributor to global warming after carbon dioxide, owing to its high warming potential and relatively short atmospheric lifetime [1]. Methane mitigation can therefore deliver near-term climate benefits while complementing long-term carbon reduction strategies [2,3]. Launched at the 26th Conference of the Parties to the United Nations Framework Convention on Climate Change (COP26), the Global Methane Pledge calls for a collective effort to reduce global methane emissions by at least 30% from 2020 levels by 2030 [4]. Its Energy Pathway, launched in 2022, promotes methane mitigation in the oil and gas sector [5].
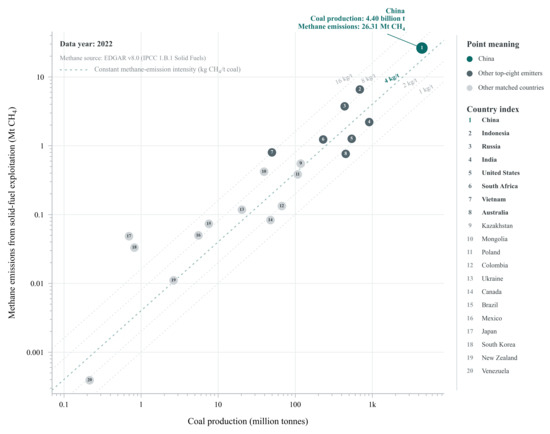
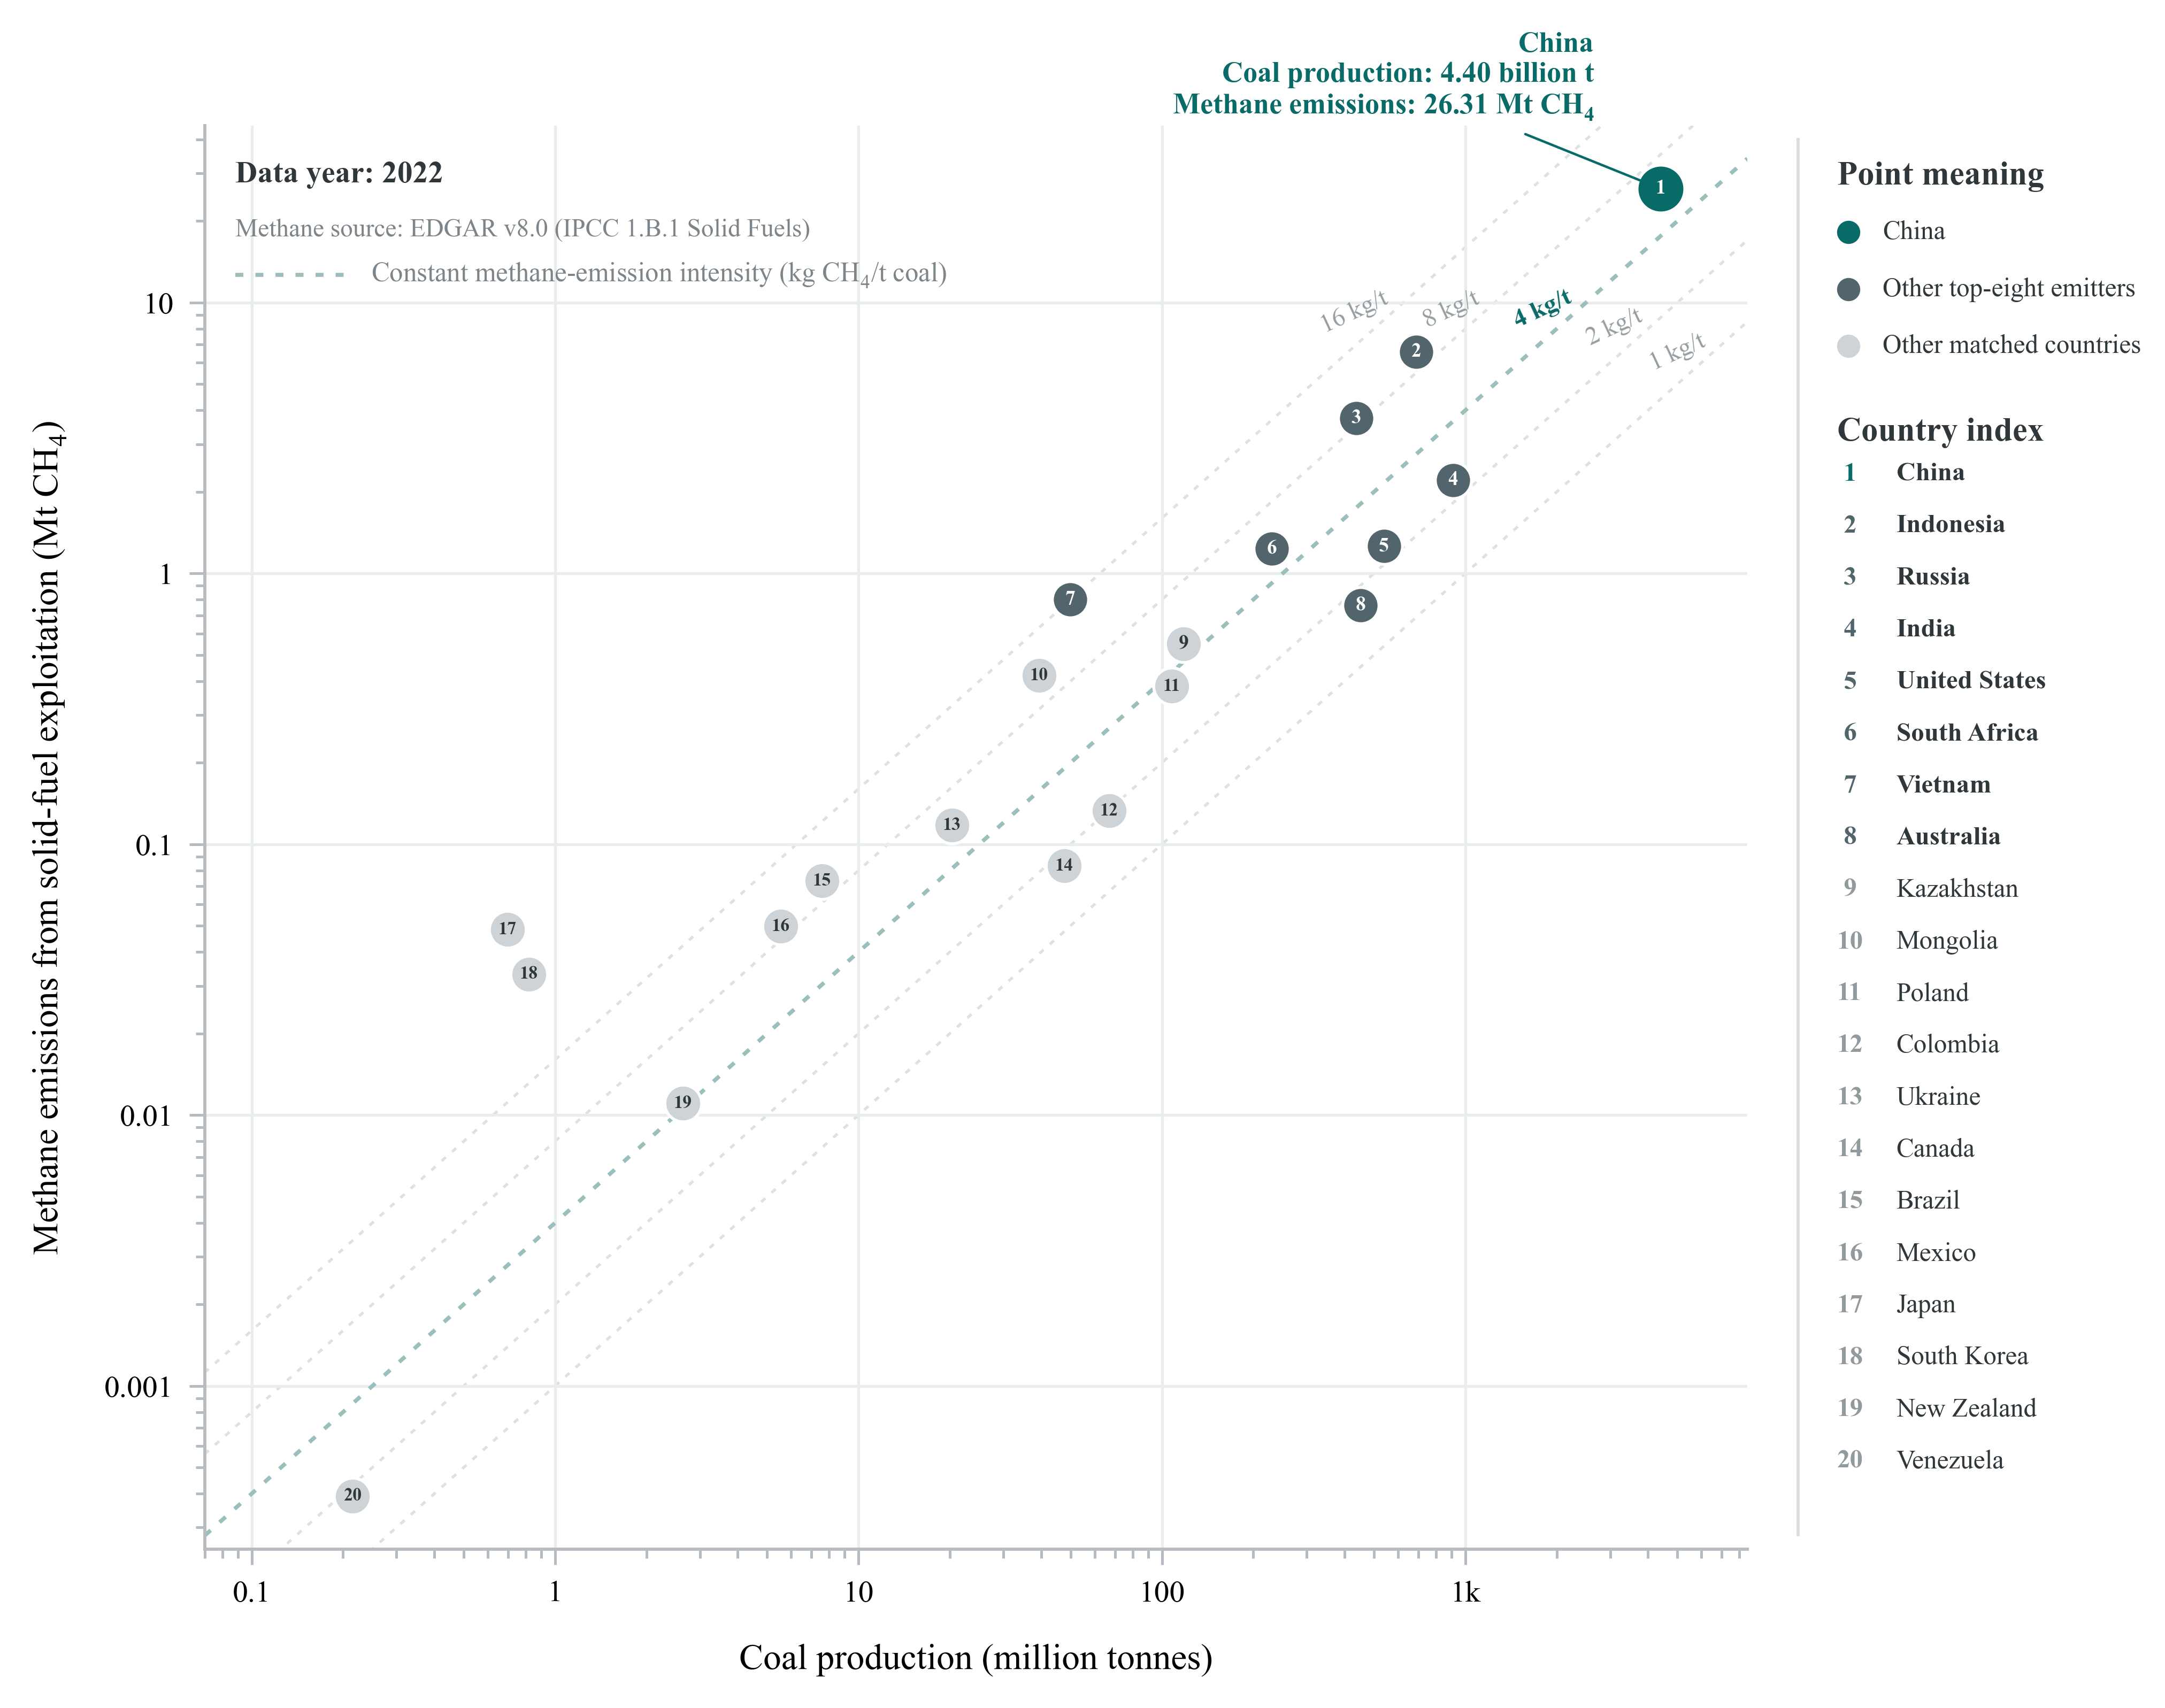
Against the backdrop of the international community’s increasing emphasis on methane emission control, China faces substantial methane mitigation challenges, particularly from coal mining. This challenge is reinforced by the country’s continued dependence on coal in its energy system [2]. Figure 1 provides a cross-country comparison of coal production and methane emissions from solid-fuel exploitation in 2022. China produced approximately 4.40 billion tonnes of coal and emitted 26.31 Mt of methane, corresponding to an indicative methane-emission intensity of approximately 5.97 kg CH4 per tonne of coal. The dispersion of countries around the constant-intensity lines further shows that coal production scale alone does not fully account for cross-country differences in coal-related methane emissions [6]. Therefore, methane mitigation depends not only on reducing coal production but also on improving methane extraction, utilization, and emission-control practices during coal mining activities. These patterns underscore the importance of effective coal mine methane (CMM) management in China for both its carbon peaking and carbon neutrality commitments and global methane mitigation.
Figure 1.
Coal production and methane emissions from solid-fuel exploitation across countries. Notes: Each numbered circle represents one country. Both axes are logarithmic. The diagonal lines indicate constant methane-emission intensities, measured in kg CH4 per tonne of coal. The data refer to 2022. Source: Coal-production data are from the Energy Institute’s Statistical Review of World Energy 2026 [7]; methane-emission data are from the European Commission Joint Research Centre, EDGAR Community GHG Database v8.0 [8].
Existing research examines the quantification, spatial characteristics, and mitigation potential of CMM emissions. Studies combining emission inventories and atmospheric inversions have assessed changes in China’s methane emissions and their relationship with coal production [9,10]. Other research has quantified abandoned mine methane and refined mine-level emission estimates [11,12]. Mitigation studies have examined production shifts and methane utilization [13], prioritized closure of gas-rich mines [14], and the roles of industrial structure, energy consumption, and technological progress [15]. However, evidence on the emission reduction effects of implemented CMM policies remains limited. Identifying the effects of a nationwide policy requires attention to differences in policy exposure and dynamic responses, consistent with methodological concerns in recent difference-in-differences (DID) research [16].
This study evaluates the CMM reduction policy using provincial differences in coal mining investment exposure, complementing mitigation-potential assessments and atmospheric studies [17,18]. It also examines public environmental attention and industrial structure upgrading as potential channels, associations with productivity and GDP-based CMM emission intensity, and variation in policy effects across coal resource-based regions and provinces with different GDP levels.
2. Institutional Background and Research Hypotheses
2.1. Institutional Background
China’s coal-dominated energy structure makes coal mining, particularly underground mining, an important source of methane emissions [13,19,20]. Coal mine gas contains methane and other gases; its extraction and utilization serve both mine safety and energy-resource objectives. Subsidies and other incentives have supported its development and utilization [21,22]. In 2011, the Notice on Further Strengthening Coal Mine Gas Prevention and Control emphasized stronger coal mine gas prevention and control and greater comprehensive utilization. In September 2013, the General Office of the State Council issued the Opinions on Further Accelerating the Extraction and Utilization of Coalbed Methane (Coal Mine Gas), specifying extraction and utilization objectives and strengthening policy support. This instrument is hereafter referred to as the CMM reduction policy.
Subsequent policies gradually broadened the governance focus from coal mine gas safety and resource utilization toward cleaner energy use and, more recently, explicit methane emission control. The 2018 Opinions of the CPC Central Committee and the State Council on Comprehensively Strengthening Ecological and Environmental Protection and Resolutely Fighting the Battle Against Pollution called for strengthening the comprehensive utilization of coalbed methane (coal mine gas) as part of efforts to reduce coal consumption and promote cleaner energy use. In 2023, the Ministry of Ecology and Environment and ten other departments issued the Action Plan on Methane Emission Control, identifying coal mining as a key mitigation sector. In 2024, the Emission Standard of Coalbed Methane (Coal Mine Gas) (GB 21522-2024) was issued, specifying extraction, emission control, monitoring, implementation, and supervision requirements. Taken together, these developments indicate that long-standing priorities of coal mine gas safety and resource utilization have increasingly been complemented by objectives related to methane emission control and low-carbon transition [23].
2.2. Research Hypotheses
Coal mine gas extraction and utilization can reduce methane emissions associated with coal mining [24]. By promoting these activities nationwide, the CMM reduction policy is expected to reduce CMM emissions.
The CMM reduction policy may affect methane emissions through multiple channels, including public environmental attention and industrial structure upgrading. First, at the societal level, environmental policies can serve as signals that increase public awareness of environmental issues and strengthen external monitoring pressure. By emphasizing methane mitigation and coal mine gas utilization, the policy may enhance public environmental attention and encourage local governments and firms to adopt stronger emission-control practices. Strengthened organizational coordination and supervision requirements may improve the implementation of methane management objectives. Second, at the industrial level, the policy may promote industrial structure upgrading by encouraging technological innovation and structural adjustment in the coal industry. Financial subsidies and incentive programs can support the development of coal mine gas extraction and utilization technologies, while also encouraging the transformation of traditional high-emission production models toward cleaner and more efficient practices [21,22].
Therefore, this study proposes the following research hypotheses:
H1.
The CMM reduction policy reduces CMM emissions.
H2.
The CMM reduction policy may reduce CMM emissions by increasing public environmental attention.
H3.
The CMM reduction policy may reduce CMM emissions by promoting industrial structure upgrading.
3. Research Design
The analysis uses panel data for 30 provincial-level administrative regions in China, excluding Tibet, Hong Kong, Macau, and Taiwan. To ensure data availability and continuity and avoid overlap with the national methane-control framework introduced in 2023, the sample covers 2011–2022. Data are drawn primarily from the National Bureau of Statistics, the China Statistical Yearbook, provincial statistical yearbooks, and government announcements.
3.1. Variable Definitions
3.1.1. Dependent Variable
CMM emissions refer to methane released during coal extraction and post-mining activities. Unlike coalbed methane, a resource-oriented term for methane contained in coal seams, CMM denotes methane emissions associated with coal mining. Methane emitted after mine closure is referred to as abandoned mine methane. Following Chen et al. [25], this study uses published province-year net CMM emission estimates covering underground mining, underground post-mining, surface mining, surface post-mining, and abandoned underground coal mines; methane recovered or utilized from underground mines is deducted from gross emissions. The present study uses these published net estimates without independently reconstructing the source inventory and normalizes them using the min–max method for regression analysis.
3.1.2. Independent Variable
Policy exposure (DID). Because the CMM reduction policy covered all provinces, there was no unaffected provincial control group. Following Vig [26] and Campello and Larrain [27], this study characterizes differential exposure using provincial coal mining investment intensity in 2013, the policy issuance year. Provinces with coal mining industry investment above the median are classified as the treatment group; the remaining provinces form the lower-exposure comparison group. The first full year of policy implementation is 2014. The post-policy indicator therefore equals 1 from 2014 onward and 0 otherwise. The interaction of treatment status and the post-policy indicator is the DID regressor, whose coefficient captures the differential post-policy change associated with policy exposure. A continuous DID specification based on 2013 coal mining investment intensity is used as a robustness test.
3.1.3. Control Variables
The model includes four control variables [28]: Economic development, measured as the logarithm of provincial GDP; Tax revenue, measured as the logarithm of provincial tax revenue; R&D expenditure, measured in 10 billion yuan; and Industrial structure, measured as the ratio of tertiary-industry to secondary-industry value added. Table 1 presents the variables.
Table 1.
Description of key variables.
3.2. Model Setting
The DID framework compares changes in CMM emissions between provinces with high and low policy exposure, measured by provincial coal mining investment intensity in 2013. The model includes province and year fixed effects, as follows:
where i and t denote province and year, respectively; Controls denotes the control variables; μi and λt denote province and year fixed effects; and εi,t is the error term. The coefficient of interest, α1, measures the differential change associated with policy exposure; a significantly negative estimate indicates lower CMM emissions in higher-exposure provinces.
4. Empirical Analyses
4.1. Baseline Results
4.1.1. Descriptive Analysis
The normalized CMM emissions measure has a mean of 0.081 and a standard deviation of 0.154 (Table 2). Its range of 0–1 reflects min–max normalization. Shanxi records the maximum and Hainan the minimum, consistent with their contrasting coal resource endowments and mining activity.
Table 2.
Descriptive statistics.
4.1.2. Baseline Regression
Table 3 reports the baseline estimates. Without control variables, the DID coefficient is −0.015 and significant at the 10% level; after adding provincial controls, it is −0.022 and significant at the 5% level. This indicates that provinces with higher exposure to the CMM reduction policy experienced larger declines in standardized CMM emissions after implementation. Since the dependent variable is normalized using the min–max method, the coefficient represents changes in the standardized scale rather than percentage reductions in emissions. Given the limited number of provincial clusters (30 provinces), we further conducted a wild cluster bootstrap-t test with 9999 replications. The bootstrap p-value is 0.032, and the 95% confidence interval remains below zero [−0.042, −0.002], confirming the robustness of the baseline results. These findings support H1.
Table 3.
Baseline regression results.
4.1.3. Parallel Trend Test
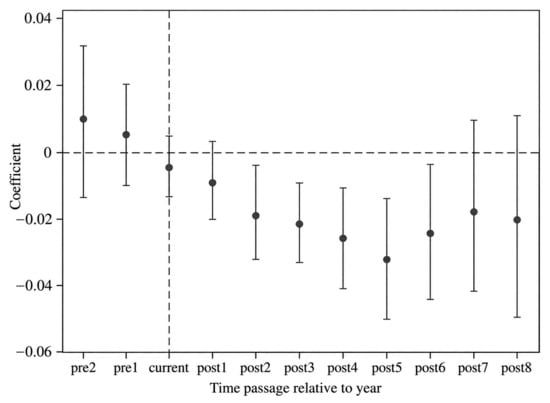
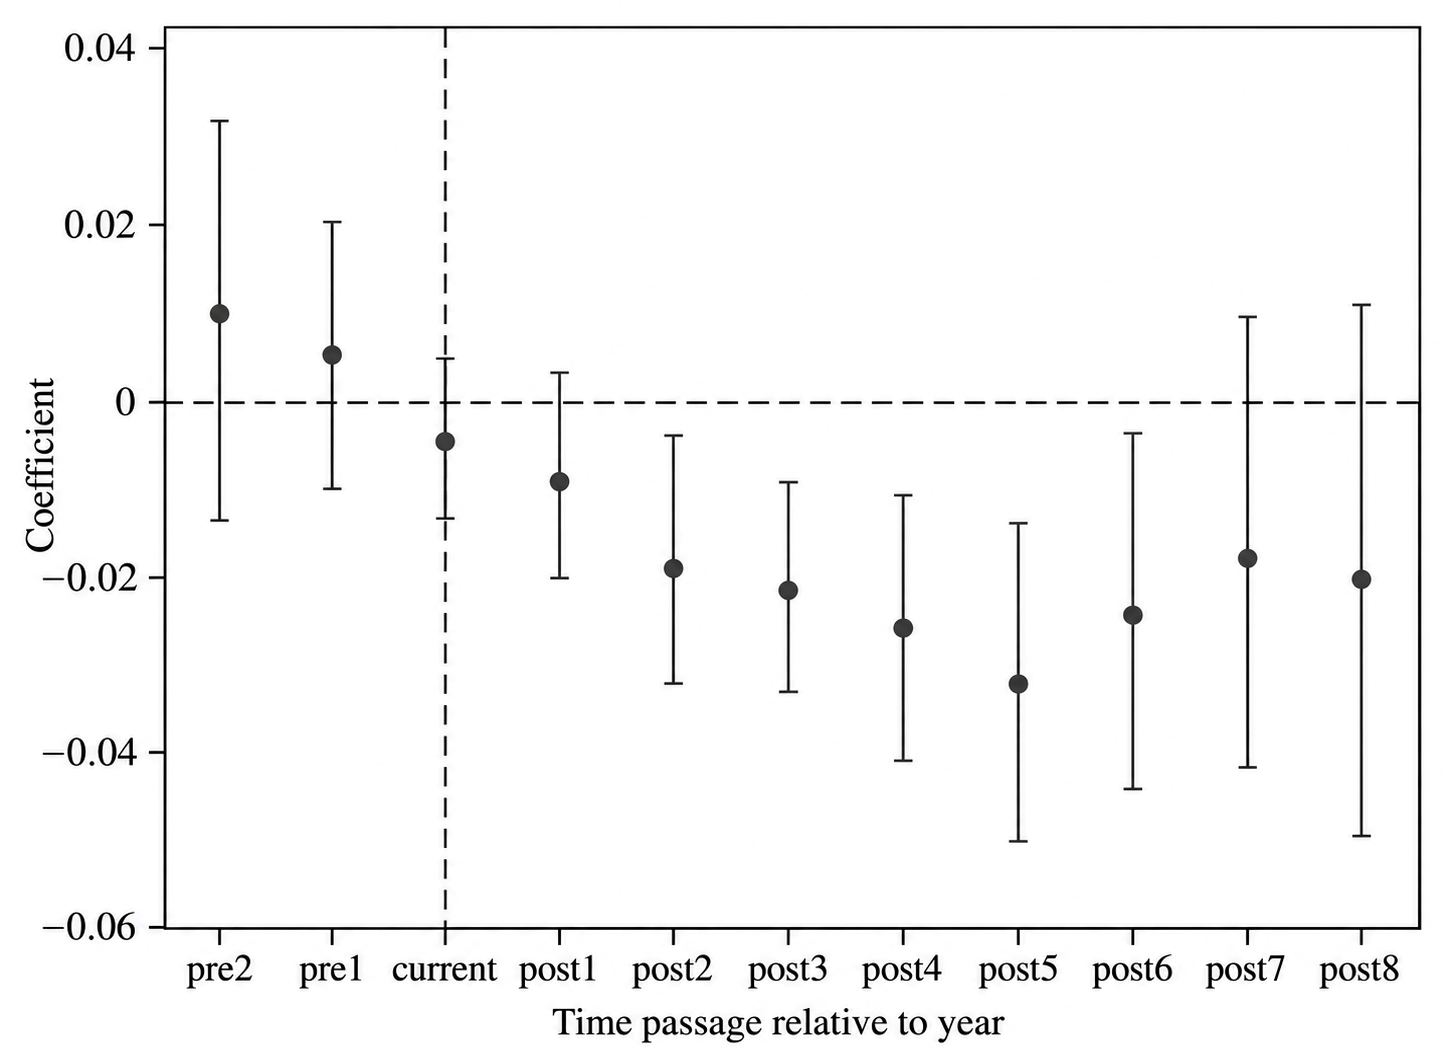
The validity of the DID approach relies on the assumption that higher- and lower-exposure provinces would have followed similar trends in the absence of the policy. To examine this assumption, this study adopts an event-study specification following Li et al. [29]. Because the CMM reduction policy was introduced at the end of 2013 and 2014 is defined as the first full year of implementation, pre1 and pre2 represent one and two years before policy implementation, respectively, while post1–post8 capture the dynamic effects from one to eight years after implementation. Figure 2 presents the estimated dynamic coefficients. The coefficients for the pre-treatment periods are statistically indistinguishable from zero, suggesting that there is no evidence of systematic differences between higher- and lower-exposure groups before policy implementation. This result is further supported by the joint significance test of the pre-treatment coefficients, which fails to reject the null hypothesis that they are jointly equal to zero (F(2, 29) = 0.29, p = 0.750).
Figure 2.
Parallel trend test.
After policy implementation, the estimated coefficients gradually become negative. Although the effects in the first two years are not statistically significant, the magnitude of the coefficients increases over time, with the strongest reduction effect observed around the fifth year after implementation. The coefficients remain negative thereafter but become statistically insignificant in later periods. These findings suggest that the CMM reduction policy exhibits a delayed and time-varying emission-reduction effect, which is consistent with the gradual nature of methane capture infrastructure development and technology adoption.
4.2. Robustness Tests
4.2.1. Placebo Test
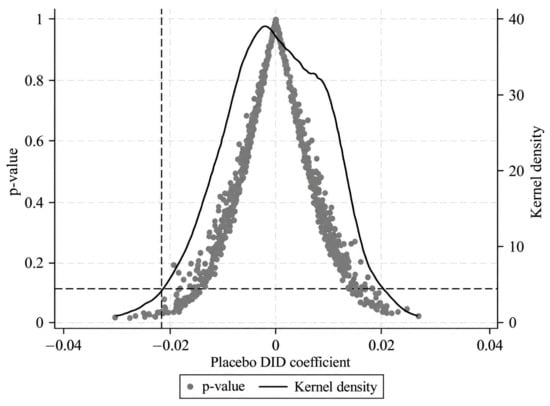
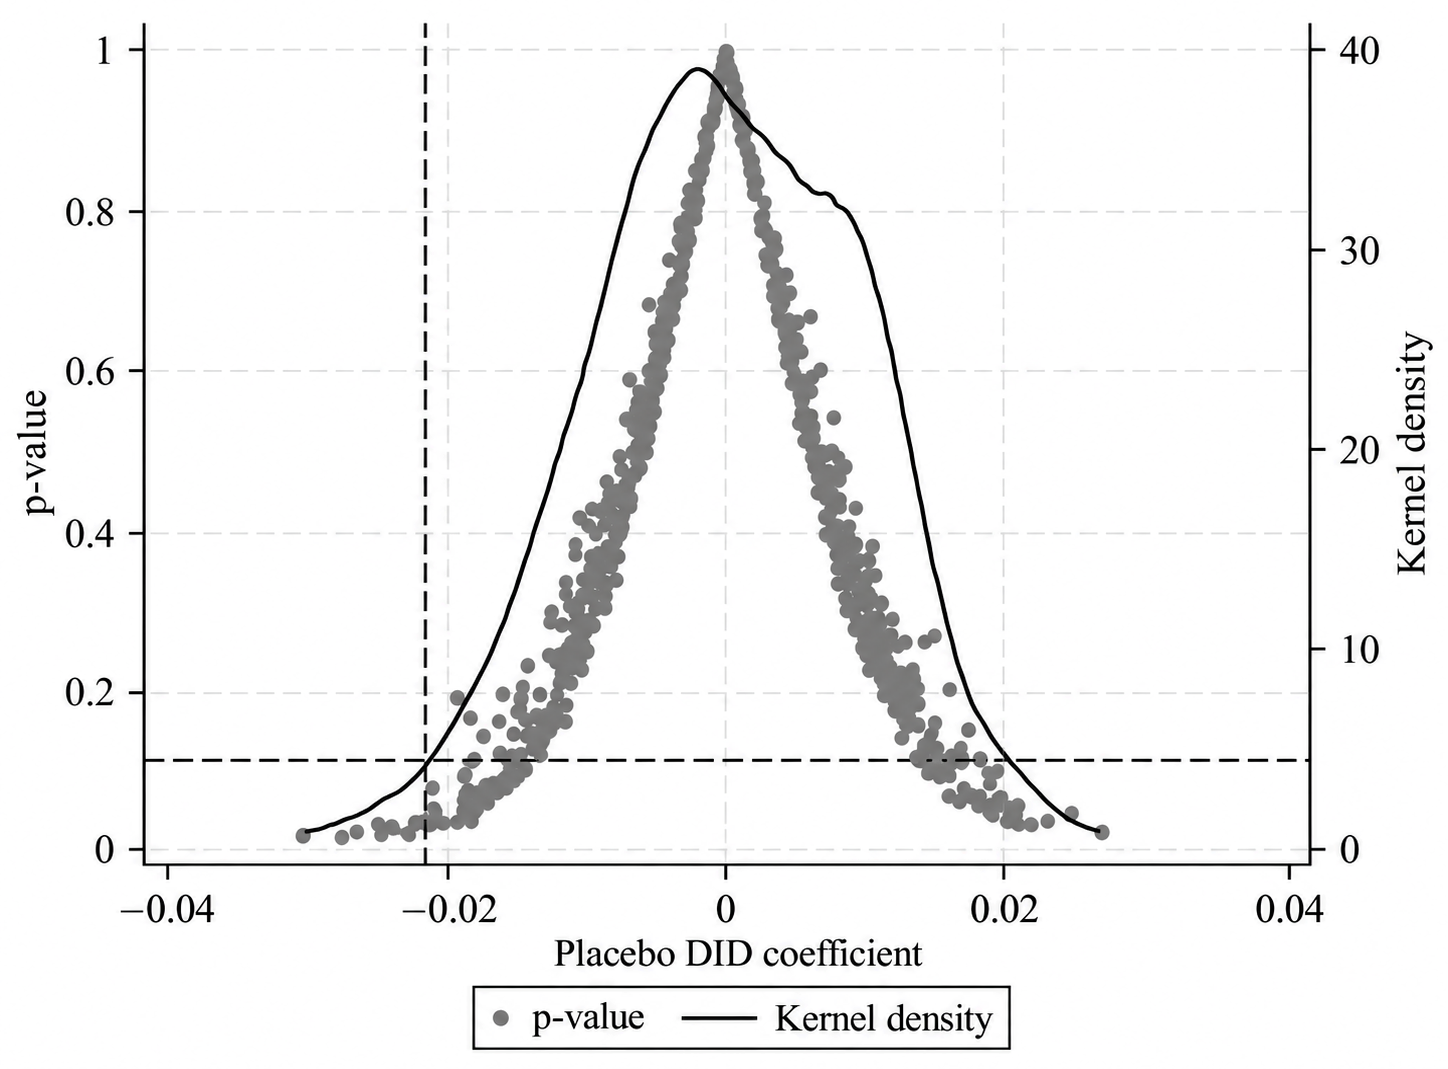
To examine whether the estimated effect is driven by random assignment or unobserved factors, this study conducts a placebo test following Li et al. [30]. Since 2014 is the first full year of policy implementation, the actual policy timing is retained, while treatment status is randomly reassigned across provinces with the same number of treated provinces as in the baseline model. The simulated DID coefficients are obtained from 1000 repetitions, and the distributions of placebo estimates and p-values are presented in Figure 3. The placebo coefficients are concentrated around zero, while the baseline estimate (−0.022) lies in the tail of the distribution. These results indicate that the estimated policy effect is unlikely to be driven by random assignment and further support the robustness of the baseline findings.
Figure 3.
Placebo test.
4.2.2. Leave-One-Province-Out Analysis
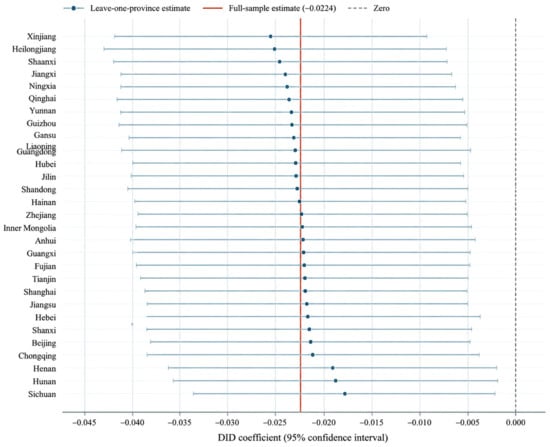
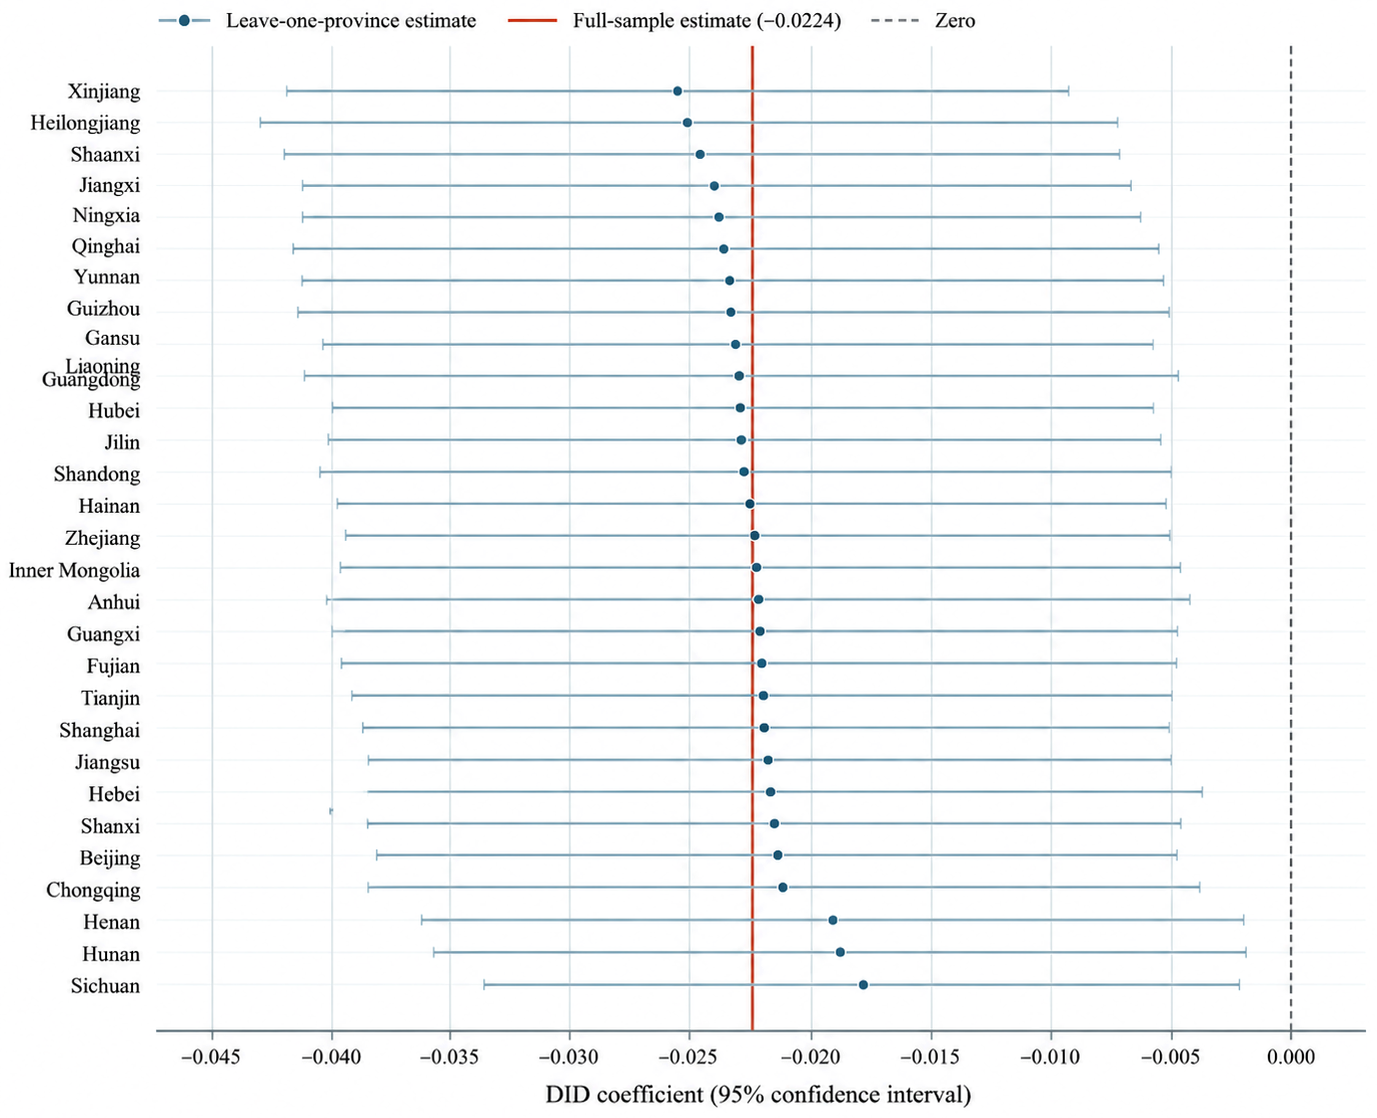
To assess sensitivity to individual provinces, the baseline model is re-estimated 30 times, excluding one province in each iteration and retaining the same variables and fixed effects.
Figure 4 shows that the DID coefficients range from −0.026 to −0.018, with p-values from 0.003 to 0.033; none of the 95% confidence intervals includes zero. The estimates remain close to the full-sample coefficient of −0.022, including when Xinjiang, Inner Mongolia, Shaanxi, or Shanxi is excluded. The estimated effect is therefore not driven by any single province.
Figure 4.
Leave-one-province-out analysis.
4.2.3. Excluding Potential Policy Confounders
Table 4 reports the robustness checks in Section 4.2.3, Section 4.2.4 and Section 4.2.5. To address potential confounding from the low-carbon city pilot policy, the model is re-estimated after excluding provinces and provincial-level municipalities covered by the three pilot batches launched in 2010, 2012, and 2016. The DID coefficient remains statistically significant.
Table 4.
Robustness tests I.
To limit the influence of subsequent environmental and energy policy changes, the model is re-estimated by restricting the sample to 2011–2017; observations from 2018 onward are excluded. The DID coefficient remains negative and statistically significant.
4.2.4. Alternative Measurement of the Explanatory Variable
Following Aretz et al. [31], an alternative grouping assigns the top third of provinces by 2013 coal mining investment intensity to the treatment group and the bottom third to the comparison group. The DID coefficient remains statistically significant.
The continuous DID specification interacts the logarithm of provincial coal mining industry investment in 2013 with the post-policy indicator, which equals 1 from 2014, the first full year of policy implementation. This specification retains variation in exposure lost through the median split. Its coefficient is negative and statistically significant at the 5% level.
4.2.5. Alternative Measurement of the Dependent Variable
The alternative dependent variable is coal-output-based CMM emission intensity (CMM/Coal), calculated as CMM emissions divided by raw coal production. Its logarithm, ln(CMM/Coal), is used to reduce the influence of extreme values.
The DID coefficient remains negative and statistically significant at the 10% level, indicating an association between the CMM reduction policy and lower coal-output-based CMM emission intensity.
4.2.6. Controlling for Additional Factors
Table 5 reports the robustness checks in Section 4.2.6, Section 4.2.7 and Section 4.2.8. The model additionally controls for ln(Coal production), measured as the natural logarithm of raw coal production; Energy structure, measured as the coal share of total energy consumption; and Environmental Expenditure, measured as environmental protection expenditure as a share of fiscal expenditure. The DID coefficient is −0.029 and statistically significant at the 1% level.
Table 5.
Robustness tests II.
4.2.7. Lagged-Variable Specifications
The core explanatory variable and control variables are lagged by one and two periods in separate specifications. Both lagged specifications retain negative and statistically significant coefficients.
4.2.8. Excluding Certain Years
To limit the influence of the COVID-19 pandemic and policies associated with China’s 2020 announcement of carbon peaking and carbon neutrality goals, this study excluded observations from 2020 onward. The DID coefficient remains negative and statistically significant.
5. Mechanism Tests
To explore potential channels, two regression specifications examine the association of the policy with each mechanism variable and the association of that variable with CMM emissions conditional on policy exposure:
In Equations (2) and (3), Mediator denotes a potential mechanism variable. The coefficient β1 captures its association with the CMM reduction policy, while γ2 captures its association with CMM emissions conditional on policy exposure. Public environmental attention (LNSC) is measured by the logarithm of the Baidu search index for “environmental pollution”, following Guo et al. [32]. This proxy measures general environmental attention and does not directly measure CMM-specific awareness. Industrial structure upgrading (ISU) is a weighted index of the output shares of the primary, secondary, and tertiary industries, with weights of one, two, and three, respectively, following Chen and Zhao [33]. Higher values indicate a more advanced industrial structure.
Table 6 reports the mechanism results. The DID coefficient for public environmental attention is 0.049 and significant at the 5% level. When CMM emissions are the outcome, the LNSC coefficient is −0.111 and significant at the 5% level, while the DID coefficient remains negative and statistically significant. These associations are consistent with public environmental attention as a potential channel.
Table 6.
Mechanism tests.
For industrial structure upgrading, the DID coefficient is 0.093 and significant at the 5% level. The ISU coefficient in the CMM equation is −0.079 and significant at the 1% level, while the DID coefficient remains negative. These results are consistent with industrial structure upgrading as another potential channel.
6. Further Analysis
6.1. Broader Implications of the CMM Reduction Policy
Total factor productivity (TFP) captures provincial production efficiency. Following Wei et al. [34], TFP is estimated by ordinary least squares using a Cobb–Douglas production function, with real provincial GDP as output and capital stock and employment as inputs. Capital stock is constructed using the perpetual inventory method with an annual depreciation rate of 9.6%. Nominal GDP and investment are converted into constant prices using corresponding price indices. The unexplained component of output is used as the TFP measure. GDP-based CMM emission intensity (CMM/GDP) is calculated as CMM emissions divided by provincial GDP, measuring methane emissions per unit of economic output. Table 7 reports a DID coefficient of 0.040 for TFP, significant at the 5% level, and −0.044 for GDP-based CMM emission intensity, significant at the 1% level. Higher-exposure provinces thus experienced relative increases in productivity and decreases in methane emissions per unit of GDP after policy implementation.
Table 7.
Broader outcome analysis.
6.2. Heterogeneity Analysis
Table 8 reports heterogeneity across coal resource-based and non-resource-based regions and across provinces with different GDP levels.
Table 8.
Heterogeneity analysis.
First, the sample is divided according to whether provinces are classified as coal resource-based regions. The DID coefficient is −0.026 and statistically significant at the 5% level in non-resource-based regions and −0.064, significant at the 10% level, in coal resource-based regions. The bootstrap test confirms that the difference between the two groups is statistically significant (p = 0.007). These results indicate that the emission-reduction effect of the CMM reduction policy is more pronounced in coal resource-based regions. One possible explanation is that these regions generally have larger coal production scales and higher methane emission pressures, providing greater potential and stronger incentives for methane mitigation after policy implementation. In addition, the concentration of coal-related industries may facilitate the implementation of targeted methane extraction and utilization measures.
Second, the sample is divided into high- and low-GDP groups according to the median value of provincial GDP. The DID coefficient is −0.005 in provinces with lower GDP levels and −0.048 in provinces with higher GDP levels, with only the latter statistically significant at the 1% level. The bootstrap test indicates that the difference between the two groups is statistically significant (p = 0.001). This finding suggests that the CMM reduction policy has stronger effects in provinces with higher GDP levels. A possible explanation is that these provinces may have greater financial capacity, technological resources, and administrative capabilities to support methane monitoring, extraction, and utilization activities, thereby improving policy implementation effectiveness.
7. Discussion
This study provides provincial-level evidence that China’s CMM reduction policy is associated with lower CMM emissions, extending previous research that has mainly relied on atmospheric observations, emission inventories, and scenario-based assessments. Although Miller et al. [18] found that China’s coal mine methane regulations had not reversed the increasing trend in aggregate emissions, this finding does not necessarily conflict with our results. Aggregate methane emissions are jointly determined by coal production scale, mining conditions, mine closures, emission factors, and methane utilization, whereas the DID approach identifies relative changes between provinces with different levels of policy exposure. Therefore, aggregate emissions may continue to increase even if higher-exposure provinces experience larger relative reductions after policy implementation. The dynamic analysis further shows that the policy effect emerges gradually rather than immediately, which is consistent with the implementation process of CMM mitigation measures. Financial support and policy incentives require time to be translated into investments, while methane extraction facilities, utilization projects, and related technologies need gradual development and diffusion [2,21]. The leave-one-province-out analysis also confirms that the estimated effect is not driven by any single major coal-producing province.
The potential channels extend the literature’s emphasis on technical mitigation by suggesting roles for environmental attention and industrial structure upgrading. Public attention may increase external monitoring pressure, while structural shifts may reduce dependence on emission-intensive activities. The Baidu measure captures general environmental concern, so the findings cannot establish increased CMM-specific awareness or a causal mediation pathway.
The association with higher TFP may reflect technological improvement and resource reallocation. Because productivity also responds to other economic and institutional factors, this result should be interpreted as an outcome associated with the policy rather than a direct productivity effect of methane reduction. The decline in GDP-based CMM emission intensity complements the emissions-level results by indicating lower methane emissions per unit of economic output.
Stronger effects in coal resource-based regions may reflect greater mitigation potential and concentrated coal-related infrastructure. Provinces with higher GDP levels may have more financial and technological resources for implementation, although the GDP grouping does not directly test these explanations. Other coal-dependent economies may require complementary technological and institutional support, with transferability depending on their regulatory and energy contexts.
8. Conclusions and Policy Implications
8.1. Research Conclusions
Using provincial panel data for 2011–2022 and a DID approach, this study finds that the CMM reduction policy is associated with lower CMM emissions. The results remain robust across the alternative specifications considered.
Public environmental attention and industrial structure upgrading emerge as potential channels. The policy is also associated with higher TFP and lower GDP-based CMM emission intensity, with stronger emission reductions in coal resource-based regions and provinces with higher GDP levels.
8.2. Policy Implications
- Sustained implementation of the CMM reduction policy should be supported by continued financing for methane extraction, utilization, and emission control. The gradual emergence of estimated effects underscores the time required for infrastructure development and technology adoption.
- Environmental information disclosure and support for industrial upgrading can complement technical mitigation measures. Public communication should provide accessible information on methane emissions, while industrial policy should support cleaner production in coal-dependent regions.
- Methane extraction and utilization can be integrated with technological upgrading and more efficient production practices. The observed associations with productivity and GDP-based CMM emission intensity support considering environmental and economic objectives jointly.
- Implementation support should account for coal resource endowments and provincial GDP levels. Coal resource-based regions warrant continued support for methane capture, utilization technologies, and infrastructure. Provinces with lower GDP levels may require additional financing and technology support, tailored to their actual implementation constraints.
8.3. Research Limitations and Prospects
First, because the CMM reduction policy was implemented at the national level, this study identifies its effects by exploiting cross-provincial differences in policy exposure. Future studies could complement this approach with more detailed policy implementation or project-level information. Second, the provincial-level data used in this study may not fully reflect heterogeneity across individual coal mines in geological conditions, extraction technologies, and methane-utilization capacity. The use of mine-level administrative records or remote-sensing data could provide more granular evidence on policy effectiveness and its underlying channels. Finally, extending the sample period beyond 2022 would help assess the persistence of the policy effects and the longer-term interaction between CMM policies and other climate-related policies.
Author Contributions
Conceptualization, R.W.; methodology, R.W.; software, R.W.; formal analysis, Y.W.; resources, X.Z.; data curation, M.C.; writing—original draft preparation, R.W. and Y.W.; writing—review and editing, M.C. and X.Z.; supervision, X.Z. All authors have read and agreed to the published version of the manuscript.
Funding
This study was supported by the Fundamental Research Funds for the Central Universities (Ph.D. Top Innovative Talents Fund of CUMTB) (Grant No. BBJ2025099), the Social Science Project of China University of Mining and Technology (Grant No. 2024170017), Provincial Natural Science Foundation of Anhui (Grant No. 2308085MG232), the Project for Cultivating Outstanding Top-notch Talents in Universities of Anhui (Grant No. gxyqZD2022042), the Anhui Province Excellent Young Talents Fund Program of Higher Education Institutions (Grant No. 2022AH030071).
Data Availability Statement
The data used in this study are available from the corresponding author upon reasonable request.
Conflicts of Interest
The authors declare no conflicts of interest.
References
- Fletcher, S.E.M.; Schaefer, H. Rising methane: A new climate challenge. Science 2019, 364, 932–933. [Google Scholar] [CrossRef] [Scilit]
- Karacan, C.Ö.; Field, R.A.; Olczak, M.; Kasprzak, M.; Ruiz, F.A.; Schwietzke, S. Mitigating climate change by abating coal mine methane: A critical review of status and opportunities. Int. J. Coal Geol. 2024, 295, 104623. [Google Scholar] [CrossRef] [Scilit]
- Chauhan, A.; Raval, S. Satellite-derived approaches for coal mine methane estimation: A review. Remote Sens. 2025, 17, 3652. [Google Scholar] [CrossRef] [Scilit]
- Global Methane Pledge. Available online: https://www.globalmethanepledge.org/resources/global-methane-pledge (accessed on 1 October 2026).
- International Energy Agency. Global Methane Pledge Energy Pathway. Available online: https://www.iea.org/policies/15806-global-methane-pledge-energy-pathway (accessed on 1 October 2026).
- Cheng, X.; Wu, X.; Guan, C.; Sun, X.; Zhang, B. Impacts of production structure changes on global CH4 emissions: Evidences from income-based accounting and decomposition analysis. Ecol. Econ. 2023, 213, 107967. [Google Scholar] [CrossRef] [Scilit]
- Energy Institute. Statistical Review of World Energy 2026; Energy Institute: London, UK, 2026; Available online: https://www.energyinst.org/statistical-review (accessed on 1 October 2026).
- European Commission, Joint Research Centre (JRC). EDGAR Community GHG Database, Version 8.0 [Dataset], 2023. Available online: https://edgar.jrc.ec.europa.eu/dataset_ghg80 (accessed on 1 October 2026).
- Liu, G.; Peng, S.; Lin, X.; Ciais, P.; Li, X.; Xi, Y.; Lu, Z.; Chang, J.; Saunois, M.; Wu, Y.; et al. Recent slowdown of anthropogenic methane emissions in China driven by stabilized coal production. Environ. Sci. Technol. Lett. 2021, 8, 739–746. [Google Scholar] [CrossRef] [Scilit]
- Sheng, J.; Tunnicliffe, R.; Ganesan, A.L.; Maasakkers, J.D.; Shen, L.; Prinn, R.G.; Song, S.; Zhang, Y.; Scarpelli, T.; Bloom, A.A.; et al. Sustained methane emissions from China after 2012 despite declining coal production and rice-cultivated area. Environ. Res. Lett. 2021, 16, 104018. [Google Scholar] [CrossRef] [Scilit]
- Chen, D.; Chen, A.; Hu, X.; Li, B.; Li, X.; Guo, L.; Feng, R.; Yang, Y.; Fang, X. Substantial methane emissions from abandoned coal mines in China. Environ. Res. 2022, 214, 113944. [Google Scholar] [CrossRef] [Scilit]
- Qin, K.; Hu, W.; He, Q.; Lu, F.; Cohen, J.B. Individual coal mine methane emissions constrained by eddy covariance measurements: Low bias and missing sources. Atmos. Chem. Phys. 2024, 24, 3009–3028. [Google Scholar] [CrossRef] [Scilit]
- Zhang, J.; Qiu, B.; Khanna, N.; Lin, J. Regional production shift and increased utilization dampen the growth of China’s coal mine methane emissions. Commun. Earth Environ. 2025, 6, 964. [Google Scholar] [CrossRef] [Scilit]
- Liu, Q.; Teng, F.; Nielsen, C.P.; Zhang, Y.; Wu, L. Large methane mitigation potential through prioritized closure of gas-rich coal mines. Nat. Clim. Change 2024, 14, 652–658. [Google Scholar] [CrossRef] [Scilit]
- Yao, L.; Qian, W.; Jiang, H. Spatial-temporal distribution and multiple driving mechanisms of energy-related CH4 emissions in China. Environ. Impact Assess. Rev. 2024, 106, 107463. [Google Scholar] [CrossRef] [Scilit]
- Roth, J.; Sant’Anna, P.H.; Bilinski, A.; Poe, J. What’s trending in difference-in-differences? A synthesis of the recent econometrics’ literature. J. Econom. 2023, 235, 2218–2244. [Google Scholar] [CrossRef] [Scilit]
- Khanna, N.; Lin, J.; Liu, X.; Wang, W. An assessment of China’s methane mitigation potential and costs and uncertainties through 2060. Nat. Commun. 2024, 15, 9694. [Google Scholar] [CrossRef] [Scilit]
- Miller, S.M.; Michalak, A.M.; Detmers, R.G.; Hasekamp, O.P.; Bruhwiler, L.M.; Schwietzke, S. China’s coal mine methane regulations have not curbed growing emissions. Nat. Commun. 2019, 10, 303. [Google Scholar] [CrossRef] [Scilit]
- Kang, Y.; Tian, P.; Li, J.; Wang, H.; Feng, K. Methane mitigation potentials and related costs of China’s coal mines. Fundam. Res. 2024, 4, 1688–1695. [Google Scholar] [CrossRef] [Scilit]
- Wang, K.; Zhang, J.; Cai, B.; Yu, S. Emission factors of fugitive methane from underground coal mines in China: Estimation and uncertainty. Appl. Energy 2019, 250, 273–282. [Google Scholar] [CrossRef] [Scilit]
- Fan, L.; Xu, J. Authority-enterprise equilibrium based mixed subsidy mechanism for carbon reduction and energy utilization in the coalbed methane industry. Energy Policy 2020, 147, 111828. [Google Scholar] [CrossRef] [Scilit]
- Sun, Y.; Wang, L.; Su, S.; Rostami, J.; Zhang, K.; Si, G. Coal mine methane mitigation in China toward carbon neutrality: Characteristics, potential, and driving mechanisms. Environ. Impact Assess. Rev. 2026, 120, 108508. [Google Scholar] [CrossRef] [Scilit]
- Wang, R.; Wang, Y.; Cao, M.; Gu, X. Thematic Evolution and Policy Design Consistency in China’s Coal Mine Methane Policy: Evidence from LDA and PMC Analysis. Sustainability 2026, 18, 9977. [Google Scholar] [CrossRef] [Scilit]
- Gao, J.; Guan, C.; Zhang, B.; Li, K. Decreasing methane emissions from China’s coal mining with rebounded coal production. Environ. Res. Lett. 2021, 16, 124037. [Google Scholar] [CrossRef] [Scilit]
- Chen, D.; Ma, M.; Hu, L.; Du, Q.; Li, B.; Yang, Y.; Guo, L.; Cai, Z.; Ji, M.; Zhu, R.; et al. Characteristics of China’s coal mine methane emission sources at national and provincial levels. Environ. Res. 2024, 259, 119549. [Google Scholar] [CrossRef] [Scilit]
- Vig, V. Access to collateral and corporate debt structure: Evidence from a natural experiment. J. Finance 2013, 68, 881–928. [Google Scholar] [CrossRef] [Scilit]
- Campello, M.; Larrain, M. Enlarging the contracting space: Collateral menus, access to credit, and economic activity. Rev. Financ. Stud. 2016, 29, 349–383. [Google Scholar] [CrossRef] [Scilit]
- Huang, Q.; Lin, S.; Guo, Y. Can energy transition improve the quality of life for the population? Empirical analysis of 30 provinces in China. Energy 2024, 313, 133938. [Google Scholar] [CrossRef] [Scilit]
- Li, X.; Xu, Y.; Tan, H.; Lei, Y. Low-carbon city pilot policies and urban carbon productivity improvement: An empirical analysis from the perspective of green competitiveness. Environ. Sustain. Indic. 2024, 24, 100531. [Google Scholar] [CrossRef] [Scilit]
- Li, P.; Lu, Y.; Wang, J. Does flattening government improve economic performance? Evidence from China. J. Dev. Econ. 2016, 123, 18–37. [Google Scholar] [CrossRef] [Scilit]
- Aretz, K.; Campello, M.; Marchica, M.T. Access to collateral and the democratization of credit: France’s reform of the Napoleonic Security Code. J. Finance 2020, 75, 45–90. [Google Scholar] [CrossRef] [Scilit]
- Guo, M.; Kuai, Y.; Liu, X. Stock market response to environmental policies: Evidence from heavily polluting firms in China. Econ. Model. 2020, 86, 306–316. [Google Scholar] [CrossRef] [Scilit]
- Chen, Y.; Zhao, L. Exploring the relation between the industrial structure and the eco-environment based on an integrated approach: A case study of Beijing, China. Ecol. Indic. 2019, 103, 83–93. [Google Scholar] [CrossRef] [Scilit]
- Wei, Y.; Du, M.; Huang, Z. The effects of energy quota trading on total factor productivity and economic potential in industrial sector: Evidence from China. J. Clean. Prod. 2024, 445, 141227. [Google Scholar] [CrossRef] [Scilit]

Disclaimer/Publisher’s Note: The statements, opinions and data contained in all publications are solely those of the individual author(s) and contributor(s) and not of MDPI and/or the editor(s). MDPI and/or the editor(s) disclaim responsibility for any injury to people or property resulting from any ideas, methods, instructions or products referred to in the content. |
© 2026 by the authors. Licensee MDPI, Basel, Switzerland. This article is an open access article distributed under the terms and conditions of the Creative Commons Attribution (CC BY) license.