


Abstract
Online partial discharge monitoring is increasingly complementing periodic offline testing in medium-voltage switchgear, particularly through the use of embedded and edge-computing platforms. This review critically examines systems based on artificial intelligence and machine learning for partial discharge detection and classification, considering the complete diagnostic chain from sensing to field deployment. The analyzed literature is organized into five interdependent layers: sensors and analog front-ends, data acquisition and triggering architectures, phase-synchronized signal representations, machine learning models, and target embedded hardware. Sensing techniques based on high-frequency current transformers, transient earth voltage, and ultra-high-frequency sensors are compared in terms of bandwidth, sensitivity, installation requirements, and immunity to interference. Particular attention is given to phase-resolved partial discharge patterns, time–frequency representations, event-driven acquisition, hardware-assisted data reduction, and synchronization mechanisms. The analysis demonstrates that high classification accuracy obtained under offline laboratory conditions does not, by itself, indicate deployment readiness. Practical implementations must also satisfy constraints related to analog-to-digital converter bandwidth, buffering, memory usage, inference latency, energy consumption, quantization, thermal performance, and field noise. Lightweight neural networks, optimized object detectors, input dimensionality reduction, quantized inference, and multimodal data fusion are identified as promising development directions. However, current research remains limited by laboratory-scale validation, incomplete hardware reporting, and insufficient long-term field datasets.
1. Introduction
Partial discharge (PD) diagnostics is one of the key issues related to the degradation of insulation systems in power equipment. In accordance with IEC 60270, partial discharges can be described as localized electrical discharges that only partially bridge the insulation between conductors and do not result in a complete breakdown of the insulation system [1,2,3].
PD activity is already present at the early stages of insulation degradation. Prolonged exposure to PD pulses causes local thermal, mechanical, and chemical stresses, accelerating insulation aging and increasing the risk of equipment failure [4,5,6]. In the literature, this phenomenon is also described using mathematical models that enable the simulation of such current pulses under laboratory conditions [7]. The considered pulse models are described by Equations (1)–(3), and the corresponding simulated waveforms are shown in Figure 1.
where , , and are the signal amplitudes; , , and are the attenuation coefficients; while and are the oscillation center frequencies.
In measurement practice, one of the basic quantitative parameters used to describe PD activity is the apparent charge q, usually expressed in picocoulombs (pC). This quantity is related to the current pulse recorded in the measurement path and, for a resistive conversion stage, can be expressed as shown in Equation (4) [8]:
where is the measured current pulse, is the voltage measured across the resistance R, and and define the integration interval containing the discharge pulse.
Energy- and power-related measures are also reported in the literature, including cumulative energy functions or discharge power derived from pulse sequences. Their interpretation, however, depends on the adopted measurement path and signal representation [9].
In medium-voltage (MV) switchgear, early PD detection is particularly important because such equipment operates continuously, and failures may cause costly outages as well as risks to industrial infrastructure [5,8,10]. Conventional measurement methods, including offline tests based on IEC 60270, remain an important reference for assessing PD activity, but they are limited in operational applications [3,10]. They require planned disconnection of the tested object, which entails significant operating costs [10]. For this reason, increasing attention is being paid to online monitoring systems using non-invasive sensors, such as ultra-high-frequency (UHF) sensors, high-frequency current transformers (HFCTs), and transient earth voltage (TEV) sensors, which enable PD signal acquisition without interrupting equipment operation [5,8,10].
The development of machine learning (ML), including deep learning (DL), has enabled automatic detection, classification, and pattern recognition of PD activity based on time-domain waveforms, signal features, phase-resolved partial discharge (PRPD) images, or time–frequency representations [4,5,11]. However, implementing these methods in embedded and edge systems is far more challenging than offline classification on laboratory data [5,12]. PD signals are short-duration, broadband, often impulsive, and strongly dependent on the measurement path and object geometry [10,13]. The literature indicates that they may cover a very wide frequency range, while their reliable acquisition requires a properly selected sensor, analog front-end (AFE), filtering, an analog-to-digital converter (ADC), phase synchronization, and buffering [5,10,13,14]. Thus, an ML model does not operate independently of the measurement hardware, but forms only one part of the diagnostic chain [12,15]. Classification performance therefore depends not only on the model architecture, but also on acquisition quality, data representation, and the robustness of the whole system to interference [4,7,11,15].
A particular challenge is transferring classification algorithms to edge devices, including microcontrollers, field-programmable gate arrays (FPGAs), and artificial intelligence (AI) accelerators. These platforms enable local data processing and reduce the amount of data transmitted to supervisory systems, but they also impose constraints on memory, computing power, energy consumption, and inference latency [12,13]. Complex deep learning models that achieve high classification scores under laboratory conditions cannot always be directly deployed in an embedded monitoring system installed near MV switchgear [4,16]. Therefore, solutions intended for PD diagnostics should be evaluated not only in terms of classification accuracy, but also with respect to computational cost, memory requirements, inference time, phase synchronization, noise immunity, and the degree of validation in a real industrial environment.
This article reviews the literature on embedded systems for PD detection and classification, with particular emphasis on MV switchgear. It addresses which sensors and acquisition paths are most often used as inputs to classification systems, which data representations offer the best compromise between diagnostic information and computational cost, which ML and DL model classes can be executed locally, and which gaps still hinder the transfer of laboratory results to real MV switchgear. The contribution of this work is a system-level analysis of the complete diagnostic chain: from the sensor and analog front-end, through acquisition and data representation, to the classification model and embedded platform. This perspective makes it possible to distinguish solutions that achieve high offline performance from concepts that genuinely bring PD diagnostics closer to practical online monitoring.
2. Scope and System-Level Analytical Framework
This review provides a structured narrative synthesis of the literature on embedded systems for partial discharge detection, classification, and pattern recognition. Particular emphasis is placed on the relationships among the sensor, acquisition path, data representation, machine learning method, and target processing platform, as illustrated in Figure 2.
Figure 2.
System-level analytical framework used to organize and compare the reviewed literature.
Literature searches were conducted during April–June 2026 and targeted publications from 2020 onwards, up to the search dates, to emphasize recent developments in PD monitoring and embedded intelligence. Scopus AI was used for exploratory literature discovery and thematic mapping through natural-language queries. The query topics are summarized in Table 1.
Table 1.
Thematic summary of the exploratory Scopus AI queries. The descriptions summarize their scope and emphasis.
Scopus AI returned 1055 records. After removing 208 duplicate records, 847 unique candidates remained. Results were examined sequentially in the order presented by the tool. Selection was guided by an approximate target of 20–30 relevant publications per thematic group, used as a practical guide to coverage rather than a fixed inclusion threshold. Further examination was discontinued when subsequent results were judged increasingly distant from the target topic. This procedure led to initial screening based on a brief review of contents and abstract analysis of 152 publications attributed to the Scopus AI discovery route; the remaining 695 records were not selected for assessment through that route.
Publications identified through Scopus AI were used as seed papers in thematic collections in ResearchRabbit. Related publications recommended through citation and similarity networks were examined for their relevance to the corresponding topics. This supplementary process contributed 22 publications to the assessed set. Publications encountered through both tools were counted once, giving a combined set of 174 assessed publications.
Relevance was assessed against the thematic groups summarized in Table 1. Publications were assigned to four categories: A—core publications for direct discussion; B—publications supporting comparisons or specific technical arguments; C—supporting references providing context; and D—publications outside the thematic or publication-date scope. Reasons for exclusion included absent or insufficient relevance to the review topics, such as PD monitoring and diagnostics of electrical power equipment, and publication before 2020. The categories describe thematic relevance and intended use rather than methodological quality. A total of 55 publications were assigned to category D, leaving a working set of 119 publications. Four further publications were omitted during manuscript preparation and revision, resulting in 115 publications used in the final synthesis. One foundational IEC standard was cited separately as technical background, bringing the bibliography to 116 references. Figure 3 summarizes the selection process.
Figure 3.
Literature identification and selection process used in the structured narrative review. The ResearchRabbit count denotes additional assessed publications. One foundational IEC standard was cited separately as technical background and is not included in the publication counts.
The tools supported literature discovery, whereas the relevance and technical interpretation of the selected studies were determined from the original publications. Because only part of the candidate pool was assessed, selection depended on the order of the displayed results and author judgement. Relevant publications appearing later in the results or outside the explored citation networks may therefore have been missed. The review provides a selective narrative synthesis without claiming exhaustive coverage or identical results from repeated AI-assisted queries.
This review focuses on MV switchgear. Studies on high-voltage GIS, cables, transformers, and laboratory models provide supporting methodological evidence. Their transferability depends on sensing, acquisition, operating conditions, and hardware constraints. These findings are distinguished from direct validation in MV switchgear.
For the assessment of deployability, particular attention is given to studies that characterize the sensors or PD data, address detection, classification, localization, or pattern recognition, and describe at least part of the measurement path, data representation, or analytical model. Broader embedded-computing studies may support the discussion of hardware constraints and optimization methods.
The central analytical premise is that diagnostic performance must be assessed across the complete measurement and processing chain. Studies are therefore examined by sensor and analog front-end, acquisition and triggering architecture, buffering and preprocessing, phase synchronization, data representation, analytical method, and target platform.
The framework supports a qualitative discussion of the relationships between signal processing, classification methods, and embedded hardware. It highlights implementation constraints, limitations of reported validation, and metrics recommended for future studies.
3. Partial Discharge Signals and Data Representations
In embedded systems for PD classification, the choice of input data representation is at least as important as the selection of the machine learning model. The same signal may be analyzed as a raw time-domain waveform, a set of hand-crafted features, a PRPD map or a more complex two-dimensional (2D) time–frequency representation.
3.1. Raw Pulse- and Feature-Based Representations
Direct sampling of raw PD pulses can impose demanding requirements on ADCs. For example, laboratory studies of UHF-based GIS diagnosis reported oscilloscope sampling rates of 10–20 gigasamples per second (GS/s) [17,18]. These values describe the acquisition setups used in those studies rather than a general sampling requirement for MV switchgear monitoring. Recording full waveforms quickly produces very large data volumes, leading to memory and transmission bottlenecks when data are sent to the cloud or a supervisory unit [18]. One-dimensional convolutional neural networks offer a way to classify raw pulses directly on edge devices without designing separate feature extraction modules [19]. However, their performance and computational cost still depend strongly on the input vector length and on the sensitivity of the time-domain waveform to environmental noise and hardware-specific effects [18,20].
Because of the hardware limitations of edge devices and microcontrollers [17], a computationally lighter alternative is to use hand-crafted feature sets. These typically include amplitude, energy, rise time, pulse count, and statistical or frequency-domain parameters [20,21]. Although such preprocessing greatly reduces the amount of data, it may also remove relevant information. Moreover, hand-crafted features are highly noise-sensitive; under field-noise conditions, the accuracy of classifiers based on traditional statistical features may drop by several dozen percentage points [21].
3.2. PRPD as Embedded-Friendly Diagnostic Representation
The PRPD representation aggregates PD pulses over time and transforms them into a two-dimensional space that reflects the distribution of pulse amplitudes with respect to the phase angle of the supply voltage, typically over the standard 0–360° range [22,23]. Converting raw signals into PRPD maps is a natural way to reduce the amount of processed data compared with continuous full-waveform acquisition. At the same time, this approach preserves statistical and spatial diagnostic information related to the physical discharge mechanism [24]. A representative set of PRPD maps recorded in three measurement channels is shown in Figure 4.
Figure 4.
Phase-resolved partial discharge (PRPD) maps recorded from three channels using MPD Suite software. Colors indicate event density, with warmer colors representing higher activity. Reprinted from [25] under CC BY 4.0 license.
Because of this structure, phase-resolved patterns are well suited to image-based classification. They can be treated as 2D input maps for ML and DL models, enabling the effective use of lightweight vision architectures [25]. From the perspective of embedded systems, appropriate simplification of PRPD representations becomes important. These maps can be converted into single-channel grayscale or binary images, with redundant background, axes, and colors removed [21,26]. Their input resolution may also be reduced, even to sizes as small as 32 × 32 pixels [20]. Such optimizations directly reduce memory requirements, model parameter count, floating-point operations (FLOPs), and inference time. It has been shown that a dedicated convolutional branch processing only PRPD images on an NVIDIA Jetson TX2 edge platform can achieve inference times of approximately 12 ms [27]. However, tests on high-performance edge accelerators do not necessarily imply equally straightforward deployment on power-optimized microcontrollers. Under field conditions, PRPD map quality may be degraded by low signal-to-noise ratio (SNR) and short acquisition windows, leading to sparse registered events [20]. In addition, when multiple PD sources overlap, weaker discharges may be visually suppressed by dominant signals [26].
An important research gap is that, while many studies report the inference cost of ML models, the computational and memory cost of generating PRPD maps directly on embedded hardware is reported much less frequently.
3.3. Two-Dimensional and Time–Frequency Representations
Although PRPD remains a memory-efficient representation for simple embedded systems, its generation inevitably removes local time–frequency features and individual pulse morphology, such as rise time [24,27], while introducing a strict dependence on precise phase synchronization with the grid voltage [28].
To recover part of this information, PD diagnostics increasingly uses more complex two-dimensional representations, including spectrograms, scalograms, short-time Fourier transform (STFT)-based maps [6,29], and phase-resolved pulse signature (PRPS) patterns [30]. These formats preserve richer diagnostic information, which is useful for identifying overlapping defects and operating under noisy conditions [29].
For example, high-frequency time-domain waveforms can first be transformed into 2D time–frequency representations using STFT, resized to a standardized image resolution, and then processed by one-stage You Only Look Once (YOLO)-family detection models [29]. A representative detection result obtained using the MDW-YOLO model is shown in Figure 5, where the bounding box indicates the waveform region identified as a partial discharge defect. Similarly, a multidimensional PRPS representation flattened into a 2D map provides broader diagnostic characteristics than standard PRPD.
Figure 5.
Representative detection result for a processed partial discharge waveform using the MDW-YOLO model. The bounding box indicates the waveform region identified as a partial discharge defect. Reprinted from [29] under CC BY 4.0 license.
Such PRPS-based representations have been analyzed using attention-based architectures, including the LeViT-FECA-LCF model proposed for GIS diagnosis [30]. However, its evaluation was performed on a desktop platform, and the reported computational metrics do not establish its suitability for resource-constrained embedded systems. Assessing this suitability requires measurements of inference latency, memory requirements, and energy consumption on the intended target hardware.
A further advanced step is multimodal fusion, which combines a spatial 2D map, such as a classical PRPD map, with a one-dimensional (1D) time-domain signal. Simultaneous modeling of both domains using hybrid convolutional neural network–long short-term memory (CNN–LSTM) architectures, cross-attention mechanisms, or knowledge distillation improves classifier robustness to noise and helps compensate for the information loss inherent in each representation used separately [20,24,27]. However, this approach requires parallel processing and synchronization of multiple data streams.
3.4. Cross-Tier Implications of Data Representation
From a system-level perspective, the choice of data representation determines where acquisition, memory, and computational burdens are placed within the embedded diagnostic chain. Raw-waveform processing preserves detailed pulse morphology and enables subsequent analysis of pulse-level temporal and spectral characteristics, but it requires an acquisition path capable of retaining the relevant signal bandwidth and leads to larger sample buffers, higher memory requirements, and increased communication load [18,19]. Hand-crafted features substantially reduce the amount of data passed to the classifier and enable computationally lightweight models, but shift part of the processing burden toward feature extraction and make diagnostic performance more dependent on the robustness of the selected descriptors under noisy conditions [21,28]. PRPD provides an intermediate solution: pulse aggregation and reduced image resolution can substantially decrease the classifier input size and enable lightweight image-based models [20,25,27], while the acquisition layer must still ensure reliable signal capture [20,22] and precise phase synchronization with the grid voltage [28].
Time–frequency and multimodal representations can preserve or recover additional pulse characteristics that are unavailable in PRPD alone [20,24,27,29,30], but this benefit is obtained at the cost of buffering high-rate waveform data [20], representation generation overhead [29,30], increased memory bandwidth requirements, and, in more demanding implementations, parallel or accelerator-assisted processing [27,30].
Consequently, data representation should not be selected solely according to classification performance. It should be co-designed with the acquisition strategy, preprocessing pipeline, synchronization mechanism, and target processing hardware, because reducing complexity at one layer may shift or introduce processing, memory, or timing requirements at another layer of the diagnostic chain.
The principal properties of the reviewed data representations and their implications for the remaining layers of the embedded diagnostic chain are summarized in Table 2.
Table 2.
Summary of data representations and their cross-tier implications for embedded PD classification systems.
4. Sensors for PD Monitoring
In MV switchgear, non-invasive sensing methods such as HFCT, TEV, and UHF are particularly relevant because they enable online PD monitoring without interrupting equipment operation. Section 4.1, Section 4.2 and Section 4.3 review their sensing principles, bandwidth, sensitivity, and installation-related constraints, while the system-level consequences of sensor selection for signal conditioning, acquisition, and embedded processing are synthesized in Section 4.4.
4.1. HFCT Sensors
High-frequency current transformers (HFCTs) are non-invasive inductive sensors with ferromagnetic cores, using electromagnetic induction to transform short-duration current pulses [31,32,33]. Owing to full galvanic isolation, they provide a safe tool for continuous monitoring of partial discharge activity in operating power installations [14,32,34].
HFCT sensors intended for embedded monitoring must maintain a technical trade-off between sensitivity and bandwidth [32,35,36]. A properly designed sensor should exhibit a flat frequency response, typically from several hundred kHz up to 20–30 MHz [14,31,32,37,38]. This relationship, and thus the transformer sensitivity in the frequency domain, is formally described by the transfer impedance model [34], as given in Equation (5):
where is the transfer impedance, denotes the output voltage, is the primary winding current, is the magnetizing inductance, is the load resistance, is the number of secondary winding turns, and is the angular frequency.
Increasing the transfer impedance may introduce nonlinear transfer characteristics and distort the PD pulse shape [38,39]. To maintain a flat frequency response with a relatively low number of turns, ferrite cores made of materials such as NiZn or MnZn are commonly used [14,31,32].
A representative compact HFCT construction is shown in Figure 6, where a nine-turn secondary winding is placed on a toroidal ferrite core.
Figure 6.
A high-frequency current transformer for partial-discharge measurement, comprising a nine-turn secondary winding on a toroidal ferrite core.
A major challenge in continuous monitoring of electrical equipment is core saturation caused by the 50 Hz operating current. This requires split-core sensors with an air gap, which extends the linear range but reduces the SNR of the measurement system [34,38]. The effects of saturation can be mitigated by active air-gap adjustment [40] or dedicated impedance filters [33]. To further improve SNR, hardware high-pass filters are often used; however, they may significantly distort the waveform and even remove the polarity information from the HFCT pulse [23,38]. Beyond analog front-end trade-offs, detection performance is strongly affected by the physical installation environment. Even an optimized measurement circuit will not register the signal if high-frequency pulses are shunted into the protective-earth (PE) bonding network. Therefore, to avoid pulse bypassing through parasitic capacitances, the grounding conductor must maintain an appropriate insulation distance from the switchgear grounding plane in the immediate vicinity of the sensor [41].
4.2. TEV Sensors
The transient earth voltage (TEV) method is a non-invasive approach for continuous partial discharge monitoring [42,43,44,45]. Electromagnetic waves propagating from inside the equipment through discontinuities in the enclosure induce transient surface currents on grounded structural elements of the switchgear [42,43,46]. TEV sensors operate through capacitive coupling with the metallic enclosure and act as detection circuits capable of registering fast voltage transients [47,48,49]. Detection performance in embedded systems depends strongly on sensor design. Increasing the electrode area and reducing the dielectric-layer thickness significantly improve sensitivity [49,50,51], enabling the detection of smaller apparent charges, even around 40 pC [50]. Sensitivity can also be enhanced using three-layer structures with an additional coupling plate [48]. However, according to the equivalent resistance–inductance–capacitance (RLC) model, excessive sensor capacitance acts as a low-pass filter that attenuates steep pulse edges, imposing a trade-off between sensitivity and bandwidth [43,46]. The typical operating bandwidth of TEV sensors in switchgear is approximately 3–100 MHz [44,52,53]. Compared with HFCT sensors, the TEV method is characterized by higher background noise and a lower SNR [54,55].
A representative printed-circuit-board-based TEV sensor prototype is presented in Figure 7.
Figure 7.
A prototype printed-circuit-board-based TEV sensor for partial-discharge detection: (a) internal view of the sensor, (b) rear view with mounting magnets.
Sensor placement requires careful planning: for busbar compartments, side walls are considered optimal [56], whereas for general supervision the lower central part of the front panel is recommended [57]. In practical deployments, signal propagation and crosstalk between adjacent switchgear bays connected by a common grounding system remain major challenges [57].
For TEV-based localization, the cumulative energy method defined by Equation (6) can be used to reduce the influence of noisy pulse onsets and determine the arrival time of a PD signal more reliably.
where E is the cumulative signal energy, is the sampling interval, is the voltage value of the ith sample, Z is the input impedance of the measurement system, assumed to be , and N is the total number of samples included in the analyzed data window.
4.3. UHF Sensors
UHF antennas used in partial discharge diagnostics convert electromagnetic waves emitted by defects in the 300 MHz–3 GHz band into measurable voltage signals [2]. The sensitivity of this conversion is described by the antenna effective height , defined as the ratio of the terminal voltage to the incident electric-field strength, as given in Equation (7):
The design of embedded systems requires a strict compromise between sensor size, antenna gain, and the required bandwidth. Large spatial antennas are increasingly being replaced by miniaturized planar microstrip antennas fabricated on low-cost substrates such as FR-4 [10,58,59,60].
A representative miniaturized printed UHF antenna implemented on an FR-4 substrate is shown in Figure 8.
Figure 8.
A prototype UHF antenna printed on a FR-4 substrate. Reprinted from [59] under CC BY 4.0 license.
To minimize the device profile, coplanar waveguide (CPW) feeding is successfully used, as it physically eliminates the need for bulky baluns [61,62]. Flexible polymer substrates, such as thermoset polyimide and polydimethylsiloxane, are also gaining importance because they facilitate non-invasive retrofitting. They allow the sensor to conformally adhere to curved internal switchgear elements without mechanical modification of the metallic enclosure [62,63]. The operating environment inside steel MV cabinets promotes strong signal reflections and multipath propagation. To stabilize PD pulse reception despite the unknown spatial orientation of the defect, circular polarization and an omnidirectional radiation pattern become desirable features [2,64,65]. An equally important factor in embedded system design is the need for dielectric windows, protective radomes, or sealed enclosures. Introducing plastic material into the antenna near field can strongly modify impedance matching and degrade the input reflection coefficient , requiring coupled electromagnetic and mechanical optimization already at the simulation stage [14,66,67,68].
4.4. System-Level Implications of Sensor Selection
From a system-level perspective, the choice of PD sensor determines not only the sensing mechanism, but also the bandwidth, noise conditions, analog front-end requirements, acquisition strategy, and the amount of signal information available to subsequent diagnostic stages.
HFCT-based monitoring illustrates a direct coupling between sensor characteristics and the acquisition chain. HFCT sensors intended for embedded systems require a compromise between sensitivity and bandwidth [32,35], and this bandwidth directly constrains the requirements imposed on the downstream acquisition circuitry [69]. Moreover, distortion introduced by the sensor transfer characteristic or the analog front-end can propagate to waveform- and feature-based representations, particularly when temporal pulse characteristics are used for subsequent analysis [38,39]. Analog filtering can reduce the amount of out-of-band interference passed to the digital processing stage, but excessive filtering may distort the recorded waveform [70] and remove polarity-related information required by some downstream diagnostic methods [23,38]. Similarly, analog pulse broadening reduces the required ADC sampling rate and buffer size, making HFCT-based acquisition viable on resource-constrained microcontrollers, albeit at the expense of pulse-shape information [69]. Consequently, the HFCT bandwidth and the degree of analog signal conditioning should be selected together with the intended acquisition strategy and data representation rather than optimized independently.
TEV sensing introduces a different set of constraints. Its typical operating bandwidth in switchgear is approximately 3–100 MHz [44,53]. Compared with HFCT measurements, TEV signals are also characterized by higher background noise and lower SNR [54,55], which increases the importance of analog front-end filtering [43,53] and robust event detection. The resulting increase in the detection threshold can limit the sensitivity to low-amplitude PD events [50,55]. In addition, signal propagation and crosstalk between adjacent switchgear bays complicate source localization [57], favoring distributed measurement architectures based on multiple TEV sensors and time-difference-of-arrival analysis [42,71]. Multi-channel operation can be implemented using time-sharing acquisition architectures based on high-frequency signal switching [71], while wireless IoT gateways provide an alternative means of aggregating sensor data at the edge [45]. Thus, in TEV-based systems, sensor placement and noise conditions propagate directly into filtering, event detection, synchronization, channel management, and data aggregation requirements.
UHF sensing imposes substantially wider front-end bandwidth requirements because PD-related electromagnetic emissions are acquired in the approximately 300 MHz–3 GHz range [2,10]. Consequently, retaining broadband UHF signal information places increased demands on the RF front-end, acquisition path, and downstream data handling [61]. Part of the interference suppression task can, however, be transferred from digital processing to the sensing layer [72,73]. Antenna geometries incorporating hardware band-stop characteristics have been proposed to suppress external communication bands before digitization, thereby reducing the amount of interference that must subsequently be removed by the embedded processing unit [73]. The degree of signal reduction performed at the sensor and AFE levels therefore determines how much broadband waveform information remains available for downstream waveform- or time–frequency-based analysis and how demanding the subsequent acquisition and processing stages become.
The principal characteristics, design trade-offs, and embedded system implications of the HFCT, TEV, and UHF sensing methods are compared in Table 3.
Table 3.
Summary of sensor technologies for embedded PD monitoring and classification systems.
Overall, no single sensing method is universally optimal for embedded PD monitoring. HFCT, TEV, and UHF sensors impose different combinations of bandwidth, SNR, conditioning, acquisition, and data processing requirements. Sensor selection should therefore be performed jointly with the analog front-end, acquisition architecture, intended data representation, and target processing platform, because reducing complexity or interference at one layer can alter both the information content and the resource requirements of subsequent layers.
5. Embedded and Edge Processing Architectures
Designing an effective embedded system for partial discharge monitoring requires a holistic hardware approach to bridge the gap between raw, high-frequency sensor data and edge AI algorithms. This section reviews the critical architectural stages of this pipeline, encompassing analog front-end conditioning, event-driven triggering mechanisms, precise phase synchronization, and the inherent constraints of low-power processing platforms.
5.1. Analog Front-End and Hardware Data Reduction
As discussed in Section 4.4, the bandwidth imposed by the selected sensing method directly affects the requirements of the analog front-end and ADC. Direct digitization of broadband PD waveforms may require sampling rates of hundreds of megasamples per second (MS/s) or even GS/s, generating data volumes that are difficult to process on low-cost embedded platforms [74]. Therefore, a properly designed analog conditioning path is a critical part of the embedded measurement architecture, as it reduces signal complexity and bandwidth before sampling [13,69]. Typical analog front-end functions include sensor impedance matching, amplification, and analog filtering. Suitable band-pass filters suppress interference outside the useful band, while low-noise amplifiers provide the required gain with limited additional noise [14,38]. To limit the signal bandwidth to a range compatible with embedded ADCs, cascaded low-pass filtering can be applied to attenuate high-frequency components outside the bandwidth required for subsequent acquisition [75]. An even more effective way to reduce ADC requirements is hardware transformation of the fast signal into a slowly varying envelope [15]. In HFCT paths, pulse-broadening techniques are used with analog circuits, as shown in Figure 9. These circuits stretch nanosecond current pulses to several tens of microseconds, enabling acquisition with integrated microcontroller ADCs, such as the STM32F7 with an aggregate throughput of 5.4 MS/s [69].
Figure 9.
Schematic diagram of a peak detector circuit for pulse broadening.
In UHF antenna measurements, demodulating multi-stage logarithmic amplifiers, such as AD8313 or AD8310, are commonly used. They act as envelope detectors that rectify the signal while strongly compressing its amplitude dynamics [14,76].
However, such aggressive analog data reduction comes at a significant information cost. Envelope detection and pulse broadening irreversibly remove the original time-domain morphology of the PD waveform, preventing the use of analytical algorithms based on parameters such as pulse rise and fall times [13,14,15]. Additional analog front-end components also introduce their own measurement errors. Excessive HFCT gain and core nonlinearities distort the waveform [36,37], while fast transistor switches, such as metal–oxide–semiconductor field-effect transistors used as active-reset switches in peak detectors, inject charge and significantly affect the measurement of very low-amplitude discharges [75]. Although analog conditioning reduces ADC bandwidth requirements, continuous conversion can still impose substantial processing and data transfer demands. These demands motivate acquisition strategies that limit either the sampling activity or the amount of data retained for subsequent analysis.
5.2. Event-Driven Acquisition and Triggering Mechanisms
While PD signals require broadband hardware in the frequency domain, their temporal sparsity is equally important. A typical discharge pulse is a transient event lasting from about 100 ns to several microseconds, followed by long inactive periods of tens or hundreds of microseconds [76]. Continuous high-rate sampling of a broadband acquisition channel while waiting for such short events would unnecessarily consume the computational and memory resources of embedded nodes.
In embedded systems with limited RAM and strict energy budgets, continuous high-rate acquisition can produce substantial data redundancy and increase the risk of buffer overflow [74,76]. For this reason, edge architectures benefit from asynchronous event-triggered acquisition, as shown in Figure 10. One implementation uses hardware threshold comparators to activate an otherwise inactive ADC when the signal exceeds a predefined level, forming a gated-ADC architecture. In the system reported in [76], triggering is based on a received-power threshold, such as −60 dBm. Advanced vertical and horizontal thresholding has also been investigated in relation to hardware dead time after triggering [77]. Event selection can alternatively be performed in software after continuous ADC acquisition with DMA-assisted transfer, using amplitude and rise-slope criteria to identify PD pulses [75]. The cross-tier implications of this approach are examined in Section 5.5.
Figure 10.
Asynchronous event-triggered acquisition scheme of a transient PD pulse. The activation threshold (green line) initiates the recording window.
The main technological barrier in event-based acquisition is the wake-up time of high-speed ADCs. Commercial converters require from 250 ns to several tens of microseconds to start conversion, which, without analog delay lines, creates a direct risk of losing the rising edge of a fast PD pulse [76]. False triggering is another important problem. Electromagnetic background, communication signals, or power-electronic switching may repeatedly wake the digital path, heavily loading the processor and memory of the node [2,15,75].
To reduce this risk and minimize stored data volume, very short acquisition windows are enforced in hardware. Using, for example, FPGAs or monostable timers, the sampling window can be limited to several dozen samples, corresponding to about 1–1.25 s, after which recording is stopped and the hardware returns to standby [76,77]. The acquired packets are dynamically buffered, and the allocated memory is freed for reuse before the next event to lower processing overhead [46]. Furthermore, real-time data transfers can be offloaded to background DMA channels, significantly minimizing CPU intervention [75].
5.3. Hardware Support for Phase-Resolved Pattern Synchronization
Phase-resolved partial discharge representation serves as a foundation of modern PD diagnostics, requiring every retained PD event to be precisely linked to the phase of the operating voltage [20,75]. In memory-constrained embedded implementations, retaining full broadband time-domain waveforms for every detected event may be impractical. Therefore, the acquisition stage can retain compact event information, including the measured amplitude and event timestamp, which is subsequently associated with the corresponding phase angle [69,75].
Figure 11 illustrates the interaction between the phase-reference path and the event-driven PD acquisition path in a representative single-node implementation. The upper path derives a phase reference from the mains voltage through isolation and conditioning, zero-crossing detection, and a hardware timer. In parallel, the lower path detects and digitizes PD events and stores the acquired event data together with their timing information. The event timestamp is then combined with the phase reference to calculate the phase angle used for PRPD map generation.
Figure 11.
Representative architecture for phase-resolved event acquisition and PRPD generation. The upper path establishes a mains-voltage phase reference using zero-crossing detection and a hardware timer. Each detected PD event initiates timestamp capture, and the timestamp is stored together with the acquired event data. The event timestamp and phase reference are used to calculate the phase angle, which is combined with the event amplitude to generate the PRPD representation.
In distributed architectures, synchronization becomes more demanding because physically separated sensing units must share a common time base. An example is the power-transformer monitoring system described in [14], which uses an Ethernet interface supporting Precision Time Protocol (PTP) timestamping and Synchronous Ethernet (SyncE). This architecture provides a reference for distributed acquisition, while its applicability to MV switchgear requires validation under the corresponding sensing and installation conditions.
The accuracy of this timing path directly determines the accuracy of phase assignment. At a mains frequency of 50 Hz, limiting the absolute phase error to 1° requires the combined timing error to remain within approximately . This limit applies to the complete phase-assignment path, including zero-crossing detection uncertainty, timer resolution, event timestamp jitter, and residual uncompensated propagation delays, rather than to each contribution separately. In addition to digital timing uncertainty, the sensor interface and analog conditioning path can introduce a systematic propagation delay between the physical PD event and its registered timestamp [75]. If this delay is not characterized or compensated, it directly translates into a systematic phase offset in the resulting PRPD representation.
Despite the importance of these mechanisms, detailed synchronization parameters are still reported inconsistently in the reviewed literature. In particular, hardware jitter, timestamping accuracy, timer resolution, and measured propagation delays of the conditioning and acquisition paths are rarely quantified [14,69]. Reporting these parameters is necessary to distinguish nominal phase resolution from the effective phase accuracy achieved by an embedded PRPD monitoring system.
5.4. Embedded Processing Platforms and Edge Constraints
Designing an edge system for partial discharge signal acquisition and processing requires a trade-off between high-performance parallel computing platforms and simpler, low-cost architectures with limited resources.
In environments with strict timing determinism requirements, FPGAs are well suited to the early stages of the digital acquisition path. They enable fully parallel handling of high-speed ADCs, PTP-based timestamp synchronization complemented by SyncE-based frequency synchronization and the definition of short acquisition windows [14,76]. In this role, FPGAs act as front-end buffers and controllers, offloading the main processor before recorded events are written to memory [14].
Direct acquisition on microcontrollers, however, faces severe edge-resource constraints. On MCU-class platforms, the available on-chip memory directly limits the length and number of concurrently retained acquisition buffers; therefore, buffer requirements must be evaluated against the resources of the specific target device [75,78].
To overcome computational bottlenecks while operating within strict power and thermal envelopes in long-term unattended deployments, modern edge-AI platforms integrate vector coprocessors, neural processing units (NPUs), or tensor processing units (TPUs). Many edge-AI accelerators are optimized for quantized inference formats such as 8-bit integer (INT8) arithmetic, improving energy efficiency and reducing inference latency relative to general-purpose CPUs [79,80].
The primary roles, advantages, and implementation constraints of the reviewed embedded processing platforms are summarized in Table 4.
Table 4.
Summary of embedded processing platforms, primary roles, and edge constraints for online PD monitoring systems.
5.5. Cross-Tier Case Study: Sensitivity and Event Separation in MCU-Based PRPD Acquisition
The system developed by Gillis et al. [75] provides a concrete example of coupling between analog conditioning, event detection, synchronization, and phase-resolved data representation. Designed for laboratory investigations of flash sintering, it uses capacitive coupling, RC filtering, and a peak detector with an actively reset holding capacitor. A Nucleo-H745ZI-Q board continuously acquires the conditioned signals using ADCs and DMA-assisted transfer. Software identifies PD events using amplitude and rise-slope criteria, while zero crossings of the sampled synchronization signal and timer readings provide the phase reference. The resulting amplitude–phase pairs are transmitted through UART to a computer application for PRPD visualization [75].
The principal cross-tier trade-off arises from the active reset of the peak detector. Although resetting the holding capacitor prepares the analog path for subsequent pulses, charge injection from the MOSFET produces a residual signal that limits the detection of low-amplitude events. Table IV in [75] reports that a commutation time of permits measurement of pulses with the specified 10% margin above the reset-induced rebound signal, whereas measuring pulses with the same margin requires . Extending the reset interval therefore improves access to weaker discharges but increases the interval required before the measurement path is ready for another event. These values characterize the analog reset constraint rather than a complete digital acquisition or communication throughput.
This dependence has consequences beyond the analog circuit. The reset interval and detection thresholds determine which events contribute to the amplitude–phase distribution: weak pulses may be rejected, while closely spaced pulses may not be resolved separately. The resulting PRPD representation therefore depends on acquisition settings as well as on the underlying discharge activity. Phase assignment introduces a further coupling, because the conditioning of the synchronization signal produces a phase lag that must be calibrated and corrected [75]. From the perspective of a subsequent classifier, these effects would alter the available input distribution before inference begins; this is a system-level implication, since the study itself does not implement an ML classifier.
The reported comparison with a commercial instrument supports the feasibility of this measurement approach under the tested laboratory conditions [75]. Its relevance to MV switchgear lies in the demonstrated conditioning, event-selection, and synchronization mechanisms; equivalent sensitivity and PRPD fidelity would require validation with the intended coupling arrangement and interference conditions.
Together with the other architectures reviewed in this section, this case illustrates why AFE conditioning, triggering or software event selection, buffering, synchronization, and data representation should be designed jointly. Compact event-level acquisition can support amplitude–phase analysis, whereas waveform-based methods require greater preservation of pulse morphology [24,29,69]. The target classifier and processing platform must therefore be selected according to the information retained by the complete acquisition path.
6. Machine Learning Methods for PD Classification
Building on the data–representation trade-offs discussed in Section 3 and the hardware constraints analyzed in Section 5, this section examines machine learning methods from the perspective of their compatibility with the complete embedded diagnostic chain. Particular attention is given to the interaction between input representation, preprocessing requirements, model complexity, optimization strategy, and target processing hardware.
6.1. Classic ML Methods
Classical machine learning methods based on hand-crafted features remain important for partial discharge classification in embedded systems. Their ability to operate on compact feature vectors can result in substantially lower memory and computational requirements than those of deep neural networks, making them attractive for resource-constrained embedded implementations [13]. Comparative studies show that classical algorithms, such as random forests (RFs) and support vector machines (SVMs), supplied with well-selected temporal and statistical features, can reach accuracies of approximately 94–95%, making them lightweight alternatives to computationally demanding deep networks [81,82,83]. In extremely resource-constrained devices, lightweight template-matching methods without heavy training [84] or rule-based fuzzy systems [77] may also be used.
The most common classification techniques include SVMs, k-nearest neighbors (k-NN), decision trees (DTs), RFs, extreme gradient boosting (XGBoost), and shallow neural networks [2,70,83,85]. Principal component analysis (PCA), locally linear embedding (LLE), K-means clustering, and Gaussian mixture models (GMMs) are also widely used for dimensionality reduction or data separation [77,84,86,87,88,89]. Standard input datasets depend on the acquisition method and usually include statistical features, PRPD image parameters, amplitude- and phase-related quantities, detailed pulse shape descriptors, and various frequency-domain or wavelet features [81,82,83,85,90,91]. However, their effectiveness strongly depends on preprocessing quality and feature-extraction reliability [85,92,93].
Moving classical feature extraction and reduction algorithms, such as PCA or LLE, directly to edge devices can greatly reduce cloud system load and shorten the training time of the diagnostic system [88]. Complementing these data-driven approaches, rigorous feature engineering can reduce the diagnostic basis to only a small number of key indicators [85]. Extracting physical parameters, such as effective pulse duration (), or selecting a minimal set of spectral–temporal measures enables effective clustering of PD sources without mathematically complex dimensionality-reduction transforms [94,95]. Advanced selection algorithms, such as minimum-redundancy maximum-relevance (mRMR), allow extreme reduction of the feature set without visible loss of predictive accuracy [91]. With such optimized vectors, lightweight models, for example XGBoost supplied with simple statistical features, can be deployed on less powerful devices and help overcome limited network bandwidth [90]. These classical classifiers can also process more difficult, noisy field data acquired in industrial environments [70].
The performance of SVM- or k-NN-based classifiers may deteriorate in the presence of substation-like measurement noise, which can increase the computational burden associated with denoising before feature extraction [92,93].
The classical algorithms most frequently considered for resource-constrained PD classification are summarized in Table 5.
Table 5.
Characteristics and literature sources of the analyzed classification algorithms.
6.2. Deep Learning Methods for PRPD-Based Classification
A common input format for deep-learning-based PD classification is the two-dimensional PRPD representation, typically encoded as an image or pixel density matrix. Its main advantage is that CNNs can automatically extract complex structural features, eliminating the time-consuming hand-crafted feature engineering required by classical machine learning methods [27,96].
For multi-source defects, where signals overlap, researchers often move beyond classical PRPD maps toward high-resolution time–frequency representations generated using continuous or stationary wavelet transforms (CWT and SWT) [93,97]. Although these representations improve detection performance when combined with deep networks, they introduce substantial preprocessing overhead, which can limit real-time implementation on resource-constrained hardware [97]. Therefore, while studies focused on maximum offline accuracy often use heavy transfer learning architectures, such as ResNet, VGG, Inception, DenseNet, or Transformer-based models [98,99], their memory and computational requirements may limit deployment on resource-constrained edge platforms, depending on the target hardware and applied model optimization techniques [100,101].
A clear trend is visible toward lightweight model architectures intended for embedded and edge deployment. Reported implementations include SqueezeNet-based approaches [99] and the reduced attention architecture proposed in [102], which was evaluated on a Jetson Nano with an inference time of 245 ms and 0.21 million parameters. A complementary strategy is to reduce the dimensionality of the classifier input through compact grayscale PRPD representations, as illustrated in Figure 12 [69]. The interaction between this representation, analog conditioning, and MCU-based inference is examined in Section 6.6.
Figure 12.
Grayscale PRPD map conversion. The red curve provides the phase reference; colored points represent discharge data, with counts per grid cell mapped to grayscale values. Reprinted from [69] under CC BY 4.0 license.
At the same time, the importance of correct diagnosis increases the need for explainable artificial intelligence (XAI). Activation maps generated using gradient-weighted class activation mapping (Grad-CAM) for 1D CNNs allow engineers to verify the physical basis of algorithmic decisions by visualizing, for example, which parts of the discharge pulse rise time receive the most attention from the network [103].
Multimodal data fusion provides an alternative architecture-level approach in which spatial PRPD information and one-dimensional time-domain signals are processed jointly using cross-attention mechanisms or knowledge distillation [20,24]. Models combining a CNN for the image with an LSTM for the 1D waveform have been successfully deployed on Jetson TX2, achieving 15 ms inference [27]. The evolution of edge systems is also leading to architectures beyond 2D convolutions, such as energy-efficient spiking neural networks (SNNs) that reduce inference energy to the microjoule range [101].
The main deployment considerations and available hardware evidence for the reviewed learning and processing approaches are summarized in Table 6.
Table 6.
Embedded deployment considerations for representative PD learning and processing approaches.
6.3. Object-Detection-Based Analysis of PRPD Patterns for Multi-Source Partial Discharge Recognition
Object detection methods represent an important extension of classical PRPD image classification, as they enable not only assignment of a sample to a defect class, but also spatial localization and separation of coexisting discharge patterns. This is particularly important in multi-source PD diagnostics, where stronger pulse clusters may mask weaker defect sources and lead to misinterpretation of the whole PRPD image. Approaches based on detection transformers (DETRs) [26], YOLO models [104], and instance segmentation [23] treat individual discharge clouds as diagnostic objects or regions, making them better suited to overlapping classes than standard CNN classifiers that analyze the image globally [25,104].
For example, a Detection Transformer (DETR) framework combined with a lightweight custom CNN backbone and flattening augmentation achieved 97.4% accuracy for single-source discharges, which slightly decreased to 90.9% for complex, overlapping multi-source defects (ranging from 2 to 6 simultaneous sources) [26]. The YOLO-MAF instance-segmentation model obtained a mean average precision averaged over intersection-over-union thresholds from 0.50 to 0.95 (mAP50:95) of 88.3%, with 99.8% recall [23], indicating the potential of these methods for recognizing complex PRPD structures.
From the embedded system perspective, however, detection accuracy is not sufficient; model complexity, inference time, and computational cost are equally important. Recent studies therefore develop lightweight detector variants, including MobileNetYOLO and SqueezeNetYOLO hybrids requiring approximately 0.60 and 0.35 billion floating-point operations (GFLOPs), respectively, and processing more than 60–70 frames per second (FPS) [25], as well as optimized YOLO versions reducing operations to about 6.1 GFLOPs [105].
Within the common experimental setting reported in [104], YOLOv5 achieved higher mAP@0.5 and substantially shorter inference time than YOLOv12. This within-study comparison illustrates that increasing architectural complexity does not necessarily improve the accuracy–latency trade-off for a given embedded PD application.
Reported diagnostic and computational characteristics of representative deep learning architectures are summarized in Table 7.
Table 7.
Reported performance and computational characteristics of representative deep learning architectures used in PD diagnostics. Results are study-specific and should not be interpreted as a direct ranking because datasets, diagnostic tasks, input representations, and hardware conditions differ.
Direct numerical comparison is justified only for models evaluated under equivalent experimental conditions within the same study. Across studies, the table provides an overview of reported results and their experimental context.
The equipment context reported in Table 7 also distinguishes direct evidence from transferable methodological evidence. Results obtained specifically for MV switchgear are treated as direct evidence for the target application, whereas studies involving transformers, GIS, rotating-machine insulation, or other equipment are used to assess transferable processing and deployment trade-offs rather than as direct validation of performance in MV switchgear.
6.4. Learning Strategies for Robustness and Data Scarcity
Transfer learning and domain adaptation methods have been investigated to reduce distribution mismatch between training and deployment data [15,107].
- In distributed industrial systems, fully labeled datasets may be difficult to obtain. Semi-supervised and unsupervised methods can therefore support identification and separation of overlapping defects with reduced labeling requirements [87,108].
- Small and imbalanced PD datasets can be expanded using generative models such as deep convolutional generative adversarial networks (DCGANs) [106] and generative adversarial networks incorporating a deep autoencoder (DAE-GANs) [109]. Severe data shortages can also be addressed using one-shot learning with Siamese networks [110].
- A practical way to improve robustness under industrial conditions is to inject real grounding noise directly into laboratory data during model training [99].
- For multi-source phenomena, domain-specific approaches such as flattening augmentation have been proposed to simulate the physical masking of weaker pulses by stronger discharges [26].
- Large streams of unlabeled data collected after deployment can be exploited without exhaustive manual labeling using self-supervised contrastive learning [111].
- Semi-supervised techniques based on auxiliary classifier generative adversarial networks (ACGANs) enable automatic pseudo-labeling of field samples, helping to reduce distribution differences between laboratory data and the target deployment environment [112].
- At substation scale, intelligent electronic devices (IEDs) can use federated learning to jointly adapt to new interference profiles. This approach exchanges model updates rather than raw PD signals, reducing the need to transmit high-volume measurement data to a central server [113].
These strategies primarily address data scarcity, distribution shift, and post-deployment adaptation. Their effectiveness, however, does not remove the need to control the dimensionality and computational cost of the data passed to the embedded classifier.
6.5. Input Dimensionality Reduction for Edge Deployment
When PD classifiers operate on high-dimensional waveform or time–frequency inputs, dimensionality reduction can decrease the amount of data passed to the inference stage and thereby reduce the associated memory and computational burden [5,74,114]. Techniques such as principal component analysis (PCA) and nonlinear autoencoders have been applied to pre-compress PD waveform data [74,114]. In the implementation reported in [74], input vectors containing tens of thousands of waveform samples were reduced to a small number of latent variables while retaining a high signal-to-noise ratio. Such input-level reduction therefore provides a complementary approach to lightweight model selection by decreasing the amount of input data that must be stored and processed before classification.
6.6. Cross-Tier Case Study: PRPD Aggregation and MCU-Based Classification
The system reported by Yan et al. [69] illustrates how analog conditioning, data representation, and model implementation jointly determine the feasibility of embedded PD classification. An HFCT with a bandwidth of 1–25 MHz supplies an amplification and pulse-broadening circuit that extends the pulses to approximately . This enables acquisition using the integrated ADCs of an STM32F769 microcontroller at an aggregate sampling rate of 5.4 MS/s. Acquisition is synchronized with the power-frequency signal, producing 108,000 samples per period. The conditioned signal supports phase–amplitude analysis, while its original high-frequency pulse morphology is no longer preserved for waveform-based classification.
The acquired samples are reduced by retaining the maximum amplitude within each of 360 phase intervals. Data from 15 consecutive periods are then superimposed and converted into a grayscale representation with 60 phase bins and 50 amplitude bins. The resulting representation is transferred through a serial interface to a second microcontroller, an STM32H743, which executes the CNN and returns the predicted discharge type [69]. Thus, the implementation distributes acquisition and classification across two MCUs, with the compact PRPD representation forming the interface between them.
The choice of aggregation length provides a quantitative example of a cross-tier trade-off. In the comparison reported in Table 7 of [69], average recognition accuracy increased from 81.8% without superposition to 98.17% with 15 superpositions, while increasing the number to 20 yielded 98.33%. The authors selected 15 because further aggregation provided limited improvement while increasing processing time and workload. Classification performance therefore depended on the amount of data accumulated and processed upstream, rather than solely on the CNN architecture.
The deployed four-convolutional-layer model required a reported 946.01 KB of Flash and 125.36 KB of RAM. The authors also reported a system power consumption of 5.28 W and approximately 12 s for a single PD pattern recognition operation [69]. The latter value is not decomposed into acquisition, representation generation, communication, and model-only inference times, and should therefore not be interpreted as isolated CNN latency. Similarly, the reported model memory requirements do not constitute a complete memory budget for both microcontrollers.
This case demonstrates that MCU-based classification is enabled by coordinated signal conditioning, representation reduction, and model deployment, but that a compact model does not by itself establish rapid system response. The results were obtained using laboratory discharge models and support implementation feasibility under those conditions; they do not establish long-term diagnostic performance in operating MV switchgear.
Together, this example and the acquisition case study in Section 5.5 connect the measurement and learning stages of the diagnostic chain. Gillis et al. [75] demonstrate how analog reset and event selection settings constrain the events available for PRPD construction, while Yan et al. [69] show how subsequent aggregation affects recognition accuracy and processing workload. Model selection should therefore account for both the information retained by the acquisition path and the resources required to construct and process its input representation.
7. Discussion
The cross-tier analyses presented in Section 3, Section 4, Section 5 and Section 6 show that the practical deployability of an embedded PD monitoring system cannot be inferred from classification accuracy or model complexity alone. The performance of the complete diagnostic chain depends on the interaction between sensing conditions, analog conditioning, acquisition and triggering, phase synchronization, data representation, machine learning processing, and the target hardware platform. Accordingly, the following discussion focuses on two issues that remain insufficiently addressed in the reviewed literature: laboratory-to-field generalization and the consistent assessment of deployment readiness.
7.1. Laboratory-to-Field Generalization and Validation
The transition from controlled laboratory experiments to online monitoring of operating power equipment remains an important validation challenge. Laboratory datasets provide repeatable conditions for developing and comparing classification methods, but they do not fully reproduce the variability of electromagnetic interference, sensor installation, operating conditions, and signal distributions encountered in practical applications. Studies conducted under non-ideal conditions have shown that changes in noise characteristics can substantially affect diagnostic performance and motivate the use of dedicated augmentation and robustness enhancement strategies [99].
This problem is not limited to the classification stage. For noise-sensitive classical classifiers, preprocessing quality becomes particularly important because the performance of SVM- or k-NN-based methods can deteriorate in the presence of substation-like measurement noise, increasing the importance and computational cost of denoising before feature extraction [83,92]. Similarly, variation in sensor placement or coupling can modify the amplitude and spectral characteristics of the measured signal before it reaches the analytical model.
The limitations of laboratory-only validation are also visible in the reviewed UHF literature. A number of antenna-oriented studies rely on controlled laboratory arrangements, numerical electromagnetic simulations, or tests performed on equipment other than MV switchgear [72,115,116]. Such studies provide useful information on sensing principles, antenna geometry, and signal acquisition, but they should be treated as transferable methodological evidence rather than as direct validation of deployment performance in MV switchgear. By contrast, studies based on field-acquired measurements from MV equipment provide more direct evidence of the behavior of PD diagnostic methods under realistic operating conditions [104].
The distinction between direct and transferable evidence is therefore important when assessing deployment maturity. Results obtained on GIS, transformers, cables, or rotating-machine insulation can support the analysis of sensing, signal processing, or machine learning principles, but they cannot by themselves demonstrate equivalent performance in MV switchgear. Field-oriented validation should consequently include measurements acquired under different noise conditions, sensor placements, operating states, and, where possible, different devices or installations.
Several learning strategies reviewed in Section 6.4 can help reduce the resulting distribution mismatch. Noise augmentation has been used to improve robustness under non-ideal conditions [99], while semi-supervised approaches can exploit incompletely labeled data and reduce the dependence on fully annotated datasets [112]. Self-supervised learning provides another possibility for extracting useful representations from unlabeled PD data [111]. These approaches can support adaptation to changing operating conditions, but they should complement rather than replace validation on independently acquired field or pilot installation data.
7.2. Deployment-Readiness Metrics and Research Gaps
The reviewed studies also show that embedded deployment is reported using highly heterogeneous criteria. Some works provide direct hardware evidence, including inference time and parameter count on platforms such as Jetson Nano or Jetson TX2 [27,102], whereas other studies report mainly model-level quantities such as FLOPs, parameter count, or classification accuracy. As demonstrated by the comparison in Section 6.3, such values cannot be interpreted independently of the input representation, diagnostic task, dataset, and hardware platform.
General TinyML benchmarking frameworks identify accuracy, inference latency, and energy consumption as complementary metrics for evaluating resource-constrained AI systems [78,79]. Although these studies do not address partial discharge monitoring directly, they provide transferable benchmarking principles that can support the evaluation of embedded PD implementations.
For PD monitoring systems, model-level metrics should therefore be complemented by measurements describing the operation of the complete embedded diagnostic process. Table 8 proposes a compact reporting framework derived from the system layers analyzed in this review. The framework is intended as a reporting guideline rather than as a universal pass–fail criterion, because acceptable values depend on the sensing technology, monitored equipment, diagnostic task, and target hardware.
Table 8.
Proposed reporting framework for assessing deployment readiness of embedded PD monitoring systems.
The proposed framework also highlights why classification accuracy alone is insufficient for assessing deployment readiness. A system may achieve high accuracy on a static dataset while still being unsuitable for continuous monitoring because of excessive false triggering, trigger dead time, limited memory, unstable timing, or poor generalization to another sensor or installation. Conversely, a moderately complex classifier may remain practically useful if the preceding acquisition and representation stages sufficiently reduce the amount of processed data.
An additional limitation is that the reviewed literature does not yet provide a common experimental protocol covering all of these quantities. Hardware-specific results should therefore be interpreted as evidence for a particular implementation rather than as universal characteristics of a given model architecture. Consistent reporting of the metrics listed in Table 8 would make future studies easier to compare and would provide a clearer distinction between offline algorithm demonstrations and systems approaching practical deployment.
7.3. Research Priorities for Field-Deployable PD Systems
Several research priorities follow from the reviewed evidence. First, future studies should place greater emphasis on datasets acquired from different devices, sensor installations, and operating conditions rather than relying exclusively on random train–test splits of a single laboratory dataset. Second, multi-source PD diagnostics should continue to address the simultaneous presence and masking of multiple discharge sources, which remains an important challenge for both classification and object detection methods [26,106]. Third, evaluation protocols should explicitly consider previously unseen defect types and uncertainty rather than assuming that every field event belongs to one of the classes represented during training. Finally, long-term pilot deployments should report false alarms, missed detections, trigger behavior, data loss, hardware stability, and changes in diagnostic performance over time. These directions would provide stronger evidence of practical readiness than further improvements in laboratory classification accuracy alone.
8. Conclusions
This review shows that the feasibility of embedded partial discharge diagnostics is determined by the complete sensing-to-inference chain rather than by the classification model alone. Sensor characteristics and analog conditioning determine the information available to the acquisition stage; triggering and buffering determine which events are retained; synchronization affects the quality of phase-resolved representations; and the selected representation ultimately constrains preprocessing complexity, memory demand, and the required processing hardware. Consequently, no single sensor, representation, or learning architecture can be considered universally optimal for embedded PD monitoring.
For resource-constrained implementations, event-driven acquisition and compact phase-resolved or feature-based representations can reduce data and memory requirements when preservation of the complete pulse waveform is not required. Conversely, waveform, time–frequency, and multimodal approaches retain richer diagnostic information but impose greater buffering, preprocessing, and computational requirements. These trade-offs should therefore be assessed jointly with the capabilities of the target embedded platform rather than on the basis of classification accuracy alone.
Future progress toward autonomous online PD monitoring requires more consistent reporting of sensing, acquisition, synchronization, representation, and hardware-level metrics. Field-oriented evaluation should additionally consider false-alarm and missed-detection rates, cross-device generalization, response to previously unseen defect types, and long-term operational stability. Such evidence is necessary to distinguish successful algorithm demonstrations from embedded diagnostic systems that are sufficiently robust for sustained operation in MV switchgear.
Author Contributions
Conceptualization, B.O.; methodology, B.O. and B.D.; formal analysis, B.O., B.D. and J.S.; writing—original draft preparation, B.O. and B.D.; writing—review and editing, B.O., B.D. and J.S. All authors have read and agreed to the published version of the manuscript.
Funding
This research received no external funding.
Data Availability Statement
No new data were created or analyzed in this study. Data sharing is not applicable to this article.
Acknowledgments
The authors used Scopus AI and ResearchRabbit (web-based services, accessed during April–June 2026) to support the identification of potentially relevant publications and the exploration of citation and similarity networks. ChatGPT (GPT-5.6, OpenAI) was used to support English-language editing, including grammatical correction, sentence restructuring, and improvement of clarity and readability. The authors independently verified the original sources, reviewed and edited all tool-assisted content, and take full responsibility for the accuracy and integrity of the manuscript.
Conflicts of Interest
The authors declare no conflicts of interest.
References
- IEC 60270; High-Voltage Test Techniques–Partial Discharge Measurements. International Electrotechnical Commission: Geneva, Switzerland, 2000.
- Chan, J.Q.; Raymond, W.J.K.; Illias, H.A.; Othman, M. Partial Discharge Localization Techniques: A Review of Recent Progress. Energies 2023, 16, 2863. [Google Scholar] [CrossRef] [Scilit]
- Faizol, Z.; Zubir, F.; Saman, N.M.; Ahmad, M.H.; Rahim, M.K.A.; Ayop, O.; Jusoh, M.; Majid, H.A.; Yusoff, Z. Detection Method of Partial Discharge on Transformer and Gas-Insulated Switchgear: A Review. Appl. Sci. 2023, 13, 9605. [Google Scholar] [CrossRef] [Scilit]
- Lu, S.; Chai, H.; Sahoo, A.; Phung, B.T. Condition Monitoring Based on Partial Discharge Diagnostics Using Machine Learning Methods: A Comprehensive State-of-the-Art Review. IEEE Trans. Dielectr. Electr. Insul. 2020, 27, 1861–1888. [Google Scholar] [CrossRef] [Scilit]
- Aydin, T.; Ozdemir, A. A Review of AI-Based Partial Discharge Analysis Studies in Medium Voltage Switchgear. In Proceedings of the 2025 60th International Universities Power Engineering Conference (UPEC), London, UK, 2–5 September 2025; pp. 1–6. [Google Scholar] [CrossRef] [Scilit]
- Li, J.; Han, X.; Wang, H.; Zhou, Y.; Chen, H.; Guo, R.; Si, W. Review of Partial Discharge Detection Technology in Electrical Equipment: 2015–2025. High Volt. Eng. 2025, 51, 3132–3158. [Google Scholar] [CrossRef]
- Cao, J.; Wang, Y.; Zhu, W.; Zhang, Y. A Noise Reduction Algorithm for White Noise and Periodic Narrowband Interference Noise in Partial Discharge Signals. Appl. Sci. 2025, 15, 1760. [Google Scholar] [CrossRef] [Scilit]
- Kucharek, M.; Kluge, P.; Owczarczuk, B.; Chudorliński, J. Analiza sygnałów WNZ rejestrowanych metodami alternatywnymi w rozdzielnicy SN w izolacji powietrznej. Prz. Elektrotech. 2025, 1, 20–23. [Google Scholar] [CrossRef]
- Hassan, W.; Hussain, G.A.; Mahmood, F.; Amin, S.; Lehtonen, M. Effects of Environmental Factors on Partial Discharge Activity and Estimation of Insulation Lifetime in Electrical Machines. IEEE Access 2020, 8, 108491–108502. [Google Scholar] [CrossRef] [Scilit]
- Habib, B.; Al Zaabi, O.; Harid, N.; Al Hosani, K.; Alkhatib, M. Condition Monitoring Based on Partial Discharge Diagnostics Using UHF Sensors: A Comprehensive State-of-the-Art Review. IEEE Trans. Dielectr. Electr. Insul. 2024, 31, 2860–2873. [Google Scholar] [CrossRef] [Scilit]
- Long, J.; Xie, L.; Wang, X.; Zhang, J.; Lu, B.; Wei, C.; Dai, D.; Zhu, G.; Tian, M. A Comprehensive Review of Signal Processing and Machine Learning Technologies for UHF PD Detection and Diagnosis (II): Pattern Recognition Approaches. IEEE Access 2024, 12, 29850–29890. [Google Scholar] [CrossRef] [Scilit]
- Cordova-Cardenas, R.; Amor, D.; Gutiérrez, Á. Edge AI in Practice: A Survey and Deployment Framework for Neural Networks on Embedded Systems. Electronics 2025, 14, 4877. [Google Scholar] [CrossRef] [Scilit]
- Wen, H.; Abu Talip, M.S.; Othman, M.; Azam, S.M.K.; Mohamad, M.; Ibrahim, M.F.; Arof, H.; Ababneh, A. Advanced Signal Processing Methods for Partial Discharge Analysis: A Review. Sensors 2025, 25, 7318. [Google Scholar] [CrossRef] [Scilit] [PubMed]
- Sikorski, W.; Walczak, K.; Gil, W.; Szymczak, C. On-Line Partial Discharge Monitoring System for Power Transformers Based on the Simultaneous Detection of High Frequency, Ultra-High Frequency, and Acoustic Emission Signals. Energies 2020, 13, 3271. [Google Scholar] [CrossRef] [Scilit]
- Long, J.; Wang, X.; Zhou, W.; Zhang, J.; Dai, D.; Zhu, G. A Comprehensive Review of Signal Processing and Machine Learning Technologies for UHF PD Detection and Diagnosis (I): Preprocessing and Localization Approaches. IEEE Access 2021, 9, 69876–69904. [Google Scholar] [CrossRef] [Scilit]
- Kumar, C.; Ganguly, B.; Dey, D.; Chatterjee, S. Recent trends and open challenges in acoustic partial discharge signal denoising techniques: A review. Electr. Power Syst. Res. 2025, 248, 111931. [Google Scholar] [CrossRef] [Scilit]
- Wang, Y.; Yan, J.; Yang, Z.; Zhao, Y.; Liu, T. Optimizing GIS partial discharge pattern recognition in the ubiquitous power internet of things context: A MixNet deep learning model. Int. J. Electr. Power Energy Syst. 2021, 125, 106484. [Google Scholar] [CrossRef] [Scilit]
- Wang, Y.; Yan, J.; Yang, Z.; Wang, J.; Geng, Y. A novel 1DCNN and domain adversarial transfer strategy for small sample GIS partial discharge pattern recognition. Meas. Sci. Technol. 2021, 32, 125118. [Google Scholar] [CrossRef] [Scilit]
- Ganguly, B.; Chaudhury, S.; Biswas, S.; Dey, D.; Munshi, S.; Chatterjee, B.; Dalai, S.; Chakravorti, S. Wavelet Kernel based Convolutional Neural Network for Localization of Partial Discharge Sources within a Power Apparatus. IEEE Trans. Ind. Inform. 2021, 17, 1831–1841. [Google Scholar] [CrossRef] [Scilit]
- Ji, J.; Wang, W.; Li, H.; Xian Lai, K.; Zheng, Y.; Jiang, X. Multimodal Fusion and Domain-Invariant Feature Learning for Partial Discharge Detection. IEEE Trans. Instrum. Meas. 2025, 74, 2551414. [Google Scholar] [CrossRef] [Scilit]
- Raymond, W.J.K.; Xin, C.W.; Kin, L.W.; Illias, H.A. Noise invariant partial discharge classification based on convolutional neural network. Measurement 2021, 177, 109220. [Google Scholar] [CrossRef] [Scilit]
- Baek, D.; Koo, J.H.; Lee, J.G. Partial Discharge Pattern Classification in High-Voltage Equipment: A Probabilistic Diagnostic Approach. IEEE Access 2026, 14, 86018–86027. [Google Scholar] [CrossRef] [Scilit]
- Liang, Y.; Zheng, H.; Li, J.; Lu, S.; Li, M.; Kang, J.; Liang, W. An Instance Segmentation and Feature Visualization Method for Multi-source Partial Discharge Diagnosis. IEEE Trans. Dielectr. Electr. Insul. 2026, 33, 1380–1390. [Google Scholar] [CrossRef] [Scilit]
- Liu, Y.; Lai, Z.; Hua, X.; Liu, H.Y.; Li, W.; Li, H.; Zhang, G.J.; Chen, X. A novel modal fusion method using cross-attention for partial discharge pattern recognition in gas insulated switchgear. Meas. Sci. Technol. 2025, 36, 086139. [Google Scholar] [CrossRef] [Scilit]
- Kluge, P.; Starzyński, J.; Kołtunowicz, W.; Bednarczyk, T.; Kolimas, Ł. Lightweight Deep Learning Framework for Real-Time PRPD-Based Insulation Defect Classification in Medium-Voltage Cable Testing. Energies 2026, 19, 2029. [Google Scholar] [CrossRef] [Scilit]
- Priananda, C.W.; Illias, H.A.; Raymond, W.J.K.; Hechifa, A.; Made Yulistya Negara, I. Detection Transformer-based Deep Learning for Multisource Partial Discharge Recognition in High-Voltage Rotating Machine Insulation. IEEE Trans. Dielectr. Electr. Insul. 2025, early access. [Google Scholar] [CrossRef] [Scilit]
- Chouaibi, S.; Ayed, M.B.; Kacem, Y.H.; AlShaya, S.A.; Tounsi, F. Fused CNN–LSTM for Within-Cycle Partial Discharge Classification From PRPD Images and Current Waveforms. IEEE Access 2025, 13, 206504–206517. [Google Scholar] [CrossRef] [Scilit]
- Kai, R.; Yamanoue, T.; Tanaka, H.; Kawano, H.; Kozako, M.; Hikita, M. A Study of PRPD Statistics to Improve the Performance of PD Detection and Defect Type Identification. In Proceedings of the 2022 9th International Conference on Condition Monitoring and Diagnosis (CMD), Kitakyushu, Japan, 13–18 November 2022; pp. 1–6. [Google Scholar] [CrossRef] [Scilit]
- Liu, S.; Wang, X.; Li, Y.; Xue, T.; Wang, G.; Zhao, J.; Cheng, X. Transformer partial discharge fault waveform recognition method based on MDW-YOLO. J. Eng. Appl. Sci. 2026, 73, 147. [Google Scholar] [CrossRef] [Scilit]
- Hu, T.; Ma, H.; Duan, D.; Dong, Y. GIS partial discharge diagnosis method under sample imbalance conditions. Int. J. Electr. Power Energy Syst. 2025, 169, 110808. [Google Scholar] [CrossRef] [Scilit]
- Das, P.; Chatterjee, S.; Koley, C. An Uniform Wideband High Frequency Current Transformer Sensor for Partial Discharge Measurement in High Voltage Apparatus. In Proceedings of the 2025 IEEE North-East India International Energy Conversion Conference and Exhibition (NE-IECCE), Silchar, India, 4–6 July 2025; pp. 1–5. [Google Scholar] [CrossRef] [Scilit]
- Ahangar, A.D.; Azirani, A.A.; Rahimi, M. Winding Configuration in High-Frequency Current Transformers for Partial-Discharge Detection in Power Cables. In Proceedings of the 2025 5th International Conference on Electrical Machines and Drives (ICEMD), Tehran, Iran, 18–19 November 2025; pp. 1–5. [Google Scholar] [CrossRef] [Scilit]
- Mandache, L.; Marinescu, A.; Dumbrava, I. A high frequency current transformer with improved low frequency current capability. Rev. Roum. Sci. Techn.–Électrotechn. Énerg. 2020, 65, 53–59. [Google Scholar]
- Fritsch, M.; Wolter, M. Saturation of High-Frequency Current Transformers: Challenges and Solutions. IEEE Trans. Instrum. Meas. 2023, 72, 9004110. [Google Scholar] [CrossRef] [Scilit]
- Nascimento, D.; Refaat, S.S.; Loschi, H.; Iano, Y.; Chuma, E.; El-Sayed, W.; Madi, A. Current sensor optimization based on simulated transfer function under partial discharge pulses. Sens. Actuators Phys. 2021, 329, 112825. [Google Scholar] [CrossRef] [Scilit]
- Yan, X.; Cheng, C.; Hu, J.; Bai, Y.; Zhang, W. Design and implementation of a novel high-frequency current transformer for partial discharge measurements. IEICE Electron. Express 2023, 20, 20230450. [Google Scholar] [CrossRef] [Scilit]
- Khamlichi, A.; Garnacho, F.; Ortego, J.; Alvarez, F.; Arcones, E. Error in the measurement of partial discharge pulses according to the frequency response of HFCT sensors. In Proceedings of the 2021 IEEE Electrical Insulation Conference (EIC), Denver, CO, USA, 7–28 June 2021; pp. 242–246. [Google Scholar] [CrossRef] [Scilit]
- Ortego, J.; Garnacho, F.; Álvarez, F.; Arcones, E.; Khamlichi, A. Locating Insulation Defects in HV Substations Using HFCT Sensors and AI Diagnostic Tools. Sensors 2024, 24, 5312. [Google Scholar] [CrossRef] [Scilit] [PubMed]
- Polyakov, D.A. Research of Partial Discharge Registration Effectiveness Using HFCT Sensor. In Proceedings of the 2022 Dynamics of Systems, Mechanisms and Machines (Dynamics), Omsk, Russia, 15–17 November 2022; pp. 1–5. [Google Scholar] [CrossRef] [Scilit]
- Fritsch, M.; Wolter, M. High-Frequency Current Transformer with Variable Air Gap for Power Cable Monitoring. IEEE Trans. Instrum. Meas. 2024, 73, 9000910. [Google Scholar] [CrossRef] [Scilit]
- Arcones, E.; Álvarez, F.; Khamlichi, A.; Garnacho, F. Scale Modular Test Platform for the Characterization of PD Measuring Systems Using HFCT Sensors. Sensors 2024, 24, 1363. [Google Scholar] [CrossRef] [Scilit] [PubMed]
- Ewaida, R.F.; Wani, N.R.; Khan, Y.; Al-Arainy, A.A. Defect Localization Inside Simulated MV Switchgear Based on Cumulative Energy Curve Using Transient Earth Voltage Sensors. Energies 2021, 14, 320. [Google Scholar] [CrossRef] [Scilit]
- Guastavino, F.; Giovanna, L.D.; Gallesi, F.; Torello, E. Transient Earth Voltage Sensor Measurements as a Nonintrusive Tool for Partial Discharge Analysis in Switchgears. IEEE Trans. Dielectr. Electr. Insul. 2024, 31, 2930–2937. [Google Scholar] [CrossRef] [Scilit]
- Ji, K.H.; Xiao, J.X.; Li, W.B.; Wang, X.F.; Song, P.; Si, W.R. Review of partial discharge detection technology for transient earth voltage of HV switchgear cabinet. In Proceedings of the 2020 13th International Conference on Intelligent Computation Technology and Automation (ICICTA), Xi’an, China, 24–25 October 2020; pp. 735–739. [Google Scholar] [CrossRef] [Scilit]
- Nguyen, K.P.; Vu, N.N.; Thang, N.D.; Quang, P.D.; Vinh, P.T. An Edge Computing for Monitoring Online Partial Discharge and Battery Management System in the Substation. In Proceedings of the 2024 International Conference on Power, Energy and Innovations (ICPEI), Nakhon Ratchasima, Thailand, 16–18 October 2024; pp. 118–123. [Google Scholar] [CrossRef] [Scilit]
- Zhao, M.; Cao, X.; Zhou, K.; Fu, Y.; Li, X.; Wan, L. Flexible Sensor Array Based on Transient Earth Voltage for Online Partial Discharge Monitoring of Cable Termination. Sensors 2020, 20, 6646. [Google Scholar] [CrossRef] [Scilit] [PubMed]
- Han, X.; Wang, H.; Sun, Y.; Chen, H.; Meng, X.; Zhou, Y.; Zhang, X.; Li, J. Partial discharge detection, diagnosis, and location technology based on a novel transient earth voltage-ultrasonic integrated sensor used for switchgear equipment. Rev. Sci. Instrum. 2024, 95, 084705. [Google Scholar] [CrossRef] [Scilit] [PubMed]
- Ibrahimkhalilov, S.; Gurbanov, C.; Muslumzade, A. Study of Transient Earth Voltage Sensor with Additional Plate. In Proceedings of the 2025 International Conference on Energy Technology and Electrical Engineering (ETEE), Shenyang, China, August 2025; Springer: Cham, Switzerland, 2025; pp. 123–126. [Google Scholar] [CrossRef] [Scilit]
- Zaeni, A.; Khayam, U.; Suwarno. The Influence of Transient Earth Voltage Sensor Dimensions on Its Performance as a PD Detector. In Proceedings of the 2024 10th International Conference on Condition Monitoring and Diagnosis (CMD), Gangneung, Republic of Korea, 20–24 October 2024; pp. 315–319. [Google Scholar] [CrossRef] [Scilit]
- Wibowo, S.H.; Khayam, U.; Kakimoto, Y.; Kozako, M.; Hikita, M. Optimization of Partial Discharge Detection Sensitivity of Transient Earth Voltage Sensors Using FDTD Modeling. In Proceedings of the 2020 International Symposium on Electrical Insulating Materials (ISEIM), Kanazawa, Japan, 13–17 September 2020; pp. 525–528. [Google Scholar]
- Zaeni, A.; Suwarno; Khayam, U. The Effect of Dielectric Thickness on TEV Sensor Performance for Enhanced Partial Discharge Detection. In Proceedings of the 2025 5th International Conference on High Voltage Engineering and Power Systems (ICHVEPS), Denpasar, Bali, Indonesia, 3–6 November 2025; pp. 365–369. [Google Scholar] [CrossRef] [Scilit]
- Lachance, M.; Rosa, F. A Comparison of PD Detection Techniques for Complete Assemblies of Air-Insulated Switchgear. In Proceedings of the 2022 IEEE Electrical Insulation Conference (EIC), Knoxville, TN, USA, 19–23 June 2022; pp. 313–317. [Google Scholar] [CrossRef] [Scilit]
- Wang, F.; Wang, N.; Zhong, L.; Chen, S.; Sun, Q.; Han, X.; Xu, P.; Liu, S.; Peng, T.; Yan, Y.; et al. Research on Recognition of Multiple Partial Discharge Sources in Switchgear Based on the Combination of GST-TEV and ResNet-18. IET Sci. Meas. Technol. 2025, 19, e70003. [Google Scholar] [CrossRef] [Scilit]
- Xie, R.; Yang, C.; Shen, Q.; Li, S.; Luo, Y.; Yu, B. Comparative Study on the Switchgear Partial Discharge Characteristics Based on Transient Earth Voltage and Pulse Current Detection Methods. Electr. Power 2022, 55, 37–47. [Google Scholar] [CrossRef]
- Zaeni, A.; Khayam, U.; Suwarno. Measurement of Partial Discharge in a GIS Model at Various Pressures Using TEV Sensor. In Proceedings of the 2024 10th International Conference on Condition Monitoring and Diagnosis (CMD), Gangneung, Republic of Korea, 20–24 October 2024; pp. 93–97. [Google Scholar] [CrossRef] [Scilit]
- Miljanovic, M.; Kearns, M.; Stewart, B.G. Simulation of TEV and RFI Detection Sensitivity Along an MV Switchgear Busbar Compartment. In Proceedings of the 2023 IEEE Electrical Insulation Conference (EIC), Quebec City, QC, Canada, 18–21 June 2023; pp. 1–4. [Google Scholar] [CrossRef] [Scilit]
- Zhang, H.; Ren, M.; Guan, H.; Dong, M. A Method for Tracing the Partial Discharge of Switchgear Based on Distributed Transient Earth Voltage Measurement. In Proceedings of the 2023 IEEE 6th International Electrical and Energy Conference (CIEEC), Hefei, China, 12–14 May 2023; pp. 2262–2267. [Google Scholar] [CrossRef] [Scilit]
- Chakravarthi, M.K.; Giridhar, A.V.; Kumar, G.A.; Sarma, D.V.S.S.S. A Compact Log Periodic Planar Dipole UHF Array Sensor for Partial Discharge Measurements. IEEE Sens. J. 2021, 21, 27748–27756. [Google Scholar] [CrossRef] [Scilit]
- Cui, Z.; Park, S.; Choo, H.; Jung, K.Y. Wideband UHF Antenna for Partial Discharge Detection. Appl. Sci. 2020, 10, 1698. [Google Scholar] [CrossRef] [Scilit]
- Uwiringiyimana, J.P.; Khayam, U.; Suwarno; Montanari, G.C. Design and Implementation of Ultra-Wide Band Antenna for Partial Discharge Detection in High Voltage Power Equipment. IEEE Access 2022, 10, 10983–10994. [Google Scholar] [CrossRef] [Scilit]
- Ghanakota, K.C.; Yadam, Y.R.; Ramanujan, S.; J., V.P.V.; Arunachalam, K. Study of Ultra High Frequency Measurement Techniques for Online Monitoring of Partial Discharges in High Voltage Systems. IEEE Sens. J. 2022, 22, 11698–11709. [Google Scholar] [CrossRef] [Scilit]
- Tian, J.; Zhang, G.; Ming, C.; He, L.; Liu, Y.; Liu, J.; Zhang, X. Design of a Flexible UHF Hilbert Antenna for Partial Discharge Detection in Gas-Insulated Switchgear. IEEE Antennas Wirel. Propag. Lett. 2023, 22, 794–798. [Google Scholar] [CrossRef] [Scilit]
- Cheng, L.; Wen, H.; Liu, Y.; Jiang, Y.; Zhou, Z.; Zhang, J.; Zhang, G.; Mao, H. Study on Flexible Built-in Miniature Archimedes Spiral Antenna Sensor for High-voltage electrical equipment PD Detection. In Proceedings of the 2022 7th Asia Conference on Power and Electrical Engineering (ACPEE), Hangzhou, China, 15–17 April 2022; pp. 1477–1482. [Google Scholar] [CrossRef] [Scilit]
- Park, S.; Jung, K.Y. Design of a Circularly-Polarized UHF Antenna for Partial Discharge Detection. IEEE Access 2020, 8, 81644–81650. [Google Scholar] [CrossRef] [Scilit]
- Yadam, Y.R.; Sarathi, R.; Arunachalam, K. Planar Ultrawideband Circularly Polarized Cosine Slot Archimedean Spiral Antenna for Partial Discharge Detection. IEEE Access 2022, 10, 35701–35711. [Google Scholar] [CrossRef] [Scilit]
- Chen, L.; Xiaoxin, C.; Xianjun, S.; Hua, X. Present Situation and Development of Internal Sensors for Ultra-high Frequency Detection in Gas Insulated Switchgear. J. Phys. Conf. Ser. 2020, 1659, 012013. [Google Scholar] [CrossRef] [Scilit]
- Yadam, Y.R.; Ramanujam, S.; Arunachalam, K. An Ultrawideband Conical Monopole with Radome for Detection of Partial Discharges. IEEE Sens. J. 2021, 21, 18764–18772. [Google Scholar] [CrossRef] [Scilit]
- Zachariades, C.; Shuttleworth, R.; Giussani, R. A Dual-Slot Barrier Sensor for Partial Discharge Detection in Gas-Insulated Equipment. IEEE Sens. J. 2020, 20, 860–867. [Google Scholar] [CrossRef] [Scilit]
- Yan, X.; Bai, Y.; Zhang, W.; Cheng, C.; Liu, J. Partial Discharge Pattern-Recognition Method Based on Embedded Artificial Intelligence. Appl. Sci. 2023, 13, 10370. [Google Scholar] [CrossRef] [Scilit]
- Lai, K.X.; Affandi, N.F.B.M.; Lo, K.W.; Lee, J.C.F.; Leck, B.H.; Bin Mashure, M.F.; Li, J.; Thantirige, K.J.; Tay, J.Z.W. Machine Learning Application on Medium Voltage Asset Sensing through High Frequency Current Transformer. In Proceedings of the 2025 25th Conference of the Electric Power Supply Industry (CEPSI), Singapore, 28 October–1 November 2025; pp. 7–12. [Google Scholar] [CrossRef] [Scilit]
- Yan, Y.; Ren, S.; Lu, Y.; Yang, S.; Zhao, K.; Li, H. Efficient and Low-Cost PD Monitoring and Locating System for MV Switchgears Using TEV Detectors. IEEE Trans. Power Deliv. 2021, 36, 3266–3269. [Google Scholar] [CrossRef] [Scilit]
- Azam, S.M.K.; Bin, M.; Latef, T.; Illias, H.; Ain, M.; Qasaymeh, Y. Wideband Antenna with UHF Sensor Applicability for HV Equipment in Smart Grid. In Proceedings of the Proceedings of the International Conference on Artificial Life and Robotics, Online, 20–23 January 2022; Volume 27, pp. 1–7. [Google Scholar] [CrossRef] [Scilit]
- Bandi, T.; Ohtsuka, S. A Multiple Narrow Band Antenna for Detection of Discharge-Emitted Electromagnetic Waves for Insulation Diagnostic. IEEJ Trans. Electr. Electron. Eng. 2020, 15, 1751–1757. [Google Scholar] [CrossRef] [Scilit]
- True, P.; Gräf, T.; Menge, M. Implementation of an AI-based Compression Method for Current Waveforms of Partial Discharges in AC and DC High Voltage Systems. In Proceedings of the 2024 IEEE International Conference on High Voltage Engineering and Applications (ICHVE), Berlin, Germany, 18–22 August 2024; pp. 1–4. [Google Scholar] [CrossRef] [Scilit]
- Gillis, T.; Fagnard, J.F.; Vanderbemden, P. Development of a Microcontroller-Based Phase-Resolved Partial Discharge Measurement System with Application to the Monitoring of Flash Sintering Discharge Patterns. IEEE Sens. J. 2023, 23, 22704–22712. [Google Scholar] [CrossRef] [Scilit]
- Upton, D.W.; Haigh, R.P.; Mather, P.J.; Lazaridis, P.I.; Mistry, K.K.; Zaharis, Z.D.; Tachtatzis, C.; Atkinson, R.C. Gated Pipelined Folding ADC-Based Low Power Sensor for Large-Scale Radiometric Partial Discharge Monitoring. IEEE Sens. J. 2020, 20, 7826–7836. [Google Scholar] [CrossRef] [Scilit]
- Choudhary, M.; Kiitam, I.; Palu, I. An Integrated Approach for Pulse Detection and Classification of Partial Discharge (PD) Signals. In Proceedings of the 2025 IEEE 66th International Scientific Conference on Power and Electrical Engineering of Riga Technical University (RTUCON), Riga, Latvia, 23–25 October 2025; pp. 1–7. [Google Scholar] [CrossRef] [Scilit]
- Banbury, C.; Reddi, V.J.; Torelli, P.; Holleman, J.; Jeffries, N.; Kiraly, C.; Montino, P.; Kanter, D.; Ahmed, S.; Pau, D.; et al. MLPerf Tiny Benchmark. arXiv 2021, arXiv:2106.07597. [Google Scholar] [CrossRef] [Scilit]
- Bartoli, P.; Veronesi, C.; Giudici, A.; Siorpaes, D.; Trojaniello, D.; Zappa, F. Benchmarking Energy and Latency in TinyML: A Novel Method for Resource-Constrained AI. arXiv 2025, arXiv:2505.15622. [Google Scholar] [CrossRef] [Scilit]
- Schauer, J.; Goodarzi, P.; Morsch, J.; Schütze, A. A Performance Study of Deep Neural Network Representations of Interpretable ML on Edge Devices with AI Accelerators. Sensors 2025, 25, 5681. [Google Scholar] [CrossRef] [Scilit] [PubMed]
- Balouji, E.; Hammarstrom, T.; McKelvey, T. Classification of Partial Discharges Originating From Multilevel PWM Using Machine Learning. IEEE Trans. Dielectr. Electr. Insul. 2022, 29, 287–294. [Google Scholar] [CrossRef] [Scilit]
- Kumar, D.; Azam, S.M.K.; Raymond, W.J.K.; Illias, H.A.; Othman, M.; Latef, T.A.; Ababneh, A.; Hossain, A.K.M.Z.; Ibrahim, M.M. Clarity-Optimized Wavelet with Autoencoder- ReliefF Ranking for Enhanced UHF PD Signal Feature Extraction. IEEE Access 2025, 13, 182444–182457. [Google Scholar] [CrossRef] [Scilit]
- Sahoo, R.; Karmakar, S. Comparative analysis of machine learning and deep learning techniques on classification of artificially created partial discharge signal. Measurement 2024, 235, 114947. [Google Scholar] [CrossRef] [Scilit]
- Abubakar, A.; Zachariades, C. Phase-Resolved Partial Discharge (PRPD) Pattern Recognition Using Image Processing Template Matching. Sensors 2024, 24, 3565. [Google Scholar] [CrossRef] [Scilit] [PubMed]
- Soh, D.; Krishnan, S.B.; Abraham, J.; Xian, L.K.; Jet, T.K.; Yongyi, J.F. Partial Discharge Diagnostics: Data Cleaning and Feature Extraction. Energies 2022, 15, 508. [Google Scholar] [CrossRef] [Scilit]
- Carvalho, I.F.; Da Costa, E.G.; Nobrega, L.A.M.M.; Silva, A.D.D.C. Identification of Partial Discharge Sources by Feature Extraction from a Signal Conditioning System. Sensors 2024, 24, 2226. [Google Scholar] [CrossRef] [Scilit] [PubMed]
- Hussain, G.A.; Hassan, W.; Mahmood, F.; Kay, J.A. Separation of Partial Discharge Faults in Metal-clad Switchgear Based on Pulse Shape Analysis. In Proceedings of the 2022 IEEE Electrical Insulation Conference (EIC), Knoxville, TN, USA, 19–23 June 2022; pp. 323–328. [Google Scholar] [CrossRef] [Scilit]
- Jia, Z.; Fan, S.; Wang, Z.; Shao, S.; He, D. Partial discharge defect recognition method of switchgear based on cloud-edge collaborative deep learning. Sci. Rep. 2025, 15, 10956. [Google Scholar] [CrossRef] [Scilit] [PubMed]
- Yoon, S.H.; Kwon, I.S.; Lim, J.S.; Park, B.B.; Lee, S.W.; Kim, H.J. Enhanced Clustering of DC Partial Discharge Pulses Using Multi-Level Wavelet Decomposition and Principal Component Analysis. Energies 2025, 18, 4835. [Google Scholar] [CrossRef] [Scilit]
- Martinovic, T.; Fulnecek, J. Fast Algorithm for Contactless Partial Discharge Detection on Remote Gateway Device. IEEE Trans. Power Deliv. 2022, 37, 2122–2130. [Google Scholar] [CrossRef] [Scilit]
- Wotzka, D.; Sikorski, W.; Szymczak, C. Investigating the Capability of PD-Type Recognition Based on UHF Signals Recorded with Different Antennas Using Supervised Machine Learning. Energies 2022, 15, 3167. [Google Scholar] [CrossRef] [Scilit]
- Chen, S.; Illias, H.A.; Wong, J.K.R.; Mansor, N.N. Denoising of partial discharges in switchgear insulation material using hybrid wavelet denoising-optimization-machine learning. Ain Shams Eng. J. 2024, 15, 103032. [Google Scholar] [CrossRef] [Scilit]
- Sahoo, R.; Karmakar, S. Effectiveness of Wavelet Scalogram on Partial Discharge Pattern Classification of XLPE Cable Insulation. IEEE Trans. Instrum. Meas. 2024, 73, 2507910. [Google Scholar] [CrossRef] [Scilit]
- Ardila-Rey, J.A.; Schurch, R.; Poblete, N.M.; Govindarajan, S.; Munoz, O.; De Castro, B.A. Separation of Partial Discharges Sources and Noise Based on the Temporal and Spectral Response of the Signals. IEEE Trans. Instrum. Meas. 2021, 70, 3526013. [Google Scholar] [CrossRef] [Scilit]
- Albarracín-Sánchez, R.; Álvarez Gómez, F. Separation of Partial Discharge Sources Measured in the High-Frequency Range with HFCT Sensors Using PRPD-teff Patterns. Sensors 2020, 20, 382. [Google Scholar] [CrossRef] [Scilit] [PubMed]
- Butdee, J.; Kongprawechnon, W.; Nakahara, H.; Chayopitak, N.; Kingkan, C.; Pupadubsin, R. Pattern Recognition of Partial Discharge Faults Using Convolutional Neural Network (CNN). In Proceedings of the 2023 8th International Conference on Control and Robotics Engineering (ICCRE), Niigata, Japan, 21–23 April 2023; pp. 61–66. [Google Scholar] [CrossRef] [Scilit]
- Almehdhar, A.; Prochazka, R. Classification of Multiple Partial Discharge Sources Using Time-Frequency Analysis and Deep Learning. Appl. Sci. 2025, 15, 5455. [Google Scholar] [CrossRef] [Scilit]
- Deng, Y.; Zhu, K.; Liu, J.; Liu, H. MRATNet: Learning Discriminative Features for Partial Discharge Pattern Recognition via Transformers. IEEE Trans. Dielectr. Electr. Insul. 2024, 31, 2198–2207. [Google Scholar] [CrossRef] [Scilit]
- Raymond, W.J.K.; Azil Illias, H.; Mokhlis, H. Novel data augmentation for improved insulation fault diagnosis under nonideal condition. Expert Syst. Appl. 2022, 209, 118390. [Google Scholar] [CrossRef] [Scilit]
- Klein, L.; Žmij, P.; Krömer, P. Partial Discharge Detection by Edge Computing. IEEE Access 2023, 11, 44192–44204. [Google Scholar] [CrossRef] [Scilit]
- Wang, C.; Yang, J.; Li, Y.; Wang, Z.; Jie, H.; Zheng, Z.; Zhao, Z.; Shu, Z.; Guo, Y. A Spike-Driven Transformer Network for Edge Computing-Based Partial Discharge Monitoring Using Ultrahigh Frequency Pulse Signals. IEEE Trans. Microw. Theory Tech. 2025, 73, 8071–8082. [Google Scholar] [CrossRef] [Scilit]
- Su, H.; Yao, L. An On-line Partial Discharge Diagnostic System for Transformer Based on Lightweight Neural Networks. In Proceedings of the 2025 Asia Meeting on Environment and Electrical Engineering (EEE-AM), Hanoi, Vietnam, 5–7 November 2025; pp. 1–5. [Google Scholar] [CrossRef] [Scilit]
- Mantach, S.; Gill, P.; Oliver, D.R.; Ashraf, A.; Kordi, B. An interpretable CNN model for classification of partial discharge waveforms in 3D-printed dielectric samples with different void sizes. Neural Comput. Appl. 2022, 34, 11739–11750. [Google Scholar] [CrossRef] [Scilit]
- Sim, H.W.B.; Krishnan, S.B.; Lai, K.X. AI-Augmented Partial Discharge Analytics for TEV-Based Monitoring. Appl. Sci. 2026, 16, 4462. [Google Scholar] [CrossRef] [Scilit]
- Zheng, H.; Liang, Y.; Li, J.; Yang, D.; Jing, J.; Li, P.; Kang, J.; Liang, W. A Visual Diagnosis Method of Power Transformer Multi-Source Partial Discharge Based on YOLO-URLKS. IEEE Trans. Power Deliv. 2025, 40, 2533–2545. [Google Scholar] [CrossRef] [Scilit]
- Wu, M.; Jiang, W.; Shen, D.; Luo, Y.; Yang, J. Multi-Source Partial Discharge Pattern Recognition Algorithm Based on DCGAN-YOLOv5. IEEE Trans. Power Deliv. 2025, 40, 2983–2992. [Google Scholar] [CrossRef] [Scilit]
- Wang, C.; Wang, Z.; Liu, Q.; Dong, H.; Liu, W.; Liu, X. A comprehensive survey on domain adaptation for intelligent fault diagnosis. Knowl.-Based Syst. 2025, 327, 114109. [Google Scholar] [CrossRef] [Scilit]
- Niazi, M.T.K.; Hussain, M.R.; Park, C. Confidence-Level-Based Semi-Supervised Machine Learning Approach for Partial Discharge Signal Classification. In Proceedings of the 2022 IEEE Transportation Electrification Conference & Expo (ITEC), Anaheim, CA, USA, 15–17 June 2022; pp. 912–916. [Google Scholar] [CrossRef] [Scilit]
- Dong, C.; Pang, X.; Lu, S.; Zhao, J.; Liu, Z.; Xie, J. Partial Discharge Data Augmentation and Pattern Recognition for Unbalanced and Small Sample Scenarios. J. Phys. Conf. Ser. 2023, 2477, 012078. [Google Scholar] [CrossRef] [Scilit]
- Vo-Nguyen, T.D.; Do, T.D.; Tran-Thi, N.D.; Youn, Y.W.; Kim, Y.H. One-Shot Learning for Partial Discharge Diagnosis Using Ultra-High-Frequency Sensor in Gas-Insulated Switchgear. Sensors 2020, 20, 5562. [Google Scholar] [CrossRef] [Scilit] [PubMed]
- Tai, H.T.; Youn, Y.W.; Choi, H.S.; Kim, Y.H. Self-supervised learning-based Partial Discharge Diagnosis in Gas-insulated Switchgear. In Proceedings of the 2024 3rd International Conference on Power Systems and Electrical Technology (PSET), Tokyo, Japan, 5–8 August 2024; pp. 8–13. [Google Scholar] [CrossRef] [Scilit]
- Zhang, Y.; Xie, Q.; Xie, J.; Wang, C.; Zheng, Y.; Xie, C. An Automatic Annotation and Pattern Recognition Method Based on Semisupervised ACGAN for Multisource Partial Discharge Diagnosis. IEEE Trans. Dielectr. Electr. Insul. 2024, 31, 3001–3010. [Google Scholar] [CrossRef] [Scilit]
- Tuyet-Doan, V.N.; Youn, Y.W.; Choi, H.S.; Kim, Y.H. Shared Knowledge-Based Contrastive Federated Learning for Partial Discharge Diagnosis in Gas-Insulated Switchgear. IEEE Access 2024, 12, 34993–35007. [Google Scholar] [CrossRef] [Scilit]
- Di Fatta, A.; Imburgia, A.; Romano, P.; Rizzo, G.; Akbar, G.; Alqutish, M.; Vigni, V.L.; Ala, G.; Candela, R. Comparative Analysis of Dimensionality Reduction Techniques for Partial Discharge Dataset. In Proceedings of the 2025 IEEE Conference on Electrical Insulation and Dielectric Phenomena (CEIDP), Manchester, UK, 14–17 September 2025; pp. 289–292. [Google Scholar] [CrossRef] [Scilit]
- Rhamdhani, T.; Khayam, U.; Zaeni, A. Improving Antenna Performance by Combining Dipole and Bowtie Antenna for Partial Discharge Measurement in Gas Insulated Switchgear. In Proceedings of the 2022 IEEE International Conference in Power Engineering Application (ICPEA), Shah Alam, Malaysia, 7–8 March 2022; pp. 1–4. [Google Scholar] [CrossRef] [Scilit]
- Uwiringiyimana, J.P.; Khayam, U.; Suwarno; Montanari, G.C. Comparative Analysis of Partial Discharge Detection Features Using a UHF Antenna and Conventional HFCT Sensor. IEEE Access 2022, 10, 107214–107226. [Google Scholar] [CrossRef] [Scilit]
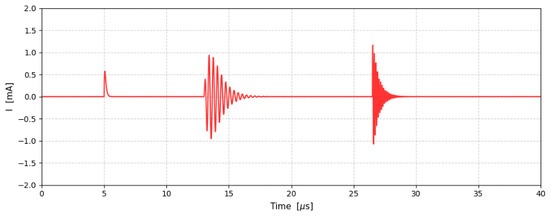
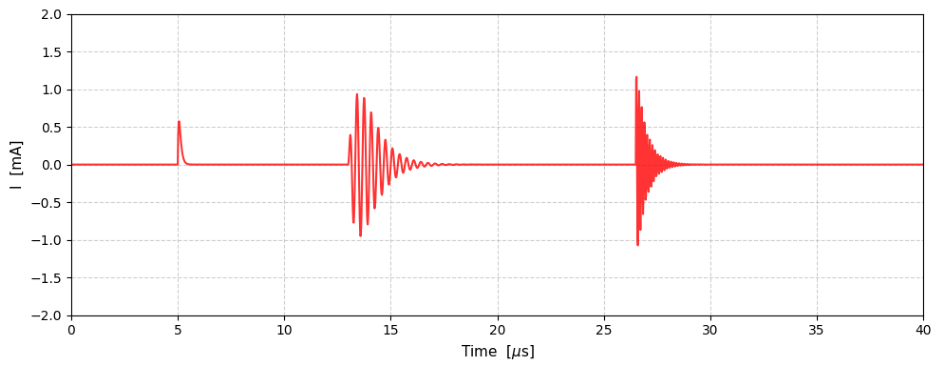


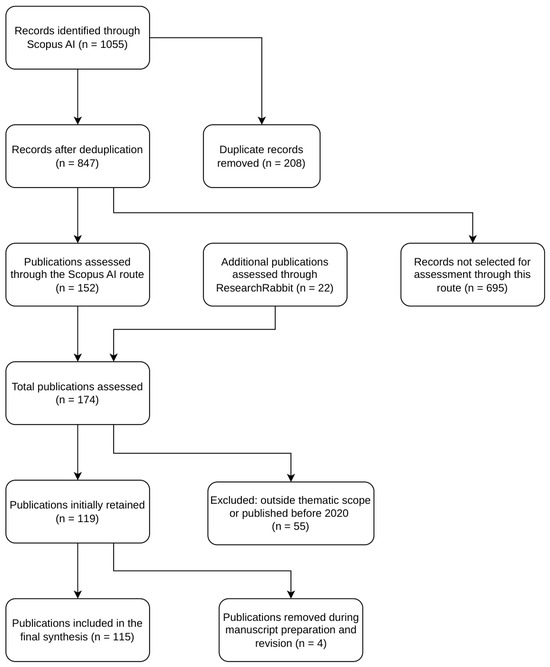
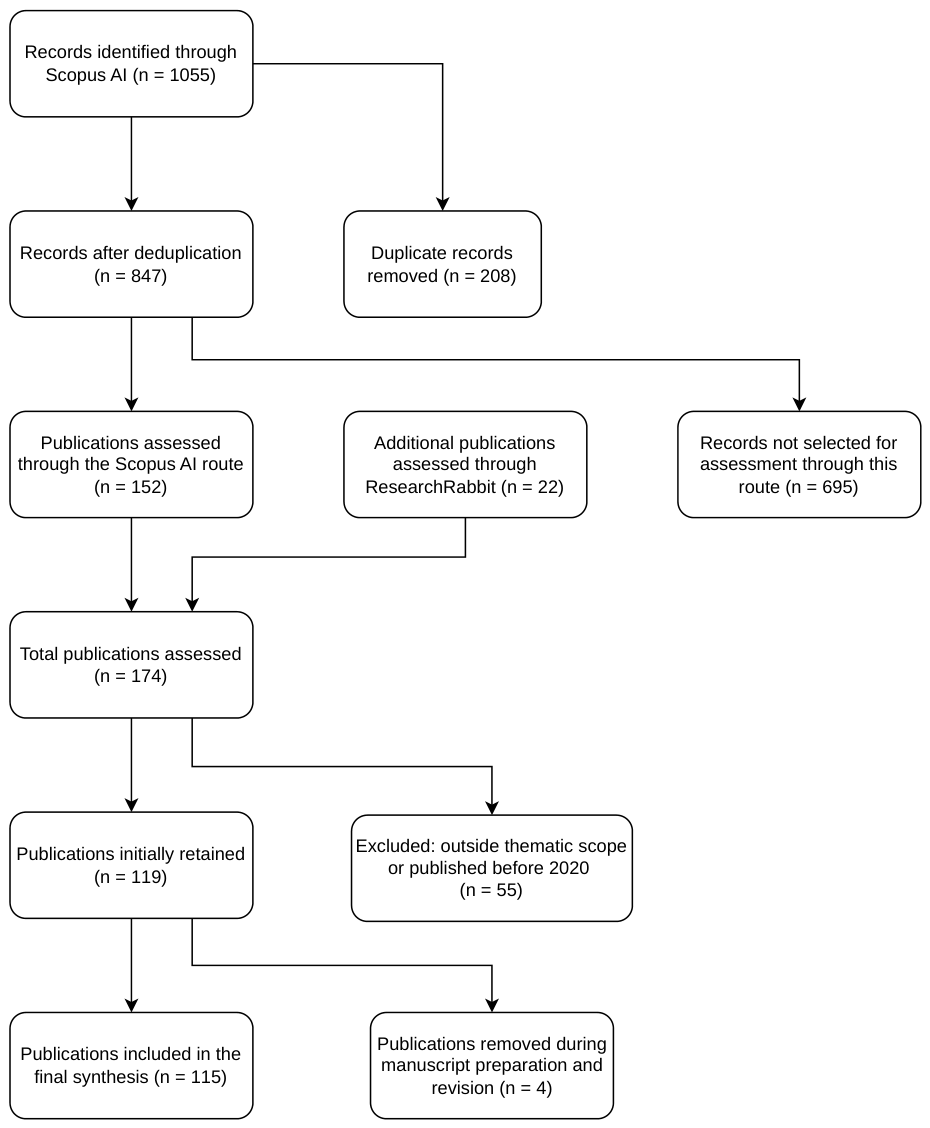
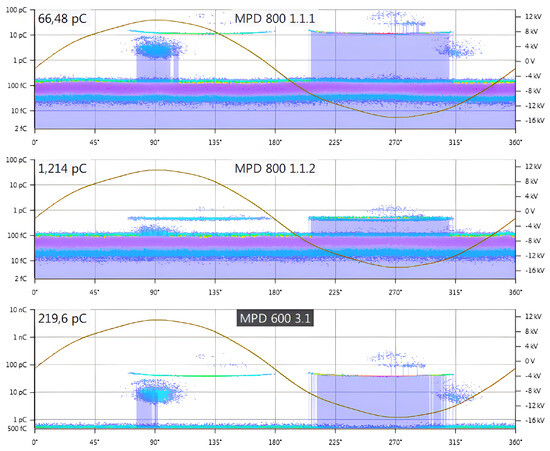
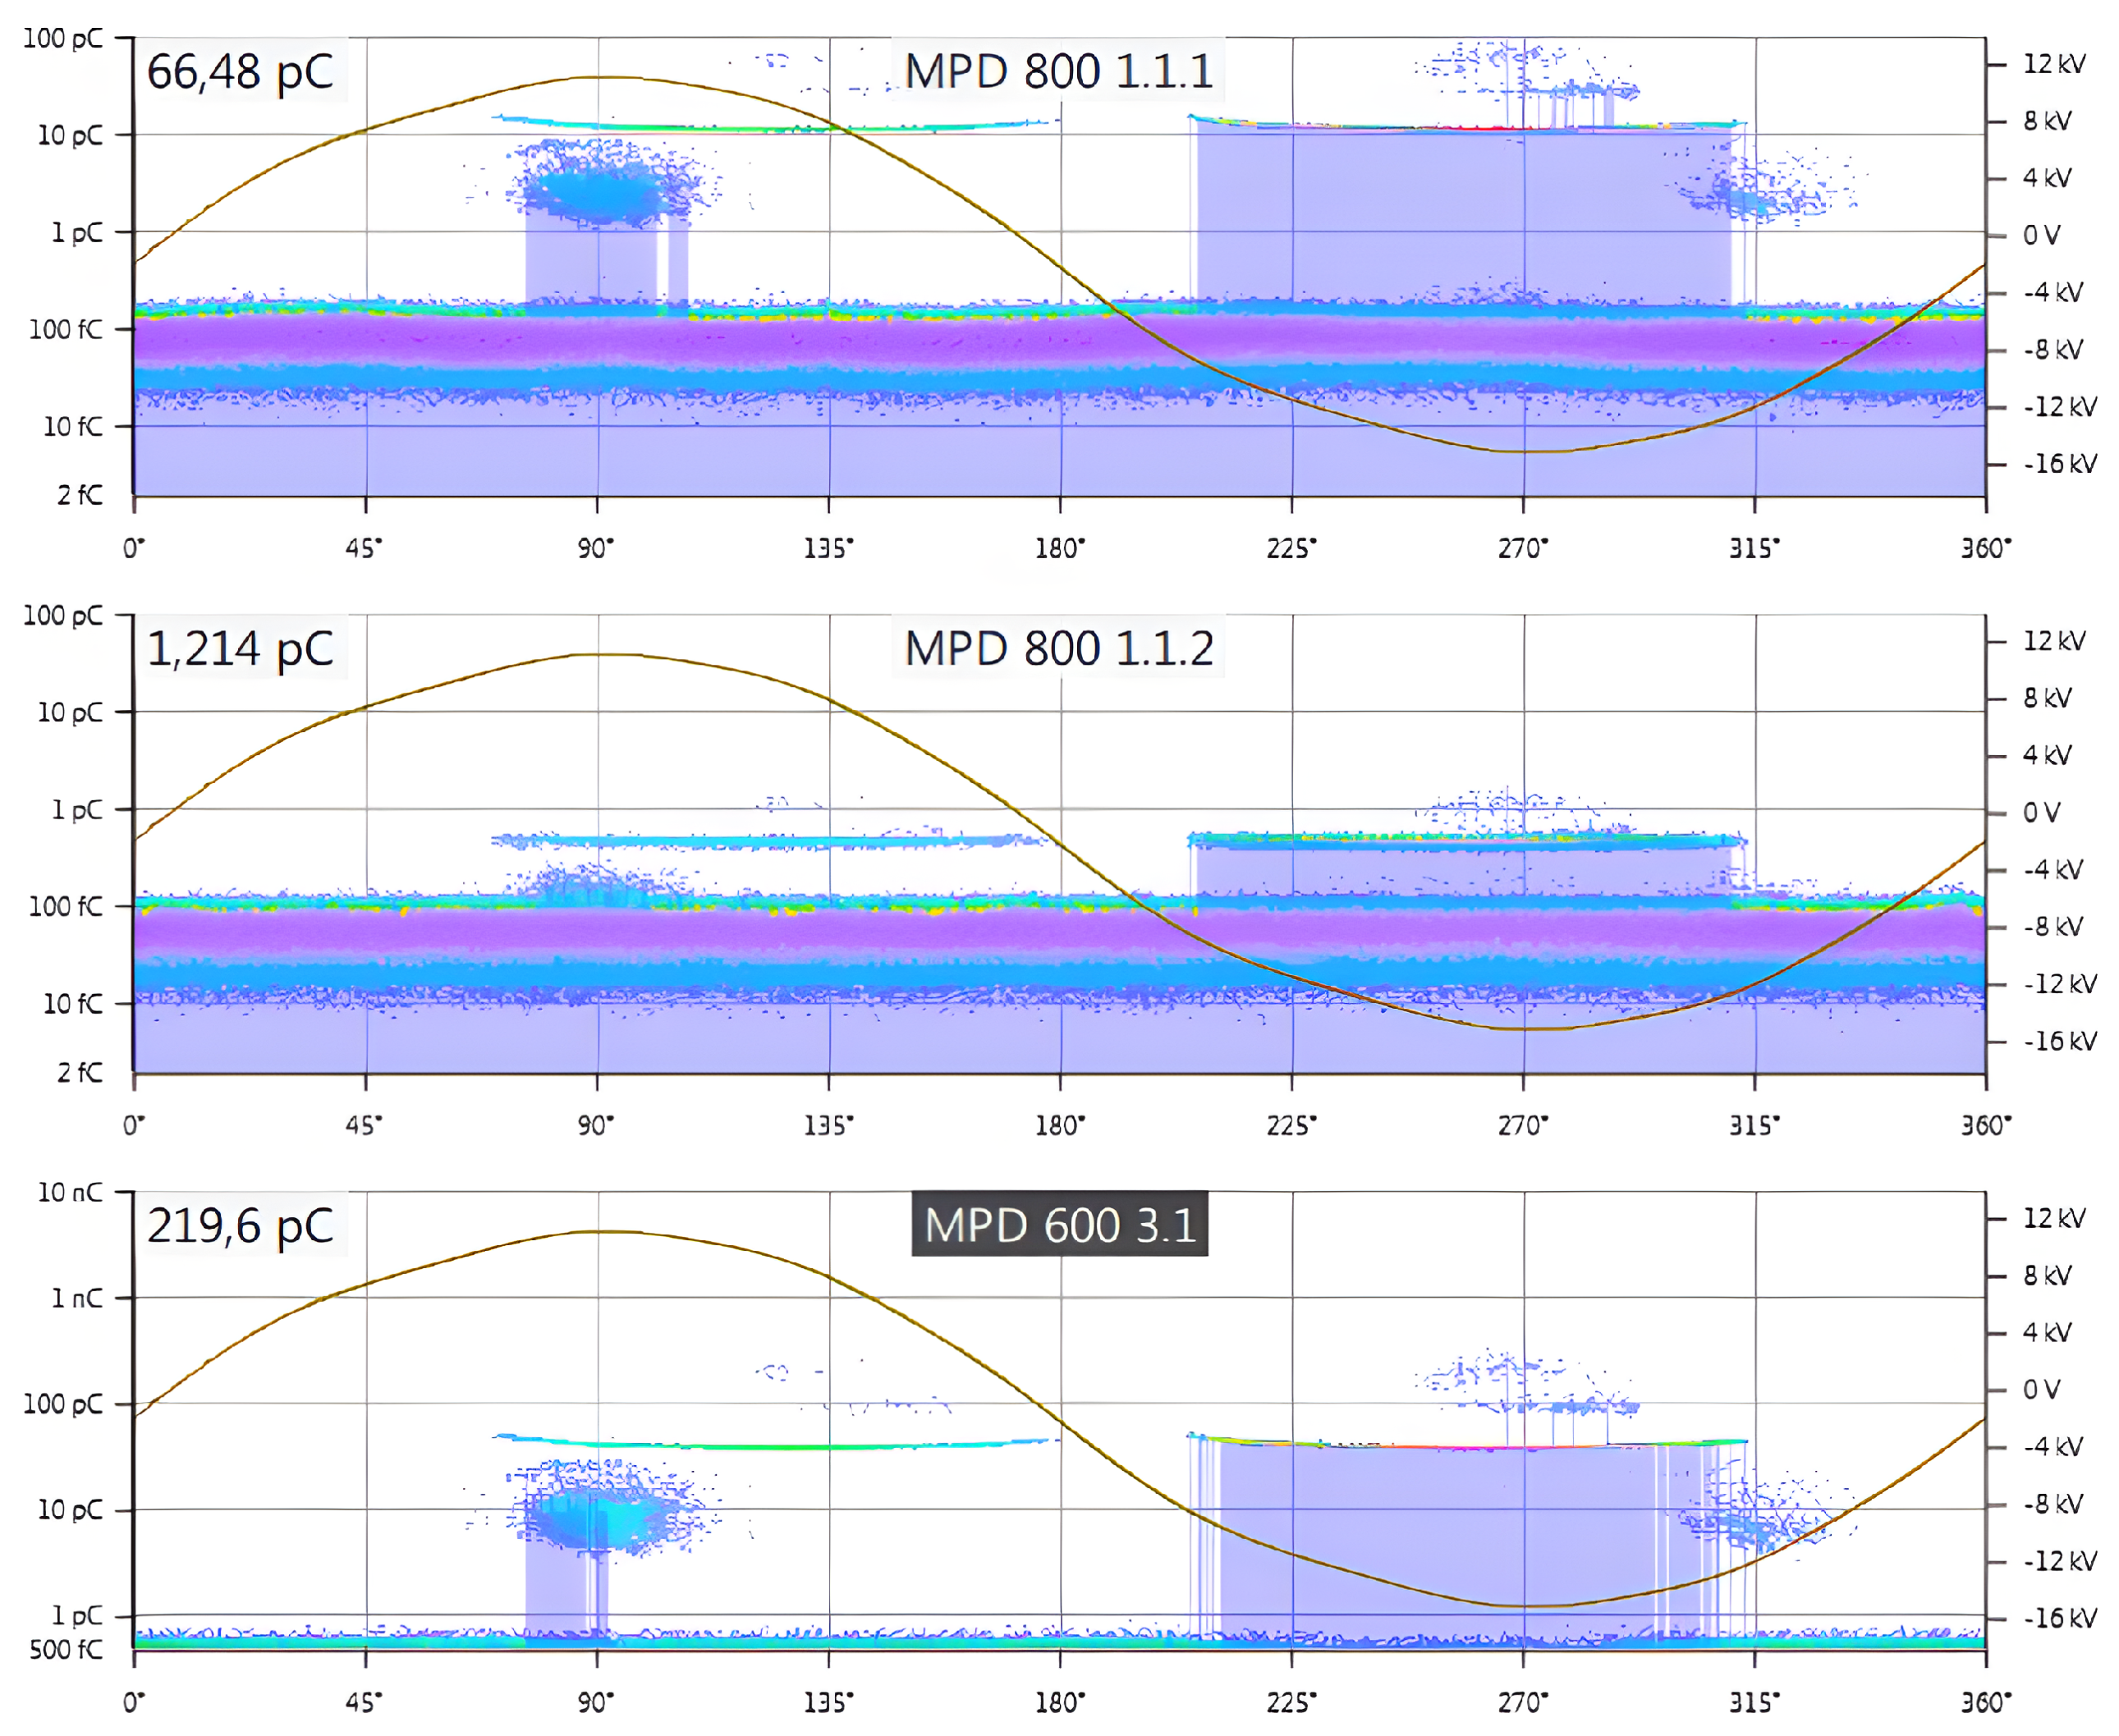
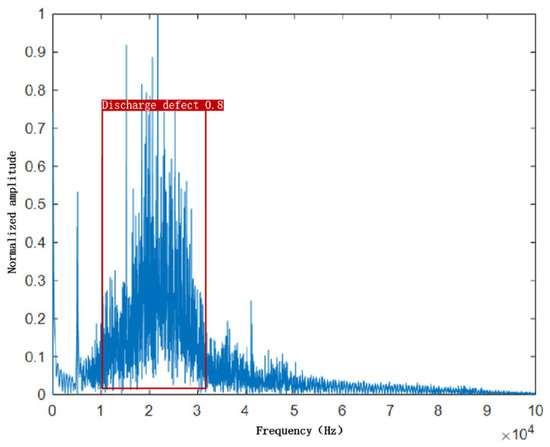
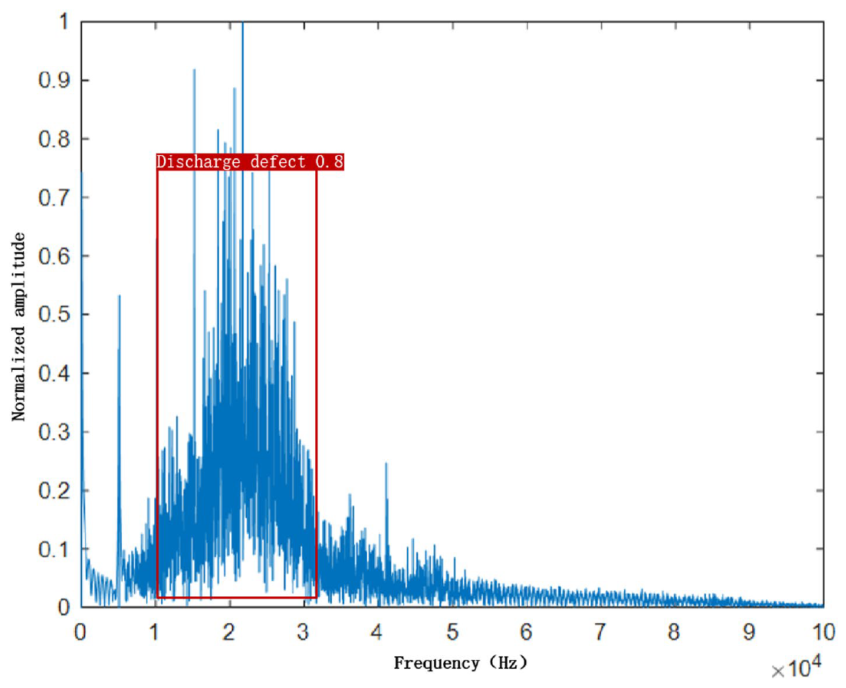
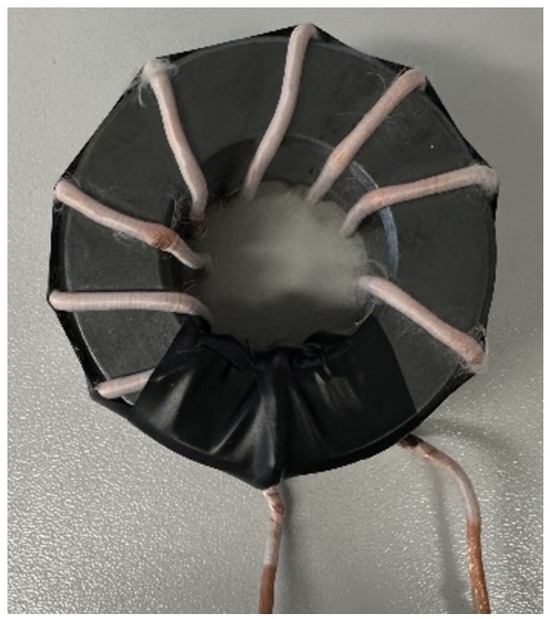
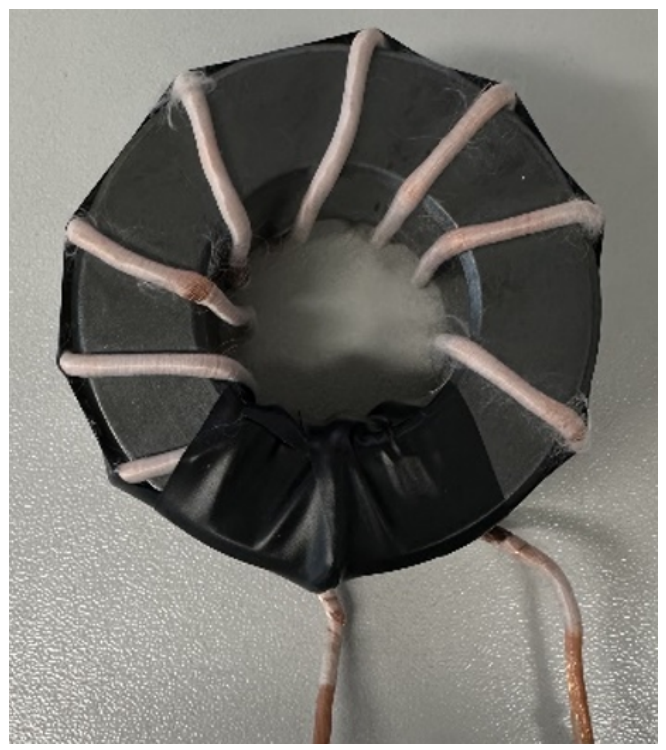
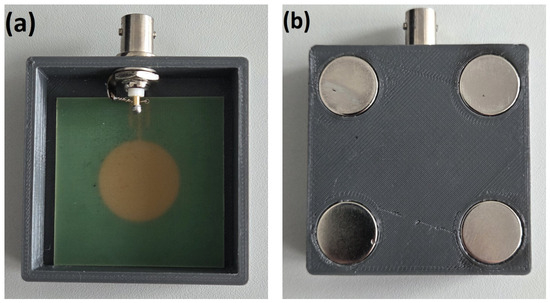
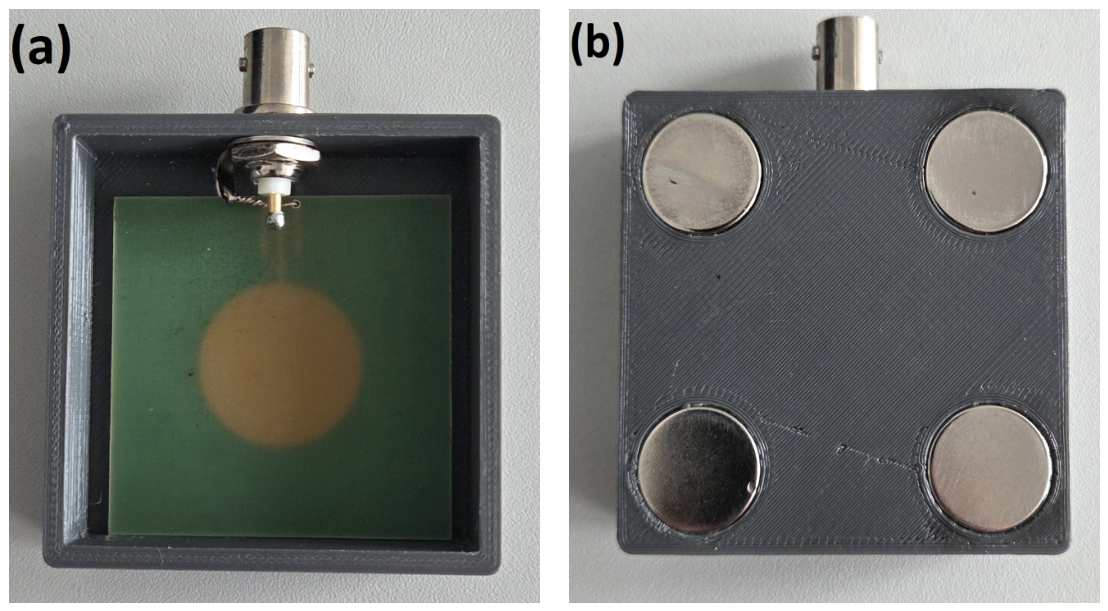
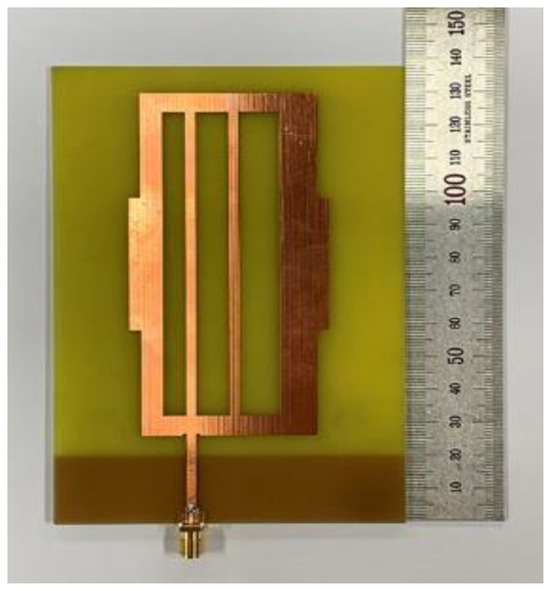
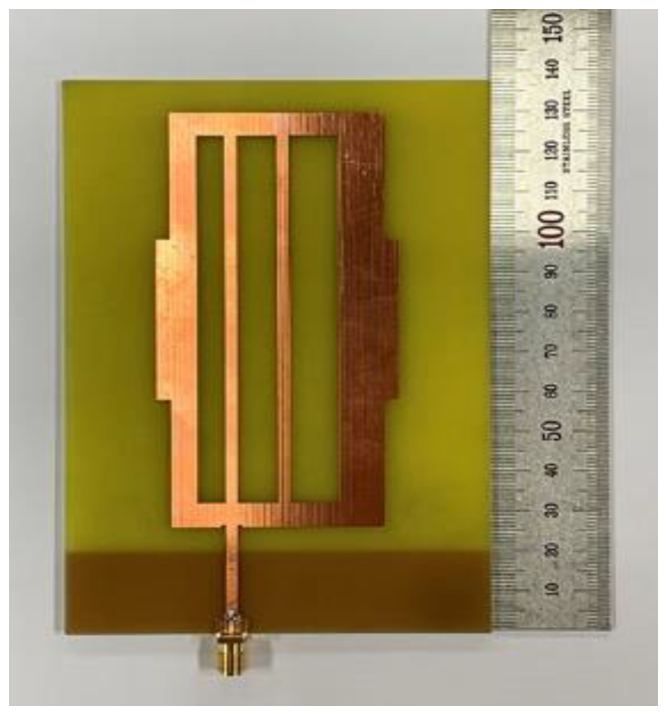
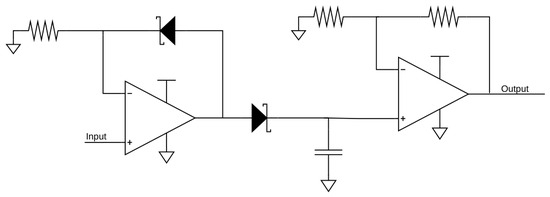
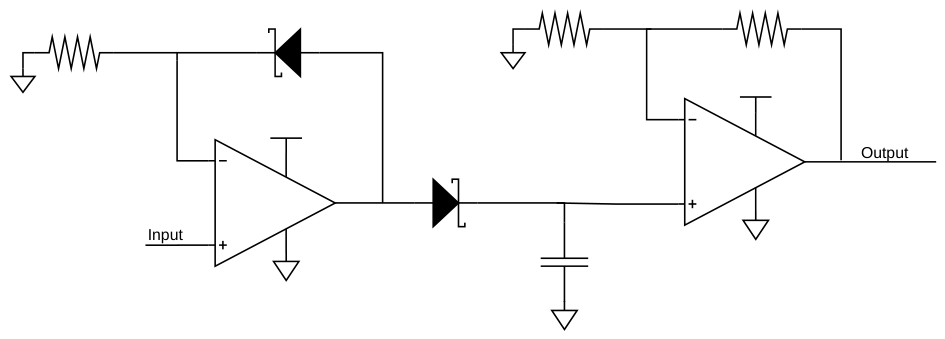
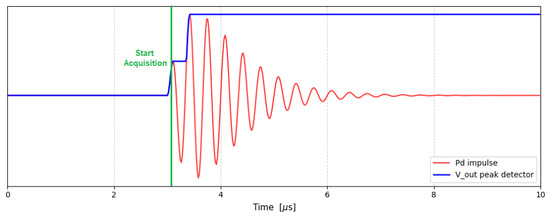
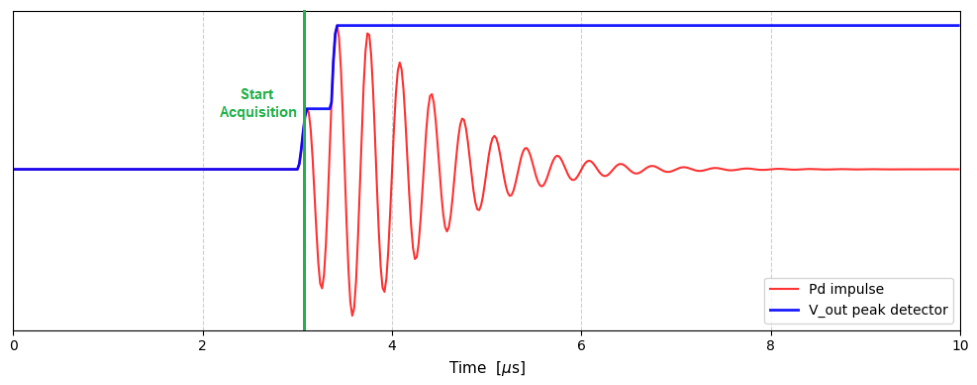
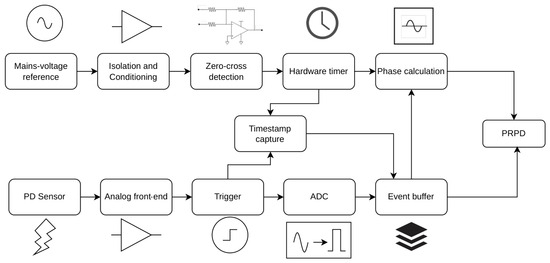
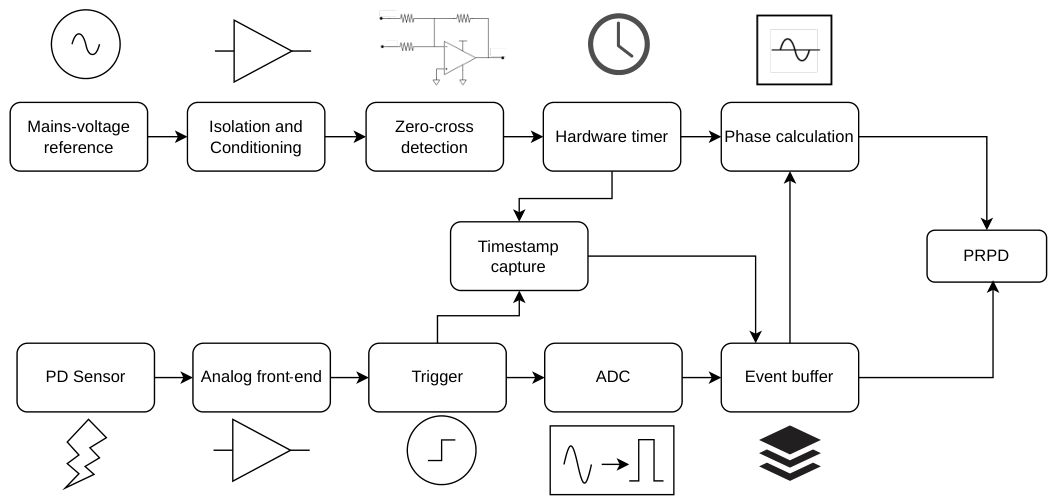
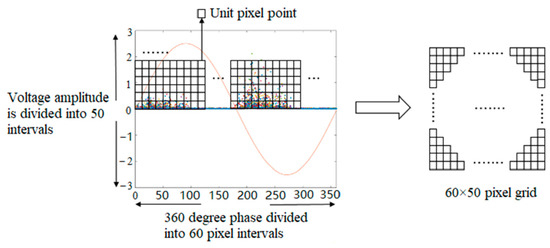
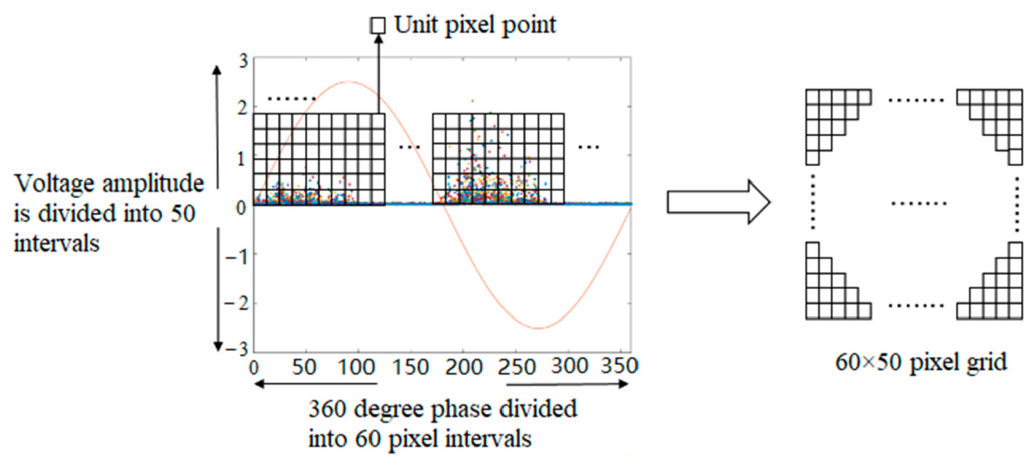

Disclaimer/Publisher’s Note: The statements, opinions and data contained in all publications are solely those of the individual author(s) and contributor(s) and not of MDPI and/or the editor(s). MDPI and/or the editor(s) disclaim responsibility for any injury to people or property resulting from any ideas, methods, instructions or products referred to in the content. |
© 2026 by the authors. Licensee MDPI, Basel, Switzerland. This article is an open access article distributed under the terms and conditions of the Creative Commons Attribution (CC BY) license.