


Abstract
Nitric acid production is among the most significant industrial point sources of nitrous oxide, which is a greenhouse gas with a global warming potential approximately 298 times that of carbon dioxide, yet the large installed base of legacy dual-pressure plants continues to operate with non-selective catalytic tail gas treatment systems that offer limited greenhouse gas abatement and impose rigid thermal constraints on the gas turbine cycle. A validated steady-state process model of an industrial dual-pressure nitric acid plant producing 52.1 t per hour of nitric acid on a 100% HNO3 basis, corresponding to 88.1 t per hour of 59.2 wt.% product acid, is developed, validated against measured plant data, and used to evaluate two selective catalytic retrofit configurations. The first heats raw tail gas to catalyst ignition temperature using the existing process heater, then raises the purified gas to turbine inlet conditions by mixing with flue gas from a newly installed combustion chamber. The second achieves the required temperature rise internally through catalytic fuel gas oxidation within an additional catalyst shelf in a two-bed reactor, eliminating supplementary combustion equipment entirely. The first configuration reduces total greenhouse gas emissions by 42% in carbon dioxide equivalent terms, lowers ammonia slip below 5 ppmv, and enables a 5% production capacity increase worth 5.75 million EUR per year, at a capital cost of 5.25 million EUR and a discounted payback period of 12 months when European Union Emissions Trading System allowance savings are credited; excluding those savings the investment is not recovered within the five-year evaluation horizon. The second achieves a 44% emissions reduction at a capital cost of 1.98 million EUR, reduces annual utility costs by 1.75 million EUR, and recovers its investment within 4 months with allowance savings and 17 months without them, in both cases without increasing electricity demand. The results demonstrate that selective catalytic tail gas treatment retrofit is a value-generating investment rather than a compliance cost. Projected across the global fleet of unabated dual-pressure plants, equivalent adoption could reduce sectoral nitrous oxide emissions by up to 21.6 Mt of carbon dioxide equivalent per year, or 6.5 Mt per year at a 30% adoption rate.
1. Introduction
1.1. State-of-the-Art Analysis
Nitrogen-based fertilisers are indispensable in sustaining modern agricultural productivity, yet their widespread use is a major contributor to environmental degradation, particularly through emissions of reactive nitrogen compounds. The primary concern focuses on nitrous oxide, a potent greenhouse gas with approximately 298 times the global warming potential of carbon dioxide over a 100-year period [1]. Additionally, nitrogen fertilisers contribute to ammonia volatilisation, which affects air quality and leads to secondary particulate formation, as well as to nitrate leaching, which causes groundwater contamination.
Nitric acid plays a central role in global nitrogen-based fertiliser production and is one of the most important commodity chemicals in the industrial sector. Nitric acid is industrially synthesised through three primary process routes, all of which are well-established: the mono-pressure, dual-pressure, and high-pressure processes [2]. Recent simulation-based optimisations using the ProSimPlus process modelling environment have demonstrated significant improvements in the mono-pressure process. These include a 55% reduction in NOx emissions and an 18% increase in nitric acid productivity, primarily achieved through advanced reactor design and refined operating conditions [3]. However, a key limitation of this optimised configuration is its reliance on a cooling water supply maintained at 5 °C to support efficient gas-phase reactions and condensation processes. Generating such low-temperature cooling water imposes an additional energy burden, partially offsetting the gains in energy efficiency and posing challenges for implementation in regions with limited access to low-cost cooling utilities. The dual-pressure process for nitric acid production has the capability to increase yield, achieving higher concentrations [2]. The notable benefit of dual-pressure methodology is its operation at a lower oxidation pressure, which diminishes the detrimental effects on the catalyst, a critical factor given the high costs and lower nitric acid concentration at the condenser exit. This improves the acid’s solubility in water for more efficient absorption. Process intensification of NO oxidation at nitric acid plants under different pressures and temperatures has also been investigated, demonstrating the potential for additional heat recovery at reduced investment cost [4].
The manufacture and utilisation of nitric acid raise substantial environmental issues, primarily due to the release of nitrous oxide (N2O), a highly potent greenhouse gas generated during the catalytic oxidation processes. Industrial nitric acid production facilities rank among the most significant point sources of anthropogenic N2O emissions worldwide. In response to these concerns, extensive research and financial resources have been allocated toward the development of abatement technologies [5]. These include the implementation of secondary and tertiary catalytic systems designed to capture or decompose N2O emissions prior to their atmospheric release, thereby mitigating their environmental impact [6]. Recent industrial deployments of a new catalyst have achieved an N2O emission reduction of 690 kilotons of CO2 equivalent per year at one plant [7] and a further 275 kilotons of CO2 equivalent per year at a second facility [8]. Catalyst ageing significantly impacts operational expenses and N2O emissions, leading to substantial research initiatives aimed at addressing these challenges [9]. Tail gas in nitric acid production can be treated by extended absorption of NO2, selective catalytic NOx reduction with ammonia [10], and non-selective NOx reduction with hydrogen and natural gas [11]. Researchers investigated and tested different catalysts. Three methods for the removal of N2O utilising a promoted Fe-ZSM-5 catalyst have been investigated under conditions that simulate the off gases produced by a nitric acid plant [12]. The pressure elevation is essential, as reported by the researchers, and the most difficult component is methane. The ageing of Fe-zeolite catalysts was investigated, and recommendations for industrial use were proposed [9]. The negative impact of NOx presence in tail gas was investigated using a double-promoted cobalt spinel catalyst, which concluded that even a low concentration of NOx affects it seriously [13]. Uhde EnviNOx technology may achieve N2O removal rates of 98–99% as reported in [14], and a special configuration of the reactor is needed to perform the process. A nickel-based catalyst demonstrated an N2O conversion of 76% at 400 °C [15]. Emissions measurement and monitoring have improved with the integration of static chamber methods, eddy covariance systems, and process-based modelling tools. These tools support more accurate emissions inventories and inform mitigation strategies [16].
The investigation of process parameters of a mono-pressure nitric acid plant by process simulation was performed using a comprehensive mathematical model [17]. A comprehensive exergy destruction analysis performed on nitric acid production plants based on the Ostwald process has revealed significant opportunities for enhancing overall energy efficiency [6]. The simulation of the Ostwald process was performed in [18] to understand the process thermodynamics, but the concentration of the final acid reaches 35.3% wt. Exergy analysis, a powerful thermodynamic tool, has also been employed to assess the environmental impacts associated with chemical processes [2]. This approach has been further refined through integration with sustainability metrics, leading to measurable improvements in system performance. For example, optimisation of compressor operating conditions, specifically through pressure adjustments, has demonstrated a 3% increase in exergy efficiency [19]. In parallel, process simulations of nitric acid plants have largely concentrated on identifying optimal operational parameters to improve performance and product yield [17]. These simulations have been carried out using advanced process modelling tools such as Aspen HYSYS [20] and Aspen Plus [21], enabling detailed investigations into parameter variations and their influence on the concentration of nitric acid in the final product stream. In addition to exergy and process simulations, heat integration strategies have also been explored to further optimise plant efficiency. Notably, researchers have applied pinch analysis to redesign the heat exchanger network within nitric acid plants. This methodology has uncovered the potential for utility savings of up to 14%, even when excluding broader process modifications and specific utility adjustments [22]. Collectively, these studies underscore the multifaceted opportunities for improving the energy and environmental performance of nitric acid production through integrated thermodynamic, simulation-based, and process optimisation approaches.
Despite extensive research on nitric acid production, a significant gap remains in modelling the entire dual-pressure process, particularly for industrial-scale units. This gap includes a comprehensive examination of various tail gas treatment options and their effects on overall process performance. Addressing this inadequacy is crucial, as the selection and optimisation of tail gas treatment technologies can substantially influence emission reductions, energy efficiency, and economic viability. Therefore, further studies should develop detailed models that integrate these variables, enabling a deeper understanding of how tail gas management strategies can improve the performance of dual-pressure nitric acid production.
1.2. Problem Statement
This study aims to identify and develop strategies to enhance the exhaust gas cleaning system associated with nitric acid production (59.2 wt.%) in dual-pressure power technology units. This initiative is driven by the pressing need to enhance the environmental safety of these industrial processes while concurrently increasing productivity and energy efficiency. The operational units, originally designed and constructed 30 years ago, continue to demonstrate competitive key performance indicators, showing they still have significant potential for further improvement. A critical component of these units’ technological framework is the catalytic exhaust gas purification system for nitrogen oxides. This system employs high-temperature catalytic reduction techniques, utilising natural gas as a reducing agent. A non-selective catalyst not only reduces nitrogen oxides but also uses residual oxygen in the exhaust gases to raise the exhaust stream temperature to the required level. This heated gas is subsequently utilised as a working fluid in the gas turbine of the main drive unit, contributing to the overall energy efficiency of the process. Despite these advancements, the existing exhaust gas cleaning strategy, which relies on traditional non-selective catalysts, is accompanied by several limitations, including:
- Challenges in maintaining a stable exhaust gas temperature prior to reaching the gas turbine, due to the strict dependency of the temperature on the oxygen volume fraction in the exhaust gas.
- The formation of by-products in the treated exhaust gases, such as carbon monoxide and ammonia.
- Significant pressure losses across the catalyst layer.
- Contamination of the purified exhaust gases with nitrogen oxides from the gas turbine cooling system, which is affected by unpurified exhaust emissions.
- The high cost and limited availability of original catalyst materials.
The scientific contribution of this study lies in the investigation of the environmental, energy, and economic performance of tail gas treatment options for the typical dual-pressure nitric acid plant. It emphasises the output parameters of the tail gas treatment unit alongside the plant’s overall performance. The study provides both research findings from specific process simulations and practical results, including opportunities to enhance yield, reduce N2O and NOx emissions, and improve energy efficiency.
2. Materials and Methods
2.1. General Framework and Workflow
This study simulates the existing processes of a dual-pressure nitric acid plant and investigates different options for tail gas treatment. This approach aims to investigate how changes to the gas treatment process affect the overall performance, e.g., emissions, energy use and plant throughput. Economic analysis supplements the process changes to demonstrate potential commercial attractiveness. The general workflow includes the following process steps, shown in Figure 1.
Figure 1.
Simplified general workflow and methodological steps.
2.2. Approach Description
Because the catalysts used in these units’ catalytic treatment systems have become outdated and require replacement with modern, more efficient alternatives, we conducted a comprehensive analysis of the units’ operation. This investigation revealed several areas for improvement that could not only enhance exhaust gas purification but also improve technical and economic performance while addressing various technical challenges. Non-selective catalysts currently available from leading global manufacturers can effectively mitigate nitrogen oxide emissions, including dinitrogen oxide. However, non-selective catalysts still have inherent drawbacks. Implementing selective catalysts requires modifications to the exhaust gas cleaning unit configuration because selective and non-selective catalysts have different operating temperature requirements. Specifically, the purified exhaust gas, used as a working fluid in the gas turbine of the main drive unit, must meet specific parameters to ensure adequate power delivery during expansion. Two strategies to facilitate the integration of selective catalysts in the exhaust gas purification unit of the dual-pressure nitric acid plant have been formulated:
- Option 1. This strategy involves heating the unpurified exhaust gas to the selective catalyst’s ignition temperature using the existing heater. Following this initial purification step, the gas is subsequently heated to the required temperature by mixing it with flue gases in a newly installed combustion chamber, as shown in Figure 2a.
- Option 2. In contrast to Option 1, this strategy heats the purified exhaust gas by oxidising the fuel gas using the residual oxygen present in the exhaust gas. For this purpose, an additional catalyst layer is introduced into the catalytic purification reactor, facilitating catalytic oxidation of the fuel gas and thereby raising the purified exhaust gas temperature to the desired level (Figure 2b).
Figure 2.
Process flow diagram (PFD) of the examined selective gas treatment options: (a) Option #1: 1—gas treatment reactor; 2—air compressor; 3—combustion chamber; 4—ammonia evaporator; 5—ammonia filter; 6—ammonia heater. (b) Option #2: 1—gas treatment reactor; 4—ammonia evaporator; 5—ammonia filter; 6—ammonia heater. Empty arrows are gas streams; black filled arrows are liquid streams.
2.3. Chemical Reactions
Nitric acid is synthesised from ammonia and oxygen as primary feedstocks, with the chemical conversion represented by the following reaction sequences (Equations (1)–(15)).
Ammonia conversion
Nitrous gas cooling and absorption of NOx
Tail gas treatment
2.4. Modelling Issues
The phase equilibria in ammonia conversion, nitrous gas cooling and nitrogen dioxide absorption are defined by the extended non-random two-liquid model (extended NRTL), which better predicts the vapour–liquid–liquid equilibria in chemical systems [23]. This model is described by Equations (16)–(18) for component i, with mole fraction xi in the liquid phase, activity coefficient γi, interaction coefficient gij for components i and j, non-randomness parameter αij, and the ternary effect on the activity coefficient of component Δt lnγi.
where parameters can be defined as follows:
The Peng–Robinson–Strijek–Vera [24] equation of state (Equation (19)) was used to calculate the fluid phase equilibria in the tail gas treatment section. This modification demonstrated improved predictive capability of binary mixtures [25].
where the attractive and repulsive parameters a and b follow from Equations (20) and (21), the temperature function alpha is given by Equation (22) with the reduced temperature Tr = T/Tc, and the characteristic parameter kappa is obtained from Equations (23) and (24):
The simulation model of the base case and different options for tail gas treatment was implemented in the Aspen HYSYS environment version 12 [26]. The main operation units and processes are simulated by the following approaches:
- Ammonia conversion: conversion reactions;
- Nitrous gas cooling: chemical equilibrium and heat transfer;
- Heat exchangers: sizing-based rating;
- Gas washer, absorber and purge: rate-based radfrac model;
- Compressors and turbines: working curve-based rating;
- Tail gas treatment: ranged conversion reactions.
2.5. Mass and Energy Balances
The overall steady-state balances are written over the plant control volume that encloses every unit operation shown in Figure 2, bounded upstream by the ammonia, air, natural gas and water feeds and downstream by the product acid, the exported steam and the stack gas. Equation (25) expresses conservation of total mass, the summation over j covering all J inlet streams crossing the boundary and the summation over y all Y outlet streams. Equation (26) expresses energy conservation over the same control volume, with each stream weighted by its mass enthalpy referenced to a common reference state of 25 °C and 101.325 kPa. Component balances for the species listed in the Nomenclature are solved simultaneously by the flowsheet solver, subject to the stoichiometry of Equations (1)–(15) and to the phase equilibria of Equations (16)–(24). Consistent with Section 2.7, the converged model carries no unaccounted streams, so that Mlosses = 0 and Qlosses = 0; both terms are nevertheless retained in the formulation because they serve as convergence diagnostics, the flowsheet being accepted only when the residual mass and energy imbalances fall below 0.1% and 0.5% of the corresponding total throughput, respectively.
2.6. Economic Assessment
The economic evaluation of the proposed modifications to tail gas treatment was conducted by analysing the capital expenditure (CAPEX) associated with new equipment in Equations (27)–(30) and applying annualisation parameters in Equations (31)–(33). The purchased cost of each new unit was obtained from the base-cost correlation CE = CB(QS/QB)^M f(t) f(p) f(m), in which correction factors for design temperature, design pressure, and materials of construction are applied to a reference unit of base capacity QB and base cost CB [27]. Base costs were updated to 2026 using the Chemical Engineering Plant Cost Index [28] and the Marshall and Swift equipment cost index as tabulated by Peters, Timmerhaus and West [29]. CAPEX for actual projects can vary significantly, influenced by installation, revamping, and other related expenditures, which can increase total capital costs by a factor of four. Acceptable accuracy for CAPEX evaluations in industrial projects usually follows AACE International Recommended Practice No. 18R-97 [30].
where QS is equipment capacity.
Where QS is the equipment capacity and fL is the Lang factor, a dimensionless multiplier that converts the free-on-board purchased-equipment cost into an installed capital cost by accounting for erection, interconnecting piping, instrumentation and control, electrical work, civil works, engineering and contingency. A value of 4 was adopted for this fluid-processing retrofit. The same correlation is applied to the reactor and to the combustion chamber in Equation (27), both being refractory-lined pressure vessels of the same class, and to the ammonia evaporator and the ammonia heater in Equation (29), both being shell-and-tube exchangers of the same duty range.
Equation (31) annualises the capital expenditure over the project lifetime n at the interest rate i. Equation (32) gives the simple payback period as the ratio of the total capital expenditure to the annual net benefit, and Equation (33) gives the discounted payback period obtained by solving the discounted cash-flow expression for the number of years required for the cumulative discounted net benefit to equal the capital expenditure. The annual net benefit is the algebraic sum of the change in utility cost, the change in catalyst cost, the revenue effect of any change in plant throughput and, where explicitly stated, the avoided cost of emission allowances. Both payback definitions return a period of time, and the discounted form is reported as the primary economic indicator throughout Section 4.4.
The following process utilities are considered in the specific nitric acid plant:
- Steam (2.2 MPa);
- Electricity;
- Cooling water;
- Natural gas (97.4% CH4, 2.6% N2);
- N2/H2 mixture (75% H2, 25% N2).
Economic assessment presumes the use of the following economic variables:
| Plant load factor | 95% | |
| Specific CO2 emission (natural gas) | 0.201 kgCO2/kWh | [31] |
| Average life-cycle CO2 equivalent emissions of electricity | 0.490 kgCO2/kWh | [32] |
| Nat. gas price | 0.410 EUR/m3 | [33] |
| N2O to CO2 equivalent | 298 kg/kg 1 | [34] |
| Electricity price | 0.240 EUR/kWh 2 | [35] |
| Nitric acid price in Europe 2026 | 270.00 EUR/t | [36] |
| CO2 equivalent price (2026) | 73.90 EUR/t | [37] |
| Steam price | 15.00 EUR/t | [38] |
| Ammonia price | 550.00 EUR/t 3 | |
| N2/H2 mixture price | 0.65 EUR/STD m3 | |
| Fe-zeolite deN2O/SCR catalyst charge | 12,000 EUR/m3 4 | |
| Oxidation-shelf catalyst charge (Option 2) | 13,000 EUR/m3 | |
| Non-selective catalyst charge (base case) | 9000 EUR/m3 | |
| Lang factor | 4 | |
| Interest rate | 10% | |
| Project lifetime | 5 | |
| Operating hours per year | 8322 h/y | |
| 1: Global warming potential over 100 years for N2O taken as 298 kg CO2-eq/kg, consistent with the IPCC Fourth Assessment Report and with Annex VI of Commission Implementing Regulation (EU) 2018/2066 on the monitoring and reporting of greenhouse gas emissions under the EU Emissions Trading System. IPCC assigns no direct global warming potential to NO, NO2 or NH3, and these species fall outside the scope of the EU ETS obligation for nitric acid installations. 2: Electricity price for non-household consumers, consumption band IF (70,000 to 149,999 MWh per year), second half of 2025, excluding VAT and other recoverable taxes and levies, from reference [34]. 3: The liquid ammonia contract price of 550 EUR/t and the price of the N2/H2 mixture of 0.65 EUR per standard cubic metre are plant-gate values for the site under study, cross-checked against published European price indices for 2026. 4: Catalyst charge costs are budgetary quotations from two European sup-pliers: 12,000 EUR/m3 for the Fe-zeolite deN2O/SCR system and 13,000 EUR/m3 for the additional oxidation shelf of Option 2, referenced to a non-selective catalyst replacement cost of 9000 EUR/m3 in the base case. | ||
2.7. Assumptions
The process simulation and performance assessment were conducted under a consistent set of simplifying assumptions to ensure model robustness, numerical stability, and comparability between the base case and the proposed retrofit options. These assumptions reflect standard steady-state modelling practice in simulation software and typical simplifications adopted in nitric acid plant simulations.
The ammonia and air feed rates were held at their base-case values in the base case and in Option 2. In Option 1, they were increased by 5% relative to the base case, for the reason set out below. Ammonia, air, water, natural gas, and utility streams were assumed to be supplied under steady nominal conditions, corresponding to full-load industrial operation. The model was developed in steady-state mode. Therefore, transient phenomena such as start-up, shutdown, load variations, catalyst ageing, and control system dynamics were not considered. All mass and energy balances represent continuous, stationary operation. Heat losses to the surroundings were neglected. Process equipment and pipelines were assumed to be perfectly insulated unless heat exchange was explicitly defined in the model. This assumption allows clear evaluation of internal heat integration without introducing uncertainties related to ambient heat transfer. Pressure drops in interconnecting pipelines were not considered. Only pressure changes explicitly defined within unit operation models (e.g., compressors, turbines, valves, reactors) were considered. Physical properties of pure components were taken from the Aspen HYSYS database, and binary interaction parameters available in the selected property packages were used without additional regression.
The 5% increase in throughput adopted for Option 1 is an outcome computed by simulation. The qualitative rationale is that the base case couples the turbine inlet temperature and tail gas mass flow though the gas turbines generating extra energy flow that is available for increased capacity of ammonia and nitrous compressors. The non-selective reactor reaches 750–770 °C by burning natural gas with the oxygen remaining in the tail gas, so the absorber is operated at an elevated residual oxygen content, 2.40 mol% at the top, rather than at the value that would maximise NOx absorption. In Option 1 the temperature rise is produced in a dedicated combustion chamber with its own pressurised air supply, so the tail gas oxygen content ceases to be a process constraint.
Three consequences follow and are stated here rather than left to the reader. First, no capacity margin has been verified for the existing equipment: absorber hydraulics are excluded by the assumptions above, and the nitrous gas compressor, the absorption column internals and the acid coolers would all have to be confirmed against a 5% higher load before the increment could be claimed. Realising this may therefore require capital beyond the scope. Second, the stack gas flow of Option 1 exceeds that of the base case by 10.5% rather than by the 5% of the feed scaling, and the difference is not an inconsistency: scaling the base-case stack flow of 236,900 kg/h by 1.05 gives 248,745 kg/h, and the remaining 13,025 kg/h, that is 5.5% of the base-case flow, is the pressurised combustion air admitted to the new chamber, which leaves with the stack gas without passing through the absorber. Third, and decisively for the comparison between the two options, the economic case for Option 1 does not survive the loss of the throughput gain. Withdrawing the capacity revenue of 5,752,166 EUR/y from the benefit stream leaves an annual net benefit of −4,818,569 EUR/y excluding allowance savings and −33,297 EUR/y including them, so Option 1 would not recover its investment at all. Option 2, whose benefit arises from utility savings at unchanged throughput, is unaffected by this consideration. A stream-level material balance for both retrofits at the resolution of Table 1, together with a hydraulic check of the absorption section, is identified in Section 4.7 as the necessary next step before the capacity increment of Option 1 could be relied upon.
Table 1.
Mass balance of the simulated nitric acid plant.
In accordance with standard Aspen HYSYS steady-state simulations, the following assumptions were used:
- Perfect mixing was assumed within the equilibrium and conversion reactor models.
- Chemical reactions were modelled using either conversion-based or equilibrium-based approaches with predefined stoichiometry and fixed conversion ratios where applicable.
- No catalyst deactivation or activity loss over time was considered.
- Equipment performance (compressors, turbines, heat exchangers) was based on rating or specified efficiency parameters assumed constant at nominal conditions.
- Thermodynamic equilibrium was assumed to have been achieved in the separation and absorption stages, where equilibrium or rate-based RadFrac models were applied.
- No mechanical degradation, fouling, or scaling effects were included in the heat transfer calculations.
- Utility systems (steam, electricity, and cooling water) were considered available at constant pressure, temperature, and unit cost.
These assumptions are commonly applied in steady-state process simulations and are suitable for comparative assessment of process modifications. Additional assumptions specific to the dual-pressure nitric acid process were adopted:
- The ammonia-to-NO conversion was represented by predefined conversion reactions reflecting industrial selectivity. Side reactions leading to N2 and N2O formation were included via fixed conversion fractions consistent with validated plant data. Reactor temperature was determined from the energy balance assuming adiabatic operation.
- Gas-phase oxidation of NO to NO2 and subsequent absorption were modelled assuming thermodynamic equilibrium in accordance with the extended NRTL model for vapour–liquid equilibria. Mass transfer limitations were not explicitly modelled beyond the rate-based absorber formulation.
- The NO2 absorption ratio was assumed to correspond to validated plant performance (approximately 99%), and hydraulic limitations of the absorber were not considered.
- The catalytic reduction of NOx and N2O was modelled using ranged conversion reactions. The conversions imposed on the tail gas reactor, and their basis, are stated explicitly below. Complete and uniform contact between gas and catalyst was assumed. No catalyst ageing, poisoning, or deactivation was considered.
- The purified tail gas was assumed to meet the required temperature and composition specifications for turbine operation. Turbine isentropic efficiency was assumed constant, and mechanical losses were incorporated through fixed performance parameters.
- The nitric acid concentration at the plant outlet was fixed at approximately 59.2 wt.% as per industrial design, and variations in product specification were not considered unless explicitly analysed in retrofit scenarios.
- Steam production from waste heat recovery was calculated assuming ideal heat transfer within the specified exchangers and no steam leakage or condensate losses.
The base case reproduces the non-selective palladium catalyst currently installed, operating at 750–770 °C, with an imposed N2O conversion of 91.1%. This value was regressed from the measured stack composition of the plant: 436 kg/h of N2O enters the tail gas reactor, carried in a tail gas flow of 191.2 t/h, and 38.61 kg/h leaves at the stack, all conversions in this work being expressed on a mass basis rather than as a ratio of volumetric concentrations, since the molar flow rises by some 30% across the reactor through the addition of combustion air, fuel gas and injected steam. The reactor inlet loading corresponds to 8.37 kg N2O per tonne of 100% HNO3, within the range reported for plants without secondary abatement, and non-selective reduction at this temperature efficiently destroys N2O as well as NOx. Both retrofit options combine an Fe-zeolite deN2O bed with a vanadia-titania selective catalytic reduction (SCR) bed operating at 430–480 °C, for which N2O conversions of 97.3% for Option 1 and 97.2% for Option 2 were imposed. These are vendor guarantee values rather than quantities regressed from plant data. (The N2O conversions adopted for the two retrofit options are taken from a vendor performance guarantee issued for the specified bed volume and space velocity. The document is commercially confidential and cannot be cited; the values are reported here so that the sensitivity analysis in Section 4.6 can be reproduced.) Both lie within the range achieved by commercial deN2O systems, the EnviNOx® process being reported to reach 98–99% under optimal conditions [14]. The near-identity of the two figures reflects that both options use the same deN2O catalyst and bed volume; the small difference arises because Option 1 processes 5% more gas at the same bed loading. The NOx entering the tail gas reactor is 126.8 kg/h of NO and 32.0 kg/h of NO2, that is 226.4 kg/h expressed as NO2, and the imposed NOx conversions are 87.3% for the non-selective catalyst of the base case and 93.1% and 94.1% for Options 1 and 2, respectively, again on a mass basis. The higher conversion adopted for Option 2 reflects the longer residence time provided by its two-shelf reactor, and both are consistent with the NOx conversions reported for vanadia-titania catalysts treating nitric acid tail gas at stoichiometric ammonia dosing [10]. These conversions are model inputs, not model outputs, and Section 4.3 distinguishes the two throughout.
The catalyst charge is treated as part of the retrofit investment rather than held constant. The base case includes a 40 m3 charge of non-selective catalyst, Option 1 includes a 40 m3 charge of Fe-zeolite deN2O/SCR catalyst, and Option 2 includes the same 40 m3 charge plus an additional 12 m3 oxidation shelf. At the unit costs listed in Section 2.6, the first charges amount to 480,000 EUR for Option 1 and 636,000 EUR for Option 2, and these sums are included in the capital expenditure. Replacement is assumed at five-year intervals for all three configurations, so the differential annual catalyst provision relative to the base case is 24,000 EUR/y for Option 1 and 55,200 EUR/y for Option 2; these amounts are charged against the annual net benefit. The assumption that catalyst life is the same across all three configurations remains a simplification; Section 4.6 discusses its consequences.
These modelling assumptions ensure a consistent and validated representation of the dual-pressure nitric acid plant while maintaining computational tractability. Since identical assumptions were applied to the base case and both retrofit options, the comparative analysis of environmental, energy, and economic performance remains methodologically coherent and reliable.
3. Case Study
The nitric acid plant employs a dual-pressure process to produce nitric acid at 59.2% wt, as presented in the simulation PFD (Figure 3). The ammonia conversion occurs at a pressure of 0.42 MPa, while nitrogen oxide absorption is conducted at a pressure of 1.1 MPa. The valuable by-product is superheated steam generated at 4.1 MPa. The primary feedstocks include liquid ammonia, natural gas, cooling and desalinated water, electricity, and atmospheric air. Before processing, the liquid ammonia is vaporised. Heat generated during scrubbing of nitrous gases before compression supplies the heat for ammonia evaporation, reducing the nitrous gas temperature before compression and minimising the steam required for ammonia evaporation. After evaporation, gaseous ammonia is purified and then heated using heat from compressed air, which is delivered to the unit to remove dissolved nitrogen oxides from the product nitric acid. The heated ammonia is then directed to the conversion reactor, where it undergoes catalytic oxidation to nitrogen oxide, utilising atmospheric oxygen as the oxidising agent. The atmospheric air is pre-filtered to remove mechanical impurities, compressed to the requisite pressure, and supplied to the reactor. The ammonia oxidation process occurs at approximately 860 °C. The heat generated from the nitrous gas produced in the reactor is recovered to generate water vapour and heat demineralised water (Figure 4a).
Figure 3.
Simulation PFD of the existing dual-pressure nitric acid plant. A—adjustment of parameters; CW—cooling water; E—heat exchanger; MIX—stream mixer; TEE—stream splitter; P—pump; Q—electricity; R—reactor; RCL—process recycle; S—parameter set; T—sub-flowsheet. Big arrows are feedstock and products; normal arrows are intermediate streams.
Figure 4.
Simulation PFDs of the existing waste heat utilisation (a) and tail gas treatment (b). A—adjustment of parameters; E—heat exchanger; MIX—stream mixer; TEE—stream splitter; P—pump; Q—electricity; R—reactor; S—gas–liquid separator. Big arrows are feedstock and products; normal arrows are intermediate streams.
Subsequently, cooling water cools the nitrous gas, releasing some process water as nitric acid condensate. This condensate is used as an absorbent in the absorption process and to scrub the nitrous gas before compression. The cooled nitrous gas is then washed with nitric acid condensate to remove by-products such as ammonium nitrate before being compressed to the required absorption pressure. The heat generated during the compression and oxidation of nitrous gas is utilised to preheat the feed water supplied for steam generation. Before entering the absorption process, the nitrous gas is cooled with water. During absorption, nitrogen oxides are extracted from the nitrous gas, forming nitric acid. Desalinated water and nitric acid condensate serve as absorbents, while cooling water dissipates the heat of the reaction. The final nitric acid, containing approximately 60% nitric acid by mass, is purified from dissolved oxides through air purging in the purge column. The purge gas is compressed alongside the nitrous gas, while the product acid is stored or dispatched to consumers. After the absorption phase, the tail gas is treated to remove aerosols before heating. This heating occurs in two stages. In the first stage, the exhaust gas is heated using heat recovered from waste gas from the gas turbine and flue gases from the radiant zone of the fire heater. The second stage involves dosing the exhaust gas into the radiant tubes of the fire heater, with natural gas serving as the fuel. The subsequently heated exhaust gas is then routed for nitrogen oxide purification (Figure 4b).
The exhaust gas is purified via catalytic reduction of nitrogen oxides, using natural gas as the reducing agent. Prior to the reduction process, an exothermic reaction between natural gas and the oxygen present occurs on the catalyst, raising the exhaust gas temperature to 750–770 °C. The hot, purified exhaust gas is directed into the gas turbine, which is the primary component of the gas turbine drive. Additionally, the gas turbine unit includes a steam backpressure turbine as an auxiliary component. After passing through the gas turbine, the exhaust gas enters the recuperative zone of the exhaust gas heater, where it transfers heat to the unpurified exhaust gas before being released into the atmosphere. The mass balance of the considered nitric acid plant is shown in Table 1.
The capacity factor QS of each new unit, together with the base capacity, base cost, cost exponent, and correction factors used in Equations (27)–(30), is summarised in Table 2.
Table 2.
Capacity factors, correction factors, and purchased cost of the equipment required for the tail gas treatment retrofit. The Lang factor of 4 converts the purchased cost into the installed capital cost.
4. Results and Discussion
4.1. Model Validation
The steady-state model developed for the dual-pressure nitric acid plant was validated using measured industrial data under nominal operating conditions. Table 3 compares plant measurements and simulation results for key process parameters, including feed preparation, ammonia oxidation, heat recovery, compression, absorption, tail gas treatment, and utility consumption. The close agreement between measured and simulated values confirms the adequacy of the selected thermodynamic models, reaction schemes, and unit operation configurations.
Table 3.
Measured and simulated process parameters of the nitric acid plant (base case).
The validation data set is a 72 h campaign at nominal full load, from which each parameter was averaged over the last 12 h of stable operation, stability being defined as an ammonia feed rate varying by less than 1% and a turbine inlet temperature varying by less than 5 K. The instrument uncertainties applicable to the measured column of Table 3 are plus or minus 1.5% of reading for the Coriolis and orifice flow metres, plus or minus 1.5 K for the Class A resistance thermometers, plus or minus 0.5% of span for the pressure transmitters, and plus or minus 2% of reading for the on-line gas analysers. Over the 28 parameters compared, the mean absolute percentage deviation is 1.2%, the root mean square relative deviation is 2.4%, and the maximum absolute deviation is 9.3%. Twenty-one of the 28 parameters agree within 1.0% and 24 within 2.5%, so that most deviations fall inside the combined instrument uncertainty band and cannot be distinguished from measurement scatter. The three stack composition entries deviate by 3.8–4.5%, consistent with the 2% analyser tolerance combined with the uncertainty of the fixed catalyst conversions; only the exhaust tail gas temperature lies substantially outside the band, and it is examined below. The validation rests on a single nominal operating point, and its representativeness at part load has not been established; this limitation is stated in Section 4.6.
Minimal deviations are observed in the primary feed and core reaction parameters. The ammonia flow rate differs by −0.1%, and the feed water flow rate deviates by −0.2%. The ammonia-to-air ratio is reproduced with a deviation of 0.1%, while the ammonia conversion ratio matches the measured value at 96.0%. The conversion reactor temperature deviates by −1.0%, which is acceptable given the highly exothermic nature of ammonia oxidation and the sensitivity of temperature to small variations in reaction enthalpy and heat capacity data. These results indicate that the conversion-based reaction model and energy-balance formulation accurately describe the oxidation stage.
The model accurately represents the waste heat recovery section. The model reproduces the waste-heat outlet gas temperature and medium-pressure steam consumption exactly, while the medium-pressure steam temperature deviates by 0.7%. These minor differences result from simplifications in heat exchanger modelling, such as neglecting external heat losses and fouling effects. The air compressor outlet pressure is predicted without deviation; however, the outlet temperature differs by 2.5%, representing one of the largest deviations in the dataset. This discrepancy is attributable to the model’s use of constant isentropic efficiency and idealised compressor performance curves, whereas actual industrial compressors operate with variable efficiency due to mechanical and thermal losses. The nitrous gas compression and washing section demonstrates strong agreement between the model and plant data. The nitrous compressor outlet pressure and temperature deviate by 0.0% and −0.2%, respectively. The gas washer top and bottom temperatures deviate by 2.2% and 0.6%, respectively. The larger deviation at the washer top temperature is due to simplifications in rate-based absorption and heat-transfer modelling, such as assuming ideal insulation and a uniform phase distribution. The predicted NO2 absorption ratio of 99.1% differs from measured data by only 0.1%, indicating that the extended NRTL thermodynamic framework and absorber configuration reliably represent mass transfer and phase equilibrium.
The tail gas treatment and turbine section maintain acceptable predictive accuracy. The tail gas temperature before the reactor is reproduced exactly, while the temperature after the reactor deviates by −0.9%. This minor difference arises from modelling catalytic conversion with fixed conversion ratios rather than from detailed kinetic expressions. The gas turbine outlet temperature deviates by 1.9%, consistent with the assumption of constant turbine efficiency and the neglect of minor mechanical and heat losses. The exhaust tail gas temperature shows the largest deviation at 9.3%, due to the combined effects of simplified heat recovery modelling, neglected external heat losses, and the absence of detailed turbine cooling-air mixing phenomena. Despite this deviation in absolute exhaust temperature, the emission composition is reproduced accurately.
The consequences of the 9.3% deviation in exhaust tail gas temperature for the reported results can be bounded quantitatively. The deviation corresponds to a simulated stack temperature 22 K above the measured value at a stack gas flow of 236,900 kg/h, which represents about 6.3 MW of sensible heat that the model assumes leaves with the stack gas rather than being recovered in the recuperative tail gas heater. The model is therefore conservative with respect to heat recovery rather than optimistic. Decisively, the recuperative exchanger is not modified in either retrofit, and the same modelling simplification is applied identically to the base case and to both options, so the error is common-mode and cancels in every differential quantity: the changes in utility consumption reported in Table 4, the emission changes reported in Table 5, and the payback periods reported in Table 6. The residual differential error is bounded by the change in stack gas flow between cases. For Option 2, the stack flow falls by 1.3%, and the effect is negligible. For Option 1, the stack flow rises by 10.5%, giving a bounding error of 0.66 MW, equivalent to 66 STD m3/h of natural gas, or 226,000 EUR/y and 1083 t CO2/y. That represents 4.0% of the annual net benefit of Option 1 and 1.7% of its annual CO2-equivalent reduction, and it lengthens the discounted payback period of Option 1 from 12.1 to 12.7 months. The deviation therefore affects neither the option ranking nor any conclusions drawn from it.
Table 4.
Utility consumption for different tail gas treatment options.
Table 5.
Simulated composition of the exhaust tail gas and its greenhouse gas contribution. Global warming potentials over 100 years follow IPCC AR4 as adopted in Annex VI of Regulation (EU) 2018/2066. Species marked as carrying no GWP have no direct global warming potential and are reported as air quality indicators only.
Table 6.
Economic results of different tail gas treatment options.
The stack composition is validated species by species rather than through a single aggregate NOx figure, because the aggregate conceals the individual conversions that the retrofit is designed to change. Table 3 therefore compares N2O, NO, and NO2 separately, each as a volumetric fraction of the wet stack gas, with deviations of −4.5%, −4.1%, and −3.8%, respectively. Table 5 reports the corresponding mass concentrations referenced to dry gas at standard conditions and uses them for the regulatory comparison in Section 4.3, with conversion based on the water content and mean molar mass of the stack gas given in that table.
4.2. Energy Performance and Plant Yield
Modifying the tail gas treatment system significantly affects the overall energy balance of the dual-pressure nitric acid plant. Table 4 shows that the base case operates with a natural gas consumption of 3528 STD m3/h and requires 221 STD m3/h of the N2/H2 mixture for non-selective catalytic reduction. Both retrofit options eliminate the need for the N2/H2 mixture, indicating a fundamental change in the reduction mechanism. However, natural gas demand differs between the two scenarios: Option 1 increases consumption to 3763 STD m3/h, while Option 2 reduces it to 3379 STD m3/h. This variation reflects the distinct thermal management strategies implemented in each option. In Option 1, the newly installed combustion chamber requires additional fuel to reach the target turbine inlet temperature after selective catalytic purification. In contrast, Option 2 utilises residual oxygen in the tail gas for catalytic fuel oxidation within the reactor, enabling temperature control with reduced external fuel input.
Electricity consumption further differentiates the two retrofit solutions. Option 1 requires an additional 3155 kW because it installs a new air compressor to support the modified gas treatment configuration. In contrast, Option 2 does not increase electrical demand, as the catalytic reactor achieves the necessary temperature rise internally. From an energy-integration perspective, Option 2 provides a more compact, thermally integrated design. Differences in steam generation and consumption patterns further highlight these distinctions. Option 1 increases steam generation from 64.1 t/h to 70.0 t/h due to enhanced heat recovery associated with higher combustion intensity. At the same time, steam consumption decreases from 41.4 t/h to 29.0 t/h, indicating improved internal heat utilisation. Option 2 maintains steam generation at the base-case level (64.1 t/h) and slightly reduces steam consumption to 31.5 t/h. Although both options improve the steam balance, the additional electricity requirement in Option 1 partially offsets its thermal advantages when total energy costs are considered.
Figure 5 also shows the impact on plant yield. Option 1 increases nitric acid production by about 5%, a significant improvement for a plant operating near design capacity. This yield enhancement results from more stable tail gas temperature control and improved process conditions, enabling higher throughput without negatively affecting turbine operation. In contrast, Option 2 does not significantly increase plant capacity and maintains production levels similar to the base case. Therefore, although Option 2 achieves superior fuel efficiency, it does not support production intensification to the same extent as Option 1.
Figure 5.
Impact of tail gas treatment on plant yield at 8322 operating hours per year.
A critical assessment of the results indicates that Option 1 prioritises productivity and steam recovery, though at the cost of increased fuel and electricity consumption. In contrast, Option 2 emphasises fuel efficiency and reduced operational energy costs, with minimal effect on throughput. The choice between these alternatives should align with the plant’s strategic objectives. If capacity expansion and revenue growth are prioritised, Option 1 may be justified despite its higher utility requirements. Conversely, if minimising energy consumption and operating costs are the primary objectives, Option 2 offers a more energy-efficient, thermodynamically integrated solution. Both configurations improve internal heat utilisation compared to the base case, but they differ fundamentally in how they balance energy intensity with production gains.
The additional electrical load of Option 1 warrants separate examination on a primary energy and Scope 2 basis, since electricity is an energy carrier rather than a primary fuel. The 3155 kW of new compressor duty corresponds to 26,256 MWh/y, or 94.5 TJ/y of final energy; at a European average conversion efficiency of about 40%, this represents 236 TJ/y of primary energy. The increase in natural gas consumption adds a further 70 TJ/y. Against these, the improvement in the steam balance of Option 1, an increase in generation of 5.9 t/h combined with a reduction in consumption of 12.4 t/h, releases 18.3 t/h of steam, equivalent to about 419 TJ/y of boiler fuel avoided. On a primary energy basis, Option 1 is therefore favourable by roughly 110 TJ/y, and the apparent energy penalty visible in Table 4 is an artefact of comparing carriers rather than primary energy.
The Scope 2 consequence depends on the grid emission factor and is more sensitive. At the life-cycle factor of 0.490 kg CO2/kWh adopted in Section 2.6, the additional electricity carries 12,865 t CO2/y. At the present EU-27 average of about 0.21 kg CO2/kWh, it carries 5514 t/y; on a predominantly nuclear or hydro grid at 0.05 kg CO2/kWh, 1313 t/y; and on a coal-dominated grid at 0.70 kg CO2/kWh, 18,379 t/y. These figures are to be compared with the direct reduction of 64,753 t CO2-eq/y delivered by Option 1, so the Scope 2 penalty consumes between 2% and 28% of the direct benefit depending on location. Option 1 remains net beneficial on every grid examined, but its advantage narrows appreciably in carbon-intensive electricity systems, whereas Option 2, which adds no electrical load, is insensitive to the grid factor. Where the grid is carbon-intensive, this consideration alone favours Option 2.
4.3. Environmental Performance
The environmental performance of the two retrofit options is evaluated on the basis of the direct emissions of greenhouse gases and nitrogen oxides reported at the stack, as summarised in Table 5 and illustrated in Figure 6. The analysis quantifies changes in N2O, NO, NO2, CO2, and NH3 mass flow rates relative to the base case and interprets the cumulative effect through the CO2-equivalent metric. The assessment is based on the full simulated stack composition rather than a selected subset of species, so it accounts for every component leaving the plant and states each greenhouse contribution explicitly. Three of the twelve species present carry a direct 100-year global warming potential: CO2 at 1, N2O at 298, and CH4 at 25, the last arising from unconverted natural gas slipping through the tail gas reactor. The remaining species, namely NO, NO2, N2O4, CO, NH3, H2O, N2 and O2, have no direct global warming potential defined by IPCC and fall outside the EU Emissions Trading System (EU ETS) obligation for nitric acid installations; they contribute nothing to the CO2-equivalent totals and are reported separately as air quality indicators. Applying a greenhouse factor to nitrogen oxides, as is sometimes done, would substantially overstate the totals and is not done here. The annualization basis is 8322 operating hours per year, corresponding to the 95% plant load factor of Section 2.6, and is applied uniformly to Table 4, Table 5 and Table 6 and to Figure 5 and Figure 6.
Figure 6.
Emissions for different options of tail gas treatment. (a) total CO2-equivalent; (b) NOx as NO2 against the BAT-AEL (best available techniques associated emission level) upper bound. The BAT-associated emission limit of 150 ppmv applies only where ammonium nitrate deposits restrict the effect of SCR or where H2O2 is used instead.
N2O is the dominant environmental concern in nitric acid production and represents the primary driver for tail gas treatment retrofit. In the base case, the N2O emission rate reaches 38.61 kg/h, consistent with the typical output of a dual-pressure plant without tertiary abatement or with a non-selective catalyst. Both retrofit options achieve substantial N2O reduction: Option 1 reduces the flow to 12.36 kg/h, while Option 2 achieves 12.35 kg/h, both corresponding to a 68.0% reduction. These reductions are significant in absolute terms: on an annualised basis of 8322 operating hours per year, the N2O mass flow falls by 218.4 and 218.6 t/y respectively, equivalent to 65,096 and 65,143 t CO2-eq/y from N2O alone. Expressed per unit of production, the specific emission factor falls from 0.74 kg N2O per tonne of 100% HNO3 in the base case to 0.23 kg/t for Option 1 and 0.24 kg/t for Option 2. Option 1 reaches the marginally lower figure because its residual mass flow is spread over a 5% larger output.
The selective catalytic reduction with ammonia, common to both retrofit configurations, reduces total NOx emissions markedly. In the base case, the combined NO and NO2 emission is 20.20 kg/h. Option 1 reduces this to 12.00 kg/h (−40.6%), and Option 2 achieves the lowest NOx output of 8.77 kg/h (−56.6%). The stronger NOx reduction in Option 2 is consistent with its reactor design: the two-shelf configuration with an additional catalyst layer provides a longer gas residence time in the SCR zone, enabling more complete conversion of residual NOx even at the elevated temperatures characteristic of this variant. Ammonia slip falls from 3.05 kg/h in the base case, which is 17.5 mg/nm3 referenced to dry gas, to 0.01 kg/h in Option 1 and to a value indistinguishable from zero in Option 2. These simulated figures should not, however, be read as a claim that slip is eliminated: they are an artefact of the conversion-based reactor model, which consumes the dosed ammonia completely by construction, and they are not measurements. For permitting purposes, the appropriate value is the design specification of 5 ppmv, equivalent to 0.66 kg/h or 3.8 mg/nm3 on the Option 2 stack flow, which is the guarantee customarily offered for a fresh charge at stoichiometric dosing. Achieving it under industrial flow disturbances requires closed-loop control rather than fixed dosing: the configuration assumed here doses ammonia on a feedforward molar ratio computed from the measured tail gas flow and the inlet NOx analyser signal, trimmed by a slow feedback loop from a downstream ammonia analyser, with the ratio clamped below unity during load transients so that slip is bounded at the expense of a transient reduction in NOx conversion. Slip will rise above the design value towards the end of catalyst life, which is one reason the catalyst replacement provision of Section 2.7 is charged against the annual benefit.
The CO2 emission profile reflects the contrasting thermal management strategies of the two options. Option 1 increases direct CO2 emissions from 6834 kg/h (base case) to 6983 kg/h (+2.2%), which is attributable to the higher natural gas consumption in the newly installed combustion chamber required to bring the purified gas to turbine inlet temperature. Option 2, by contrast, reduces CO2 emissions to 6732 kg/h (−1.5%) by using residual oxygen in the tail gas for internal catalytic oxidation, thereby reducing net fuel combustion. This fundamental difference underscores the thermodynamic trade-off: Option 1 achieves a greater throughput gain at the cost of higher carbon intensity per unit of production, while Option 2 operates with near-base-case fuel consumption and lower direct CO2 output.
The total environmental impact, expressed as cumulative CO2-equivalent emissions and shown in Figure 6a, captures the dominant contribution of N2O reduction. Despite the modest increase in direct CO2 under Option 1, both retrofit configurations deliver substantial reductions in total CO2-equivalent output. Option 1 achieves a 41.8% reduction and Option 2 a 43.6% reduction in CO2-equivalent emissions relative to the base case, with the base case total at 18,618 kg CO2-eq/h, 10,837 kg/h for Option 1, and 10,504 kg/h for Option 2. Of the base-case total, N2O contributes 11,505 kg/h, direct CO2 6834 kg/h, and methane slip 279 kg/h; the methane contribution, small but not negligible, falls to 173 and 92 kg/h in the two options as the selective catalyst converts the fuel gas more completely.
Across the tail gas reactor, both retrofit options convert 97.2–97.3% of the incoming N2O, comparable to the 98–99% reported for commercially deployed systems such as the EnviNOx® process under optimal conditions [14]. The stack-to-stack reduction of 68.0% is smaller because the base case already incorporates non-selective tertiary abatement, so the retrofit is measured against an abated, rather than an unabated, baseline. The gap between the values obtained in this study and the upper-bound literature values reflects the specific constraints of the retrofit scenario: the selective catalyst must operate within the thermal window imposed by the existing heater and the turbine inlet temperature requirement, which limits the achievable ignition temperature and therefore the depth of N2O decomposition. Future plant designs conceived from the outset with tertiary abatement integrated into the heat recovery network could approach the higher removal efficiencies reported in dedicated installations. From a regulatory standpoint, the CO2-equivalent reductions demonstrated here are directly relevant to the EU ETS, under which nitric acid producers are obligated to surrender allowances for N2O emissions. The emission cost savings of 4.79 and 4.99 million EUR/year estimated for Options 1 and 2 (Table 6) are consistent with the scale of the environmental improvements quantified in Table 5, confirming the internal consistency of the environmental and economic analyses. The results confirm that selective catalytic tail gas treatment, even under the constraints of retrofitting an existing dual-pressure plant, is a technically effective and environmentally meaningful abatement measure. The choice between options should therefore be informed not only by economic payback criteria but also by the plant operator’s specific emission-reduction commitments and carbon-pricing exposure.
The stack concentrations may be placed in a regulatory context. Referenced to dry gas at standard conditions, the NOx concentration expressed as NO2 falls from 165 mg/nm3 in the base case to 81 mg/nm3 for Option 1 and 76 mg/nm3 for Option 2. Expressed on the volumetric basis used by the source, and at the same reference state, these correspond to 80, 40 and 37 ppmv as NO2, one ppmv as NO2 being 2.053 mg/nm3 at 0 °C and 101.325 kPa. Table 3.15 of the reference document on best available techniques for large volume inorganic chemicals, reproduced as Table IV of its executive summary, gives 5–90 ppmv as NO2 for existing nitric acid plants, admitting 150 ppmv only where ammonium nitrate deposits restrict the effect of selective catalytic reduction or where hydrogen peroxide is used in its place [11]. All three cases therefore lie within the range applicable to existing plants. The base case does so with little margin, at 80 ppmv against an upper bound of 90, whereas both retrofits operate at rather less than half that bound and so retain headroom against load variation, catalyst ageing and any future tightening of the limit. Compliance is therefore not in itself a driver for the retrofit, but the operating margin it confers is. The specific N2O emission of 0.23 to 0.24 kg per tonne of HNO3 achieved by the two options lies within the 0.12–0.25 kg/t range associated with well-performing tertiary abatement and approaches, without reaching, the level of 0.20 kg N2O per tonne identified in mechanism methodology A6.4-AMM-002 as the performance of the best-performing abated plants, below which the annual increase in the downward adjustment of the baseline is set to 0.01 rather than to the standard value (paragraph 40(a)) (Mechanism methodology A6.4-AMM-002, N2O abatement from nitric acid production, which entered into force on 21 May 2026 under the Article 6.4 mechanism of the Paris Agreement, superseding the proposal cited as reference [39]) [39]. Carbon monoxide, formed in the base case by partial oxidation of methane over the non-selective catalyst according to Equation (13), falls from 20.7 kg/h, that is 119 mg/nm3, to 11.3 kg/h in Option 1, where combustion takes place with excess air in a dedicated chamber, and to 5.2 kg/h in Option 2, where oxidation proceeds over a precious-metal shelf. Unconverted methane follows the same ordering, falling from 11.2 kg/h to 6.9 and 3.7 kg/h. Section 1.2 identifies both species as by-products of the existing system, and reducing them is a secondary benefit of both retrofits.
The oxygen balance of the tail gas deserves particular attention for Option 2, because the residual oxygen in the tail gas is the resource from which the internal temperature rise is produced. The absorber delivers tail gas containing 2.40 mol% oxygen, but very little survives to the stack in the base case: the non-selective reactor consumes it by burning natural gas to reach the turbine inlet temperature, and the simulated stack composition shows only 0.265 mol% remaining. Option 2 uses the same resource more sparingly and more selectively, leaving 0.488 mol% at the stack, roughly twice the base-case residue, because the catalytic oxidation shelf converts the fuel gas at lower temperature and with less excess. Option 1 shows a markedly different profile, 2.87 mol% at the stack, because its combustion chamber is supplied with its own pressurised air and the tail gas oxygen is no longer consumed to raise temperature. The narrowness of the base-case and Option 2 margins is the binding constraint on the internal-oxidation concept: the temperature rise that can be generated within the reactor is limited by the oxygen the absorber delivers, the existing fired heater must continue to preheat the tail gas to 529 °C, and Option 2 could not be transferred to a plant operating at appreciably lower absorber-top oxygen without a supplementary air supply, at which point it would converge on the equipment count of Option 1. Tail gas oxygen consumption is also why Option 2 provides no throughput gain, as set out in Section 2.7.
4.4. Economic Performance
The economic evaluation of the two retrofit options is structured around four principal financial components: annualised capital expenditure, changes in utility operating costs, revenue effects from changes in plant yield, and savings generated by reduced CO2-equivalent emissions. Table 6 synthesises these components and provides the basis for comparing the overall commercial attractiveness of each option. Figure 7, Figure 8 and Figure 9 present sensitivity analyses for CAPEX uncertainty, nitric acid market price, and energy price, respectively. The annualization of capital costs applies a 10% interest rate over a five-year project lifetime, consistent with Equations (31)–(33) and the economic assumptions defined in Section 2.6. Payback periods are reported both as simple and as discounted periods, and both with and without the emission allowance saving, because the two framings lead to materially different conclusions for Option 1.
Figure 7.
CAPEX impact on economic performance for the proposed tail gas treatment retrofit.
Figure 8.
Nitric acid price impact on economic performance for the proposed tail gas treatment retrofit.
Figure 9.
Energy price impact on economic performance for proposed tail gas treatment retrofit. In option 1, no recovery occurs beyond point 1.73.
The CAPEX estimates reflect the different scope and complexity of the two retrofit configurations. Option 1, which requires a new combustion chamber, an additional air compressor, an ammonia evaporator, an ammonia filter, and an ammonia heater, carries an equipment cost of 4,771,557 EUR, to which the first charge of deN2O/SCR catalyst adds 480,000 EUR, giving a total capital expenditure of 5,251,557 EUR, annualised to 1,385,348 EUR/year. Option 2 introduces only an additional catalyst shelf within the reactor vessel, together with the associated ammonia dosing equipment, resulting in an equipment cost of 1,340,663 EUR; its larger catalyst inventory, comprising the same 40 m3 deN2O/SCR charge together with a 12 m3 oxidation shelf, adds 636,000 EUR, giving a total capital expenditure of 1,976,663 EUR annualised to 521,439 EUR/year. The capital cost ratio between the two options is approximately 2.7:1, a difference that decisively determines relative payback performance and reflects the inherent advantage of the thermally integrated, reactor-internal approach adopted in Option 2. Both estimates were derived using the base-cost correlations of [27], with Chemical Engineering Plant Cost Index corrections [28] and a Lang factor of 4 applied to account for installation, interconnecting piping, instrumentation, and civil works, in accordance with AACE International Recommended Practice No. 18R-97.
The utility consumption changes introduced by each option translate directly into operating cost changes, as summarised in Table 4 and monetised in Table 6. Option 1 incurs an additional utility cost of +4,794,569 EUR/year, driven by three simultaneous effects: (i) an increase in natural gas consumption from 3528 to 3763 STD m3/h (+235 STD m3/h), attributable to the combustion chamber fuel requirement; (ii) additional electricity demand of 3155 kW from the new air compressor; and (iii) the cost of ammonia supply (127 STD m3/h) as SCR reductant. These are partially offset by eliminating the N2/H2 mixture (221 STD m3/h) previously required for non-selective catalytic reduction, and by improved steam generation (from 64.1 to 70.0 t/h) combined with reduced steam consumption (from 41.4 to 29.0 t/h). In aggregate, however, the increased fuel and electricity demand outweighs the steam-side savings, producing a net utility cost penalty for Option 1. In contrast, Option 2 achieves a utility cost reduction of 1,750,090 EUR/year. The internal catalytic oxidation of fuel gas within the two-shelf reactor eliminates the need for a combustion chamber and the associated air compressor, reduces natural gas consumption to 3379 STD m3/h (−149 STD m3/h relative to the base case), and requires no additional electricity. Together with the elimination of the N2/H2 mixture cost, Option 2 delivers a strictly favourable operating cost outcome at the utility level.
The 5% increase in nitric acid production achieved by Option 1, enabled by more stable tail gas temperature control and improved process conditions, generates an additional revenue of +5,752,166 EUR/year, calculated at the European nitric acid market price of 270 EUR/t adopted in Section 2.6 [36]. This revenue contribution is the single largest positive cash flow item for Option 1 and is decisive in offsetting its utility cost penalty. Option 2, which does not significantly alter plant throughput, produces a negligible capacity-related revenue change of −112,347 EUR/year, reflecting minor process interactions rather than a structural throughput effect. The contrast between the two options on this dimension is fundamental: Option 1 is essentially a combined production-expansion and abatement investment, whereas Option 2 is a pure abatement measure with an improved energy cost profile.
Both retrofit options generate significant savings under the EU ETS, where N2O and combustion CO2 emissions are accounted for at the allowance price of 73.90 EUR/t CO2-equivalent [37]. The reduction in N2O and CO2 emissions quantified in Section 4.3 translates into emission cost savings of 4,785,272 EUR/year for Option 1 and 4,989,961 EUR/year for Option 2; the figures are close because the abatement performances of 41.8% and 43.6% are also close. The distinction between the two payback framings is decisive for Option 1. Excluding allowance savings, its annual net benefit is 933,597 EUR/year against a capital expenditure of 5,251,557 EUR, giving a simple payback of 67.5 months and a discounted payback of 104 months, so that on operational and production-side economics alone the investment is not recovered within the five-year evaluation horizon adopted here. Including allowance savings raises the annual net benefit to 5,718,869 EUR/year and shortens the discounted payback to 12.1 months. Option 1 is therefore an investment whose viability depends on carbon pricing. Option 2 is recovered within the horizon on either basis, with a discounted payback of 16.8 months excluding allowance savings and 3.8 months including them.
Table 6 clearly differentiates the two options. Option 2 presents the stronger financial case by every metric: lower capital expenditure (1,976,663 against 5,251,557 EUR), reduced utility operating costs (a saving of 1,750,090 EUR/year against a penalty of 4,794,569 EUR/year), and marginally higher emission cost savings (4,989,961 against 4,785,272 EUR/year), yielding a discounted payback period of 3.8 months, an exceptionally short horizon for an industrial retrofit investment. Option 1, despite its higher capital and operating costs, is viable because the 5% capacity increase (5,752,166 EUR/year) provides revenue that no other mechanism in Option 2 can replicate. The discounted payback period for Option 1 of 12.1 months remains commercially attractive for operators whose primary objective is throughput expansion and who are exposed to carbon pricing, but operators outside an emissions trading scheme should bear in mind that figure depends on allowance savings.
The robustness of the payback conclusions was assessed across three dimensions. Figure 7 presents the sensitivity of payback period to CAPEX variation for each option. Since CAPEX estimates at the AACE Class 4–5 level can vary by a factor up to four, this sensitivity is particularly relevant. For Option 2, the discounted payback period rises from 3.8 to 16.1 months as capital expenditure is multiplied by four, remaining well within the project lifetime across the range and confirming its resilience to cost estimation uncertainty. For Option 1, the discounted payback rises from 12.1 to 57.6 months over the same range, remaining just within the five-year lifetime and crossing it at a multiplier of approximately 4.1, so that only a capital cost overrun at the extreme of the AACE band would render it unviable. Figure 8 shows how economic performance depends on the nitric acid market price. Option 1 is more exposed to price volatility because its positive net cash flow depends on revenue from the additional 5% production capacity. Over the range from 150 to 400 EUR/t, the discounted payback of Option 1 varies from 22.9 to 8.0 months, whereas Option 2 remains at 3.8 to 3.9 months throughout, insulated from product price risk by its operating cost savings structure. Figure 9 illustrates the impact of energy price variation. Given that Option 1 carries a net increase in natural gas and electricity costs, it is adversely affected by energy price increases. Doubling natural gas and electricity prices lengthens Option 1’s discounted payback from 12.1 months to beyond the project lifetime, with no recovery within the horizon, at approximately 1.73 times present energy prices. Option 2, conversely, benefits from higher energy prices, its discounted payback falling from 3.8 to 3.6 months as prices double, because its utility cost savings are proportionately amplified.
The economic analysis confirms that both retrofit options offer commercially viable pathways for tail gas treatment upgrade in dual-pressure nitric acid plants. Option 2 is the superior choice from a purely financial standpoint, offering minimal capital outlay, reduced operating costs, and a near-immediate payback, making it immediately attractive to investors and plant owners seeking rapid returns. Option 1 is appropriate when capacity expansion is the strategic priority, with its higher CAPEX and utility costs justified by substantial incremental revenue from increased production. Under current EU carbon pricing, emission-cost savings reinforce the financial case for both options and are indispensable to Option 1; carbon prices above the 73.90 EUR/t CO2-eq baseline assumed here would further improve the economics of both configurations, and prices materially below it would place Option 1 outside the five-year horizon.
One qualification applies to Option 1 alone and is decisive for the comparison. Its benefit stream depends on the capacity revenue of 5,752,166 EUR/y, which in turn depends on the 5% throughput increment specified in Section 2.7 computed by the model. Withdrawing that revenue leaves an annual net benefit of −4,818,569 EUR/y excluding allowance savings and −33,297 EUR/y including them, so Option 1 would not recover its investment at all if the increment were not realised. The economics of Option 1 are therefore conditional on a debottlenecking study that this work does not provide, whereas those of Option 2 rest on utility savings at unchanged throughput and carry no equivalent condition. The simulated increase in plant yield represented the debottlenecking increment against which the retrofit could be costed, and the ammonia and air feeds were scaled by the same proportion so that the burner ratio, the absorber oxygen profile, and the acid strength remain at their validated values. The simulation then returns the corresponding heat, power and emission flows. It follows that the model demonstrates 5% is simulated increment under model constraints and additional investigation is needed on real process debottlenecking under increased capacity.
4.5. Global Impact on the Fertiliser Industry
Nitric acid is the essential intermediate in nitrogen-based fertiliser production, with global output reaching approximately 60 million tonnes per year in 2023 across roughly 500 production plants worldwide [40]. Around 80% of this volume feeds the manufacture of ammonium nitrate, a critical nitrogen source for agricultural productivity (The downstream ammonium nitrate share is taken from the same source as the production and plant count figures, reference [40]). The fertiliser industry as a whole is responsible for approximately 1.4% of annual global CO2-equivalent emissions [41]. Within this, nitric acid manufacturing is the dominant point source of industrial N2O, with total sectoral N2O emissions estimated at 36.1 Mt CO2-equivalent in 2020 (The sectoral N2O inventory of 36.1 Mt CO2-equivalent for 2020 and the unabated share of 63% are both taken from reference [42]). Crucially, an estimated 63% of this total, some 22.5 Mt CO2-equivalent [42], originates from plants operating without effective tertiary abatement and therefore constitutes a readily addressable mitigation potential.
The present study demonstrates that selective catalytic tail gas treatment applied to an existing dual-pressure nitric acid plant reduces the plant-level N2O emission factor from 0.75 to approximately 0.24 kg N2O per tonne of HNO3 produced; a reduction of 66–68% depending on the retrofit configuration. Extending this performance to the global fleet of unabated plants requires contextualisation with IPCC-referenced emission factors. Medium-pressure dual-pressure plants without tertiary abatement typically operate with emission factors of 5–7 kg N2O per tonne HNO3 [43]. The retrofit performance demonstrated here cannot be transferred to the unabated fleet as a percentage reduction, because the plant studied already incorporates non-selective tertiary abatement, so its base-case stack emission factor of 0.74 kg N2O/t is far below the unabated range, even though its burner outlet at 8.37 kg N2O/t is squarely within it. The transferable quantity is instead the absolute residual emission factor achieved after retrofit, 0.24 kg N2O/t, set by the catalyst system and reactor conditions rather than by the inlet loading. On that basis, the extrapolation is anchored to the addressable potential itself. An unabated inventory of 22.5 Mt CO2-eq/y at a representative emission factor of 6 kg N2O/t implies about 12.6 Mt/y of nitric acid produced without tertiary abatement, roughly 21% of global output. Retrofitting that entire capacity to the residual factor demonstrated here would avoid 72.5 kt N2O/y, equivalent to 21.6 Mt CO2-eq/y, or about 96% of the addressable potential, the residual 4% being the irreducible emission at 0.24 kg/t. At the more realistic adoption rate of 30%, the saving is 21.8 kt N2O/y, or 6.5 Mt CO2-eq/y, worth approximately 479 million EUR per year at the allowance price of 73.90 EUR/t adopted in Section 2.6; at 10% adoption it is 2.2 Mt CO2-eq/y and about 160 million EUR per year. These figures rest on literature emission factors for the unabated fleet and on the assumption that the residual factor achieved in this retrofit is reproducible on plants of different pressure configuration, neither of which is demonstrated here; they are therefore indicative rather than predictive. These estimates are consistent with the order of magnitude of recently reported commercial deployments: the Clariant EnviCat® N2O-S catalyst alone is reported to reduce emissions by 690 kt CO2-equivalent per year at a single large-scale nitric acid complex in China [7], and by a further 275 kt CO2-equivalent per year at a second facility [8], underscoring the material scale of per-plant impact from modern tertiary abatement systems.
The long-term transformation of the fertiliser industry extends beyond incremental abatement of existing plants to structural decarbonisation of the upstream ammonia supply chain. Green ammonia, produced via electrolysis of water using renewable electricity to generate hydrogen, followed by the Haber–Bosch synthesis, currently commands a production cost of USD 700–1400 per tonne, compared to approximately USD 300–450 per tonne for conventionally produced grey ammonia [44]. However, this premium is projected to narrow substantially: IRENA and IEA modelling indicates that with renewable electricity costs below USD 20 per MWh, green ammonia becomes cost-competitive with grey ammonia without carbon pricing, with production costs expected to converge toward USD 310–480 per tonne by 2030–2050. The IEA Sustainable Development Scenario projects that direct CO2 emissions from the ammonia industry can be reduced by over 70% by 2050 relative to today, while a Net Zero Emissions trajectory requires a 95% reduction. Near-zero emission production capacity of approximately 8 Mt per year is scheduled to come online by 2030 [45]. These trajectories are significant for nitric acid and fertiliser producers in two ways. First, decarbonised ammonia feedstock would substantially reduce the upstream Scope 1 and Scope 2 footprint of nitric acid synthesis, complementing the tail gas abatement measures examined in the present study. Second, ammonia is gaining traction as an e-fuel and hydrogen energy carrier, with the International Maritime Organisation projecting that ammonia could supply approximately 25% of the global shipping fuel mix by 2050 [46]. This dual role, as fertiliser precursor and as carbon-free fuel, is expected to drive global ammonia demand to 350 million tonnes per year by 2050, up from approximately 185 million tonnes today [45]. Nitric acid plants operating with green ammonia feedstock and equipped with selective catalytic tail gas treatment would approach near-zero lifecycle N2O and CO2 emission profiles, consistent with the decarbonisation requirements of the EU’s Farm to Fork Strategy and the broader Fit for 55 regulatory frameworks.
4.6. Limitations
The process model was developed exclusively in steady-state mode. It did not capture transient phenomena inherent to industrial operation, including plant start-up, scheduled and unscheduled shutdowns, load-following behaviour, and control system response. In practice, N2O and NOx emission rates are sensitive to transient conditions, particularly during catalyst warm-up and ammonia burner campaigns; peak emissions during these periods may deviate substantially from the nominal values reported here. Dynamic modelling would be required to quantify these effects and to validate the stability of the proposed retrofit configurations under real operational variability.
The catalytic reduction of N2O and NOx in the tail gas treatment reactor was modelled using fixed conversion fractions derived from literature data and validated plant measurements, rather than from detailed reaction kinetics. This approach captures steady-state performance at the design operating point but cannot represent how conversion efficiency depends on inlet concentration fluctuations, temperature gradients across the catalyst bed, or the spatial distribution of reactants. Furthermore, this study did not consider catalyst deactivation, poisoning, or ageing. Industrial iron-zeolite and vanadium-titania catalysts experience progressive activity loss over service lifetimes of several years, and the economic case for retrofit is sensitive to catalyst replacement frequency and cost factors not reflected in the current model.
We neglected heat losses from process equipment and interconnecting pipelines by assuming perfect insulation throughout. Pressure drops in connecting piping were not considered. While these simplifications are standard in steady-state comparative assessments and are unlikely to alter the relative ranking of options, they bias the energy recovery estimates. The bias is conservative rather than optimistic: the model overpredicts the stack temperature by 22 K, so it recovers less heat in the recuperative tail gas heater than the plant achieves in practice. As shown in Section 4.1, the bias is common to the base case and both options and cancels in all differential results; its bounding differential effect is 2.0% of the annual net benefit of Option 1 and negligible for Option 2. Absolute values of stack temperature and recovered heat should nevertheless be treated with caution.
Capital cost estimates were generated using the equipment-scaling correlations of Smith, Timmerhaus, and West [27] with a Lang factor of 4, consistent with AACE Class 4–5 accuracy (expected accuracy: −30% to +50%). Actual project costs for revamping existing plants may deviate significantly from these estimates because site-specific constraints, structural modifications, and installation complexity are not captured by the correlations. The economic analysis used single-point values for energy prices, carbon prices, and the nitric acid market price, all of which are volatile. Sensitivity analyses presented in Figure 7, Figure 8 and Figure 9 partially address this, but do not account for correlated price scenarios or long-term structural shifts in the EU ETS.
The study investigates one specific dual-pressure plant configuration under nominal full-load conditions. The results’ generalisability to plants with different capacities, pressure configurations, or geographic and regulatory contexts is limited. The global impact extrapolations presented in Section 4.5 rely on literature-derived industry-average emission factors and should be regarded as indicative rather than predictive. Validation of the retrofit options on additional plant configurations and under part-load conditions would strengthen the basis for broader recommendations.
A detailed debottlenecking study for both retrofit configurations, at the resolution of the process units, together with a hydraulic check of the absorption section and a capacity review of the nitrous gas compressor and the acid coolers, is the necessary next step before the throughput increment can be finally verified.
The validation rests on a single nominal operating point, without repeated campaigns at different loads and without formally propagating measurement uncertainty into the simulated quantities. The agreement reported in Table 3 therefore demonstrates that the model reproduces the plant at design conditions but does not establish its accuracy across the operating envelope. In addition, the catalyst conversions imposed in the tail gas reactor are fixed inputs taken from supplier data and from the regressed base case rather than outcomes of a kinetic model, so the emission results inherit the uncertainty of those inputs directly; a variation of one percentage point in the assumed N2O conversion changes the CO2-equivalent reduction of either option by approximately seven percentage points. The assumption of equal catalyst life across the three configurations is a further simplification: were the selective catalyst to require replacement every three years rather than five, the annual catalyst provision would rise by about 56,000 EUR/y for Option 1 and 82,000 EUR/y for Option 2, lengthening the discounted payback periods including allowances to 13.2 and 3.9 months respectively, which does not alter the ranking of the options.
4.7. Future Works
This work evaluates tail gas treatment options within the plant’s existing thermal infrastructure, treating the heat exchanger network as fixed. A combined approach that simultaneously redesigns the heat recovery system and the tail gas treatment configuration using pinch analysis or mathematical programming would likely reveal additional energy savings not captured here. Prior work on heat integration in nitric acid plants has identified utility savings of up to 14% through network retrofit alone [22]. Synergistic optimisation with selective catalytic abatement could amplify this potential, particularly for Option 1, in which the combustion chamber introduces a significant high-temperature heat source that could be further exploited.
Option 1 increases steam generation from 64.1 to 70.0 t/h while reducing steam consumption to 29.0 t/h, creating a substantial exportable steam surplus that the current study did not fully optimise. A detailed investigation of steam turbine performance, including off-design efficiency curves, back-pressure regulation, and the potential for additional power generation, could enhance the energy and economic case for Option 1. This is particularly relevant at sites with high electricity prices or where cogeneration incentives apply.
Nitric acid plants typically operate as part of integrated fertiliser complexes producing ammonium nitrate or other downstream products. The utility streams identified in this study, including surplus steam, hot tail gas, and recoverable heat from the combustion chamber, could serve as inputs to adjacent process units such as ammonium nitrate evaporators or granulation systems. Site-level integration could improve overall energy efficiency and reduce total utility consumption beyond what is achievable within the nitric acid unit boundary alone.
As noted in Section 4.6, the steady-state model does not capture transient behaviour during start-up, shutdown, load variation, or catalyst ageing. A dynamic simulation model would enable the investigation of control strategies for maintaining stable catalyst ignition temperature under variable load, the quantification of peak emission events during transient periods, and the identification of operational bottlenecks that limit performance under off-design conditions. This is of direct industrial relevance given that regulatory emission limits apply continuously, not only at nominal load.
Progressively substituting conventional grey ammonia with green ammonia, produced via electrolysis-based hydrogen and renewable electricity, would substantially reduce the upstream carbon intensity of nitric acid synthesis. Combined with the tail gas treatment measures demonstrated in this study, a green ammonia feedstock pathway offers a route to near-zero lifecycle N2O and CO2 emissions. A techno-economic assessment of this integrated pathway, including sensitivity to renewable electricity cost and carbon pricing, would provide the quantitative basis needed to support investment decisions aligned with sustainable development goals [47]. Policy instruments such as the EU’s Farm to Fork Strategy and climate-smart agriculture programmes increasingly incentivise such transitions, but region-specific economic analysis and reliable emissions data remain prerequisites for widespread adoption.
5. Conclusions
The principal contribution of this study is demonstrating that retrofitting selective catalytic tail gas treatment into a mature dual-pressure nitric acid plant is an economically self-funding decarbonisation measure, with financial returns from emission cost avoidance, utility savings, and production gains sufficient to recover the capital investment within months, not years. This finding shifts the framing of tail gas abatement from a regulatory compliance cost to a value-generating retrofit, with implications for how operators, policymakers, and investors approach emission reduction in the nitrogen fertiliser sector.
The two retrofit configurations studied reveal a fundamental design principle that extends beyond the specific plant investigated: no universal optimum exists between thermal integration and throughput expansion. Option 2, which achieves temperature control through internal catalytic oxidation of fuel gas in a two-shelf reactor, shows that a purely thermodynamic retrofit can deliver a 43.6% reduction in CO2-equivalent emissions and a discounted payback period of 3.8 months at a capital cost below 2 million EUR, without requiring additional electricity or supplementary combustion infrastructure. Option 2 also recovers its investment within 16.8 months on operating savings alone, independently of any carbon price. Option 1, by contrast, sacrifices energy economy to unlock a 5% increase in plant throughput, worth 5.75 million EUR per year in additional revenue, making it the rational choice when production capacity is the strategic constraint. The coexistence of two commercially viable yet strategically distinct solutions within the same plant boundary confirms that abatement-technology selection cannot be decoupled from the operator’s production and investment objectives, a finding absent from prior single-option assessments in the literature.
From a thermodynamic standpoint, the results challenge a persistent assumption in nitric acid process design: that tail gas treatment is thermally parasitic on the gas turbine cycle. Both retrofit options show that selective catalytic reduction, when properly integrated, either preserves or enhances the plant’s steam balance: Option 1 increases steam generation by 9% while reducing consumption by 30%, and Option 2 maintains the base-case steam surplus. The non-selective catalytic systems that these options replace imposed a strict thermal constraint through their dependence on residual oxygen content for temperature control. Selective catalysts, by decoupling purification chemistry from combustion thermodynamics, restore degrees of freedom in the energy system that the legacy plant design has left underutilised for three decades.
The N2O emission factors achieved, 0.23 and 0.24 kg N2O per tonne HNO3 for Options 1 and 2, respectively, approach or meet the best-practice crediting threshold of 0.2 kg N2O per tonne HNO3 established under the UNFCCC Article 6.4 mechanism and fall significantly below the IPCC default emission factor of 7 kg N2O per tonne for unabated medium-pressure plants. If applied across the global fleet of unabated dual-pressure plants, retrofitting the unabated fleet to achieve the residual emission factor demonstrated here would reduce sectoral N2O emissions by approximately 21.6 Mt CO2-equivalent per year—some 96% of the estimated addressable industry mitigation potential of 22.5 Mt CO2-equivalent identified for 2020—with 6.5 Mt per year attainable at a 30% adoption rate. This places selective catalytic tail gas treatment among the highest-leverage, lowest-cost mitigation opportunities available to the industrial sector in the near term.
The wider significance of this work lies in its evidence that decarbonisation and industrial competitiveness are not in tension at the plant level; they are structurally aligned. The barriers to adopting proven abatement technology in the global nitric acid industry are therefore not technical or economic, but institutional: variability in carbon pricing, the absence of mandatory tertiary abatement requirements in many jurisdictions, and insufficient integration of tail gas treatment into plant-level energy optimisation frameworks. Closing these gaps, through binding emission standards, carbon market expansion, and the kind of integrated, validated process modelling methodology applied here, holds the potential to deliver emission reductions at a scale and speed that significantly exceed what agricultural and land-use interventions can achieve in the same timeframe, at a fraction of the systemic cost.
Author Contributions
Conceptualization, V.S. and S.B.; methodology, O.S. and S.B.; software, S.B.; validation, V.S. and O.S.; formal analysis, O.S.; investigation, O.S. and S.B.; resources, V.S.; data curation, V.S. and O.S.; writing—original draft preparation, V.S., O.S. and S.B.; writing—review and editing, S.B.; visualization, O.S. and S.B.; supervision, S.B.; project administration, V.S.; funding acquisition, V.S. All authors have read and agreed to the published version of the manuscript.
Funding
This research received no external funding.
Data Availability Statement
The data is available upon request.
Conflicts of Interest
Authors Volodymyr Shpylov and Olexander Sudak were employed by the Chemical Equipment and Engineering. The remaining author declares that the research was conducted in the absence of any commercial or financial relationships that could be construed as a potential conflict of interest.
Nomenclature
| Latin symbols: | |
| a, b, α | coefficients |
| hin | mass enthalpy of inlet process stream, kJ/kg |
| hout | mass enthalpy of outlet process stream, kJ/kg |
| i | index of a component in the liquid phase (Equations (16)–(18)); interest rate, n/d (Equations (31) and (33)) |
| B | annual net benefit, EUR/y |
| fL | Lang factor, n/d |
| n | summation index (Equation (16)); project lifetime, y (Equations (31) and (33)) |
| Tr | reduced temperature T/Tc, n/d |
| κ | function of the acentric factor and reduced temperature, n/d |
| κ0 | function of the acentric factor and reduced temperature, n/d |
| κ1 | parameter of pure component, n/d |
| Min | mass flow of inlet streams, kg/h |
| Mout | mass flow of outlet streams, kg/h |
| Mlosses | mass losses, kg/h |
| p | pressure, Pa |
| PC | critical pressure, Pa |
| QS | capacity factor of new equipment |
| R | gas constant, J/(mole K) |
| T | absolute temperature, °C |
| TC | critical temperature, °C |
| Vm | molar volume, m3/mole |
| xi | mole fraction of component i |
| Greek symbols: | |
| α | temperature function |
| αij | non-randomness parameter |
| ω | acentric factor, n/d |
| γI | activity coefficient |
| gij | interaction coefficient for components i and j |
| Chemical symbols: | |
| C | carbon |
| CH4 | methane |
| CO | carbon monoxide |
| CO2 | carbon dioxide |
| H2 | hydrogen |
| H2O | water |
| HNO3 | nitric acid |
| N2 | nitrogen |
| NO | nitrogen monoxide |
| NO2 | nitrogen dioxide |
| N2O4 | nitrogen tetroxide |
| N2O | nitrous oxide |
| NH3 | ammonia |
| O2 | oxygen |
| Abbreviations: | |
| AACE | association for the advancement of cost engineering |
| BAT-AEL | best available techniques associated emission level |
| CAPEX | capital expenditure |
| EUR | Euro |
| EU ETS | European Union Emissions Trading System |
| NRTL | non-random two-liquid |
| PFD | process flow diagram |
| SCR | selective catalytic reduction |
| STD | standard conditions, 0 °C and 101.325 kPa (STD m3 and nm3 denote the same reference state, 0 °C and 101.325 kPa, and are used inter-changeably in this work: STD m3/h for volumetric feed and fuel flows, and nm3/h for stack gas flows and concentrations.) |
References
- Vallero, D.A. Chapter 8—Air Pollution Biogeochemistry. In Air Pollution Calculations; Vallero, D.A., Ed.; Elsevier: Amsterdam, The Netherlands, 2019; pp. 175–206. ISBN 978-0-12-814934-8. [Google Scholar]
- Kirova-Yordanova, Z. Application of the Exergy Method to the Environmental Impact Estimation: The Nitric Acid Production as a Case Study. Energy 2011, 36, 3733–3744. [Google Scholar] [CrossRef] [Scilit]
- Nascimento, G.R.O.; Dangelo, J.V.H. Operating Parameters Analysis of a Nitric Acid Plant to Increase Production and Reduce NOx Gases Emission. Chem. Eng. Process. Process Intensif. 2024, 196, 109662. [Google Scholar] [CrossRef] [Scilit]
- Grande, C.A.; Andreassen, K.A.; Cavka, J.H.; Waller, D.; Lorentsen, O.-A.; Øien, H.; Zander, H.-J.; Poulston, S.; García, S.; Modeshia, D. Process Intensification in Nitric Acid Plants by Catalytic Oxidation of Nitric Oxide. Ind. Eng. Chem. Res. 2018, 57, 10180–10186. [Google Scholar] [CrossRef] [Scilit]
- Pérez-Ramírez, J.; Kapteijn, F.; Schöffel, K.; Moulijn, J.A. Formation and Control of N2O in Nitric Acid Production. Appl. Catal. B Environ. 2003, 44, 117–151. [Google Scholar] [CrossRef] [Scilit]
- Inger, M.; Moszowski, B.; Ruszak, M.; Rajewski, J.; Wilk, M. Two-Stage Catalytic Abatement of N2O Emission in Nitric Acid Plants. Catalysts 2020, 10, 987. [Google Scholar] [CrossRef] [Scilit]
- Karsunke, X.; Zhu, A. Clariant EnviCat N2O-S Catalyst to Cut CO2eq by 690,000 Tonnes/y at Hengli’s Nitric Acid Plant in China. Focus Catal. 2024, 2024, 6. [Google Scholar] [CrossRef] [Scilit]
- Karsunke, X.; Guang, S. Clariant EnviCat N2O-S Catalyst Expected to Cut 275,000 Tonnes/y CO2eq at Sichuan Lutianhua Nitric Acid Plant. Focus Catal. 2025, 2025, 5. [Google Scholar] [CrossRef] [Scilit]
- Buttignol, F.; Rentsch, D.; Alxneit, I.; Garbujo, A.; Biasi, P.; Kröcher, O.; Ferri, D. Aging of Industrial Fe-Zeolite Based Catalysts for Nitrous Oxide Abatement in Nitric Acid Production Plants. Catal. Sci. Technol. 2022, 12, 7308–7321. [Google Scholar] [CrossRef] [Scilit]
- van den Brink, R.W.; Booneveld, S.; Verhaak, M.J.F.M.; de Bruijn, F.A. Selective Catalytic Reduction of N2O and NOx in a Single Reactor in the Nitric Acid Industry. Catal. Today 2002, 75, 227–232. [Google Scholar] [CrossRef] [Scilit]
- European Commission. Best Available Techniques for the Manufacture of Large Volume Inorganic Chemicals—Ammonia, Acids and Fertilisers; European Commission: Brussels, Belgium, 2007. [Google Scholar]
- van den Brink, R.W.; Booneveld, S.; Pels, J.R.; Bakker, D.F.; Verhaak, M.J.F.M. Catalytic Removal of N2O in Model Flue Gases of a Nitric Acid Plant Using a Promoted Fe Zeolite. Appl. Catal. B Environ. 2001, 32, 73–81. [Google Scholar] [CrossRef] [Scilit]
- Inger, M.; Rajewski, J.; Ruszak, M.; Wilk, M. The Influence of NOx Presence on the Catalytic N2O Decomposition over the Supported Double-Promoted Cobalt Spinel Catalyst. Chem. Pap. 2019, 73, 1979–1986. [Google Scholar] [CrossRef] [Scilit]
- Groves, M.C.E.; Sasonow, A. Uhde EnviNOx® Technology for NOX and N2O Abatement: A Contribution to Reducing Emissions from Nitric Acid Plants. J. Integr. Environ. Sci. 2010, 7, 211–222. [Google Scholar] [CrossRef] [Scilit]
- Qi, J.; Qi, X.; Pan, Y.; Cui, J.; Xiong, Y.; Shan, W.; Yu, H. Sm Doped NiO Catalysts with Excellent H2O Resistance for N2O Decomposition under Simulated Nitric Acid Plant Exhaust Condition. Appl. Surf. Sci. 2023, 611, 155657. [Google Scholar] [CrossRef] [Scilit]
- Capała, P.; Ruszak, M.; Rudawska, A.; Inger, M.; Wilk, M. The Technology of Tail Gases Purifying in Nitric Acid Plants and Design of deN2O and deNOx Reactors—Review. Appl. Sci. 2023, 13, 7492. [Google Scholar] [CrossRef] [Scilit]
- Chatterjee, I.B.; Joshi, J.B. Modeling, Simulation and Optimization: Mono Pressure Nitric Acid Process. Chem. Eng. J. 2008, 138, 556–577. [Google Scholar] [CrossRef] [Scilit]
- Yadav, R.K. Study of Simulation of Nitric Acid Production Using HYSYS Simulation Software. Int. J. Eng. Sci. Math. 2017, 6, 288–294. [Google Scholar]
- Abbasian Hamedani, E.; Abdalisousan, A.; Khoshgard, A.; Nazari, M. Energy, Exergy, and Sustainability Analysis of an Industrial Nitric Acid Plant. Energy Sources Part A Recovery Util. Environ. Eff. 2023, 45, 10952–10970. [Google Scholar] [CrossRef] [Scilit]
- Abbasian Hamedani, E.; Hamidzadeh, Z.; Mousavi, S.A.; Kariman, A.; Mahnesaei, A. Simulation of a Nitric Acid Production Unit in Aspen Hysys. In Proceedings of the 9th International Conference on Technology and Energy Management, Behshahr, Iran, 14–15 February 2024. [Google Scholar]
- Mukhitdinov, D.; Sattarov, O.; Akhmatov, A.; Abdullayeva, D.; Bekchanov, E. Computer Simulation and Optimization of the Oxidation Process in the Production of Nitric Acid in the Aspen Plus Environment. E3S Web Conf. 2023, 417, 05004. [Google Scholar] [CrossRef] [Scilit]
- Ivaniš, G.; Lazarevic, M.; Radovic, I.; Kijevcanin, M. Energy Integration of Nitric Acid Production Using Pinch Methodology. Hem. Ind. 2014, 69, 39. [Google Scholar] [CrossRef] [Scilit]
- Steltenpohl, P.; Graczová, E. Application of Extended NRTL Equation for Ternary Liquid-Liquid and Vapor-Liquid-Liquid Equilibria Description. Chem. Pap. 2010, 64, 310–317. [Google Scholar] [CrossRef] [Scilit]
- Stryjek, R.; Vera, J.H. PRSV: An Improved Peng—Robinson Equation of State for Pure Compounds and Mixtures. Can. J. Chem. Eng. 1986, 64, 323–333. [Google Scholar] [CrossRef] [Scilit]
- Abu-Eishah, S.I. Modification of the Predictive Capability of the PRSV-2 Equation of State for Critical Volumes of Binary Mixtures. Fluid Phase Equilibria 1999, 157, 1–16. [Google Scholar] [CrossRef] [Scilit]
- Aspen HYSYS, Process Simulation Software, AspenTech. Available online: https://www.aspentech.com/en/products/engineering/aspen-hysys (accessed on 18 March 2026).
- Smith, R. Chemical Process Design and Integration, 2nd ed.; Wiley: Chichester, UK, 2016. [Google Scholar]
- Plant Cost Index Archives. Available online: https://www.chemengonline.com/site/plant-cost-index/ (accessed on 18 March 2026).
- Peters, M.S.; Timmerhaus, K.D.; West, R.E. Plant Design and Economics for Chemical Engineers, 5th ed.; McGraw-Hill: New York, NY, USA, 2003. [Google Scholar]
- AACE International. Recommended Practice No. 18R-97: Cost Estimate Classification System—As Applied in Engineering, Procurement, and Construction for the Process Industries; 2020 revision (originally published 1997); AACE International: Morgantown, WV, USA, 2020. [Google Scholar]
- Quaschning, V. Specific Carbon Dioxide Emissions of Various Fuels. Available online: https://www.volker-quaschning.de/datserv/CO2-spez/index.php (accessed on 18 March 2026).
- Sims, R.E.H.; Schock, R.N.; Adegbululgbe, A.; Fenhann, J.; Konstantinaviciute, I.; Moomaw, W.; Nimir, H.B.; Schlamadinger, B.; Torres-Martínez, J.; Turner, C.; et al. Energy supply. In Climate Change 2007: Mitigation. Contribution of Working Group III to the Fourth Assessment Report of the Intergovernmental Panel on Climate Change; Metz, B., Davidson, O.R., Bosch, P.R., Dave, R., Meyer, L.A., Eds.; Cambridge University Press: Cambridge, UK; New York, NY, USA, 2007. [Google Scholar]
- Natural Gas Rates. Available online: https://www.kitchenerutilities.ca/en/rates/natural-gas-rates.aspx (accessed on 18 March 2026).
- European Commission. Commission Implementing Regulation (EU) 2018/2066 of 19 December 2018 on the Monitoring and Reporting of Greenhouse Gas Emissions Pursuant to Directive 2003/87/EC of the European Parliament and of the Council and Amending Commission Regulation (EU) No 601/2012 (Text with EEA Relevance.). Off. J. Eur. Union 2018, 334, 1–93. [Google Scholar]
- Electricity Price Statistics. Available online: https://ec.europa.eu/eurostat/statistics-explained/index.php?title=Electricity_price_statistics (accessed on 18 March 2026).
- Business Analytiq. Nitric Acid Price Index. Available online: https://businessanalytiq.com/procurementanalytics/index/nitric-acid-price-index/ (accessed on 18 March 2026).
- Sandbag. Carbon Price Viewer. Available online: https://sandbag.be/carbon-price-viewer/ (accessed on 18 March 2026).
- Sun, L.; Doyle, S.; Smith, R. Understanding Steam Costs for Energy Conservation Projects. Appl. Energy 2016, 161, 647–655. [Google Scholar] [CrossRef] [Scilit]
- Butzengeiger, S.; Michaelowa, A. Proposed Mechanism Methodology: N2O Abatement from Nitric Acid Production|UNFCCC; Carbon Climate Protection GmbH: Langenlois, Austria, 2026. [Google Scholar]
- Global Nitric Acid Output, Plant Count and the Downstream Ammonium Nitrate Share. Available online: https://ifastat.org/ (accessed on 18 March 2026).
- Menegat, S.; Ledo, A.; Tirado, R. Greenhouse Gas Emissions from Global Production and Use of Nitrogen Synthetic Fertilisers in Agriculture. Sci. Rep. 2022, 12, 14490, Correction in Sci. Rep. 2022, 12, 19777. [Google Scholar] [CrossRef] [Scilit]
- The Nitric Acid Climate Action Group. Available online: https://www.nitricacidaction.org/ (accessed on 18 March 2026).
- 2006 IPCC Guidelines for National Greenhouse Gas Inventories, Volume 3, Industrial Processes and Product Use. Available online: https://www.ipcc-nggip.iges.or.jp/public/2006gl/vol3.html (accessed on 18 March 2026).
- Innovation Outlook Renewable Ammonia. Available online: https://www.irena.org/publications/2022/May/Innovation-Outlook-Renewable-Ammonia (accessed on 18 March 2026).
- Ammonia Technology Roadmap—Analysis. Available online: https://www.iea.org/reports/ammonia-technology-roadmap (accessed on 18 March 2026).
- Maritime Fuel Mix Could Be 25% Ammonia by 2050. Available online: https://ammoniaenergy.org/articles/maritime-fuel-mix-could-be-25-ammonia-by-2050/ (accessed on 18 March 2026).
- Neumann, N.C.; Baumstark, D.; López Martínez, P.; Monnerie, N.; Roeb, M. Exploiting Synergies between Sustainable Ammonia and Nitric Acid Production: A Techno-Economic Assessment. J. Clean. Prod. 2024, 438, 140740. [Google Scholar] [CrossRef] [Scilit]
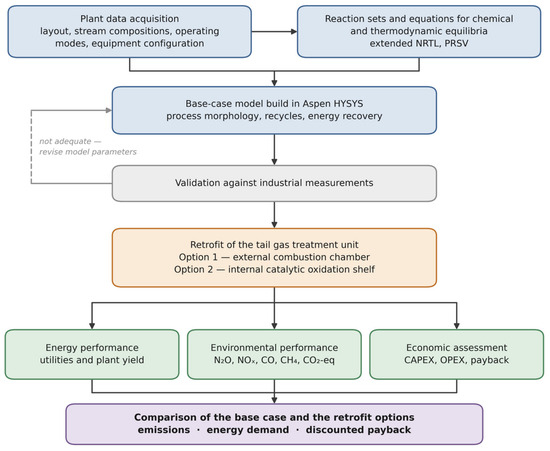
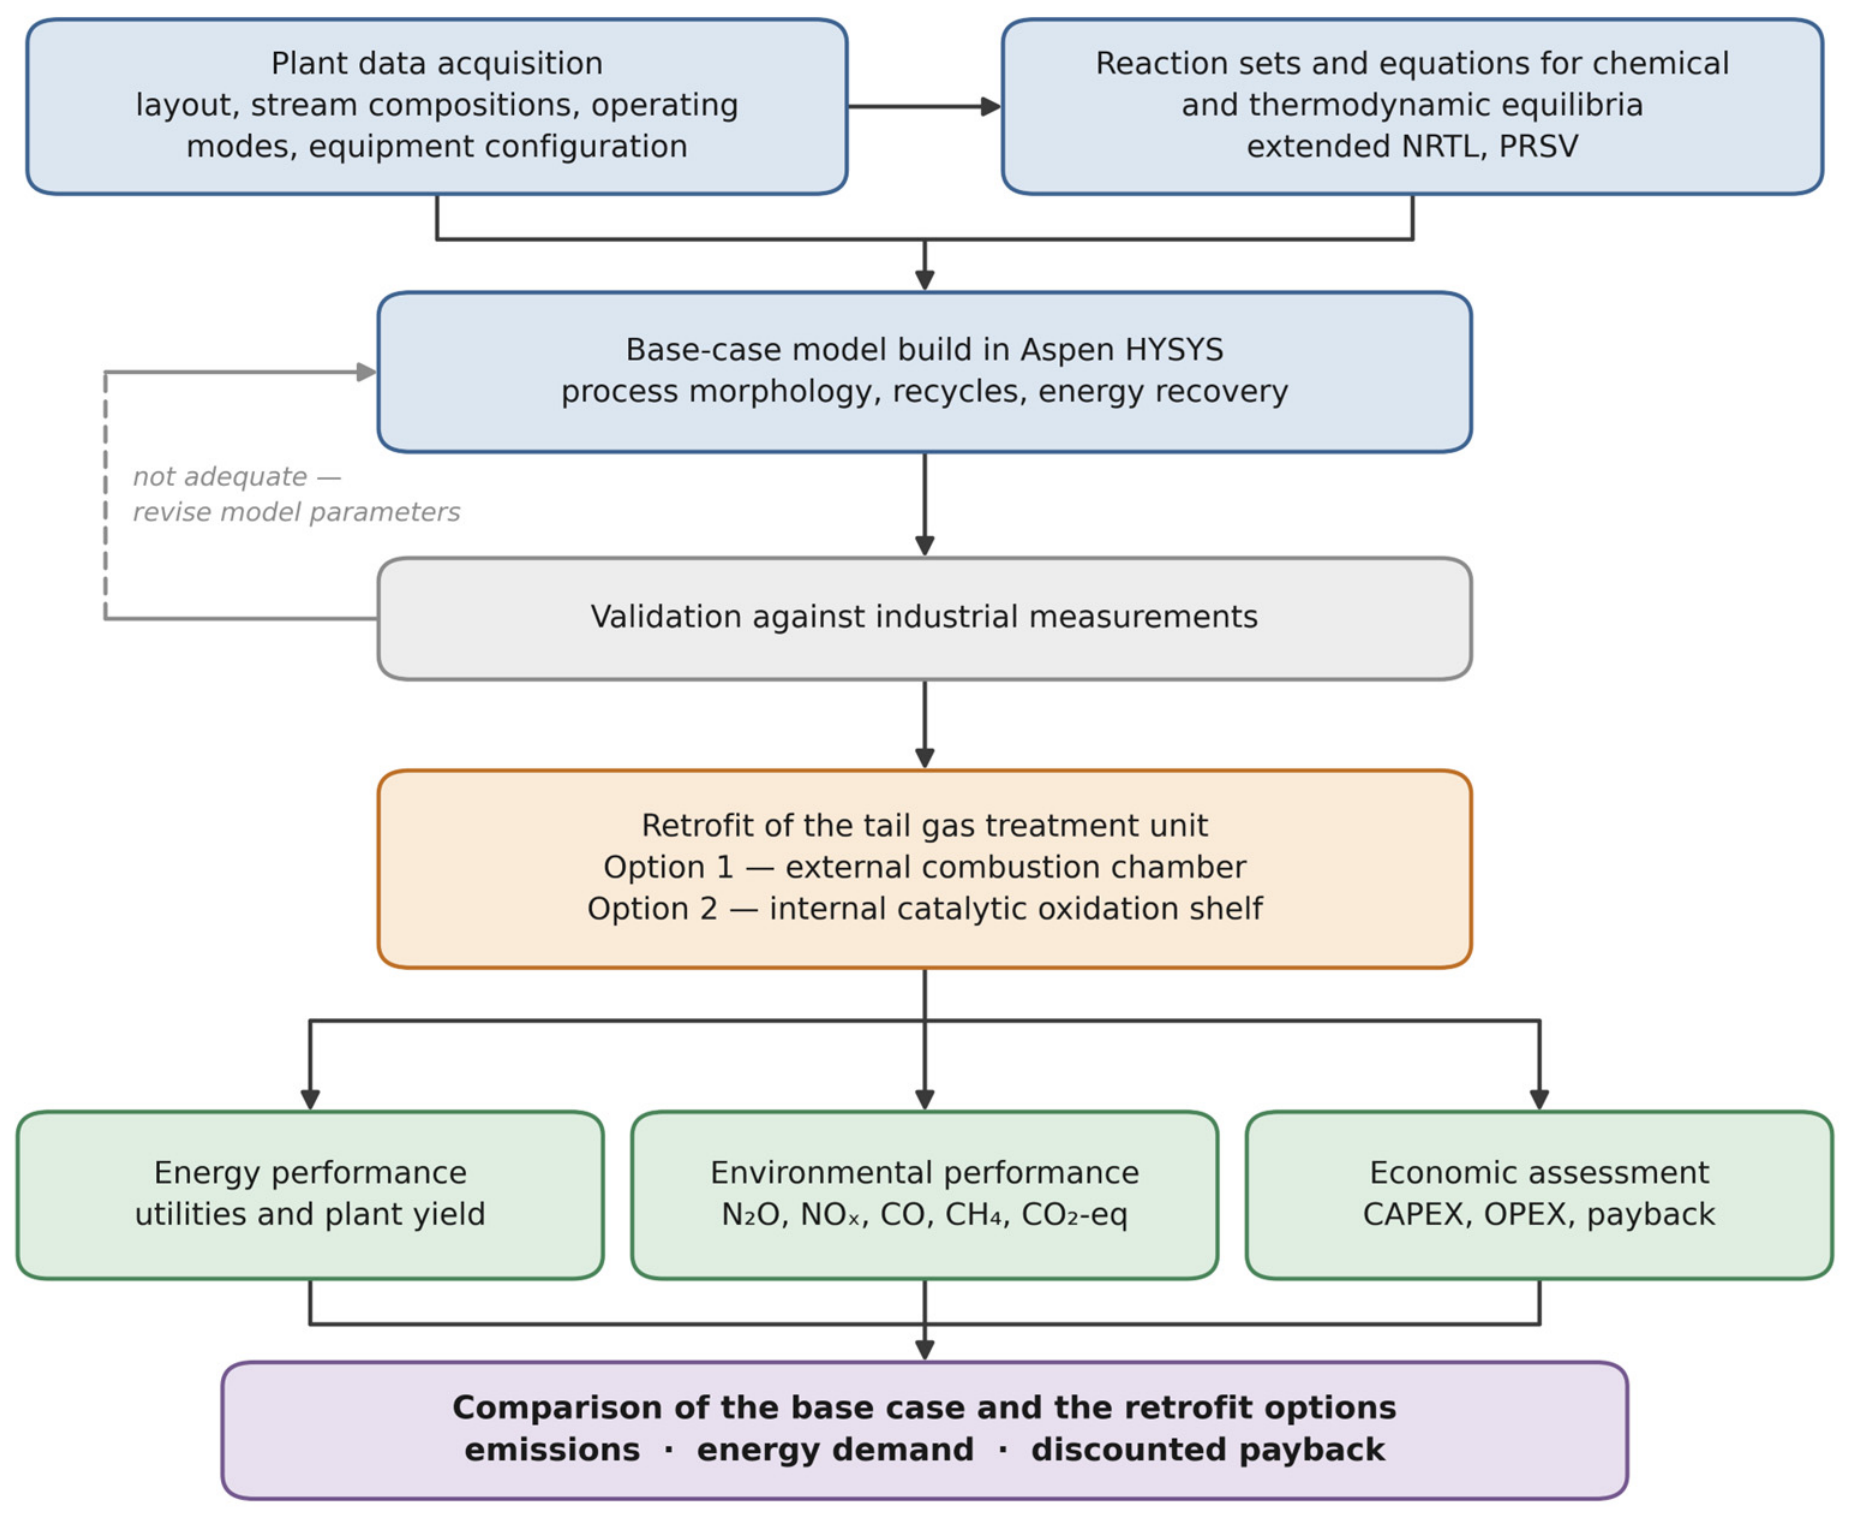
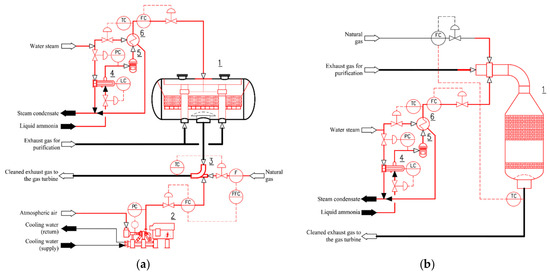
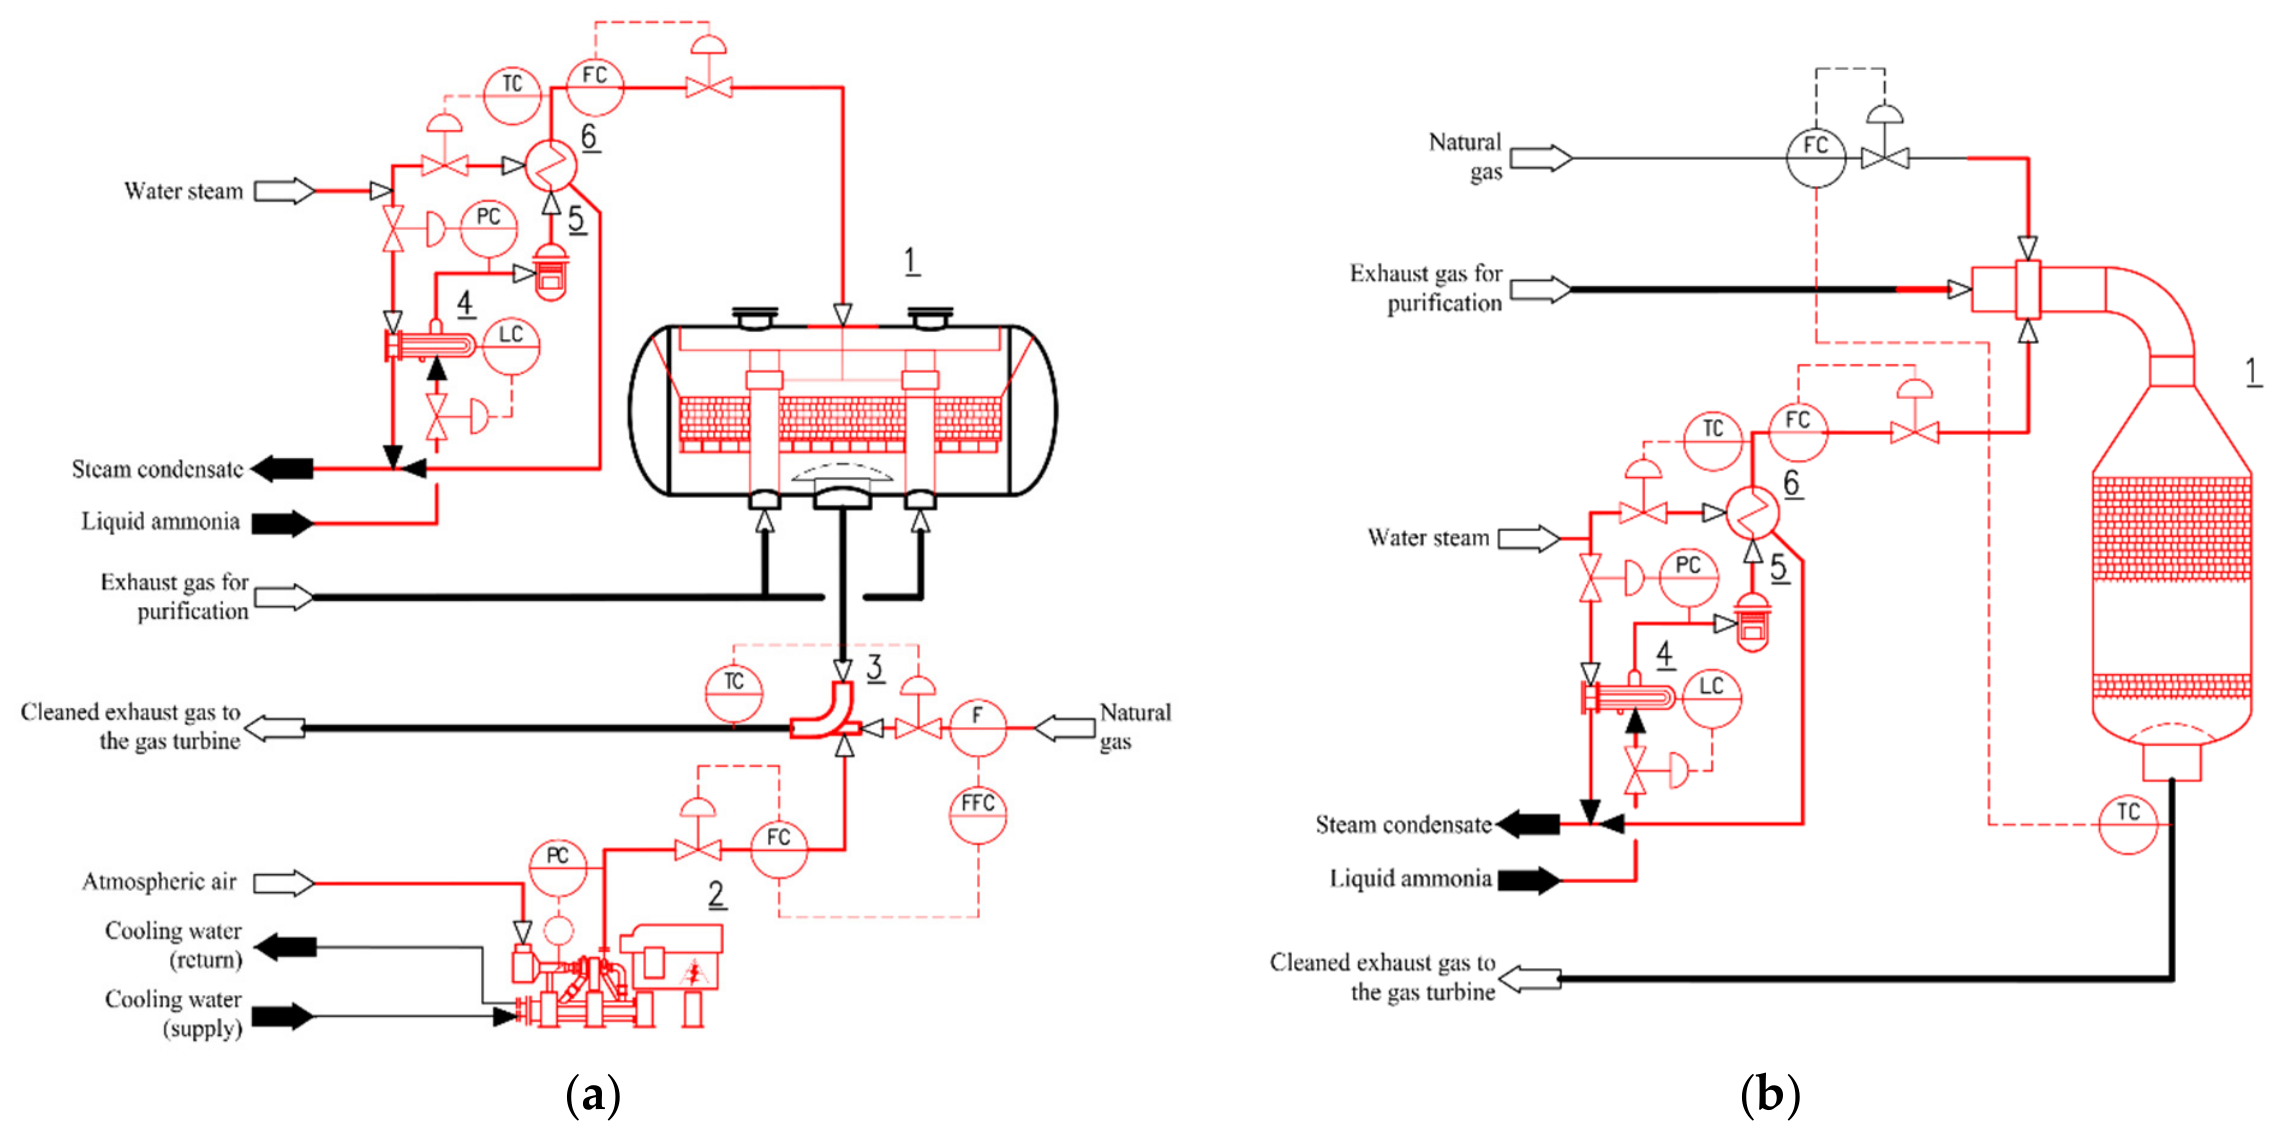
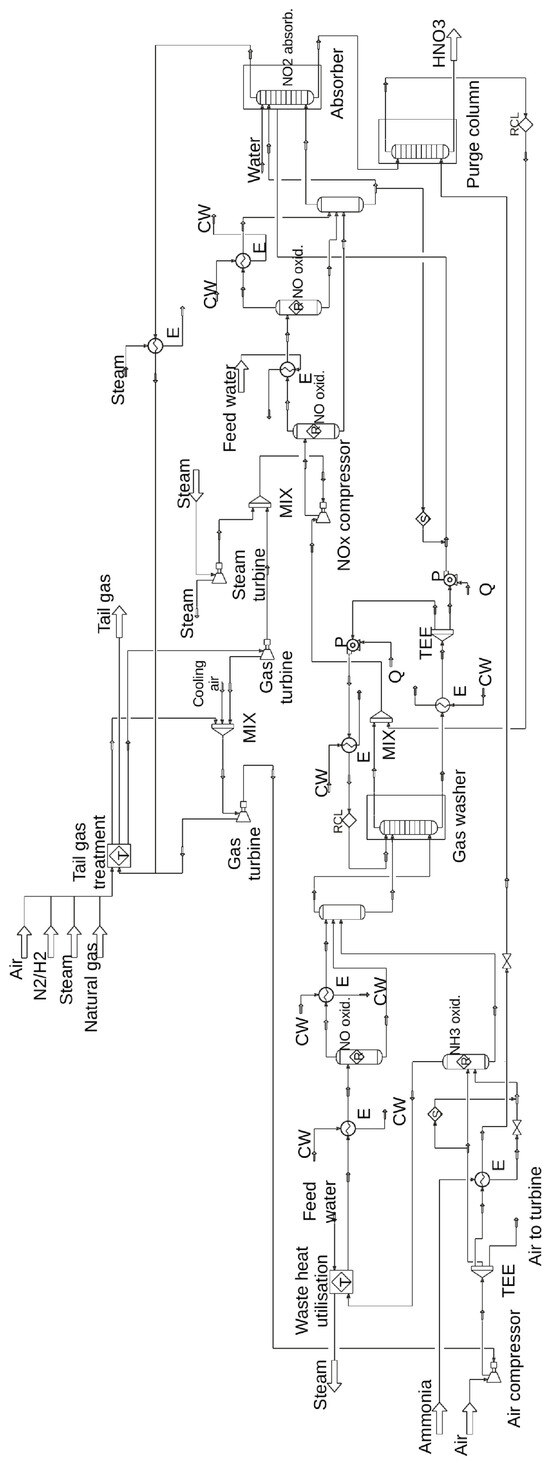
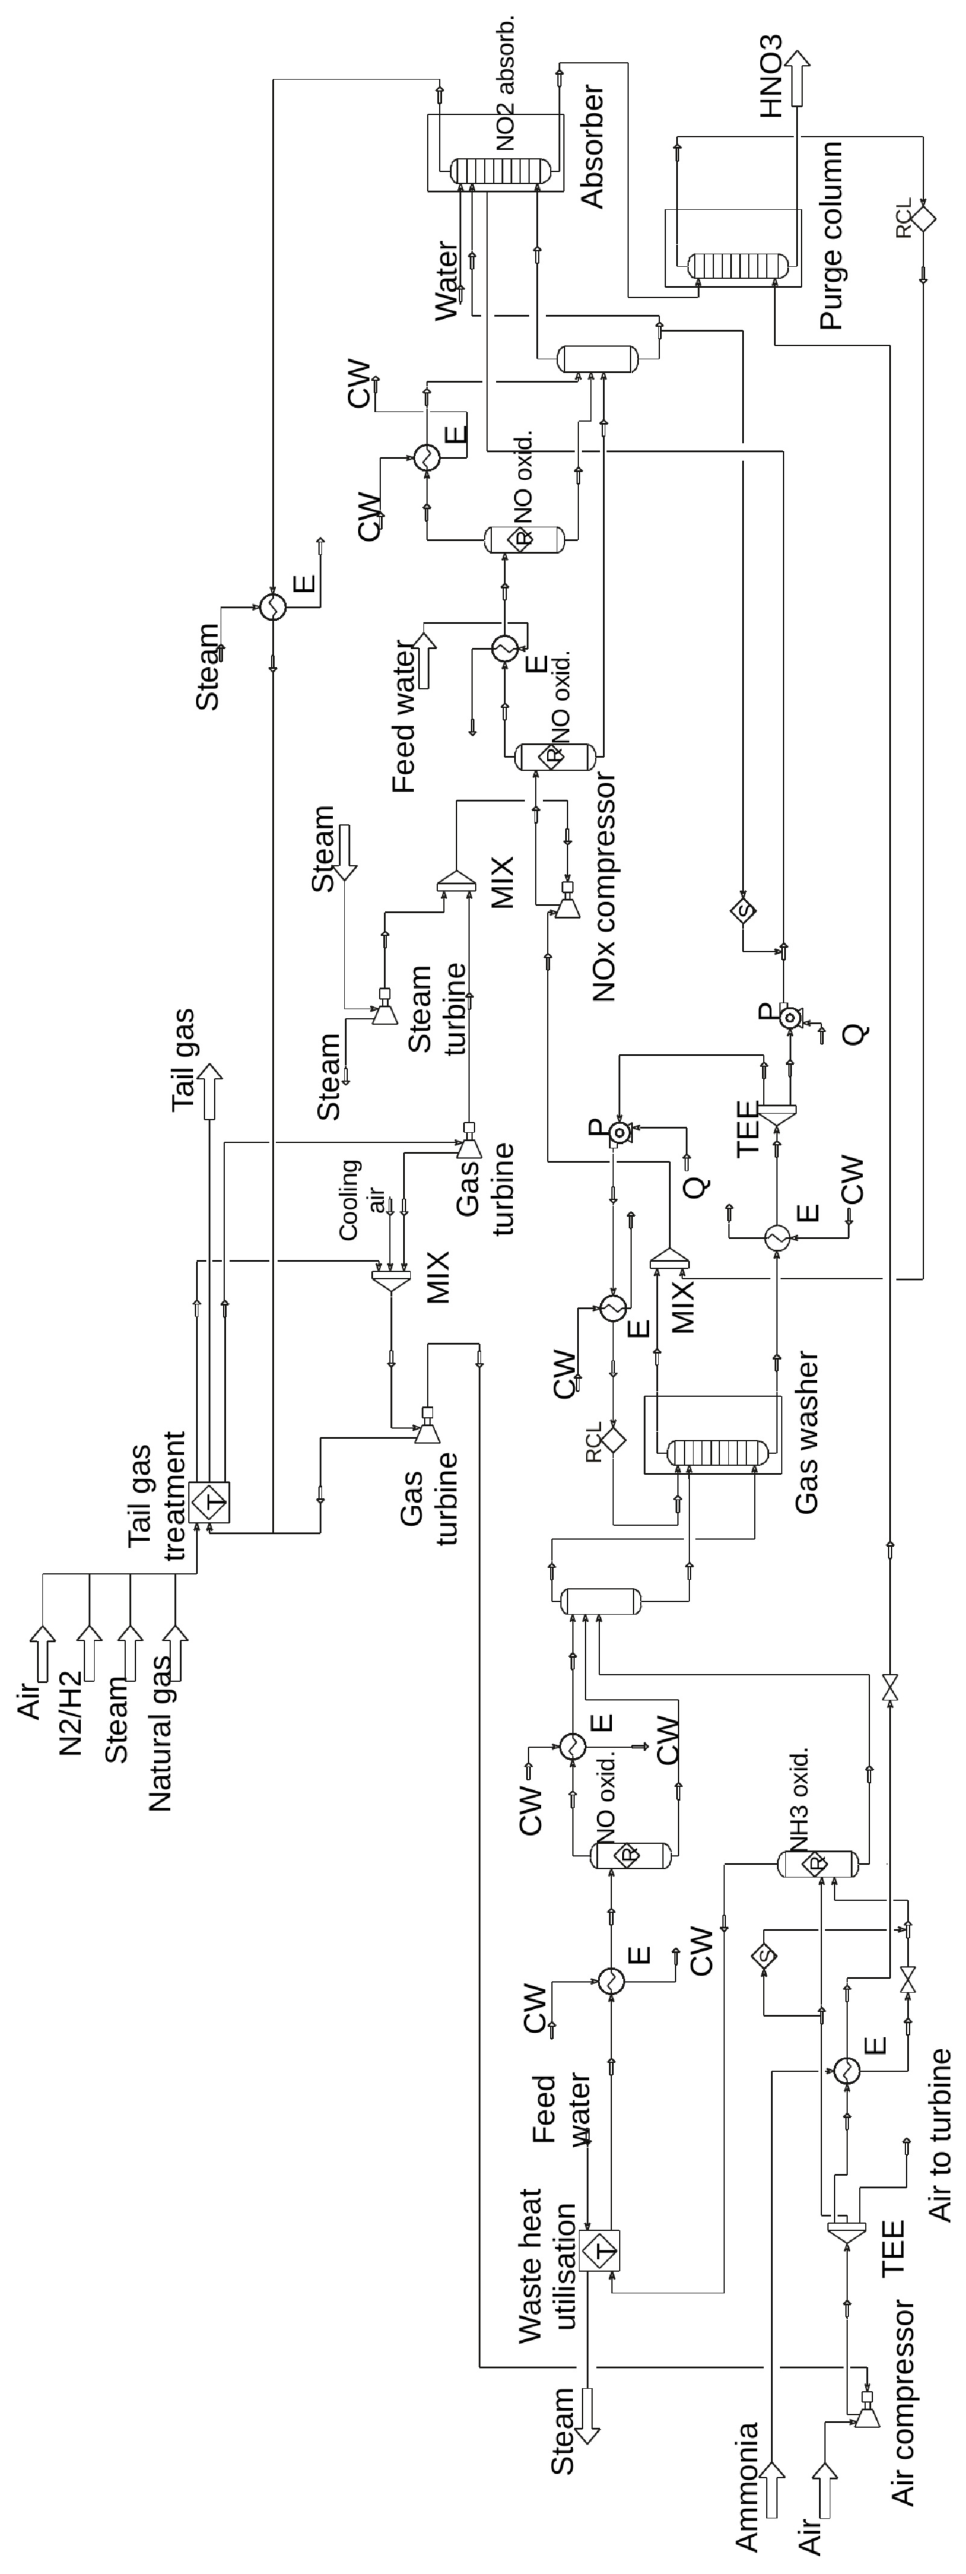
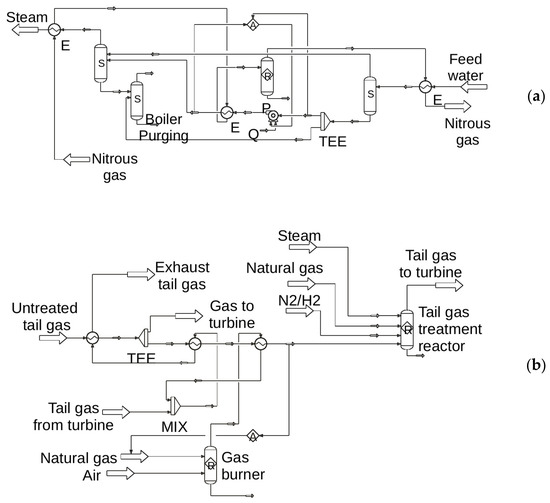
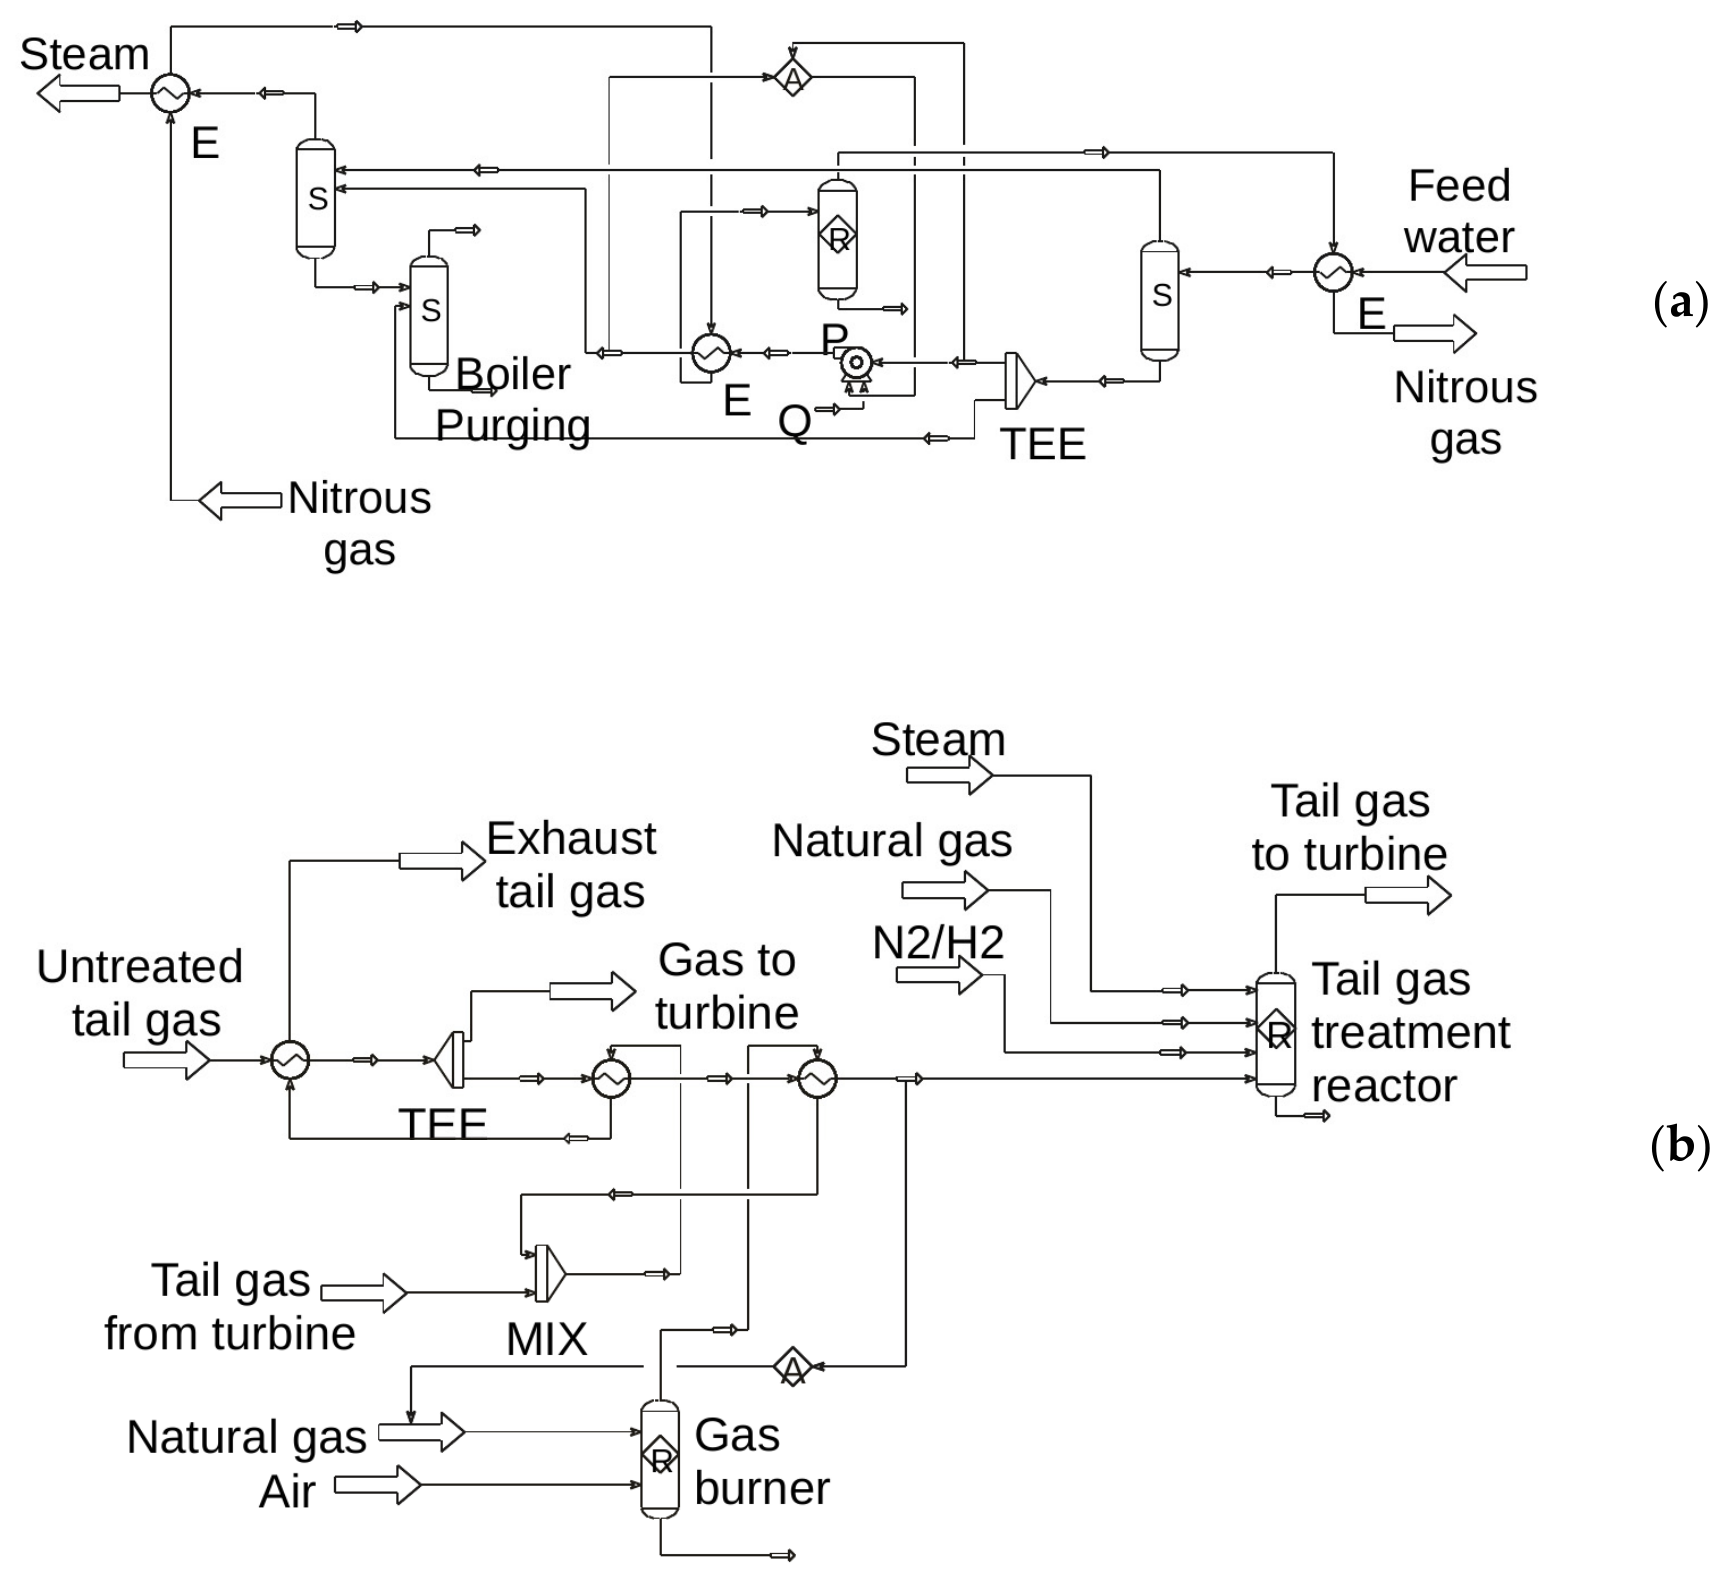
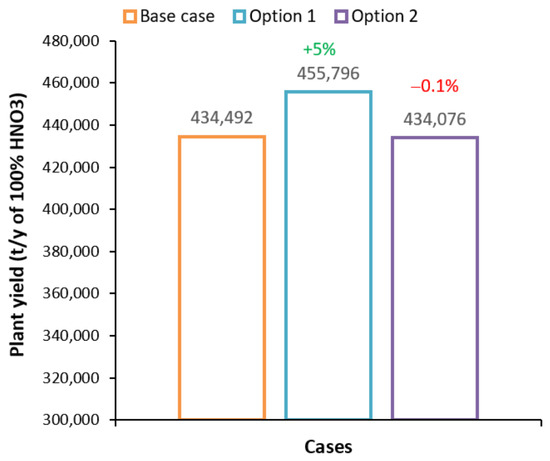
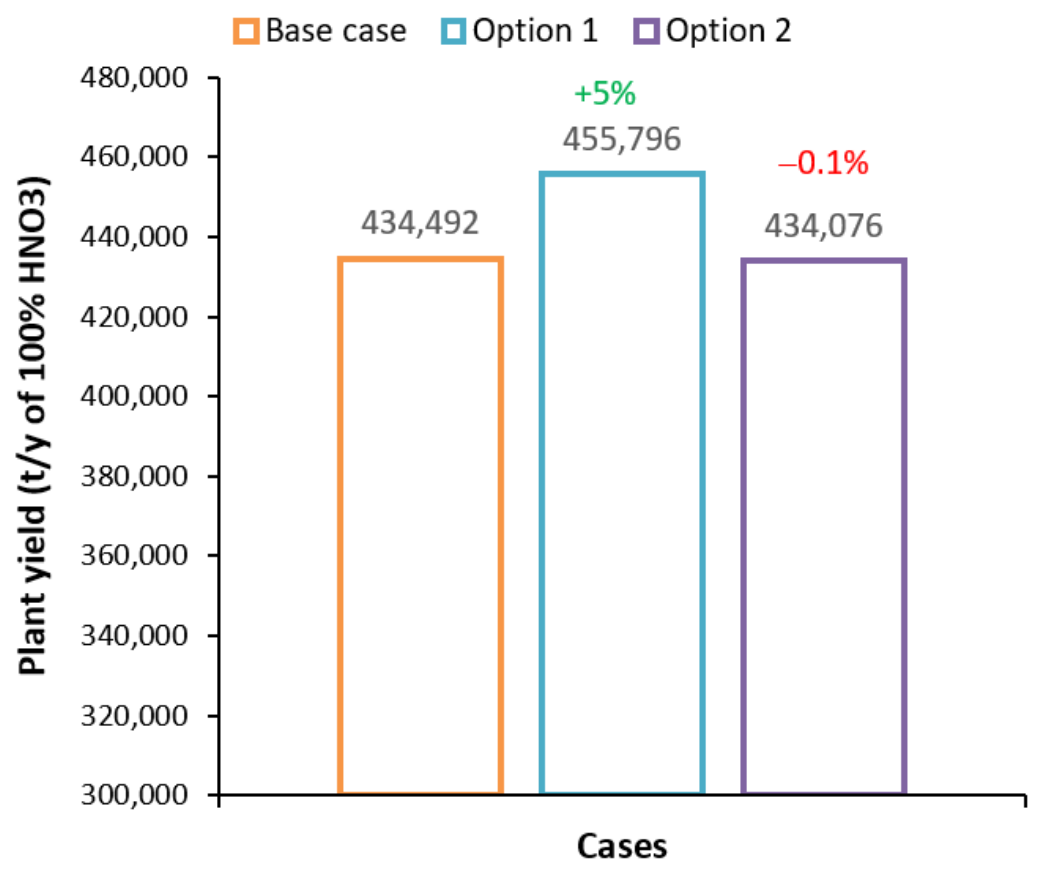
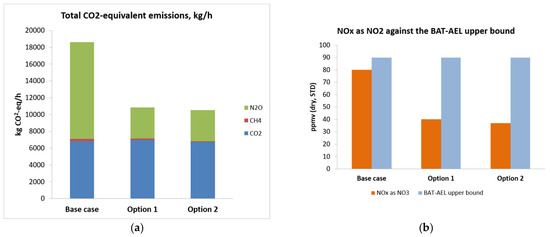
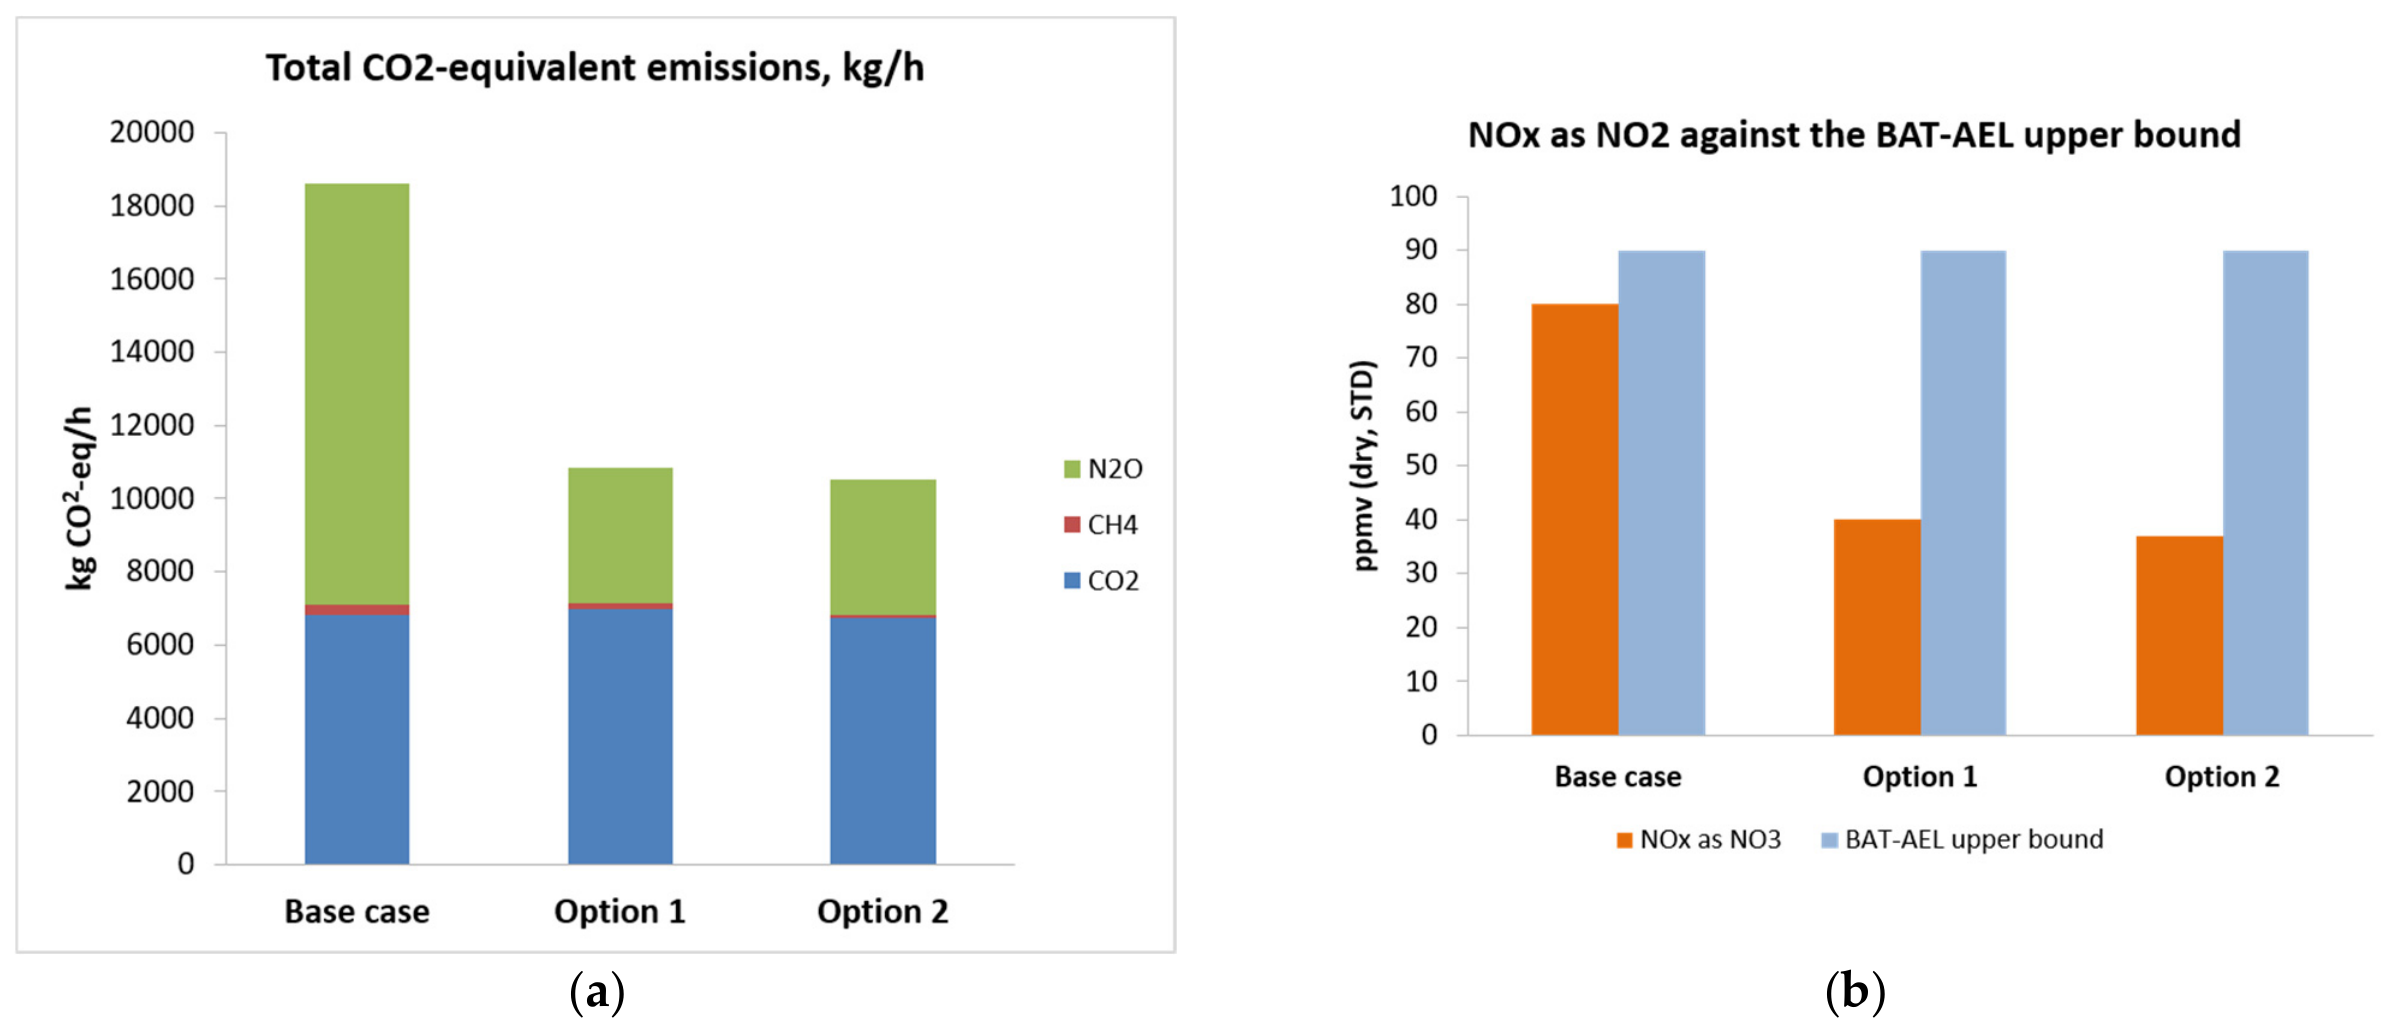
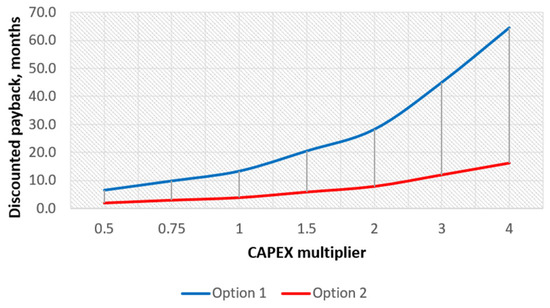
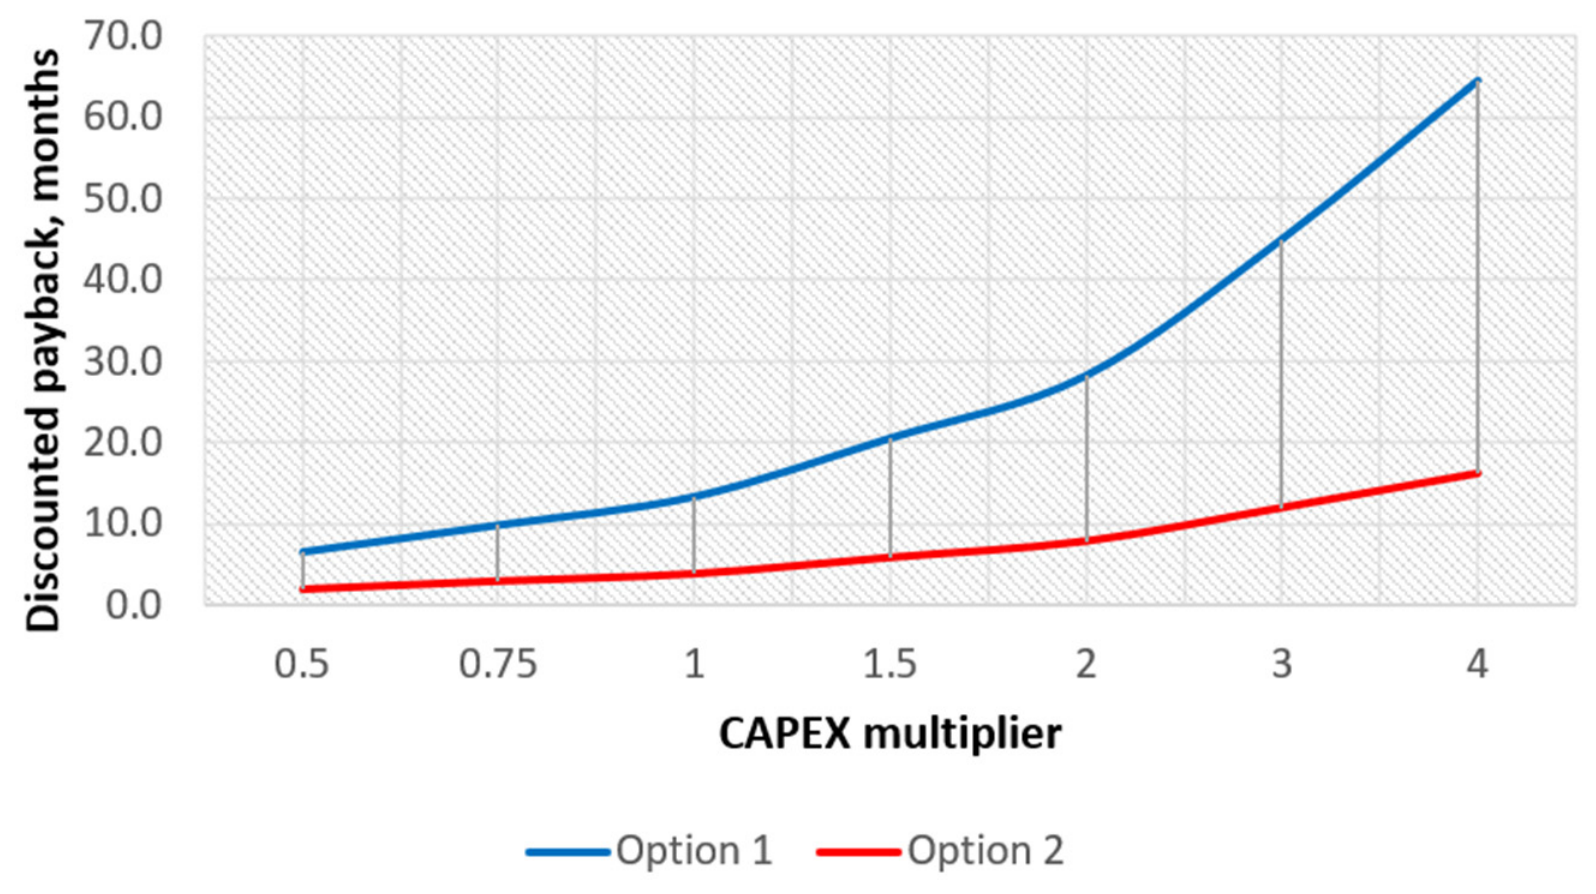
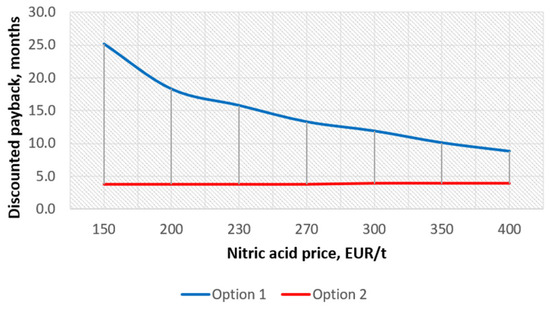
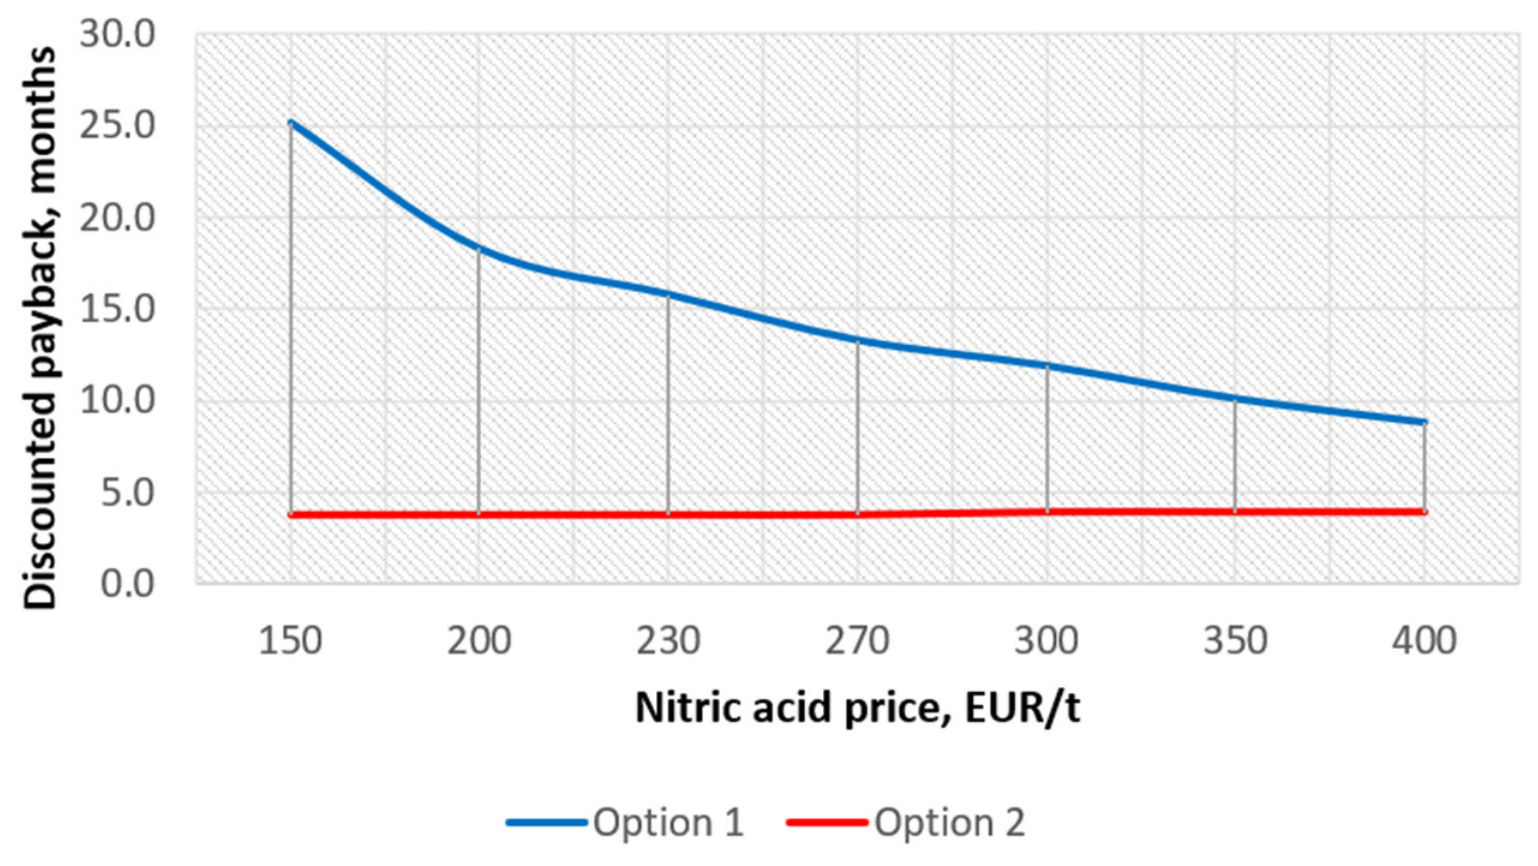
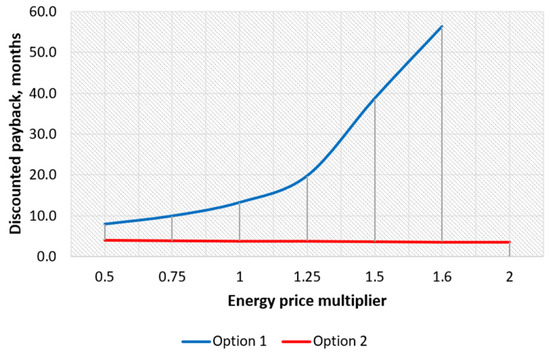
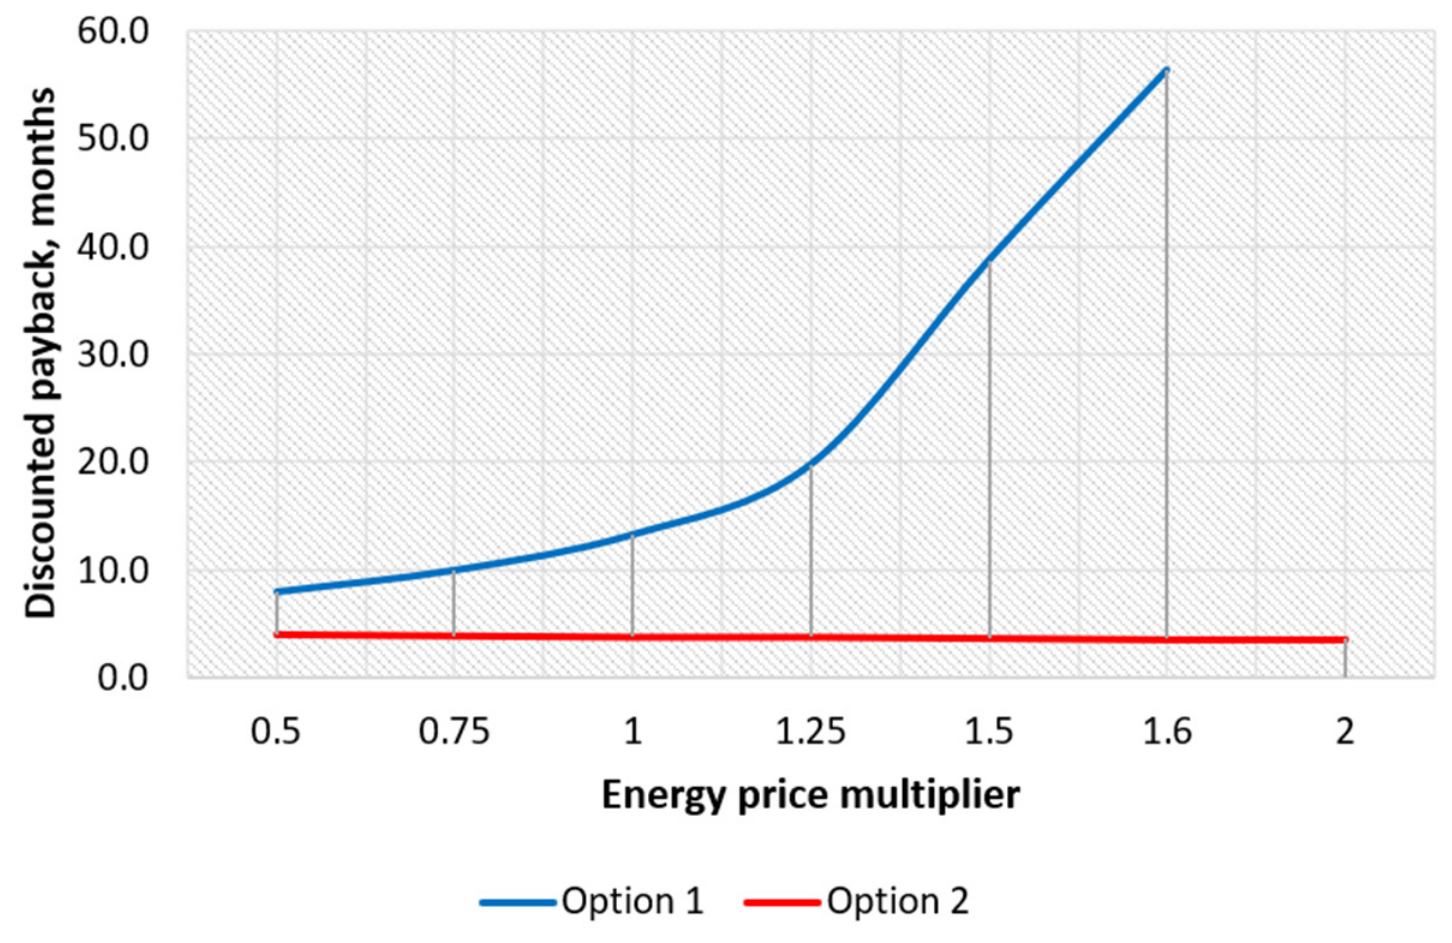

Disclaimer/Publisher’s Note: The statements, opinions and data contained in all publications are solely those of the individual author(s) and contributor(s) and not of MDPI and/or the editor(s). MDPI and/or the editor(s) disclaim responsibility for any injury to people or property resulting from any ideas, methods, instructions or products referred to in the content. |
© 2026 by the authors. Licensee MDPI, Basel, Switzerland. This article is an open access article distributed under the terms and conditions of the Creative Commons Attribution (CC BY) license.