


Abstract
Non-sinusoidal operating conditions are frequently present in modern power systems and can adversely affect the normal operation and performance of industrial equipment connected to the electrical grid. This paper presents a method for evaluating the relationship between the harmonic weights of voltage and current and the sensitivities of reactive and apparent power under these conditions. These conditions primarily arise from non-linear loads and circuit components, particularly power electronic converters and other power electronic devices. In practical industrial environments, the harmonic composition of voltage and current may vary considerably, leading to significant changes in their RMS values and consequently affecting power transfer and overall power quality. The proposed approach first establishes the mathematical dependencies between active, reactive, and apparent power and the harmonic components of voltage and current. Based on these relationships, the sensitivities of the power quantities can be determined when one or more system parameters undergo variations. To validate the proposed methodology, we developed and implemented a numerical algorithm in MATLAB/Simulink for a practical industrial case. We compare the sensitivities obtained using the proposed approach with those calculated directly from measured data. The small differences between the two sets of results confirm the method’s accuracy and show that it is suitable for assessing harmonic variations on power quantities in non-sinusoidal power systems.
1. Introduction
Nowadays, electrical power systems are subjected to a non-sinusoidal regime that produces voltage and current harmonics, with harmful consequences on equipment. The most common effects associated with this are an increase in losses in wires and transformers, electric drives overheating, the degradation of insulation, the growth of electromagnetic interference, and errors in energy measurement [1,2]. Therefore, the analysis of active (P), reactive (Q), and apparent () power in the non-sinusoidal regime is very important. Voltage stability and the maintenance of the power factor in the presence of non-linear loads are based on active and reactive power assessment [3,4]. For example, the correct use of reactive power compensation can decrease the capacitive battery by 5–7% and, at the same time, the total power losses can be reduced [5,6]. The causes of the non-sinusoidal regime that modifies the harmonic parameters are, on the one hand, the different types of generators used, including renewable sources, and, on the other hand, the increasingly diverse set of non-linear loads, consisting, for example, of electronic devices, power converters, electrical power equipment, and inverters [7,8,9].
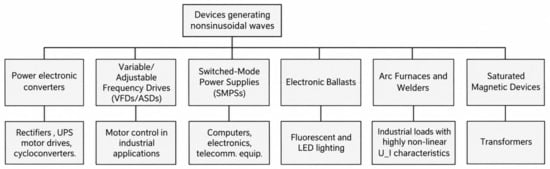
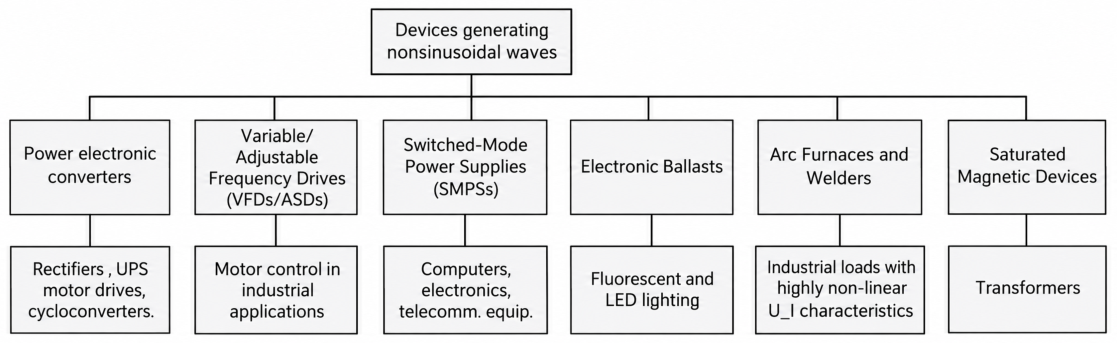
Previous work has analysed the sensitivity analysis applied to the calculation of dependency between the variations of voltage and current harmonic parameters and the electrical system response by computing the network transfer functions [10,11,12]. Other works propose specific techniques to address detailed sensitivity methods using active power data obtained by acquired measurement systems, thus highlighting the importance of the variation of each harmonic parameter in different operating regimes [13,14,15]. From a synthetic perspective, Figure 1 presents a summary of the main types of equipment that generate non-sinusoidal waveforms, including whether the sinusoidal power supply network is considered, a new non-sinusoidal regime is established, or a new sinusoidal regime is established when the initial conditions are still non-sinusoidal.
Figure 1.
General types of non-linear equipment.
Unlike the previously mentioned works, the main subject of the article is the determination of the influence of the variation of the voltage, current and phase shift angle weights (defined in the following as parameters) on the active, reactive and apparent powers absorbed by an industrial consumer. On a real circuit operating in non-sinusoidal mode, two modifications were introduced—which could very possibly appear as faults—and the measured data were used to calculate the sensitivities associated with the powers. within this context, new relations for the active, reactive and apparent power calculations were then introduced dependent on these parameters, which were further used to calculate the sensitivities [16]. The variations of one or more harmonic parameters were considered as input data for the numerical algorithm. The mathematical formulation and the relations used to determine the dependence of active, reactive, and apparent power sensitivities on harmonic parameters are presented in Section 2. Section 3 analyses a real industrial load, discusses the obtained results, and identifies errors. Finally, Section 4 provides conclusions.
2. Materials and Methods
The classical definition of the first-order sensitivity of function F of n variables , if only the change of a single variable xk is taken into account, is as follows [16]:
We considered that the set of variables on which the function F depends can be divided into 3 disjoint subsets, X, Y, Z, each containing the same number n of variables, so . This classification of variables will be used in the following. Similarly, second-order sensitivity concerning the variation of two variables (xk, ym) from two subsets can be defined as follows [17]:
where the variables k, m = 1, …, n. In general, one can express the sensitivity of the function F to the variation of multiple variables. Thus, for the simultaneous variation of all variables x, y, z from the 3 disjointed subsets, the 3n multiple-order sensitivity is expressed as a Taylor linear approximation in connection with the parameters x, y, z:
The voltage and current at the terminals of a load operating in a non-sinusoidal regime appear in the time domain in the form of their Fourier decomposition, expressed as follows [18,19]:
where n represents the number of harmonics, and Uk and Ik the rms values of voltage and current harmonics (expressed in volts and amperes, respectively); the phase angle is between the voltage and current of each harmonic order. In industrial applications, the initial non-sinusoidal operating mode can be modified by varying one or more parameters, which can be undertaken by changing the non-linear characteristics of the load, the occurrence of faults or the operating mode of the network. Thus, the values of the active, reactive, and apparent power absorbed by a load strongly depend on three categories of parameters which define the non-sinusoidal operating regime. These harmonic parameters constitute the 3 disjoint subsets specified above, X, Y, Z, and are defined as follows [20]:
- The relative voltage harmonic with respect to the fundamental:
- The relative current harmonic with respect to the fundamental:
- The angle between the voltage and current harmonics , for which one can compute cosine and sine as given below:
Starting from the general definition relations, the powers P, Q, Sa can be calculated according to the three parameters with the following relations [20]:
where U1 and I1 represent the rms values of voltage and current, respectively, of the fundamental frequency (in V and A). From relations (11)–(13), it can be seen that the dependencies of P, Q and Sa on the harmonic parameters suggest the use of the sensitivities defined by relation (3). Considering that the parameters r, p, and described by relations (7)–(10) represent the subsets of variables X, Y, and Z and F represents P, Q, and Sa, respectively, then the 3n multiple-order sensitivities related to the active, reactive and apparent power, respectively and the 2n multiple-order sensitivity related to apparent power are calculated starting from (3) and using relations (11)–(13) as follows:
Obviously, any combination of parameters r, p and can be chosen, which changes for any harmonic including the same one when calculating the sensitivities. In particular, presuming that only two parameters vary simultaneously compared to the initial values, for example for the same k-harmonic rk and pk, then the second-order sensitivity regarding the active, reactive and apparent powers is calculated based on relations (14)–(16). Results of the second-order sensitivities are as follows:
If one or more parameters do not change from their initial values, then the respective term(s) is/are missing (is/are 0) from the sum. In industrial applications, we can define an initial regime with the initial values of parameters r, p, . Such a regime can be considered the nominal operating regime of the load, and the initial parameters can be measured by a data acquisition system. and denote the new values of relative harmonic weight of voltage and current and of the phase angle, respectively, that change compared to the initial ones.
Three computation methods are used: (i) Method 1 (direct computation) evaluates P, Q, and Sa by directly applying the values of the initial harmonic parameters using (11)–(13). (ii) Method 2 implies the re-computation of the powers after modifying a selected subset of relative values of harmonic using the same relations (11)–(13). P′, Q′, and Sa′ denote these values. (iii) Method 3 considers the sensitivity-based estimation for the same parameters’ changes using (14)–(16), where the terms in the sums corresponding to the parameters that do not change are zero. Then, in the next step of the numerical algorithm, one can calculate new values of the active Pcalc., reactive Qcalc., and apparent power Sa,calc., respectively, using Method 3 according to the variation in the parameters. The following relations can be introduced:
where P, Q and S represent the initial values of active, reactive, and apparent power, calculated with Method 1.
To validate the proposed method, the absolute error can be defined as the difference between the and computed in Method 1 and the values of powers calculated with Method 3 that use the sensitivity method:
The relative errors concerning the increase or decrease in active, reactive and apparent power when parameters are modified are obtained with the relations below:
Considering the classical definition of Total Harmonic Distortion of voltage Ku and current Ki, respectively, relations (7) and (8) can be used to obtain the following:
The values of these two indicators in the two studied cases provide quantitative information about the power quality, and voltage/current distortion in the two non-sinusoidal regimes.
3. Case Study, Results and Discussions
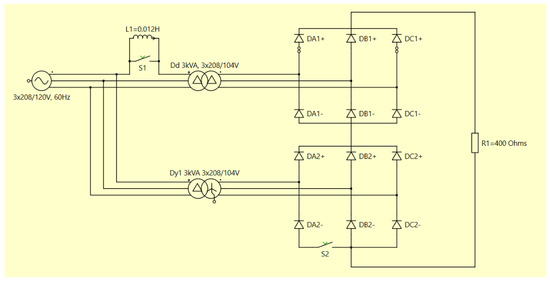
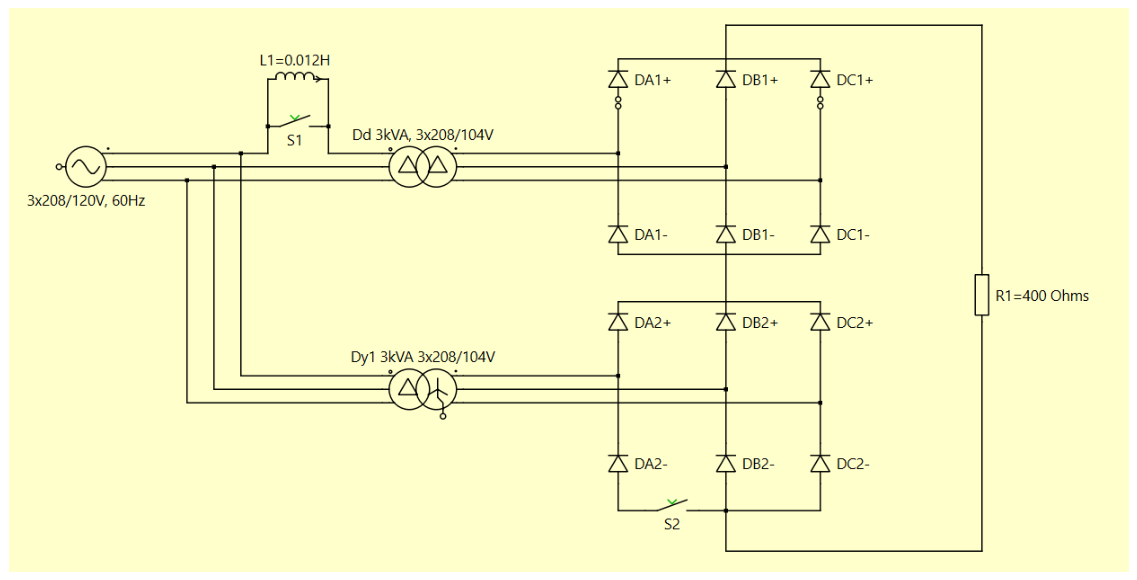
For the case study, the power circuit represented in Figure 2 consists of a twelve-pulse uncontrolled rectifier energized through two transformers of equal rating. At the same time, the data acquisition system provides information about the first 50 harmonics, which were not included in the paper due to their very large volume. To obtain the 15-degree phase shift between the three-phase output voltages at the transformers’ secondary outputs, one transformer has a delta–delta winding connection, whereas the other one has a delta–star configuration. The main power supply comes from a system that is intrinsically slightly polluted with harmonics, due to the proximity of a light-rail system.
Figure 2.
The studied three-phase circuit.
In Case I, the circuit is symmetrical and operated in normal conditions. In Case II, there are non-symmetries state-simulated as possible faults by inserting the inductivities L1 in series with phase A, together with the removal of one diode (marked as DA2).
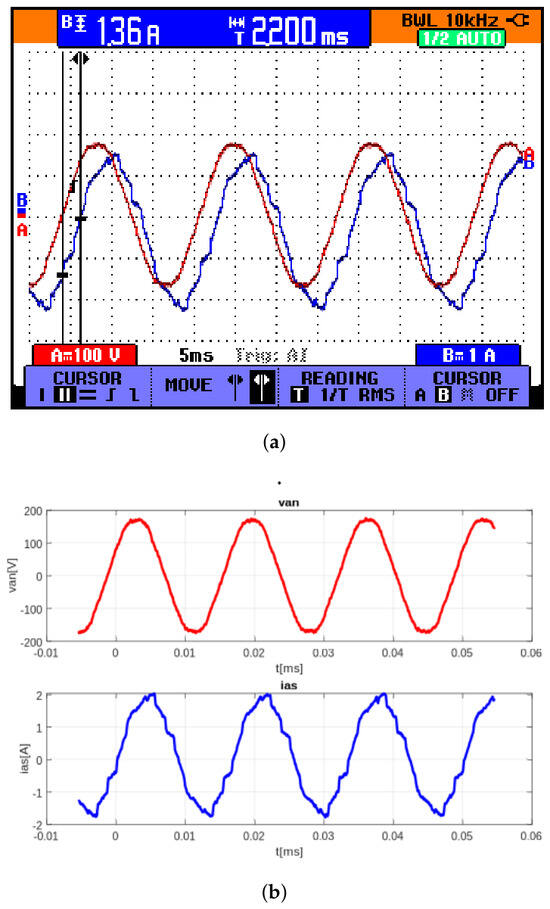
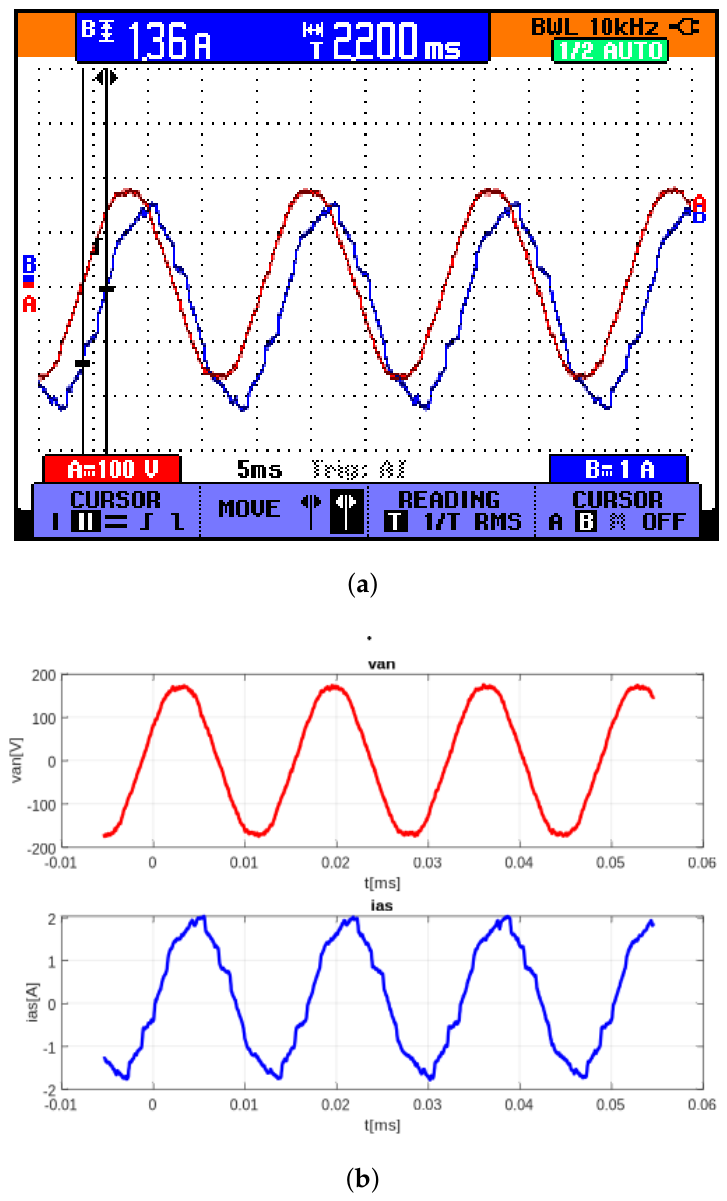
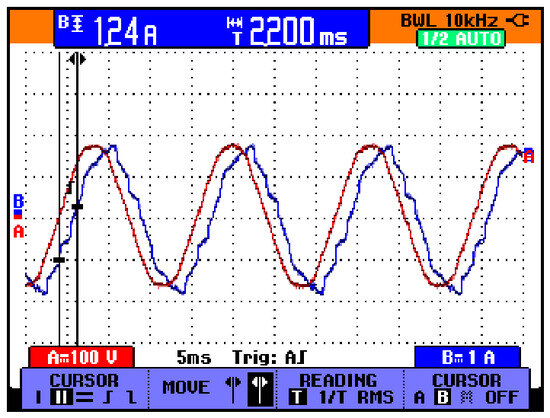
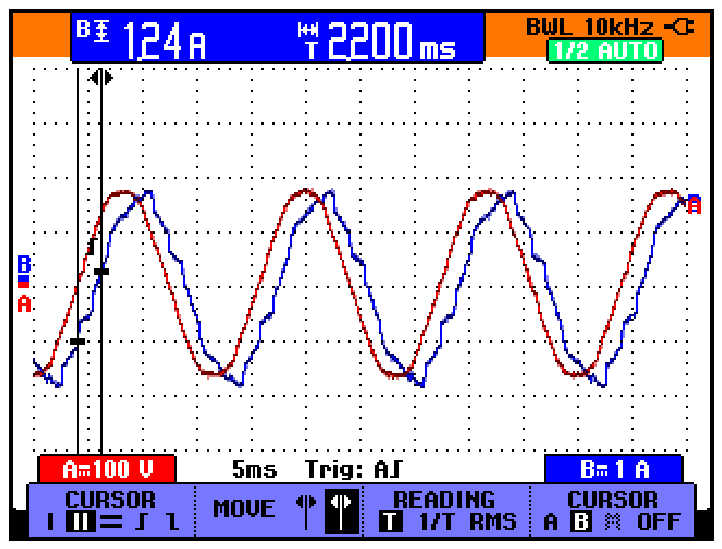
The circuit, supplied by 3x208 V/60 Hz, consists of one delta–delta 3 kVA, 3x208 V/104 V, 60 Hz transformer, one delta–star 3 kVA, 3x208 V/104 V, 60 Hz transformer, two uncontrolled three-phase bridge rectifiers, and a resistive load of 400 ohms (for the rectifiers). The inductor introduced to create unbalanced voltages at the input to the delta–delta transformer has an air core and a value of 0.012 H. All measurements were performed using a Fluke 196C Scopemeter (Fluke Corporation, Everett, WA, USA), whereas waveform acquisition and harmonic analysis were performed using the dedicated software package Fluke View (version 4.5) associated with the meter. To obtain the line to neutral voltages, one connected a three-phase high impedance load at the output of the three-phase power supply, with direct access to its isolated neutral. All three phase line-to-neutral voltages, together with the line currents (uA and iA; uB and iB; and y uC and iC, respectively) were acquired using equipment from a specialized laboratory at the Northern Alberta Institute of Technology. Consequently, the phase notations (A, B, C) conform to Canadian standards. The sampling frequency used in signal acquisition is 10 kHz, and the measurements show the magnitudes of the two non-sinusoidal regimes, Case I and Case II in the steady state, without presenting the transient regime. The acquired data took into account the same 15 harmonic contents, which introduced an additional error related to the appearance of new voltage and current harmonics. The waveforms obtained with the Scopemeter can be compared to the ones computed following the harmonic decomposition. In Figure 3 and Figure 4, one can compare the phase A line to neutral voltage obtained through direct measurement, respectively calculated following the harmonic decomposition in conditions of a completely symmetrical circuit (Case I) when the circuit is unsymmetrical due to the intentional introduction of inductivity in series through phase A by removing the diode DA2 (Case II). The second case delivers harmonic parameters considered for determining the powers in both cases, calculated with modified parameters with respect to sensitivities. The measured and computed parameters of the harmonics of phase A in Case I and Case II are presented in Table 1 and Table 2, respectively.
Figure 3.
(van) and (ias): (a) measured values; (b) synthesized signals following the harmonic decomposition—Case I.
Figure 4.
(van) and (ias): (a) measured values; (b) synthesized signals following harmonic decomposition in unsymmetrical conditions (coils inserted into line A and diode DA2 missing)—Case II.
Table 1.
Values of voltage and current harmonic parameters of Phase A in initial operating conditions—Case I.
Table 2.
Values of voltage and current harmonic parameters of Phase A in non-symmetrical voltage and current conditions—Case II.
As expected for a three-phase bridge rectifier, the harmonic orders (), i.e., the 5th, 7th, 11th and 13th, are the dominant current and voltage harmonics in Table 1, each exceeding its non-characteristic neighboring orders (2, 3, 4, 6, 8, 9, 10, 12 and 14). The comparatively small remaining content on these non-characteristic orders is consistent with the pre-existing supply-side pollution noted above, superimposed on the rectifier’s own characteristic harmonic spectrum; this is why, for example, the amplitude does not decrease strictly monotonically with harmonic order (the 11th exceeds the 7th in Table 1). The same characteristic-harmonic pattern is present in Table 2, Table 3, Table 4, Table 5 and Table 6.
Table 3.
Values of voltage and current harmonic parameters of Phase B in initial operating conditions—Case I.
Table 4.
Values of voltage and current harmonic parameters of Phase B in non-symmetrical voltage and current conditions—Case II.
Table 5.
Values of voltage and current harmonic parameters of Phase C in initial operating conditions—Case I.
Table 6.
Values of voltage and current harmonic parameters of Phase C in non-symmetrical voltage and current conditions—Case II.
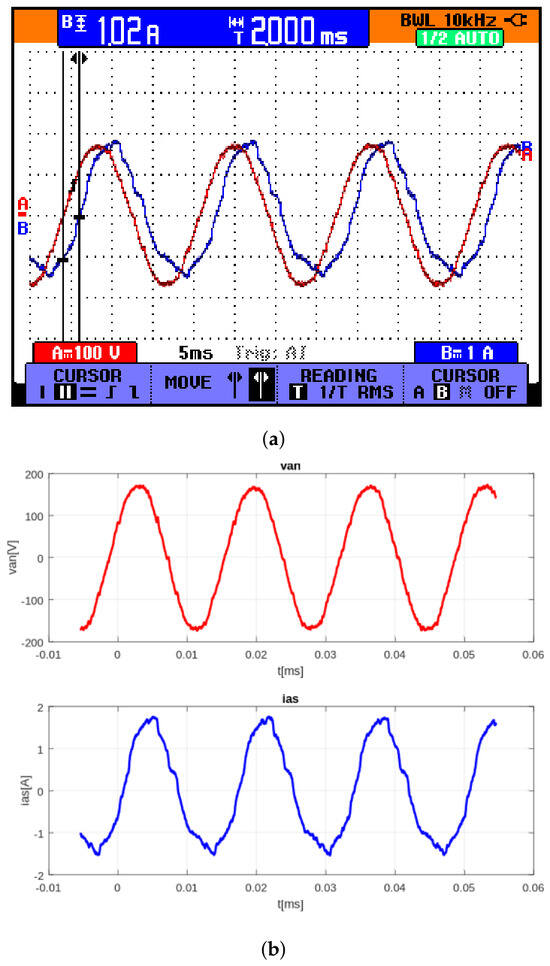
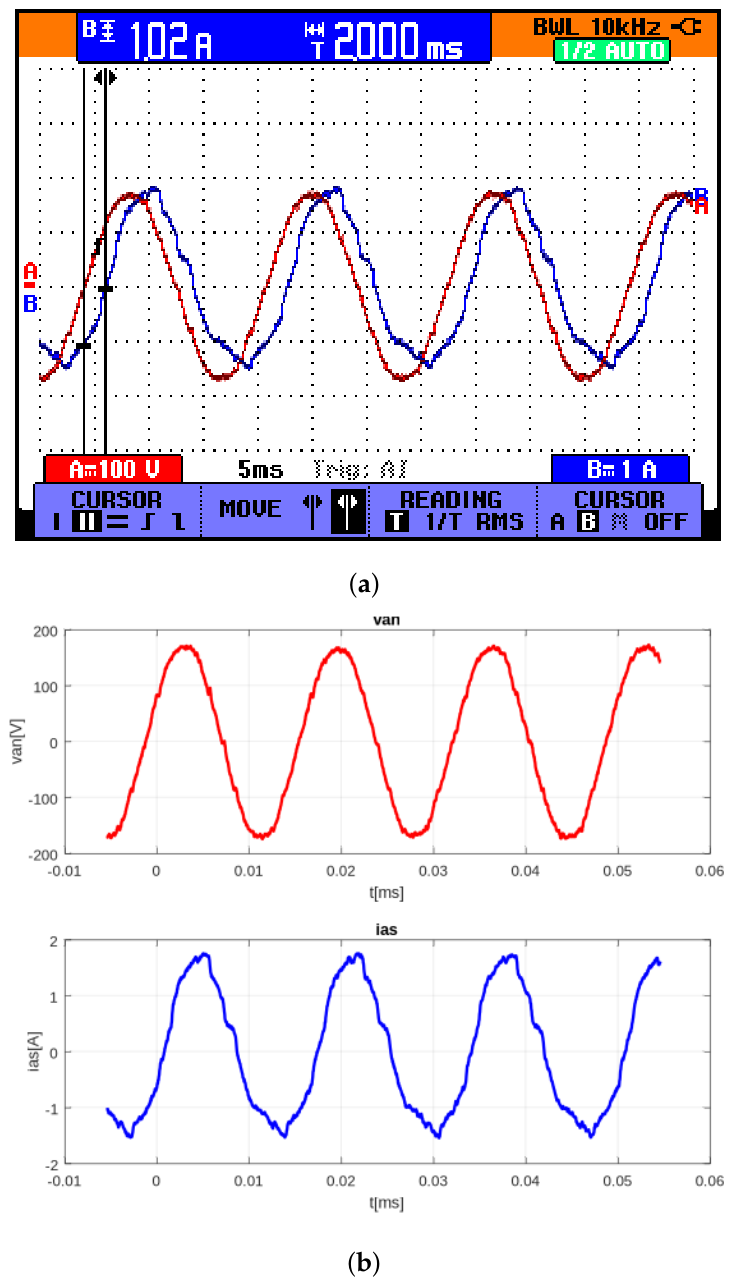
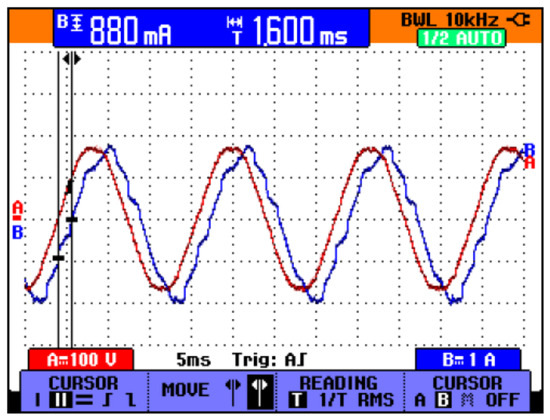
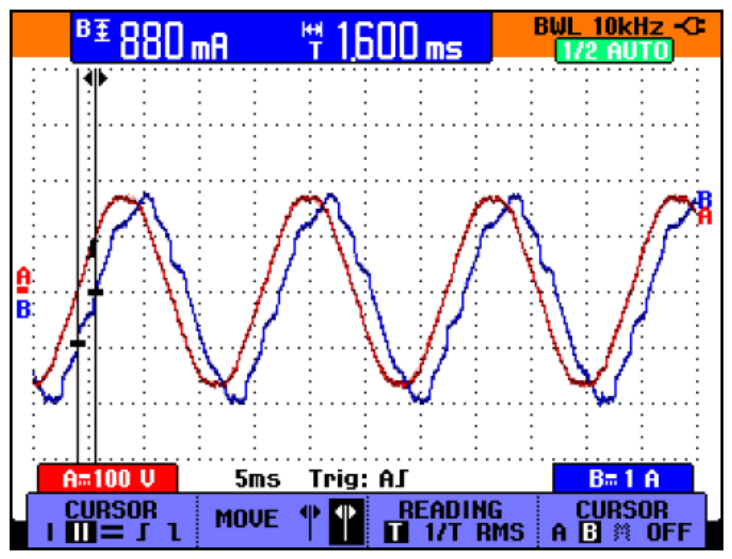
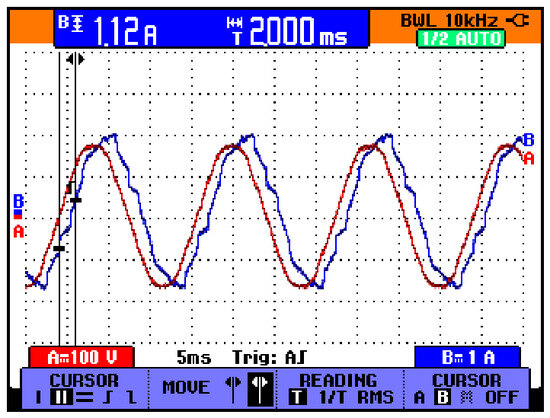
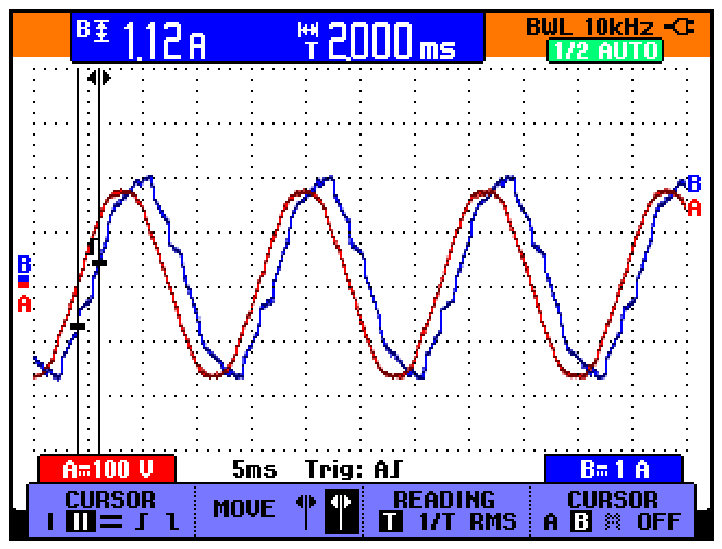
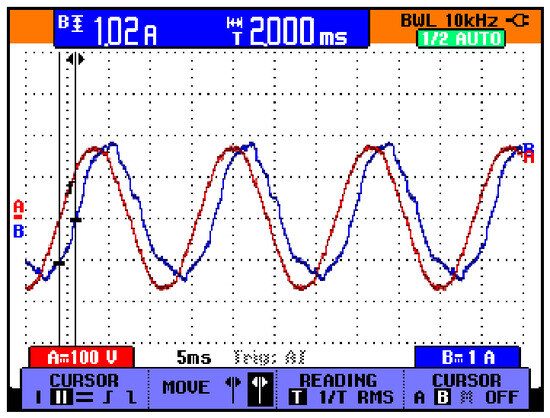
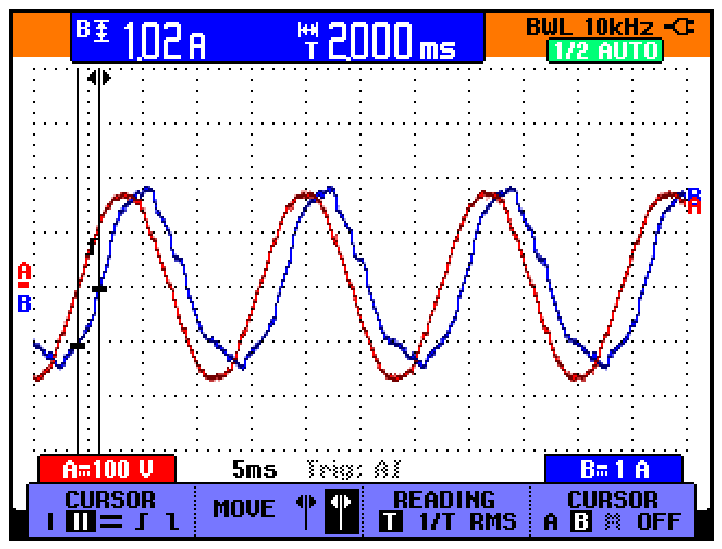
For Phase B, the voltage and current graphs in both cases’ studied normal operating conditions and non-symmetrical regimes are represented in Figure 5 and Figure 6, while the associated values of the harmonics’ parameters are specified and calculated in Table 3 and Table 4, respectively.
Figure 5.
(vbn, red) and (ibs, blue), measured values—Case I.
Figure 6.
(vbn, red) and (ibs, blue), measured values—Case II.
The voltage and current graphs for phase C in both cases’ studied normal operating conditions and non-symmetrical regimes are shown in Figure 7 and Figure 8, while the associated values of the harmonics’ parameters are presented and calculated in Table 5 and Table 6, respectively.
Figure 7.
(vcn, red) and (ics, blue), measured values—Case I.
Figure 8.
(vcn, red) and (ics, blue), measured values—Case II.
To determine the sensitivities with relations (14)–(16), Table 7, Table 8 and Table 9 synthetically present the values of the parameters r, p, and that change in Case II compared to Case I and that will be considered in the calculation. For a correct and simple presentation of the parameters that will be considered and are changed, they have been highlighted in turquoise in Table 7, Table 8 and Table 9, corresponding to the table citations in the paper as well, and the other terms associated with the parameters that do not change will be null. The numerical algorithm contains a procedure for comparing the values of the parameters in the two cases and for choosing the parameters that change. In the studied cases, the only parameter that does not change is r attached to the 12th and 14th harmonics of phase A, the 12th harmonic of phase B, and the 10th and 14th harmonics of phase C. All other parameters change in Case II compared to Case I.
Table 7.
Comparison of relative harmonic parameters for Phase A (Case I vs. Case II).
Table 8.
Comparison of relative harmonic parameters for Phase B (Case I vs. Case II).
Table 9.
Comparison of relative harmonic parameters for Phase C (Case I vs. Case II).
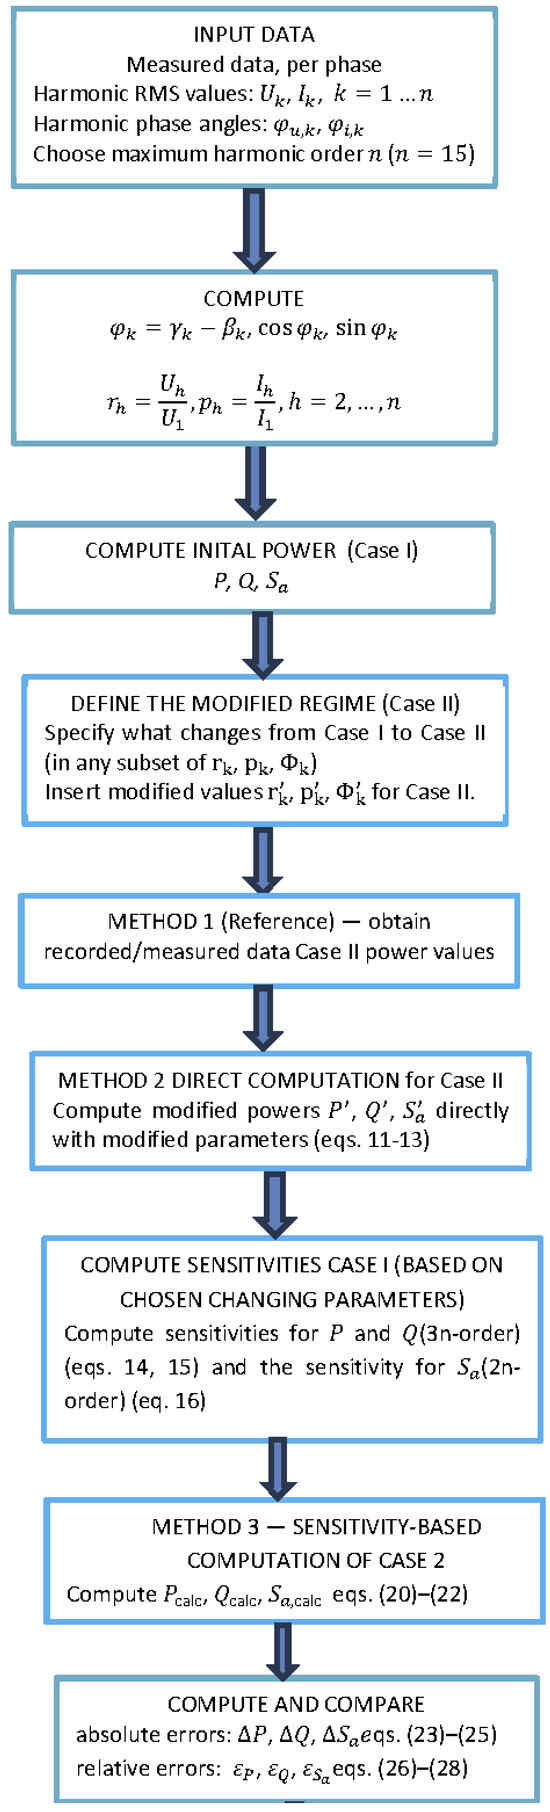
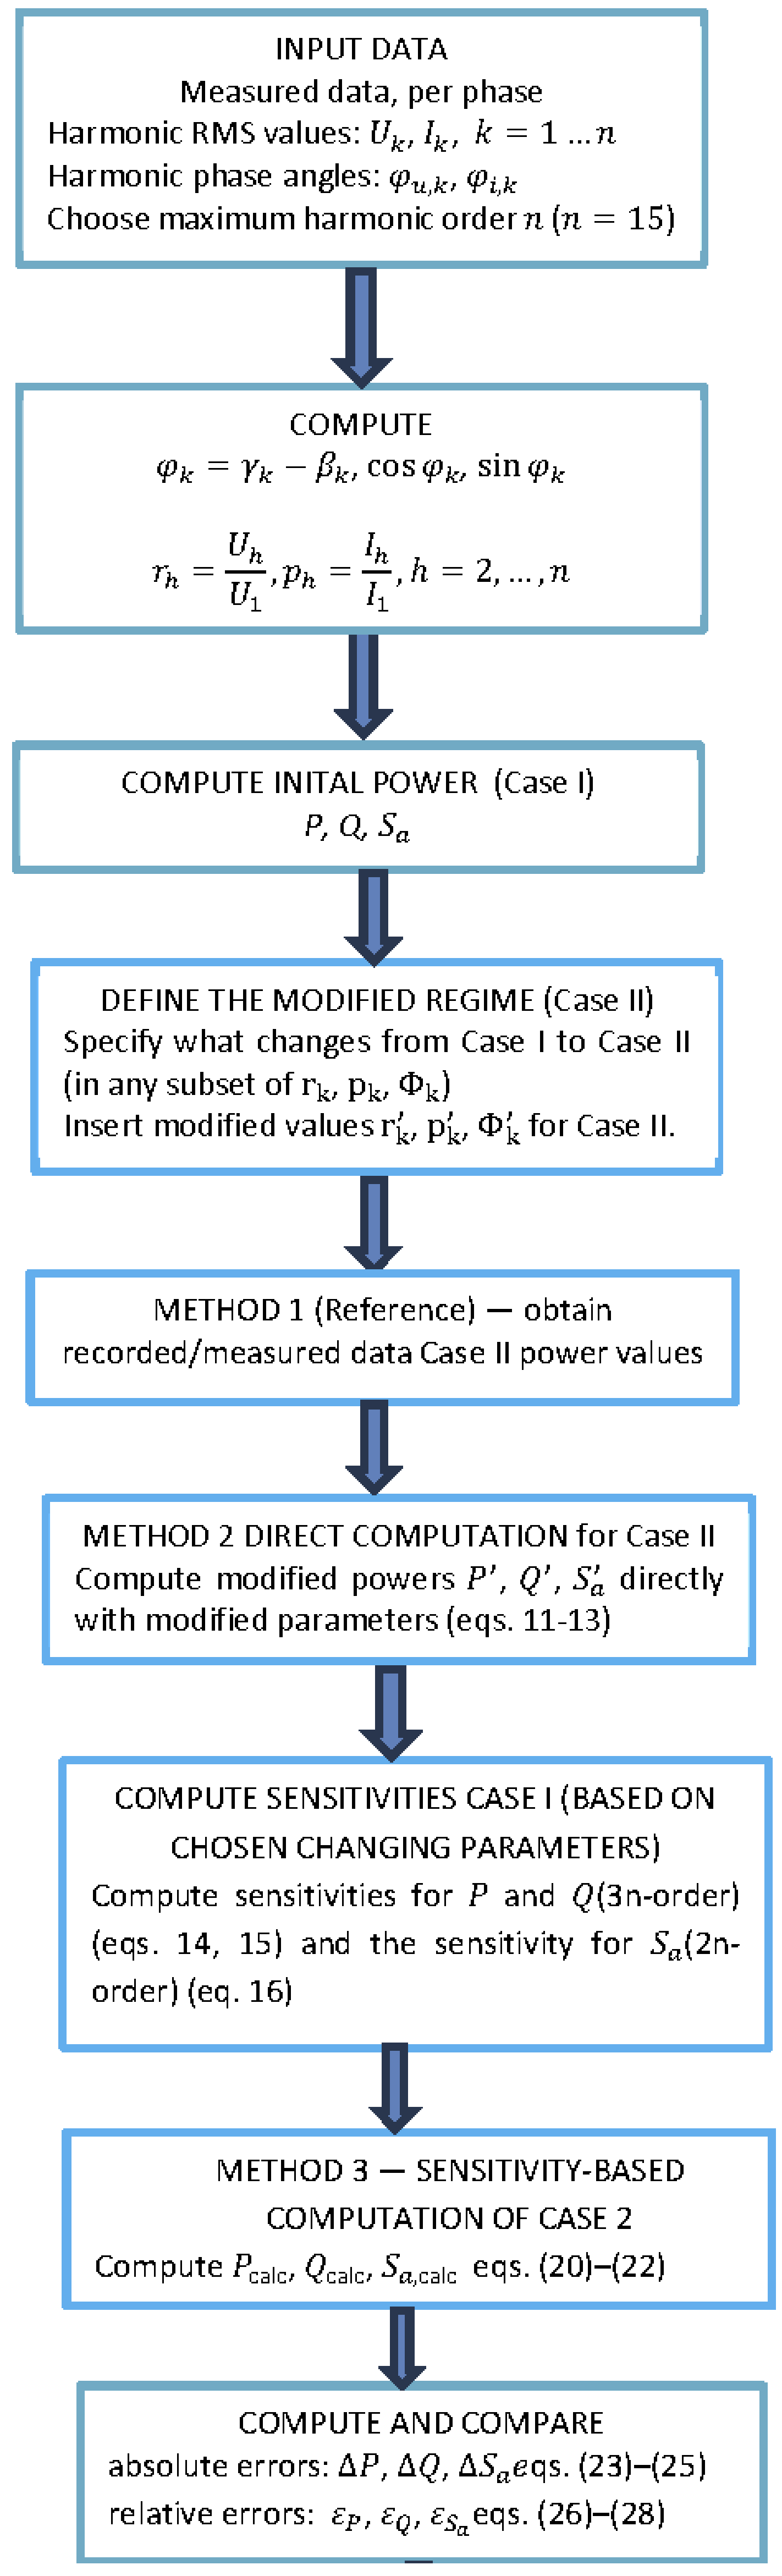
The flowchart shown in Figure 9 presents the steps for implementing the algorithm in MATLAB/Simulink (R2025b, MathWorks, Natick, MA, USA), to calculate active, reactive, and apparent powers using three methods: direct calculation using the parameters of normal conditions and the modified parameters, respectively, and the calculation with the sensitivity method.
Figure 9.
Flowchart of the numerical algorithm.
The direct method computation of the powers in the two cases uses relations (11)–(13) and parameters and for Case I, and and for Case II, respectively. Table 10 presents the numerical results obtained for each phase.
Table 10.
Values of active, reactive, and apparent powers per phase—direct method.
When analysing the two cases, one can conclude that the most significant modifications encounter current harmonics: harmonics 2 and 5, respectively. Also, the fifth harmonic of the phase voltage suffers modifications. The parameters of interest for the sensitivity analysis, when subjecting the active, reactive and apparent power for all three phases, are r2, p2 and r5 and p5, respectively. The new values calculated utilizing sensitivities are compared with the power values recorded in Case II. The values of the parameters mentioned above are summarized in Table 7, Table 8 and Table 9.
The sensitivity method used relations (14)–(16), in which only the parameters and that change appear. Relations (14) and (15) are applied for the 3-order sensitivities related to the active and reactive power, and relation (16) used the 2-order sensitivity related to apparent power. For example, in the calculation of the sensitivity SP related to the active power, for Phase A, all the terms containing r12 and r14, for Phase B all the terms containing r12, and for Phase C all the terms containing r10 and r14 are zero. Then, using relations (20)–(22), the active, reactive and apparent powers can be computed. The results for each phase are presented synthetically in Table 11.
Table 11.
Values of active, reactive, and apparent powers per phase—sensitivity method.
The absolute error (23)–(25) and the relative errors (26)–(28) of the proposed method are synthetically presented in Table 12 for each phase.
Table 12.
Absolute and relative errors of the method.
The values of Ku and Ki, determined with relations (29) and (30), respectively, are presented in Table 13.
Table 13.
Values of and in Case I and Case II.
In Table 13, and are calculated as the ratio between the total RMS and the fundamental RMS, and these values exceed 1 because they use the fundamental. First, it is found that has very close values in the two cases, which shows that the low total voltage distortion in the two cases is preserved. On the other hand, the total current distortion in Case II is significantly higher than in Case I, especially in Phases A and C of the circuit. From the point of view of circuit reliability, these high values in Case II may contribute to a reduction in the transformer power factor, to degradation of the cables’ insulation, and to equipment failures.
The numerical algorithm was implemented on a laptop with an Intel Core i7, 2 GHz, 16 GB RAM, which processed the data received from the Fluke 196C in 24.5 ms.
Several discussions can be formulated from the analysis of the case study and the calculations performed. First of all, it was found that the modifications made to the initial circuit, i.e., the introduction of inductivity in series through Phase A by removing the diode DA, are not found in all parameters nor in all phases equally. Table 7, Table 8 and Table 9 show that only small parts of the relative parameters r, p, and change in Case II compared to Case I of the nominal regime. Thus, in Phases A and C, 2 parameters are not changed, and in Phase B only one is. It can be said that Phase B is less sensitive to variations in the parameters.
The resistive–inductive character of the initial circuit is preserved in Case II, which results from the analysis of the values calculated from Table 10, so all the reactive power values are positive.
Regarding the errors, it was found that their values were positive and negative. For absolute errors, positive values show a higher value of the powers calculated with the direct method using the modified parameters compared to the powers calculated with the sensitivity method. Otherwise, the absolute error values are negative. The positive or negative sign of the absolute errors is also preserved in the case of relative errors.
As can be seen from Table 12, all the values of both absolute and relative errors are small, which shows good accuracy of the method. Moreover, the absolute and relative errors of the powers of Phases A and C are slightly higher than those of Phase B, which indicates the higher sensitivity of this phase, confirming the strong modification of 58 parameters, as can be seen from Table 7 and Table 9.
4. Conclusions
Sensitivity analysis evaluates how variations in electrical network parameters affect the active, reactive, and apparent power absorbed by loads under non-sinusoidal conditions. We propose sensitivity-based formulations to determine these power quantities when one or more system parameters vary simultaneously.
The proposed approach can also be applied to voltage and current waveforms containing time-dependent harmonic components. In such cases, first use an online monitoring and data acquisition system, such as SCADA, to obtain the initial and modified values of the relevant parameters together with the corresponding power measurements. Then, express the varying parameters through the relative magnitudes of the voltage and current harmonic components and the phase differences between the associated voltage and current harmonics.
Use the measured initial and modified parameters in a numerical procedure to determine the corresponding power quantities. First obtain the power values associated with the initial operating condition using the direct calculation method. Then, let the proposed sensitivity-based formulation evaluate the changes resulting from parameter variations. This procedure quantifies the contribution of individual parameter variations to changes in active, reactive, and apparent power.
The results obtained from the investigated three-phase circuit confirm the accuracy and applicability of the sensitivity-based approach. In addition, the analysis indicates the sensitivity of each parameter and phase shift to changes in the circuit configuration. This information can be used to identify the harmonic components and operating parameters that most affect the system’s power characteristics, aiding circuit evaluation and adjustment.
The proposed sensitivity analysis can further contribute to harmonic filter design and to the selection of appropriate harmonic-mitigation techniques. By identifying the parameters that most influence system performance, the method can support more effective strategies for reducing the adverse effects of harmonic distortion. Moreover, the resulting optimization functions can determine acceptable ranges for voltage and current harmonic magnitudes and their corresponding phase shifts. These limits can be established by considering the power-quality requirements specified in IEEE 519-2022, providing a systematic approach to assessing and mitigating harmonic-related effects in electrical networks operating under non-sinusoidal conditions and to guiding mitigation design.
Author Contributions
Conceptualization H.A., M.S.; methodology H.A., M.S., P.A., S.D., E.C., E.D., D.M.; software P.A., E.D.; validation E.C.; formal analysis H.A., M.S., D.M.; investigation P.A., S.D., E.D.; resources S.D.; data curation P.A.; writing—original draft preparation M.S.; writing—review and editing H.A.; visualization S.D., E.C., P.A.; supervision H.A. All authors have read and agreed to the published version of the manuscript.
Funding
This research received no external funding.
Institutional Review Board Statement
Not applicable.
Informed Consent Statement
Not applicable.
Data Availability Statement
The data supporting the findings of this study are available from the corresponding author upon reasonable request.
Conflicts of Interest
The authors declare no conflicts of interest.
References
- Coelho, R.d.A.; Araújo, B.V.S.; Xavier, G.V.R.; Rodrigues, G.A.; Ferreira, T.V.; Brito, N.S.D. Novel indices for power quality assessment of non-linear loads. Electr. Power Syst. Res. 2024, 236, 110952. [Google Scholar] [CrossRef] [Scilit]
- Hu, Z.; Han, Y.; Zalhaf, A.S.; Zhou, S.; Zhao, E.; Yang, P. Harmonic sources modeling and characterization in modern power systems: A comprehensive overview. Electr. Power Syst. Res. 2023, 218, 109234. [Google Scholar] [CrossRef] [Scilit]
- Madnani, R.; Mishra, M.; Ghosh, A. Reactive Power Evaluation for Non-Sinusoidal Single Phase Systems. IEEE Trans. Circuits Syst. I Regul. Pap. 2024, 71, 6058–6069. [Google Scholar] [CrossRef] [Scilit]
- NEMA. Definitions for Calculations of VA, VAh, VAR, and VARh for Electricity Meters; C12.24 TR-2022; NEMA: Rosslyn, VA, USA, 2022; pp. 1–57. [Google Scholar]
- Venkatesh, A.; Nalinakshan, S.; Aswini, K. Voltage source converter with different control strategies for a MicroGrid-connected solar PV with nonlinear loads for current harmonics compensation. In Proceedings of the IEEE International Conference on Electronics, Computing and Communication Technologies (CONECCT 2022), Bangalore, India, 8–10 July 2022; pp. 1–6. [Google Scholar]
- Demerdziev, K.; Dimcev, V. Reactive Power and Energy Instrument’s Performance in Non-Sinusoidal Conditions Regarding Different Power Theories. Meas. Sci. Rev. 2023, 23, 19–31. [Google Scholar] [CrossRef] [Scilit]
- Crotti, G.; D’Avanzo, G.; Letizia, P.S.; Luiso, M. Measuring harmonics with inductive voltage transformers in presence of subharmonics. IEEE Trans. Instrum. Meas. 2021, 70, 9005013. [Google Scholar] [CrossRef] [Scilit]
- IEEE 519-2022; IEEE Standard for Harmonic Control in Electric Power Systems. IEEE Standards Association: New York, NY, USA, 2022.
- Vlahinic, S.; Brnobic, D.; Stojkovic, N. Indices for Harmonic Distortion Monitoring of Power Distribution Systems. IEEE Trans. Instrum. Meas. 2009, 58, 1771–1777. [Google Scholar] [CrossRef] [Scilit]
- Andrei, H.; Cepisca, C.; Grigorescu, S.D.; Andrei, P.; Silaghi, M. Sensitivity Analysis of the Linear Networks in Non-sinusoidal Regime. In Proceedings of the IEEE International Conference on Automation, Quality and Testing, Robotics, Cluj-Napoca, Romania, 28–30 May 2010; IEEE: New York, NY, USA, 2010; Volume P1, p. 7317. [Google Scholar]
- Ginocchi, M.; Ponci, F.; Monti, A. Sensitivity Analysis and Power Systems: Can We Bridge the Gap? A Review and a Guide to Getting Started. Energies 2021, 14, 8274. [Google Scholar] [CrossRef] [Scilit]
- Scholbeck, C.A.; Moosbauer, J.; Casalicchio, G.; Gupta, H.; Bischl, B.; Heumann, C. Position Paper: Bridging the Gap Between Machine Learning and Sensitivity Analysis. arXiv 2024, arXiv:2312.13234. [Google Scholar]
- Sadeghi, Z.; Matwin, S. A Review of Global Sensitivity Analysis Methods and a comparative case study on Digit Classification. arXiv 2024, arXiv:2406.16975v1. [Google Scholar]
- Souza Lima, E.; De Jesus Fernandes, L. Assessing eigenvalue sensitivities [power system control simulation]. IEEE Trans. Power Syst. 2000, 15, 299–306. [Google Scholar] [CrossRef]
- Blenk, T.; Weindl, C. Development of Methods for Sensitivity Analysis of Electrical Energy Networks and Systems within State Space. Energies 2024, 17, 4489. [Google Scholar] [CrossRef] [Scilit]
- Lu, Z.; Xu, X.; Yan, Z.; Wang, H. Density-based Global Sensitivity Analysis of Islanded Microgrid Loadability Considering Distributed Energy Resource Integration. J. Mod. Power Syst. Clean Energy 2020, 8, 94–101. [Google Scholar] [CrossRef] [Scilit]
- Caciula, I.; Andrei, H.; Diaconu, E.; Puchianu, D.C.; Iordache, M.; Andrei, P.C.; Stanculescu, M.; Bobaru, M.-L. Numerical Method Analysis of Nonlinear Elements Behavior in Non-sinusoidal State. In Proceedings of the 13th International Symposium on Advanced Topics in Electrical Engineering (ATEE), Bucharest, Romania, 23–25 March 2023; pp. 1–6. [Google Scholar] [CrossRef] [Scilit]
- Iordache, M.; Stanculescu, M.; Andrei, P.; Bobaru, L.I.; Andrei, H.; Diaconu, E.; Cobianu, C.; Caciula, I.; Niculae, D. Equivalent Models of Nonlinear Circuit Elements in Nonsinusoidal Regime. In Proceedings of the 2023 10th International Conference on Modern Power Systems (MPS), Cluj-Napoca, Romania, 21–23 June 2023; pp. 1–5. [Google Scholar] [CrossRef] [Scilit]
- Andrei, P.; Deleanu, S.; Micu, D.; Stanculescu, M.; Cazacu, E.; Diaconu, E.; Andrei, H. Unified Sensitivity Analysis of Powers and Distortion Quantities in Non-Sinusoidal Regime. In Proceedings of the 2025 14th International Symposium on Advanced Topics in Electrical Engineering (ATEE), Bucharest, Romania, 9–11 October 2025; pp. 1–6. [Google Scholar] [CrossRef] [Scilit]
- Andrei, P.; Deleanu, S.; Diaconu, E.; Gheorghe, A.; Stănculescu, M.; Cazacu, E.; Andrei, H. New Method for Sensitivity Analysis of Reactive and Apparent Power in Non-Sinusoidal State. In Proceedings of the 2025 17th International Conference on Electronics, Computers and Artificial Intelligence (ECAI), Targoviste, Romania, 26–27 June 2025; pp. 1–6. [Google Scholar]

Disclaimer/Publisher’s Note: The statements, opinions and data contained in all publications are solely those of the individual author(s) and contributor(s) and not of MDPI and/or the editor(s). MDPI and/or the editor(s) disclaim responsibility for any injury to people or property resulting from any ideas, methods, instructions or products referred to in the content. |
© 2026 by the authors. Licensee MDPI, Basel, Switzerland. This article is an open access article distributed under the terms and conditions of the Creative Commons Attribution (CC BY) license.