


Abstract
The unclear coupled temperature–pressure control mechanism of deep coalbed methane (CBM) occurrence and the poorly understood transformation law of adsorbed and free gas during geological history have severely restricted the accurate evaluation of CBM resources in the southern margin of the Junggar Basin. Taking the No. 42 main coal seam in the Fukang mining area as the research object, this study combines isothermal adsorption experiments, thermodynamic analysis, and basin numerical simulation to identify the methane adsorption characteristics of coal and their main controlling factors, establishes a CBM content prediction model coupled with coal maceral composition and temperature–pressure conditions, and reconstructs the complete CBM accumulation evolution process over geological time. Isothermal adsorption experiments were conducted at 30 °C over 0–8 MPa (6 pressure points) for all seven core samples, and variable-temperature adsorption experiments were performed on representative sample No. 42-5 at 30, 50, 70, and 90 °C over 0–22 MPa (10 pressure points per temperature). The results show that the average equilibrium moisture-based Langmuir volume of coal samples in the study area is 22.36 m3/t, and the adsorption capacity is significantly positively correlated with fixed carbon content. Pressure dominates the positive adsorption effect in the low-temperature and low-pressure range, while temperature dominates the negative adsorption effect in the high-temperature and high-pressure range. The total gas content first increases and then decreases with depth, reaching a peak of 12.56 m3/t at 900 m; free gas accounts for a larger proportion than adsorbed gas below 3600 m. The central-southern main area of the study area, with a gas content of 11–13 m3/t, is a favorable exploration target. The accumulation evolution four stages: pure adsorption, free gas occurrence, excessive gas expulsion, and uplift adjustment. The proportion of free gas reached its peak during the maximum burial period in the Late Cretaceous. After the Paleogene uplift, hydrocarbon generation ceased, and the total gas content remained at 13.16 m3/t. The coupled research method of “experimental determination–model prediction–evolution simulation” established in this paper realizes cross-validation of CBM content through multiple methods, and can provide theoretical support for deep low-rank CBM accumulation research and resource evaluation.
1. Introduction
Natural gas plays an increasingly critical role in the global transition toward lower-carbon energy systems, with applications spanning power generation, industrial heating, transportation, and chemical feedstocks [1]. Among unconventional gas resources, coalbed methane (CBM) has emerged as a significant supplement to conventional natural gas reserves and production in China [2,3]. Coalbed methane (CBM) is a critical alternative resource for expanding natural gas reserves and production in China. In recent years, remarkable breakthroughs have been made in the exploration and development of shallow to medium-depth CBM [4]. However, the complex occurrence state of deep CBM and the unclear accumulation evolution mechanism have greatly limited the accuracy of resource evaluation and the effectiveness of exploration target selection [5]. Accurately quantifying the contents of adsorbed and free gas and revealing their evolution laws over geological history are core scientific issues in deep CBM accumulation research [6,7,8,9].
At present, domestic and foreign scholars have carried out extensive research on CBM adsorption characteristics and content prediction, mainly focusing on the following aspects: conducting isothermal and isosteric adsorption experiments under actual geological conditions to clarify the differences in adsorption capacity of coal seams with different ranks [10,11,12,13,14]; establishing multi-scale adsorption prediction models based on microscopic adsorption theory and thermodynamic methods [15,16,17]; revealing the controlling effects of coal composition, pore structure, and temperature–pressure conditions on the occurrence of adsorbed and free gas [18,19,20]; explaining the microscopic mechanism of methane adsorption–desorption and seepage laws through molecular simulation and hydrodynamic simulation [21,22,23]; and indirectly estimating subsurface gas content using seismic and logging data [10,24,25,26,27,28]. The present study does not claim methodological novelty at the framework level; rather, it contributes an incremental, region-specific application that couples temperature–pressure adsorption thermodynamics with full burial–hydrocarbon-generation evolution for the No. 42 low-rank coal seam in the southern Junggar Basin—a system where such coupled analysis has not been previously reported. Existing studies mostly focus on the characterization of adsorption characteristics under static conditions. Coupled research on the dynamic transformation of adsorbed and free gas during geological evolution is still relatively weak and cannot meet the needs of accumulation mechanism research and dynamic resource evaluation [29,30,31,32].
Taking the No. 42 main mining coal seam in Block 9 of the Fukang CBM field on the southern margin of the Junggar Basin as the research object, this study follows the main line of “experimental determination of adsorption characteristics–establishment of content prediction model–reconstruction of accumulation evolution process”. Through laboratory isothermal and isosteric adsorption experiments, the coal adsorption capacity and its main controlling factors are identified. A prediction model for adsorbed and free gas content coupled with coal composition and temperature–pressure conditions is established. Combined with basin numerical simulation technology, the coal burial history, hydrocarbon generation history, and gas content evolution history are restored, and the multi-factor coupled control mechanism of CBM accumulation evolution is revealed. The research results can provide a theoretical basis and technical support for CBM resource evaluation and favorable area optimization in the study area [14].
2. Geological Setting of the Study Area
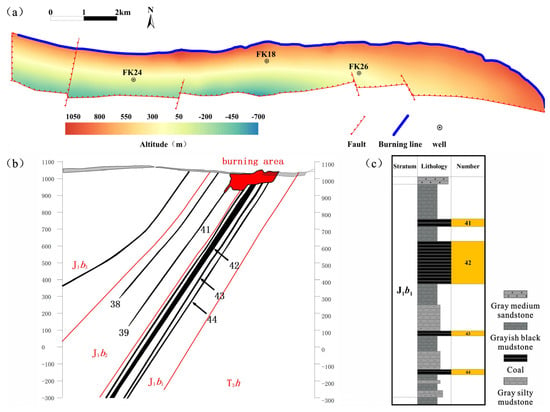
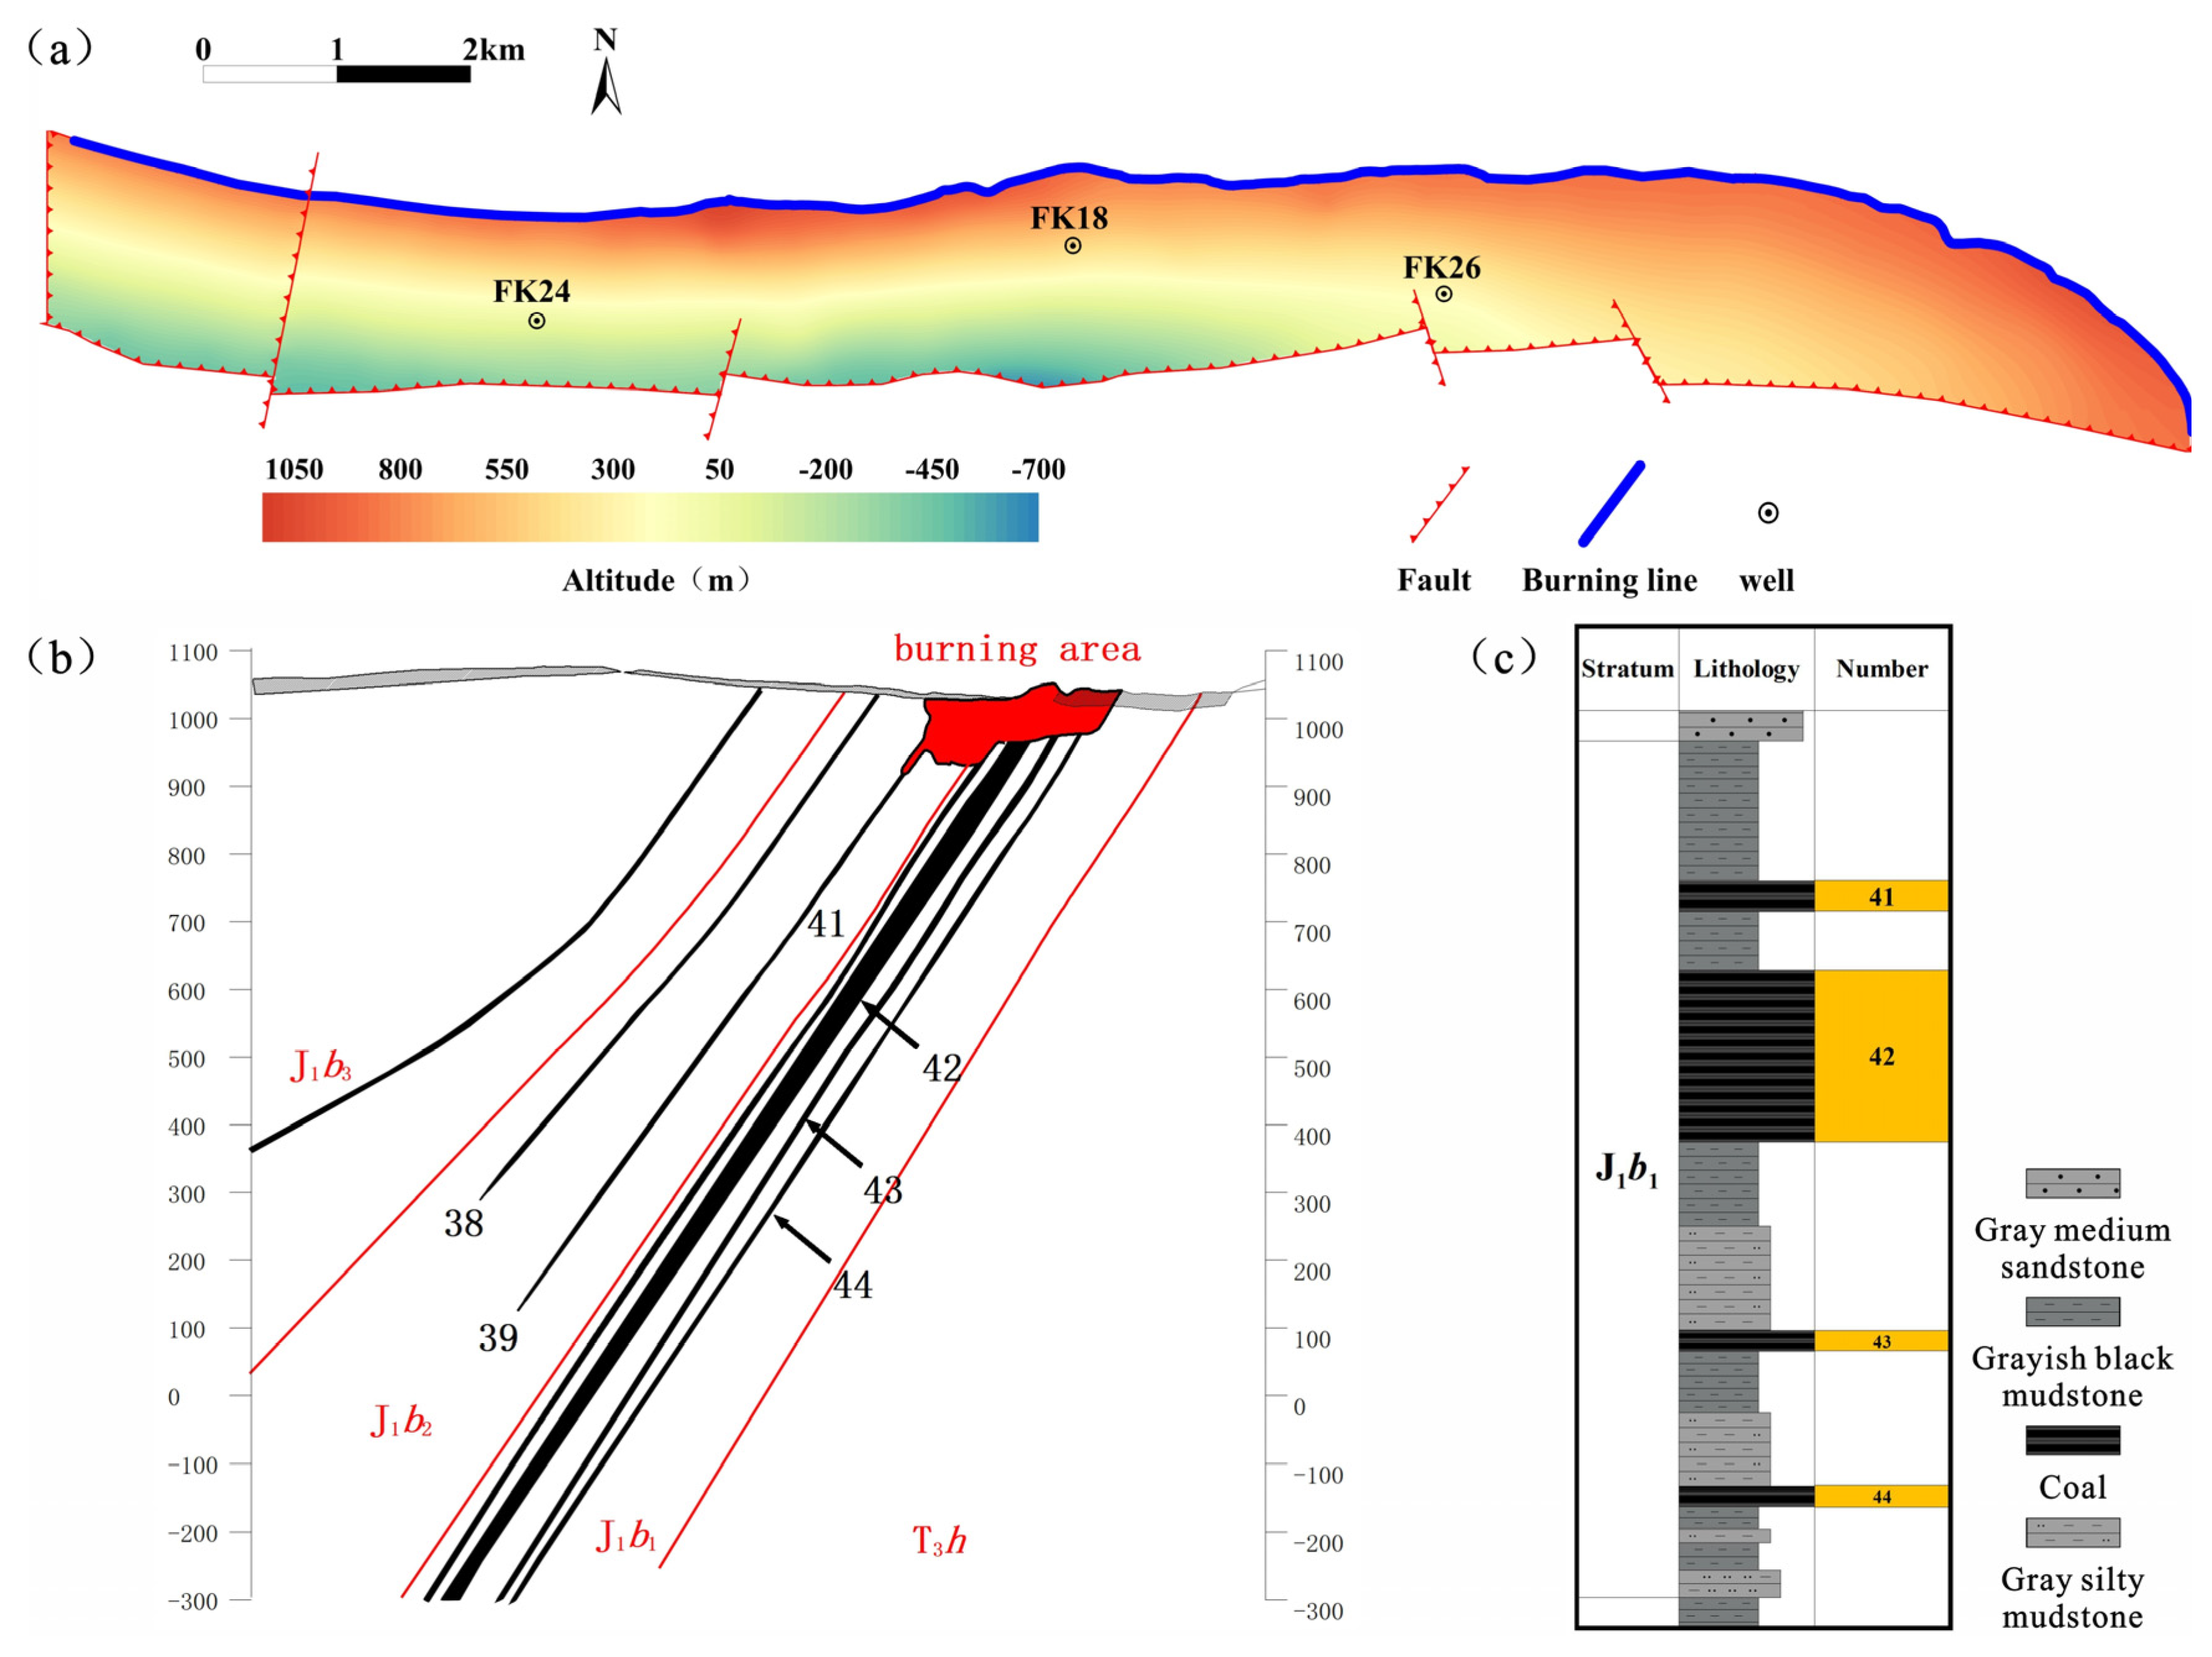
Block 9 of the Fukang CBM field is located in the hilly area on the northern piedmont of the Bogda Mountains, southern margin of the Junggar Basin. It presents an overall south-dipping monocline structure, with coal seams outcropping in the northern and eastern parts of the well block [33]. The burial depth of the coal seam is relatively small at the northern edge and the eastern uplifted end of the syncline and it increases southward (Figure 1a). Faults are less developed in the block, and most are compressional–torsional faults with good lateral sealing conditions, which are favorable for CBM preservation [34].
Figure 1.
Geological overview of coal-bearing strata in the study area. (a) Structural map of the base of the No. 42 coal seam. (b) Main coal seam profile map of the study area. (c) Stratigraphic column of J1b1 formation in the study area.
The first member of the Jurassic Badaowan Formation (J1b1) in the study area consists of 3–4 sedimentary cycles of coal-bearing clastic rocks in fluvial, lakeside delta, and peat swamp facies. The main lithologies are interbeds of dark gray, gray, and gray-white medium-coarse sandstone, medium sandstone, fine sandstone, silty mudstone, and coal seams. Four coal seams are developed from bottom to top in the J1b1 member, among which the No. 43, No. 42, and No. 41 coal seams are stably distributed throughout the area. The No. 42 coal seam has the largest thickness, with an average of approximately 25 m. It has a stable horizon and wide distribution, accounting for 78% of the total coal resources in the area, and is the main target layer of this study (Figure 1b,c) [35,36].
3. Experimental Samples and Methods
3.1. Basic Characteristics of Samples
A total of 7 core samples from the No. 42 coal seam were collected from three wells: FK18, FK24, and FK26. Before the experiment, coal petrographic observation, proximate analysis, vitrinite reflectance testing, and porosity measurement were completed.
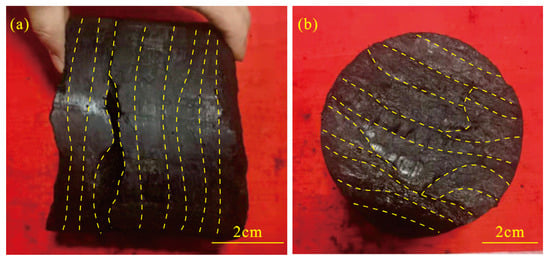
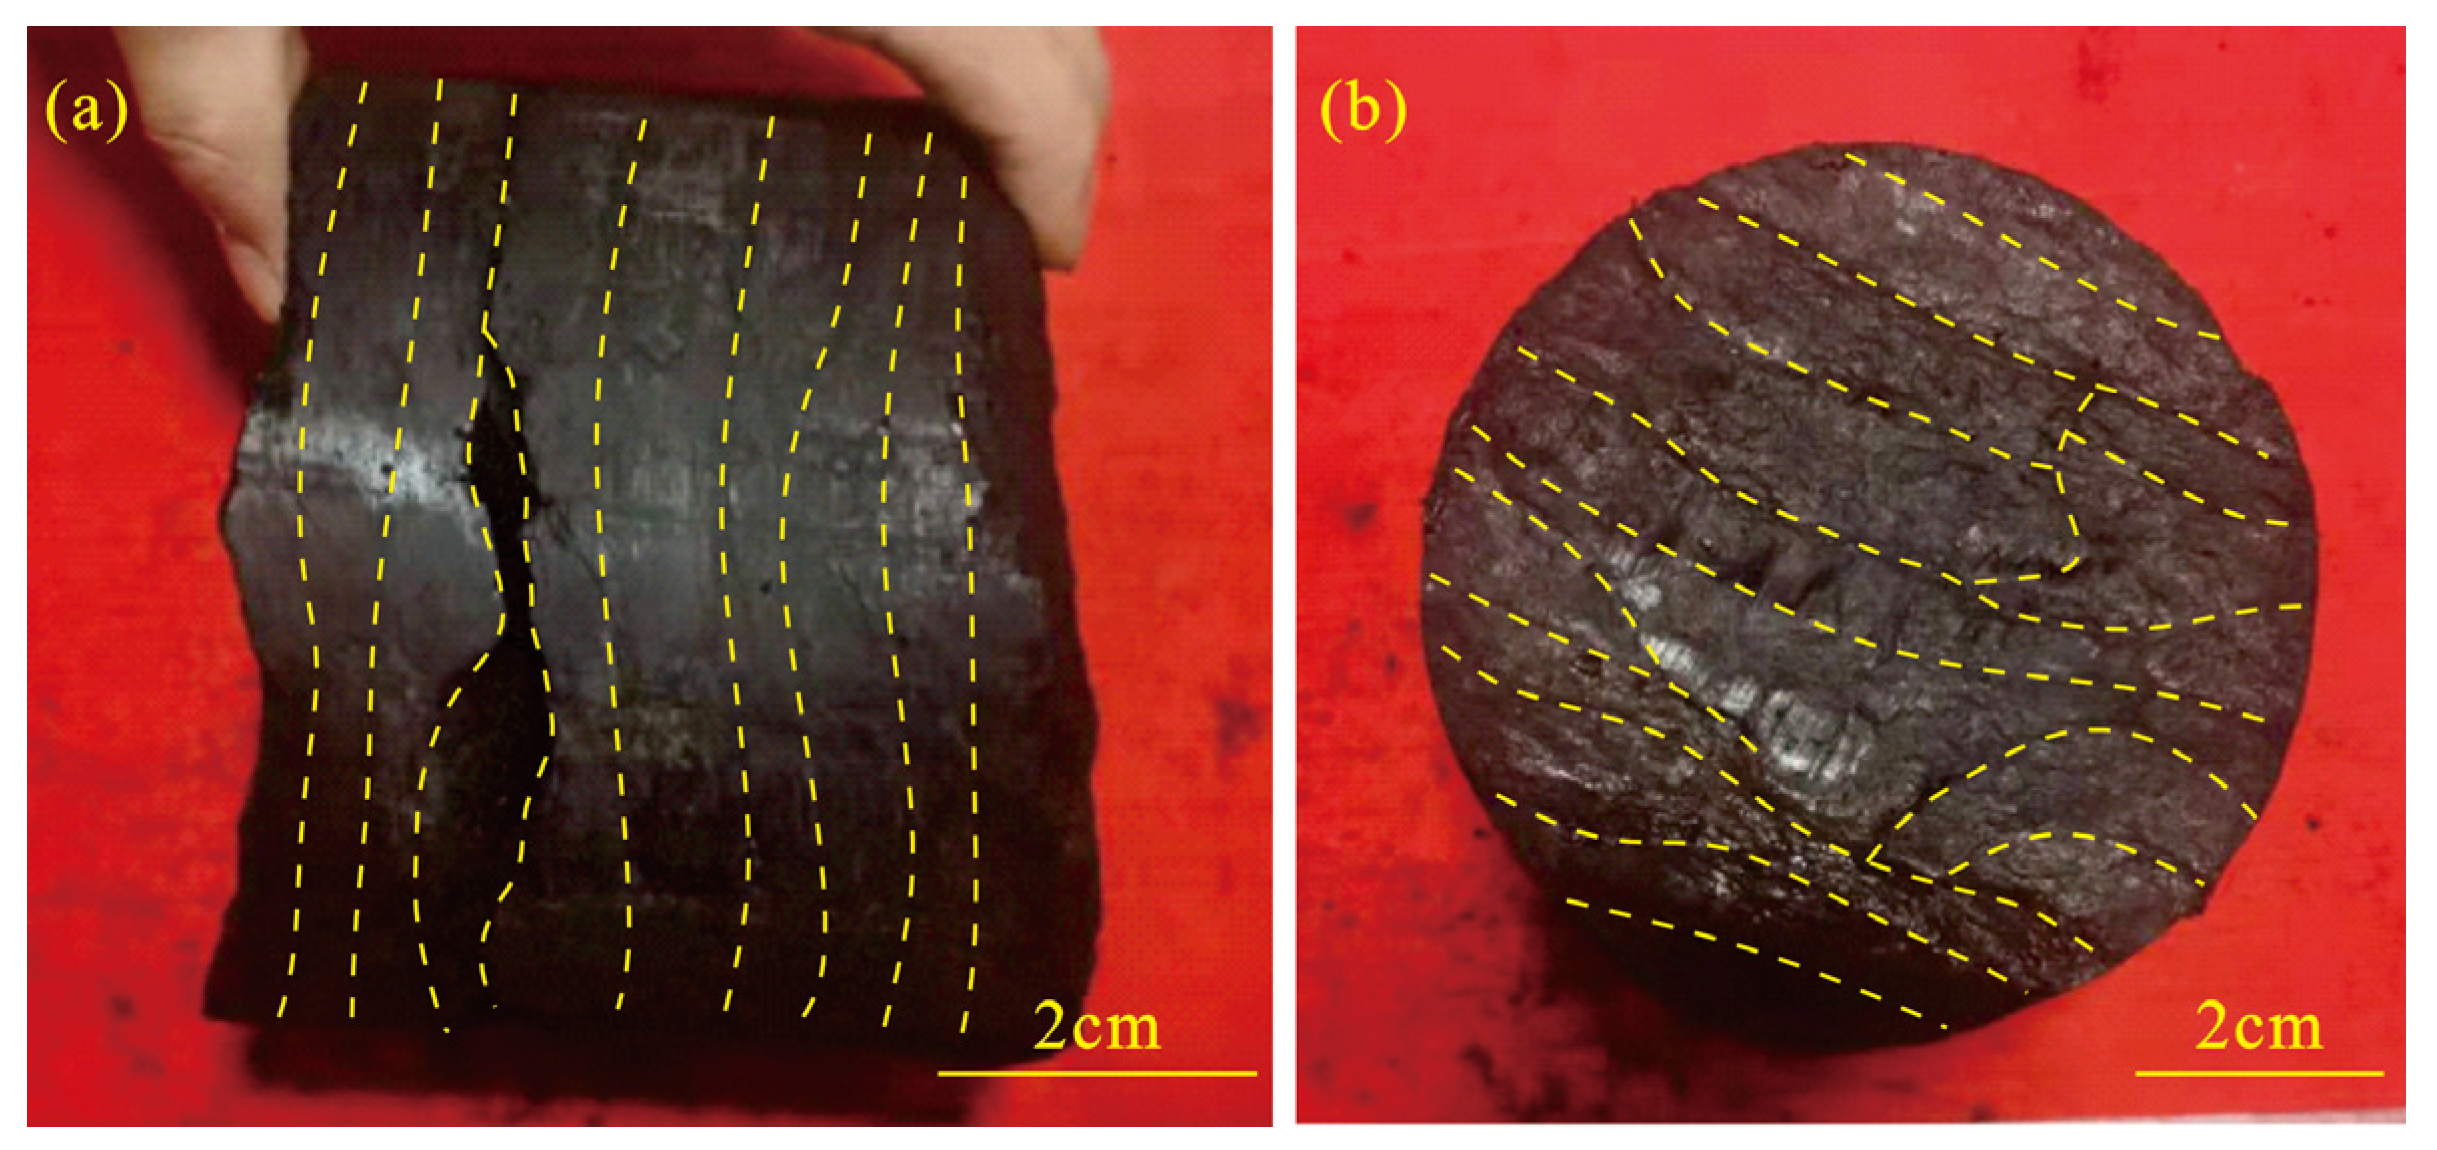
The coal samples are generally black with vitreous luster. The macroscopic maceral composition is dominated by bright coal, interbedded with thin to wide bands of vitrain, and contains a small amount of dull coal. The coal structure is mainly cataclastic, with conchoidal and stepped fractures, and well-developed structural slip surfaces and striations. Fractures are distributed nearly perpendicular to the bedding, and some fractures are filled with white mineral films [37]. Among them, sample No. 42-3 has the most developed fractures, with a fracture density of 10 per 5 cm, fracture lengths ranging from 0.2 to 4.0 cm, and larger apertures, providing dominant channels for gas escape (Figure 2).
Figure 2.
Fracture development characteristics of 42-3 coal rock samples. (a) Fracture development on the surface of sample No. 42-3; (b) Cross-section of sample No. 42-3. The yellow dotted lines indicate fractures.
The vitrinite reflectance (RO) of the coal samples ranges from 0.66% to 0.72%, with an average of 0.69%, corresponding to the gas coal stage of coal metamorphism. The moisture and ash yields are generally low, ranging from 1.40% to 1.57% and 2.74% to 12.07%, with averages of 1.46% and 5.71%, respectively. The porosity ranges from 2.36% to 5.33%, with an average of 3.10%. Detailed parameters of the samples are shown in Table 1.
Table 1.
Basic parameters of coal samples.
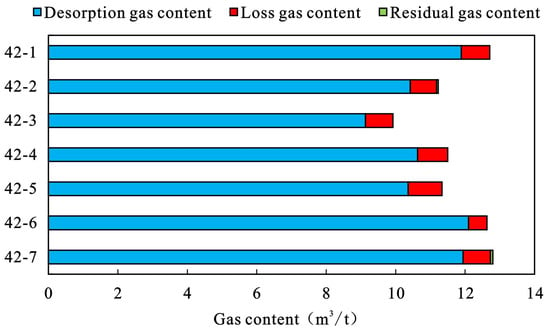
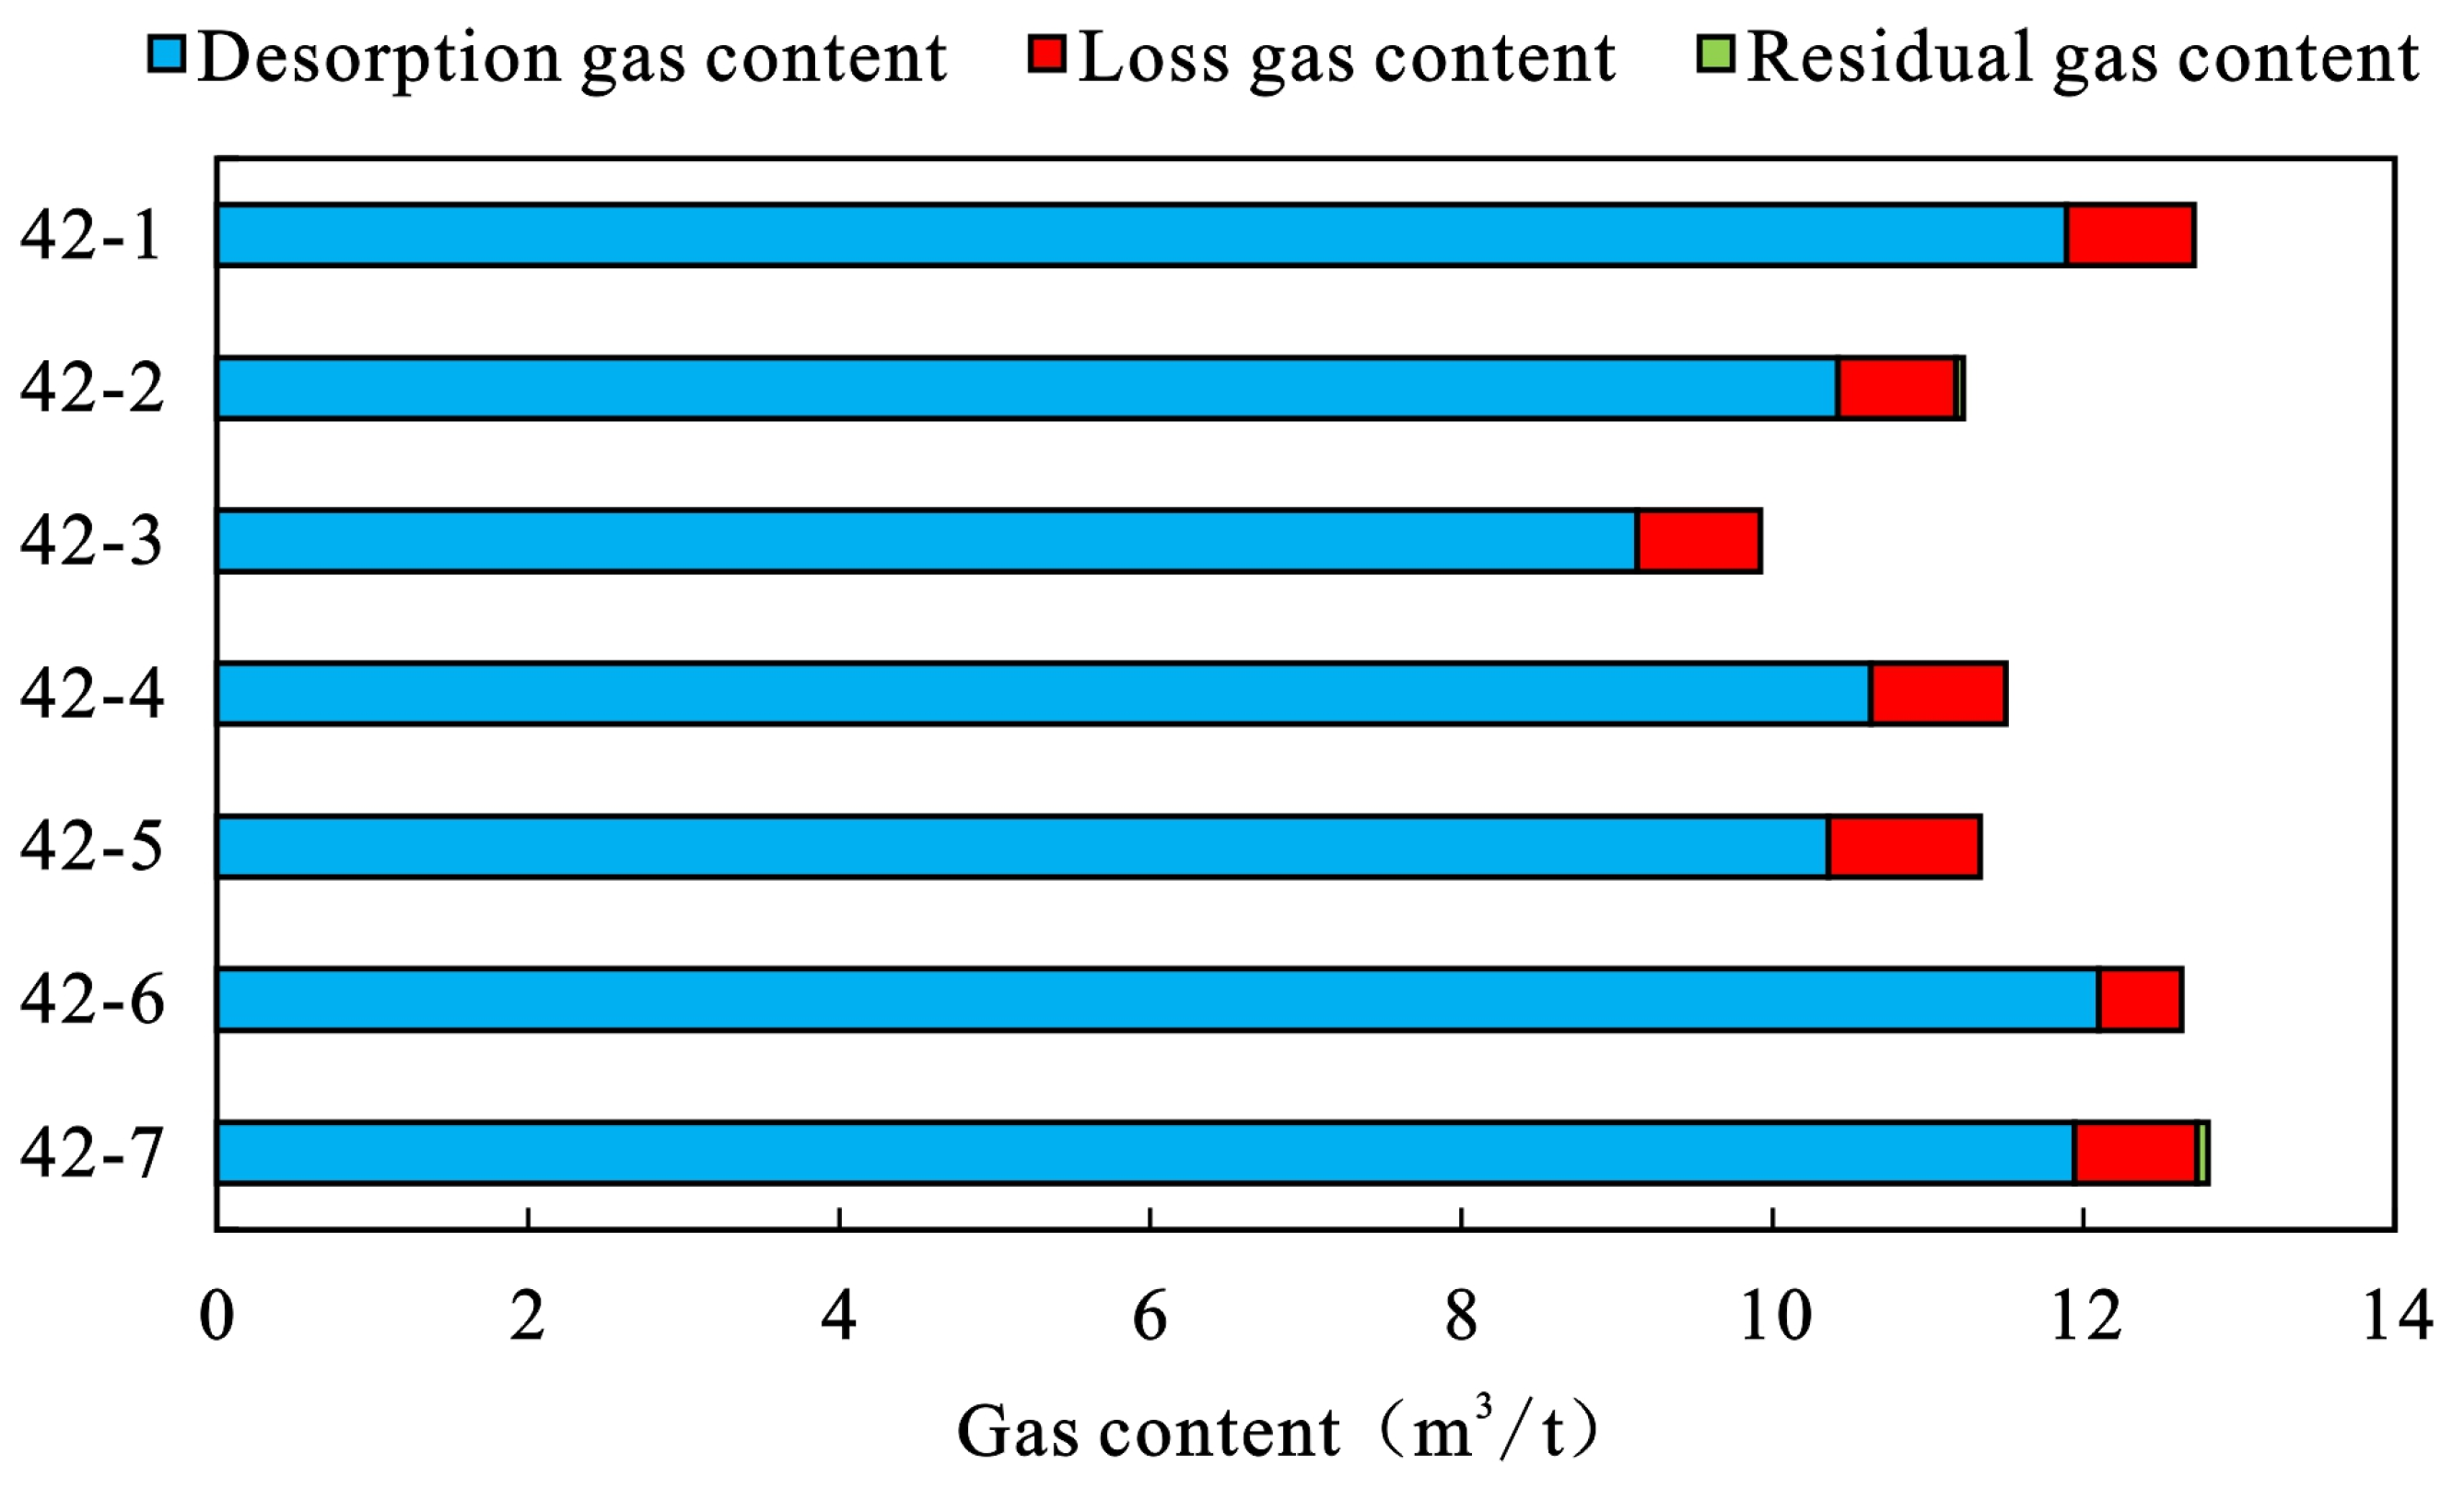
In addition, on-site desorption experiments were carried out on 7 fresh coal cores. The total gas content of the samples ranges from 9.92 to 12.80 m3/t, with an average of 11.73 m3/t. The proportion of desorbed gas ranges from 91.39% to 95.78%, with an average of 93.06%. The methane content in desorbed gas ranges from 67.44% to 86.51%, with an average of 75.13%, indicating good gas quality (Figure 3). The on-site desorption results are affected by factors such as lost gas volume of samples and test procedures and need to be comprehensively evaluated combined with experimental conditions [38]. Combined with the burial depth conditions, shallow CBM in the study area should be dominated by adsorbed state. Sample No. 42-3 has significantly lower gas content than other samples due to well-developed fractures, poor preservation conditions, and high gas escape degree.
Figure 3.
Total gas content of samples on air-dried basis.
3.2. Experimental Methods
3.2.1. Isothermal Adsorption Experiment
Referring to the national standard GB/T 19560-2008, Experimental method of high-pressure isothermal adsorption to coal [39], methane isothermal adsorption tests were carried out using the volumetric method. Coal samples were crushed to 60–80 mesh and tested under equilibrium moisture conditions. The single-temperature adsorption experiment was conducted at 30 °C with a pressure gradient of 0–8 MPa and 6 test points. For the variable-temperature adsorption experiment, representative sample No. 42-5 was selected, with four temperature gradients of 30 °C, 50 °C, 70 °C, and 90 °C, a pressure range of 0–22 MPa, and 10 test points. Based on the test data, the Langmuir equation was used for fitting to obtain Langmuir volume and Langmuir pressure parameters [40].
3.2.2. Isosteric Adsorption Experiment
Based on the isothermal adsorption experimental results at different temperatures, temperature–pressure data corresponding to fixed adsorption amounts were selected. Linear fitting was performed with P versus T, and the isosteric adsorption heat was calculated using the Clapeyron–Clausius equation to characterize the thermodynamic characteristics of the adsorption process and the coupled temperature–pressure mechanism.
3.2.3. Basin Numerical Simulation
BasinMod 1-D software (Software version 1.23) was used to simulate burial history, thermal history, and hydrocarbon generation history. The simulation workflow involved the following: (1) defining stratigraphic units with lithology, thickness, and age; (2) specifying paleo-heat flow history and sediment-water interface temperatures; (3) setting erosion/denudation events; (4) calibrating against measured vitrinite reflectance (RO); and (5) extracting gas-generation and storage-capacity outputs at each geological time step. Basic data such as stratigraphic division data, denudation parameters, and paleo-heat flow values required for the simulation were obtained from well completion reports and previous research results. The simulation results were calibrated by measured RO values to ensure reliability.
4. Coal Adsorption Capacity Characteristics and Main Controlling Factors
4.1. Experimental Determination of Adsorption Characteristics Under Variable Temperature and Pressure
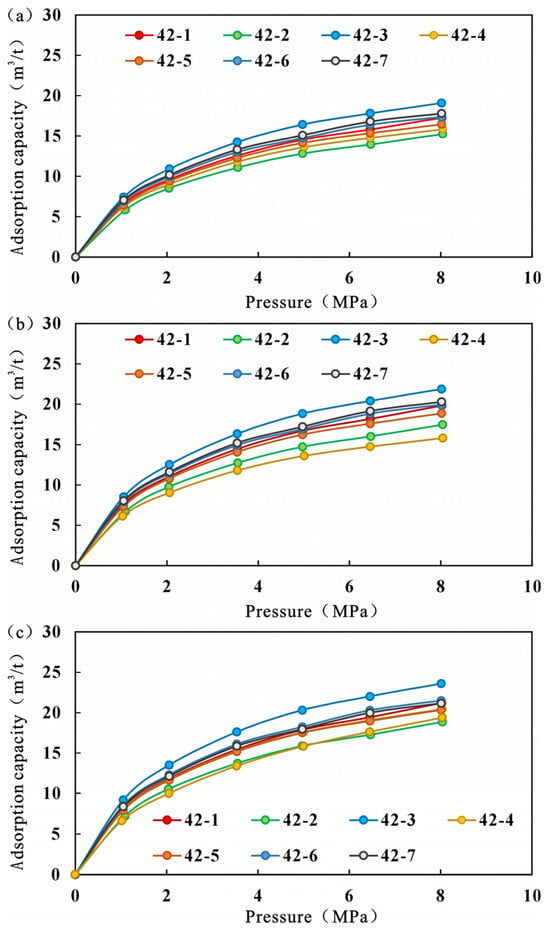
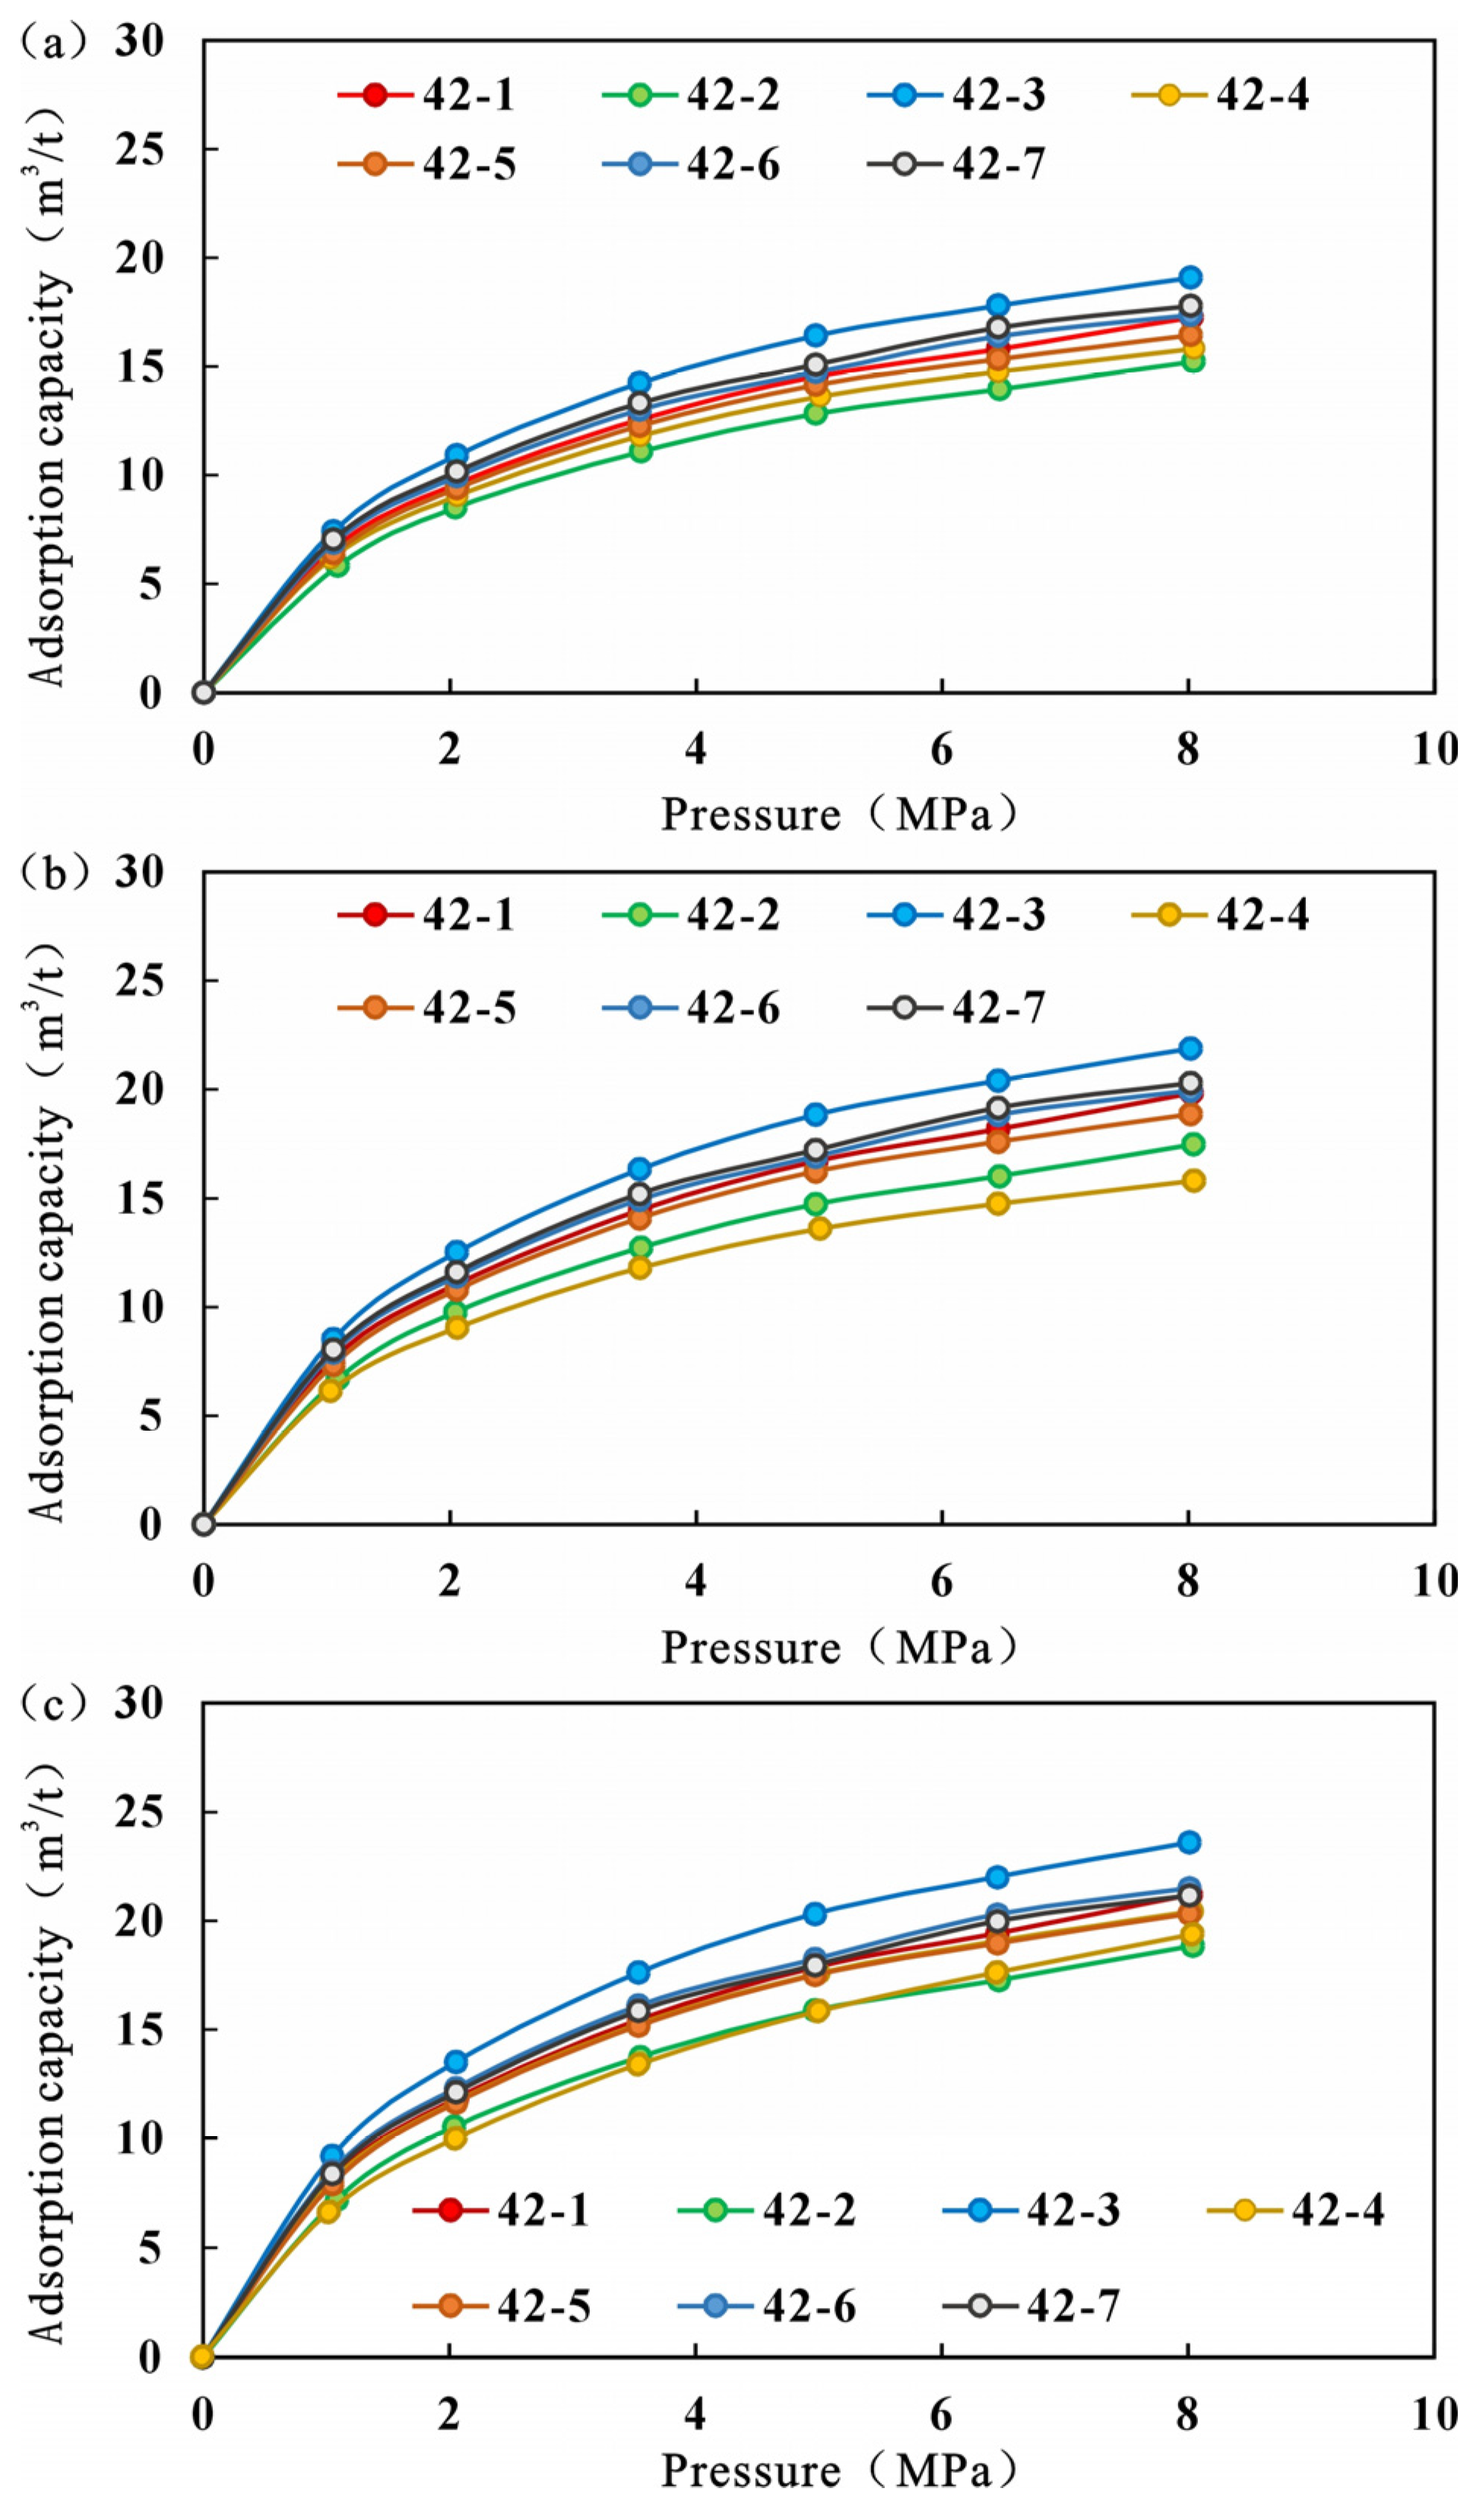
The isothermal adsorption curves of seven coal samples at 30 °C are shown in Figure 4. The adsorption curves under different bases all show typical Type I morphology, consistent with monolayer adsorption characteristics, which is consistent with the adsorption law of most low-rank coal seams in China. The methane adsorption capacity of coal increases nonlinearly with increasing pressure: in the 0–5 MPa pressure range, the adsorption amount increases rapidly with pressure; after 5 MPa, the growth rate gradually slows down and approaches the adsorption asymptotic limit.
Figure 4.
Comparison of isothermal adsorption results of coal samples. (a) Isothermal adsorption results of coal samples on equilibrium moisture basis. (b) Isothermal adsorption results of coal samples on air drying basis. (c) Isothermal adsorption results of coal samples on dry ash-free basis.
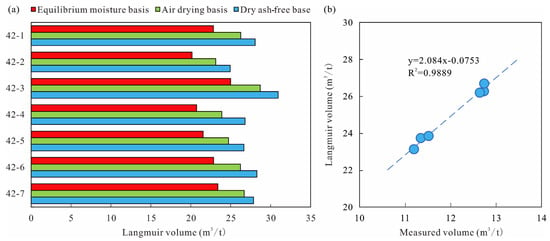
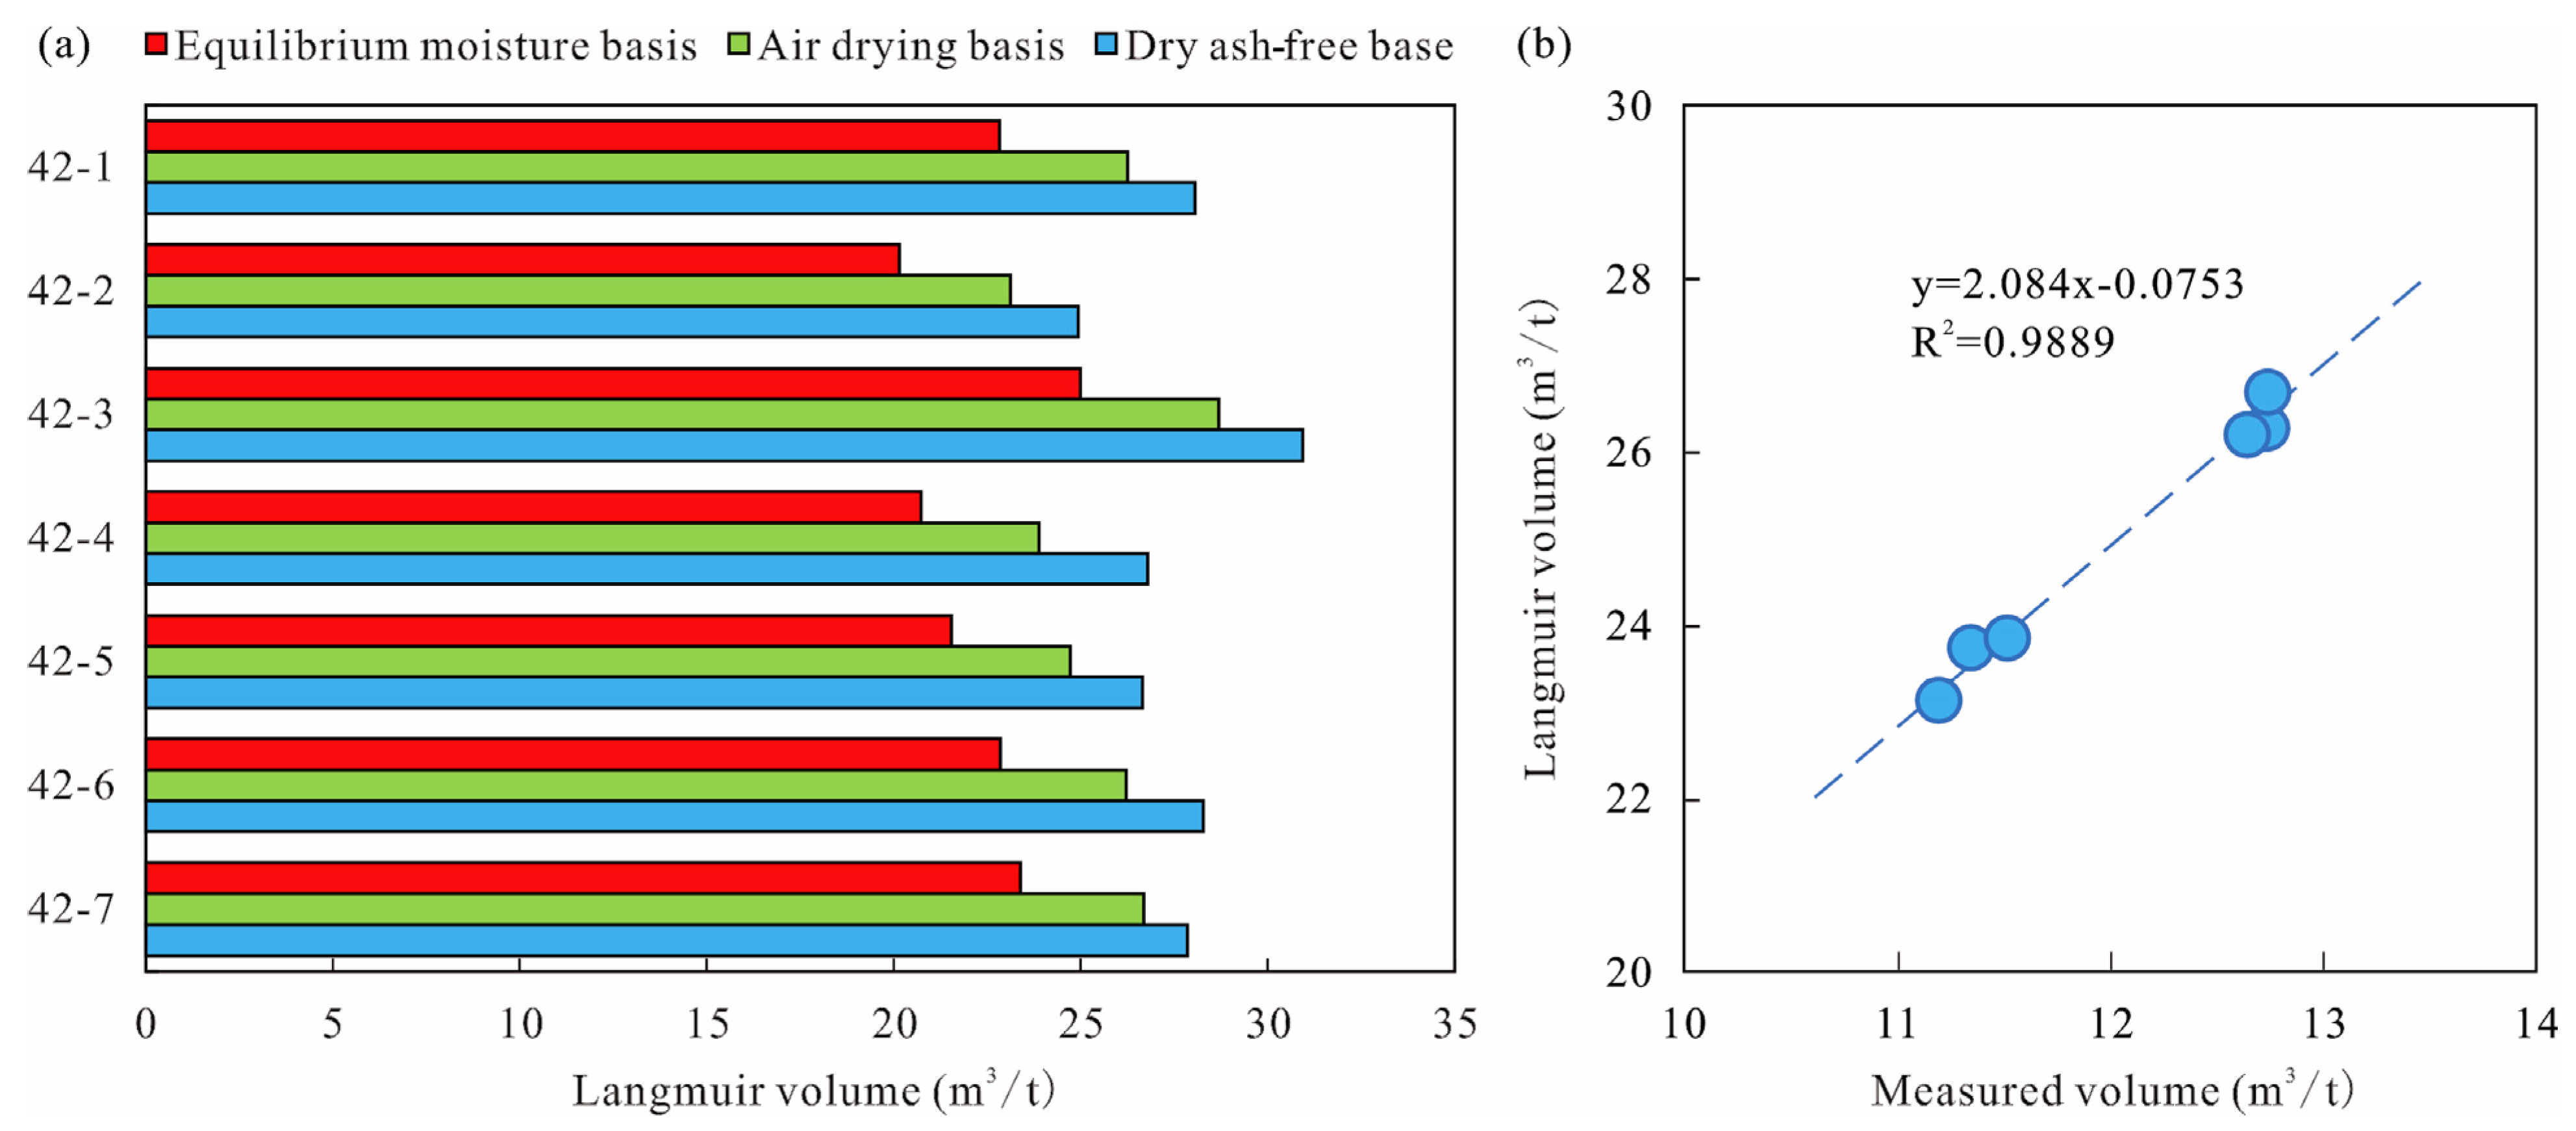
Linear fitting of the adsorption data using the Langmuir equation yields Langmuir volume parameters under different bases: equilibrium moisture-based Langmuir volume ranges from 20.15 to 25.08 m3/t, with an average of 22.36 m3/t; air-dried basis Langmuir volume ranges from 23.12 to 28.69 m3/t, with an average of 25.66 m3/t; dry ash-free basis Langmuir volume ranges from 24.93 to 30.86 m3/t, with an average of 27.65 m3/t. Under dry ash-free conditions, the proportion of organic matter is the highest, so the adsorption capacity is significantly higher than the other two bases (Figure 5). The differences in adsorption parameters under different bases mainly result from the occupation effect of moisture and ash on adsorption sites, which is consistent with previous research conclusions. After excluding sample No. 42-3 (which suffered gas escape due to developed fractures), linear regression analysis between the air-dried basis Langmuir volume and the measured total gas content of the remaining six samples show a coefficient of determination (R2 = 0.9889). It should be noted that this R2 is based on only six data points and reflects an internal consistency check between Langmuir volume and measured gas content, not an independent validation of the depth-extrapolated model. The strong linear association nevertheless indicates that the isothermal adsorption experimental results have reasonable reliability for the study area.
Figure 5.
Langmuir volume under different adsorption bases and correlation between Langmuir adsorption capacity and measured gas content. (a) Langmuir volume from isothermal adsorption experiments under different bases. (b) Correlation between Langmuir adsorption capacity and measured gas content; blue circles represent the six samples used for regression, and the dashed line represents the linear regression fit.
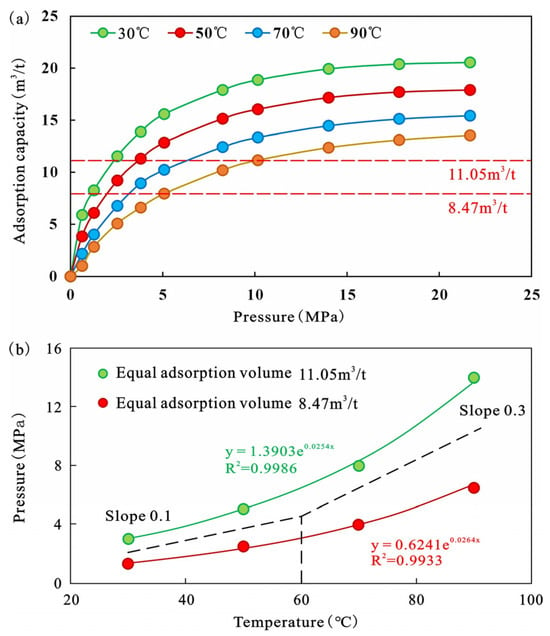
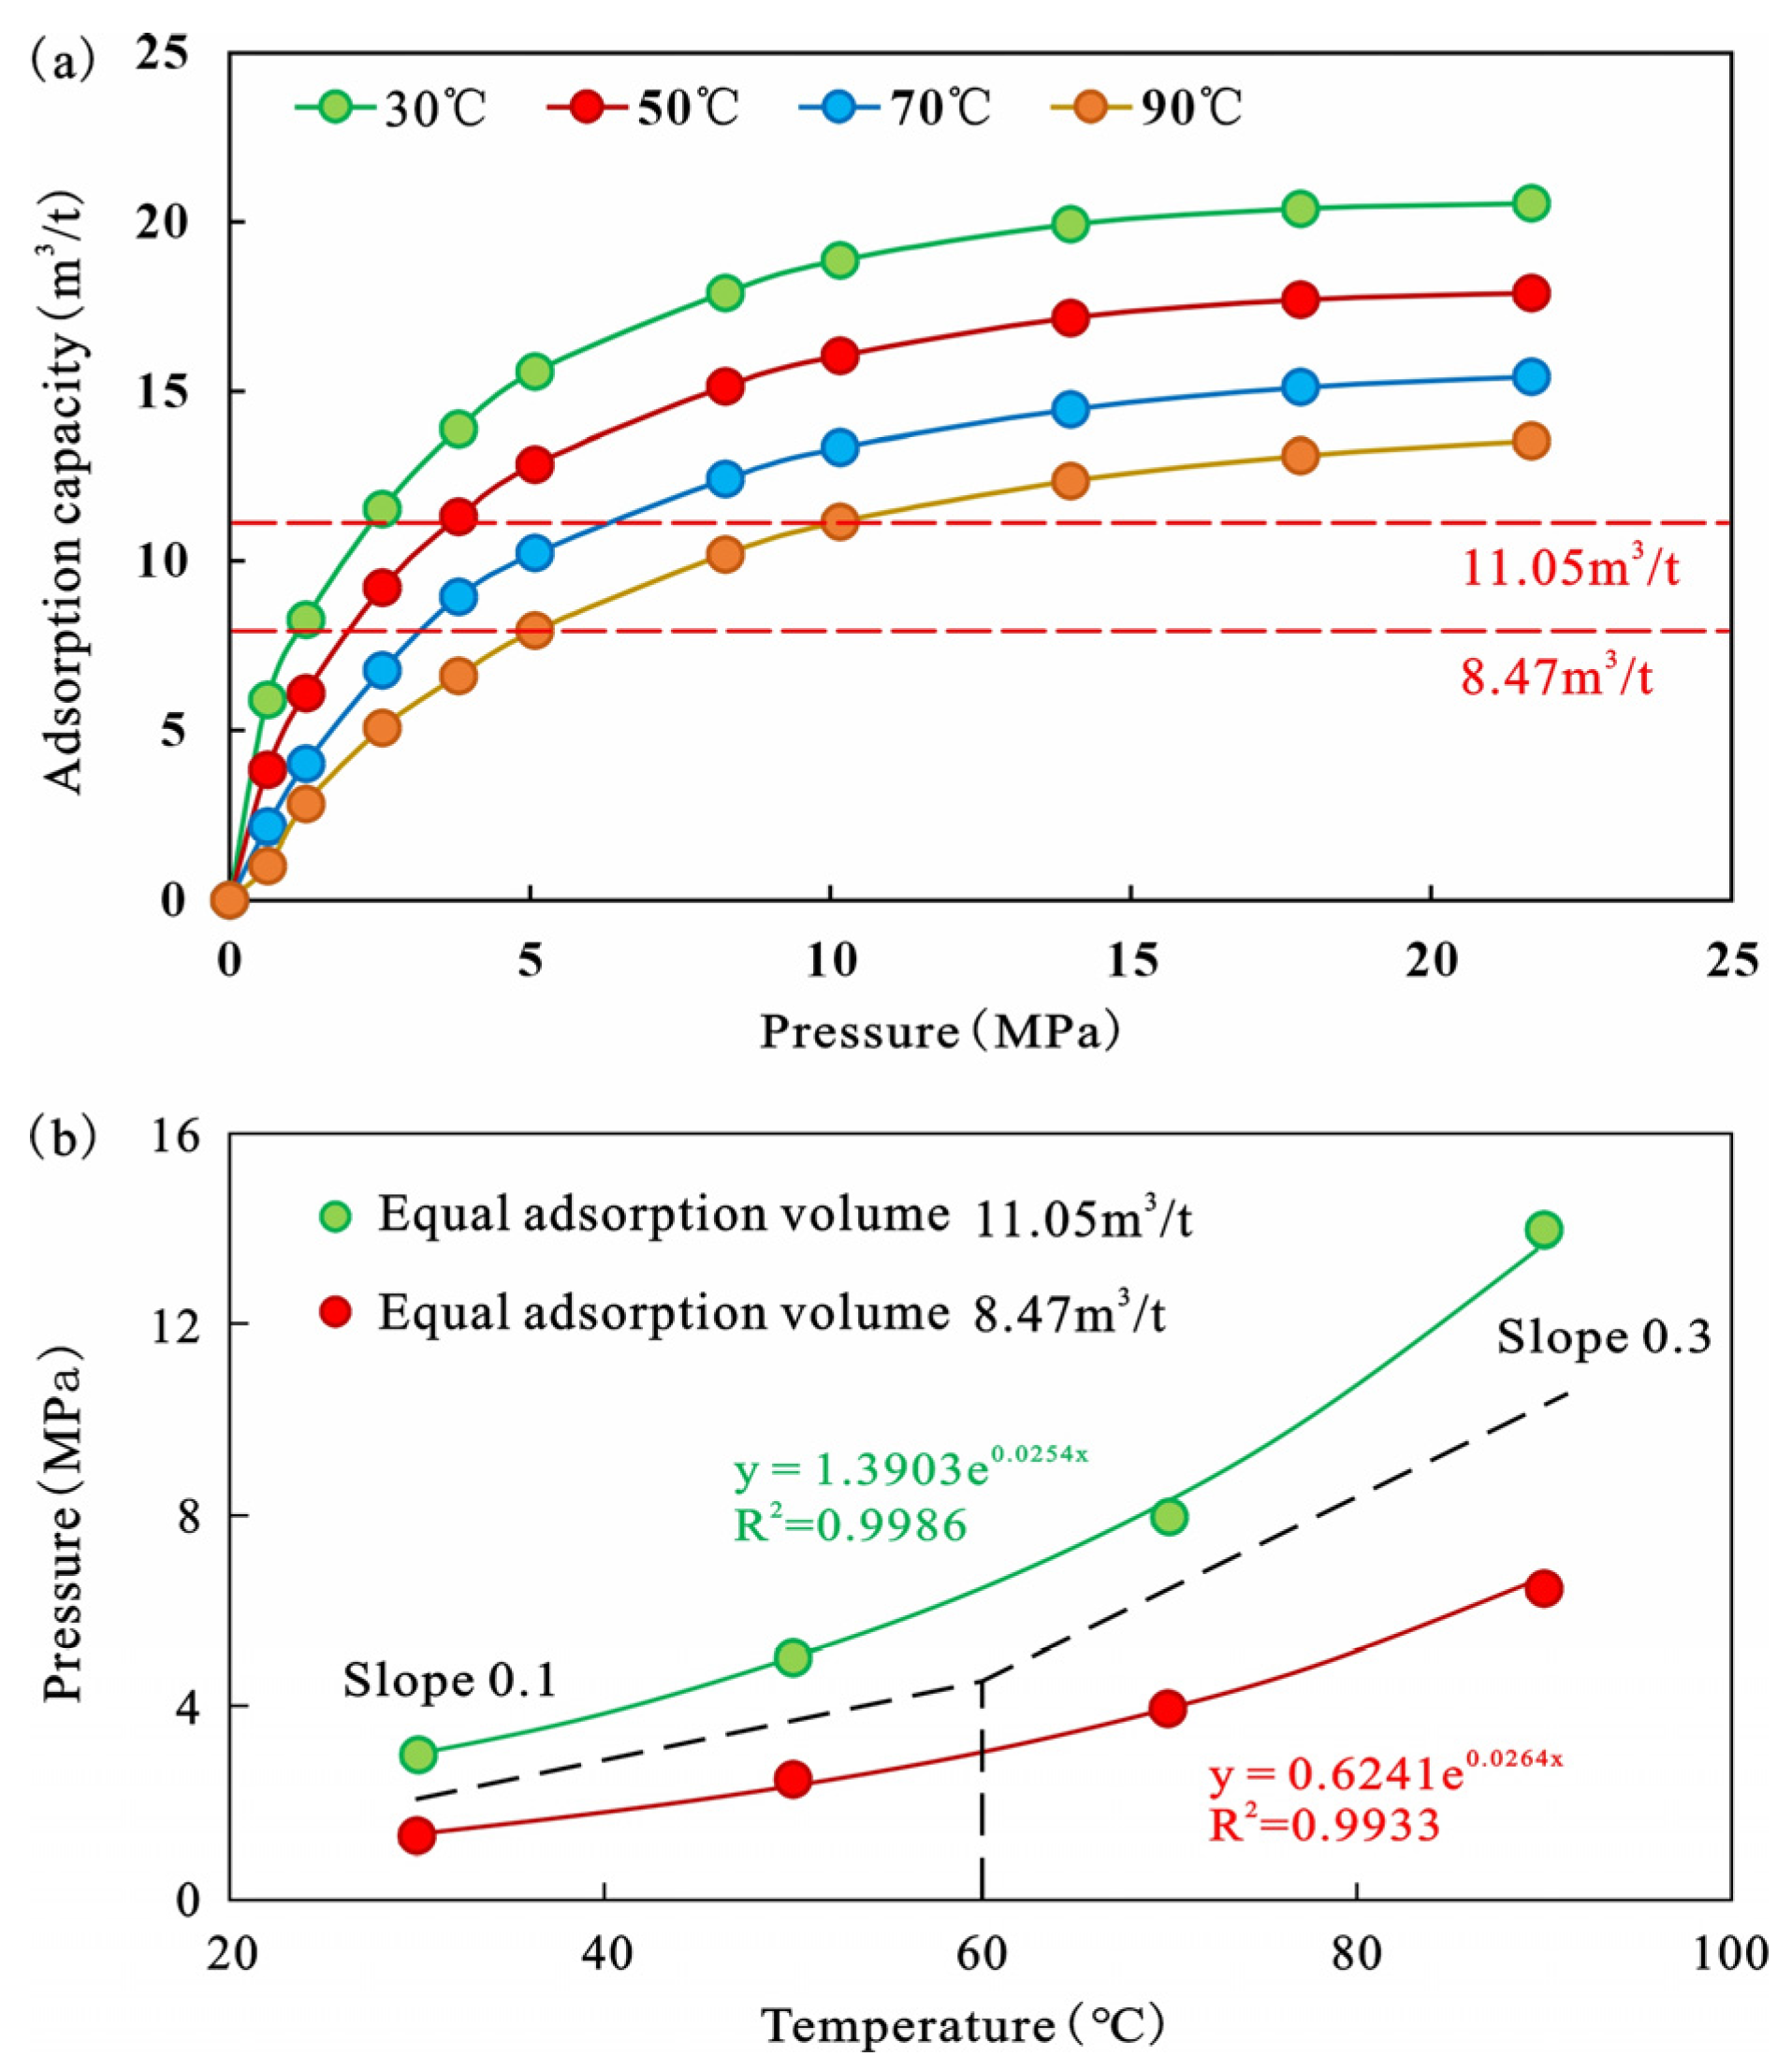
Sample No. 42-5, with parameters closest to the average sample, was selected for variable-temperature adsorption experiments. The results show that temperature has a significant negative effect on coal adsorption capacity: under the same pressure, the higher the temperature, the lower the adsorption amount. When the experimental temperature rises from 30 °C to 90 °C, the Langmuir volume decreases by 7.01 m3/t (Figure 6a). Elevated temperature intensifies the thermal motion of methane molecules and weakens the van der Waals force between the coal surface and methane molecules, leading to decreased adsorption capacity. This law is universal in coal reservoirs of different ranks [41].
Figure 6.
Methane adsorption lines and temperature–pressure linear fitting results of coal sample No. 42-5. (a) Isothermal adsorption lines of methane for coal sample No. 42-5. (b) Linear fitting of temperature–pressure parameters for isosteric adsorption lines of methane for coal sample No. 42-5.
Figure 6b shows the fitting results of temperature–pressure parameters for isosteric adsorption lines of coal samples. Under isosteric adsorption conditions, P and T show an exponential positive correlation. According to the difference in the control intensity of temperature on adsorption, two intervals can be divided:
Low-temperature interval (temperature < 60 °C): The slope of the P-T curve is low (average slope 0.1). The increment of adsorption amount caused by pressure increase is greater than the decrement caused by temperature increase. Only a small pressure increase is needed to offset a large temperature increase, and pressure plays a dominant positive role in the adsorption process.
High-temperature and high-pressure interval (temperature > 60 °C): The slope of the P-T curve is high (average slope 0.3). The increment of adsorption amount caused by pressure increase is less than the decrement caused by temperature increase. A large pressure increase is required to offset a small temperature increase, and temperature plays a dominant negative role in the adsorption process.
Overall, coal methane adsorption capacity is the result of the coupled action of temperature and pressure, and the main controlling factors differ significantly in different temperature–pressure intervals. We note that the variable-temperature experiment was only conducted on representative sample 42-5; the P-T slope thresholds derived from this single sample should be regarded as first-order approximations for the No. 42 seam, and sample-to-sample variability in fixed carbon (49.8–55.2%) and porosity (2.36–5.33%) may shift these thresholds. Multi-sample variable-temperature experiments are needed to fully constrain seam-wide behavior. This temperature–pressure coupled control model is intrinsically consistent with the coal rank-pressure coupling mechanism.
4.2. Control of Coal Composition on Adsorption Capacity
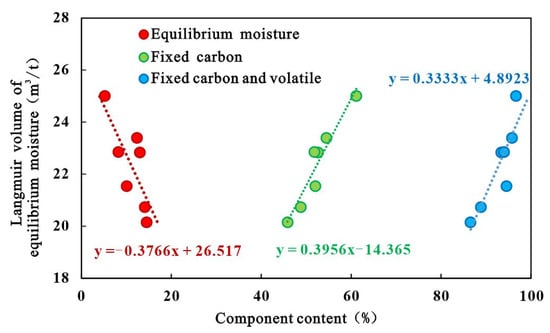
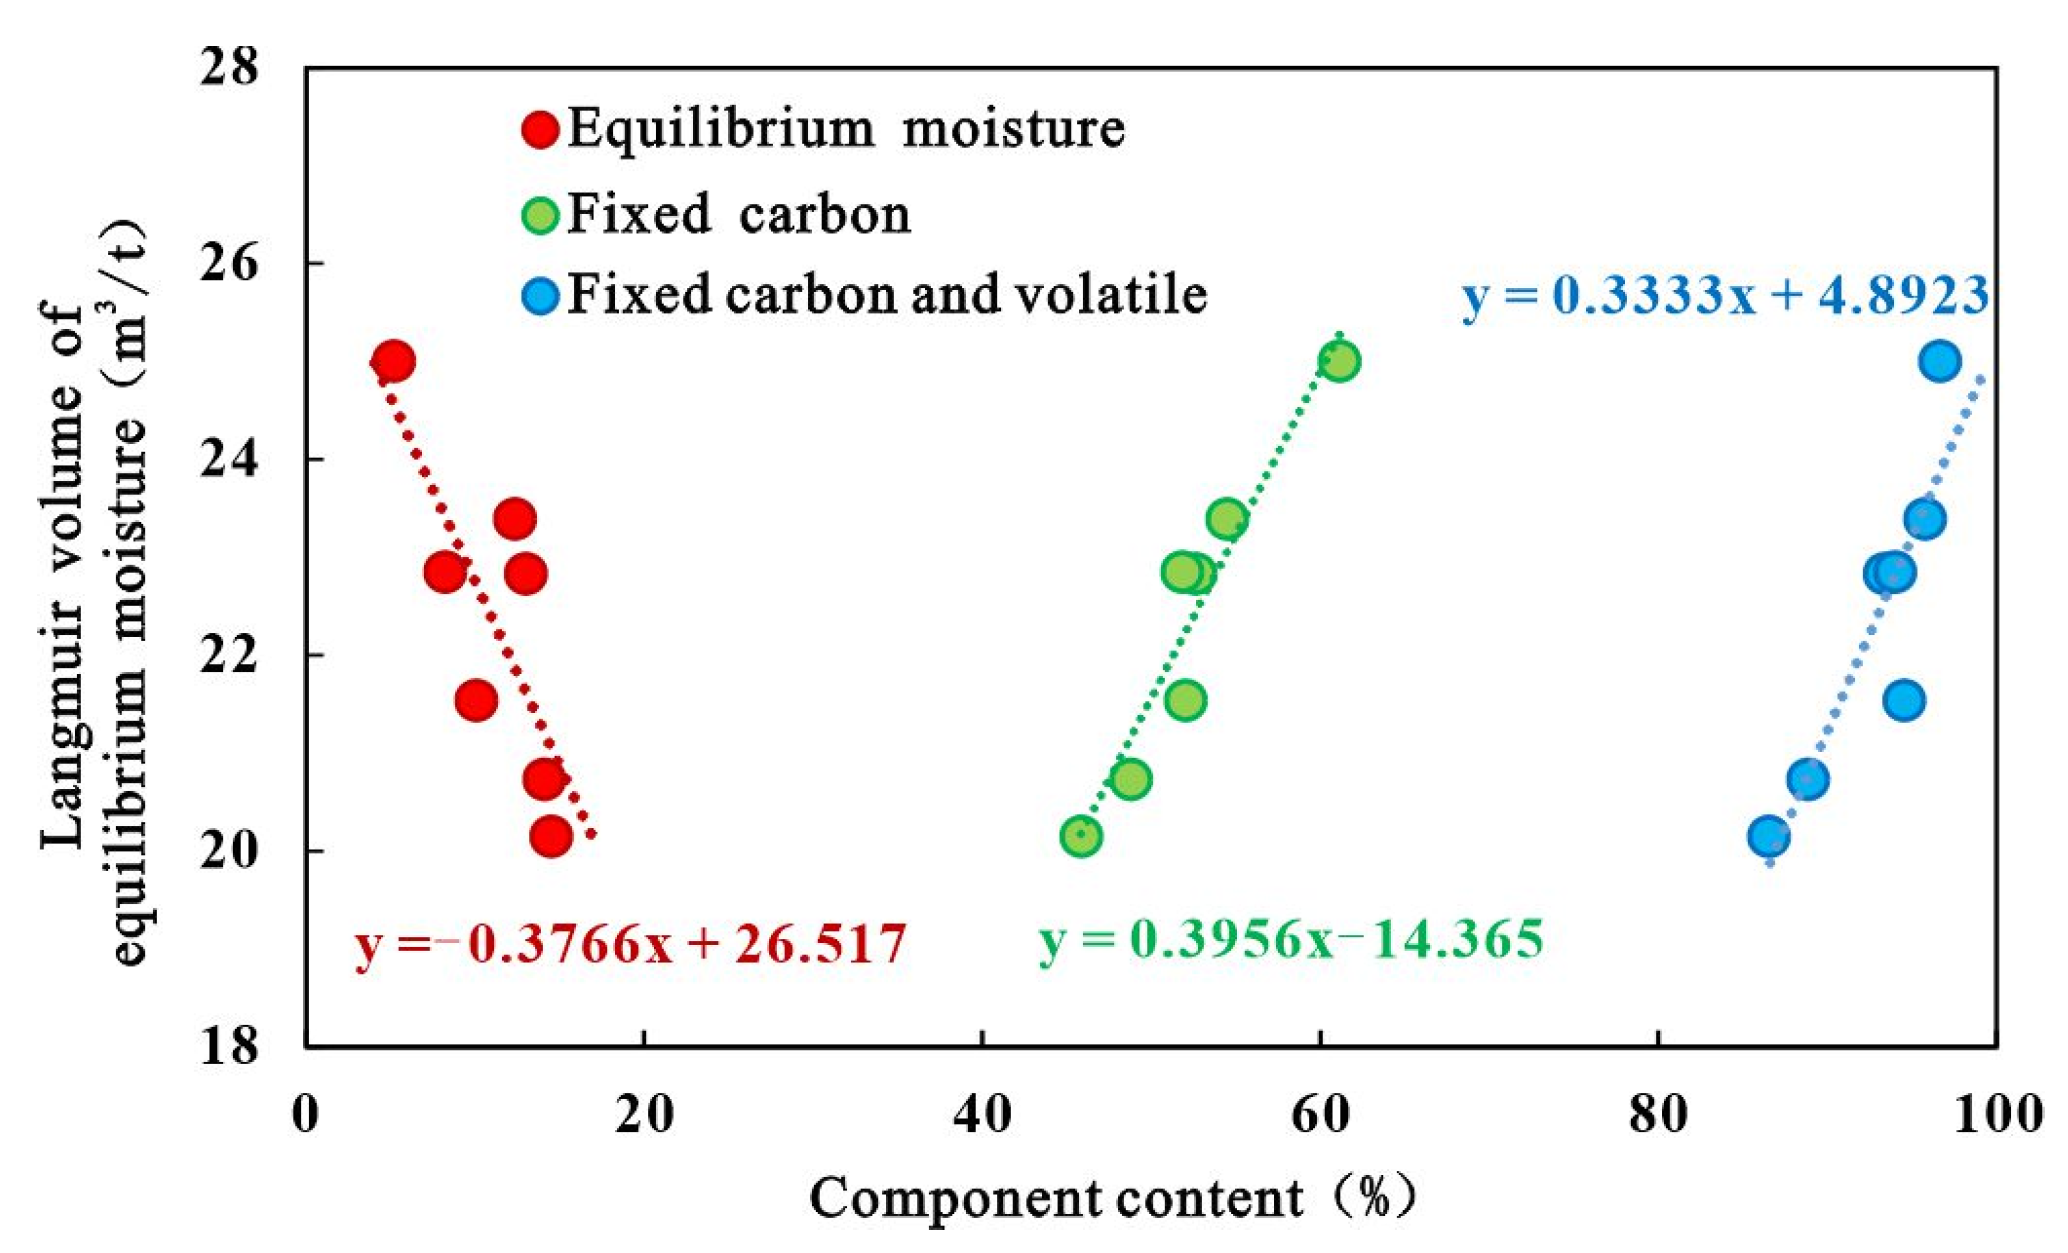
Coal consists of four components: moisture, ash, volatile matter, and fixed carbon, with significantly different methane adsorption capacities. Considering that coal seams are water-saturated under formation conditions, equilibrium moisture-based adsorption parameters are more consistent with actual subsurface conditions. Correlation analysis shows that the equilibrium moisture-based Langmuir volume has a good linear correlation with coal composition: moisture content is negatively correlated with Langmuir volume, as moisture occupies adsorption sites on the pore surface and reduces the effective adsorption area; fixed carbon content is significantly positively correlated with Langmuir volume, with a higher correlation coefficient than the sum of fixed carbon and volatile matter, indicating that fixed carbon is the core internal factor controlling coal adsorption capacity (Figure 7).
Figure 7.
Correlation analysis between equilibrium moisture-based Langmuir volume and component content. The dashed lines represent the linear regression fits.
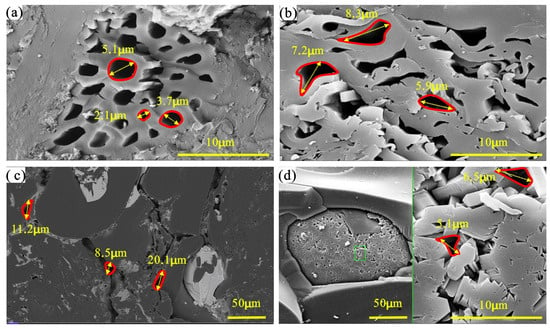
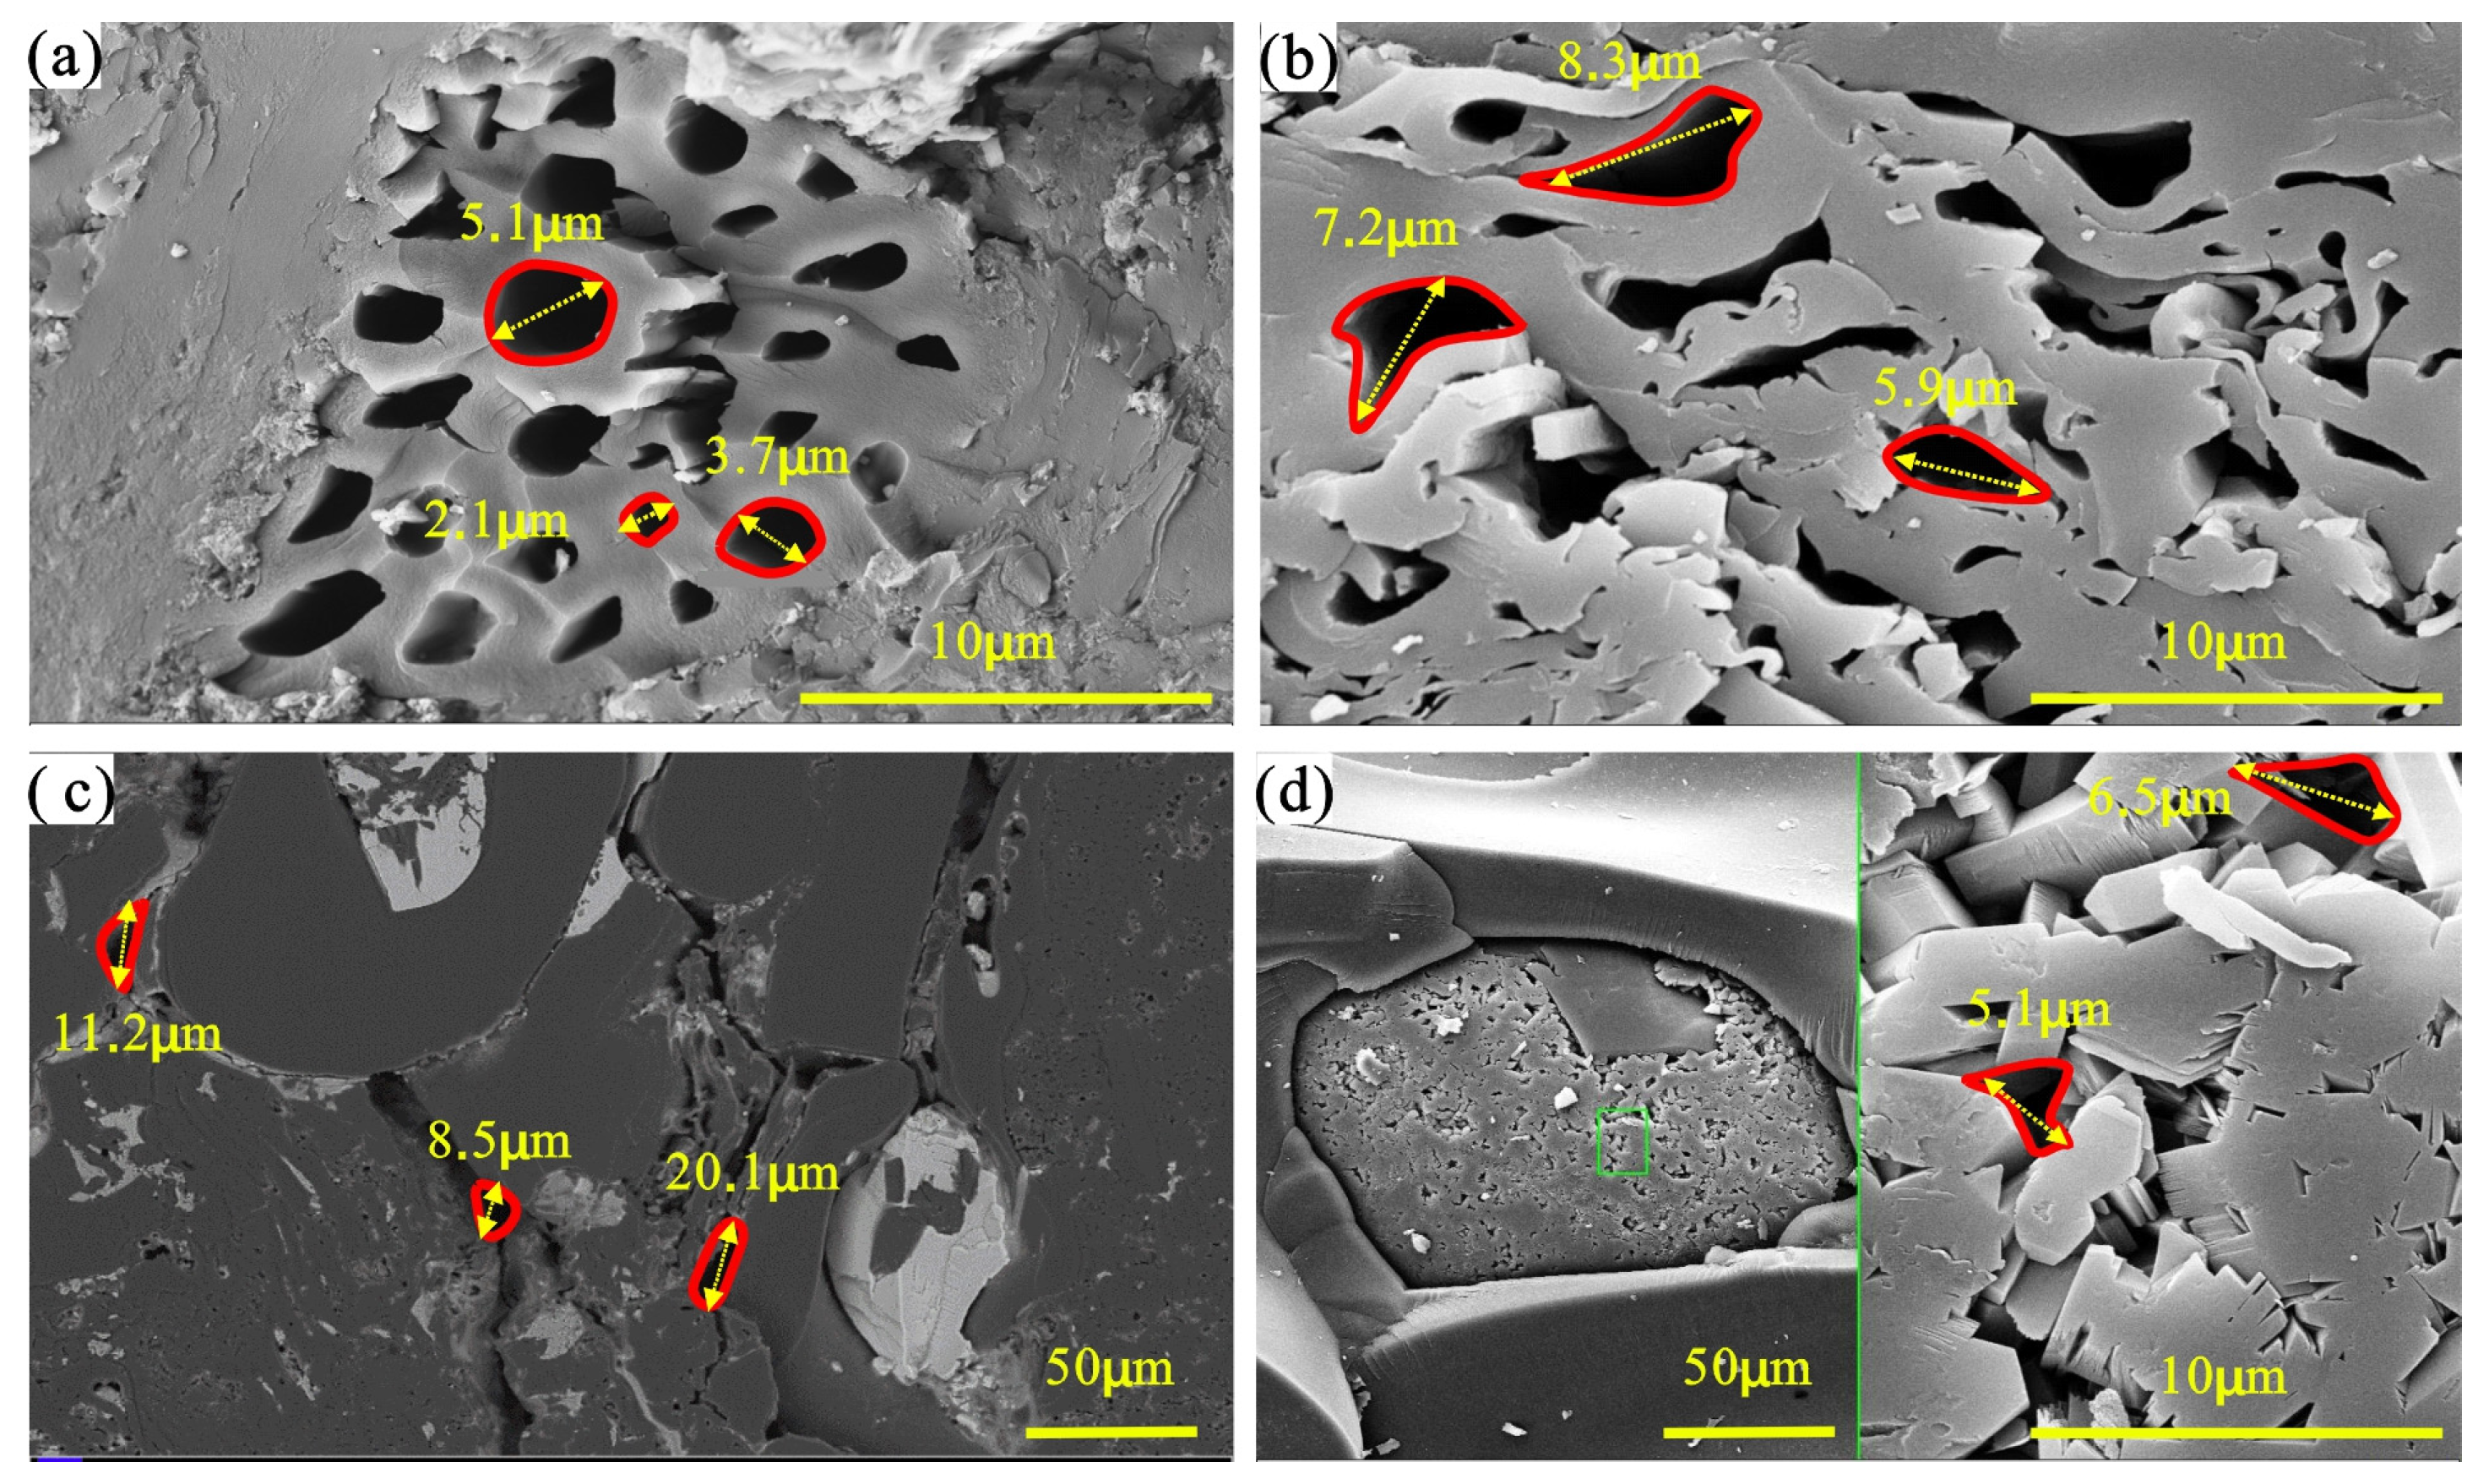
From the perspective of microscopic occurrence characteristics, fixed carbon retains a large number of primary plant structures and develops abundant plant cell lumen pores. The pore morphology is dominated by medium-micro scale elliptical and compressed irregular shapes, with a large specific surface area, providing sufficient sites for methane adsorption (Figure 8a,b). Meanwhile, fixed carbon is mainly composed of organic matter with a hydrocarbon-philic surface, which has strong adsorption affinity for gaseous hydrocarbons.
Figure 8.
SEM images of microscopic pore structure of coal seams in the study area. (a) Well FK24, fusinite section, plant cell lumen pores. (b) Well FK24, fusinite section, compressed deformation of plant cell lumen pores. (c) Well FK24, intercrystalline pores of aluminosilicate minerals. (d) Well FK24, kaolinite intercrystalline pores. Red outlines indicate representative pore boundaries, yellow dashed double-headed arrows indicate the characteristic pore widths, and the green box in (d) marks the area enlarged in the adjacent high-magnification SEM image.
Moisture and ash basically have no methane adsorption capacity. They occupy rock volume and pore space, leading to a decrease in effective specific surface area and reduced methane adsorption sites, thus exerting a negative effect on adsorption capacity. However, mineral particles in some ash are modified by diagenesis, developing inorganic pores such as feldspar intergranular pores and clay intercrystalline pores, which can provide storage space for free methane (Figure 8c,d). Volatile matter is the pyrolysis product of organic matter and some minerals in coal, and its methane adsorption capacity is relatively low under formation conditions that have not reached the pyrolysis temperature.
5. CBM Content Prediction
5.1. Adsorbed Gas Content Prediction Model
Fixed carbon is the core internal factor controlling coal adsorption capacity, while temperature and pressure are important external controlling conditions. Based on the classical Langmuir equation and combined with high-temperature and high-pressure isothermal adsorption experimental data, an extended Langmuir adsorption prediction model coupled with fixed carbon content, temperature, and pressure is established through multiple linear regression. This model provides a preliminary framework for estimating gas content variation with coal quality and depth; independent validation with additional wells and samples is required before the model can be applied to other coal-bearing areas. Compared with the traditional Langmuir model under single temperature–pressure conditions, this model incorporates the control effect of coal composition, which can improve the prediction accuracy of gas content in areas with different coal qualities.
The relationship between Langmuir volume (VL, m3/t), fixed carbon content (WF, %), and temperature (T, °C) is as follows:
The relationship between Langmuir pressure (PL, MPa) and formation temperature (T, °C) is:
Substituting Equations (1) and (2) into the classical Langmuir equation yields the extended Langmuir equation under the coupled control of fixed carbon content, temperature, and pressure:
where V is the adsorbed gas content (m3/t), VL is the Langmuir volume (m3/t), PL is the Langmuir pressure (MPa), and P is the formation pressure (MPa).
It should be noted that the extended Langmuir model was calibrated on seven samples (six after excluding the fractured 42-3), and no independent validation set was available. The temperature-dependence coefficients were calibrated on sample 42-5 and should be validated against additional variable-temperature data in future work. Furthermore, the adsorption model is calibrated on experimental data up to 22 MPa and 90 °C (sample 42-5). The profile predictions extend to 4000 m depth, corresponding to approximately 40 MPa and 112 °C under the assumed hydrostatic and geothermal gradients—beyond the calibrated range by roughly a factor of two in pressure and 22 °C in temperature. The Langmuir-type extrapolation assumes that the adsorption mechanism remains valid under these conditions, but supercritical methane behavior and coal matrix compression at high pressure may introduce deviations. Deep predictions (below ~2000 m, corresponding to ~20 MPa and ~66 °C) should therefore be regarded as extrapolations with increased uncertainty.
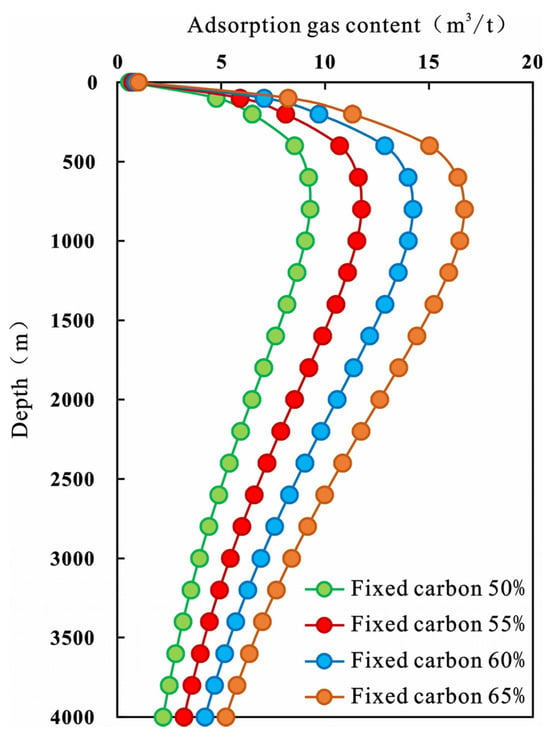
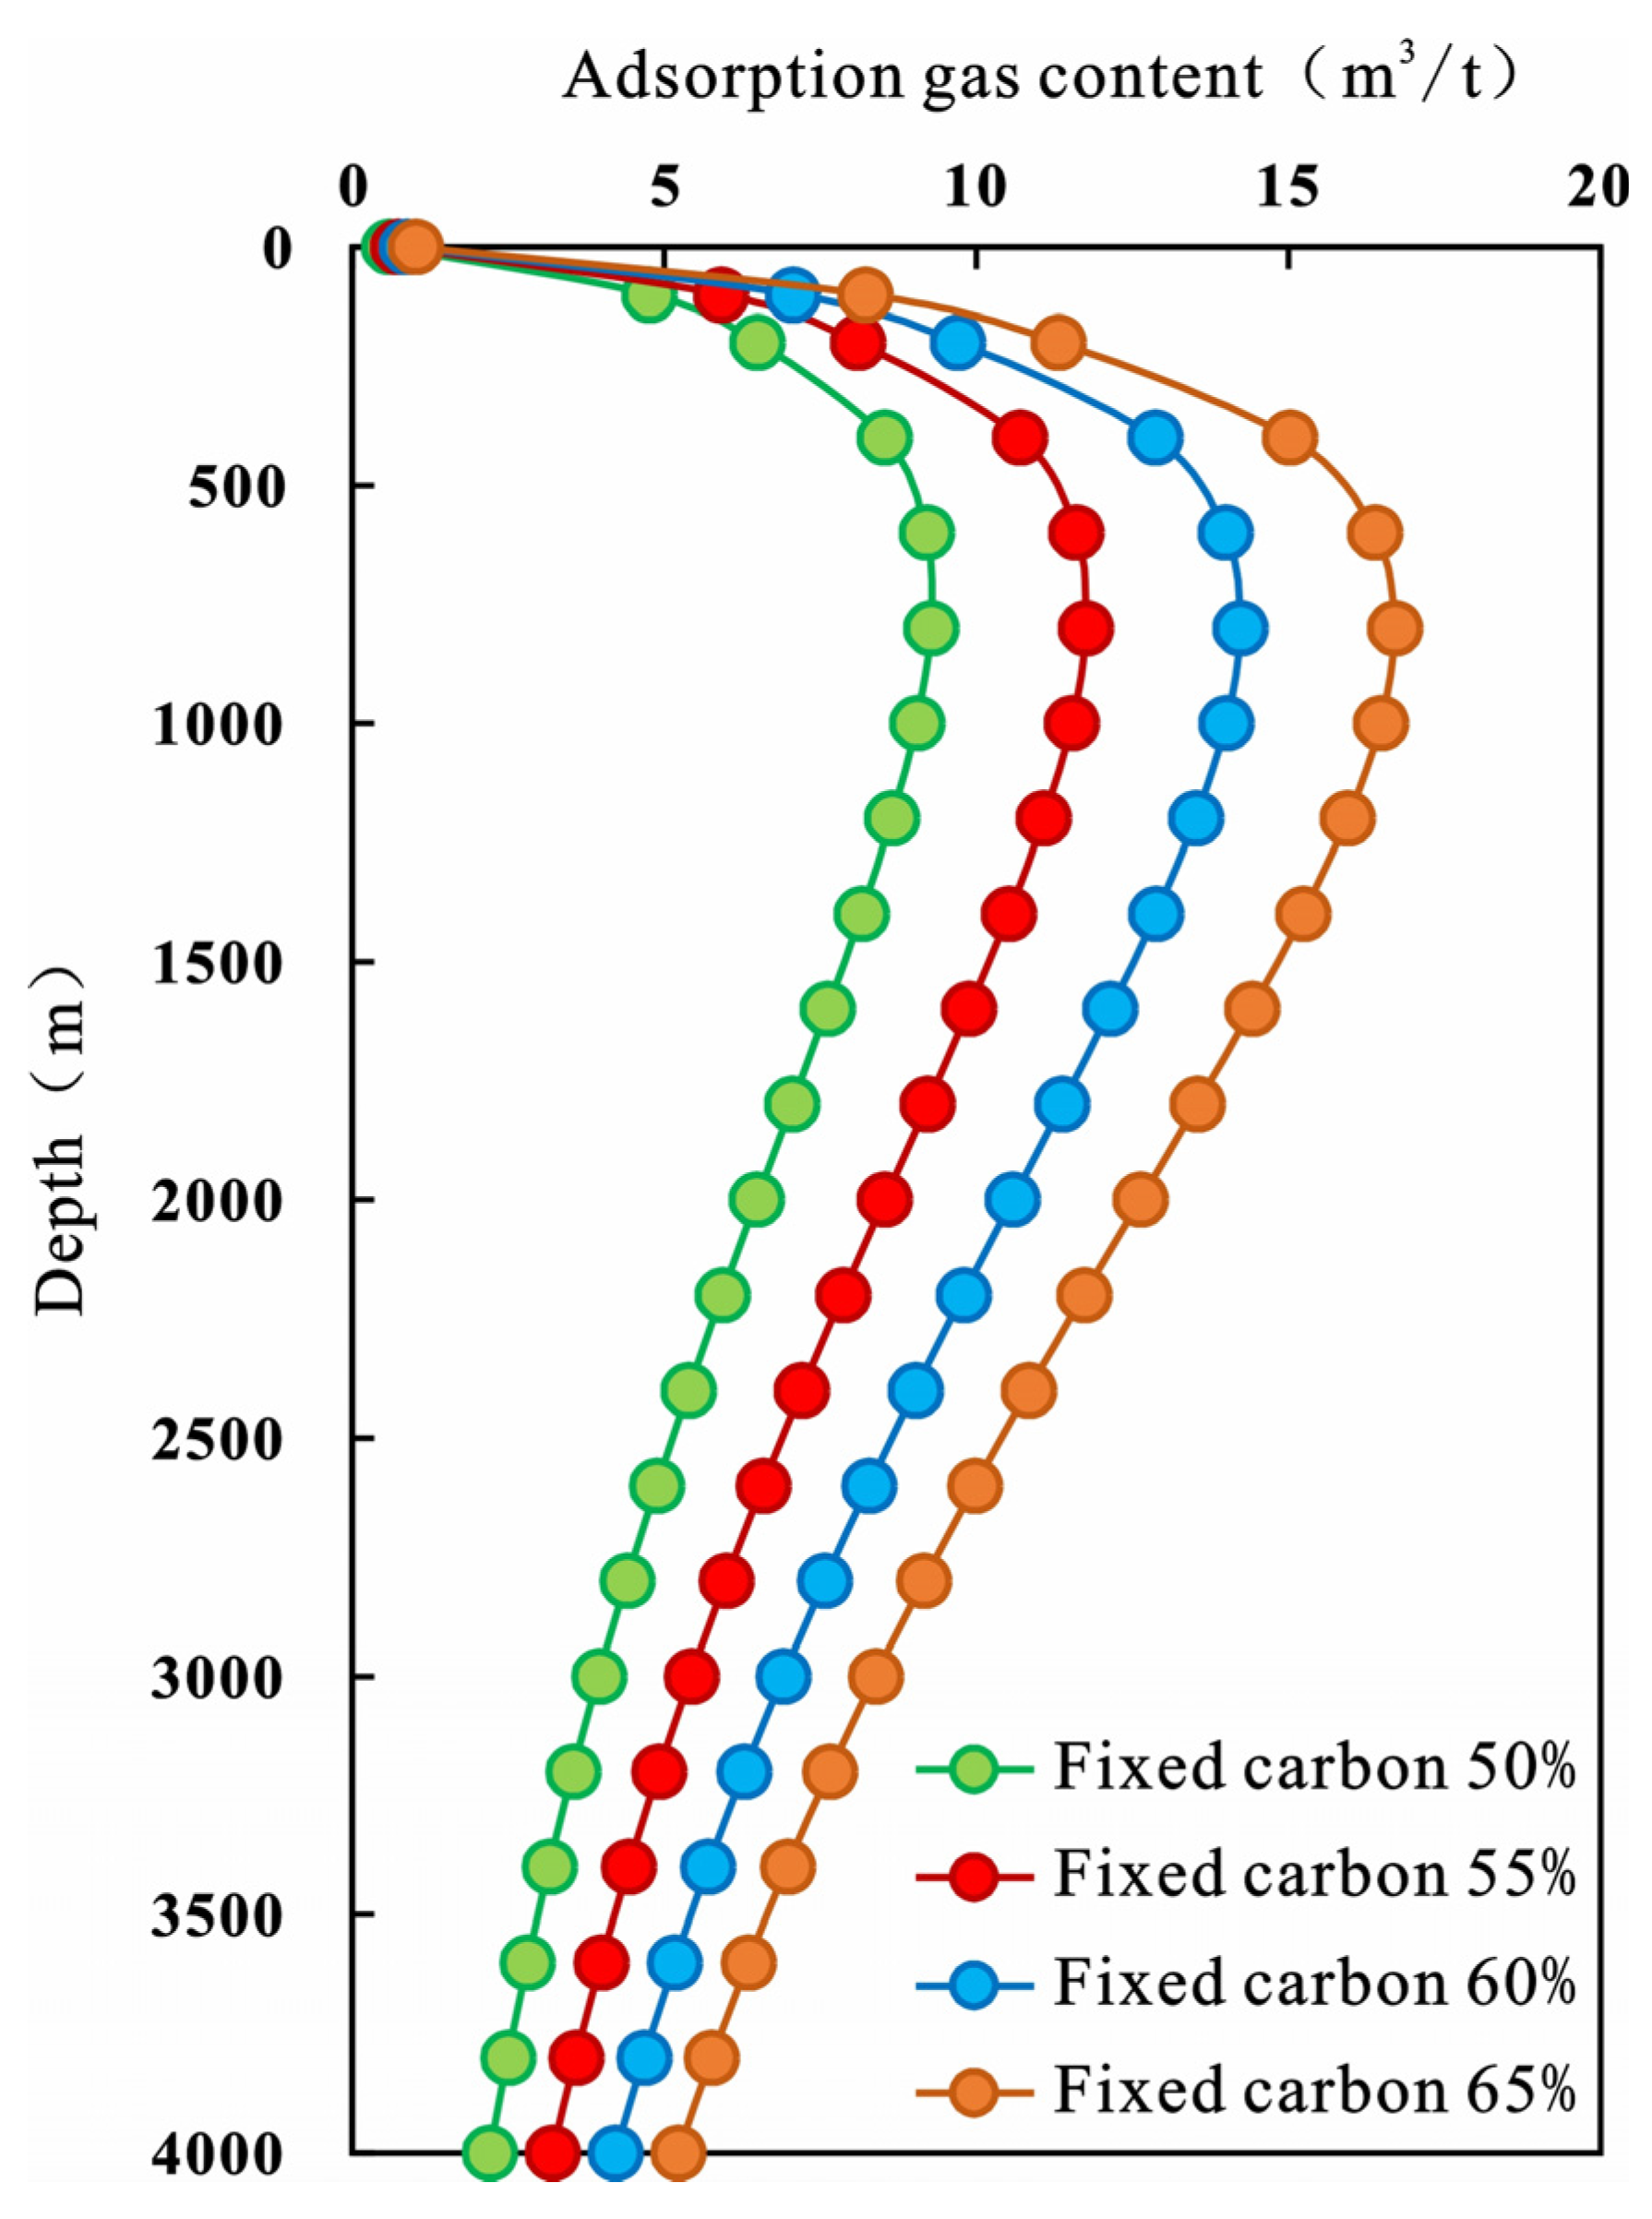
Based on the actual geological conditions of the study area, with a geothermal gradient of 2.3 °C/100 m, surface temperature of 20 °C, and hydrostatic pressure gradient, Equation (3) is used to predict the variation law of adsorbed gas content with depth under different fixed carbon contents. The results are shown in Figure 9.
Figure 9.
Profile of predicted adsorbed gas content variation for the No. 42 coal seam.
With increasing burial depth, the adsorbed gas content of the No. 42 coal seam first increases and then decreases, reaching the adsorption peak at a depth of approximately 800 m, with a maximum adsorption capacity of 11.50 m3/t. In the shallow stage, the positive effect of pressure increase with depth dominates, and the adsorption amount rises rapidly. In the medium-deep stage, the negative effect of temperature increase with depth gradually strengthens and exceeds the positive effect of pressure, leading to a gradual decrease in adsorption amount with depth. This depth distribution pattern of adsorbed gas is widespread in deep CBM reservoirs, and the peak depth is controlled by factors such as geothermal gradient and coal rank. With increasing fixed carbon content, the maximum adsorption capacity of the coal seam increases, and the corresponding peak depth also deepens slightly. For every 5% increase in fixed carbon content of the No. 42 coal seam in the study area, the maximum adsorption amount increases by approximately 3 m3/t.
5.2. Free Gas Content Prediction Model
In coal pore space, adsorbed gas is adsorbed on the pore surface in the form of a monomolecular layer, while free gas occurs in the remaining pore space. Based on mass conservation and the real gas equation of state, a free gas content prediction model is established. Combined with parameters such as formation temperature and pressure, porosity, and water content, the free gas content under subsurface conditions can be calculated. Accurate quantification of free gas content is the key to deep CBM resource evaluation, and its contribution to resources continues to increase with burial depth.
Under formation and surface conditions, the microscopic molar quantity (n, mol) of free CBM is conserved, and the macroscopic occurrence state follows the real gas equation of state:
where P is formation pressure (MPa), V is gas volume (m3), Z is the methane compressibility factor (dimensionless), R is the ideal gas constant (J/(mol·K)), and T is formation temperature (K).where the free CBM content per unit mass of coal is
where is coal porosity (%), Sw is water saturation (%), TS is standard temperature (K), ρc is coal density (t/m3), and PS is standard pressure (MPa). Under surface conditions, the free gas content in the coal reservoir is
The methane compressibility factor Z was calculated using the Peng–Robinson equation of state at each depth-specific temperature and pressure condition, ranging from approximately 0.90 at shallow conditions to 0.75 at 4000 m (40 MPa, 112 °C).
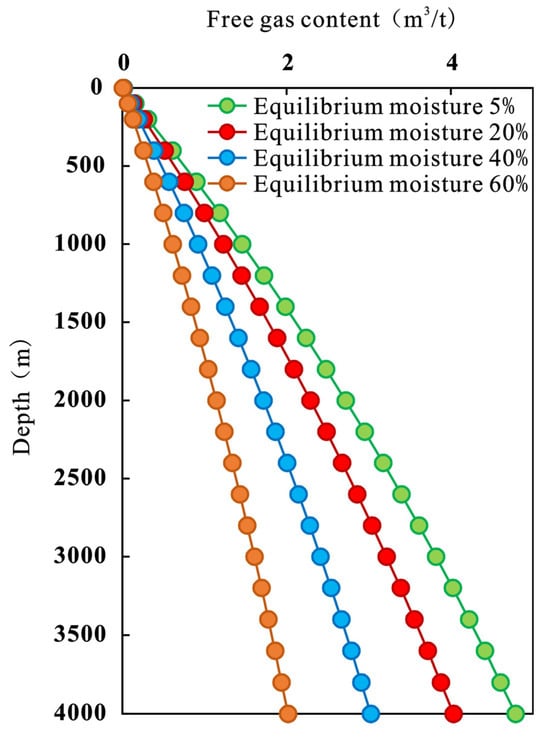
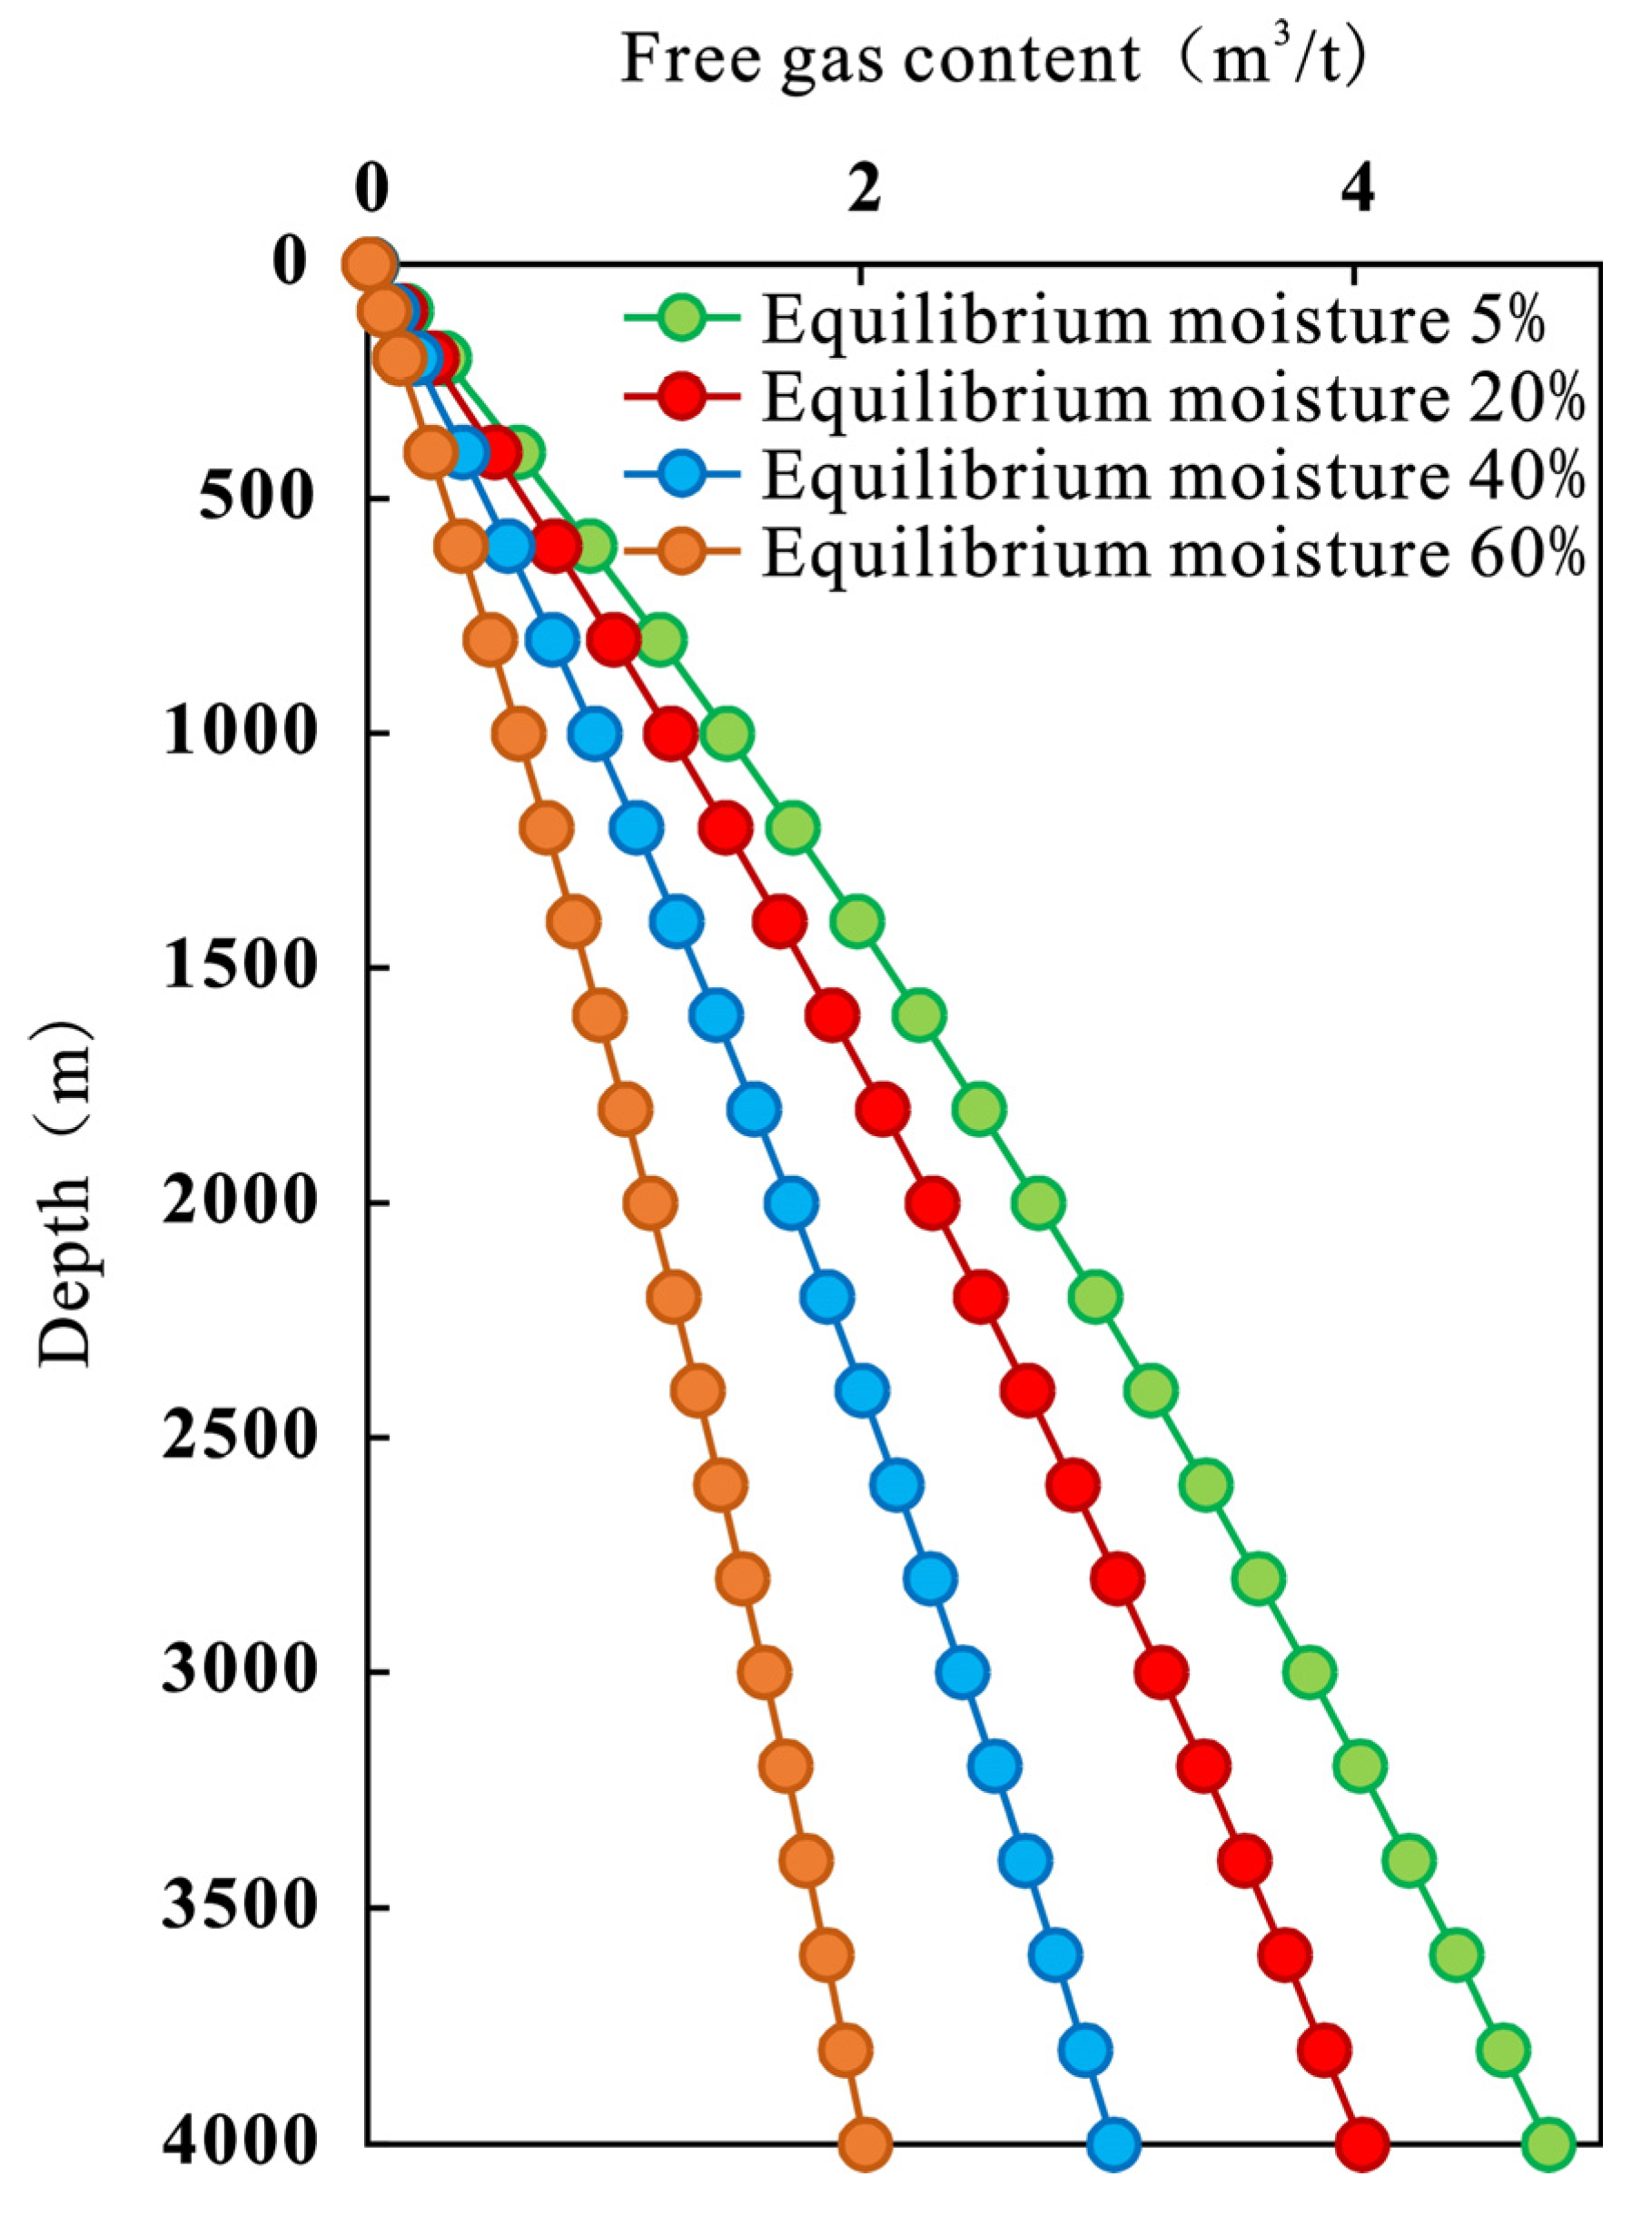
Taking the representative porosity of 3.87% for sample 42-5 (the sample closest to the overall mean in proximate composition; note that the seven-sample arithmetic mean porosity is 3.10%, as reported in Table 1) and combining the aforementioned temperature–pressure gradient conditions, the variation law of free gas content with depth under different moisture contents is predicted. The results are shown in Figure 10. With increasing burial depth, the formation pressure gradually increases, and the free gas content generally shows a continuous increasing trend, but the growth rate gradually slows down with depth. Under the same depth condition, the higher the equilibrium moisture content of the coal seam, the larger the proportion of pore space occupied by formation water, the smaller the free gas storage space, and the lower the free gas content. Overall, formation pressure and coal seam moisture content are the most important factors controlling free gas content.
Figure 10.
Profile of predicted free gas content variation for the No. 42 coal seam under different moisture contents (base-case porosity = 3.87%, sample 42-5; porosity variability 2.36–5.33% is not captured in these curves).
Given that measured porosity ranges from 2.36% to 5.33% across the seven samples, and that free gas content scales linearly with porosity in Equation (6), the actual free gas content at a given depth may vary by approximately ±20% around the base-case curve depending on local coal quality. Porosity heterogeneity likely exerts a stronger control on free gas variability than moisture content within the observed range (1.40–1.57%), and future work should incorporate spatially variable porosity fields.
5.3. Total CBM Content Prediction
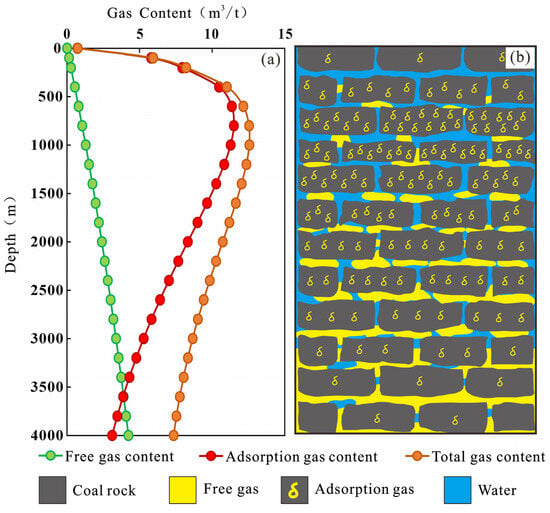
Based on the geological parameters of representative sample 42-5 (moisture content 1.57%, fixed carbon content 53.04%, porosity 3.86%), which is used as the type sample for profile prediction at Well FK24, and the aforementioned temperature–pressure gradient conditions, the profiles of total gas content and the proportions of adsorbed and free gas with depth are calculated. The results are shown in Figure 11.
Figure 11.
Predicted total gas content and proportion variation profile of different gas types for the No. 42 coal seam at Well FK24. (a) Predicted variation profile of different gas contents. (b) Variation pattern of free gas and adsorbed gas proportions.
The variation trend of total gas content with depth is basically consistent with that of adsorbed gas, showing a characteristic of first increasing and then decreasing. It reaches a peak at a depth of approximately 900 m, with a maximum total gas content of 12.56 m3/t. In the shallow stage, adsorbed gas is absolutely dominant and is the main contributor to total gas content. With increasing burial depth, the proportion of free gas gradually increases. At a depth of approximately 3600 m, free gas content exceeds adsorbed gas and becomes the main occurrence state. With further depth increase, a large amount of adsorbed gas desorbs due to high temperature, and the adsorption amount continues to decrease. Meanwhile, the growth rate of free gas content gradually slows down and tends to be stable. Eventually, CBM is dominated by free state, and the proportions of the two remain relatively stable.
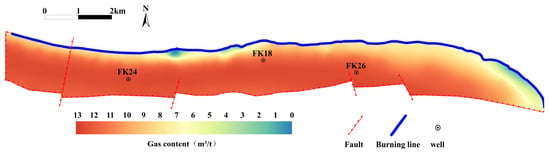
Based on the profile gas content distribution law, combined with the structural morphology and coal seam thickness distribution in the study area, the plane distribution of total gas content of the No. 42 coal seam is predicted. The results are shown in Figure 12. The gas content in the study area generally shows a distribution trend of low in the north and high in the south, and low in the east and high in the west. Near the burning area in the north, the coal seam structure is damaged by igneous rock baking and the burial depth is shallow, so the gas content is generally lower than 5 m3/t. In the central-southern main area, the coal seam has a moderate burial depth and a gas content of 11–13 m3/t, with superior resource conditions. In the southern area near faults, the coal seam burial depth is too large, and high geothermal temperature causes extensive desorption of adsorbed gas, reducing storage capacity. The gas content is lower than that in the central area. Overall, the central-southern main area of the study area has a high CBM enrichment degree and good exploration and development potential.
Figure 12.
Predicted plane contour map of total gas content for the No. 42 coal seam.
The plane contour map (Figure 12) is constrained by gas content data from only 3 wells (FK18, FK24, FK26); the spatial distribution pattern should be regarded as a first-order estimate, and additional well control is needed for refined mapping.
6. CBM Content Evolution
6.1. Burial and Hydrocarbon Generation Evolution History
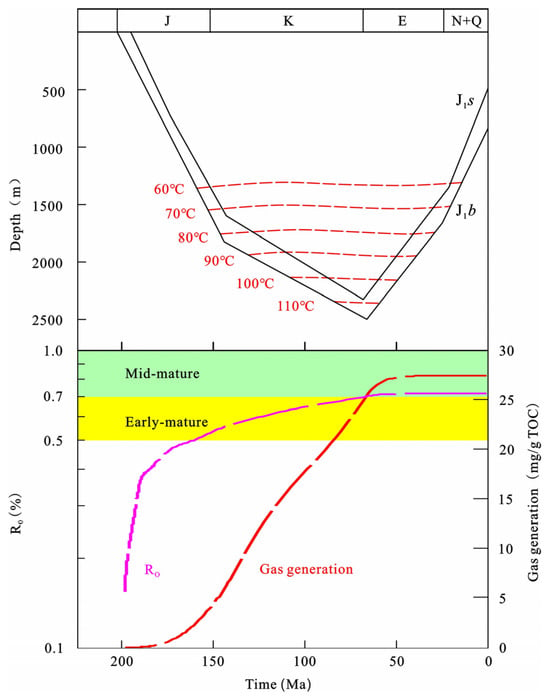
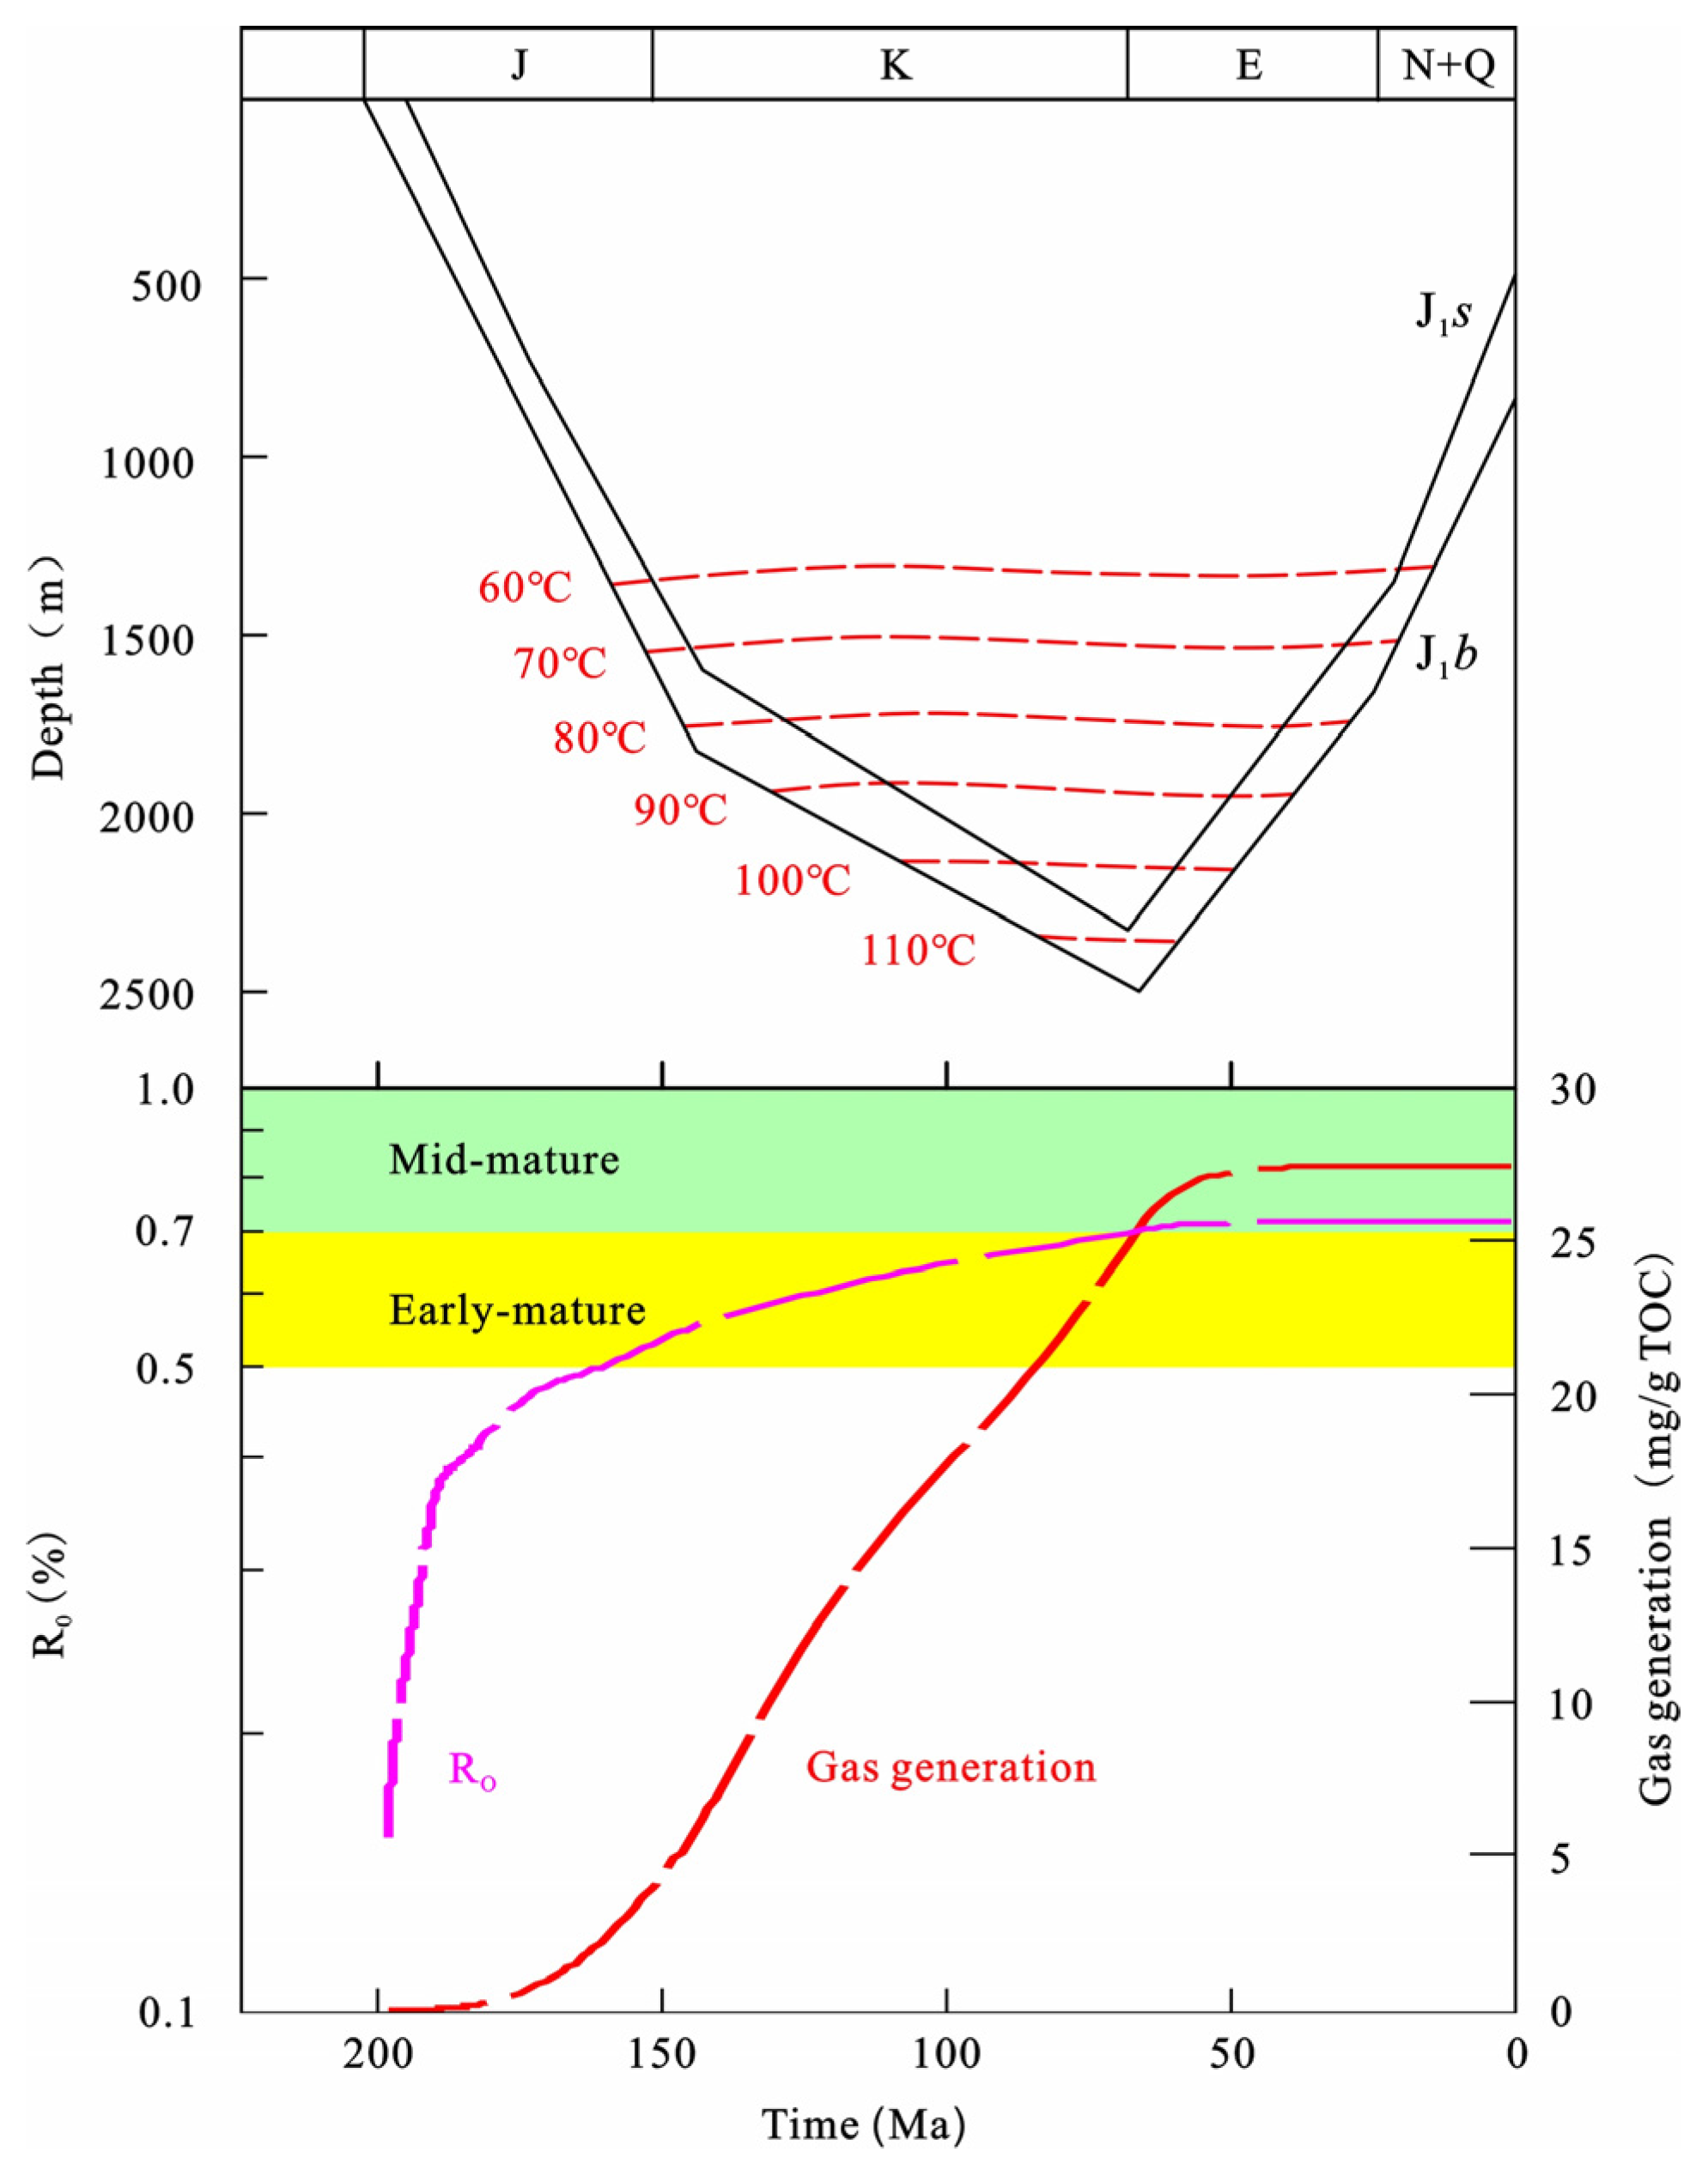
BasinMod software (Software version 1.23) was used to reconstruct the burial history, thermal history, and hydrocarbon generation evolution history of the No. 42 coal seam at Well FK24 in the study area. The simulation results show that the simulated value of the No. 42 coal seam at Well FK24 is 0.72%, with a relative error of only 1.4% compared with the measured value of 0.71%. Meanwhile, the measured RO values of Wells FK18 and FK26 were used for verification. The relative errors between simulated and measured values of the two wells are 6.8% and 5.3%, respectively, both less than 10%, indicating that the simulation results have reasonable reliability. Limited by the number of wells, this accumulation evolution analysis takes Well FK24 as a typical representative, and fine regional evolution still needs more drilling data for constraint.
The burial history reconstruction shows that the Early–Middle Jurassic was a rapid subsidence period with rapid sedimentary burial. From the Middle Jurassic to the Late Cretaceous, it was a slow subsidence period with continuously increasing burial depth. At the end of the Cretaceous, the coal seam reached its maximum burial depth of 1824.18 m. Since the Paleogene, the strata have been continuously uplifted and denuded. The Upper Jurassic and Cretaceous are completely denuded, and only part of the Middle Jurassic remains. The current burial depth of the coal seam floor is approximately 840.77 m. The late stratigraphic uplift process plays an important controlling role in the adjustment and preservation of CBM occurrence state, which is also a typical tectonic evolution characteristic of CBM accumulation in the southern margin of the Junggar Basin.
The hydrocarbon generation history simulation shows that the coal seams in the study area are currently in the low-mature to mature stage. The hydrocarbon generation process over geological history can be divided into three stages (Figure 13): ① Middle Jurassic: The coal seam began to enter the biogas and early pyrolysis gas stage, generating a small amount of gaseous hydrocarbons. ② Late Jurassic: RO exceeded 0.5%, entering the early mature stage. The cumulative gas generation reached 21.22 mg/g Total Organic Carbon (TOC), equivalent to a gas content of approximately 15.35 m3/t under standard conditions; the actual retained gas content at this stage was lower due to incomplete reservoir saturation. ③ RO exceeded 0.7%, entering the middle mature stage with an accelerated hydrocarbon generation rate. At the maximum burial period (Early Paleogene), RO reached a peak of 0.72%, and the cumulative gas generation reached a maximum of 27.46 mg/g TOC, equivalent to a gas content of approximately 19.87 m3/t. Since the Paleogene, stratigraphic uplift has led to decreased geothermal temperature and ceased hydrocarbon generation.
Figure 13.
Evolution of coal maturation degree and gas generation capacity in the study area.
6.2. CBM Reservoir Evolution
The basin simulation was fully calibrated at Well FK24 (RO error 1.4%); Wells FK18 and FK26 were used for RO verification (errors 6.8% and 5.3%, respectively). The storage-capacity and gas-content evolution curves for FK18 and FK26 are generated by applying the same burial–thermal history framework calibrated at FK24, adjusted for each well’s specific burial depth. These should be interpreted as first-order estimates constrained by three points along a south-dipping monocline, not as independently calibrated well histories.
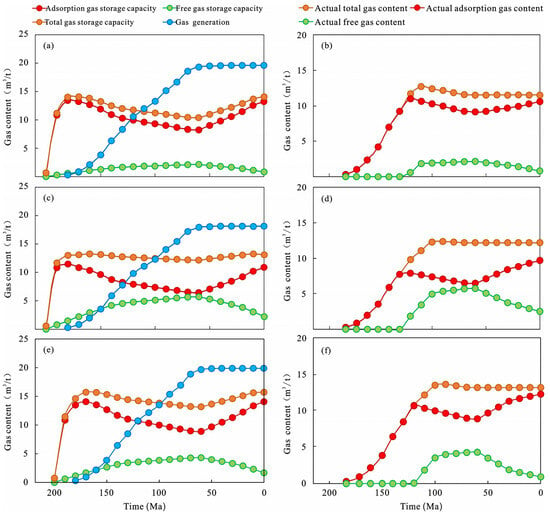
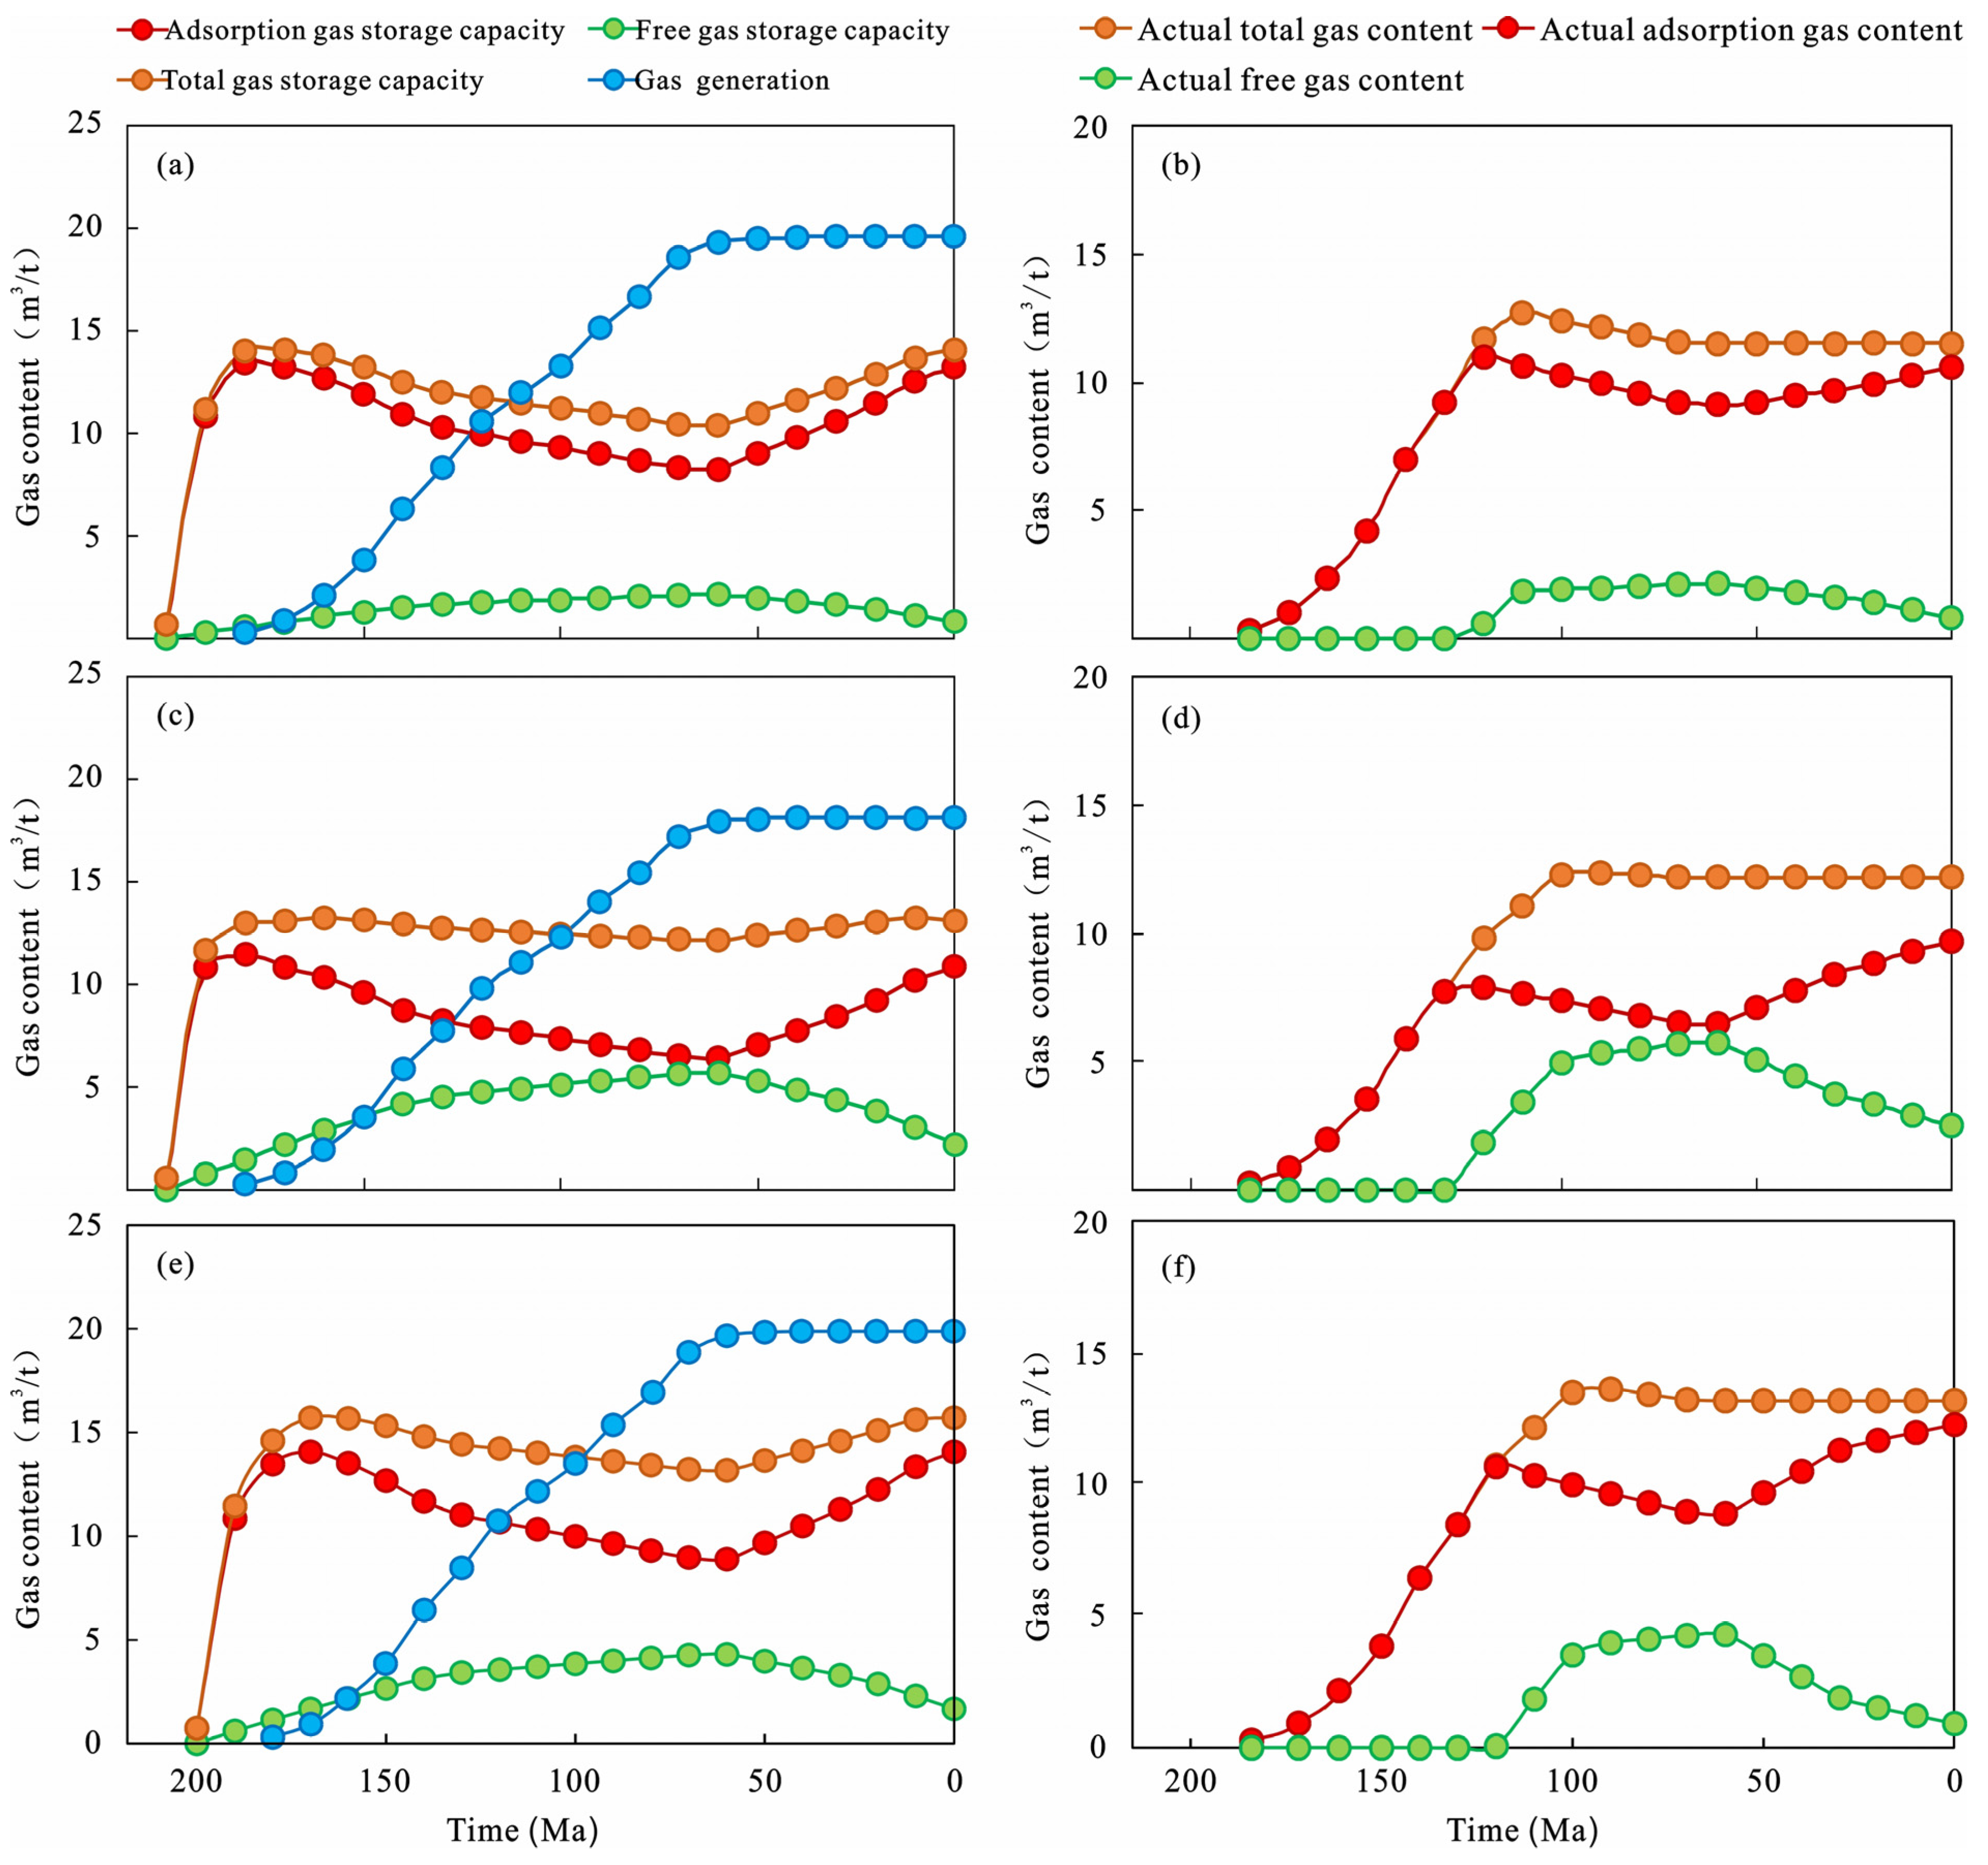
Based on the aforementioned adsorbed and free gas content prediction models, combined with the burial and thermal history results of three wells (FK18, FK24, FK26), the evolution process of CBM storage capacity, hydrocarbon generation process, and actual gas content over geological time is simulated. The results are shown in Figure 14.
Figure 14.
Evolution process of different types of CBM content at Wells FK18, FK24, and FK26. (a) Evolution process of gas generation and storage capacity of CBM in Well FK18. (b) Evolution process of actual gas content of CBM in Well FK18. (c) Evolution process of gas generation and storage capacity of CBM in Well FK24. (d) Evolution process of actual gas content of CBM in Well FK24. (e) Evolution process of gas generation and storage capacity of CBM in Well FK26. (f) Evolution process of actual gas content of CBM in Well FK26.
In each geological stage, the adsorbed gas storage capacity of the coal seams at the three wells is significantly higher than the free gas storage capacity, and the adsorbed state also dominates the actual gas content. The evolution of both storage capacity and actual gas content can be divided into two stages, corresponding to the regional tectonic evolution process of subsidence burial and uplift denudation.
6.2.1. Subsidence and Burial Stage (Early Jurassic–Late Cretaceous)
During the rapid burial of strata in the Early Jurassic, the positive effect of pressure increase dominated, and the adsorbed gas storage capacity of all three wells increased rapidly: the adsorbed gas storage capacity of Well FK18 rapidly increased to approximately 14.0 m3/t, with a free gas storage capacity of 2.0 m3/t and a total storage capacity of 16.0 m3/t; the adsorbed gas storage capacities of Wells FK24 and FK26 rose to 13.2 m3/t and 14.0 m3/t, with free gas storage capacities of 1.8 m3/t and 1.7 m3/t, and total storage capacities of 15.0 m3/t and 15.7 m3/t, respectively.
With continuous stratigraphic subsidence and burial, the geothermal temperature gradually increased, the negative effect of temperature gradually strengthened, adsorbed gas desorbed, and the adsorbed gas storage capacity gradually decreased. The desorbed gas transformed into free state, leading to a corresponding increase in free gas storage capacity. Meanwhile, the thermal evolution degree of coal continued to deepen, and the gas generation amount showed a rapid growth trend.
At the maximum burial period of the Late Cretaceous, the adsorbed gas storage capacities of the three wells dropped to the lowest value in this stage: Well FK18 decreased to 9.7 m3/t, free gas storage capacity rose to a maximum of 3.0 m3/t, with a total storage capacity of 12.7 m3/t; Well FK24 decreased to 7.5 m3/t, free gas storage capacity rose to a maximum of 5.0 m3/t, with a total storage capacity of 12.5 m3/t; Well FK26 decreased to 8.9 m3/t, free gas storage capacity rose to a maximum of 4.3 m3/t, with a total storage capacity of 13.2 m3/t. At the end of this stage, the gas generation amounts of Wells FK18 and FK24 reached 18.0 m3/t, and that of Well FK26 was close to 20.0 m3/t, all entering the peak hydrocarbon generation stage.
The evolution of actual CBM content is highly consistent with the storage capacity and hydrocarbon generation–expulsion process, also showing stage characteristics. During the subsidence and burial stage, with the initiation of hydrocarbon generation and the rapid improvement of storage capacity, the actual total gas content and actual adsorbed gas content of the three wells all increased rapidly, reaching a phased high value in the Early–Middle Jurassic. Subsequently, affected by the decrease in adsorption capacity caused by temperature rise, the actual gas content declined slightly, and then gradually stabilized with the dynamic balance of continuous gas generation and storage capacity.
6.2.2. Uplift and Denudation Stage (Paleogene–Present)
Model outputs suggest that, with continuous stratigraphic uplift, decreasing geothermal temperature leads to gradual recovery of coal adsorption capacity. The model implies that part of the free gas may re-transform into the adsorbed state—this is a model-derived inference consistent with thermodynamic expectations, but direct petrographic or isotopic evidence of re-adsorption has not been obtained in this study. The adsorbed gas storage capacity of the three wells continued to rise, while the free gas storage capacity decreased accordingly. The gas generation amount remained basically stable without obvious growth.
At the present stage: the adsorbed gas storage capacity of Well FK18 recovered to 13.5 m3/t, free gas storage capacity dropped to 2.2 m3/t, and total storage capacity recovered to 15.7 m3/t; the adsorbed gas storage capacity of Well FK24 recovered to 10.5 m3/t, free gas storage capacity dropped to 3.0 m3/t, with a total storage capacity of 13.5 m3/t; the adsorbed gas storage capacity of Well FK26 recovered to 14.0 m3/t, free gas storage capacity dropped to 1.7 m3/t, and total storage capacity recovered to 15.7 m3/t.
During the uplift and denudation stage, hydrocarbon generation basically stagnated. Meanwhile, stratigraphic uplift gradually restored the adsorption capacity, and the actual total gas content of the three wells remained generally stable with a small fluctuation amplitude. The proportion of adsorbed state slightly increased with the recovery of adsorption capacity. At present, the actual total gas content of Well FK18 is maintained at approximately 12.5 m3/t, that of Well FK24 is about 12.8 m3/t, and that of Well FK26 is about 13.4 m3/t. The actual free gas contents of the three wells all decreased to varying degrees, consistent with the variation trend of free gas storage capacity.
6.3. Evolution of Occurrence State
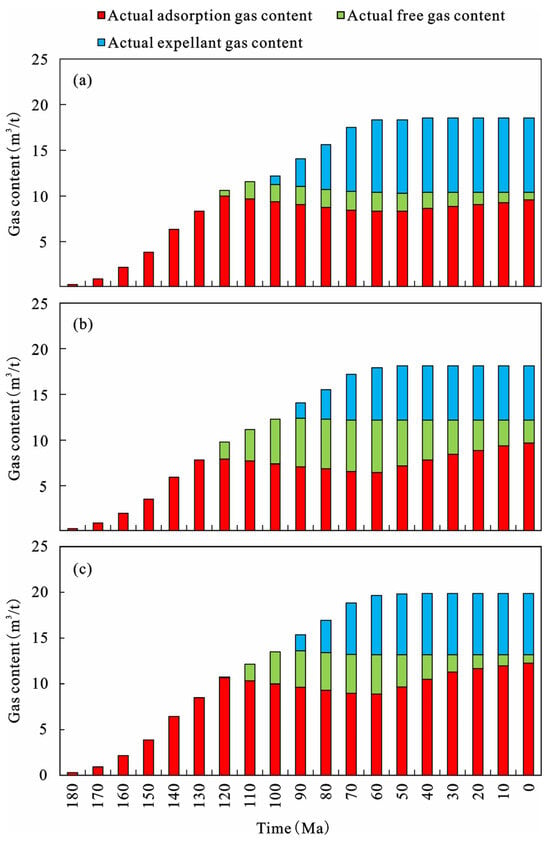
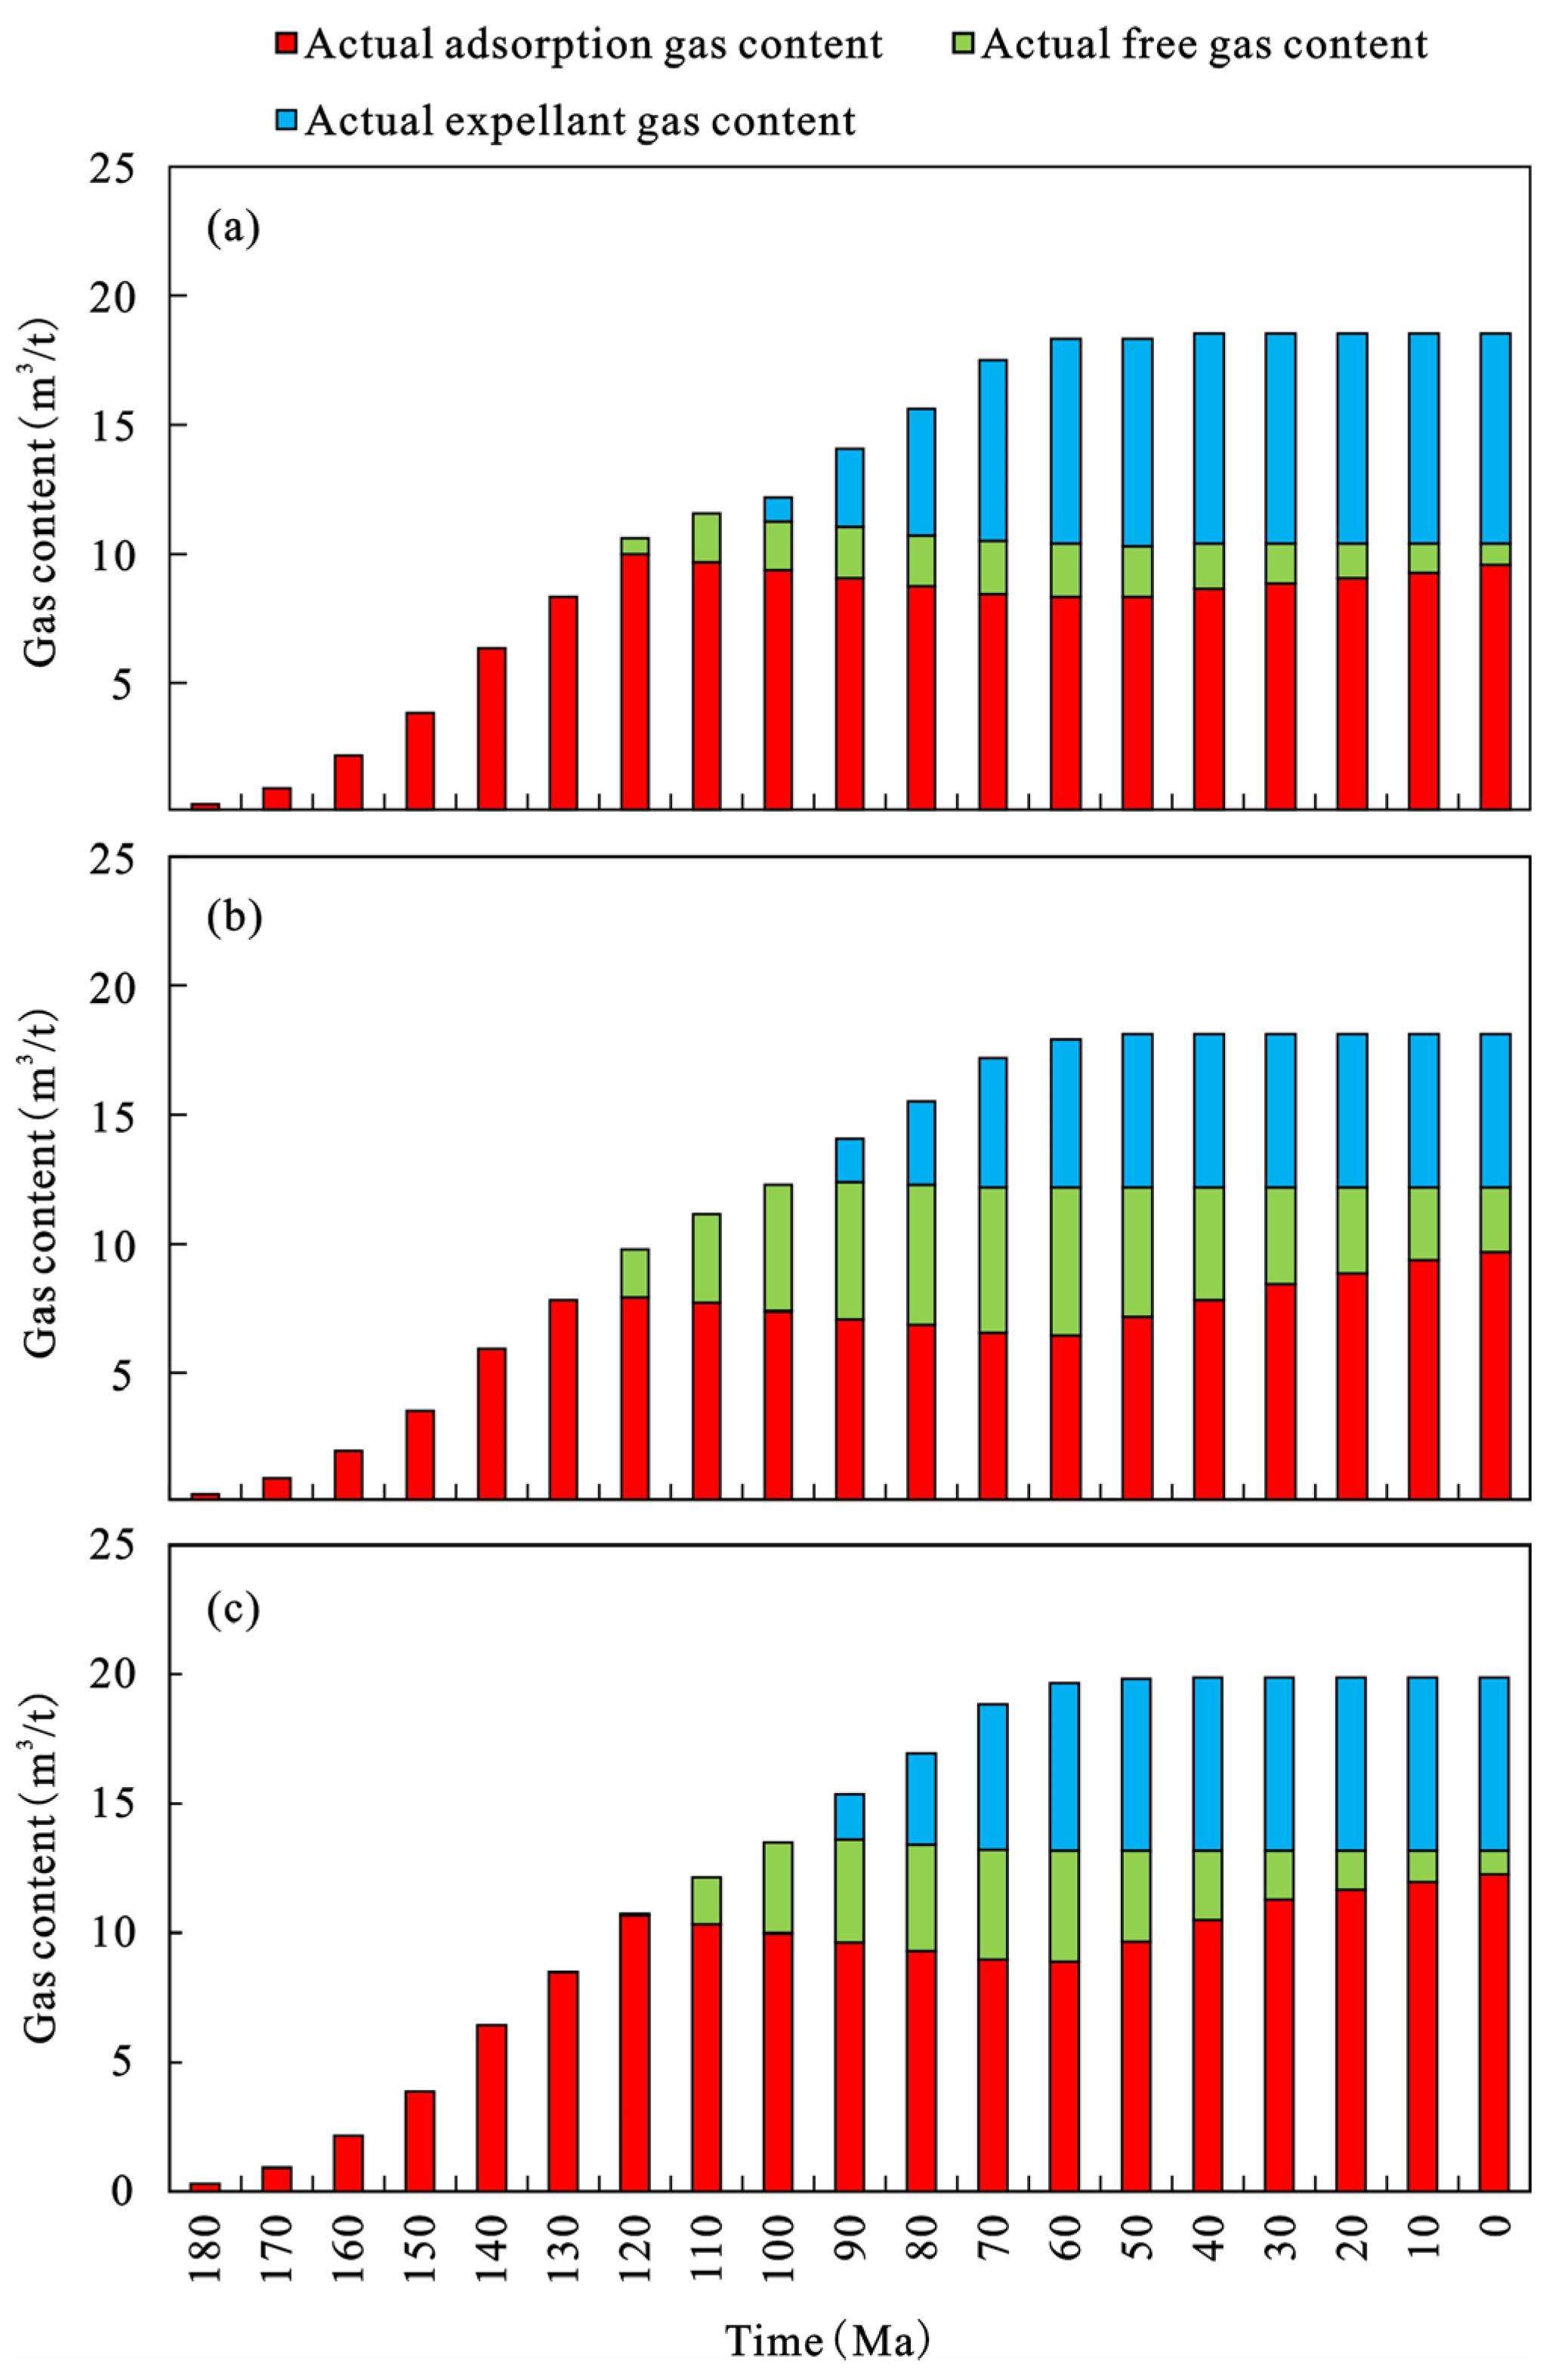
The actual CBM content is closely related to the relative magnitude of hydrocarbon generation capacity and storage capacity, which can be divided into two cases (Figure 15):
Figure 15.
Evolution process of CBM occurrence state at Wells FK18, FK24, and FK26. (a) Evolution process of CBM occurrence state in Well FK18. (b) Evolution process of CBM occurrence state in Well FK24; (c) Evolution process of CBM occurrence state in Well FK26.
① When the gas generation amount is less than the total storage capacity, the actual gas content equals the gas generation amount. If the gas generation amount is less than the adsorbed gas storage capacity, all gas occurs in adsorbed state. If the gas generation amount is greater than the adsorbed gas storage capacity, adsorbed gas is saturated, and the remaining gas occurs in free state.
② When the gas generation amount is greater than the total storage capacity, the actual gas content equals the total storage capacity, and excess gas is expelled and migrated outward.
Combined with the hydrocarbon generation history and storage capacity evolution history, the evolution process of actual gas content and occurrence state of the No. 42 coal seam at three wells (FK18, FK24, FK26) in the study area is reconstructed (Figure 15). The evolution laws of CBM occurrence state at the three wells are generally consistent, highly coupled with the regional burial–thermal evolution process, and can be divided into four stages:
① Pure adsorption stage (Early Jurassic—Early Cretaceous). In this stage, the thermal evolution degree of coal was low, the gas generation amount was limited, and the coal adsorption storage capacity was strong. The gas generation amount was always less than the adsorbed gas storage capacity, and all generated gas occurred in the coal seam in adsorbed state. There was no free gas or expelled gas, and the proportion of adsorbed gas reached 100%. With gradual stratigraphic burial, the hydrocarbon generation intensity increased slowly, and the adsorbed gas content of all three wells continued to increase over geological time. By the early Early Cretaceous, the adsorbed gas content of each well reached 8.0–8.5 m3/t.
② Free gas occurrence stage (Early Cretaceous, ~120 Ma). With continuous stratigraphic burial, the thermal evolution degree of coal deepened, hydrocarbon generation continued to intensify, and gas generation amount increased continuously. Meanwhile, rising geothermal temperature led to a gradual decrease in adsorbed gas storage capacity. By the middle Early Cretaceous (~120 Ma), the gas generation amounts of the three wells successively exceeded the adsorbed gas storage capacity. Gas beyond the adsorption capacity occurred in coal pores in free state, and free gas appeared for the first time in the formation. CBM occurrence entered the coexistence stage of adsorption and free state.
③ Excessive gas expulsion stage (Middle Cretaceous—Late Cretaceous, ~100 Ma—60 Ma). After entering the Middle Cretaceous, hydrocarbon generation further intensified, and the gas generation amount exceeded the total storage capacity of adsorbed and free gas for the first time. The coal storage space became saturated, and the coal seam began to expel gas outward as source rock, entering the excessive gas expulsion stage. At the maximum burial period of the Late Cretaceous (~60 Ma), the proportions of free gas and expelled gas both reached evolutionary peaks: free gas and adsorbed gas accounted for 19.0% and 37.8% in Well FK18, 44.7% and 22.5% in Well FK24, and 32.8% and 34.0% in Well FK26, respectively.
④ Uplift adjustment stage (Paleogene–Present). Since the end of the Late Cretaceous, continuous stratigraphic uplift and denudation have led to a gradual decrease in geothermal temperature, a gradual cessation of hydrocarbon generation, and no increase in total gas generation. Although the coal storage capacity gradually recovered with stratigraphic uplift, there was no new gas source supplement, and the gas expulsion amount remained at the peak level unchanged. In terms of occurrence state, with decreasing temperature, coal adsorption capacity gradually recovered, the model suggests that part of the free gas may have retransformed into the adsorbed state, the proportion of free gas continued to decrease, and the proportion of adsorbed gas increased accordingly. The total gas content in the coal seam remained at the level of the maximum burial period.
At present, the proportion of free gas drops to 6.7% and adsorbed gas accounts for 50.1% in Well FK18; free gas accounts for 20.3% and adsorbed gas accounts for 46.9% in Well FK24; and free gas accounts for 6.1% and adsorbed gas accounts for 60.7% in Well FK26.
The gas content results obtained by three different methods are as follows: the average measured gas content from core desorption experiments is 11.7 m3/t, the maximum predicted gas content from the profile model is 13.5 m3/t, and the current gas content restored by basin simulation is 12.9 m3/t. The maximum relative difference among the three sets of data is only 13%. It should be noted that these three estimates are not strictly independent: the profile model is calibrated on the same seven adsorption/desorption samples, and the basin simulation is constrained by measured Ro from the same wells. The 13% maximum spread therefore reflects internal consistency among complementary approaches rather than true independent validation. Considering the influences of desorption loss of core samples under surface conditions, experimental test errors, the simplification of model parameters, and the heterogeneity of geological conditions, the three show reasonable internal consistency, which provides mutual support for the order-of-magnitude gas content estimates, although independent validation with new drilling data remains desirable, The evolution of CBM occurrence states at Wells FK18, FK24, and FK26 is shown in Figure 15.
7. Conclusions
Taking the No. 42 coal seam in the Fukang mining area of the Junggar Basin as the research object, this study identifies the methane adsorption characteristics of coal and their main controlling factors, establishes a multi-factor coupled CBM content prediction model, and reconstructs the CBM accumulation evolution process over geological time through a combination of laboratory experiments, model construction, and numerical simulation. The adsorption capacity of low-rank coal seams in the study area is jointly controlled by coal composition and temperature–pressure conditions. The average equilibrium moisture-based Langmuir volume is 22.36 m3/t. Adsorption capacity is significantly positively correlated with fixed carbon content, while moisture and ash exert negative effects. Pressure dominates the positive adsorption effect in the low-temperature interval (<60 °C), while temperature dominates the negative adsorption effect in the high-temperature and high-pressure interval (>60 °C).
Furthermore, the total CBM content first increases and then decreases with depth, reaching a peak of 12.56 m3/t at 900 m. Shallow CBM is dominated by adsorbed gas, and free gas accounts for a larger proportion than adsorbed gas at 3600 m depth. The plane distribution of gas content in the study area shows characteristics of low in the north and high in the south, and low in the east and high in the west. The central-southern main area, with a gas content of 11–13 m3/t, is a favorable exploration target.
In addition, the CBM accumulation evolution in the study area comprises four stages: pure adsorption occurrence, free gas occurrence, excessive gas expulsion, and uplift adjustment. Free gas began to appear in the Early Cretaceous, and the proportions of free gas and expelled gas reached peaks during the maximum burial period of the Late Cretaceous. Since the Paleogene, stratigraphic uplift has ceased hydrocarbon generation, and the occurrence state has gradually transformed toward the adsorbed state. The re-adsorption during uplift is a model-inferred process; isotopic or petrographic validation is needed in future work.
However, this study is limited by a small sample set (seven adsorption samples, three wells for basin simulation and contour mapping). The high R2 (0.9889) between Langmuir volume and gas content reflects a strong trend but is based on only six data points; the temperature–pressure coupling thresholds are derived from a single representative sample (42-5); the regional contour map is constrained by three well locations; and the gas content predictions below ~2000 m depth represent extrapolations beyond the experimental calibration range (22 MPa, 90 °C). The accumulation evolution reconstruction is most robust at Well FK24; results for FK18 and FK26 are first-order estimates extrapolated along the monocline. Expanded sampling, multi-sample variable-temperature experiments, high-pressure/high-temperature adsorption tests, and additional drilling are needed for statistically robust model validation and refined resource assessment.
Looking forward, the integrated research method of “experimental determination–model prediction–evolution simulation” established in this paper realizes cross-validation of CBM content through multiple methods, and can provide a methodological reference for deep low-rank CBM resource evaluation and accumulation research, particularly as a regional case study for the southern Junggar Basin and analogous low-rank CBM systems.
Author Contributions
Conceptualization, X.D.; methodology, X.D.; software, G.W.; validation, Z.L.; formal analysis, G.W.; investigation, G.W.; resources, K.W.; data curation, K.W.; writing—original draft preparation, X.D.; writing—review and editing, H.Z.; visualization, H.Z.; supervision, G.W.; project administration, K.W.; funding acquisition, K.W. All authors have read and agreed to the published version of the manuscript.
Funding
This work is supported by Science and Technology Program of Xinjiang Uyghur Autonomous Region (2024A01010-1).
Data Availability Statement
The data presented in this study are available on request from the corresponding author. (Part of the geological parameters and field measurement data involved in this research are subject to the internal data confidentiality regulations of the affiliated oilfield institutions, and therefore cannot be deposited in a fully public repository at this stage. For the purpose of academic verification and non-commercial scientific research, the full dataset supporting the conclusions of this paper can be obtained upon reasonable request).
Conflicts of Interest
Author Xinlu Ding was employed by the company CNPC Xibu Drilling Engineering Co. Author Guozhen Wang was employed by the company PetroChina Xinjiang Oilfield Company. Author ZeLiang Liang was employed by the company Xinjiang Yaxin CBM investment and development (Group) Co. The remaining authors declare that the research was conducted in the absence of any commercial or financial relationships that could be construed as a potential conflict of interest.
Abbreviations
| List of symbols | |
| n | Molar amount of methane, mol |
| P | Formation pressure, MPa |
| PL | Langmuir pressure, MPa |
| PS | Standard surface pressure, MPa |
| R | Ideal gas constant, J/(mol·K) |
| RO | Vitrinite reflectance, % |
| Sw | Volume fraction of pore water, % |
| T | Formation temperature, °C/K |
| TS | Standard surface temperature, K |
| VL | Langmuir volume, m3/t |
| Vf | Free gas content, m3/t |
| Va | Adsorbed gas content, m3/t |
| Vs | Gas volume under standard surface conditions, m3 |
| ωF | Mass fraction of fixed carbon, % |
| ωw | Moisture content of coal, % |
| Z | Compressibility factor of methane, Dimensionless |
| ρc | Coal density, t/m3 |
| ρw | Formation water density, t/m3 |
| Φ | Coal porosity, % |
References
- Debossam, J.G.S.; de Freitas, M.M.; de Souza, G.; Amaral Souto, H.P.; Pires, A.P. Numerical Simulation of Non-Darcy Flow in Naturally Fractured Tight Gas Reservoirs for Enhanced Gas Recovery. Gases 2024, 4, 253–272. [Google Scholar] [CrossRef] [Scilit]
- Li, Y.; Fu, X.; Yang, X.; Ge, Y.; Quan, F. Coalbed methane accumulation and dissipation patterns: A Case study of the Junggar Basin, NW China. J. Asian Earth Sci. 2018, 163, 70–82. [Google Scholar] [CrossRef] [Scilit]
- Ge, L.; Liu, S.; Cai, Y.; Wang, Y. Gas Content Evaluation of Coalbed Methane Reservoir in the Fukang Area of Southern Junggar Basin, Northwest China by Multiple Geophysical Logging Methods. Energies 2018, 11, 1867. [Google Scholar] [CrossRef] [Scilit]
- Tang, Y.; Yao, W.; Wang, M.; Pi, D.; Wang, G.; Xiang, J.; Cheng, M. Enrichment factors and strategic target areas of medium- to low-rank coal-rock gas/coalbed methane in Xinjiang, China. Pet. Explor. Dev. 2026, 53, 723–740. [Google Scholar] [CrossRef] [Scilit]
- Wang, Q.; Ren, P.; Xu, H.; Tang, D.; Liang, H. Study on the enrichment mechanism of low to medium rank coalbed gas (CBG) from multiple sources and complex components. Fuel 2024, 364, 131129. [Google Scholar] [CrossRef] [Scilit]
- Li, C.; Yang, Z.; Yan, X.; Wang, G.; Huang, D.; Lu, B.; Zhang, B.; Feng, S.; Wang, J.; Liu, C.; et al. Dynamic distribution patterns and release behavior of adsorbed gas/free gas during deep coalbed methane production. Fuel 2026, 407, 137310. [Google Scholar] [CrossRef] [Scilit]
- Kedzior, S. The occurrence of coalbed methane in the depocentre of the Upper Silesian Coal Basin in the light of the research from the Orzesze-1 deep exploratory well. Int. J. Coal Geol. 2024, 292, 104588. [Google Scholar] [CrossRef] [Scilit]
- Salmachi, A.; Rajabi, M.; Wainman, C.; Mackie, S.; McCabe, P.; Camac, B.; Clarkson, C. History, Geology, In Situ Stress Pattern, Gas Content and Permeability of Coal Seam Gas Basins in Australia: A Review. Energies 2021, 14, 2651. [Google Scholar] [CrossRef] [Scilit]
- Ayers, W.B. Coalbed gas systems, resources, and production and a review of contrasting cases from the San Juan and Powder River basins. AAPG Bull. 2002, 86, 1853–1890. [Google Scholar] [CrossRef] [Scilit]
- Guo, Q.; Chen, Y.; Huang, Y.; Ba, J. Seismic rock-physics inversion for petrophysical parameters in deep coalbed methane reservoirs with complex pore structures. J. Appl. Geophys. 2026, 251, 106338. [Google Scholar] [CrossRef] [Scilit]
- Sun, F.; Liu, D.; Cai, Y.; Qiu, Y. Coal rank-pressure coupling control mechanism on gas adsorption/desorption in coalbed methane reservoirs. Energy 2023, 270, 126849. [Google Scholar] [CrossRef] [Scilit]
- Kalkreuth, W.; Levandowski, J.; Weniger, P.; Krooss, B.; Prissang, R.; Rosa, A.L.D. Coal characterization and coalbed methane potential of the Chico-Loma Coalfield, Parana Basin, Brazil—Results from exploration borehole CBM001-CL-RS. Energy Explor. Exploit. 2020, 38, 1589–1630. [Google Scholar] [CrossRef] [Scilit]
- Busch, A.; Han, F.; Magill, C.R. Paleofloral dependence of coal methane sorption capacity. Int. J. Coal Geol. 2019, 211, 103232. [Google Scholar] [CrossRef] [Scilit]
- Kalkreuth, W.; Holz, M.; Levandowski, J.; Kern, M.; Casagrande, J.; Weniger, P.; Krooss, B. The coalbed methane (CBM) potential and CO2 storage capacity of the Santa Terezinha Coalfield, Parana Basin, Brazil-3D modelling, and coal and carbonaceous shale characteristics and related desorption and adsorption capacities in samples from exploration borehole CBM001-ST-RS. Energy Explor. Exploit. 2013, 31, 485–527. [Google Scholar] [CrossRef] [Scilit]
- Chen, X.; Tao, M.; Zhou, Z.; Holland, G.; Wang, Y. Geological control on carbon isotope equilibrium and kinetic fractionation of CH4-CO2-HCO3− in microbial coalbed and shale gas systems. Chem. Geol. 2023, 635, 121609. [Google Scholar] [CrossRef] [Scilit]
- Yang, W.; Yao, Y.; Feng, D.; Sun, X.; Wang, Z.; Duan, S. Nanoconfinement effects on adsorbed and free methane densities: Revisiting coalbed methane content evaluation. Fuel 2027, 427, 139801. [Google Scholar] [CrossRef] [Scilit]
- Asif, M.; Ojha, K.; Panigrahi, D.C.; Suorineni, F. Application of ANN-based prediction insights into the stable isotope geochemistry of the clean energy coalbed gas. J. Clean. Prod. 2025, 501, 145308. [Google Scholar] [CrossRef] [Scilit]
- Abrar, S.W.; Mendhe, V.A.; Kamble, A.D.; Shukla, P.; Sharma, P.; Buragohain, J.; Kumari, S.; Kumari, S.; Das, A.K.; Kumari, M.; et al. Cleat and Fracture Systems in Coal with Implications for Strength, Hydrofracking, and Gas-Water Flow Mechanisms: A Critical Review. ACS Omega 2025, 10, 29909–29928. [Google Scholar] [CrossRef] [Scilit] [PubMed]
- Hou, X.; Liu, S.; Zhu, Y.; Yang, Y. Evaluation of gas contents for a multi-seam deep coalbed methane reservoir and their geological controls: In situ direct method versus indirect method. Fuel 2020, 265, 116917. [Google Scholar] [CrossRef] [Scilit]
- Liu, A.; Fu, X.; Wang, K.; An, H.; Wang, G. Investigation of coalbed methane potential in low-rank coal reservoirs—Free and soluble gas contents. Fuel 2013, 112, 14–22. [Google Scholar] [CrossRef] [Scilit]
- Xu, H.; Qin, Y.; Yang, D.; Wang, G.; Huang, Q.; Zhang, F. Experimental investigation of gas diffusion kinetics and pore-structure characteristics during coalbed methane desorption within a coal seam. Gas Sci. Eng. 2024, 121, 205173. [Google Scholar] [CrossRef] [Scilit]
- Durucan, S.; Ahsan, M.; Syed, A.; Shi, J.-Q.; Korre, A. Two Phase Relative Permeability of Gas and Water in Coal for Enhanced Coalbed Methane Recovery and CO2 Storage. Energy Procedia 2013, 37, 6730–6737. [Google Scholar] [CrossRef] [Scilit]
- McLaughlin, J.F.; Frost, C.D.; Sharma, S. Geochemical analysis of Atlantic Rim water, Carbon County, Wyoming: New applications for characterizing coalbed natural gas reservoirs. AAPG Bull. 2011, 95, 191–217. [Google Scholar] [CrossRef] [Scilit]
- Ojha, S.; Punjrath, N.K.; Chakraborty, A.; Singh, P.K. Evolution and Evaluation of Coal-bed Methane in Cambay Basin, Western India: Insights from Stable Isotopic and Molecular Composition. J. Geol. Soc. India 2023, 99, 193–204. [Google Scholar] [CrossRef] [Scilit]
- Liu, B.; Chang, S.; Zhang, S.; Chen, Q.; Zhang, J.; Li, Y.; Liu, J. Coalbed methane gas content and its geological controls: Research based on seismic-geological integrated method. J. Nat. Gas Sci. Eng. 2022, 101, 104510. [Google Scholar] [CrossRef] [Scilit]
- Furmann, A.; Schimmelmann, A.; Brassell, S.C.; Mastalerz, M.; Picardal, F. Chemical compound classes supporting microbial methanogenesis in coal. Chem. Geol. 2013, 339, 226–241. [Google Scholar] [CrossRef] [Scilit]
- Gentzis, T. Coalbed methane potential of the Paleocene Fort Union coals in south-central Wyoming, USA. Int. J. Coal Geol. 2013, 108, 27–34. [Google Scholar] [CrossRef] [Scilit]
- Hosgoermez, H. Origin and secondary alteration of coalbed and adjacent rock gases in the Zonguldak Basin, western Black Sea Turkey. Geochem. J. 2007, 41, 201–211. [Google Scholar] [CrossRef] [Scilit][Green Version]
- Bezyk, Y.; Szurgacz, D.; Gorka, M.; Strapoc, D.; Kruszewski, L.; Wachniew, P.; Ecki, J.N.; Zimnoch, M.; Sowka, I.; Modelska, M.; et al. Isotope and chemical alteration of coalbed gases during migration from underground coal mine into the atmosphere. Int. J. Coal Geol. 2026, 313, 104922. [Google Scholar] [CrossRef] [Scilit]
- Bezyk, Y.; Szurgacz, D.; Strapoc, D.; Misz-Kennan, M.; Fabianska, M.J.; Szram, E.; Kruszewski, L.; Zimnoch, M.; Necki, J.; Sowka, I.; et al. Understanding coalbed gas distribution from longwall mining: Geochemical and isotopic approach. Int. J. Coal Geol. 2025, 309, 104859. [Google Scholar] [CrossRef] [Scilit]
- Yang, X.; Tang, S.; Xi, Z.; Zhang, S.; Zhang, Q.; Zhang, K.; Lin, D.; Wang, J. Dynamic evolution and differential enrichment of deep coalbed methane: A case study in Qinshui Basin. Int. J. Coal Geol. 2025, 299, 104696. [Google Scholar] [CrossRef] [Scilit]
- Zhang, Z.; Chen, B.; Liu, Y.; Xu, Z.; Stuart, F.M.; Xu, S. Reconstructing coalbed methane accumulation history in the Qinshui Basin using noble gas isotopes. Appl. Geochem. 2025, 195, 106629. [Google Scholar] [CrossRef] [Scilit]
- Kang, J.; Fu, X.; Gao, L.; Liang, S. Production profile characteristics of large dip angle coal reservoir and its impact on coalbed methane production: A case study on the Fukang west block, southern Junggar Basin, China. J. Pet. Sci. Eng. 2018, 171, 99–114. [Google Scholar] [CrossRef] [Scilit]
- Chen, Z.; Dong, K.; Yao, W.; Hu, X.; Jin, X.; Ou, X. Multiscale pore structure and coalbed methane in the Jurassic deep coal seams of Southern Junggar Basin, China. J. Asian Earth Sci. 2026, 299, 106955. [Google Scholar] [CrossRef] [Scilit]
- Fu, H.; Wu, H.; Li, Y.; Xu, F.; Su, X.; Yan, D.; Wang, G.; Wang, Y.; Yang, S.; Liu, M.; et al. Microbial methanogenesis in deep coal seams: Geochemical and microbiological evidence from the Fukang Block, Southern Junggar Basin, NW China. Int. J. Coal Geol. 2026, 322, 105039. [Google Scholar] [CrossRef] [Scilit]
- Xiang, J.; Li, J.; Li, X.; Ma, X.; Sun, J.; Zou, Z.; Qin, Y. Isotopic and hydrochemical evidence for the origins of unconventional gases in the Middle and Lower Jurassic coal measures in the Fukang area of Junggar Basin, NW China. Int. J. Coal Geol. 2025, 302, 104726. [Google Scholar] [CrossRef] [Scilit]
- Shi, W.; Ru, Z.; Zhao, B.; Lu, G. The control effect of the pore and fracture characteristics of tectonic coal assisted by the triaxial stress permeability system on permeability. J. Pet. Explor. Prod. Technol. 2025, 15, 87. [Google Scholar] [CrossRef] [Scilit]
- Long, Q.; Hu, Q.; Zhang, Z.; Ren, T. On factors affecting coalbed gas content measurement. Measurement 2018, 121, 47–56. [Google Scholar] [CrossRef] [Scilit]
- GB/T 19560-2008; Experimental Method of High-Pressure Isothermal Adsorption to Coal. China National Standardization Administration Committee: Beijing, China, 2008.
- Guo, P.; Tang, X.; Wen, L.; Wu, B.; Luo, F.; Liu, Y. Geological characteristics and coalbed methane adsorbability of shallow coal rock in Qinshui Basin, China. J. Pet. Explor. Prod. Technol. 2024, 14, 2901–2912. [Google Scholar] [CrossRef] [Scilit]
- Wei, Q.; Hu, B.; Li, X.; Feng, S.; Xu, H.; Zheng, K.; Liu, H. Implications of geological conditions on gas content and geochemistry of deep coalbed methane reservoirs from the Panji Deep Area in the Huainan Coalfield, China. J. Nat. Gas Sci. Eng. 2021, 85, 103712. [Google Scholar] [CrossRef] [Scilit]

Disclaimer/Publisher’s Note: The statements, opinions and data contained in all publications are solely those of the individual author(s) and contributor(s) and not of MDPI and/or the editor(s). MDPI and/or the editor(s) disclaim responsibility for any injury to people or property resulting from any ideas, methods, instructions or products referred to in the content. |
© 2026 by the authors. Licensee MDPI, Basel, Switzerland. This article is an open access article distributed under the terms and conditions of the Creative Commons Attribution (CC BY) license.