


Abstract
Selecting three-way catalysts (TWCs) solely from precious-metal loading or a single light-off metric may not reflect the broad operating domain encountered by plug-in hybrid electric vehicles (PHEVs). This study linked bench-scale conversion characteristics of three aged, Pt-free Pd-Rh formulations to cycle-level emissions. The formulations represented a low-loading baseline (TWC-1), a proportional increase in Pd and Rh (TWC-2), and a higher-loading Pd-rich strategy (TWC-3). Light-off, temperature–space-velocity, and λ-sweep data were incorporated into coupled vehicle, engine-out emission, catalyst thermal, and aftertreatment models for Worldwide Harmonized Light Vehicle Test Cycle (WLTC) and Real-driving Emission (RDE) evaluation. The formulation ranking varied with the test boundary. At 30,000 h−1, TWC-3 exhibited the lowest CO light-off temperatures, whereas TWC-2 achieved the lowest T50 values for C3H6 and NO. At 50,000 h−1 with its corresponding inlet composition, TWC-2 produced the lowest T50 and T90 values for all three species. Across the broader operating domain, TWC-1 deteriorated most when lower temperature coincided with higher space velocity, while the higher-loading Pd-rich strategy provided no consistent advantage for C3H6 or NO conversion. The WLTC emphasized light-off and intermediate-temperature activity, whereas the predominantly hot RDE profile included space velocities above 200,000 h−1. Relative to TWC-3, TWC-2 reduced predicted TWC-out CO and NOx emissions by 10.0% and 4.1% over the WLTC and by 36.4% and 18.8% over the RDE profile, respectively, while producing the lowest cycle-integrated THC emissions. These results demonstrate that the highest precious-metal loading does not necessarily provide the best cycle-level emission control. Linking formulation-specific conversion characteristics with cycle-dependent operating-domain distributions provides a more representative basis for TWC selection than a single light-off metric.
1. Introduction
Plug-in hybrid electric vehicles (PHEVs) represent an important transitional technology in transport electrification. By combining electric propulsion, regenerative braking, and efficient engine operation, PHEVs can reduce fuel consumption and CO2 emissions under suitable operating conditions. Nevertheless, they retain an internal combustion engine, which may be activated during cold start, engine restart, rapid acceleration, high-load operation, or when the battery state of charge is low. These events can generate substantial instantaneous emissions of carbon monoxide (CO), total hydrocarbons (THC), and nitrogen oxides (NOx), particularly before the exhaust aftertreatment system reaches its effective operating temperature. PHEVs should therefore not be regarded simply as vehicles with inherently low or zero tailpipe emissions [1,2,3].
This issue is becoming increasingly important as light-duty vehicle regulations extend beyond laboratory-cycle limits to include real-driving emissions, broader operating boundaries, durability, and in-use compliance. The Euro 7 regulation and the China 6 real-driving emission (RDE) requirements place greater emphasis on emission control under actual driving conditions [4,5,6]. Compared with standardized laboratory cycles, real-world operation produces wider and more transient variations in exhaust temperature, flow rate, and excess air ratio, λ. PHEV aftertreatment systems must therefore maintain high conversion efficiency not only during the initial cold start, but also during repeated engine activation, high exhaust flow, and deviations from stoichiometric operation.
Previous PHEV studies have mainly clarified how vehicle operation affects overall emission behavior. Ehrenberger et al. [7] found that pollutant emissions did not decrease proportionally with increasing electric-driving share, while Feinauer et al. [8] reported elevated emissions during urban cold starts, engine restarts, and high-speed transients. Studies comparing laboratory and on-road operation further demonstrated that standardized cycles cannot fully reproduce real-world emissions and that acceleration, road load, and driving dynamics can strongly affect NOx emissions [9,10,11,12,13]. These findings establish that PHEV emissions are governed by the interaction among engine activation, driving dynamics, catalyst thermal state, and exhaust conditions. However, they do not explain how different catalyst formulations respond to these transient operating boundaries.
A second group of studies has focused on modeling the dynamic response of three-way catalysts (TWCs). Brandt et al. [14] developed a control-oriented TWC model based on air–fuel ratio, exhaust flow, and catalyst temperature. More detailed models subsequently coupled pollutant conversion with axial and radial temperature distributions to improve cold-start emission prediction [15]. For hybrid powertrains, Endo et al. [16] modeled TWC conversion during warm-up and repeated engine start–stop operation, while Okajima et al. [17,18] investigated the effects of intermittent engine operation, lean-rich transitions, and changes in the chemical state of Rh. These studies demonstrate that controlled catalyst experiments and transient vehicle data can be integrated to predict TWC thermal and emission responses. Nevertheless, most models have been developed for a single catalyst formulation and have mainly addressed cold-start prediction or control optimization. They have rarely been used to determine whether the relative performance of different formulations changes across the operating domain of a complete driving cycle.
A third research direction concerns the effects of precious-metal formulation on catalytic activity. Kang et al. [19] reported a nonlinear relationship between Pd loading and CO and hydrocarbon oxidation, indicating that increasing Pd content does not necessarily produce a proportional increase in activity. Rh is particularly important for NOx reduction and affects both reaction rate and product selectivity [20]. Comparisons of Rh-only, Pd-only, and Pd/Rh catalysts have also shown that different precious-metal combinations provide distinct capabilities for controlling CO, hydrocarbons, and NOx [21]. Moreover, interactions between Pd and Rh, including their spatial distribution and influence on metal agglomeration, affect the effective utilization of both components [22]. Recent studies further indicate that the effects of Pd/Rh formulation can evolve during catalyst aging. High-temperature exposure can alter precious-metal dispersion, oxidation state, metal–support interactions, and active-site accessibility. Moreover, Pd and Rh do not necessarily exhibit identical thermal-deactivation behavior. Pd deactivation under severe thermal exposure is frequently associated with particle sintering and loss of dispersion, whereas Rh can additionally undergo changes in metal–support interactions and active-site accessibility [23,24,25]. These findings indicate that the post-aging performance of a Pd-Rh TWC depends not only on the nominal precious-metal loading and Pd/Rh ratio, but also on the stability and accessibility of the corresponding active sites after thermal aging.
The influence of formulation is further coupled with catalyst operating conditions. Simultaneous conversion of CO, THC, and NOx occurs within a narrow λ window near the stoichiometric air–fuel ratio. CO and THC oxidation is restricted by oxygen availability under rich conditions, whereas NOx reduction deteriorates under lean conditions. Wang et al. [26] showed that the transient response of Pd/Rh catalysts during lean-to-rich transitions depends on λ, exhaust temperature, catalyst state, and the duration of rich operation. At high space velocities, reduced gas residence time can further amplify these effects. Existing formulation studies, however, have generally relied on light-off performance or a limited number of steady-state conditions. Consequently, they do not establish whether a formulation advantage measured at an isolated condition is retained when temperature, space velocity, and λ vary concurrently during vehicle operation.
The unresolved issue is therefore not whether catalyst temperature, GHSV, λ, or precious-metal formulation affects conversion when considered separately, but whether a formulation ranking obtained at one bench condition remains valid across the operating domain occupied during a complete vehicle cycle. This question is particularly relevant to PHEVs, for which cold engine activation and hot high-flow operation may occur within the same trip. Previous vehicle studies have identified these operating boundaries, while formulation studies have established condition-dependent catalytic activity; however, the two have rarely been connected in a common evaluation framework.
The present study tests the hypothesis that single-condition light-off rankings and total precious-metal loading are insufficient predictors of cycle-level emission performance. Three aged, Pt-free Pd-Rh TWC formulations were evaluated: a low-loading baseline, a formulation with proportionally increased Pd and Rh, and a higher-loading Pd-rich formulation. Bench-scale light-off, temperature–GHSV, and λ-sweep data were used to construct formulation-specific conversion datasets. These datasets were then coupled with common vehicle, engine-out emission, catalyst thermal, and downstream cGPF models to predict emissions over the WLTC and a representative RDE profile.
The principal novelty of this study is the establishment of an operating-domain-based framework that connects formulation-specific bench measurements with the temperature, GHSV, and λ distributions encountered during complete vehicle cycles. This framework enables catalyst formulations to be compared according to the operating regions that actually govern emission breakthrough, rather than according to nominal precious-metal loading or a single light-off temperature. It also enables changes in formulation ranking between the WLTC and RDE profile to be interpreted from their different thermal, flow, and redox distributions. The study therefore provides both a formulation-selection result for the investigated PHEV application and a transferable methodology for cycle-relevant catalyst screening.
2. Experimental and Modeling Methods
An integrated experimental-simulation procedure was developed to link the formulation-dependent conversion characteristics of Pd-Rh three-way catalysts (TWCs) to their cycle-level emission performance. Three catalyst formulations were first characterized using controlled synthetic-gas tests covering light-off, temperature–space-velocity, and excess-air-ratio (λ) operating domains. The experimentally determined conversion characteristics were then incorporated into a coupled vehicle, engine-out emission, catalyst thermal, and aftertreatment model. This procedure enabled the relative performance of the three formulations to be evaluated under the distinct operating-boundary distributions of the worldwide harmonized light vehicle test cycle (WLTC) and a representative real-driving emission (RDE) profile.
2.1. Study Design and Evaluation Procedure
This study combined bench-scale catalyst characterization with cycle-level emission simulation. First, light-off, temperature–space-velocity, and λ-sweep tests were conducted to characterize the formulation-dependent conversion of CO, C3H6, and NO under the tested operating conditions. Second, the experimentally determined conversion characteristics were incorporated into a coupled vehicle, engine-out emission, catalyst thermal, and aftertreatment model. Finally, the three formulations were evaluated over the WLTC and a representative RDE profile using identical vehicle, engine, control, substrate, and downstream cGPF parameters. This procedure allowed differences in cycle-level emissions to be related to the experimentally measured conversion characteristics of the three TWC formulations.
2.2. Catalyst Formulations
Three Pt-free Pd-Rh TWC formulations, denoted TWC-1, TWC-2, and TWC-3, were investigated. Identical substrate dimensions, cell density, wall thickness, and aftertreatment arrangement were used to minimize differences in geometric surface area, gas residence time, and thermal inertia. Their precious-metal compositions are summarized in Table 1.
Table 1.
Precious-metal compositions of the investigated TWC configurations.
TWC-1 was used as the low-loading baseline. TWC-2 contained proportionally higher Pd and Rh loadings while maintaining a Pd/Rh mass ratio similar to that of TWC-1. Their comparison therefore primarily reflects the effect of increasing total precious-metal loading at an approximately constant Pd/Rh ratio. TWC-3 had the highest total loading but adopted a more Pd-rich composition: its Pd loading was higher than that of TWC-2, whereas its Rh loading was slightly lower.
It should be emphasized that the present formulation matrix was not designed as an orthogonal experiment in which total PGM (Platinum Group Metal) loading, Pd loading, Rh loading, and Pd/Rh ratio were varied independently. In particular, the comparison between TWC-2 and TWC-3 simultaneously involves changes in total PGM loading, absolute Pd and Rh contents, and Pd/Rh ratio. Consequently, differences between these formulations cannot be uniquely attributed to the isolated effect of Pd loading, Rh loading, or Pd/Rh ratio. Instead, TWC-2 and TWC-3 represent two practical formulation strategies. Their comparison was used to determine whether allocating additional precious-metal loading predominantly to Pd improved the overall CO-THC-NOx conversion balance under cycle-relevant operating conditions. Accordingly, interpretations concerning the roles of Pd and Rh are considered mechanistically consistent with their established catalytic functions rather than as an independent quantitative determination of the effect of either metal.
The dimensions reported in Table 1 refer to the full-size catalyst bricks. Cylindrical cores were extracted from the corresponding bricks for the synthetic-gas reactor tests described below.
2.3. Catalyst Test System and Experimental Procedures
2.3.1. Test System, Catalyst Samples, and Data Processing
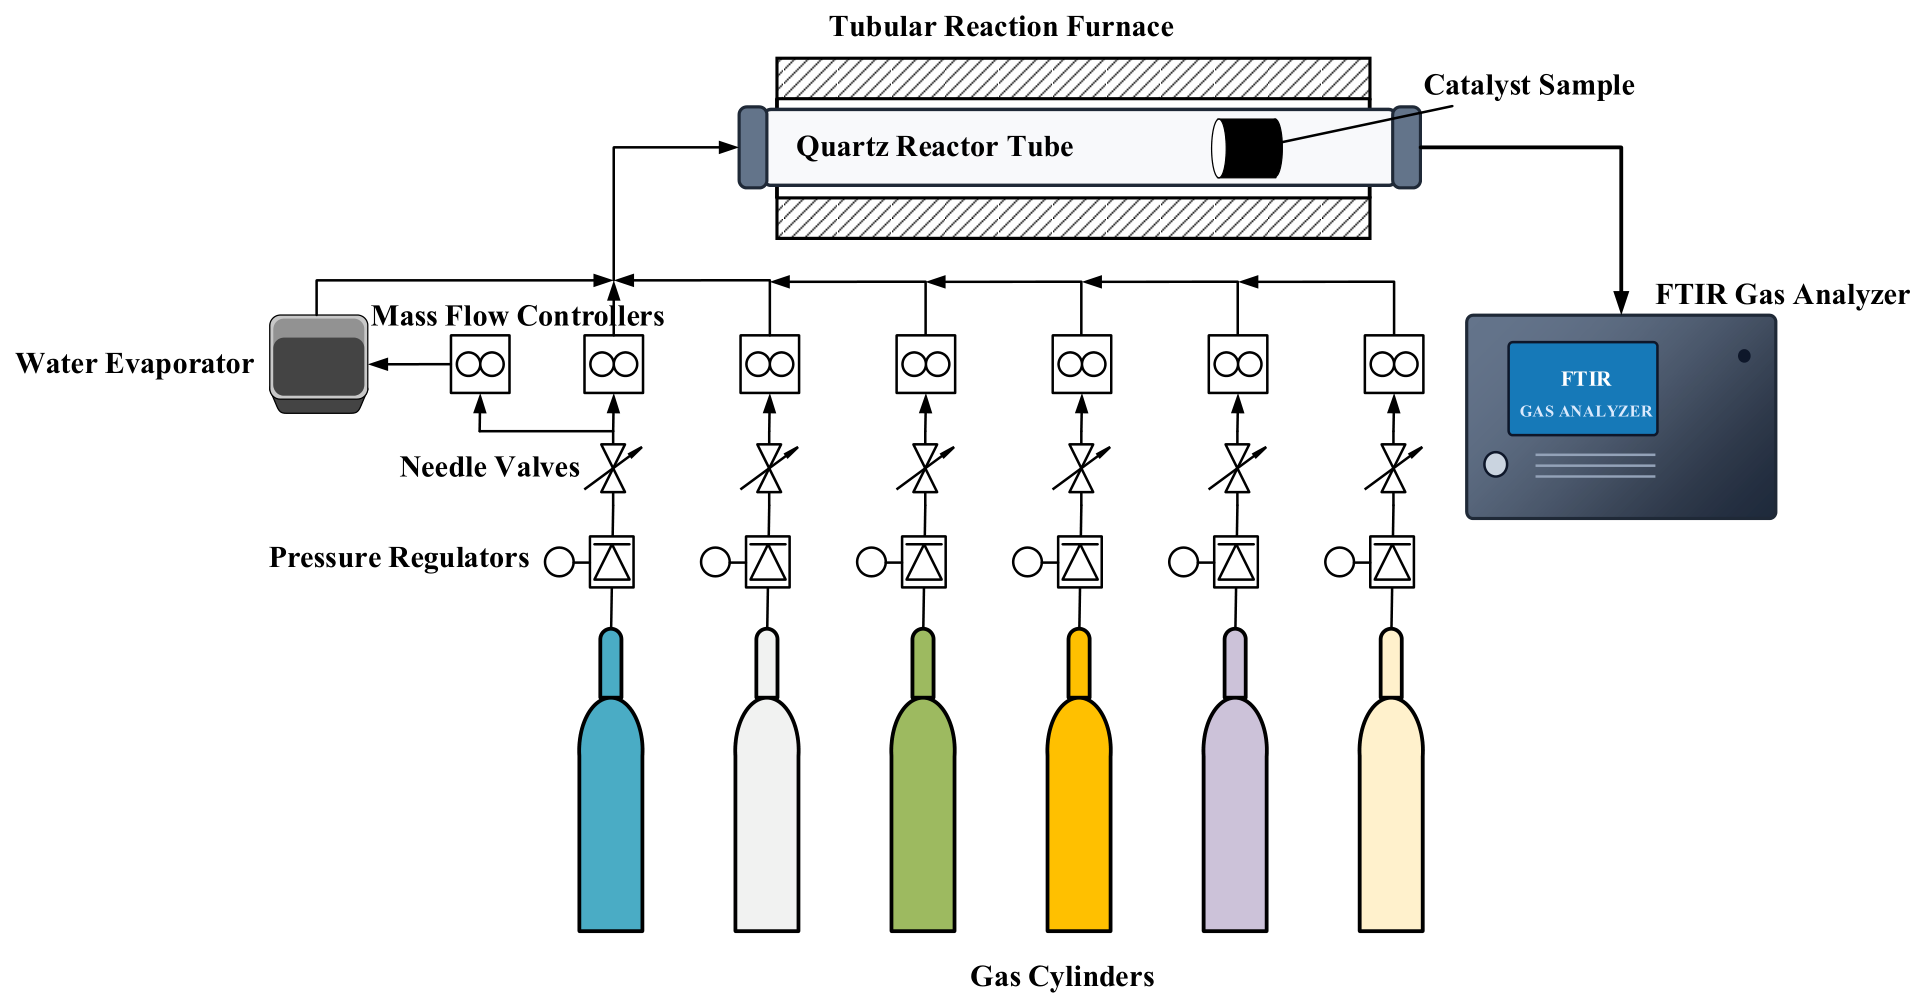
The schematic diagram of the catalyst-sample test bench is shown in Figure 1. The system consisted primarily of gas cylinders, pressure regulators, needle valves, mass flow controllers, a water evaporator, a tubular reaction furnace, a quartz reactor tube, and a Fourier-transform infrared gas analyzer.
Figure 1.
Schematic diagram of the fixed-bed continuous-flow catalyst-sample test bench.
The flow rate of each gaseous component was independently regulated using a mass flow controller before mixing. Water vapor was generated using a water evaporator and mixed with the other gaseous components upstream of the reactor. The resulting synthetic gas mixture was continuously introduced into the quartz reactor tube installed inside the electrically heated tubular furnace.
Cylindrical monolithic catalyst samples measuring 1 in (25.4 mm) in diameter and 1 in (25.4 mm) in length were extracted from the full-size catalyst bricks. All samples had a cell density of 600 cpsi. Each catalyst sample was positioned in the quartz reactor tube and sealed around its circumference using a 3M high-temperature gasket to prevent gas bypass between the sample and the inner wall of the tube.
Before testing, all catalyst samples were subjected to the same accelerated furnace thermal-aging treatment. The catalyst samples were placed in the aging furnace at room temperature, heated to 980 °C at a constant rate of 5 °C min−1, and subsequently maintained at 980 °C for 15 h. The same heating rate, aging temperature, holding time, and aging procedure were applied to TWC-1, TWC-2, and TWC-3 to establish a common and reproducible aged state before catalytic performance evaluation.
The aging condition was selected as a severe accelerated thermal-aging condition for comparative formulation screening. High-temperature treatments in the approximate range of 950–1000 °C have been employed in previous studies to investigate the thermal stability and deactivation of automotive Pd-, Rh-, and Pd-Rh-containing TWCs [23]. The present procedure was therefore designed to represent the severe thermal-durability component of automotive TWC aging within a controlled laboratory protocol while maintaining an identical aging history for all three formulations.
The procedure was not intended to reproduce the complete time- or mileage-resolved aging history of a PHEV over its service life, which additionally involves repeated heating and cooling, exposure to water vapor and other exhaust constituents, and dynamically varying exhaust conditions. Rather, the furnace-aging treatment was used to define a common thermally aged catalyst state prior to the subsequent PHEV-specific operating-domain evaluation, in which the formulation-dependent conversion characteristics were coupled with the transient temperature, GHSV, and λ conditions encountered over the WLTC and RDE profiles.
The total gas flow rate was adjusted according to the required gas hourly space velocity (GHSV), calculated from the geometric volume of the catalyst sample:
where is the total volumetric gas flow rate under the specified reference conditions and is the geometric volume of the catalyst sample.
The inlet and outlet gas compositions were measured using a Fourier-transform infrared gas analyzer (MKS MultiGas 6030, model 6030BBG2BZKS13T, Andover, MA, USA).
Propene (C3H6) was selected as the representative hydrocarbon species in the synthetic-gas experiments. As a gaseous short-chain olefin relevant to gasoline-engine exhaust, C3H6 can be accurately metered and has been used as a representative hydrocarbon species in recent studies of gasoline-vehicle cold-start hydrocarbon abatement [27]. Its use also enabled reproducible comparison of the three catalyst formulations while temperature, GHSV, and λ were systematically varied.
However, C3H6 does not represent the complete reactivity distribution of engine-out THC. Actual gasoline-engine exhaust contains a complex mixture of hydrocarbons with different adsorption and oxidation characteristics, and some species may exhibit different light-off behavior from C3H6, particularly during cold-start operation. The experimentally measured quantity is therefore reported specifically as C3H6 conversion rather than THC conversion.
In the cycle-level aftertreatment model, the formulation-specific C3H6 conversion characteristics were used as a surrogate for engine-out THC conversion. Accordingly, the model does not explicitly resolve the species-dependent conversion behavior of the complete engine-out hydrocarbon mixture. The C3H6-based conversion data were used primarily to represent the relative hydrocarbon-conversion characteristics of the three formulations under different temperature, GHSV, and λ conditions. The overall cycle-level THC prediction was subsequently evaluated against measured WLTC tailpipe emissions as part of the model validation described in Section 2.5.
NO was the only nitrogen oxide introduced into the synthetic-gas mixtures. Because the bench-scale conversion efficiency was calculated from the inlet and outlet NO concentrations, the experimentally measured quantity is reported as NO conversion. These NO conversion characteristics were used as a surrogate for the dominant engine-out NOx component in the cycle-level model. The resulting cycle-level NOx emissions should therefore be interpreted as model predictions based on the NO surrogate.
The excess air ratio of the synthetic-gas mixture was defined from the molar concentrations of the oxidizing and reducing species as
where the square brackets denote the inlet molar concentrations of the corresponding species. The numerator represents the total oxygen-atom equivalents available in the inlet mixture from H2O, CO, CO2, NO, and O2. The denominator represents the stoichiometric oxygen-atom requirement for the complete conversion of the carbon- and hydrogen-containing species to CO2 and H2O, with nitrogen-containing species converted to N2. Accordingly, λ < 1, λ = 1, and λ > 1 represent rich, stoichiometric, and lean inlet conditions, respectively. The target λ was obtained by adjusting the O2 concentration while maintaining the prescribed concentrations of the other inlet species.
The instantaneous conversion efficiency of pollutant i was calculated as
where and represent the instantaneous inlet and outlet concentrations, respectively.
2.3.2. Light-Off Tests
Light-off tests were performed at GHSVs of 30,000 and 50,000 h−1 to evaluate the low-temperature activity of the three formulations. The corresponding inlet gas compositions are summarized in Table 2. These mixtures were selected from representative engine-out conditions encountered during catalyst heating. They were intended to reproduce the main characteristics of the light-off boundary in a controlled and repeatable manner rather than a specific instantaneous point in a driving cycle.
Table 2.
Inlet gas compositions and space velocities used in the light-off tests.
N2 was used as the balance gas, whereas CO2 and H2O were maintained at the prescribed concentrations. The O2 concentration was adjusted to obtain the target λ according to Equation (2).
During each light-off test, the catalyst temperature was increased at a constant rate of 5 °C min−1, while the inlet composition and total gas-flow rate were maintained at their prescribed values. The inlet and outlet concentrations were measured throughout the temperature ramp, and the instantaneous conversion efficiencies were calculated using Equation (3).
The light-off performance was characterized by T50 and T90, defined as the catalyst temperatures at which the conversion efficiency reached 50% and 90%, respectively. Lower T50 and T90 values indicate better low-temperature catalytic activity.
The simplified inlet mixtures were designed to provide controlled and repeatable conditions for comparing the three aged formulations rather than to reproduce the complete composition of actual engine exhaust.
2.3.3. Temperature–Space-Velocity Mapping and λ-Sweep Tests
Temperature–space-velocity tests were conducted to characterize the conversion performance of the three catalyst formulations over a broad operating domain. Six representative test conditions were established at gas hourly space velocities of 25,000, 50,000, 100,000, 150,000, 200,000 and 250,000 h−1. For each space velocity, the corresponding inlet gas composition listed in Table 3 was used, and the catalyst temperature was varied from 100 to 650 °C. This range covered the kinetically limited low-temperature region, the light-off transition, and the fully activated high-temperature region.
Table 3.
Base inlet gas compositions used in the temperature, space velocity, and λ-sweep tests.
The inlet compositions were selected from representative engine-out conditions associated with different exhaust-flow ranges. Consequently, the measured conversion responses reflected the combined influence of space velocity and the associated inlet composition. These tests were therefore intended to characterize catalyst conversion under representative flow-dependent inlet conditions rather than to isolate the effect of space velocity under an identical inlet composition. The measured CO, C3H6, and NO conversion efficiencies at the discrete temperature and space-velocity conditions were subsequently used as formulation-specific conversion data in the cycle-level simulation.
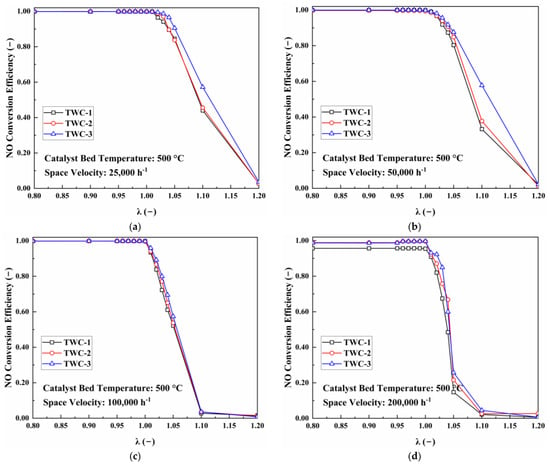
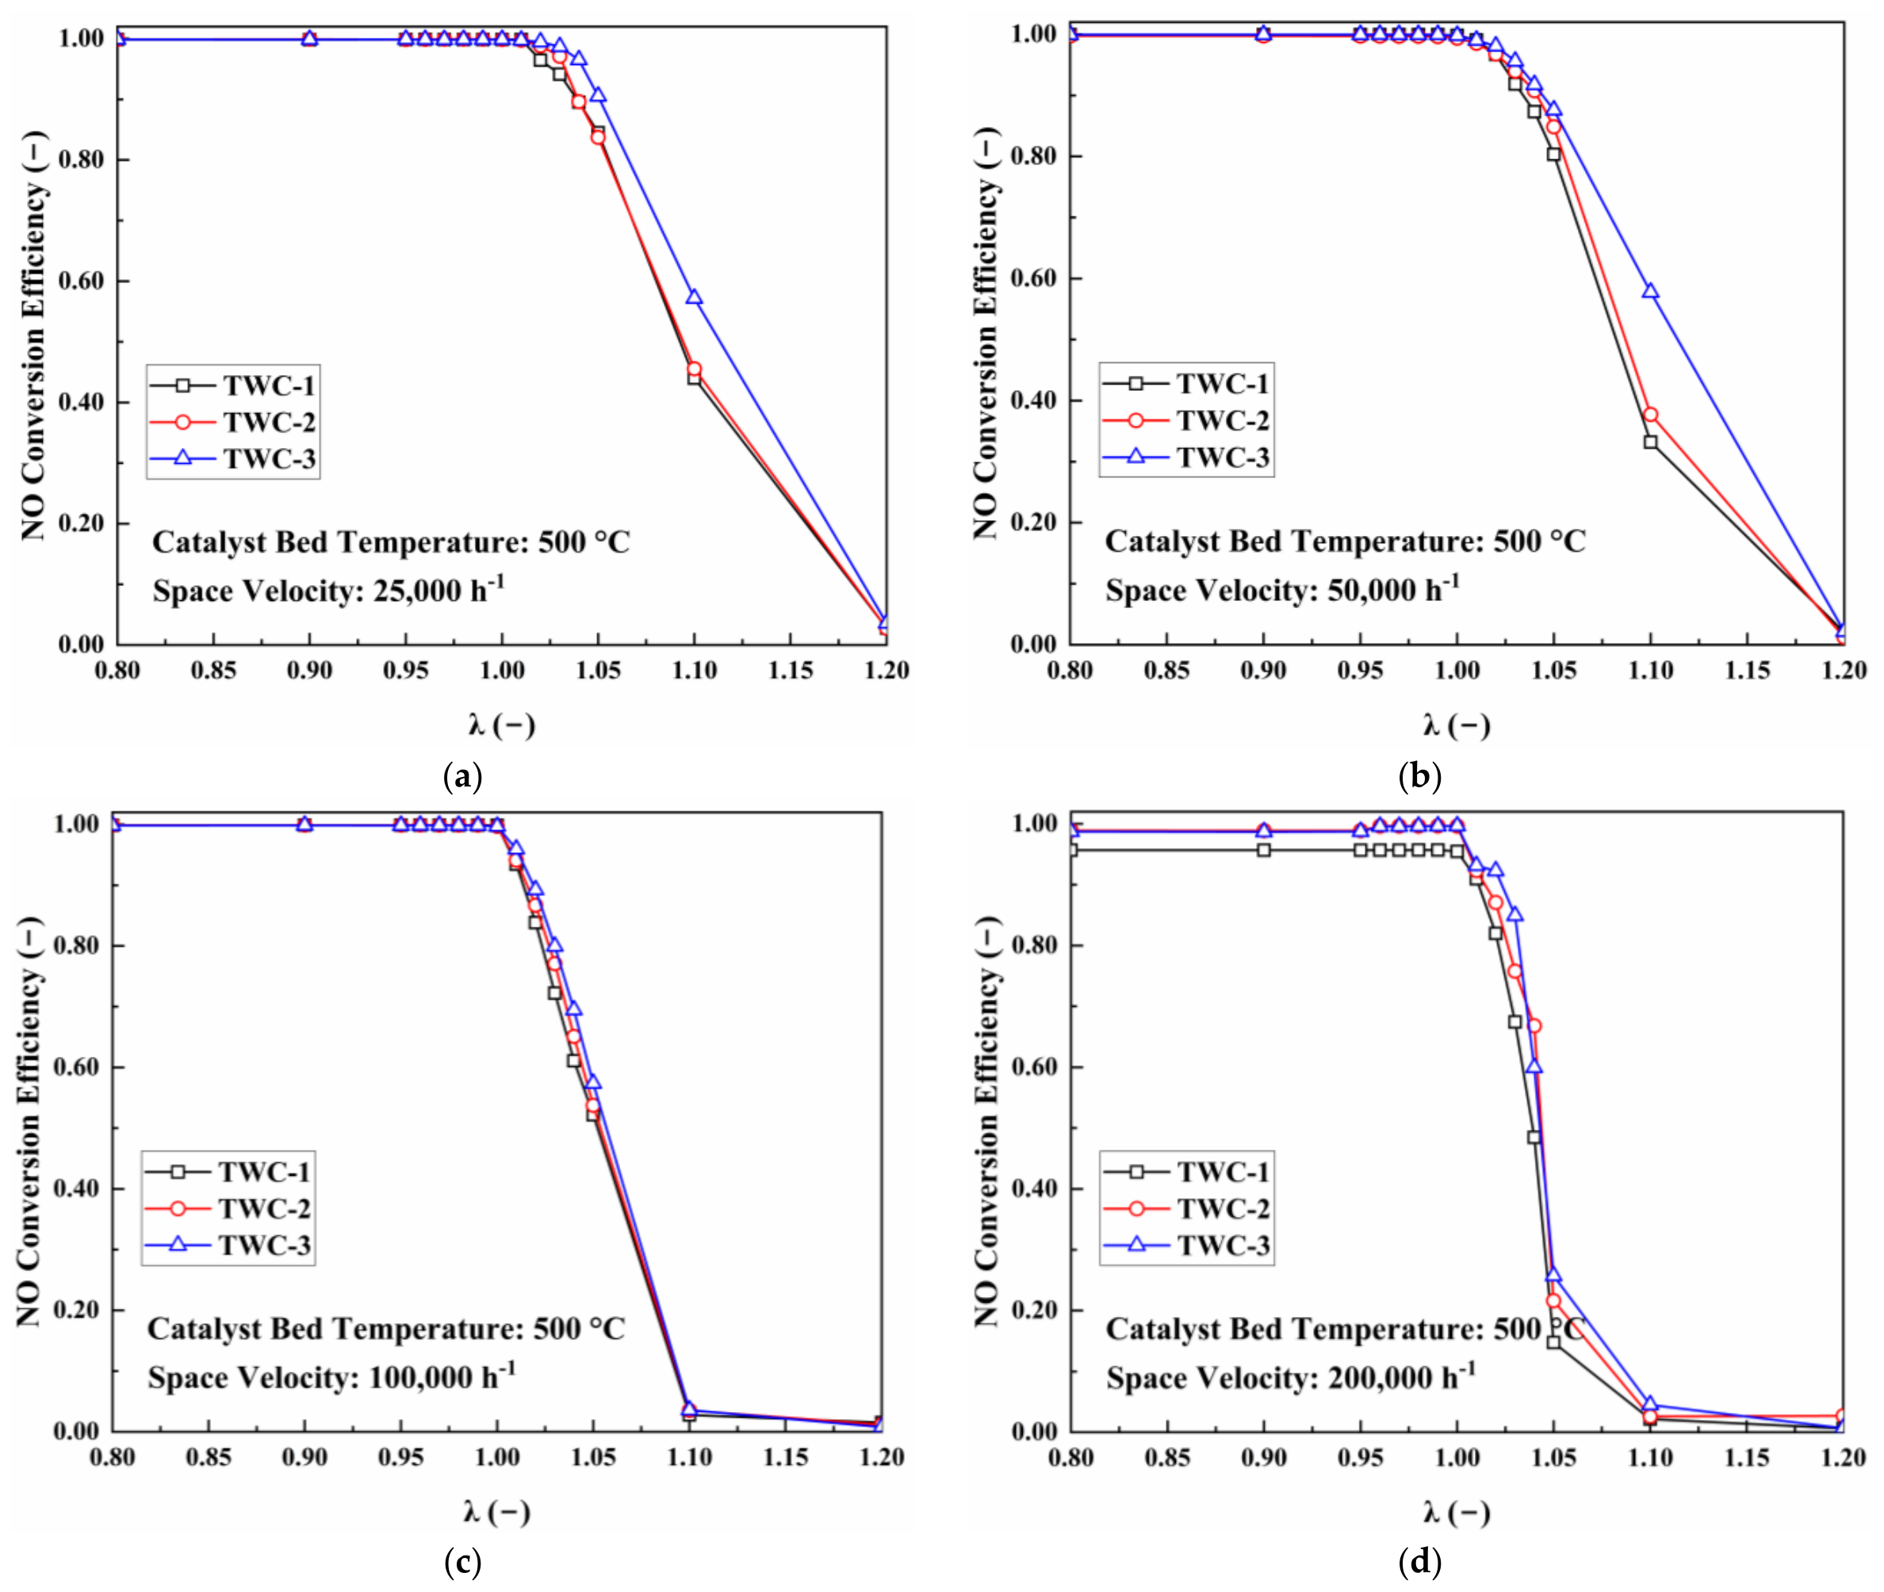
The influence of excess-air-ratio excursions was evaluated separately through λ-sweep tests. These tests were performed at a catalyst temperature of 500 °C and gas hourly space velocities of 25,000, 50,000, 100,000, and 200,000 h−1. At each space velocity, the corresponding base inlet composition in Table 3 was used. The value of λ was varied from 0.80 to 1.20 by adjusting the O2 concentration, while the nominal concentrations of NO, CO, C3H6, CO2, and H2O were maintained at their prescribed values. This range covered rich, near-stoichiometric, and lean conditions relevant to transient air–fuel-ratio fluctuations.
A test temperature of 500 °C was selected to keep all three catalyst formulations above their principal light-off regions. This reduced interference from catalyst activation and allowed the effects of oxygen availability, reducing-species availability, and gas residence time on pollutant conversion to be evaluated more directly. Under each test condition, the inlet and outlet concentrations were measured using the Fourier-transform infrared gas analyzer, and the corresponding instantaneous conversion efficiencies were calculated using Equation (3).
2.4. Cycle-Level Emission Simulation
2.4.1. Vehicle, Powertrain, and Engine-Out Emission Models
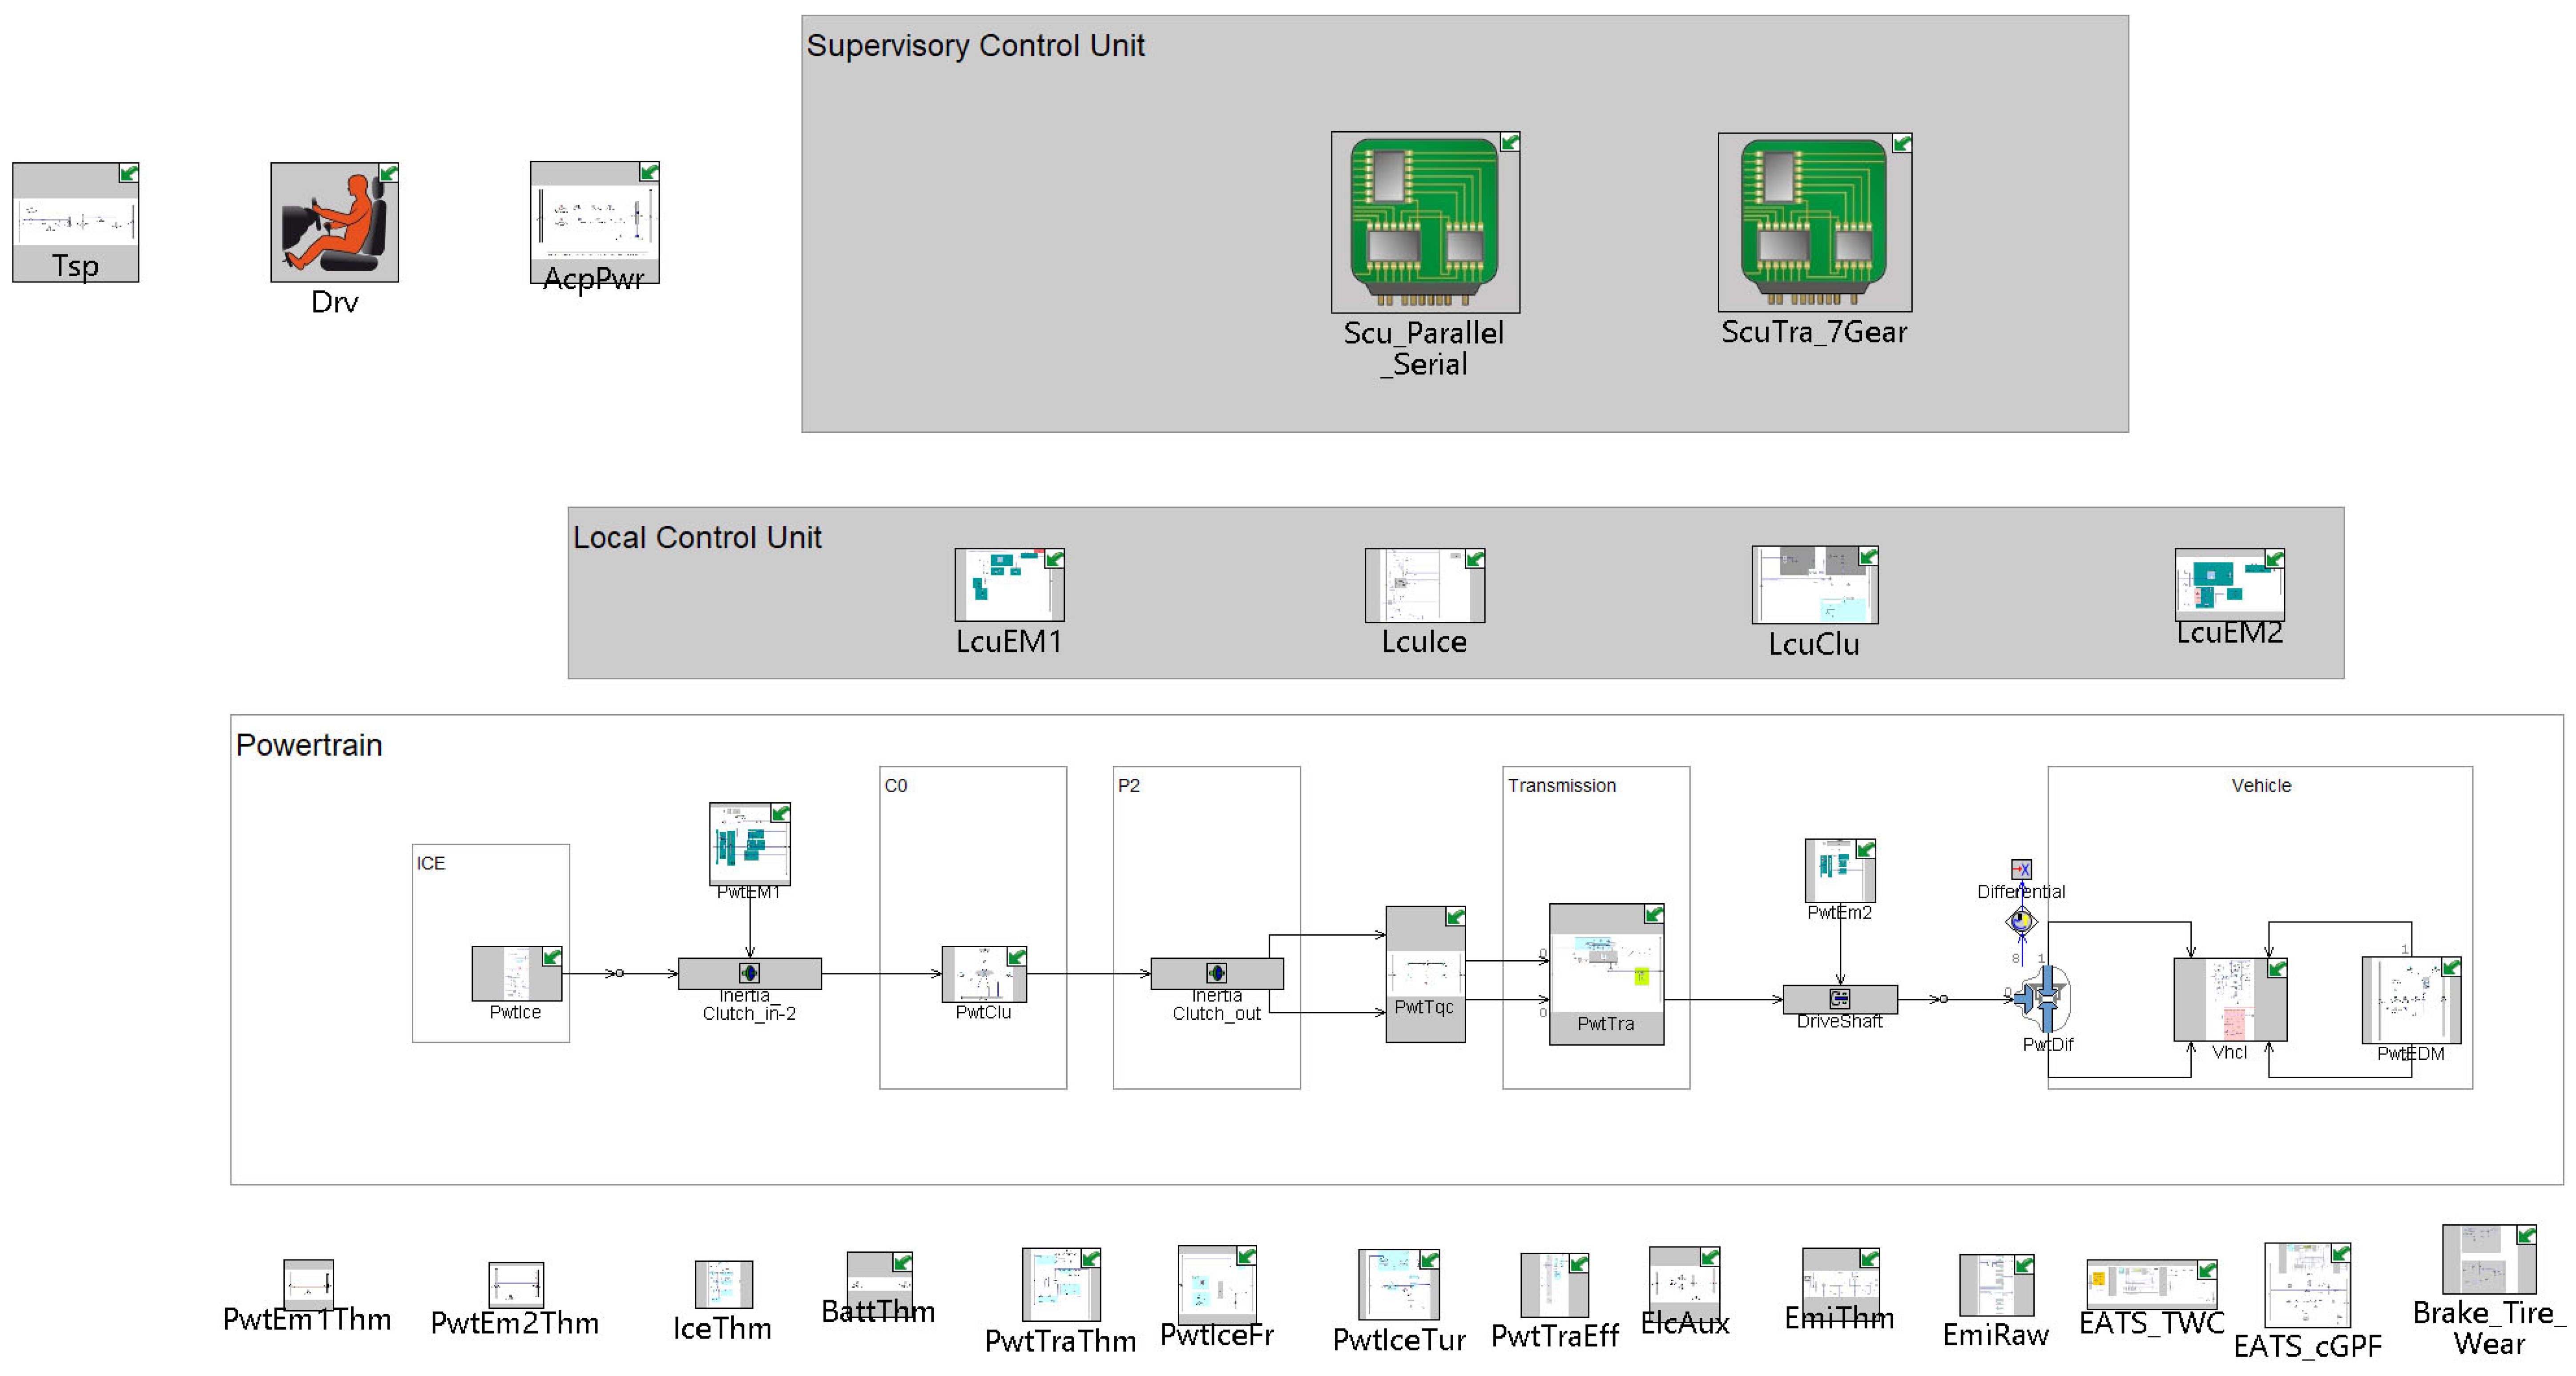
A coupled model of vehicle operation, engine-out emissions, and exhaust aftertreatment was developed to predict cycle-level emissions for the three TWC configurations. Vehicle speed and road gradient were used to calculate the required traction power. The powertrain model then determined engine start–stop status, engine speed, torque, exhaust mass flow rate, exhaust temperature, and λ. These variables were supplied to the engine-out emission and aftertreatment models to calculate CO, THC, and NOx emissions downstream of the TWC and cGPF. The overall model architecture is shown in Figure 2.
Figure 2.
Overall architecture of the coupled vehicle, engine-out emission, and aftertreatment model.
The investigated vehicle was equipped with a 2.0 L turbocharged four-cylinder engine, a two-speed dedicated hybrid transmission, a P1 electric machine, a P3 electric machine [28], a high-voltage traction battery, and a 12 V low-voltage battery. The main vehicle and powertrain parameters are summarized in Table 4 and Table 5.
Table 4.
Main parameters of the vehicle model.
Table 5.
Main powertrain parameters.
The required traction power was calculated from road-load and acceleration resistance [29]. Battery voltage, charge and discharge limits, and energy losses were determined from the battery open-circuit voltage and internal resistance characteristics. These calculations provided the constraints for engine start–stop operation, power generation, and traction power allocation.
The resulting power demand and control decisions were used to determine engine operating state, speed, and torque, together with the exhaust temperature, mass flow rate, and λ supplied to the aftertreatment model.
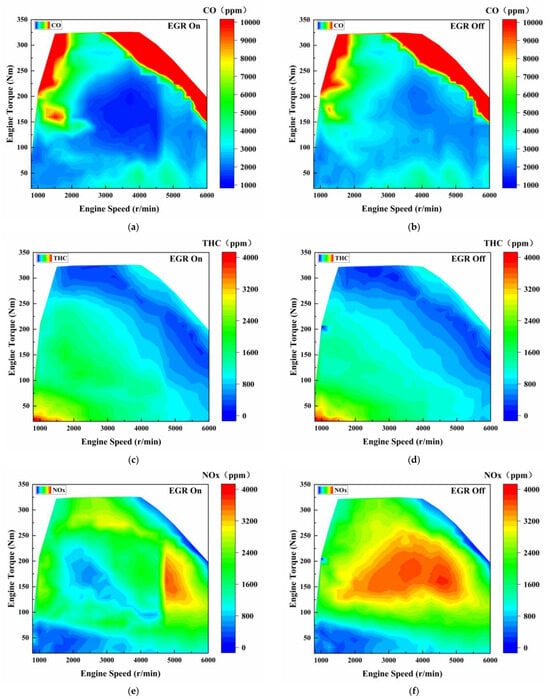
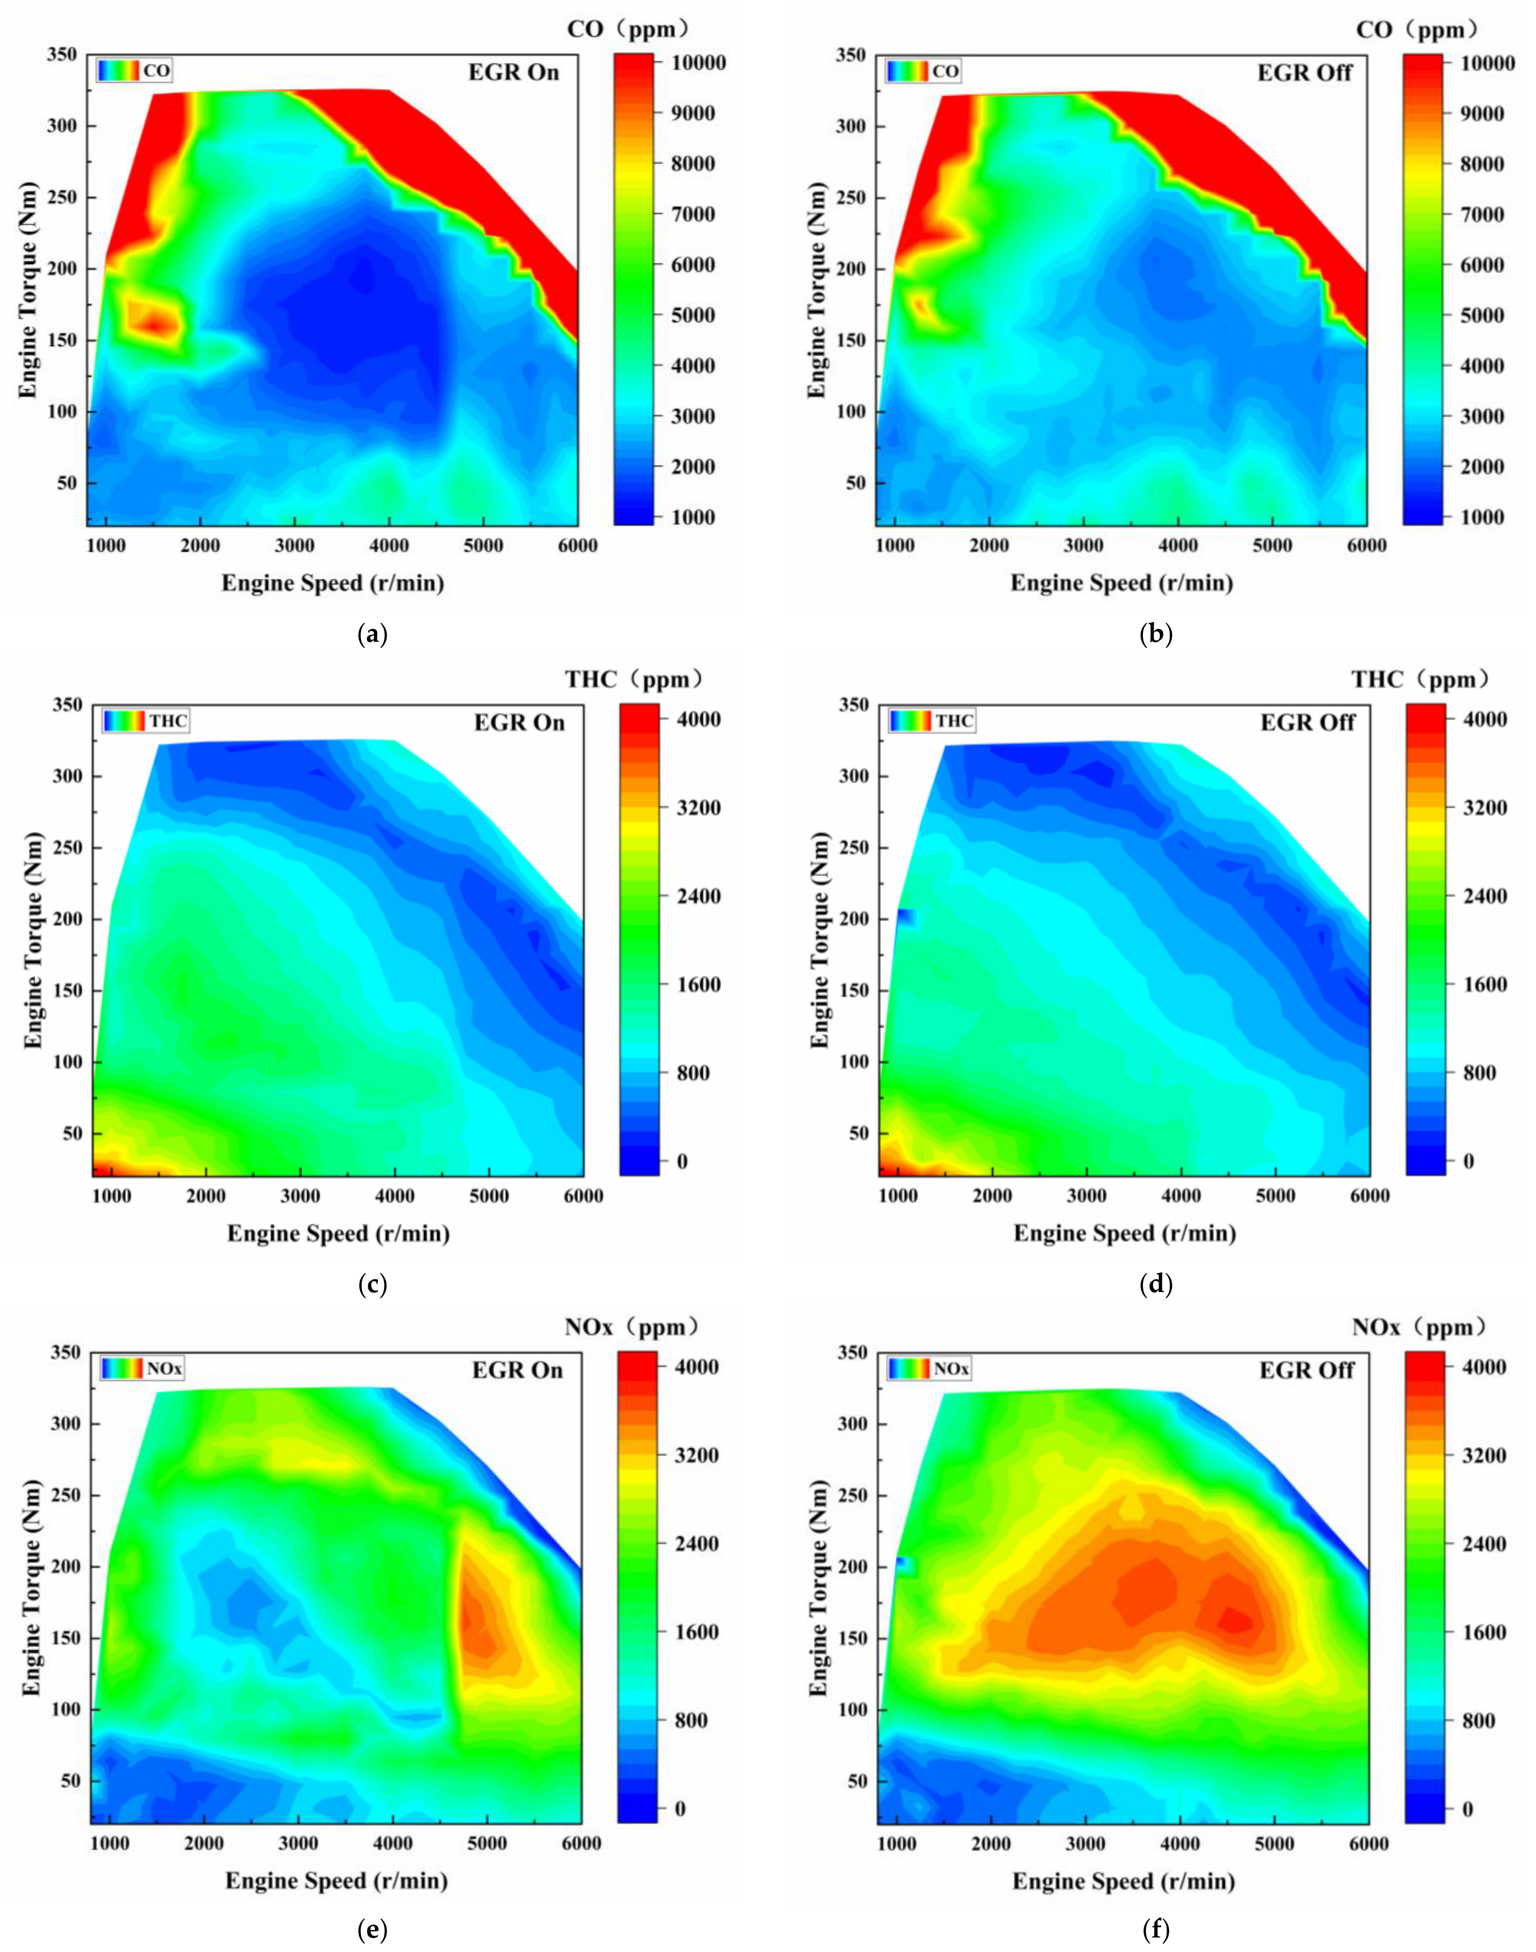
The engine-out emission model was established from steady-state engine characteristic data. Separate baseline maps of CO, THC, and NOx were constructed for EGR-on and EGR-off operation, as shown in Figure 3.
Figure 3.
Engine-out emission maps under EGR-on and EGR-off conditions: (a) CO engine-out emission map under EGR-on operation; (b) CO engine-out emission map under EGR-off operation; (c) THC engine-out emission map under EGR-on operation; (d) THC engine-out emission map under EGR-off operation; (e) NOx engine-out emission map under EGR-on operation; (f) NOx engine-out emission map under EGR-off operation. The model outputs supplied to the aftertreatment calculation included the engine-out pollutant mass flows, exhaust mass-flow rate, exhaust temperature, and λ.
The baseline maps used engine speed, (n), and torque, (T), as inputs. Because steady-state maps alone cannot represent the effects of engine start–stop events, rapid load variations, and changes in engine thermal state, correction factors for coolant temperature, λ, and ignition timing were introduced. The instantaneous engine-out emission of pollutant i was calculated as
where Ei,base denotes the baseline engine-out emission obtained by interpolation from the two-dimensional emission map; Ei,raw(t) is the corrected instantaneous engine-out emission of pollutant; CT,i(t), Cλ,i(t) and CΔign,i(t) are the correction factors for coolant temperature, excess air ratio, and ignition timing, respectively; Tct(t) denotes the engine coolant temperature; λ(t) is the excess air ratio; and Δign(t) represents the deviation of the actual ignition timing from the baseline calibrated ignition timing.
2.4.2. Catalyst Thermal and Conversion Models
The aftertreatment system consisted of an upstream TWC followed by a cGPF. The TWC provided the primary gaseous-pollutant conversion, while the cGPF model described the additional change in downstream emissions. The cGPF geometry, thermal parameters, and model parameters were kept unchanged for all three TWC comparisons. The exhaust composition downstream of each TWC, including the pollutant concentrations and exhaust redox conditions supplied to the cGPF model, was used as the inlet boundary condition for the downstream cGPF calculation. Consequently, formulation-dependent differences generated by the upstream TWC were propagated into the cGPF model and could influence the subsequent conversion of gaseous pollutants. Thus, although the same cGPF configuration and model parameters were used for all three cases, its downstream effect was calculated according to the different exhaust boundary conditions produced by TWC-1, TWC-2, and TWC-3.
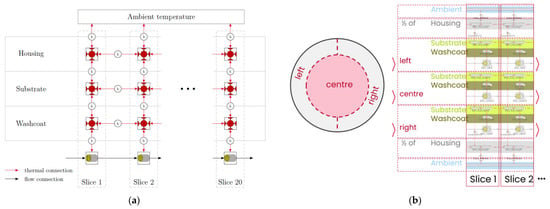
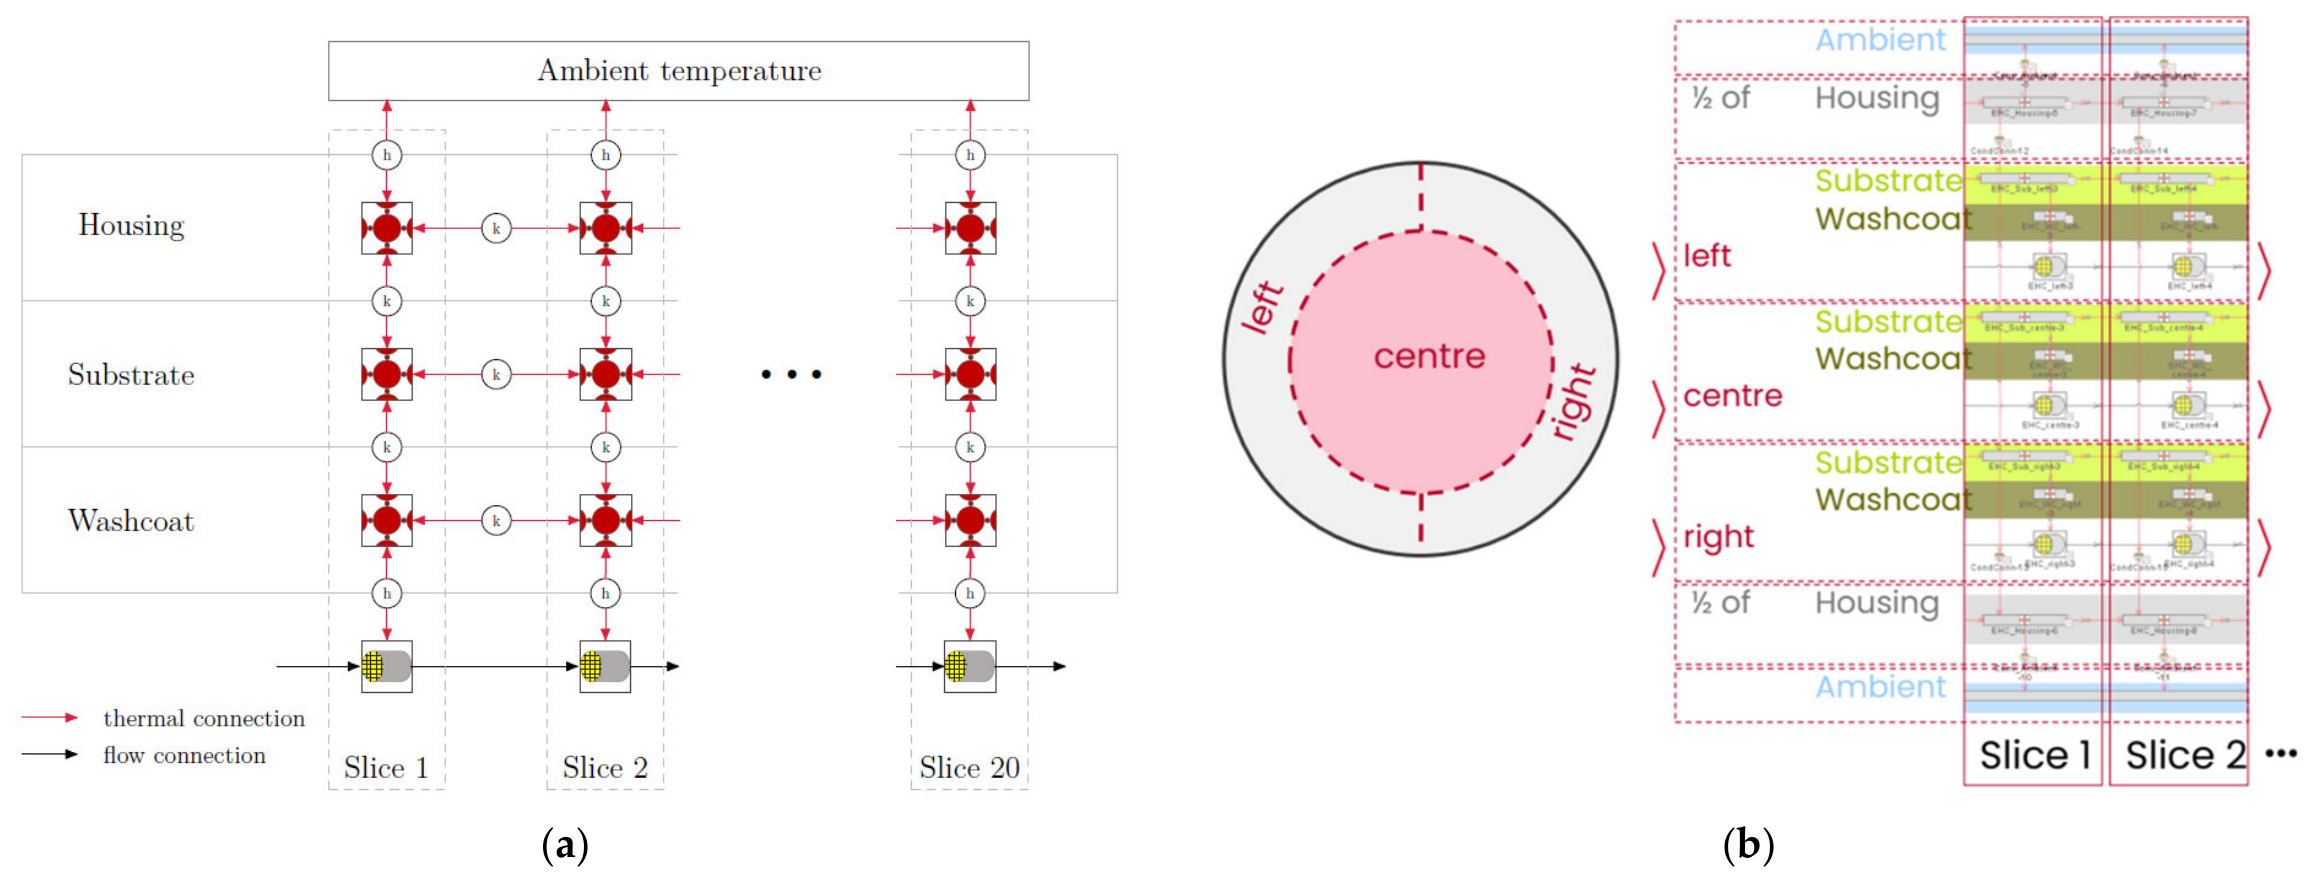
The transient temperatures of the TWC and cGPF were calculated using a segmented thermal model. Each component was discretized axially and divided into central and peripheral radial regions as shown in Figure 4. Separate thermal nodes were assigned to the exhaust gas, washcoat, substrate, and housing. The model accounted for exhaust-gas enthalpy, gas–solid heat transfer, axial and radial conduction, reaction heat release, and heat loss to the surroundings. This structure represented the temperature evolution caused by engine start–stop events and rapid changes in engine load.
Figure 4.
Axial and radial discretization of the TWC and cGPF thermal models: (a) axial discretization; (b) radial discretization.
The representative catalyst temperature was obtained from the segmented thermal model, and GHSV was calculated from the exhaust volumetric flow rate and the geometric catalyst volume. At each simulation time step, the instantaneous catalyst temperature, GHSV, and λ were used to determine the corresponding formulation-specific conversion efficiencies from the experimentally derived conversion datasets. The temperature–space-velocity tests provided the conversion characteristics under representative flow-dependent inlet conditions, while the λ-sweep tests described the response to variations in oxygen availability. Linear interpolation was applied between adjacent experimental points. When catalyst temperature, GHSV, or λ fell outside the experimentally characterized range, the corresponding input was clamped to the nearest measured boundary, and no extrapolation beyond the experimental domain was performed.
The target conversion amounts obtained from the experimental characteristics were constrained using pollutant availability, reaction stoichiometry, and an equivalent oxygen-storage-and-release balance. These constraints prevented nonphysical predictions, including pollutant conversion greater than the inlet amount and continued oxidation when the available oxygen and stored oxygen were insufficient. The model was intended for cycle-level engineering prediction rather than for resolving detailed surface-reaction kinetics.
2.5. Driving Cycles, Operating-Boundary Analysis, and Model Validation
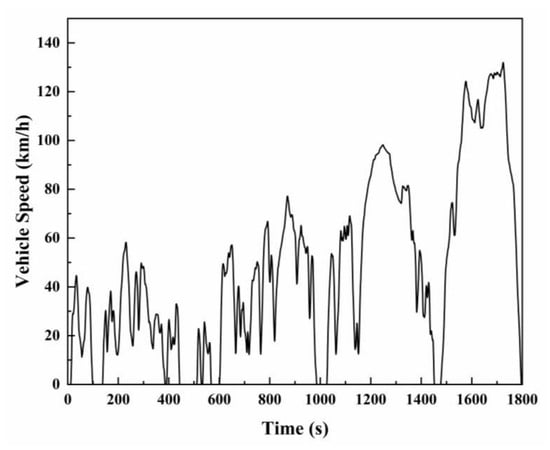
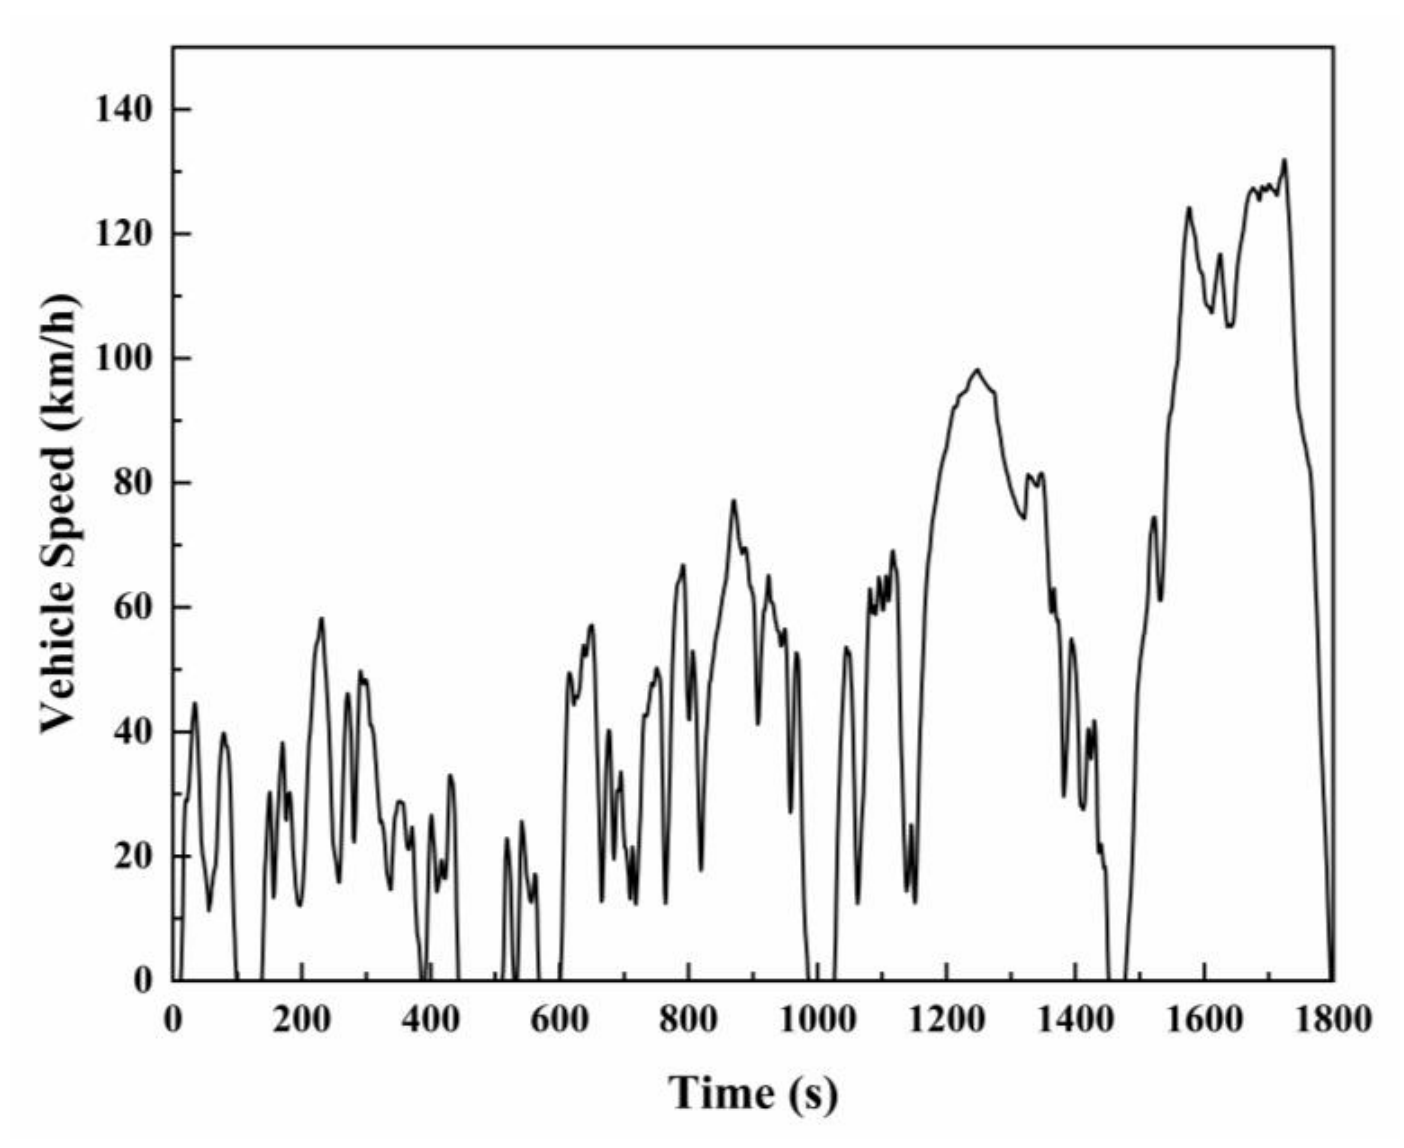
The WLTC and a representative RDE driving profile were used for the emission simulations. The WLTC provided a standardized speed trace containing low-, medium-, high-, and extra-high-speed phases, as shown in Figure 5.
Figure 5.
Vehicle speed profile of the WLTC.
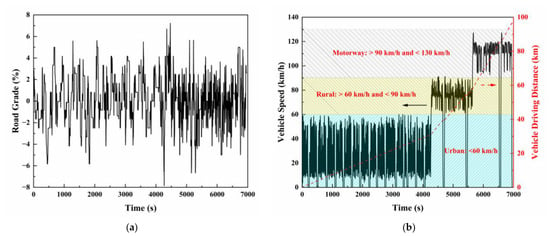
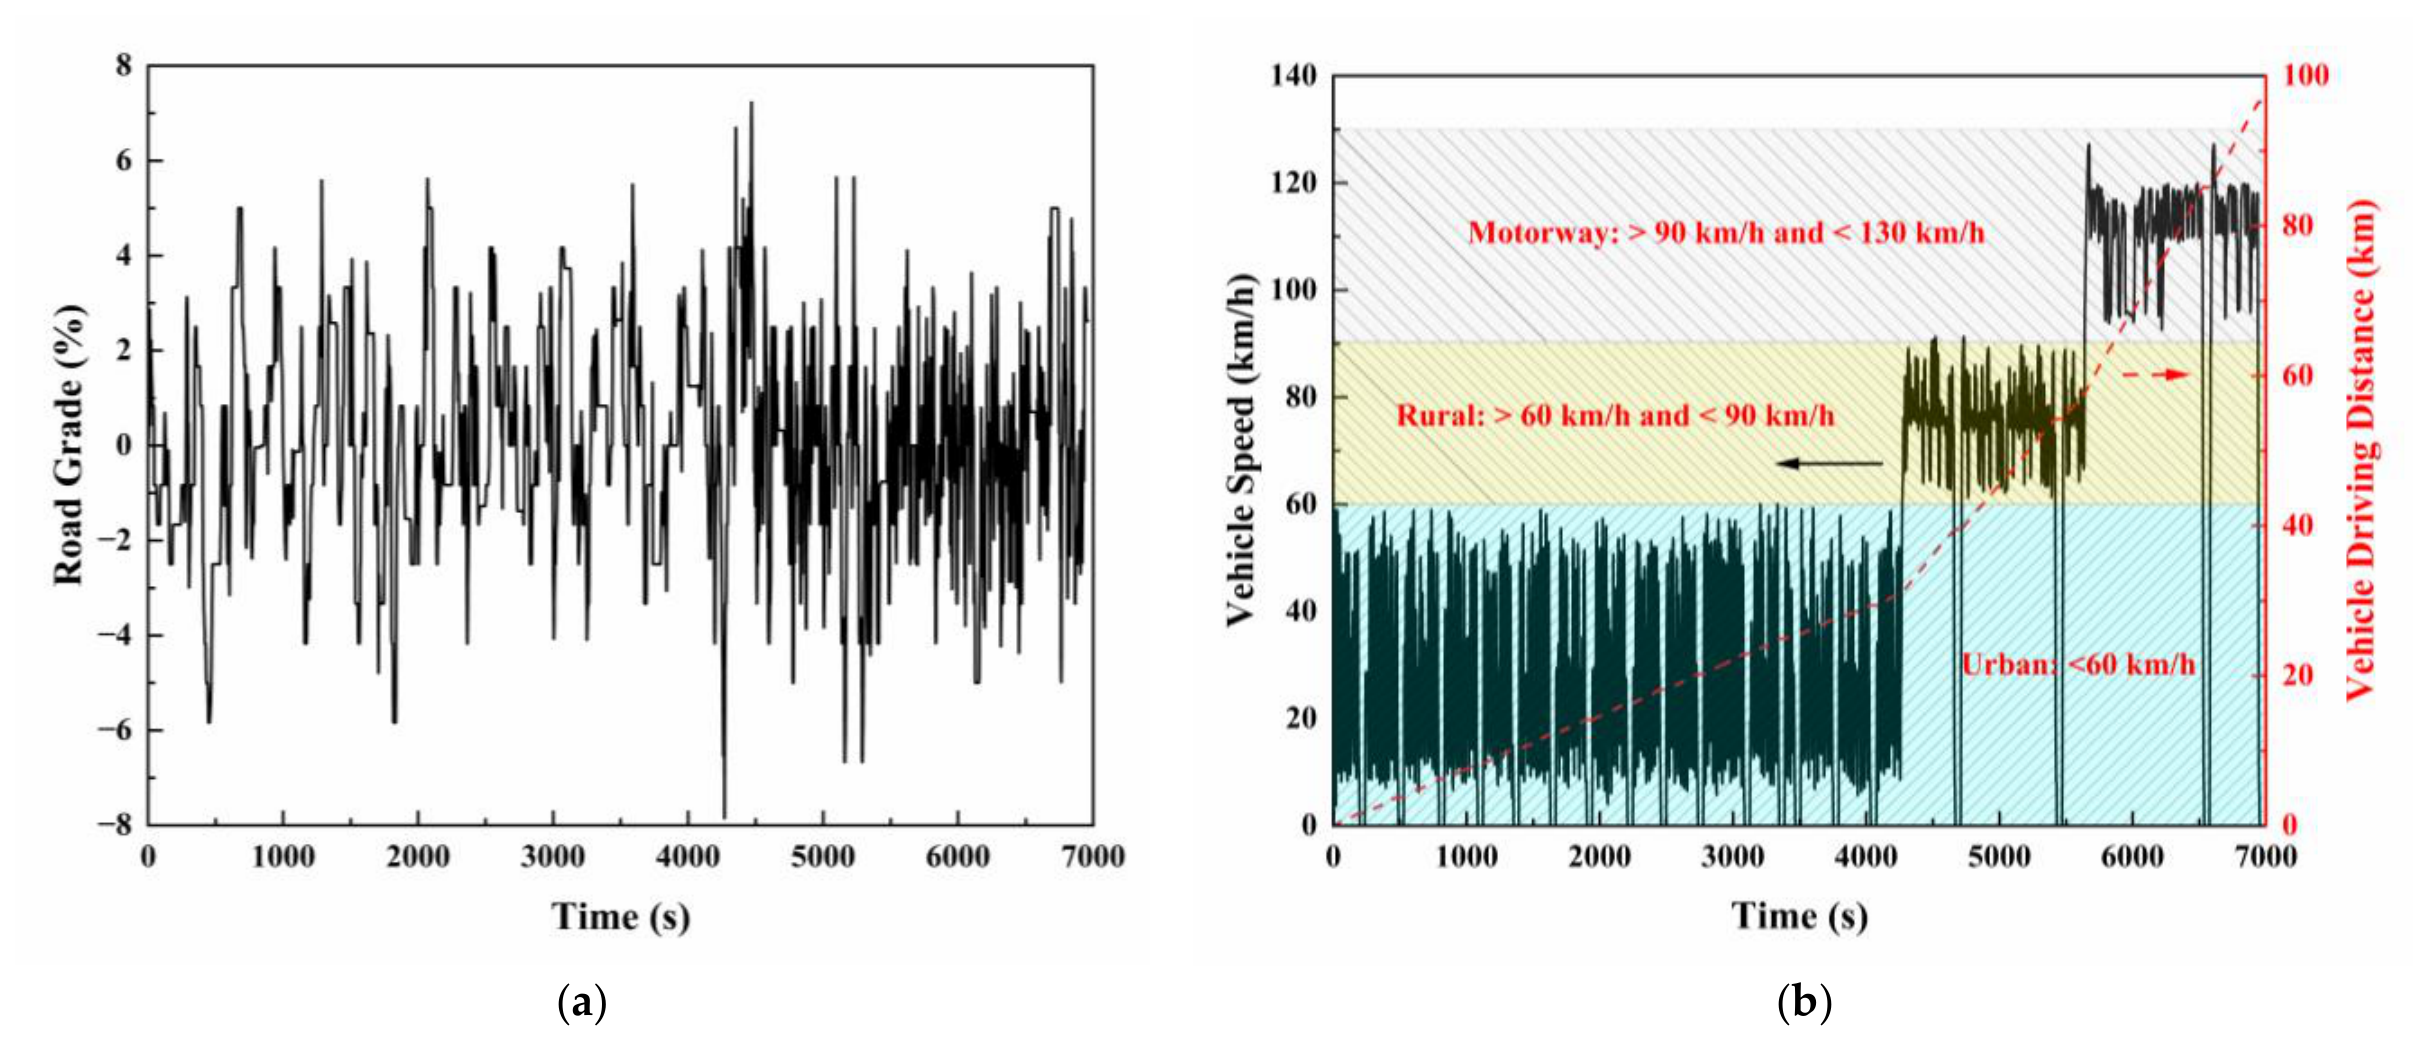
The RDE profile was obtained from a representative on-road trip that satisfied the relevant Euro 6 RDE boundary conditions as shown in Figure 6. The trip consisted of urban, rural, and motorway sections and met the requirements for trip duration, distance share, stop ratio, and speed distribution [30]. Road gradient was included to account for its influence on traction demand, engine operation, exhaust flow, catalyst temperature, and space velocity.
Figure 6.
Vehicle speed and road gradient profiles of the RDE: (a) road gradient; (b) vehicle speed and cumulative distance.
The RDE profile was used as a dynamic evaluation condition rather than for regulatory compliance assessment. Compared with the WLTC, it contained greater speed fluctuations, a broader exhaust flow range, and more frequent periods of high space velocity [5]. It therefore provided a suitable basis for evaluating catalyst performance under hot operation, short gas residence times, and transient variations in λ.
All three TWC configurations were evaluated using identical vehicle operation, engine control, engine-out emissions, and cGPF parameters. Differences in downstream emissions therefore reflected the formulation-specific conversion characteristics measured for the three TWCs.
The temporal profiles and statistical distributions of mid-catalyst temperature, space velocity, and λ were extracted from both driving conditions. These parameters were used to relate cycle-level emission differences to the conversion characteristics measured in the bench-scale tests.
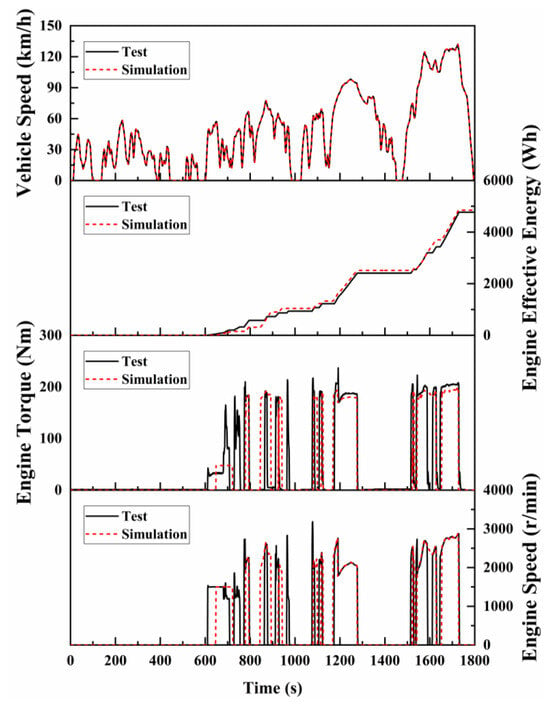
The coupled model was calibrated and its performance was evaluated against experimental WLTC data at three levels: vehicle and powertrain operation, engine-out boundary conditions, and cumulative tailpipe emissions.
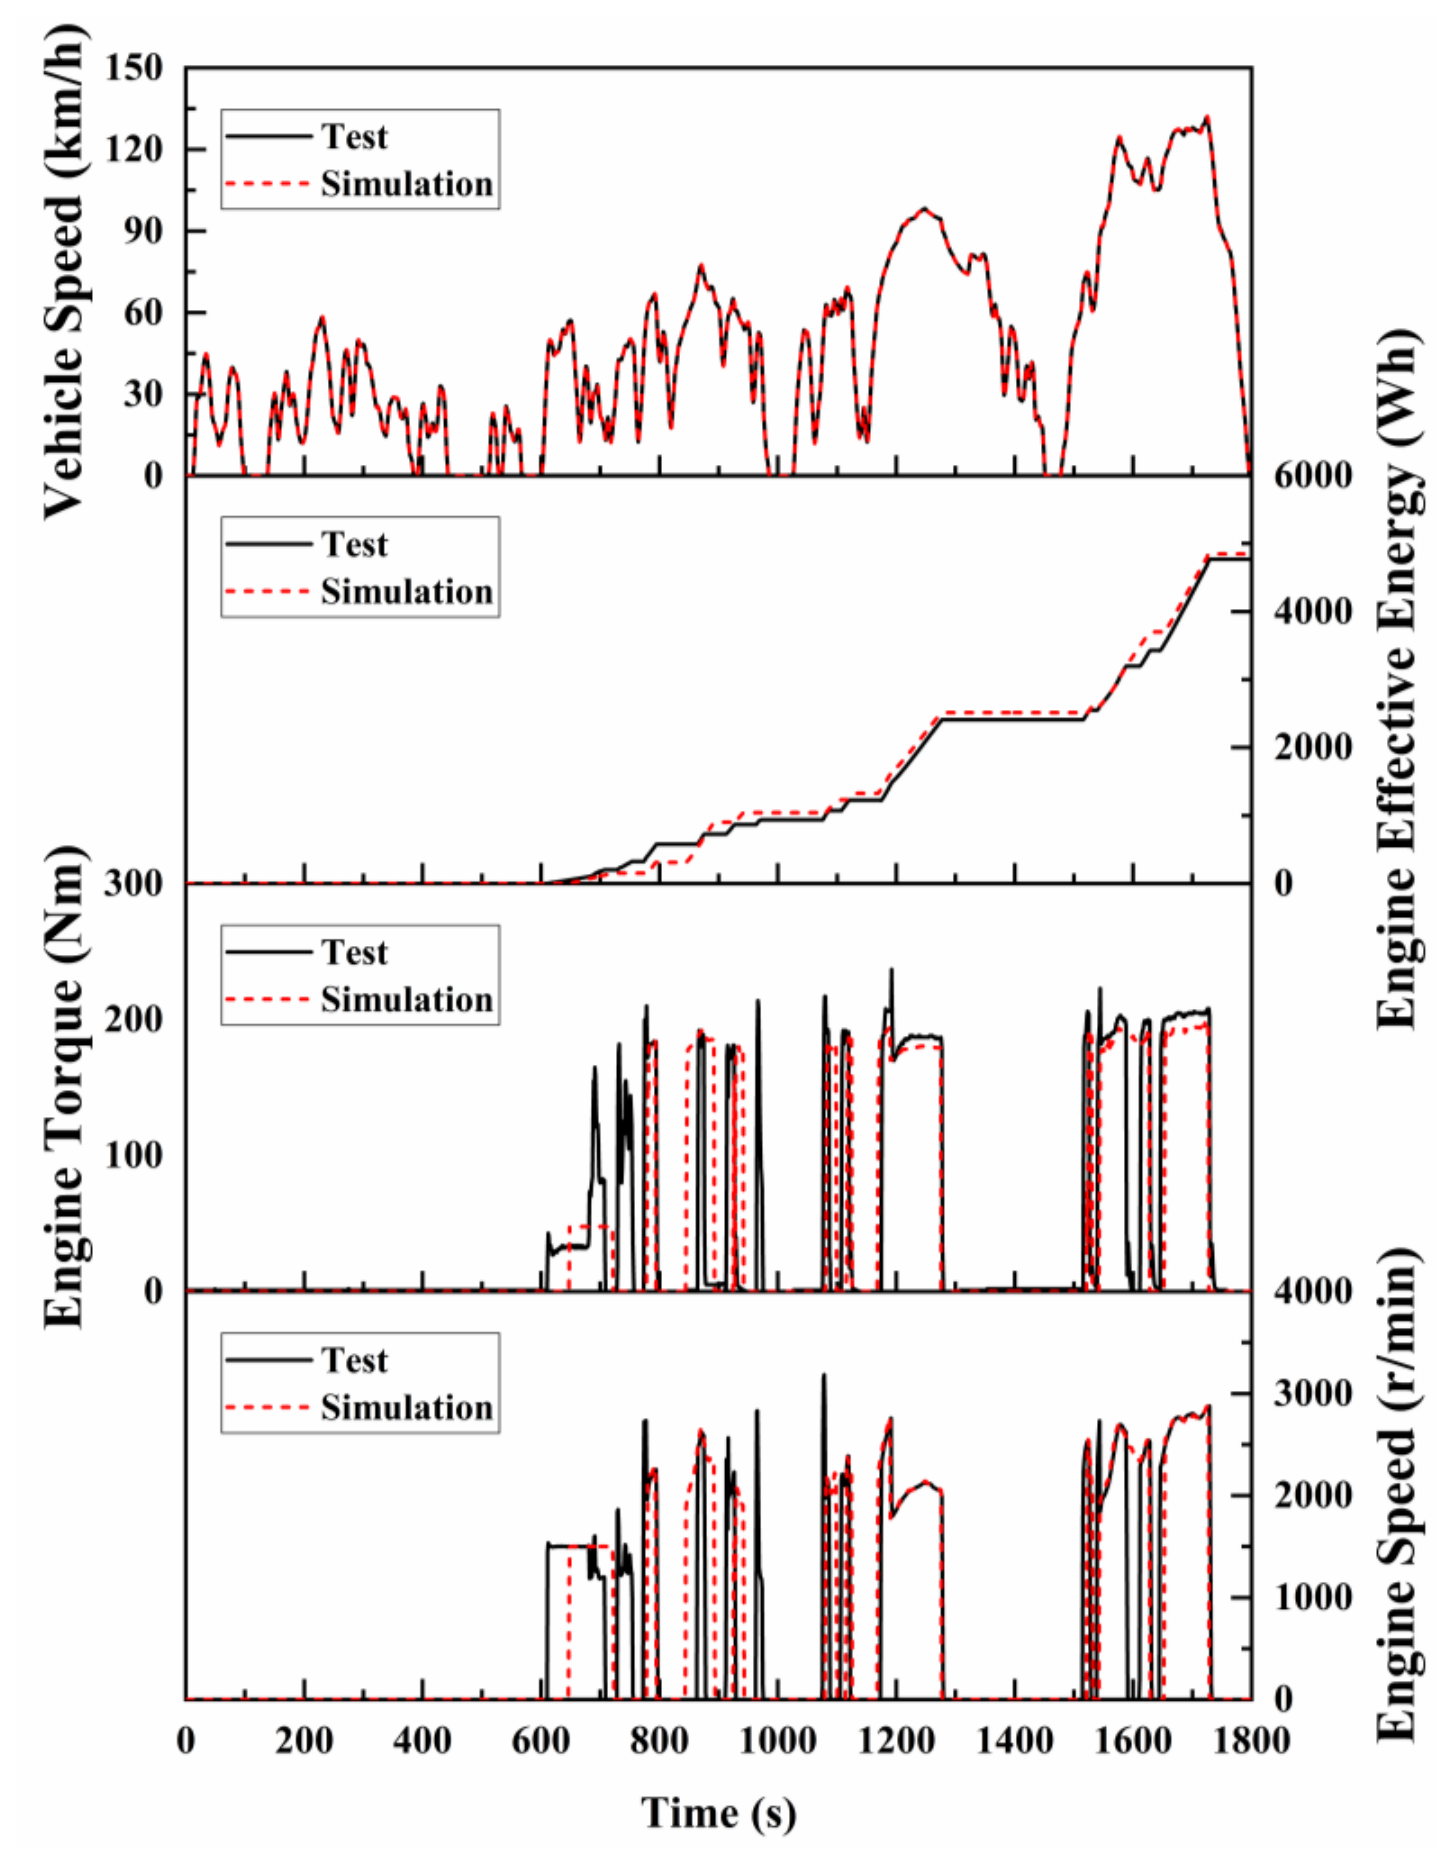
First, the vehicle and powertrain models were calibrated using measured vehicle speed, engine speed, torque, and cumulative effective engine energy, as shown in Figure 7.
Figure 7.
Comparison of measured and simulated vehicle speed, cumulative effective engine energy, engine torque, and engine speed over the WLTC.
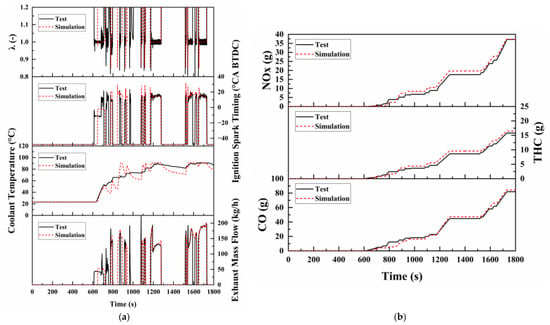
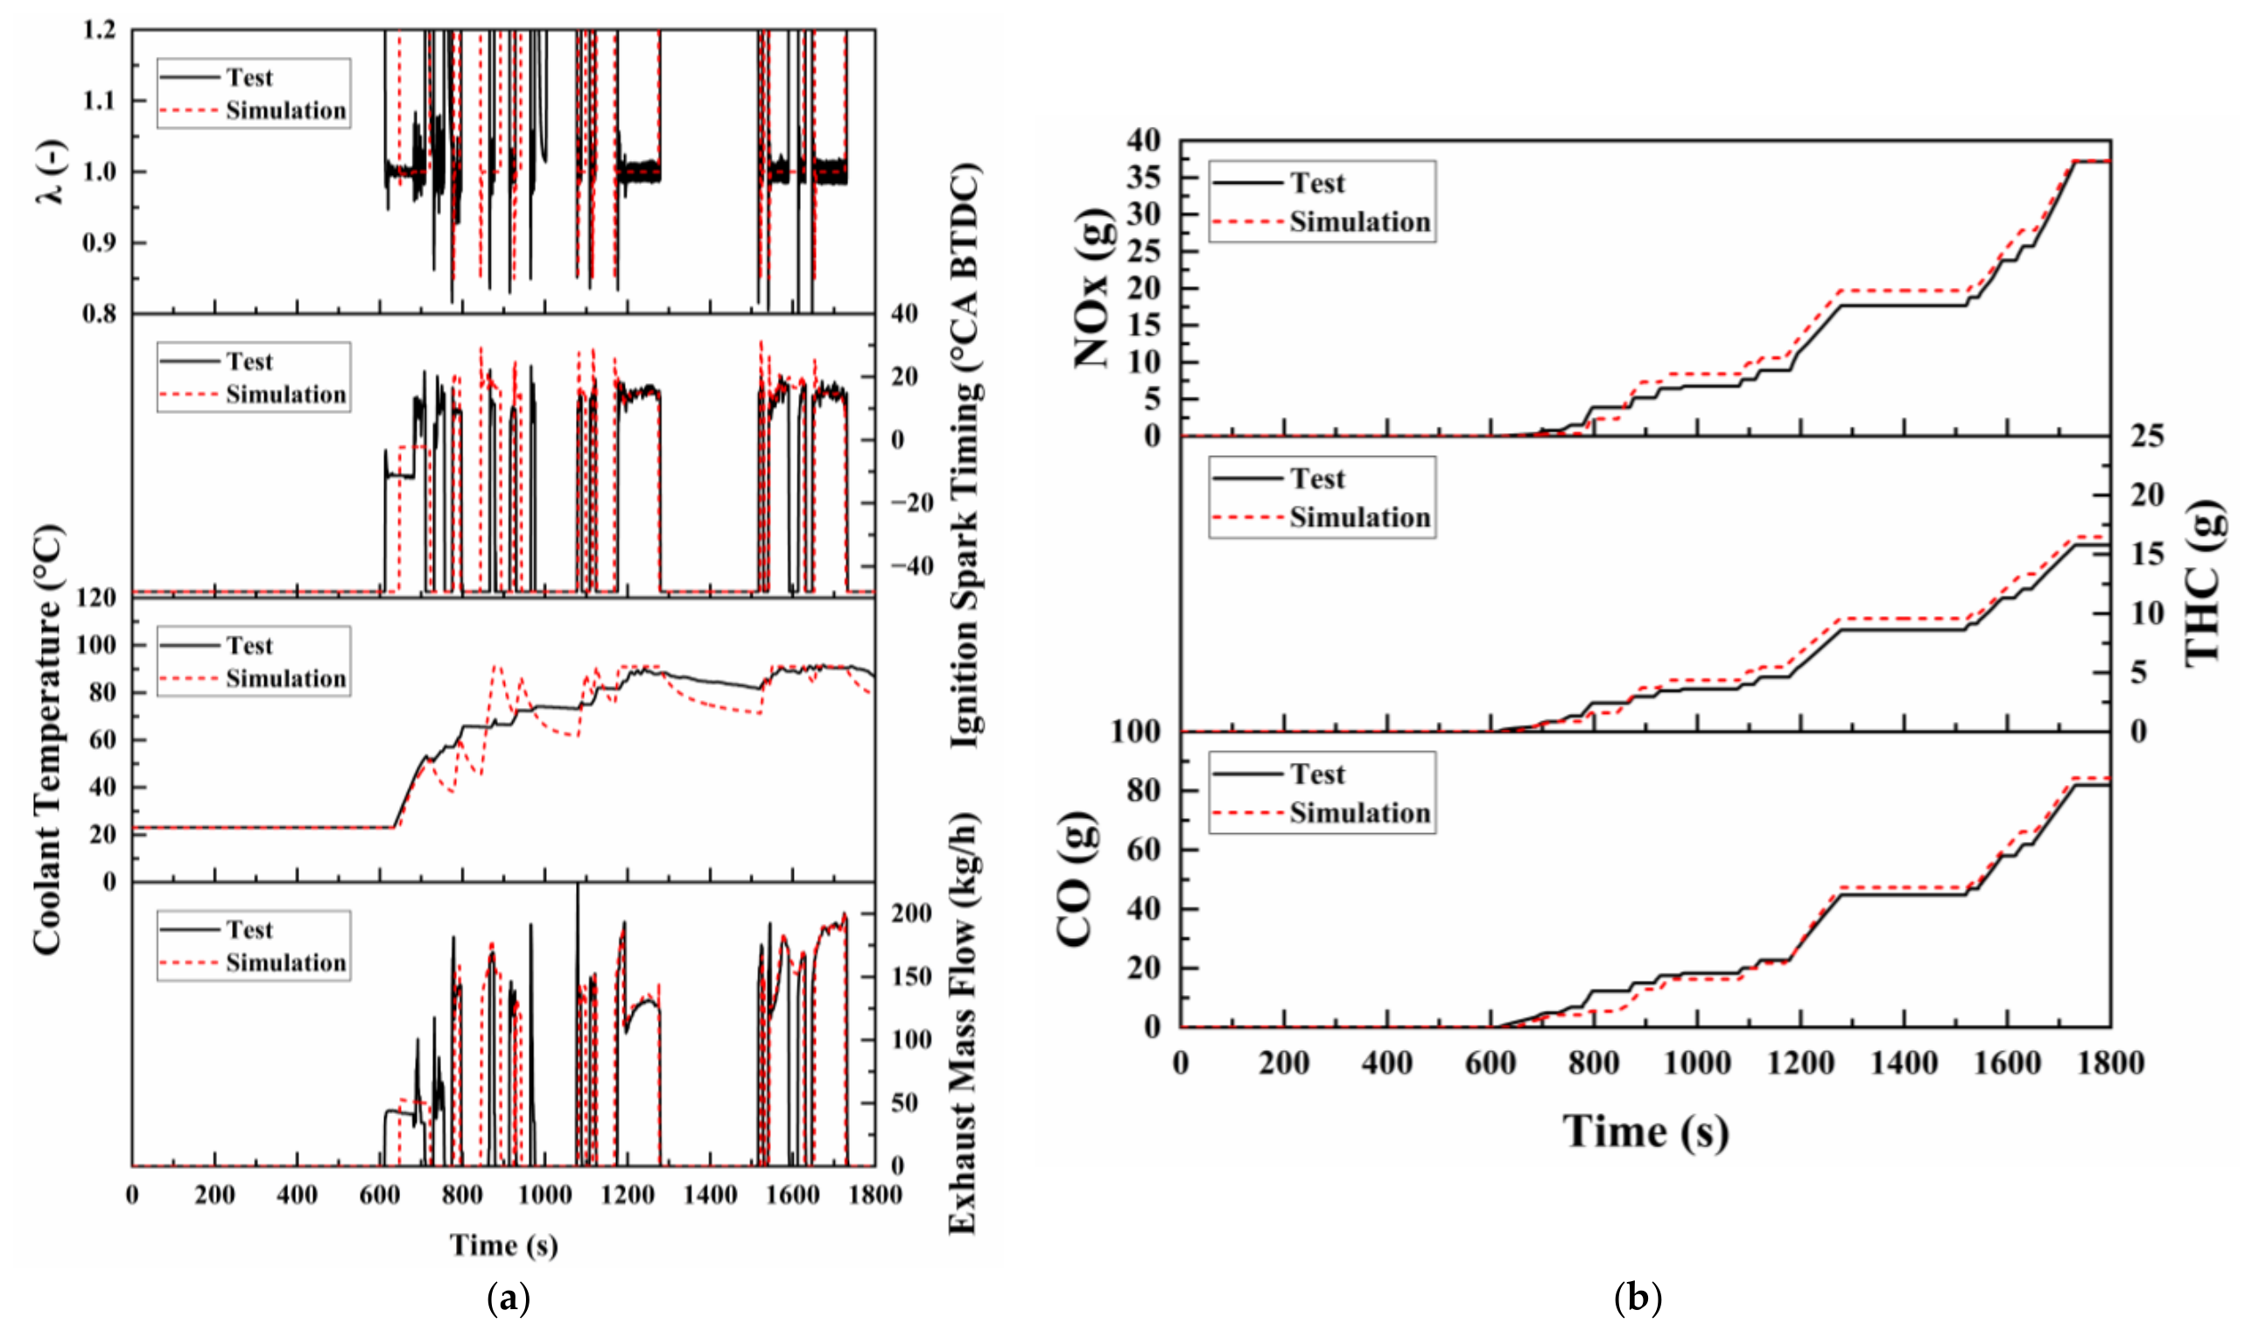
Second, the predicted λ, ignition timing, engine coolant temperature, exhaust mass flow rate, and engine-out emissions were compared with experimental measurements, as shown in Figure 8.
Figure 8.
Comparison of measured and simulated engine operating boundary conditions and engine-out emissions over the WLTC: (a) comparison of measured and simulated λ, ignition timing, engine coolant temperature, and exhaust mass flow rate; (b) comparison of measured and simulated engine-out emissions.
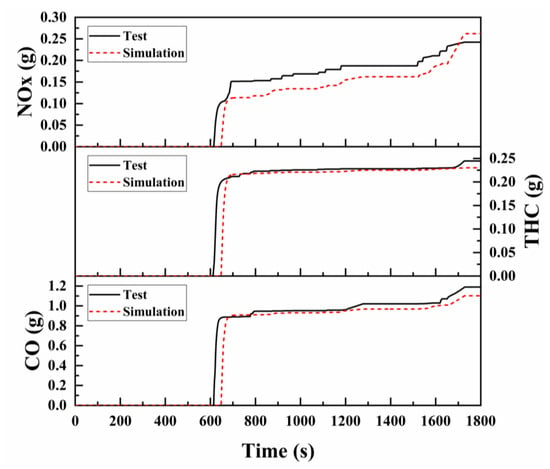
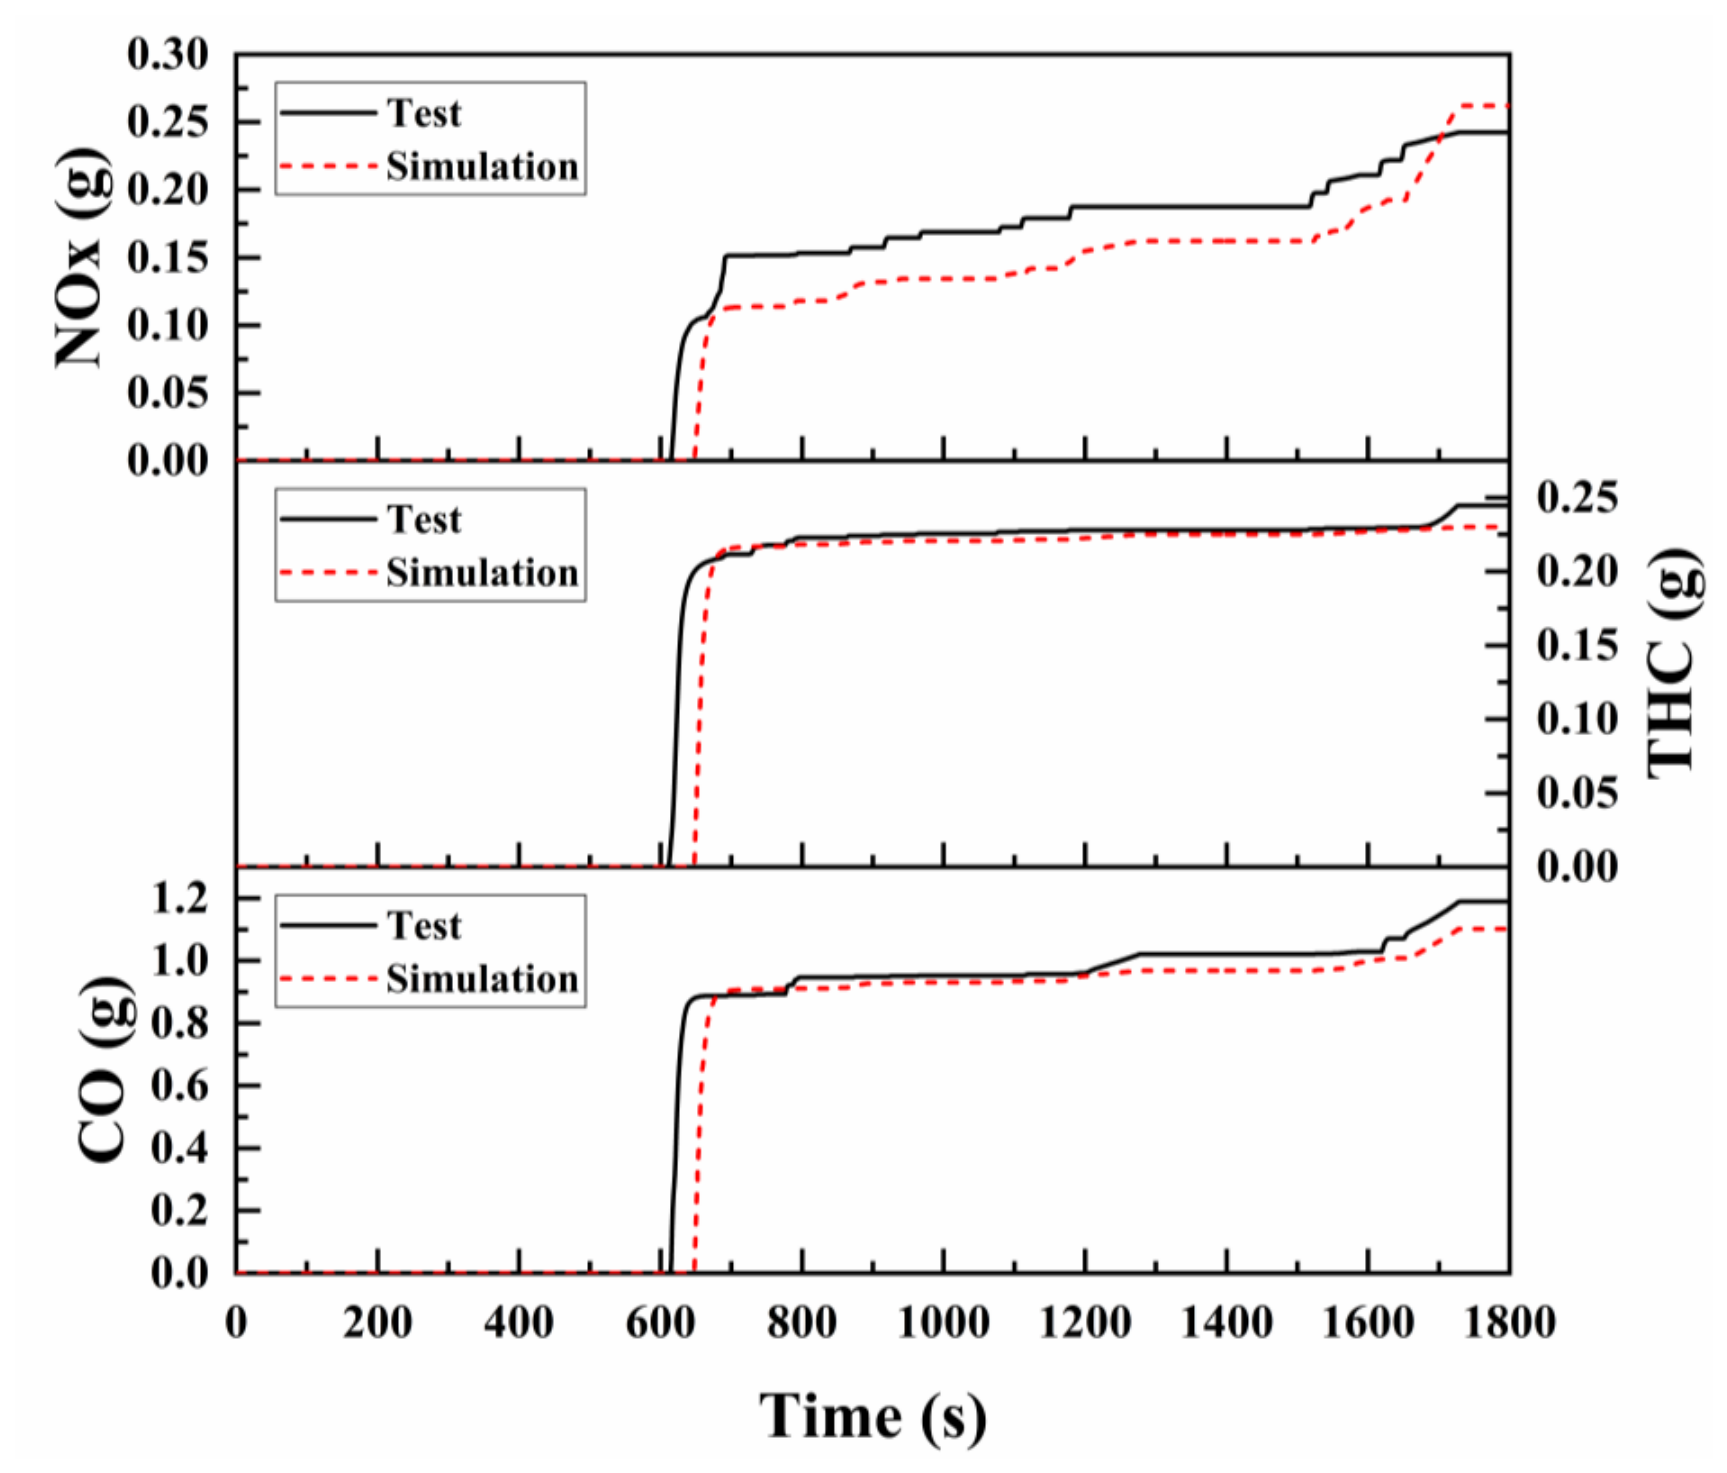
Finally, the simulated cumulative CO, THC, and NOx emissions downstream of the cGPF were compared with the corresponding experimental measurements, as shown in Figure 9.
Figure 9.
Comparison of measured and simulated cumulative tailpipe emissions downstream of the cGPF over the WLTC.
The model reproduced the principal engine start–stop events, load variations, and changes in thermal state over the WLTC. The predicted exhaust mass flow rate, λ, and engine-out emission trends were generally consistent with the measurements. The simulated cumulative emissions downstream of the cGPF also agreed with the experimental results, indicating that the model captured the overall transient emission behavior of the coupled TWC and cGPF system.
3. Results and Discussion
3.1. Light-Off Characteristics Under Two Representative Flow Conditions
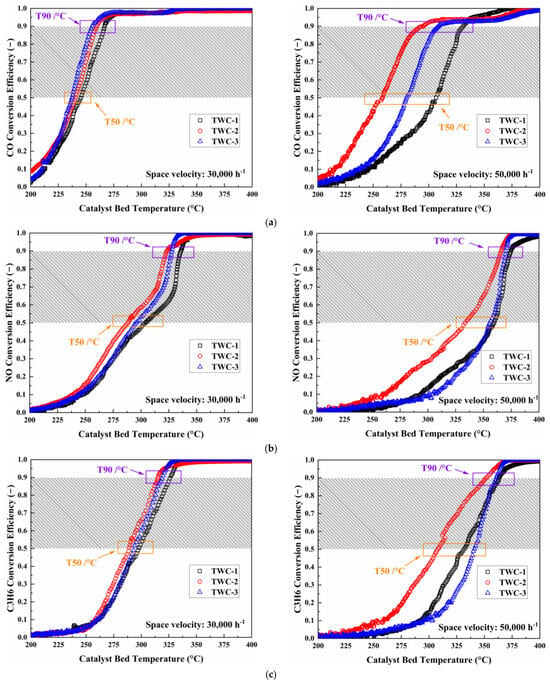
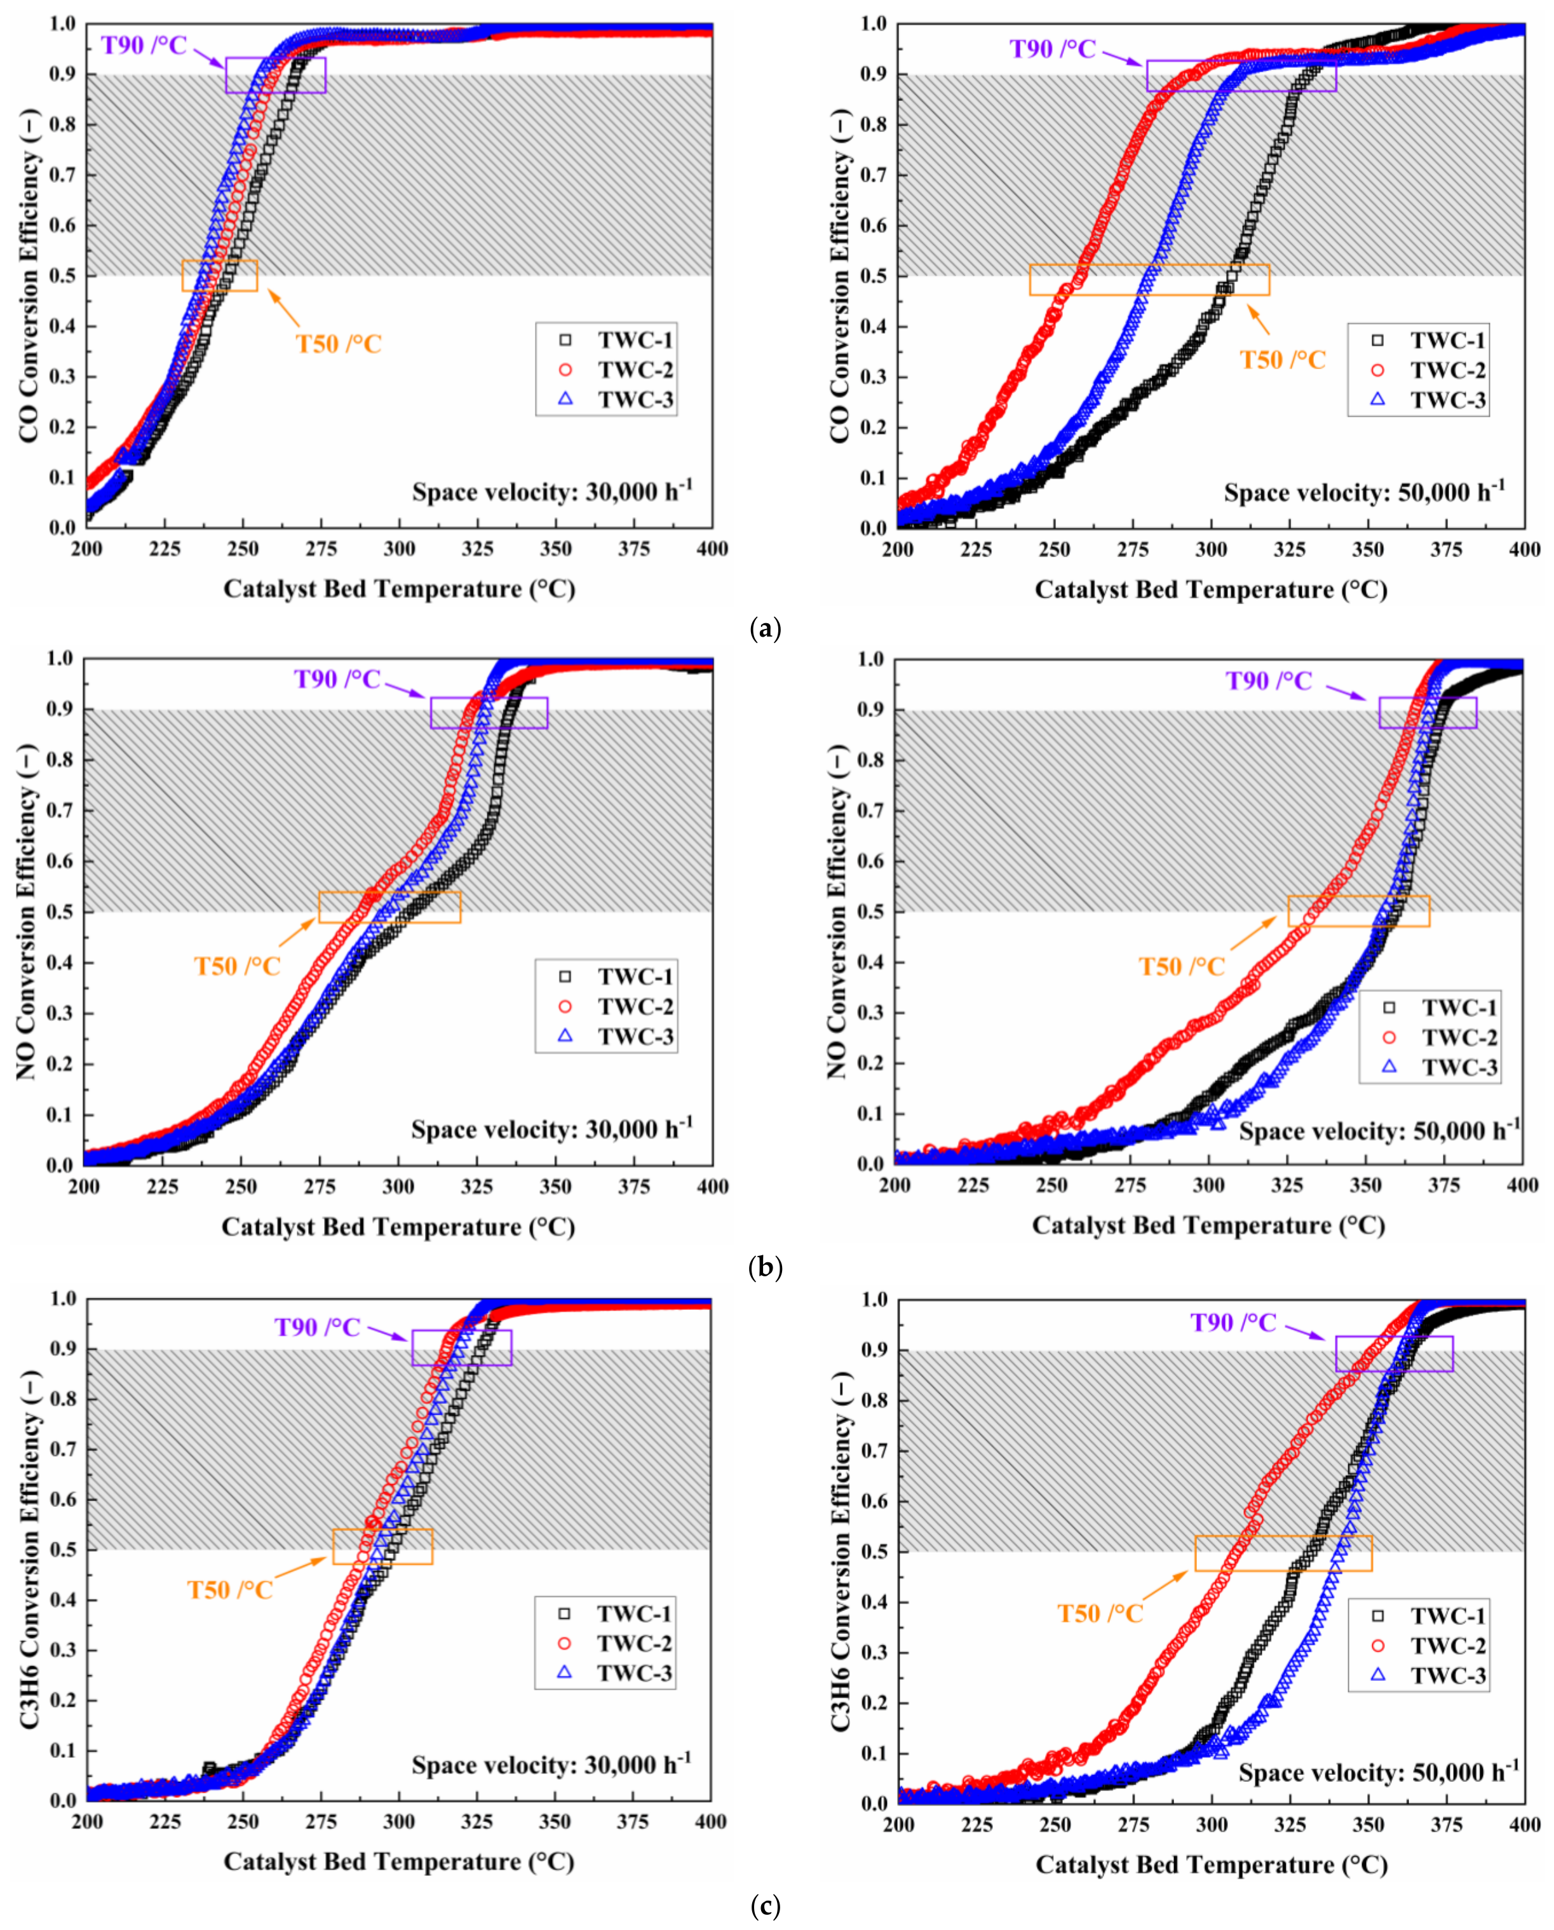
Figure 10 compares the light-off characteristics of the three TWC formulations under two representative test conditions at GHSVs of 30,000 and 50,000 h−1. Because the inlet compositions also differed between the two conditions, the observed changes reflect their combined effects rather than the independent effect of GHSV alone.
Figure 10.
Light-off conversion curves of the TWC configurations at different space velocities: (a) CO conversion efficiency; (b) NO conversion efficiency; (c) C3H6 conversion efficiency.
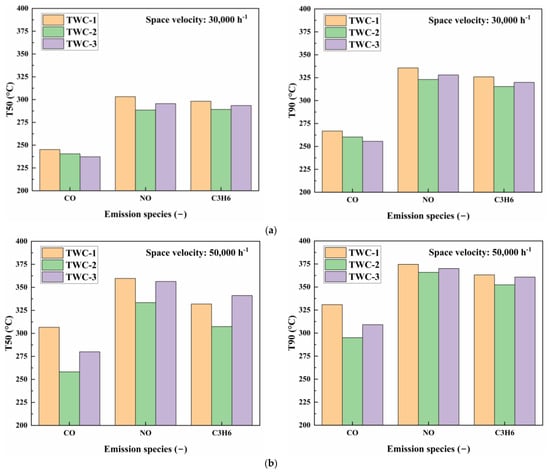
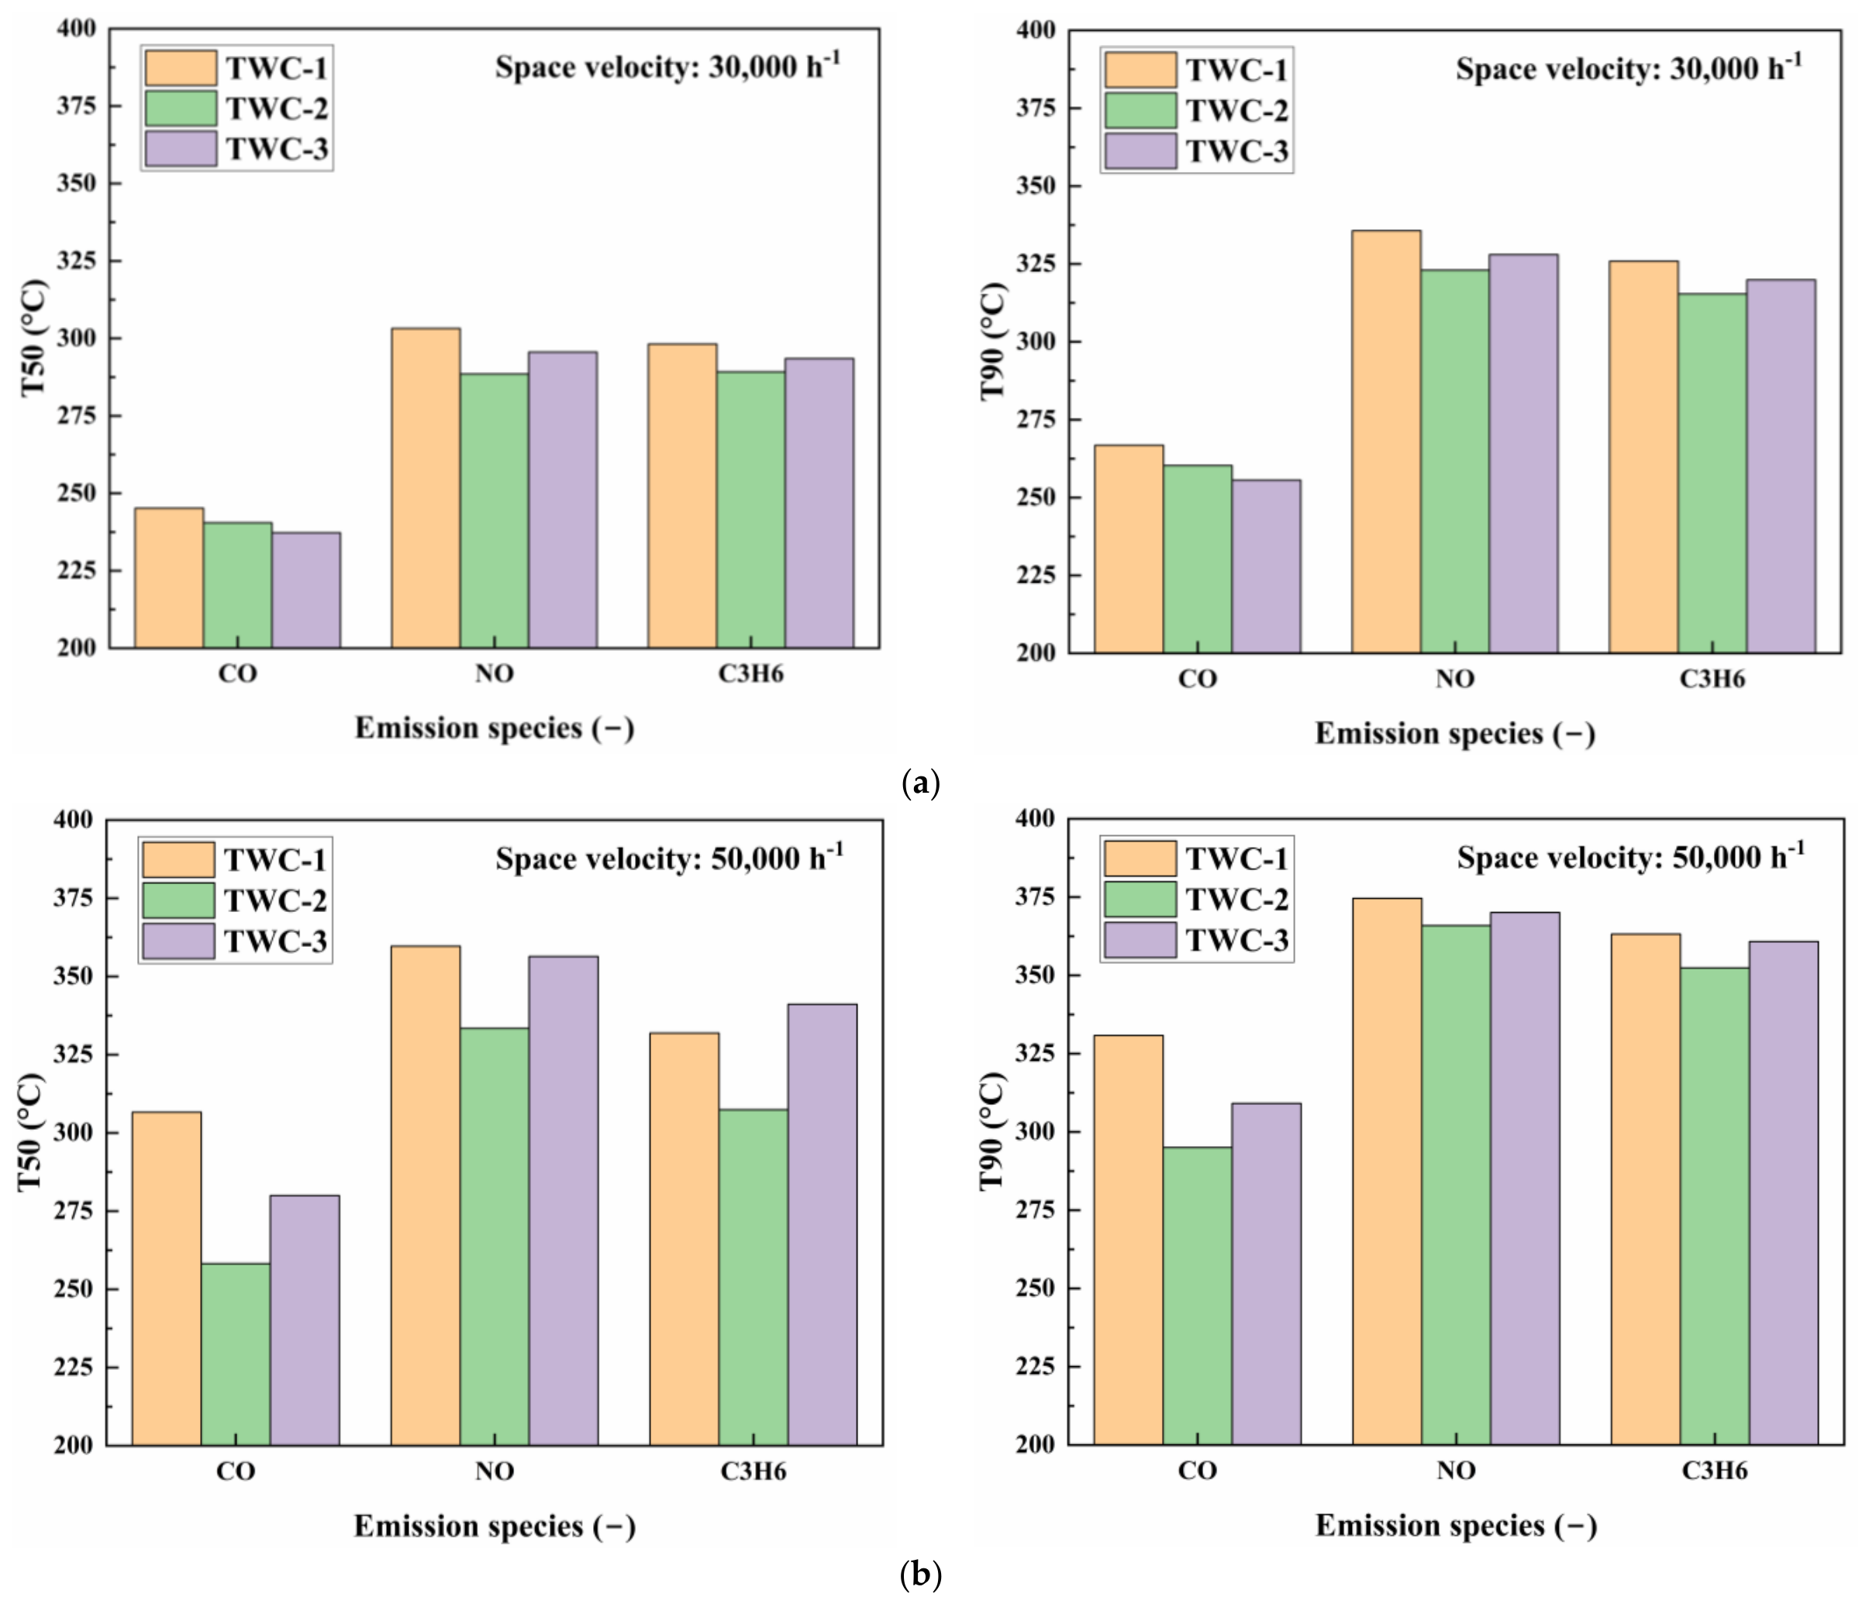
At 30,000 h−1, CO light-off generally improved from TWC-1 to TWC-3. The CO T50 decreased from 245.2 °C for TWC-1 to 237.3 °C for TWC-3, while T90 decreased from 266.8 to 255.6 °C, as shown in Figure 11a. This trend is consistent with the progressively higher Pd loading of the three formulations and the principal role of Pd in CO oxidation. The responses of C3H6 and NO were different. TWC-2 exhibited the lowest T50 values for both NO and C3H6 (288.5 and 289.2 °C, respectively), compared with 295.6 and 293.5 °C for TWC-3. Thus, the additional precious-metal loading of TWC-3 did not translate into lower light-off temperatures for all pollutants.
Figure 11.
Comparison of T50 and T90 values for the different TWC configurations: (a) comparison of T50 and T90 at 30,000 h−1; (b) comparison of T50 and T90 at 50,000 h−1.
The distinction among the formulations became clearer at 50,000 h−1. As shown in Figure 10 and Figure 11b, TWC-2 had the lowest T50 and T90 values for all three pollutants; its T50 values for CO, NO, and C3H6 were 258.2, 333.4, and 307.4 °C, respectively. In contrast, the NO and C3H6 T50 values of TWC-3 increased to 356.4 and 341.1 °C. The higher flow rate therefore changed the CO light-off ranking observed at 30,000 h−1 and exposed differences in the ability of the formulations to use their active components under residence-time-limited conditions.
The light-off results demonstrate that the formulation ranking was condition- and pollutant-dependent. TWC-3 provided the best CO light-off at 30,000 h−1, but this local advantage did not extend to C3H6 and NO or to the 50,000 h−1 condition. TWC-2 instead provided the most balanced low-temperature activity across the three pollutants. Therefore, selecting a formulation solely from CO light-off at one test condition would have favored TWC-3, whereas the broader multi-pollutant assessment identified TWC-2 as the more robust formulation.
3.2. Coupled Effects of Temperature and Space Velocity
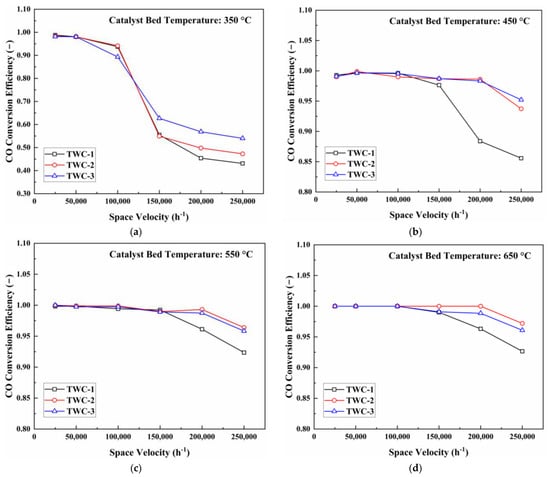
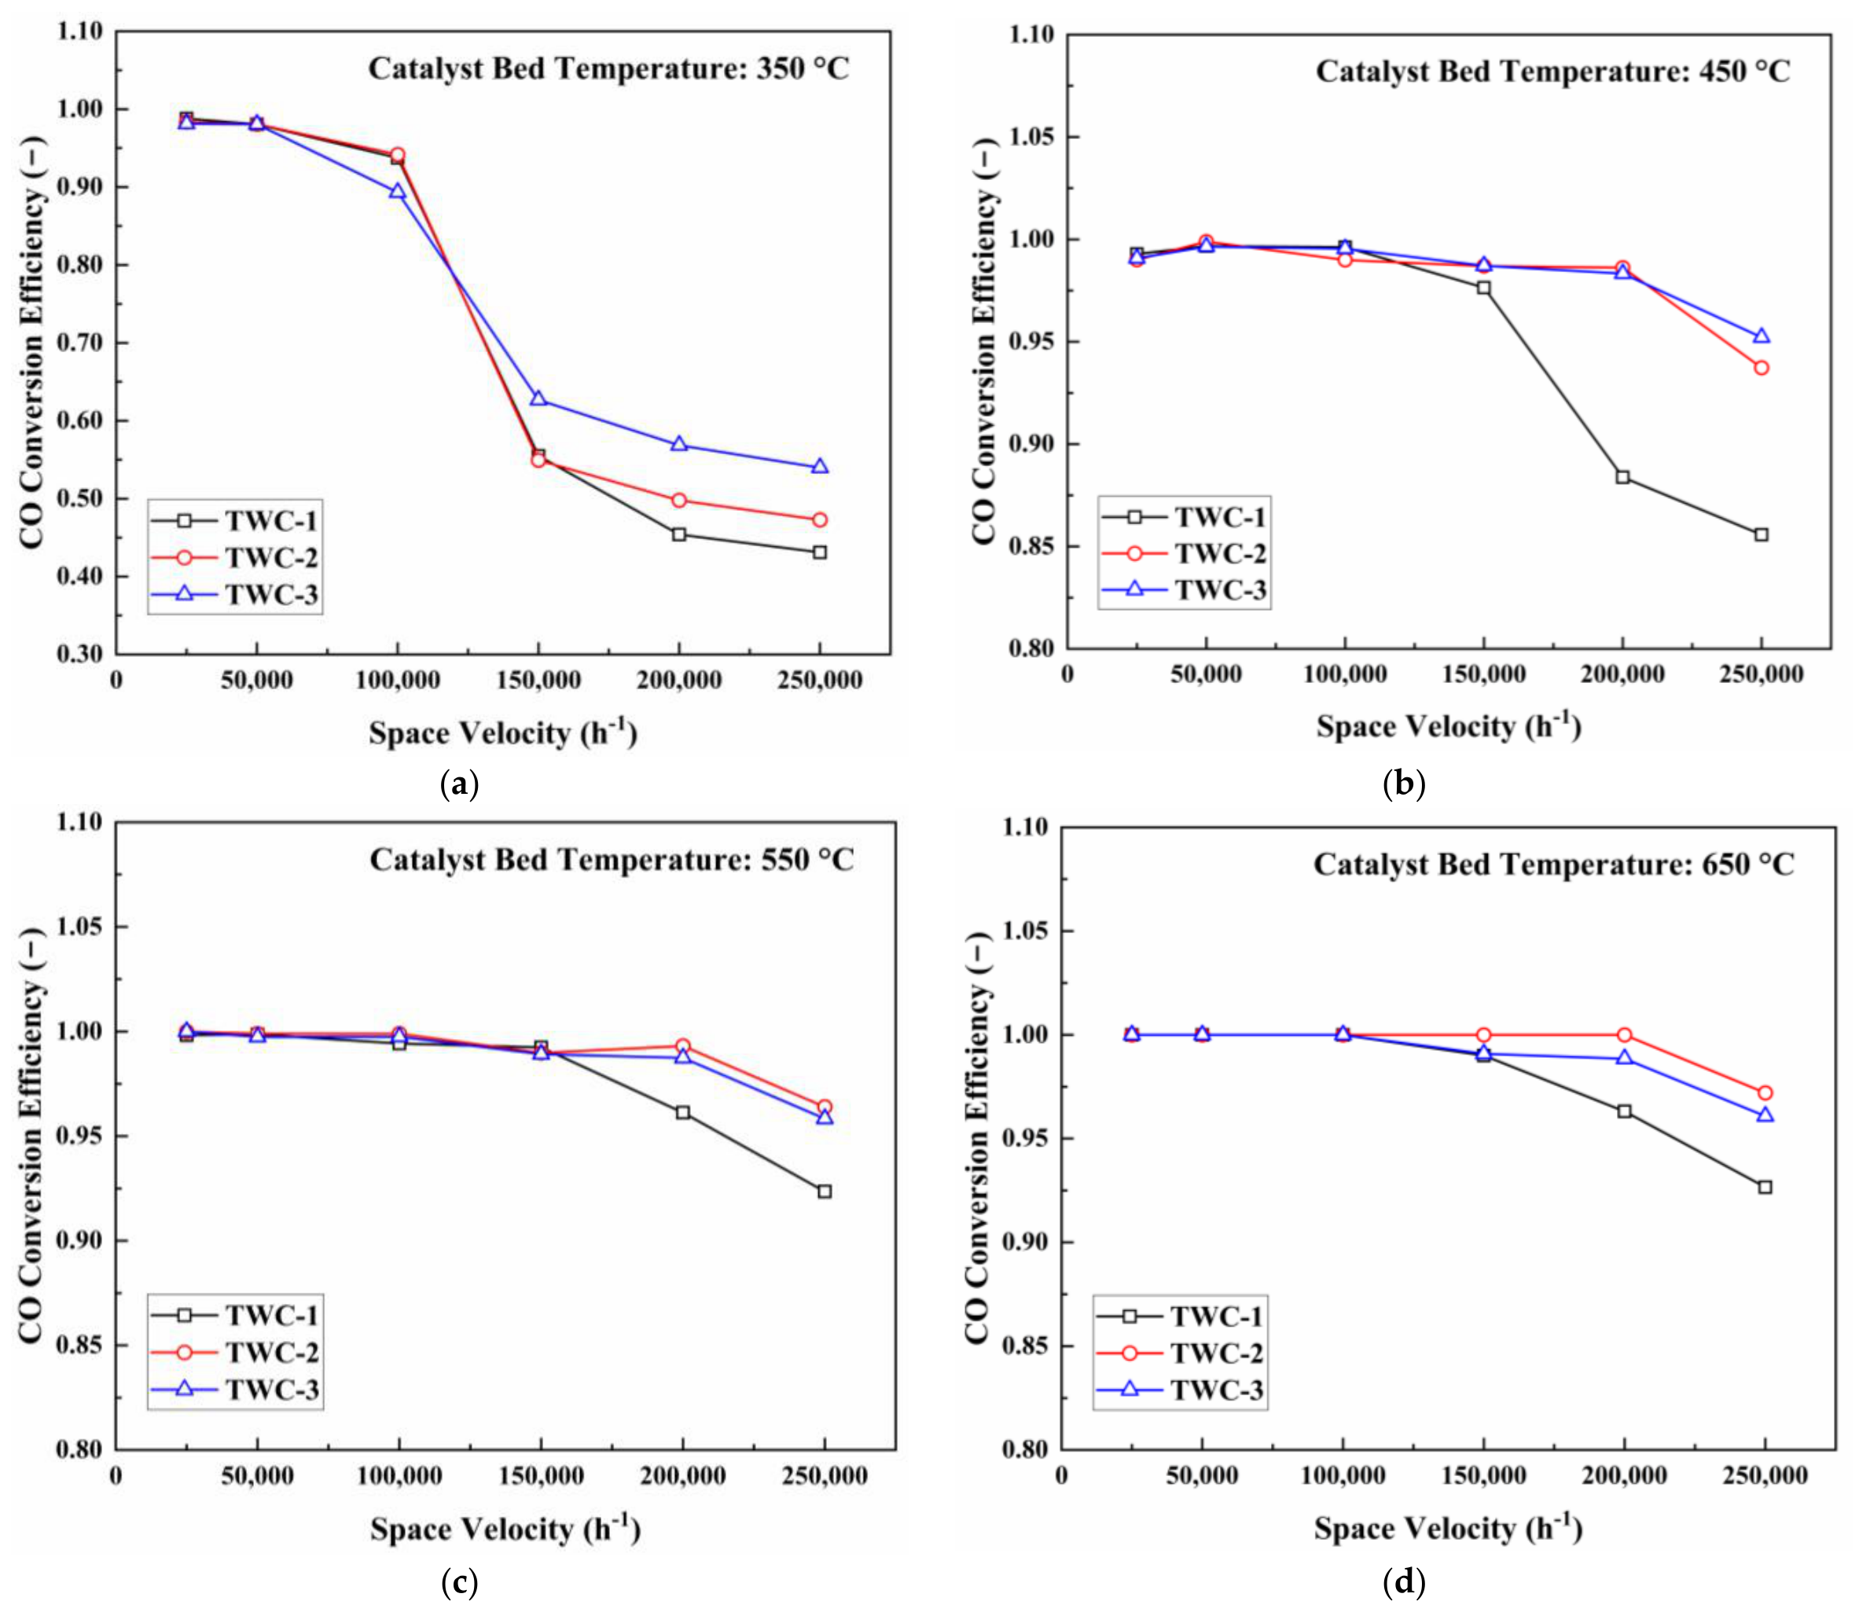
Light-off temperatures describe catalyst activation during heating, but they do not fully represent conversion after activation under rapidly changing exhaust flow. Figure 12, Figure 13 and Figure 14 therefore show the conversion of CO, C3H6, and NO as a function of space velocity at catalyst-bed temperatures of 350, 450, 550, and 650 °C. These tests extend the light-off results by separating two limiting regimes: a kinetically constrained regime at low temperature and a residence-time-constrained regime at high space velocity.
Figure 12.
CO conversion as a function of space velocity at different catalyst-bed temperatures: (a) 350 °C; (b) 450 °C; (c) 550 °C; (d) 650 °C.
Figure 13.
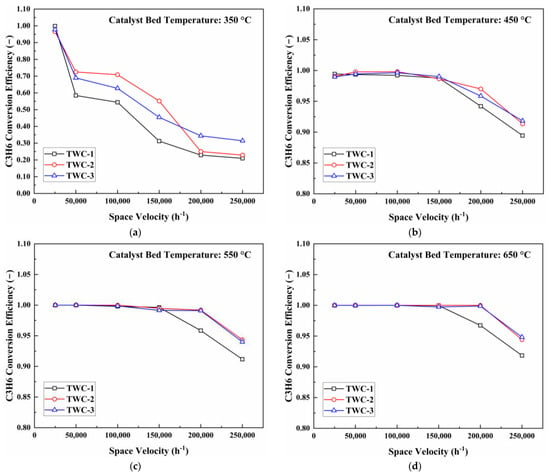
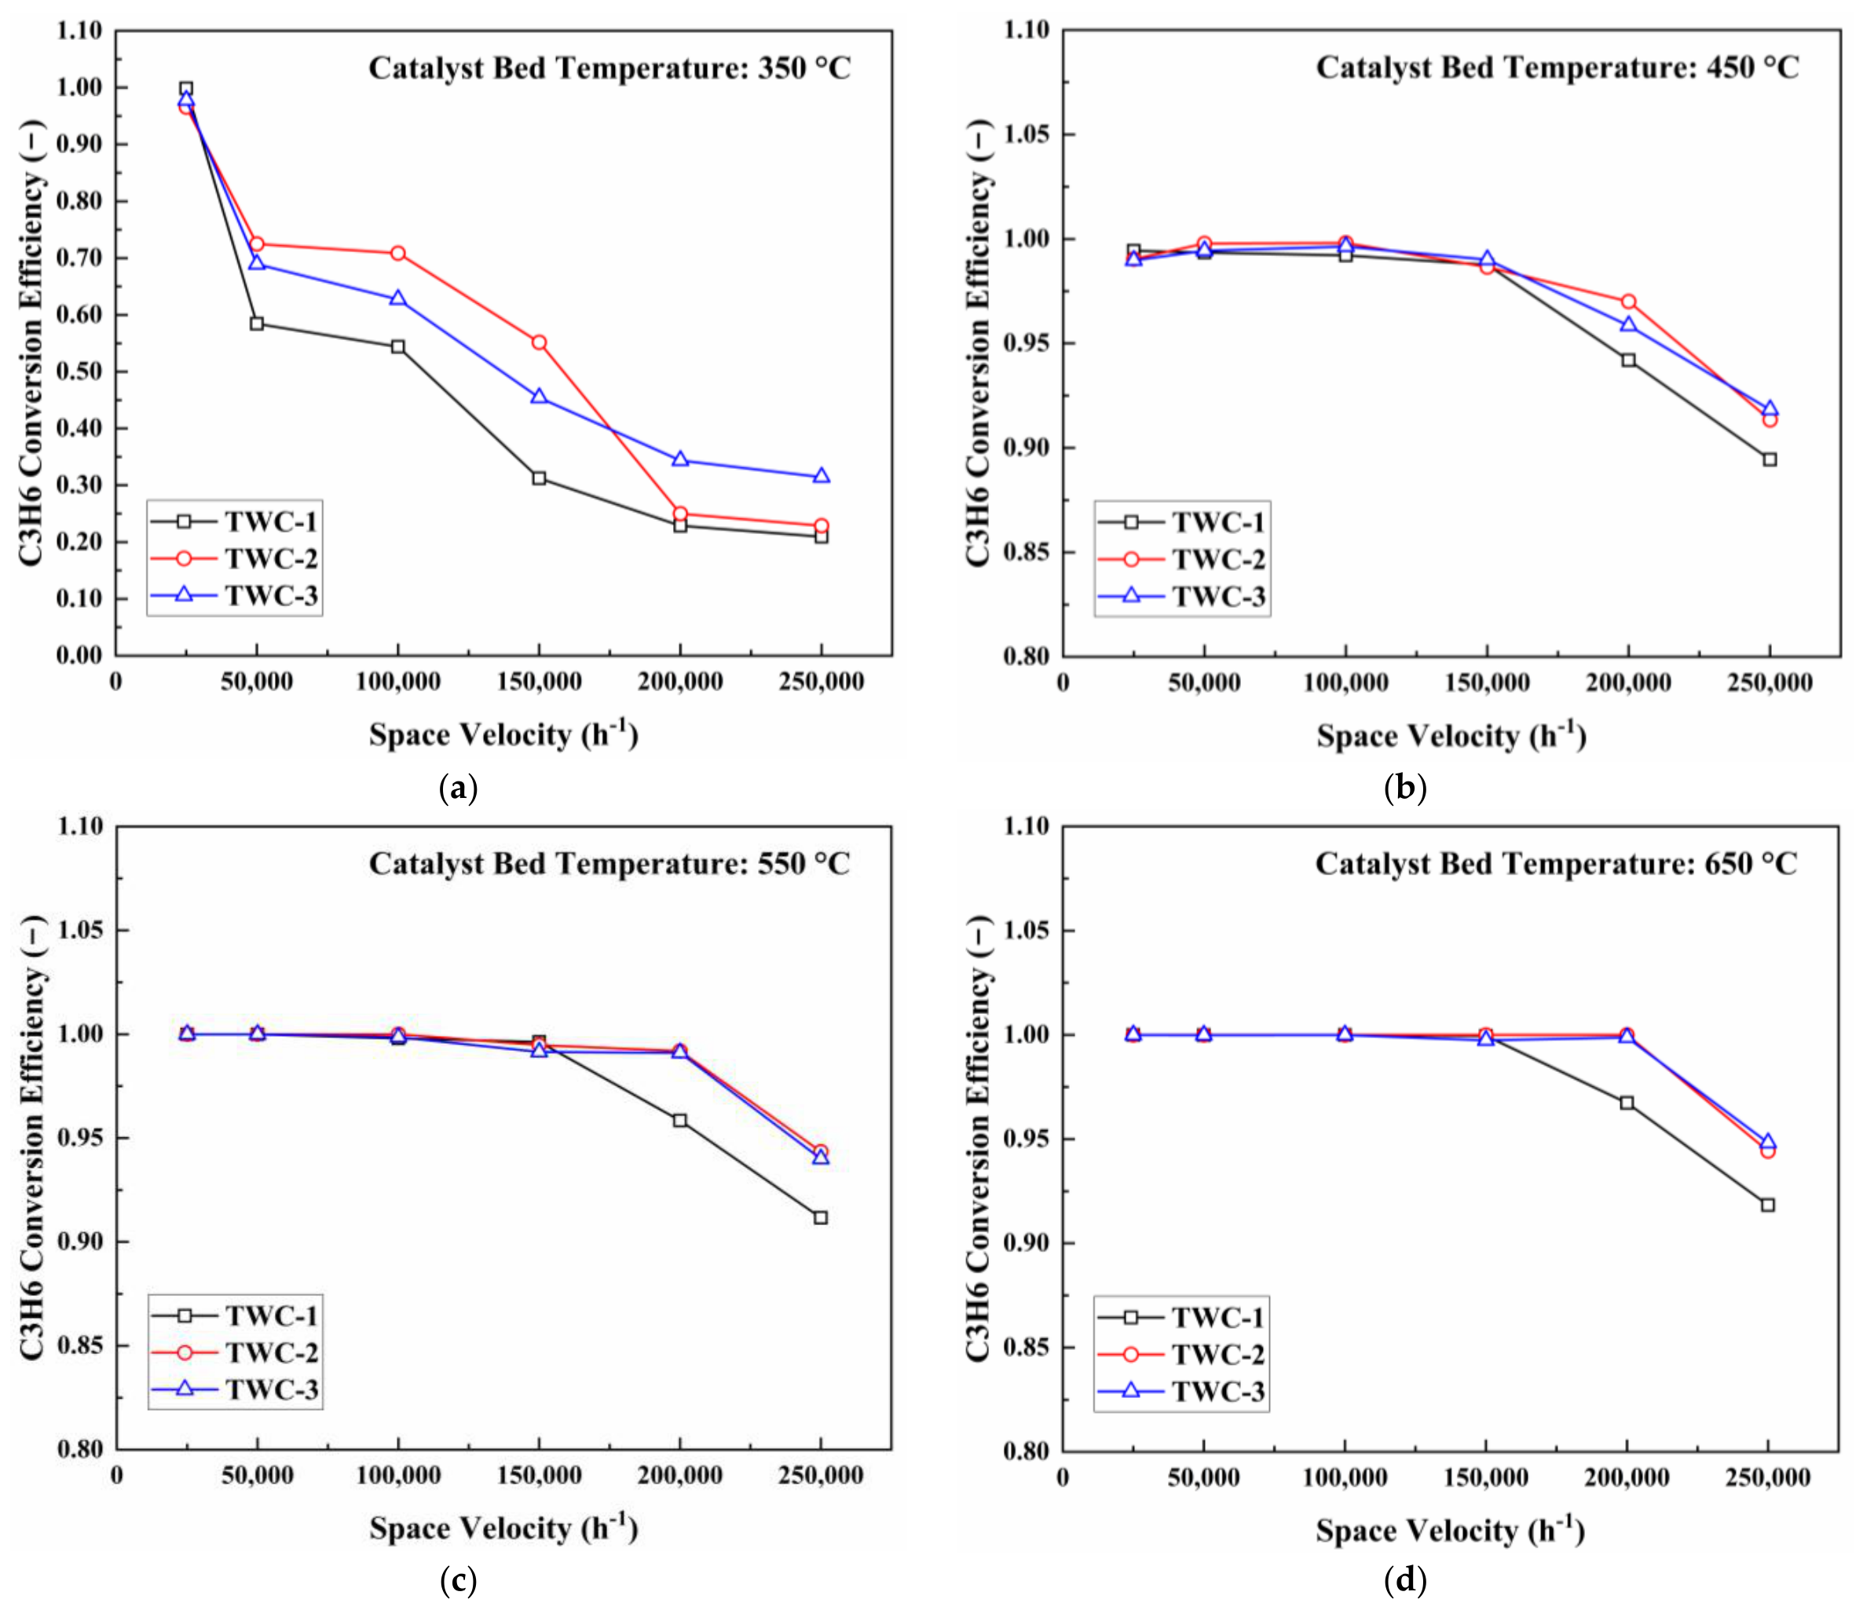
C3H6 conversion as a function of space velocity at different catalyst-bed temperatures: (a) 350 °C; (b) 450 °C; (c) 550 °C; (d) 650 °C.
Figure 14.
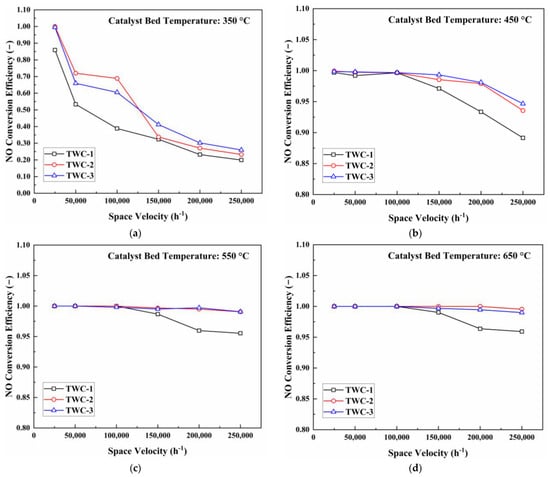
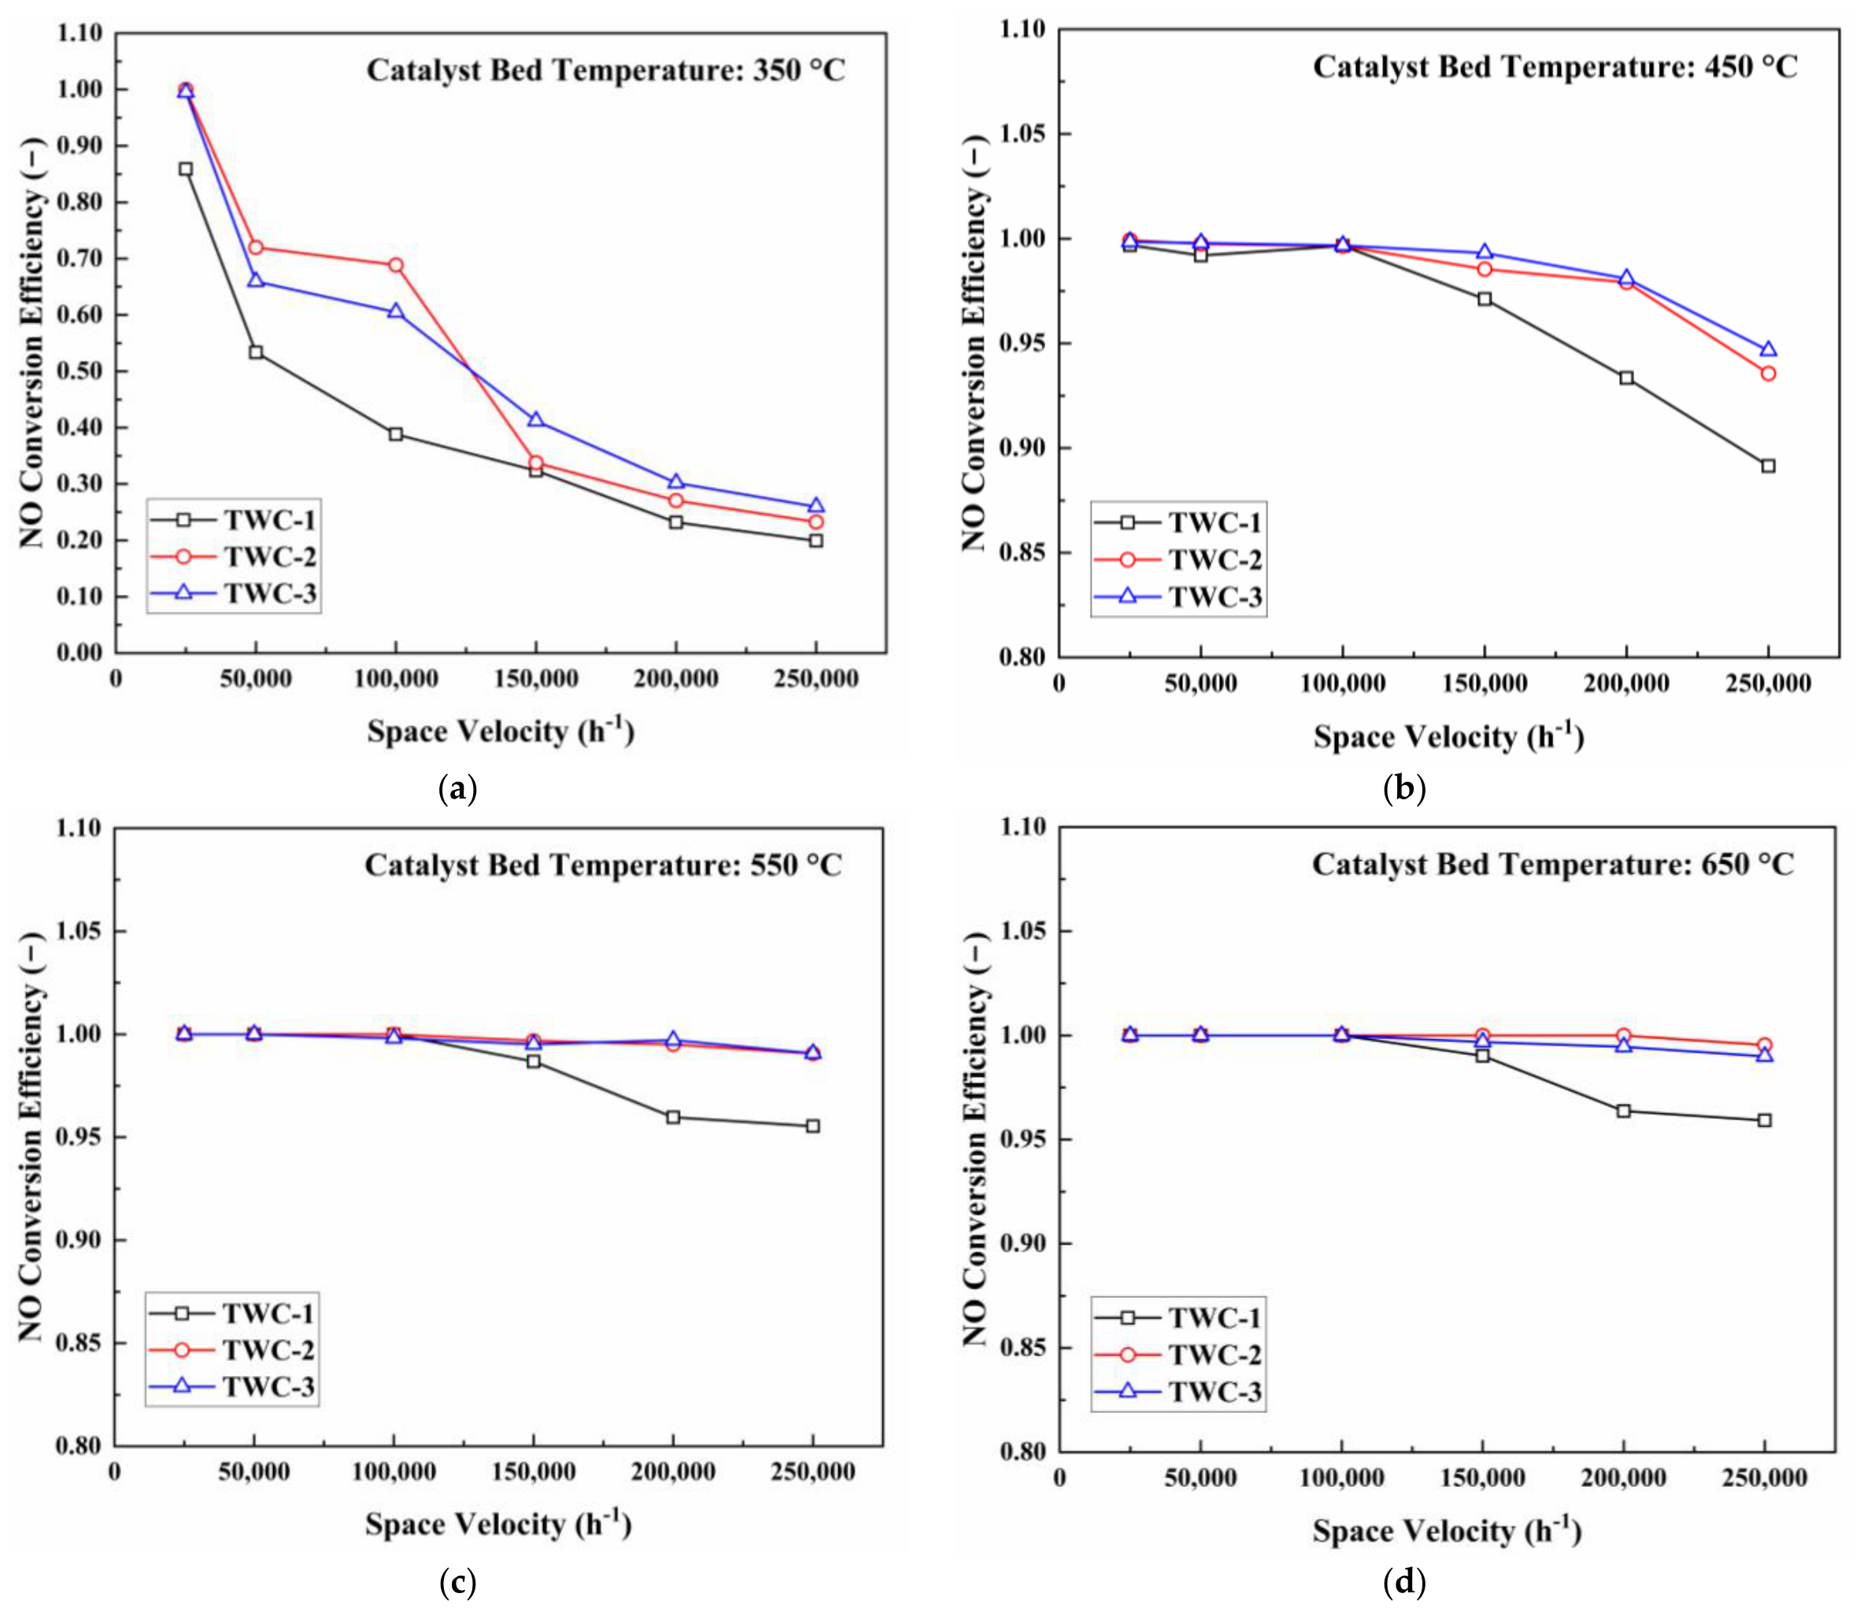
NO conversion as a function of space velocity at different catalyst-bed temperatures: (a) 350 °C; (b) 450 °C; (c) 550 °C; (d) 650 °C.
For all three pollutants, conversion decreased with increasing space velocity, and the decrease was greatest at 350 °C. At this temperature, reaction rates were still strongly temperature-dependent, so the reduction in residence time produced a pronounced loss of conversion. At 450 °C, higher intrinsic reaction rates moderated this effect. At 550 and 650 °C, the catalysts were largely activated, and formulation differences were mainly observed at the highest space velocities, where residence time rather than light-off temperature became the dominant constraint.
For CO as shown in Figure 12, TWC-1 showed the largest conversion loss at medium and high space velocities, particularly at 350 and 450 °C. The higher-Pd formulations, TWC-2 and TWC-3, maintained higher conversion under these conditions. However, once the catalysts were fully activated, TWC-3 did not consistently exceed TWC-2 at high space velocity. This result indicates diminishing benefit from the additional Pd loading when gas residence time, rather than the number of nominal active sites, limits overall conversion. Across the complete temperature–space-velocity domain, TWC-2 consequently combined favorable low-temperature activity with stable conversion at high flow rates.
C3H6 conversion (Figure 13) was more sensitive than CO conversion to the combined effects of low temperature and high space velocity. At 350 °C, conversion decreased rapidly with increasing space velocity for all three formulations, with the greatest deterioration observed for TWC-1. TWC-2 and TWC-3 maintained higher conversion, but the additional Pd loading of TWC-3 did not yield a systematic advantage over TWC-2. At 550 and 650 °C, differences were small at low and moderate space velocities and re-emerged only at the highest flow rates. The C3H6 results therefore support the light-off observation that hydrocarbon conversion is governed by the effective formulation response over the operating domain and cannot be inferred from total Pd loading alone.
As shown in Figure 14, NO conversion increased with catalyst temperature and decreased with space velocity. Unlike CO and C3H6 removal, NO conversion relies primarily on reduction reactions and is therefore strongly affected by Rh-related active sites, the Pd/Rh ratio, and the availability of reducing species. At 350 °C, TWC-1 deteriorated rapidly as space velocity increased, whereas TWC-2 exceeded TWC-3 at low and moderate space velocities despite its lower total precious-metal loading. At 450 °C, both TWC-2 and TWC-3 clearly outperformed TWC-1, but TWC-3 again showed no consistent advantage over TWC-2. At 550 and 650 °C, high conversion was maintained at low and moderate space velocities, while the formulations remained distinguishable at high space velocity. This response is consistent with the established role of Rh-containing sites and the influence of Pd/Rh balance on NO reduction, although their individual contributions cannot be isolated using the present formulation matrix.
Taken together, Figure 12, Figure 13 and Figure 14 show that the formulation ranking depends on the limiting regime. The low loading of TWC-1 was most detrimental when low temperature and short residence time acted simultaneously. TWC-3 could provide a local advantage for CO oxidation, but its higher total loading did not ensure superior C3H6 or NO conversion. TWC-2 exhibited the broadest region of simultaneously high conversion and the smallest overall sensitivity to increasing space velocity. This operating-domain behavior provides the first link between the bench measurements and the driving-cycle results: a formulation that remains effective over a wide temperature–space-velocity domain should be less susceptible to emission breakthrough when exhaust flow changes rapidly after light-off.
3.3. Effect of λ Under Different Space Velocities
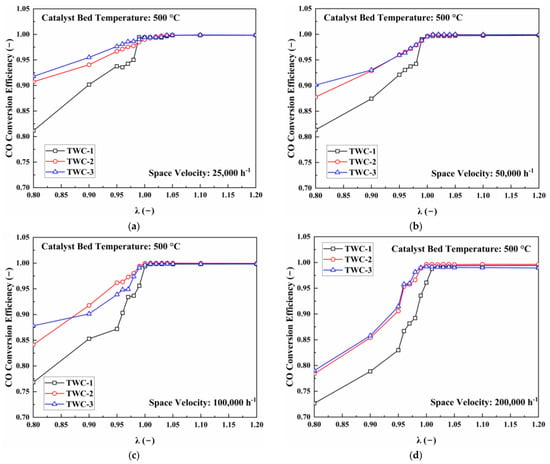
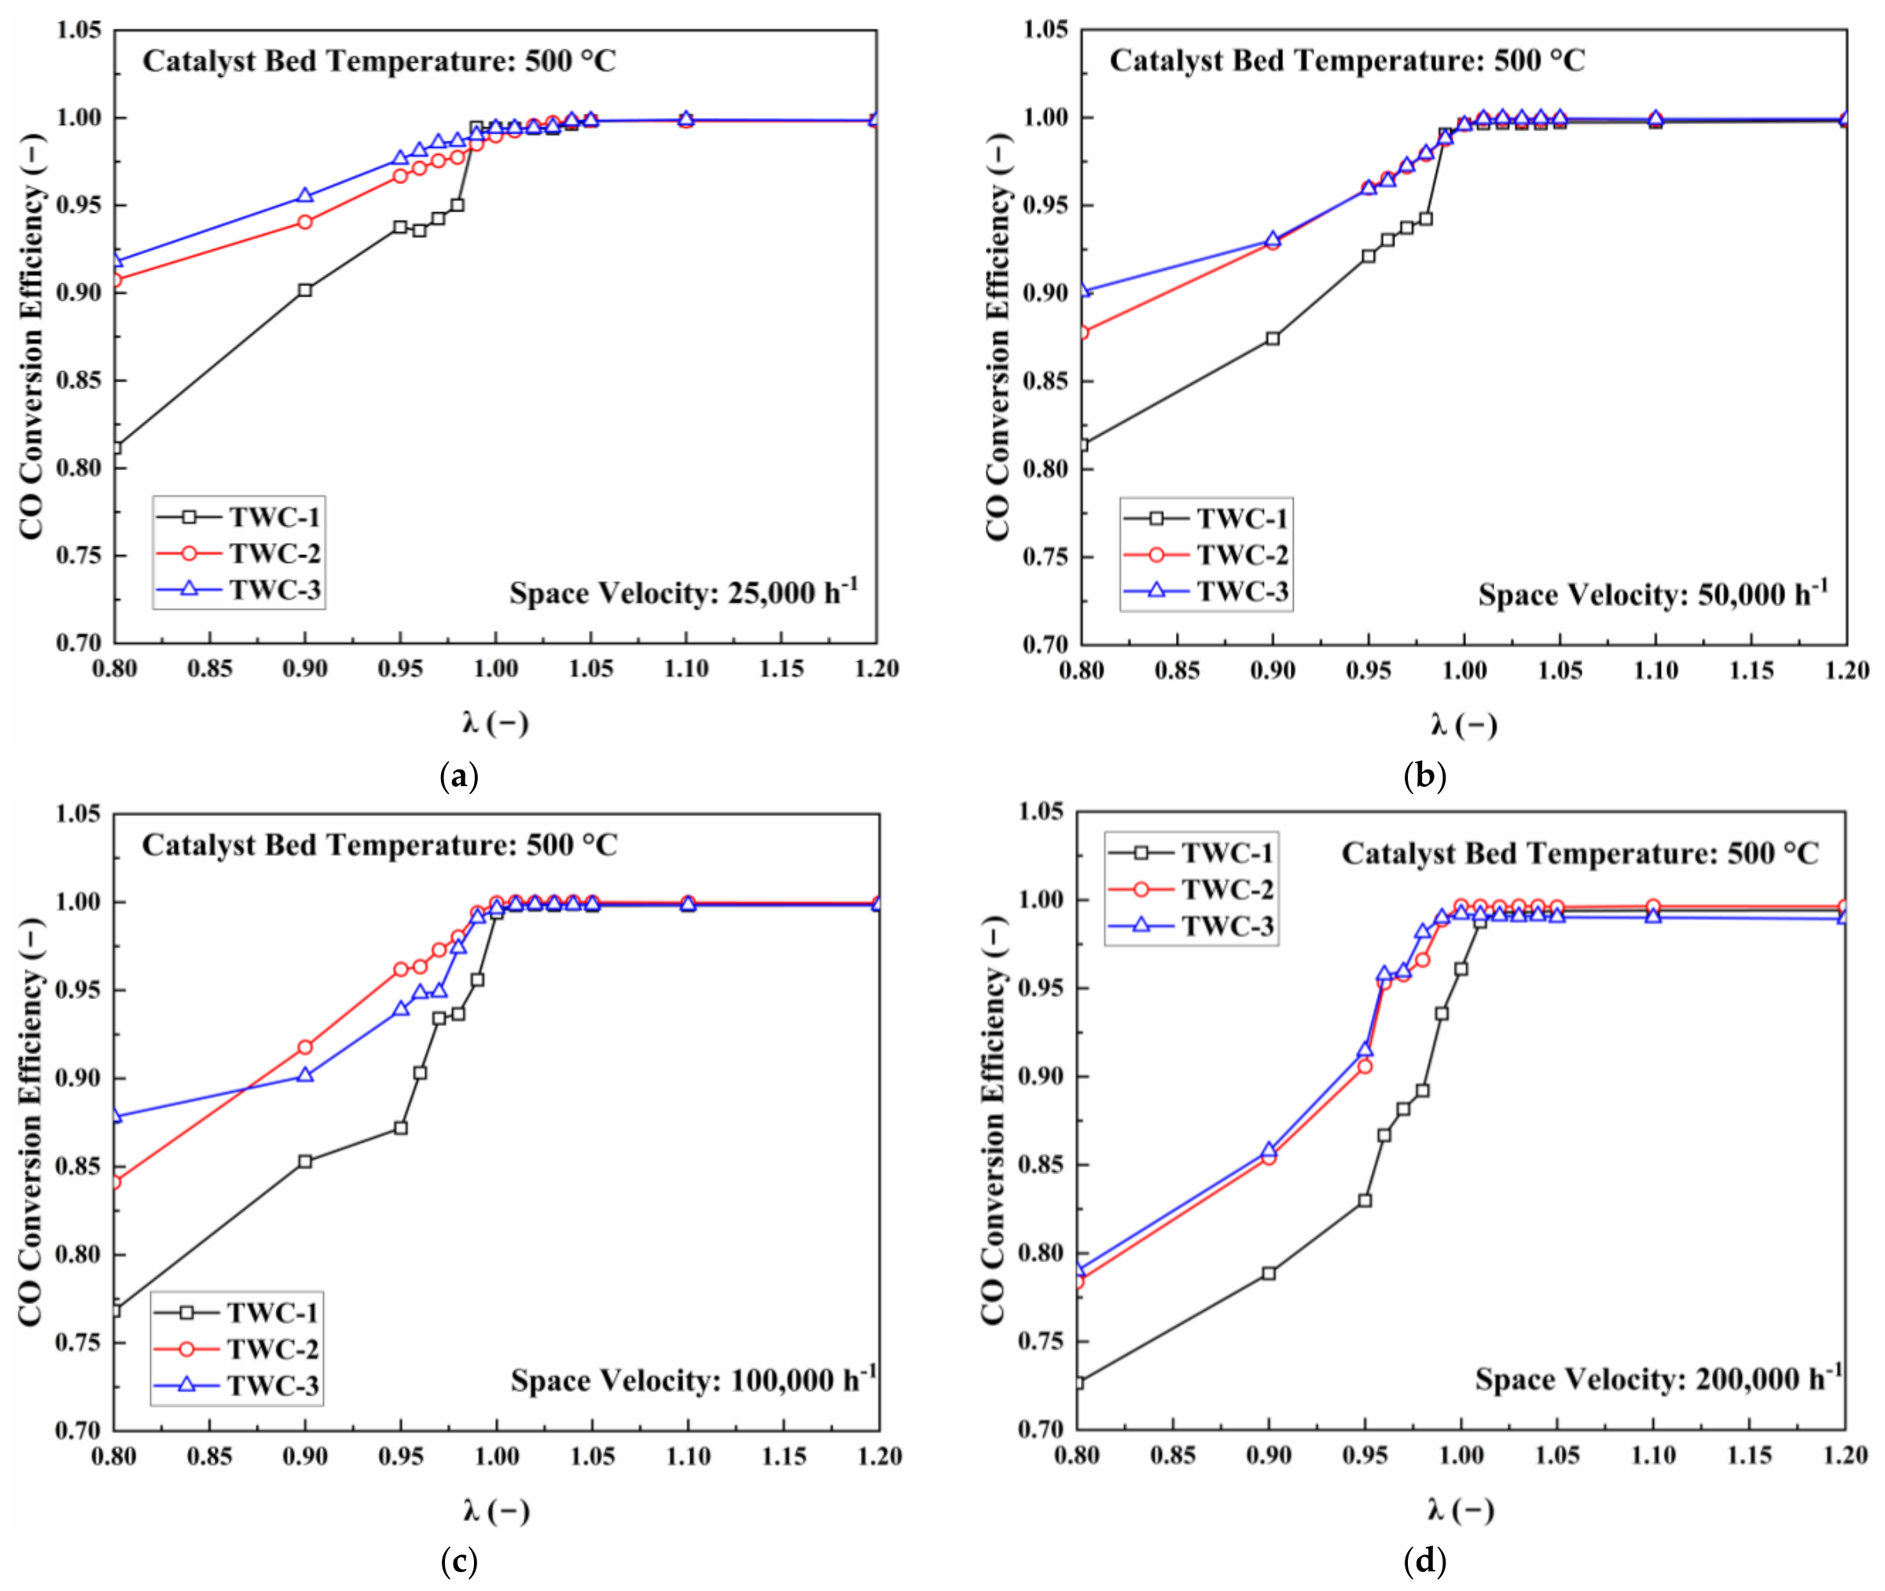
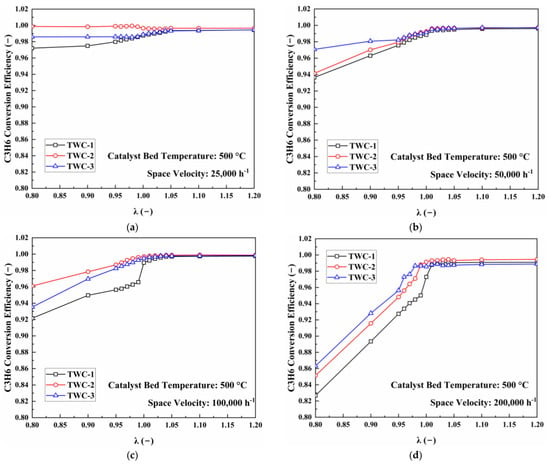
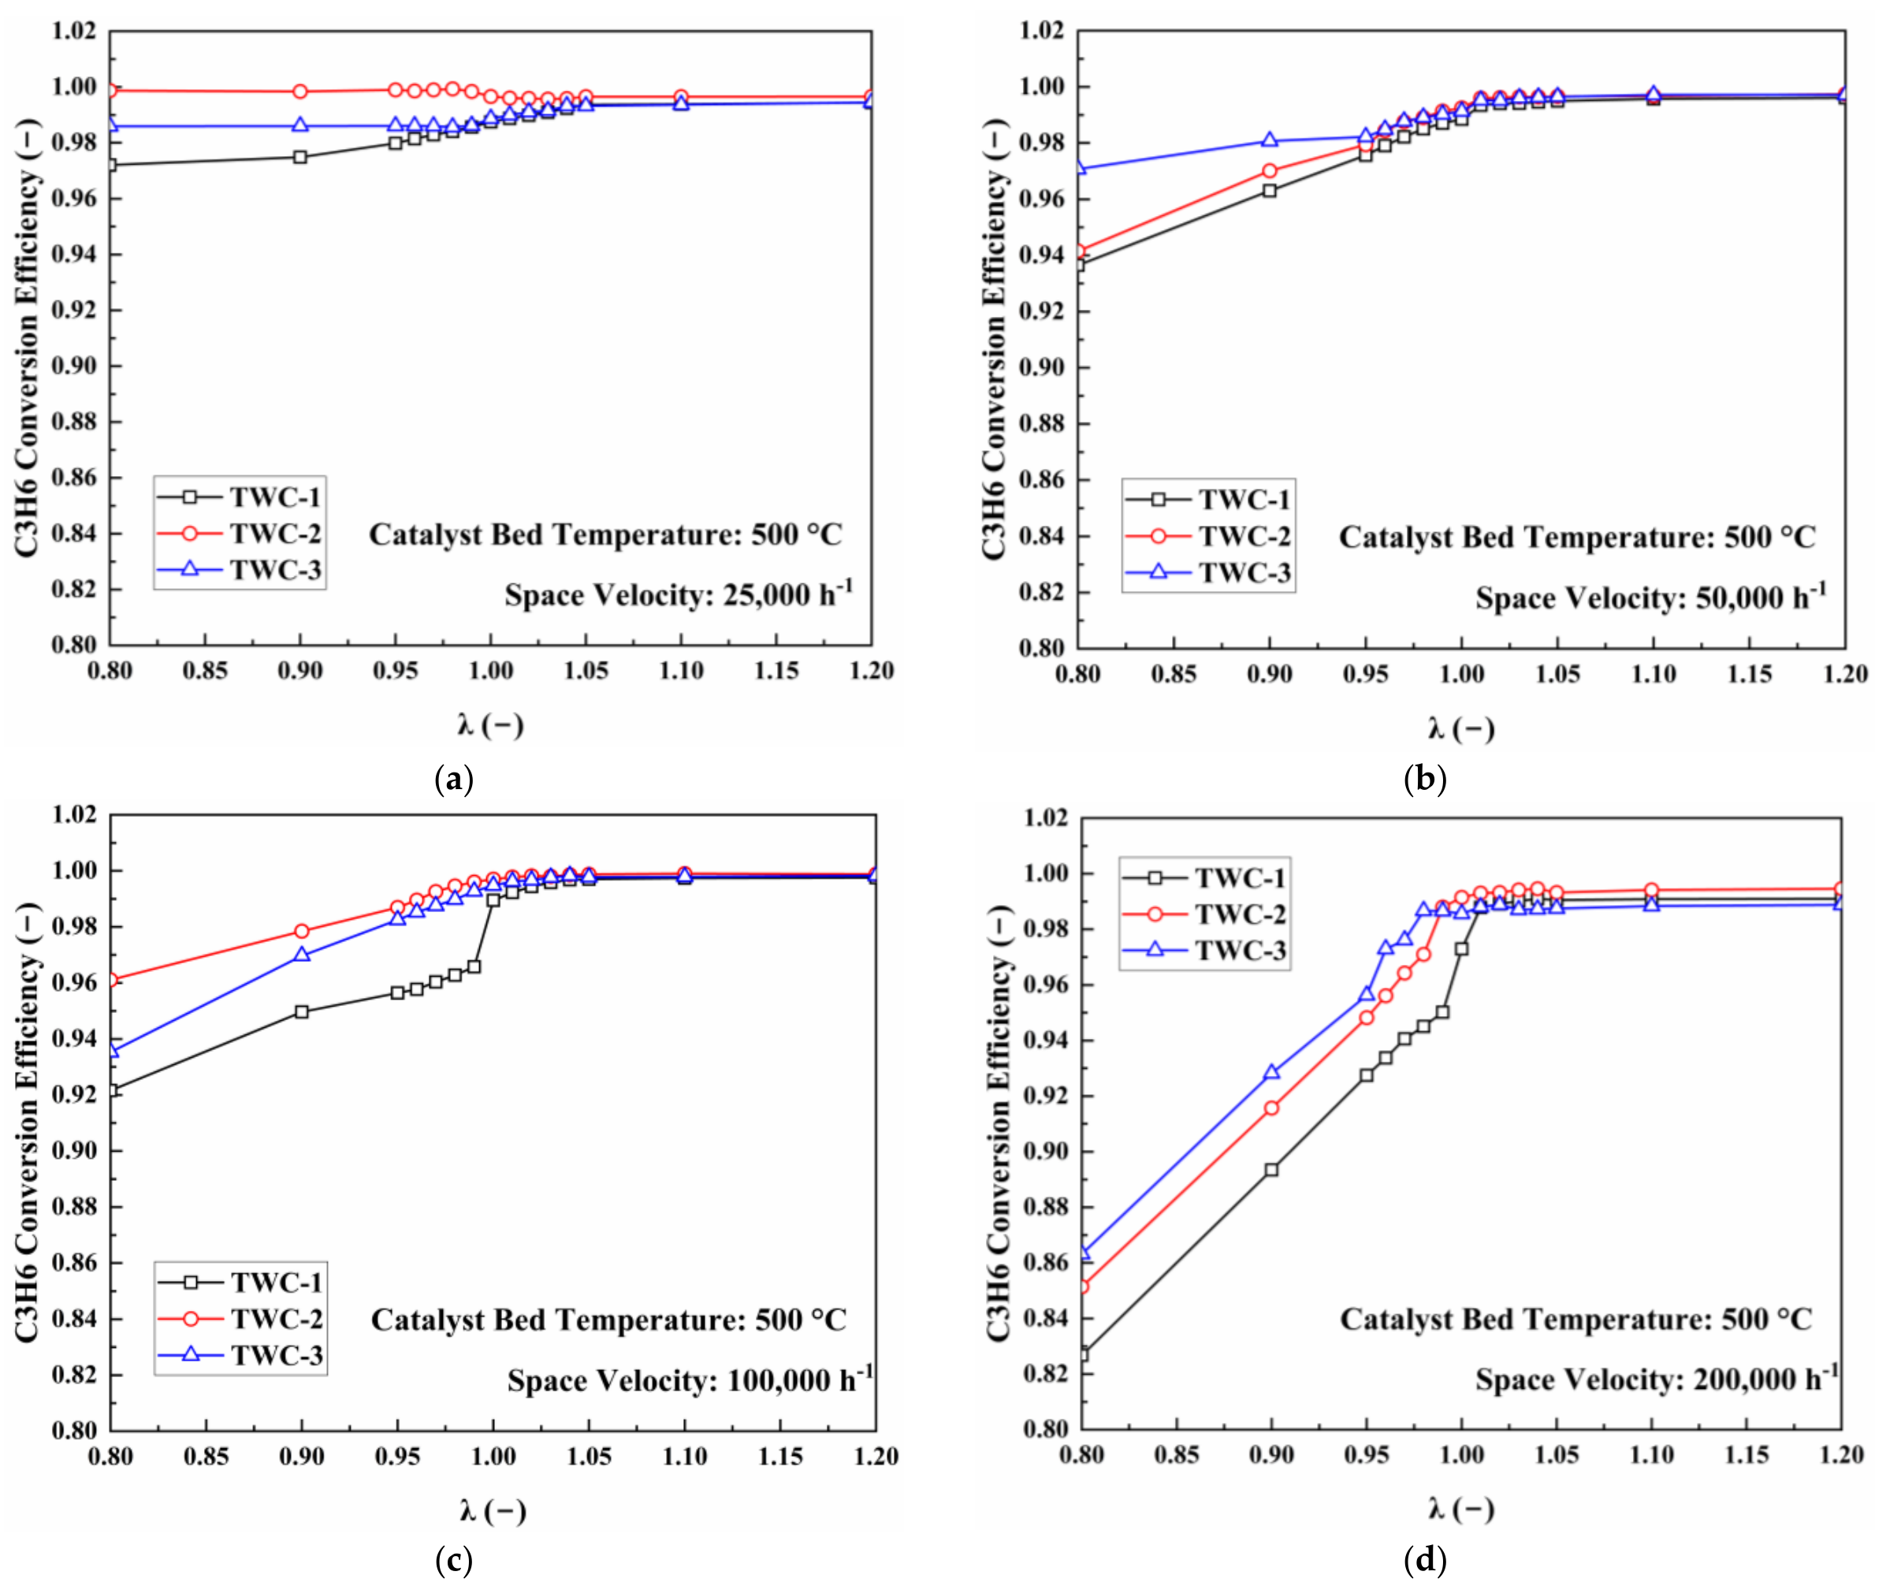
The λ-sweep tests were conducted at 500 °C to minimize the influence of light-off and isolate the combined effects of exhaust redox state and gas residence time. Figure 15, Figure 16 and Figure 17 show the conversion responses at space velocities of 25,000, 50,000, 100,000, and 200,000 h−1.
Figure 15.
CO conversion as a function of λ at different space velocities: (a) 25,000 h−1; (b) 50,000 h−1; (c) 100,000 h−1; (d) 200,000 h−1.
Figure 16.
C3H6 conversion as a function of λ at different space velocities: (a) 25,000 h−1; (b) 50,000 h−1; (c) 100,000 h−1; (d) 200,000 h−1.
Figure 17.
NO conversion as a function of λ at different space velocities: (a) 25,000 h−1; (b) 50,000 h−1; (c) 100,000 h−1; (d) 200,000 h−1.
CO conversion increased sharply as λ approached unity from the rich side and then entered a high-conversion region, as shown in Figure 15. Under rich conditions, oxygen availability limited CO oxidation. Increasing space velocity intensified this limitation by reducing the time available for oxygen transfer and surface reaction. Consequently, the differences among the formulations were most apparent at λ < 1 and at high space velocity. TWC-1 was the most sensitive to this combined constraint, whereas TWC-2 and TWC-3 generally maintained higher conversion. Although TWC-3 achieved high CO conversion under some conditions, its advantage was not uniform across the λ–space-velocity domain.
As shown in Figure 16, C3H6 conversion showed a response similar to that of CO, increasing rapidly as λ approached the stoichiometric point from the rich side. The decline in conversion under rich conditions became more pronounced as space velocity increased because oxygen deficiency and short gas residence time acted simultaneously. TWC-1 again showed the greatest sensitivity. TWC-2 and TWC-3 achieved comparable high conversion over much of the domain, and TWC-3 did not consistently outperform TWC-2 despite its greater Pd loading. Among the three formulations, TWC-2 provided the most uniform C3H6 response as both λ and space velocity varied.
As shown in Figure 17, the response of NO conversion to λ differed markedly from those of CO and C3H6. High NO conversion was maintained under rich and near-stoichiometric conditions, whereas conversion decreased rapidly when λ exceeded unity because excess oxygen and the lower availability of reducing species inhibited NO reduction. Increasing space velocity narrowed the λ interval over which high conversion could be sustained. At 200,000 h−1, even a small lean excursion caused appreciable NO breakthrough, demonstrating that short residence time increases the sensitivity of NO conversion to air–fuel-ratio control.
The three formulations performed similarly under sufficiently rich conditions and close to λ = 1, where NO conversion was already high. Their differences emerged under slightly lean conditions and increased with space velocity. TWC-1 showed the earliest and most pronounced deterioration, whereas TWC-2 maintained a wider high-conversion region. TWC-3 did not show a systematic benefit from its higher total precious-metal loading, a response consistent with its high Pd/Rh ratio and lower relative Rh content.
The λ sweeps therefore identify the redox boundaries of effective simultaneous conversion. CO and C3H6 breakthrough is favored by rich excursions, whereas NO breakthrough is favored by lean excursions; both responses are amplified at high space velocity. The simultaneous high-conversion window is consequently centered near λ = 1 and contracts as space velocity increases. This result is important for the cycle simulations because average λ alone cannot characterize catalyst performance: short rich or lean excursions occurring concurrently with high exhaust flow can account for a disproportionate fraction of cycle emissions.
3.4. Aftertreatment-Out Emission Responses over the WLTC and RDE Profiles
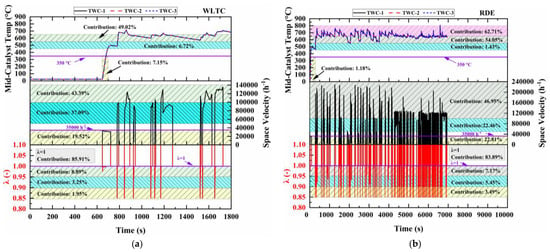
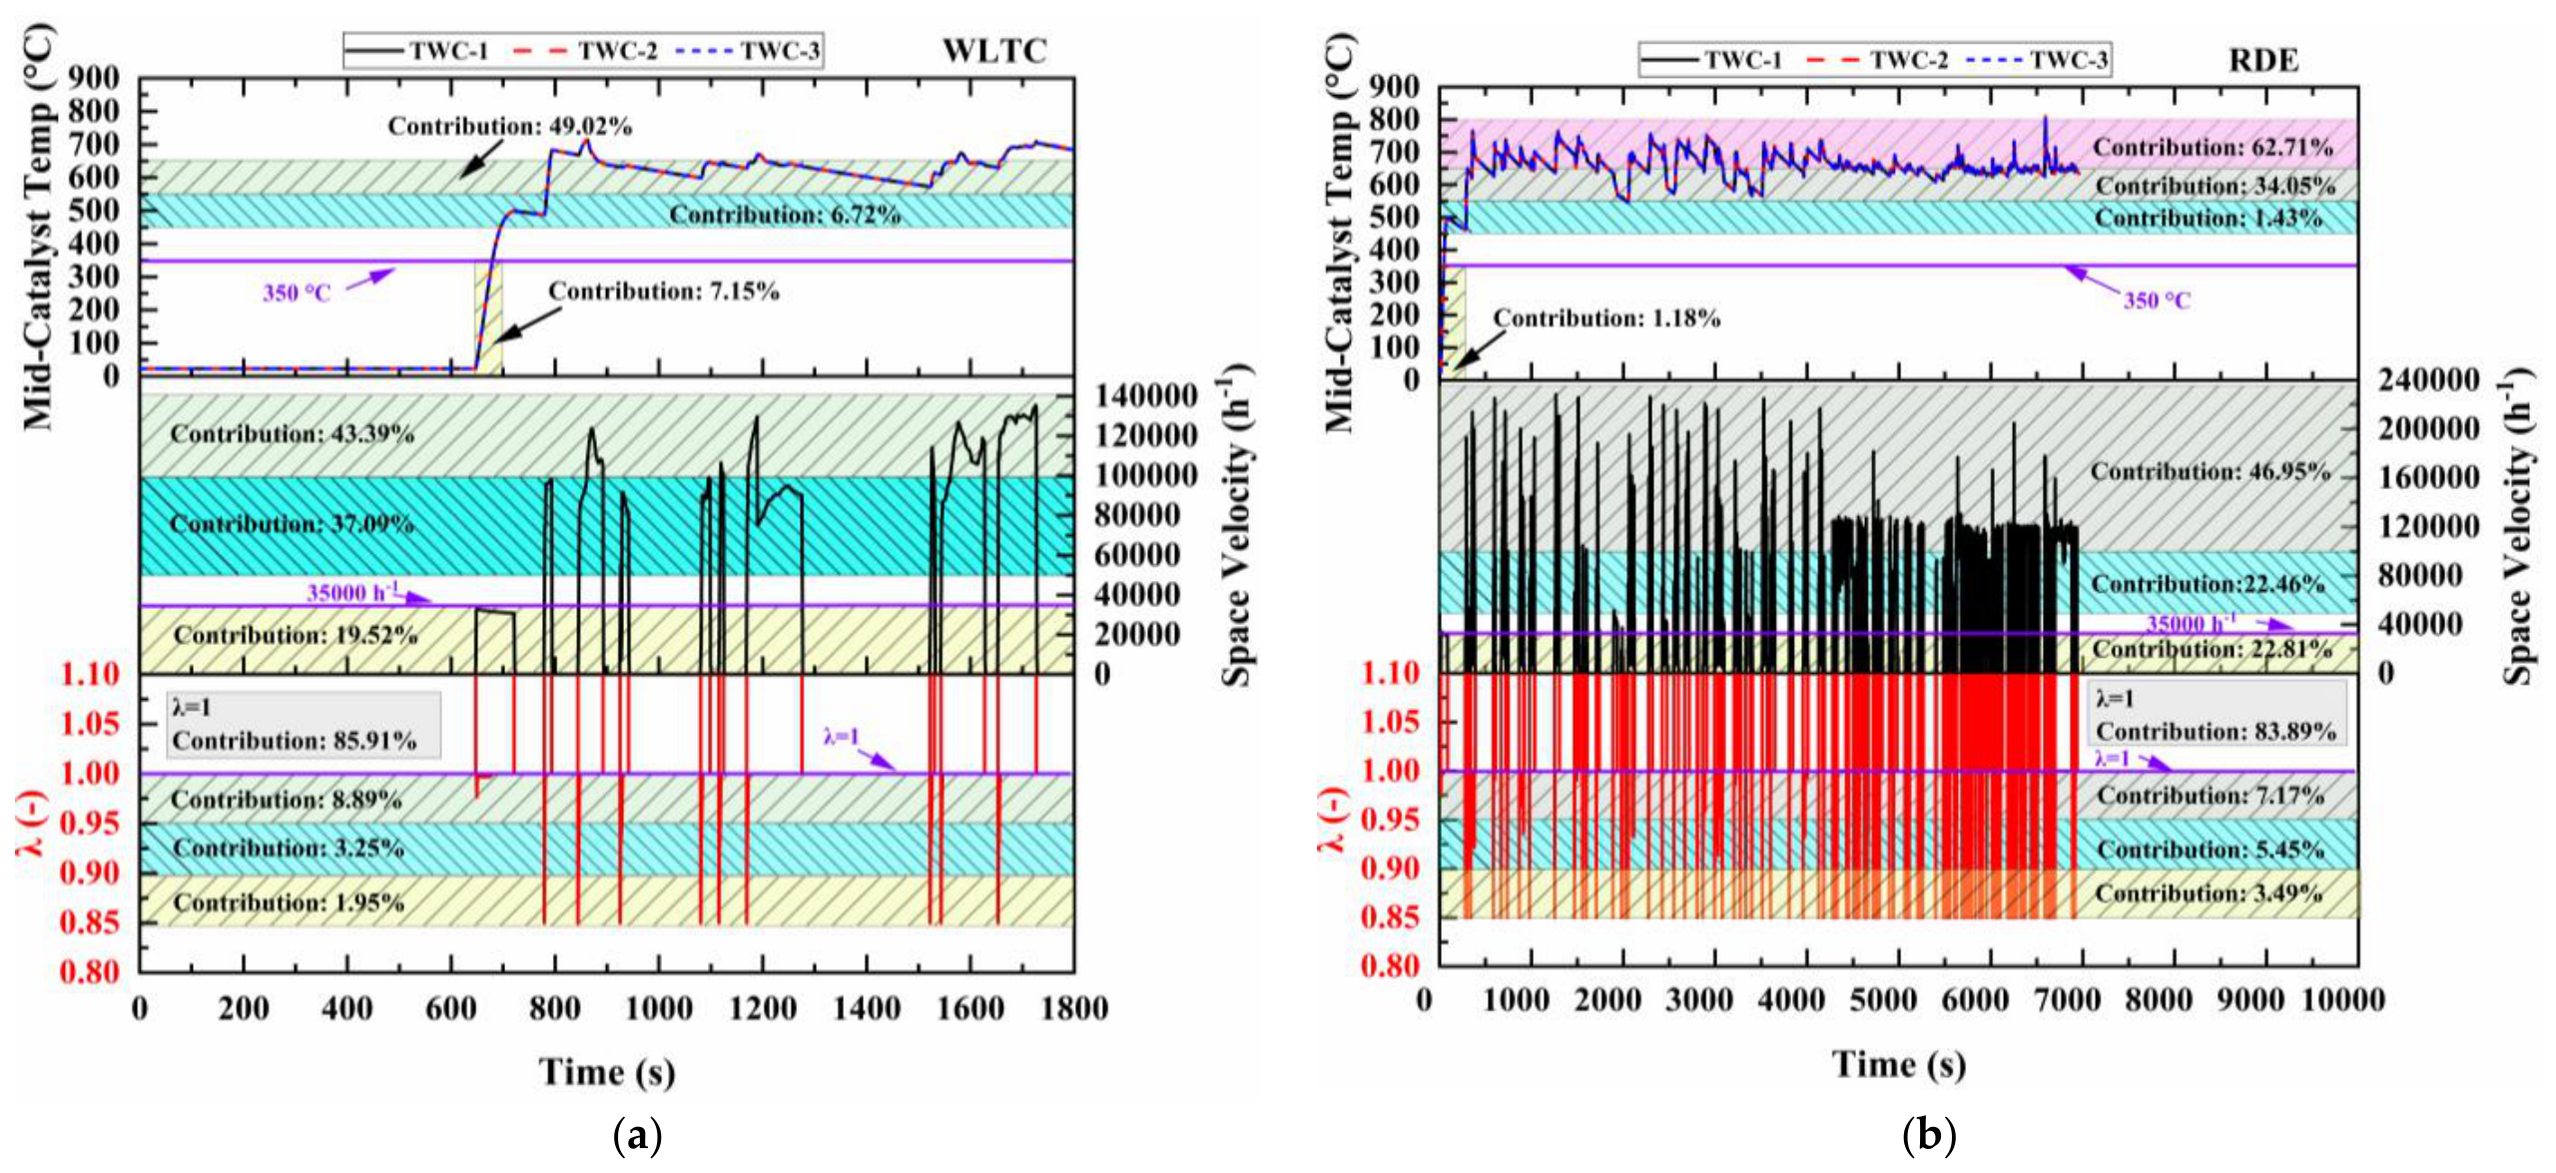
Figure 18 compares the time histories and distributions of mid-catalyst temperature, space velocity, and λ over the WLTC and RDE profiles. These variables form the connection between the controlled catalyst tests and the cycle simulations. The light-off tests describe the low-temperature portions of the cycles, the temperature–space-velocity sweeps describe conversion after activation under changing exhaust flow, and the λ sweeps identify the susceptibility to transient rich and lean excursions. Interpreting the cycle results in this operating-domain framework makes it possible to determine which bench-measured characteristic governs emission breakthrough under each driving condition.
Figure 18.
Time histories and distributions of mid-catalyst temperature, space velocity, and λ over the WLTC and RDE profiles: (a) WLTC; (b) RDE.
The WLTC contained a larger low-temperature fraction: 7.15% of the cycle occurred below 350 °C, compared with 1.18% of the RDE profile. A further 6.72% of the WLTC occurred between 450 and 500 °C, where Figure 12, Figure 13 and Figure 14 show that conversion remained sensitive to both temperature and space velocity. The WLTC space velocity remained below 140,000 h−1 and was concentrated in the low-to-moderate range. Its cumulative emissions should therefore be particularly responsive to the light-off temperatures and intermediate-temperature activity identified in Section 3.1 and Section 3.2.
In contrast, the RDE profile was predominantly a hot-catalyst condition but covered a broader flow range, including space velocities above 200,000 h−1. The RDE profile also contained a larger proportion of operation at λ < 0.95. According to the bench results, this combination of short residence time and rich operation is particularly unfavorable for CO and THC oxidation. The RDE simulation therefore provides a stronger test of high-flow and λ tolerance than of initial light-off performance.
The similar mid-catalyst temperature histories arose because the three configurations shared identical exhaust enthalpy inputs, substrate geometry, and thermal properties. Although formulation-dependent conversion produced different reaction heat release, these differences were small relative to the exhaust-gas enthalpy input and were attenuated by the thermal inertia of the monolith. The cycle-level emission differences therefore arose primarily from the formulation-specific conversion responses under nearly identical thermal and flow trajectories.
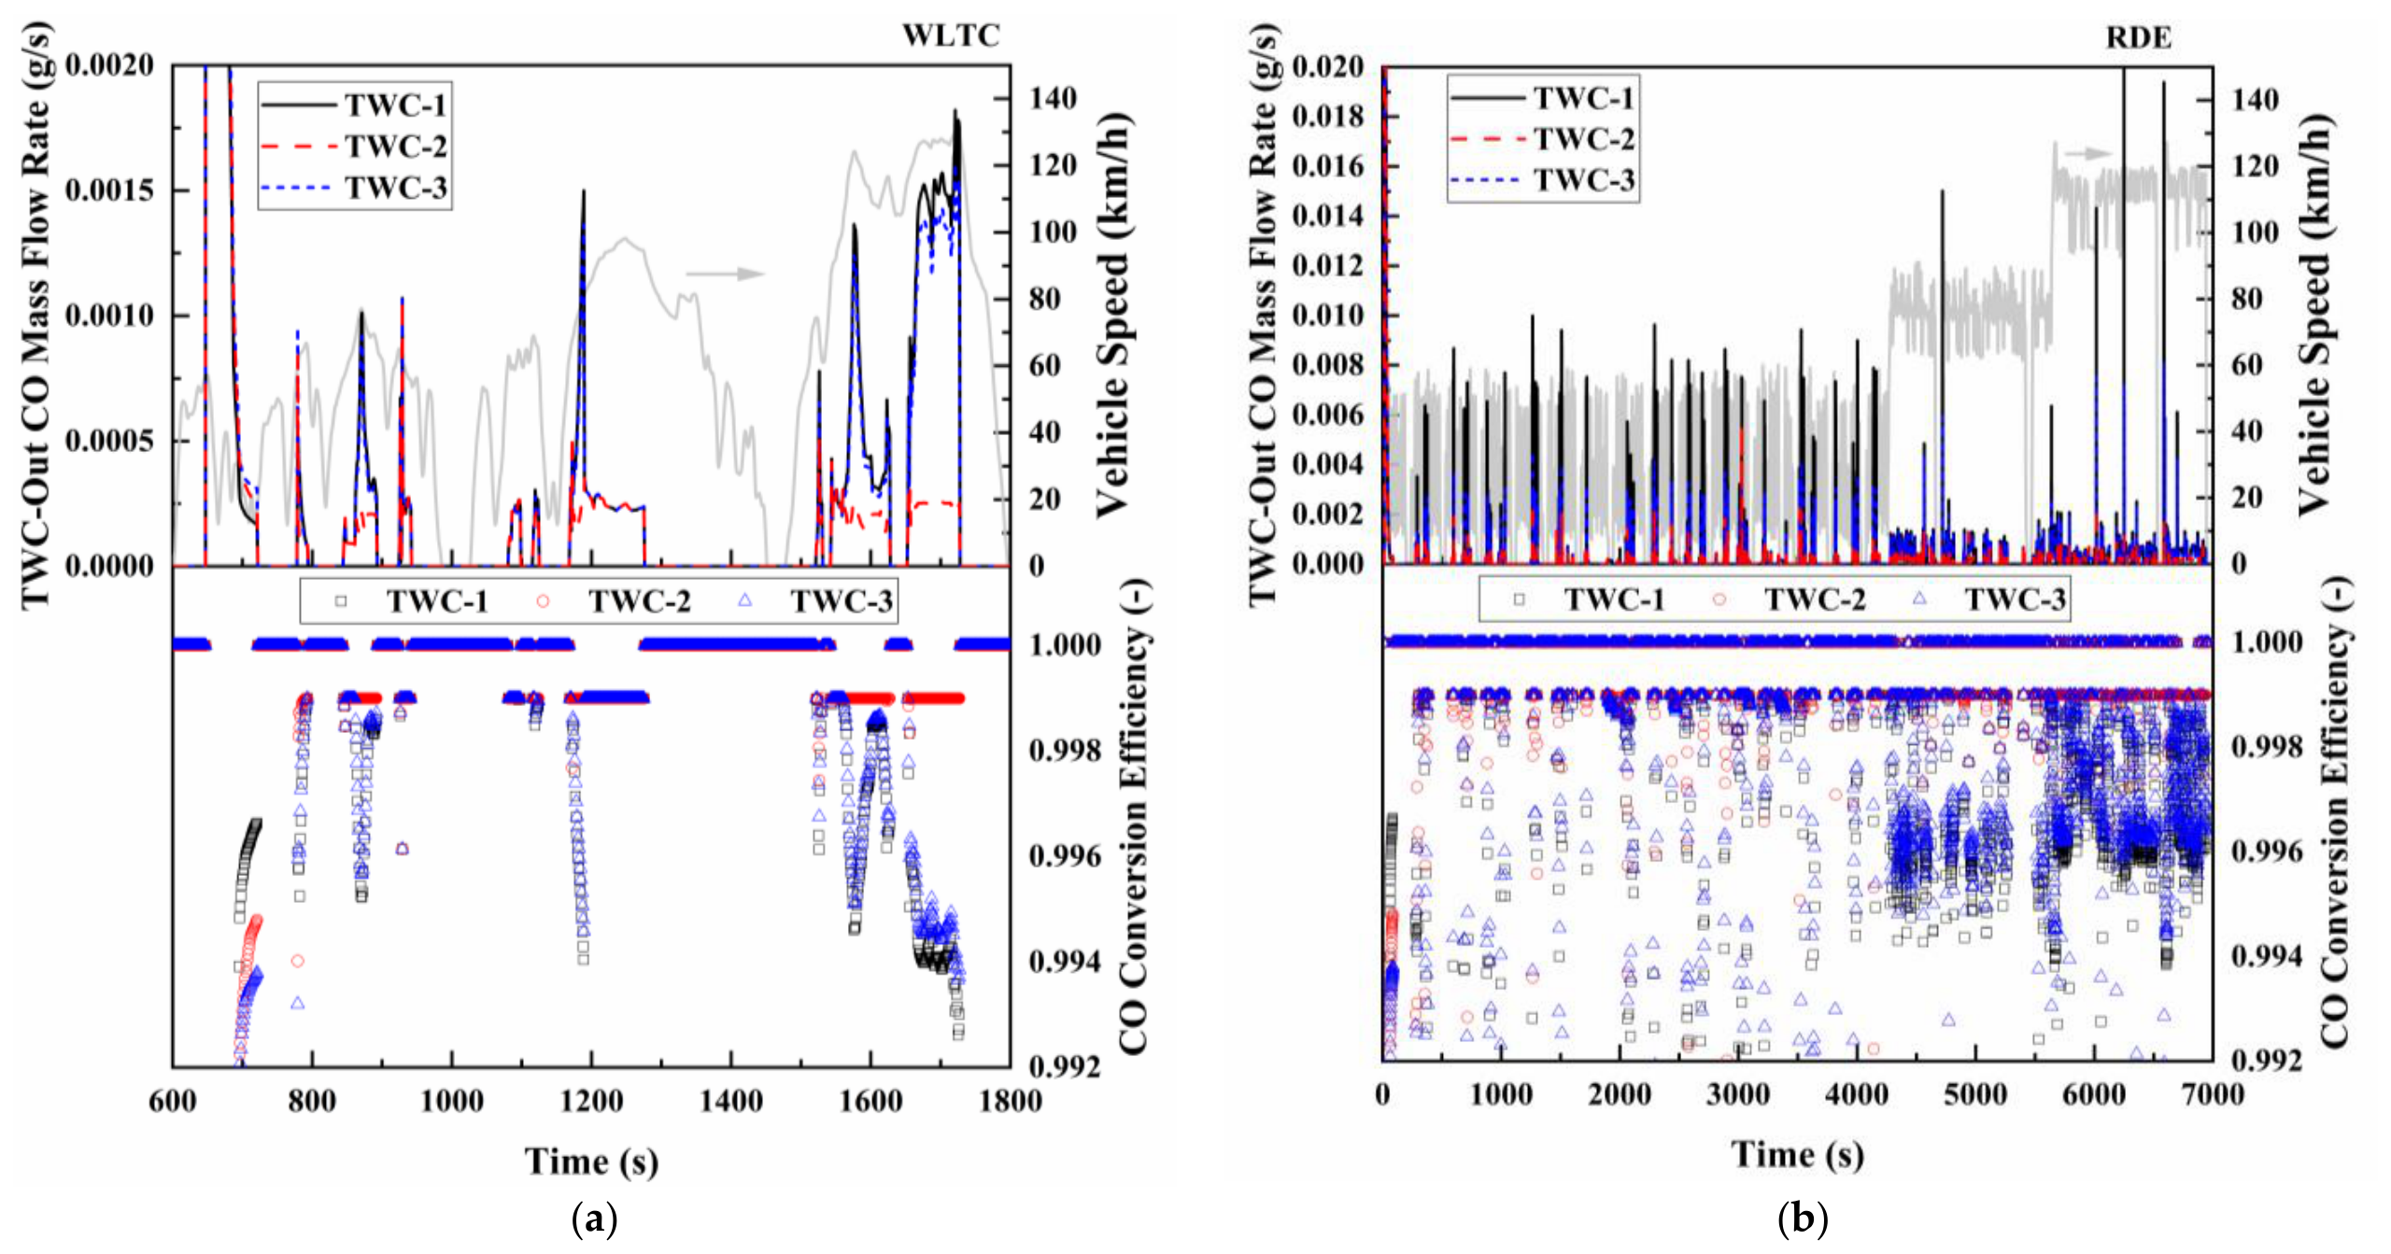
As shown in Figure 19, TWC-2 exhibited the best overall transient CO control over both the WLTC and RDE profiles, generally maintaining higher conversion efficiency and lower breakthrough emissions than TWC-1 and TWC-3. TWC-2 generally maintained lower instantaneous CO emissions and more stable conversion over the RDE profile. Because low-temperature operation accounted for only a small fraction of the RDE profile, the advantage of TWC-2 was associated mainly with its more stable conversion under hot, high-space-velocity, and transient rich conditions observed in Figure 12 and Figure 15, rather than with light-off performance alone.
Figure 19.
TWC-out CO mass flow rates and conversion efficiencies over the WLTC and RDE profiles: (a) WLTC; (b) RDE.
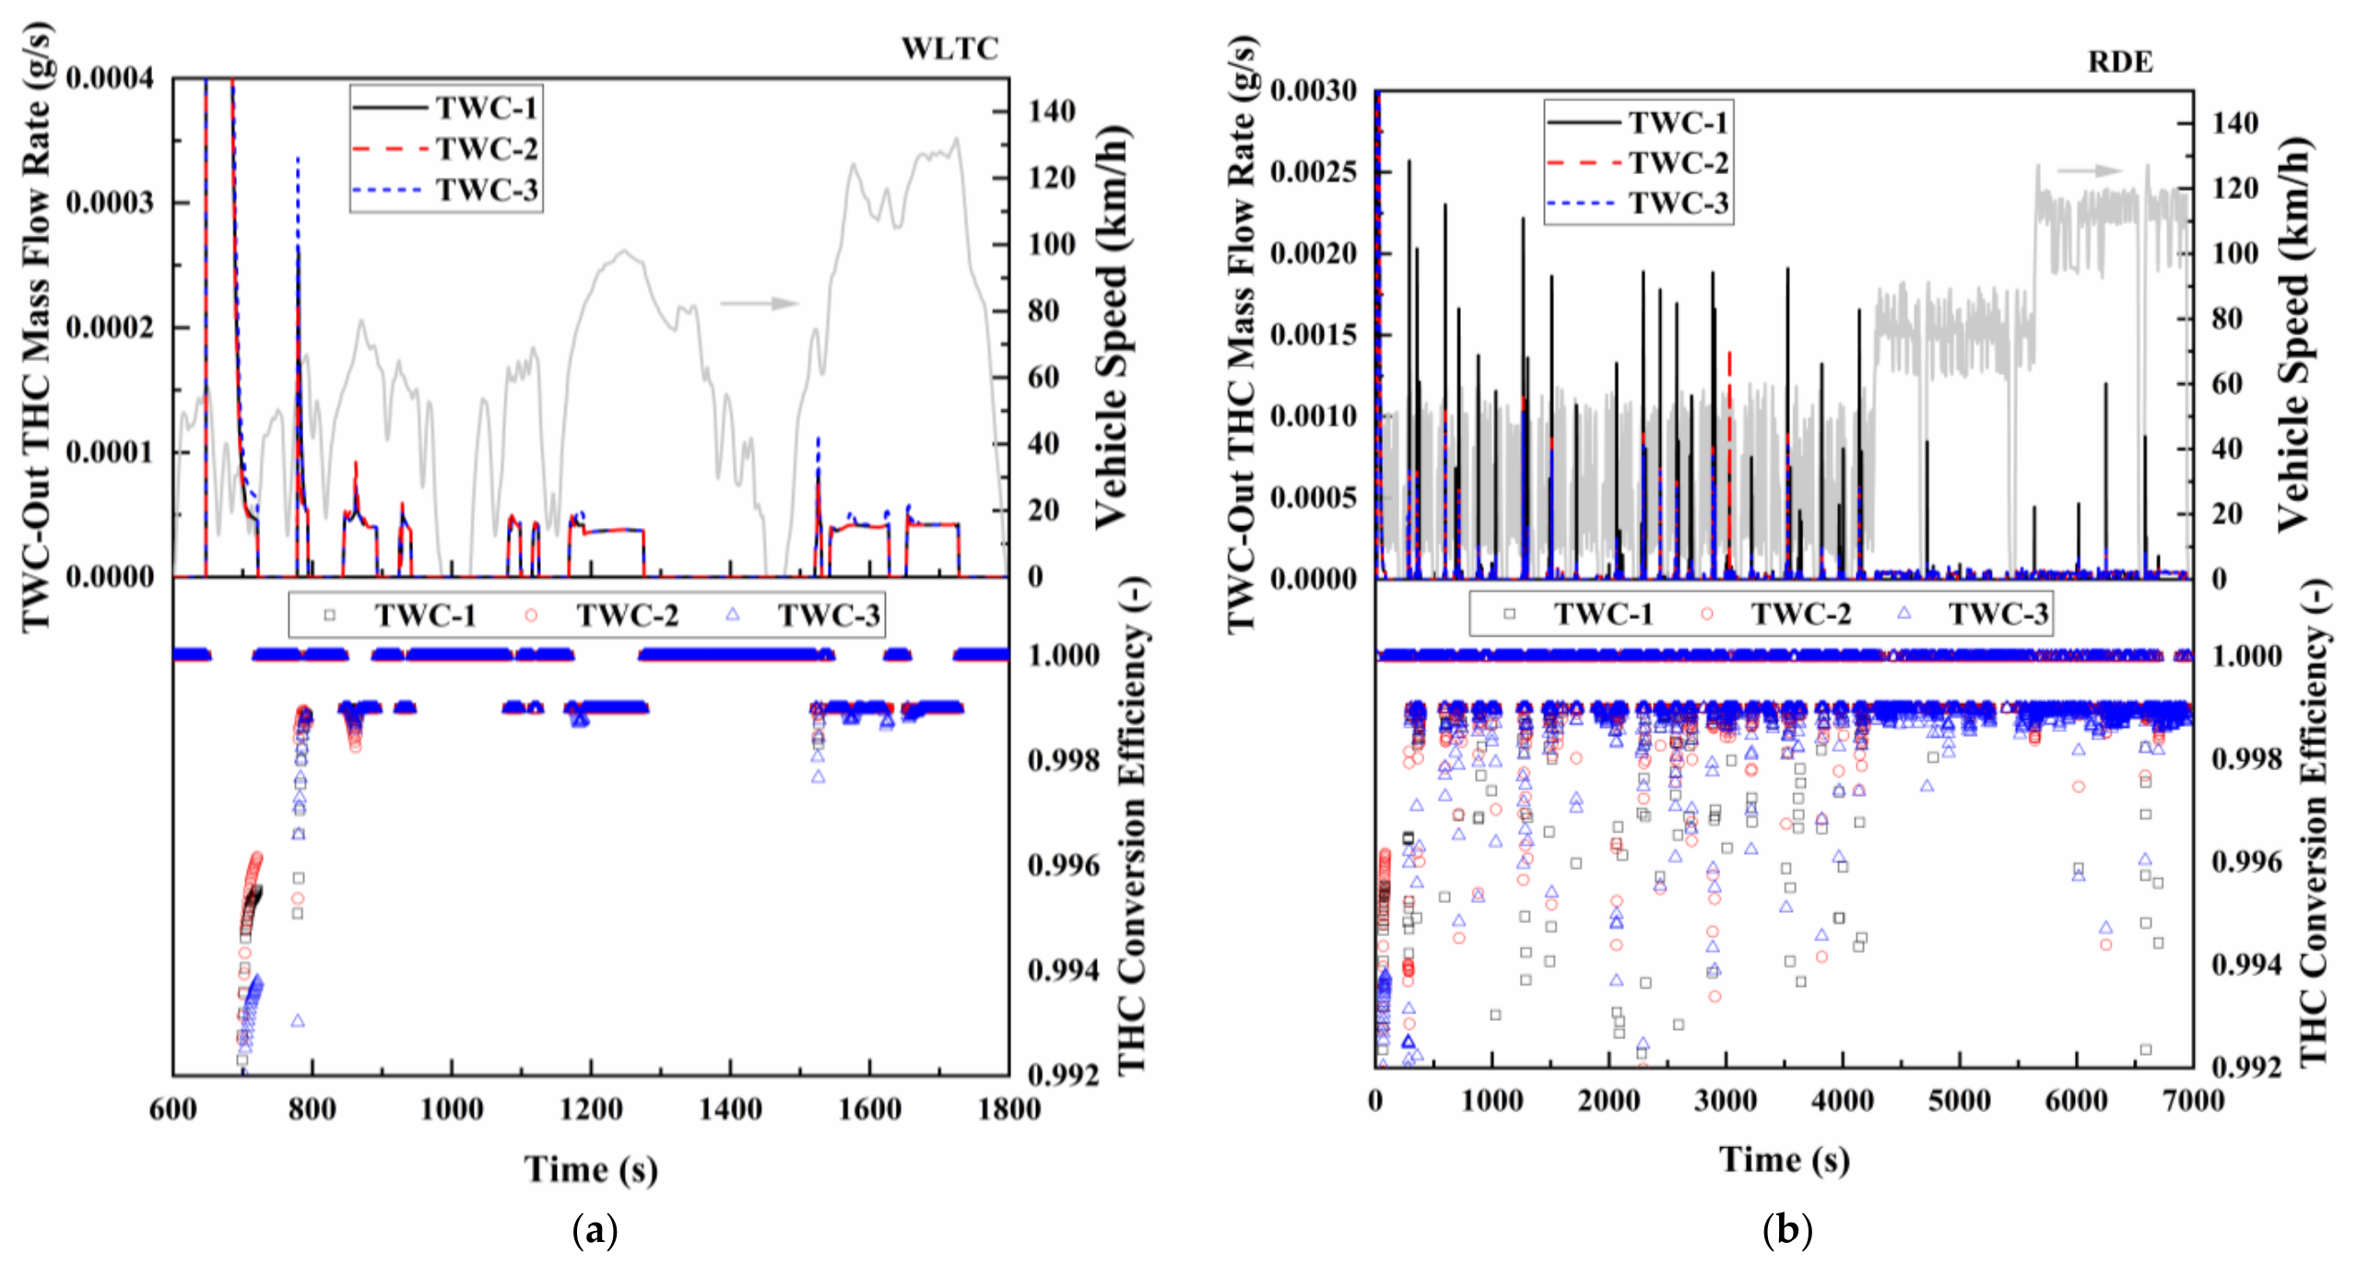
Figure 20 presents the instantaneous TWC-out THC mass flow rates and conversion efficiencies of the three configurations over the WLTC and RDE profiles. As shown in Figure 20a, THC breakthrough over the WLTC occurred mainly during catalyst light-off and several subsequent transient events. TWC-3 produced the largest THC spikes under some of these conditions, accompanied by the lowest instantaneous conversion efficiency. Despite its higher Pd loading, TWC-3 therefore did not provide improved THC control during the low- and intermediate-temperature periods. In comparison, TWC-2 generally produced smaller breakthrough peaks and maintained more stable conversion efficiency, consistent with its lower THC T50 and T90 values shown in Figure 11 and favorable conversion at 350–450 °C.
Figure 20.
TWC-out THC mass flow rates and conversion efficiencies over the WLTC and RDE profiles: (a) WLTC; (b) RDE.
A different relative response was observed over the RDE profile as shown in Figure 20b. TWC-1 exhibited more frequent and pronounced THC spikes, as indicated by the black solid curve, whereas TWC-2 and TWC-3 generally maintained lower instantaneous emissions. This change in relative performance can be attributed to the different catalyst operating domains of the two profiles. The WLTC contained a greater proportion of light-off and intermediate-temperature operation, which exposed the weaker transient THC conversion of TWC-3 under some conditions. In contrast, the RDE profile was dominated by hot operation at higher space velocities, under which the lower precious-metal loading of TWC-1 was insufficient to maintain stable conversion during rapid flow transients. TWC-3 consequently performed better relative to TWC-1 over the RDE profile, although it did not consistently outperform TWC-2. Overall, TWC-2 exhibited the most stable transient THC control across both low-temperature WLTC operation and hot, high-space-velocity RDE conditions.
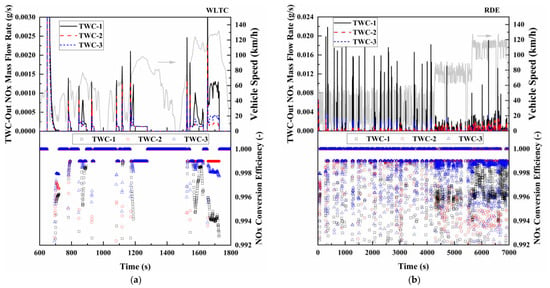
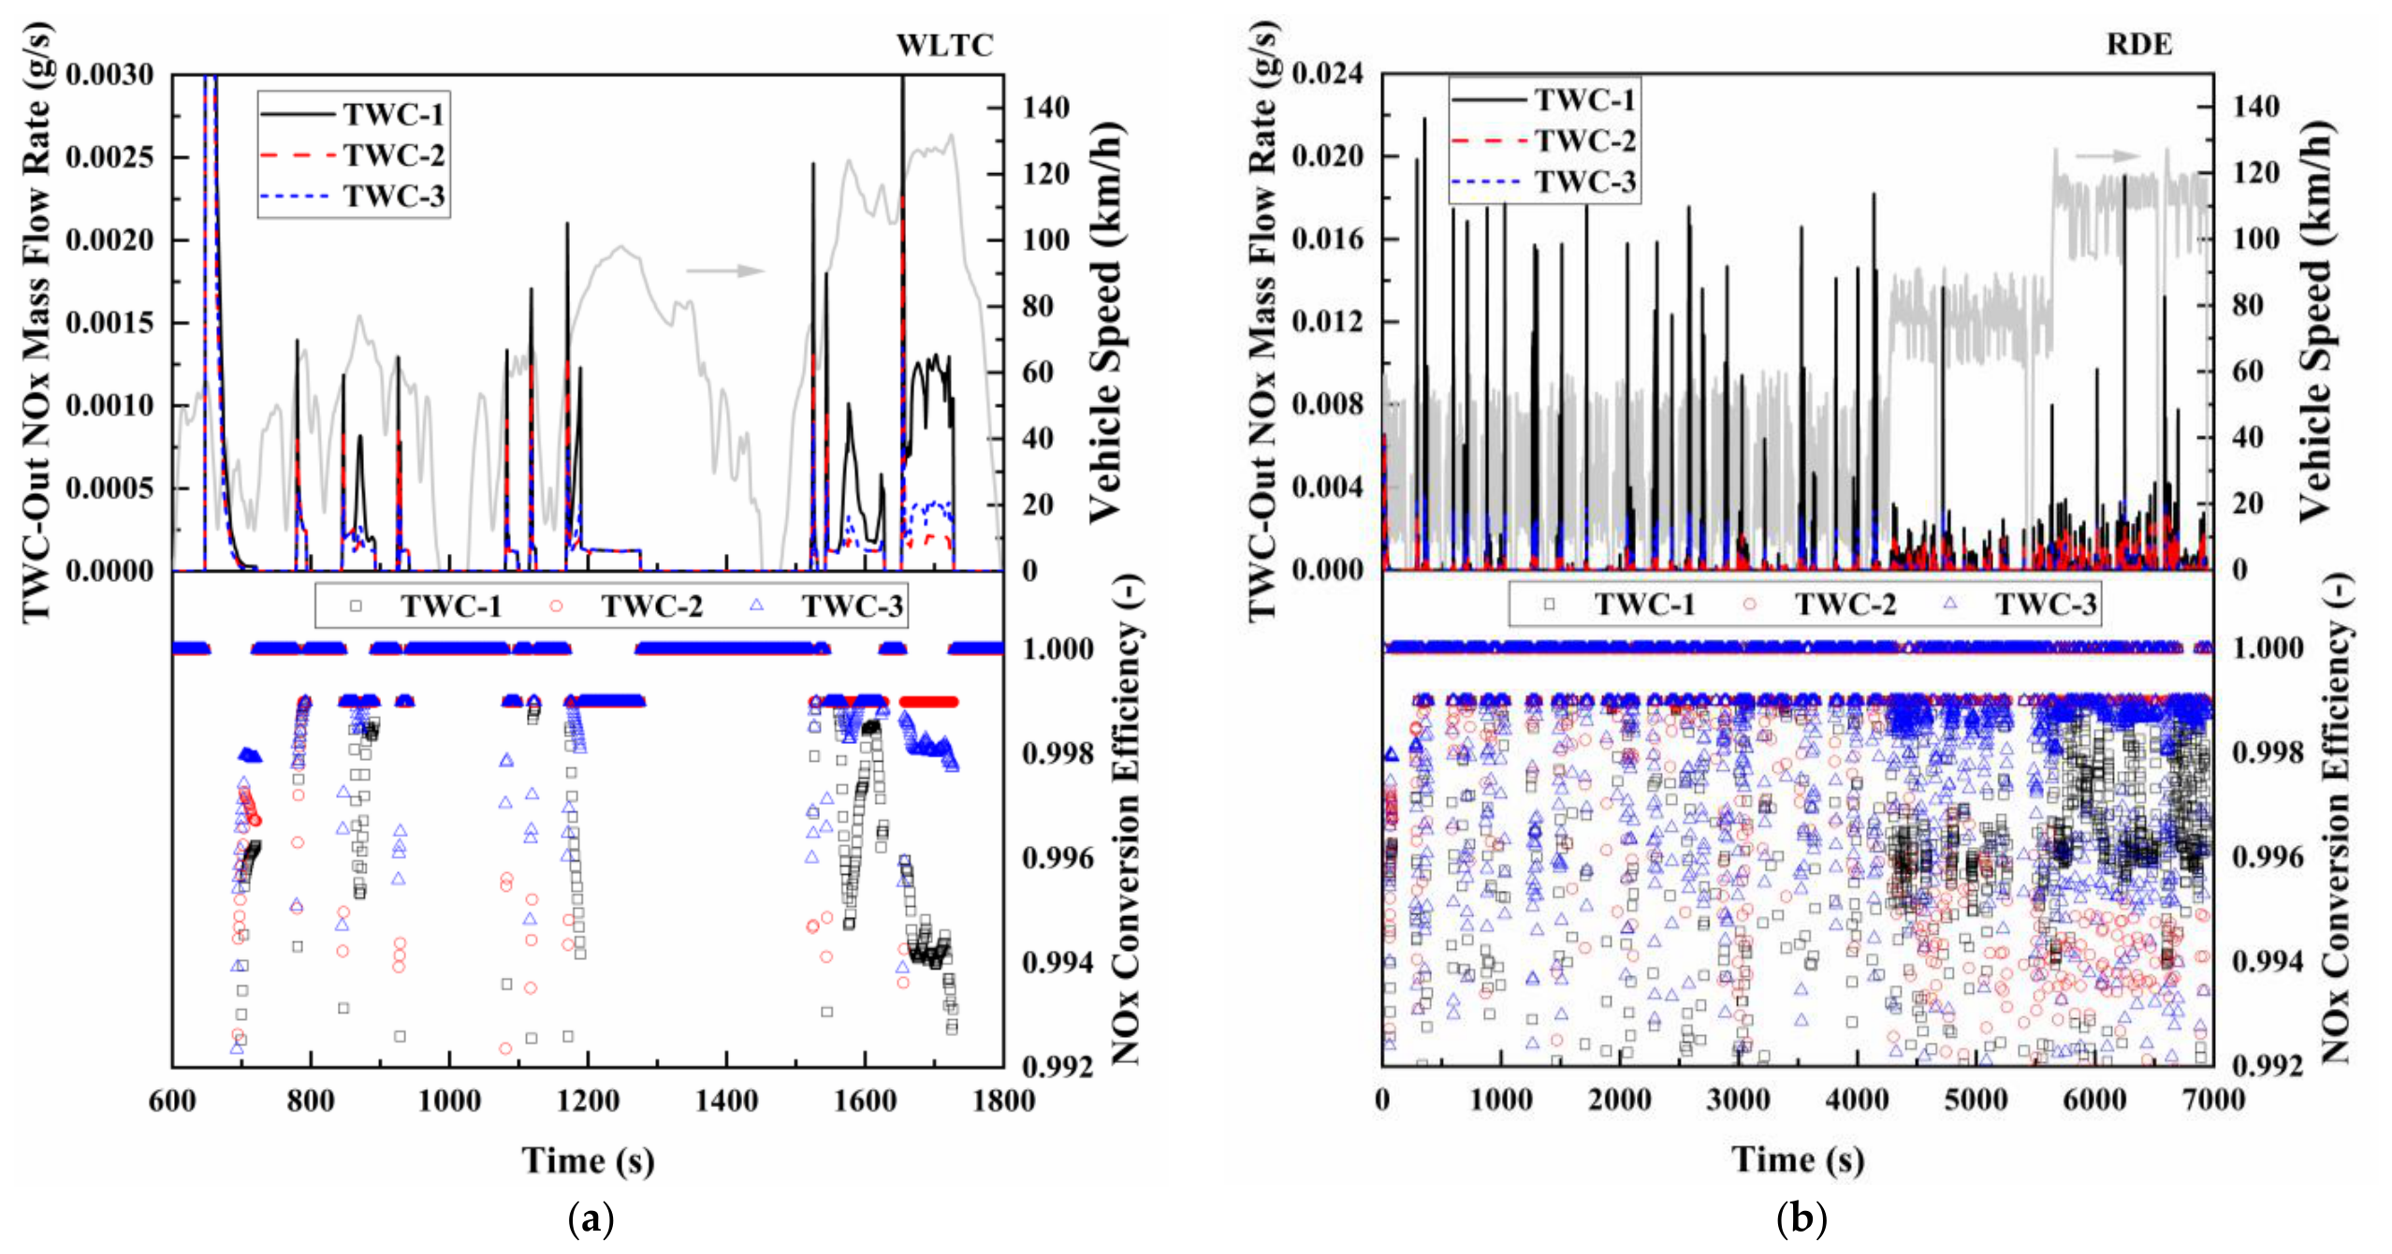
Figure 21 presents the instantaneous TWC-out NOx mass flow rates and conversion efficiencies of the three configurations over the WLTC and RDE profiles. As shown in Figure 21a, additional NOx peaks occurred during the later high-speed phase of the WLTC, when increasing exhaust flow and space velocity reduced the gas residence time. TWC-1 exhibited larger breakthrough peaks and greater fluctuations in conversion efficiency, indicating limited NOx conversion under the combined effects of transient operation and shortened residence time. TWC-2 generally maintained lower instantaneous NOx emissions and more stable conversion. Although TWC-3 had the highest total precious-metal loading, it did not consistently outperform TWC-2. This response is consistent with the light-off and temperature–space-velocity results, which showed that increasing total precious-metal loading alone did not ensure improved NOx conversion.
Figure 21.
TWC-out NOx mass flow rates and conversion efficiencies over the WLTC and RDE profiles: (a) WLTC; (b) RDE.
As shown in Figure 21b, the RDE profile produced more frequent and pronounced NOx pulses, and the differences among the formulations became clearer. The instantaneous peak levels generally followed the order TWC-1 > TWC-3 > TWC-2. Because the catalyst remained hot during most of the RDE profile, these peaks were associated primarily with high space velocity, elevated engine-out NOx mass flow, and rapid exhaust-flow transients rather than with catalyst light-off. TWC-1 showed the greatest deterioration under these conditions, consistent with its lower precious-metal loading. TWC-3 performed better than TWC-1 but showed no consistent advantage over TWC-2, despite its higher total loading. The weaker NOx performance of TWC-3 is consistent with its lower Rh loading and substantially higher Pd/Rh ratio relative to TWC-2, given the established importance of Rh-containing sites for NO reduction. Although the present formulation matrix does not isolate the individual contribution of each metal, the results show that directing the additional precious-metal loading predominantly toward Pd did not improve the overall CO-THC-NOx balance under the investigated operating conditions. Overall, TWC-2 maintained the most stable transient NOx conversion over both profiles, demonstrating a more favorable balance between low-temperature activity and tolerance to hot, high-space-velocity operation.
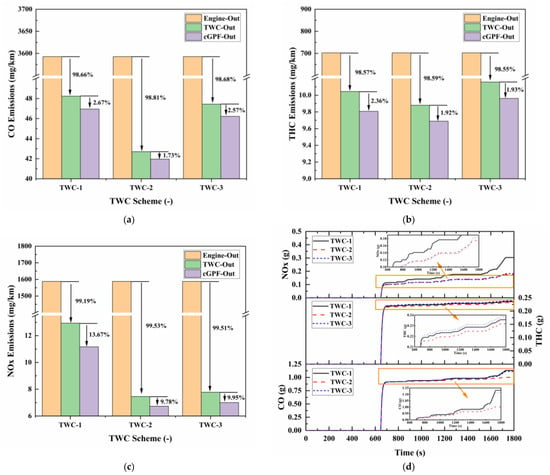
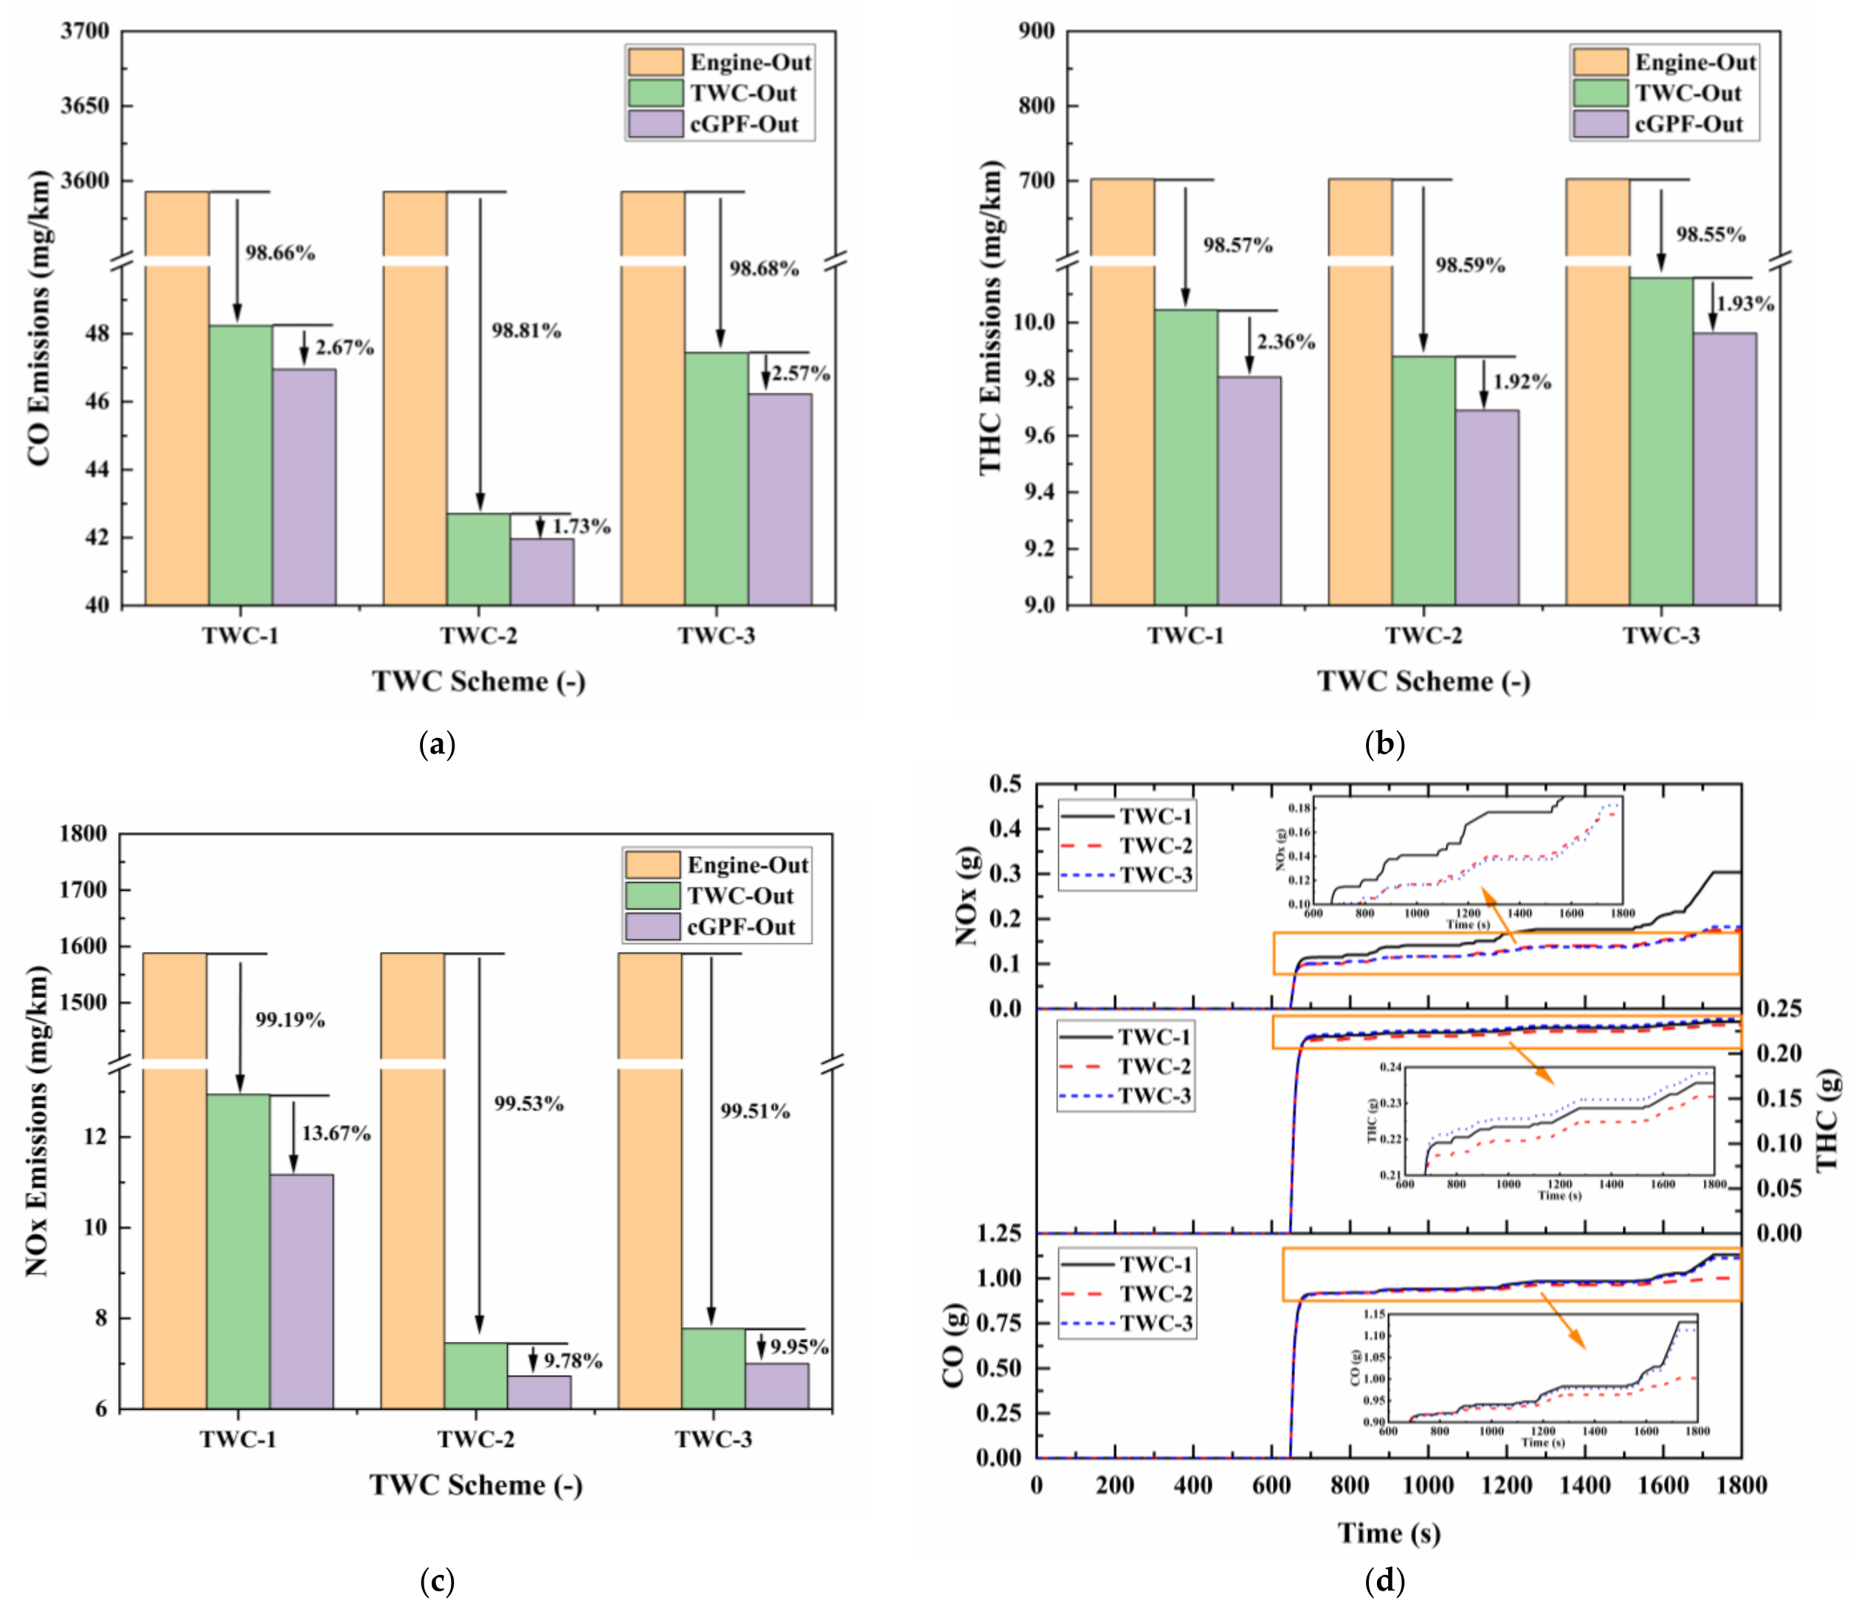
Figure 22 summarizes the cumulative and cycle-integrated distance-specific emissions downstream of the TWC and cGPF over the WLTC. The TWC provided the primary removal of all three pollutants, with conversion efficiencies exceeding 98% for CO and THC and 99% for NOx. At the TWC outlet, the CO emissions of TWC-1, TWC-2, and TWC-3 were 48.24, 42.70, and 47.45 mg/km, respectively. TWC-2 therefore reduced CO emissions by 11.5% relative to TWC-1 and by 10.0% relative to TWC-3.
Figure 22.
Cumulative and cycle-integrated distance-specific emissions of the different TWC configurations over the WLTC: (a) cycle-integrated distance-specific emissions of CO downstream of the TWC and cGPF; (b) cycle-integrated distance-specific emissions of THC downstream of the TWC and cGPF; (c) cycle-integrated distance-specific emissions of NOx downstream of the TWC and cGPF; (d) cumulative emissions downstream of the TWC.
The differences in THC were smaller, with TWC-out emissions of 10.04, 9.88, and 10.16 mg/km for TWC-1, TWC-2, and TWC-3, respectively. Although TWC-3 had the highest Pd loading, it produced the highest THC emissions over the WLTC, consistent with its relatively poor conversion during some light-off and intermediate-temperature transients. The largest separation between TWC-1 and the higher-loading formulations was observed for NOx. The corresponding TWC-out values were 12.94, 7.46, and 7.78 mg/km, with TWC-2 reducing NOx by 42.4% relative to TWC-1 and by 4.1% relative to TWC-3.
The differences between TWC-2 and TWC-3 in the predicted WLTC THC and NOx emissions were relatively small, corresponding to 2.8% and 4.1%, respectively. Although the cycle-level model provides a unique prediction for a given set of inputs, the formulation-specific conversion characteristics were obtained experimentally, and the uncertainty associated with these experimentally derived characteristics was not propagated through the cycle-level simulation. Therefore, these differences should be interpreted as small predicted differences rather than as statistically significant separation between the two formulations. Overall, TWC-2 produced the lowest predicted cycle-integrated emissions and provided the most balanced performance across CO, THC, and NOx over the WLTC.
Relative to the TWC-out values, the cGPF provided additional reductions of 1.73–2.67% for CO, 1.92–2.36% for THC, and 9.78–13.67% for NOx. Although the same cGPF configuration and model parameters were used for all three cases, the exhaust boundary conditions entering the cGPF differed among the three upstream TWC formulations. Therefore, the cGPF contribution was not identical in relative magnitude for the three configurations. Nevertheless, comparison of the TWC-out and cGPF-out emissions showed that the formulation ranking remained unchanged over the WLTC.
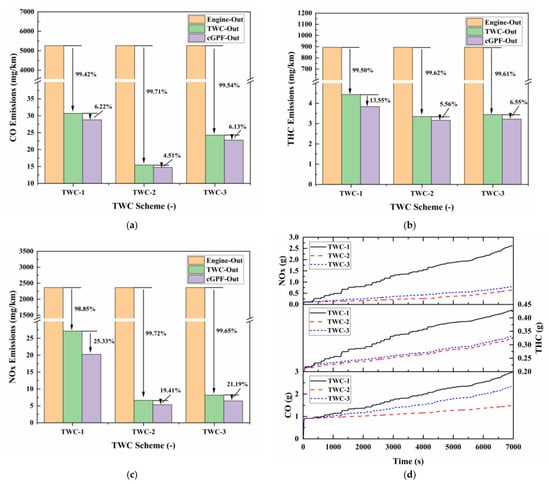
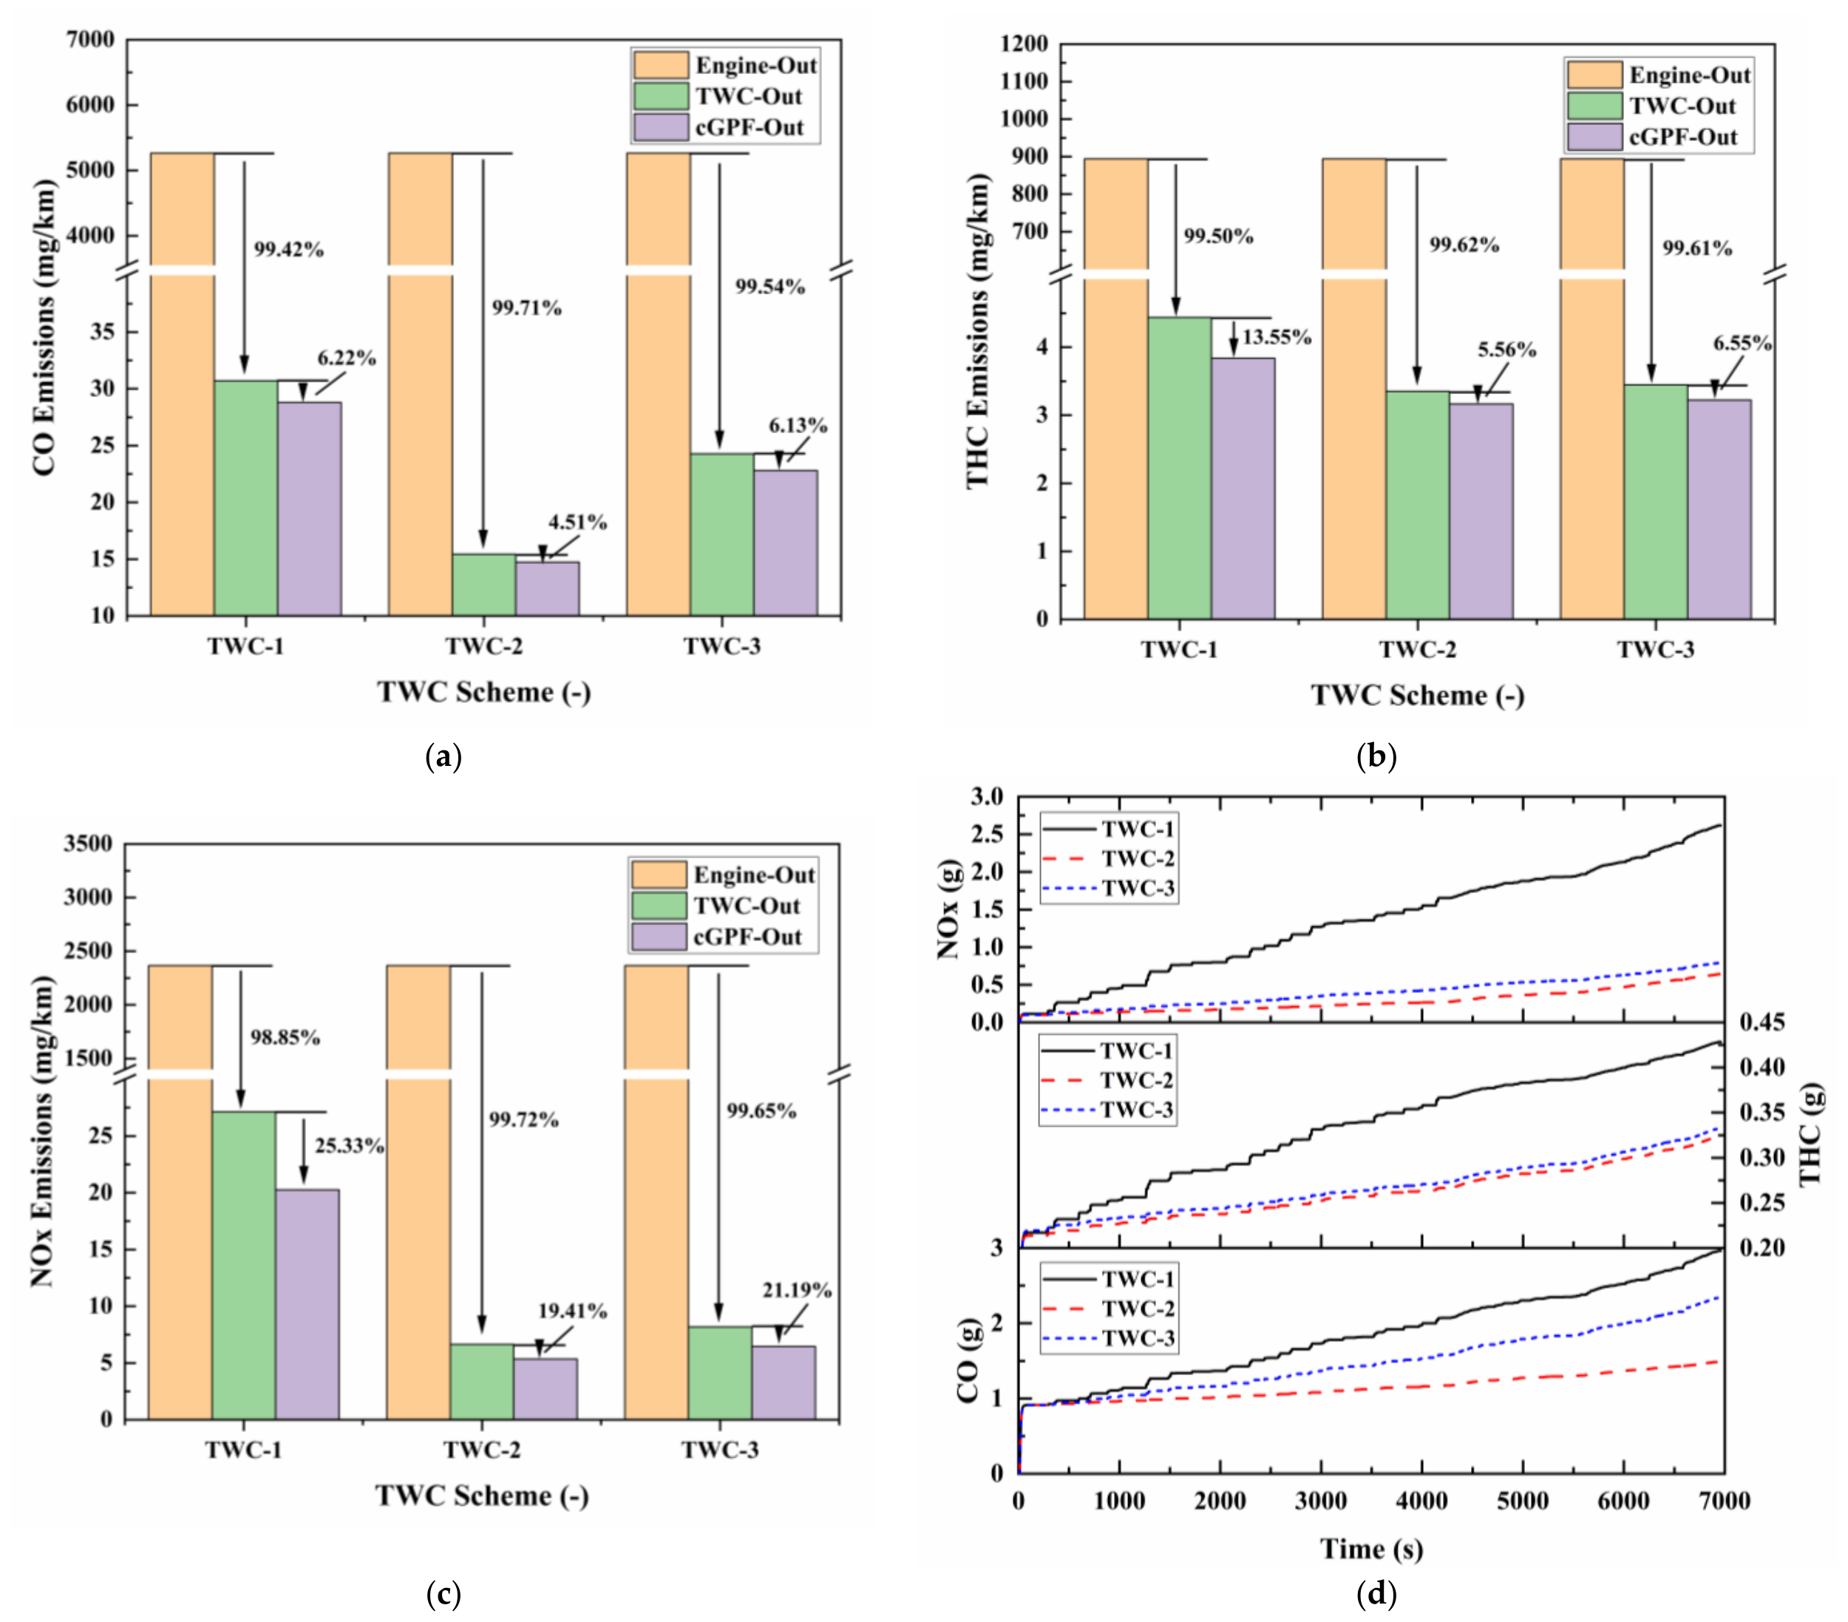
Figure 23 presents the corresponding results over the RDE profile. At the TWC outlet, the CO emissions of TWC-1, TWC-2, and TWC-3 were 30.70, 15.44, and 24.28 mg/km, respectively. TWC-2 reduced CO by 49.7% relative to TWC-1 and by 36.4% relative to TWC-3, showing a substantially greater advantage than over the WLTC. The stronger differentiation under RDE conditions is consistent with the greater sensitivity of the formulations to hot operation at high space velocity and during rich transients.
Figure 23.
Cumulative and cycle-integrated distance-specific emissions of the different TWC configurations over the RDE: (a) cycle-integrated distance-specific emissions of CO downstream of the TWC and cGPF; (b) cycle-integrated distance-specific emissions of THC downstream of the TWC and cGPF; (c) cycle-integrated distance-specific emissions of NOx downstream of the TWC and cGPF; (d) cumulative emissions downstream of the TWC.
The TWC-out THC emissions were 4.44, 3.35, and 3.45 mg/km for TWC-1, TWC-2, and TWC-3, respectively. TWC-2 was 24.5% lower than TWC-1 but only 2.8% lower than TWC-3. The ranking of TWC-1 > TWC-3 > TWC-2 differed from that over the WLTC, where TWC-3 produced the highest THC emissions. This change agrees with the instantaneous results in Figure 20: TWC-3 showed relatively poor THC conversion during some WLTC light-off and intermediate-temperature events, whereas TWC-1 exhibited more pronounced breakthrough under the hot, high-space-velocity conditions of the RDE profile.
The RDE NOx results showed the clearest separation. TWC-out emissions were 27.13, 6.64, and 8.19 mg/km for TWC-1, TWC-2, and TWC-3, respectively. TWC-2 reduced NOx by 75.5% relative to TWC-1 and by 18.8% relative to TWC-3. The markedly higher NOx emissions of TWC-1 indicate that the RDE operating conditions amplified the limitations associated with its lower precious-metal loading. TWC-3 performed better than TWC-1 but did not match TWC-2, consistent with the importance of Rh loading and Pd/Rh balance for NOx reduction.
Over the RDE profile, the cGPF further reduced CO, THC, and NOx by 4.51–6.22%, 5.56–13.55%, and 19.41–25.33%, respectively. Although the same cGPF configuration and model parameters were used for all three cases, the exhaust boundary conditions entering the cGPF differed among the three upstream TWC formulations. Therefore, the cGPF contribution was not identical in relative magnitude for the three configurations. Nevertheless, comparison of the TWC-out and cGPF-out emissions showed that the formulation ranking remained unchanged over the investigated RDE profile.
3.5. Implications for Catalyst Formulation Selection
The results reveal an important distinction between condition-specific activity and cycle-level robustness. TWC-3 exhibited a local advantage in CO light-off, whereas TWC-2 maintained more balanced conversion of CO, C3H6, and NO across the low-temperature, intermediate-temperature, high-GHSV, and λ-dependent regions encountered during the two driving profiles. Consequently, the catalyst favored by a single light-off metric was not necessarily the formulation that produced the lowest cycle-integrated emissions.
These findings support an operating-domain-based strategy for catalyst selection. Instead of ranking formulations solely by precious-metal loading or one T50 value, the temperature, GHSV, and λ distributions of the target vehicle application should first be identified and then matched with formulation-specific, multi-pollutant conversion characteristics. The lower predicted emissions of TWC-2 relative to the higher-loaded TWC-3 further show that increasing precious-metal loading does not necessarily improve its effective utilization under cycle-relevant conditions. Because total loading and Pd/Rh ratio were not varied independently, this comparison does not isolate the individual effects of Pd and Rh. Nevertheless, it demonstrates that precious-metal allocation and operating-domain coverage are more informative formulation-selection criteria than total loading alone.
4. Conclusions
Unlike conventional catalyst screening based on precious-metal loading or isolated light-off metrics, this study established an experimentally informed operating-domain framework that links formulation-specific bench measurements with cycle-level catalyst operation. The framework was applied to compare three Pt-free Pd-Rh TWC formulations subjected to a common accelerated thermal-aging treatment and subsequently evaluated under common PHEV vehicle, engine, substrate, and downstream cGPF boundary conditions. Bench-scale measurements characterized the conversion of CO, C3H6, and NO, with C3H6 and NO serving as surrogates for engine-out THC and the dominant NOx component, respectively. The measured conversion characteristics were subsequently linked to the temperature, GHSV, and λ distributions predicted over the WLTC and a representative RDE profile. The principal conclusions are as follows.
(1) The formulation ranking depended on the light-off boundary and the pollutant considered. At 30,000 h−1, TWC-3 exhibited the lowest CO light-off temperatures, whereas TWC-2 produced the lowest T50 values for C3H6 and NO. At 50,000 h−1 with its corresponding inlet composition, TWC-2 achieved the lowest T50 and T90 values for all three species. Therefore, the formulation favored by CO light-off at one test condition did not necessarily provide the best simultaneous control of CO, C3H6, and NO under another condition.
(2) Across the representative temperature–GHSV–composition combinations, conversion generally deteriorated when lower temperature coincided with higher GHSV, with TWC-1 showing the greatest sensitivity. The λ sweeps further showed that the simultaneous high-conversion window was centered near stoichiometry and narrowed as GHSV increased. TWC-2 maintained the most consistent combined conversion across the investigated operating domain, whereas the advantages of the higher-loading, Pd-rich TWC-3 were pollutant- and condition-specific.
(3) The WLTC and RDE profile emphasized different catalyst operating regions. The WLTC contained a greater proportion of low- and intermediate-temperature operation, increasing the influence of light-off and warm-up activity. In contrast, the RDE profile was predominantly characterized by hot operation but included GHSVs above 200,000 h−1 and more frequent rich excursions, placing greater emphasis on conversion under short gas residence times and transient redox conditions. These differences explain why the RDE profile produced greater separation among the predicted formulation performances.
(4) Among the three investigated formulations, TWC-2 produced the lowest predicted cycle-integrated emissions overall and exhibited the most balanced performance across the investigated pollutants and driving conditions. Relative to TWC-1 and TWC-3, respectively, TWC-2 reduced predicted TWC-out CO emissions by 11.5% and 10.0% and NOx emissions by 42.4% and 4.1% over the WLTC. The corresponding reductions over the RDE profile were 49.7% and 36.4% for CO and 75.5% and 18.8% for NOx. TWC-2 also produced the lowest predicted cycle-integrated THC emissions. Although the predicted WLTC differences between TWC-2 and TWC-3 for THC and NOx were relatively small, the formulation separation was substantially clearer for CO and under the RDE profile, particularly for NOx. Overall, the results indicate that the higher total precious-metal loading of TWC-3 did not provide a consistent cycle-level advantage over TWC-2 within the investigated operating domains.
Two limitations should be considered when interpreting the formulation comparison. First, total PGM loading, Pd loading, Rh loading, and Pd/Rh ratio were not varied independently. The individual contributions of Pd content, Rh content, and Pd/Rh ratio therefore cannot be uniquely separated from the present formulation matrix, and the observed trends should not be interpreted as isolated causal effects of either metal.
Second, the 980 °C, 15 h furnace thermal-aging treatment was used as a common accelerated aging condition to represent the severe thermal-durability aspect of automotive TWC aging and to establish a reproducible aged state for formulation comparison. The procedure was not intended to reproduce the complete lifetime aging history of a PHEV, which involves additional thermal and chemical aging processes. Accordingly, the robustness of the observed formulation ranking under alternative lifetime-aging protocols was not examined in the present study. The conclusions therefore apply to the investigated formulations after the specified common thermal-aging treatment and over the investigated PHEV operating domains.
The principal contribution of this study is the demonstration that catalyst rankings obtained under isolated bench conditions may not be retained when conversion characteristics are weighted by the operating domains encountered during complete vehicle cycles. In the investigated PHEV application, the highest-loaded formulation provided a local CO light-off advantage but did not deliver the lowest overall emissions, whereas TWC-2 achieved the most balanced performance across the WLTC and RDE operating regions. These findings establish that multi-pollutant conversion over cycle-relevant temperature, GHSV, and λ distributions provides a more representative basis for TWC selection than total precious-metal loading or a single light-off metric.
Author Contributions
Conceptualization, K.L. and X.J.; methodology, X.J.; software, X.J.; validation, K.L., X.J. and H.C.; formal analysis, F.X.; investigation, J.D. and Y.L.; resources, H.C.; data curation, C.W.; writing—original draft preparation, K.L.; writing—review and editing, K.L.; visualization, X.J.; supervision, H.C. and F.X.; project administration, H.C. All authors have read and agreed to the published version of the manuscript.
Funding
This research was funded by the National Key R&D Program of China (Grant No. 2024YFC3712400); Guangdong Provincial Key Laboratory of Clean Automotive Propulsion and Energy Application Technology (2024) (Grant No. 2024B1212020006); and Guangdong Special Support Plan for Young Top-notch Talents (Grant No. 2024TQ08L125). The authors declare that this study did not receive any funding from Guangzhou Automobile Group (China).
Data Availability Statement
The original contributions presented in this study are included in the article. Further inquiries can be directed to the corresponding author.
Conflicts of Interest
Authors Hong Chen, Jiakun Du, and Chengyun Wang were employed by the company Guangzhou Automobile Group (China). The remaining authors declare that the research was conducted in the absence of any commercial or financial relationships that could be construed as potential conflicts of interest.
Abbreviations
| PHEV | Plug-in Hybrid Electric Vehicle |
| TWC | Three-way Catalyst |
| WLTC | Worldwide Harmonized Light Vehicle Test Cycle |
| RDE | Real-driving Emission |
| GHSV | Gas Hourly Space Velocity |
| THC | Total Hydrocarbons |
| cGPF | Catalyzed Gasoline Particulate Filter |
| PGM | Platinum Group Metal |
References
- Jeong, J.W.; Lee, G.; Lee, J.; Woo, S.; Kim, N.; Lee, K. Analysis of energy consumption and emissions characteristics of plug-in hybrid electric vehicle (PHEV) under various real-world driving conditions. J. Environ. Sci. 2026, 163, 566–574. [Google Scholar] [CrossRef] [Scilit]
- Li, L.; Yuan, R.; Hu, W.; Xu, H.; Lv, P.; Xu, Q.; Wang, J.; Jiang, X.; Tan, J.; Yin, J.; et al. Laboratory characterization of VOC evaporative emissions from light-duty plug-in hybrid electric vehicles: Environmental impact comparison with conventional vehicles. Environ. Pollut. 2025, 385, 127176. [Google Scholar] [CrossRef] [Scilit]
- Mandev, A.; Plötz, P.; Sprei, F.; Tal, G. Empirical charging behavior of plug-in hybrid electric vehicles. Appl. Energy 2022, 321, 119293. [Google Scholar] [CrossRef] [Scilit]
- Barbier, A.; Salavert, J.M.; Palau, C.E.; Guardiola, C. Analysis of the Euro 7 on-board emissions monitoring concept with real-driving data. Transp. Res. Part D Transp. Environ. 2024, 127, 104062. [Google Scholar] [CrossRef] [Scilit]
- Londoño, J.D.; Ramos, Á.; Ballesteros, R. Development of a realistic Euro 7 Real Driving Cycle for chassis dyno testing. Transp. Res. Interdiscip. Perspect. 2025, 34, 101625. [Google Scholar] [CrossRef] [Scilit]
- Chen, Z.; Zhang, X.; Chen, Q.; He, R. Study on vehicle evaporative emission characteristics and purge strategy based on China VI measurement methods. Atmos. Pollut. Res. 2025, 16, 102608. [Google Scholar] [CrossRef] [Scilit]
- Ehrenberger, S.I.; Konrad, M.; Philipps, F. Pollutant emissions analysis of three plug-in hybrid electric vehicles using different modes of operation and driving conditions. Atmos. Environ. 2020, 234, 117612. [Google Scholar] [CrossRef] [Scilit]
- Feinauer, M.; Ehrenberger, S.; Epple, F.; Schripp, T.; Grein, T. Investigating particulate and nitrogen oxides emissions of a plug-in hybrid electric vehicle for a real-world driving scenario. Appl. Sci. 2022, 12, 1404. [Google Scholar] [CrossRef] [Scilit]
- Zhang, X.; Wang, H.; Li, J.; Wang, Y.; Yu, H.; Liu, S.; Liu, Y.; Liu, M.; Yan, F.; Cui, Y. Effect of heavy aromatic structures on particulates emission of GDI vehicles under WLTC and RDE conditions. Fuel 2025, 401, 135712. [Google Scholar] [CrossRef] [Scilit]
- Prati, M.V.; Costagliola, M.A.; Giuzio, R.; Corsetti, C.; Beatrice, C. Emissions and energy consumption of a plug-in hybrid passenger car in Real Driving Emission (RDE) test. Transp. Eng. 2021, 4, 100069. [Google Scholar] [CrossRef] [Scilit]
- Wang, R.; Zhang, L.; Peng, J.; Han, J.; Du, B.; Gong, B.; Xue, H.; Tuo, D.; Zhang, Q. Effect of ambient high-temperature on real driving emission tests of a light-duty gasoline vehicle. Atmos. Pollut. Res. 2024, 15, 101998. [Google Scholar] [CrossRef] [Scilit]
- Weiss, M.; Bonnel, P.; Hummel, R.; Provenza, A.; Manfredi, U. On-road emissions of light-duty vehicles in Europe. Environ. Sci. Technol. 2011, 45, 8575–8581. [Google Scholar] [CrossRef] [Scilit]
- O’Driscoll, R.; ApSimon, H.M.; Oxley, T.; Molden, N.; Stettler, M.E.J.; Thiyagarajah, A. A portable emissions measurement system (PEMS) study of NOx and primary NO2 emissions from Euro 6 diesel passenger cars and comparison with COPERT emission factors. Atmos. Environ. 2016, 145, 81–91. [Google Scholar] [CrossRef] [Scilit]
- Brandt, E.P.; Wang, Y.; Grizzle, J.W. Dynamic modeling of a three-way catalyst for SI engine exhaust emission control. IEEE Trans. Control Syst. Technol. 2000, 8, 767–776. [Google Scholar] [CrossRef] [Scilit]
- Lock, J.; Clasén, K.; Sjöblom, J.; McKelvey, T. Cold-start modeling and on-line optimal control of the three-way catalyst. Emiss. Control Sci. Technol. 2021, 7, 321–347. [Google Scholar] [CrossRef] [Scilit]
- Endo, Y.; Hato, Y.; Araki, T.; Sok, R.; Kusaka, J. Prediction of emission performance of a Pd/CeZrAl-three-way catalyst during warmup and start-stop modes in a next-generation plug-in hybrid electric vehicle. Int. J. Engine Res. 2026. [Google Scholar] [CrossRef] [Scilit]
- Okajima, T.; Sivakumar, S.; Shingyouchi, H.; Yamaguchi, K.; Kusaka, J.; Nagata, M. Modeling on a three-way catalyst used in series hybrid electric vehicles considering its specific engine operation attribute. Ind. Eng. Chem. Res. 2021, 60, 1583–1601. [Google Scholar] [CrossRef] [Scilit]
- Okajima, T.; Sivakumar, S.; Shingyouchi, H.; Yamaguchi, K.; Kusaka, J.; Nagata, M. Modeling on a three-way catalyst used in series hybrid electric vehicles focusing on its catalytic behavior at cold start. Ind. Eng. Chem. Res. 2021, 60, 14069–14086. [Google Scholar] [CrossRef] [Scilit]
- Kang, S.B.; Han, S.J.; Nam, S.B.; Nam, I.S.; Cho, B.K.; Kim, C.H.; Oh, S.H. Activity function describing the effect of Pd loading on the catalytic performance of modern commercial TWC. Chem. Eng. J. 2012, 207–208, 117–121. [Google Scholar] [CrossRef] [Scilit]
- Jiang, R.; Wang, H.; Liu, L.; Geng, B.; Chu, X.; Shi, Y.; Wang, X.; Song, S.; Zhang, H. Recent progress of Rh-based three-way catalysts. Smart Mol. 2024, 2, e20240004. [Google Scholar] [CrossRef] [Scilit]
- Zheng, T.; Lu, B.; Harle, G.; Yang, D.; Wang, C.; Zhao, Y. A comparative study of Rh-only, Pd-only and Pd/Rh catalysts. Appl. Catal. A Gen. 2020, 602, 117649. [Google Scholar] [CrossRef] [Scilit]
- Lan, L.; Chen, S.; Wang, S.; Xiang, J.; Huang, L.; Zhu, M.; Lin, H. Synthesis of an advanced Pd-Rh bimetallic catalyst for gasoline engine emission control. Arab. J. Chem. 2022, 15, 103587. [Google Scholar] [CrossRef] [Scilit]
- Woo, H.; Lee, E.J.; Park, H.; Yoon, D.; Kim, C.H.; Lee, K.Y. Enhancing the thermal stability and activity of Pd–Rh/Al2O3 catalyst for three–way catalytic reaction by introducing Pt and varying the synthesis method. J. Environ. Chem. Eng. 2023, 11, 110671. [Google Scholar] [CrossRef] [Scilit]
- Muta, T.; Ohta, R.; Tsushida, M.; Awaya, K.; Ohyama, J.; Koinuma, R.; Miki, T.; Machida, M. Rh/Al2O3 and Pd/Al2O3 three-way catalysts show different thermal deactivation behaviors under real engine-aging conditions. Catal. Today 2025, 459, 115422. [Google Scholar] [CrossRef] [Scilit]
- Machida, M.; Yoshida, H.; Kamiuchi, N.; Fujino, Y.; Miki, T.; Haneda, M.; Tsurunari, Y.; Iwashita, S.; Ohta, R.; Yoshida, H.; et al. Thermal aging of Rh/ZrO2–CeO2 three-way catalysts under dynamic lean/rich perturbation accelerates deactivation via an encapsulation mechanism. ACS Catal. 2023, 13, 3806–3814. [Google Scholar] [CrossRef] [Scilit]
- Wang, C.; Tan, J.; Harle, G.; Gong, H.; Xia, W.; Zheng, T.; Yang, D.; Ge, Y.; Zhao, Y. Ammonia formation over Pd/Rh three-way catalysts during lean-to-rich fluctuations: The effect of the catalyst aging, exhaust temperature, lambda, and duration in rich conditions. Environ. Sci. Technol. 2019, 53, 12621–12628. [Google Scholar] [CrossRef] [Scilit]
- Lee, E.; Bu, J.; Hwang, S.; Choi, J.; Jung, H.; Kim, Y.; Lee, H.; Kim, C.H.; Yoo, J.S.; Kim, D.H. Effects of Pd/CeO2 on the abatement of unburnt hydrocarbon emissions from gasoline vehicles during the cold-start period. JACS Au 2025, 5, 4570–4583. [Google Scholar] [CrossRef] [Scilit]
- Liu, H.; Zhao, J.; Qing, T.; Li, X.; Wang, Z. Energy consumption analysis of a parallel PHEV with different configurations based on a typical driving cycle. Energy Rep. 2021, 7, 254–265. [Google Scholar] [CrossRef] [Scilit]
- Guzzella, L.; Sciarretta, A. Vehicle Propulsion Systems: Introduction to Modeling and Optimization; Springer: Berlin/Heidelberg, Germany, 2005. [Google Scholar] [CrossRef] [Scilit]
- Maurer, R.; Kossioris, T.; Hausberger, S.; Toenges-Schuller, N.; Sterlepper, S.; Günther, M.; Pischinger, S. How to define and achieve Zero-Impact emissions in road transport? Transp. Res. Part D Transp. Environ. 2023, 116, 103619. [Google Scholar] [CrossRef] [Scilit]

Disclaimer/Publisher’s Note: The statements, opinions and data contained in all publications are solely those of the individual author(s) and contributor(s) and not of MDPI and/or the editor(s). MDPI and/or the editor(s) disclaim responsibility for any injury to people or property resulting from any ideas, methods, instructions or products referred to in the content. |
© 2026 by the authors. Licensee MDPI, Basel, Switzerland. This article is an open access article distributed under the terms and conditions of the Creative Commons Attribution (CC BY) license.