


Abstract
High renewable-energy shares do not, by themselves, guarantee that renewable electricity can be absorbed, shifted, and delivered through a constrained network. This study uses openTEPES for a deterministic 8736 h assessment of Tunisia’s 2035 power system, represented by 47 domestic nodes. It compares matched cases without and with endogenous battery energy storage system (BESS) investment and evaluates eight sensitivity families. In the no-BESS case, 265.996 GWh of modelled energy not served (ENS) and 1120.263 GWh of renewable curtailment occur in disjoint hours, indicating a temporal mismatch between scarcity and surplus. Under the central assumptions, the model selects 3.590 GW/14.361 GWh of BESS, reducing modelled ENS to zero under the represented deterministic conditions and renewable curtailment to 42.362 GWh. The sensitivity analysis shows that the model-selected BESS capacity and location, together with transmission exposure, depend strongly on demand, imposed duration, renewable-profile stress, interconnection availability, and candidate siting. Within the modelled scenario space, storage, internal transmission, and cross-border exchange therefore provide complementary forms of flexibility. The central BESS quantity is interpreted as a conditional planning benchmark, not as evidence of probabilistic adequacy or a national procurement target.
1. Introduction
1.1. Background and Previous Work
Installed renewable capacity and annual renewable shares do not, by themselves, show whether electricity can be absorbed, shifted, and delivered when and where it is needed. As solar photovoltaic (PV) and wind generation increase, renewable surpluses, residual-load ramps, scarcity periods, and network bottlenecks may coexist within the same annual energy balance. Planning outcomes therefore depend on both renewable chronology and operating constraints [1,2], requiring modelled energy not served (ENS), curtailment, and transmission loading to be assessed jointly.
Storage, transmission, and interconnection offer complementary forms of flexibility. Storage can reduce curtailment in transmission-constrained systems [3], while generation, storage, and transmission choices evolve jointly as renewable targets increase [4]. The system value of batteries also depends on renewable penetration, system structure, cost, and duration [5,6,7], which motivates the coordinated consideration of grid capacity and bulk storage [8]. Under specific assumptions, batteries may complement or partly substitute for cross-border transfer [9]; however, the relative contributions of these flexibility options remain strongly system- and scenario-dependent.
High-resolution investment and dispatch models can help bridge long-term transition pathways and operational constraints. openTEPES jointly represents the operation and expansion of generation, storage, and transmission [10], while linearised network formulations enable tractable active-power routing across large chronological datasets. Such representations are nevertheless planning approximations and do not replace alternating-current (AC) load-flow analysis [11] or dedicated assessments of voltage, reactive power, and N − 1 security.
Tunisia provides a relevant setting for electricity-system planning. Natural gas remains the principal fuel for electricity generation [12], and the national energy strategy foresees substantial solar and wind deployment through 2035 [13]. At the same time, the planned 600 MW ELMED Tunisia–Italy interconnector is intended to strengthen regional exchange alongside domestic network development [14]. Against this background, renewable availability, temporal flexibility, and domestic transmission deliverability constitute distinct but interacting planning dimensions.
Previous studies specific to Tunisia have examined alternative electricity-generation mixes [15], long-term OSeMOSYS pathways [16], interactions between energy-efficiency policies and renewable integration [17], demand and fuel-price uncertainty [18], and nationally determined contribution pathways [19]. At the regional level, TIMES-MAGe has assessed renewable deployment, mitigation pathways, and electricity trade across the Maghreb [20]. Collectively, these studies establish the strategic context for Tunisia’s electricity transition. Building on this body of work, the present study adds an 8736 h nodal assessment that jointly evaluates modelled ENS, renewable curtailment, endogenous battery energy storage system (BESS) selection, and physical-circuit loading by time and location.
The broader literature also identifies complementary analyses that lie beyond the scope of the present work. Resource adequacy is inherently probabilistic [21], and the dependable contributions of solar generation and energy-limited storage are commonly assessed using capacity-credit metrics [22]. Multi-year weather variability can materially affect investment and operating outcomes [23,24], while storage size and siting depend on network conditions and the available candidate set [25]. Long-term storage economics also depend on technology-cost trajectories, degradation, replacement, and other lifetime assumptions [26,27]. Assessing the dependable contribution of interconnection, in turn, requires multi-region adequacy analysis [28]. Table 1 positions the present deterministic assessment relative to these complementary strands of the literature.
Table 1.
Positioning of the present study within the representative literature.
1.2. Motivation, Scope and Main Contributions
This study addresses the gap between aggregate transition-pathway analysis and detailed security and adequacy studies by applying a chronological, network-constrained model to Tunisia’s prospective power system. The model represents 47 domestic nodes, seven external boundary nodes, and 8736 sequential hourly time steps. Four central configurations comprise a 2024 operating baseline, a 2030 diagnostic case, and matched 2035 cases without and with endogenous BESS investment.
Eight deterministic sensitivity families test the aggregate BESS cost assumption, the assumed value of lost load (VoLL), annual demand, stylised Algerian and ELMED import availability, targeted transfer-capacity relaxations, BESS duration, candidate-node eligibility, and variable renewable energy (VRE)-profile stress. These cases are structured scenario perturbations rather than samples from a probabilistic uncertainty distribution. Accordingly, zero modelled ENS indicates balance feasibility only under the represented conditions; it does not establish probabilistic adequacy, AC system security, or a national investment requirement.
The analysis addresses three interrelated dimensions. The first examines how BESS cost, assumed VoLL, and the imposed power–energy relationship affect model-selected storage power and energy, modelled ENS, and renewable curtailment. The second assesses how stylised cross-border availability and targeted transfer-capacity relaxations affect storage selection and internal transmission exposure. The third evaluates how demand scaling, deterministic VRE-profile stress, and alternative BESS candidate domains alter the selected portfolio and its spatial consequences.
The study makes four contributions. First, it combines an 8736 h chronology with a 47-node representation to evaluate modelled ENS, renewable curtailment, BESS operation, and physical-circuit loading within a common framework. Second, it distinguishes temporal scarcity from renewable surplus, showing why annual renewable-energy availability alone is insufficient to characterise system balance. Third, it examines the interaction between temporal flexibility and spatial deliverability through matched 2035 cases and the resulting changes in internal network exposure. Fourth, the eight sensitivity families show how storage quantity, duration, siting, and transmission consequences vary across the tested economic, demand, interconnection, and renewable-profile assumptions.
Accordingly, the resulting BESS quantities, recurrent nodes, and stressed corridors are treated as scenario-conditioned planning outputs rather than probabilistic adequacy evidence or definitive investment requirements. The central-case BESS selection serves as a benchmark within the represented model, network, and candidate set, while the sensitivity analysis identifies the conditions under which that benchmark changes.
The remainder of the paper presents the modelling framework and data representation, followed by the central-case and sensitivity results, their planning interpretation, and the main limitations and priorities for future work on probabilistic adequacy, multi-year weather variability, co-optimised network-flexibility planning, and AC security.
2. Materials and Methods
2.1. Analytical Design and Inference Target
This study applies a deterministic, chronological, and nodal optimisation framework to examine how enabling storage affects modelled energy not served (ENS), renewable curtailment, and active-power transfers in Tunisia’s prospective power system. The analytical design includes a 2024 operating baseline, a 2030 diagnostic case, matched 2035 cases without and with endogenous battery energy storage system (BESS) investment, and eight deterministic sensitivity families. The central 2035 case assumes an annual demand of 33.300 TWh.
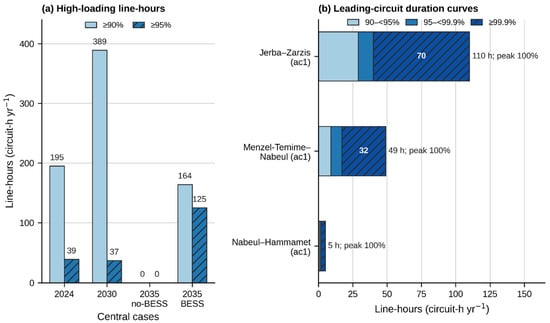
The nodal representation provides operational detail beyond national aggregates. Its 47 domestic nodes allow ENS, renewable curtailment, storage siting, and circuit exposure to be resolved by location and hour. In the central BESS case, the model produces 164 physical-circuit line-hours at or above 90% of effective capacity and 125 at or above 95%. Across the S7 candidate-domain screens, line-hours at or above 95% range from 6 to 1916. These siting-dependent differences would be obscured in a single-node model or national energy balance.
The matched 2035 cases form the main controlled comparison within the model. They share the same hourly nodal demand matrix, renewable capacities and reference profiles, thermal-unit data and static availability parameters, nodal allocations, 101-circuit network, cross-border limits, operating costs, direct-emission factors, CO2 price, and ENS penalty. They differ only in the activation of continuous BESS investment and operating variables, the associated storage constraints, and the annualised BESS-investment term in the objective. Differences between the two cases therefore isolate the consequences of enabling BESS within the represented option set. This attribution does not extend beyond that option set to all feasible generation, demand-side, network, or interconnection alternatives.
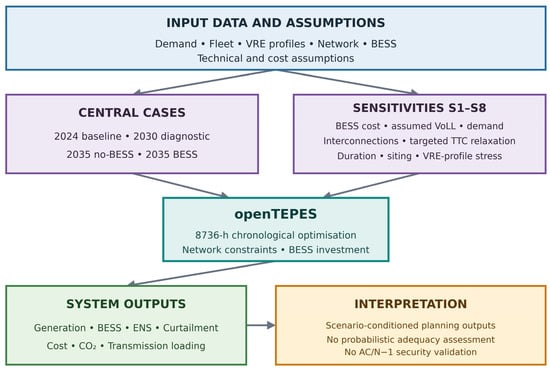
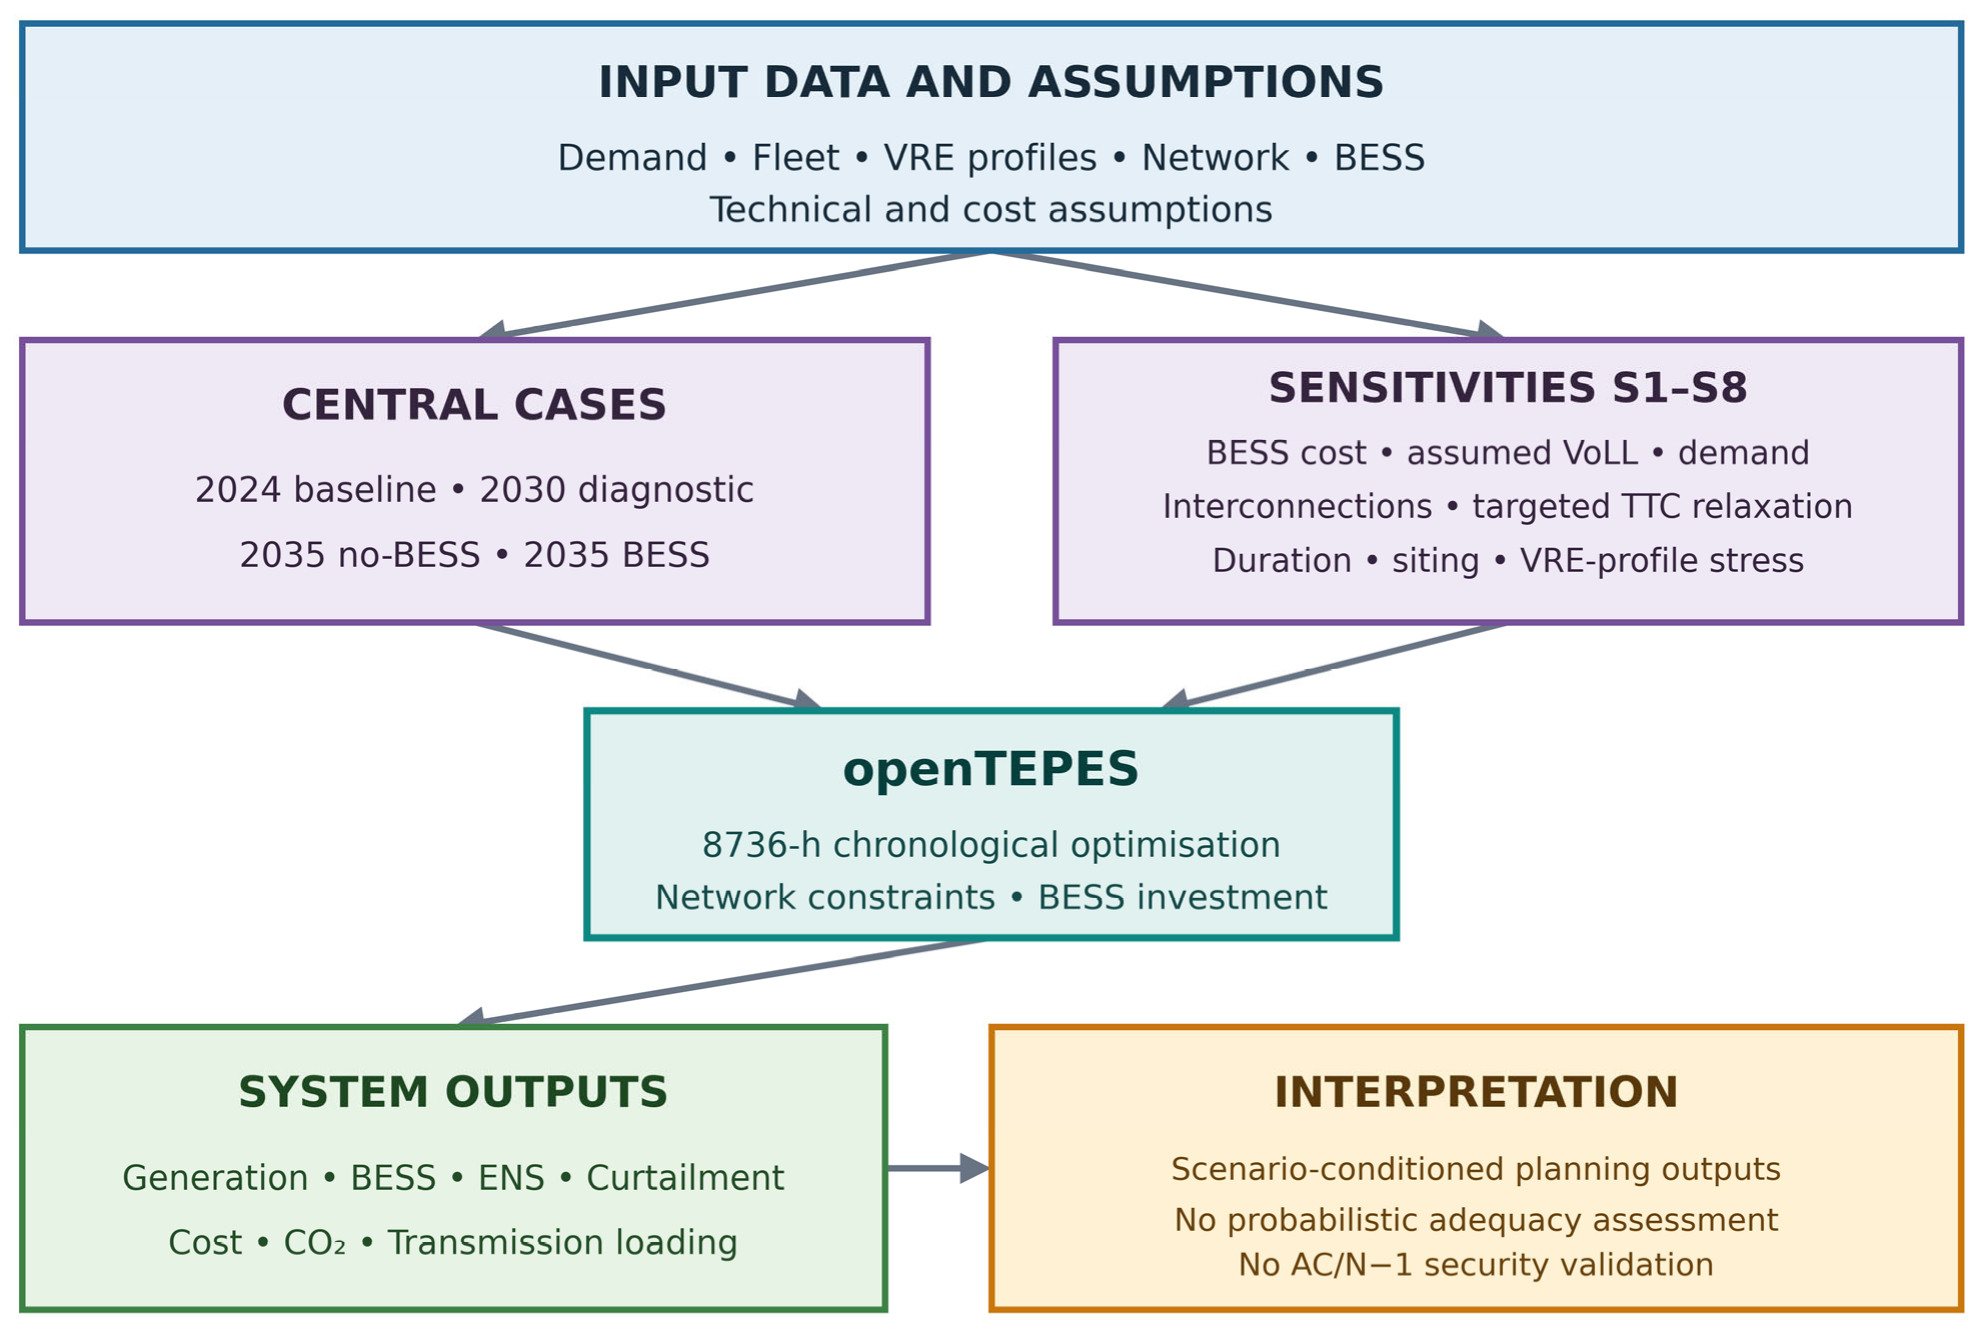
Figure 1 summarises the analytical chain. The framework screens energy-balance and transmission-deliverability outcomes under the stated assumptions. Its inference scope is limited to deterministic active-power planning and excludes probabilistic resource adequacy, AC or N − 1 security assessment, and investment-grade national expansion planning.
Figure 1.
Modelling workflow and scenario structure. Central cases and sensitivity families S1–S8 are evaluated using the chronological, network-constrained openTEPES framework.
2.2. openTEPES Configuration and Formulation
The cases were formulated as a continuous linear programme and solved with openTEPES version 4.18.16 [10] and Gurobi Optimizer 13.0.2. Binary generation investment, retirement, and commitment; binary line investment and switching; ramping; and minimum up/down-time options were disabled, while active-power network losses were enabled. Each configuration contains one period, one unit-probability scenario, one stage, and 8736 sequential one-hour load levels. The represented horizon therefore covers 52 complete weeks (364 days), rather than an 8760 h civil year. All cases use the same chronology and hour weights; annual totals refer to the represented 8736 h.
The model minimises annual system cost, as expressed in Equation (1):
where is total modelled annual cost; includes fuel and variable operating costs; is the cost of direct domestic operational emissions; is the penalty assigned to unserved energy; and is the annualised storage-investment term included only in BESS-enabled cases. A direct CO2 price of 25 EUR tCO2−1 is used. The central assumed value of lost load (VoLL) is 10,000 EUR MWh−1. It is an exogenous scarcity penalty assumption, implemented through the openTEPES input as ENSCost; it is not presented as an empirically estimated, consumer-specific Tunisian VoLL. The assumed VoLL range is tested explicitly in S2, consistent with the methodological distinction in [29].
For each domestic node and hour , the active-power balance is given by Equation (2):
where denotes local generation; denotes BESS discharge; denotes imports when enabled; denotes net transmission inflow; denotes unserved power; denotes nodal demand; denotes BESS charging; and denotes allocated active-power losses. All power terms are expressed in MW. ENS is a non-negative slack penalised in the objective. Imported power is fixed to zero when the relevant cross-border transfer limit is unavailable and is otherwise bounded by the case-specific limit.
2.3. Data Sources, Representation and Preprocessing
Project-specific processed datasets provide the numerical model inputs, including sets and mappings, hourly demand and renewable availability, generator and network characteristics, operating assumptions, emissions, variable costs, and model options. Table A3 summarises the numerical representation, source or modelling basis, and model treatment of each data component.
The 2024 annual energy balance, Algerian imports, and reference electricity-demand data were derived from the Société Tunisienne de l’Électricité et du Gaz (STEG) Annual Report 2024 [30]. These data informed the identification and representation of Tunisia’s principal demand locations. Prospective annual demand, renewable deployment, and horizon-specific infrastructure assumptions were aligned with Tunisia’s 2035 energy-strategy framework [13], while the stylised 600 MW ELMED option follows the documented project rating [14]. The resulting hourly, nodal, generation, and network inputs were processed for the openTEPES implementation, as detailed below and in Table A3.
The 2035 model contains 54 nodes, 87 generating units, 101 network circuits, and 8736 hourly time steps. Of the 54 nodes, 47 are domestic and seven are external boundary nodes: four Algerian, two Libyan, and one Italian. The generator inventory comprises 37 gas-fired units, seven hydropower units, 28 solar units, and 15 wind units. The network contains 100 AC circuits and one direct-current (DC) circuit.
The inputs were prepared consistently across cases. Annual demand matrices were scaled to the stated TWh totals. The matched 2035 cases share the same demand matrix and all non-BESS exogenous inputs, while node, generator, and circuit mappings and scenario, period, stage, and duration weights remain fixed. Energy balances, costs, emissions, and network indicators are calculated using common post-processing definitions.
2.4. Demand Chronology and Nodal Allocation
The authors developed the domestic nodal representation using an expert-informed spatial aggregation. The 47 demand nodes provide national coverage of Tunisia’s principal regions and demand centres. Node selection and demand allocation were informed by node-level demand information reported by the STEG [30]. These values were mapped to the selected model nodes and processed into the openTEPES oT_Data_Demand input. The resulting dataset is therefore a STEG-informed, author-developed nodal-demand representation rather than a directly published 47-node openTEPES dataset.
The reference demand chronology was constructed from electricity-demand information in the STEG Annual Report 2024 [30] and harmonised with the model’s 8736 h, 52-week horizon. The resulting 2024-derived hourly nodal matrix was scaled to annual demand totals of 29.500666 TWh for 2030 and 33.300 TWh for 2035, while preserving the reference temporal profile and nodal demand shares. The 2030 and 2035 profiles are therefore scenario projections based on a common 2024 reference chronology rather than independently forecast hourly profiles. Timestamp offsets in the processed input preserve only the ordering of the 8736 hourly steps and carry no time-zone-dependent operational interpretation.
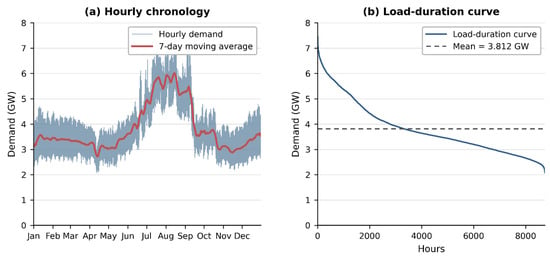
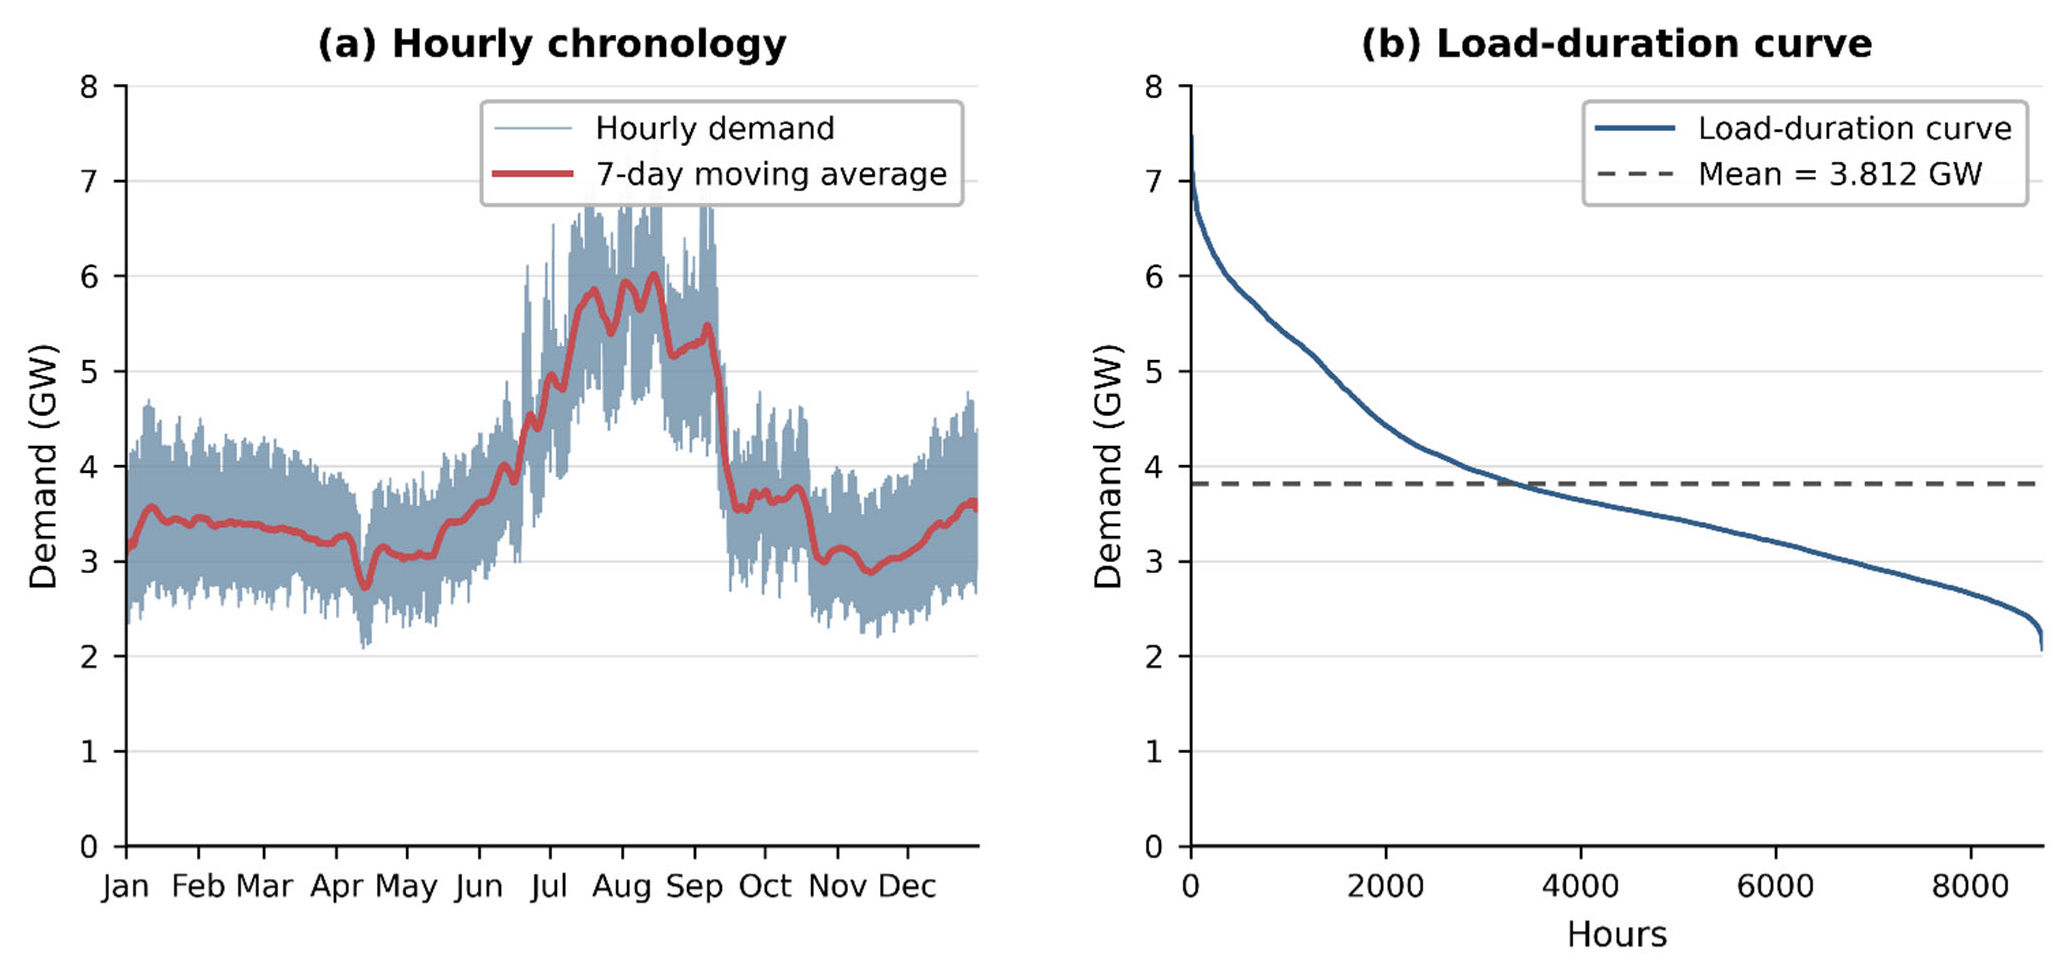
In the 2035 reference matrix, mean hourly demand is 3.812 GW, peak demand is 7.453 GW, and the load factor is 51.1%. The matrix sums to 33.300 TWh and contains no missing or negative demand values. Figure 2 shows the aggregate hourly chronology and the corresponding load-duration curve.
Figure 2.
Aggregate 2035 demand profile. (a) Hourly chronology and 7-day moving average; (b) load-duration curve. Annual demand is 33.300 TWh, with mean and peak loads of 3.812 and 7.453 GW, respectively.
2.5. Renewable and Thermal Generation Representation
Solar PV and wind capacities are specified exogenously by horizon, generator, and node. The 2035 case includes 43 generator-level VRE availability series: 28 solar and 15 wind. The openTEPES input VariableMaxGeneration specifies hourly available-power ceilings in MW rather than dimensionless capacity factors. Renewable dispatch is bounded by these hourly ceilings, and curtailment is calculated using Equation (3):
where is curtailed renewable power; is the available-power ceiling; and is dispatched renewable power for renewable unit at hour t, with all power quantities expressed in MW. Installed capacities and nodal allocations remain fixed in S8; only the prescribed hourly solar and/or wind availability ceilings are modified. Private-sector and independent-power-producer renewable units are consolidated within the solar and wind technology categories. BESS discharge is reported separately and excluded from domestic primary renewable generation because it represents previously generated electricity shifted in time. Imports are likewise excluded from the numerator used to calculate domestic primary renewable generation.
The reference VRE series represent a single chronology rather than a multi-year weather dataset. S8 applies nine deterministic annual scaling transformations and one synthetic 168 h low-VRE stress to this chronology. The low-VRE stress applies PV × 0.70 and wind × 0.50 during model hours 4674–4841, with all other hours unchanged. These cases quantify the model response to prescribed VRE-profile perturbations rather than weather-event probabilities, return periods, or probabilistic renewable uncertainty. Table A2 reports the transformations and bounding rules.
In the implemented formulation, positive VariableMaxGeneration values define absolute hourly availability ceilings and supersede the corresponding static MaximumPower values. In the reference dataset, 1215 generator-hours have hourly availability values above the corresponding static metadata while remaining within the applicable hourly ceilings. For 48 hourly entries associated with wind001 and wind002 on 1 March, VariableMaxGeneration values are missing, so the applicable static limits of 54 and 186 MW, respectively, are used. During these hours, the full 240 MW is curtailed. This fallback accounts for 5.760 GWh, or 0.51%, of no-BESS curtailment and does not affect ENS, dispatch, fuel use, emissions, or cost. Accordingly, the reference series are treated as model input profiles rather than as meteorologically validated multi-year data.
Thermal-generator inputs include node, technology, minimum and maximum output, fuel and variable operating costs, static availability, and direct CO2-emission rates. Continuous output bounds and nodal balances are active, whereas binary unit commitment, start-up/shutdown trajectories, ramp constraints, and minimum up/down-time constraints are disabled, even when corresponding descriptive input fields are present. The formulation therefore represents chronological economic dispatch with relaxed unit commitment rather than detailed unit-level operation.
Operating-reserve requirements are set to zero in all hours, and reserve activation is disabled. The model includes neither sampled forced-outage states nor chronological maintenance schedules; static availability parameters therefore represent deterministic assumptions rather than a probabilistic outage model. Voltage, reactive power, inertia, frequency response, dynamic stability, and full N − 1 security lie outside the formulation. Accordingly, modelled ENS represents residual active-energy imbalance under the stated conditions rather than reserve-constrained reliability or operational-security compliance.
2.6. Nodal Network and Cross-Border Representation
The modelled network comprises 47 Tunisian nodes and seven external boundary nodes representing the cross-border topology. Transmission expansion is treated exogenously rather than optimised within the model. Horizon-specific topologies comprise 87 circuits in 2024, 96 in 2030, and 101 in 2035. The topology is fixed within each same-horizon comparison; in particular, the matched 2035 cases use the same 101-circuit network.
The asymmetry between endogenous BESS investment and exogenous transmission is intentional. The matched 2035 comparison isolates the storage response within a predetermined network. Endogenous co-expansion would introduce route, technology, and cost trade-offs beyond the represented option set and would alter the comparison being isolated. S5 therefore uses prescribed transfer-capacity relaxations as counterfactual screening cases. Joint storage–transmission expansion could reduce, increase, or relocate the selected BESS portfolio; the central storage quantity is therefore conditional on the represented network-development assumptions.
Each circuit is characterised by its terminals, circuit identifier, type, voltage, reactance, loss factor, nominal total transfer capacity (TTC), and security factor. Active-power routing follows a linearised DC power-flow formulation [11]. Effective capacity is defined as TTC multiplied by the circuit security factor, and utilisation is measured relative to this value. Losses are enabled and allocated to nodal balances, while binary line switching and endogenous line investment are disabled. The formulation therefore supports active-power congestion screening, but not voltage, reactive-power, short-circuit, protection, stability, or N − 1 assessment.
The prospective 2030 and 2035 reference cases are represented as domestic zero-import stress tests. Algerian and Libyan links remain in the topology with negligible effective transfer limits, while ELMED has zero transfer capacity. The 2024 operating baseline includes 2.663 TWh of calibrated Algerian imports. S4 tests stylised Algerian and ELMED import availability through controlled 0/300/600 MW configurations. These cases exclude interconnector investment costs, foreign-system adequacy, market and outage availability, and emissions associated with imported electricity. They therefore quantify the effect of stylised import availability on the domestic model solution rather than dependable import capacity or project feasibility.
S5 applies prescribed multipliers to the direct TTC of recurrently stressed circuits, while all non-targeted network parameters remain unchanged. Because project costs, routing alternatives, construction constraints, and AC/N − 1 validation lie outside these cases, S5 is interpreted as a transfer-capacity screening exercise rather than a transmission-investment assessment.
The reference TTC values are 357 MW for Jerba–Zarzis and 179 MW for both Menzel-Temime–Nabeul and Nabeul–Hammamet. The ×1.20 and ×1.50 screens increase these values to 428.4 and 535.5 MW for Jerba–Zarzis and to 214.8 and 268.5 MW for each 179 MW circuit, respectively. The Top2 ×2.00 screen sets TTC to 714 MW for Jerba–Zarzis and 358 MW for Menzel-Temime–Nabeul; Nabeul–Hammamet is included only in the Top3 ×1.20 and ×1.50 screens. The security factor remains fixed at 0.70. Because TTCBck is left blank, openTEPES applies the resulting effective transfer limit symmetrically in both directions. Reactance, loss factor, topology, and all non-targeted network inputs remain unchanged.
2.7. BESS Candidates and Economic Representation
BESS investment is enabled only in BESS-enabled configurations. The central candidate set consists of 27 lithium-ion (Li-ion) options: one solar-oriented candidate at each of the 17 domestic nodes hosting solar generation and one wind-oriented candidate at each of the 10 domestic nodes hosting wind generation. Six nodes belong to both groups, yielding 21 unique candidate nodes. Each candidate has a continuous investment bound of 1000 MW and a four-hour power–energy relationship, giving an aggregate pre-optimisation domain of 27 GW and 108 GWh. Candidate eligibility is determined by the generator and candidate mappings. The central selection of 3.590 GW/14.361 GWh is an endogenous model output rather than an imposed national target.
The assumed round-trip efficiency is 0.90. In the openTEPES storage balance, the charging term is multiplied by the square root of this coefficient and the discharging term is divided by the same quantity [10]. The eChargeDischarge constraint further couples charging and discharging by limiting their combined normalised utilisation. No binary operating-mode variable is used. The resulting hourly schedules were checked for simultaneous positive charging and discharging; no such occurrence was found in the analysed BESS cases.
Selected storage energy and power are linked by Equation (4):
where is selected energy capacity (MWh), is selected power (MW), and is the imposed duration (h). S6 tests 2, 4, 6, 8 and 10 h.
The central investment assumption is an aggregated power-based capital expenditure (CAPEX) of 200 kEUR MW−1 with a fixed charge rate (FCR) of 0.08 yr−1. The corresponding annualised BESS-investment term is given by Equation (5):
where is the assumed power-based CAPEX. The resulting annualised coefficient is 16 kEUR MW−1 yr−1. Because the model includes no separate energy-cost coefficient, the corresponding four-hour equivalent is 50 EUR kWh−1. This simplified cost representation serves as a sensitivity proxy rather than a complete lifetime-cost, profitability, or procurement model. The economic assumptions are summarised in Table A3.
2.8. Central Cases and Deterministic Sensitivity Programme
Table 2 defines the four central configurations. Cross-horizon differences reflect exogenous horizon assumptions, whereas the matched 2035 comparison isolates BESS activation within a common 2035 dataset.
Table 2.
Central-case definitions and matched assumptions.
Table 3 summarises the eight deterministic sensitivity families. Unless otherwise stated, each family varies a single input or admissible domain relative to TN2035_B_REF, while all other assumptions remain fixed. Central-value replications provide numerical consistency checks and are excluded from slope estimates, threshold estimates, and cross-family extrema. The resulting ranges characterise scenario responses and stress boundaries rather than probability-weighted uncertainty or interaction effects. Table A1 reports the exact S7 candidate-node domains.
Table 3.
Deterministic sensitivity design and interpretation boundaries.
2.9. Indicators, Post-Processing and Reproducibility
A common post-processing framework is applied to all cases. Annual indicators include demand and served demand, generation by technology, renewable availability and curtailment, ENS, thermal generation, imports, selected BESS power and energy, charging and discharging, equivalent full cycles, direct domestic operational CO2 emissions, active-power losses, cost components, and circuit-loading duration. Imports and BESS discharge are retained as separate energy-flow categories.
Equivalent full cycles, , are calculated using Equation (6):
where is the annual discharged energy, and is the selected energy capacity. Annual ENS is calculated using Equation (7):
with = 1 h. For manuscript display, annual ENS below 0.001 GWh is rounded to zero; hourly events are considered material above 0.001 MW. These are reporting thresholds, not reliability standards.
Circuit utilisation is defined by Equation (8):
where is circuit flow, is nominal transfer capacity, and is the security factor. Loading is reported as physical-circuit line-hours at or above 90%, 95% and, where available, 99% of effective capacity. Line-hours sum qualifying hours over circuits and are distinct from system-hours. S6 retains only ≥99% counts and is therefore excluded from comparisons using the common ≥95% metric.
To distinguish avoided ENS penalties from storage profitability, the cost excluding the ENS term is also reported using Equation (9):
where is the native modelled total cost, is the assumed value of lost load, and is annual ENS. The conversion from EUR to million euros (MEUR) is applied consistently. Emissions cover direct domestic operation only; imported-electricity emissions are outside the boundary.
All analysed cases returned an optimal solution status. Before presolve, the 2035 no-BESS configuration contains approximately 4.31 million constraints, 4.53 million variables, and 16.27 million non-zero coefficients, with zero reported primal and dual infeasibility. Common consistency checks cover annual energy balances, units, demand totals, technology aggregation, costs, emissions, and circuit identifiers. BESS-enabled cases are additionally checked for consistency among selected power, selected energy, and imposed duration, and for simultaneous charging and discharging.
Hourly ENS and renewable curtailment in the 2035 no-BESS case were also compared to determine whether their annual coexistence reflects simultaneous events or distinct operating regimes. Co-occurrence is evaluated using the 0.001 MW reporting threshold defined above, together with demand, VRE availability, thermal dispatch, and circuit loading during the identified hours.
2.10. Scope of Inference
The following boundaries govern the interpretation of the Results and Discussion.
Deterministic energy balance: Zero modelled ENS indicates that all represented nodal active-power balances are satisfied for the selected chronology, static availability parameters, network, and option set. It does not estimate loss-of-load probability, expected outage frequency, reserve sufficiency, or dependable capacity contribution.
Renewable and demand uncertainty: S3 and S8 apply deterministic perturbations to a single demand shape and a single renewable chronology. They do not sample correlated weather years, temperature-sensitive demand, forced outages, chronological maintenance, reserve deployment, or compound events. A probabilistic multi-year study incorporating unit and network contingencies could alter ENS as well as the selected storage quantity, duration, location, and competing flexibility mix. The present analysis therefore characterises responses across the tested scenarios rather than robustness to a probability distribution.
Storage quantity and economics: BESS is the principal endogenous expansion option in the central comparison; new generation, demand response, network expansion, and interconnector investment are not co-optimised as competing options. The selected 3.590 GW/14.361 GWh therefore represents a conditional central-case screening benchmark rather than a national requirement or investment recommendation. A statistical confidence interval is not meaningful for a deterministic single-chronology optimisation. Scenario dependence is instead characterised by the bounded responses across S1–S8 and the matched-case structure; the selected capacity should not be extrapolated beyond the tested option set.
Network and interconnection: Circuit loading and TTC relaxations are active-power screening measures. Corridors identified through these screens require subsequent AC load-flow, contingency, protection, stability, constructability, and economic assessment. Import cases assume stylised capacity availability and therefore do not establish foreign-system adequacy, market access, or dependable import contribution.
Transferability: The analytical framework and reporting logic may be transferable to other emerging power systems, whereas the numerical capacities, nodes, corridors, and thresholds are specific to the represented Tunisian dataset and scenario set.
3. Results
All results are derived from deterministic 8736 h simulations under the represented chronology, static availability parameters, network configuration, and option set. Zero modelled energy not served (ENS) indicates that nodal active-power balances are satisfied under these conditions; it does not establish probabilistic adequacy, reserve sufficiency, AC feasibility, or N − 1 security. Transmission exposure is reported as physical-circuit line-hours at or above specified fractions of effective transfer capacity.
3.1. Central-Case Trajectory and No-BESS Mechanism
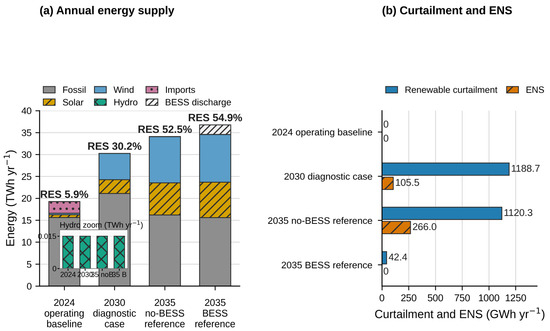
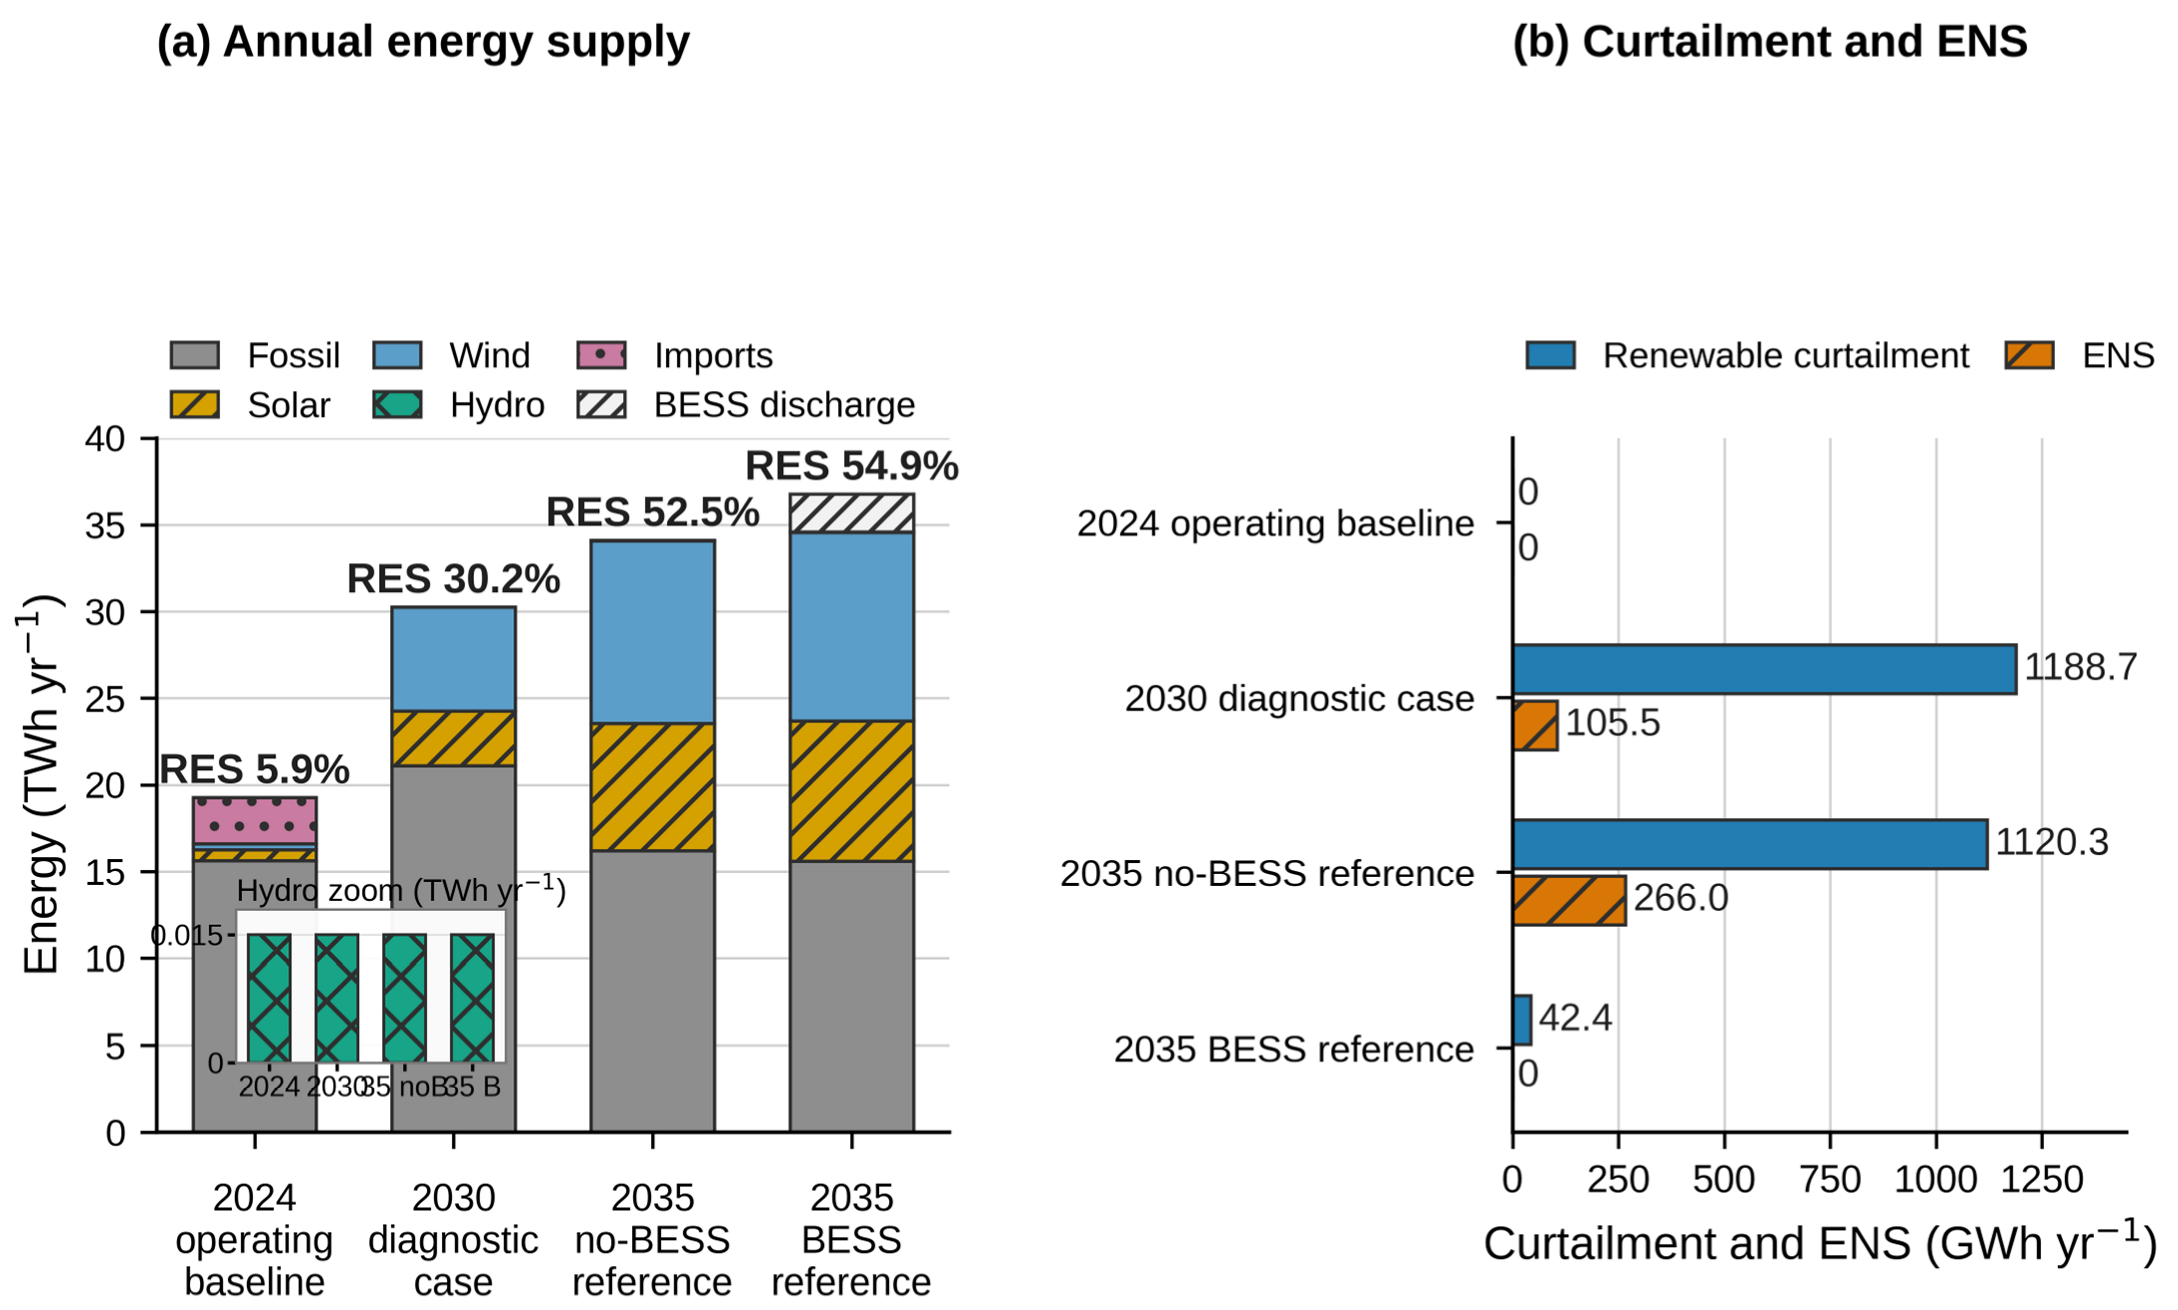
The 2024 operating baseline serves all 18.614 TWh of demand without modelled ENS or renewable curtailment. Total supply is 19.268 TWh, including 2.663 TWh of Algerian imports. Domestic solar PV, wind, and hydropower generate 0.976 TWh, equivalent to 5.87% of domestic primary generation, while direct domestic operational emissions reach 6.030 MtCO2. The network records 195 and 39 internal physical-circuit line-hours at or above 90% and 95% of effective transfer capacity, respectively, with the highest exposure on Tunis-ville–Tunis-nord (ac1).
The 2030 diagnostic case assumes zero prospective imports and no BESS. Of the 29.501 TWh annual demand, 29.395 TWh is served. Domestic primary renewable generation reaches 9.151 TWh (30.24%), while renewable curtailment is 1188.735 GWh and modelled ENS is 105.535 GWh over 382 h, with a maximum hourly shortfall of 964.6 MW. The case records 389/37 physical-circuit line-hours at or above 90%/95%, and direct domestic operational emissions reach 8.715 MtCO2. These results describe the represented zero-import transition case rather than an unconditional forecast of the 2030 system.
In the 2035 no-BESS reference case, annual demand is 33.300 TWh, of which 33.034 TWh is served. Domestic primary renewable generation reaches 17.907 TWh (52.53%), while fossil generation reaches 16.185 TWh. Renewable curtailment is 1120.263 GWh, and modelled ENS reaches 265.996 GWh over 564 h, with a maximum hourly shortfall of 1527.0 MW. No physical circuit reaches 90% of effective capacity; annual peak loading is 85.7% on Gafsa–Tozeur (ac1). Thus, the annual renewable-energy balance does not imply hourly supply–demand balance.
The hourly decomposition explains how annual shortage and renewable surplus coexist. At the 0.001 MW reporting threshold, modelled ENS and renewable curtailment do not occur in the same hour. During the 564 ENS hours, mean demand is 5.818 GW, mean available VRE is 0.937 GW, thermal dispatch averages 4.530 GW at the represented aggregate ceiling, and maximum internal-circuit loading reaches 81.3%. By contrast, during the 1320 curtailment hours, mean demand is 3.287 GW and mean available VRE is 4.223 GW. The two outcomes therefore arise from distinct temporal regimes: high-demand/low-VRE periods produce scarcity, whereas lower-demand/high-VRE periods produce renewable surplus that is curtailed in the absence of storage. Figure 3 summarises annual generation, renewable curtailment, and modelled ENS across the central cases.
Figure 3.
Central-case energy outcomes. (a) Domestic generation, imports and BESS discharge; (b) renewable curtailment and modelled ENS. BESS discharge and imports are excluded from domestic primary renewable generation.
3.2. Central BESS Response and Utilisation
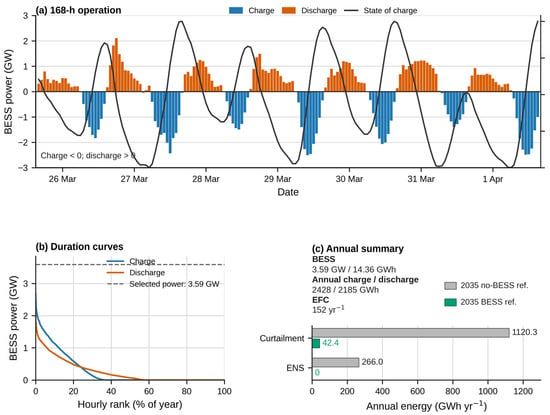
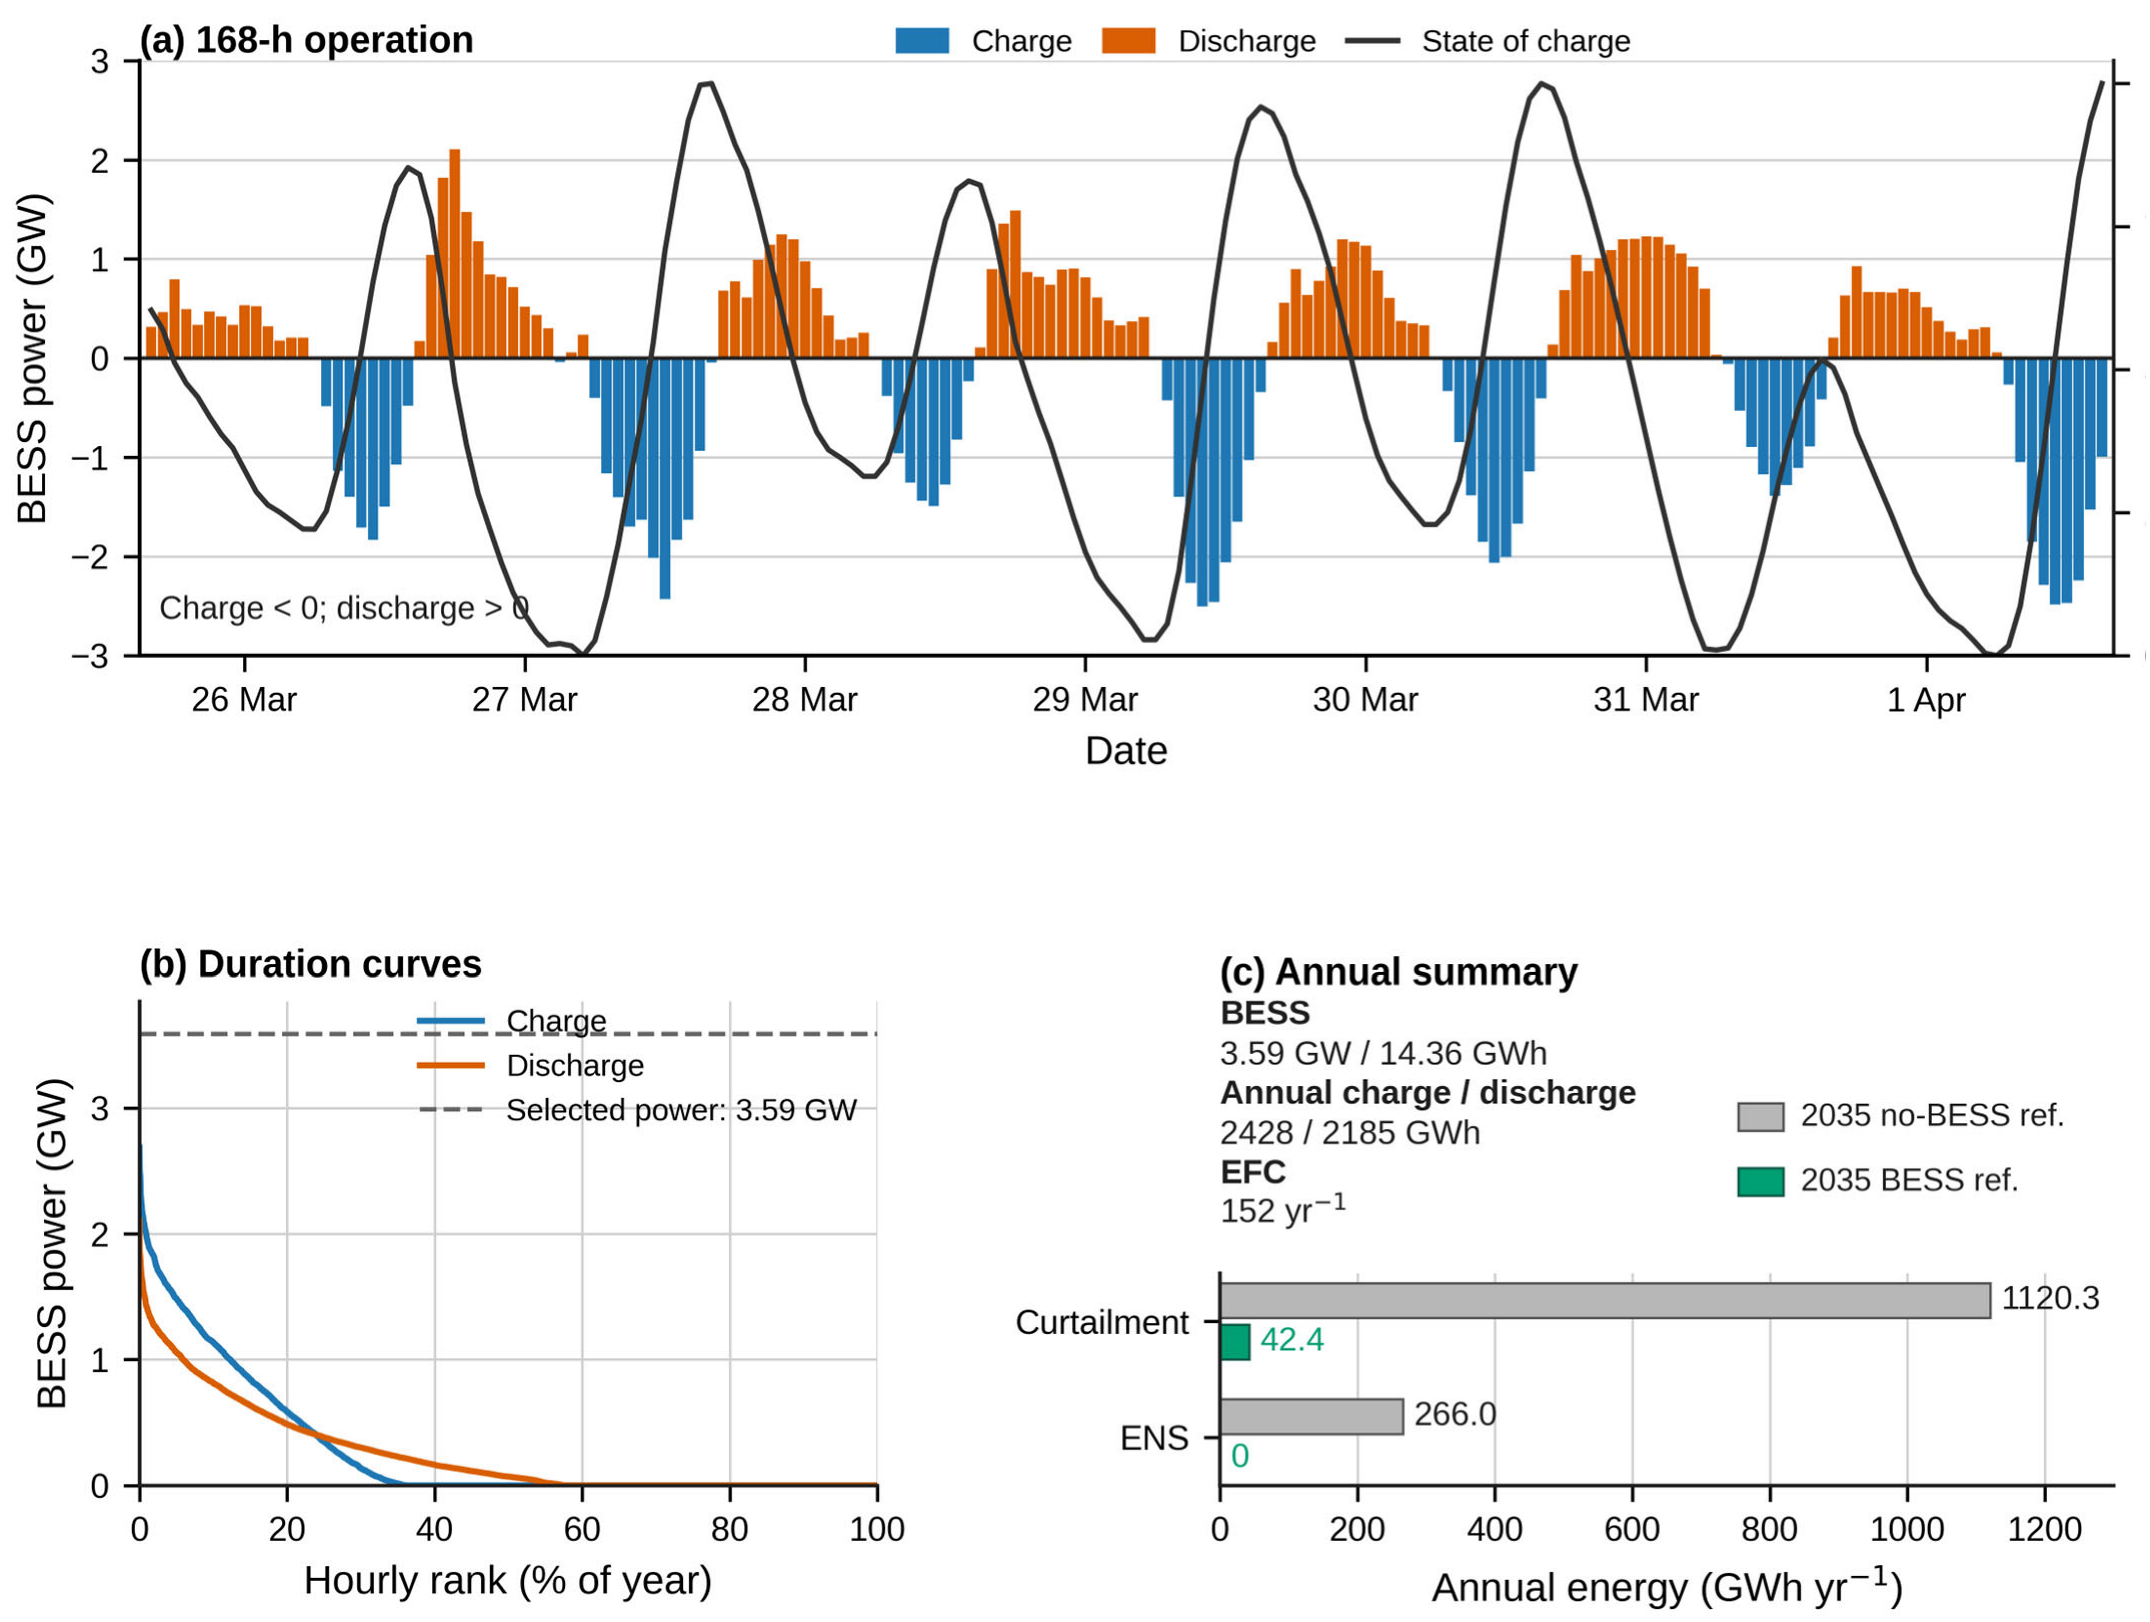
The central assumptions comprise 33.300 TWh annual demand, a four-hour BESS duration, an aggregated BESS cost assumption of 200 kEUR MW−1, an assumed VoLL of 10,000 EUR MWh−1, the fixed 2035 network, and the defined candidate set. Under these conditions, openTEPES selects 3.590 GW/14.361 GWh of BESS. This model-selected central-case benchmark is neither a prescribed capacity nor a national target. Relative to the matched no-BESS case, modelled ENS falls from 265.996 GWh to zero, and renewable curtailment falls from 1120.263 to 42.362 GWh, a 96.2% reduction. Domestic primary renewable generation increases to 18.985 TWh (54.88%), while fossil generation decreases to 15.605 TWh.
The selected portfolio charges 2428.180 GWh and discharges 2185.362 GWh annually. The discharge-to-charge ratio is 0.90, consistent with the assumed round-trip efficiency, and annual discharge corresponds to 152.2 equivalent full cycles of the selected energy capacity. Figure 4a shows the 168 h interval with the highest gross BESS throughput (model hours 2009–2176; 25 March 16:00 to 1 April 15:00). The independently ranked duration curves in Figure 4b show that substantial charging and discharging also occur outside this interval. Figure 4c summarises annual BESS capacity and utilisation, together with the no-BESS/BESS comparison of curtailment and modelled ENS.
Figure 4.
BESS operation in the 2035 reference case. (a) Maximum-throughput 168 h interval; (b) annual charge/discharge duration curves; (c) annual capacity and utilisation summary. Charging is plotted below zero.
Including the ENS penalty, total modelled cost is 3792.682 MEUR yr−1 in the no-BESS case and 1127.495 MEUR yr−1 in the BESS case. The assumed VoLL penalty accounts for 2659.958 MEUR yr−1 of the no-BESS total. Excluding this penalty, the corresponding costs are 1132.724 and 1127.495 MEUR yr−1, respectively, a difference of 5.229 MEUR yr−1. The BESS case includes 57.445 MEUR yr−1 of annualised storage investment. These values are confined to the model cost boundary defined in Section 2 and do not constitute a levelised cost of storage (LCOS) calculation, a profitability assessment, or an investment-grade estimate. Direct domestic operational emissions decrease from 6.684 to 6.314 MtCO2.
3.3. Residual Transmission Deliverability and Spatial Coupling
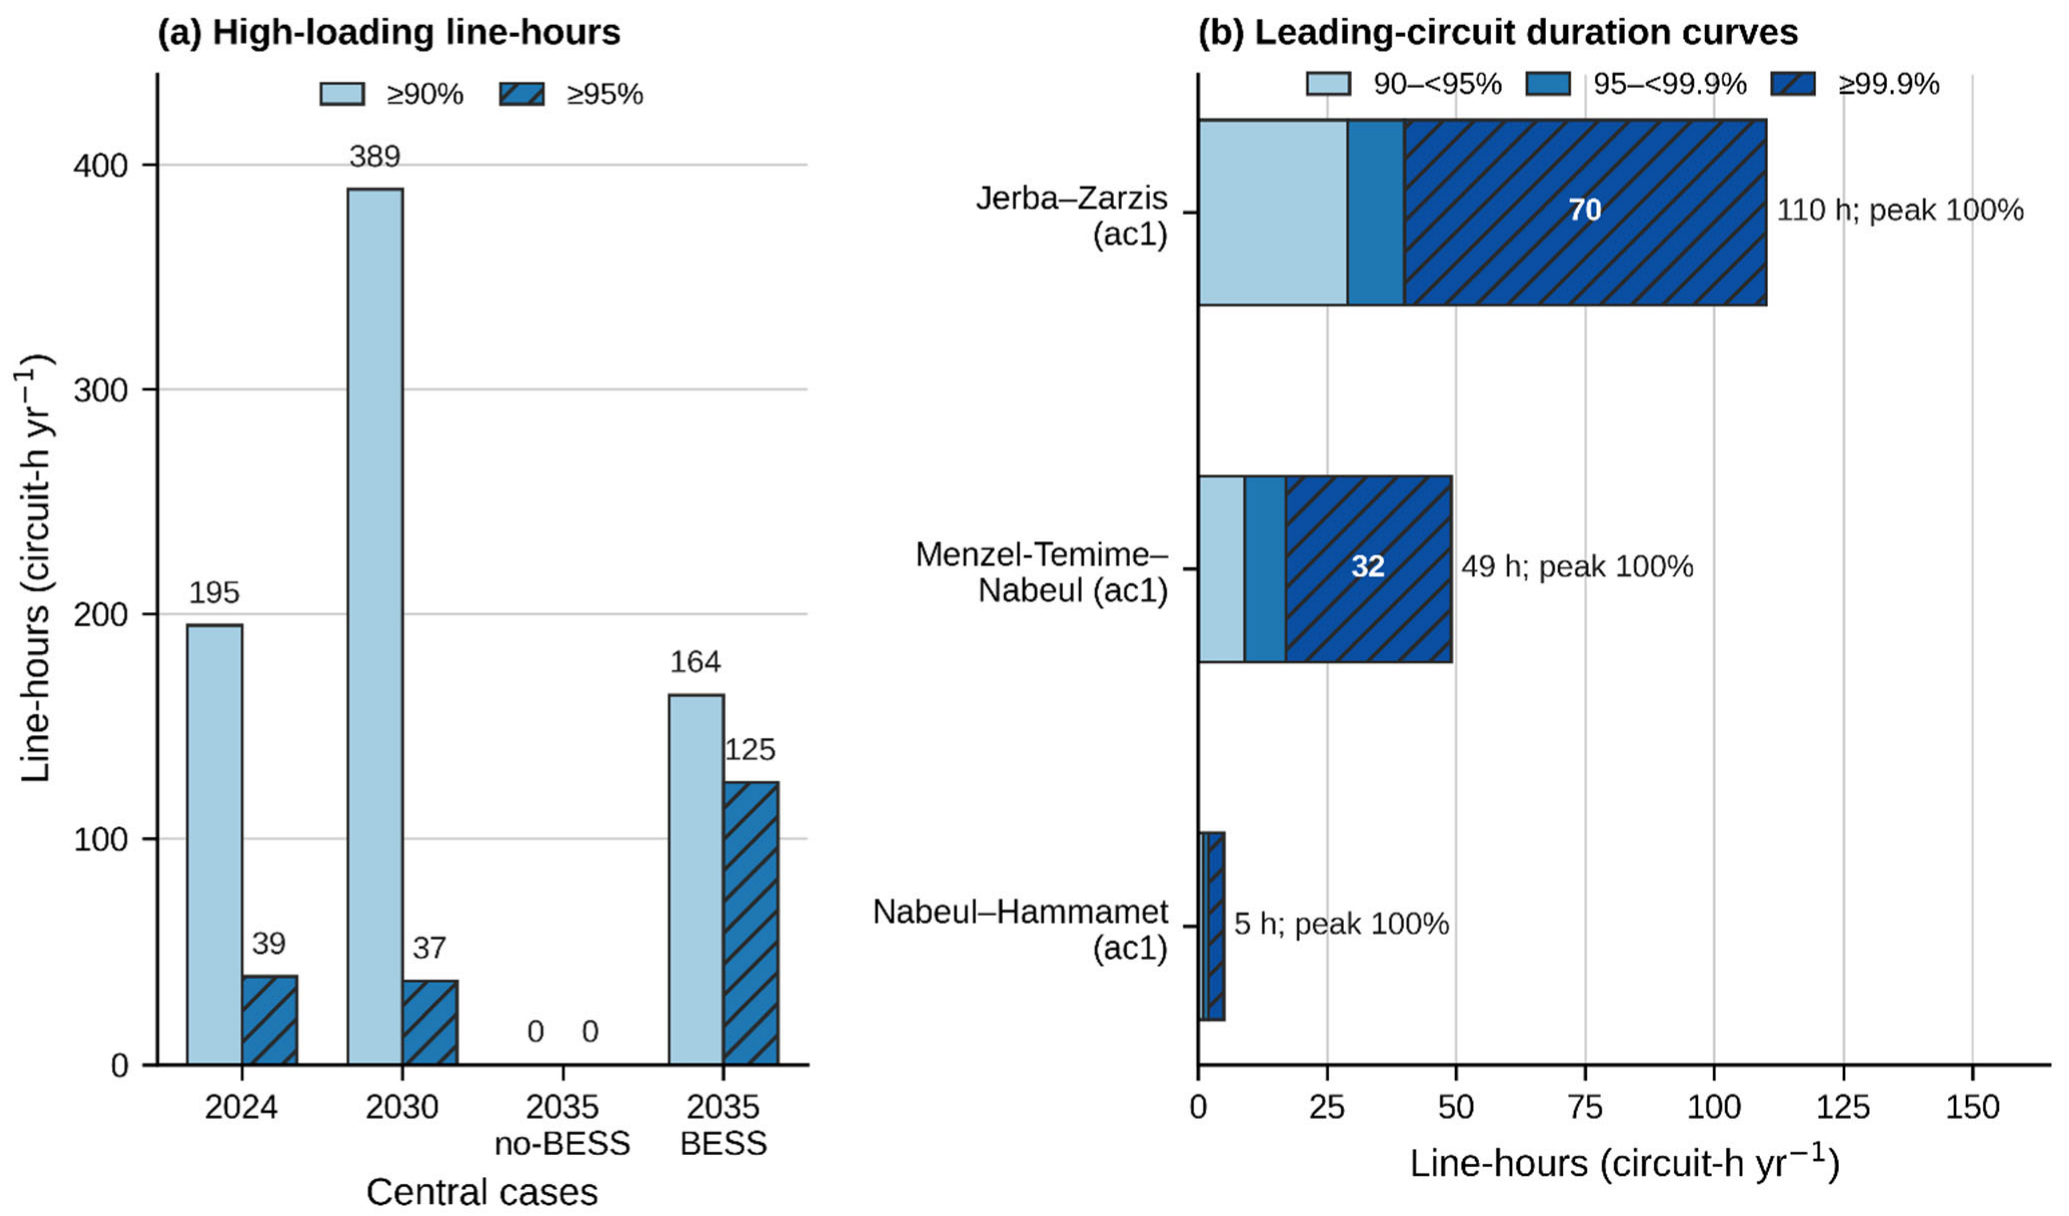
BESS operation redistributes internal active-power flows. The 2035 BESS reference case records 164 and 125 internal physical-circuit line-hours at or above 90% and 95% of effective transfer capacity, respectively, including 105 circuit-hours at the modelled transfer limit. Jerba–Zarzis (ac1) records 110/81 h at or above 90%/95%, Menzel-Temime–Nabeul (ac1) 49/40 h, and Nabeul–Hammamet (ac1) 5/4 h. All three reach 100% peak loading and constitute the leading constrained circuits at both thresholds within the DC/TTC representation.
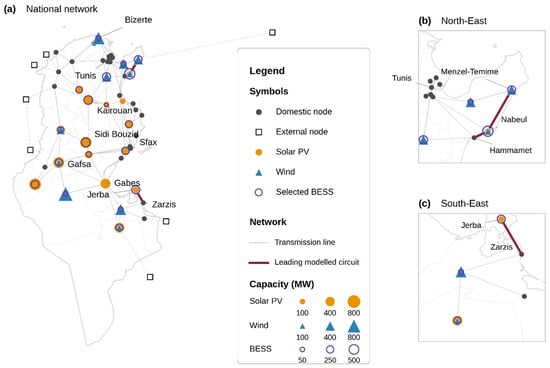
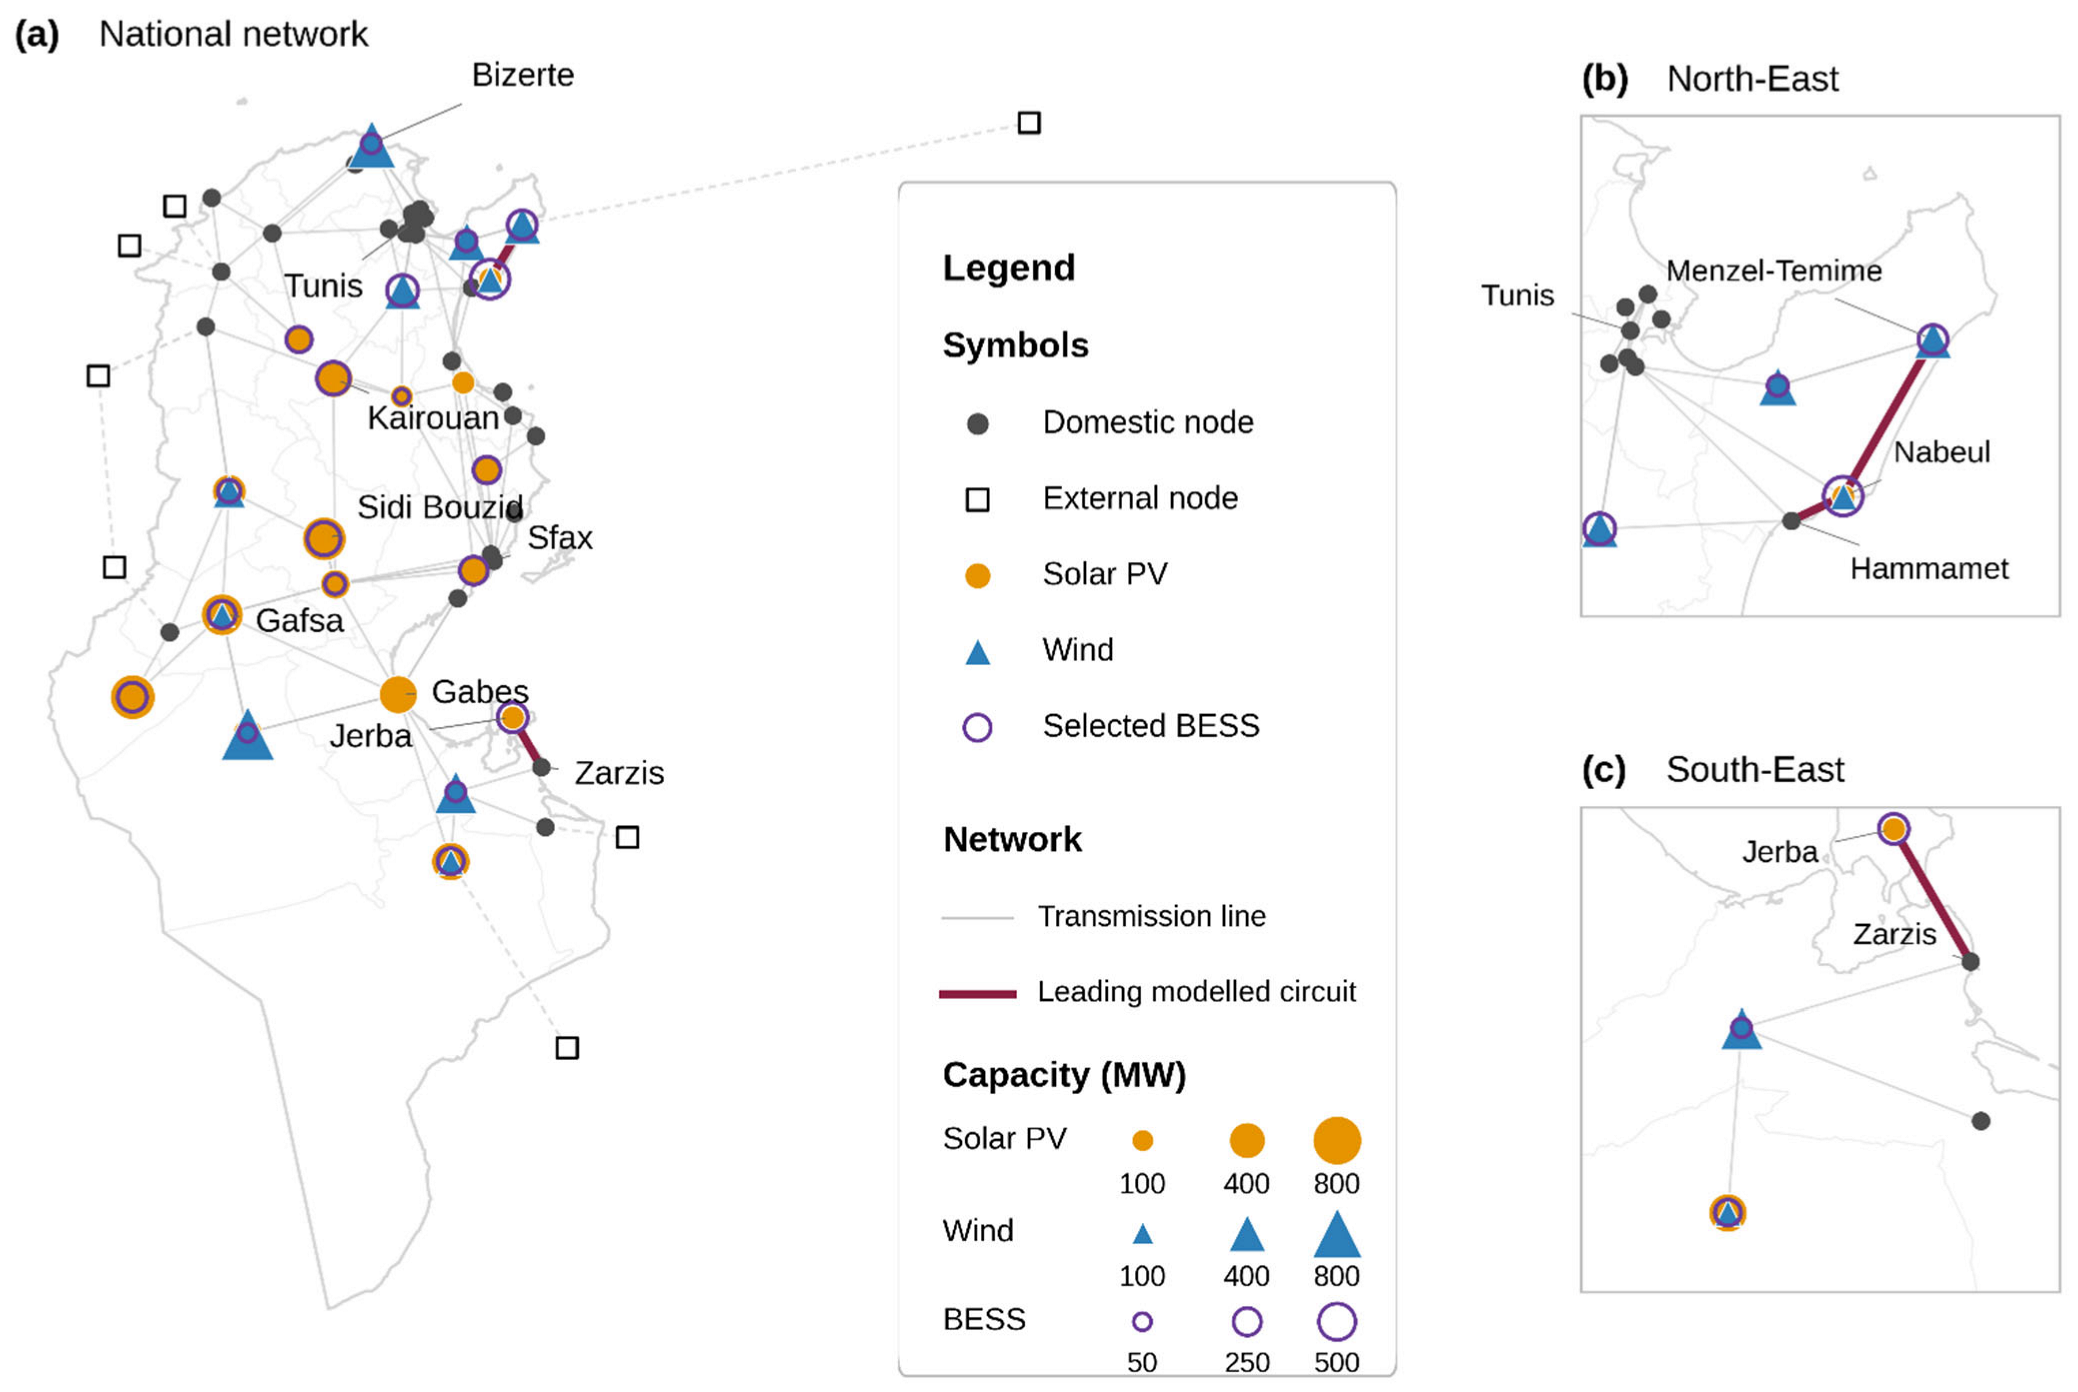
The increase from zero line-hours at or above 90%/95% in the 2035 no-BESS case to 164/125 in the BESS case illustrates the spatial consequences of temporal balancing. By shifting renewable energy across time at selected nodes, BESS operation alters internal power flows and increases utilisation of specific transfer paths. Compared with the more diffuse Greater Tunis exposure in 2024 and 2030, the 2035 BESS-enabled hotspots are concentrated on southern and north-eastern network interfaces. Figure 5 compares central-case transmission exposure and the leading circuits in the 2035 BESS reference case, Table 4 summarises the central model outputs, and Figure 6 shows the spatial relationship among renewable capacity, model-selected BESS, and the leading circuits.
Figure 5.
Central-case transmission loading. (a) Physical-circuit line-hours at or above 90% and 95% of effective transfer capacity; (b) loading-duration profiles of the leading circuits in the 2035 BESS reference case.
Table 4.
Central-case model outputs.
Figure 6.
Spatial distribution of VRE, BESS, and transmission exposure. (a) National network; (b) north-eastern detail; (c) south-eastern detail. Highlighted corridors denote the leading constraints identified in the DC/TTC screening.
3.4. Deterministic Sensitivity Responses
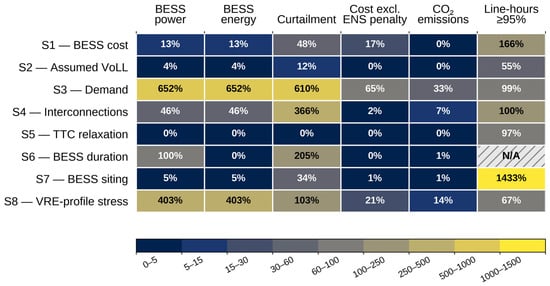
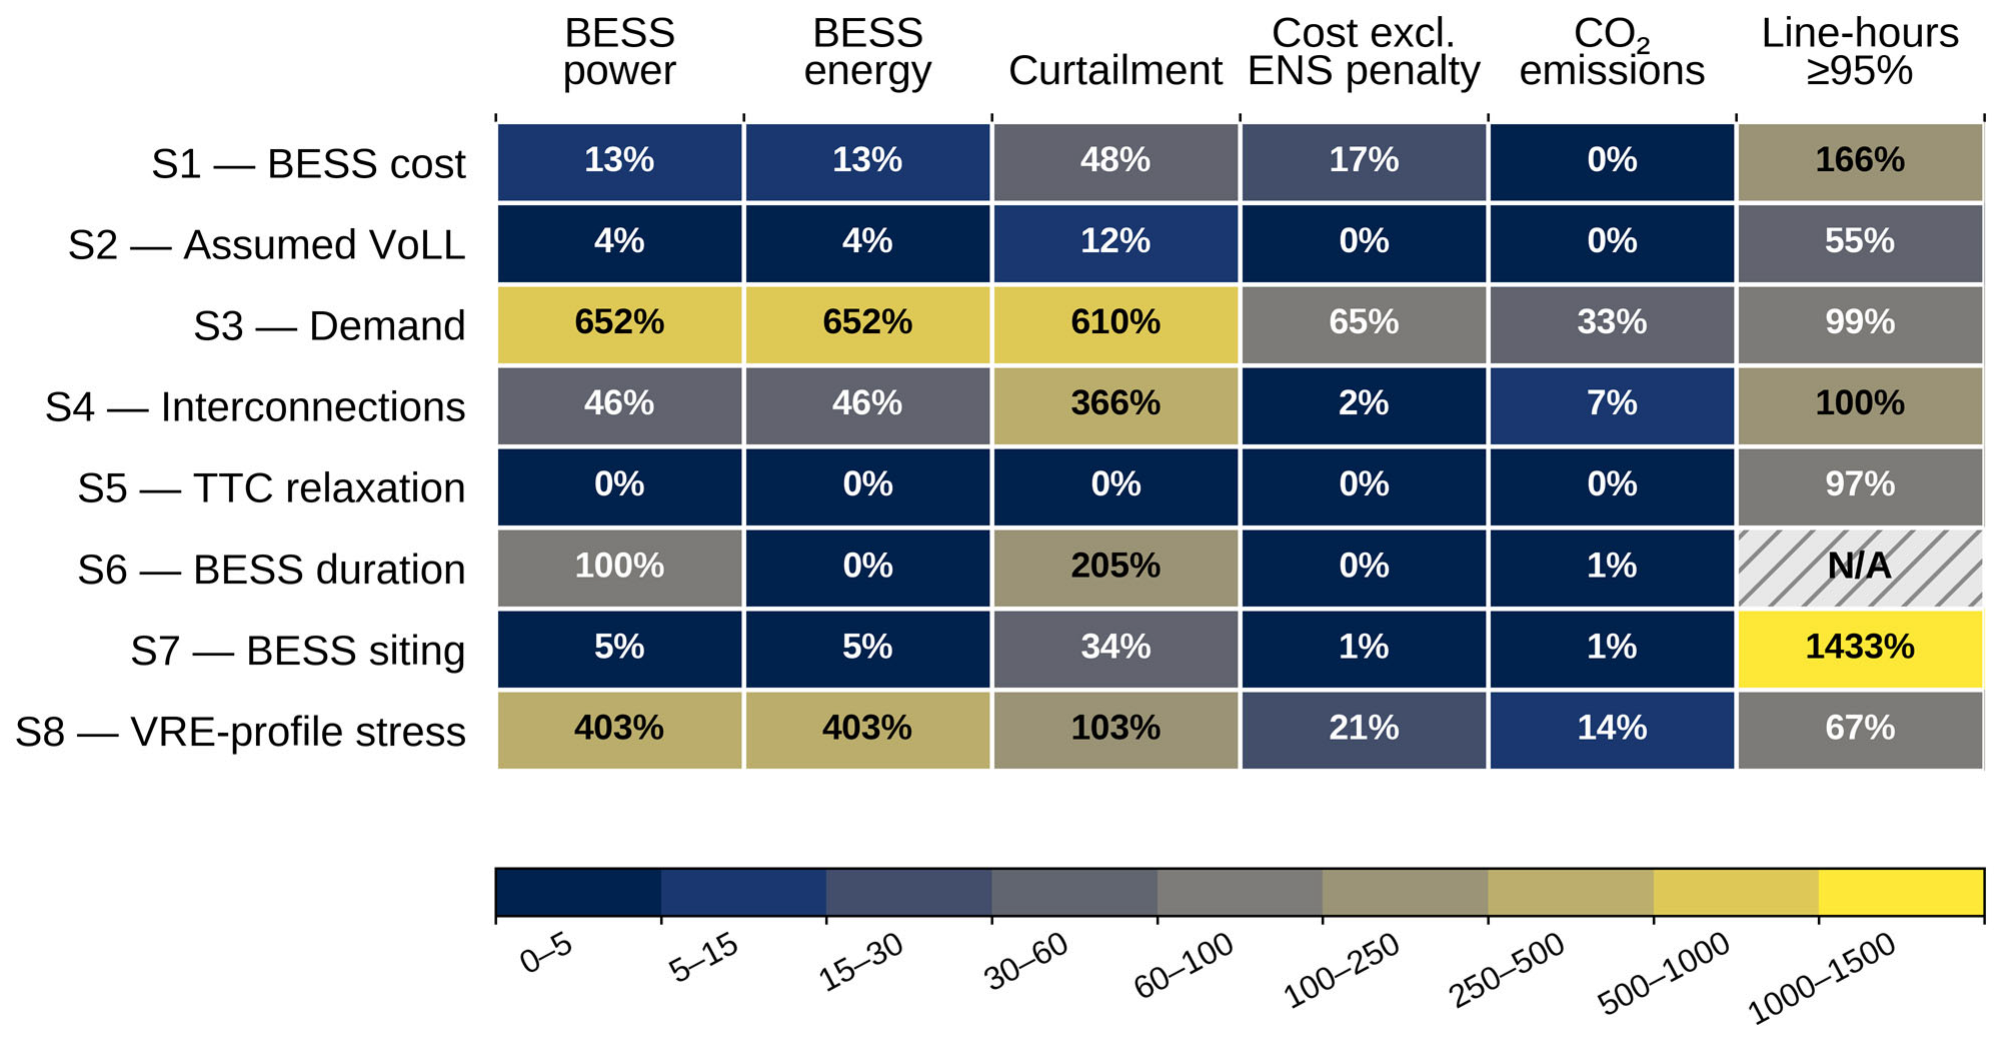
The eight sensitivity families produce distinct economic, operational, network, and spatial responses. Figure 7 reports the maximum absolute deviation from the 2035 BESS reference case within each deterministic family. The figure is a compact response matrix rather than a probabilistic or composite stability metric. For S4, the normalisation includes only BESS-enabled configurations, and the S6 network cell is omitted because S6 reports line-hours at or above 99%, rather than 95%, of effective capacity. BESS remains selected in every BESS-enabled sensitivity case, although its quantity, duration, and location vary substantially across the tested option set.
Figure 7.
Cross-sensitivity response relative to the 2035 BESS reference case. Cells report the maximum absolute deviation within each deterministic sensitivity family.
3.4.1. Economic Assumptions and Imposed BESS Duration
The model-selected capacity changes only marginally as the aggregated BESS cost assumption increases from 200 to 400 kEUR MW−1: selected power decreases from 3.590 to 3.585 GW, energy decreases from 14.361 to 14.340 GWh, and modelled ENS remains zero. A clearer transition occurs between 400 and 600 kEUR MW−1. At 600 kEUR MW−1, selected BESS falls to 3.456 GW and modelled ENS reaches 0.459 GWh. At 1000 kEUR MW−1, selected BESS is 3.141 GW/12.564 GWh, modelled ENS reaches 2.710 GWh, curtailment reaches 62.702 GWh, and line-hours at or above 95% of effective capacity increase from 125 to 333. S1 therefore identifies a transition within the represented power-based cost assumption rather than a complete life-cycle cost threshold.
The response to the assumed VoLL is concentrated at the lower end of the tested range. From 5000 to 50,000 EUR MWh−1, selected BESS remains close to 3.590 GW/14.361 GWh and modelled ENS remains zero. At 2000 EUR MWh−1, selected BESS falls to 3.460 GW/13.841 GWh and modelled ENS reaches 0.481 GWh. This response reflects the assumed scarcity penalty; objective values obtained under different VoLL assumptions are not directly comparable as welfare measures.
The imposed-duration sensitivity reveals contrasting responses in selected power and energy. Energy capacity remains close to 14.36 GWh, while selected power decreases from 7.180 GW at 2 h to 3.590, 2.394, 1.798, and 1.438 GW at 4, 6, 8, and 10 h, respectively. Curtailment increases to 65.799 GWh at 8 h and 129.140 GWh at 10 h; the 10 h case also records 0.152 GWh of modelled ENS. Within the represented cost formulation, longer imposed durations therefore reduce selected power but can constrain short-duration flexibility.
3.4.2. Demand and Deterministic VRE-Profile Stress
Demand scaling produces the largest selected BESS capacity response among the scalar sensitivity families. At 30.0 TWh, the model selects 2.243 GW/8.971 GWh with zero modelled ENS. At 36.63 TWh, the full 27 GW/108 GWh candidate portfolio is selected, yet 4.103 GWh of modelled ENS remains. At 38.3 TWh, the same candidate-domain ceiling remains binding, modelled ENS rises to 205.982 GWh, and line-hours at or above 95% of effective capacity reach 244. These high-demand cases therefore represent candidate-saturation boundaries under fixed generation, network, and import assumptions.
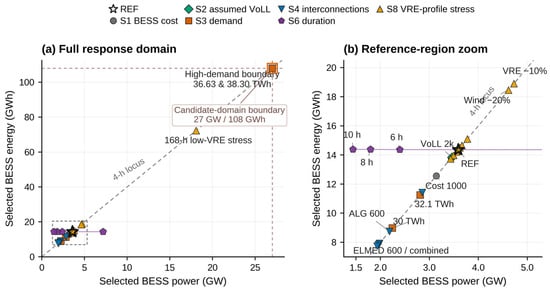
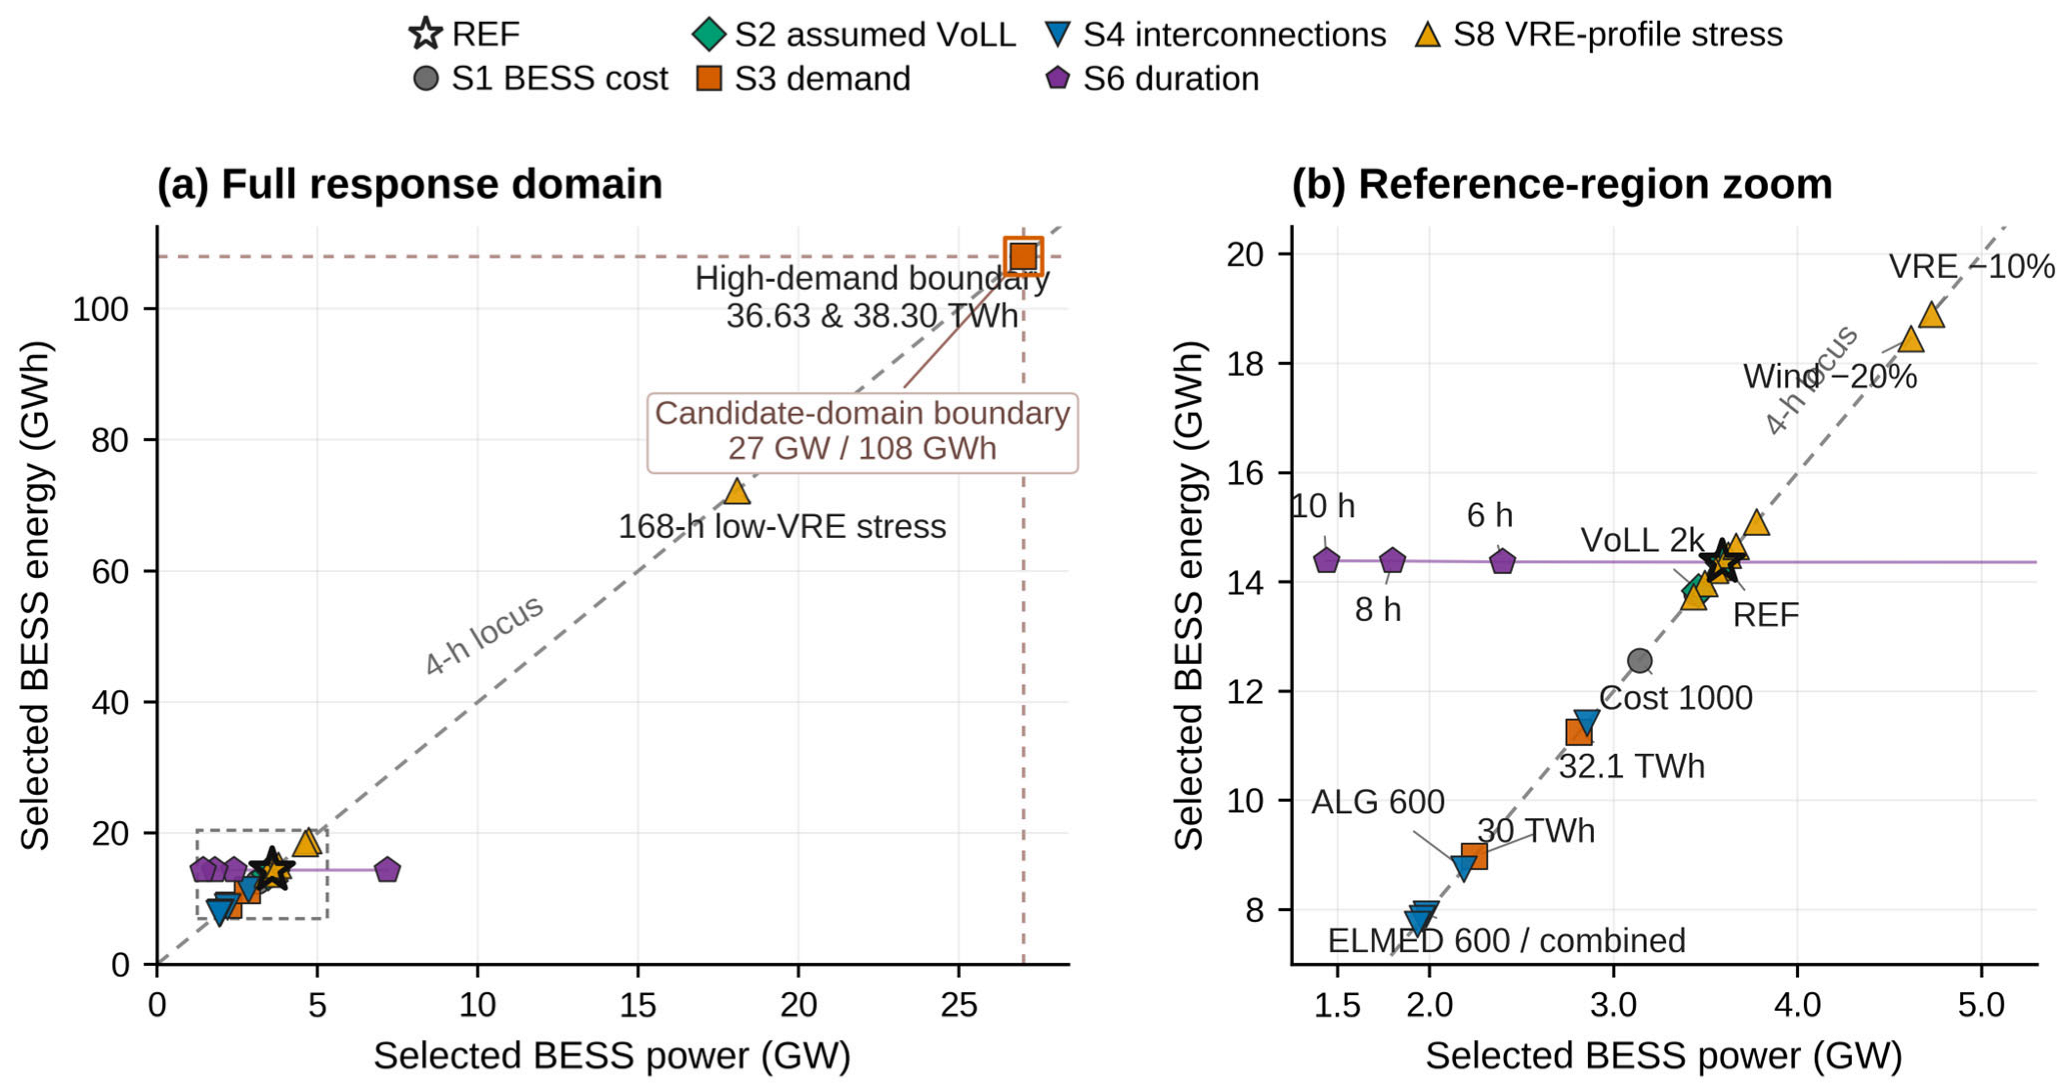
Selected BESS capacity is also sensitive to the prescribed VRE profiles. A 10% reduction in combined VRE availability increases selected BESS capacity to 4.726 GW/18.905 GWh, while the synthetic 168 h low-VRE stress increases it to 18.067 GW/72.268 GWh. Conversely, a 10% increase in wind availability reduces selected BESS capacity to 3.434 GW/13.737 GWh, although curtailment rises to 85.966 GWh. These responses characterise deterministic perturbations of the reference VRE chronology rather than probabilities associated with multi-year weather variability. Figure 8 shows the demand and VRE-profile responses across the full BESS power–energy domain and provides an enlarged view of the reference region.
Figure 8.
BESS power–energy response across deterministic sensitivities. (a) Full response domain; (b) reference-region zoom. The dashed line denotes the 4 h power–energy relation. The purple line connects the S6 duration-sensitivity cases; the 27 GW/108 GWh boundary reflects the candidate-domain ceiling.
3.4.3. Interconnection, Targeted TTC Relaxation and Siting
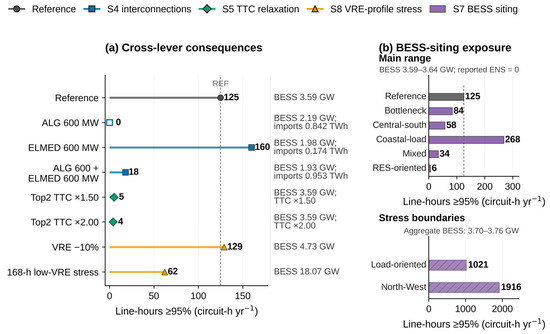
Stylised interconnection availability reduces model-selected BESS capacity, while the network response depends on the location of the available import path. With 600 MW available from both Algeria and ELMED, selected BESS capacity falls to 1.933 GW/7.733 GWh, imports reach 0.953 TWh, and direct domestic operational emissions fall to 5.900 MtCO2. Renewable curtailment rises to 197.498 GWh, reflecting the associated change in domestic dispatch. The corresponding no-BESS case retains 10.113 GWh of modelled ENS. The ELMED-only BESS case records 160 line-hours at or above 95% of effective capacity, compared with 0 for Algeria-only availability and 18 for combined availability. These cases represent stylised import-availability assumptions and exclude interconnector CAPEX, foreign-system adequacy, market and outage availability, and emissions associated with imported electricity.
Targeted TTC relaxation primarily reduces transmission exposure. Increasing the limits of Jerba–Zarzis and Menzel-Temime–Nabeul by 50% reduces line-hours at or above 90%/95% from 164/125 to 6/5, while selected BESS remains 3.590 GW/14.361 GWh, modelled ENS remains zero, and curtailment is 42.292 GWh. Doubling the same limits reduces the total number of line-hours at or above 95% by only one additional circuit-hour. The incremental network relief beyond the ×1.50 case is therefore marginal within this direct capacity-relaxation experiment.
Across the eight S7 candidate domains, modelled ENS remains zero and selected BESS ranges from 3.590 to 3.760 GW, whereas line-hours at or above 95% range from 6 for the case oriented towards renewable energy sources (RES-oriented siting) to 1916 in the North-West boundary case. Coastal-load siting yields the lowest curtailment, at 38.342 GWh, but records 268 line-hours at or above 95%; the mixed domain reduces this exposure to 34 line-hours at near-reference cost. Aggregate BESS capacity therefore varies over a much narrower range than transmission exposure. The North-West boundary combines strong geographic concentration with only 240.1 MW of candidate headroom. Figure 9 compares transmission exposure across representative flexibility cases and S7 siting domains, while Table 5 summarises the deterministic response ranges and their interpretation boundaries.
Figure 9.
Transmission exposure across flexibility sensitivities. (a) Representative interconnection, TTC-relaxation and VRE-profile cases; (b) BESS-siting domains. Values denote physical-circuit line-hours at or above 95% of effective transfer capacity.
Table 5.
Deterministic cross-sensitivity response summary and interpretation boundaries.
3.5. Nodal Recurrence and Transmission Consequences
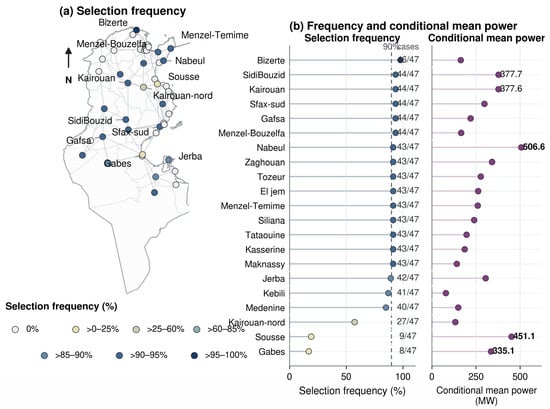
Across 47 BESS-enabled cases with comparable nodal outputs, Bizerte is selected in 46 cases (97.9%). Sidi Bouzid, Kairouan, Sfax-sud, Gafsa, and Menzel-Bouzelfa are each selected in 44 cases (93.6%), while Nabeul is selected in 43 cases (91.5%) and has the highest conditional mean selected power, at 506.6 MW. Sousse and Gabes illustrate the distinction between recurrence and conditional size: they are selected in only 9/47 and 8/47 cases, respectively, but have conditional mean selected powers of 451.1 and 335.1 MW. These frequencies describe recurrence across the tested deterministic cases rather than investment probabilities; S6 is excluded because comparable nodal outputs are unavailable.
In the central 2035 BESS case, the 3.590 GW portfolio is distributed across 19 active nodes, with the largest allocations at Nabeul (498.7 MW), Sidi Bouzid (339.2 MW), Kairouan (334.3 MW), Zaghouan (289.1 MW), and Jerba (263.3 MW). Candidate-domain restrictions can reduce the number of active nodes to three while maintaining zero modelled ENS, although curtailment, cost, and transmission exposure change substantially. Kairouan and Kairouan-nord are treated as distinct nodes throughout the nodal analysis. Figure 10 distinguishes node-selection recurrence from conditional mean selected BESS power, while Table 6 summarises the recurrence results and representative siting and TTC-relaxation consequences.
Figure 10.
BESS siting recurrence across deterministic sensitivities. (a) Node-selection frequency; (b) selection frequency and conditional mean selected BESS power. Frequencies indicate recurrence across the tested deterministic cases, not investment probabilities.
Table 6.
Nodal BESS recurrence and representative spatial consequences.
Siting also changes which circuits are most exposed. In the central 2035 BESS case, the leading high-loading circuits are Jerba–Zarzis, Menzel-Temime–Nabeul, and Nabeul–Hammamet, whereas the coastal-load, load-oriented, and North-West candidate domains shift exposure to different network interfaces. A 50% targeted TTC relaxation of the two leading reference-case corridors reduces line-hours at or above 95% from 125 to 5 without materially changing aggregate BESS capacity. The number, location, and loading intensity of highly exposed circuits are therefore conditional on the spatial flexibility configuration.
Across the tested cases, BESS remains selected within the represented option set, but its quantity, duration, and location vary substantially. Demand and deterministic VRE-profile stress produce the widest capacity responses, specified interconnection availability reduces selected BESS capacity, and targeted TTC relaxation and siting primarily reshape transmission exposure. These results define deterministic response ranges under the stated assumptions rather than statistical confidence intervals or procurement requirements.
4. Discussion
4.1. What the Chronological and Nodal Representation Adds
The central comparison shows why annual renewable-energy availability cannot be equated with hourly deliverability. In the 2035 no-BESS reference case, 265.996 GWh of modelled ENS and 1120.263 GWh of renewable curtailment occur in disjoint sets of hours at the 0.001 MW reporting threshold. During ENS hours, demand is higher and VRE availability is lower, whereas curtailment occurs under lower-demand, higher-VRE conditions. The coexistence of annual shortage and surplus therefore reflects a temporal mismatch between scarcity and renewable availability rather than simultaneous network congestion during shortage.
The nodal representation adds a spatial dimension that cannot be recovered from an annual balance or copper-plate model. Enabling BESS eliminates modelled ENS under the represented deterministic conditions and sharply reduces curtailment, but also redistributes charging and discharging across the network. Consequently, physical-circuit line-hours at or above the 90% and 95% thresholds increase from zero at both thresholds to 164 and 125, respectively, with Jerba–Zarzis, Menzel-Temime–Nabeul, and Nabeul–Hammamet emerging as the leading interfaces. The siting sensitivities reinforce this result: aggregate BESS selection remains within 3.590–3.760 GW across the eight S7 candidate domains, whereas line-hours at or above 95% range from 6 to 1916. Similar national storage volumes can therefore produce markedly different nodal and transmission consequences.
This joint temporal–spatial assessment is the main incremental contribution relative to existing Tunisia- and Maghreb-focused transition studies [15,16,17,18,19,20]. Those studies examine technology pathways, policy, and regional exchange, whereas the present analysis identifies when modelled shortage and curtailment occur and how storage operation changes transmission exposure. The contribution is therefore a network-constrained planning assessment rather than an operational-security certification: modelled ENS, curtailment, storage operation, and circuit loading are evaluated within a common chronological and nodal framework. This interpretation is consistent with the broader literature showing that renewable-system planning is sensitive to both chronology and network representation [1,2,3,4,8].
4.2. Conditional Role and Economic Interpretation of BESS
Within the represented expansion space, BESS is selected in every BESS-enabled sensitivity case. This persistence indicates a role for temporal flexibility under the tested assumptions, but does not imply a fixed national storage requirement. The central selection of 3.590 GW/14.361 GWh is conditional on 33.300 TWh annual demand, a four-hour duration, an aggregated BESS cost assumption of 200 kEUR MW−1, an assumed VoLL of 10,000 EUR MWh−1, the fixed 2035 network, the prescribed generation fleet, and the admissible candidate set. Demand and adverse VRE-profile stresses produce the widest capacity responses, while duration, import availability, and siting alter the power–energy balance, aggregate storage requirement, and spatial allocation. The central value is therefore a scenario-conditioned benchmark rather than a procurement target.
Several sensitivity families remain close to the central benchmark under nearby assumptions, but selected capacity changes materially when the balancing requirement or candidate domain changes. Because the analysis is deterministic and based on a single reference chronology, no statistical confidence interval is meaningful for the 3.590 GW/14.361 GWh result. The evidence therefore supports conditional persistence of storage selection, not invariance of the exact capacity: the required MW, MWh, and nodal allocation remain contingent on future demand, renewable availability, network development, and competing flexibility options.
The economic comparison is bounded by the simplified model representation. Excluding the ENS penalty, the 2035 no-BESS and BESS cases differ by only 5.229 MEUR yr−1; including the ENS term makes the comparison largely a valuation of avoided modelled shortage. These results therefore do not establish merchant profitability, levelised cost of storage, or an investment-grade business case. The BESS cost representation is an aggregated power-based proxy and does not separately represent energy-capacity CAPEX, degradation, replacement and augmentation, fixed operation and maintenance, residual value, financing, or market revenues. A complete lifetime-cost assessment would require additional treatment of cost trajectories and degradation [26,27]. Likewise, the assumed VoLL sensitivity tests the model trade-off between storage expenditure and unserved energy rather than an empirically estimated Tunisian consumer valuation [29]. The reported 152.2 equivalent full-discharge cycles quantify operational utilisation rather than project profitability.
The asymmetry between endogenous BESS and exogenous transmission is deliberate: the matched central comparison isolates storage within a prescribed 2035 topology. However, this design also limits the economic interpretation. Joint expansion could introduce new generation, demand-side flexibility, candidate transmission projects, and interconnection investment as competing or complementary options, potentially changing both the quantity and location of selected storage. The targeted TTC-relaxation cases therefore indicate the consequences of additional transfer capability but do not identify an economically optimal transmission portfolio. The central BESS benchmark remains conditional on the represented expansion space.
4.3. Temporal, Spatial and External Flexibility Are Complementary
The cross-lever results support a functional interpretation of flexibility. BESS shifts energy across time, internal transmission transfers it across locations, and interconnections provide external energy at specific points of entry. These functions interact but are not interchangeable [3,4,8,9]. In the central BESS case, temporal shifting reduces modelled ENS and renewable curtailment while increasing utilisation of selected internal transfer paths. Additional temporal flexibility can therefore reveal spatial deliverability constraints rather than eliminate them.
The targeted TTC-relaxation cases isolate this spatial effect. Increasing the limits of the two leading reference-case circuits by 50% reduces line-hours at or above 95% from 125 to 5, while selected BESS remains approximately 3.590 GW/14.361 GWh and modelled ENS remains zero. Doubling the same limits provides only marginal additional relief within this simplified screening exercise. These results identify interfaces where additional transfer capability may be valuable, but route design, capital cost, phasing, constructability, outage scheduling, voltage performance, and contingency security remain outside the analysis. The recurrent circuits therefore indicate priorities for detailed engineering assessment rather than validated reinforcement projects.
The interconnection sensitivities illustrate a different form of flexibility. With stylised availability of 600 MW from Algeria and 600 MW through ELMED, selected domestic BESS falls to 1.933 GW/7.733 GWh; however, the matched no-BESS case still records 10.113 GWh of modelled ENS. Algeria-only, ELMED-only, and combined availability also produce different internal high-loading patterns, showing that the point of entry matters alongside the amount of imported energy. These cases quantify the response to specified import availability; they do not establish dependable import contribution because foreign-system adequacy, coincident regional stress, market access, interconnector outages, investment costs, and emissions associated with imported electricity are not represented [28].
Siting introduces a further spatial trade-off. Restricting candidate domains changes curtailment, cost, and circuit exposure far more than aggregate selected BESS capacity. The recurrent multi-node core, including Bizerte’s selection in 46 of 47 comparable cases, identifies locations that remain relevant across many tested scenarios, but recurrence is descriptive rather than probabilistic. Conversely, the North-West boundary case combines geographic concentration with only 240.1 MW of candidate headroom and therefore does not support a general conclusion about BESS value in that region. Coordinated storage-connection and network studies should combine these nodal screening results with land availability, connection capacity, and project-cost information [25], together with subsequent AC load-flow analysis [11] and, where required, dedicated contingency, short-circuit, protection, and dynamic studies.
4.4. Deterministic Sensitivities and Adaptive Planning Implications
The eight sensitivity families identify the assumptions that most strongly affect the model response. Demand produces the widest capacity response: at 36.63 and 38.3 TWh, the full 27 GW/108 GWh candidate domain binds while modelled ENS remains positive. This saturation is a diagnostic boundary rather than a storage recommendation. Under fixed generation, network, and import assumptions, storage alone is no longer sufficient to meet the additional balancing requirement. The result therefore points to joint reconsideration of the generation portfolio, demand-side flexibility, network capability, imports, and the candidate domain. Lower curtailment at high demand should likewise not be interpreted as improved flexibility, because greater demand absorbs surplus in some hours while deepening deficits in others.
The VRE-profile sensitivities require the same bounded interpretation. A 10% reduction in combined VRE availability increases selected BESS to 4.726 GW/18.905 GWh, while the synthetic 168 h low-VRE stress increases it to 18.067 GW/72.268 GWh. These cases show sensitivity to the magnitude and duration of low-VRE conditions, but they are transformations of a single reference chronology rather than a multi-year weather assessment. They therefore define deterministic stress boundaries rather than event probabilities or return periods. Correlated weather years, temperature-sensitive demand, forced outages, maintenance, reserve deployment, and interconnection scarcity could alter the magnitude, location, and technology mix of flexibility; their combined effects cannot be inferred from the present deterministic cases alone [21,22,23,24].
For planning purposes, the results support a staged and adaptive use of the model outputs. The central benchmark can guide the scale and location of subsequent studies, while recurrent nodes and high-loading interfaces identify priorities for connection and network assessment. Future updates can track demand level and shape, renewable chronology, candidate headroom, modelled ENS, curtailment, BESS utilisation, interconnection availability, and circuit-loading duration. Material departures from the reference assumptions should trigger re-optimisation of the flexibility portfolio rather than automatic scaling of the central BESS quantity.
The methodological implication extends beyond Tunisia. Emerging power systems with rapidly increasing VRE can apply a similar combination of chronological, nodal, and network-constrained sensitivity analysis to distinguish temporal scarcity from spatial deliverability. The numerical capacities, recurrent nodes, and stressed interfaces remain specific to the represented Tunisian scenarios. What is transferable is the planning logic: annual renewable shares, hourly balance, and spatial transfer capability should be evaluated jointly, with model-selected quantities interpreted within the option set and scenario boundaries that produced them.
5. Conclusions, Limitations and Future Work
5.1. Conclusions
This study applied openTEPES to a deterministic 8736 h, 47-node representation of Tunisia’s prospective power system to assess renewable integration, modelled ENS, endogenous BESS selection, and transmission deliverability. Four central cases and eight deterministic sensitivity families were evaluated. The framework links aggregate transition-pathway analysis with more detailed probabilistic adequacy, AC-security validation, and project-level investment studies.
The matched 2035 comparison shows that annual renewable availability alone does not ensure deliverable electricity. At 33.300 TWh annual demand, the no-BESS reference case records 265.996 GWh of modelled ENS and 1120.263 GWh of renewable curtailment in disjoint hours. Enabling BESS leads to a central selection of 3.590 GW/14.361 GWh, reduces modelled ENS to zero under the represented deterministic conditions, and lowers curtailment to 42.362 GWh. These results indicate a strong role for temporal flexibility within the represented option set, while the exact storage quantity remains conditional on the adopted assumptions.
The nodal analysis shows that temporal balancing and spatial deliverability are closely coupled. The BESS reference case records 164 and 125 physical-circuit line-hours at or above the 90% and 95% thresholds, respectively, compared with zero at both thresholds in the matched no-BESS case; across the S7 siting domains, line-hours at or above 95% range from 6 to 1916. A 50% TTC relaxation of the two leading circuits reduces line-hours at or above 95% from 125 to 5 with negligible change in aggregate BESS capacity. Stylised Algerian and ELMED availability reduces selected domestic BESS under the tested assumptions but does not establish dependable import contribution. Storage, internal transmission, and cross-border exchange therefore address complementary dimensions of renewable integration.
Across the sensitivity programme, demand and deterministic VRE-profile stress produce the widest storage-capacity responses, while imposed duration, interconnection availability, and siting restrictions alter storage power, energy, and spatial allocation. The central 3.590 GW/14.361 GWh selection is therefore interpreted as a conditional planning benchmark rather than a national target or adequacy requirement. The broader methodological implication is that renewable-integration assessments benefit from combining hourly chronology with nodal network representation and from distinguishing scenario-conditioned model outputs from investment recommendations.
5.2. Limitations and Future Work
The first limitation concerns temporal uncertainty. The analysis relies on a single 8736 h reference chronology and deterministic perturbations rather than a multi-year probabilistic representation. It excludes spatially correlated weather years, forced-outage sampling, chronological maintenance, operating reserves, demand response, and probabilistic adequacy metrics such as loss-of-load expectation (LOLE), expected energy not served (EENS), and effective load-carrying capability (ELCC). A priority extension is therefore a multi-year nodal assessment combining weather-dependent demand and VRE production with unit and network contingencies, maintenance, reserve requirements, and scenario-dependent interconnection availability [21,22,23,24,28].
Second, the DC/TTC network representation is an active-power planning screen. It does not establish AC feasibility, voltage or reactive-power performance, short-circuit behaviour, protection coordination, dynamic stability, or N − 1 security. The recurrent nodes and stressed circuits identified here warrant subsequent connection studies and AC load-flow analysis [11], followed, where appropriate, by dedicated contingency, short-circuit, protection, and dynamic studies before project-level decisions.
Third, the investment and economic boundary is deliberately limited. BESS is endogenous, whereas new generation, demand-side flexibility, transmission projects, and interconnector investment are not co-optimised. The BESS formulation omits separate MW and MWh cost components, degradation, replacement and augmentation, fixed operation and maintenance, residual value, financing, and market revenues. Future work should co-optimise storage with generation, demand-side flexibility, candidate transmission projects, and interconnection using consistent life-cycle cost, emissions, and reliability boundaries. Relevant extensions include network-aware storage siting [25], richer storage cost and degradation modelling [26,27], and multi-region adequacy treatment of interconnection [28].
Finally, the demand sensitivities scale a single load shape, while the VRE sensitivities transform a single reference chronology. Sector-specific electrification, temperature-sensitive demand, behavioural change, and compound high-demand/low-VRE/outage events are not represented. Extending the framework along these dimensions would provide a stronger basis for subsequent investment-grade studies. Within its stated scope, the present analysis provides a coherent deterministic assessment of the mechanisms linking modelled ENS, renewable curtailment, storage selection, and transmission deliverability, while identifying the additional analyses required to progress from planning screening to project validation.
Author Contributions
Conceptualization, H.B., L.O., A.R., M.S.G., M.B.C. and I.G.; methodology, H.B., O.F., M.N., L.O., A.R., M.S.G. and M.B.C.; software, A.R. and H.B.; validation, H.B. and M.B.C.; formal analysis, H.B., L.O., A.R., M.S.G. and M.B.C.; investigation, H.B., O.F., M.N. and M.B.C.; resources, H.B., L.O., A.R., M.S.G. and M.B.C.; data curation, H.B., O.F. and M.N.; writing—original draft preparation, H.B., M.N., O.F., L.O., A.R. and M.B.C.; writing—review and editing, L.O., A.R., M.S.G. and M.B.C.; visualisation, H.B.; supervision, L.O., A.R. and M.B.C.; project administration, M.S.G., M.B.C. and I.G.; funding acquisition, M.S.G., M.B.C. and I.G. All authors have read and agreed to the published version of the manuscript.
Funding
This research was funded by the European Union’s Horizon Europe research and innovation programme through the openMod4Africa project, Grant Agreement No. 101118123.
Data Availability Statement
The raw data supporting the conclusions of this article will be made available by the authors upon request.
Conflicts of Interest
Author Ingeborg Graabak was employed by SINTEF Energy Research. The remaining authors declare that the research was conducted in the absence of any commercial or financial relationships that could be construed as a potential conflict of interest. The authors declare that this study received funding from the European Union’s Horizon Europe research and innovation programme through the openMod4Africa project. The funder was not involved in the study design; data collection, analysis, or interpretation; preparation of this article; or the decision to submit it for publication.
Appendix A
This appendix provides detailed input definitions for the S7 BESS-siting and S8 VRE-profile sensitivities and summarises the data sources and model representation used in the study. Appendix A.1 defines the admissible BESS candidate domains, candidate counts, and aggregate pre-optimisation ceilings used in S7. Appendix A.2 specifies the PV and wind availability transformations, temporal domains, and bounding rules used in S8. Appendix A.3 summarises the numerical representation, source or modelling basis, and treatment of the principal data components. These tables document scenario inputs and model representation; Section 3 reports the investment and operational outcomes.
Appendix A.1. S7 BESS-Siting Candidate Domains
Table A1.
Candidate-node definitions for the S7 BESS-siting sensitivity.
Appendix A.2. S8 Renewable-Profile Transformations
The S8 family modifies the hourly PV and wind available-power ceilings while retaining installed renewable capacities, nodal allocations, demand, thermal generation data, network topology, interconnection assumptions, costs, and BESS parameters. Nine cases apply deterministic annual multipliers, while the synthetic 168 h low-VRE stress applies PV × 0.70 and wind × 0.50 only during model hours 4674–4841, with the reference profiles retained elsewhere. SolarSurplus applies an annual PV × 1.10 scaling. Table A2a defines the transformations, temporal scope, and spatial coverage, while Table A2b specifies the bounding rules applied to the transformed profiles.
Table A2.
(a) Deterministic available-power transformations for the S8 VRE-profile sensitivity; (b) upper-bound treatment for the S8 VRE-profile transformations.
Appendix A.3. Data Sources and Model Representation
Table A3.
Data sources, numerical representation and model treatment.
References
- Ruggles, T.H.; Virgüez, E.; Reich, N.; Dowling, J.; Bloomfield, H.; Antonini, E.G.A.; Davis, S.J.; Lewis, N.S.; Caldeira, K. Planning reliable wind- and solar-based electricity systems. Adv. Appl. Energy 2024, 15, 100185. [Google Scholar] [CrossRef] [Scilit]
- Jain, A.; Yamujala, S.; Gaur, A.; Das, P.; Bhakar, R.; Mathur, J. Power sector decarbonization planning considering renewable resource variability and system operational constraints. Appl. Energy 2023, 331, 120404. [Google Scholar] [CrossRef] [Scilit]
- Jorgenson, J.; Denholm, P.; Mai, T. Analyzing storage for wind integration in a transmission-constrained power system. Appl. Energy 2018, 228, 122–129. [Google Scholar] [CrossRef] [Scilit]
- Conlon, T.; Waite, M.; Modi, V. Assessing new transmission and energy storage in achieving increasing renewable generation targets in a regional grid. Appl. Energy 2019, 250, 1085–1098. [Google Scholar] [CrossRef] [Scilit]
- Mallapragada, D.S.; Sepulveda, N.A.; Jenkins, J.D. Long-run system value of battery energy storage in future grids with increasing wind and solar generation. Appl. Energy 2020, 275, 115390. [Google Scholar] [CrossRef] [Scilit]
- Sepulveda, N.A.; Jenkins, J.D.; Edington, A.; Mallapragada, D.S.; Lester, R.K. The design space for long-duration energy storage in decarbonized power systems. Nat. Energy 2021, 6, 506–516. [Google Scholar] [CrossRef] [Scilit]
- Staadecker, M.; Szinai, J.; Sánchez-Pérez, P.A.; Kurtz, S.; Hidalgo-Gonzalez, P. The value of long-duration energy storage under various grid conditions in a zero-emissions future. Nat. Commun. 2024, 15, 9501. [Google Scholar] [CrossRef] [Scilit] [PubMed]
- Knezović, K.; Marinakis, A.; Evrenosoglu, C.Y.; Oudalov, A. Role of grid and bulk storage in the integration of variable renewable energy resources: Framework for optimal operation-driven multi-period infrastructure planning. Energy 2021, 226, 120378. [Google Scholar] [CrossRef] [Scilit]
- Biancardi, A.; Mendes, C.; Staffell, I. Battery electricity storage as both a complement and substitute for cross-border interconnection. Energy Policy 2024, 189, 114134. [Google Scholar] [CrossRef] [Scilit]
- Ramos, A.; Alvarez, E.F.; Lumbreras, S. openTEPES: Open-source transmission and generation expansion planning. SoftwareX 2022, 18, 101070. [Google Scholar] [CrossRef] [Scilit]
- Neumann, F.; Hagenmeyer, V.; Brown, T. Assessments of linear power flow and transmission loss approximations in coordinated capacity expansion problems. Appl. Energy 2022, 314, 118859. [Google Scholar] [CrossRef] [Scilit]
- International Energy Agency (IEA). The Future of Electricity in the Middle East and North Africa; IEA: Paris, France, 2025; Available online: https://www.iea.org/reports/the-future-of-electricity-in-the-middle-east-and-north-africa (accessed on 11 August 2026).
- Ministry of Industry, Mines and Energy. Stratégie Énergétique de la Tunisie à l’Horizon 2035: Synthèse; Ministry of Industry, Mines and Energy: Tunis, Tunisia, 2023. Available online: https://www.energiemines.gov.tn/fileadmin/docs-u1/synth%C3%A8se_strat%C3%A9gie_2035.pdf (accessed on 11 August 2026).
- World Bank. Tunisia-Italy Electricity Integration and Renewable Energy Ecosystem (P179240): Project Appraisal Document; World Bank: Washington, DC, USA, 2023; Available online: https://documents1.worldbank.org/curated/en/099041823142027387/pdf/P1792400ce0383030ab5e094f80e97f1f8.pdf (accessed on 11 August 2026).
- Brand, B.; Missaoui, R. Multi-criteria analysis of electricity generation mix scenarios in Tunisia. Renew. Sustain. Energy Rev. 2014, 39, 251–261. [Google Scholar] [CrossRef] [Scilit]
- Dhakouani, A.; Gardumi, F.; Znouda, E.; Bouden, C.; Howells, M. Long-term optimisation model of the Tunisian power system. Energy 2017, 141, 550–562. [Google Scholar] [CrossRef] [Scilit]
- Dhakouani, A.; Znouda, E.; Bouden, C. Impacts of energy efficiency policies on the integration of renewable energy. Energy Policy 2019, 133, 110922. [Google Scholar] [CrossRef] [Scilit]
- Gardumi, F.; Mhiri, N.; Howells, M.; Bock, F.; Necibi, T.; Bouden, C. A scenario analysis of potential long-term impacts of COVID-19 on the Tunisian electricity sector. Energy Strateg. Rev. 2021, 38, 100759. [Google Scholar] [CrossRef] [Scilit]
- Fragkos, P.; Zisarou, E. Energy system transition in the context of NDC and mitigation strategies in Tunisia. Climate 2022, 10, 166. [Google Scholar] [CrossRef] [Scilit]
- Ayed, Y.; Fortes, P.; Al Afif, R. Maghreb’s renewable power future for climate mitigation: Insights from the TIMES-MAGe model. Energy Strateg. Rev. 2025, 62, 101918. [Google Scholar] [CrossRef] [Scilit]
- Stenclik, D.; Bloom, A.; Cole, W.; Stephen, G.; Figueroa Acevedo, A.; Gramlich, R.; Dent, C.J.; Schlag, N.; Milligan, M. Quantifying risk in an uncertain future: The evolution of resource adequacy. IEEE Power Energy Mag. 2021, 19, 29–36. [Google Scholar] [CrossRef] [Scilit]
- Mills, A.D.; Rodriguez, P. A simple and fast algorithm for estimating the capacity credit of solar and storage. Energy 2020, 210, 118587. [Google Scholar] [CrossRef] [Scilit]
- Collins, S.; Deane, P.; Ó Gallachóir, B.; Pfenninger, S.; Staffell, I. Impacts of inter-annual wind and solar variations on the European power system. Joule 2018, 2, 2076–2090. [Google Scholar] [CrossRef] [Scilit] [PubMed]
- Gøtske, E.K.; Andresen, G.B.; Neumann, F.; Victoria, M. Designing a sector-coupled European energy system robust to 60 years of historical weather data. Nat. Commun. 2024, 15, 10680. [Google Scholar] [CrossRef] [Scilit] [PubMed]
- Wogrin, S.; Gayme, D.F. Optimizing storage siting, sizing, and technology portfolios in transmission-constrained networks. IEEE Trans. Power Syst. 2015, 30, 3304–3313. [Google Scholar] [CrossRef] [Scilit]
- Schmidt, O.; Melchior, S.; Hawkes, A.; Staffell, I. Projecting the future levelized cost of electricity storage technologies. Joule 2019, 3, 81–100. [Google Scholar] [CrossRef] [Scilit]
- Ibacache, E.; Sauma, E. BESS degradation effects over operational and investment decisions in power system expansion planning. Appl. Energy 2026, 415, 127947. [Google Scholar] [CrossRef] [Scilit]
- Hagspiel, S.; Knaut, A.; Peter, J. Reliability in multi-regional power systems: Capacity adequacy and the role of interconnectors. Energy J. 2018, 39, 183–204. [Google Scholar] [CrossRef] [Scilit]
- European Union Agency for the Cooperation of Energy Regulators (ACER). Decision No. 23/2020 of 2 October 2020 on the Methodology for Calculating the Value of Lost Load, the Cost of New Entry, and the Reliability Standard; ACER: Ljubljana, Slovenia, 2020. Available online: https://www.acer.europa.eu/sites/default/files/documents/Individual%20Decisions_annex/ACER%20Decision%2023-2020%20on%20VOLL%20CONE%20RS%20-%20Annex%20I_1.pdf (accessed on 11 August 2026).
- Société Tunisienne de l’Électricité et du Gaz (STEG). Rapport Annuel 2024; STEG: Tunis, Tunisia, 2025; Available online: https://www.steg.com.tn/system/files/pdf/DG_RA_2024_Fr_0.pdf (accessed on 11 August 2026).

Disclaimer/Publisher’s Note: The statements, opinions and data contained in all publications are solely those of the individual author(s) and contributor(s) and not of MDPI and/or the editor(s). MDPI and/or the editor(s) disclaim responsibility for any injury to people or property resulting from any ideas, methods, instructions or products referred to in the content. |
© 2026 by the authors. Licensee MDPI, Basel, Switzerland. This article is an open access article distributed under the terms and conditions of the Creative Commons Attribution (CC BY) license.