


Abstract
Continental shale reservoirs exhibit pronounced multi-scale heterogeneity, with reservoir quality governed by the interplay of lamina assemblages, bedding continuity, and lithological spatial variability. Conventional digital outcrop modeling (DOM) primarily targets geometric reconstruction and three-dimensional (3D) visualization of sedimentary bodies, which is insufficient for the fine-scale structural characterization and quantitative modeling required for shale reservoirs. Here we present a Digital Shale Outcrop Modeling method (DSOM) tailored to continental shale reservoirs, exemplified by the Gulong Shale in the Qingshankou Formation (Upper Cretaceous) of the Songliao Basin, northeastern China. DSOM integrates six sequential modules: digital outcrop reconstruction, digital section interpretation, virtual well construction, virtual well correlation, 3D structural modeling, and parameter extraction. A high-precision digital outcrop model covering 0.369 km2 was constructed from 1885 calibrated UAV images (DJI Mavic 3 Enterprise) using Structure-from-Motion (SfM) photogrammetry, yielding derived products including a digital outcrop model (DOM), digital surface model (DSM), digital elevation model (DEM), orthomosaic, and dense point cloud. Seven virtual wells were extracted along the outcrop strike, and a unified lithological classification comprising seven lithotypes was established. A regionally persistent rusty-yellow ferruginous siltstone layer served as a marker bed for virtual well correlation. Results reveal a distinct vertical lithological transition: the section above the marker bed is dominated by muddy deposits, with black mudstone and dark-gray silty mudstone collectively accounting for 52.84% of the total area, whereas the section below the marker bed exhibits a marked increase in silt-grade material, with gray siltstone reaching 32.78%. This vertical evolution reflects a depositional shift from relatively high-energy to low-energy conditions. Using the virtual wells as conditioning data, 3D lithological probability models for all seven lithotypes were constructed via Sequential Indicator Simulation (SIS), achieving quantitative representation of lithological spatial distribution and lateral variability under bedding constraints. Our results demonstrate that DSOM effectively converts outcrop digital information into reservoir structural data, providing reliable constraints for multi-scale structural characterization, 3D geological modeling, and heterogeneity evaluation of the Gulong Shale. More broadly, DSOM establishes a methodological framework for digital characterization of fine-grained sedimentary reservoirs, bridging the gap between outcrop-scale observations and subsurface reservoir modeling.
1. Introduction
During the global transition toward a low-carbon energy system, unconventional hydrocarbon resources serve as an important transitional energy source, playing a critical role in ensuring energy security and compensating for the decline of conventional hydrocarbon reserves. Among these, shale oil has emerged as a primary focus of international petroleum exploration and development, owing to its immense resource scale, widespread distribution, and substantial production potential [1,2,3]. Unlike conventional sandstone reservoirs, shale reservoirs are characterized by pronounced multi-scale heterogeneity. Reservoir quality and production performance depend not only on organic matter abundance, mineral composition, and thermal maturity, but are also intimately linked to structural features including lamina assemblages, bedding continuity, and natural fracture networks. Extensive studies have established that millimeter-scale laminae, centimeter-scale bedding, and meter-scale fracture networks collectively form complex fluid storage and migration systems that govern sweet-spot formation, horizontal well trajectory deployment, and hydraulic fracturing effectiveness. Consequently, developing fine-scale characterization methods for the spatial architecture of shale reservoirs constitutes a critical foundation for efficient shale oil development.
Recent years have witnessed major breakthroughs in continental shale oil exploration and development in China, with the Gulong Shale of the Songliao Basin emerging as the most representative example [4,5]. In contrast to North American marine shales, the Gulong Shale was deposited in a large-scale continental lacustrine environment characterized by rapid facies changes, complex lamina assemblages, well-developed bedding, pronounced mineralogical variability, and abundant natural fractures, resulting in more pronounced multi-scale heterogeneity. Previous studies have addressed the depositional environment, organic matter enrichment mechanisms, mineral composition, pore structure, and reservoir physical properties of the Gulong Shale [4,5,6,7], providing important foundations for understanding the formation mechanisms of continental shale reservoirs. However, research on outcrop-scale spatial architecture and its digital representation remains limited, particularly regarding bedding continuity, lamina spatial distribution, and the geometric relationships among fracture networks—all of which lack continuous, intuitive, and three-dimensional understanding. This knowledge gap constrains heterogeneity evaluation and 3D geological modeling of continental shale reservoirs.
The advent of unmanned aerial vehicle (UAV) platforms, Structure-from-Motion (SfM) photogrammetry, and 3D reconstruction technologies has established digital outcrop modeling (DOM) as an essential tool in modern sedimentary geology and reservoir characterization. Compared with traditional field surveys, digital outcrops enable rapid acquisition of 3D models at centimeter- to millimeter-scale spatial resolution, facilitating geometric reconstruction, digital preservation, quantitative measurement, and 3D visualization. DOM has been widely applied to fluvial, alluvial fan, deltaic, and carbonate depositional systems, achieving notable advances in sedimentary architecture analysis, fracture identification, reservoir modeling, and structural interpretation, and progressively establishing a workflow of “data acquisition–3D reconstruction–geological interpretation–3D modeling” [8,9,10,11,12,13,14]. However, existing DOM research has predominantly targeted sandstone and carbonate reservoirs, focusing on macro-scale geological features such as channel geometry, sedimentary body boundaries, and reservoir architecture. In contrast, shale reservoir research centers on fine-scale structures including millimeter-scale laminae, bedding continuity, and natural fracture networks. Owing to the wide scale range, rapid lithological variations, high bedding continuity, and extremely thin individual lamina thickness characteristic of shale reservoirs, conventional DOM approaches cannot directly meet the demands of fine-scale shale reservoir characterization. Shale-focused digital outcrop research remains in an exploratory stage, lacking a dedicated modeling workflow tailored to shale reservoir structural characteristics, as well as an integrated technical system spanning digital outcrop modeling, bedding interpretation, lamina recognition, 3D modeling, and quantitative heterogeneity assessment. Therefore, establishing a digital outcrop modeling methodology suitable for shale reservoirs has become a critical research direction at the intersection of digital geology and unconventional petroleum geoscience.
To address these challenges, we propose a Digital Shale Outcrop Modeling Method (DSOM) and apply it to the Gulong Shale outcrops in the Songliao Basin. Unlike conventional DOM, which prioritizes 3D geometric reconstruction as its primary objective, DSOM treats the digital outcrop model as a platform for shale structural information representation. With digital section interpretation as its core, DSOM establishes an integrated technical workflow of “digital outcrop reconstruction–structural interpretation–3D modeling–parameter extraction–heterogeneity evaluation”, enabling the digital representation and quantitative analysis of key shale structural elements, including bedding, laminae, and lithological interlayers. Specifically, this study: (1) develops a DSOM technical workflow tailored to shale reservoirs; (2) establishes digital representation methods for key structural units such as bedding and laminae, achieving quantitative 3D structural characterization at the outcrop scale; and (3) forms a reservoir structural parameter extraction and heterogeneity evaluation methodology based on digital outcrop models, providing a new technical framework for digital characterization, sweet-spot evaluation, and 3D geological modeling of continental shale reservoirs.
2. Geological Setting
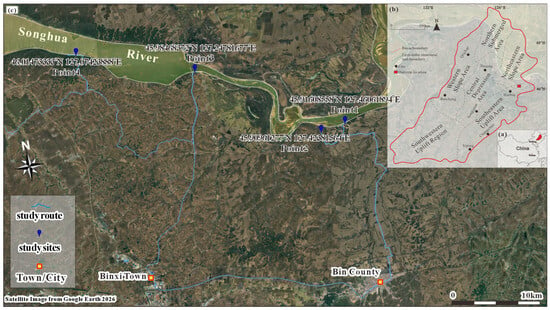
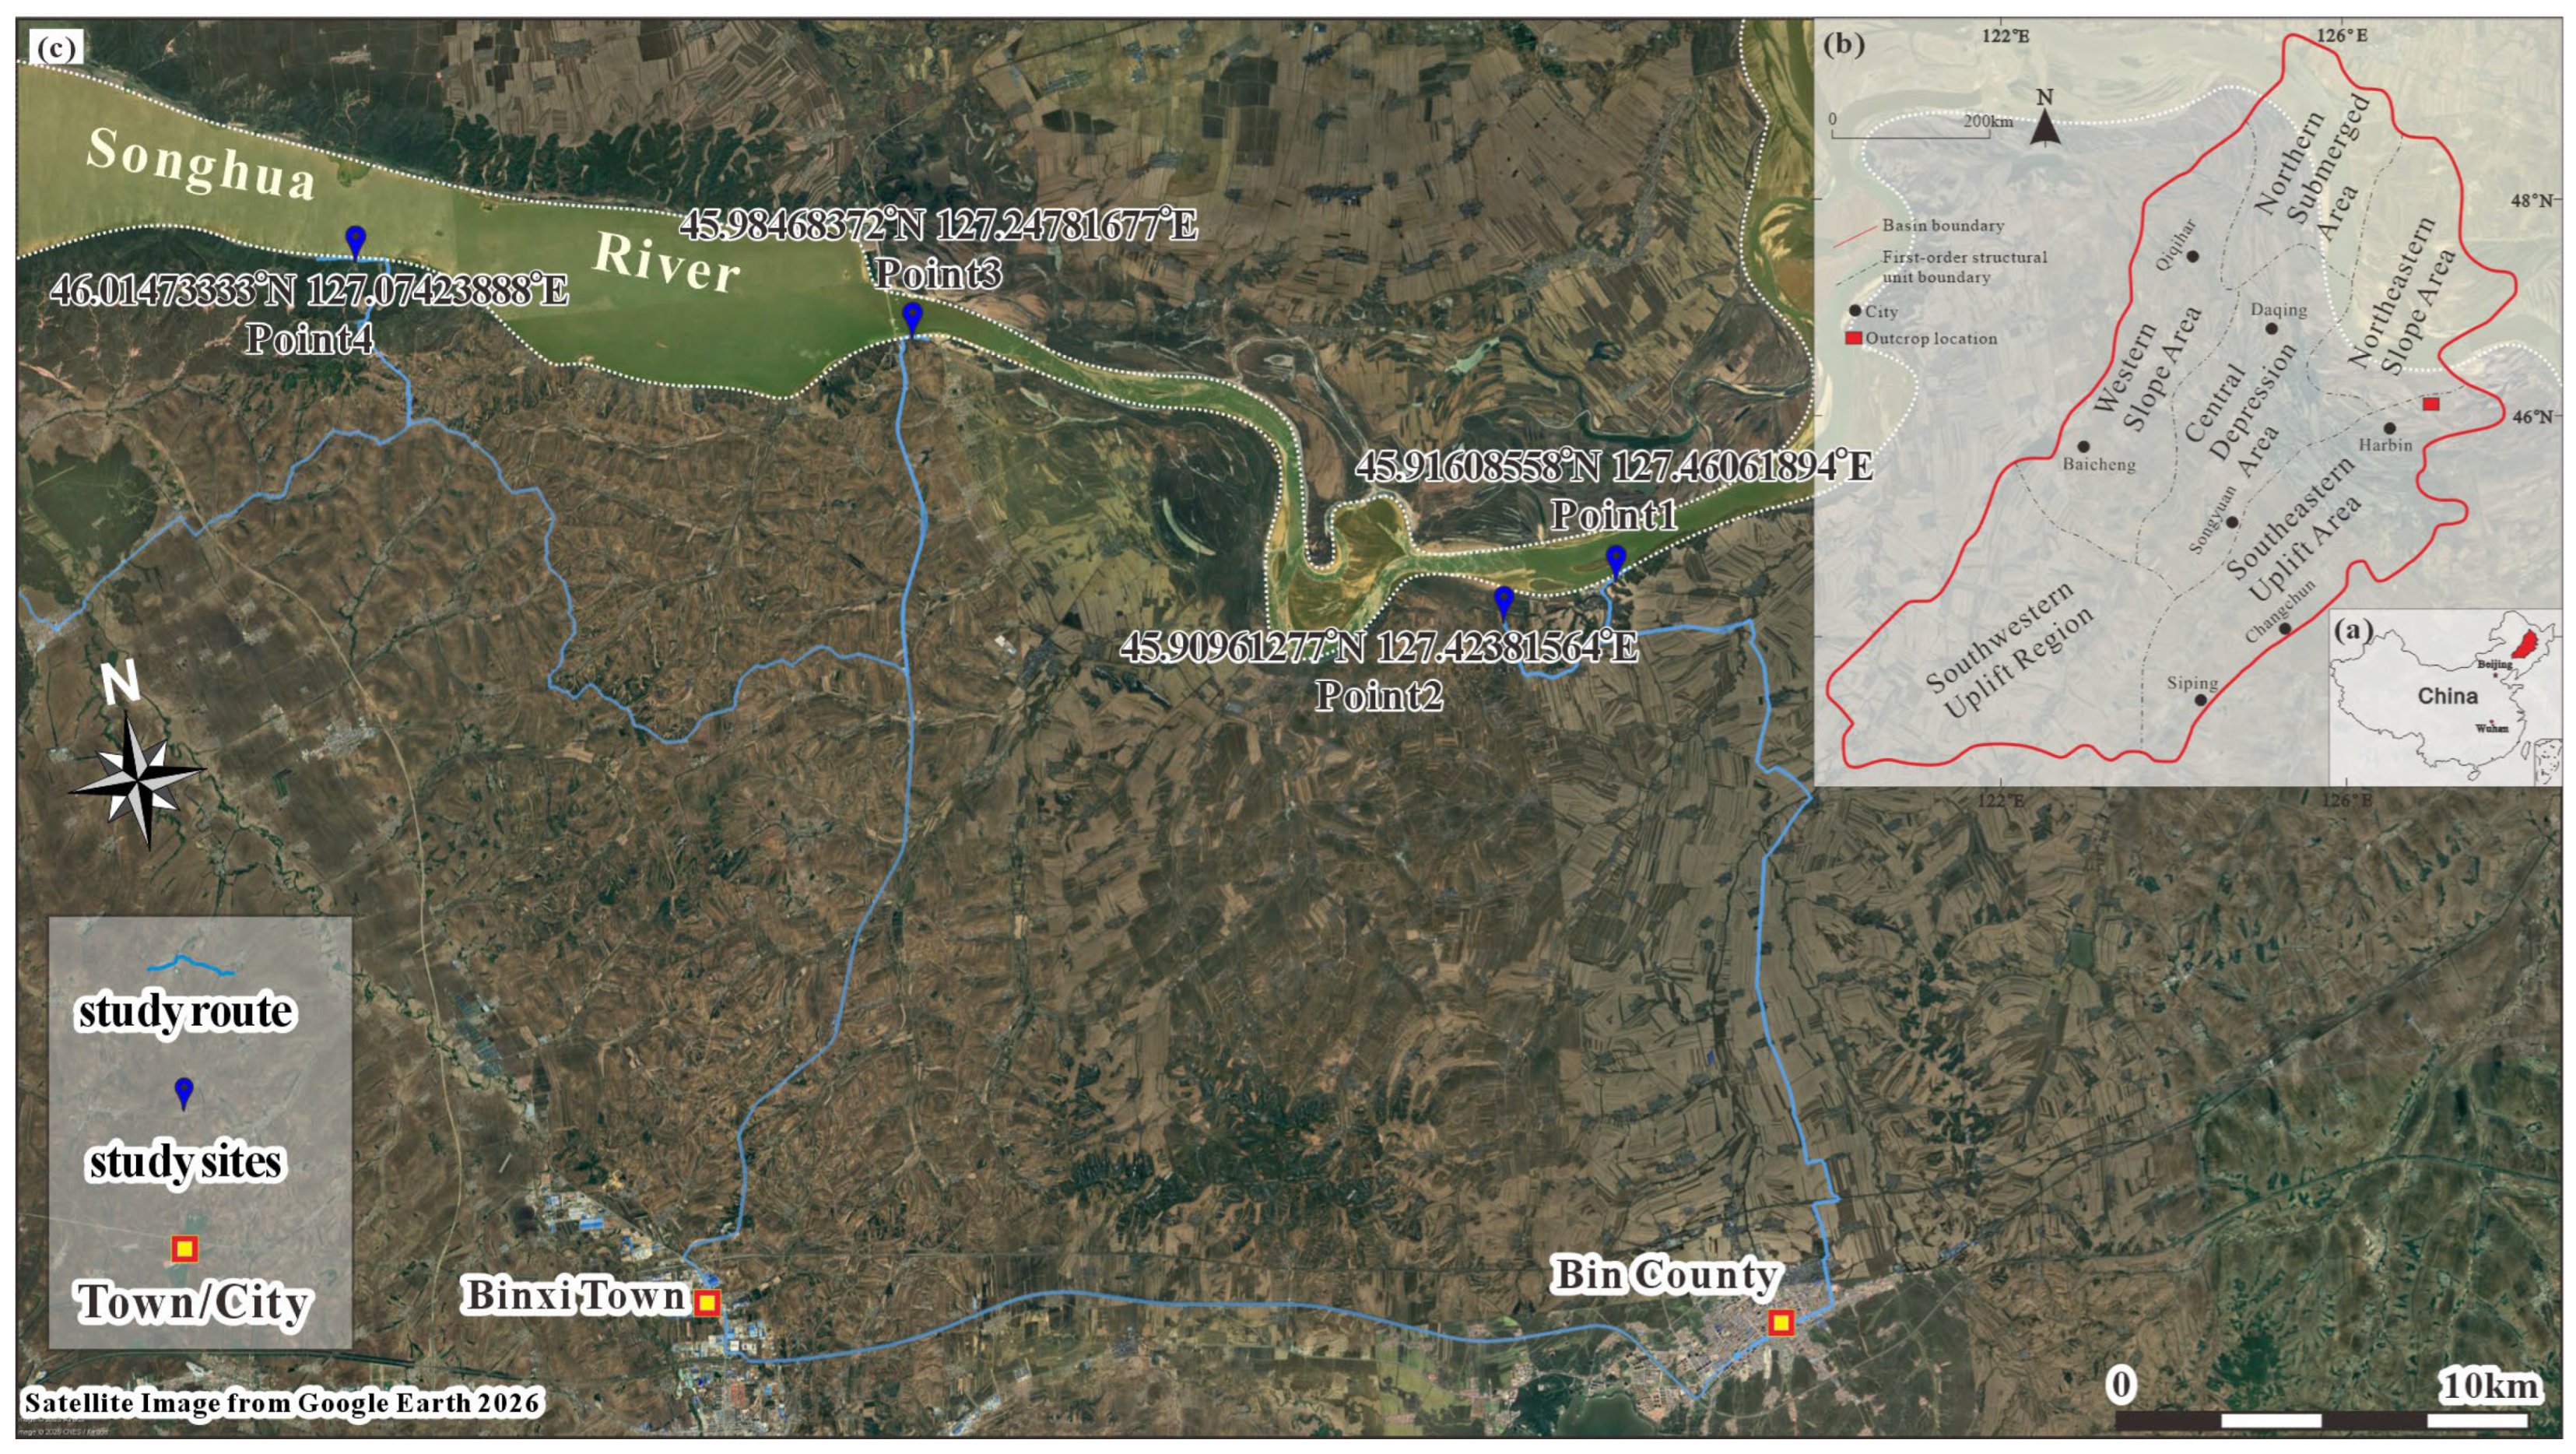
The Songliao Basin, located in northeastern China and spanning Heilongjiang, Jilin, and Liaoning provinces, covers an area of approximately 26 × 104 km2 and constitutes one of the principal petroliferous basins in China [15,16,17] (Figure 1a). The basin is subdivided into six secondary tectonic units: the Northern Plunge Zone, Western Slope Zone, Northeastern Uplift Zone, Southeastern Uplift Zone, Southwestern Uplift Zone, and Central Depression Zone (Figure 1b). The study area lies within the Qijia–Gulong Sag in the northern Central Depression, and the target interval is the Gulong Shale of the Upper Cretaceous Qingshankou Formation (Figure 1c). Two major lacustrine transgressive events occurred during deposition of the Nenjiang and Qingshankou formations, producing two thick, high-quality source rock intervals that constitute the primary shale oil enrichment targets. Source rocks of the Nenjiang Formation remain at immature to low-maturity stages, whereas the Qingshankou Formation—deposited during the main phase of sag development under conditions of broad, gently subsiding basin paleogeography—attained higher organic matter enrichment and thermal maturity, hosting medium- to high-maturity shale oil and representing the most favorable exploration and development target.
Figure 1.
Location of the study area. (a) Geographic location of the Songliao Basin. (b) Tectonic subdivision of the Songliao Basin. (c) Specific location of the studied outcrop section.
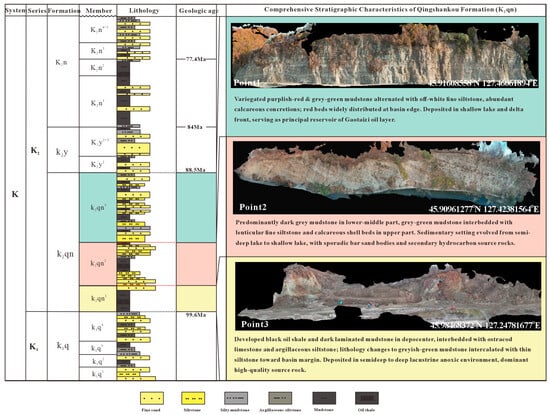
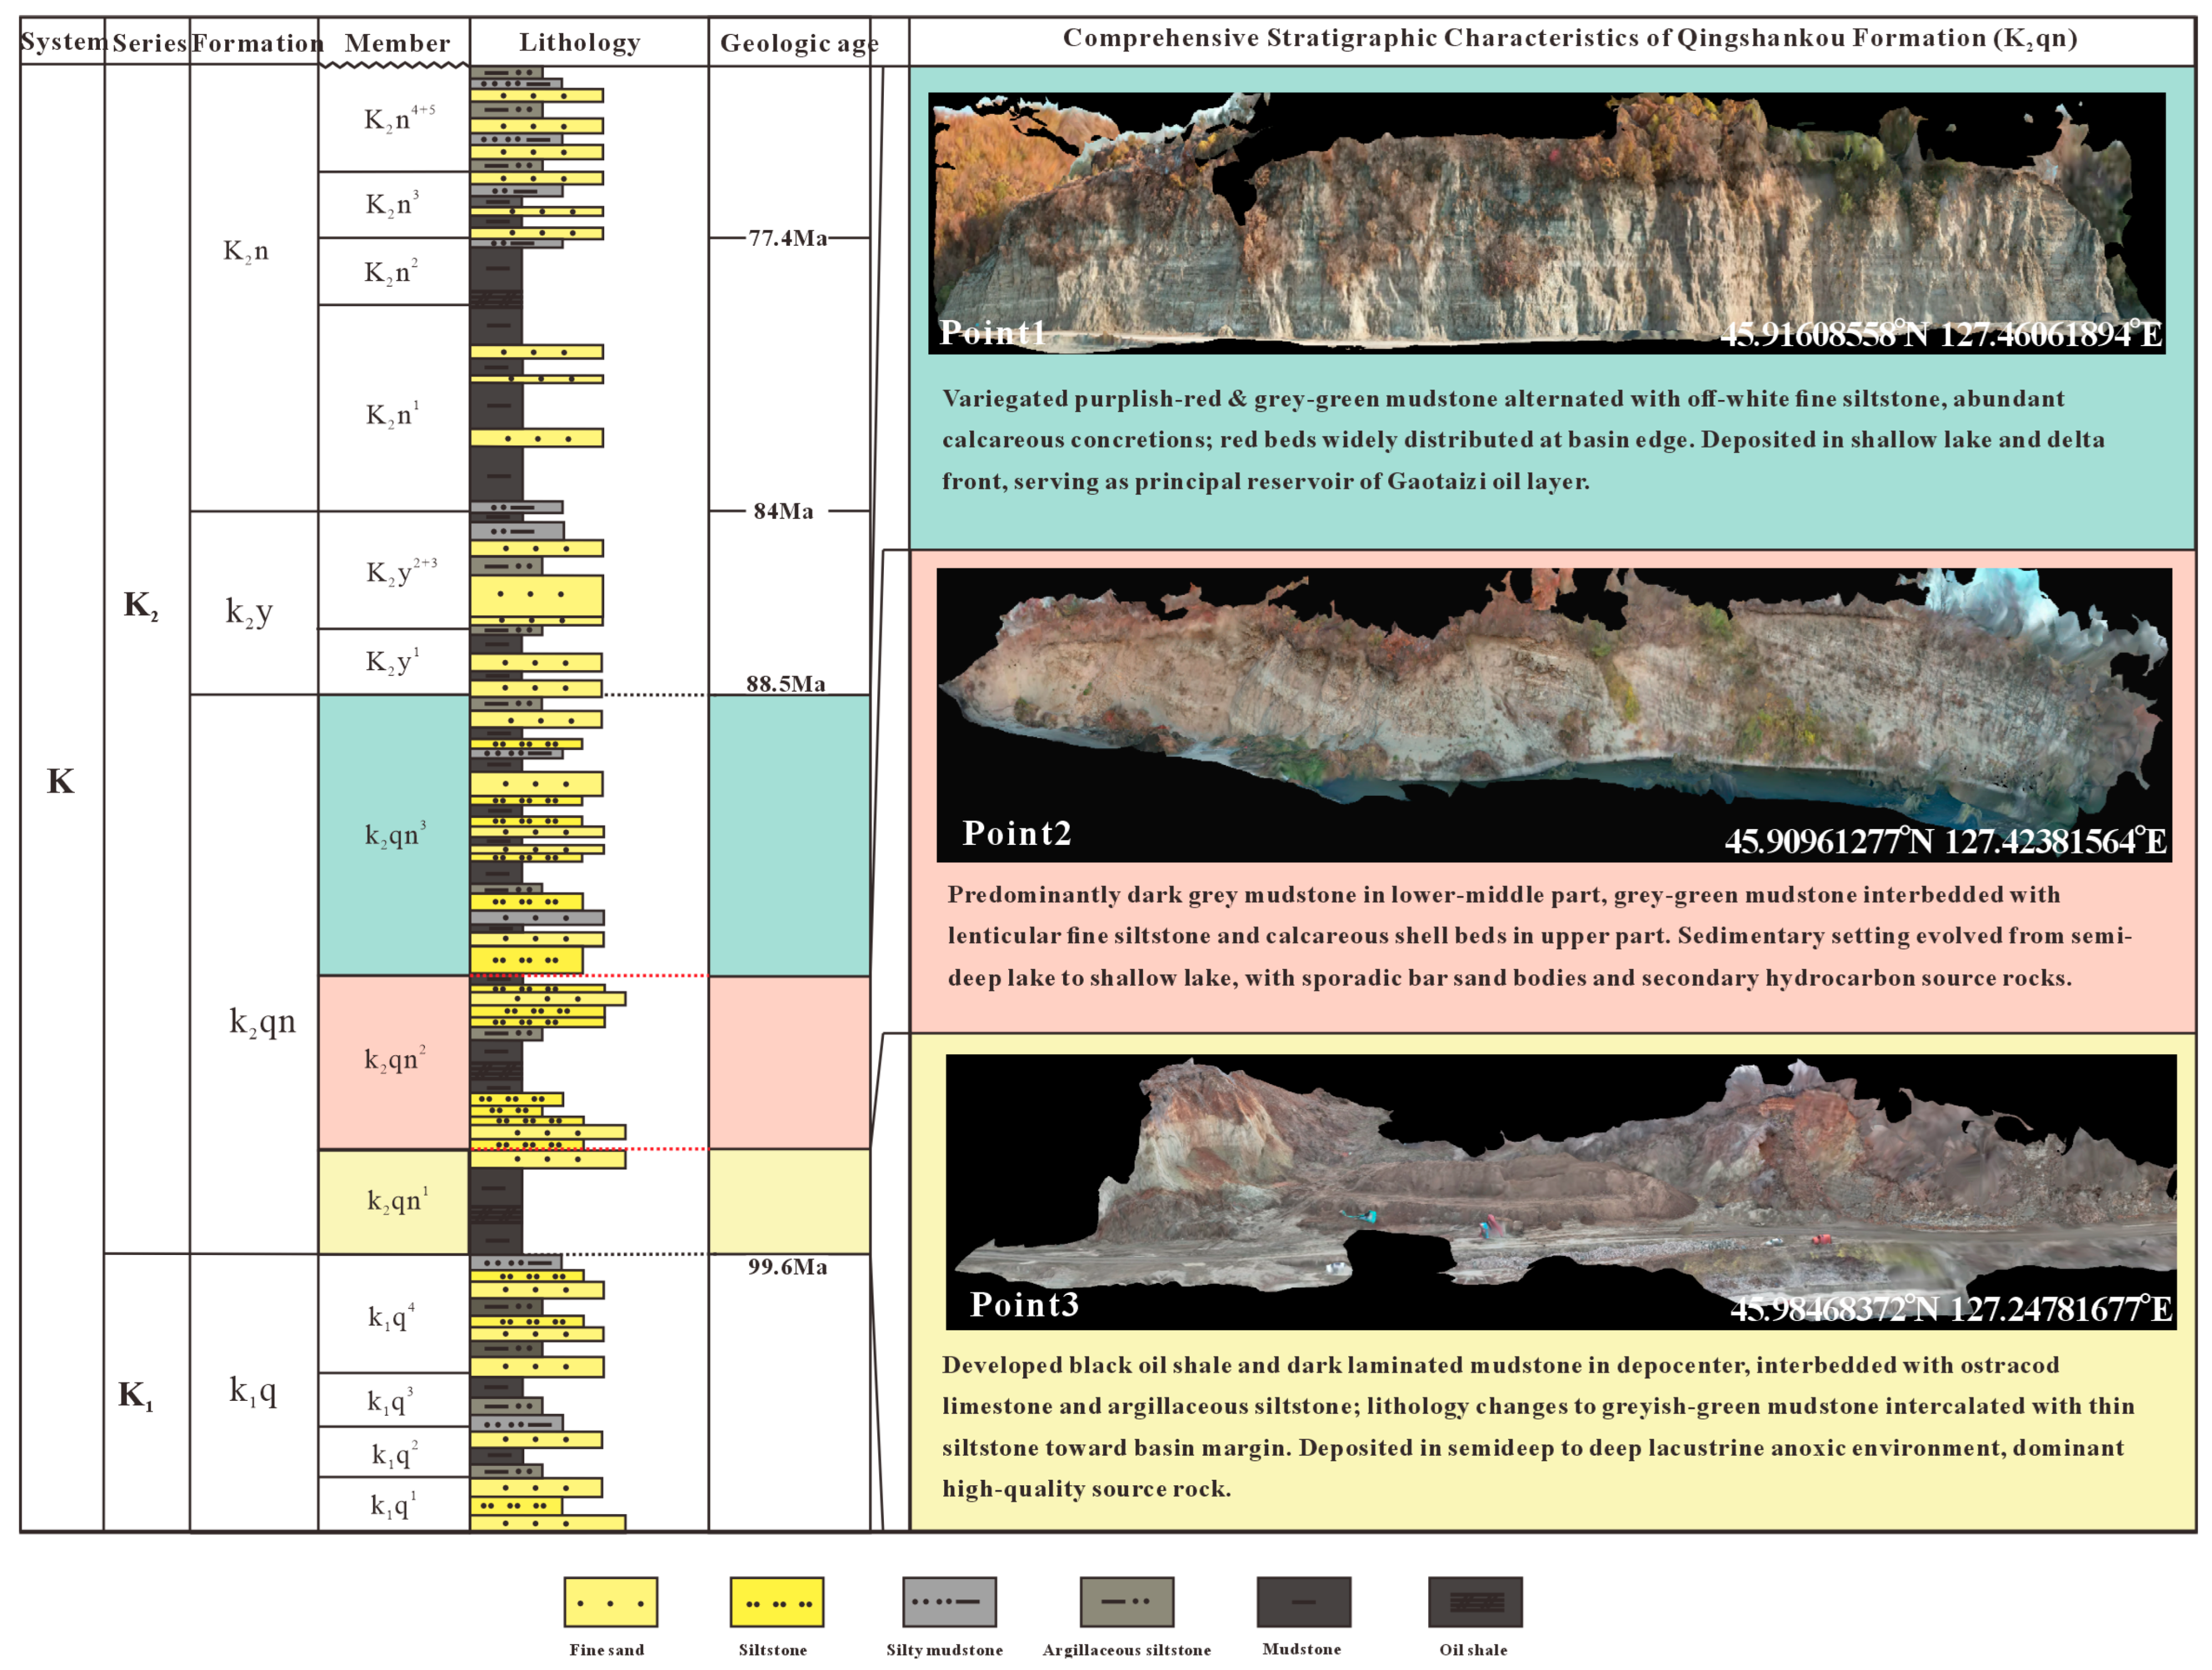
The Qingshankou Formation is subdivided, from base to top, into the first member (K2qn1), second member (K2qn2), and third member (K2qn3) (Figure 2). The Gulong Shale is developed primarily within K2qn1 and the lower part of K2qn2, attaining a total thickness of approximately 100–150 m, locally exceeding 200 m. Lithologically, it is dominated by organic-rich dark mudstone and shale, with local thin interbeds of siltstone, dolostone, and bioclastic limestone, and is characterized by widespread millimeter-scale lamination and lamellation structure, good bedding continuity, and lateral stability. The Qingshankou Formation shale is vertically subdivided into nine oil-bearing intervals (Q1–Q9) based on lithological, electrical, and geochemical characteristics [6,7,18], representing a typical example of continental source–reservoir integrated shale oil in China [4,5].
Figure 2.
Stratigraphic characteristics of the Qingshankou Formation, subdivided into the first member (K2qn1), second member (K2qn2), and third member (K2qn3).
Compared with North American marine shales, the Gulong Shale was deposited in a large freshwater lacustrine environment characterized by complex sediment provenance, diverse lamina assemblages, pronounced mineralogical variability, and relatively high natural fracture intensity. The reservoir is composed predominantly of clay minerals, quartz, feldspar, and carbonate minerals, with an extensive multi-scale pore–fracture system including organic matter-hosted pores, intergranular pores, dissolution pores, and bedding-parallel fractures [19,20]. High organic matter abundance, moderate thermal maturity, and substantial brittle mineral content collectively govern shale oil enrichment [4,5,21] and development potential, making the Gulong Shale an exemplary subject for investigating continental shale reservoir architecture and heterogeneity [22,23].
The studied outcrop is located near Bin County, Harbin City, where four outcrop observation points were identified (Figure 1c). Based on exposure completeness, Observation Point 1 was selected for digital outcrop model construction. This outcrop section is well preserved, with a continuous exposure length of approximately 100 m, well-developed and clearly visible bedding, continuous laminae, and relatively low weathering intensity, enabling continuous observation of millimeter-scale laminae, bedding surfaces, and fracture distribution characteristics. The structural features of this outcrop exhibit good correspondence with drill cores from the Gulong area, making it an ideal outcrop analogue for subsurface shale reservoir structural research and an excellent subject for digital outcrop modeling and 3D structural characterization.
3. Methodology
3.1. DSOM Technical Framework
Conventional Digital Outcrop Modeling (DOM) primarily serves reservoir architecture analysis for fluvial, deltaic, and carbonate depositional systems [8,9,10], with geometric reconstruction and 3D visualization of outcrop morphology as its core objectives. Shale reservoirs, however, are characterized by fine lamina scale, high bedding continuity, and pronounced multi-scale heterogeneity [4,5,6], rendering conventional DOM workflows inadequate for fine-scale shale reservoir characterization [10,11]. To address this, we propose the Digital Shale Outcrop Modeling method (DSOM). Unlike conventional DOM, DSOM does not treat 3D geometric model reconstruction as the final deliverable; instead, it positions the digital outcrop model as a platform for expressing shale structural information, with digital section interpretation as its core. DSOM establishes an integrated five-module workflow: (1) multi-source data acquisition; (2) digital outcrop reconstruction; (3) digital structural interpretation of shale; (4) 3D structural modeling; and (5) reservoir structural parameter extraction and heterogeneity evaluation (Figure 3). Each module is functionally independent yet sequentially constrained by outputs from the preceding stage, collectively constituting a complete digital shale outcrop modeling system.
Figure 3.
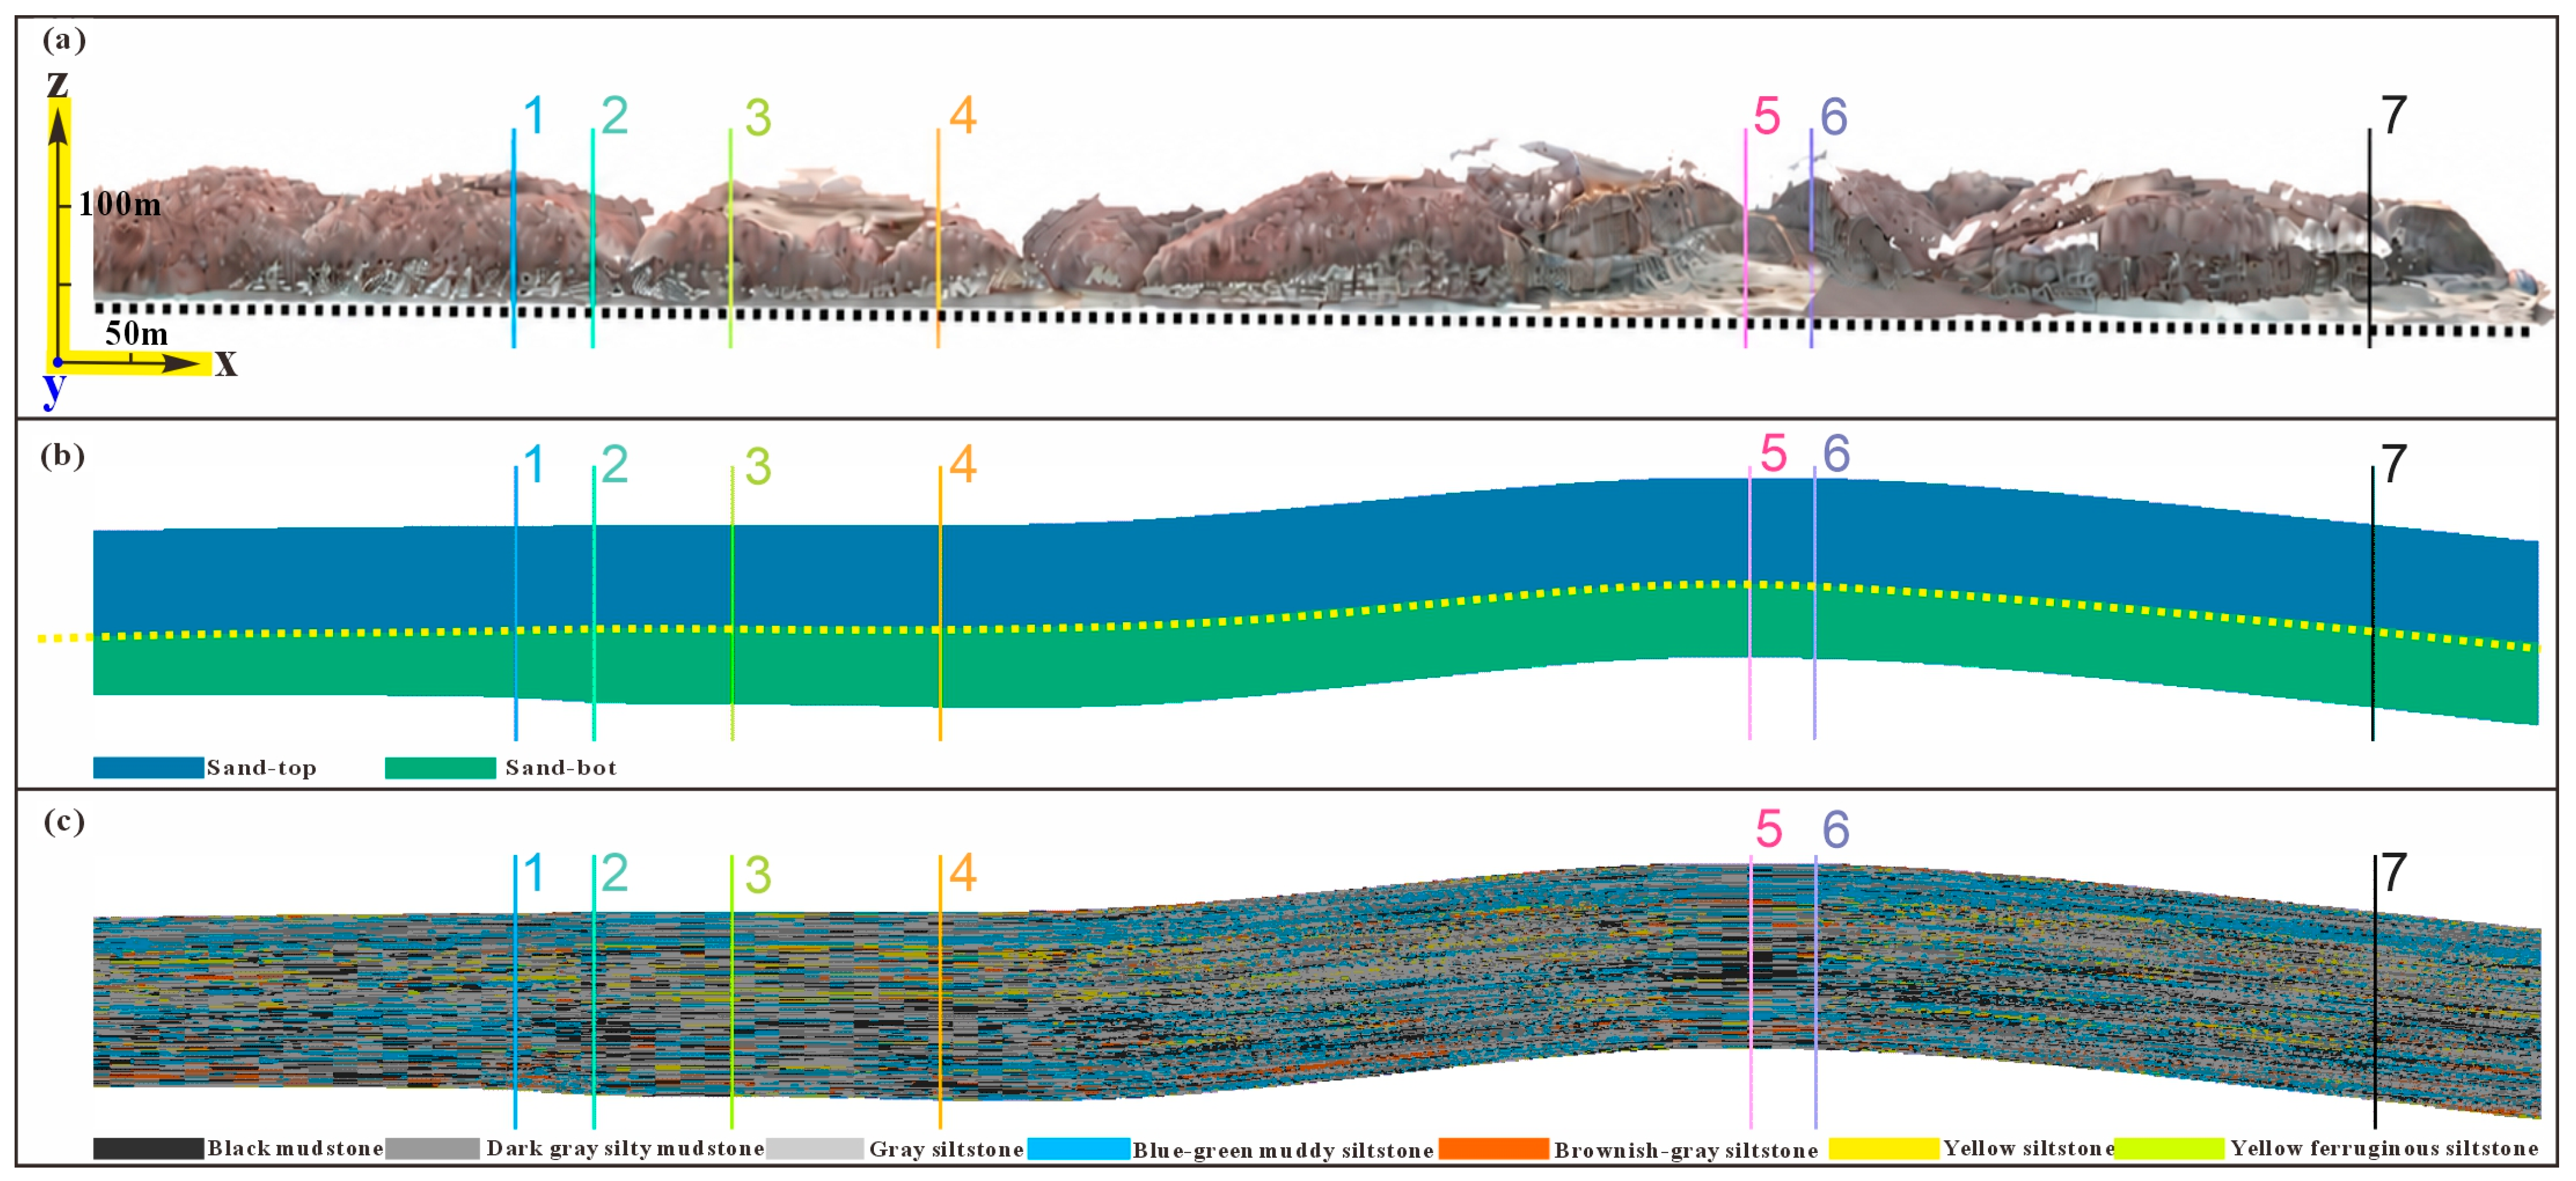
Key steps of the DSOM technical framework. (a) Digital outcrop reconstruction of the study area. (b) Structural interpretation of the outcrop section. (c) Visualization of modeling parameters. In (a), numbers 1–7 mark the locations of the seven corresponding profiles shown in Figure 8.
3.2. Digital Structural Interpretation
Shale reservoir architecture exhibits inherent multi-scale characteristics that cannot be fully captured by any single data type alone. We therefore adopted a multi-source data acquisition strategy integrating UAV photogrammetry, field geological surveys (Figure 4), and laboratory analyses to achieve comprehensive constraints across scales. UAV oblique photogrammetry primarily provided overall 3D geometric information and high-resolution texture data of the outcrop. A DJI Mavic 3 Enterprise UAV was deployed [11,24], with forward and lateral overlap rates maintained at approximately 70%, acquiring centimeter-scale spatial resolution imagery to serve as the foundation for digital outcrop model reconstruction [25,26,27] (Table 1).
Figure 4.
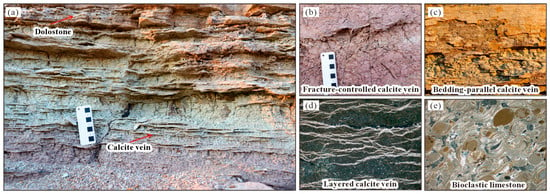
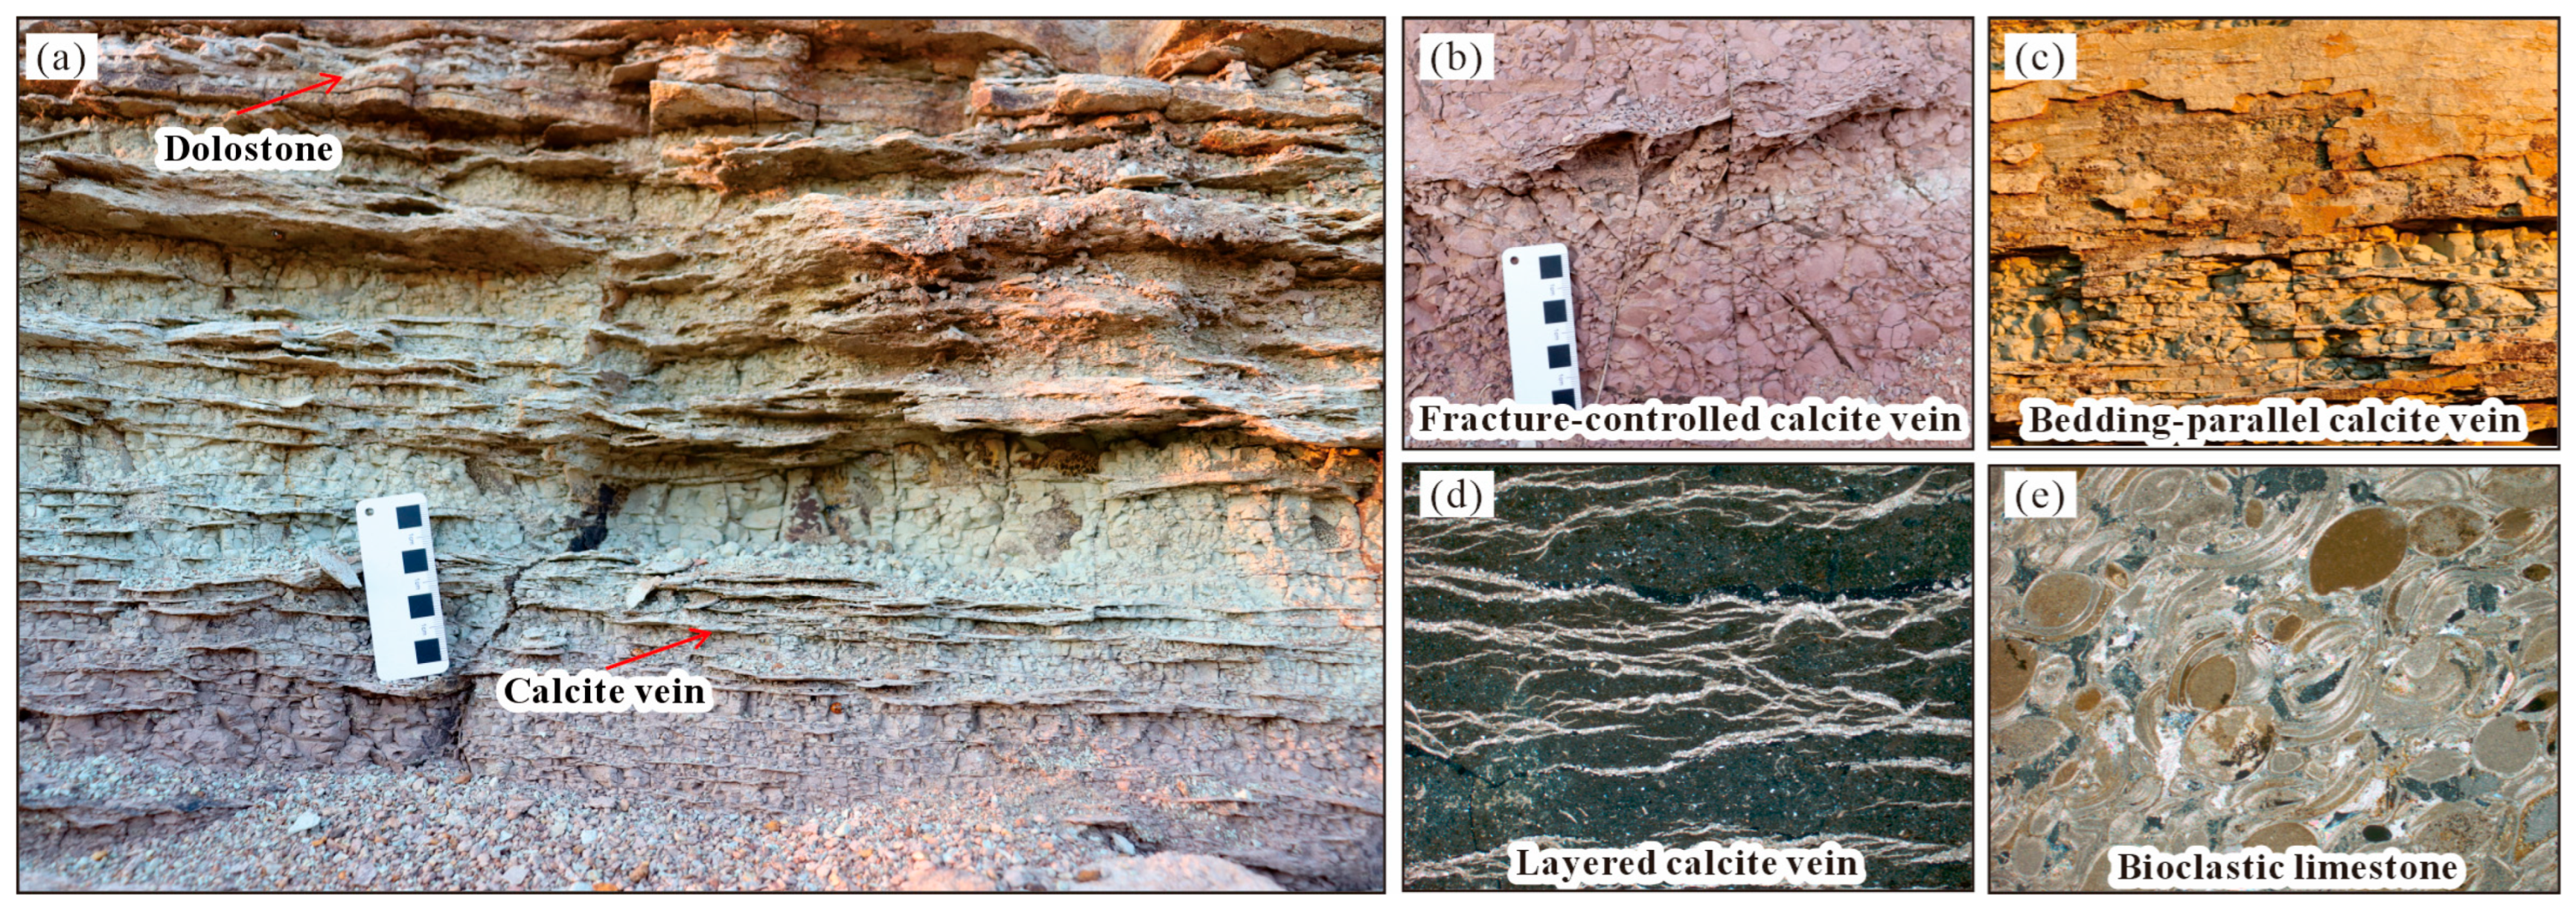
Micro-scale shale section information acquisition. (a) Bedding-parallel dolomite and calcite veins. (b) Fracture-filling calcite veins. (c) Bedding-parallel calcite veins. (d) Layered calcite veins. (e) Bioclastic limestone.
Table 1.
The UAV photogrammetry acquisition parameters and camera specifications for the SfM digital outcrop reconstruction.
Field surveys focused on documenting bedding attitudes, lamina assemblages, fracture characteristics (Figure 4a), and key lithological boundaries (Figure 4b), and provided ground-truth calibration for digital interpretation results (Figure 4c). Representative sampling points were distributed along the outcrop using systematic equidistant sampling (Table 2). Concurrently, representative rock samples were collected for TOC analysis, XRD whole-rock mineralogy (Figure 4d), and Rock-Eval pyrolysis to determine organic matter abundance, mineral composition, and brittleness characteristics, providing experimental constraints for lamina type identification and reservoir heterogeneity evaluation (Figure 4e). Data from different sources were spatially co-registered and mutually complementary across scales, collectively forming the data foundation for DSOM modeling.
Table 2.
Representative sampling-point POS data.
3.3. Multi-Source Shale Structural Data Acquisition
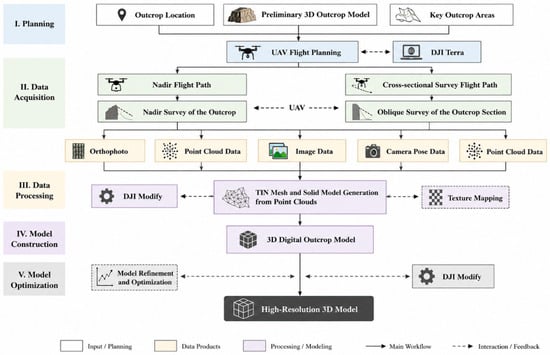
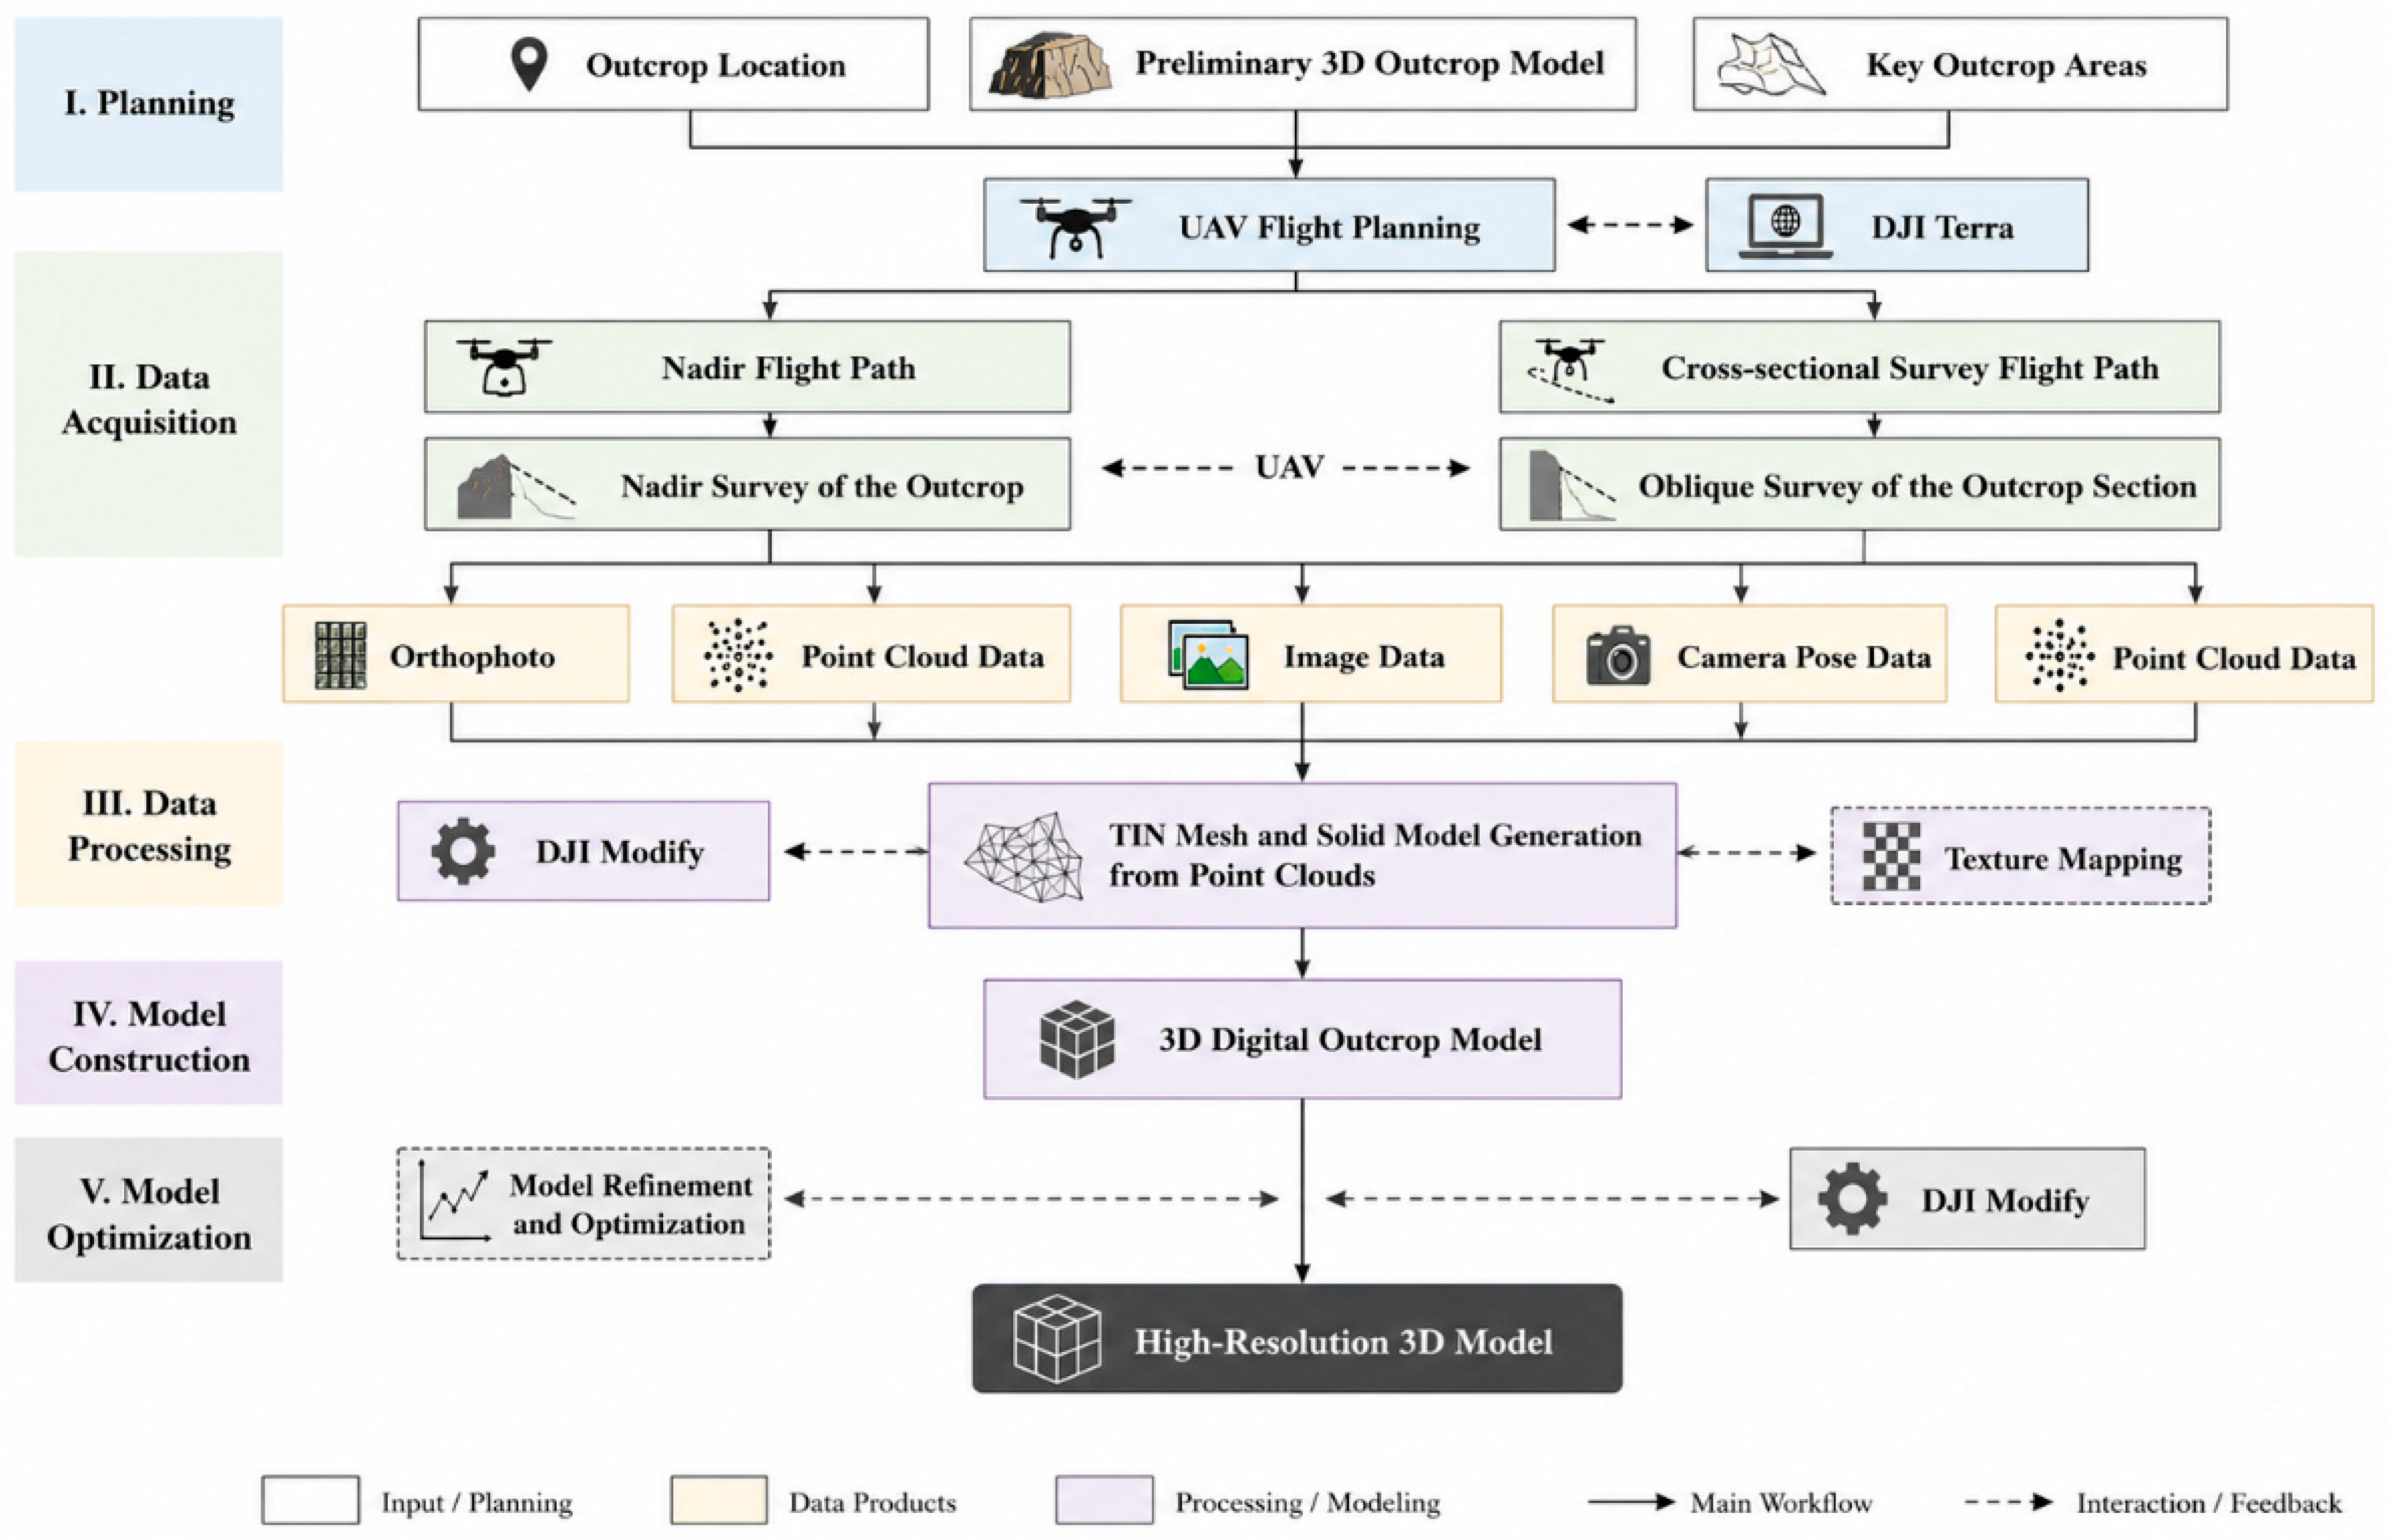
Digital outcrop reconstruction constitutes the foundational module of DSOM. Its purpose extends beyond restoring the true geometric morphology of the outcrop to establishing a unified spatial reference framework essential for subsequent digital interpretation, spatial modeling, and parameter extraction. We employed an SfM-based photogrammetric approach [25,26,27] to achieve digital outcrop representation. UAV imagery was first subjected to quality inspection and filtering, then processed using DJI Terra, version 5.3.5 (SZ DJI Technology Co., Ltd., Shenzhen, China) for aerial triangulation, camera self-calibration, dense point cloud generation, triangular mesh construction, and texture mapping, ultimately yielding a digital outcrop model with real-world spatial coordinates and high-resolution texture information. The complete modeling workflow comprises five steps: image matching, bundle adjustment, dense point cloud generation, TIN mesh construction, and texture mapping (Figure 5). Bundle adjustment optimizes camera poses and interior orientation parameters, enhancing the internal geometric accuracy of the model; the dense point cloud establishes the 3D morphology of the outcrop; the TIN mesh constructs a continuous surface; and texture mapping preserves the true color and textural characteristics of the outcrop, providing visual evidence for subsequent bedding and lamina recognition. Upon model completion, multiple derived data products—including the digital outcrop model, DSM, DEM, orthomosaic, and dense point cloud—were simultaneously generated to provide a unified data foundation for subsequent digital interpretation and 3D modeling [11,12].
Figure 5.
Technical workflow for digital shale outcrop reconstruction.
3.4. Quantitative Structural Characterization
Following digital outcrop model construction, we employed digital sections as the primary template for fine-scale geological interpretation and developed a virtual well construction method based on the digital outcrop [28,29]. Multiple digital sections were extracted along the outcrop strike at regular intervals; each digital section was treated as a virtual well, for which a corresponding lithological log was established based on digital outcrop interpretation results. Virtual wells preserve not only the lithological, bed thickness, and bedding information of traditional field sections, but also record structural features such as lamina assemblages, sedimentary cycles, and key stratigraphic surfaces, thereby organizing outcrop data in a format consistent with subsurface well data and enabling effective integration between outcrop information and subsurface reservoir modeling.
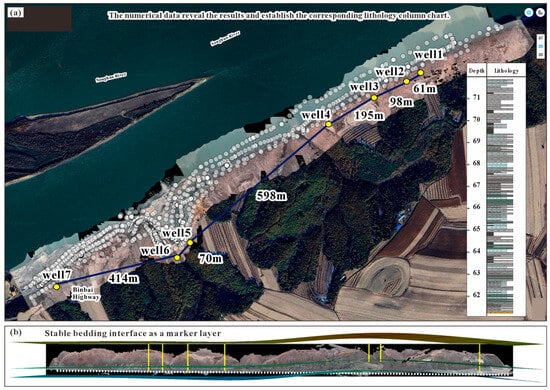
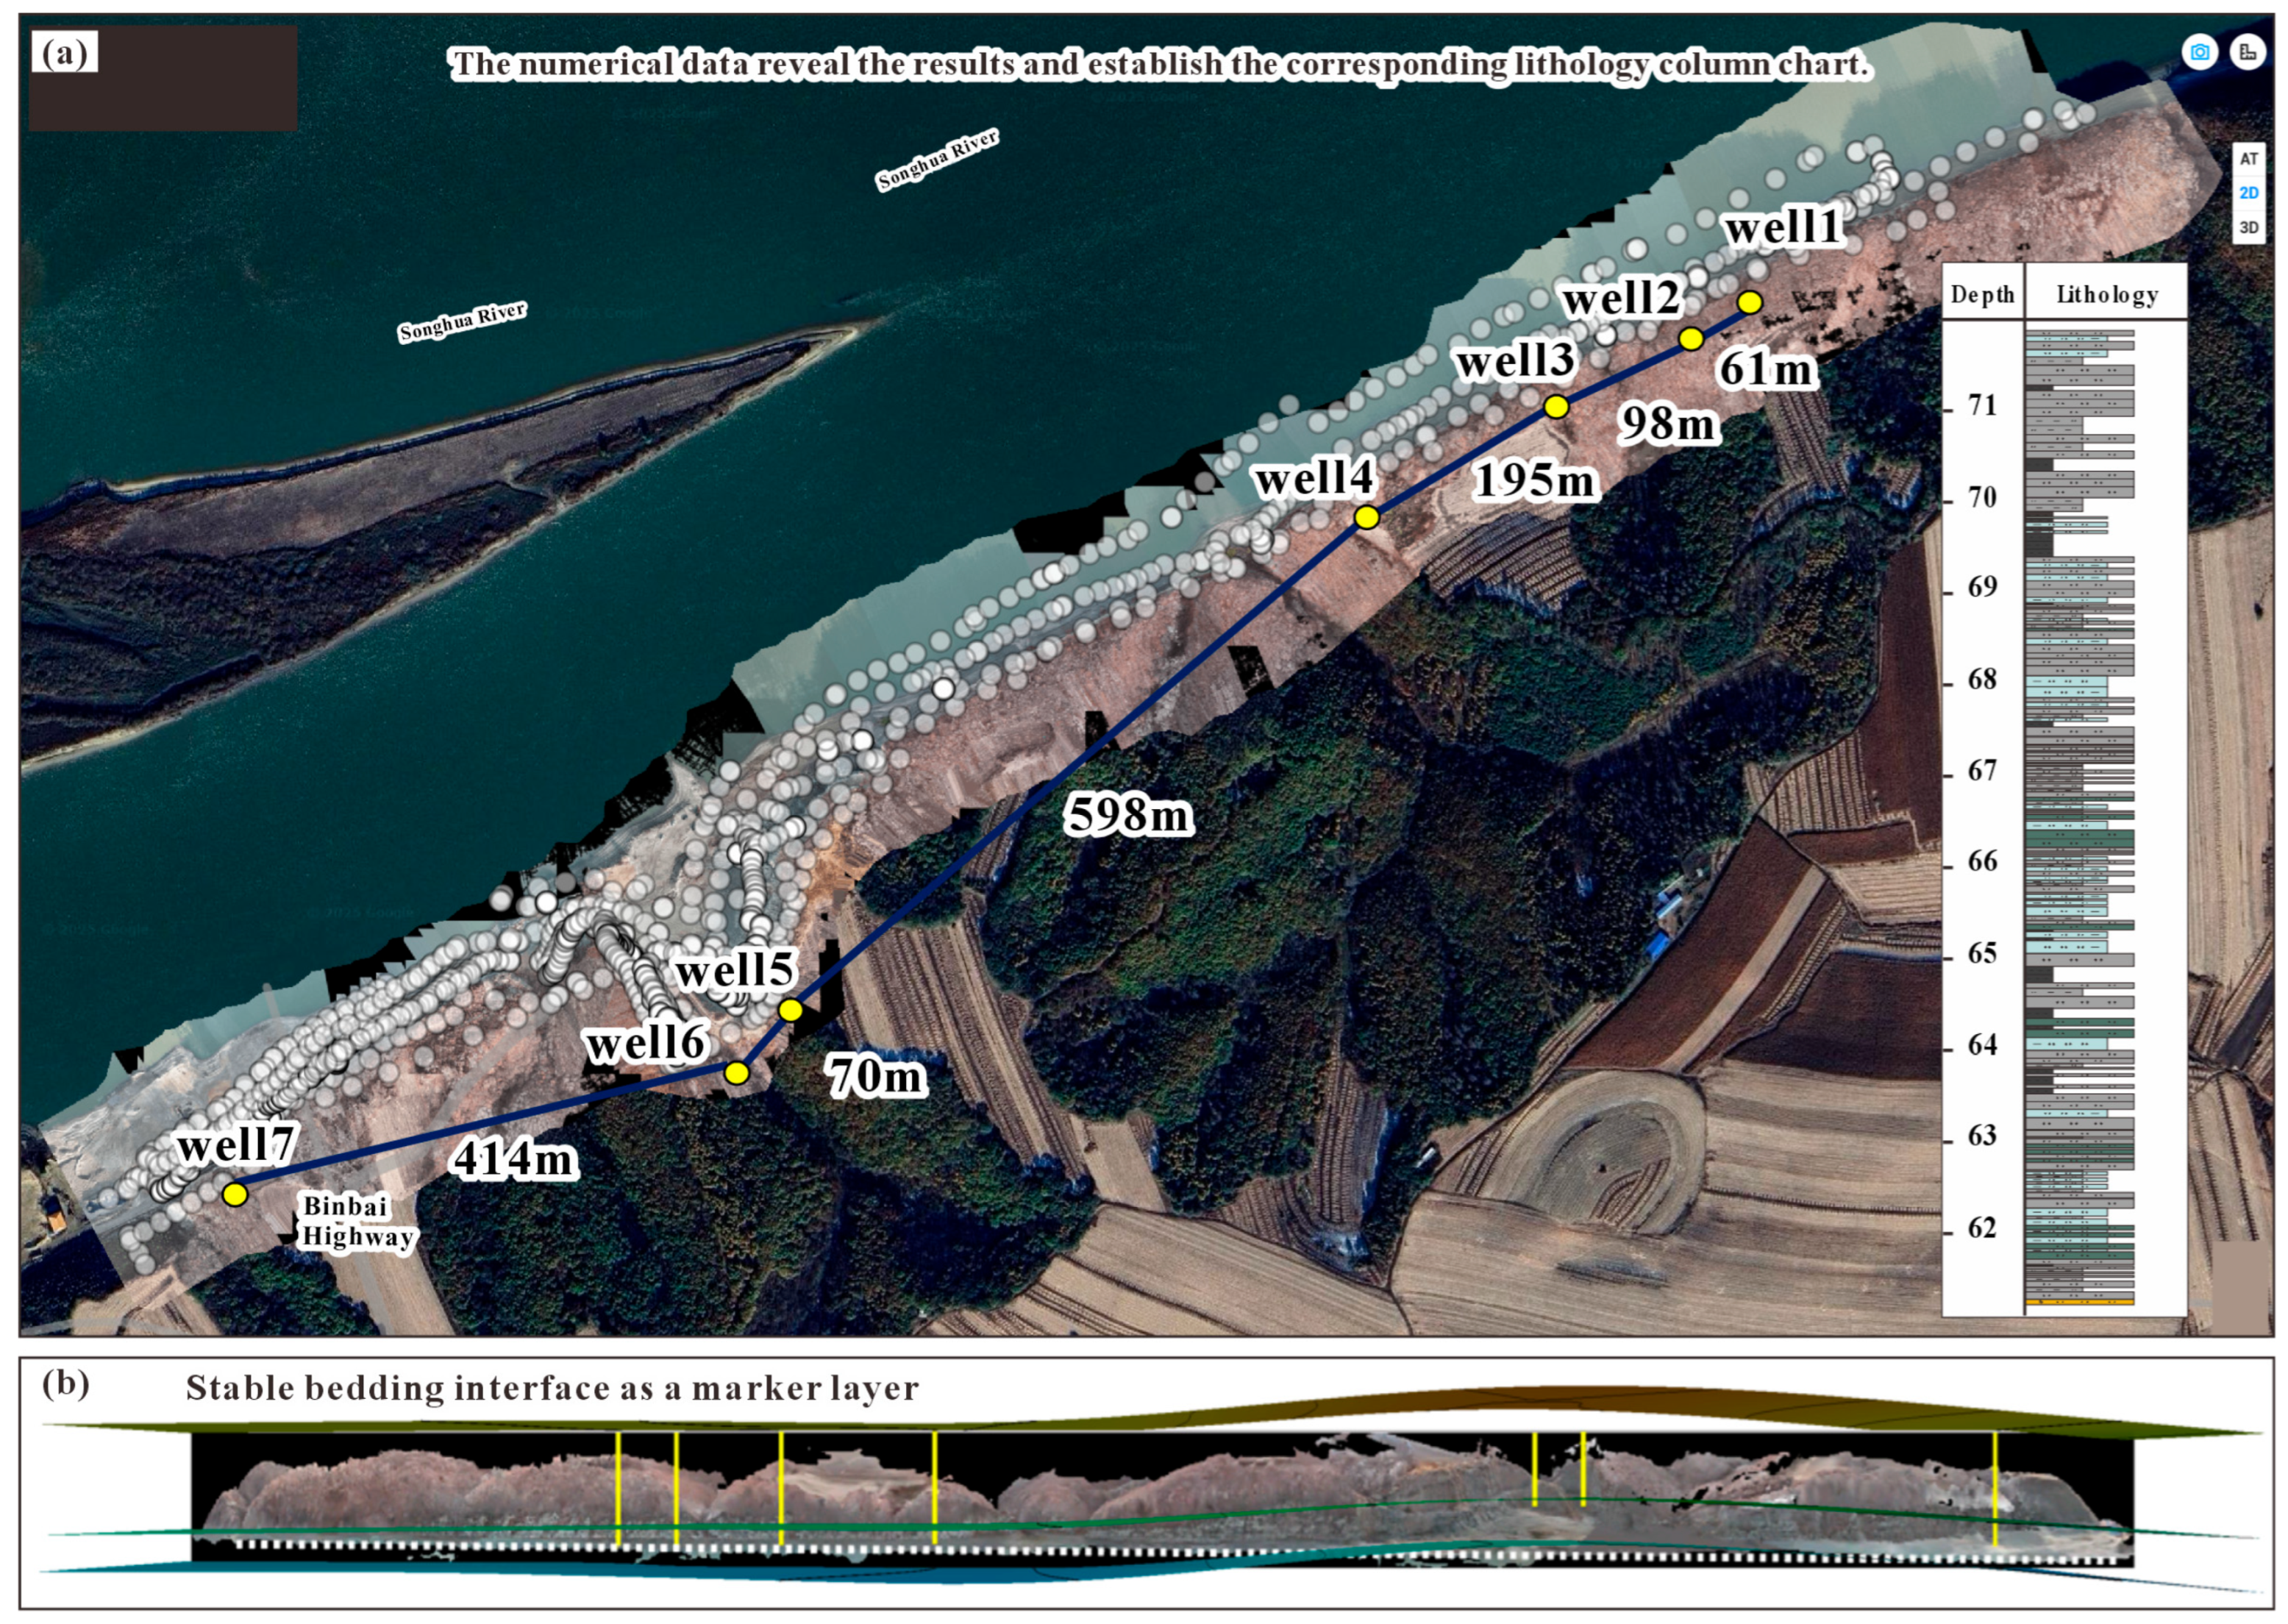
To ensure consistency and comparability of interpretation results across virtual wells, a unified lithological classification scheme was first established. Based on rock color, grain size, and sedimentary structures, seven lithotypes were identified: black mudstone, dark-gray silty mudstone, gray siltstone, greenish-gray argillaceous siltstone, brownish-gray siltstone, yellow siltstone, and rusty-yellow ferruginous siltstone. Under this unified classification system, each virtual well was interpreted layer by layer, with detailed documentation of lithological type, bed thickness variation, bedding structure, lamina assemblages, and characteristic sedimentary structures, yielding standardized digital lithological columns that provide a consistent data foundation for outcrop-scale stratigraphic correlation (Figure 6).
Figure 6.
Shale section interpretation. (a) Lithological log of Well 1 derived from digital outcrop interpretation. (b) Stable bedding surfaces serving as marker beds. The yellow vertical lines indicate the positions of the seven virtual wells.
Following virtual well construction, a regionally persistent key horizon—the rusty-yellow ferruginous siltstone layer—was selected as a marker bed for virtual well correlation [28,29]. By continuously tracking the spatial extent of this marker bed across all virtual wells, an outcrop-scale stratigraphic framework was established, enabling systematic identification of bed thickness variations, lithological pinch-outs, lamina assemblage transitions, and lateral evolutionary characteristics of key stratigraphic surfaces. Concurrently, lateral continuity analysis between virtual wells provided quantitative assessment of bedding extension distances, lamina continuity, and lithological variation patterns, delivering reliable stratigraphic constraints for subsequent 3D structural modeling and reservoir heterogeneity analysis.
3.5. 3D Structural Modeling and Heterogeneity Evaluation
Based on the digital interpretation results, a 3D structural model of the shale reservoir was constructed. First, primary and secondary bedding surfaces served as control horizons, and ordinary kriging interpolation [30,31,32] was employed to build a 3D bedding framework model, achieving spatially continuous representation of bedding surfaces. Subsequently, under bedding framework constraints, Sequential Indicator Simulation (SIS) [30,32,33] was applied, based on the spatial distribution characteristics of the seven lithotypes, to construct a 3D lithological probability model. Unlike continuous-variable interpolation, SIS preserves discrete boundaries and spatial continuity among different lithotypes, making it more suitable for simulating shale lithological spatial distributions. The final output comprises a 3D shale structural model integrating the bedding framework, lithological probability volumes, and fracture spatial information, providing a spatial basis for reservoir structural analysis and parameter extraction. Based on the 3D digital outcrop model, key parameters reflecting shale reservoir structural characteristics were extracted in batch mode, and a reservoir heterogeneity evaluation system was established.
4. Results
4.1. Digital Outcrop Model Reconstruction
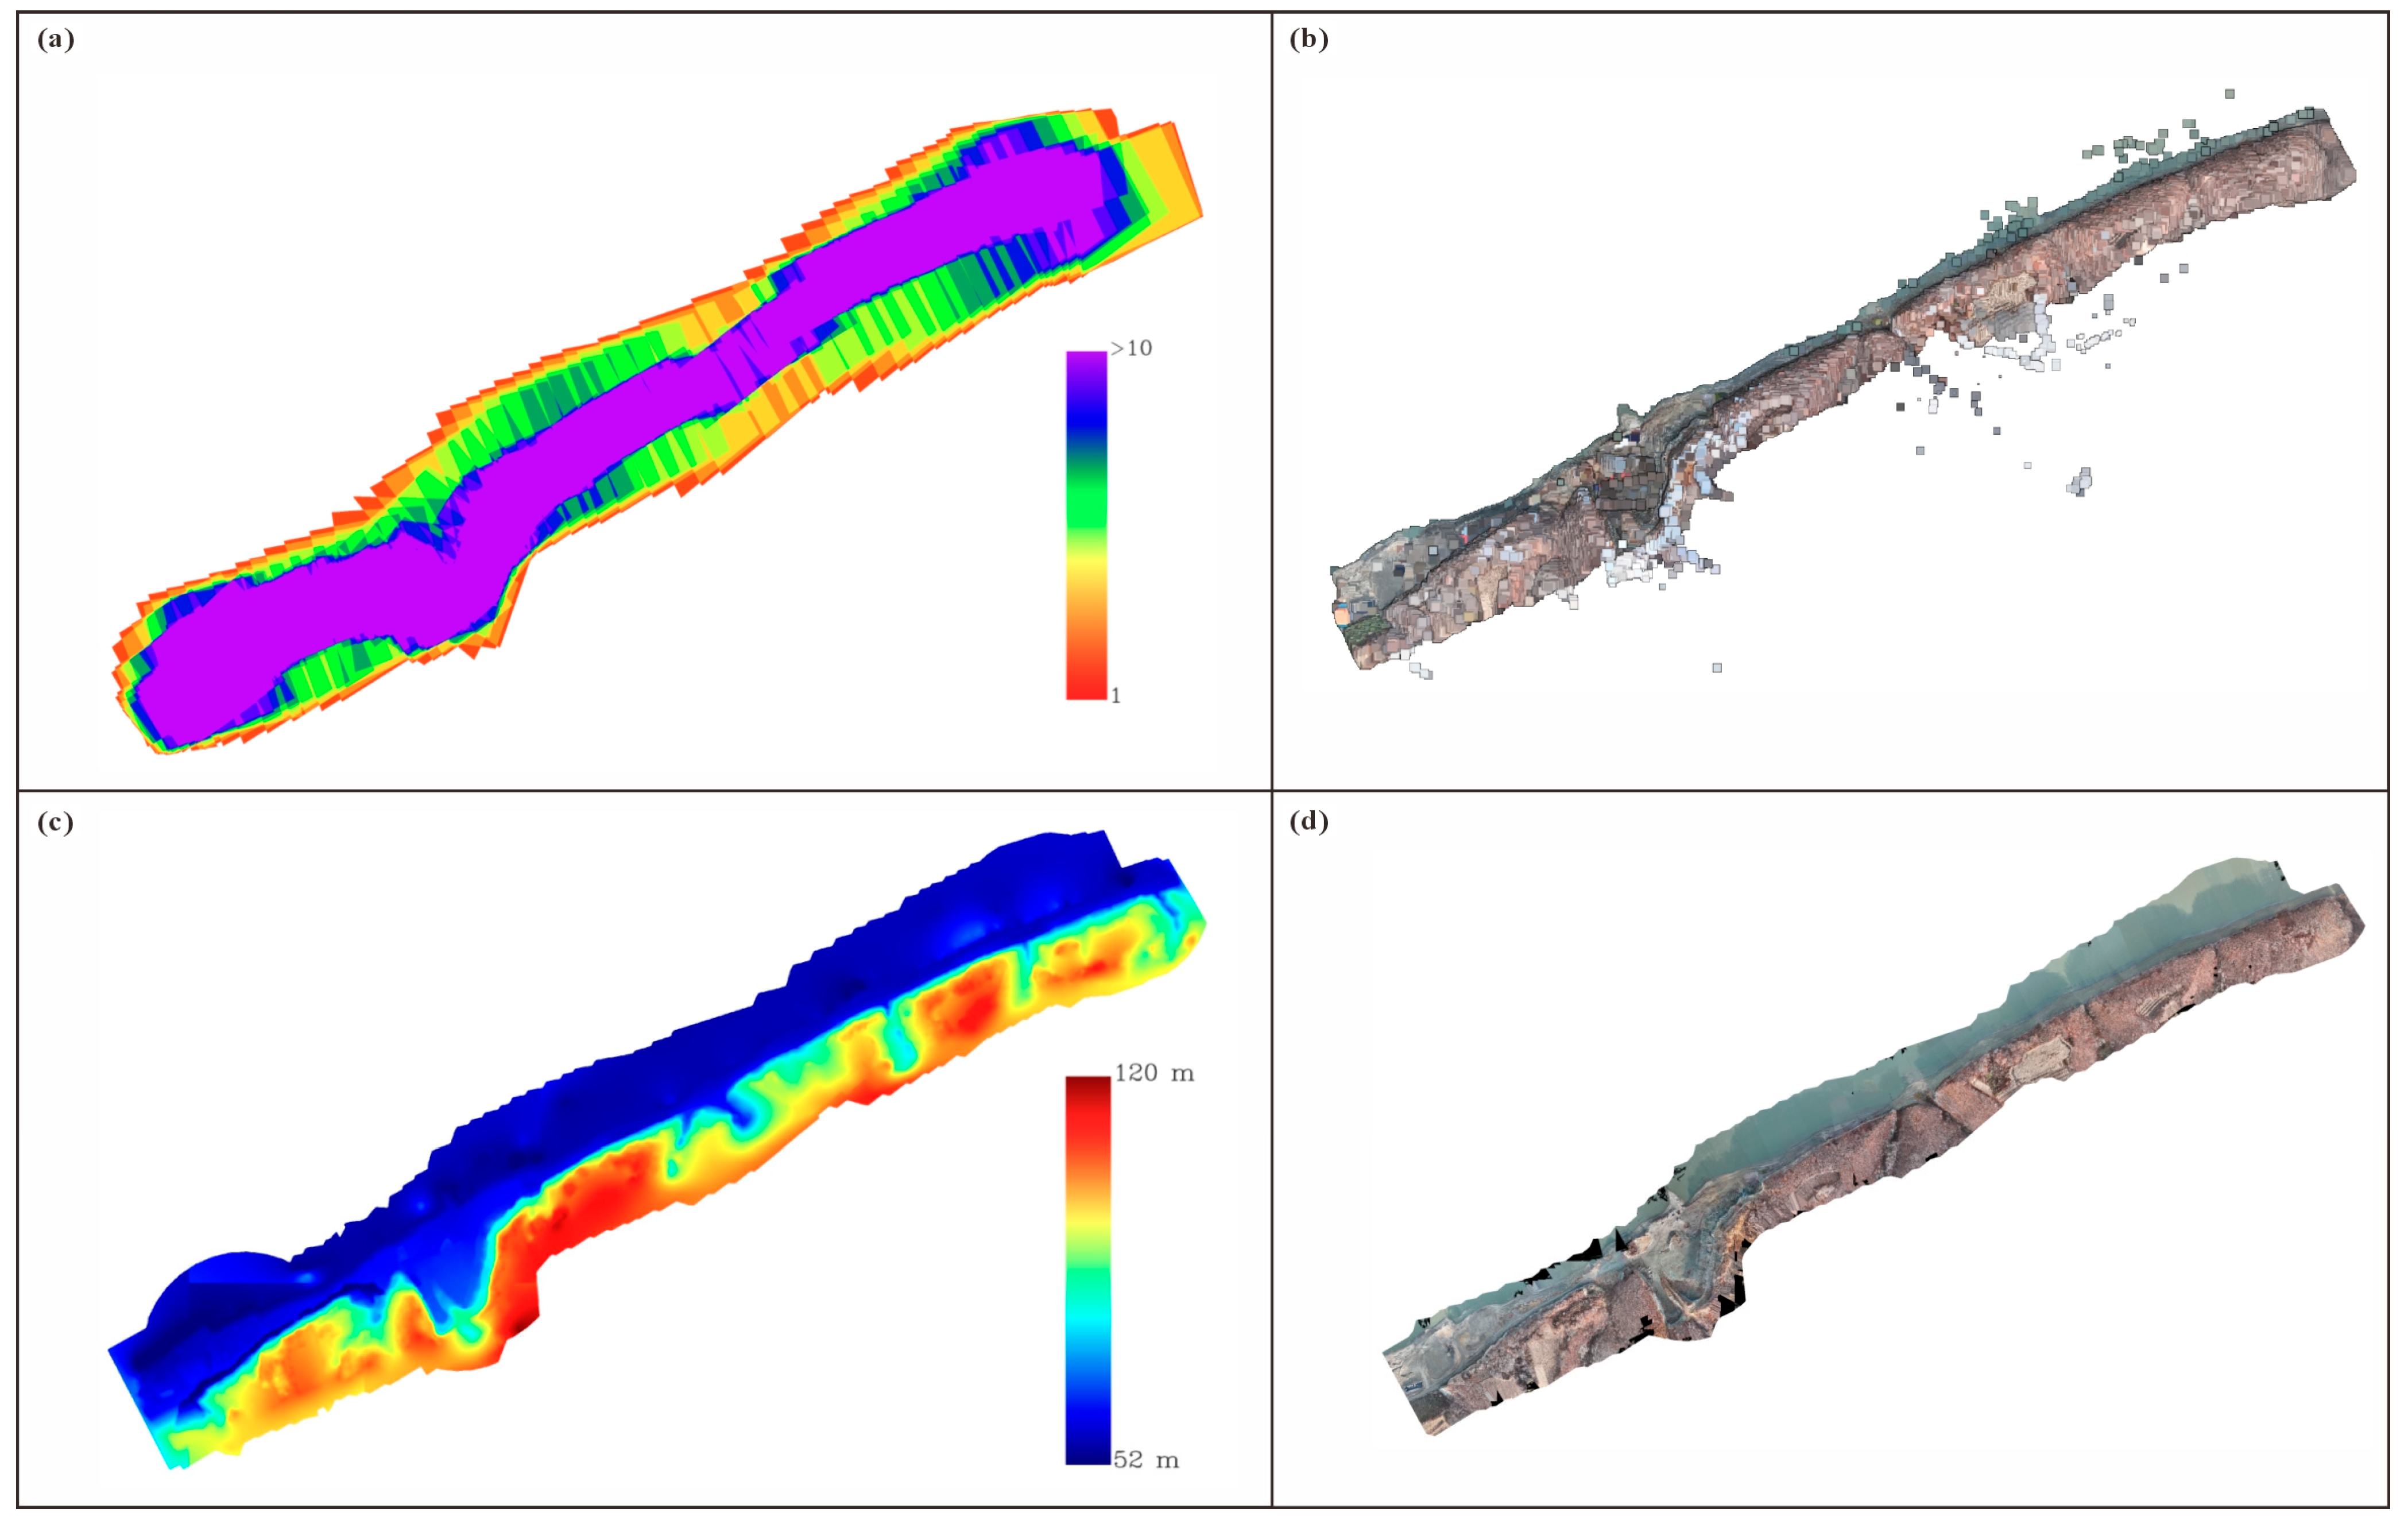
Applying the DSOM technical workflow, UAV oblique photogrammetry was conducted at Observation Point 1 of the Gulong Shale outcrop. A total of 1927 raw images were acquired, of which 1885 passed quality control and were used in 3D reconstruction. The resulting high-precision digital outcrop model covers an area of approximately 0.369 km2, providing a unified spatial reference framework for subsequent digital structural interpretation, virtual well construction, and 3D structural modeling. Photogrammetric results indicate a native ground sampling distance (GSD) of 0.649 cm/pixel, an orthomosaic spatial resolution of 2.58 cm/pixel, and a model elevation range of 52–120 m. Aerial triangulation yielded 712,396 tie points, with each tie point constrained by an average of 6.3 images. The reprojection error root-mean-square (RMS) was 1.021 pixels, corresponding to approximately 6.6 mm on the ground, indicating high internal geometric consistency of image matching and bundle adjustment. The georeferencing RMSE was 3.068 m, primarily governed by onboard GNSS positioning accuracy; notably, internal relative geometric precision substantially exceeded absolute positioning accuracy, satisfying the requirements for outcrop-scale bedding tracing, structural interpretation, and geometric measurement.
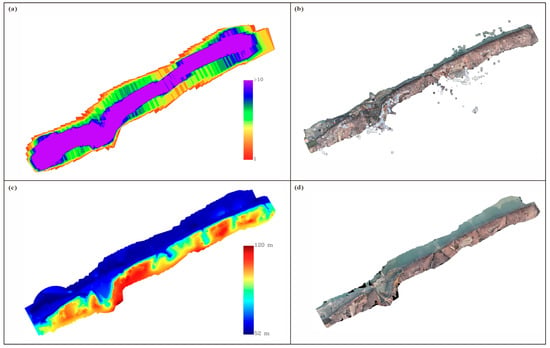
Following reconstruction, multiple data products were generated, including the digital outcrop model (DOM), digital surface model (DSM), digital elevation model (DEM), orthomosaic, and dense point cloud (Figure 7). The 3D digital outcrop model faithfully reproduces the overall geometric morphology of the outcrop while preserving detailed features such as bedding surfaces, lamina assemblages, and local fractures, providing a reliable data foundation for subsequent digital section extraction and structural interpretation. Compared with traditional field outcrop surveying, the digital outcrop model not only achieves permanent digital preservation of outcrop information but also establishes a unified spatial coordinate framework, enabling continuous tracking and quantitative analysis of outcrop structure within a common reference system. Based on this model, further digital section extraction, virtual well construction, virtual well correlation, and 3D structural modeling can be conducted, enabling the conversion of outcrop geometric information into reservoir structural information and providing robust data support for multi-scale structural characterization of shale reservoirs.
Figure 7.
Digital outcrop reconstruction results. (a) Overview of UAV aerial survey scene overlap. (b) Dense point cloud. (c) Digital Elevation Model (DEM). (d) Orthomosaic.
4.2. Digital Structural Interpretation of Shale
During digital section interpretation, the rusty-yellow ferruginous siltstone layer—exhibiting the best lateral continuity and stability across the study area—was selected as a regional marker bed and served as the datum for virtual well correlation. This marker bed displayed excellent traceability in all virtual wells, enabling reliable identification and continuous correlation, and thus providing robust constraints for outcrop-scale stratigraphic subdivision and framework establishment. Based on lateral tracing results of the marker bed, the study succession was divided into two intervals: above the marker bed and below the marker bed, and the areal proportions of the seven lithotypes were statistically determined for each interval.
Results show that the interval above the marker bed is dominated by muddy deposits with relatively low siltstone content. Black mudstone and dark-gray silty mudstone account for 26.54% and 26.30% of the total area, respectively, collectively reaching 52.84%. Gray siltstone and greenish-gray argillaceous siltstone account for 22.65% and 19.59%, respectively, whereas brownish-gray siltstone (2.45%), yellow siltstone (2.39%), and rusty-yellow ferruginous siltstone (0.07%) represent minor components. These proportions indicate that the section above the marker bed is characterized by an overall lithological assemblage dominated by fine-grained muddy deposits.
In contrast, the interval below the marker bed exhibits a marked increase in silt-grade components accompanied by a relative decline in muddy deposits. Gray siltstone accounts for 32.78% and constitutes the dominant lithotype of this interval. Greenish-gray argillaceous siltstone and dark-gray silty mudstone account for 21.11% and 21.28%, respectively, while black mudstone accounts for 19.07%. Additionally, brownish-gray siltstone, yellow siltstone, and rusty-yellow ferruginous siltstone account for 2.96%, 1.01%, and 1.78%, respectively. Overall, the interval below the marker bed exhibits a higher proportion of silty components and a coarser lithological assemblage compared with the overlying interval.
Comparative analysis reveals a distinct lithological contrast across the marker bed. In the interval above the marker bed, the cumulative proportion of black mudstone and dark-gray silty mudstone exceeds 50%, indicating muddy depositional dominance. In the interval below the marker bed, the proportion of gray siltstone increases by approximately 10 percentage points (from 22.65% to 32.78%), while the black mudstone proportion decreases by approximately 7 percentage points (from 26.54% to 19.07%). This vertical lithological evolution from silt-dominated deposition below to mud-dominated deposition above reflects a progressive transition in the depositional environment from relatively high-energy to low-energy conditions. Furthermore, these observations confirm that the rusty-yellow ferruginous siltstone layer possesses not only excellent lateral continuity but also serves as a key marker bed for distinguishing distinct lithological assemblages and depositional cycles.
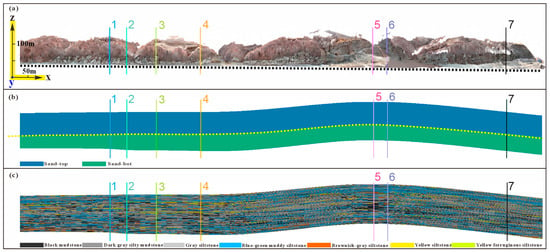
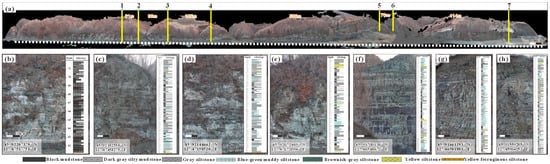
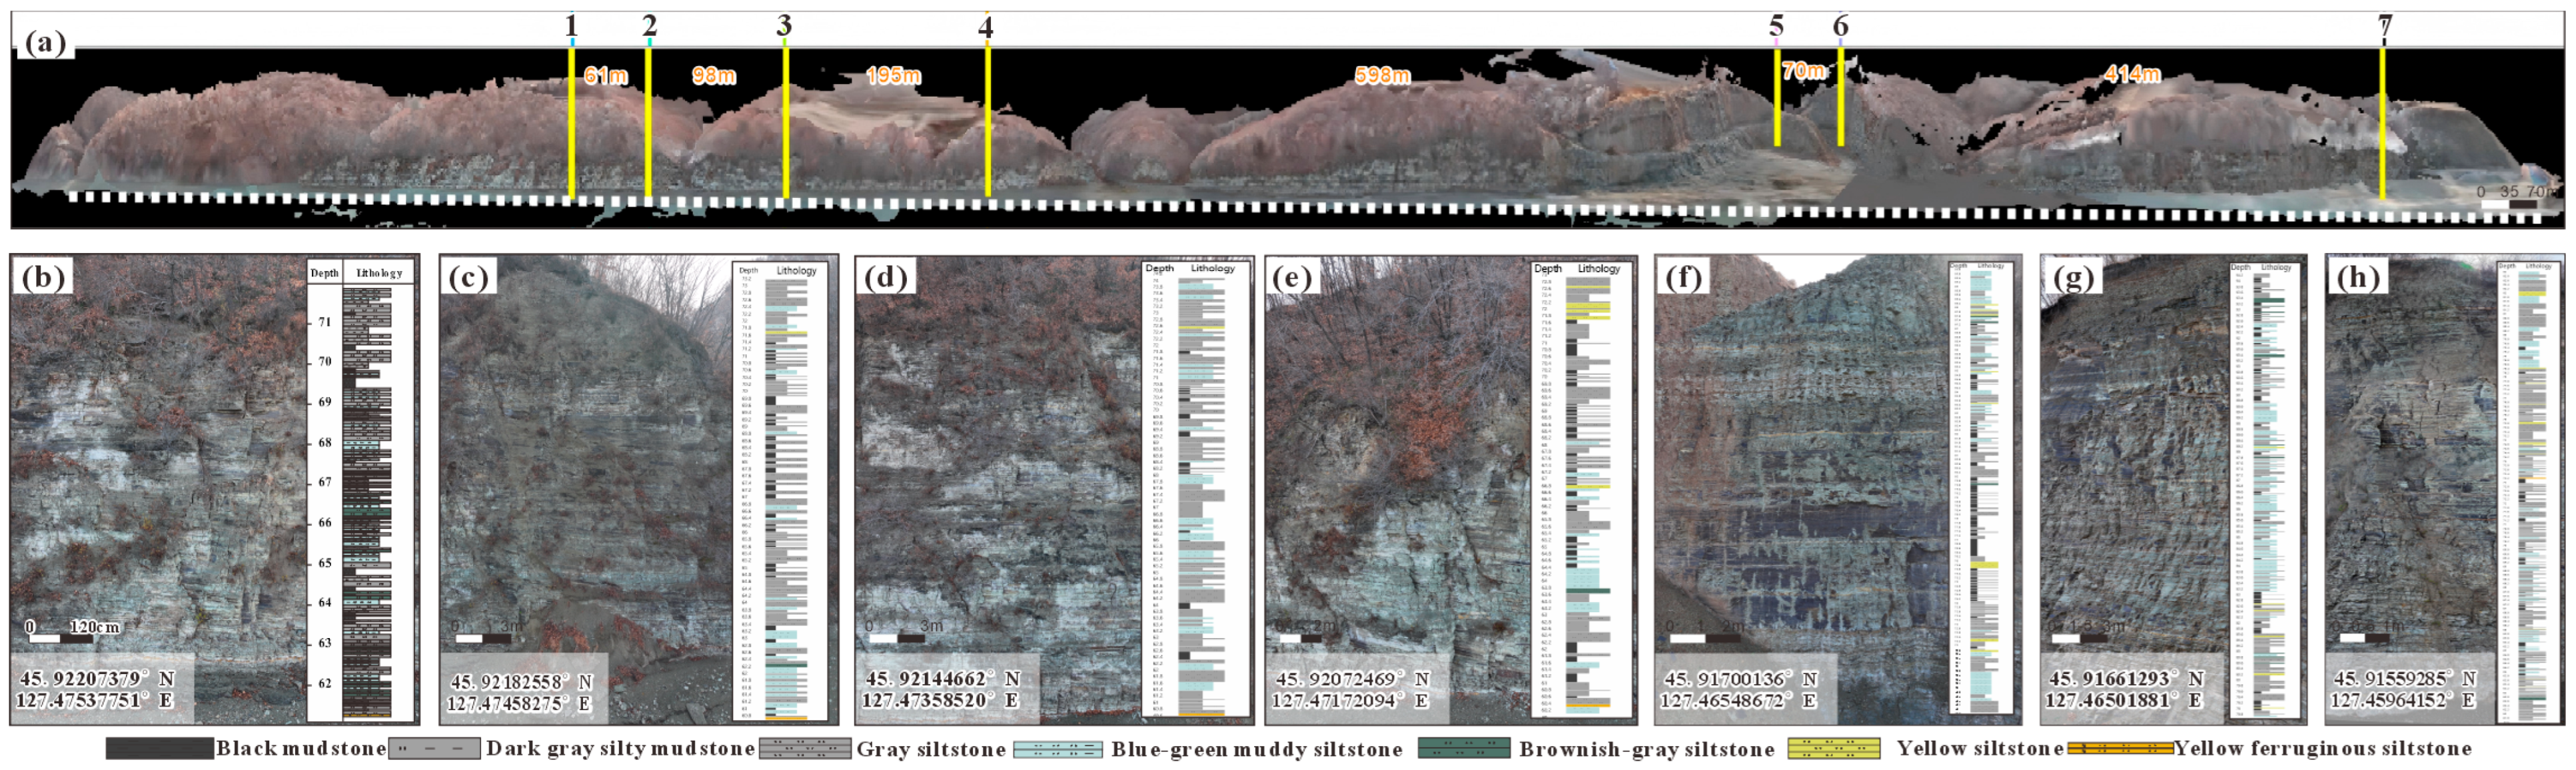
The outcrop-scale stratigraphic framework established through virtual well correlation further enabled identification of lateral variations in bed thickness, lithological pinch-outs, and lamina assemblage transitions (Figure 8), providing reliable stratigraphic constraints for subsequent 3D structural modeling and reservoir heterogeneity evaluation.
Figure 8.
Digital structural interpretation of shale. (a) Relative positions of the seven virtual wells. (b–h) Section characteristics and lithological features of each virtual well.
4.3. Three-Dimensional Structural Modeling
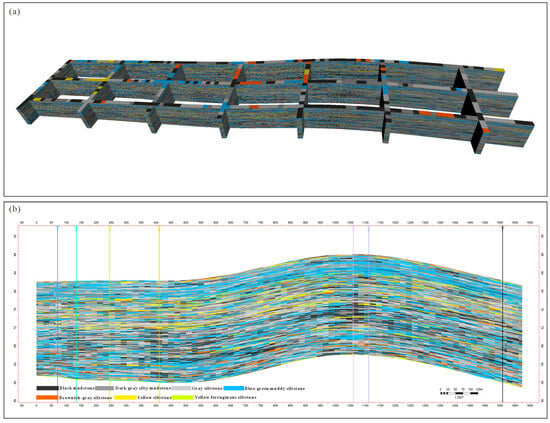
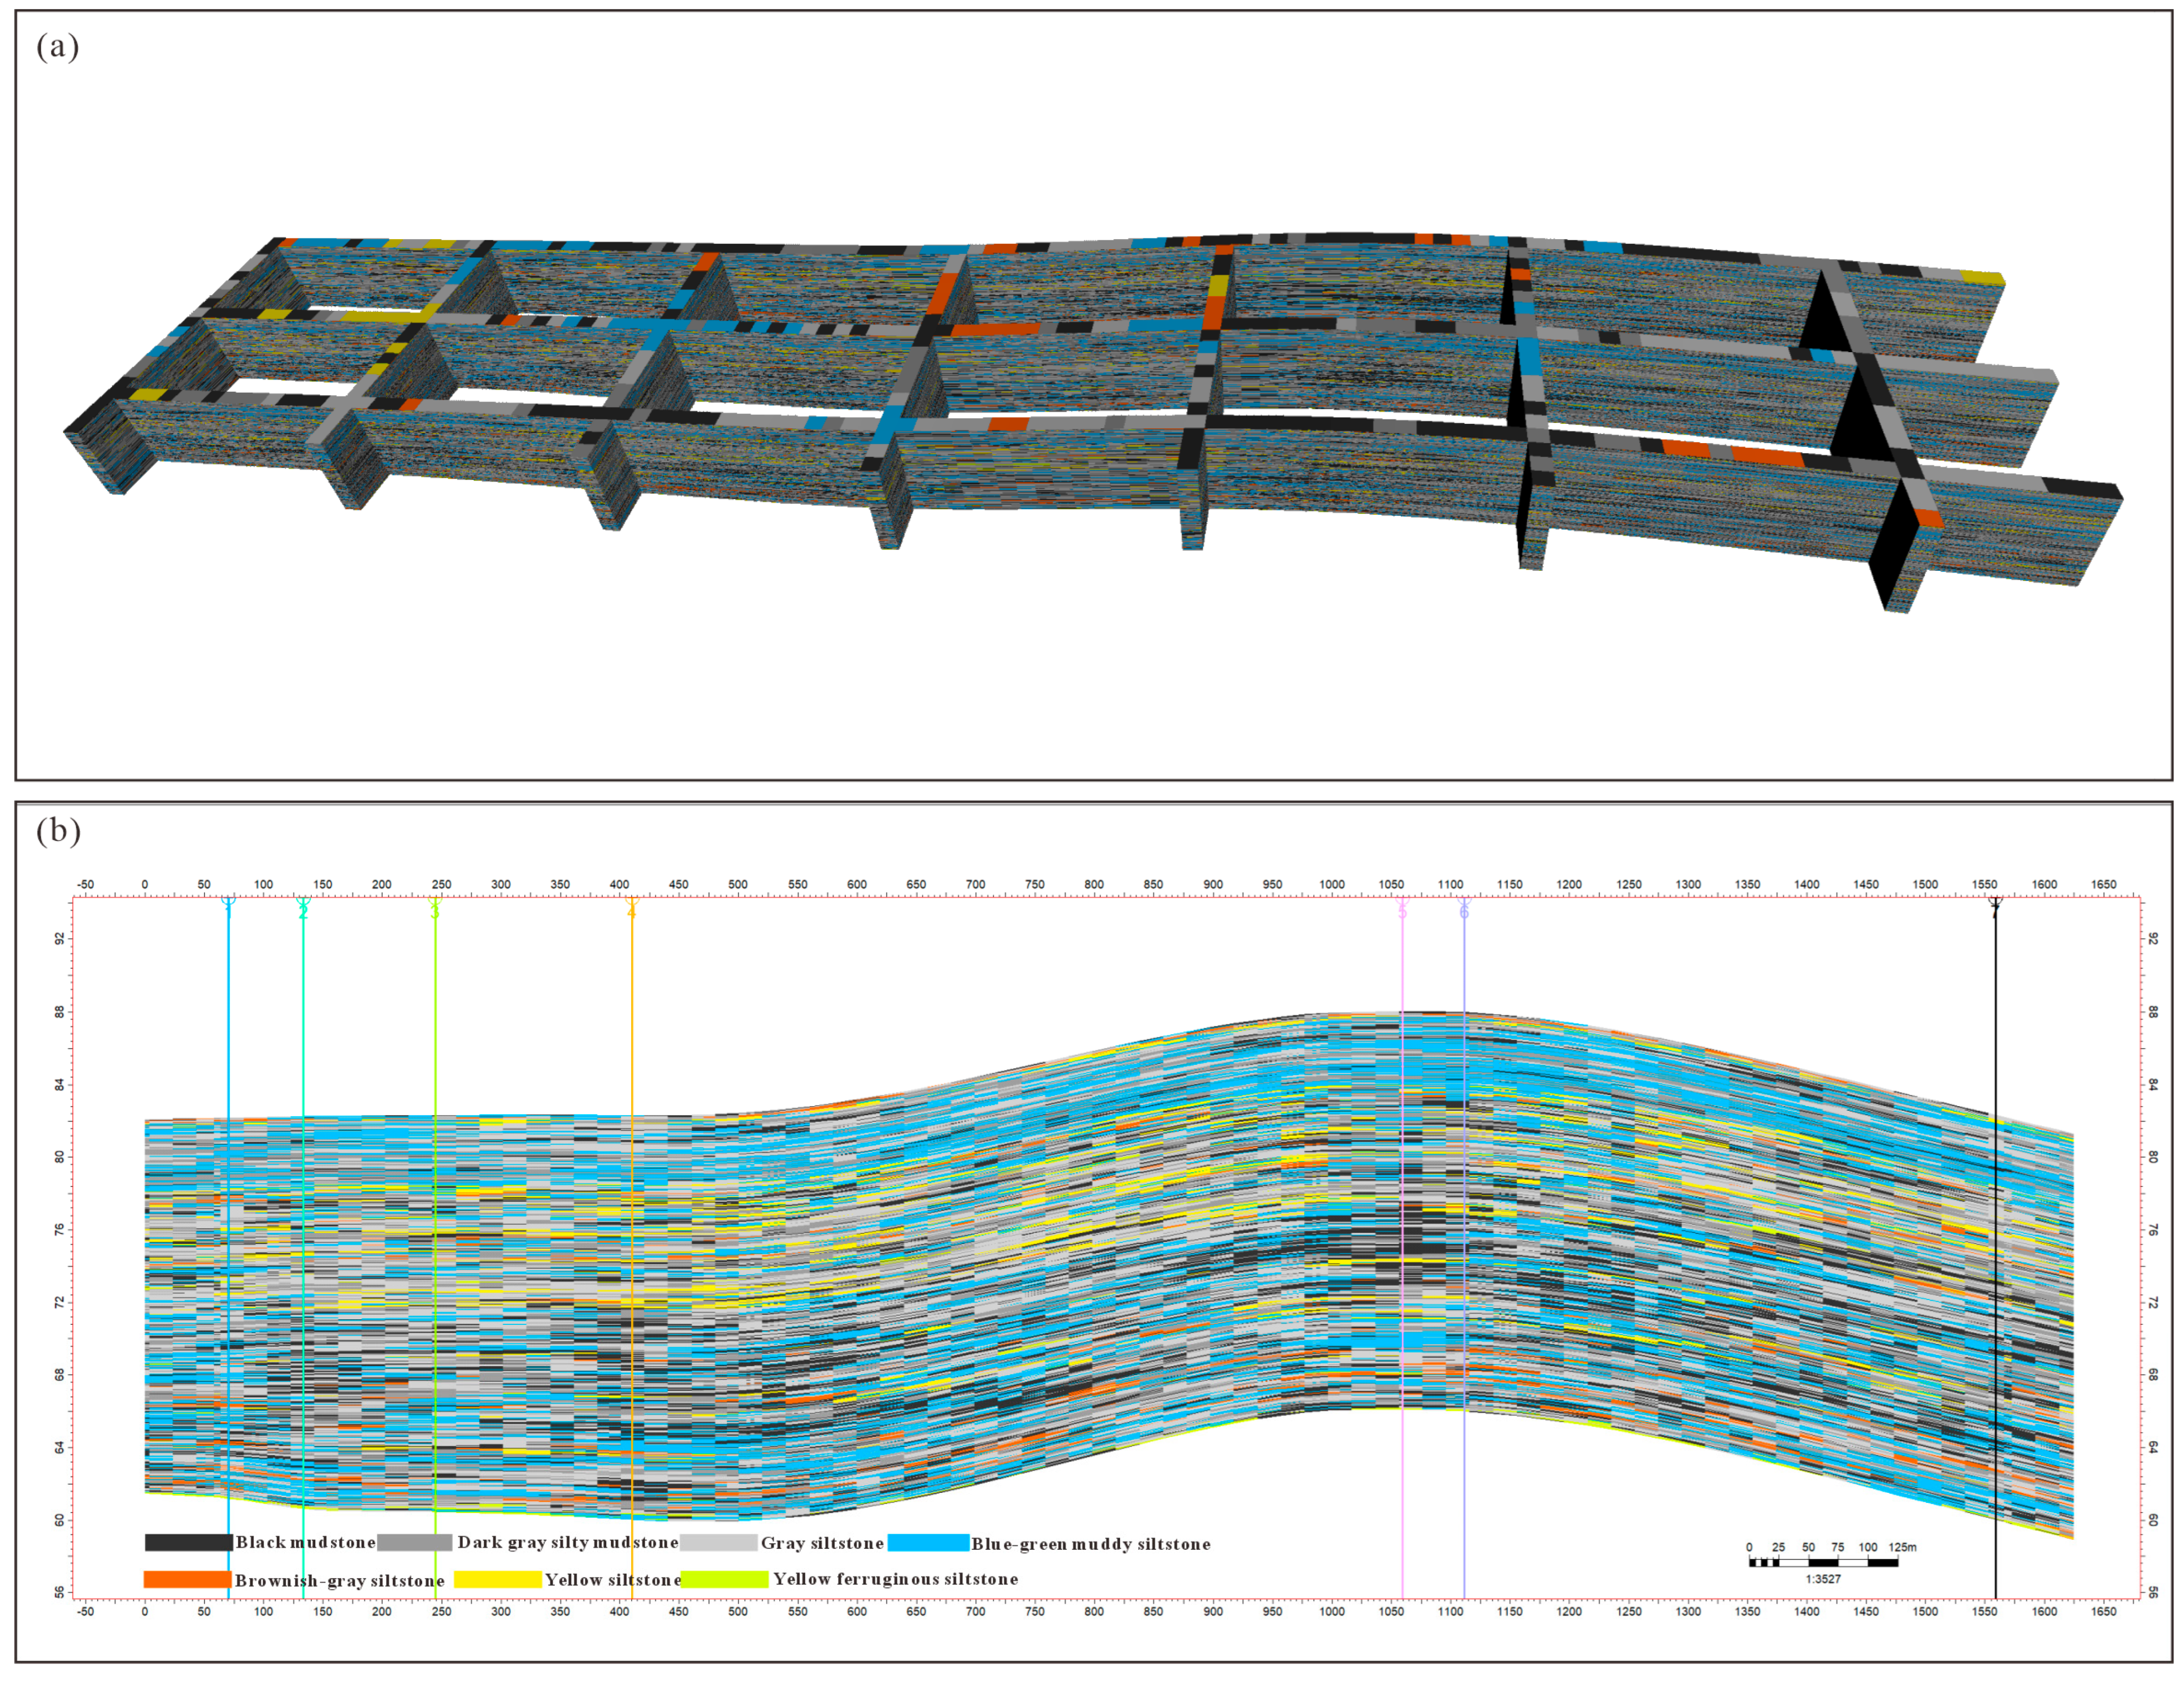
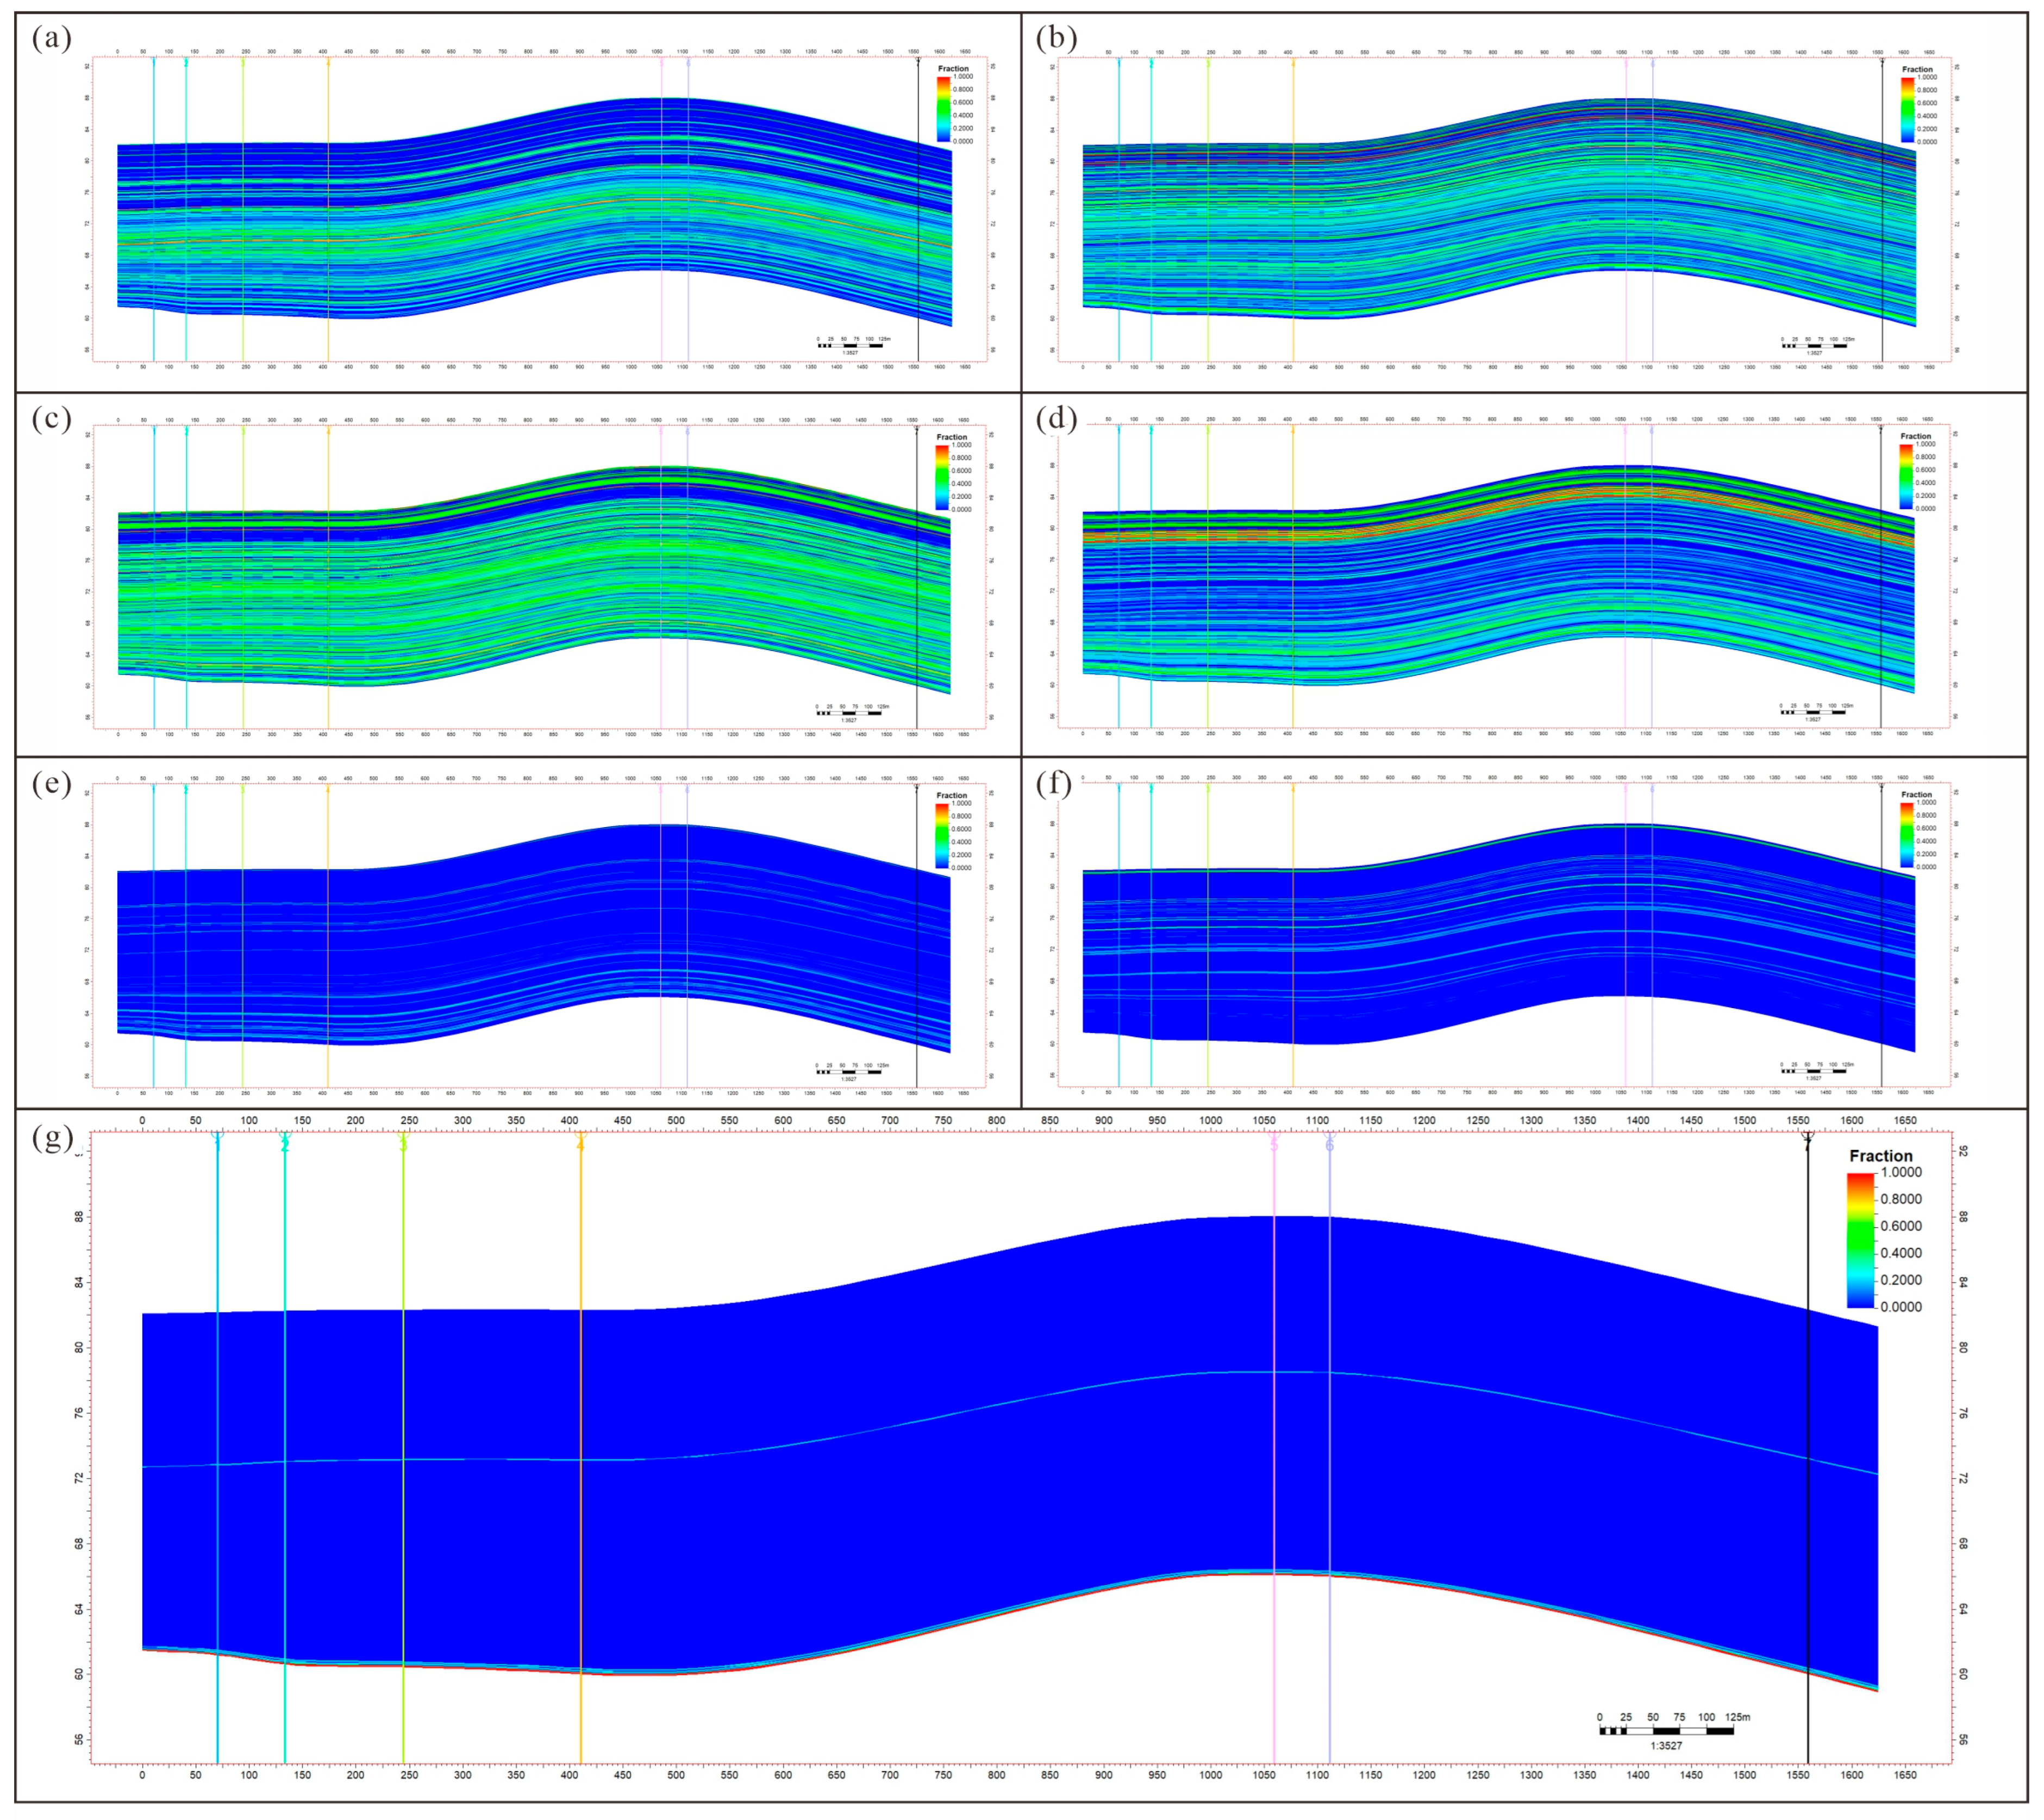
Based on digital interpretation results, primary and secondary bedding surfaces were used as constraining horizons to build a 3D bedding framework model. This model effectively restores outcrop-scale bedding spatial geometric relationships and enables continuous representation of bedding lateral extension, spacing variations, and local undulation characteristics. Under bedding framework constraints and according to the spatial distribution characteristics of the seven lithotypes, SIS was employed to construct 3D lithological probability models. Modeling results indicate that different lithotypes exhibit distinctly different spatial continuity patterns. Integrating lithological data with analytical measurements, organic-rich laminae display predominantly layer-controlled continuous distribution and maintain good correspondence with high-TOC intervals. Carbonate-rich laminae exhibit relatively poor continuity, typically occurring as localized lenticular bodies. Clay-rich laminae display the highest continuity and constitute the continuous reservoir matrix background. The 3D lithological probability models achieve quantitative representation of the spatial occurrence and lateral variability of different lithotypes under bedding constraints (Figure 9 and Figure 10).
Figure 9.
3D structural modeling of the shale section. (a) 3D bedding framework model. (b) Lithological model cross-section through wells.
Figure 10.
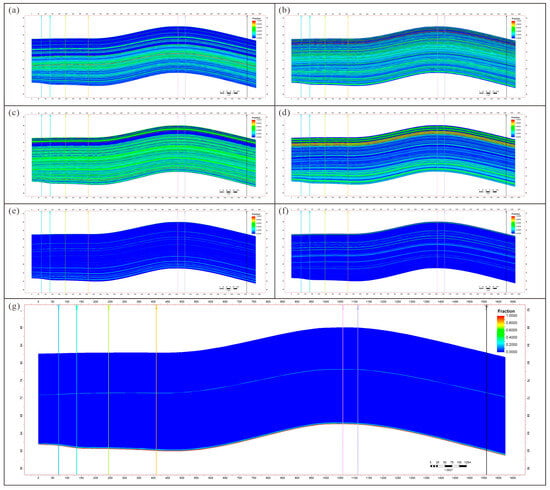
Spatial probability volumes of individual lithotypes derived from 3D lithological probability modeling. (a) Black mudstone. (b) Dark-gray silty mudstone. (c) Gray siltstone. (d) Greenish-gray argillaceous siltstone. (e) Brownish-gray siltstone. (f) Yellow siltstone. (g) Rusty-yellow ferruginous siltstone. The colored vertical lines in all panels indicate the locations of the seven virtual wells.
4.4. Quantitative Structural Characterization
Using the seven virtual wells as conditioning data, Sequential Indicator Simulation (SIS) was applied to construct three-dimensional (3D) probability models for the spatial distribution of the seven lithotypes, generating individual probability volumes for each lithology (Figure 10). In these models, the colored vertical bars represent the virtual well locations, where lithological columns interpreted from the digital sections serve as conditioning data, whereas the surrounding volumes represent the simulated occurrence probabilities of each lithotype. Warm colors indicate high occurrence probabilities, whereas cool colors represent low probabilities.
To quantitatively evaluate the reliability of the simulated lithological probability models, a leave-one-well-out (LWOO) cross-validation procedure was performed. During each of the seven validation iterations, one virtual well was excluded from the conditioning dataset, and the SIS model was reconstructed using the remaining six wells. The predicted lithological probabilities at the excluded well location were subsequently compared with the interpreted lithological column. The average prediction accuracy reached 78.3%, with individual validation accuracies ranging from 72.1% to 84.6%. Among the seven lithotypes, black mudstone and gray siltstone achieved the highest prediction accuracies (82.5% and 80.1%, respectively), reflecting their relatively large volumetric proportions and excellent bedding-parallel continuity. In contrast, brownish-gray siltstone, yellow siltstone, and rusty-yellow ferruginous siltstone exhibited lower prediction accuracies (55.2–67.8%), which is consistent with their localized distribution and thin-bedded occurrence. Overall, the validation results demonstrate that the SIS models reliably reproduce the first-order spatial architecture of the dominant lithotypes while providing a quantitative estimate of prediction uncertainty for relatively rare lithologies.
The validated probability models reveal that all lithotypes exhibit pronounced bedding-controlled distribution patterns, with their spatial occurrence largely constrained by stratigraphic surfaces and characterized by strong lateral continuity along bedding. Owing to gentle structural uplift, the probability volumes display a slightly inclined and undulating geometry, producing a broad arch-shaped configuration in the central part of the outcrop. Different lithotypes exhibit distinct spatial continuity and development scales. Black mudstone and dark-gray silty mudstone are widely distributed and laterally continuous, constituting the dominant lithologies of the shale succession. Gray siltstone and greenish-gray argillaceous siltstone also occur as laterally continuous stratified units but exhibit localized thickness variations and gradual lateral facies transitions, reflecting subtle depositional heterogeneity in the silt-grade fraction. In comparison, brownish-gray siltstone, yellow siltstone, and rusty-yellow ferruginous siltstone show much more restricted spatial distributions, occurring mainly as localized thin-bedded intervals with relatively low occurrence probabilities, suggesting that these lithologies primarily function as local interbeds or marker horizons.
Despite representing the smallest volumetric proportion among all lithotypes, the rusty-yellow ferruginous siltstone exhibits excellent lateral continuity across all seven virtual wells, making it an effective regional marker bed for stratigraphic correlation. The stratigraphic framework established using this marker horizon effectively constrains the spatial relationships among different lithotypes, enabling the probability models to reproduce continuous three-dimensional lithological variations, lateral facies transitions, and bed-thickness changes. Consequently, the resulting 3D probability models provide a robust geological framework for subsequent quantitative reservoir characterization, including structural parameter extraction and heterogeneity evaluation.
5. Discussion
5.1. Geological Significance of Digital Outcrops in Multi-Scale Shale Reservoir Characterization
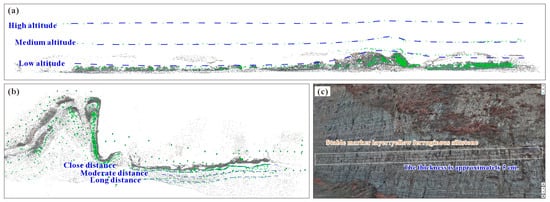
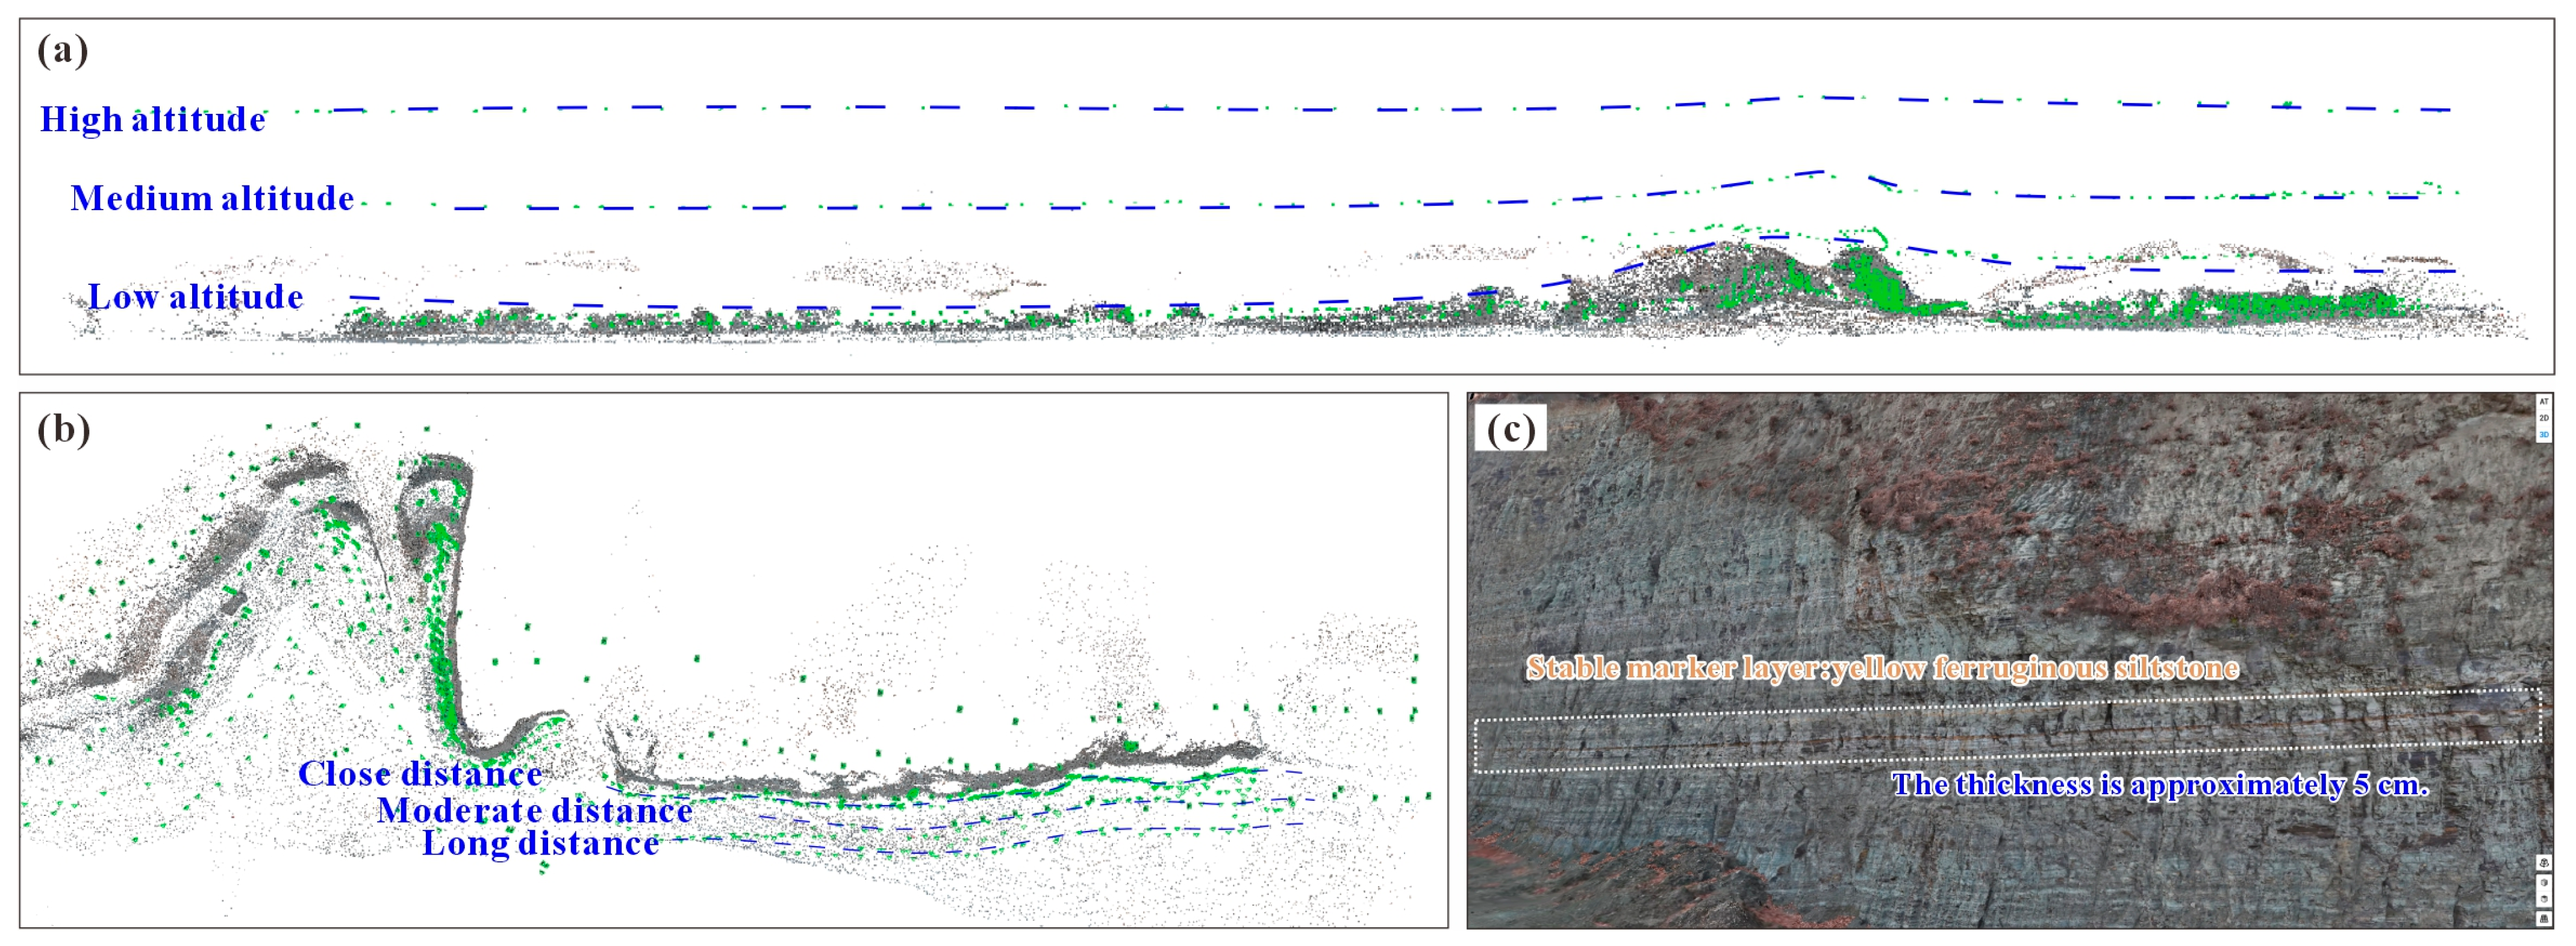
Shale reservoirs exhibit characteristic multi-scale heterogeneity. Reservoir quality is governed by the interplay of structural elements spanning millimeter-scale laminae, centimeter-scale bedding, meter-scale fracture networks, and larger-scale depositional architecture. However, current shale reservoir structural research relies predominantly on disparate datasets spanning multiple scales—including core, thin sections, scanning electron microscopy (SEM), CT scanning, and well logs [4,5,19,20]. Core and thin-section analyses can finely resolve mineral composition, lamina structure, and pore characteristics but are limited by sampling scale, making it difficult to capture bedding continuity and lateral lithological variability. Seismic data can provide regional-scale depositional frameworks but cannot resolve centimeter- to millimeter-scale fine structures within shale (Figure 11). Consequently, shale reservoir research has long faced a scale gap characterized by “high-resolution microscopic observation but insufficient macroscopic continuity”, hindering unified understanding of multi-scale reservoir architecture.
Figure 11.
High-precision characterization of shale outcrops. (a) Outcrop section planar information recorded at three altitudes (high, medium, low). (b) Outcrop section information recorded at three distances (near, medium, far). (c) Centimeter-scale geological information statistics enabled by the high-precision model.
The high-precision digital outcrop model established in this study effectively bridges the observational gap between core-scale and seismic-scale characterization. As demonstrated in Figure 7, UAV oblique photogrammetry combined with SfM photogrammetry can fully reconstruct hectometer-scale outcrop geometry while preserving centimeter-scale bedding surfaces, lamina assemblages, fractures, and other critical geological information. Further integration with digital section interpretation (Figure 8) enables continuous identification of different lithotypes, bedding surfaces, and marker beds, and the establishment of an outcrop-scale stratigraphic framework through virtual well correlation. Building on this foundation, 3D bedding framework models and lithological probability models (Figure 9 and Figure 10) achieve spatially continuous representation and quantitative prediction of lithological assemblages and bedding architecture. Compared with traditional field outcrop surveys, digital outcrops not only achieve permanent digital preservation of outcrop information but, more importantly, establish a unified spatial coordinate framework that enables integrated analysis of multi-scale geological information within a common reference system. The digital outcrop model enables continuous tracking of bedding extension, quantification of lithological variations, statistical analysis of lamina continuity, and further construction of 3D structural models, achieving the transition from 2D outcrop observation to 3D spatial characterization of shale reservoirs. In this sense, the digital outcrop serves not merely as a digital representation of outcrop geometry but as a critical bridge connecting core, outcrop, and subsurface reservoir data, providing a new technical pathway for multi-scale structural characterization of shale reservoirs. It should be noted that outcrops remain natural analogues of subsurface reservoirs, and localized fracture intensity and rock mechanical properties may differ from subsurface conditions owing to weathering, unloading, and tectonic uplift. Therefore, structural parameters derived from digital outcrops cannot be directly equated with subsurface reservoir parameters but should be integrated with core, well log, and experimental data for comprehensive calibration. For continental shales such as the Gulong Shale, which exhibit well-developed bedding and well-preserved outcrop exposures, digital outcrops can faithfully reflect bedding continuity and lithological spatial variability, thereby providing reliable geological constraints for subsurface reservoir structural modeling [8,9,10,11,34,35].
5.2. Comparative Analysis of DSOM and Conventional Digital Outcrop Modeling
Conventional Digital Outcrop Modeling (DOM) has been predominantly applied to fluvial, deltaic, and carbonate depositional systems [8,9,10], with geometric restoration of outcrop morphology and sedimentary architecture analysis as its core objectives. Accordingly, its technical workflow typically concludes at the “data acquisition–3D reconstruction–geological interpretation” stage [8,11,36], with the digital outcrop model serving primarily as a visualization product or a platform for sedimentary analysis. Shale reservoir research, however, focuses not on sedimentary body geometry but on multi-scale structural elements—bedding, laminae, lithological assemblages, and fracture networks—rendering conventional DOM inadequate for fine-scale shale reservoir characterization [4,5,6,37]. Table 3 presents a systematic comparison of conventional DOM and DSOM across eight dimensions.
Table 3.
Comparison of Traditional Digital Outcrop Modeling (DOM) and Digital Shale Outcrop Modeling Method (DSOM).
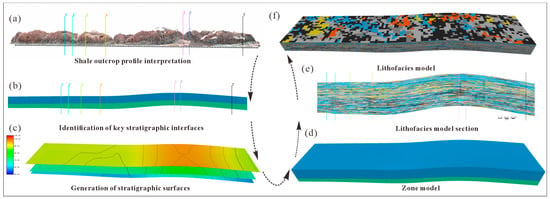
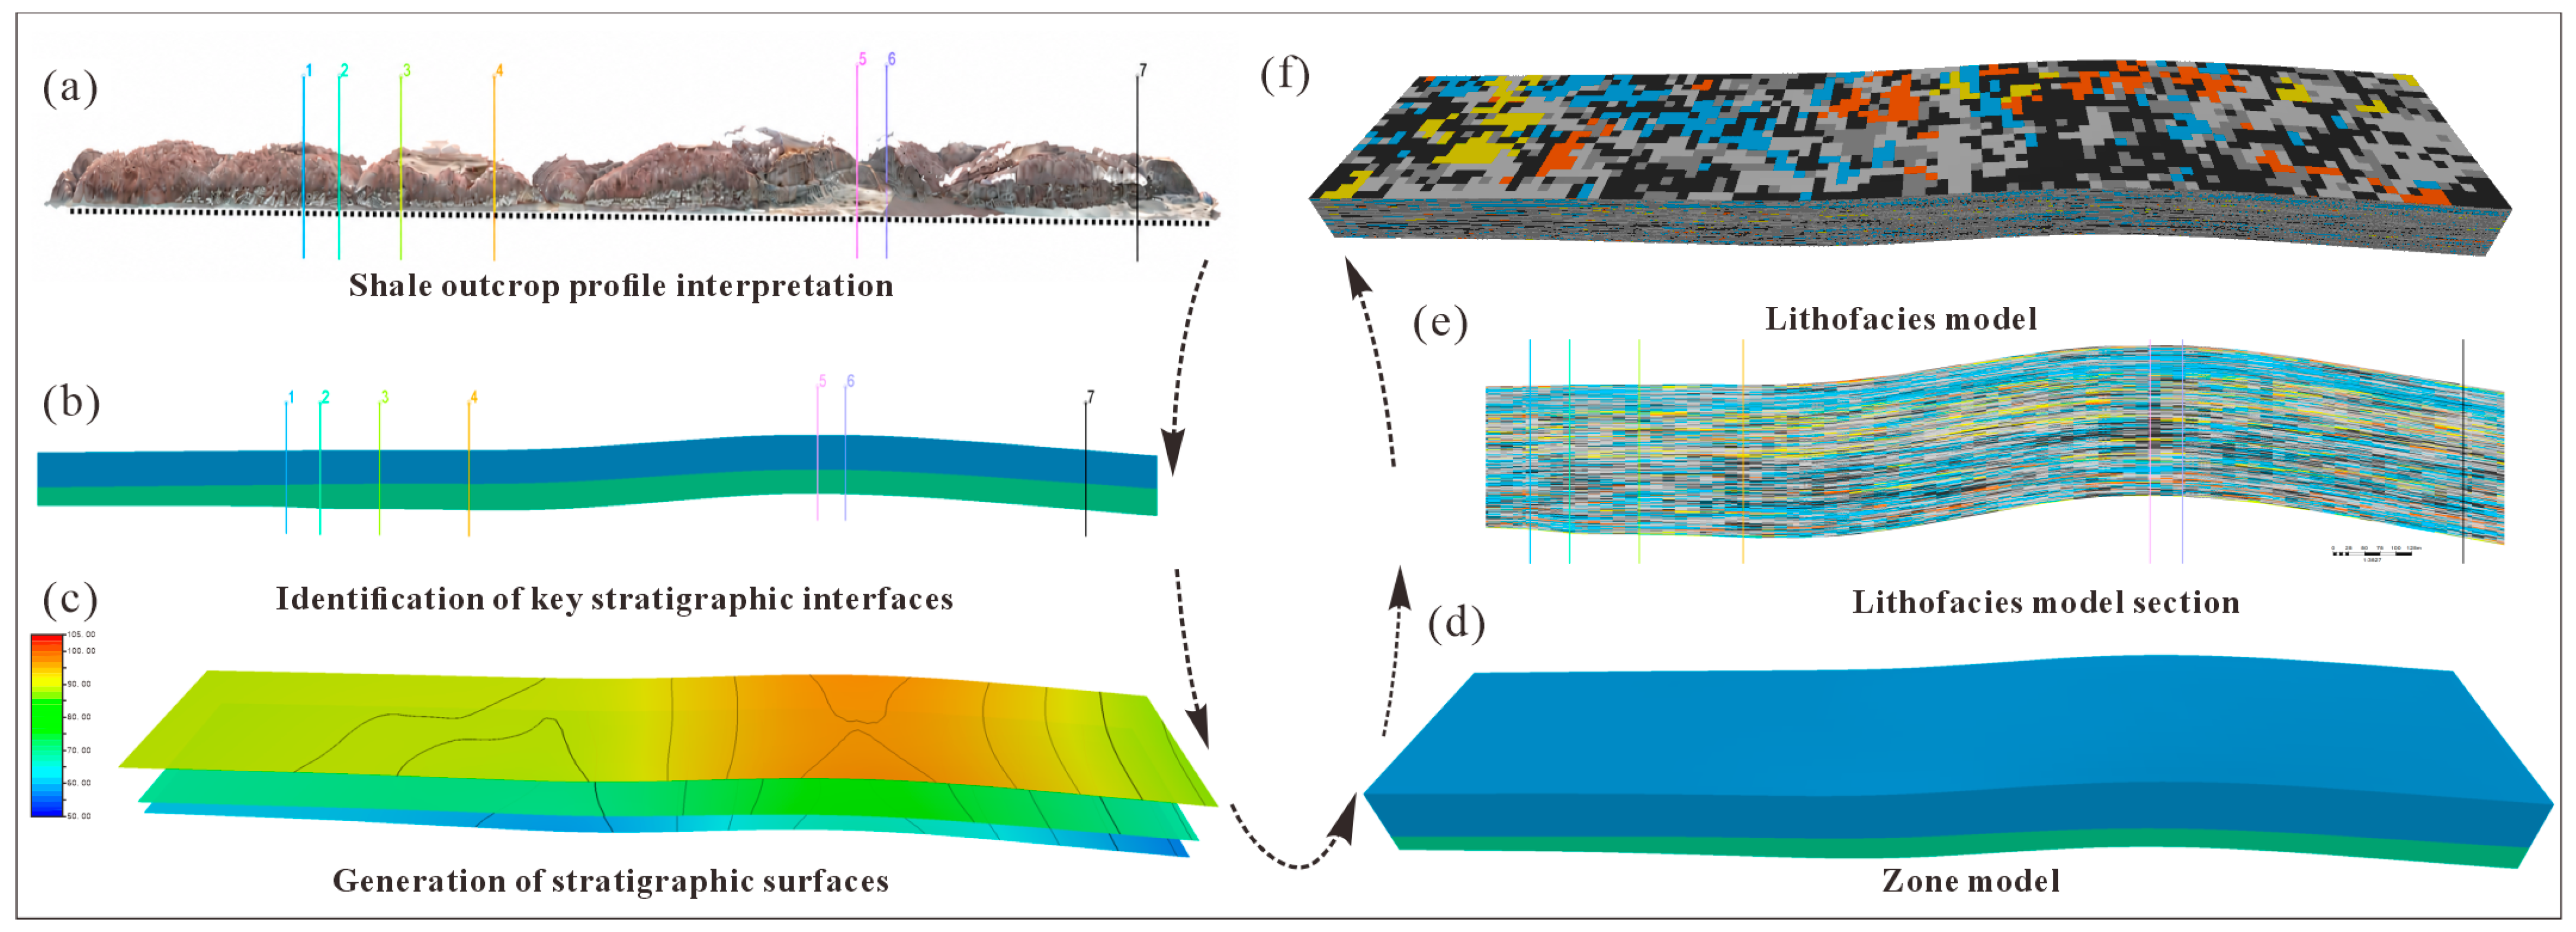
The DSOM method proposed in this study builds upon the strengths of conventional DOM while further constructing an integrated technical system oriented toward shale reservoir structural analysis. The most distinctive feature of DSOM, in contrast to conventional DOM, is that it treats the digital outcrop model as a platform for reservoir structural information representation rather than as a final deliverable. Following digital outcrop model construction, DSOM does not proceed directly to 3D interpretation; instead, it first extracts digital sections, establishes unified digital interpretation standards, and converts outcrop information into a data format comparable with subsurface well data through virtual well construction (Figure 11c). Virtual well correlation is then employed to establish an outcrop-scale stratigraphic framework, providing reliable constraints for subsequent 3D modeling. Figure 12 comprehensively illustrates the DSOM technical workflow. Starting from the digital outcrop model, progressive conversion of outcrop information into a 3D reservoir model is achieved through digital section interpretation, key horizon identification, stratigraphic surface establishment, zone model construction, lithofacies modeling, and 3D lithofacies model generation. This workflow overcomes the limitation of conventional digital outcrop studies, which typically remain at the geometric reconstruction and visualization stage, and establishes a complete data conversion chain of “digital outcrop–digital interpretation–virtual well–stratigraphic framework–3D modeling–parameter extraction”, thereby transforming the digital outcrop into a genuine data source for 3D geological modeling.
Figure 12.
Digital shale outcrop modeling workflow. (a) Outcrop section interpretation. (b) Key sequence boundary identification. (c) Generation of sequence boundaries. (d) Zone model. (e) Lithofacies model section. (f) 3D lithofacies model.
Furthermore, DSOM establishes a unified data organization system tailored to shale reservoirs. Digital section interpretation standardizes the rules for bedding, lithology, and lamina interpretation; virtual wells unify the data representation format between outcrop and subsurface well data; and 3D probability models unify the representation of spatial distributions of different lithotypes. This standardized data organization approach not only enhances the consistency and reproducibility of geological interpretation but also enables digital outcrop products to directly support reservoir parameter extraction, heterogeneity evaluation, and 3D geological modeling, achieving a transformation of digital outcrops from a “geometric reconstruction platform” to a “reservoir structural analysis platform”. Therefore, the innovation of DSOM lies not merely in UAV photogrammetry or 3D modeling technologies per se, but in the establishment of a workflow—encompassing digital interpretation, virtual well construction, and 3D modeling—that is specifically adapted to shale reservoirs, achieving systematic conversion of outcrop-scale geological information into reservoir structural models and providing a new methodological framework for the application of digital outcrop technology in unconventional hydrocarbon exploration.
5.3. Methodological Limitations, Future Developments, and Implications for Gulong Shale Reservoir Research
Although this study has established a DSOM technical workflow suitable for continental shale reservoirs and achieved integrated expression of digital outcrop reconstruction, digital interpretation, and 3D modeling, several limitations remain. First, the current DSOM primarily addresses bedding, lithology, and lamina assemblages in digital interpretation; a unified digital interpretation system for structural elements such as faults, complex fracture networks, and interlayer offsets has not yet been established. Consequently, the present DSOM is more applicable to well-stratified, weakly deformed shale outcrops, and further refinement of fracture digital modeling methods is required for structurally complex regions. Second, lithological classification, bedding identification, and virtual well establishment on digital sections still rely primarily on manual interpretation. Although unified interpretation standards have been established, improving consistency among interpreters, challenges of high workload, limited efficiency, and a degree of subjectivity persist in large-scale outcrop surveys. Future development should incorporate intelligent interpretation technologies such as deep learning, computer vision, and GeoAI to construct automated lithology recognition and bedding extraction methods for digital sections, thereby enabling the transition from manual to intelligent interpretation in digital outcrop studies. For instance, semantic segmentation networks could be employed for automatic lithotype classification, instance segmentation techniques for automatic identification of bedding surfaces and fracture networks, and large language models for establishing intelligent digital outcrop interpretation workflows, further enhancing the automation and intelligence level of DSOM. Additionally, the 3D structural model established in this study is based primarily on outcrop-scale data, and the results remain analogue models for subsurface reservoirs. Future work should strengthen multi-scale integration among outcrop, core, well log, and seismic data, establishing quantitative relationships between outcrop structural parameters and subsurface reservoir parameters to extend outcrop-scale insights to subsurface reservoir prediction. For the Gulong Shale, the digital outcrop model established in this study not only faithfully records outcrop-scale bedding architecture, lithological assemblages, and spatial distribution patterns but, more importantly, generates outcrop constraint data directly applicable to subsurface 3D geological modeling. Through virtual well construction, stratigraphic framework establishment, and 3D lithofacies modeling, outcrop information can directly contribute to subsurface reservoir structural modeling, providing reliable constraints for bedding continuity analysis, lithofacies modeling, fracture prediction, and sweet-spot evaluation. As the digital outcrop database is progressively enriched, DSOM is expected to further serve digital twin reservoir construction, multi-scale reservoir modeling, and intelligent reservoir prediction for the Gulong Shale, providing new technical support for the fine-scale exploration and development of continental shale oil [1,2,3,37,38]. As the digital outcrop database is progressively enriched, DSOM is expected to further serve digital twin reservoir construction, multi-scale reservoir modeling, and intelligent reservoir prediction for the Gulong Shale, providing new technical support for the fine-scale exploration and development of continental shale oil. Beyond hydrocarbon exploration, the DSOM framework is also applicable to carbon capture, utilization, and storage (CCUS), where quantitative characterization of bedding continuity, lithological heterogeneity, and fracture architecture can provide valuable constraints for caprock integrity assessment and long-term CO2 storage security [39]. Future developments should extend DSOM to automated fracture network characterization by integrating high-resolution digital outcrop data with computer vision and three-dimensional reconstruction techniques. In addition, incorporating deep learning and GeoAI into DSOM is expected to enable automated lithological classification, bedding extraction, and geological interpretation, further improving the efficiency, consistency, and applicability of digital outcrop analysis.
6. Conclusions
- (1)
- Addressing the limitation that conventional digital outcrop studies of continental shale reservoirs remain largely at the stage of 3D geometric reconstruction and cannot meet the demands of fine-scale structural characterization, this study proposes a Digital Shale Outcrop Modeling method (DSOM). With digital section interpretation as its core, DSOM integrates digital outcrop reconstruction, digital interpretation, virtual well construction, virtual well correlation, 3D structural modeling, and lithological probability simulation into a unified “digital outcrop–digital interpretation–virtual well–stratigraphic framework–3D modeling” technical workflow, transforming the digital outcrop from a geometric reconstruction platform into a reservoir structural analysis platform.
- (2)
- Digital outcrop reconstruction of Observation Point 1 of the Gulong Shale was completed using UAV oblique photogrammetry. A total of 1885 calibrated images were used to construct a high-precision digital outcrop model covering 0.369 km2, with derived data products including DOM, DSM, DEM, orthomosaic, and dense point cloud. The photogrammetric results exhibit high internal geometric precision, faithfully reproducing the overall outcrop geometry and centimeter-scale bedding and lamina structures, thereby providing a unified spatial reference framework for digital interpretation and 3D modeling.
- (3)
- A virtual well construction method based on the digital outcrop was established, and the well-established concept of well correlation from subsurface reservoir studies was introduced, enabling the conversion of outcrop information into standardized stratigraphic data. Using the rusty-yellow ferruginous siltstone as a regional marker bed, an outcrop-scale stratigraphic framework was constructed, systematically revealing lateral variations in lithological assemblages and bedding architecture above and below the marker bed, and providing reliable stratigraphic constraints for 3D structural modeling.
- (4)
- 3D probability modeling of the seven lithotypes was achieved under virtual well conditioning constraints, enabling quantitative representation of the spatial distribution patterns of different lithotypes. Results demonstrate that all lithotypes exhibit good spatial continuity along bedding directions, and the lithological probability models faithfully reflect bedding extension, lithological transitions, and lateral variability, providing a new technical approach for shale reservoir heterogeneity analysis and multi-scale structural characterization.
- (5)
- DSOM is applicable not only to digital outcrop modeling of the Gulong Shale but also establishes a digital characterization framework for fine-grained sedimentary reservoirs, bridging the gap between outcrop information and subsurface reservoir modeling. With future advances in artificial-intelligence-assisted digital interpretation, multi-source data fusion, and digital twin reservoir technologies, DSOM is expected to find further application in digital geological modeling of shale, tight sandstone, and other complex reservoirs, providing new technical support for fine-scale characterization, 3D modeling, and reservoir prediction in unconventional hydrocarbon systems.
Author Contributions
Conceptualization, Y.S. and X.F.; investigation, Y.S., X.F., X.Z. and Q.X.; data curation, Y.S. and H.S.; software, Y.S. and H.S.; writing—original draft preparation, Y.S.; methodology, X.F. and X.Z.; supervision, X.F., X.Z. and Q.X.; writing—review and editing, X.F., X.Z., J.L. and Q.X.; resources, J.L.; visualization, J.L. and H.S.; formal analysis, H.S.; validation, X.Z. and Q.X. All authors have read and agreed to the published version of the manuscript.
Funding
This research was funded by the Heilongjiang Province Natural Science Foundation Project, grant number JQ2024D003, and the CNPC Innovation Fund (Grant: 2024DQ02-0502).
Data Availability Statement
The original contributions presented in the study are included in the article, further inquiries can be directed to the corresponding authors.
Conflicts of Interest
Authors Yangxin Su, Xiuli Fu and Jinlong Li were employed by the Exploration and Development Research Institute of Daqing Oilfield Company Limited. The remaining authors declare that the research was conducted in the absence of any commercial or financial relationships that could be construed as a potential conflict of interest.
References
- Zou, C.N.; Pan, S.Q.; Jing, Z.H.; Gao, J.L.; Yang, Z.; Wu, S.T.; Zhao, Q. Shale oil and gas revolution and its impact. Acta Pet. Sin. 2020, 41, 1–12. [Google Scholar] [CrossRef]
- Zhang, J.C.; Tao, J.; Li, Z.; Wang, X.W.; Li, X.Q.; Jiang, S.L.; Wang, D.S.; Zhao, X.X. Prospect of deep shale gas resources in China. Nat. Gas Ind. 2021, 41, 15–28. [Google Scholar] [CrossRef]
- Zou, C.N.; Dong, D.Z.; Wang, Y.M.; Li, X.; Huang, J.; Wang, S.; Guan, Q.; Zhang, C.; Wang, H.; Liu, H.; et al. Shale gas in China: Characteristics, challenges and prospects. Pet. Explor. Dev. 2015, 42, 689–701. [Google Scholar] [CrossRef] [Scilit]
- Wang, Y.H.; Liang, J.P.; Zhang, J.Y.; Zhao, B.; Zhao, Y.; Liu, X.; Xia, D. Oil resource potential and exploration direction of Gulong shale in Songliao Basin. Pet. Geol. Oilfield Dev. Daqing 2020, 39, 20–34. [Google Scholar] [CrossRef]
- Sun, L.D.; Liu, H.; He, W.Y.; Li, G.X.; Zhang, S.C.; Zhu, R.K.; Jin, X.; Meng, S.; Jiang, H. An analysis of major scientific problems and research paths of Gulong shale oil in Daqing Oilfield, NE China. Pet. Explor. Dev. 2021, 48, 453–463. [Google Scholar] [CrossRef]
- Pang, X.J.; Wang, G.W.; Kuang, L.C.; Zhao, F.; Li, H.B.; Han, Z.Y.; Bai, T.Y.; Lai, J. Logging evaluation of lithofacies and their assemblage under control of sedimentary environment: A case study of the Qingshankou Formation in Gulong sag, Songliao Basin. J. Palaeogeogr. 2023, 25, 1156–1175. [Google Scholar] [CrossRef]
- Cui, B.W.; Zhang, S.; Fu, X.L.; Su, Y.X.; Jin, M.Y. Organic sequence stratigraphic division and controlling factors of the Gulong shale in the Songliao Basin. Pet. Geol. Oilfield Dev. Daqing 2021, 40, 13–28. [Google Scholar] [CrossRef]
- Howell, J.A.; Martinius, A.W.; Good, T.R. The application of outcrop analogues in geological modelling: A review, present status and future outlook. In Sediment-Body Geometry and Heterogeneity: Analogue Studies for Modelling the Subsurface; Martinius, A.W., Howell, J.A., Good, T.R., Eds.; Special Publications; The Geological Society of London: London, UK, 2014; Volume 387, pp. 1–25. [Google Scholar] [CrossRef] [Scilit]
- Enge, H.D.; Howell, J.A.; Buckley, S.J. From outcrop to reservoir simulation model: Workflow and procedures. Geosphere 2007, 3, 469–490. [Google Scholar] [CrossRef] [Scilit]
- Hodgetts, D. Laser scanning and digital outcrop geology in the petroleum industry: A review. Mar. Pet. Geol. 2013, 46, 335–354. [Google Scholar] [CrossRef] [Scilit]
- Yin, S.L.; Wang, Y.W.; Yin, Y.S.; Zhang, X.H.; Bai, K.; Tang, Y.J.; Cheng, L.L.; Tang, P. Advances in the application of UAV oblique photography technology in sedimentary geology. Acta Sedimentol. Sin. 2025, 2025, 1–38. [Google Scholar] [CrossRef]
- Dong, Z.C.; Chen, G.Y.; Yin, S.L.; Zhu, B.Y. WebGL-based digital outcrop visualization and recognition system: A case study of UAV oblique photography in the Yiqikelike section. Sci. Technol. Eng. 2024, 24, 4633–4642. [Google Scholar] [CrossRef]
- Dong, X.Y. 3D Geological Modeling of Braided River Delta Outcrops. Master’s Thesis, Yangtze University, Wuhan, China, 2022. [Google Scholar] [CrossRef]
- Wang, L.X.; Yin, Y.S.; Feng, W.J.; Duan, T.Z.; Zhao, L.; Zhang, W.B. A training image optimization method in multiple-point geostatistics and its application in geological modeling. Pet. Explor. Dev. 2019, 46, 739–745. [Google Scholar] [CrossRef] [Scilit]
- Zhang, H.; Wang, X.J.; Jia, C.Z.; Li, J.H.; Meng, Q.A.; Jiang, L.; Wang, Y.Z.; Bai, X.F.; Zheng, Q. Whole petroleum system and hydrocarbon accumulation model in shallow and medium strata in northern Songliao Basin, NE China. Pet. Explor. Dev. 2023, 50, 784–797. [Google Scholar] [CrossRef] [Scilit]
- Meng, Q.A.; Bai, X.F.; Zhang, W.J.; Fu, L.; Xue, T.; Bao, L. Accumulation and exploration of petroleum reservoirs in west slope of northern Songliao Basin, China. Pet. Explor. Dev. 2020, 47, 254–265. [Google Scholar] [CrossRef] [Scilit]
- Feng, Z.Q.; Jia, C.Z.; Xie, X.N.; Zhang, S.; Feng, Z.H.; Cross, T.A. Tectonostratigraphic units and stratigraphic sequences of the nonmarine Songliao Basin, northeast China. Basin Res. 2010, 22, 79–95. [Google Scholar] [CrossRef] [Scilit]
- He, W.Y.; Pei, M.B. Seismic waveform based sequence framework and study on shale lithofacies characteristics: A case study of No.5 test zone of Gulong shale oil in Songliao Basin. China Pet. Explor. 2024, 29, 123–133. [Google Scholar] [CrossRef]
- Loucks, R.G.; Reed, R.M.; Ruppel, S.C.; Hammes, U. Spectrum of pore types and networks in mudrocks and a descriptive classification for matrix-related mudrock pores. AAPG Bull. 2012, 96, 1071–1098. [Google Scholar] [CrossRef] [Scilit]
- Gale, J.F.W.; Laubach, S.E.; Olson, J.E.; Eichhuble, P.; Fall, A. Natural fractures in shale: A review and new observations. AAPG Bull. 2014, 98, 2165–2216. [Google Scholar] [CrossRef] [Scilit]
- Sun, L.D.; He, W.Y.; Feng, Z.H.; Zeng, H.; Jiang, H.; Pan, Z. Shale oil and gas generation process and pore fracture system evolution mechanisms of the continental Gulong shale, Songliao Basin, China. Energy Fuels 2022, 36, 6893–6905. [Google Scholar] [CrossRef] [Scilit]
- He, W.Y.; Meng, Q.A.; Feng, Z.H.; Zhang, J.Y.; Wang, R. In-situ accumulation theory and exploration and development practice of Gulong shale oil in Songliao Basin. Acta Pet. Sin. 2022, 43, 1–14. [Google Scholar] [CrossRef]
- Sun, L.D.; Zhao, W.Z.; Liu, H.; Zhu, R.K.; Bai, B.; Kang, Y.; Zhang, J.Y.; Wu, S.T. Concept and application of “sweet spot” in shale oil. Acta Pet. Sin. 2023, 44, 1–13. [Google Scholar] [CrossRef]
- Li, D.R.; Li, M. Research advances and application prospects of UAV remote sensing systems. Geomat. Inf. Sci. Wuhan Univ. 2014, 39, 505–513. [Google Scholar] [CrossRef]
- Westoby, M.J.; Brasington, J.; Glasser, N.F.; Hambrey, M.J.; Reynolds, J.M. Structure-from-Motion photogrammetry: A low-cost, effective tool for geoscience applications. Geomorphology 2012, 179, 300–314. [Google Scholar] [CrossRef] [Scilit]
- James, M.R.; Robson, S. Straightforward reconstruction of 3D surfaces and topography with a camera: Accuracy and geoscience application. J. Geophys. Res. Earth Surf. 2012, 117, F03017. [Google Scholar] [CrossRef] [Scilit]
- Smith, M.W.; Carrivick, J.L.; Quincey, D.J. Structure from motion photogrammetry in physical geography. Prog. Phys. Geogr. 2016, 40, 247–275. [Google Scholar] [CrossRef] [Scilit]
- Wu, S.H.; Zhang, Y.W.; Ringas, J.E. Reservoir Stochastic Modeling Constrained by Quantitative Geological Conceptual Pattern. Pet. Sci. 2006, 3, 27–33. [Google Scholar] [CrossRef]
- Yu, X.H.; Li, S.L.; Zhao, S.; Chen, J.Y.; Hou, G.W. Constraining method of stochastic modeling for fluvial petroleum reservoir controlled by depositional facies using wells and seismic data. Earth Sci. Front. 2008, 15, 33–41. [Google Scholar] [CrossRef] [Scilit]
- Kupfersberger, H.; Deutsch, C.V.; Journel, A.G. Deriving constraints on small-scale variograms due to variograms of large-scale data. Math. Geol. 1998, 30, 837–852. [Google Scholar] [CrossRef] [Scilit]
- Goovaerts, P. Geostatistical tools for deriving block-averaged values of environmental attributes. Geogr. Inf. Sci. 1999, 5, 88–96. [Google Scholar] [CrossRef] [Scilit]
- Pyrcz, M.J.; Catuneanu, O.; Deutsch, C.V. Stochastic surface-based modeling of turbidite lobes. AAPG Bull. 2005, 89, 177–191. [Google Scholar] [CrossRef] [Scilit]
- Strebelle, S. Conditional simulation of complex geological structures using multiple-point statistics. Math. Geol. 2002, 34, 1–21. [Google Scholar] [CrossRef] [Scilit]
- Pickel, A.; Frechette, J.D.; Comunian, A.; Weissmann, G. Building a training image with digital outcrop models. J. Hydrol. 2015, 531, 53–61. [Google Scholar] [CrossRef] [Scilit]
- Sun, L.D.; Jia, C.Z.; Zhang, J.F.; Cui, B.W.; Bai, J.; Huo, Q.L.; Xu, X.Y.; Liu, W.B.; Zeng, H.S.; Liu, W. Resource potential of Gulong shale oil in the key areas of Songliao Basin. Acta Pet. Sin. 2024, 45, 1699–1714. [Google Scholar] [CrossRef]
- Comunian, A.; Renard, P.; Straubhaar, J. 3D multiple-point statistics simulation using 2D training images. Comput. Geosci. 2012, 40, 49–65. [Google Scholar] [CrossRef] [Scilit]
- Mariethoz, G.; Renard, P.; Straubhaar, J. The direct sampling method to perform multiple-point geostatistical simulations. Water Resour. Res. 2010, 46, W11536. [Google Scholar] [CrossRef] [Scilit]
- Yin, S.L.; Lin, S.L.; Hu, Z.M.; Zhao, J.W.; Yang, Y.T.; Zhang, L.; Chen, G.Y.; Chen, W.C. 3D mineral modeling inside tight sandstone reservoirs and fracture-type sweet-spot distribution: A case study of the 2nd Member of Xujiahe Formation outcrop at Gongnong Town, western Sichuan Basin. Earth Sci. Front. 2025, 32, 404–418. [Google Scholar] [CrossRef]
- Neagu, D.D.; Dumitrache, L.; Suditu, S.; Branoiu, G.; Chis, T.-V.; Eparu, C.N.; Stan, I.G.; Prundurel, A.P.; Simion, P.C. A Technical Feasibility Assessment Using Reservoir Simulation for CO2 Storage in Sarmatian Formations of the Getic Platform, Romania. Sustainability 2026, 18, 6932. [Google Scholar] [CrossRef] [Scilit]

Disclaimer/Publisher’s Note: The statements, opinions and data contained in all publications are solely those of the individual author(s) and contributor(s) and not of MDPI and/or the editor(s). MDPI and/or the editor(s) disclaim responsibility for any injury to people or property resulting from any ideas, methods, instructions or products referred to in the content. |
© 2026 by the authors. Licensee MDPI, Basel, Switzerland. This article is an open access article distributed under the terms and conditions of the Creative Commons Attribution (CC BY) license.