


Abstract
Conventional typhoon-resistant assessments of floating offshore wind turbines commonly adopt a single stationary extreme environmental condition, although wind and wave characteristics vary substantially among different stages of typhoon evolution. This study investigates the structural weak points and strength performance of the IEA 15 MW reference wind turbine supported by the VolturnUS-S semi-submersible platform under five representative stages of Typhoon Lekima: the front outer vortex, front eyewall, eye center, back eyewall, and back outer vortex regions. Stage-dependent wind profiles, turbulence spectra, and wave spectra were constructed and applied to a fully coupled aero-hydro-servo-elastic model. The resulting global motions and environmental loads were transferred to a shell finite-element model for time-domain load reconstruction and local stress assessment. The overall stress distribution pattern remained broadly similar among the analyzed conditions, whereas the stress levels and stress ranges varied considerably. Stress concentrations consistently occurred at the column–pontoon connections. Stress Concentration Zones 1 and 3 satisfied the adopted allowable stress of 511 MPa under all load cases, with Zone 1 reaching 493.2 MPa under the back eyewall condition. In contrast, Zone 2 exceeded the allowable stress under the front outer vortex, eye center, back eyewall, and back outer vortex conditions. Its maximum von Mises stress reached 591.0 MPa under the front outer vortex condition, corresponding to an exceedance of 15.7%. The eye center condition generally produced relatively low and spatially uniform stresses at the selected monitoring points, whereas the back eyewall condition generated substantially increased stress ranges at several locations, indicating more severe cyclic loading. These results demonstrate that the governing structural strength condition does not necessarily coincide with the maximum wind-speed stage and highlight the need for stage-dependent typhoon assessment and targeted reinforcement of side column–pontoon connections.
1. Introduction
With the strategic transformation of the global energy structure, offshore wind power development is rapidly expanding from nearshore to deep-sea areas. To pursue higher wind energy capture efficiency and better economy, offshore wind turbines are showing a significant trend toward large-scale development. The performance of the floating offshore wind turbine (FOWT) can be evaluated through numerical analysis or model tests. Gao et al. [1] performed numerical simulations of a 15 MW FOWT based on a FAST-OrcaFlex coupled model, discussing the dynamic responses of the mooring system and dynamic cables in 50 m water depth. Zhang et al. [2] took the IEA 15 MW reference wind turbine as the research object, established a one-way fluid–structure interaction (FSI) model of the full-scale FOWT, and explored the influence of platform motion on blade structural stress. Validated by numerous scholars, the 15 MW ultra-large units have become the mainstream benchmark for commercial development. The increasing scale of offshore wind turbines (OWTs) also creates installation challenges, particularly the need for reliable real-time monitoring of the relative motion between mating components. Luy and Ren [3] developed an RGB-D vision framework for non-contact, real-time tracking of such relative motion during OWT installation.
However, in wind energy-rich areas such as the South China Sea and the Northwest Pacific, FOWTs are frequently exposed to severe typhoon conditions (or hurricanes). The accompanying extreme wind speeds, intense turbulence, and giant waves pose severe challenges to the survival and structural safety of FOWTs. Yu et al. [4] evaluated the vulnerability of coastal countries involved in the “Belt and Road” initiative under typhoon disasters based on historical data and DEA assessment models. Deng et al. [5] investigated the seasonal intensity changes in typhoons in the western North Pacific making landfall in mainland China from 1979 to 2017, revealing the primary reasons why typhoon systems are both powerful and possess microphysical characteristics. Hsiao et al. [6] investigated simulation methods for shallow-water wave fields under the influence of Super Typhoons Maria (2018) and Lekima (2019). Ensuring the dynamic evolution laws and structural damage mechanisms of ultra-large FOWTs under extreme typhoon environments is a key scientific challenge facing deep-sea wind power engineering.
High-fidelity typhoon wind field reconstruction is the prerequisite for structural dynamic analysis. In engineering applications, classic parametric models like the Holland model [7] and the Jelesnianski model [8] are widely adopted due to their high computational efficiency. These models typically reconstruct wind fields based on key parameters such as maximum wind speed, radius of maximum wind speed, and central pressure. However, traditional models are often based on axisymmetric assumptions, making it difficult to reproduce the complex asymmetric spatial structure of real typhoons. To address this limitation, Zhang et al. [9] introduced an adaptive segmentation algorithm to detect the evolution of the time-varying sea state, enhancing real-time capabilities; Dong et al. [10] developed a real marine environmental data extraction method based on image segmentation and corner point regression; Ishihara et al. [11] proposed a refined wind field model considering typhoon-specific turbulence intensity and gust factors, pointing out significant differences between typhoon turbulence characteristics and IEC standard spectra. Furthermore, to capture spatial heterogeneity, Xie et al. [12] introduced non-axisymmetric effects and combined real-time buoy observation data to establish an improved four-quadrant typhoon model. Although wind field modeling technology has made significant progress, further exploration is needed on how to apply these refined models containing high variability and special turbulence characteristics to the aero-elastic coupled analysis of ultra-large wind turbines.
Regarding FOWT dynamic response and safety assessment, the international academic community has conducted extensive research. Karimirad et al. [13] and Cai et al. [14] established an early analysis framework for the stochastic dynamic response of FOWTs under severe sea states, emphasizing the importance of nonlinear wave loads. To complement these numerical investigations, Meng et al. [15] investigated the dynamic responses of a 6 MW spar-type FOWT through both wave-tank experiments and FAST simulations under still-water, wind-only, wave-only, and combined wind–wave–current conditions. The numerical and experimental results showed generally consistent trends in the surge, heave, and pitch responses, demonstrating the value of combining physical model tests with numerical simulations for coupled FOWT response assessment. Bachynski et al. [16] delved into the impact of wind–wave misalignment on system response, a phenomenon particularly common during typhoon transit. Haider et al. [17] employed a fully coupled aero-hydro-mooring CFD model to investigate a semi-submersible FOWT under focused-wave excitation, demonstrating that the wave focus position significantly affects the coupled surge-pitch response and mooring-line tensions, with upstream and mid-position focusing producing stronger dynamic responses than downstream focusing. Liu et al. [18] established an aerodynamic–hydrodynamic–mooring coupled model for a 3 × 3 barge-array floating wind farm and investigated the six-degree-of-freedom responses of both an isolated platform and the platform array under extreme combined wind–wave conditions, highlighting the importance of system-level coupling in extreme-environment assessments. For specific typhoon conditions, Yang et al. [19] explored the impact of Super Typhoon Saola on the drivetrain dynamics of a FOWT installed on an OC4-DeepCwind semi-submersible platform. Ma et al. [20] analyzed the attenuation effect of extreme wind shear and yaw error on wind turbine aerodynamic performance; Teng et al. [21] attempted to integrate FOWTs with Wave Energy Converters (WECs) to optimize system dynamic performance. Under extreme conditions, Ren et al. [22] focused on the safety of the mooring system, revealing that snap loads induced by typhoon waves are the primary mode leading to semi-submersible platform failure; the deep learning-integrated mooring tension prediction method (VMD-MI-LSTM) proposed by Hu et al. [23] and the comprehensive RBDO framework optimization method proposed by Yan et al. [24] together provide a reliable and economical mooring system solution for FOWTs under extreme conditions; Liu et al. [25] evaluated the system failure probability under typhoon sea states based on the OC4 platform. However, most of these studies are based on 5 MW reference wind turbines. As unit capacity jumps to 15 MW, Chen et al. [26,27] pointed out that the flexible characteristics of ultra-large blades and their significantly reduced structural natural frequencies will trigger aero-servo-elastic instability problems not previously seen in traditional 5 MW units. Meanwhile, Wang et al. [28] simulated NREL 5 MW and IEA 15 MW blades under different conditions to evaluate the impact of long and flexible blade designs on nonlinear aero-elastic behavior.
In summary, although existing research has laid a solid foundation, several limitations remain: First, existing literature mostly focuses on the steady-state extreme condition at the “peak wind speed moment,” ignoring the spatiotemporal evolution characteristics of wind–wave loads and their unsteady impact on the structure during the full transit process (including the front outer vortex, eyewall, eye center, and back outer vortex stages). Second, for 15 MW ultra-large FOWTs, the multi-scale coupling mechanism of “global motion-local strength” under the stage-dependent typhoon conditions of the typhoon is not yet clear, and there is a lack of full-process structural strength verification combined with refined typhoon evolution models. In view of this, this paper takes the super typhoon “Lekima” and the IEA 15 MW reference wind turbine as research objects to construct a refined asymmetric typhoon wind field model containing five evolution stages. Using a fully coupled numerical framework, the dynamic response characteristics of the wind turbine during representative stages of the typhoon evolution process are analyzed, and finite-element method (FEM) strength analysis is performed on the tower base and key platform nodes. Different from previous studies that mainly focused on global motions, mooring responses, or drivetrain dynamics under a single extreme typhoon condition, the present work links stage-dependent typhoon wind–wave conditions with local finite-element strength assessment of critical platform connections. This enables the identification of structural weak points and governing load cases that may not coincide with the maximum wind-speed stage. This study aims to provide theoretical support and reference for the anti-typhoon optimization design of deep-sea ultra-large FOWTs.
2. Materials and Methods
2.1. Typhoon Wind Field Model
As an extreme meteorological phenomenon with highly destructive and non-stationary characteristics, the significantly high wind speeds, sudden changes in wind direction, and unsteady flow characteristics of a typhoon are critical inputs for evaluating the response and survivability of FOWT structures. Although traditional parametric typhoon models (such as the Holland model) can describe macroscopic wind field characteristics, they struggle to accurately reproduce the non-axisymmetric and non-stationary structure and complex spatiotemporal correlation during actual typhoon transit.
To this end, this paper constructs a refined parametric typhoon wind field simulation framework (as shown in Figure 1), aiming to comprehensively capture the dynamic characteristics of the entire typhoon transit process. This framework breaks through the limitations of traditional static models by systematically dividing the typhoon position into five key stages: front outer vortex region (FOVR), front eyewall region (FEWR), eye center region (ECR), back eyewall region (BEWR), and back outer vortex region (BOVR). Its logic includes three progressive modules: (1) background or mean wind field construction based on an improved Holland model; (2) spatiotemporal multi-stage average wind profile and turbulence reconstruction of stage-dependent wind and turbulence profiles; and (3) numerical theory of 3D steady-state stochastic turbulence wind fields. This subsection expands from three dimensions—discrete flow field foundation, numerical implementation, and model validation—to provide high-fidelity environmental signal input for subsequent strength analysis.
Figure 1.
Schematic diagram of typhoon regions. Red and blue arrows indicate ascending and descending airflow, respectively.
2.1.1. Engineering Wind Field Model
The macroscopic characteristics of the typhoon wind field are determined by the gradient wind speed. This paper adopts the Holland pressure wind field model to calculate the gradient wind speed [29] at different radial positions. This model reconstructs the wind field through key typhoon parameters (such as central pressure, radius of maximum wind speed, etc.), and its control equation is:
where is the gradient wind speed; is the atmospheric pressure far from the typhoon area; is the typhoon center pressure; is the air density; is the distance from the typhoon center point; and is the Coriolis parameter. is the radius of maximum wind speed, and represents the Holland-B parameter, both determined through empirical formulas [30]:
where is the typhoon translation speed; is the latitude of the typhoon center.
This paper uses the Super Typhoon “Lekima” as the research blueprint, which had a maximum sustained wind speed of 62 m/s at the center upon landfall [31]. Figure 2 shows the radial gradient wind speed curve of “Lekima” reconstructed based on the above model. The results show that the gradient wind speed reaches its peak (>55 m/s) at 28 km from the center (eyewall region) and exhibits a spatial distribution pattern of “eyewall region > outer vortex region > eye center region,” which is highly consistent with CMA measured data, verifying the accuracy of the model.
Figure 2.
Radial gradient wind speed of typhoon.
2.1.2. Multi-Stage Wind Profile and Turbulence Intensity Model
The vertical wind profile and turbulence characteristics of a typhoon are crucial for the dynamic response of large flexible wind turbines. Traditional normative models (such as power law or logarithmic law) have systematic deviations in the typhoon surface layer. This study adopts the multi-stage typhoon wind profile model from [32]. This model introduces variable parameters that change dynamically with the typhoon radius and intensity, enabling a more accurate description of the vertical distribution of average wind speed in different typhoon regions (such as the eyewall and outer vortex):
where is the friction velocity, is the von Kármán constant, usually taken as 0.4, is the height above the still water surface, is the friction length, is the inertial stability, and are variable parameters varying with typhoon intensity and distance from the typhoon center, with values shown in Table 1. The friction velocity and friction length are calculated via empirical formulas:
where is the molecular viscosity of air; is the gravitational acceleration; is the indicated friction velocity; is the Charnock constant.
Table 1.
Value of wind profile parameter.
For turbulence intensity, this study fits a modified model based on measured typhoon data from the South China Sea, considering the inverse relationship between turbulence ratio and height:
where are variable parameters changing with wind speed and radius of maximum wind speed, as shown in Table 2; is the turbulence ratio, which can be 2.07, 2.45, or 2.96 depending on different reference data.
Table 2.
Value of turbulence profile parameter.
Based on the above models, the average wind speed time history at different heights during the entire typhoon transit can be accurately simulated. Taking Typhoon “Lekima” as an example, assume a wind farm exists on its path, with the locations of each FOWT shown in Figure 3. Since the typhoon translation speed is relatively small compared to its vortex size, it can be seen from the wind field changes that, except for the area near the eye, the average wind speed and wind direction change gradually, consistent with actual observation laws.
Figure 3.
Schematic diagram of typhoon and wind turbine locations.
2.1.3. Turbulence Wind Spectrum Model
The turbulence wind spectrum of a typhoon has a higher energy concentration in the low-frequency band compared to monsoons, directly affecting structural dynamic response. This study adopts a six-parameter generalized wind spectrum model in the form:
where is frequency; is the Monin coordinate of frequency; are the six parameters determined according to the specific problem. Based on Monin–Obukhov similarity theory and basic assumptions of homogeneous isotropic turbulence (including the Kolmogorov hypothesis [33]), the six-parameter generalized model of fluctuating wind speed spectrum can be simplified. Li et al. [34] established a longitudinal turbulence wind spectrum model considering multi-stage effects based on measured data from Typhoon “Hagupit”:
where is the standard deviation of wind speed, and its relationship with turbulence intensity can be expressed by Equation (13):
Figure 4 compares the wind spectrum simulation results of different typhoon stages with the target spectra, showing that the simulated spectra match the target spectra well in the critical low-frequency band (0.01~2 Hz), and differ significantly from the Davenport spectrum recommended by China’s “Guidelines for the Application of Environmental Conditions for Design and Assessment of Offshore Engineering Structures,” reflecting the unique energy distribution mechanism of typhoons.
Figure 4.
Wind spectral density verification: (a) front outer vortex region; (b) front eyewall region; (c) back eyewall region; (d) back outer vortex region.
2.1.4. 3D Turbulence Wind Field Numerical Simulation
To generate unsteady typhoon wind speed time histories, this paper uses the harmonic superposition method for 3D turbulence simulation. This method reconstructs the turbulence field by superimposing simple harmonic waves of different frequencies. The turbulence wind speed time history sequence at any point in space is expressed as:
where is the frequency increment; is the number of frequency subdivisions; is the random phase angle. Matrix can be decomposed from the cross-power spectral density matrix . The cross-power spectral density matrix of a stationary random process with n variables can be expressed as:
where is the turbulence wind power spectral density at a point. is the spatial coherence function of turbulence wind speed between points i and j, using the Davenport model:
where and are the lateral and vertical decay coefficients, respectively. Considering the multi-stage nature of typhoons, they take different values in different stages. is the average wind speed at point i in the wind field; and are the vertical and lateral coordinates of point i, respectively.
At this point, the wind field simulation for the representative stages of the typhoon evolution process is complete. Figure 5 shows the wind speed time histories at 10 m height for each typhoon stage. It can be seen that the wind speed time histories in different stages differ significantly: in the eyewall regions (FEWR and BEWR), the standard deviation of wind speed is significantly higher than in the outer vortex regions (FOVR and BOVR) and the eye center region (ECR). The turbulence intensity in the eyewall region can reach approximately 18%. Additionally, wind speed components in the ECR stage show good synchronicity, indicating stable horizontal wind speeds in the eye, whereas synchronicity is poor in FOVR, FEWR, BEWR, and BOVR, reflecting the transient wind direction characteristics of the wind field.
Figure 5.
Wind speed simulation results: (a) front outer vortex region; (b) front eyewall region; (c) back eyewall region; (d) back outer vortex region.
2.2. Typhoon Wave Field Model
Extreme waves generated under the analyzed typhoon-stage conditions (typhoon waves) are characterized by huge wave heights, short periods, and highly concentrated energy, posing a significant threat to the structural safety of deep-sea FOWT platforms. Statistics show that over 90% of offshore structure failures can be attributed to the extreme effects of wave loads, with typhoon waves being particularly prominent [35]. Since typhoon-induced wave fields are usually not fully developed and are directly driven by local wind fields, the significant wave height and peak period are closely related to the wind speed at a height of 10 m . Therefore, this paper adopts the JONSWAP spectrum model, validated for the South China Sea typhoon environment, to construct a parametric typhoon wave field.
The key to simulating typhoon waves lies in establishing a robust relationship between wind speed, wave height, and period. Traditional semi-empirical formulas (such as the Ochi model ) tend to produce deviations under extreme typhoon conditions: either overestimating wave height to produce unrealistic waves or underestimating the destructive power of real typhoon waves. To address this, this paper introduces an improved model fitted from measured South China Sea typhoon data, with the significant wave height formula as:
This model corrects for the high wind speed saturation effect through a quadratic term, indicating that wave height growth rates slow down at extremely high wind speeds, aligning better with the physical mechanism of energy saturation in typhoon sea areas. The calculation of peak period must consider the asymmetry in the typhoon’s direction of travel. This paper uses different relationships before and after the typhoon transit:
Before typhoon transit:
After typhoon transit:
Equation (19) reflects the dominant mechanism of the linear growth stage of wind waves, while Equation (20) captures the nonlinear characteristics of enhanced wave dispersion effects as the typhoon moves away. To comprehensively characterize the spectral structure of typhoon waves, this paper adopts a six-parameter generalized JONSWAP spectrum:
where is the Phillips constant; is gravitational acceleration; is the peak wave frequency; is the high-frequency decay of the waves; is the peak enhancement factor; is the dimensionless width parameter. This model more accurately reproduces the energy concentration characteristics of typhoon waves in low-frequency bands by correcting the correlation between γ and α.
Based on the above models, numerical simulations of the wave spectrum during the entire transit of Typhoon “Lekima” were performed. Figure 6 shows the evolution of wave spectra in different stages: in the eyewall region (FEWR and BEWR), the spectral peak energy significantly increases and the spectral shape narrows, indicating high concentration of large wave energy; in the outer vortex regions (FOVR and BOVR), spectral width increases, reflecting the complex characteristics of wave fields subject to multi-frequency excitation. In the ECR, although global spectral energy decreases, the low-frequency component relatively increases, revealing the residual effect of long-period swells within the typhoon eye.
Figure 6.
Wave spectra of typhoons at different stages: (a) before typhoon transit; (b) after typhoon transit.
This model achieves a full-process simulation of typhoon waves, from parameterization to spectral reconstruction, by integrating empirical wind–wave relationships and physical spectral shape corrections. The simulation results agree well with measured data from the Huaniao Island station. Table 3 shows that the reconstructed peak wind speed and wave height are within the observed range of Typhoon Lekima, with mean relative errors of 1.71% and 3.68%, respectively. Therefore, the reconstructed typhoon wind and wave conditions are considered sufficiently reliable for defining the representative environmental load cases used in the subsequent structural strength assessment.
Table 3.
Validation of reconstructed wind and wave parameters against buoy observations during Typhoon Lekima.
2.3. 15 MW Floating Offshore Wind Turbine Numerical Model
This paper selects the IEA 15 MW reference wind turbine (RWT) released by the International Energy Agency (IEA) as the research object. This unit represents the development direction of ultra-large deep-sea offshore wind turbines [36]. The support platform uses the VolturnUS-S semi-submersible platform, consisting of four columns (one central column supporting the tower, and three side columns providing buoyancy) and a Y-shaped bottom pontoon, made of marine steel.
To meet the refined analysis needs for structural strength under extreme typhoon conditions, this paper established a detailed stiffener model including longitudinals and transverse ribs at key stress areas such as column–pontoon connections (as shown in Figure 7). This allows the model to accurately reflect local buckling strength characteristics, compensating for the deficiencies of traditional simplified beam models in stress concentration analysis. Main design parameters are in Table 4 and Table 5.
Figure 7.
Platform stiffener model.
Table 4.
Structural parameters of IEA 15 MW wind turbine.
Table 5.
Structural parameters of IEA 15 MW wind turbine [Platform].
The platform uses a three-line catenary mooring system for positioning. Three R3-grade studless chains are arranged symmetrically at 120° intervals, each with a breaking strength of 22,286 kN. As shown in Figure 8, the single mooring line length is 850 m with an equivalent diameter of 185 mm. Fairleads are 14 m below the still water level, and anchors are 200 m underwater with a radial distance of 837.6 m between anchors.
Figure 8.
Configuration of the mooring systems.
This paper utilizes SIMA (version [4.6]; DNV, Høvik, Norway) to construct an aero–hydro–elastic–control fully coupled model. The tower and blades are simulated based on beam elements; the mooring system uses discrete bar elements and calculates hydrodynamic loads via the Morison equation; and platform rigid body loads are solved based on 3D potential flow theory. In SIMA, the time-domain realization of fluid loads relies on pre-calculated frequency-domain hydrodynamic parameters, including first-order wave excitation forces, the added mass matrix, the radiation damping matrix, buoyancy correction terms, and the hydrostatic restorative stiffness matrix. Using impulse-response functions, the frequency-domain hydrodynamic coefficients are transformed into the time domain through convolution integrals. This procedure yields the time-domain governing equations for the coupled multibody dynamics of the FOWT. The overall numerical workflow is shown in Figure 9 and Table 6 shows the numerical simulation settings.
Figure 9.
Numerical simulation workflow for the fully coupled time-domain analysis and structural stress assessment.
Table 6.
Numerical simulation settings.
2.4. Calculation Load Cases
The load case design refers to the 2019 Super Typhoon “Lekima”. This typhoon was the fifth strongest to make landfall in mainland China since 1949, with a maximum wind force of level 16 (52 m/s) near the center at landfall. Referring to observation data at 10 m height provided by the CMA, the maximum sustained wind speed reached 62 m/s, and the 10 min average wind speed in the nearshore sea area was 50.06 m/s to 59.68 m/s. Under the LC4 condition, considering the short transit time of the typhoon eye and the extremely unstable state of the wind field and sea state, and to avoid the wind turbine frequently triggering start-stop mechanisms under low wind speeds, which would cause more severe fatigue damage, the wind turbine is maintained in the feathered shutdown state under extreme survival mode in the typhoon eye region. Specific load cases are designed as shown in Table 7.
Table 7.
Load cases.
2.5. FOWT Platform Calculation Model
The semi-submersible platform consists primarily of three side columns, one central column, and a Y-shaped bottom pontoon. Before the strength analysis, determining mesh density is crucial. To ensure that accuracy is independent of mesh density, a systematic mesh convergence analysis was performed for typical extreme typhoon cases. “Mesh convergence was evaluated from an initial average element size of 2.0 m, with the mesh size reduced in 0.2 m increments. As shown in Table 8, when the average mesh size reached 1.0 m, the convergence threshold was <3%, establishing the final baseline mesh. The final FEM model has an average mesh size of 1 m, totaling 38,948 elements and 19,808 nodes. The platform structural model is shown in Figure 10.
Table 8.
Global mesh convergence results for the structural model under LC2.
Figure 10.
Finite-element model of semi-submersible wind turbine platform. (a) Wind turbine platform; (b) stiffener; (c) side column; (d) central column connection. Light-green surfaces represent the structural shell regions, whereas dark-green lines show the finite-element mesh and stiffener grid.
Stress analysis is achieved by reconstructing distributed loads in Wasim, including external loads, inertial loads, and gravity. Inertial loads and gravity are directly related to the platform mass matrix. To ensure accuracy, the mass model construction strictly refers to actual dimensions, density, center of gravity, and moments of inertia, selecting appropriate equivalent wall thicknesses. The mass model is shown in Figure 11 and Table 9.
Figure 11.
Equivalent wall thickness of semi-submersible wind turbine platform. (a) External surface; (b) inner diaphragm.
Table 9.
Equivalent wall thickness parameter.
2.6. Material Model
Considering that the strength analysis in this paper mostly involves extreme typhoon conditions, the platform design uses EH420 high-strength steel. For areas requiring special reinforcement, such as the top of the central column and the connections between the columns and pontoons, EH690 high-strength steel is used. EH420 has a yield stress of 420 MPa, and EH690 has 690 MPa. The Young’s modulus is 2.1 × 10¹¹ Pa, Poisson’s ratio is 0.3, and density is 7.8 × 10³ kg/m3.
3. Results
This study was completed using the Wasim (version [4.9]; DNV, Høvik, Norway) module in SESAM software, employing the time-domain reconstruction method. Based on the fully coupled analysis results from SIMA, platform motion responses are used as boundary conditions. Environmental loads corresponding to the motion responses (including wind and waves), tower base loads, and mooring loads are applied to the FEM model to finally achieve quasi-static stress analysis.
3.1. Definition of Feature Points
Ten feature points were selected for comparison to better contrast the impacts of different wind regions, as shown in Figure 12. FP1, FP2, SP1, and SP2 are located on the line connecting the side columns to the center column, distributed on the top and bottom of the pontoons. FC1, FC2, CC1, CC2, SC1, and SC2 are located on the respective columns, 1 m above the top surface of the pontoon. These ten points cover different surfaces of the columns and pontoons, effectively reflecting the stress changes across the platform.
Figure 12.
Definition of feature points. (a) Top view; (b) side view.
3.2. Strength Analysis of Floating Wind Turbine Platform Under Combined Wind and Wave Loads
3.2.1. Analysis of Stress State Under Rated Condition
As a core design condition for the continuous and stable operation of offshore wind power systems, the rated condition represents the full-load operating state of the wind turbine under the combined action of conventional wind and waves. Its strength analysis serves as an important benchmark for evaluating structural safety and reliability. Under this condition, the dynamic response amplitudes are relatively stable, and the stress distribution characteristics directly reflect the rationality of the design parameters. Through von Mises stress analysis, high-stress concentration areas (such as mooring connection points and column-pontoon transition regions) can be easily identified. Furthermore, the strength verification results under rated conditions provide the basis for validating the accuracy of the numerical model. The von Mises equivalent stress contour diagrams for the floating wind turbine platform under rated conditions are presented, with the statistical values at the feature points shown in Figure 13.
Figure 13.
Stress contour plot of wind turbine platform under LC1 condition. (a) Global structural stress contour; (b) Bulkhead stress contour.
As can be seen from the stress contour diagrams, under the rated condition, the overall stress in the platform columns is relatively small, while the stress in the submerged sections is significantly higher than that in other parts; this is caused by the presence of wave loads. The bottom pontoons of the platform experience relatively high stress because they must withstand large wave loads, hydrodynamic loads, and inertial loads. The overall stress distribution of the platform is relatively uniform, but some stress concentration phenomena exist. These regions are primarily located at the connections between the platform side columns and the bottom pontoons, mainly due to abrupt changes in the geometric shape. In the future design process of the wind turbine platform, appropriate structural reinforcement can be applied to these high-stress areas to enhance the overall safety of the platform.
Figure 14 presents the mean, maximum, and minimum stress values at the platform feature points under LC1. By comparing the stress values at the feature points, it can be observed that the stress values of the side columns are significantly higher than those of the center column. This is the result of the superposition of various factors, such as the moment arm, wave impact, dynamic response, and composite loads. When the wind turbine is subjected to horizontal loads such as wind thrust and wave forces, these forces are transmitted to the platform through the tower, generating bending moments on the columns. The moment arm of the side columns is significantly larger than that of the center column, and consequently, the bending moments they experience are also higher. Additionally, the floating wind turbine undergoes low-frequency roll and pitch motions as well as high-frequency wave-induced vibrations during operation. Due to their positions, the side columns are more susceptible to the coupling effects of these two types of motion, leading to a significant increase in stress ranges. On the same column, it is also evident that the stress on the outer side is significantly higher than that on the inner side of the platform; this is primarily because the direct impact of waves on the outer side of the columns produces larger wave loads, which in turn produce higher stress. Finally, it is noteworthy that the stress on the bottom surface of the lower pontoons is also significantly higher than on the top surface. This is mainly attributed to hydrostatic pressure, wave loads, and platform bending effects. The pontoons are in direct contact with seawater, and the hydrostatic pressure they bear increases linearly with water depth. Even when the platform is in an equilibrium state, the hydrostatic pressure on the bottom surface is significantly higher than that on the top surface. Furthermore, the floating platform will undergo global bending deformation under the action of wind thrust and wave forces; if the pontoons are located below the neutral axis of bending, the bottom surface will experience greater additional stress due to tension.
Figure 14.
Statistical values of stress at feature points under LC1 condition.
3.2.2. Analysis of Stress State Under Outer Vortex Region Conditions
The outer vortex region is divided into the front outer vortex region and the back outer vortex region, corresponding to load cases LC2 and LC6, respectively. Although the outer vortex region is not the area with the strongest destructive power in a typhoon, the characteristics of its continuous medium-to-high intensity wind–wave composite action can also cause serious structural damage to the wind turbine. Additionally, the structure of the typhoon wind field dictates that during a typhoon transit, the duration of the wind turbine’s exposure to the outer vortex region is longer, potentially lasting from several hours to several days; furthermore, if the typhoon path shifts, the wind field may pass through the outer vortex region multiple times. Therefore, stress analysis of the outer vortex region is essential, as it more accurately reflects the long-term stability and fatigue life of the floating wind turbine platform in actual operation, providing references of greater engineering value. Figure 15 and Figure 16 display the von Mises equivalent stress contour diagrams for the floating wind turbine platform under outer vortex region conditions, with statistical values at the feature points provided.
Figure 15.
Stress contour plot of wind turbine platform under LC2 condition. (a) Global structural stress contour; (b) Bulkhead stress contour.
Figure 16.
Stress contour plot of wind turbine platform under LC6 condition. (a) Global structural stress contour; (b) Bulkhead stress contour.
As can be seen from the stress contour diagrams, under the outer vortex region conditions, the global stress distribution of the platform does not undergo significant changes. The global stress distribution remains relatively uniform, with stress concentration areas primarily located at the connections between the side columns and the bottom pontoons; however, the mean stress values of the platform show a significant increase. Comparing the stress contour diagrams of the front and back outer vortex regions, the two outer-vortex cases differ only slightly because their mean wind speeds and significant wave heights are smaller, as their average wind speeds and significant wave heights are relatively similar. This result can also be verified by the stress statistical values at the feature points.
Figure 17 presents the mean, maximum, and minimum stress values at the platform feature points under LC2 and LC6. Compared with the rated condition, it can be found that the mean stress at six feature points increased, with the maximum increase reaching 17.0% (15.7%), which is consistent with expectations. However, the mean stress at four points—FC1, FC2, SC1, and SP2—decreased, with reduction rates of 14.0% (14.5%), 49.7% (49.0%), 42.0% (47.1%), and 3.7% (3.8%), respectively. These reflects indicate that in the outer vortex region, the stress generated by the outer side columns is lower than that under the rated condition, particularly for the column on the windward side, where the reduction in stress is more pronounced. The main reason for this phenomenon is the dynamic unloading effect caused by the global motion of the platform. In the outer vortex region conditions, high wind speeds and giant waves significantly increase the pitch motion amplitude of the platform. Moreover, since the peak wave period is closer to the natural period of platform pitch, the pitch motion amplitude is further amplified. Although the platform moves more violently in the pitch direction, the phase lag causes the windward side column to be in the lifting stage when the wave peak arrives, thereby reducing the instantaneous pressure. Simultaneously, the enhancement of heave motion leads to periodic changes in the relative immersion depth of the side columns during wave phases, partially offsetting the hydrostatic pressure component of the waves.
Figure 17.
Statistical values of stress at feature points under LC6 and LC2 conditions.
3.2.3. Analysis of Stress State Under Eyewall Region Conditions
The eyewall region is divided into the front eyewall region and the back eyewall region, corresponding to load cases LC3 and LC5, respectively. The eyewall region is the area where wind speeds and waves are most extreme in a typhoon. Its strong winds, giant waves, and complex flow conditions pose severe challenges to the structural strength of the floating wind turbine platform. Through stress analysis, the loading state of the platform under extreme conditions can be clarified, and whether the structure can withstand these extreme loads can be evaluated, thereby ensuring the safety and reliability of the platform during a typhoon. Figure 18 and Figure 19 display the von Mises equivalent stress contour diagrams for the floating wind turbine platform under eyewall region conditions, with statistical values at the feature points provided.
Figure 18.
Stress contour plot of wind turbine platform under LC3 condition. (a) Global structural stress contour; (b) Bulkhead stress contour.
Figure 19.
Stress contour plot of wind turbine platform under LC5 condition. (a) Global structural stress contour; (b) Bulkhead stress contour.
As can be seen from the stress contour diagrams, under the eyewall region conditions, the global stress distribution of the platform also did not undergo significant changes. Stress concentration areas are still located at the connections between the platform side columns and the bottom pontoons, and the mean stress of the platform has increased significantly. This indicates that changes in environmental loads do not significantly affect the stress distribution pattern; the stress distribution is governed primarily by the platform design itself. In future platform design processes, stress distribution should be controlled more through the optimization of structural forms and connection methods. Comparing the front and back eyewall regions, there is almost no difference between the stress contour diagrams of the two conditions.
Figure 20 presents the mean, maximum, and minimum stress values at the platform feature points under LC3 and LC5. Compared with the rated condition, it can be seen that the mean stress at half of the feature points increased, with the maximum increase occurring at point FC2, reaching 21.1% (9.5%). The mean stress at the other half of the feature points showed a downward trend, with the maximum decrease at point SC1 being 37.9% (35.6%). This decrease may be associated with motion-induced unloading caused by the global platform response. By comparing the changes in stress ranges, it can be seen that the back eyewall region causes the platform stress range to increase significantly. The increase at six points exceeds 100%, with the maximum increase at point CC2 reaching 154.1%. There is also a 28.8% decrease in stress range at point SC1. This result indicates that in the typhoon eyewall region, the dynamic loads borne by the platform are extremely high, and the structural strength faces a severe test. The increased stress variation ranges observed under the back eyewall condition indicate more severe cyclic loading at several monitoring points.
Figure 20.
Statistical values of stress at feature points under LC5 and LC3 conditions.
A comparison between the front and back eyewall conditions shows that most monitoring points exhibit smaller stress ranges under the front eyewall condition during the analyzed simulation interval. However, fatigue accumulation cannot be inferred from the stress ranges alone because the number, sequence, and distribution of stress cycles have not been quantified. The differences between the two conditions may be associated with the combined effects of significant wave height, peak period, wind loading, and platform motion. Dedicated sensitivity analyses are required to isolate the contribution of each environmental parameter.
3.2.4. Analysis of Stress State Under Eye Center Region Condition
The typhoon eye center is the most unique and complex area in the typhoon structure. Its wind field, wave field, and flow field exhibit distinct characteristics, corresponding to load case LC4. Although the typhoon eye center usually manifests as relatively calm wind speeds and low wave heights, the surrounding strong wind bands and rapidly changing environmental conditions pose severe challenges to the structural integrity of the floating wind turbine platform. Additionally, environmental conditions in the typhoon eye center are characterized by high uncertainty and transience. The wind turbine platform may encounter sudden changes in wind speed, nonlinear wave actions, and complex flow field interference when passing through or approaching this area. Conducting stress analysis under the typhoon eye center condition is of great significance for evaluating the structural safety and reliability of the floating wind turbine platform. Figure 21 displays the von Mises equivalent stress contour diagram for the floating wind turbine platform under the eye center condition, with statistical values at the feature points provided.
Figure 21.
Stress contour plot of wind turbine platform under LC4 condition. (a) Global structural stress contour; (b) Bulkhead stress contour.
From the stress contour diagram, it can be seen that the platform stress under the eye center condition is basically the same as that under the rated condition, but the global stress distribution becomes more uniform. Compared with the rated condition, the biggest difference between the two is whether the turbine blades adopt a pitch control strategy. This is reflected in the structural analysis of the platform as a significant change in the tower base loads, which is well demonstrated in the center column section of the stress contour diagram. Simultaneously, compared with the other four conditions during the typhoon transit, it can be found that the platform stress in the typhoon eye center is significantly reduced, indicating that the nominal stresses are lower, but local Zone 2 remains unsafe.
Figure 22 presents the mean, maximum, and minimum stress values at the platform feature points under LC4. Compared with the rated condition, it can be seen that the mean stress at six feature points increased, with the maximum increase occurring at point FP1, reaching 21.3%. The mean stress values at feature points FC1, FC2, SC1, and SP2 decreased, with the maximum reduction being 54.0%. The stress generated by the outer columns of the platform is lower than that under the rated condition, especially for the windward column, where the stress reduction is more pronounced. Furthermore, it should be noted that the stress differences among the ten feature points in the eye center are lower than those under the rated condition, indicating a more uniform global stress distribution of the platform, which is consistent with the stress contour diagram analysis.
Figure 22.
Statistical values of stress at feature points under LC4 condition.
Despite the fact that the absolute stress values of the platform did not undergo significant changes under the eye center condition, the stress ranges significantly decreased. Among the ten feature points, six showed a decrease in stress range, most notably at point CC2. Overall, the eye-center condition produced relatively low and spatially uniform stresses at the selected monitoring points, with stress ranges generally lower than those under the rated and eyewall conditions.
3.3. Stress Analysis of Key Components
Under the analyzed typhoon-stage conditions, the floating wind turbine platform is subjected to strong winds, extreme waves, and complex hydrodynamic actions. Stress concentration phenomena at key locations may accelerate fatigue accumulation or even lead to local failure, thereby affecting the overall safety and reliability of the platform. Through stress analysis of these components, weak links in the design can be identified, providing a basis for structural optimization. Furthermore, stress analysis results can provide scientific support for stability checks, mooring system design, and dynamic response assessments of the floating wind turbine platform. This not only helps ensure the operational stability of the platform under extreme conditions such as typhoons but also promotes the further development of floating wind turbine technology. From the previous analysis, it can be seen that there are three stress concentration areas on the platform. These are defined as follows: the connection between the windward side column and the bottom pontoon is Stress Concentration Zone 1; the connection between the lateral side column and the bottom pontoon is Stress Concentration Zone 2; and the connection between the center column and the bottom pontoon is Stress Concentration Zone 3. The material grades and strength assessment parameters assigned to different structural regions are summarized in Table 10. Figure 23 is a schematic diagram of these stress concentration areas. This section will conduct a more detailed analysis of the stress distribution in these regions.
Table 10.
Material and strength parameters of different structural regions.
Figure 23.
Stress contour plot of stress concentration zones.
3.3.1. Strength Verification of Stress Concentration Zone 1
Due to the large number of calculation results, the stress contour diagram for Stress Concentration Zone 1—the connection between the windward side column and the bottom pontoon—is provided using the rated condition LC1 as an example, as shown in Figure 24.
Figure 24.
Stress Concentration Zone 1.
As seen from the stress contour diagram, Stress Concentration Zone 1 exists in a relatively small area where the stress is significantly higher than in the surrounding regions. This stress concentration results from the combined effects of geometric discontinuity and load transfer. On the one hand, the cross-sectional shapes and dimensions of the column and the pontoon are different, and the connection presents a 90° angle with an abrupt change in the cross-section, leading to local stiffness discontinuity. On the other hand, during operation, the platform is subjected to various complex loads, such as wind, waves, and self-weight. These loads are transmitted to the bottom pontoons through the side columns. As a critical part of the load transmission, the connection experiences a significant increase in stress levels, especially when the load direction does not match the geometric shape of the connection. The strength verification results for Stress Concentration Zone 1 during the typhoon transit are shown in Table 11.
Table 11.
Calculated stresses and strength-compliance results for Zone 1.
As seen from the table, under the six conditions, the stress in the floating wind turbine platform is lower than the allowable stress. This indicates that under the current design and load conditions, the structural strength of the platform meets the requirements. Under the LC5 condition, the maximum stress reaches 493.2 MPa, which is close to the allowable stress, with a safety margin of only 3.4%; thus, attention should be paid to the risks of load uncertainty. After further analysis of the load characteristics and local stress distribution, methods such as local thickening or composite material reinforcement could be adopted to enhance local load-bearing capacity. Although the static strength verification results show that the structure meets requirements, under LC2 and LC5 conditions, the stress range reaches 112.2 MPa and 120.2 MPa, respectively.
3.3.2. Strength Verification of Stress Concentration Zone 2
Figure 25 displays the stress contour diagram for Stress Concentration Zone 2—the connection between the side column and the bottom pontoon—under the rated condition.
Figure 25.
Stress Concentration Zone 2.
As seen from the stress contour diagram, Stress Concentration Zone 2 also exists in a relatively small area where the stress is significantly higher than in the surrounding regions, which is quite similar to Stress Concentration Zone 1. This is because both are connections between columns and pontoons, and the causes of stress concentration are largely identical. Compared to Stress Concentration Zone 1, this area is directly subjected to wave impact, resulting in larger wave loads and a consequently significant increase in stress values. Table 12 displays the strength verification results for Stress Concentration Zone 2 under different conditions.
Table 12.
Calculated stresses and strength-compliance results for Zone 2.
As seen from the table, the maximum von Mises stress values under LC2, LC4, LC5, and LC6 conditions exceed the allowable stress, indicating that the structural strength of the platform does not meet the requirements under these cases. Particularly under the LC2 condition, the maximum stress value reaches 591.0 MPa, far exceeding the allowable stress with an exceedance of 15.7%, which represents a critical state for structural strength.
Although the wind speed in LC2 is lower than that in the eyewall conditions, the outer vortex stage still produces considerable wind–wave loading. The associated pitch and heave motions change the relative immersion depth of the side column and modify the phase relationship between the incoming wave crest, local hydrodynamic pressure, and structural response. When these effects are superimposed with the geometric discontinuity at Zone 2, a more unfavorable local stress state can be generated than that produced by the maximum wind-speed stage. Therefore, the governing strength condition is determined by the combined wind–wave–motion–structure interaction rather than by the peak wind speed alone.
This suggests that the structure exhibits a persistent local strength deficiency at Zone 2 during extreme typhoon events, requiring further design optimization.
It is worth noting that LC4, corresponding to the eye center condition, also exceeds the adopted allowable stress in Stress Concentration Zone 2, although the global environmental loading in this stage is lower than that in the eyewall and outer vortex regions. This result indicates that a reduction in global environmental loading does not necessarily eliminate local strength risks at geometrically discontinuous connections. The high local stress under LC4 is mainly attributed to the structural characteristics of Zone 2, including the abrupt transition between the side column and the pontoon, local stiffness discontinuity, and the concentrated load-transfer path. Therefore, the LC4 result should not be interpreted as evidence of motion-induced unloading, but rather as a local stress amplification phenomenon under reduced global loading.
3.3.3. Strength Verification of Stress Concentration Zone 3
Due to the large number of calculation results, the stress contour diagram for Stress Concentration Zone 3—the connection between the center column and the bottom pontoon—is provided using the rated condition LC1 as an example, as shown in Figure 26.
Figure 26.
Stress Concentration Zone 3.
As seen from the stress contour diagram, Stress Concentration Zone 3 exhibits a certain degree of symmetry along the centerline and is relatively small in area, primarily existing on the top surface of the pontoons. There are two main reasons for the stress concentration in this area. First, the connection between the center column and the bottom pontoons features geometric abruptness; such geometric discontinuities lead to an uneven stress distribution, resulting in stress concentration. Second, the center column is the primary support structure for the wind turbine tower, bearing self-weight, wind loads, and dynamic response loads from the turbine. These loads are transmitted to the bottom pontoons through the center column. As a key component for load transmission, the connection experiences a significant increase in stress levels. This concentration effect is even more pronounced under extreme conditions such as typhoons or giant waves.
As shown in Table 13, the maximum von Mises stresses under all six load cases remain below the adopted allowable stress, indicating that Stress Concentration Zone 3 satisfies the static strength requirement under the analyzed conditions. However, the stress ranges under LC2 and LC5 reach 202.9 MPa and 179.1 MPa, respectively, indicating pronounced cyclic loading. In future analyses, local reinforcement should be applied to areas where stress exceeds limits, and the structural design should be optimized. Simultaneously, combined with fatigue life analysis and dynamic response analysis, the reliability of the structure under long-term operation should be further assessed.
Table 13.
Calculated stresses and strength-compliance results for Zone 3.
4. Discussion
This study evaluated the structural response of a 15 MW semi-submersible FOWT under five representative stages of typhoon evolution. Although the global stress distribution pattern remained broadly similar among the analyzed conditions, considerable differences were observed in the time-averaged stresses, stress ranges, and local peak stresses. Stress concentrations consistently occurred at the column–pontoon connections, indicating that the structural response was governed not only by the environmental-load intensity but also by the local geometry and load-transfer paths. Notably, the governing structural strength condition did not coincide with the stage having the highest wind speed. This finding demonstrates that selecting a design condition solely according to the peak wind speed may not capture the most unfavorable combined wind–wave loading condition for a floating wind turbine platform.
The local strength-verification results further demonstrate the importance of connection-level assessment. Stress Concentration Zones 1 and 3 satisfied the adopted allowable stress of 511 MPa under all analyzed load cases. However, the maximum von Mises stress in Zone 1 reached 493.2 MPa under the back eyewall condition, leaving a safety margin of only 3.4%. Consequently, uncertainties associated with environmental loads, load reconstruction, material properties, and local finite-element modeling may affect the strength assessment of this region. Stress Concentration Zone 2 was identified as the most critical structural location. Its maximum stresses exceeded the adopted allowable stress under LC2, LC4, LC5, and LC6, and the largest value of 591.0 MPa occurred under the front outer vortex condition, corresponding to an exceedance of 15.7%. These results indicate that the side column–pontoon connection is the principal structural weak point of the investigated platform and should be prioritized in subsequent design refinement.
The high stresses at the side column–pontoon connections can be attributed to the combined effects of geometric discontinuity, local stiffness variation, and complex load transfer. The transition between the side column and the pontoon introduces an abrupt change in structural geometry, while wind thrust, wave loads, inertial loads, and mooring loads are transferred through this connection. In addition, the side columns are directly exposed to wave loading and are located farther from the platform center, resulting in relatively large bending moments associated with global pitch and roll motions. The superposition of global platform motion and local hydrodynamic loading therefore produces pronounced stress concentrations at these connections. The results also show that local peak stresses cannot be reliably inferred from the overall stress level of the platform, emphasizing the need to combine global dynamic analysis with refined local structural assessment.
Under the outer vortex conditions, the time-averaged stresses at several monitoring points were lower than those under the rated condition, despite the increased environmental-load intensity. A possible explanation is motion-induced unloading associated with the phase relationship among wave elevation, platform pitch and heave, local immersion depth, and hydrodynamic pressure. When a windward column moves upward as a wave crest approaches, its instantaneous immersion and wave-induced pressure may be reduced. However, the current results are based primarily on stress statistics and cannot conclusively verify this mechanism. Synchronized time histories of wave elevation, pitch, heave, local pressure, and structural stress, together with phase or cross-spectral analyses, are required to determine whether the observed stress reduction is directly caused by platform-motion-induced unloading.
Marked differences were also observed between the front and back eyewall conditions. The back eyewall condition produced substantially increased stress ranges at several monitoring points, with the largest increase relative to the rated condition occurring at CC2. This indicates that the back eyewall condition imposes more severe cyclic loading on some structural locations during the analyzed simulation interval. Nevertheless, the differences between the two eyewall conditions cannot be attributed to wind speed, significant wave height, or peak period individually because these environmental parameters vary simultaneously. Their effects may also depend on the spectral energy distribution and the phase relationships between aerodynamic loading, wave excitation, and platform motion. A systematic sensitivity analysis is therefore required to isolate the contribution of each parameter.
The eye center condition generally produced relatively low and spatially uniform stresses at the selected monitoring points. However, the local maximum stress in Stress Concentration Zone 2 still exceeded the adopted allowable stress under LC4. This apparent difference between the monitoring-point statistics and the local strength-verification result illustrates that relatively low global or nominal stress levels do not necessarily guarantee sufficient local structural strength. Geometric discontinuities can generate high local stresses even under environmental conditions with comparatively low wind speed and wave height. Consequently, structural strength assessment should include refined evaluations of critical connections rather than relying only on global response quantities or a limited number of monitoring points.
The increased stress ranges observed under the back eyewall and outer vortex conditions indicate that cyclic loading may be relevant to the long-term performance of the column–pontoon connections. However, the present study does not constitute a fatigue verification. Maximum-to-minimum stress ranges alone cannot determine cumulative fatigue damage because the number, magnitude, sequence, and duration of stress cycles have not been quantified. A dedicated fatigue assessment should use complete stress time histories, rainflow cycle counting, appropriate S-N curves for the corresponding welded details, thickness corrections, long-term environmental occurrence probabilities, and a cumulative damage model. Therefore, the current results should be interpreted as identifying fatigue-sensitive locations and load cases rather than predicting fatigue life or fatigue-driven failure.
Several limitations of the present study should be acknowledged. First, the five load cases represent separate stages of typhoon evolution rather than a continuously varying non-stationary typhoon-transit simulation. Consequently, transition effects and response-history dependence between successive stages were not explicitly considered. Second, the structural analysis was based on time-domain load reconstruction and quasi-static finite-element stress evaluation. Nonlinear structural behavior and potential local phenomena such as plastic deformation, wave impact, green water, and nonlinear buckling require further investigation. Third, the sensitivity of extreme stress responses to stochastic wind and wave realizations should be evaluated using multiple random seeds. The influence of wind–wave misalignment should also be examined because the relative directions of wind, waves, and mooring lines may alter the governing connection and load path.
Future work should therefore focus on continuous non-stationary wind–wave simulations, multiple stochastic realizations, synchronized analyses of environmental loads and platform responses, and refined local finite-element models of the critical connections. Full time-domain fatigue analyses should be performed to quantify cumulative damage associated with individual typhoon events and long-term typhoon exposure. As reviewed by Shi et al. [37], real-time hybrid testing can combine numerical aerodynamic calculations with physically reproduced platform responses, thereby alleviating the scaling conflicts and turbulent-wind reproduction limitations of conventional FOWT model tests. Further coupling among turbine control, nonlinear mooring response, and local structural stress would also provide a more comprehensive assessment of the survivability of large semi-submersible FOWTs under typhoon conditions.
5. Conclusions
In this study, a systematic strength analysis of a large floating wind turbine platform during a typhoon transit was conducted. Combining numerical simulation and code-based verification methods, the stress distribution characteristics and the strength performance of key components were investigated across different typhoon conditions. Through analysis of typical conditions such as the rated condition, outer vortex region, eyewall region, and eye center, the structural response characteristics of the platform in extreme typhoon environments were revealed. The main conclusions are as follows:
- Stress response characteristics under different typhoon conditions: Under different conditions, the global stress distribution of the platform exhibits certain regularities. Under the rated condition, the platform stress distribution is relatively uniform, though stress concentration areas exist, primarily at the connections between the side columns and the bottom pontoons. Under the outer vortex and eyewall region conditions, the mean stress values of the platform increase significantly, but the stress distribution pattern does not undergo obvious changes, with stress concentration areas remaining at the column–pontoon connections. The ECR condition produces relatively low and spatially uniform stress levels, while the stress ranges are generally lower than those under the rated and eyewall conditions.
- Strength verification of key components: Through detailed analysis of stress concentration areas, it was found that the key weak links of the platform under the analyzed typhoon-stage conditions are primarily concentrated at the connections between the columns and the pontoons. Stress Concentration Zone 1 (windward side column–pontoon connection) satisfies the adopted strength criterion under all load cases, with the smallest safety margin occurring under the back eyewall condition. The maximum stress value in Stress Concentration Zone 2 (side column–pontoon connection) exceeds the allowable stress under extreme conditions (such as LC2), indicating a risk of insufficient strength in this area during extreme typhoon events. In Stress Concentration Zone 3 (center column–pontoon connection), requirements are met under the analyzed conditions, but relatively large stress variation ranges are observed under some typhoon conditions, indicating the need for further fatigue-oriented assessment and local design optimization.
- Structural optimization suggestions: Based on the results of the stress concentration area strength verification, it is recommended to implement local reinforcement at key components during the platform design stage, such as using local thickening or composite material reinforcement to enhance local load-bearing capacity. Furthermore, optimizing the connection forms and geometric shapes of the columns and pontoons to reduce stress concentration caused by geometric abruptness is also an effective approach for reducing local stress concentrations and cyclic stress ranges.
In summary, this study, through stress analysis of a floating wind turbine platform during a typhoon transit, reveals the structural strength response characteristics of the platform under different conditions and identifies the weak structural links. These research results provide an important basis for subsequent structural optimization design and fatigue life assessment.
Author Contributions
Conceptualization, B.W. and Y.T.; methodology, B.W.; software, J.Y. and W.L.; validation, B.W., Y.L. and W.L.; formal analysis, B.W.; investigation, Y.L.; resources, B.W.; data curation, B.W.; writing—original draft preparation, Y.T.; writing—review and editing, B.W.; visualization, J.Y.; supervision, J.Y.; project administration, Y.L.; funding acquisition, Y.T. All authors have read and agreed to the published version of the manuscript.
Funding
This research work was financially supported by the National Key Research and Development Program of China (Grant No. 2023YFB4203200). Their financial support is gratefully acknowledged.
Data Availability Statement
The numerical input parameters, processed response data, and stress statistics supporting the findings of this study are available from the corresponding author upon reasonable request.
Conflicts of Interest
Author Bin Wang was employed by the company Power China Huadong Engineering Corporation Limited. Authors Yujia Tang and Jiawei Yu were employed by the company China Southern Power Grid. The remaining authors declare that the research was conducted in the absence of any commercial or financial relationships that could be construed as a potential conflict of interest.
References
- Gao, Y.; Li, Y.; Wang, L. Integrated numerical investigation of a 15 MW semi-submersible wind turbine at moderate water depth. Ocean Eng. 2024, 309, 118567. [Google Scholar] [CrossRef] [Scilit]
- Zhang, Y.C.; Song, Y.; Shen, C.; Chen, N.-Z. Aerodynamic and structural analysis for blades of a 15 MW floating offshore wind turbine. Ocean Eng. 2023, 287, 115785. [Google Scholar] [CrossRef] [Scilit]
- Luy, H.V.J.; Ren, Z. RGB-D vision for relative motion monitoring of mated components during OWT installation. Mech. Syst. Signal Process. 2026, 258, 114729. [Google Scholar] [CrossRef] [Scilit]
- Yu, X.; Chen, H.; Li, C. Evaluate Typhoon Disasters in 21st Century Maritime Silk Road by Super-Efficiency DEA. Int. J. Environ. Res. Public Health 2019, 16, 1614. [Google Scholar] [CrossRef] [Scilit] [PubMed]
- Deng, L.; Zhao, Y.; Gao, W.; Xue, L.; Duan, Y. Intensity and microphysical properties surrounding the rapid intensification in landfalling Super Typhoons over China during the summer and autumn seasons. Int. J. Climatol. 2021, 41, 6366–6381. [Google Scholar] [CrossRef] [Scilit]
- Hsiao, S.-C.; Wu, H.-L.; Chen, W.-B.; Guo, W.-D.; Chang, C.-H.; Su, W.-R. Effect of Depth-Induced Breaking on Wind Wave Simulations in Shallow Nearshore Waters off Northern Taiwan during the Passage of Two Super Typhoons. J. Mar. Sci. Eng. 2021, 9, 706. [Google Scholar] [CrossRef] [Scilit]
- Holland, G.J. An analytic model of the wind and pressure profiles in hurricanes. Mon. Weather Rev. 1980, 108, 1212–1218. [Google Scholar] [CrossRef] [Scilit]
- Jelesnianski, C.P. A numerical calculation of storm tides induced by a tropical storm impinging on a continental shelf. Mon. Weather Rev. 1965, 93, 343–358. [Google Scholar] [CrossRef] [Scilit]
- Zhang, T.; Ma, C.; An, Y.; Ren, Z. Estimating Semi-stationary Sea States through Wavelet-based Adaptive Segmentation of Ship Motions. Ocean Eng. 2026, 350, 124030. [Google Scholar] [CrossRef] [Scilit]
- Dong, W.; Zhou, L.; Ding, S.; Wang, A.; Cai, J. Two-Staged Method for Ice Channel Identification Based on Image Segmentation and Corner Point Regression. China Ocean Eng. 2024, 38, 313–325. [Google Scholar] [CrossRef] [Scilit]
- Ishihara, T.; Phuc, P.V.; Fujino, Y.; Takahara, K.; Mekaru, T. A field test and full dynamic simulation on a stall regulated wind turbine. In Proceedings of 6th Asia-Pacific Conference on Wind Engineering; Architectural Institute of Japan (AIJ): Tokyo, Japan, 2005; pp. 599–612. [Google Scholar]
- Xie, L.; Bao, S.; Pietrafesa, L.J.; Foley, K.; Fuentes, M. A real-time hurricane surface wind forecasting model: Formulation and verification. Mon. Weather Rev. 2006, 134, 1355–1370. [Google Scholar] [CrossRef] [Scilit]
- Karimirad, M.; Moan, T. Wave- and wind-induced dynamic response of a spar-type floating wind turbine. J. Waterw. Port Coast. Ocean Eng. 2012, 138, 9–20. [Google Scholar] [CrossRef] [Scilit]
- Cai, Y.; Zhao, H.; Li, X.; Shi, W.; Xiao, Q. Developing an OpenFOAM solver for coupled aero-hydrodynamic analysis of integrated structure with floating offshore wind turbine and aquaculture net cage. Coast. Eng. 2025, 198, 104720. [Google Scholar] [CrossRef] [Scilit]
- Meng, L.; He, Y.; Zhao, Y.; Yang, J.; Yang, H.; Han, Z.; Yu, L.; Mao, W.; Du, W. Dynamic Response of 6 MW Spar Type Floating Offshore Wind Turbine by Experiment and Numerical Analyses. China Ocean Eng. 2020, 34, 608–620. [Google Scholar] [CrossRef] [Scilit]
- Bachynski, E.E.; Kvittem, M.I.; Luan, C.; Moan, T. Wind–wave misalignment effects on floating wind turbines: Motions and tower load effects. Offshore Mech. Arct. Eng. 2014, 136, 041902. [Google Scholar] [CrossRef] [Scilit]
- Haider, R.; Shi, W.; Lin, Z.; Xiao, Q.; Zhang, W.; Li, X. Dynamic response of floating offshore wind turbine to focused wave excitation. Phys. Fluids 2025, 37, 082120. [Google Scholar] [CrossRef] [Scilit]
- Liu, Q.; Miao, W.; Yue, M.; Li, C.; Wang, B.; Ding, Q. Dynamic Response of Offshore Wind Turbine on 3 × 3 Barge Array Floating Platform under Extreme Sea Conditions. China Ocean Eng. 2021, 35, 186–200. [Google Scholar] [CrossRef] [Scilit]
- Yang, Q.Y.; Liu, Y.W.; Wu, S.J.; Yu, M.; Xie, J.; Xue, X. Super typhoon impact on the dynamic behavior of floating offshore wind turbine drivetrains: A comprehensive study. Ocean Eng. 2024, 312, 119084. [Google Scholar] [CrossRef] [Scilit]
- Ma, Y.; Bi, A.; Ren, Y.; Xiao, L. Coupled dynamic response analysis of a semi-submersible floating wind turbine under typhoon conditions. Appl. Ocean Res. 2020, 100, 102159. [Google Scholar]
- Teng, H.; Leng, S.; Shi, W.; Li, X.; Hou, X.; Ren, Y.; Michailides, C.; Karimirad, M. Hydrodynamic and Power Performance of a V-Shaped Floating Wind-Wave Integrated System Based on Multi-Field Coupling. Ocean Eng. 2026, 351, 124331. [Google Scholar] [CrossRef] [Scilit]
- Ren, Y.; Venugopal, V.; Li, Y. Numerical analysis of the dynamic response of a semi-submersible floating wind turbine mooring system under typhoon conditions. Ocean Eng. 2022, 266, 112705. [Google Scholar]
- Hu, L.; Shi, W.; Hu, W.; Chai, W.; Hu, Z.; Wu, J.; Li, X. Short-term prediction of mooring tension for floating offshore wind turbines under typhoon conditions based on the VMD-MI-LSTM method. Renew. Sustain. Energy Rev. 2025, 216, 115606. [Google Scholar] [CrossRef] [Scilit]
- Yan, C.; Shi, W.; Jiang, Z.; Li, L.; Han, X.; Li, X. Reliability-based design optimization of a mooring system for a floating wind turbine. Renew. Energy 2026, 260, 125116. [Google Scholar] [CrossRef] [Scilit]
- Liu, L.; Zhang, L.; Hu, Z. System reliability analysis of a semi-submersible floating wind turbine under typhoon conditions. Renew. Energy 2021, 178, 935–949. [Google Scholar]
- Chen, P.; Chen, J.; Hu, Z. Investigation on the aero-servo-elastic stability of a 15 MW floating wind turbine with flexible blades. Ocean Eng. 2022, 258, 111768. [Google Scholar]
- Chen, M.; Chen, Y.; Li, T.; Tang, Y.; Ye, J.; Zhou, H.; Ouyang, M.; Zhang, X.; Shi, W.; Sun, X. Analysis of the wet-towing operation of a semi-submersible floating wind turbine using a single tugboat. Ocean Eng. 2024, 299, 117354. [Google Scholar] [CrossRef] [Scilit]
- Wang, Z.D.; Hu, J.J.; Wang, Y.; Yang, M.; Zhou, B.; Yuan, Y.; Jin, P.; Chen, Y. Nonlinear aeroelastic performance in 5 MW and 15 MW wind turbine blades using intrinsic geometrically exact method. Renew. Energy 2026, 256, 124581. [Google Scholar] [CrossRef] [Scilit]
- Holland, G. A revised hurricane pressure–wind model. Mon. Weather Rev. 2008, 136, 3432–3445. [Google Scholar] [CrossRef] [Scilit]
- Vickery, P.J.; Wadhera, D. Statistical models of Holland pressure profile parameter and radius to maximum winds of hurricanes from flight-level pressure and H* Wind data. J. Appl. Meteorol. Climatol. 2008, 47, 2497–2517. [Google Scholar] [CrossRef] [Scilit]
- Harper, B.A.; Kepert, J.D.; Ginger, J.D. Guidelines for Converting Between Various Wind Averaging Periods in Tropical Cyclone Conditions; World Meteorological Organization (WMO): Geneva, Switzerland, 2010. [Google Scholar]
- Wang, H.; Ke, S.T.; Wang, T.G.; Kareem, A.; Hu, L.; Ge, Y. Multi-stage typhoon-induced wind effects on offshore wind turbines using a data-driven wind speed field model. Renew. Energy 2022, 188, 765–777. [Google Scholar] [CrossRef] [Scilit]
- Wang, D.; Yu, C.; Zhao, X. Inviscid limit of the inhomogeneous incompressible Navier-Stokes equations under the weak Kolmogorov hypothesis in R3. arXiv 2021, arXiv:2102.02748. [Google Scholar]
- Li, L.; Xiao, Y.; Kareem, A.; Song, L.; Qin, P. Modeling typhoon wind power spectra near sea surface based on measurements in the South China sea. J. Wind. Eng. Ind. Aerodyn. 2012, 104, 565–576. [Google Scholar] [CrossRef] [Scilit]
- Liang, S.X.; Sun, Z.C.; Yin, H.Q.; Niu, H.Y. Analysis of factors influencing typhoon wave simulation in the South China Sea based on the SWAN model. Adv. Mar. Sci. 2015, 33, 19–30. [Google Scholar]
- Gaertner, E.; Rinker, J.; Sethuraman, L.; Zahle, F.; Anderson, B.; Barter, G.; Abbas, N.; Meng, F.; Bortolotti, P.; Skrzypinski, W.; et al. IEA Wind TCP Task 37: Definition of the IEA 15-Megawatt Offshore Reference Wind Turbine; Technical Report NREL/TP-5000-75698; National Renewable Energy Laboratory (NREL): Golden, CO, USA, 2020. [Google Scholar]
- Shi, W.; Fu, J.; Ren, Z.; Jiang, Z.; Wang, T.; Cui, L.; Li, X. Real-time hybrid model tests of floating offshore wind turbines: Status, challenges, and future trends. Appl. Ocean Res. 2023, 141, 103796. [Google Scholar] [CrossRef] [Scilit]
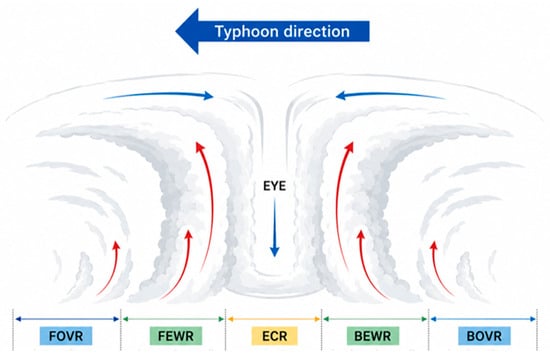
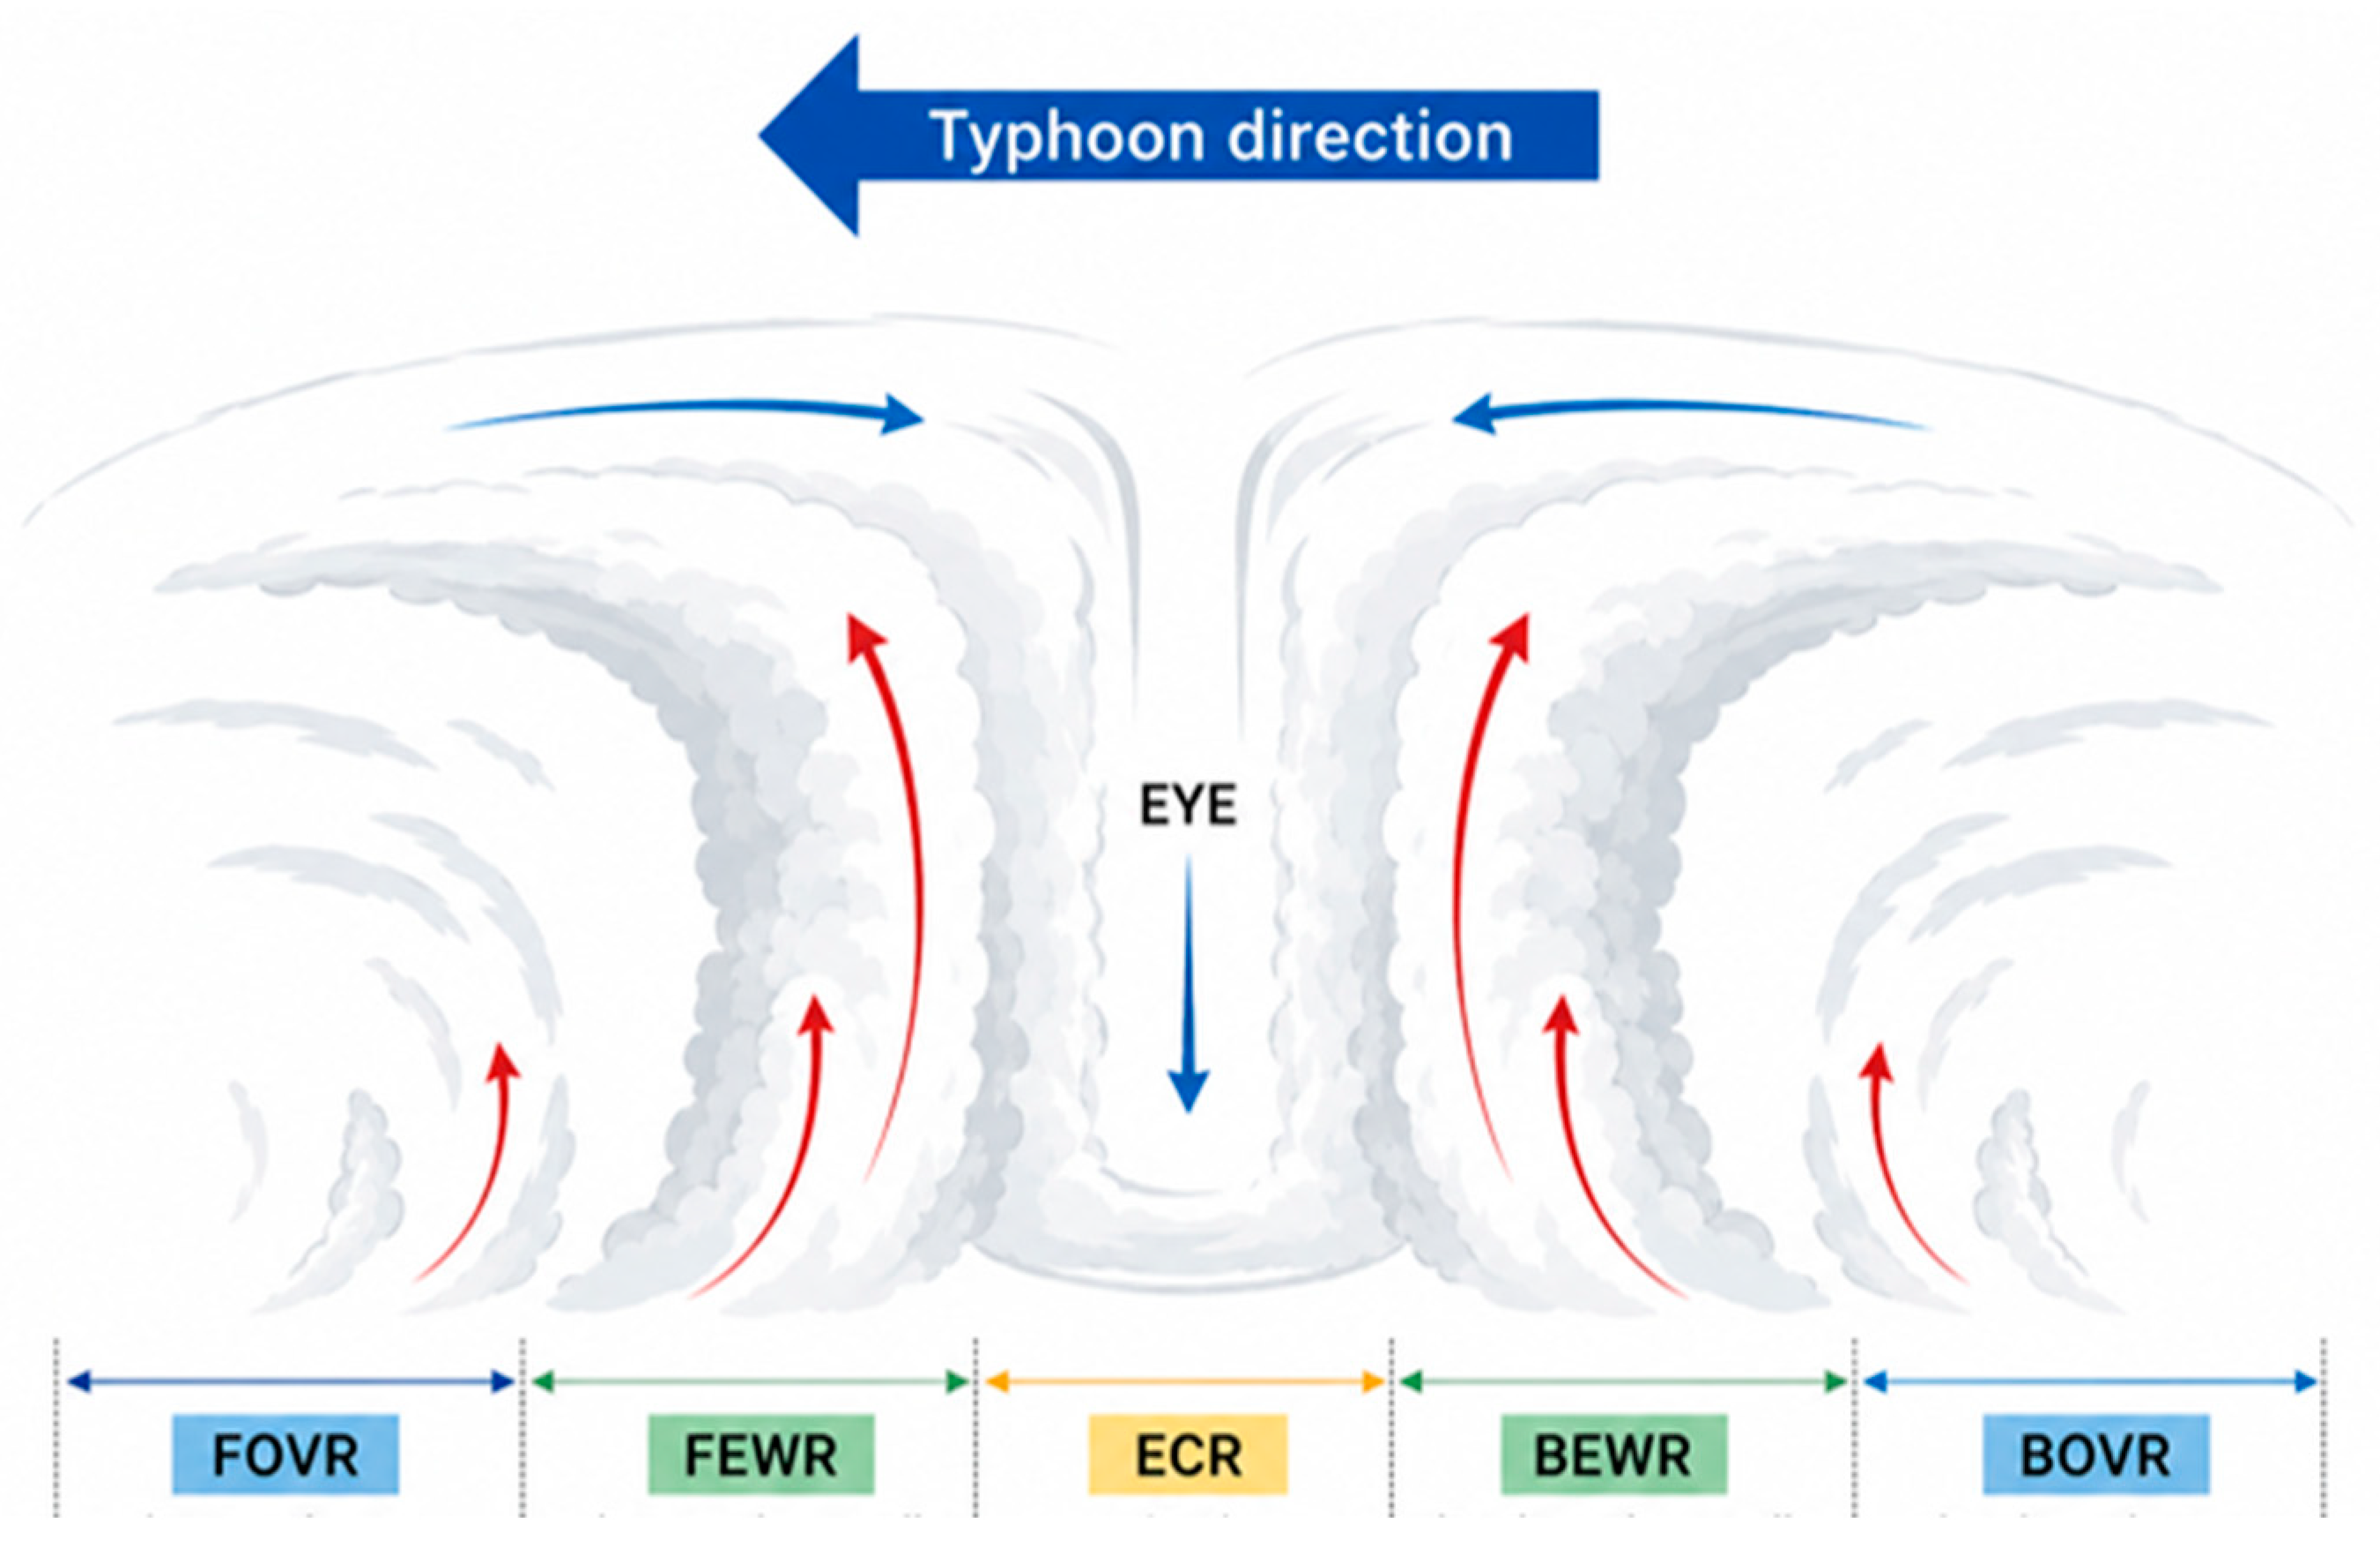
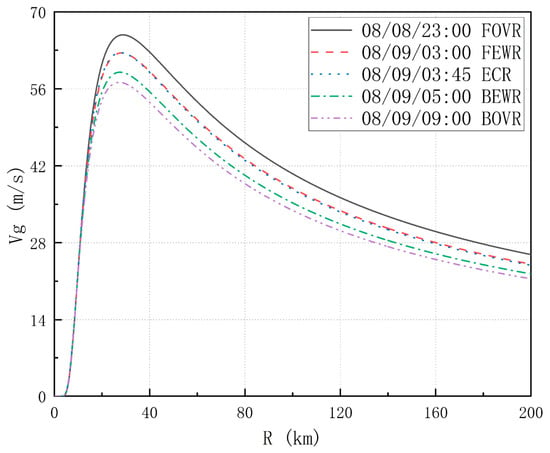
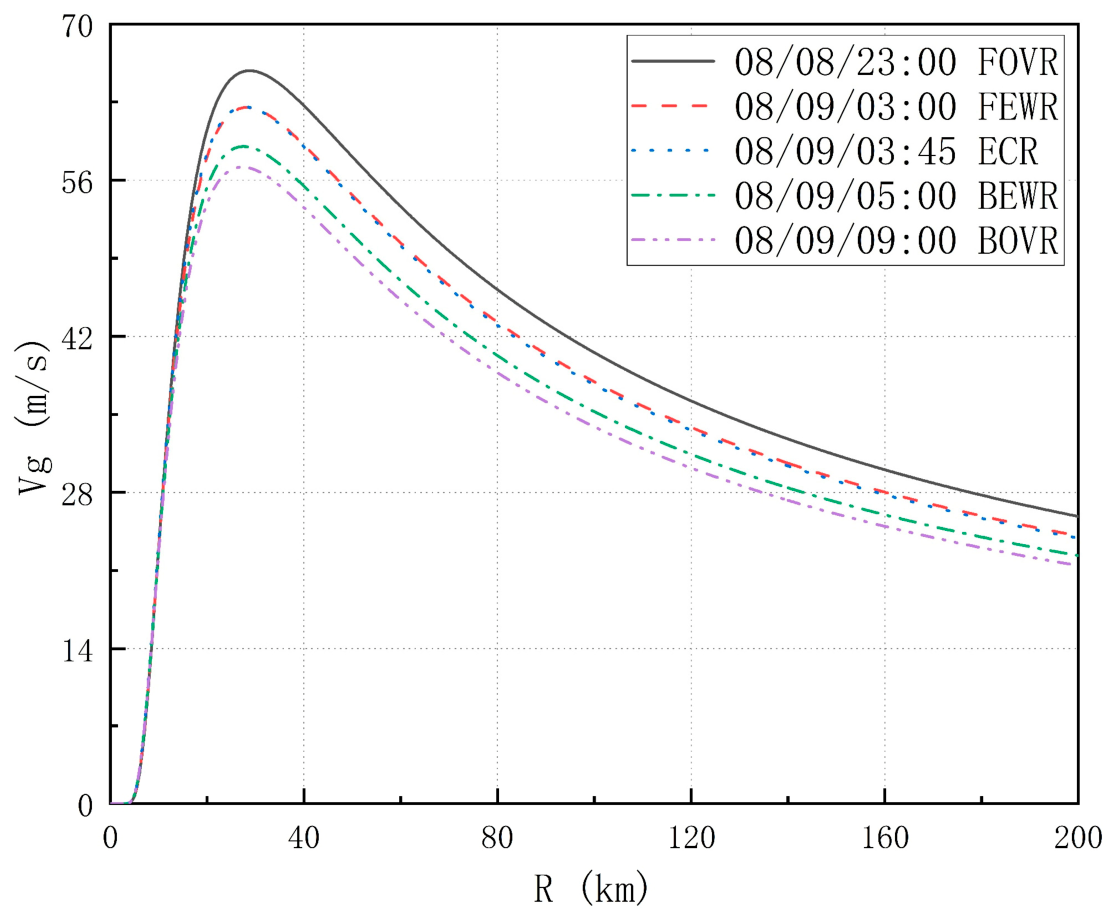
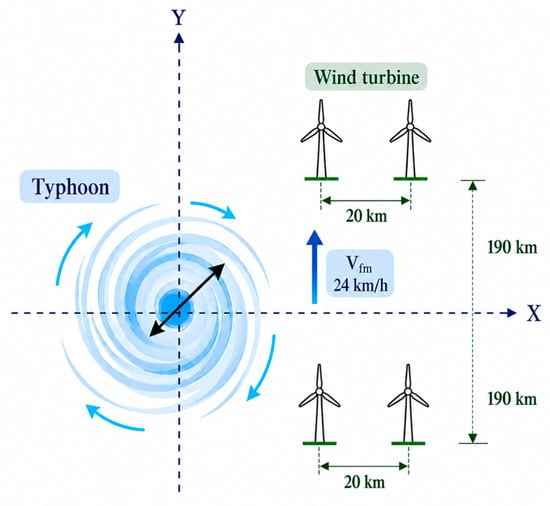
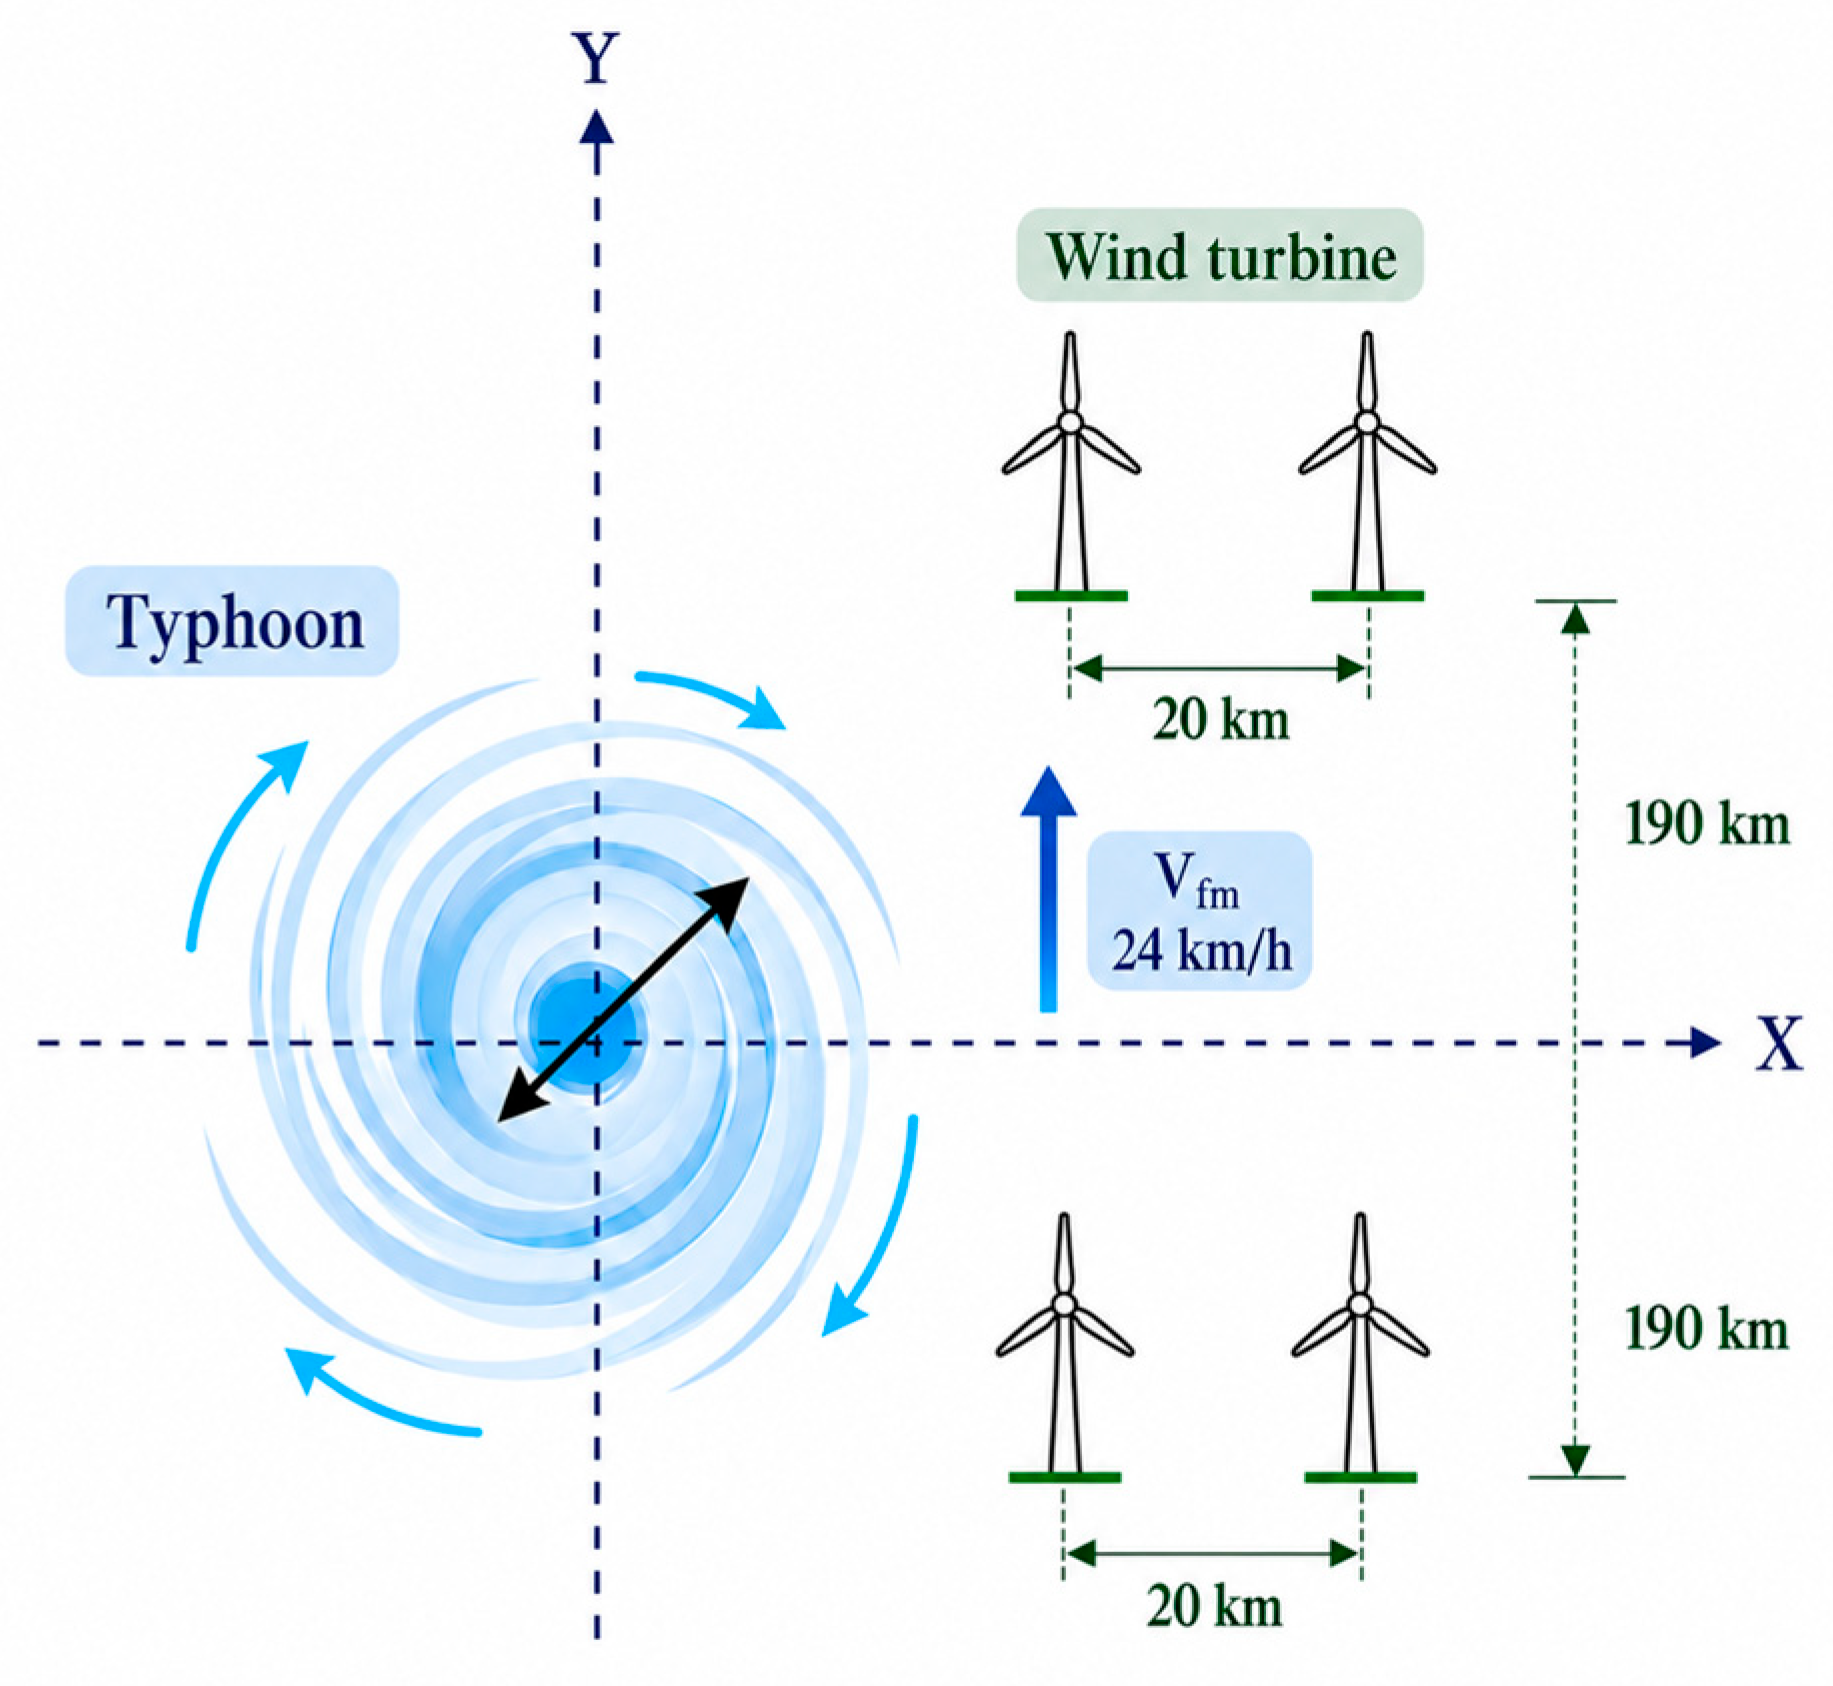
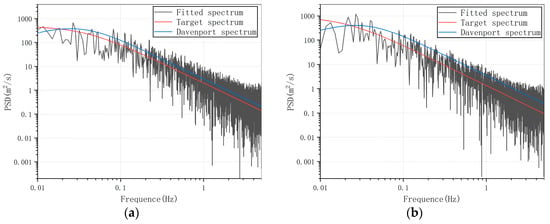
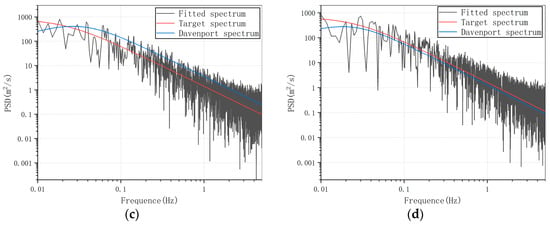
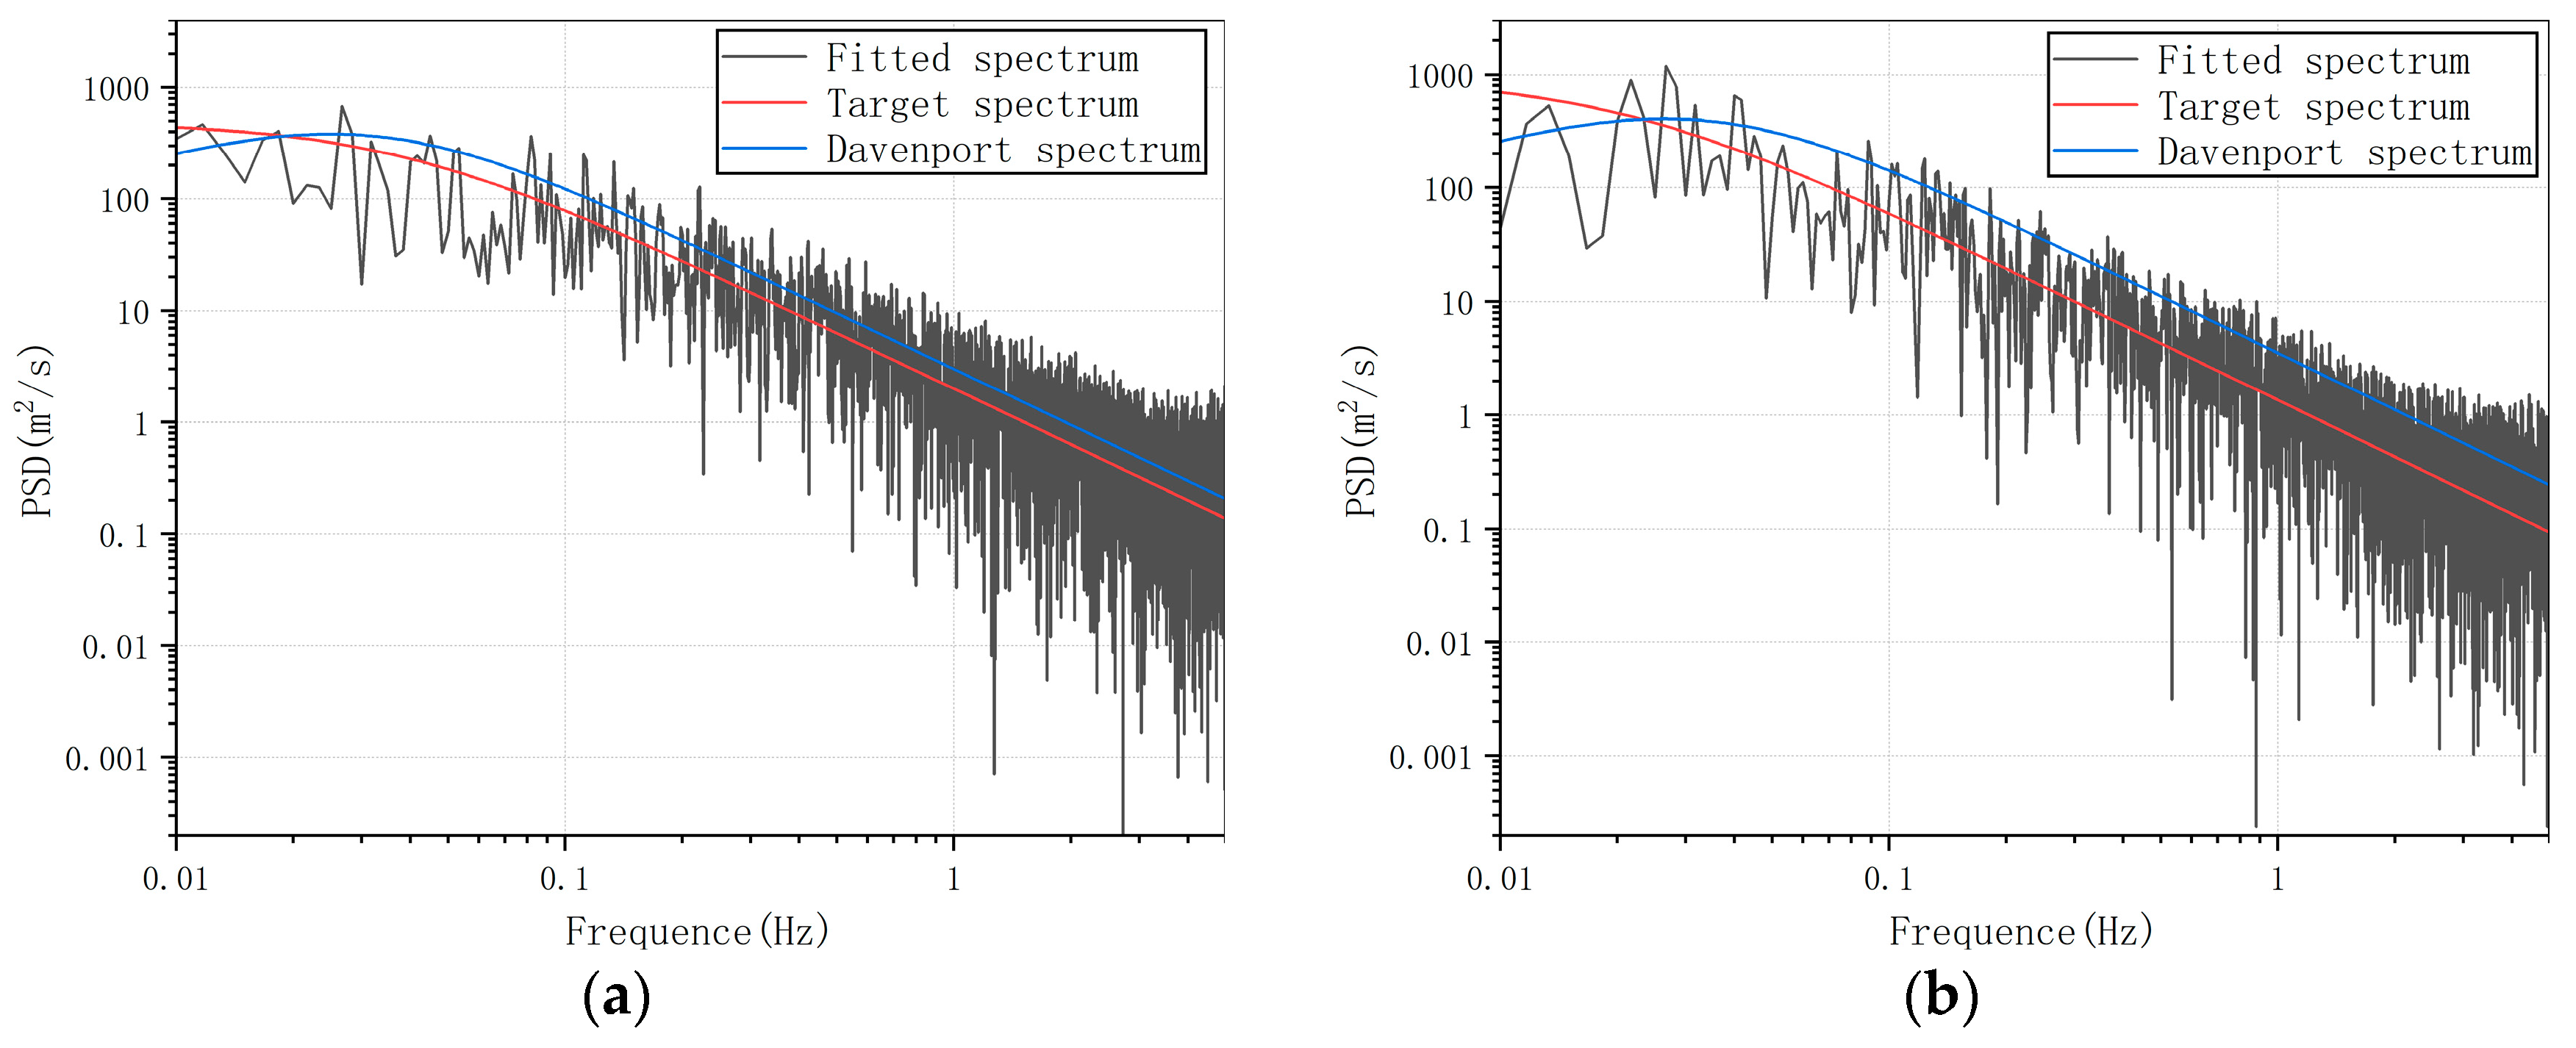
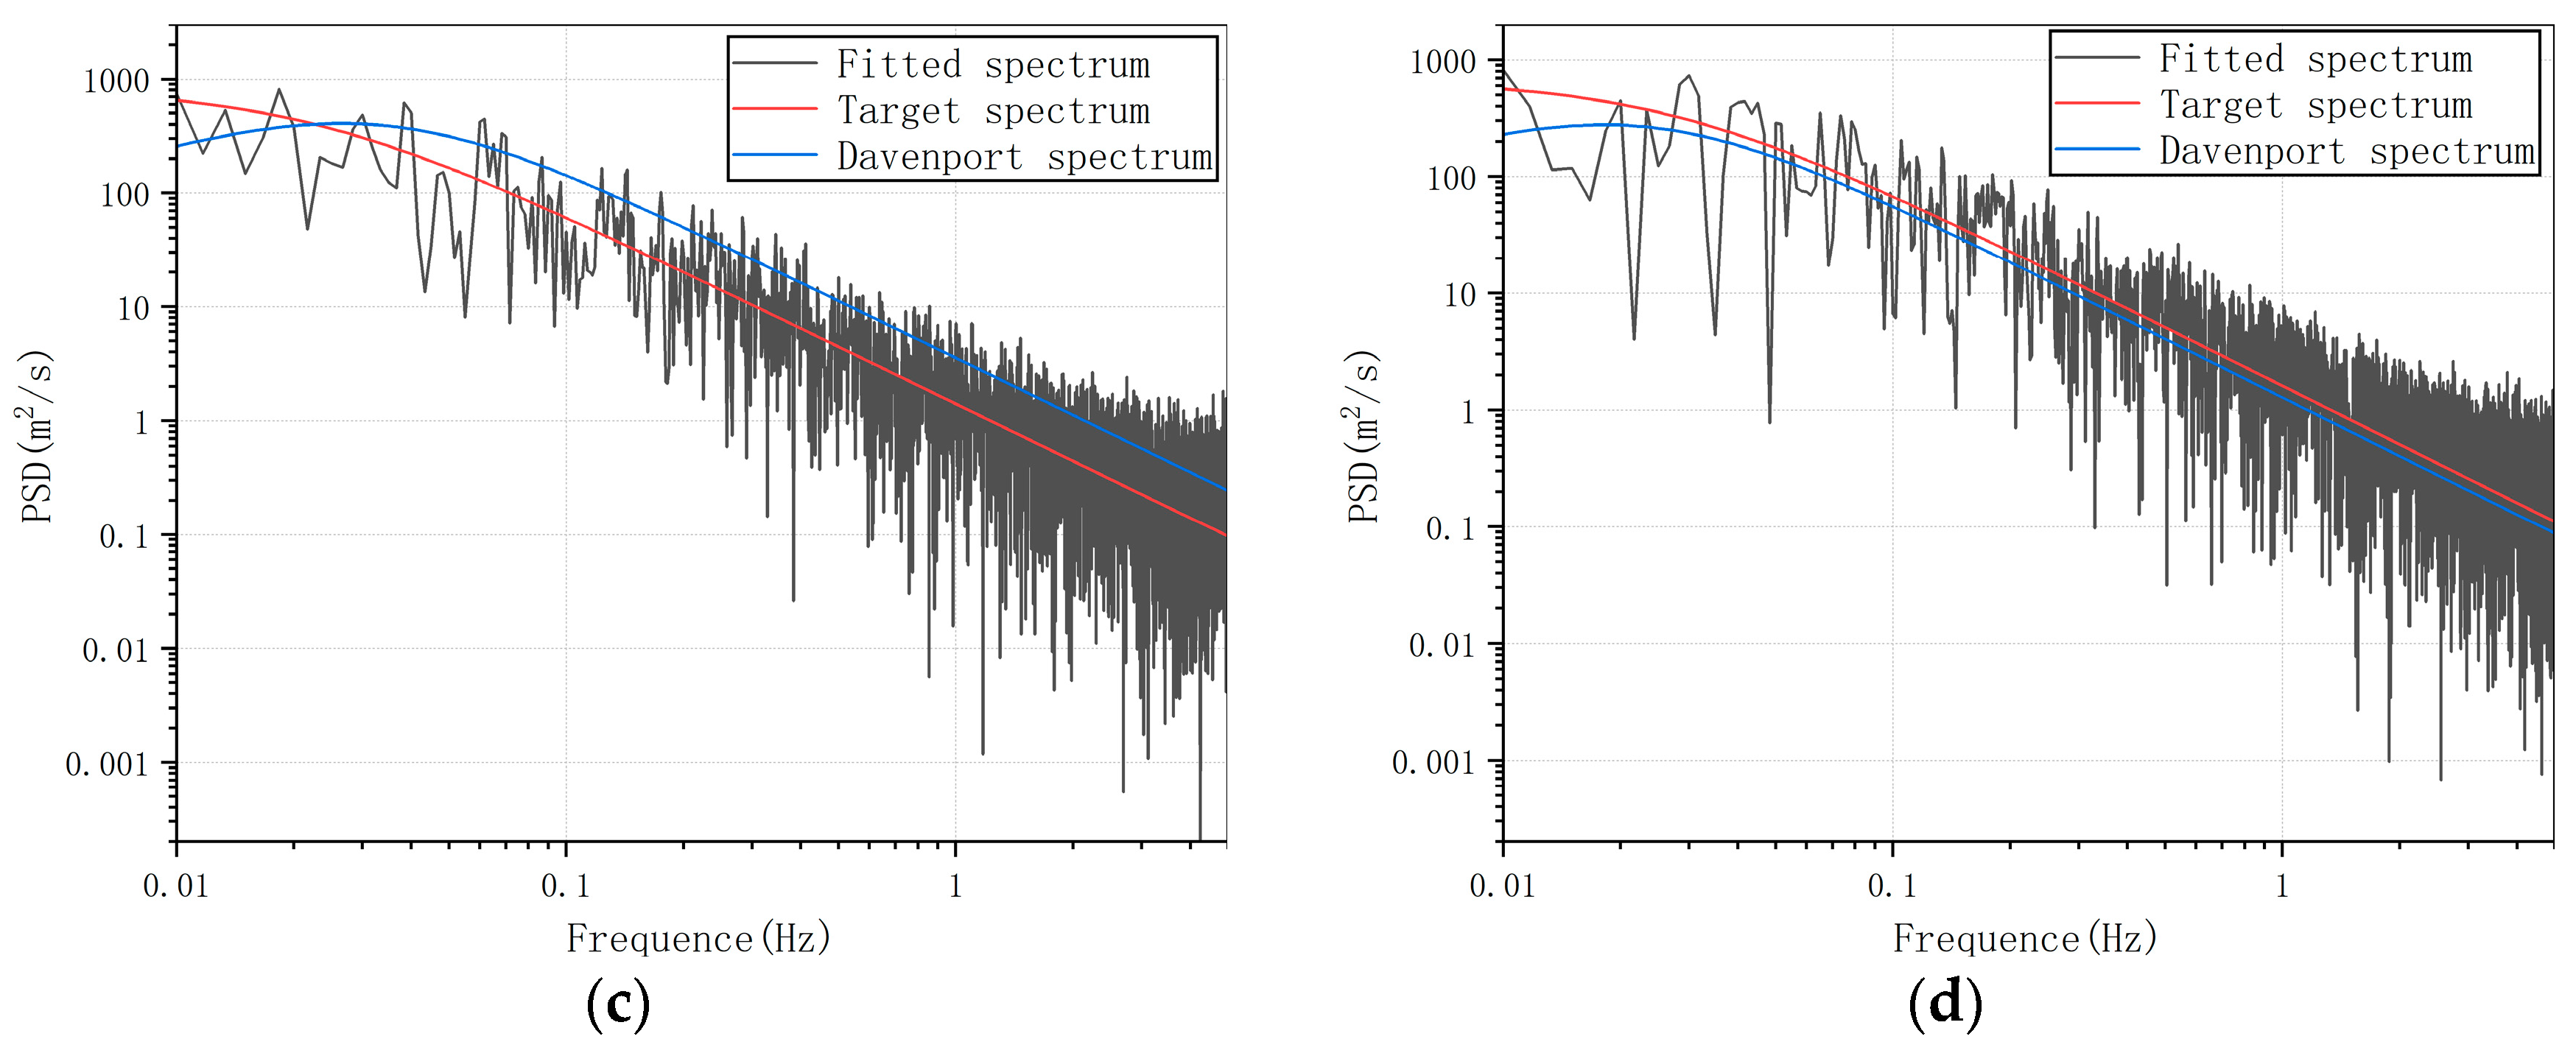
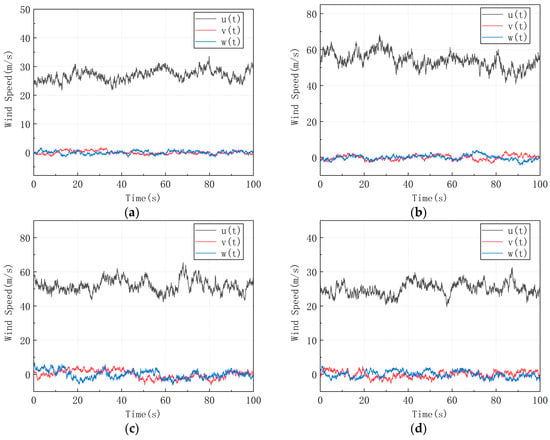
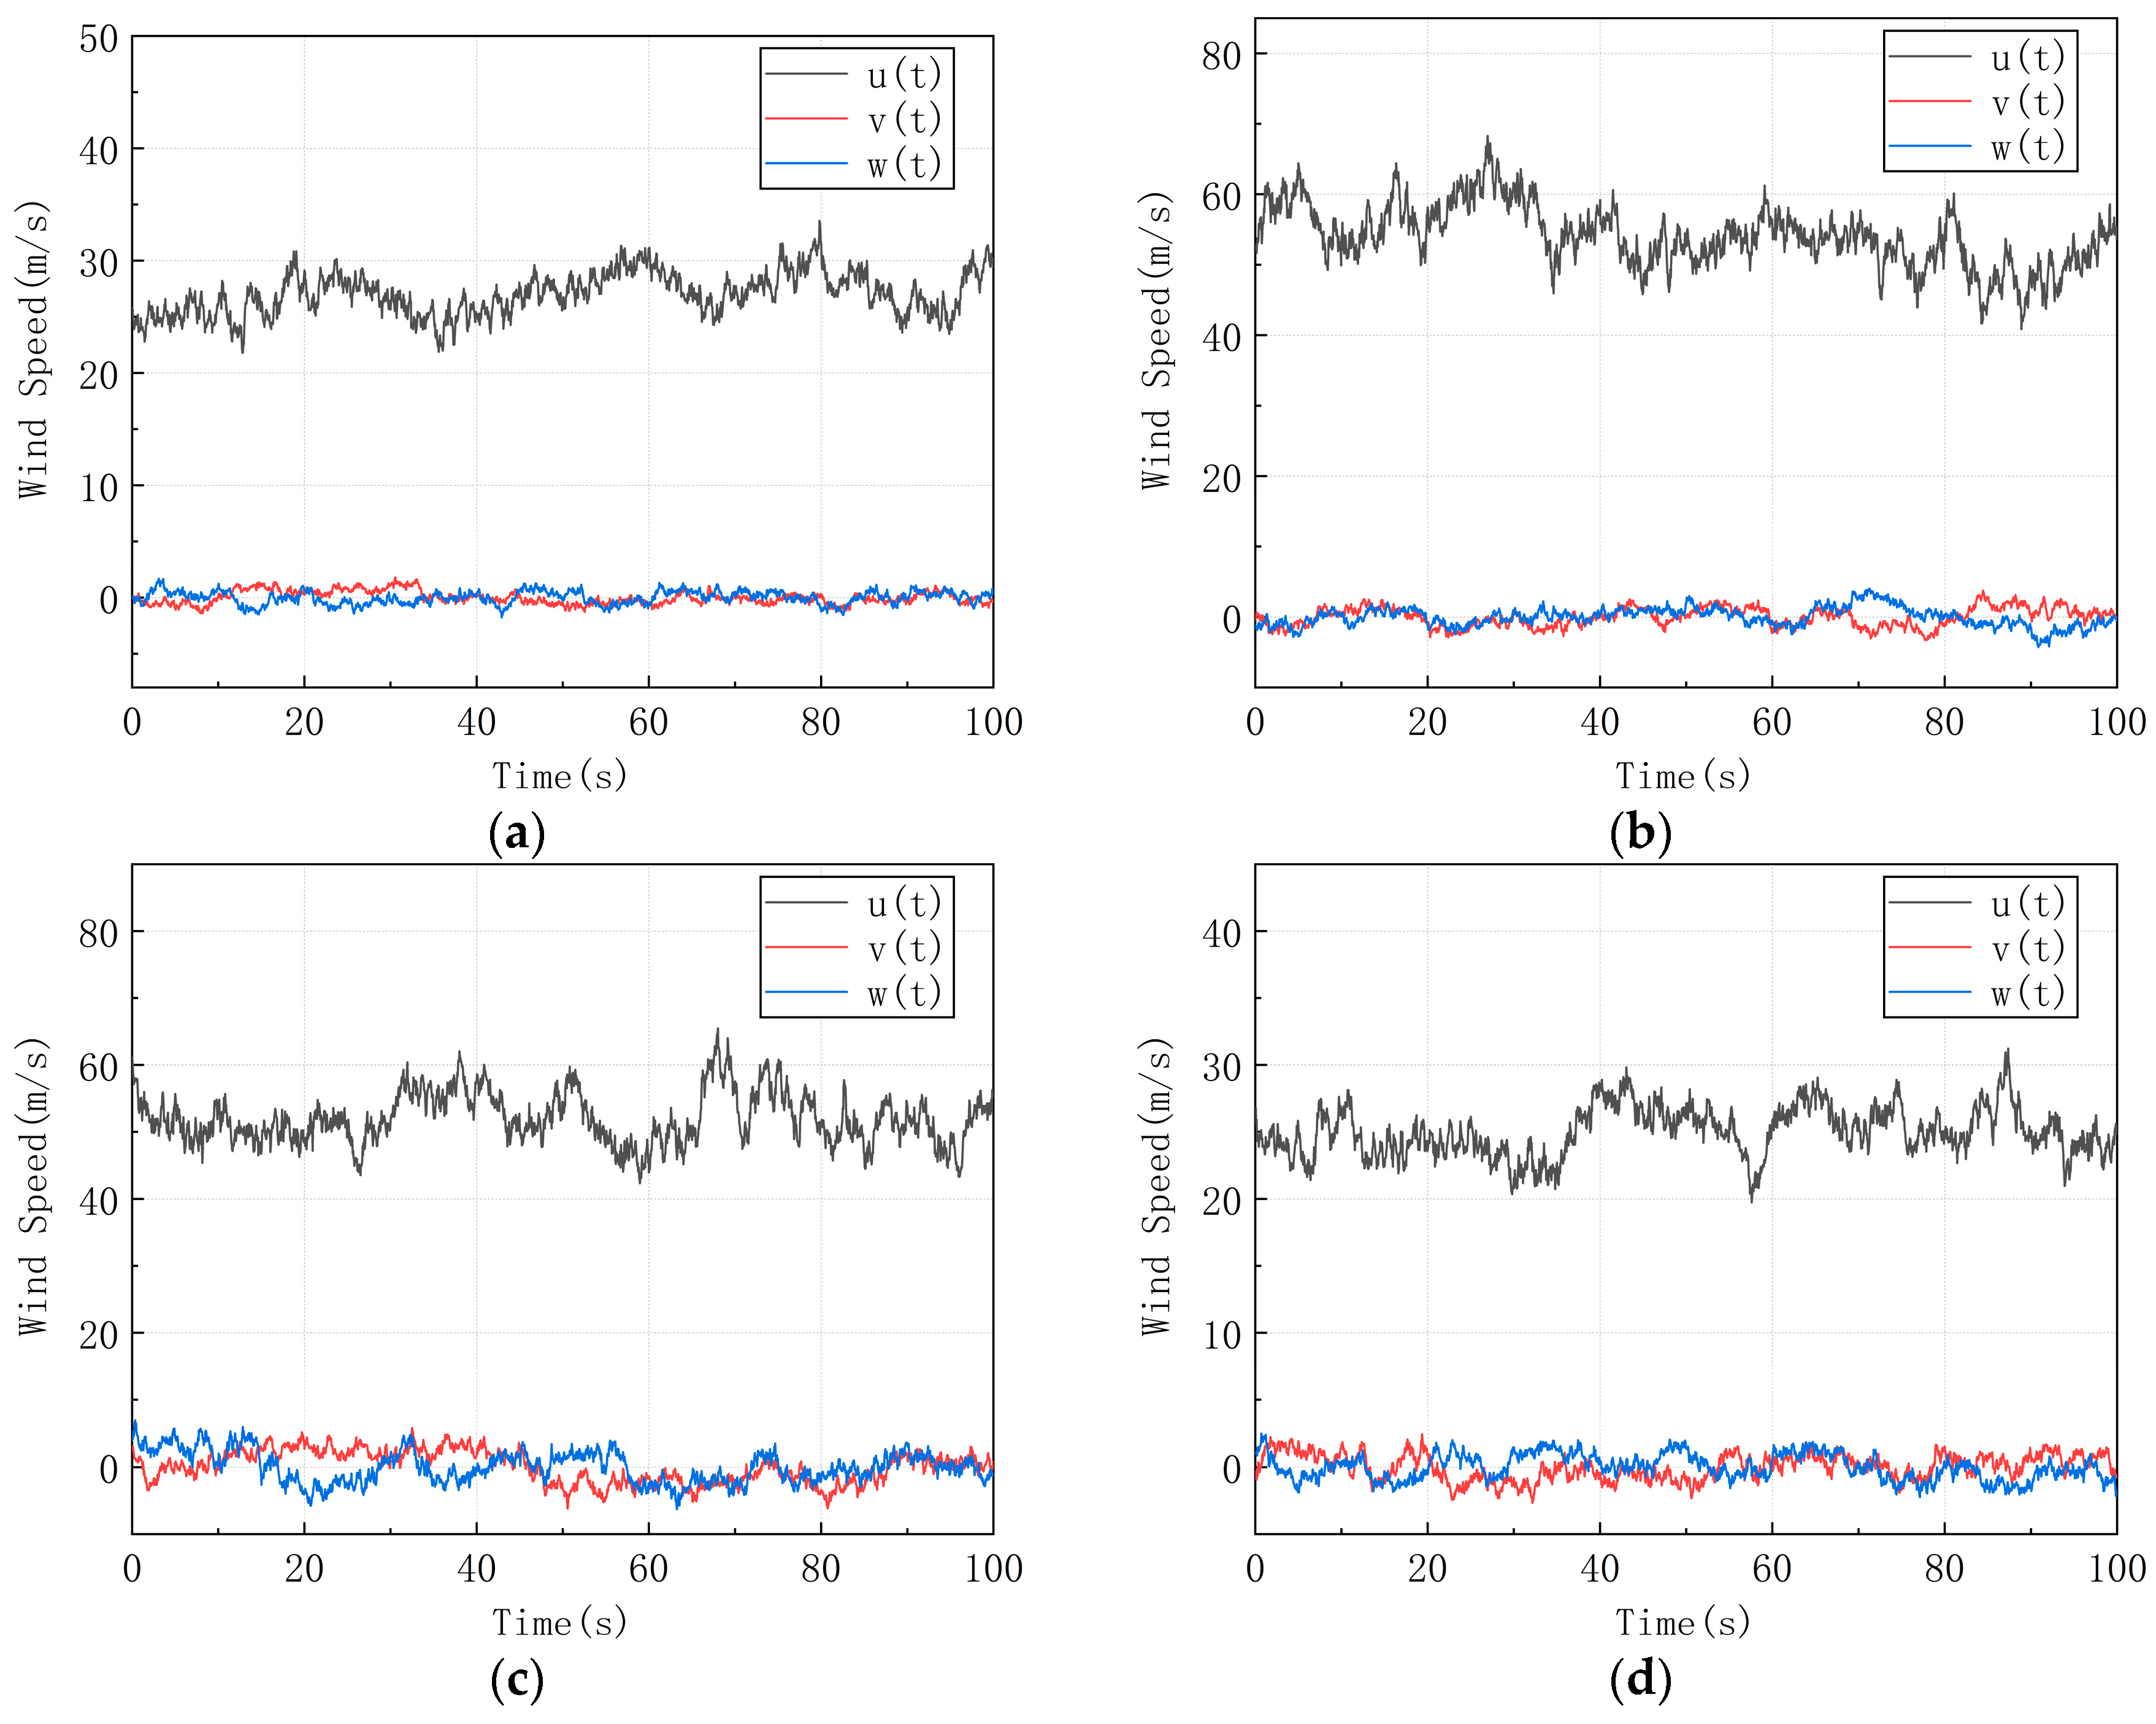
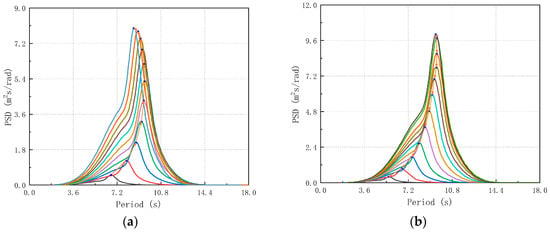
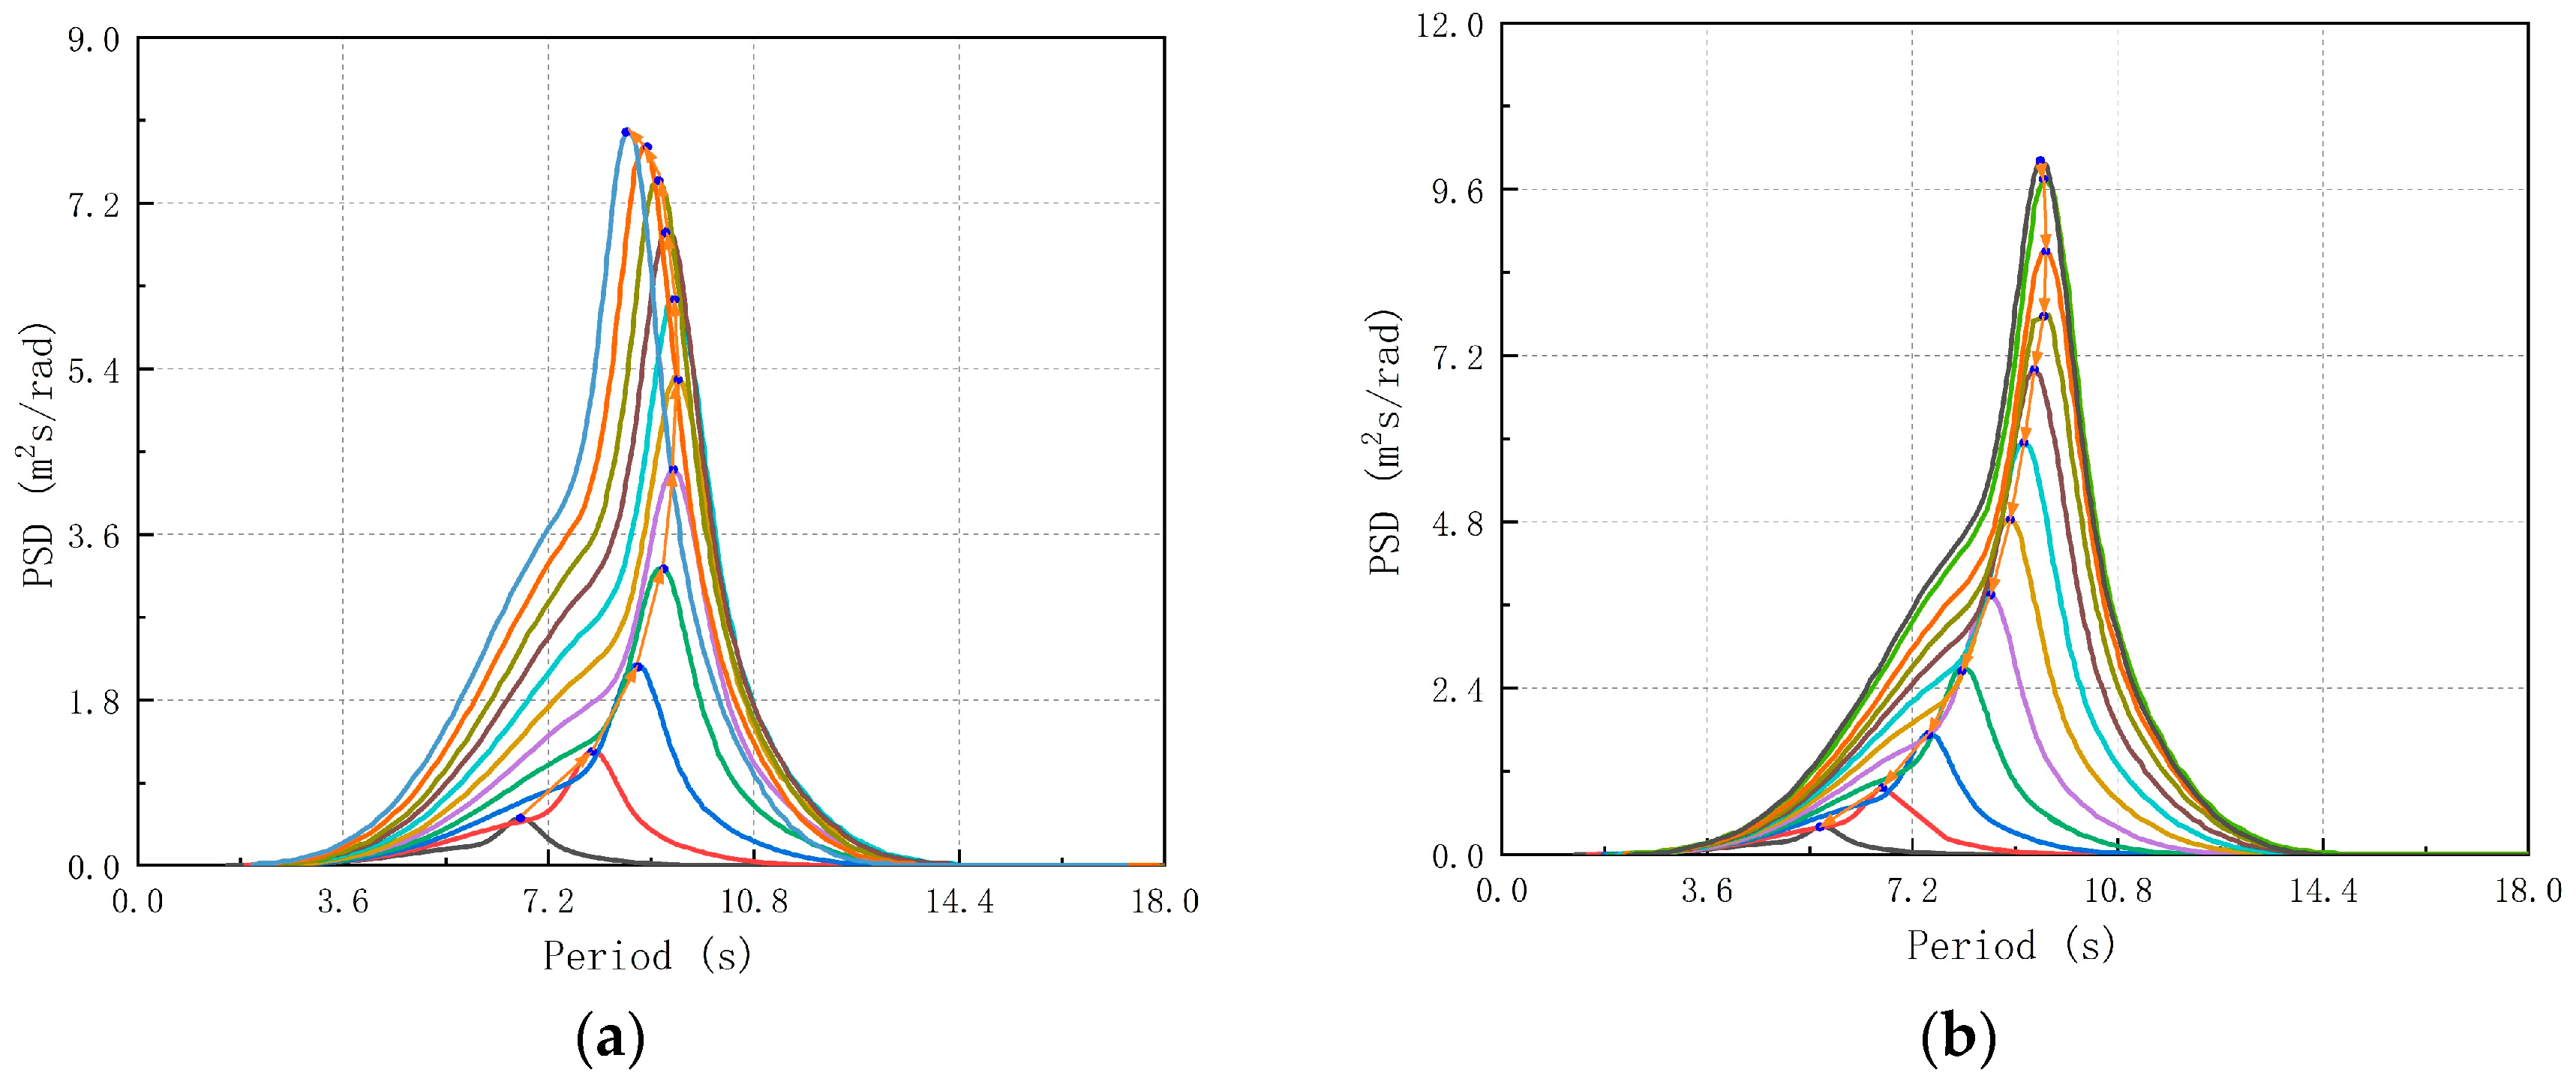
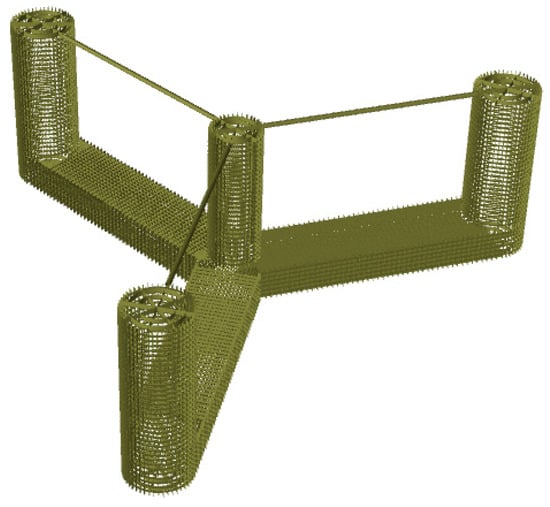
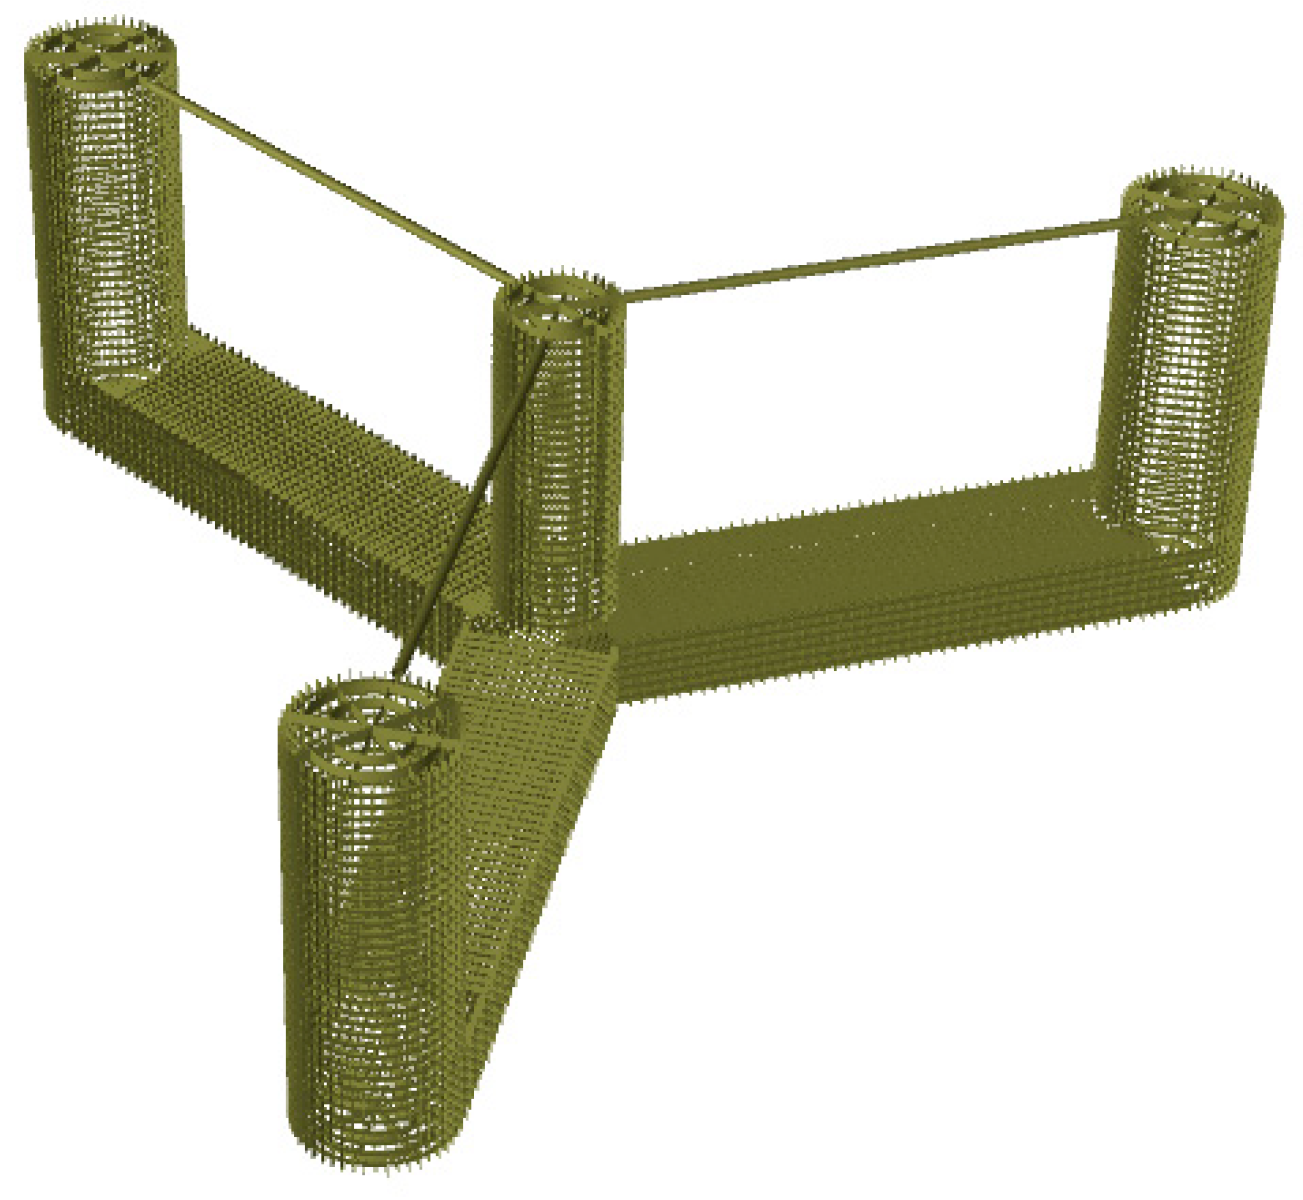
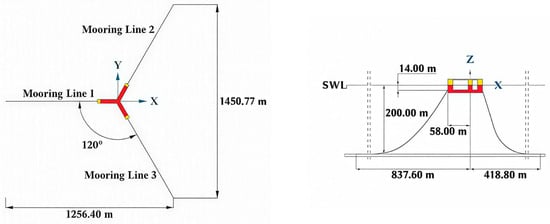
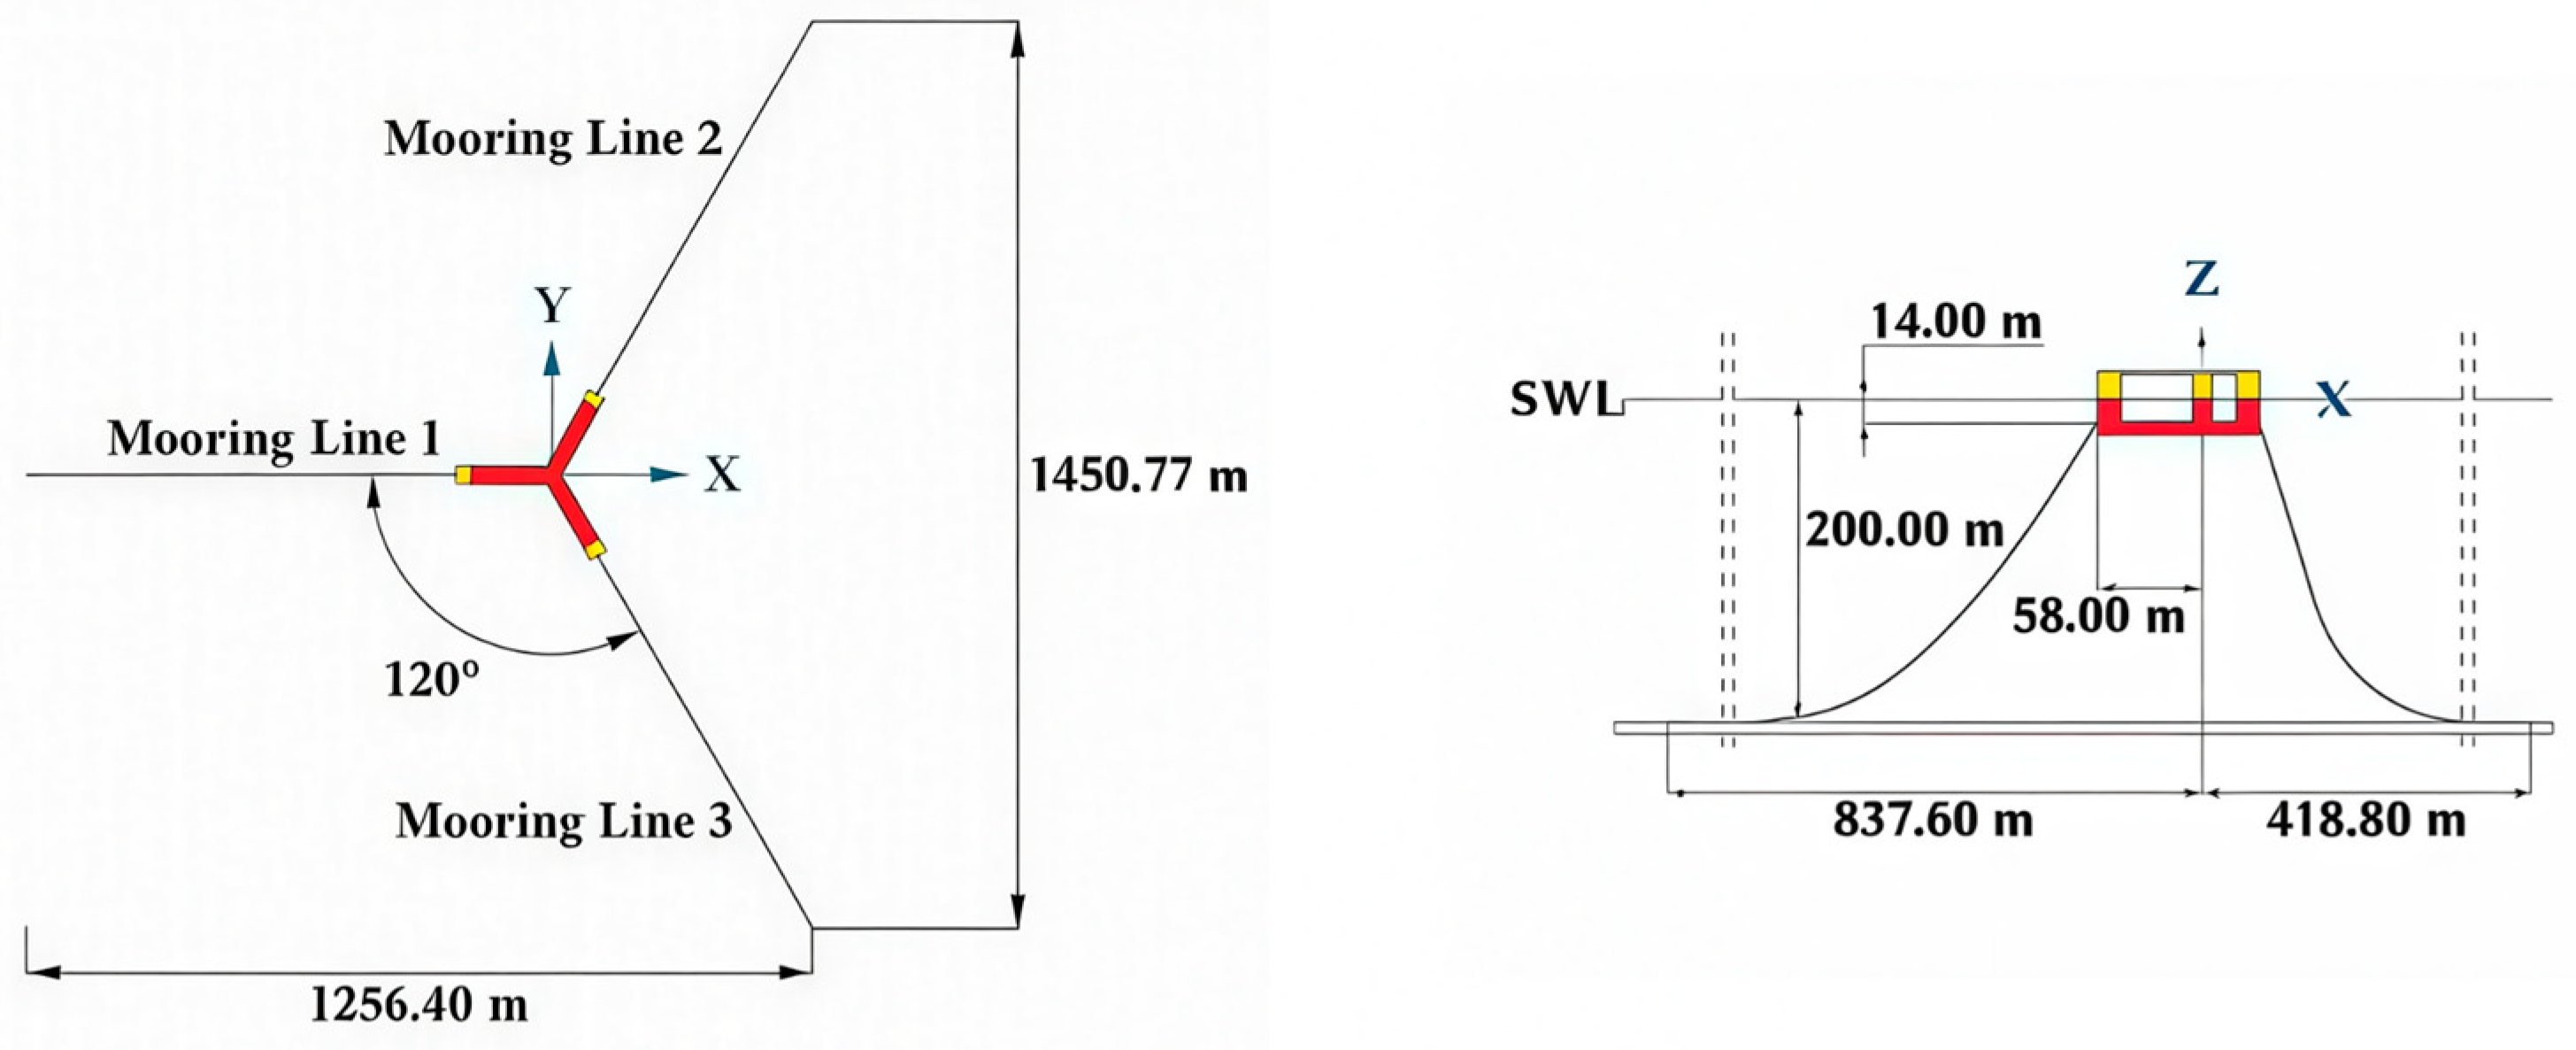
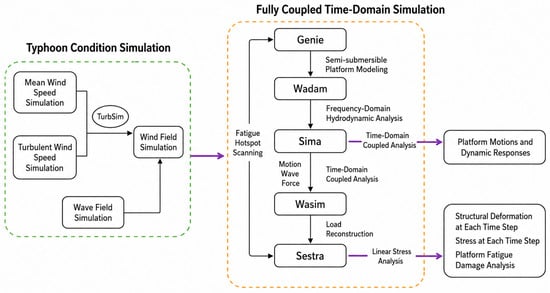
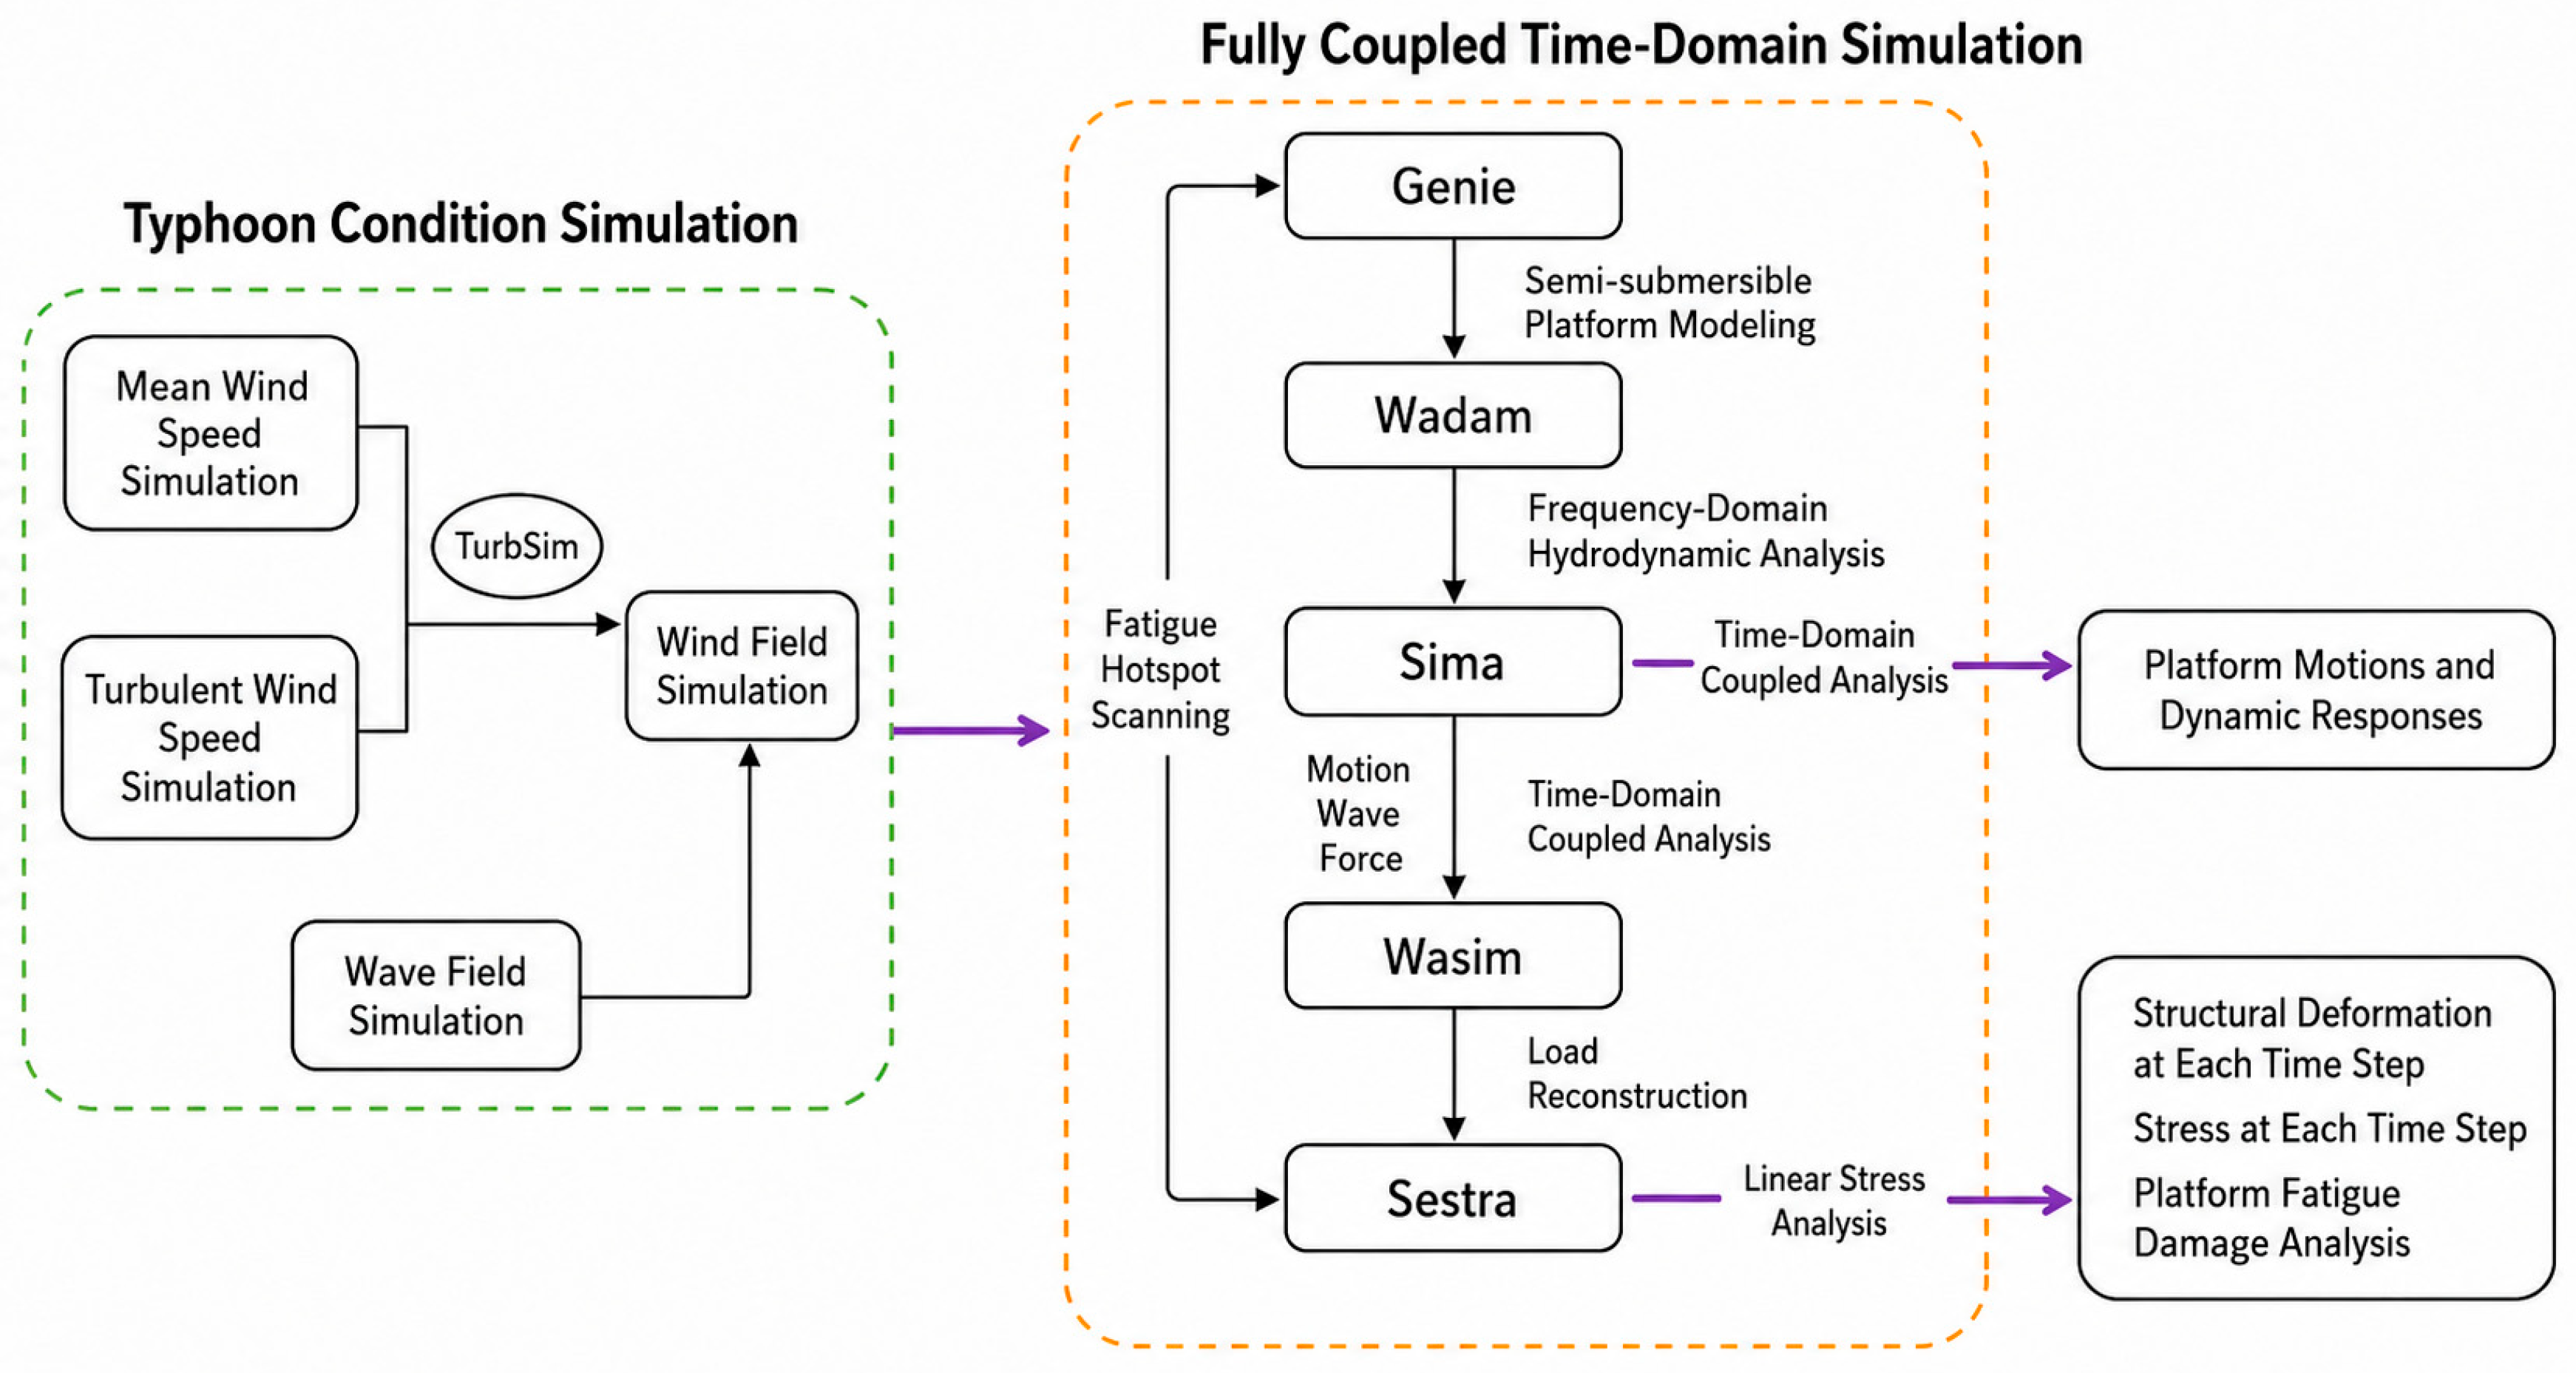
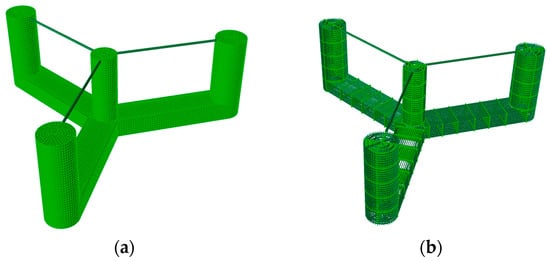
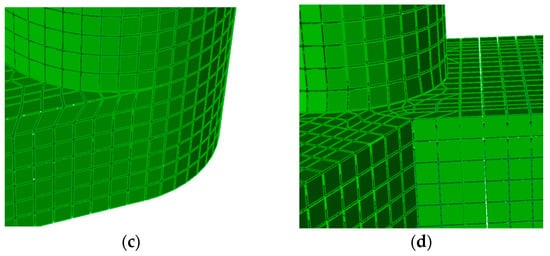
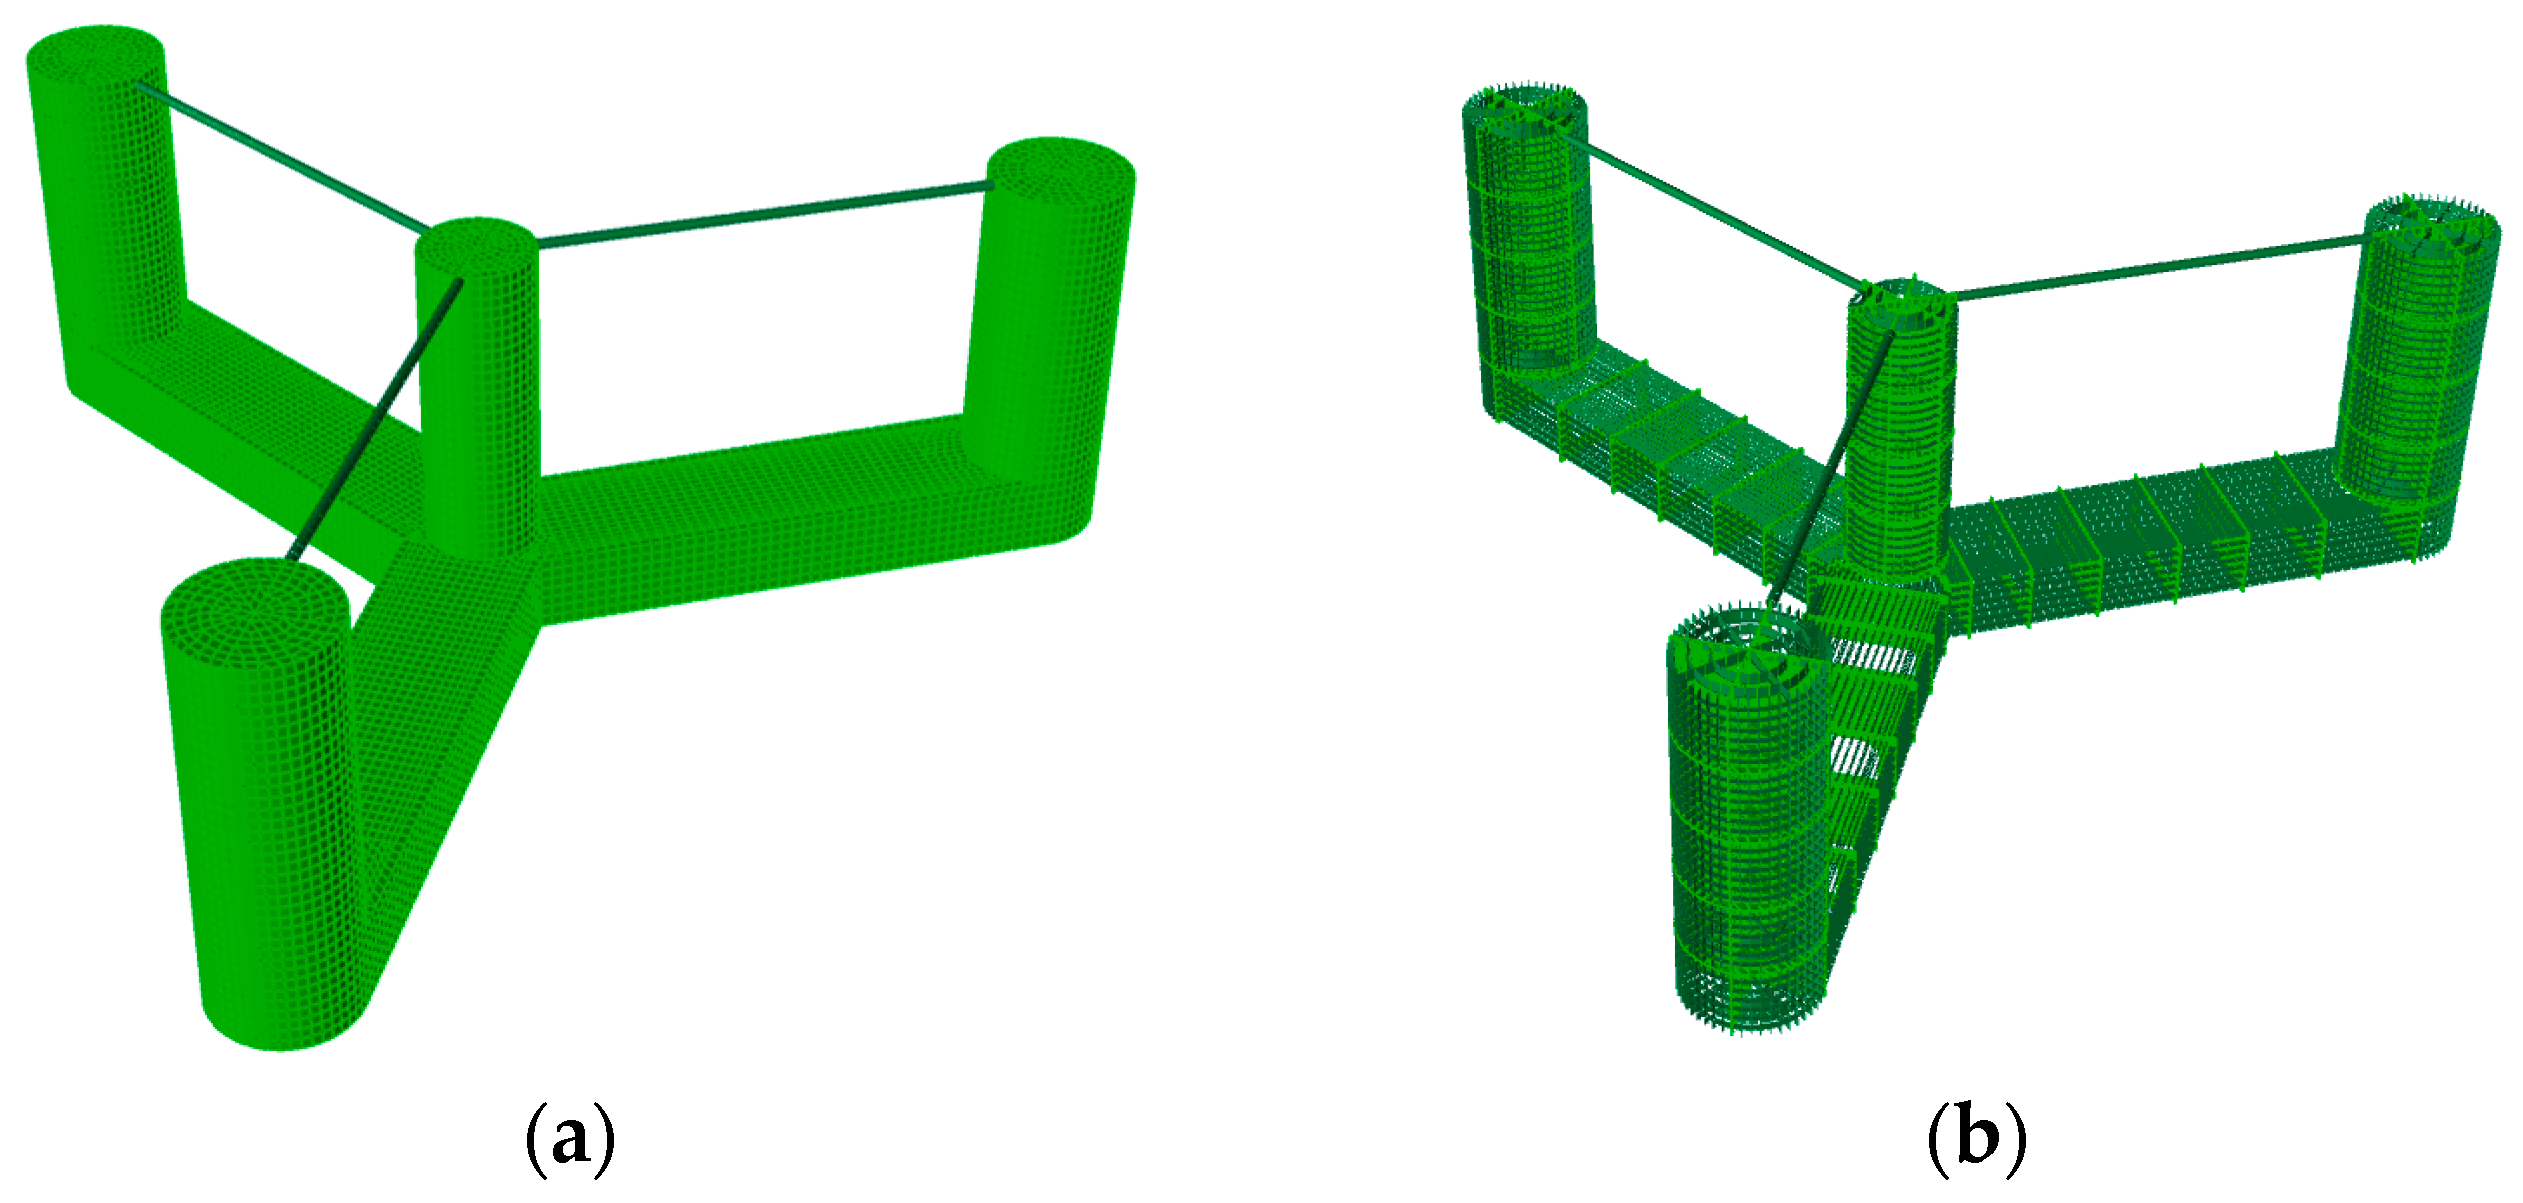
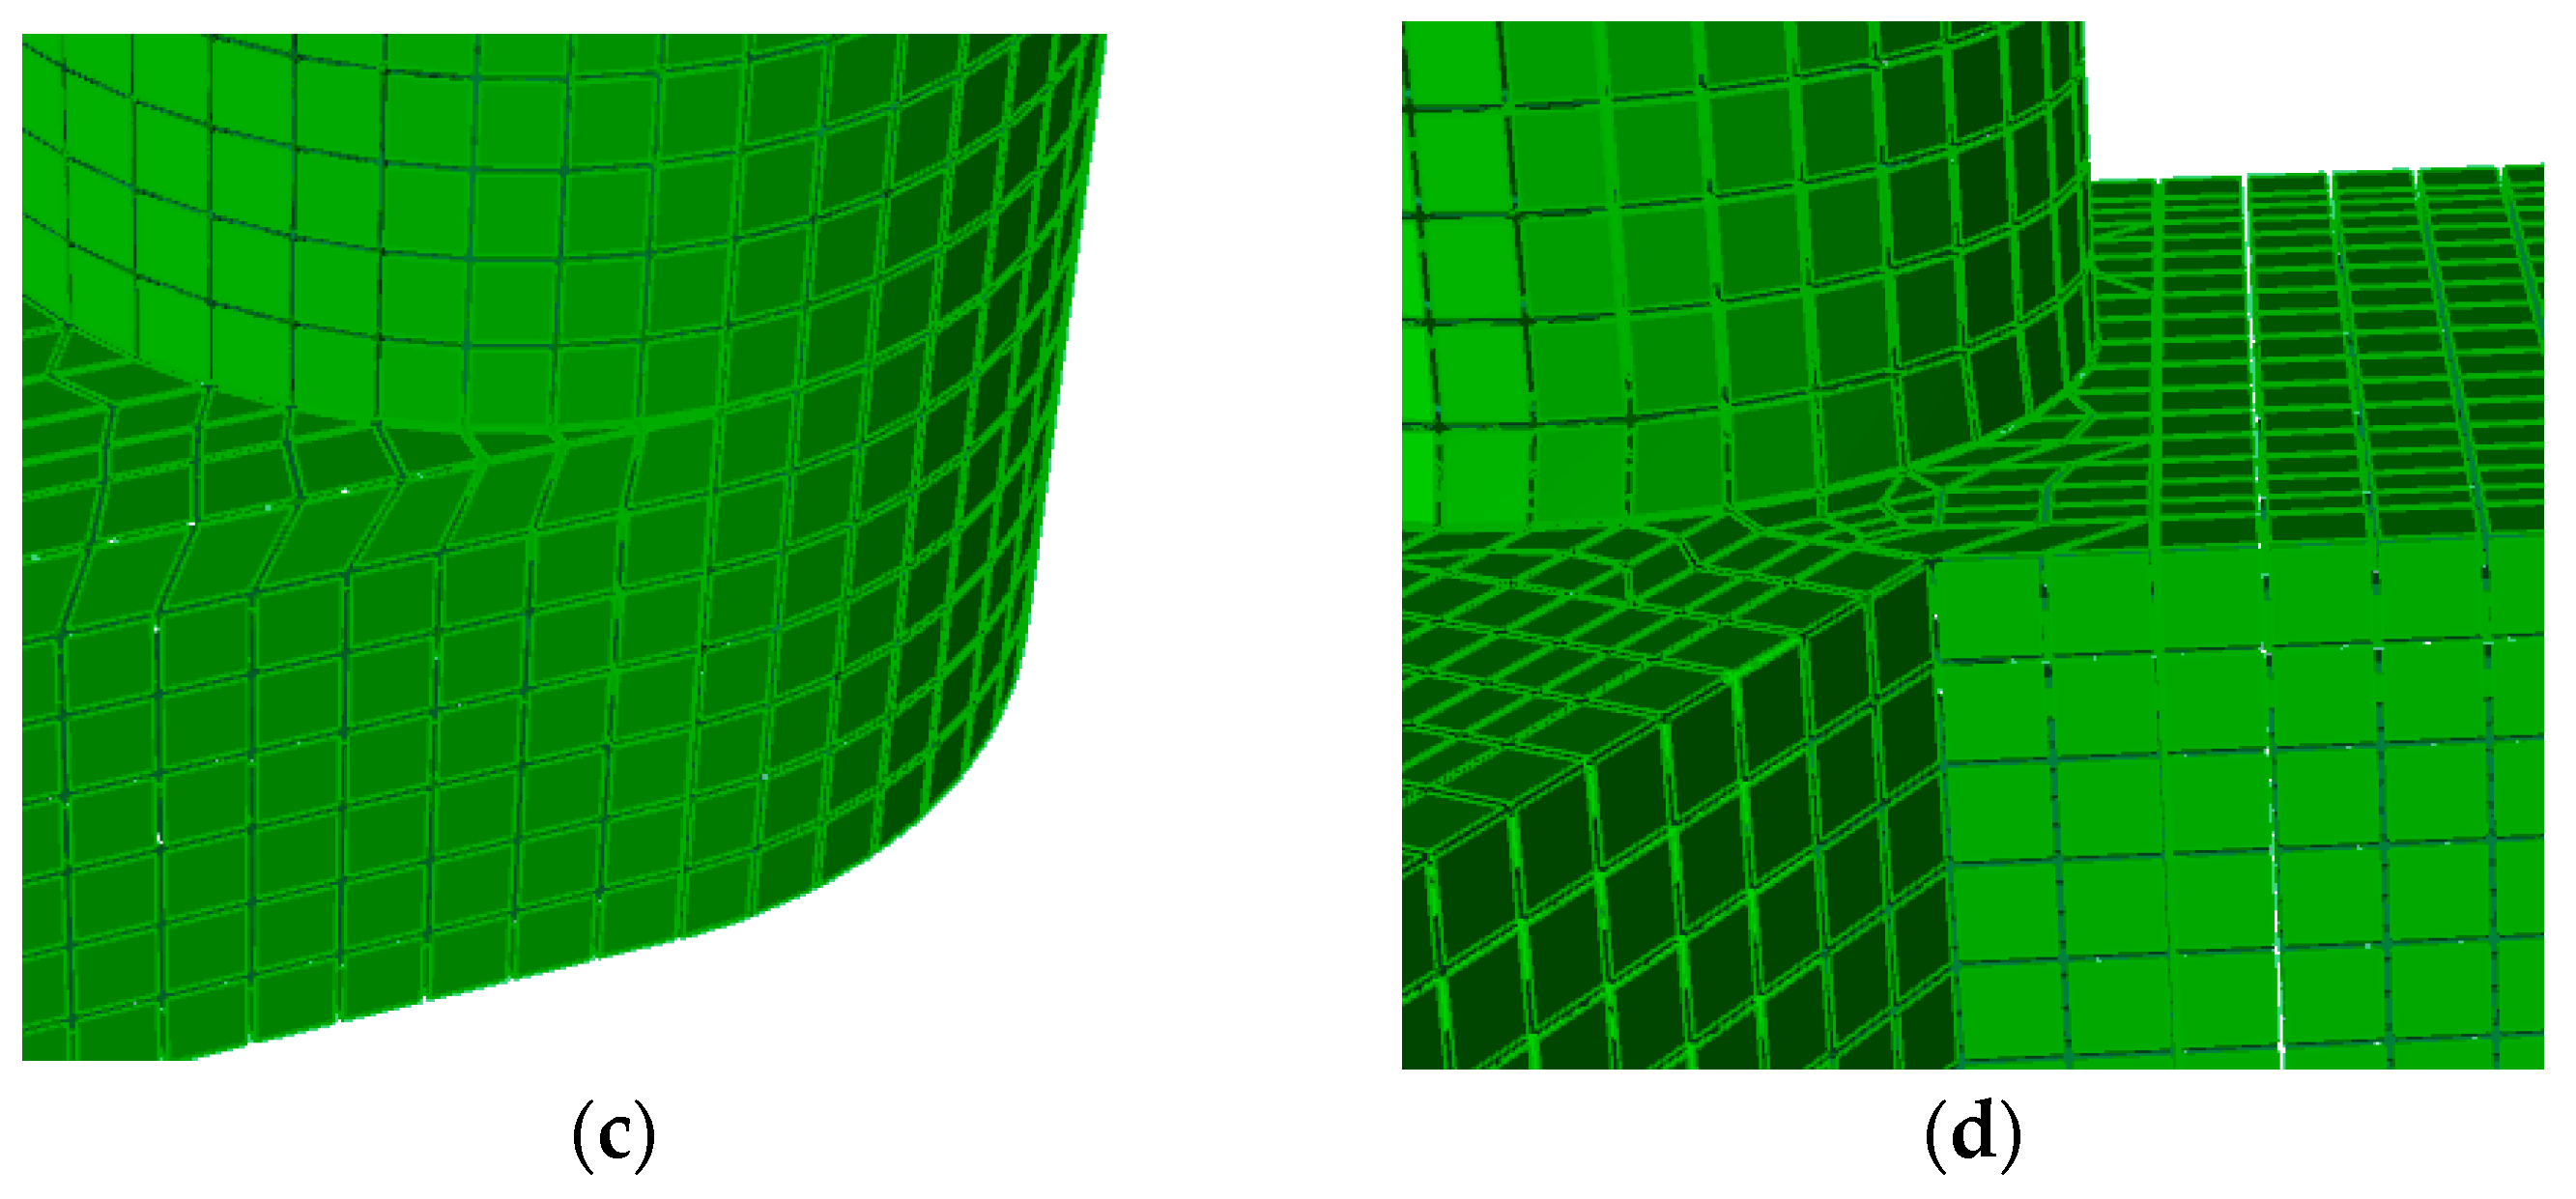
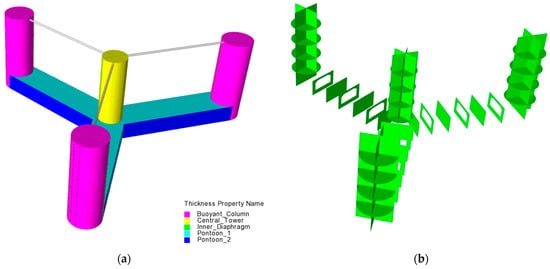
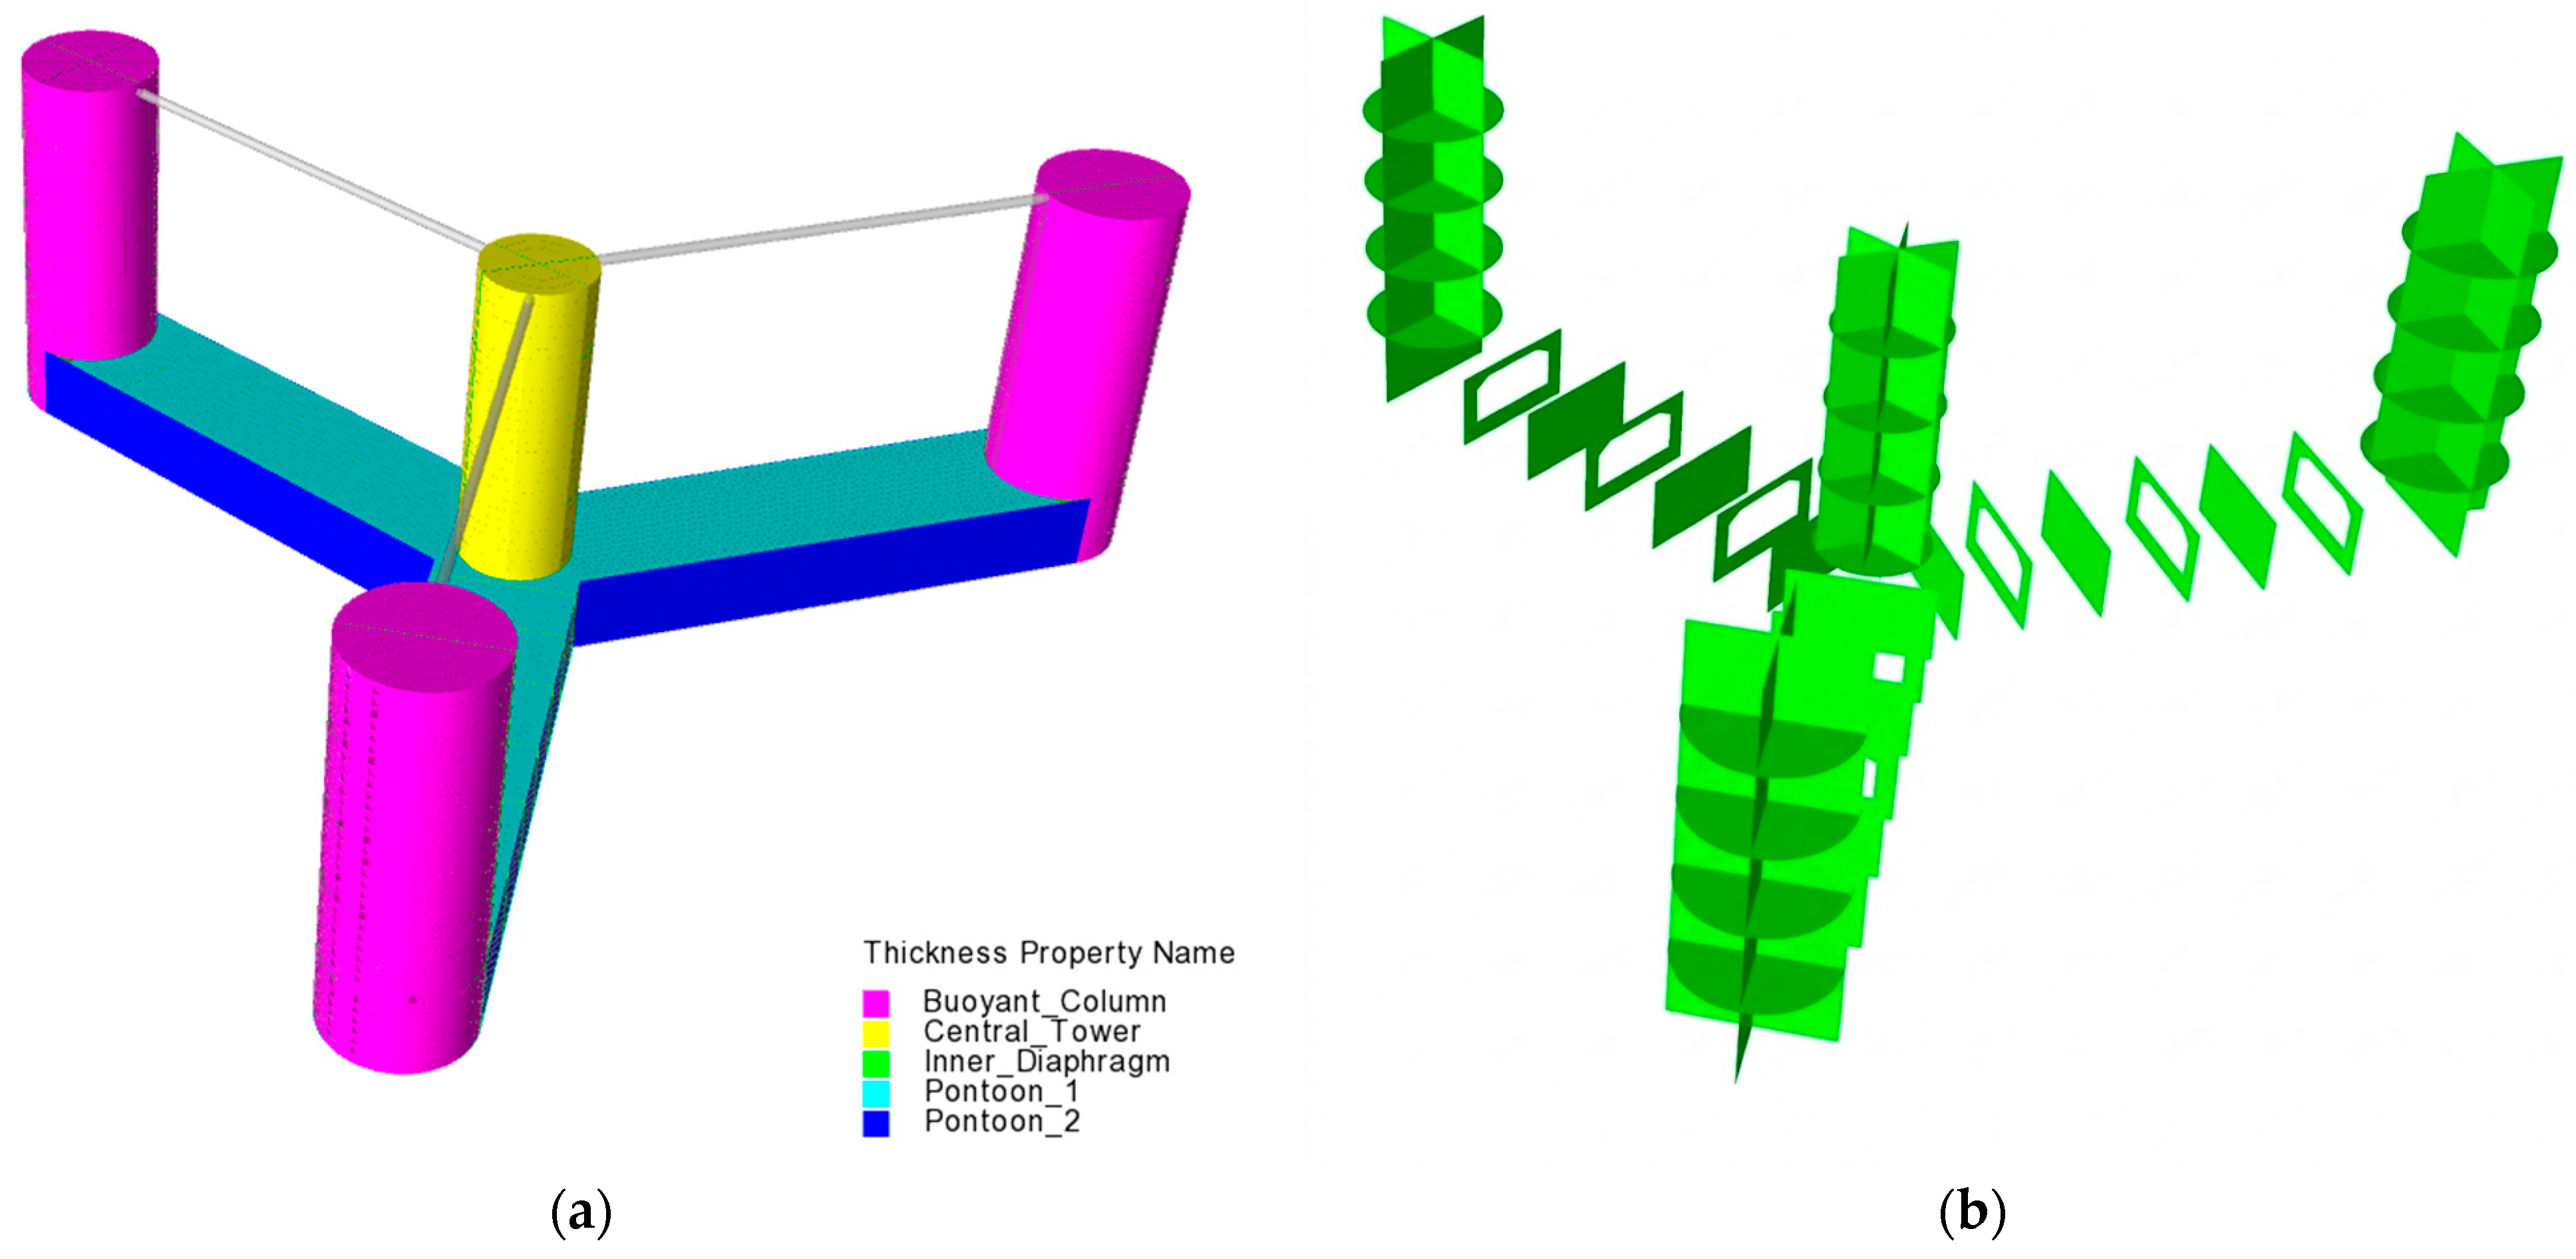
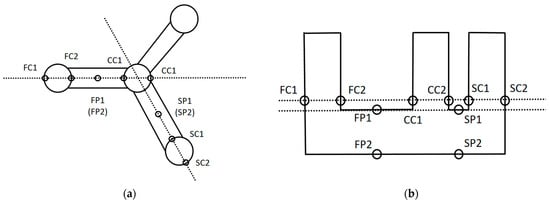
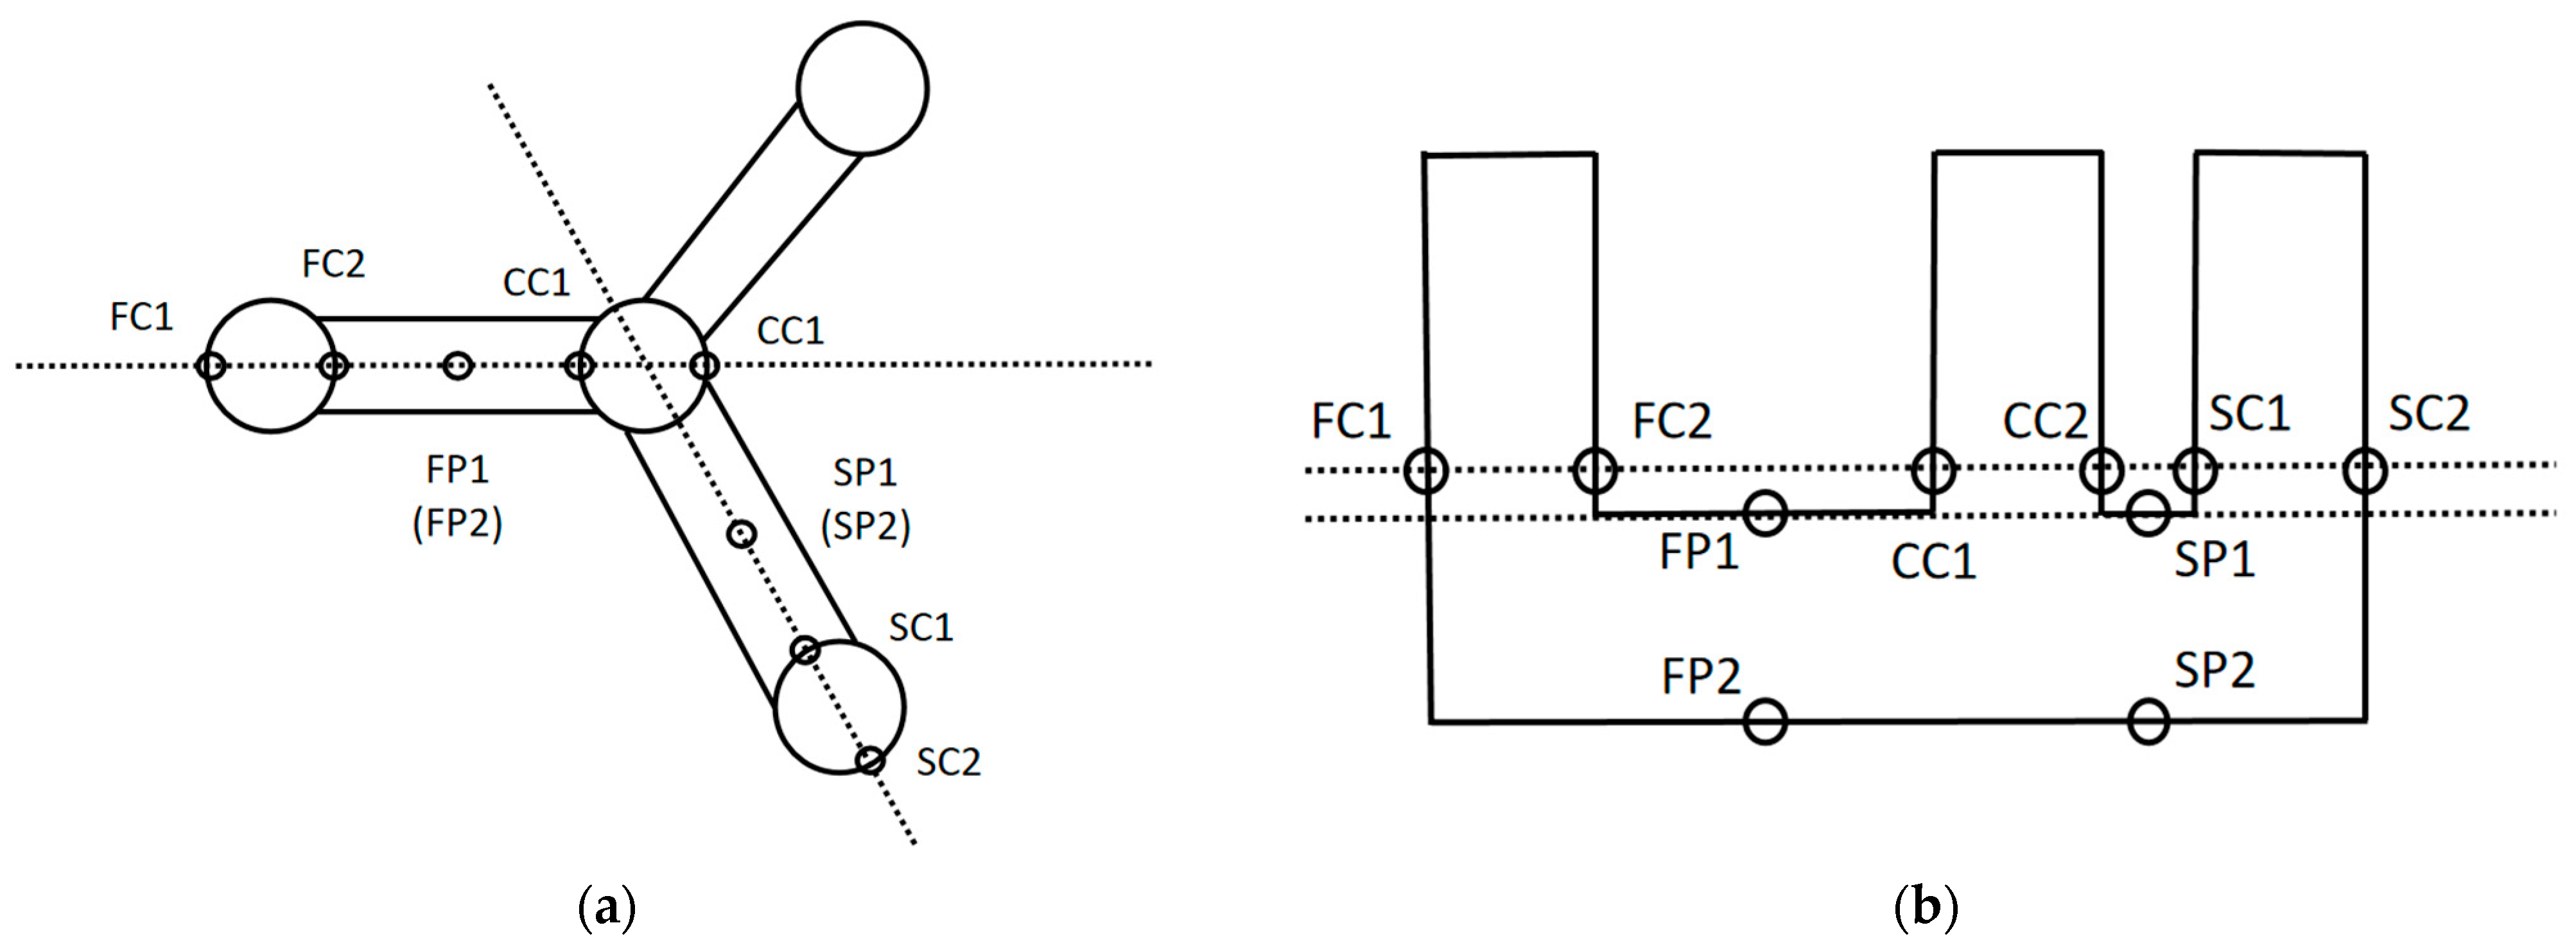
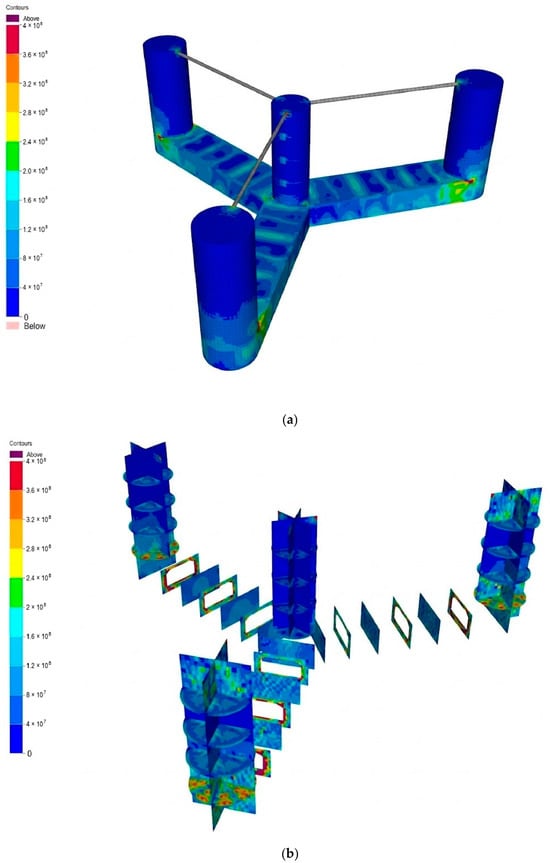
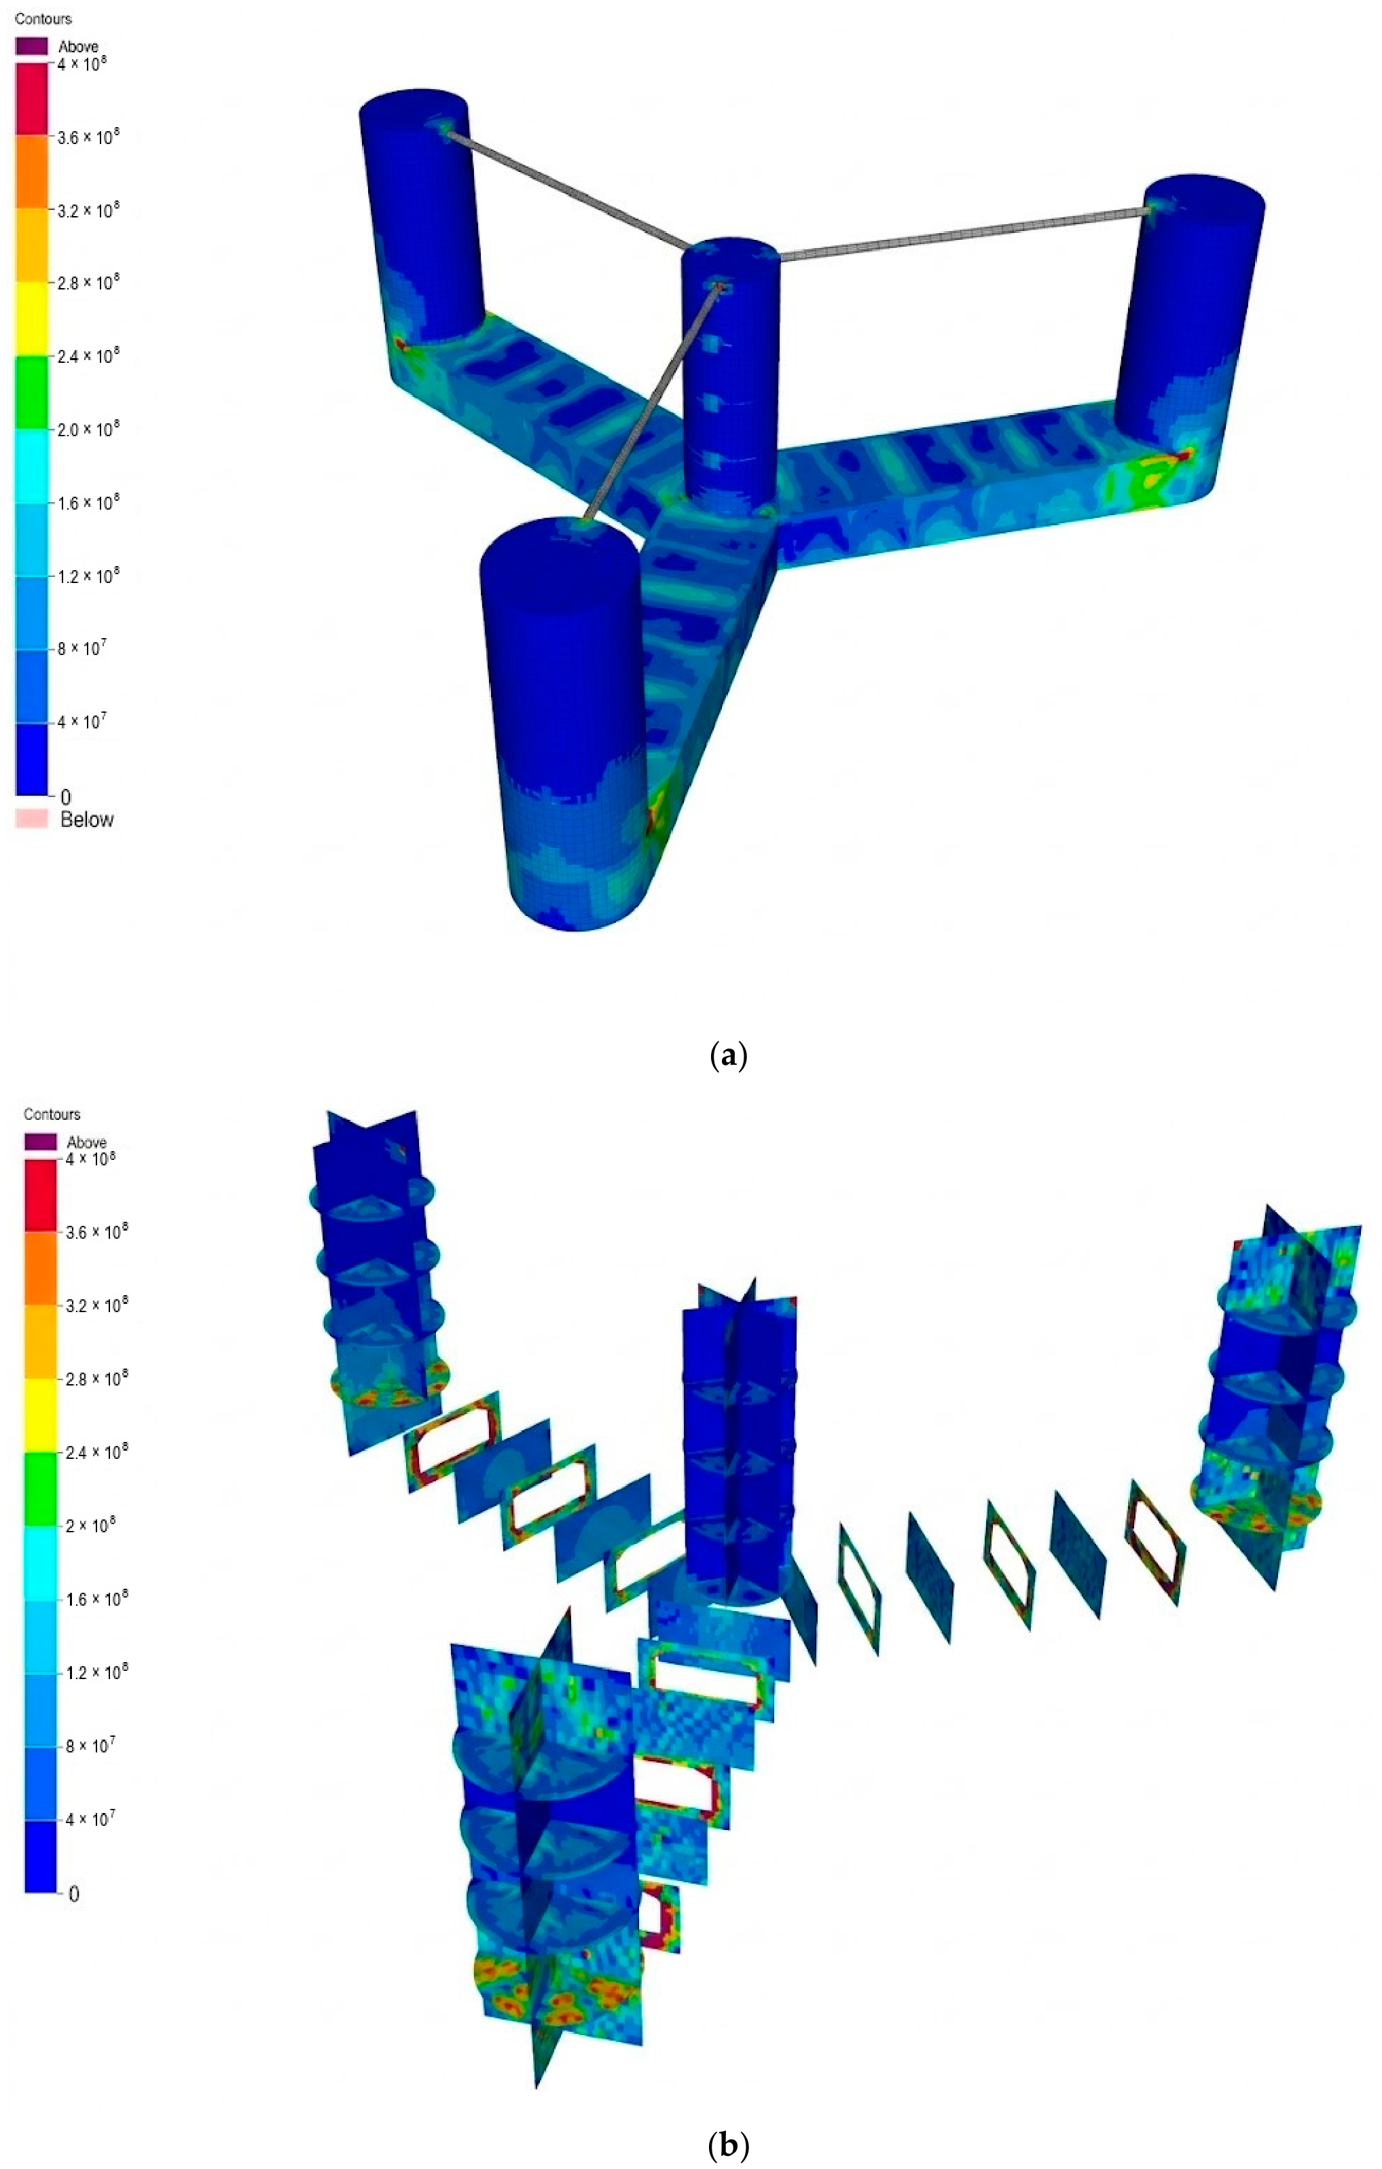
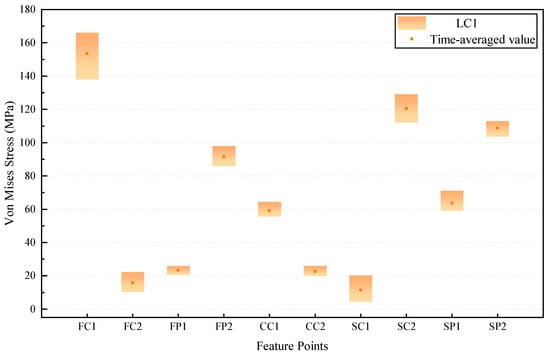
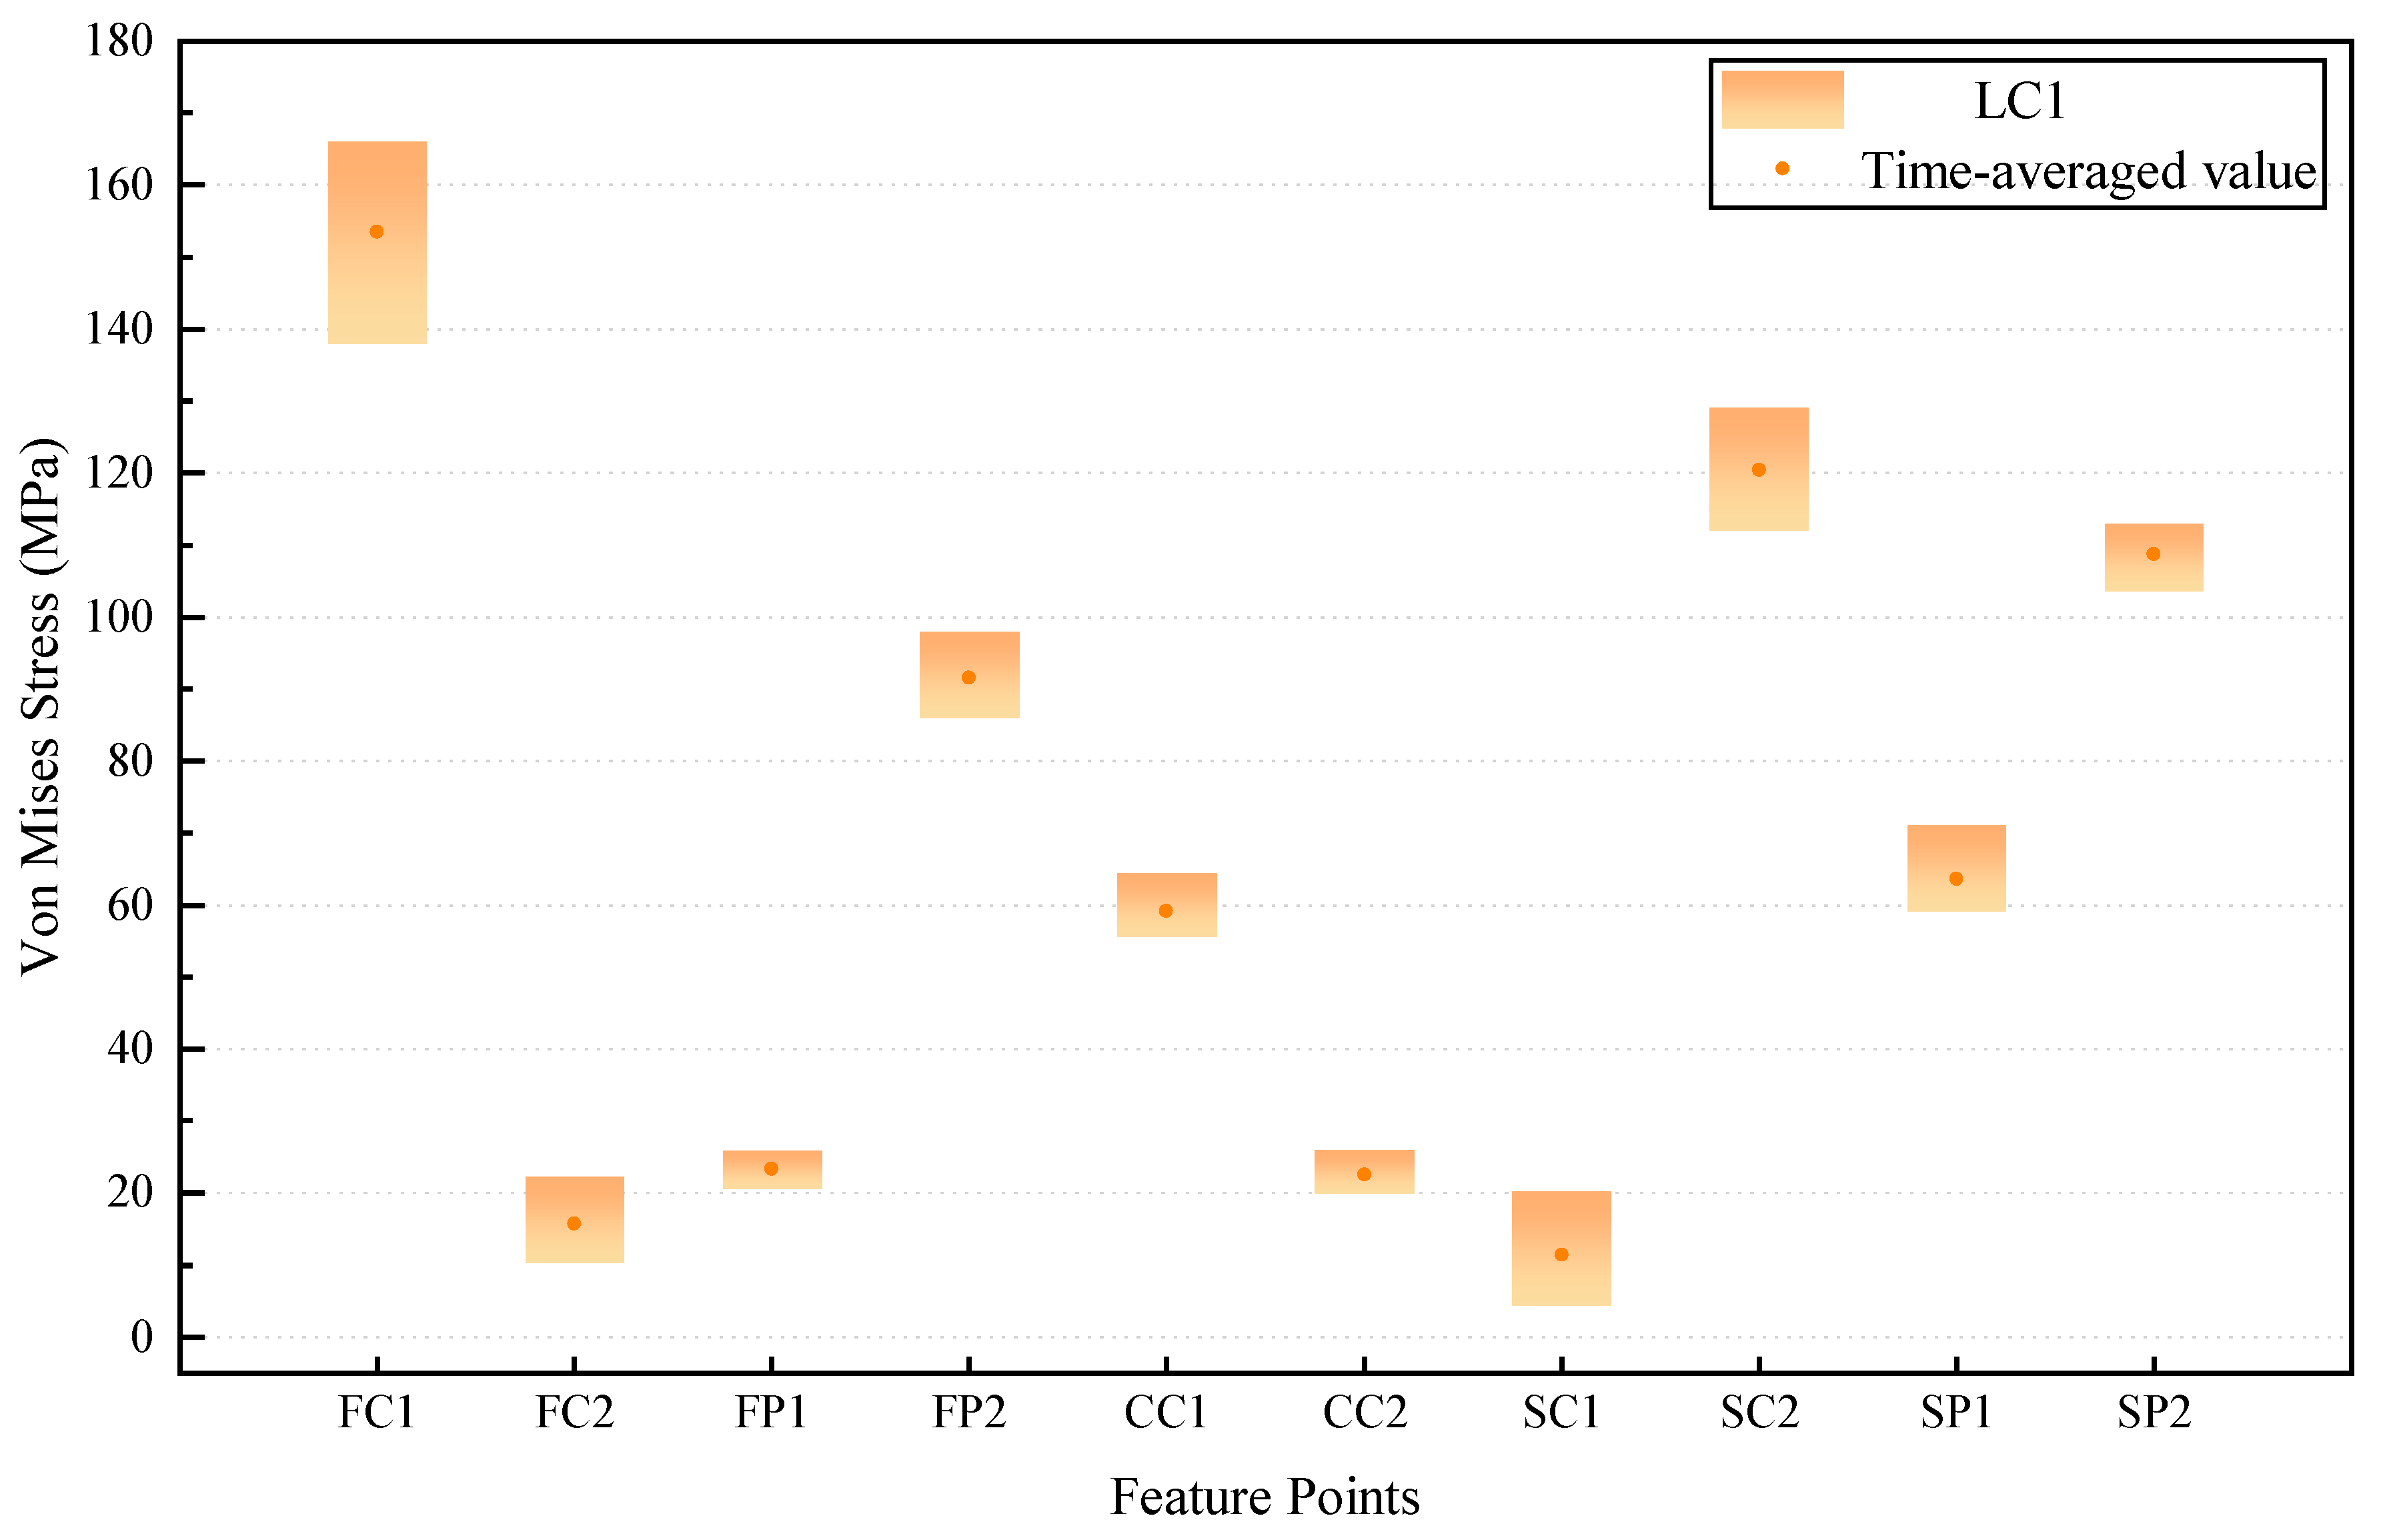
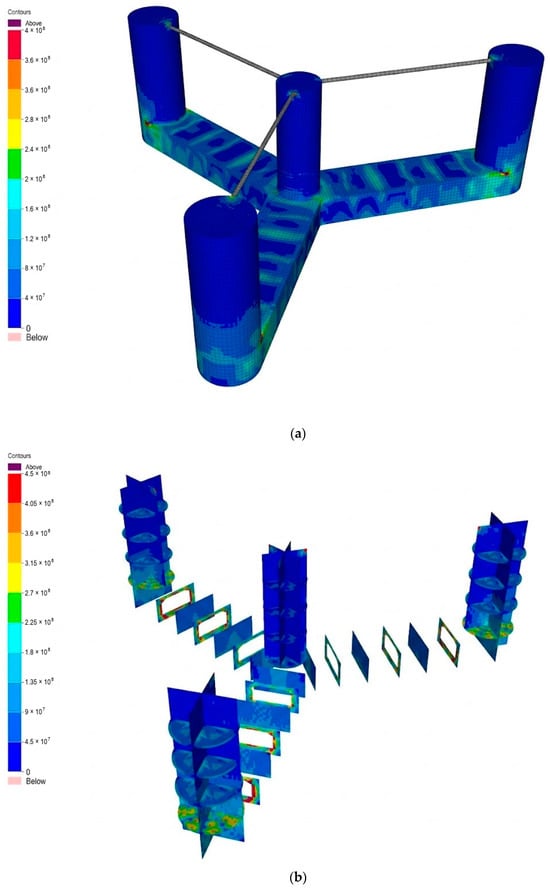
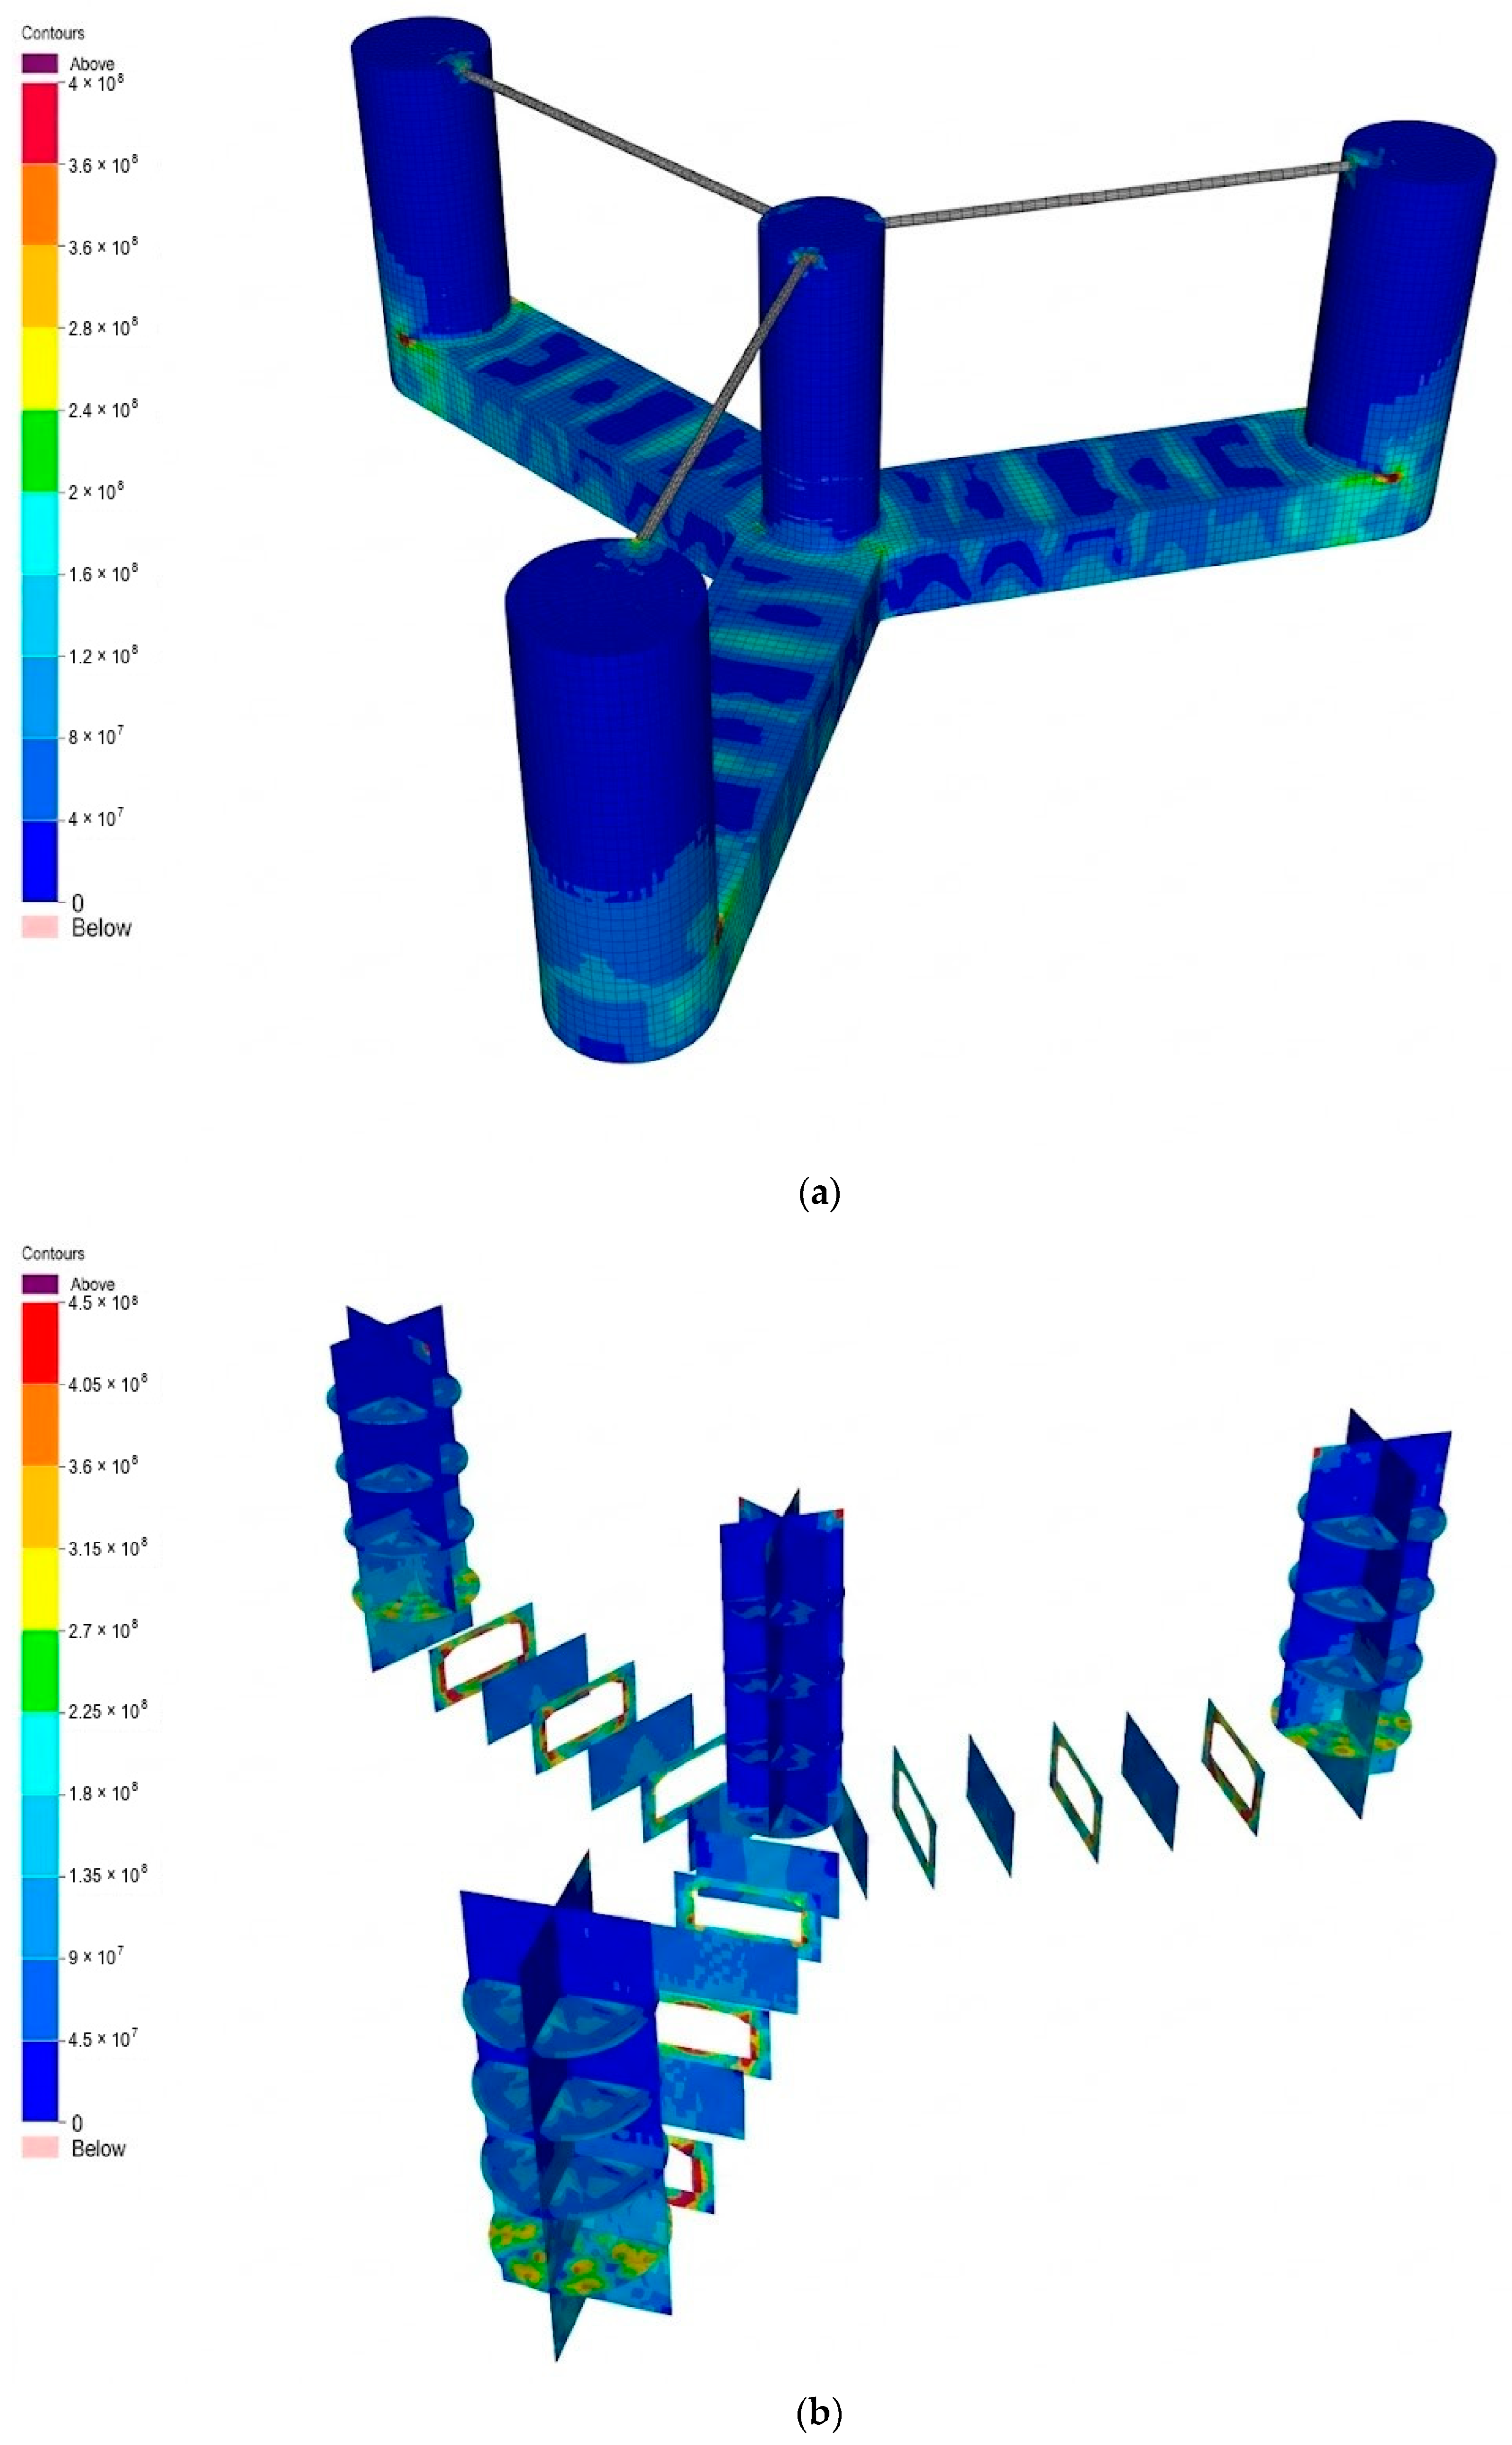
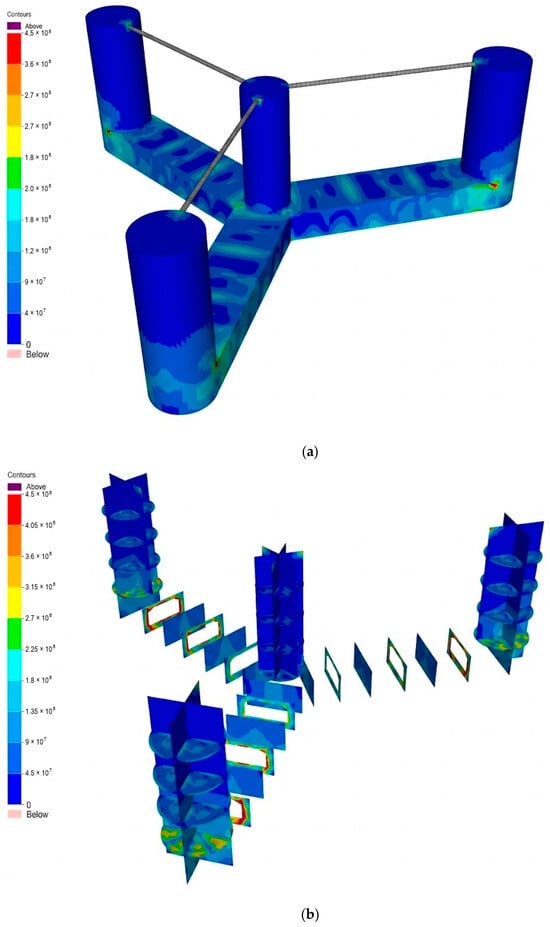
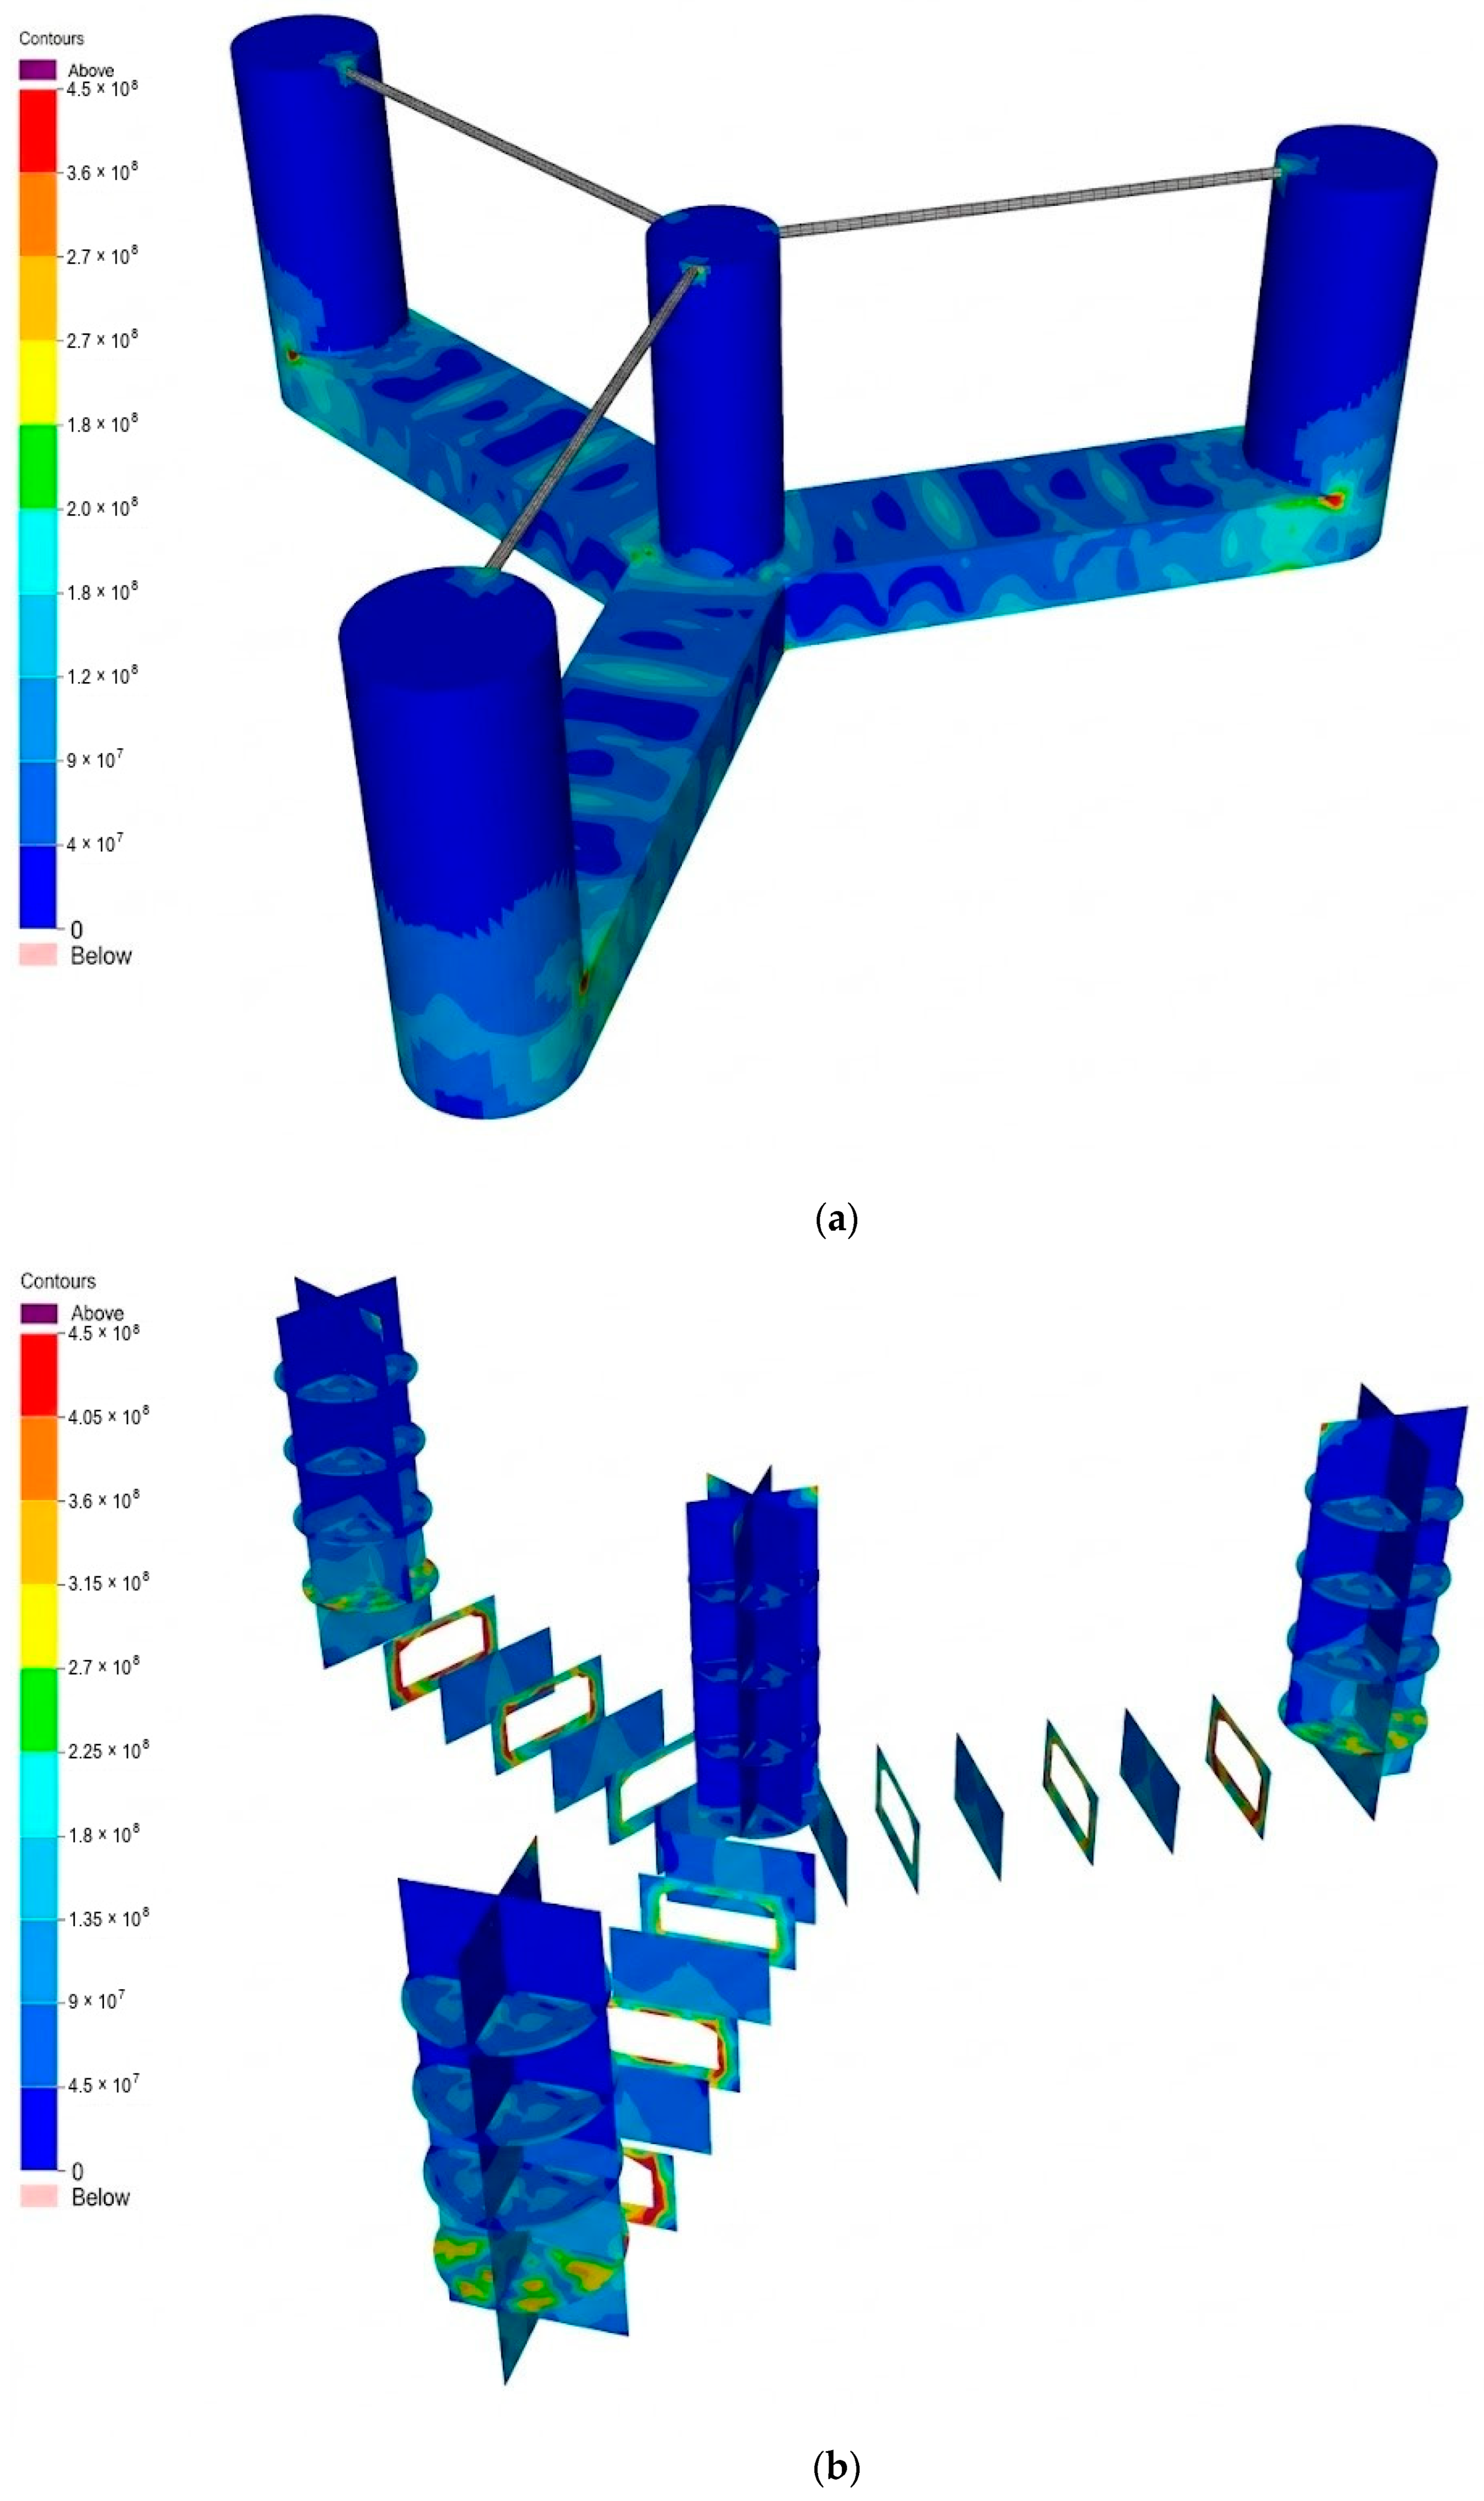
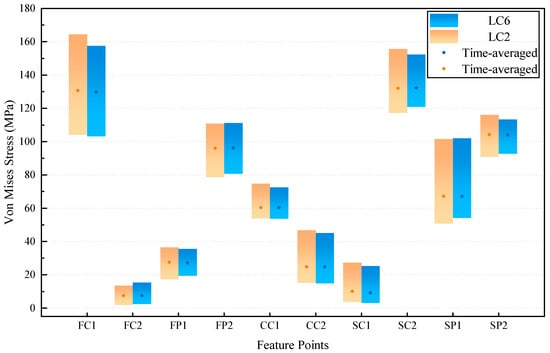
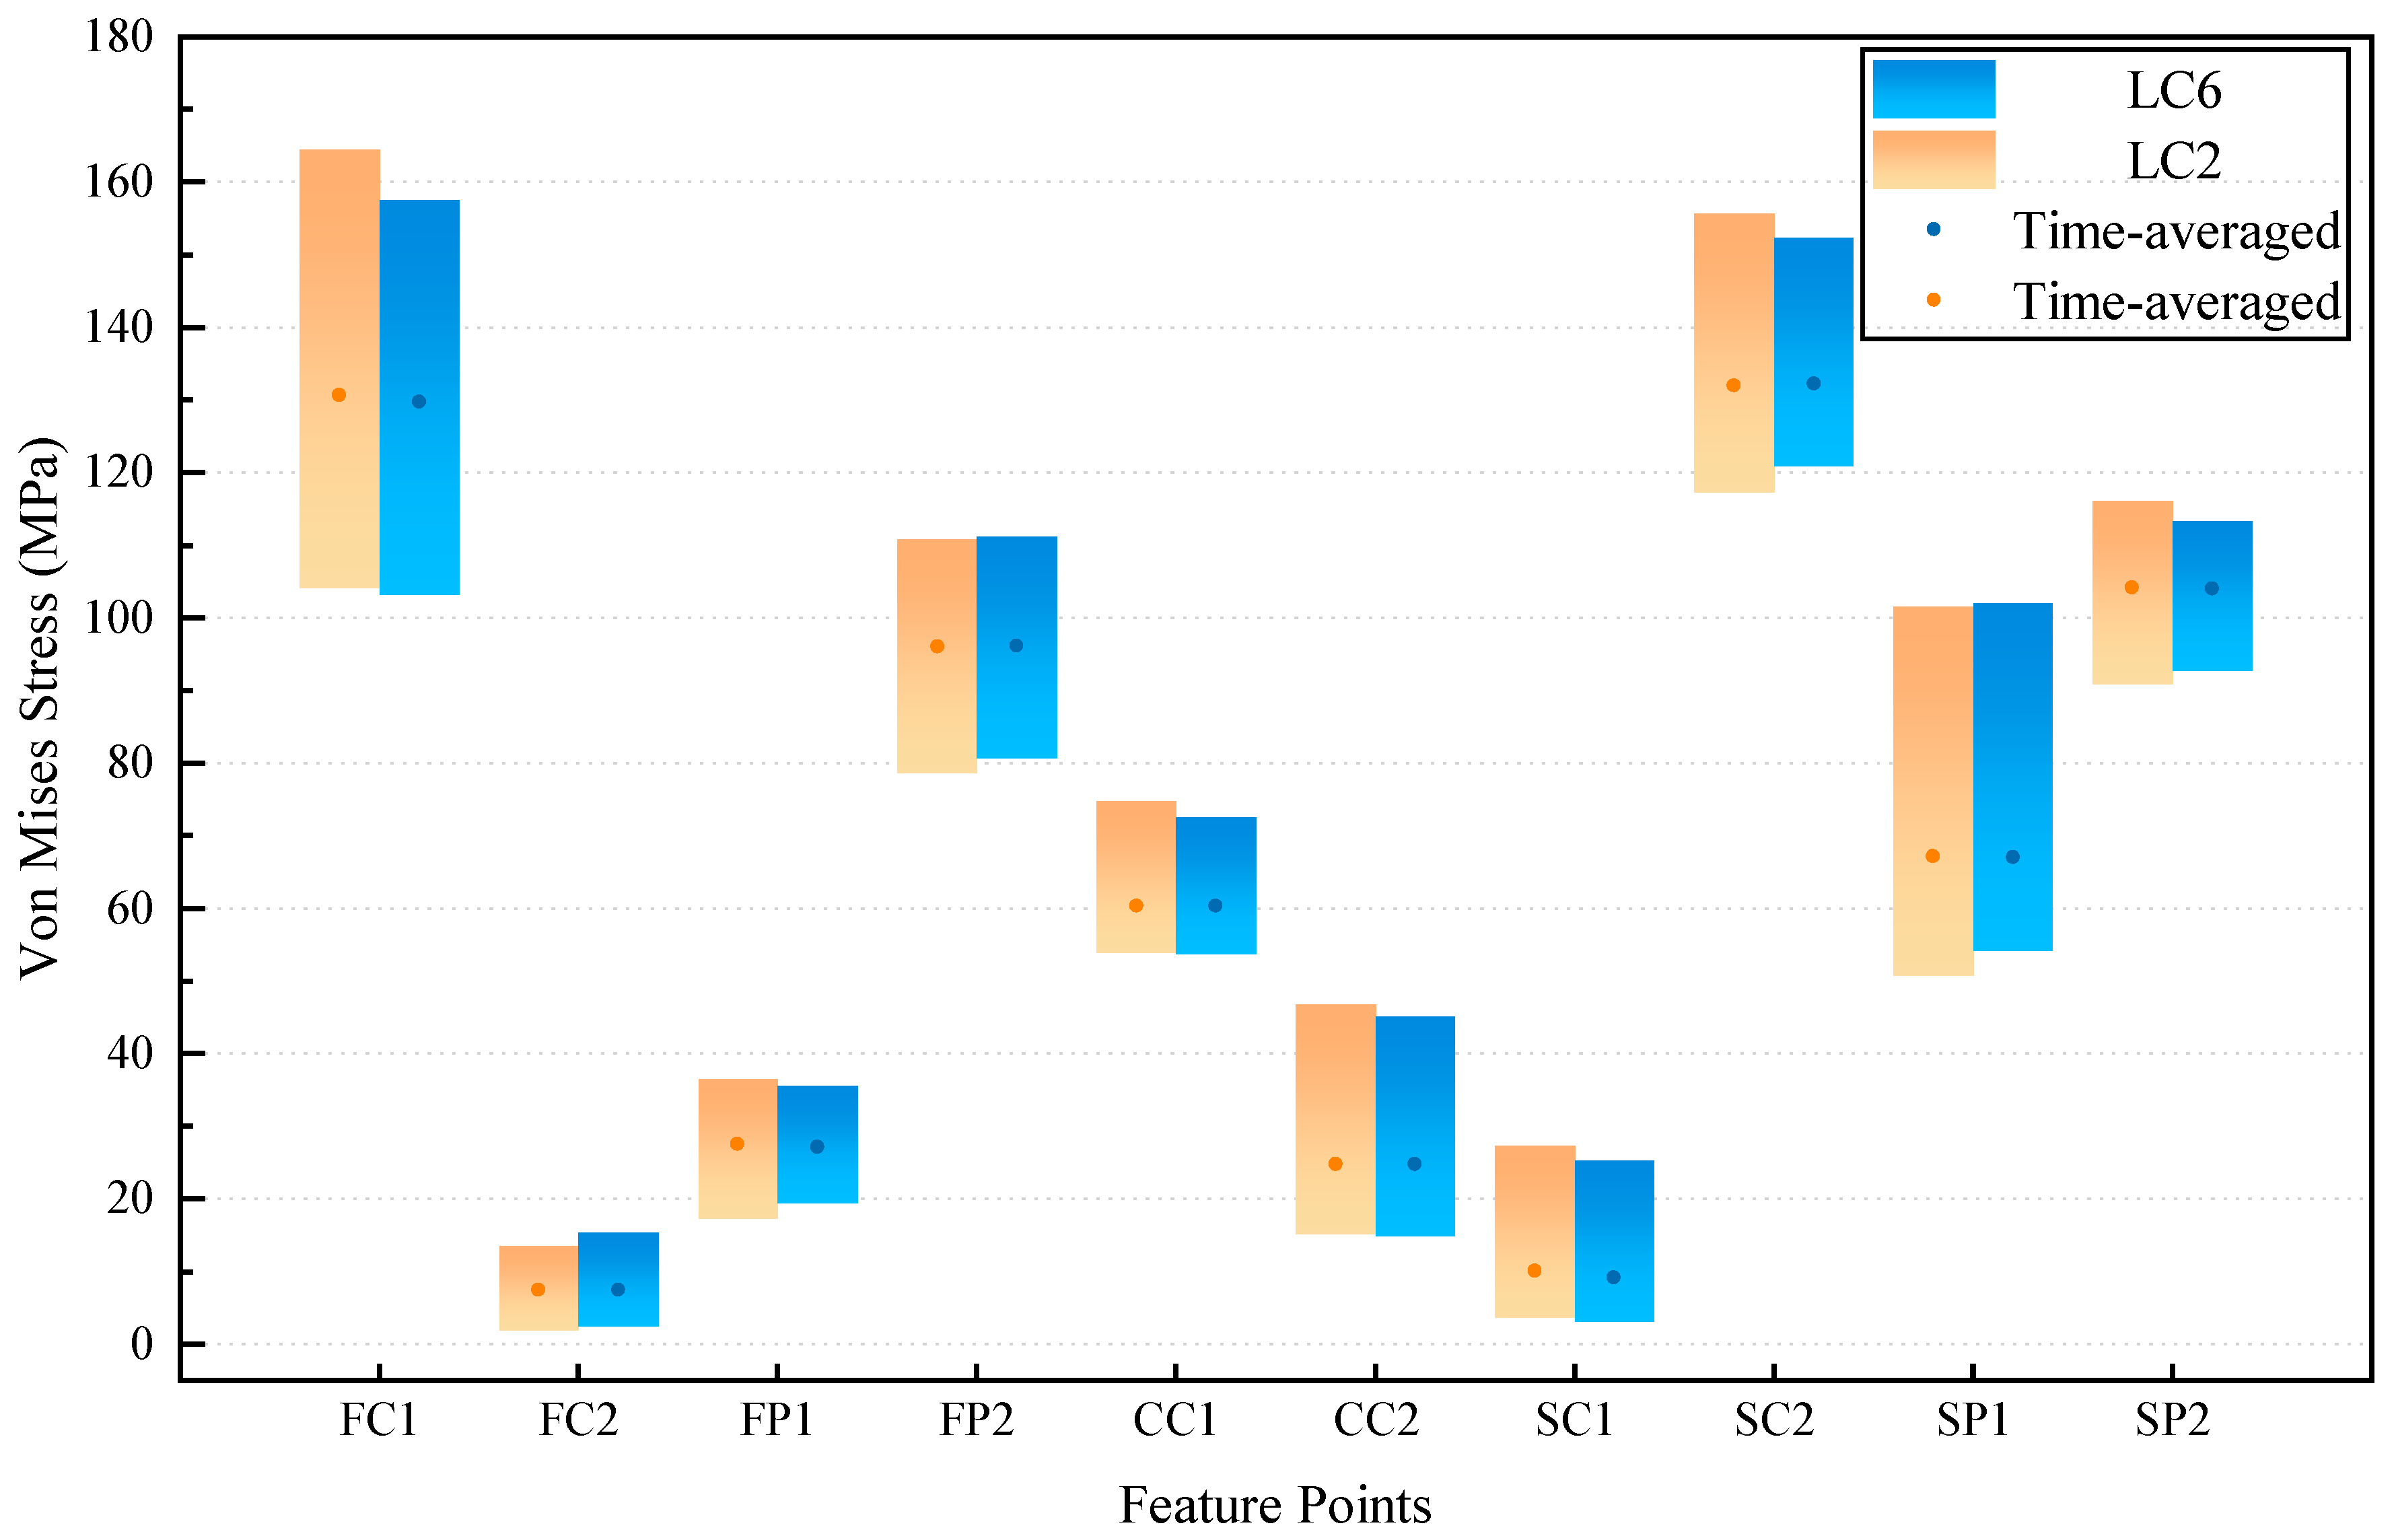
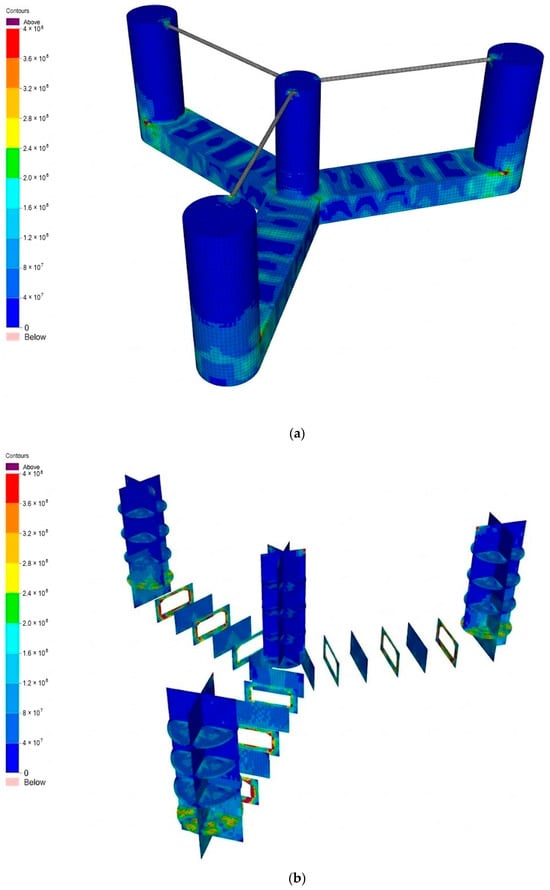
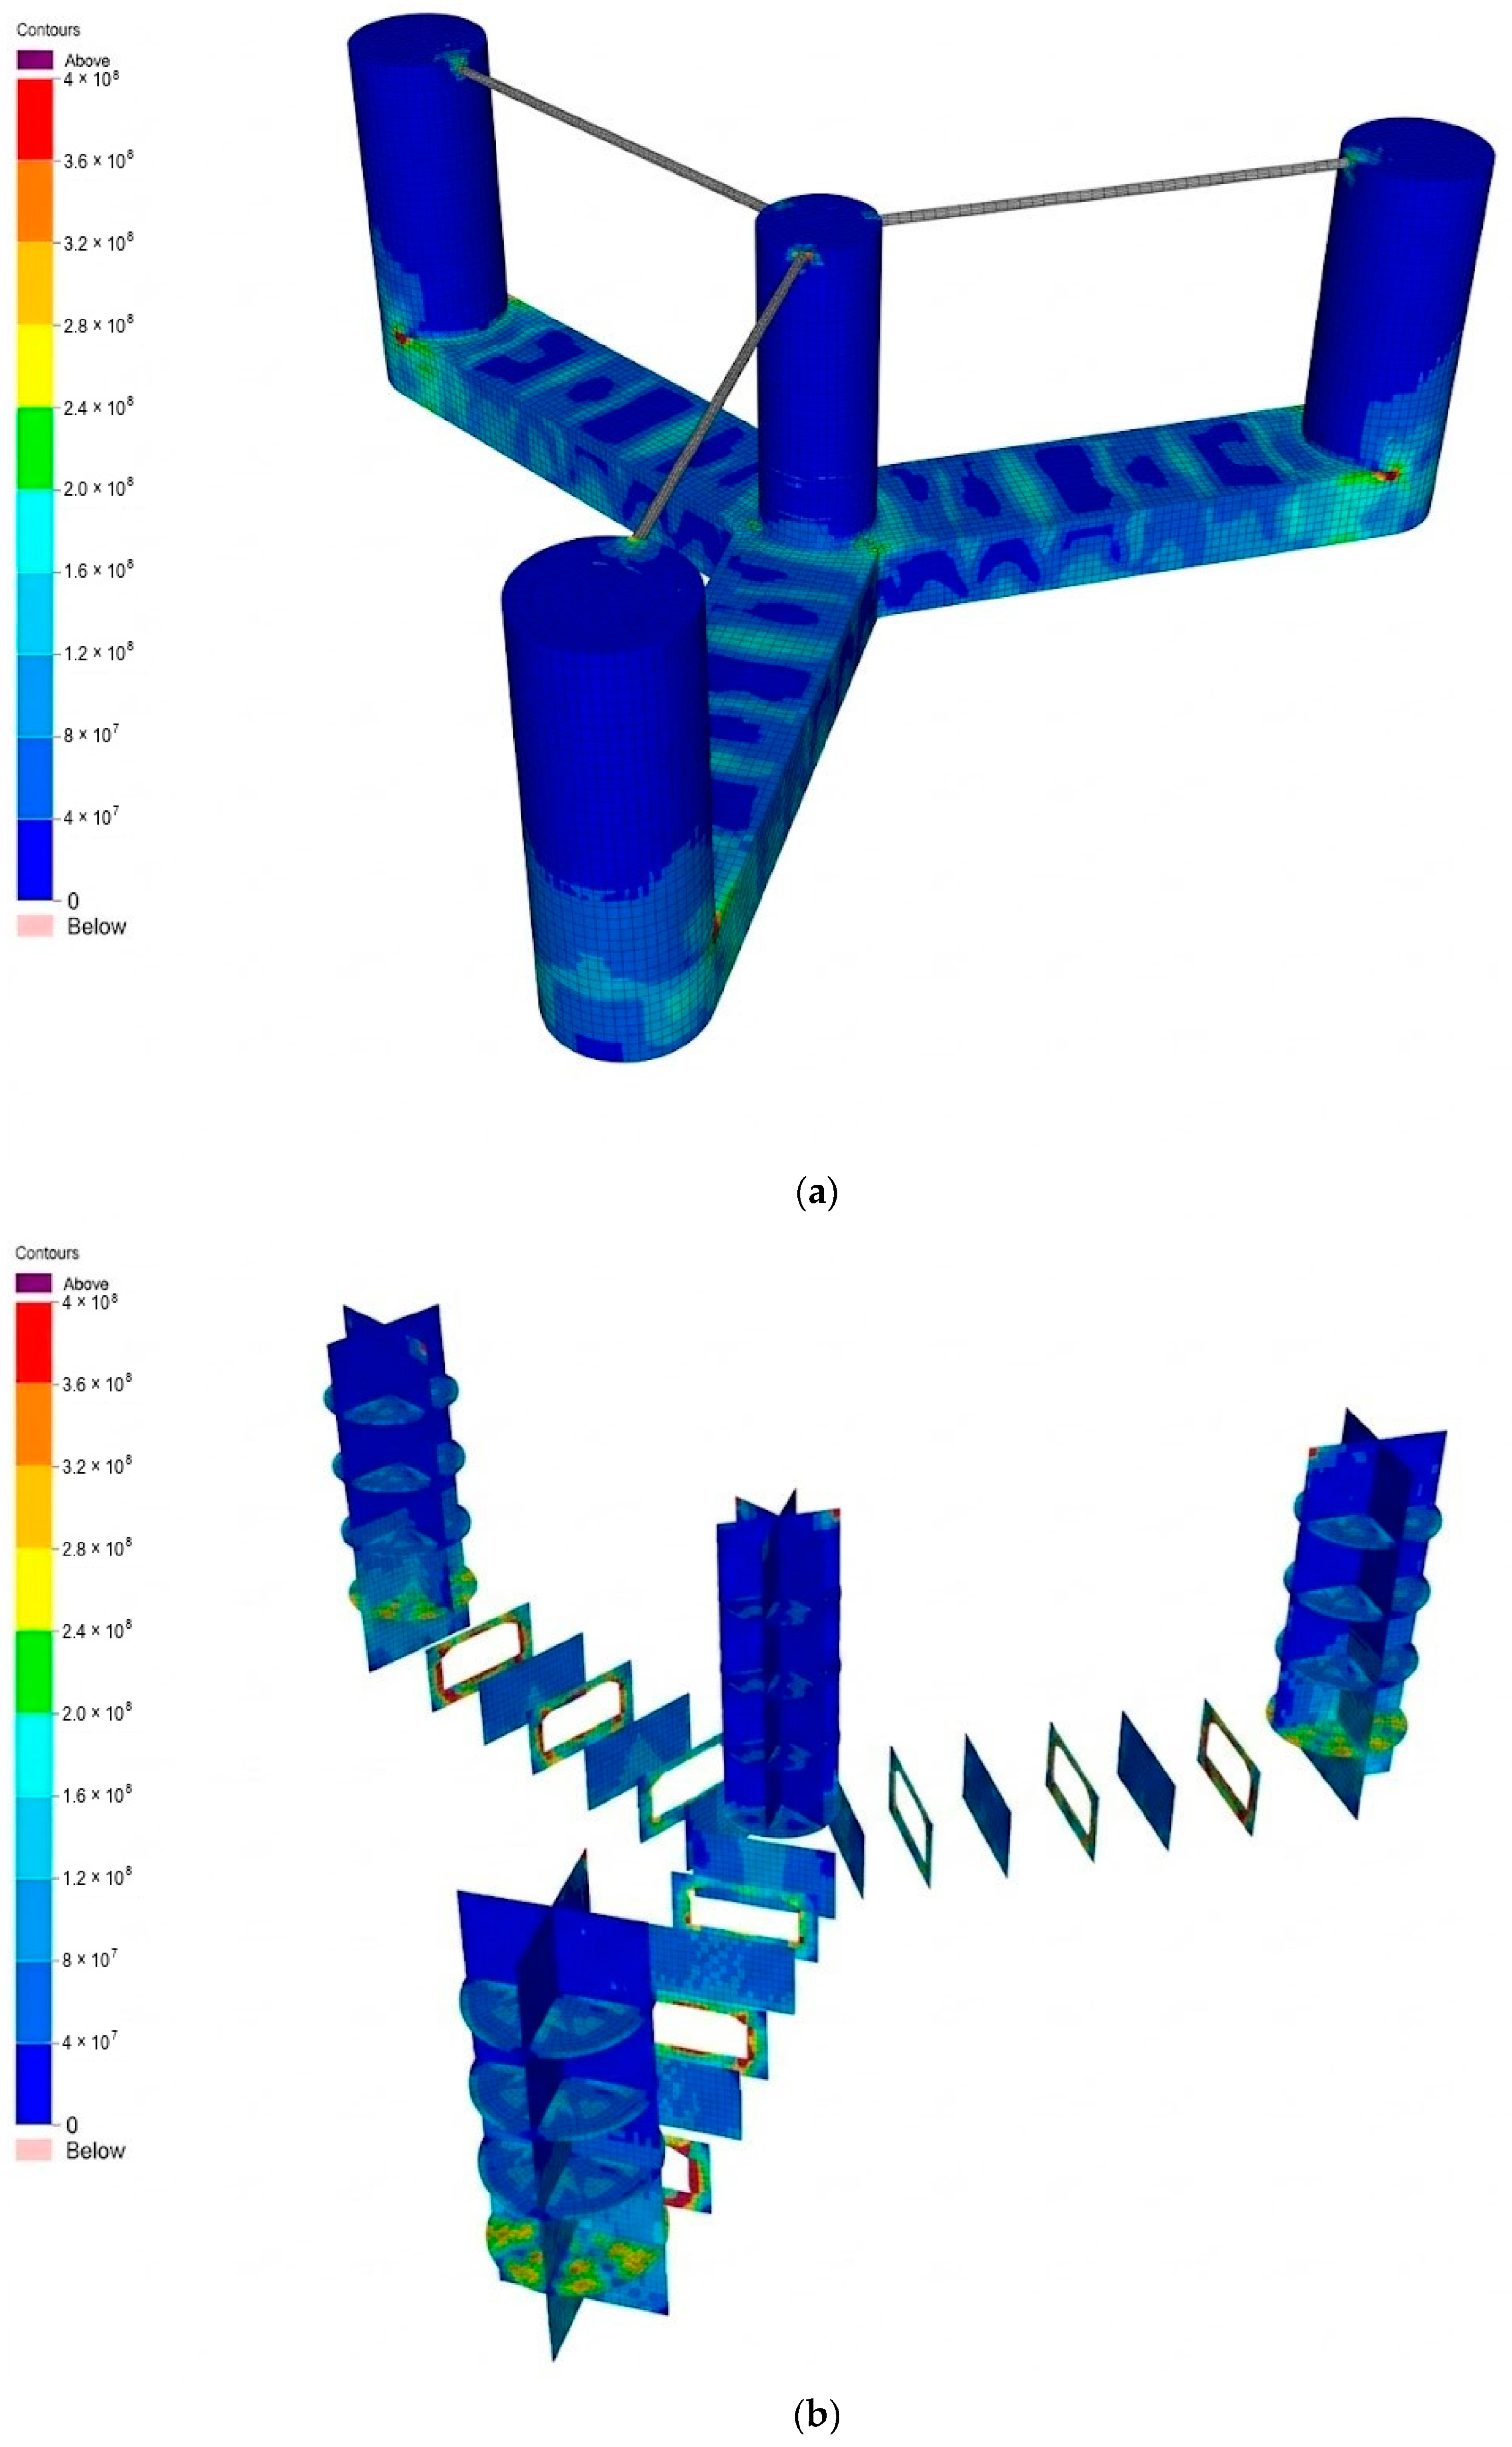
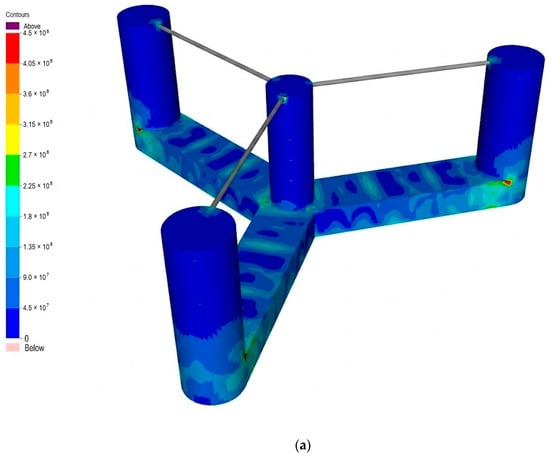
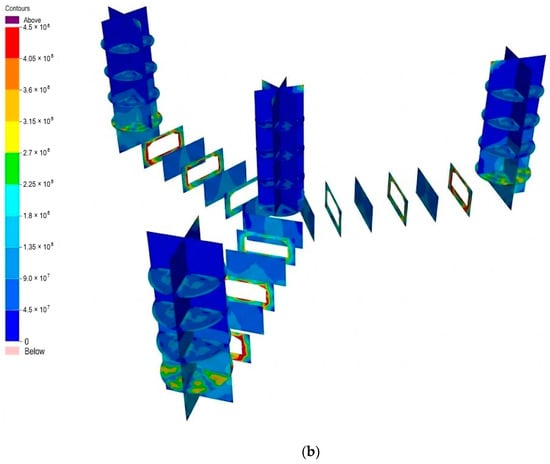
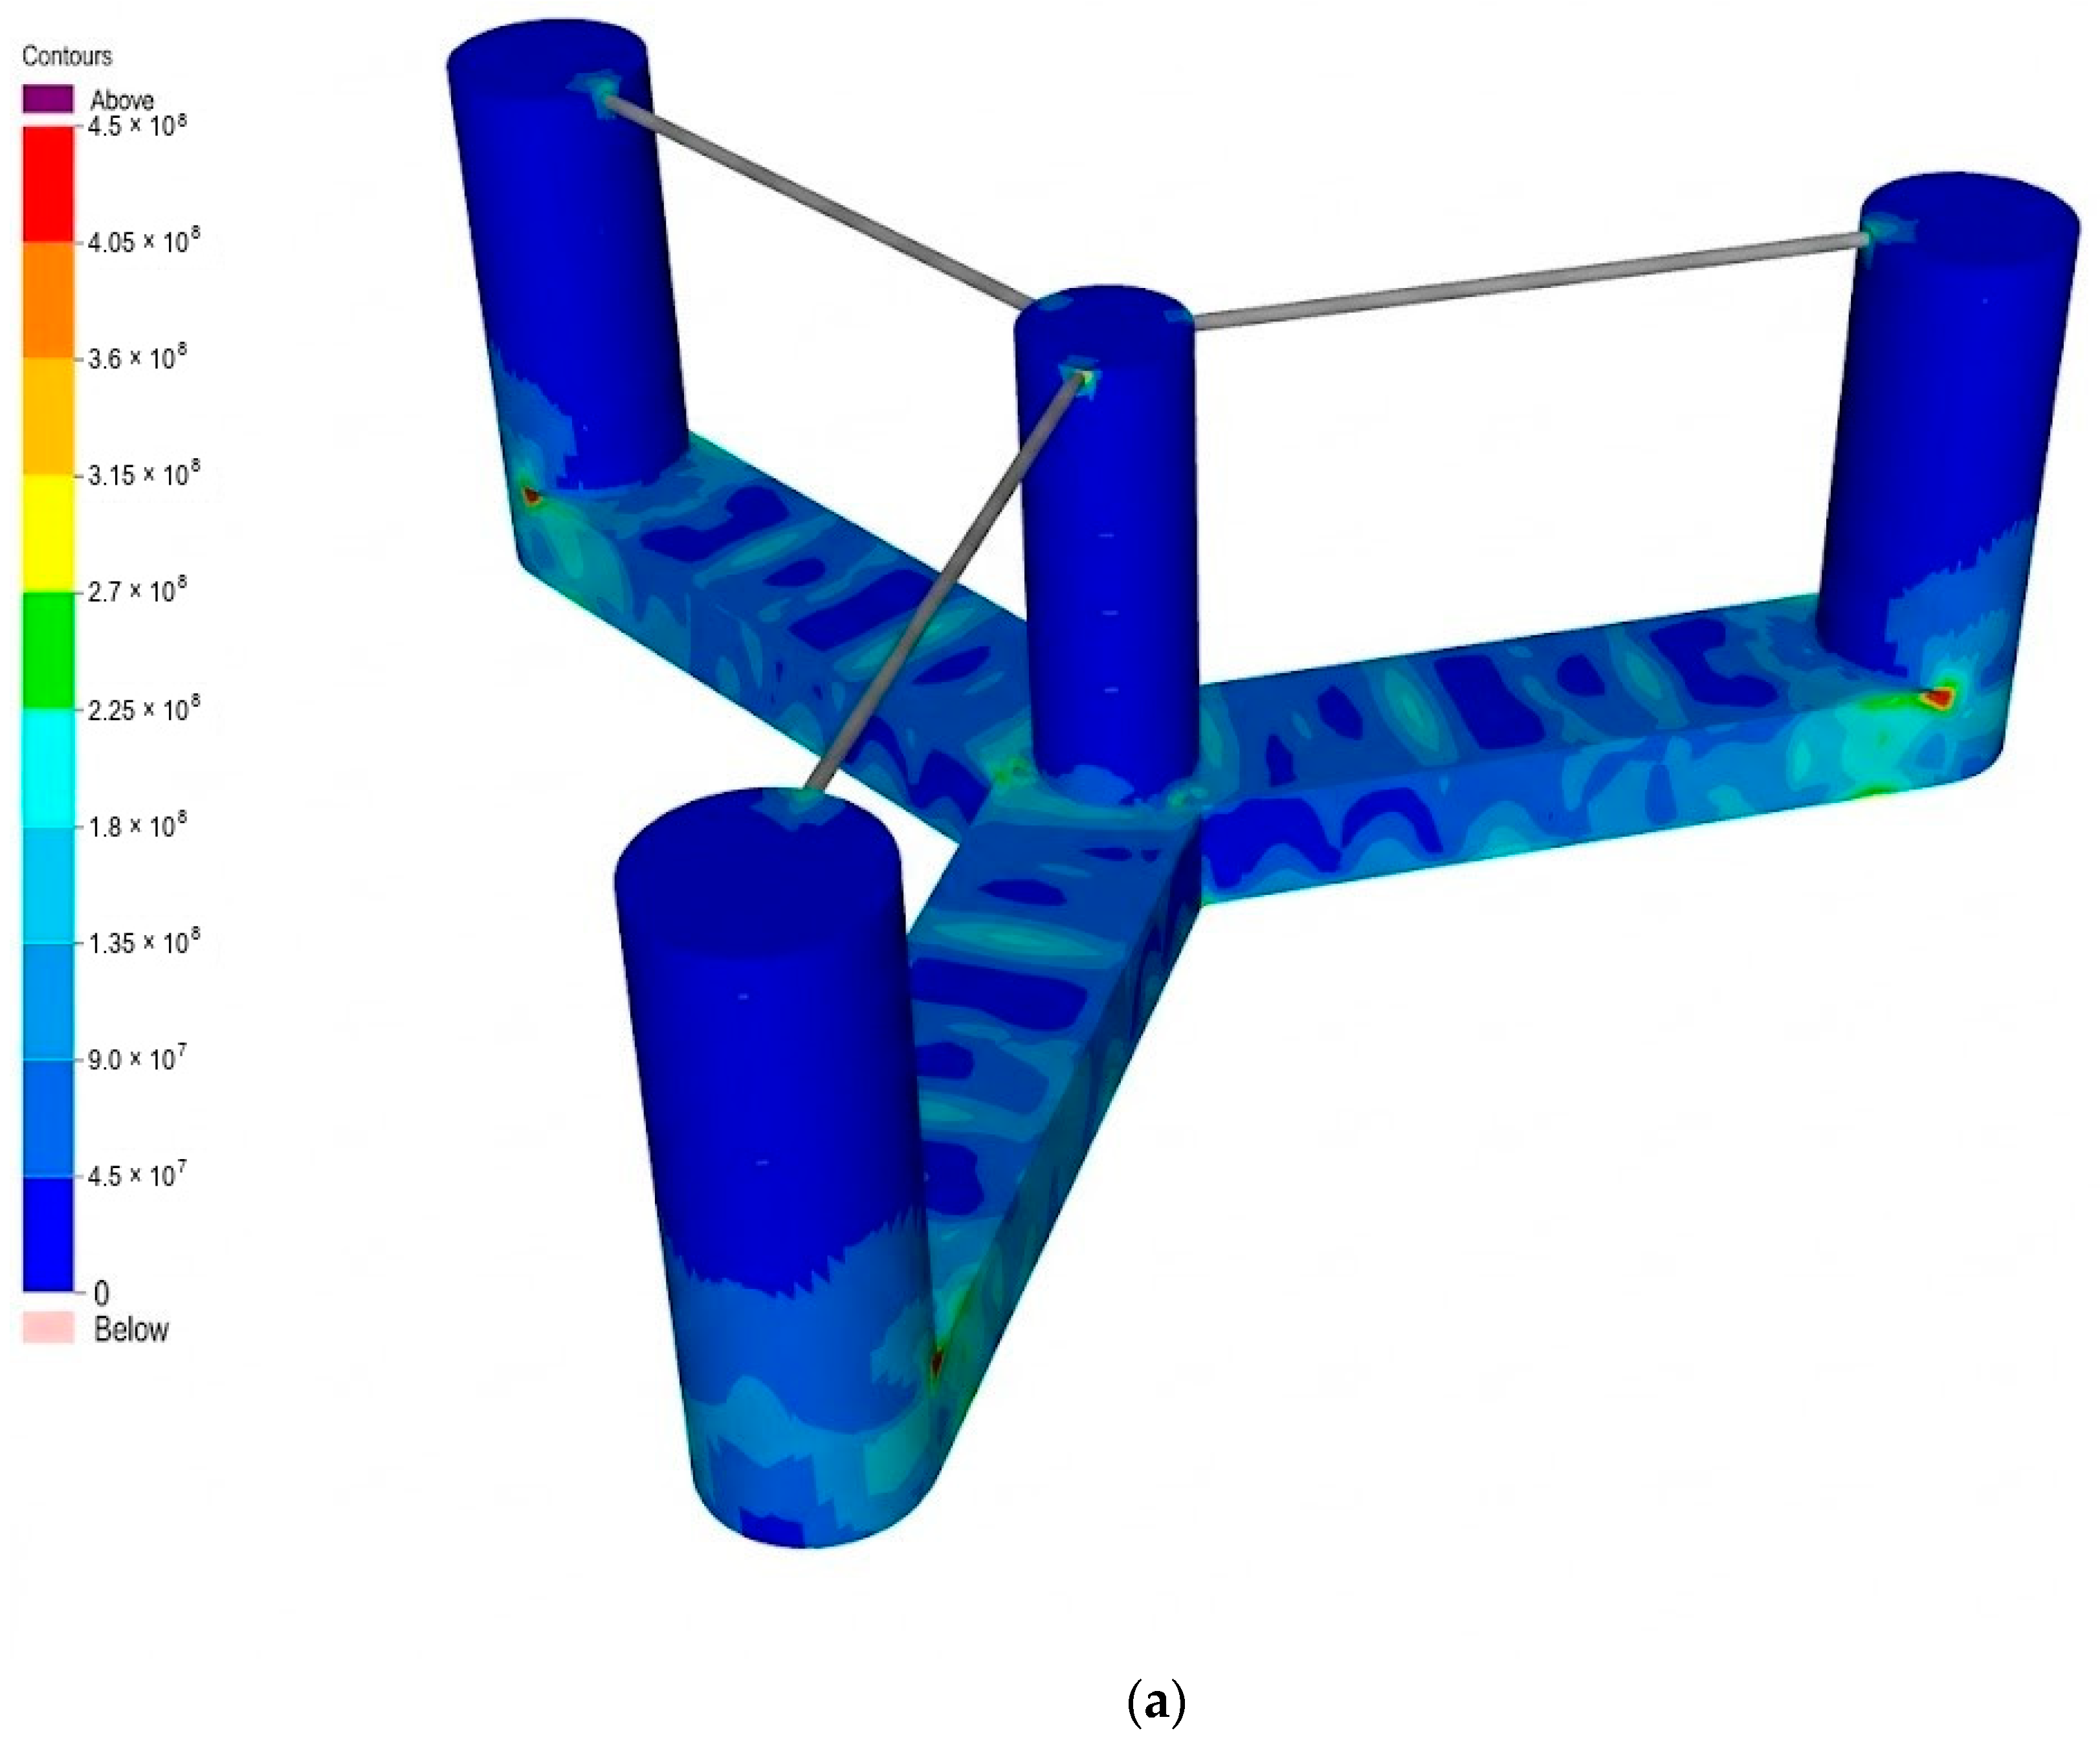
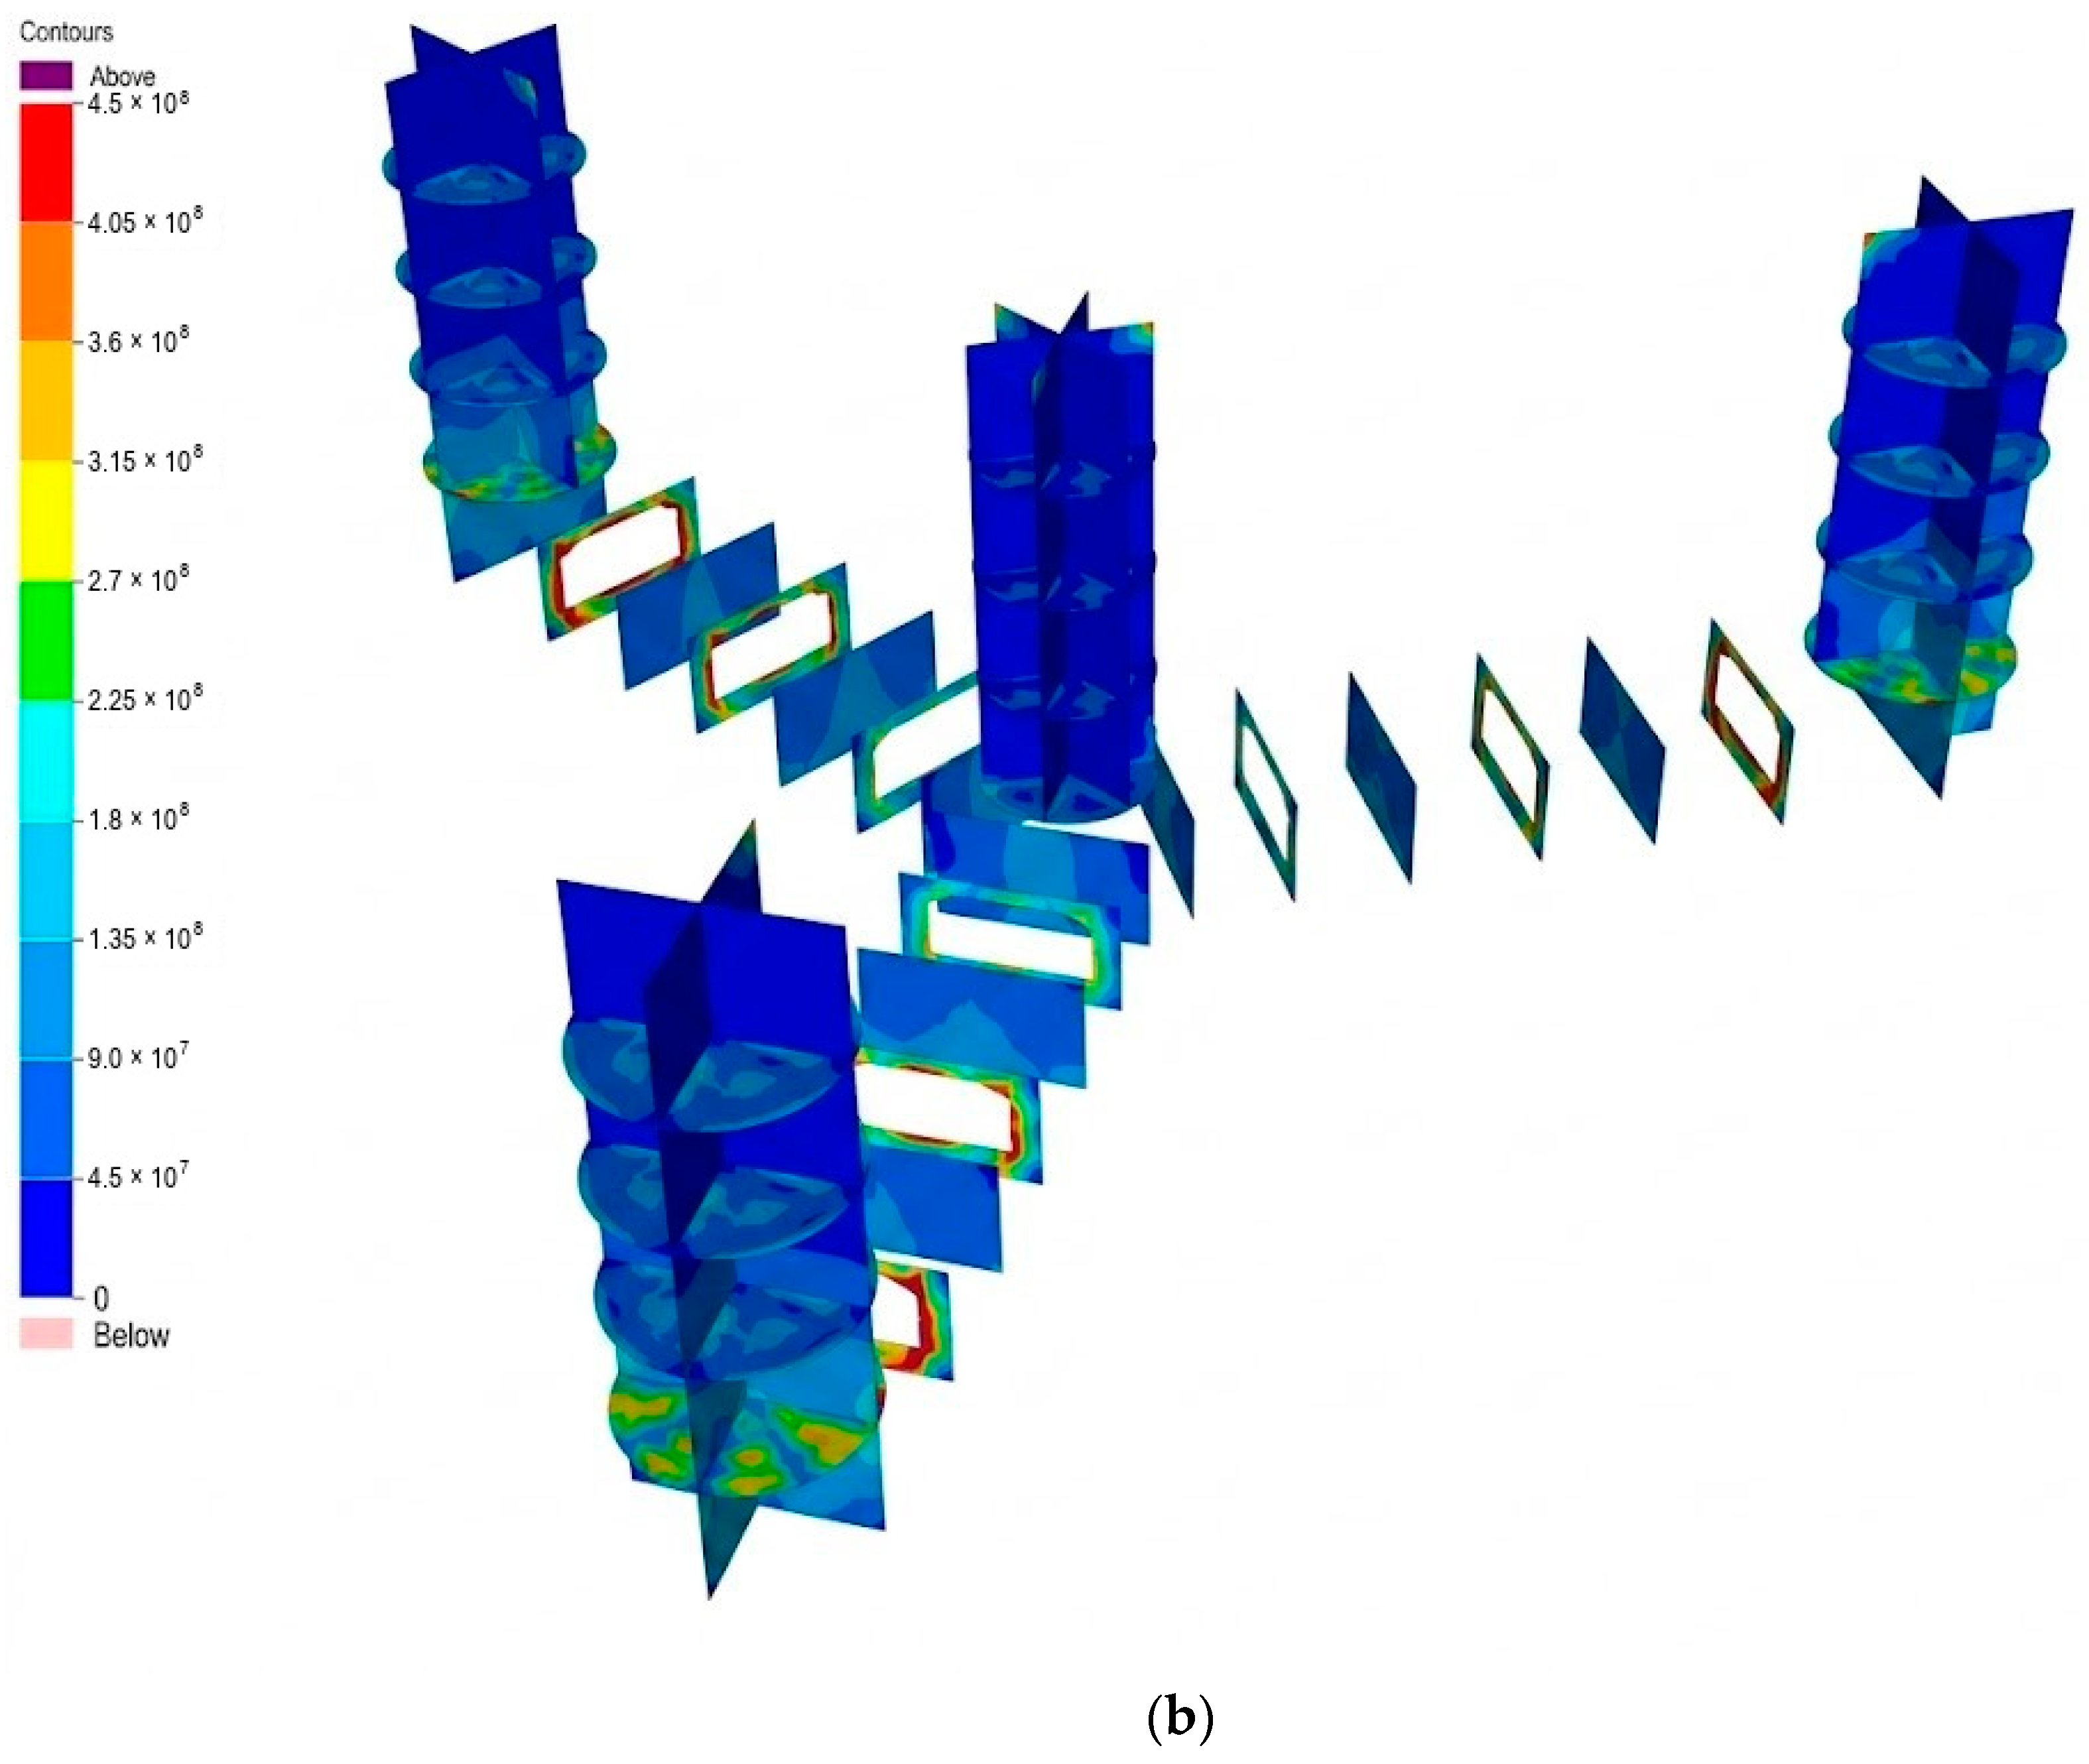
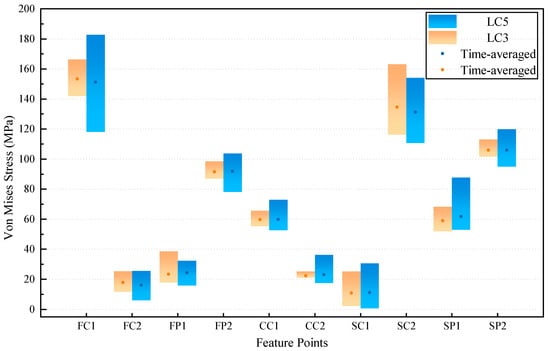
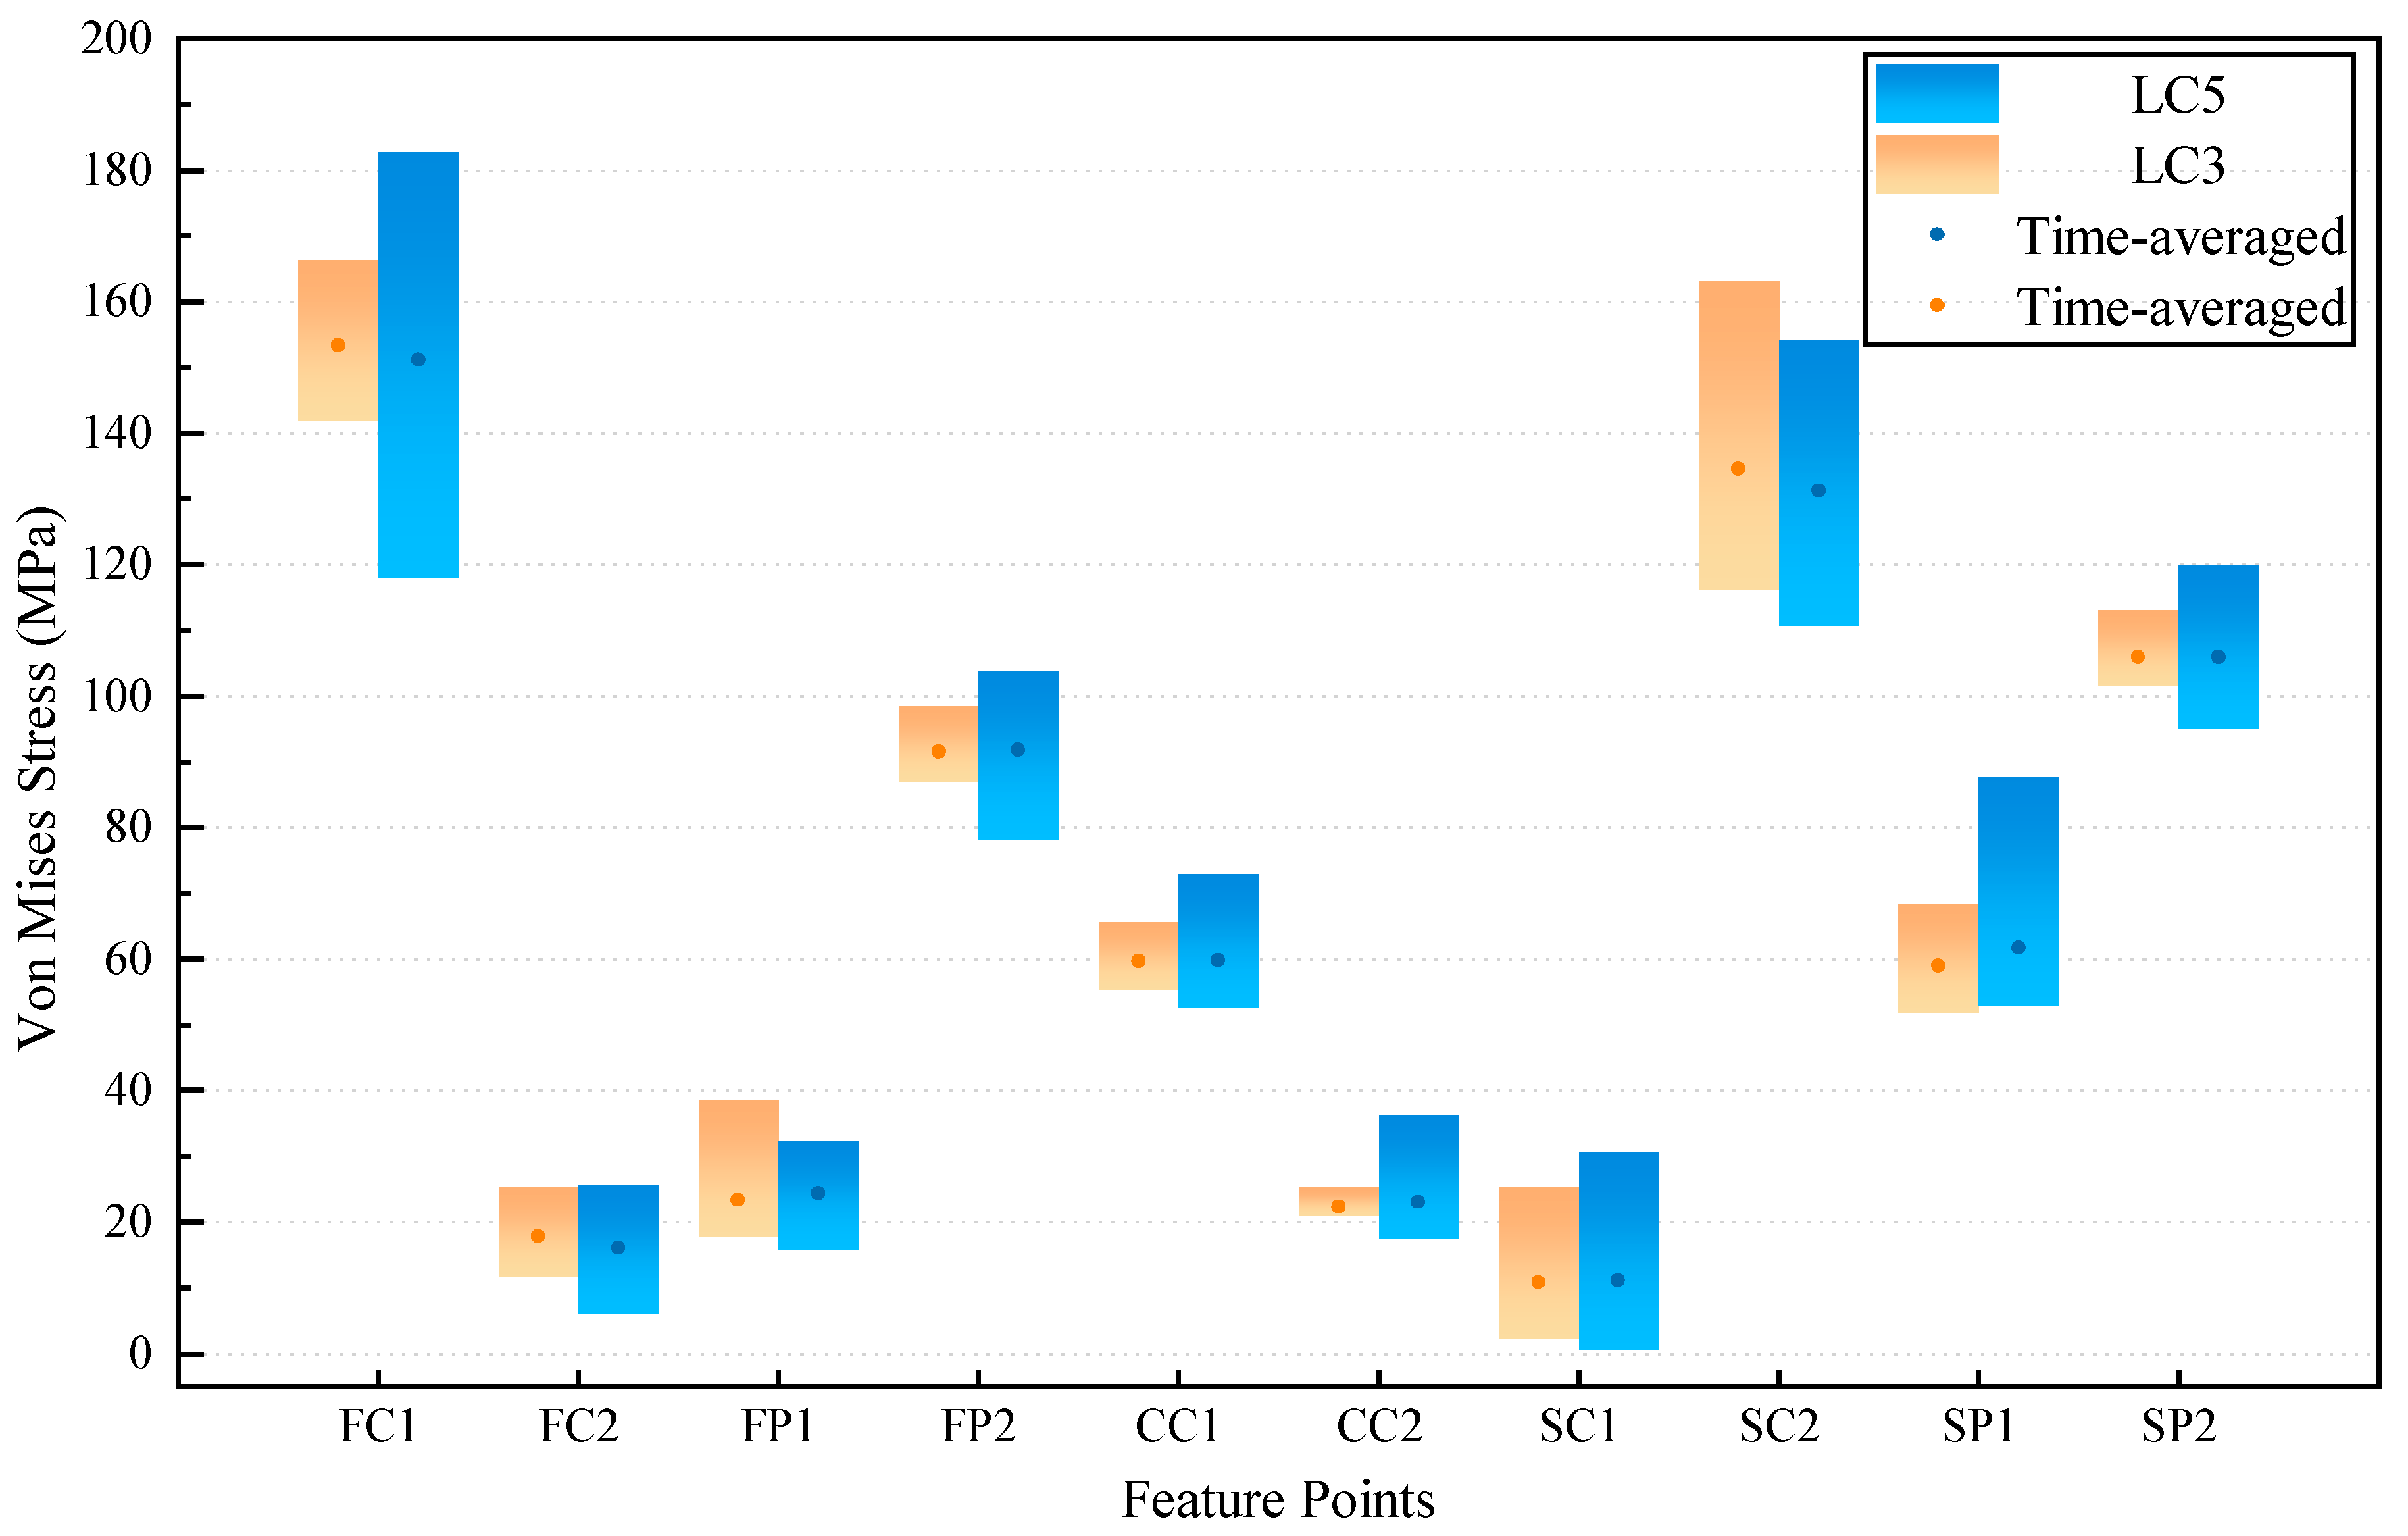
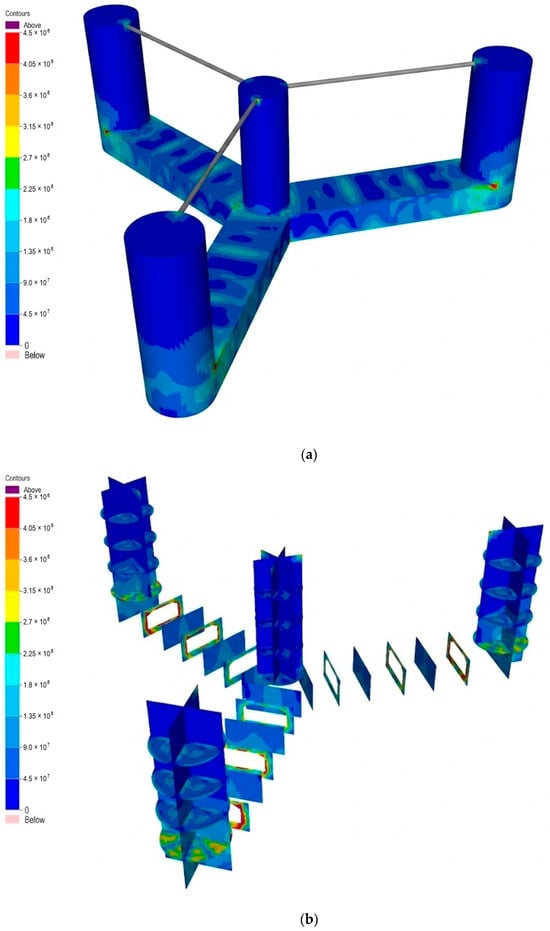
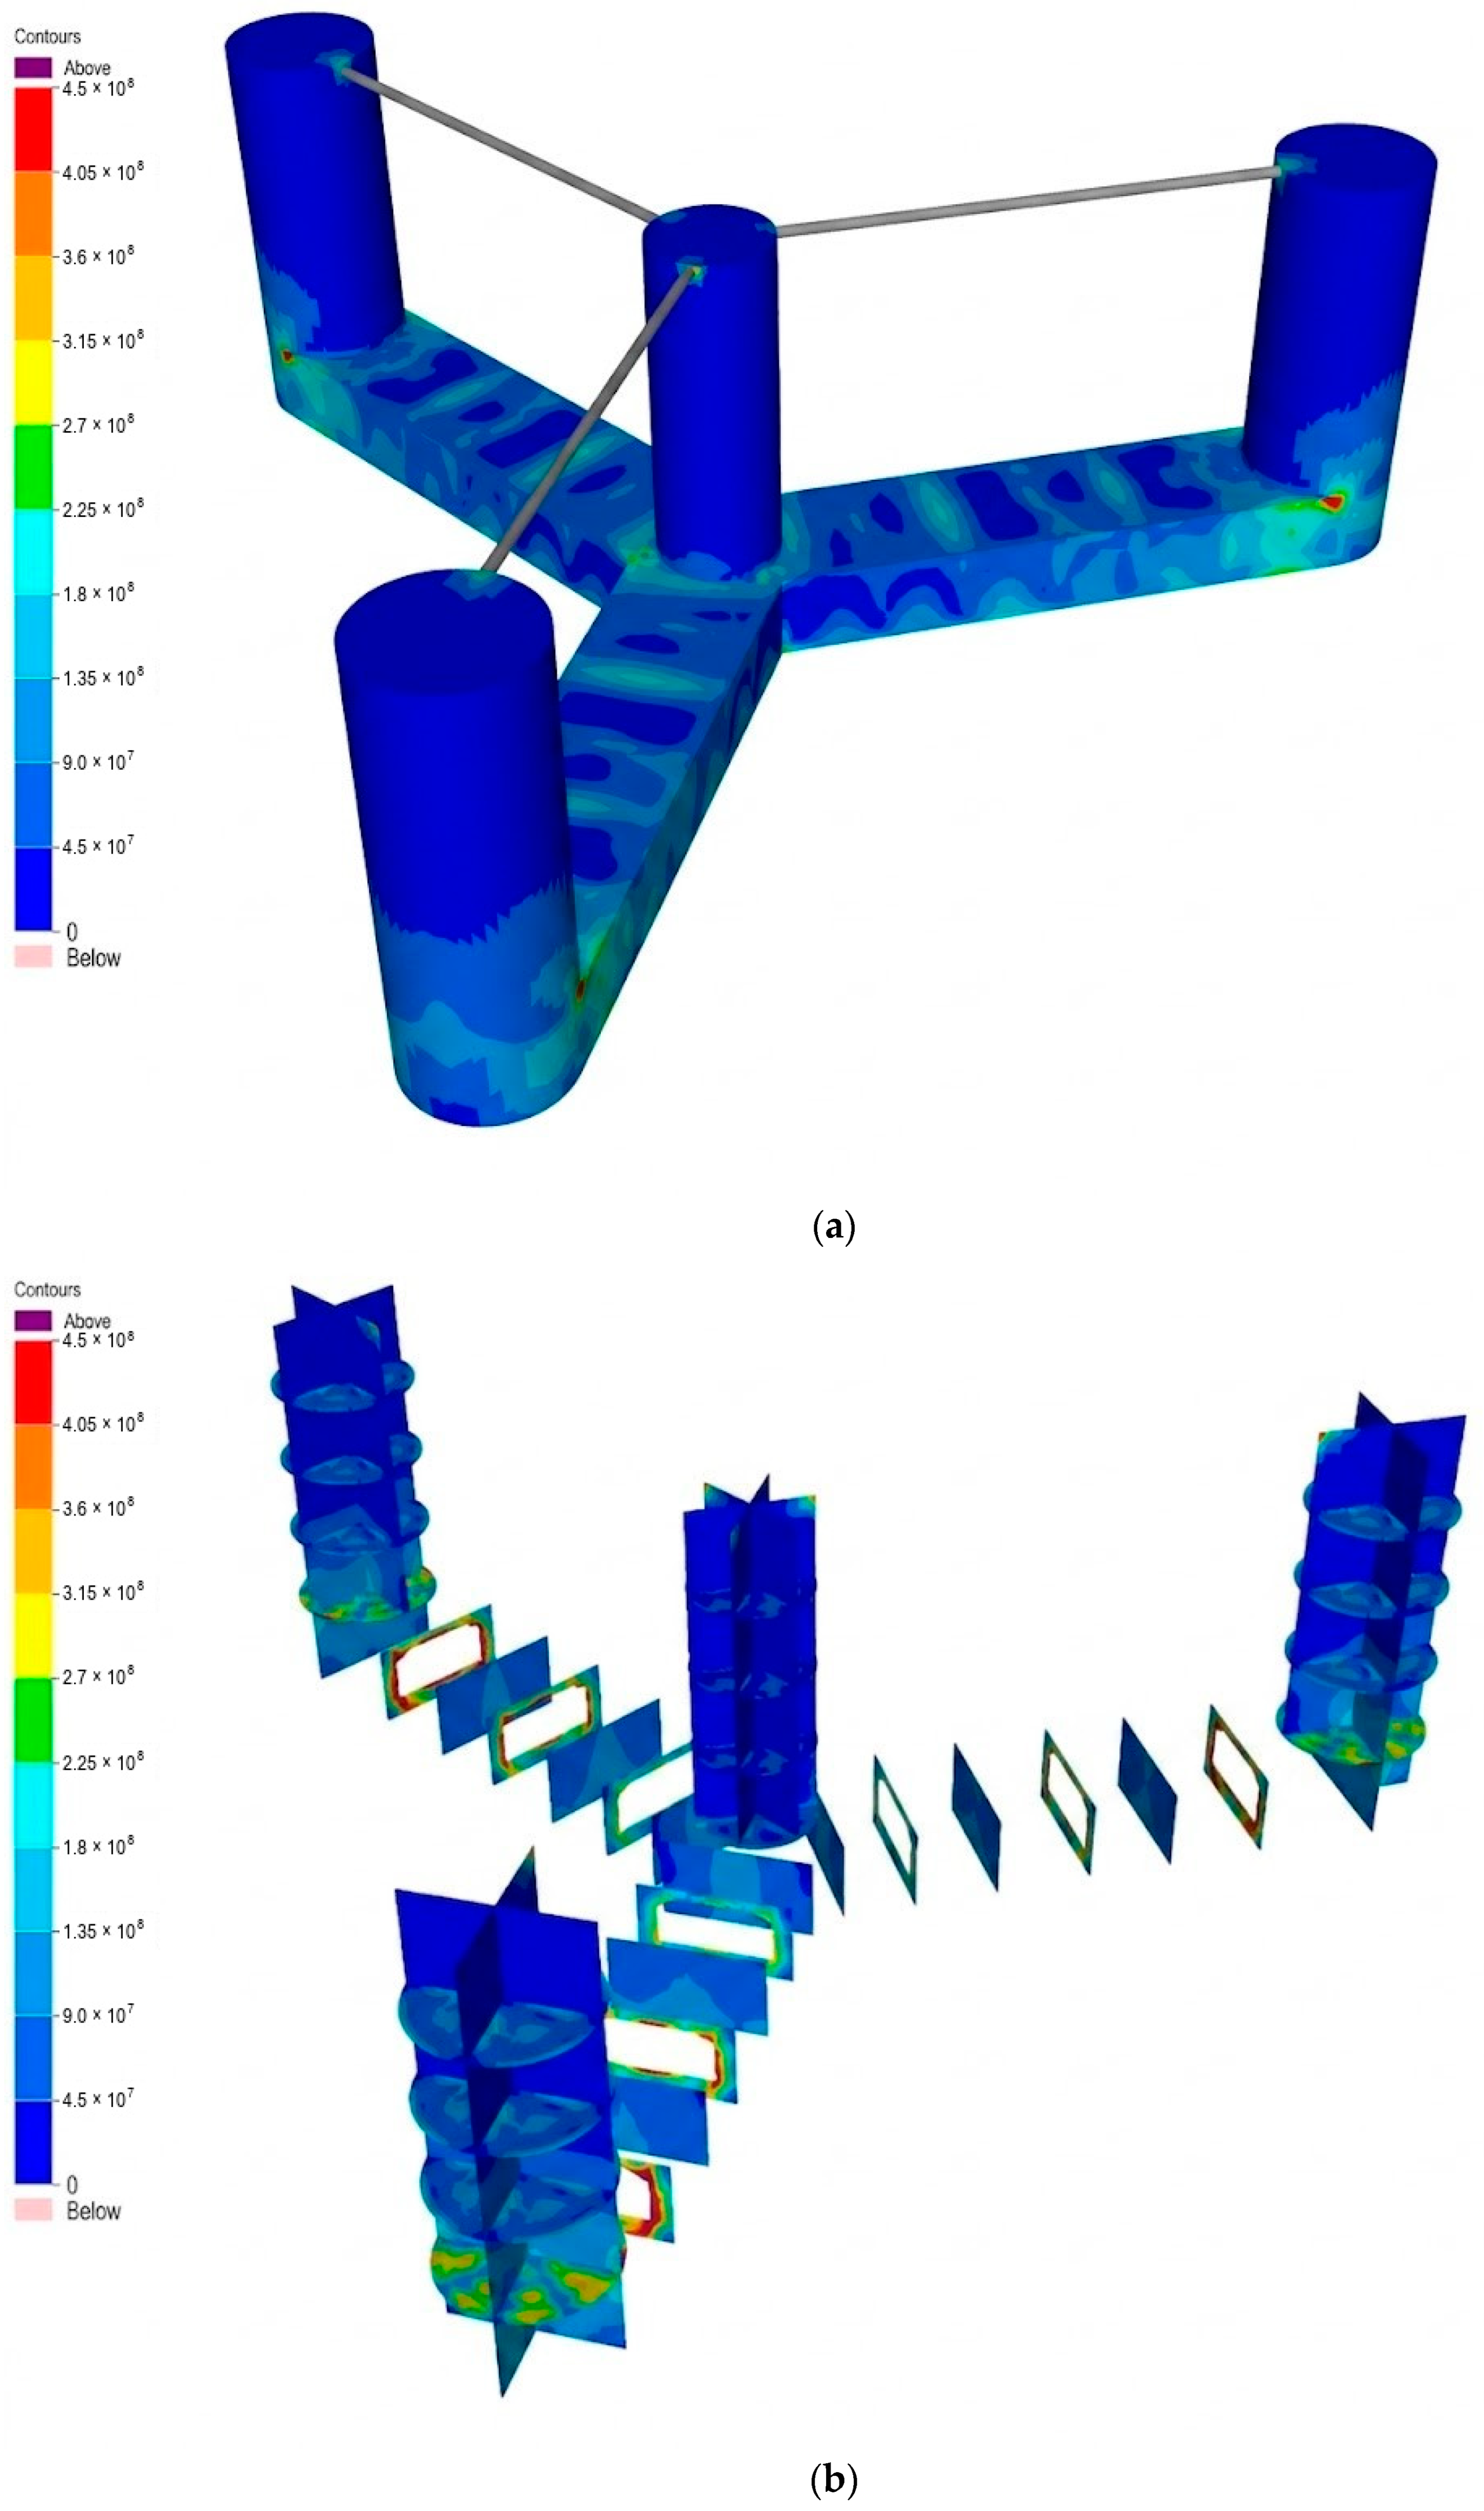
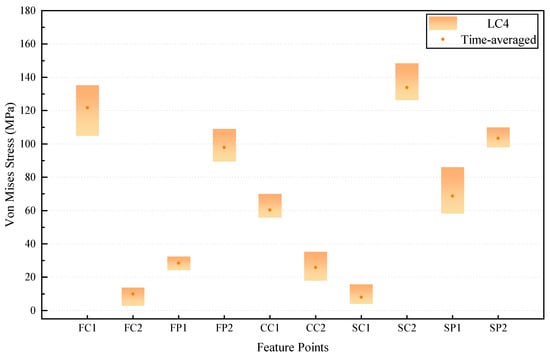
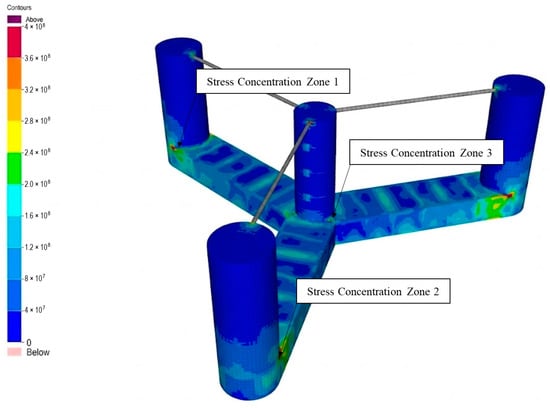
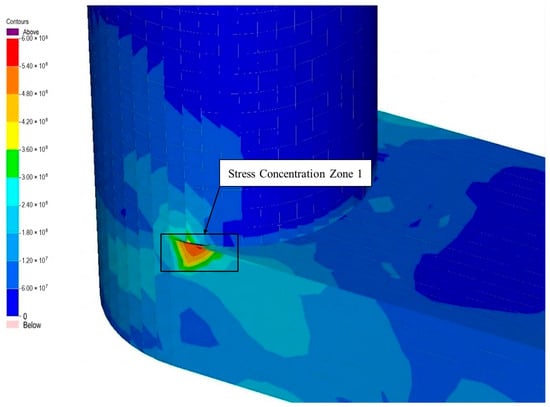
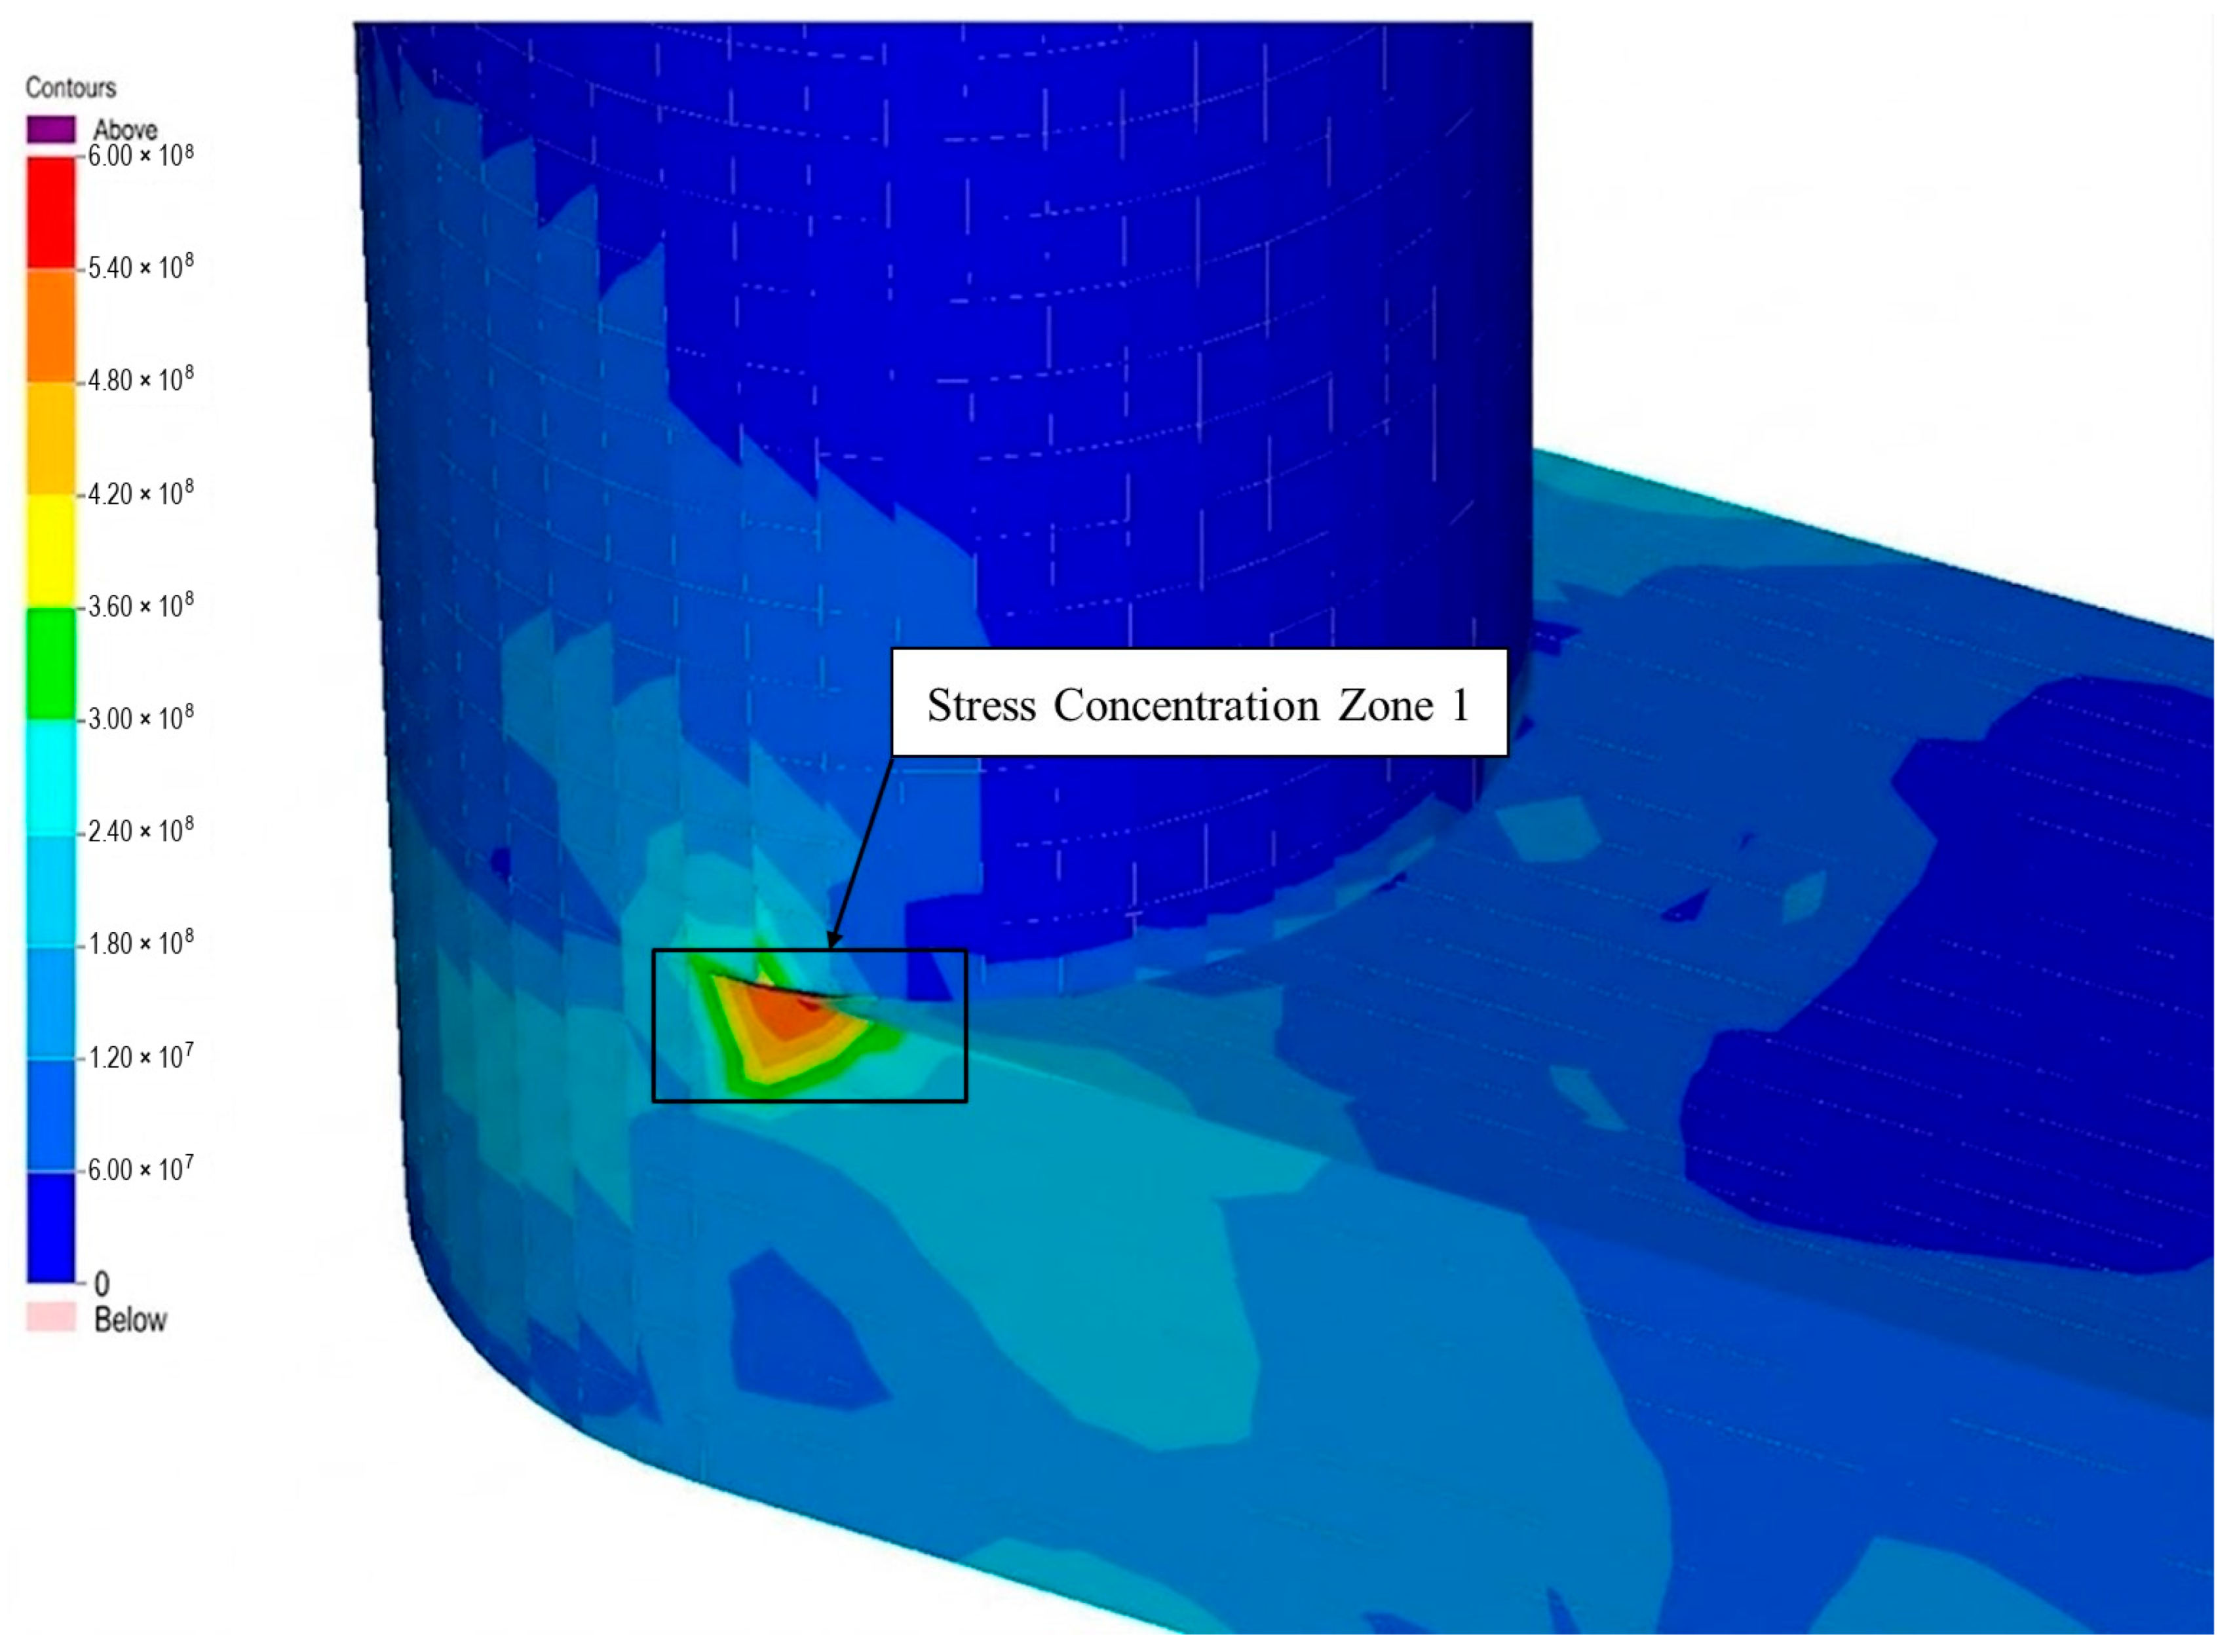
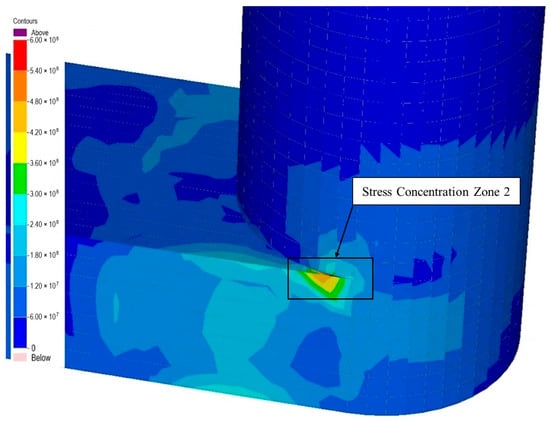
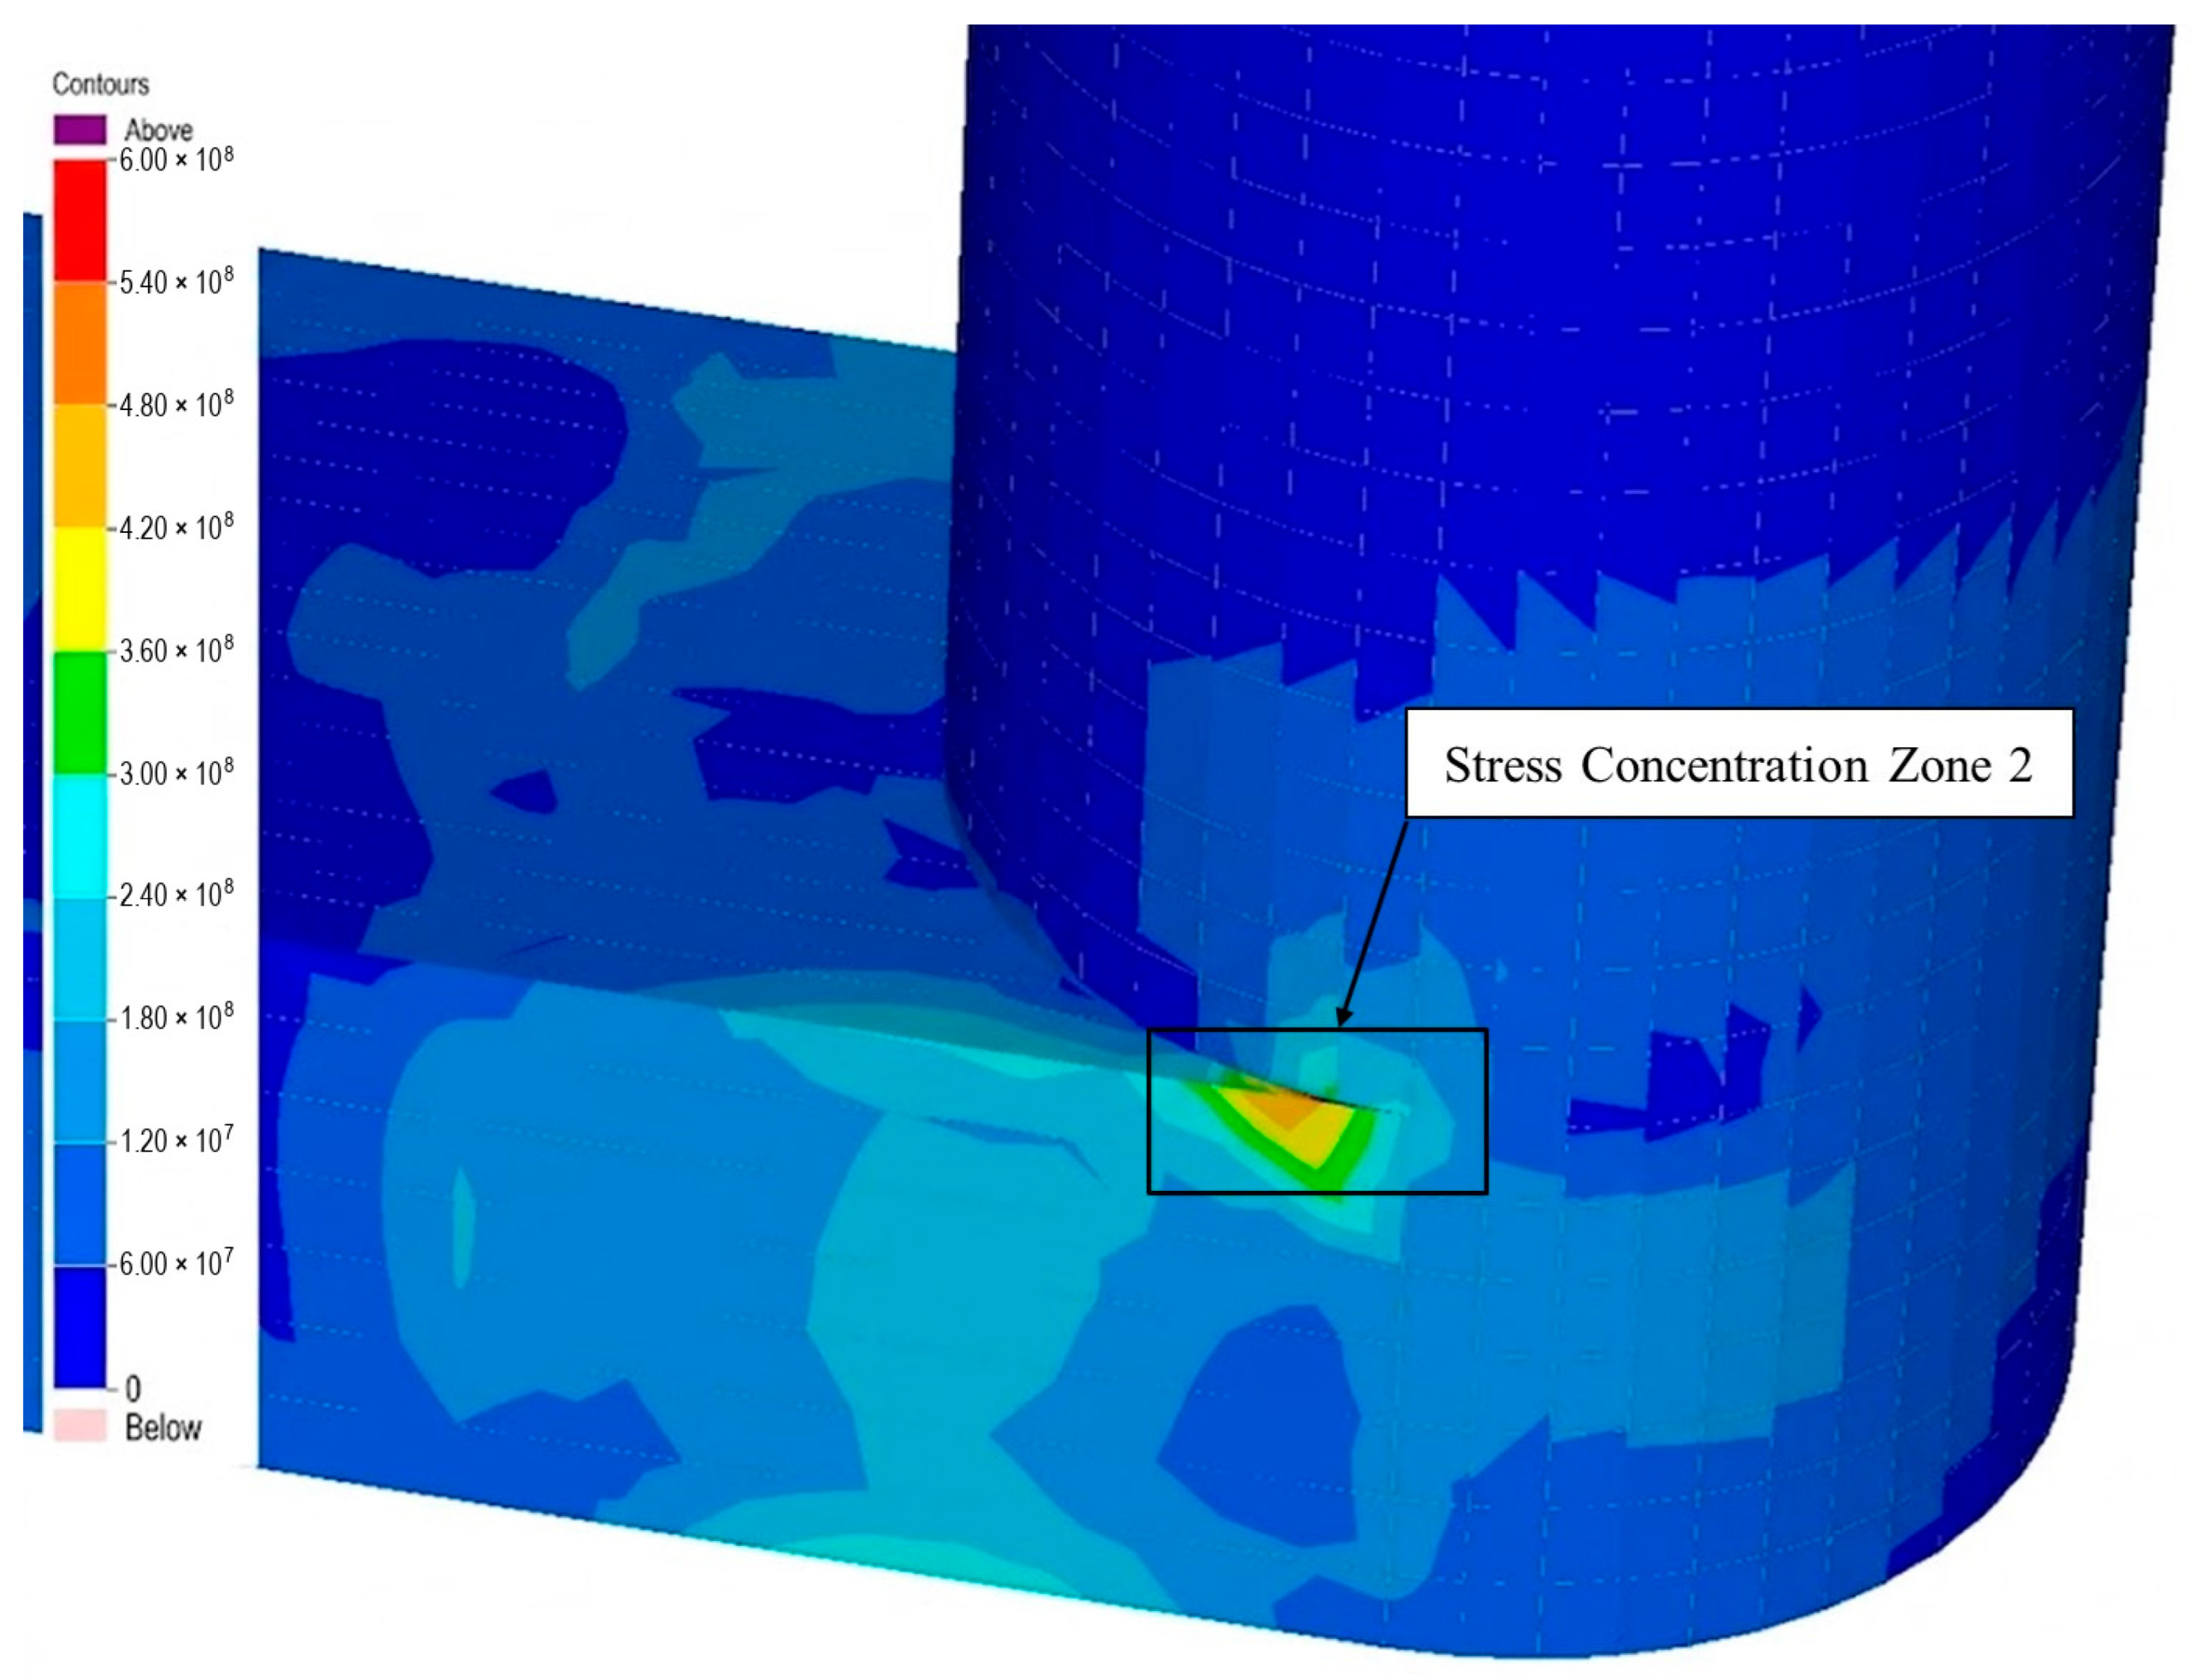
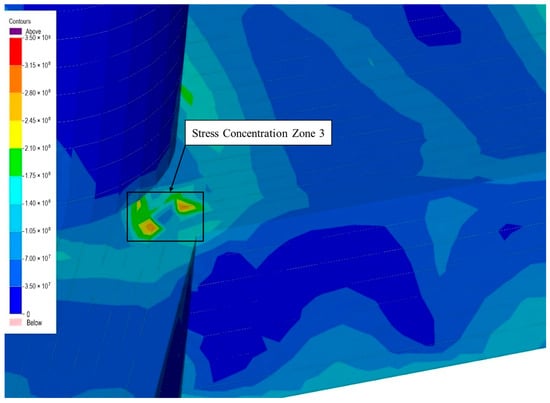
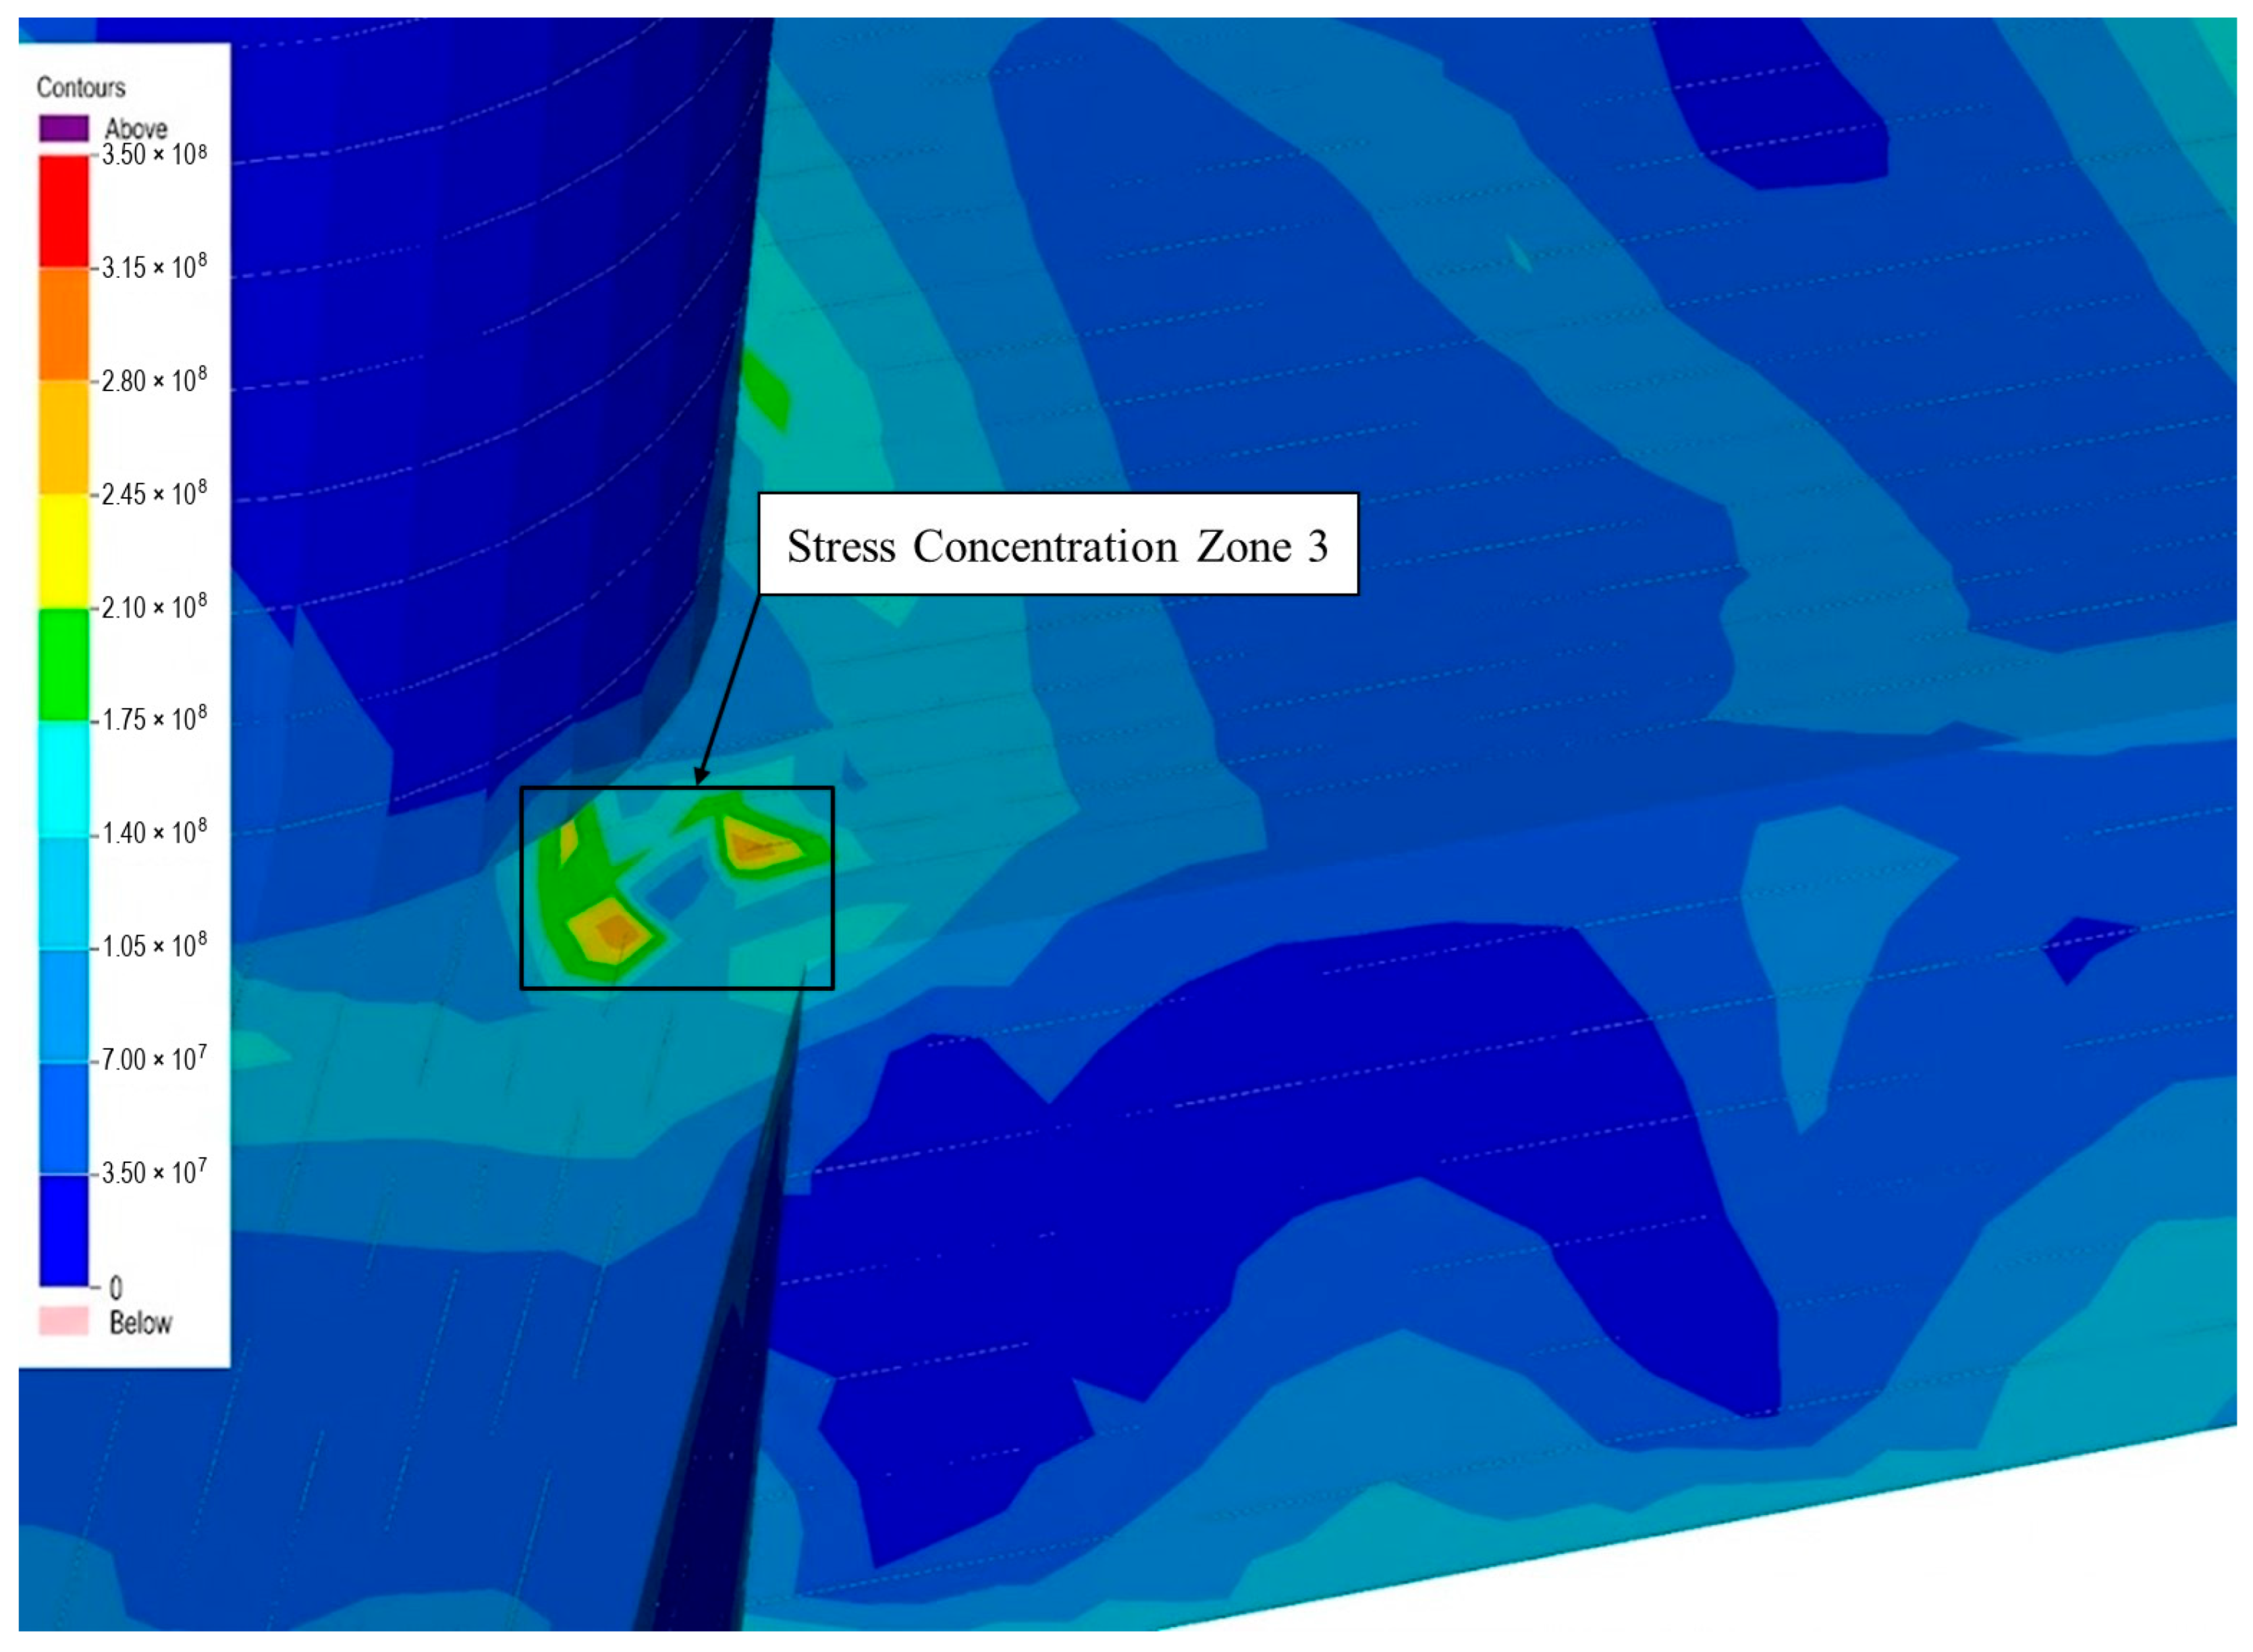

Disclaimer/Publisher’s Note: The statements, opinions and data contained in all publications are solely those of the individual author(s) and contributor(s) and not of MDPI and/or the editor(s). MDPI and/or the editor(s) disclaim responsibility for any injury to people or property resulting from any ideas, methods, instructions or products referred to in the content. |
© 2026 by the authors. Licensee MDPI, Basel, Switzerland. This article is an open access article distributed under the terms and conditions of the Creative Commons Attribution (CC BY) license.