


Abstract
Battery Energy Storage System (BESS) models for reliability evaluation, as well as other power system simulation studies, are typically characterized by two key variables: State of Charge (SOC), representing the stored energy in MWh, and Injected Power (), indicating charging or discharging power in MW. These variables strongly depend on the operational role of the BESS within the system. Ideally, long-term time series data—spanning at least one year—from real installations would be available to support accurate modeling. However, due to the relatively recent deployment of BESS technologies, such data are often limited or unavailable. To address this limitation, this paper proposes a methodology for generating synthetic time series of SOC and PI for a specific BESS configuration and operational objective. The approach is based on a framework that determines the operation of the BESS to meet a predefined objective. The generated data is subsequently used to develop a BESS model suitable for composite reliability assessment using non-sequential Monte Carlo simulation.
1. Introduction
The growth of variable renewable generation (VRG), particularly wind and solar, has motivated the need for large-scale energy storage to compensate for the intermittency of these sources, making storage an essential element to ensure the reliability of electrical systems. Battery Energy Storage Systems (BESS) have a number of advantages over other types of storage, making them a viable option to compensate for VRG fluctuations.
Power system reliability assessment evaluates the grid’s ability to consistently supply electricity during unexpected component failures, unpredictable generation variation, or demand spikes. It is vital for safeguarding public health, preventing massive economic losses from downtime, and guiding cost-effective infrastructure planning as grids integrate more renewables and unpredictable modern loads.
Simulation methods used for composite power system reliability assessment may be performed by sequential or non-sequential MCS [1]. The first simulates events in chronological order, which is very adequate for systems involving energy storage and intermittent renewables, but usually requires a large computational effort. The second evaluates system behavior by randomly selecting component or variable states without regard to chronological order. It drastically reduces computational time compared with sequential simulations, which makes it ideal for actual-size system reliability assessment.
BESS model for power system reliability assessment has been proposed in the literature. In [2], a multi-state model has been developed by tracking the state of charge of the BESS in the context of an arbitrage market to assess generation adequacy using a discrete convolution approach. In [3] a four-state reliability model of a battery ESS operating with a photovoltaic system is proposed and tested using sequential MCS. Reference [4] introduces a generic energy storage model in a methodology that integrates sequential MCS simulations, sensitivity analysis, and linear optimization. In [5], an energy storage model is used in a sequential MCS integrated with machine learning techniques to assess the reliability of coordination of BESS with renewable energy sources.
This work proposes a state-space BESS modeling for non-sequential MCS to be used in the reliability assessment of power systems, considering the relation between the BESS power injected or consumed and its corresponding drawn State of Charge when dispatch from the storage system is required to avoid load shedding. Given that the BESS is a temporal device that displaces power over time, this model is an approximation to leverage the shorter computational times of the non-sequential simulation. By capturing the association between State of Charge and the Injected Power through the proposed re-dispatch algorithm, a better representation of the BESS is achieved despite not including time, and more realistic reliability indices can be obtained. In order to validate the non-sequential approach, a synthetic BESS series, with a peak shaving operational strategy, is created and used as input for the state-space sampling. The proposed model was tested with actual data from the Brazilian Northeastern system.
Paper Structure
In Section 2, the general aspects of the BESS operational strategy and its modeling are described, as well as its main parameters; in Section 3, the non-sequential state-space model for BESS representation and its embedded re-dispatch algorithm are explained; Section 4 presents the process to generate the BESS synthetic historical series with a sequential approach, to validate the non-sequential model; Section 5 reports and discusses the results obtained with the test cases of the Brazilian Northeast Region and Section 6 concludes with the final remarks.
2. BESS Operation and Modeling
A BESS is a system consisting of a set of batteries and auxiliary equipment that allows efficient use of the energy storage capacity of the batteries, their connection to the power grid and the safety of operation [6]. BESS applications in the electricity system can be of two types:
- (a)
- grid-scale applications, in which systems with large storage capacity (tens or hundreds of MWh) are used to optimize the operation of the interconnected system;
- (b)
- behind-the-meter applications, i.e., BESS located at consumers’ facilities to improve economic performance and supply reliability.
In large-scale power systems applications, BESS are used in multiple functions [7]:
- Energy Optimization: compensation of the variability of the non-controllable renewables and consequent increase in their firm capacity, operational flexibility, assistance to meet peak demand (ramps), and reduction in curtailment.
- Ancillary Services: BESS offers a variety of grid support services, including grid stabilization, frequency and voltage control, oscillation damping, spinning reserve, etc.
- Transmission Services: postponement of expansion and reinforcements, network congestion relief, angular, voltage and frequency stability.
- Energy Displacement: BESS stores energy during periods of low demand or low electricity prices and releases it during periods of high demand or high prices, two concepts known as load leveling and arbitrage.
Depending on the chosen application, the BESS behaves differently in the daily, or even larger, operating horizon. Moreover, BESS are capable of executing multiple functions simultaneously in the power system, intercalating them in the considered period in consecutive time slots. The BESS also exhibits an accumulated behavior that can be represented by a recursive model later described in Section 4 of this paper.
The main parameters of a BESS, to be considered in a power system model, are its energy storage capacity (MWh), nominal power capacity (MW), and charging and discharge efficiency (%). According to most BESS models available in the technical literature [2] for reliability or other types of studies, BESS performance can be well characterized by two variables:
- State of Charge (SOC) is the indicator of the usable energy remaining in a battery, expressed as a percentage of the energy storage capacity (0% = empty, 100% = full).
- Power Injected/Consumed in the Network () is the power that the battery makes available to the system or removes from the system as it is in a charge or discharge operation and may oscillate between maximum positive or negative values.
Experience with different battery technologies indicates that it is not appropriate to allow the SOC of BESS to reach extreme values, and for most of these technologies it is recommended to have ranges ranging from 10–20% to 80–90% [8].
3. BESS Model in the Non-Sequential Monte Carlo Simulation
Non-sequential Monte Carlo Simulation (NMCS) is a powerful, non-chronological reliability evaluation technique for power systems composite (generation and transmission) reliability evaluation. It consists of randomly sampling power system component states (available, unavailable, or derated) based on component availability to generate overall system snapshots, whose analysis provides information that allows reliability indices calculations, like Loss of Load Probability (LOLP). Non-sequential methods are generally faster than sequential methods, making them ideal for long-term planning studies. Power system components, like generators, transformers, and transmission lines, are usually modeled by a Markov multi-state model. Loads are represented by load curves, usually clustered in a few load levels. Renewable generation requires special probabilistic models considering variability and intermittence [9].
A BESS model for NSMC should take into account its multifunctional behavior [2]. Depending on the function assigned to the BESS, the values of SOC and exhibit different behaviors along with the time evolution in the period considered. In some cases, more than one function may be implemented simultaneously in an intercalated form, producing different historical data for the specific BESS considered.
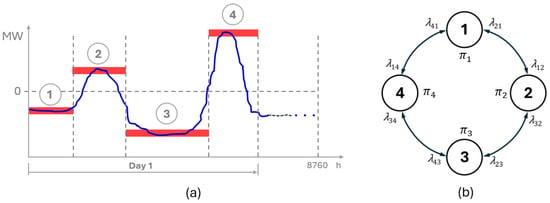
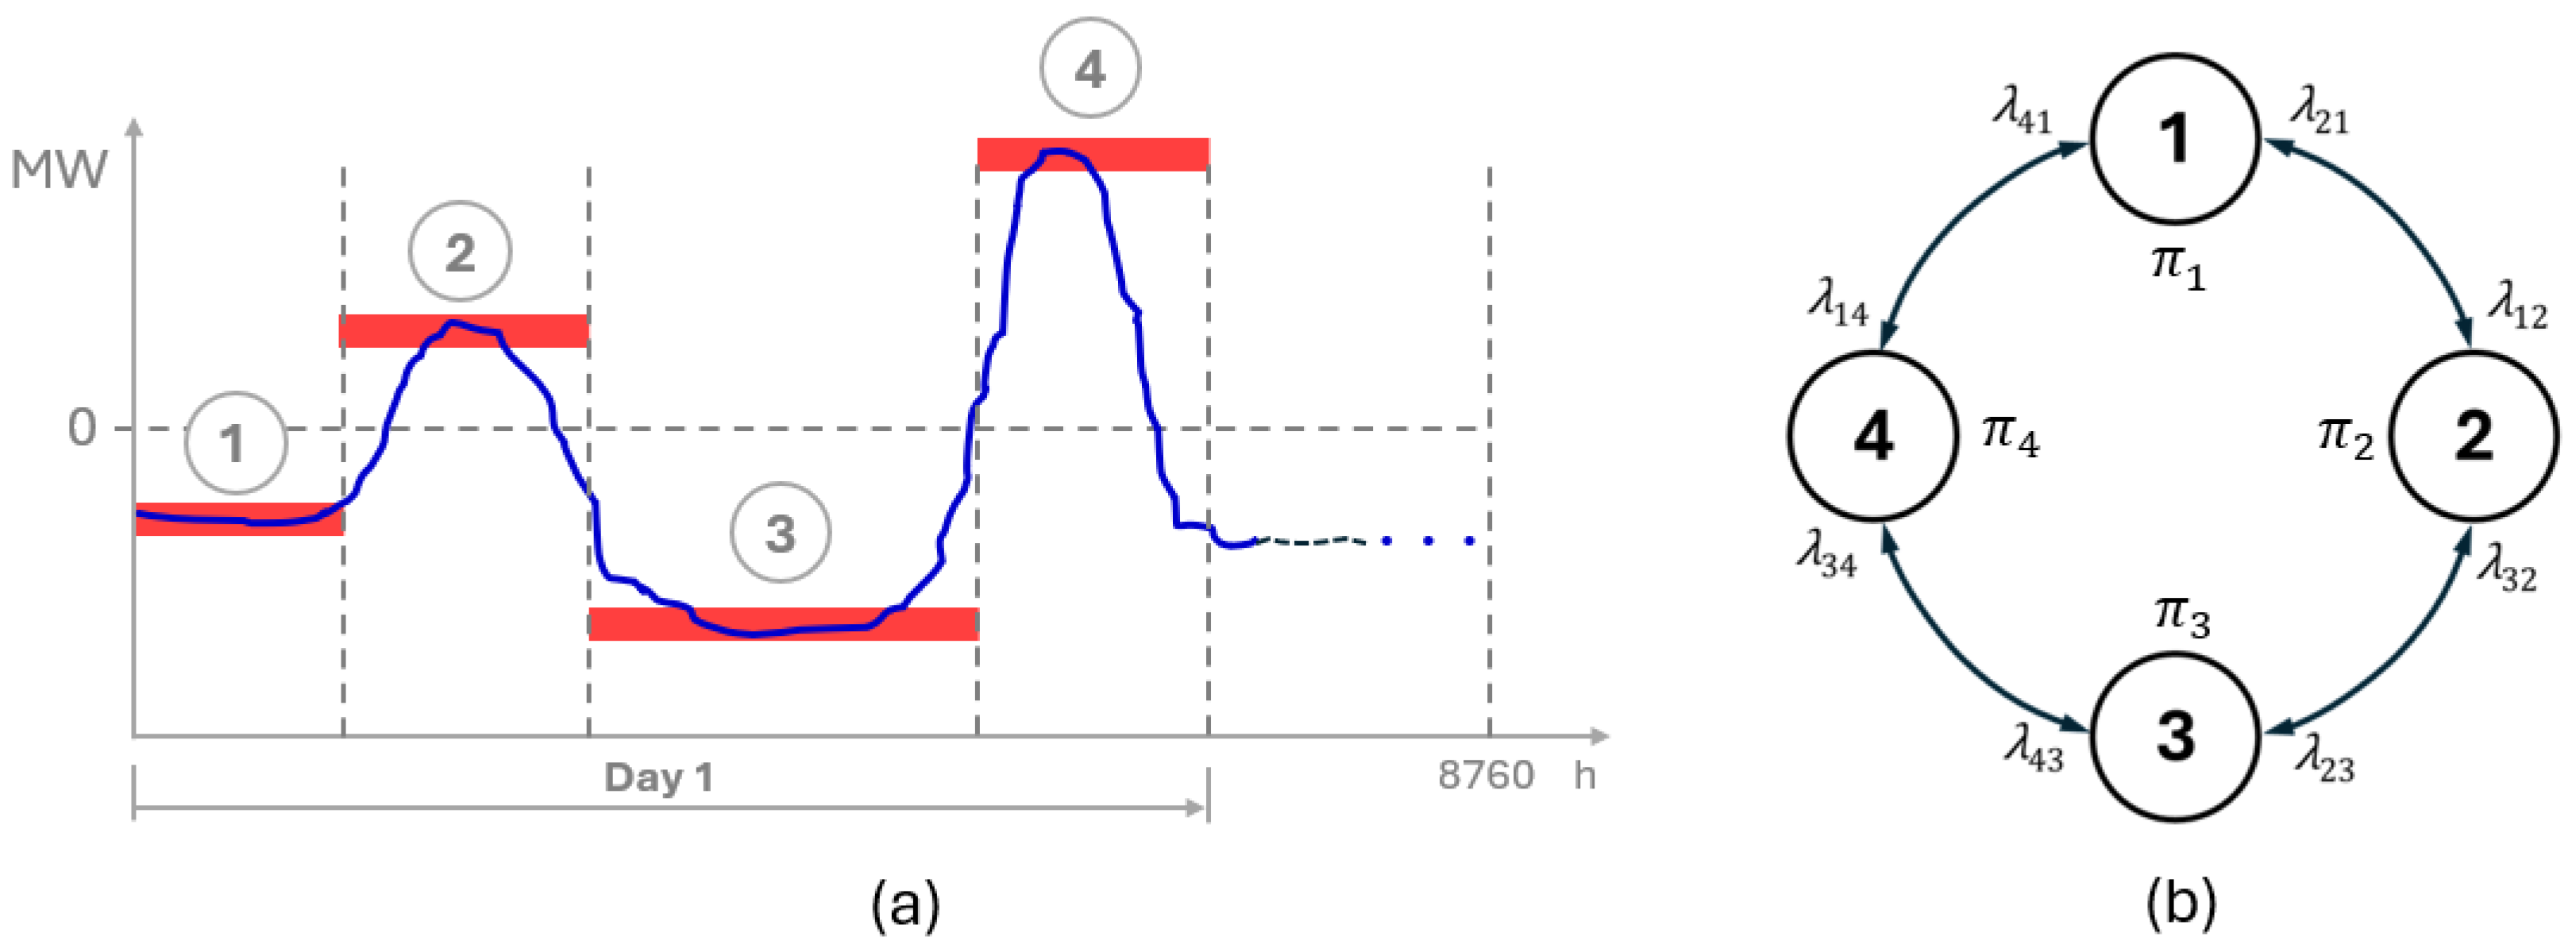
The BESS model proposed in this work is based on a multi-state Markov model obtained from the history of SOC and measured over a period of, for example, 8760 h. These historical data are transformed into SOC and models with multiple levels (states) obtained by clustering techniques. The number of levels into which the load curve is clustered depends on the characteristics of the SOC and data and should take into consideration the practical aspects of the BESS operation. The parameters of the model, such as the transition rates between states () and probability of occurrence of each state (), can be obtained directly from the clustered curves. is the number of transitions between states i and j divided by the total time of permanence in state i, while is the total time of permanence in state i divided by the total time of the considered period. Figure 1 illustrates this kind of model for hypothetical historic data for , from which four power levels are clustered (a), and the respective multi-state model is established (b). In Figure 1a, the blue line is the historical or synthetic data, and the red ones are the levels obtained by the clustering process.
Figure 1.
Hypothetical BESS injected power historic (a) and multi-state model (b).
3.1. Re-Dispatch BESS Model
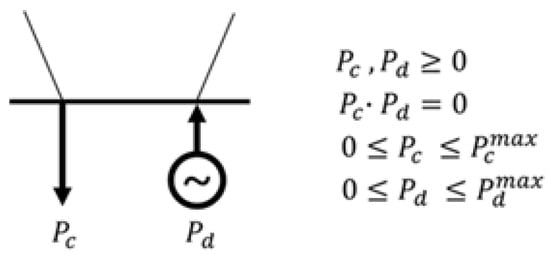
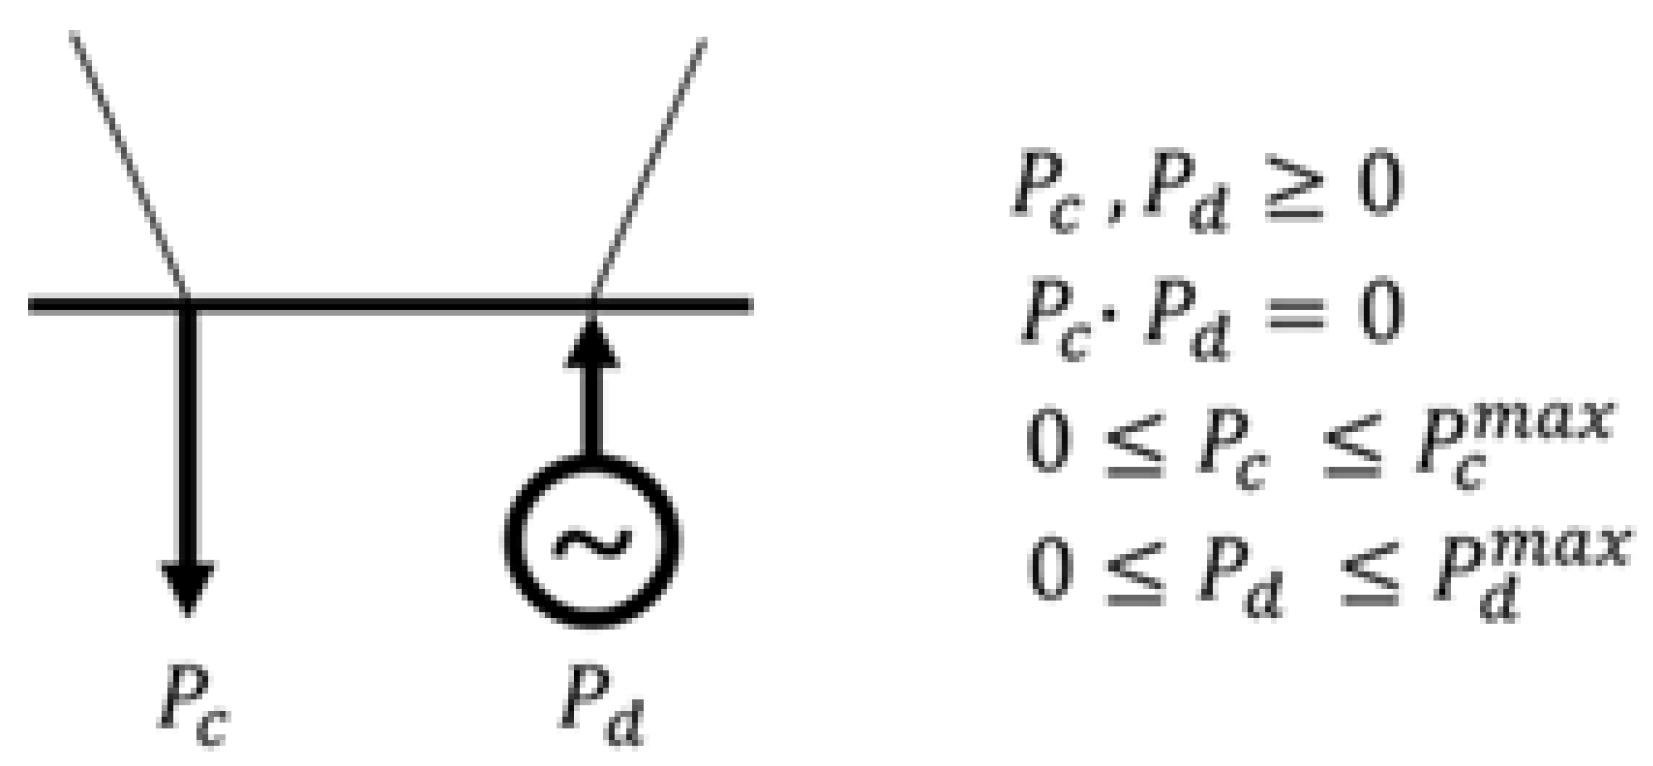
The reliability assessment by NMCS includes load flow evaluation for each sampled system state. In these load flow calculations, the BESS are represented as shown in Figure 2, where the values of and are obtained from the state model introduced above. In the case that the load flow solution indicates that the system demand cannot be fully attended, owing to generation shortage or grid limits violation, a re-dispatch is attempted in order to reduce or, if possible, eliminate the loss of load. If this is not possible, reliability indices, like LOLP, are incremented.
Figure 2.
BESS inject power model for loadflow and OPF calculations.
The re-dispatch is usually performed by an Optimal Power Flow (OPF) algorithm. The implementation of the BESS model in the OPF re-dispatch involves a difficult question: how much additional power can be injected by the BESS in the system, knowing its present state (SOC and )? As the NMCS does not take into consideration the past BESS operation, this assessment can only be guessed based on a reasonable estimation. In this work, this estimate is given by the product of the current SOC and the BESS maximum power (). The reasoning is that this is the average power the BESS can deliver in the maximum allowed discharge interval. Another way to explain this procedure is to consider that the power is equal to energy over a unit of time, as if each sample represented one hour. For instance, a 100 MW/4h BESS with 50% SOC can deliver 50 MW.
The algorithm shown in Algorithm 1 implements the concepts presented above. This algorithm should be used to determine the value of , the maximum value of power that can be injected by the BESS to reduce or eliminate the load shedding. As can be noted, in this algorithm the constraint in the BESS model is momentarily relaxed for implementation simplicity, but after the OPF execution, the actual value of should be corrected by subtracting the value of . This procedure is convenient to allow the case in which the solution of the OPF indicates a partial reduction in the charging power.
| Algorithm 1 BESS Re-dispatch Algorithm for OPF application |
|
3.2. Time Series Correlation Maintenance
To greatly improve the results obtained with the NMCS, some techniques to preserve the input time series correlations must be utilized instead of a simple random state sampling. The procedure adopted by this paper is described in Reference [10], which proposes a non-parametric method based on rank correlations to induce a desired dependence among variables. In this reference, the authors use mainly Van der Waerden scores based on normal distributions, but an alternative scoring presented is the use of the correlation matrix ranks themselves. Reference [9], which evaluates methods to consider correlation in NMCS, showed that the latter scoring, referred to as Rank Score, performs better in computing reliability indices, so this was the approach used. This performance was confirmed in reference [11], where the Rank Score was compared with the Kernel Density Estimation for large-scale energy systems and also presented a higher computational efficiency.
For faster convergence, the Rank Score method was utilized in conjunction with Latin Hypercube Sampling (LHS), which covers the sample space in a more efficient way. In this technique, the random variables are partitioned into different strata, whose values are randomly selected. These drawn values for the variables are such that each stratum is considered only once. The LHS is thoroughly described in References [12,13].
Several methods for modeling correlations among multiple random variables in NMCS have been compared by means of statistical metrics (R2, Wilcoxon signed-rank and Kolmogorov–Smirnov test (p-value), etc.): Hierarchical Archimedean Copula [14], Correlation Matrix with Nataf transformation [15], Rank Score with Latin Hypercube sampling (RS + LHS), Vine Copulas [9] and Kernel Density Estimation with Bayesian Networks [11]. Overall, the RS + LHS approach demonstrates superior performance, making it the best choice for NMCS to accurately capture correlations between renewable generation, load and BESS, while requiring significantly less computational effort than SMCS.
4. Synthetic Historic Data Generation
The algorithm for generating the synthetic time series for use in the SMCS is detailed in this section. It depends heavily on the BESS operational strategy employed. The scheme chosen for this paper was the peak shaving strategy. The described algorithm is based on a simplified power system model with no network constraints, i.e., loads, generations, and BESS are connected to a single bus. The time series of renewable generations and loads are supposed to be available for adequate periods of time.
The peak shaving algorithm is composed of the steps described below, considering and , respectively, as the maximum charging (MW) and capacity (MWh) for the BESS:
- For each BESS, its participation factor is calculated using the following formulation [16]:
- The generation G and load L are sampled, with the energy source availability also being taken into account. G and L are, respectively, the total generation and total load without considering BESS at time t. Then
- (a)
- If < and G > L, where and are, in order, the SOC for the previous time step and its maximum operational value, the ith storage will be set in charge mode. Therefore, the following equation applies:in which is the BESS charge at time t. The minus sign highlights the fact that the BESS is acting as a load instead of a source in this case;
- (b)
- If > and G < L, where is the minimum SOC value accepted by operational standards, the ith storage will be set in discharge mode. Its respective equation is as follows:
- (c)
- If the SOC is already at its maximum or minimum limits, the ith storage will be set to neutral mode, and no action is needed. Thus, the BESS generation becomes the following:
- The SOC value for the actual time step can now be calculated, depending on the BESS operation mode:
- (a)
- If the BESS is charging, the following expression is used:where is the SOC in MWh given by (%) times , is the time step drawn from the chronological simulation and is the charging efficiency. In charge mode, since is negative, it is possible that the SOC value given by Equation (5) becomes greater than . In this case, the calculated SOC is bounded to this upper limit, and the BESS charging is limited to the following:Then the generation and load with BESS can be calculated as follows:
- (b)
- If the BESS is discharging, will be the following:with denoting the discharge efficiency. Considering that reduces from one time step to another in discharge mode, it could become lower than its minimum operational limit. In this situation, the SOC will be fixed at , and , and will be given by the following:
- (c)
- In neutral mode, the SOC is the same as in the previous time step, since there is no BESS generation. Therefore,
The values used for the parameters and the initial SOC and BESS generation are the following:
5. Results
The methodology was validated using test cases similar to those described in [9], which are composed of sets of generation and load time series corresponding to the aggregated generators in the Brazilian Northeastern region, but modified with the addition of BESS storage. Then, the loss of load probability (LOLP) and expected power not supplied (EPNS) indices in the NH1 reliability for the non-sequential and sequential approaches were calculated and compared to assess the accuracy of the former method.
5.1. Description of the Cases
The three test cases used in this work are based on the Brazilian Northeastern case reported in [9]. These cases do not have network representation, and all of them were modified to have different BESS energy capacities (MWh) and power rating (MW) (considered with no failure) as follows:
- The first modification introduces one BESS with a capacity of 1000 MWh and a maximum charge/discharge power of 100 MW. To simplify its description, this modification will be denoted by an ‘a’;
- The second modification introduces two BESS with the same discharge time of 10 h. The first storage has 600 MWh of capacity and 60 MW of maximum power, while the second has 400 MWh and 40 MW. This modification will be denoted by a ‘b’;
- The third modification also introduces two BESS but with different discharge times. The first one has 600 MWh and 40 MW, with a duration of 15 h, while the second has 400 MWh and 60 MW, with a duration of about 6.67 h. This modification will be denoted by a ‘c’.
Power plant information for Cases 1, 2 and 3 is, respectively, described in Table 1, Table 2 and Table 3. The first case is a version of the Northeast case without wind generation, while the second and third cases have, respectively, one and seven wind generators, along with the other generations present in the first case. The mean time to failure (MTTF) and mean time to repair (MTTR) of each generating unit are also based on those used in [9], although the MTTR of the HPP and TPP were slightly raised to increase their downtimes.
Table 1.
Generating plant data of Case 1 (without BESS).
Table 2.
Generating plant data of Case 2 (without BESS).
Table 3.
Generating plant data of Case 3 (without BESS).
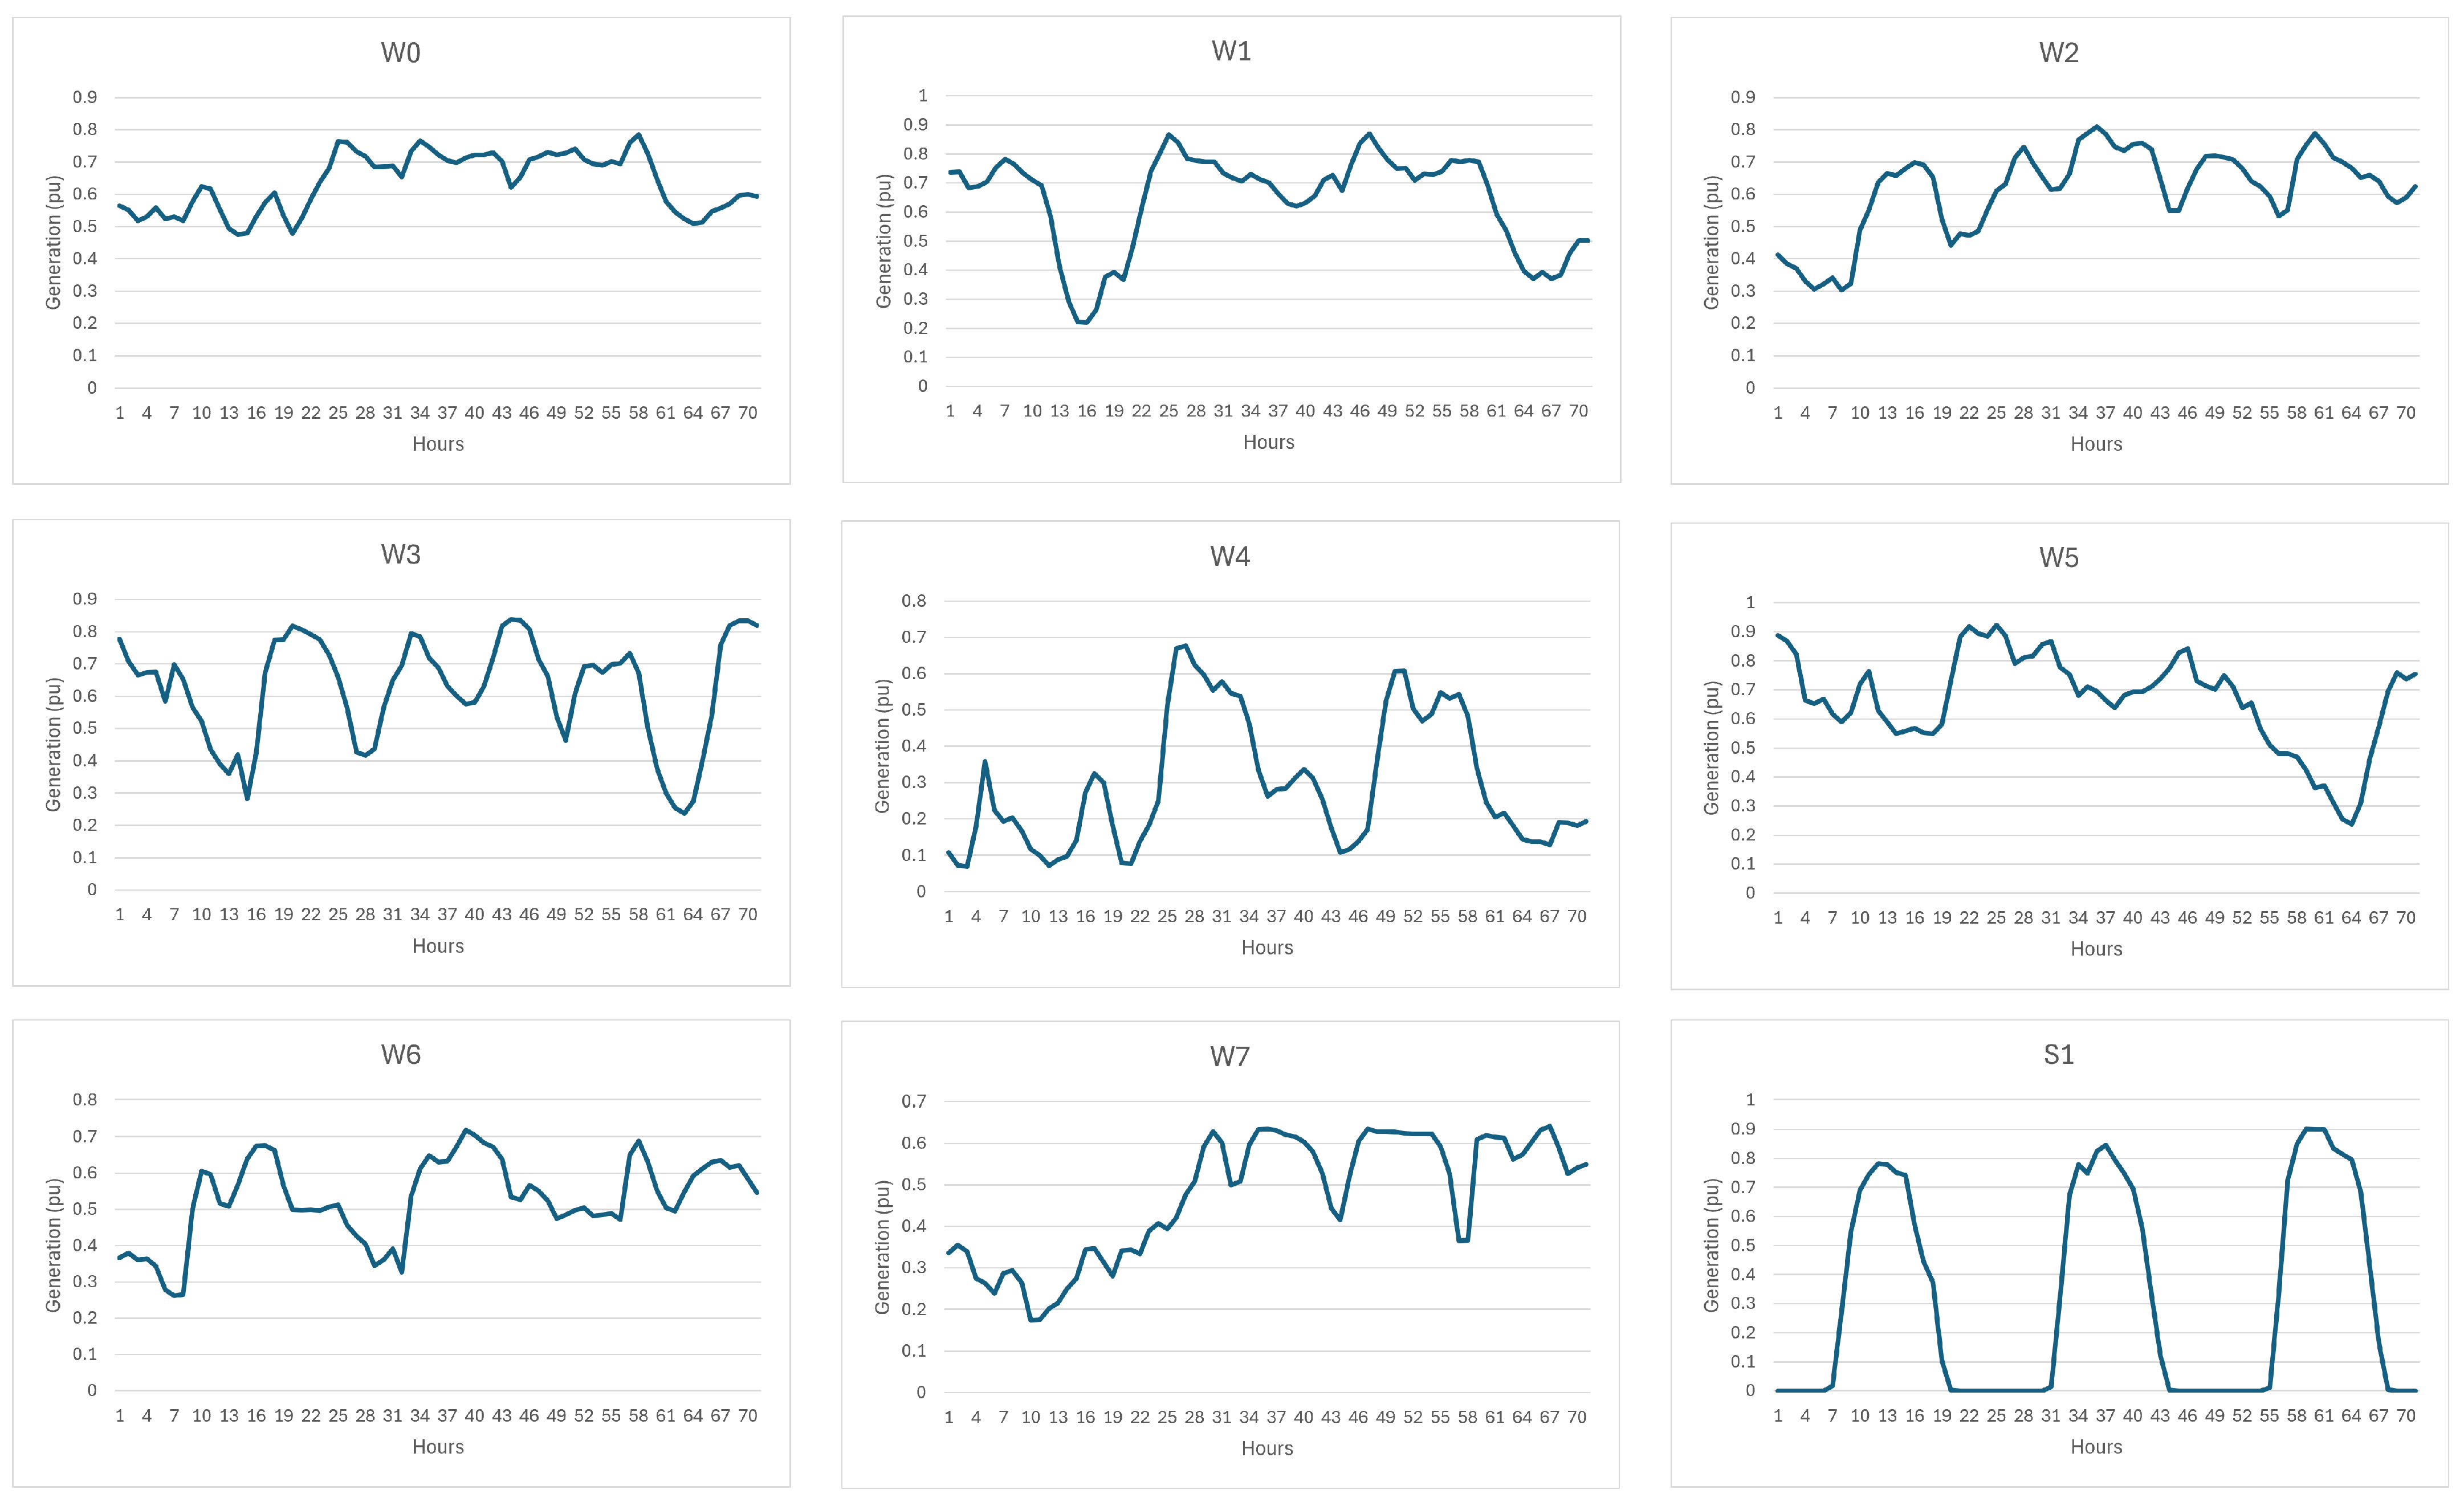
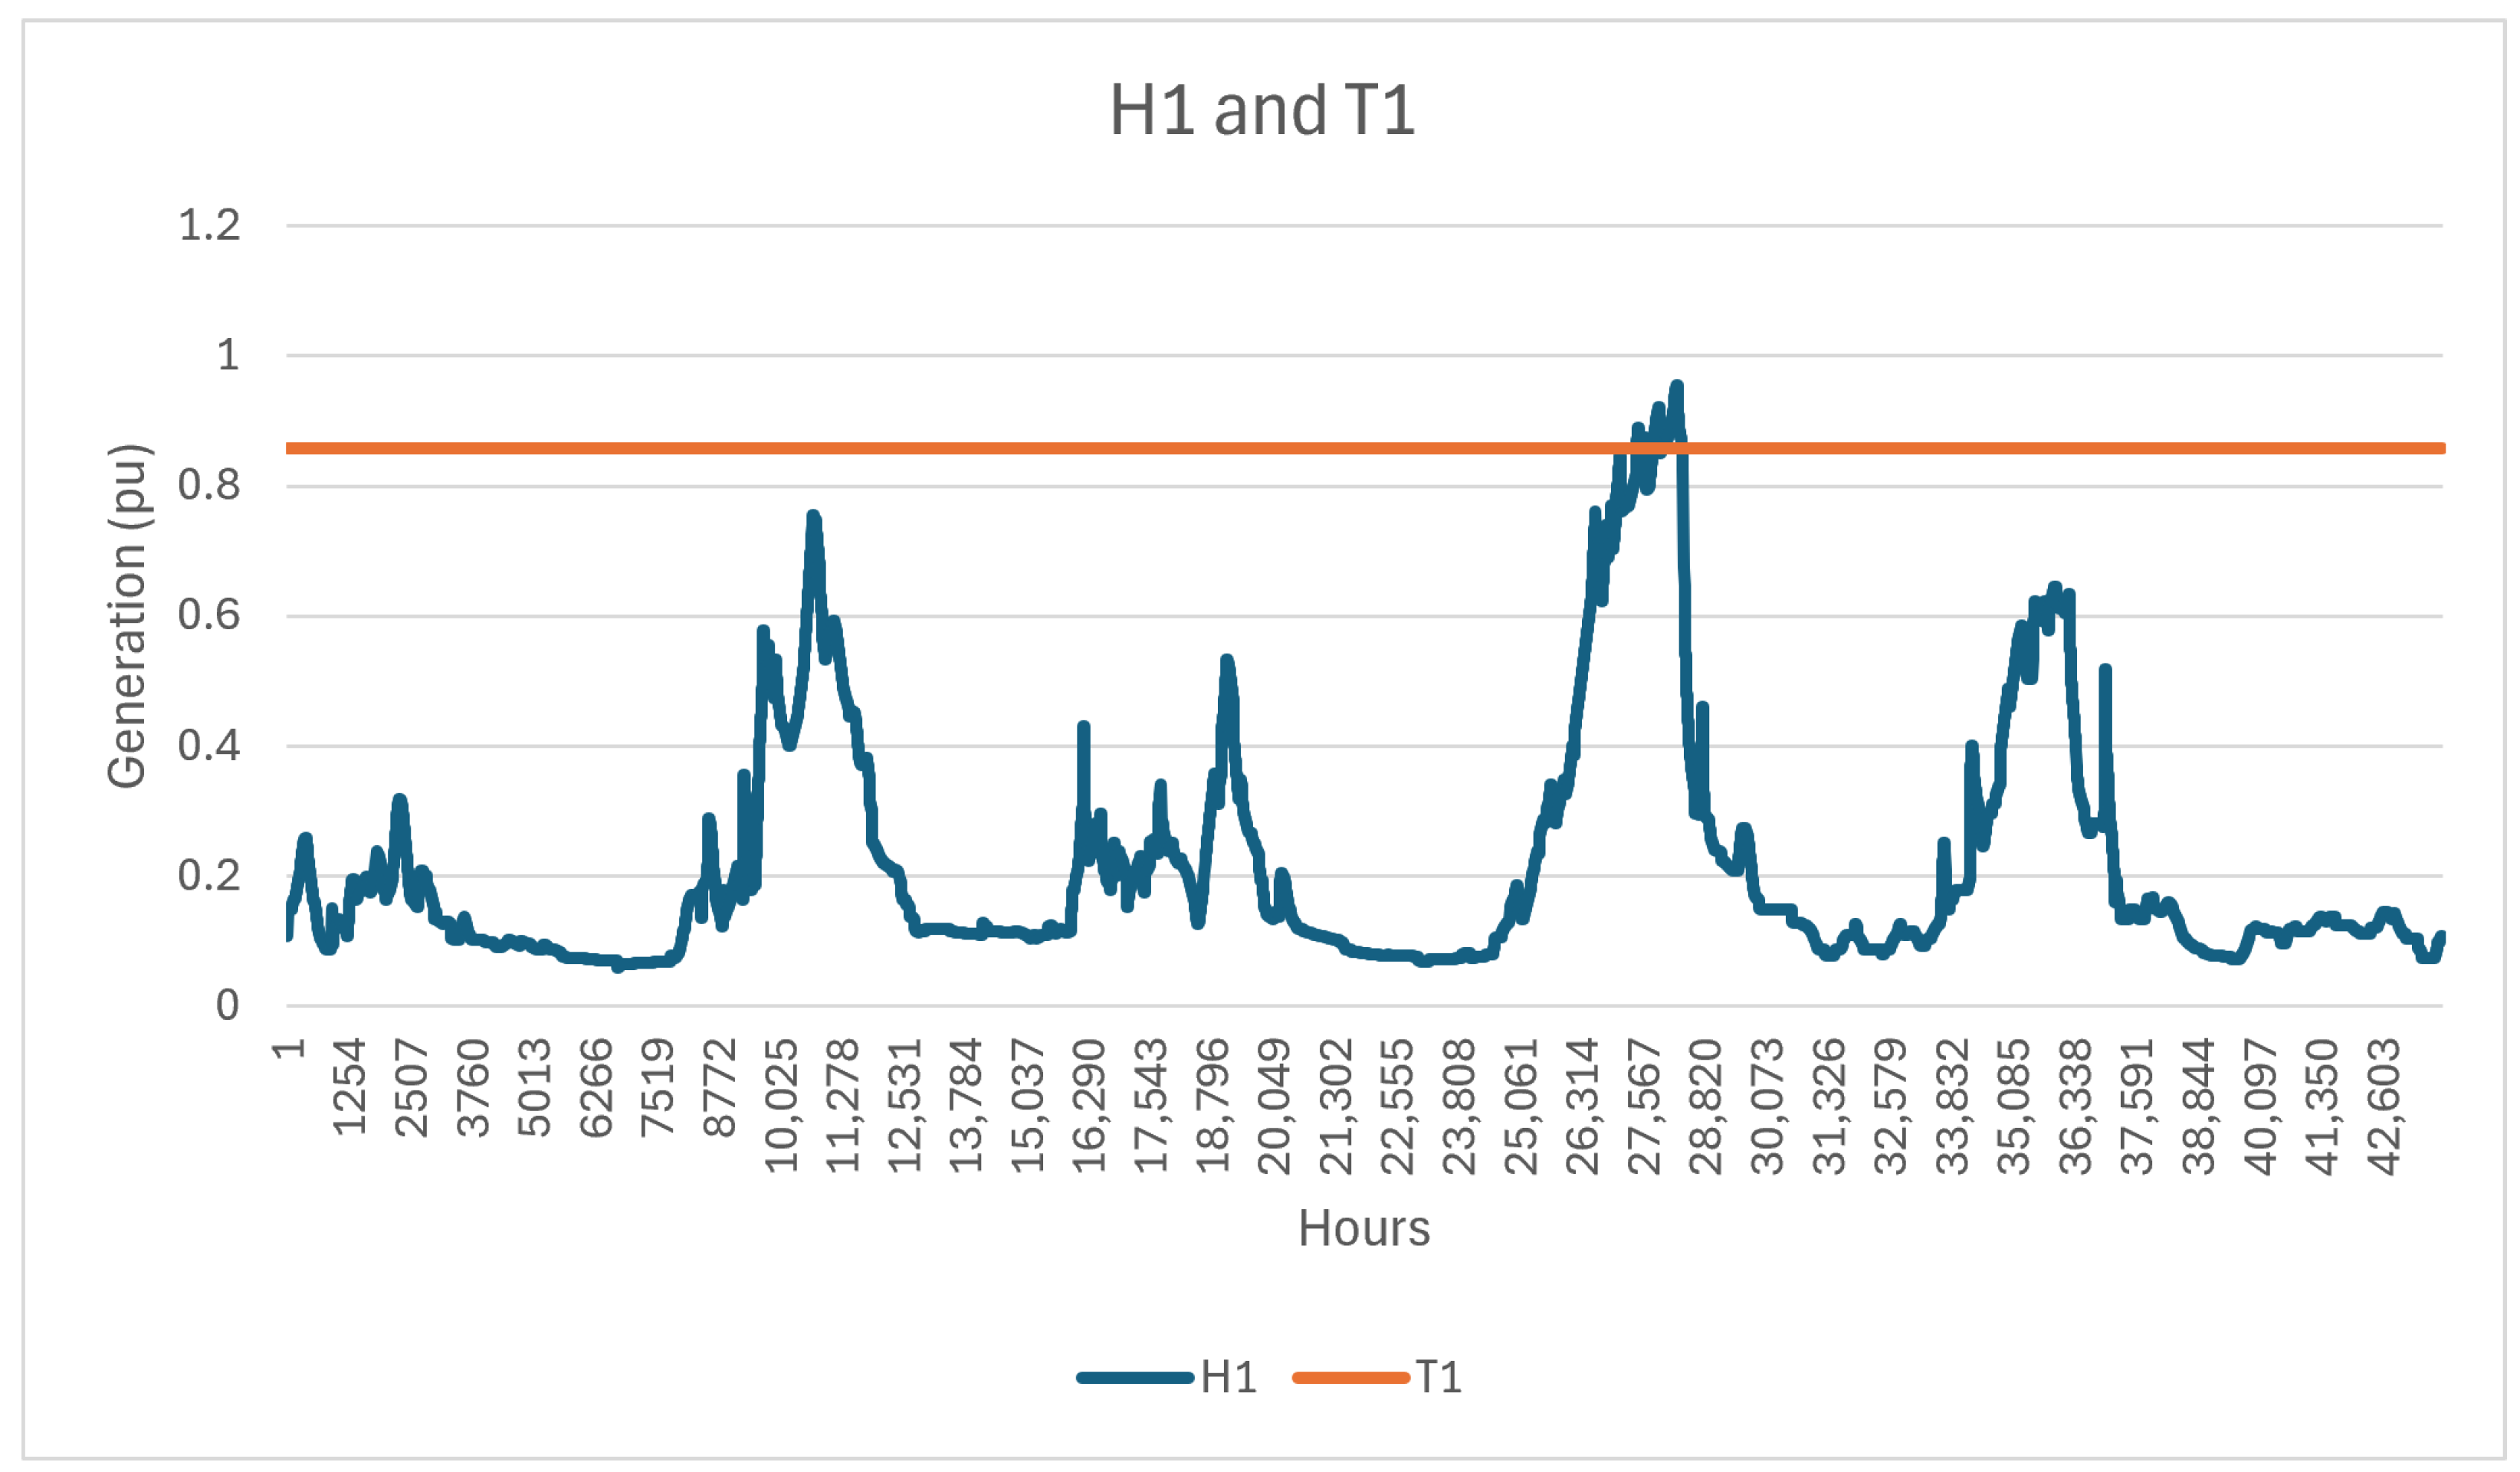
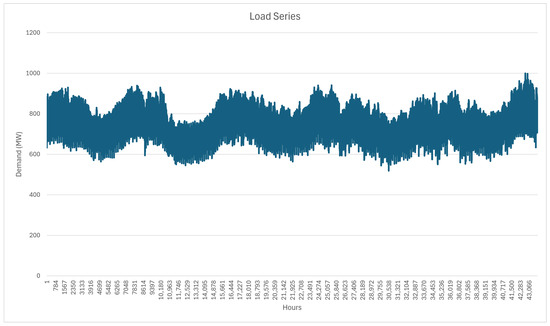
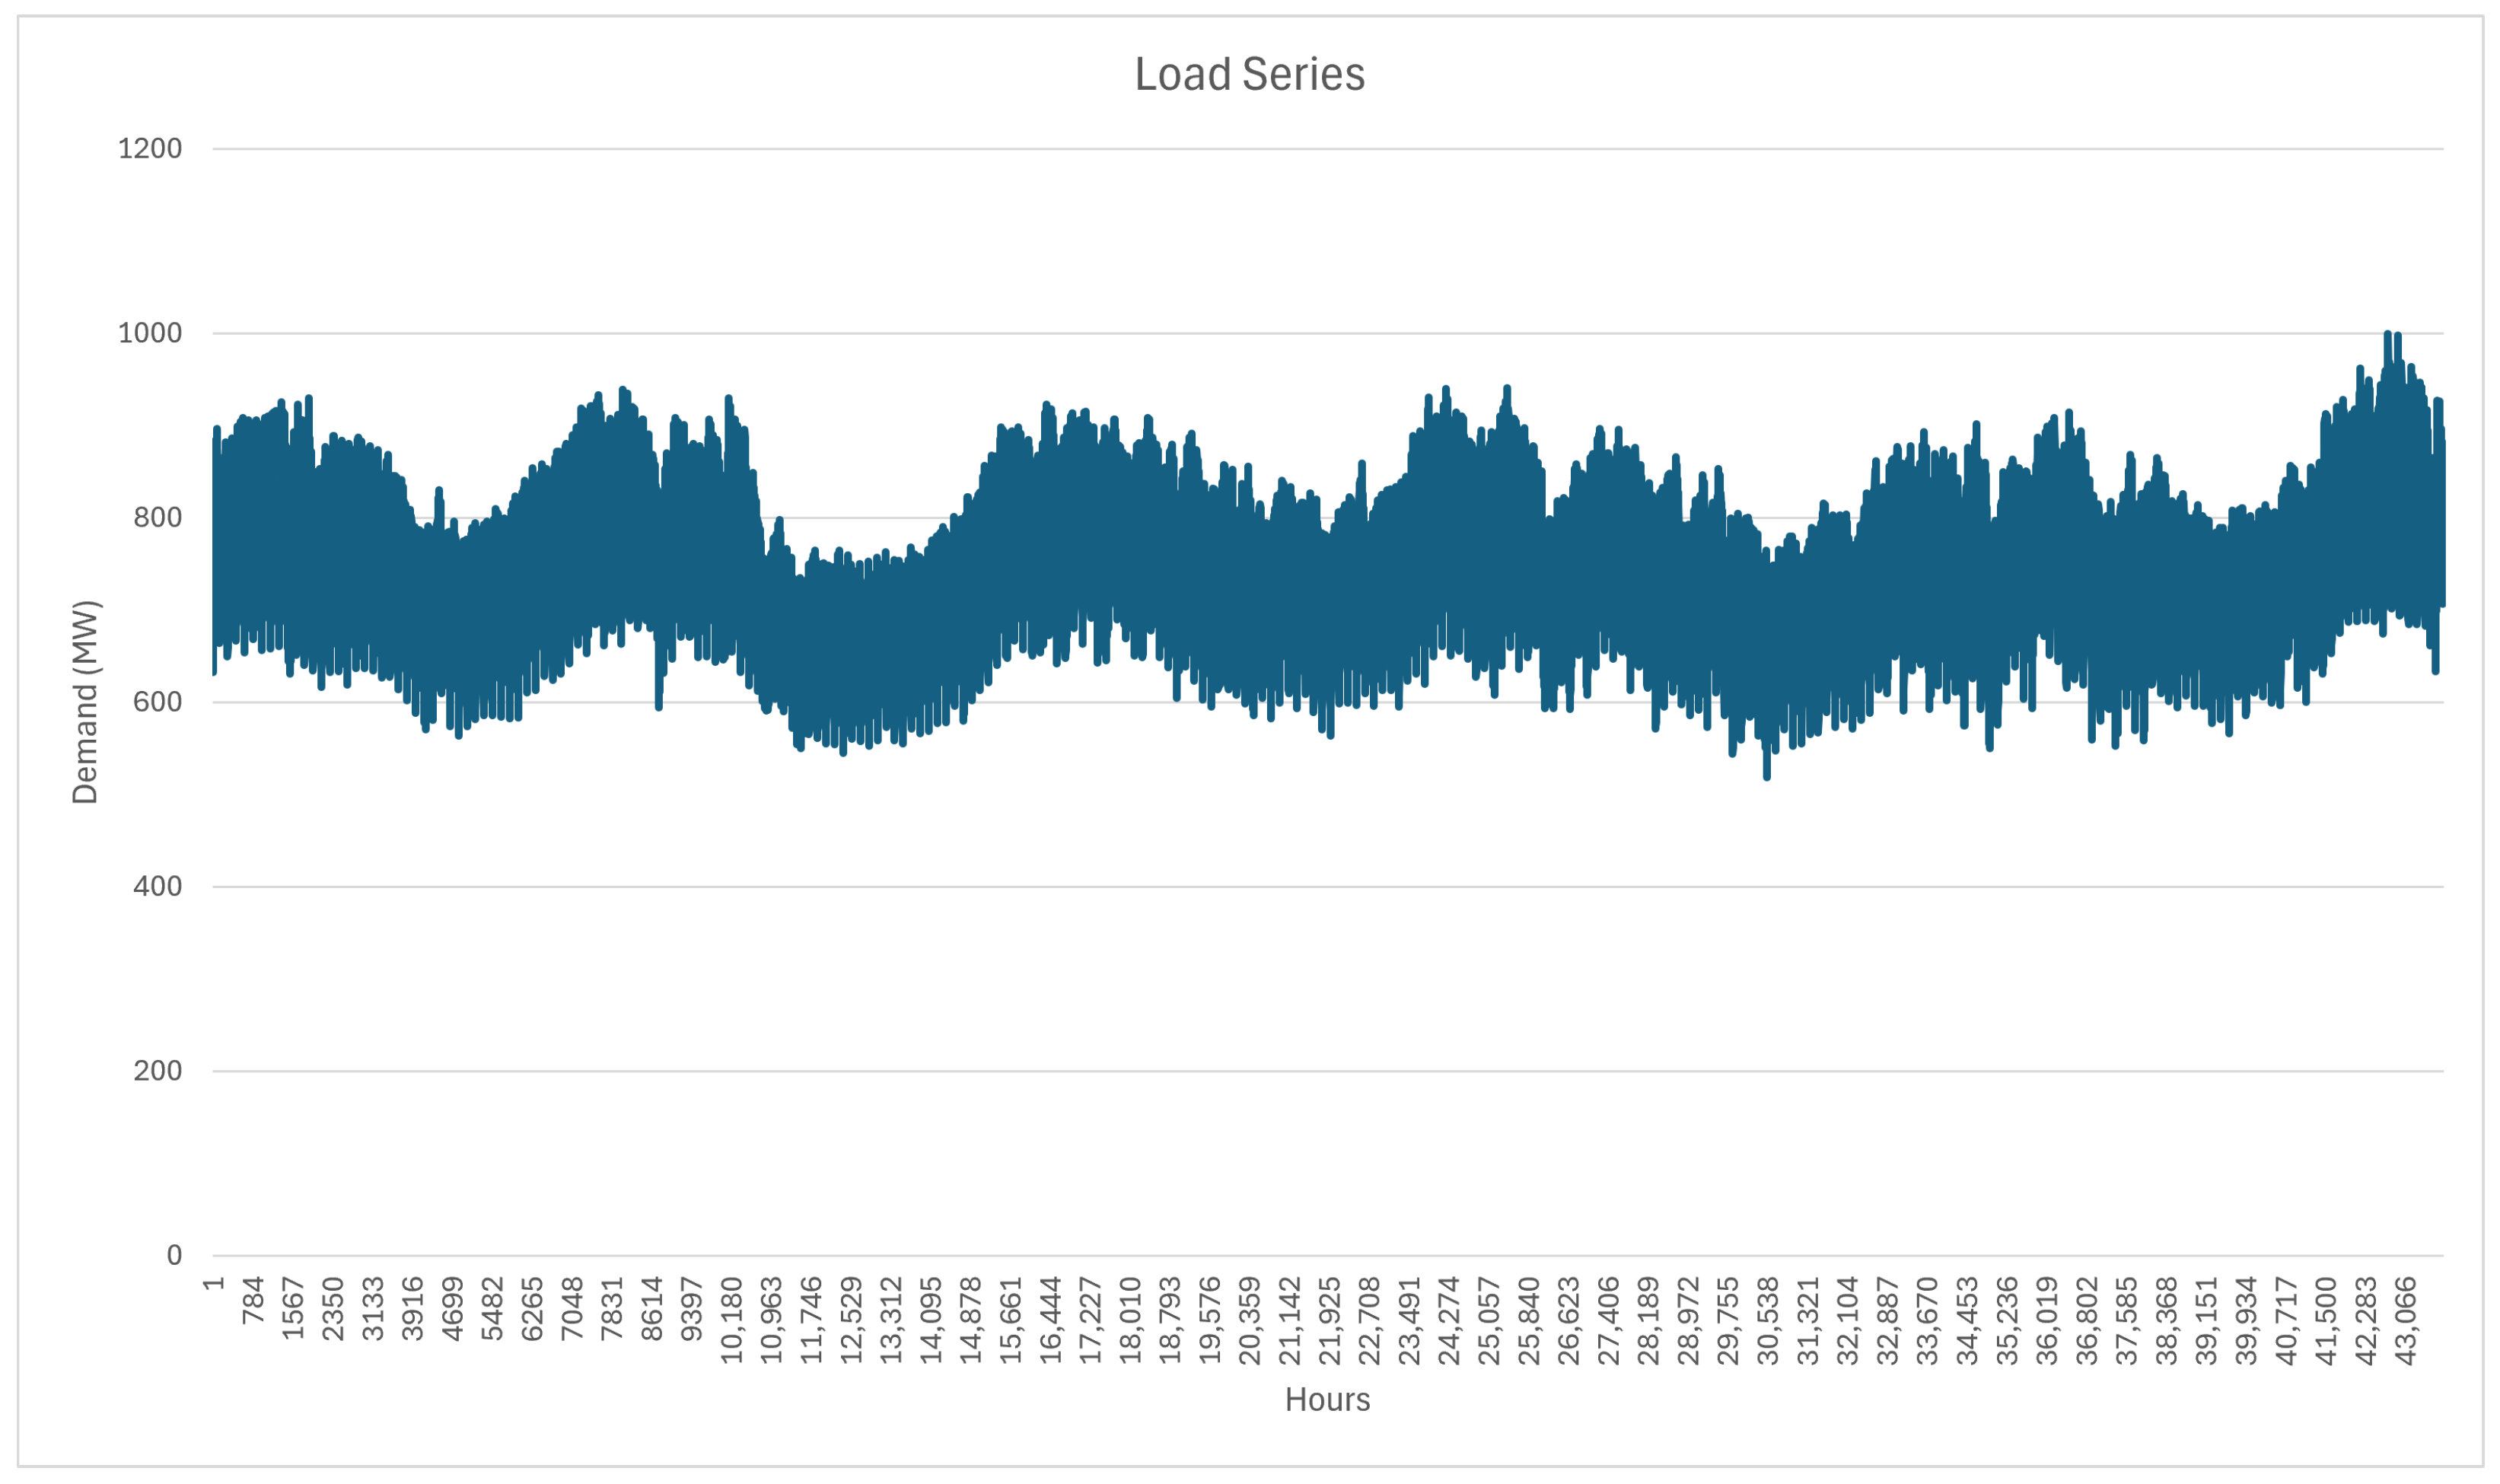
The five-year hourly per-unit generation series, composed of 43,825 data points and comprising the period from 2019 to 2023, is fully described in [9] for each type of generator. The series of wind and solar generation are illustrated in Figure 3, for a three-day period, while hydro and thermal plants are shown in Figure 4, for the five-year period. It can be seen that thermal generation is constant for the time considered. The load time series has the same granularity and period as the generation series and is the same for all three cases. It is shown in Figure 5.
Figure 3.
Time series for a 72 h period of wind and solar generation.
Figure 4.
Time series for the five-year period of hydro and thermal generation.
Figure 5.
Load time series for the five-year period.
5.2. Results Obtained
In this section, the calculated reliability indices and synthetic series that correspond to the behavior of the BESS in the sequential simulation will be presented. For all the following cases, the convergence criteria used for both sequential and non-sequential simulations were a coefficient of variation , with a minimum number of samples equal to 2. The maximum number of samples is different in the sequential and non-sequential simulations, being 300 for the former and 50,000 for the latter. Also, all the simulations were conducted in a Windows OS, with an 8-core processor and 32 GB RAM. The methodology was programmed in Python 3.14 language, without parallel processing.
5.2.1. Case 1: No Wind Generation
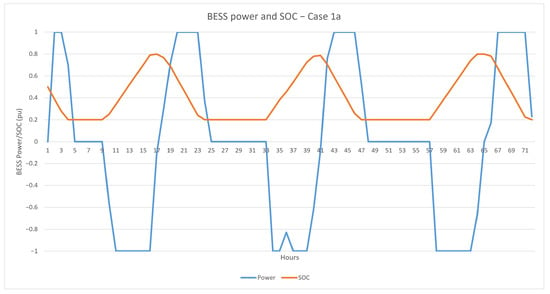
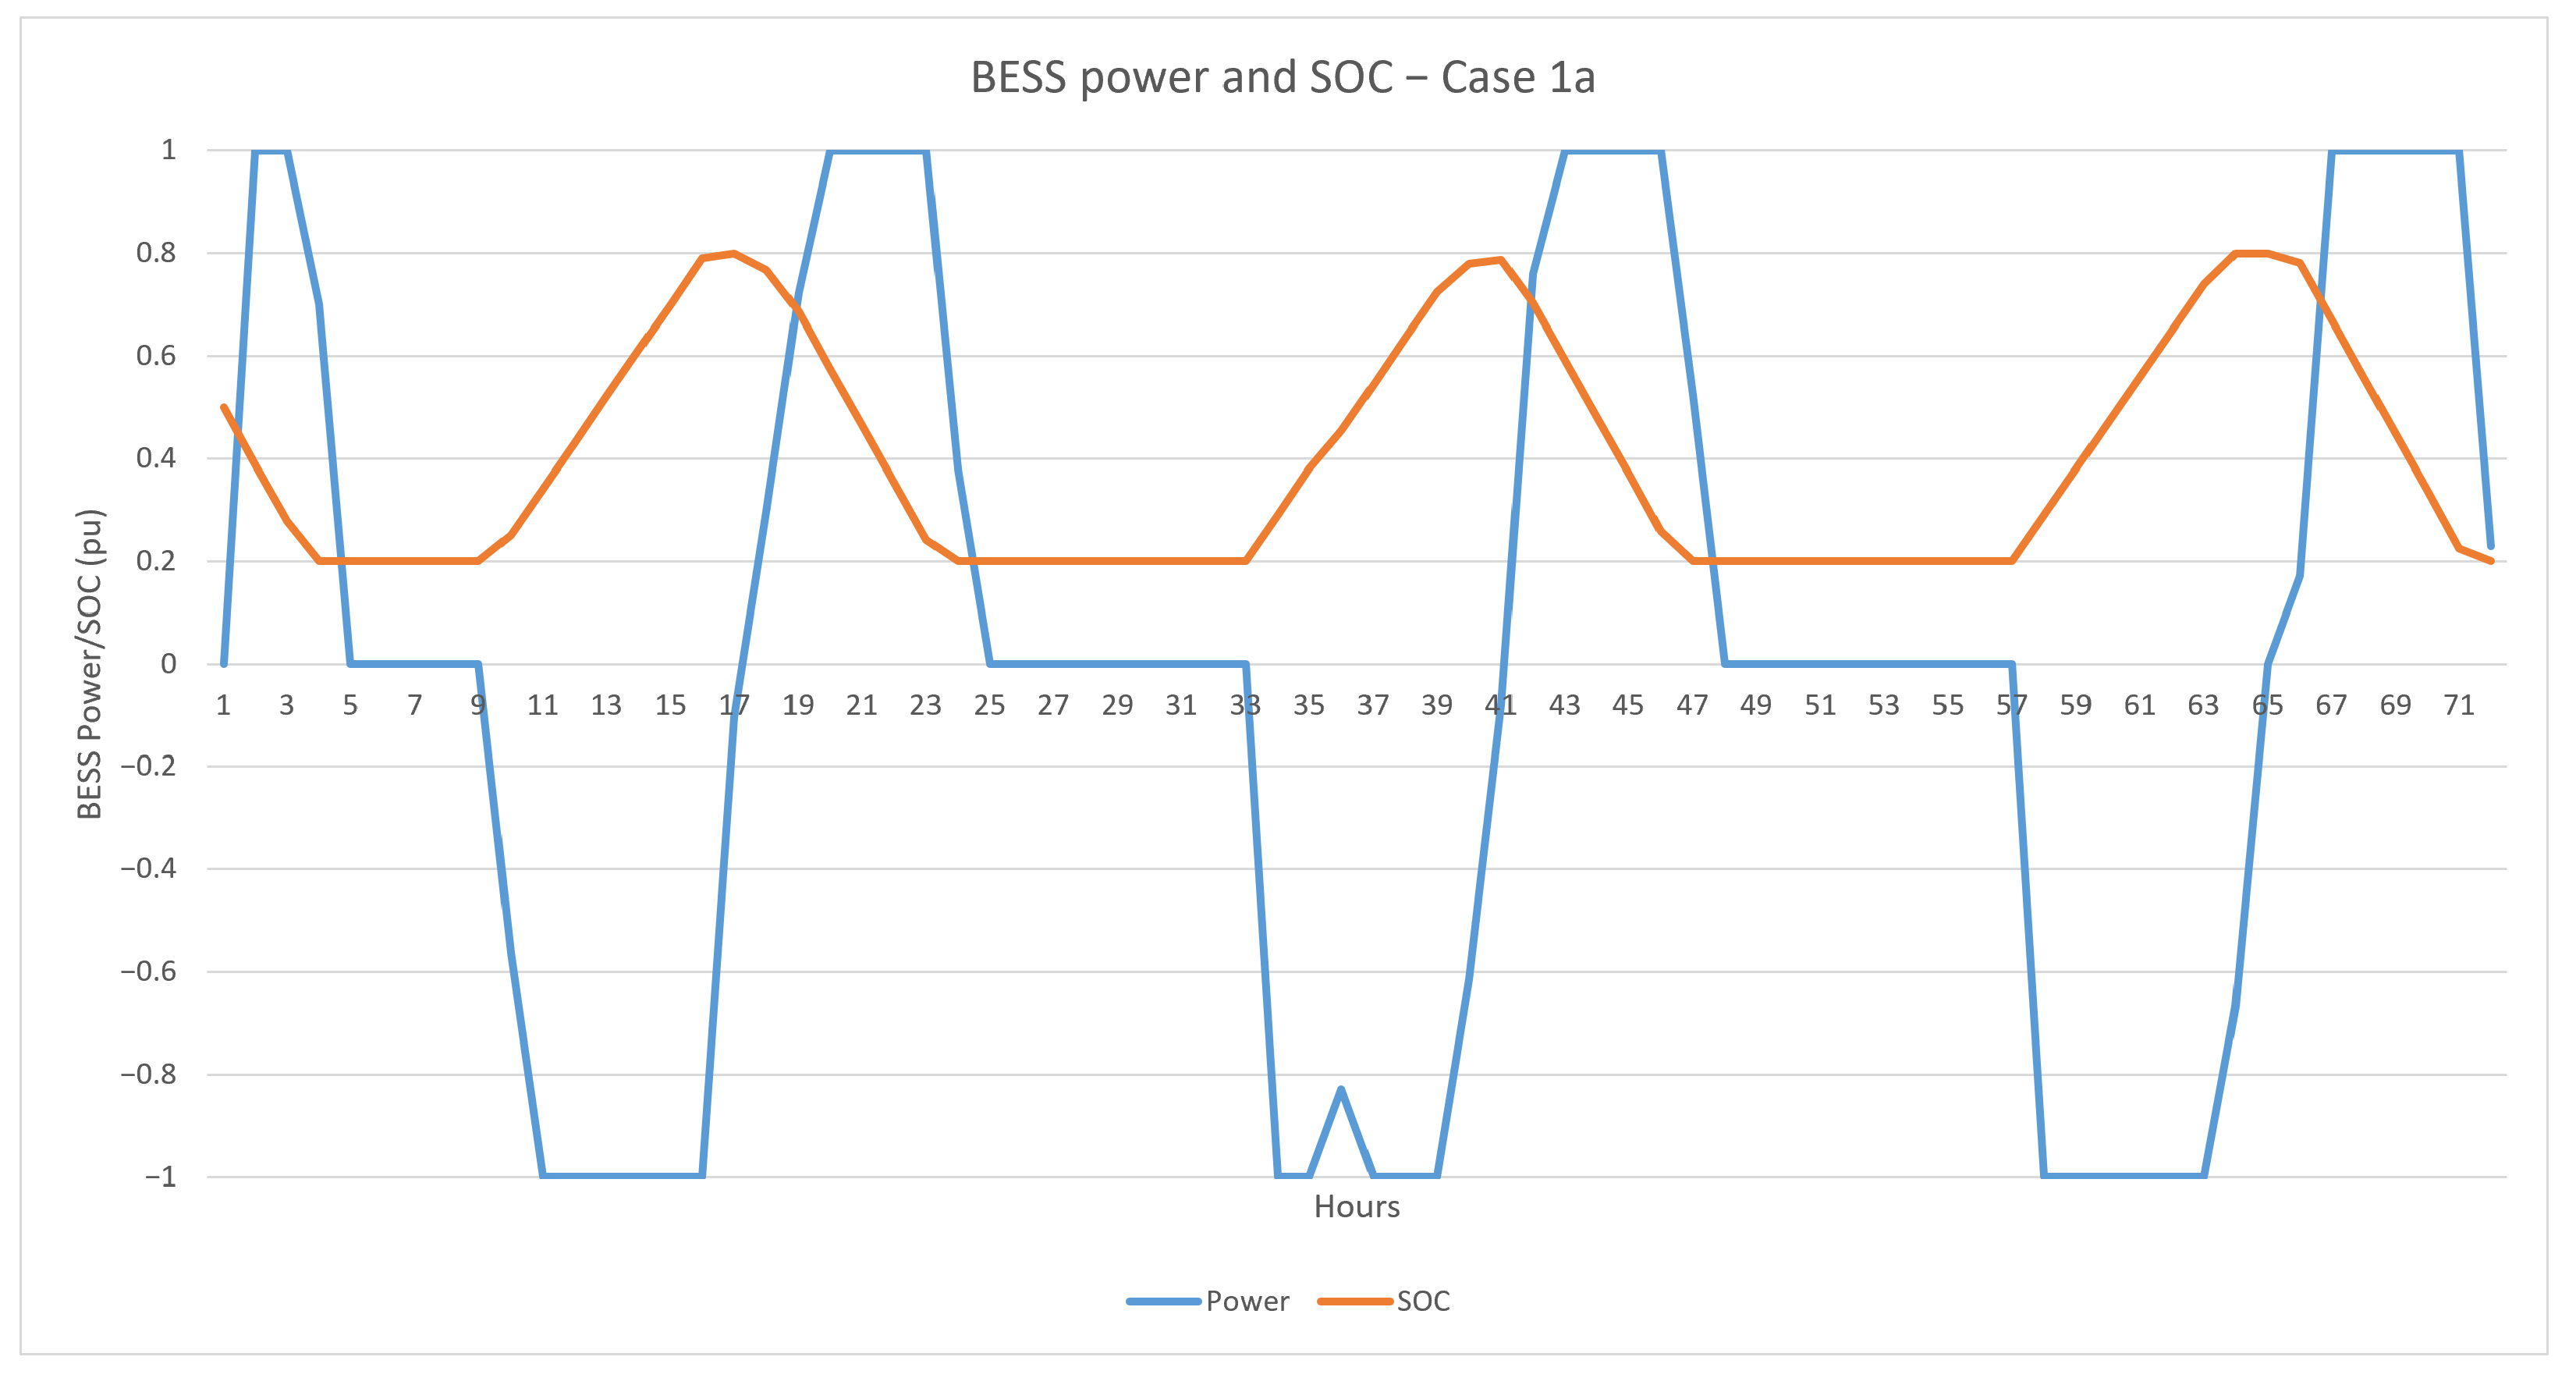
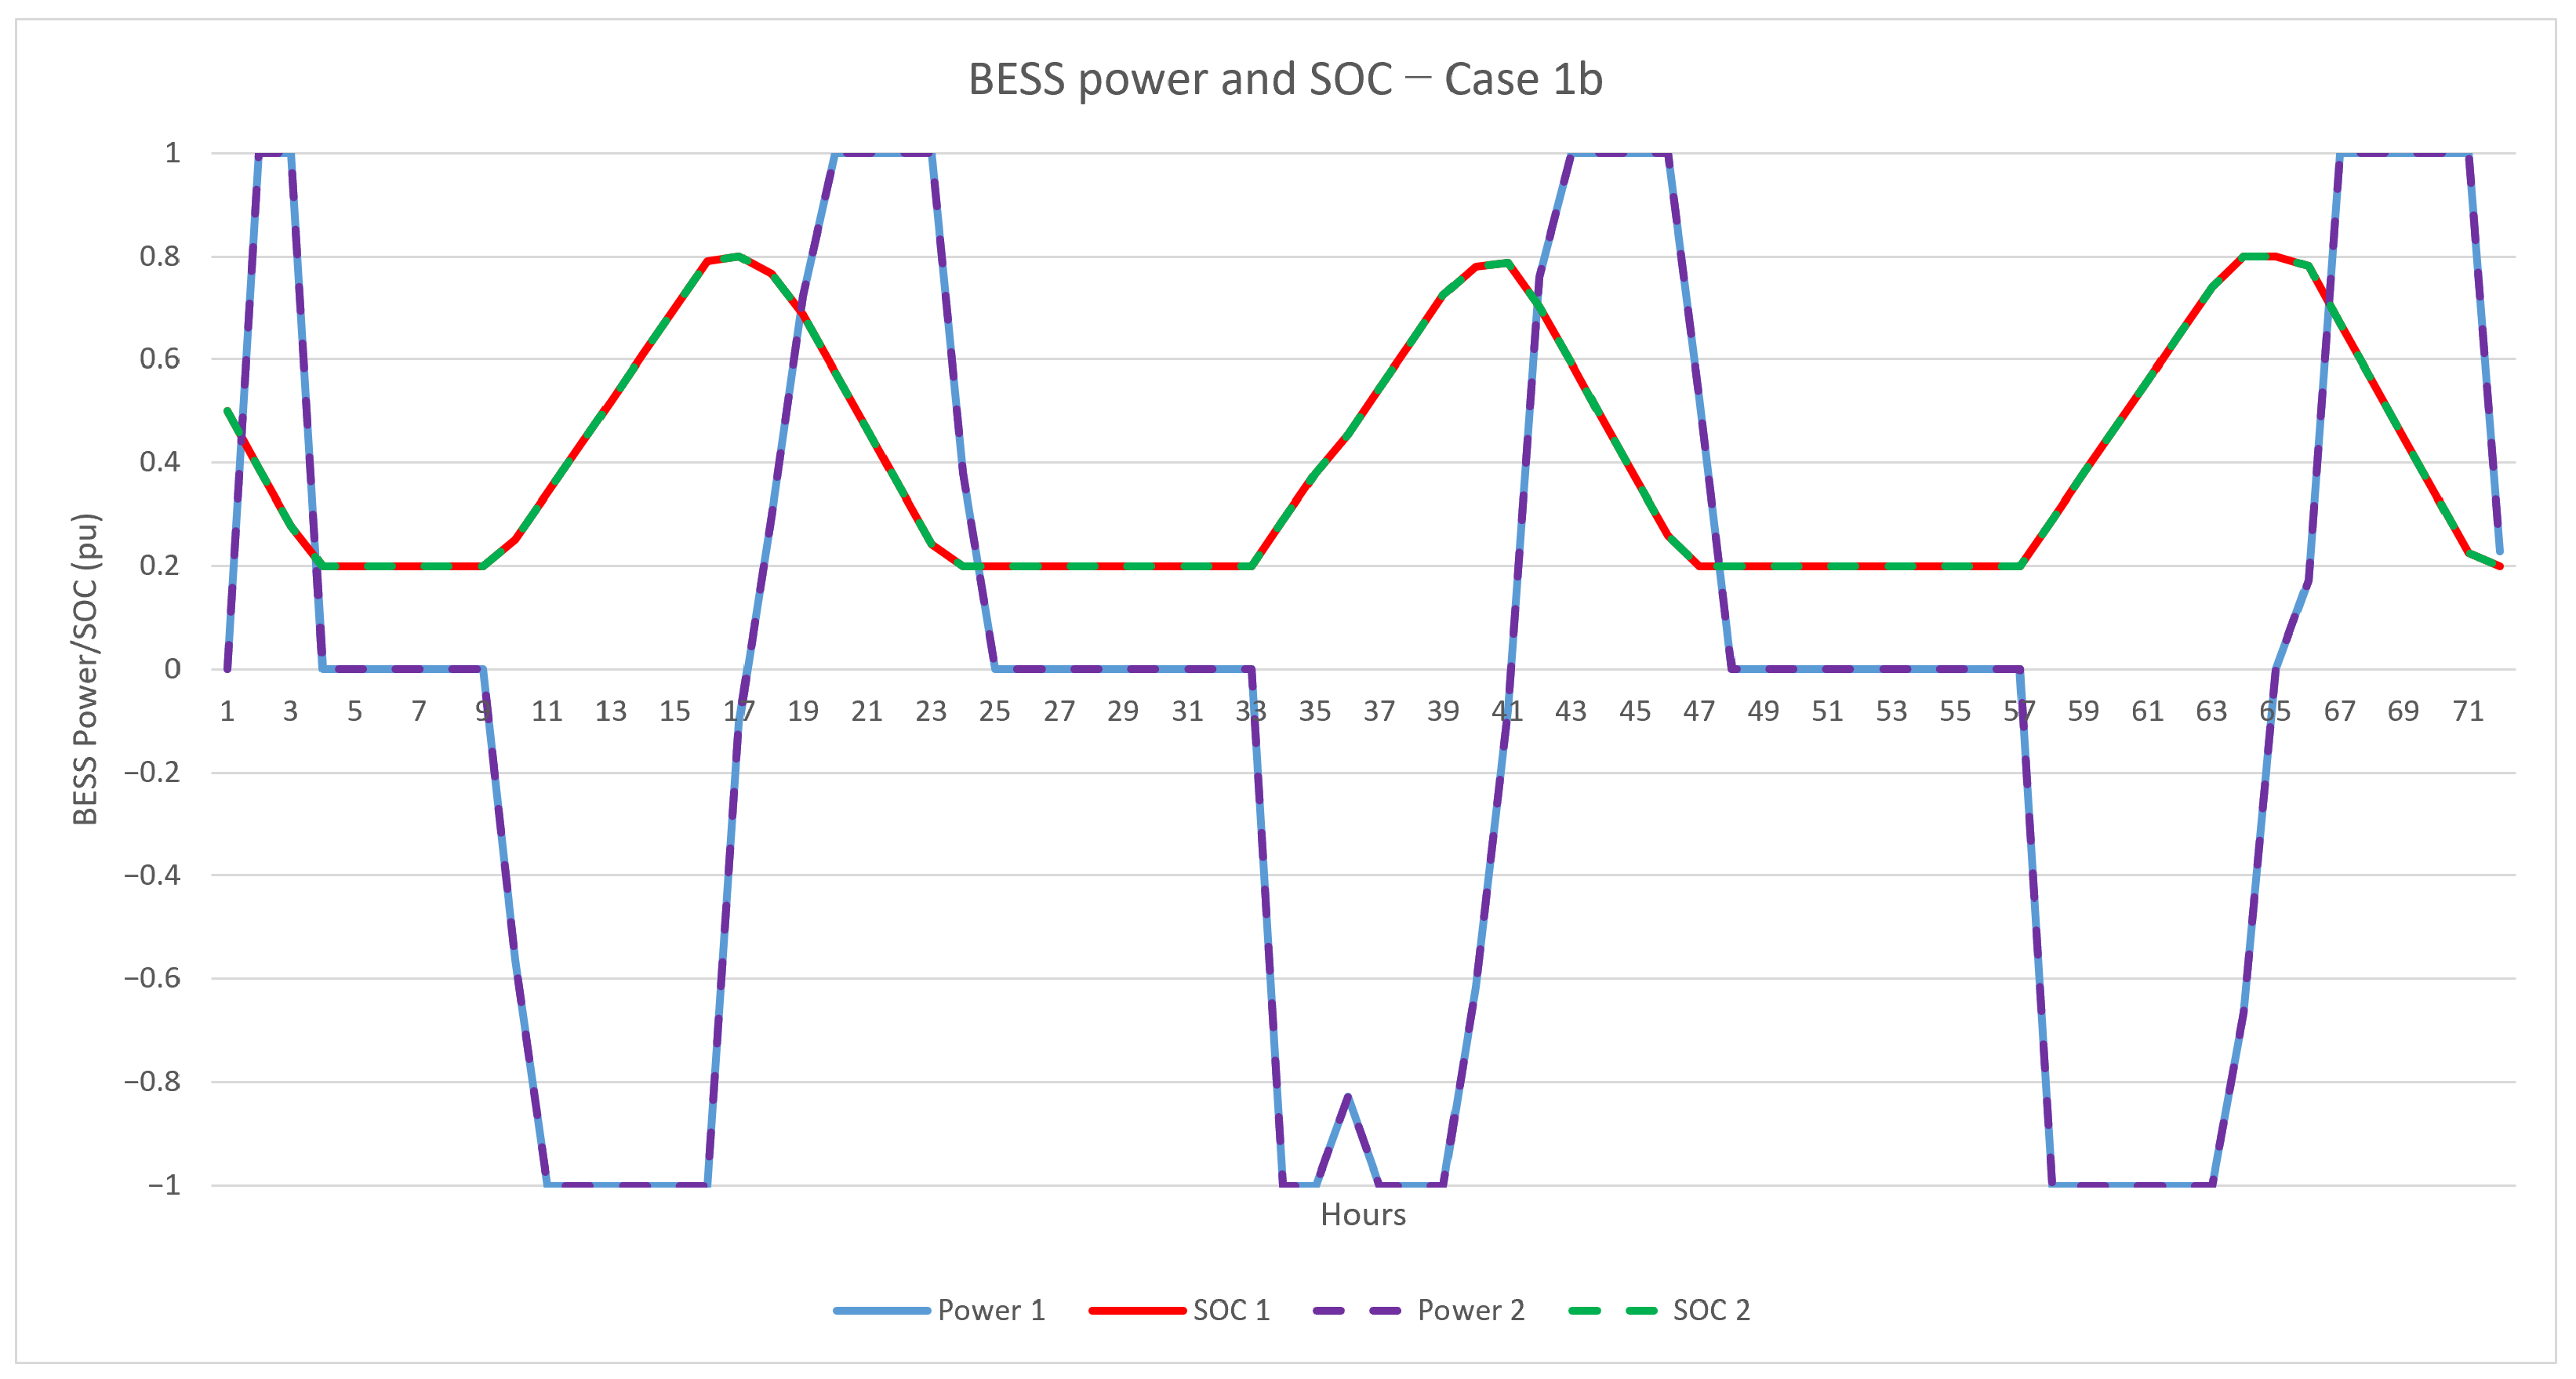
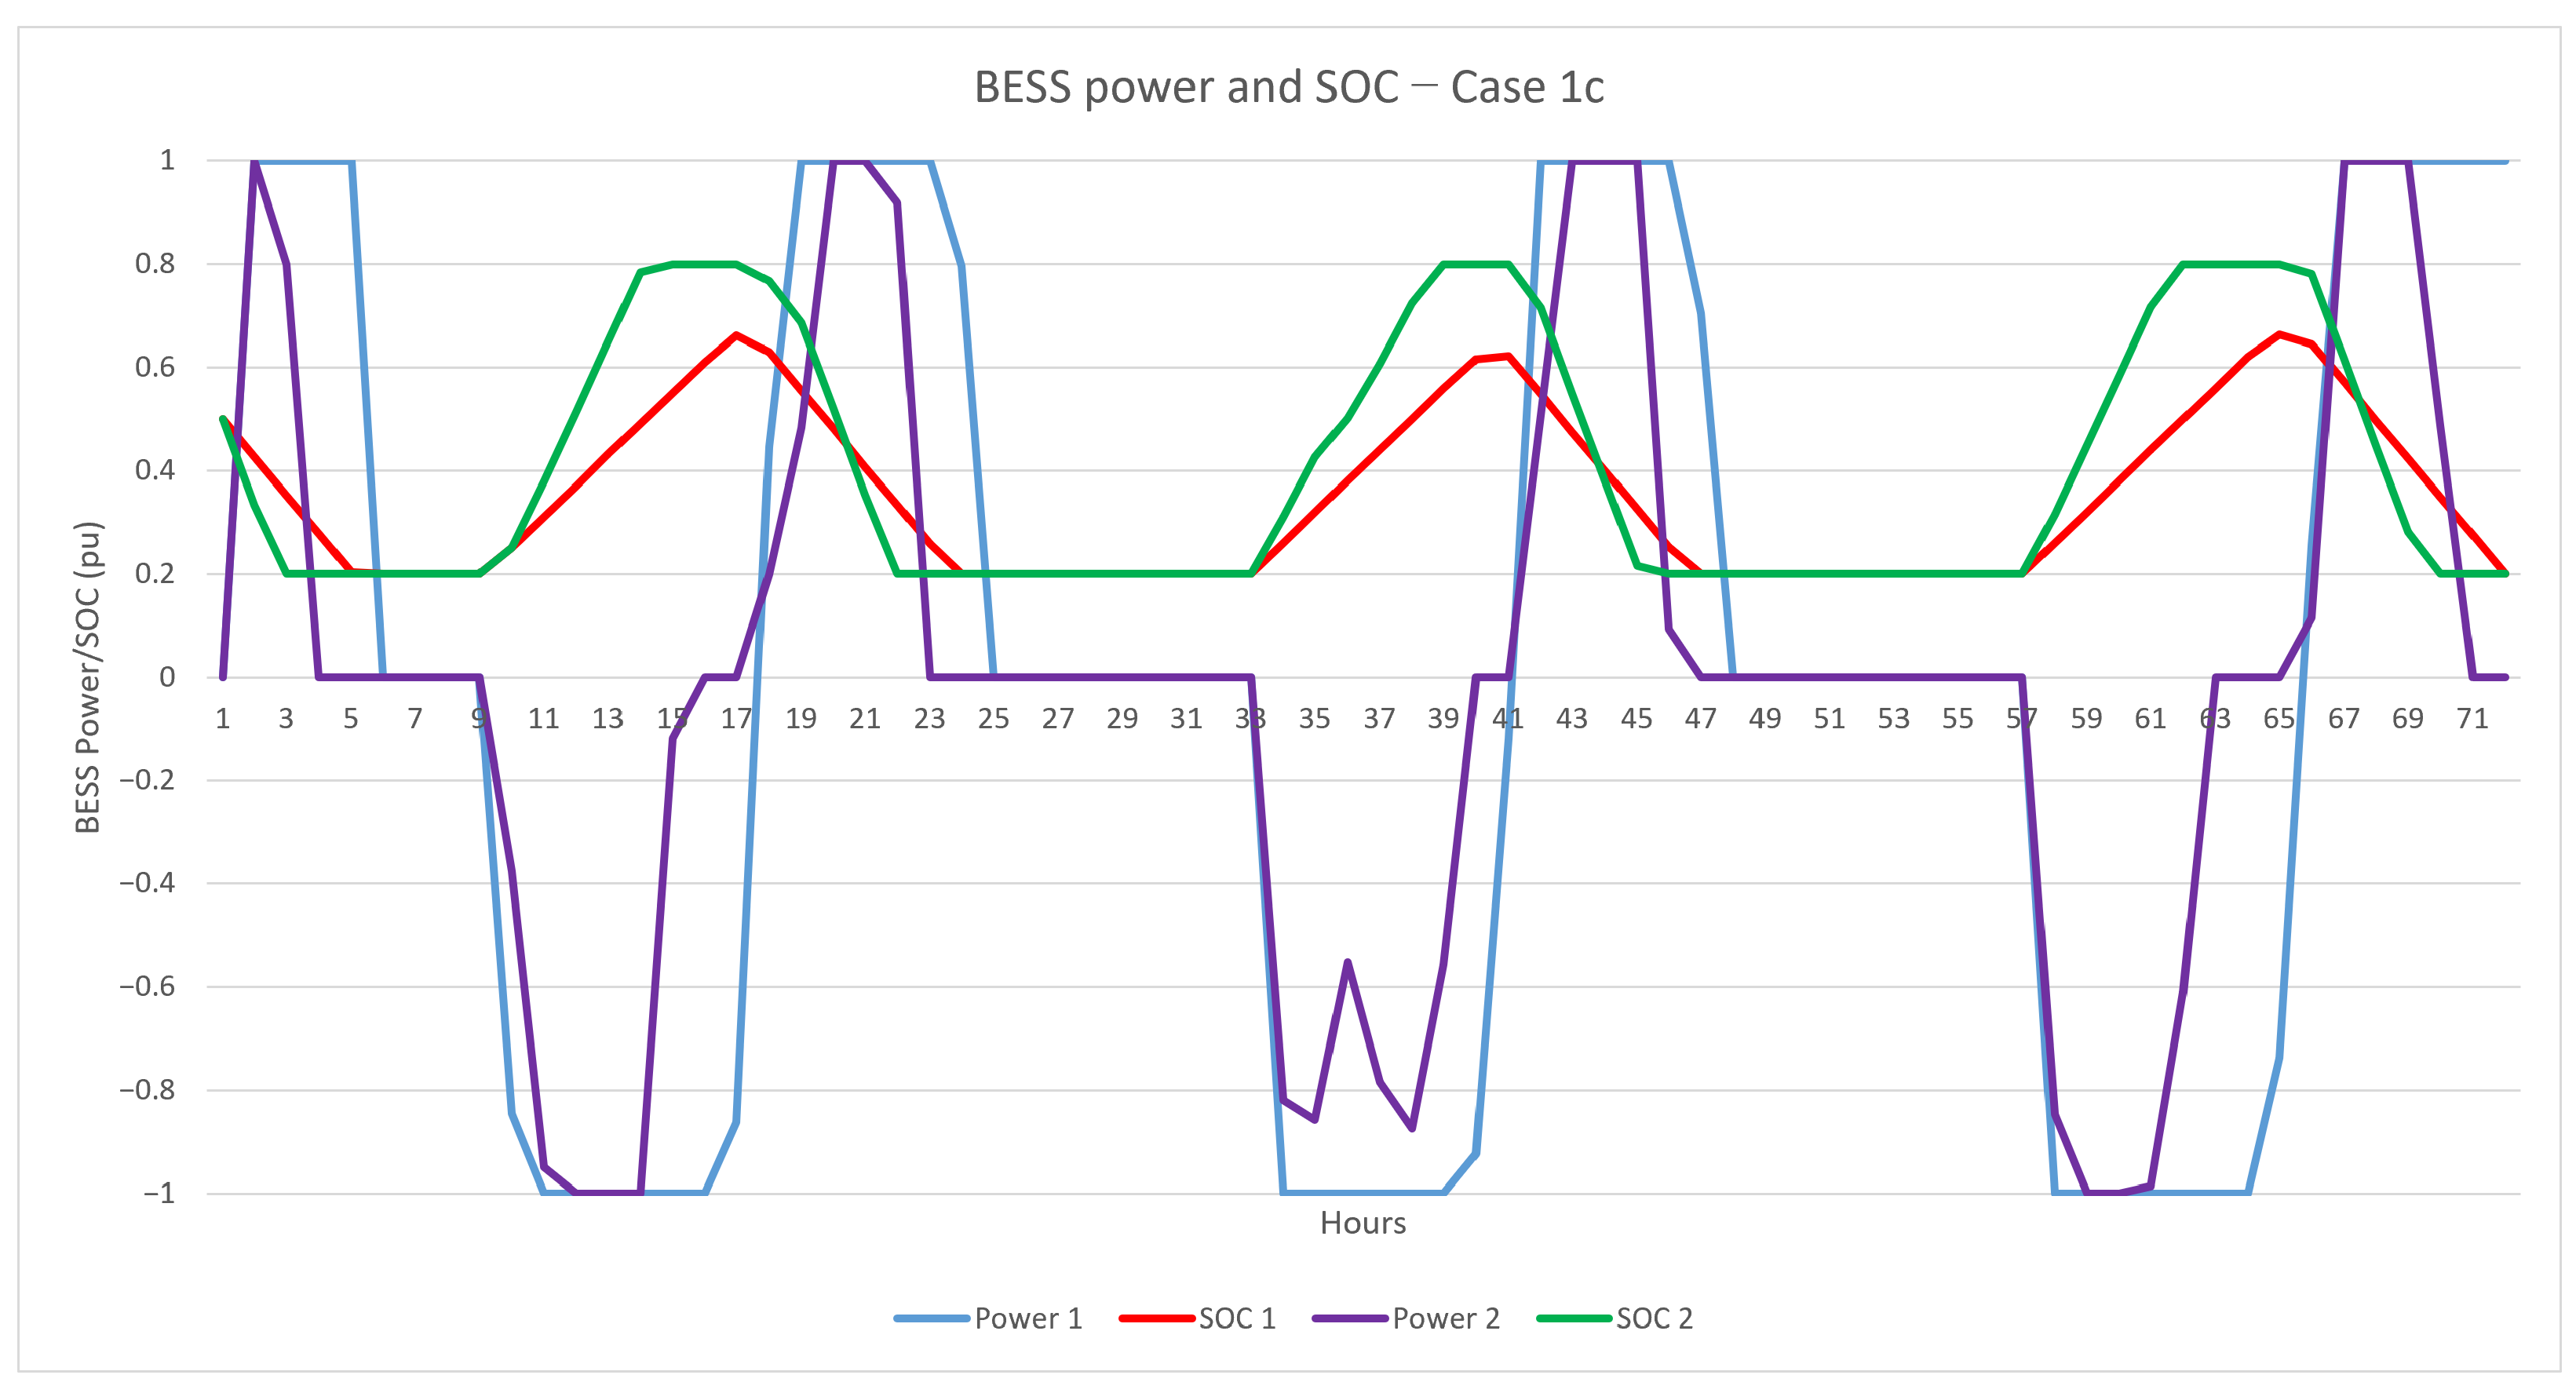
The first 72 h of the generated synthetic BESS series for Cases 1a, 1b and 1c are, respectively, shown in Figure 6, Figure 7 and Figure 8. The calculated indices for Case 1 without BESS and with all three modifications to include storage are represented in Table 4.
Figure 6.
First three days of generated power and SOC for Case 1a.
Figure 7.
First three days of generated power and SOC for Case 1b.
Figure 8.
First three days of generated power and SOC for Case 1c.
Table 4.
Reliability indices for Case 1.
Figure 6 and Figure 7 show similar power and SOC curves. Whether it was a single BESS, as in Case 1a, or multiple storage systems, as in Case 1b, since all of these BESSs have a discharge time of 10 h its behavior in the sequential simulation was the same. Although the BESSs in Case 1b have different participation factors, because their powers are in the same proportion as the SOC, their operation was the same. As this pattern repeats for the next cases, the figures for Cases 2a and 3a are omitted.
However, for Case 1c represented in Figure 8, the BESSs have different discharge times and, therefore, their curves do not overlap. In particular, BESS 1 has a higher MWh capacity and lower MW power, so it can sustain the maximum charge and discharge for a longer time and more intensively than BESS 2.
As can be seen in Table 4, the LOLP and EPNS for Case 1 without BESS are higher than the other three scenarios, which indicates that the storage can positively contribute to the reliability in this example, especially during the night hours when solar generation is off. Furthermore, Case 1c has worse indices in comparison with Cases 1a and 1b due to the lower durations of one of the BESS, which can cause the storage device to reach its maximum limits earlier than the other.
The calculated indices for both non-sequential simulations are within the confidence intervals of the sequential results, considered as reference values, for almost all cases. The exception is the EPNS index for Case 1b with no correlation. Additionally, it can be observed that the Rank Score indices are closer than the ones without correlation, which demonstrates that a better representation of the time series relationship can improve the results. Finally, as expected, the execution times of the non-sequential simulations are significantly lower than those from the sequential simulations.
5.2.2. Case 2: One Wind Generator
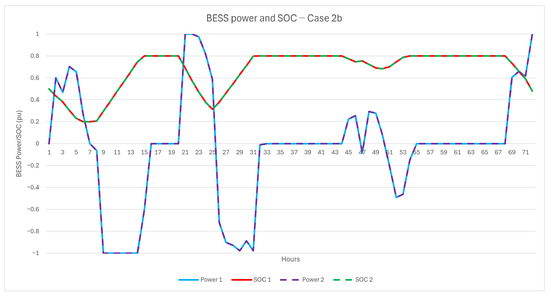
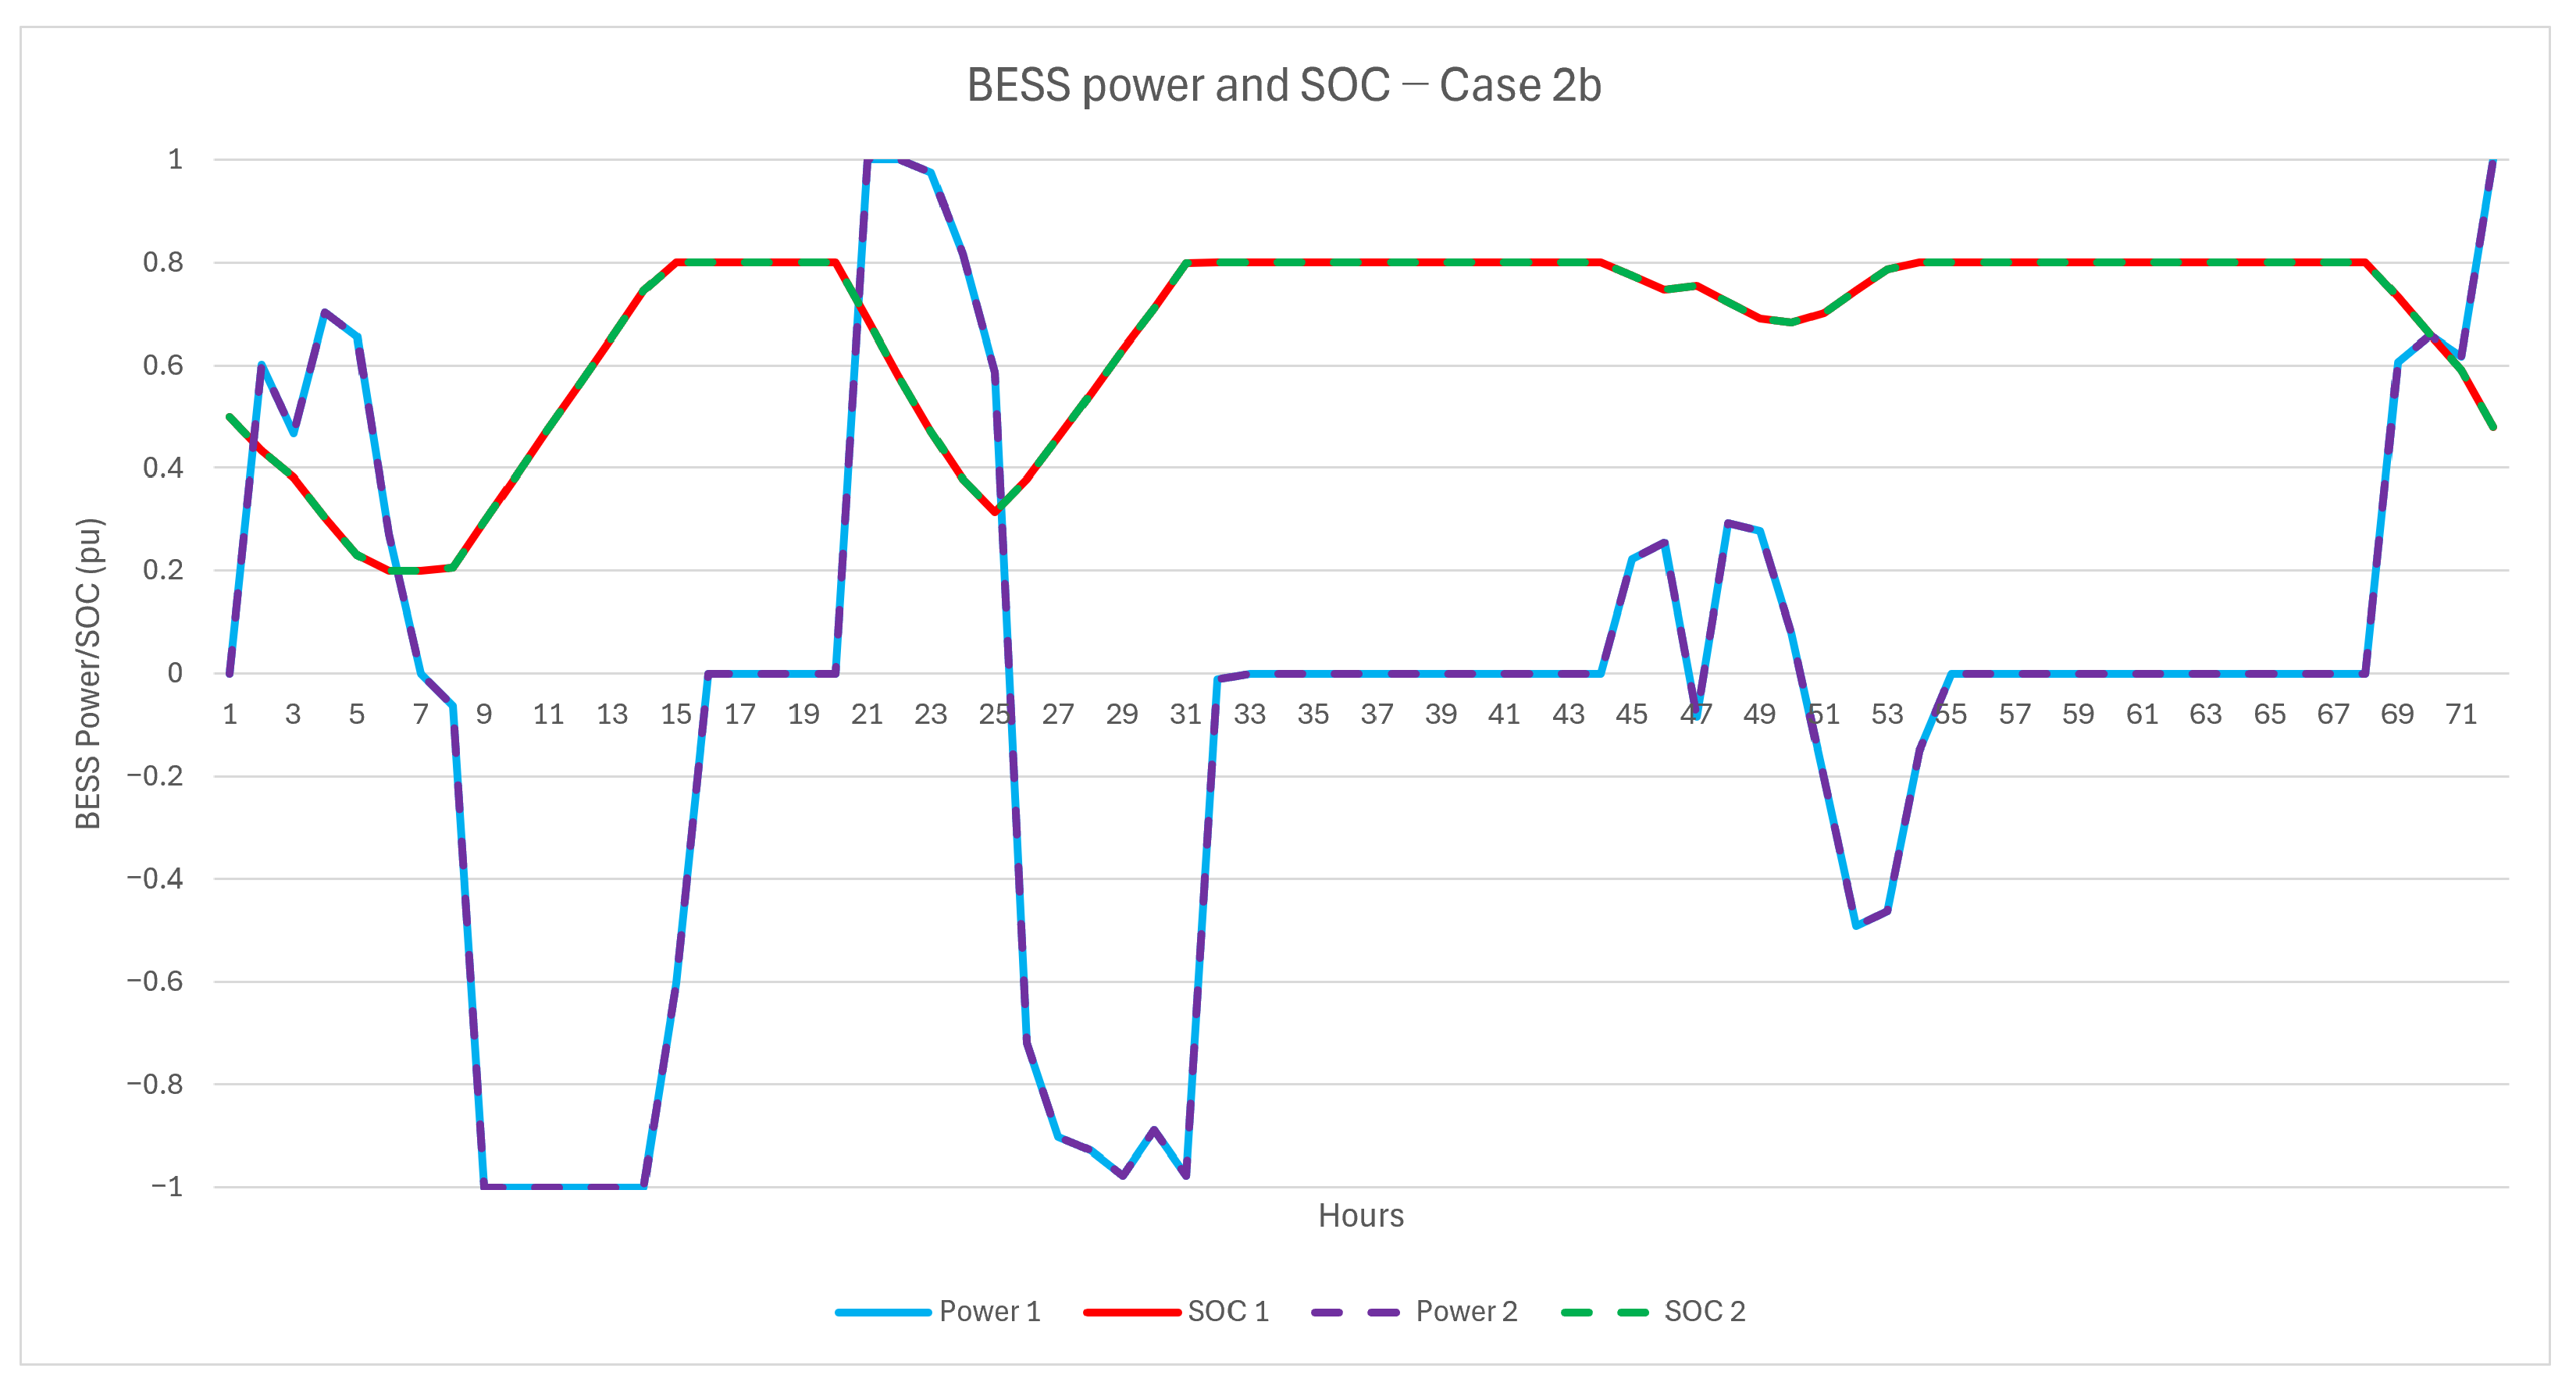
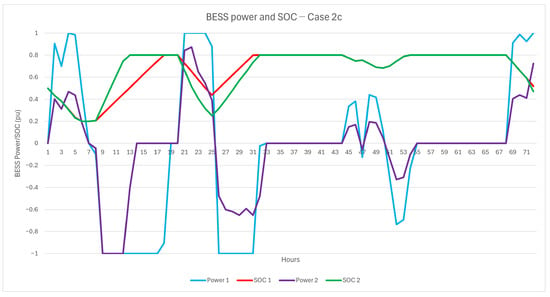
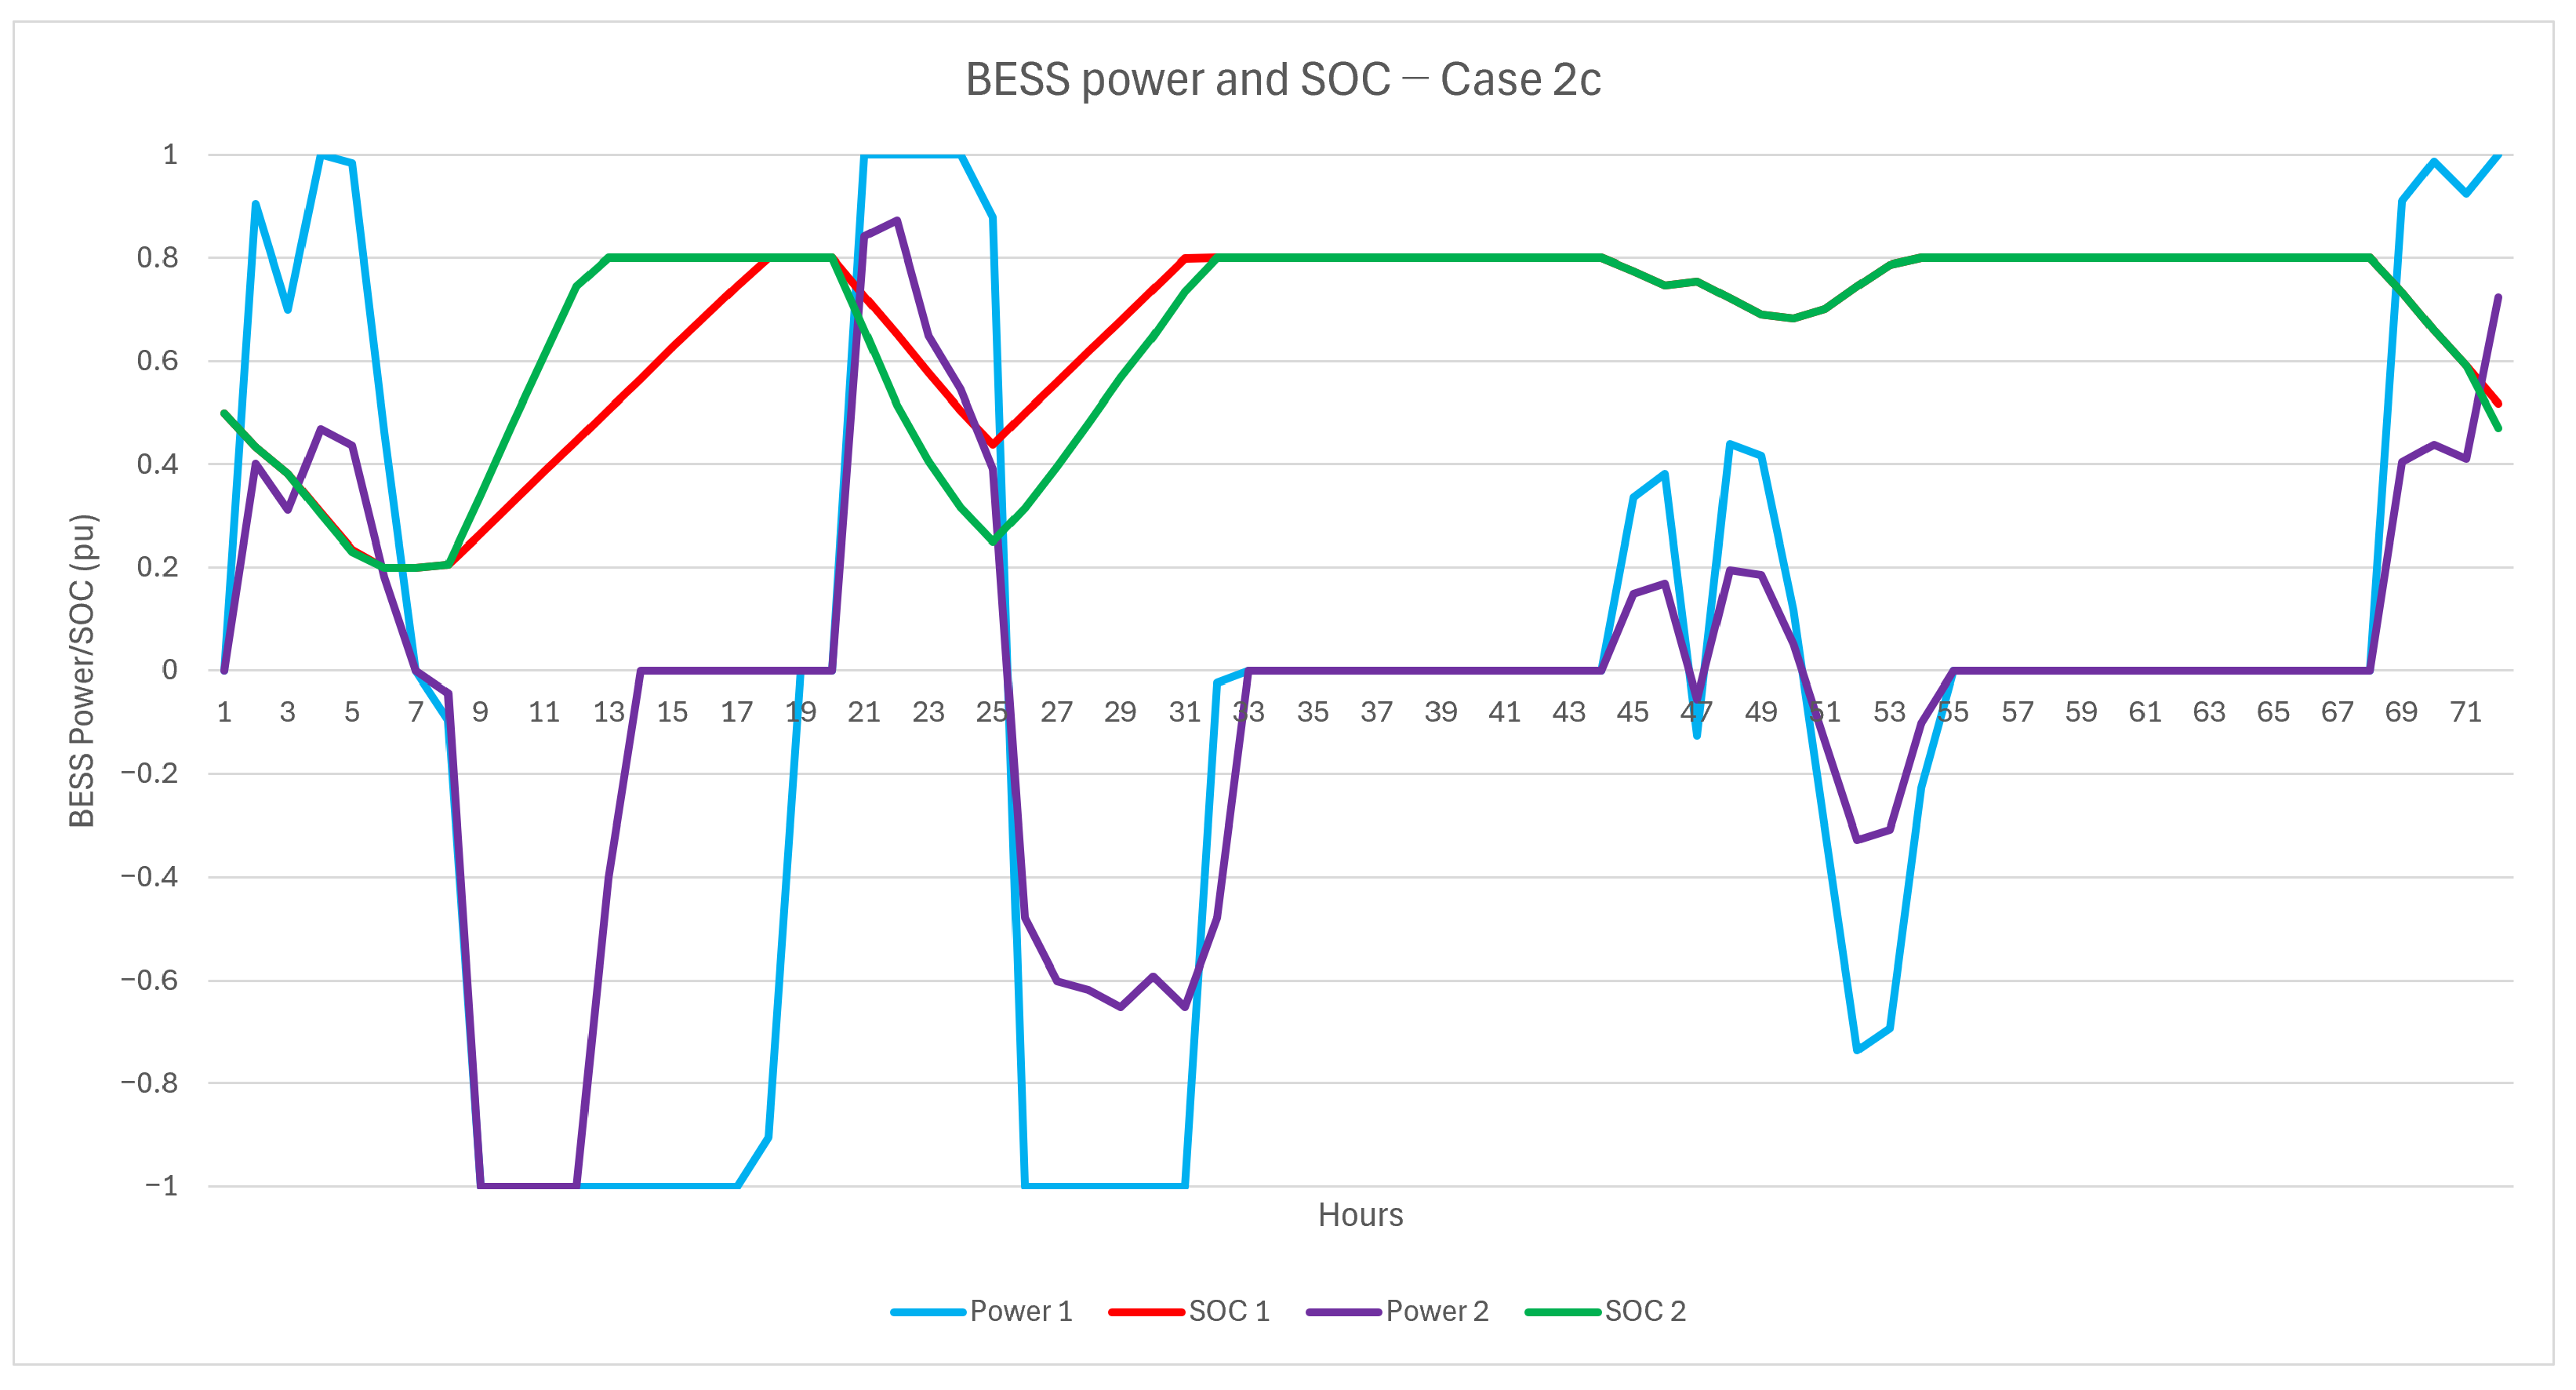
The first 72 h of the synthetic BESS series for Cases 2b and 2c are shown in Figure 9 and Figure 10. The calculated indices for Case 2 with and without BESS are represented in Table 5.
Figure 9.
First three days of generated power and SOC for Case 2b.
Figure 10.
First three days of generated power and SOC for Case 2c.
Table 5.
Reliability indices for Case 2.
Figure 9 shows the graphs for power and SOC of the BESSs and this time, due to the presence of wind generation, there is a lower utilization of the storage system. Unlike Case 1, now the BESS power and SOC do not have a daily variation to compensate for the night, but stay more consistently at the higher SOC levels with sporadic discharges.
Figure 10 shows the graphs when the BESSs have different discharge times, and, as in the previous case, BESS 1 is more requested than BESS 2, since it takes longer to charge and discharge. However, during periods with low storage necessity, both curves overlap.
Table 5 shows that, overall, the LOLP and EPNS are lower than those from Case 1, which is expected as there is an additional generation. Case 2 without BESS has the highest indices of the four cases in the table, so storage is being used. Once again, the situation where one of the BESSs has a shorter duration is slightly worse than when their discharge times are equal. With respect to the non-sequential indices, now only those that preserve the correlations are statistically consistent with the sequential simulation, supporting the conclusions drawn from Case 1. Because this also happens in the next case, the non-sequential indices with no correlation are omitted for Case 3.
5.2.3. Case 3: Seven Wind Generators
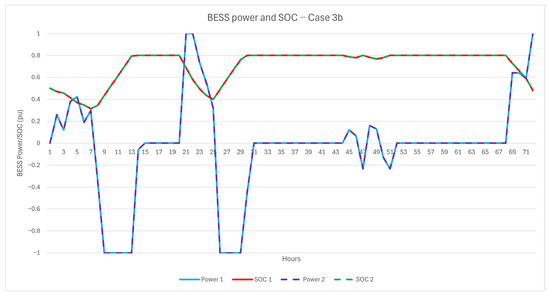
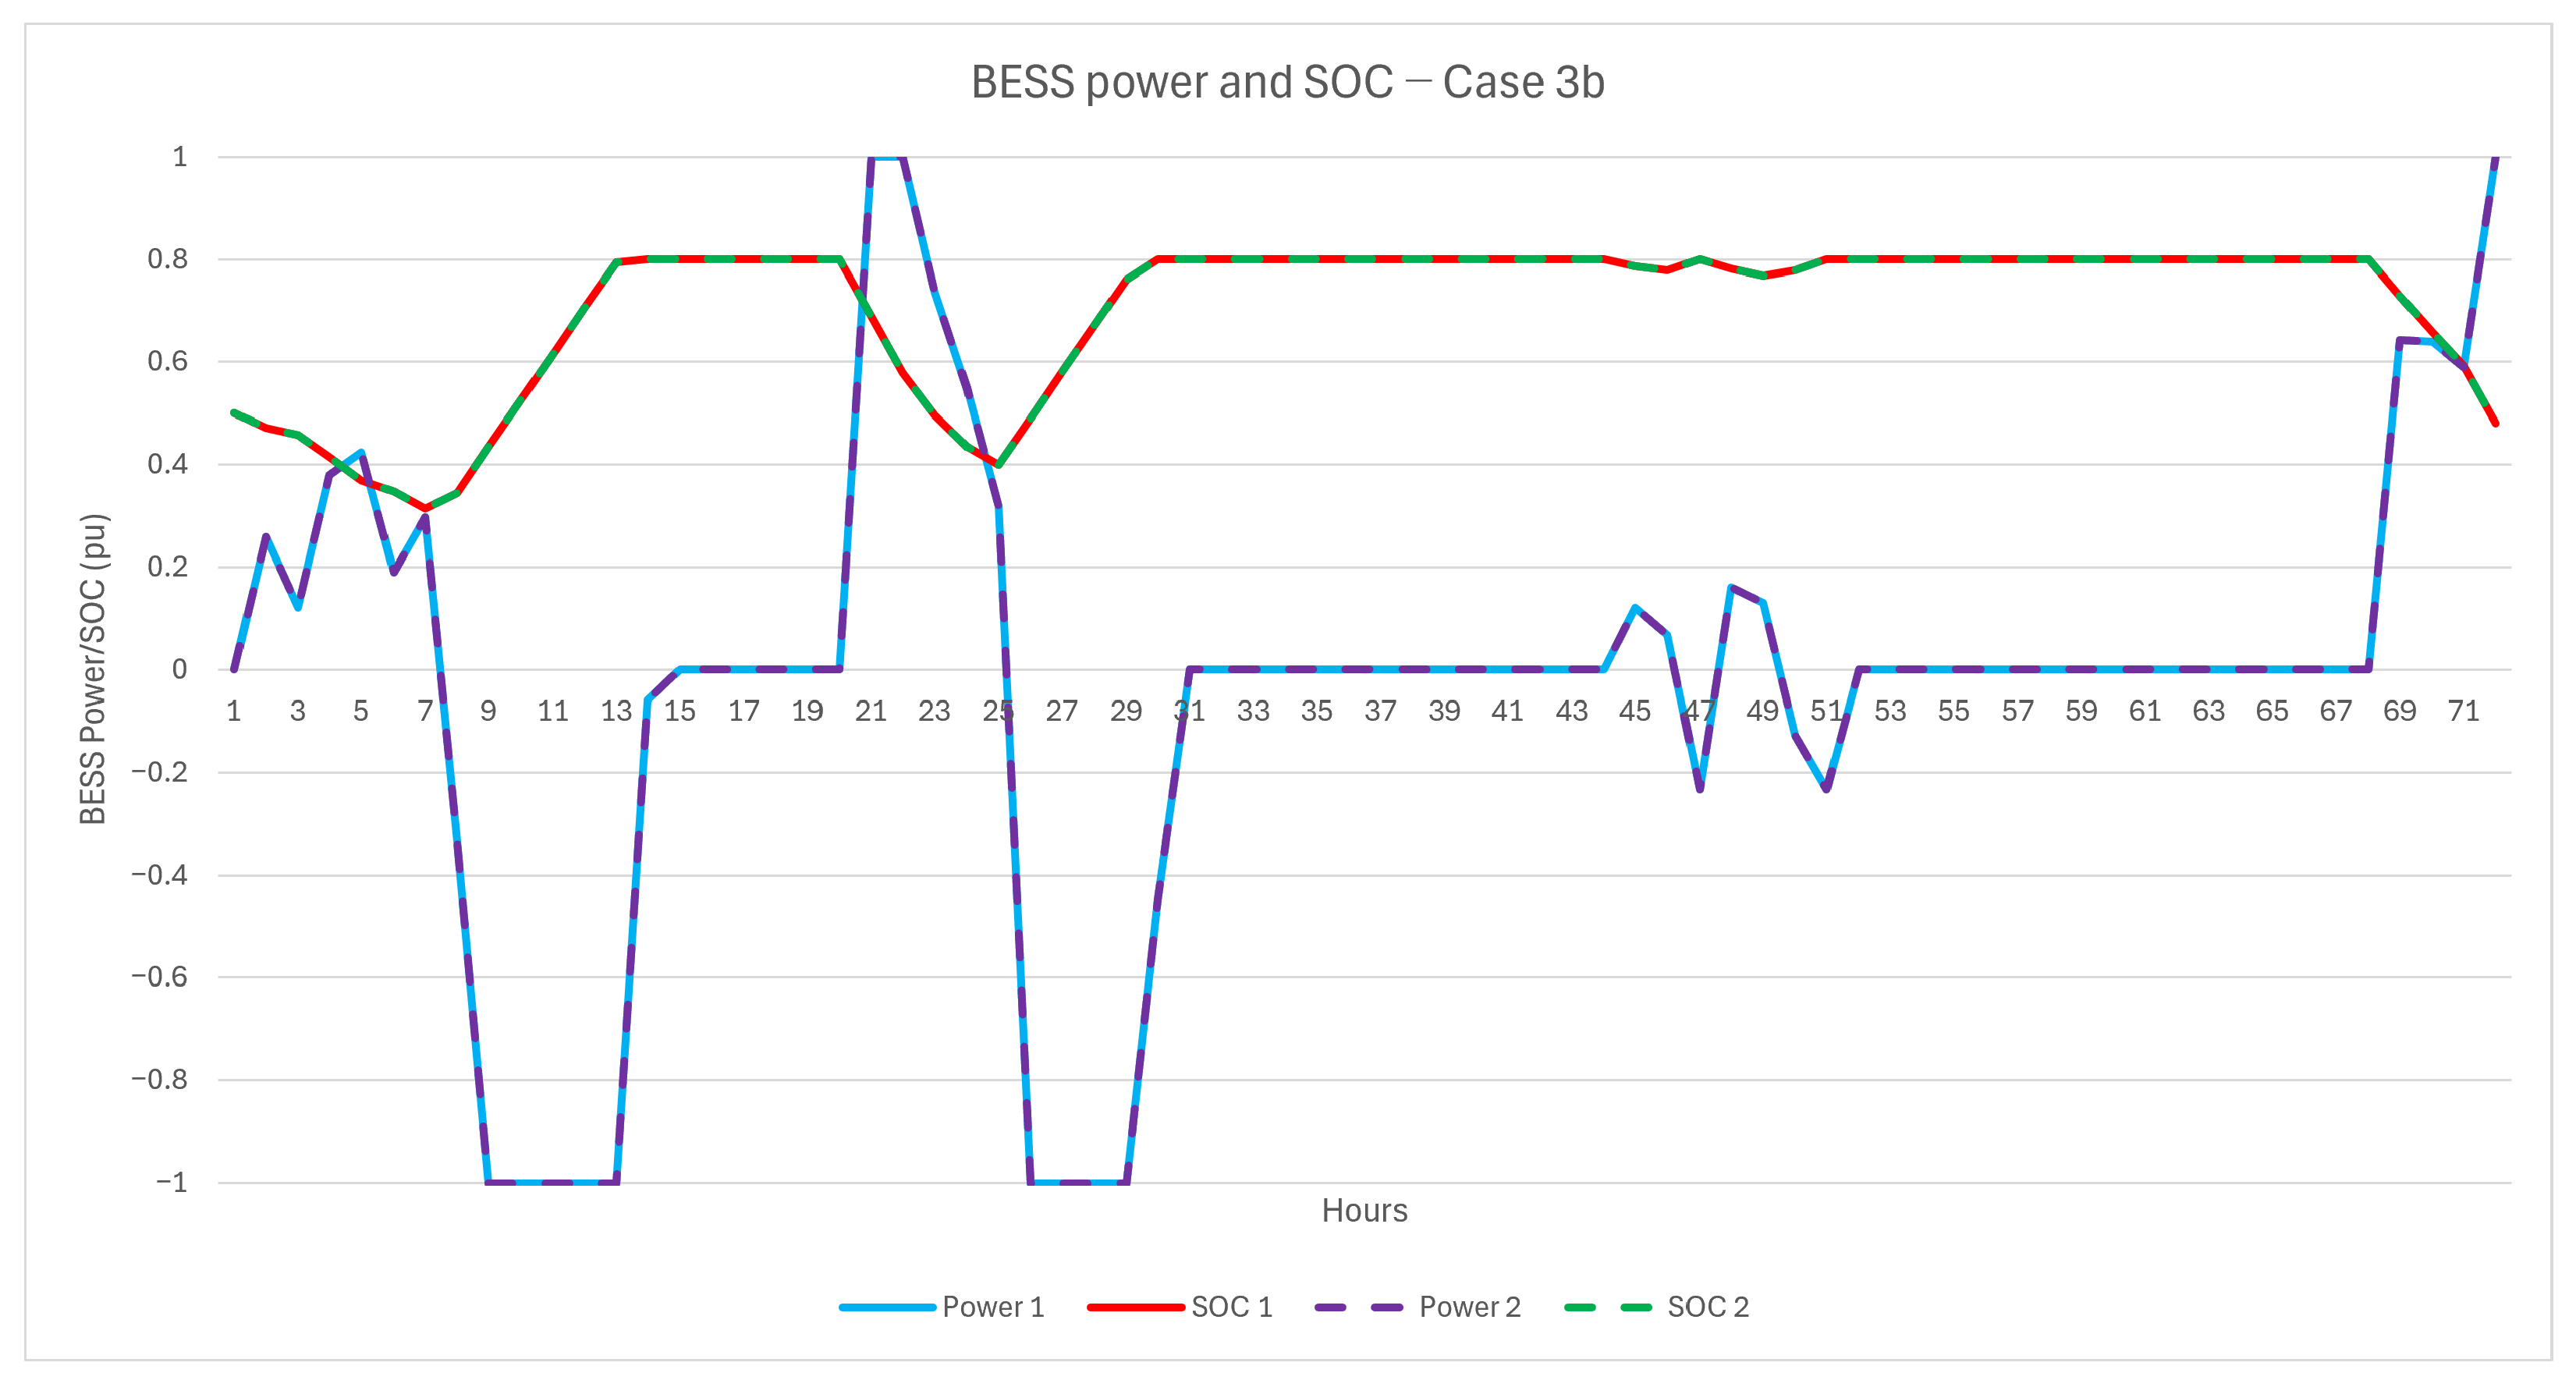
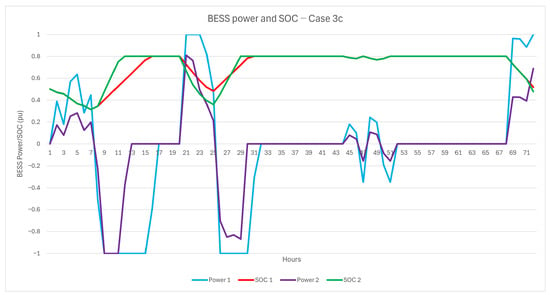
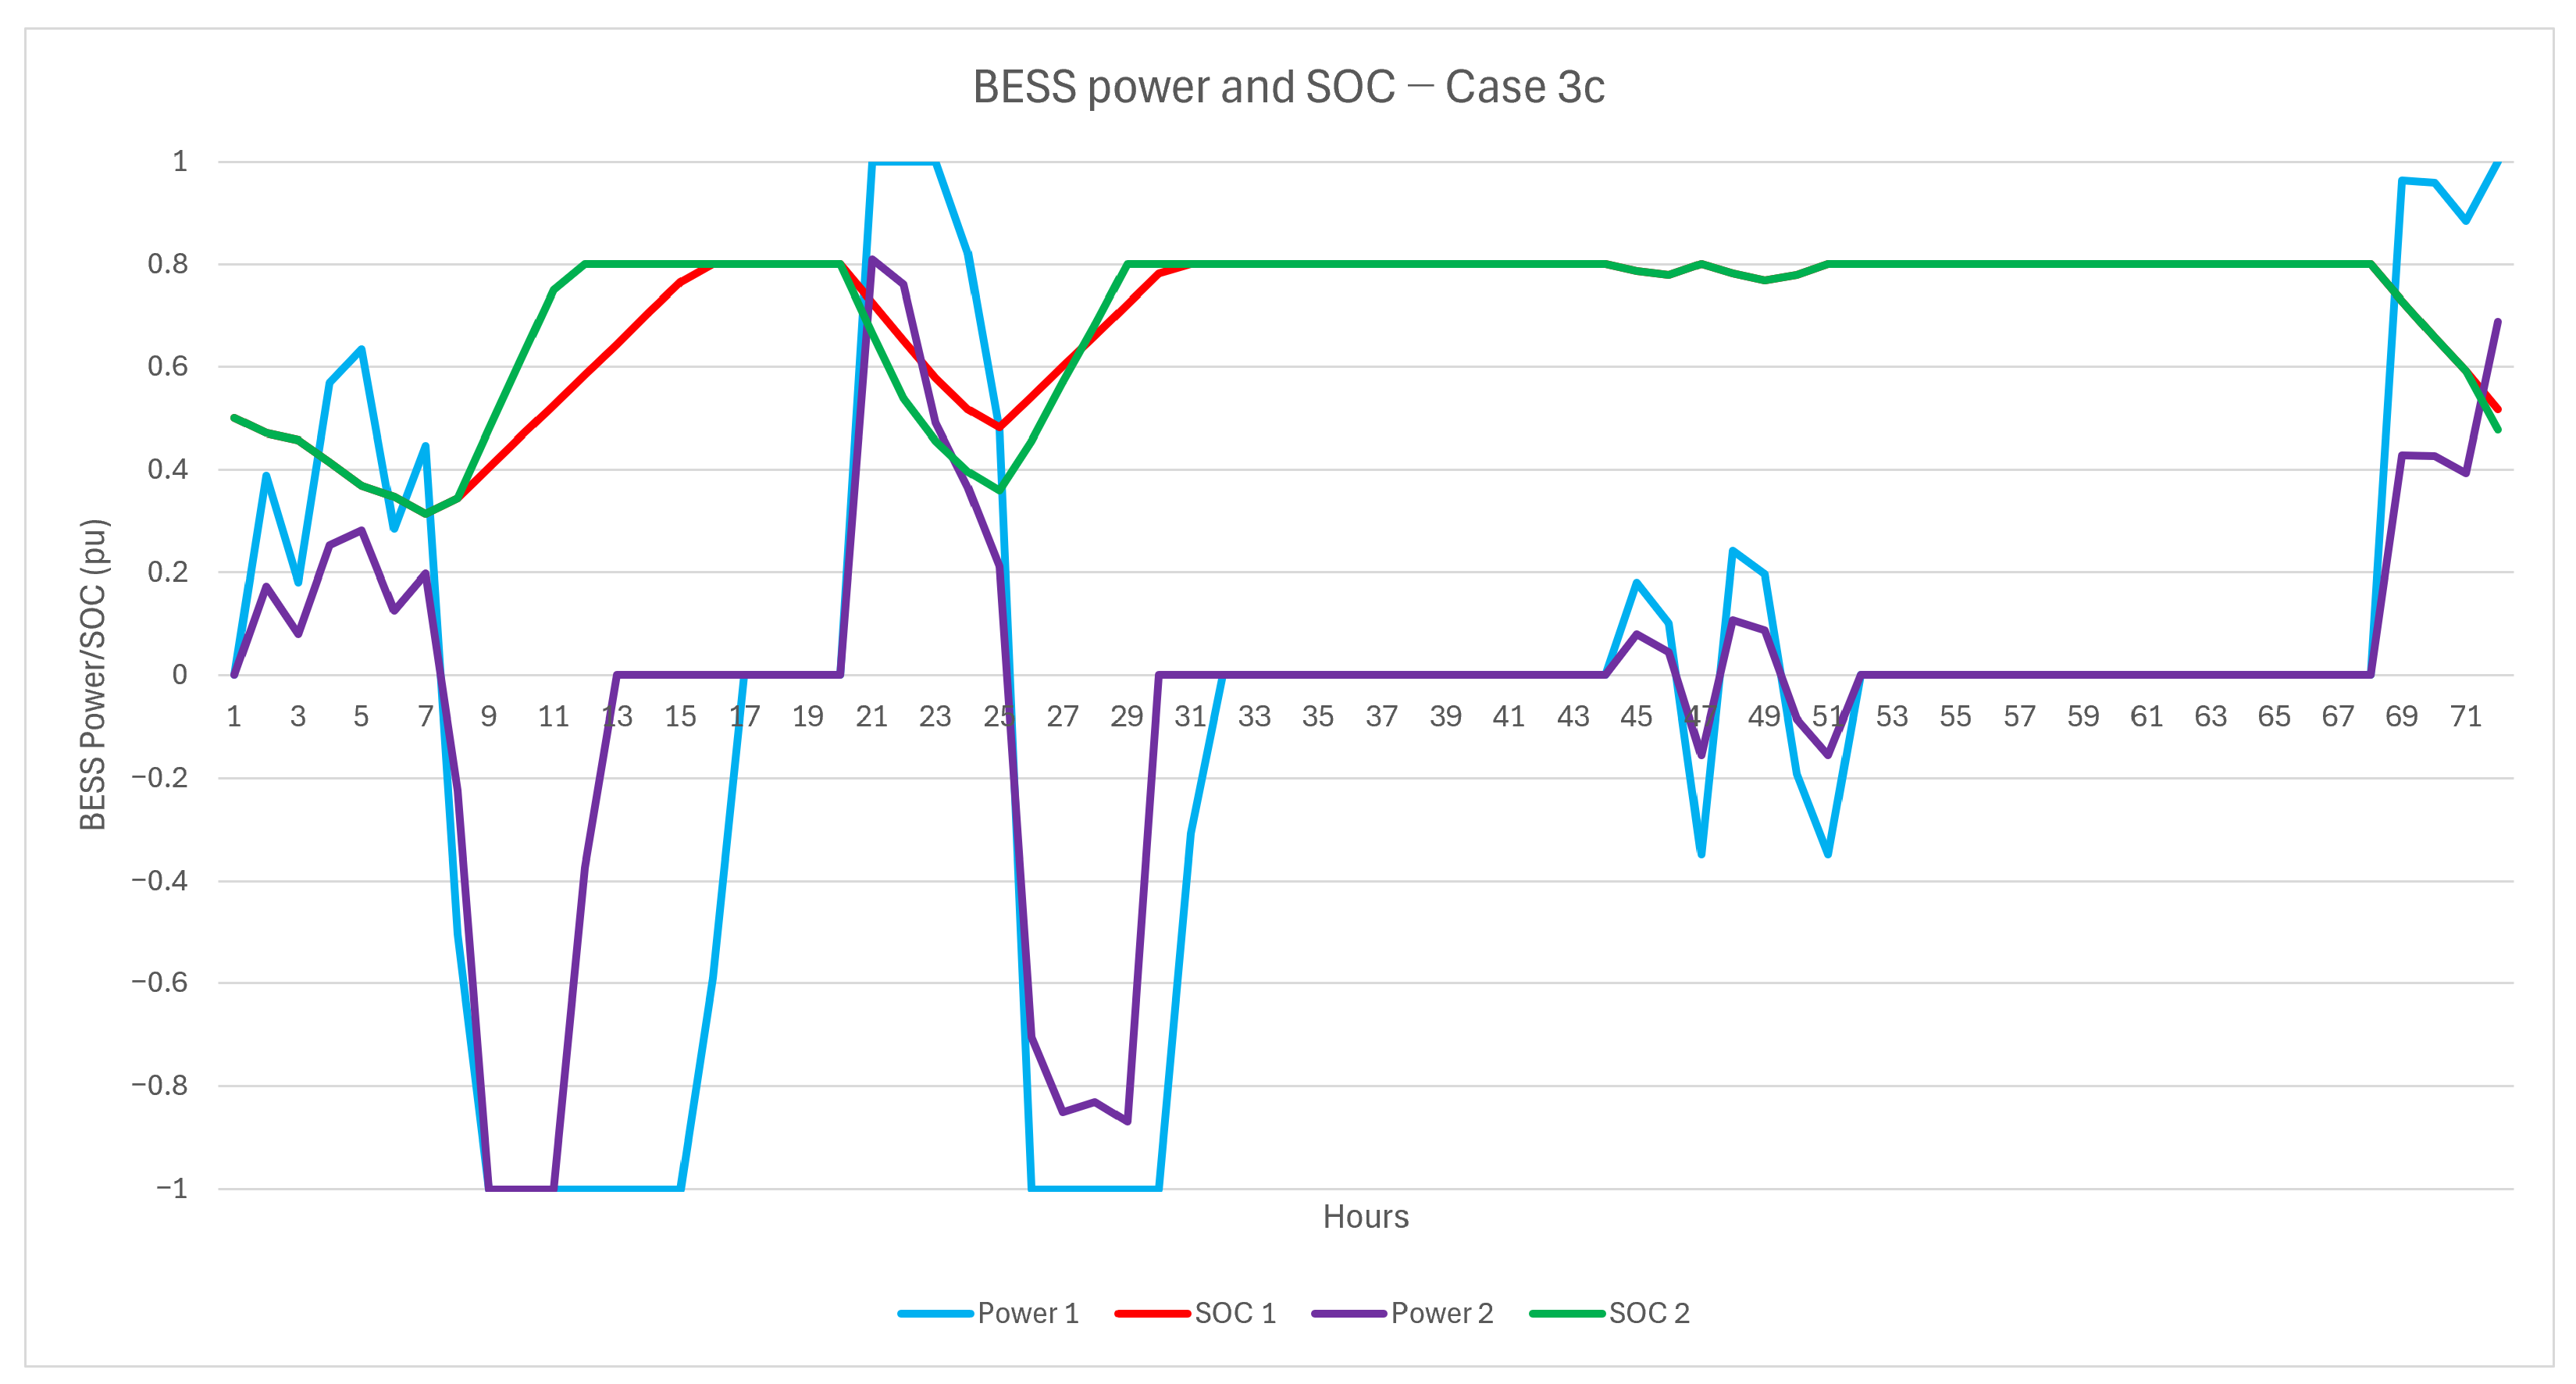
The first 72 h of the synthetic BESS series for Cases 3b and 3c are, respectively, shown in Figure 11 and Figure 12. The calculated indices for Case 3 with and without BESS are represented in Table 6.
Figure 11.
First three days of generated power and SOC for Case 3b.
Figure 12.
First three days of generated power and SOC for Case 3c.
Table 6.
Reliability indices for Case 3.
Figure 11 shows an even lower utilization of storage due to the seven wind generators with more installed capacity (product between the number of units and the unit power) than in the previous case. Similarly to Case 2, the two BESS often stay at higher SOC levels and are occasionally discharged. Figure 12 shows a behavior similar to its counterpart in the previous case, but with lower peaks and shorter charges and discharges.
Table 6 shows an even lower LOLP and EPNS than in Case 2, and the presence of storage and its discharge time once more influence the reliability results. As noted before, the consideration of the time series correlation leads to the calculation of more faithful indices.
6. Conclusions
This paper presented a Battery Energy Storage System (BESS) model for use in non-sequential Monte Carlo simulation of composite power system reliability assessment. The model is based on historical or synthetic data representing the BESS power injection and state of charge (SoC). The BESS is modeled as a Markov multi-state system, combined with a simple logic that determines the maximum power injection available for redispatch to prevent loss of load and energy.
The proposed model was tested using equivalent configurations of the Northeastern Brazilian power system. The results showed reliability indices that closely matched those obtained through sequential Monte Carlo simulation, while significantly reducing computational time.
Author Contributions
Conceptualization, D.F., M.V., T.M., C.B. and P.E.; Methodology, D.F., T.M. and C.B.; Software, M.V., J.A., T.A. and V.L.; Validation, D.F., P.E., J.A., T.A. and V.L.; Formal analysis, D.F. and P.E.; Resources, R.S. and C.C.; Supervision, R.S. and C.C. All authors have read and agreed to the published version of the manuscript.
Funding
This research was funded within the scope of the Research, Development and Innovation Program for the Electric Energy Sector regulated by the Brazilian National Electric Energy Agency (ANEEL), according to ANEEL’s Normative Resolution No. 1074/2023, under the project PD-02608-0004/2023—Reliability in the planning and operation of the transmission system. The funding institutions are Canarana Transmissora de Energia S.A., Centrais Elétricas Brasileiras S/A—Eletrobrás; Centrais Elétricas do Norte do Brasil S.A., Companhia Hidro Elétrica do São Francisco, Copel Geração e Transmissão S.A., Costa Oeste Transmissão de Energia S.A., Equatorial Transmissora SPE S.A., Expansion Transmissão de Energia Elétrica S.A., Expansion Transmissão Itumbiara Marimbondo S.A., Horizon Transmissão ES S.A., Horizon Transmissão MA I S.A., Horizon Transmissão MA II S.A., Marumbi Transmissão de Energia S.A., Ourilândia do Norte Transmissora de Energia S.A., Porto Primavera Transmissora de Energia S.A., Serra Paracatu Transmissora de Energia S.A., and Uirapuru Transmissão de Energia S.A.
Data Availability Statement
The data presented in this study are available on request from the corresponding author.
Conflicts of Interest
Authors Tiago Amaral and Vinicius Lopes were employed by the company CEPEL, Rio de Janeiro, Brazil; Author Roberta Souza was employed by the company State Grid Brazil Holding, Rio de Janeiro, Brazil; Authors Paulo Esmeraldo and João Aires were employed by the company Powerconsult. The remaining authors declare that the research was conducted in the absence of any commercial or financial relationships that could be construed as a potential conflict of interest. The authors declare that this study received funding from Canarana Transmissora de Energia S.A., Centrais Elétricas Brasileiras S/A—Eletrobrás; Centrais Elétricas do Norte do Brasil S.A., Companhia Hidro Elétrica do São Francisco, Copel Geração e Transmissão S.A., Costa Oeste Transmissão de Energia S.A., Equatorial Transmissora SPE S.A., Expansion Transmissão de Energia Elétrica S.A., Expansion Transmissão Itumbiara Marimbondo S.A., Horizon Transmissão ES S.A., Horizon Transmissão MA I S.A., Horizon Transmissão MA II S.A., Marumbi Transmissão de Energia S.A., Ourilândia do Norte Transmissora de Energia S.A., Porto Primavera Transmissora de Energia S.A., Serra Paracatu Transmissora de Energia S.A., and Uirapuru Transmissão de Energia S.A. The funder was not involved in the study design, collection, analysis, interpretation of data, the writing of this article, or the decision to submit it for publication.
Abbreviations
The following abbreviations are used in this manuscript:
| BESS | Battery Energy Storage System |
| SOC | BESS State of Charge |
| BESS Injected Power | |
| SMCS | Sequential Monte Carlo Simulation |
| NMCS | Non-Sequential Monte Carlo Simulation |
| OPF | Optimal Power Flow |
| LHS | Latin Hypercube Sampling |
| LOLP | Loss Of Load Probability |
| EPNS | Expected Power Not Supplied |
| MTTF | Mean Time To Failure |
| MTTR | Mean Time To Repair |
| HPP | Hydro Power Plant |
| TPP | Thermal Power Plant |
References
- Bagen, B.; Bhavaraju, M.; Choi, J.; Ekisheva, S.; Kang, S.W.; Karki, R.; Lin, W.; Logan, D.; Lombardi, M.; Meliopoulos, S.; et al. Composite Power System Reliability; Technical Report; IEEE Power and Energy Society: Piscataway, NJ, USA, 2022. [Google Scholar]
- Bera, A.; Tian, Y.; Almasabi, S.; Mitra, J.; Borges, C.L.T. Modeling of Battery Energy Storage Systems for System Reliability Studies. In Proceedings of the 2019 IEEE Power & Energy Society General Meeting (PESGM); IEEE: Piscataway, NJ, USA, 2019. [Google Scholar]
- Bartecka, M.; Marchel, P.; Zagrajek, K.; Lewandowski, M.; Kłos, M. Reliability Model of Battery Energy Storage Cooperating with Prosumer PV Installations. Energies 2024, 17, 5839. [Google Scholar] [CrossRef] [Scilit]
- Sanchez, J.; Chaudhary, C.; Benidris, M.; Mitra, J. Energy storage integration for grid reliability. In Proceedings of the 2024 18th International Conference on Probabilistic Methods Applied to Power Systems (PMAPS); IEEE: Piscataway, NJ, USA, 2024; pp. 1–6. [Google Scholar]
- Yarramsetty, C.; Moger, T.; Jena, D. Reliability Assessment of Composite Power Systems Integrated with Renewables and Energy Storage using a Hybrid LSTM-AdaBoost Approach. IEEE Trans. Ind. Appl. 2026, 1–13. [Google Scholar] [CrossRef] [Scilit]
- Lebowitz, D.; Daly, S.; Sundaram, S.M. The BESS Book: A Cell to Grid Guide to Utility-Scale Battery Energy Storage Systems; BEES Book: Portland, OR, USA, 2024. [Google Scholar]
- Zhao, C.; Andersen, P.B.; Træholt, C.; Hashemi, S. Grid-connected battery energy storage system: A review on application and integration. Renew. Sustain. Energy Rev. 2023, 182, 113400. [Google Scholar] [CrossRef] [Scilit]
- Koltermann, L.; Cortés, M.C.; Figgener, J.; Zurmühlen, S.; Sauer, D.U. Power curves of megawatt-scale battery storage technologies for frequency regulation and energy trading. Appl. Energy 2023, 347, 121428. [Google Scholar] [CrossRef] [Scilit]
- Santos, A.S.; Borges, C.L.T. Methods to incorporate correlation of intermittent renewable generation and load into non-sequential Monte Carlo simulation for reliability evaluation. Sustain. Energy Grids Netw. 2026, 46, 102237. [Google Scholar] [CrossRef] [Scilit]
- Iman, R.L.; Conover, W.J. A distribution-free approach to inducing rank correlation among input variables. Commun. Stat.-Simul. Comput. 1982, 11, 311–334. [Google Scholar] [CrossRef] [Scilit]
- Borges, C.L.T.; Vaz, M.O.; Santos, A.S.; Fontenele, G.; Souza, R.C.; Carvalho, C.E.; Russo, A. Efficient methods for modeling correlations among renewable energy sources in state-space sampling Monte Carlo Simulation. Energies 2026, 19, 3163. [Google Scholar] [CrossRef] [Scilit]
- McKay, M.D.; Beckman, R.J.; Conover, W.J. A comparison of three methods for selecting values of input variables in the analysis of output from a computer code. Technometrics 2000, 42, 55–61. [Google Scholar] [CrossRef]
- Stein, M. Large sample properties of simulations using Latin hypercube sampling. Technometrics 1987, 29, 143–151. [Google Scholar] [CrossRef]
- Carvalho, J.H.; Schwartz, U.B.; Borges, C.L.T. Copula based model for representation of hybrid power plants in non-sequential Monte Carlo reliability evaluation. Sustain. Energy Grids Netw. 2023, 35, 101077. [Google Scholar] [CrossRef] [Scilit]
- Santos, A.S.; Borges, C.L.T.; Barboza, R.R. A methodology to correlate river inflows in state sampling Monte Carlo simulation. Electr. Power Syst. Res. 2024, 236, 110926. [Google Scholar] [CrossRef] [Scilit]
- Teixeira, T.P.; Borges, C.L.T. Operation Strategies for Coordinating Battery Energy Storage with Wind Power Generation and Their Effects on System Reliability. J. Mod. Power Syst. Clean Energy 2021, 9, 190–198. [Google Scholar] [CrossRef] [Scilit]

Disclaimer/Publisher’s Note: The statements, opinions and data contained in all publications are solely those of the individual author(s) and contributor(s) and not of MDPI and/or the editor(s). MDPI and/or the editor(s) disclaim responsibility for any injury to people or property resulting from any ideas, methods, instructions or products referred to in the content. |
© 2026 by the authors. Licensee MDPI, Basel, Switzerland. This article is an open access article distributed under the terms and conditions of the Creative Commons Attribution (CC BY) license.