Article

Optimal Scheduling of Photovoltaic–Storage–Charging Integrated Stations Based on a PriceSOC-Guided Initialization Particle Swarm Optimization Algorithm

1
School of Electric Power, Shenyang Institute of Engineering, Shenyang 110136, China
2
School of Renewable Energy, Shenyang Institute of Engineering, Shenyang 110136, China
3
Strategy and Development Department, Liaoning Energy Investment (Group) Co., Ltd., Shenyang 110014, China
*
Author to whom correspondence should be addressed.
Energies 2026, 19(17), 4076; https://doi.org/10.3390/en19174076
Submission received: 29 July 2026 / Revised: 22 August 2026 / Accepted: 26 August 2026 / Published: 30 August 2026

Abstract

Against the backdrop of the “dual-carbon” strategy (carbon peaking and carbon neutrality), countries worldwide are committed to advancing the application of new energy in the transportation sector. This has spurred the rapid development of electric vehicles (EVs) and led to higher requirements for the research and construction of charging infrastructure. To address the challenges of high daily power purchase costs and severe grid-connected power fluctuations in the daily scheduling of PV–storage–charging integrated stations, as well as the limitations of conventional particle swarm optimization (PSO) with random or chaotic initialization—including insufficient engineering prior knowledge of station time-of-use (TOU) electricity prices and energy storage state of charge (SOC), numerous inferior solutions in the initial population, and high susceptibility to premature convergence—this paper develops a dual-objective optimal scheduling model that balances daily power purchase cost and grid-connected power fluctuation. The model integrates PV output, EV charging loads, energy storage charge–discharge schedules, and multiple categories of operational constraints. Grounded in the economic operation principle of “valley-period charging and peak-period discharging”, an improved PSO algorithm with electricity PriceSOC joint guided initialization (PriceSOC-PSO) is proposed. High-quality initial particles are generated by setting segmented SOC targets, introducing random perturbations, and implementing closed-loop correction of the energy storage schedule, while hybrid random particles are incorporated into the population to preserve diversity. Multiple simulation scenarios, including the no-energy-storage case, standard PSO, chaotic-initialized PSO, the proposed PriceSOC-PSO, Grey Wolf Optimizer (GWO), Harris Hawks Optimization (HHO), and the Sparrow Search Algorithm (SSA), are established to carry out objective weight sensitivity analysis and cross-algorithm comparative analysis. The results demonstrate that, compared with the no-energy-storage scenario, the proposed strategy reduces the daily power purchase cost and grid-connected power fluctuation by 11.7% and 74.9% respectively under the weight configuration ( ω 1 = 0.3 ,   ω 2 = 0.7 ) . When the weight configuration is adjusted to ( ω 1 = 0.7 ,   ω 2 = 0.3 ) , the two indicators are decreased by 14.8% and 62.6% respectively.

1. Introduction

1.1. Research Background

With the rapid construction of new power systems and the continuous popularization of electric vehicles, PV–storage–charging integrated charging stations have become important distributed power sources and charging infrastructure. By coordinating photovoltaic (PV) generation, battery energy storage, and EV charging demand, the PV–storage–charging integrated station can effectively facilitate on-site renewable energy absorption and exploit TOU price differentials for peak-valley arbitrage [1,2]. However, with the expansion of EV battery capacity, the increase in charging power, and the sharp rise in EV ownership, the scenario of a large number of EVs performing high-power fast charging at the same time is inevitable. This will inevitably lead to increased grid-connected power fluctuations at the station, higher peak-shaving pressure on the power grid, and increased daily operation costs of the charging station. Therefore, it is necessary to study its scheduling strategy to improve the economy and stability of system operation.

1.2. Research Status and Existing Deficiencies

PV–storage–charging integrated stations fulfill EV charging functions using PV power, energy storage power, and utility grid power. First, they help improve the utilization of renewable clean energy and EVs, thus facilitating the adoption of green and low-carbon travel. Second, they reduce the dependence of charging stations on the public grid and mitigate the load impact caused by large-scale EV integration. These advantages rely on a reasonable energy scheduling strategy for PV–storage–charging integrated stations, and many researchers have launched extensive investigations into PV–storage integrated systems. The authors of [3] construct a two-layer multi-objective orderly charging model for PV–storage–charging integrated communities: the upper layer aims to reduce the peak–valley difference in the community load, and the lower layer aims to cut users’ charging costs. However, this work focuses on collaborative optimization between the user side and the grid side at the community level, and fails to coordinate power purchase costs and grid-connected power fluctuations. In [4], a Stackelberg game approach is adopted to establish a master–slave game model for islanded PV–storage charging stations, which balances the benefits of both sides and enables orderly charging. Nevertheless, its scenario is islanded operation, and the charging station has no grid connection. The work in [5] develops a two-layer optimization model for PV–storage battery swapping stations considering the interaction between optimal TOU tariffs and charging loads, introduces the TOU price elasticity matrix, and improves net operating profit via an improved PSO (IPSO) combined with the CPLEX solver in an iterative framework. This study focuses on economic optimization and takes only the maximization of net operating profit as its objective. The authors of [6] propose a joint optimization strategy for PV–storage–charging systems considering PV consumption assessment at the distribution network level, aiming at the minimum comprehensive system cost, and solve the optimal energy storage and EV scheduling scheme using improved PSO. This research focuses on distribution network node planning and voltage stability, with a research scale at the distribution network level, which differs from the intra-day scheduling scenario for charging stations in this paper. In [7], an orderly charging and discharging strategy based on improved multi-objective PSO (IMOPSO) is proposed for community energy storage charging piles that considers users’ charging costs and charging pile revenue while reducing the load peak–valley difference rate. However, its scenario covers only energy storage and charging piles, without the access and coordination of PV units. In [8], the authors take a wind–solar–storage hybrid power generation system including wind power and pumped storage as the research object, focus on day-ahead scheduling, propose a hybrid energy storage scheduling strategy considering battery life loss, and use improved PSO to independently optimize three objectives: generalized load fluctuation, system output fluctuation, and power generation cost. The work in [9] incorporates the mean square error and peak–valley difference in grid-side load, as well as user-side charge–discharge cost and battery loss cost, into a unified multi-objective optimization framework, converts multiple objectives into a single one via weighted summation, and adopts an improved PSO integrating Lévy flight and simulated annealing to solve the EV charge–discharge scheduling scheme under V2G mode. However, this study focuses on interactive scheduling between EVs and the distribution network under V2G mode, and does not involve the coordination of PV output and energy storage systems. In [10], the authors propose an improved PSO named SCMPSO for the economic and environmental dispatch of wind–diesel–storage microgrids, which uses Henon chaotic mapping for population initialization to improve particle distribution uniformity; it designs a nonlinear adaptive inertia weight and dynamic learning factors to balance global exploration and local exploitation. In [11], a dual-objective scheduling model of operation cost and grid-connected load variance is built for PV–storage charging stations, and is solved by improved multi-objective PSO. The algorithm introduces cubic chaotic initialization and adaptive inertia weight to alleviate the premature convergence defect of traditional algorithms. Study [12] proposes a guided initialization measure that sets initial values of energy storage SOC according to peak and valley periods of TOU tariffs in the energy scheduling optimization of building-integrated PV–storage systems, verifying the feasibility of electricity price-guided PSO initialization. The work in [13] applies PSO to optimize the energy storage charge–discharge strategy in a residential building PV–storage–shiftable load system. The objective function calculates the user-side power purchase and sale cost based on dynamic electricity prices, verifying that the optimal energy storage scheduling trajectory naturally follows the economic law of “charging at valley prices and discharging at peak prices”. On this basis, the study introduces a particle position initialization method combined with electricity price period distribution to improve algorithm performance. In [14], the authors verify the superiority of chaotic PSO over standard PSO in the economic dispatch of residential/industrial loads with wind–PV–storage at the distribution network level. In [15], the performance differences between pure random initialization and various chaotic initialization methods such as Logistic and PWLCM (Piecewise Linear Chaotic Map) are systematically compared in an offshore micro-energy system scenario. It is verified that the ergodicity and non-repeatability of chaotic sequences can significantly improve the coverage of the initial population in the decision space, with overall performance better than random initialization. However, the study also clearly points out that chaotic initialization is a general knowledge-free improvement strategy. Although the generated initial particles can cover a wider search space, they cannot utilize the physical laws and economic prior knowledge of the optimization problem itself. A large number of particles still fall into inferior solution regions that violate energy storage SOC constraints or incur high operation costs, and the improvement effect on convergence speed and solution quality is limited. In recent years, besides heuristic algorithms, learning-based intelligent optimization methods, particularly reinforcement learning (RL), have witnessed rapid development in the field of electric vehicle (EV) charging scheduling. Reference [16] provides a comprehensive review of RL applications in EV charging station management, categorizing existing studies into value-based, policy-based, actor-critic, and hybrid frameworks. It points out that deep RL methods, such as DQN, DDPG, SAC, and PPO, offer the advantages of being model-free and adaptive, demonstrating superior performance in handling uncertainties arising from stochastic user behaviors, electricity price fluctuations, and intermittent renewable energy generation. These methods have also been extended to multi-agent coordination and vehicle-to-grid (V2G) scenarios. However, such approaches still suffer from long training times, low sample efficiency, and poor interpretability. Moreover, most studies remain confined to simulation environments, and the sim-to-real transfer gap remains a prominent challenge, hindering large-scale engineering deployment in real-world applications.
Consequently, existing research on the scheduling optimization of multi-energy complementary systems such as PV–storage–charging systems covers a wide scope, and PSO is widely adopted. However, there remains limited research focusing on PV–storage–charging integrated charging stations and addressing the coordinated scheduling of daily power purchase cost and grid-connected power fluctuation. On the other hand, algorithm improvements remain inadequate: most existing improved PSO algorithms focus on parameter adjustments such as inertia weight and learning factors, which are primarily designed to balance the global exploration and local exploitation ability of the algorithm. However, the optimal scheduling of PV–storage–charging integrated charging stations is characterized by high dimensionality (96 time periods), strong constraints (SOC corridor), and objective coupling (cost and fluctuation). The feasible region accounts for an extremely small proportion of the search space, and the initial population generated by random initialization contains few feasible solutions with generally low overall quality. In this context, improvements to inertia weight and learning factors can only optimize particle search behavior in the infeasible region, but cannot fundamentally resolve the core dilemma that the search starting point deviates from the feasible region. Although several existing studies adopt chaotic initialization to boost the ergodic property of particle populations, chaotic initialization is a generic knowledge-free improvement strategy that cannot leverage the physical laws or economic prior knowledge of the optimization problem itself. A large number of initial particles still fall into inferior regions of the solution space, yielding limited improvement in convergence speed and solution quality.

1.3. Main Contributions and Innovations

To address the poor initial population quality and susceptibility to local optima caused by the random initialization of standard PSO, along with the limitations of existing improvement strategies—which primarily focus on parameter adjustments during the iteration process (e.g., inertia weight and learning factors)—while chaotic initialization lacks physical prior knowledge, this paper proposes an electricity PriceSOC joint guided initialization strategy (PriceSOC). Based on the economic scheduling principle of “valley charging and peak discharging,” the strategy systematically generates high-quality initial particles conforming to engineering characteristics through four steps: (1) setting SOC guidance targets by time period; (2) constructing SOC guidance trajectories with random disturbances; (3) performing closed-loop smooth correction at the end; and (4) inversely calculating energy storage power sequences from SOC trajectories. The core advantage of this strategy is that it effectively integrates the economic prior knowledge embedded in the TOU electricity price mechanism with the physical constraints of energy storage SOC, thereby improving the convergence speed and solution quality of the algorithm from the perspective of population initialization, while compensating for the deficiencies of existing knowledge-free improvement strategies.

2. Modeling of PV–Storage–Charging Integrated Charging Station

2.1. Photovoltaic Output Model

Compared with traditional fossil fuels, solar energy features environmental friendliness, renewability, and wide availability. With the continuous development and advancement of photovoltaic power generation technology, its application prospects have become increasingly broad. For a PV–storage–charging integrated charging station, the primary energy source is the photovoltaic array, which consists of numerous photovoltaic cells. Photovoltaic cells convert absorbed solar radiation into electrical energy based on the photovoltaic effect of semiconductor materials, serving as the most fundamental power generation units. The output power of photovoltaic cells is affected by factors such as solar irradiance and ambient temperature. Under standard test conditions (STCs; irradiance of 1000 W/m2 and ambient temperature of 25 °C), the output power P p v is expressed as follows:
P p v = P S T C G c G S T C 1 + k T c T S T C
where P p v denotes the output power of the photovoltaic module; P S T C is the rated output power of the photovoltaic cell under STCs; GSTC is the solar irradiance under STCs; G c is the actual operating irradiance; and k is the power temperature coefficient, whose value varies across different photovoltaic modules.
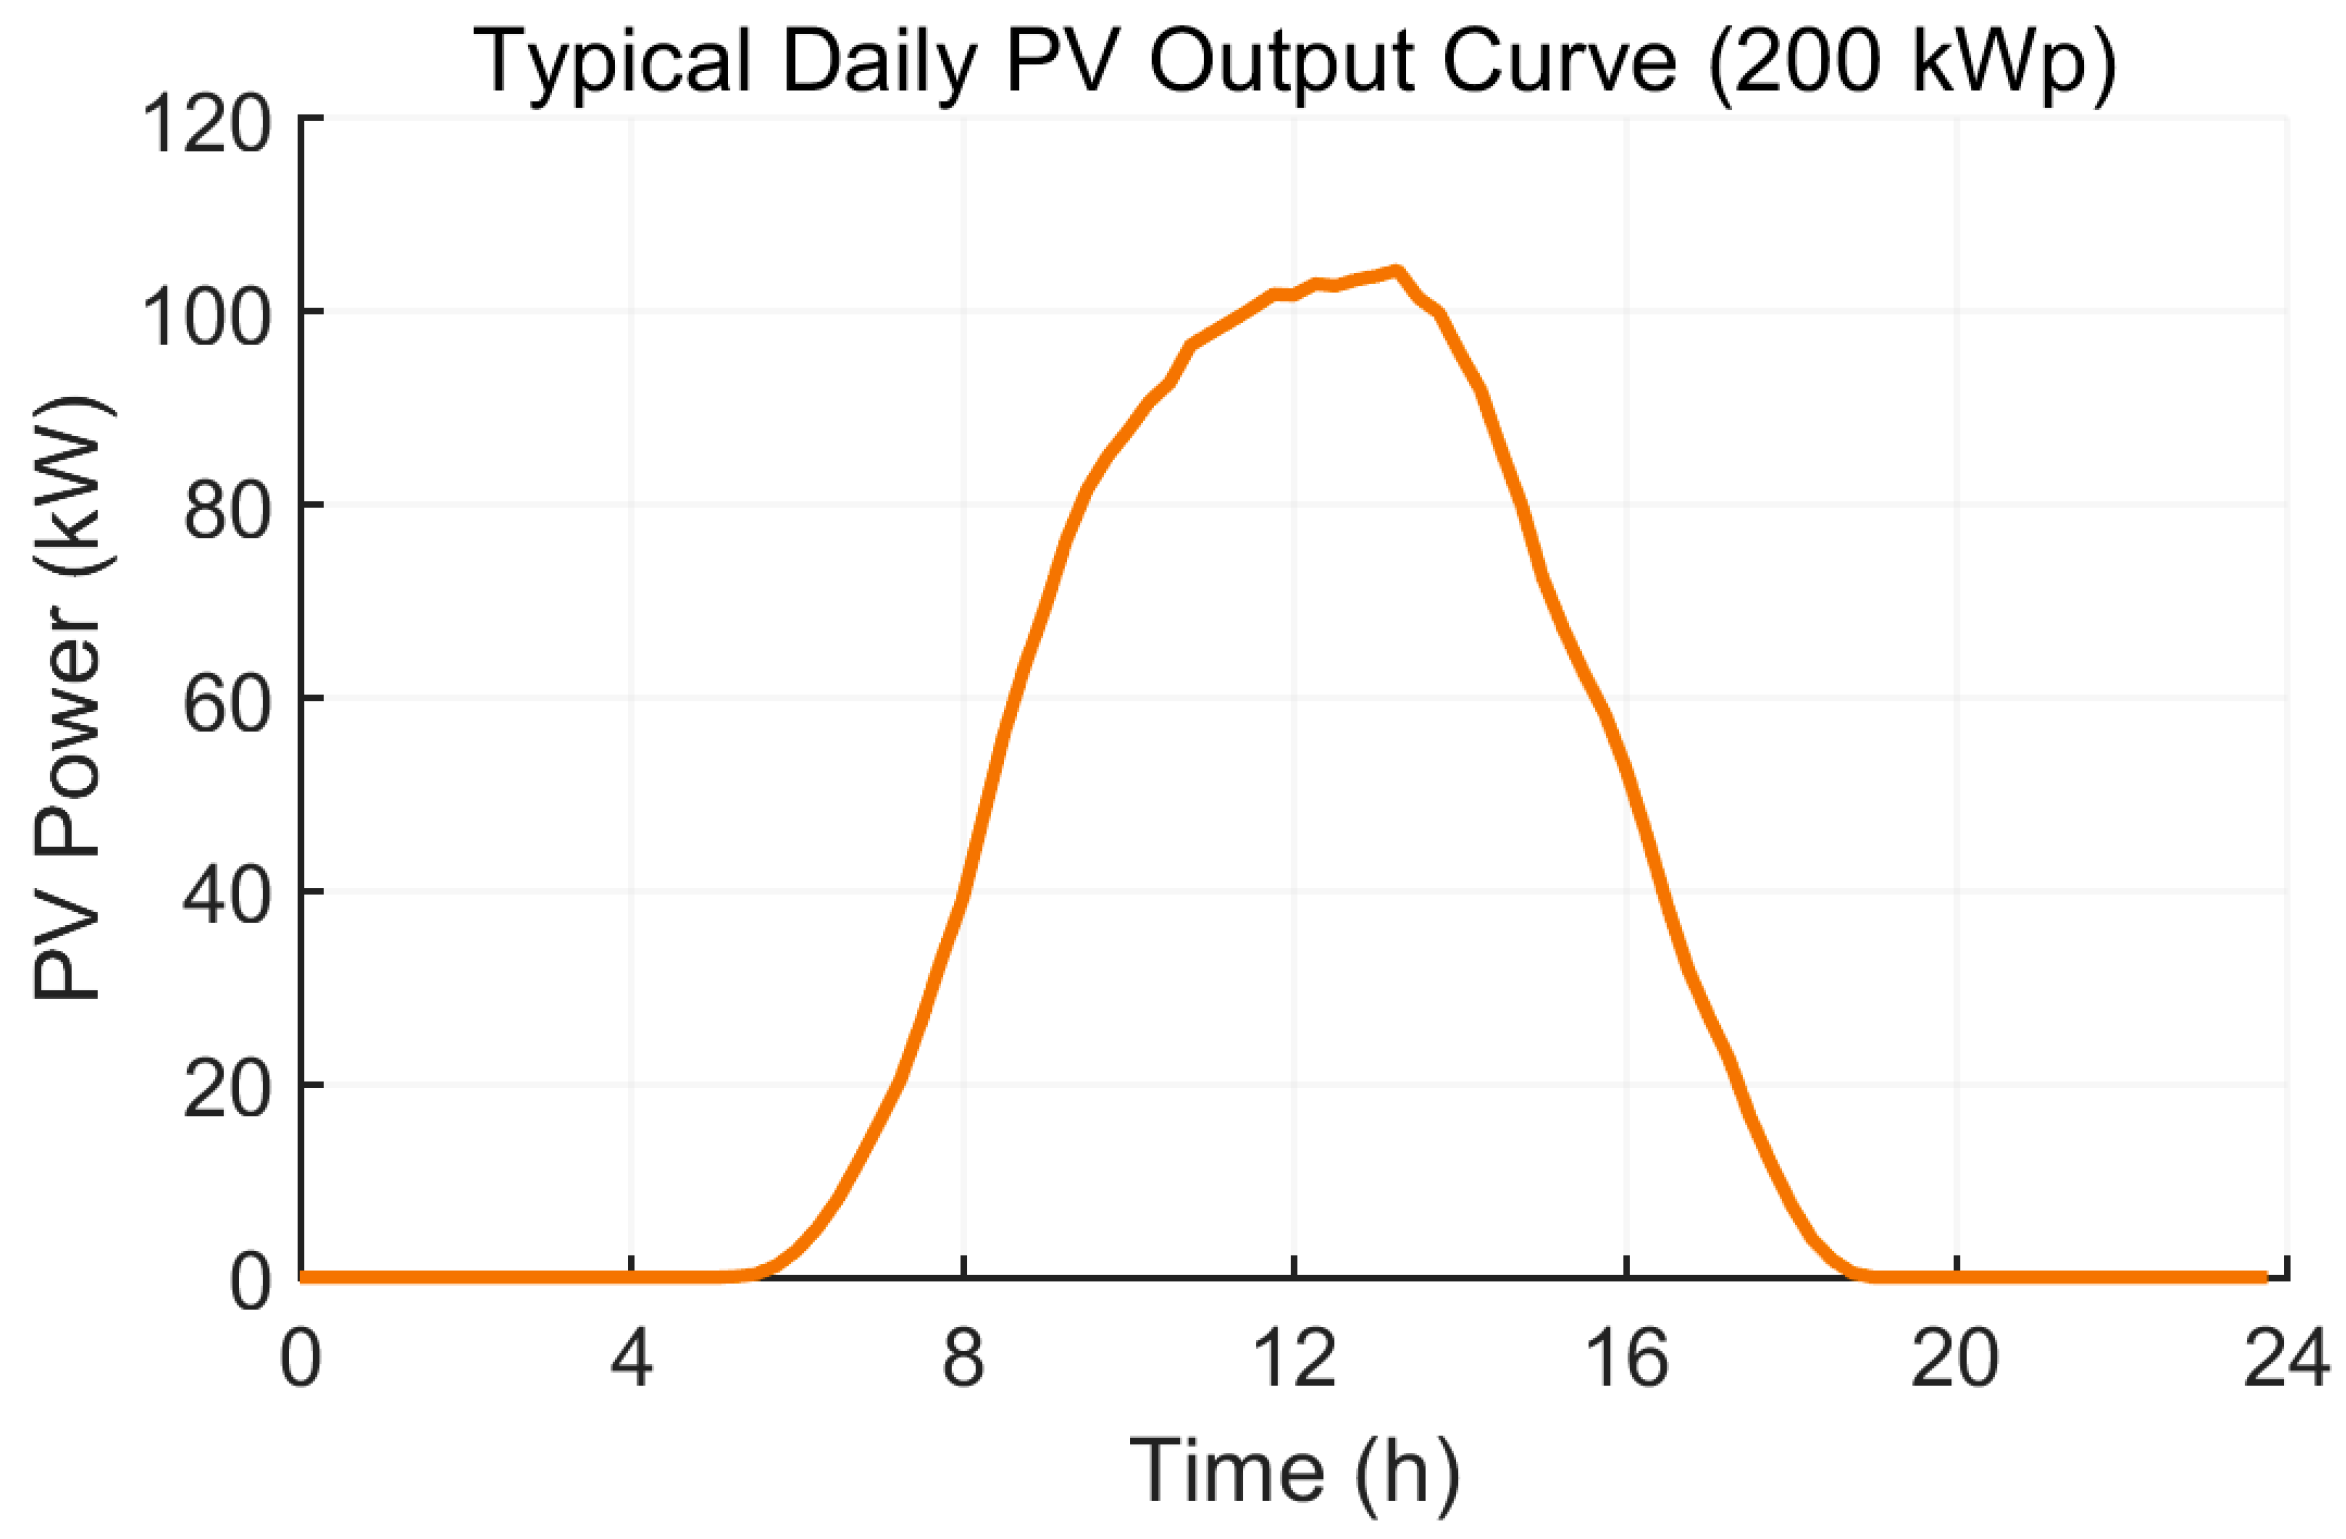
The photovoltaic output data used in this paper are obtained from the public dataset of the State Grid of China Renewable Energy Generation Forecasting Competition [17]. The measured data were collected from Solar Station Site 8 (rated capacity: 30 MW) during the summer months (June to August) of 2019. To match the scale of the charging station in this study, the average output of each time interval in summer is adopted as the typical daily output curve, which is then scaled down to 200 kWp according to the rated capacity ratio. The typical daily PV output curve is shown in Figure 1, with a time resolution of 15 min.

2.2. Energy Storage-System Model

As an essential component of PV–storage–charging integrated charging stations, the energy storage system can store surplus PV power during periods of excess photovoltaic generation, thereby avoiding PV curtailment. Conversely, when PV generation is insufficient, the stored energy can be discharged to ensure reliable station operation. This mechanism helps reduce electricity purchases from the grid during peak-load periods, supports grid operation stability, and lowers operational costs for the station and end users. Owing to their eco-friendliness, lack of memory effect, low self-discharge rate, high operating voltage, extended cycle life, and substantial energy density, lithium iron phosphate (LFP) batteries are extensively used in such integrated stations.
The overall performance and operating state of energy storage batteries are typically quantified by their capacity and state of charge (SOC). The mathematical model for the charging process of energy storage batteries is given as follows:
S O C ( t ) = ( 1 δ ) S O C ( t 1 ) + P b a t , c Δ t η c E b a t
The discharging process can be described as follows:
S O C ( t ) = ( 1 δ ) S O C ( t 1 ) P b a t , d Δ t E b a t η d
where S O C ( t ) and SOC ( t 1 ) denote the battery state of charge at time interval t and t 1 , respectively; δ is the self-discharge rate of the energy storage system; P b a t , c and P b a t , d are the charging and discharging powers, both taking positive values; E b a t is the rated energy capacity; and η c and η d are the charging and discharging efficiencies, respectively. The energy capacity of the energy storage system is determined according to 30–50% of the average daily PV generation. In this paper, the average daily PV generation is approximately 700 kWh. Adopting a 40% capacity ratio, the rated energy capacity is set to E b a t = 300   k W h .The charge–discharge power rating is determined based on 30–50% of the total installed power of charging facilities. Given a total charging power of 416 kW and a 40% power ratio, the rated power of the energy storage system is configured as P b a t N = 160   k W . The SOC is constrained to an operating range of 10–90%, with a uniform charge–discharge efficiency of 92%, and the initial SOC is set at 50%.

2.3. Load Model

The charging load is determined by fleet size, user behavior, and charging power levels. In this paper, the station serves 200 electric vehicles per day, which are divided into two categories by charging power: 7 kW AC slow charging (40%, corresponding to private car users) and 60 kW DC fast charging (60%, corresponding to commercial vehicle users). The specific parameters are listed in Table 1.
The charging load characteristics of electric vehicles (EVs) are comprehensively affected by factors such as daily travel distance, charging power, and charging start and end times. The daily travel distance d of EV generally follows a log-normal distribution [18]. Its probability density function is given by Equation (4):
f d ( x ) = 1 x 1 σ d 2 π e x p ( ln x μ d ) 2 2 σ d 2
where σ d and μ d are the mean and standard deviation of the natural logarithm of travel distance, with values of 3.2 and 0.88, respectively.
The probability density function of EV arrival time is given in Equation (5):
f T ( x ) = 1 σ i 2 π e x p ( x μ i ) 2 2 σ i 2 ,     μ i 12 < x 24 1 σ i 2 π e x p ( x μ i + 24 ) 2 2 σ i 2 ,     0 < x μ i 12
where T denotes the EV arrival time, μ i is the mean value and σ i is the standard deviation. Slow-charging users, mostly private car owners, typically start charging immediately upon evening arrival; their return time follows a truncated normal distribution N(17.47, 3.412). Fast-charging users, mostly commercial vehicle drivers, mainly recharge during midday operational breaks, with arrival time following N ( 11.0 ,   3.0 2 ) .
The final return time of each EV during a day is taken as the charging start time. Assuming charging starts immediately after the EV returns, the charging duration T c under uncontrolled charging mode is calculated as
T c = d E η c P c
where T c is the required charging duration (h); d is the daily travel distance (km); E is the specific energy consumption, taken as 0.18 kWh/km; η c is the charging efficiency, taken as 0.9; and P c is the charging power (kW).
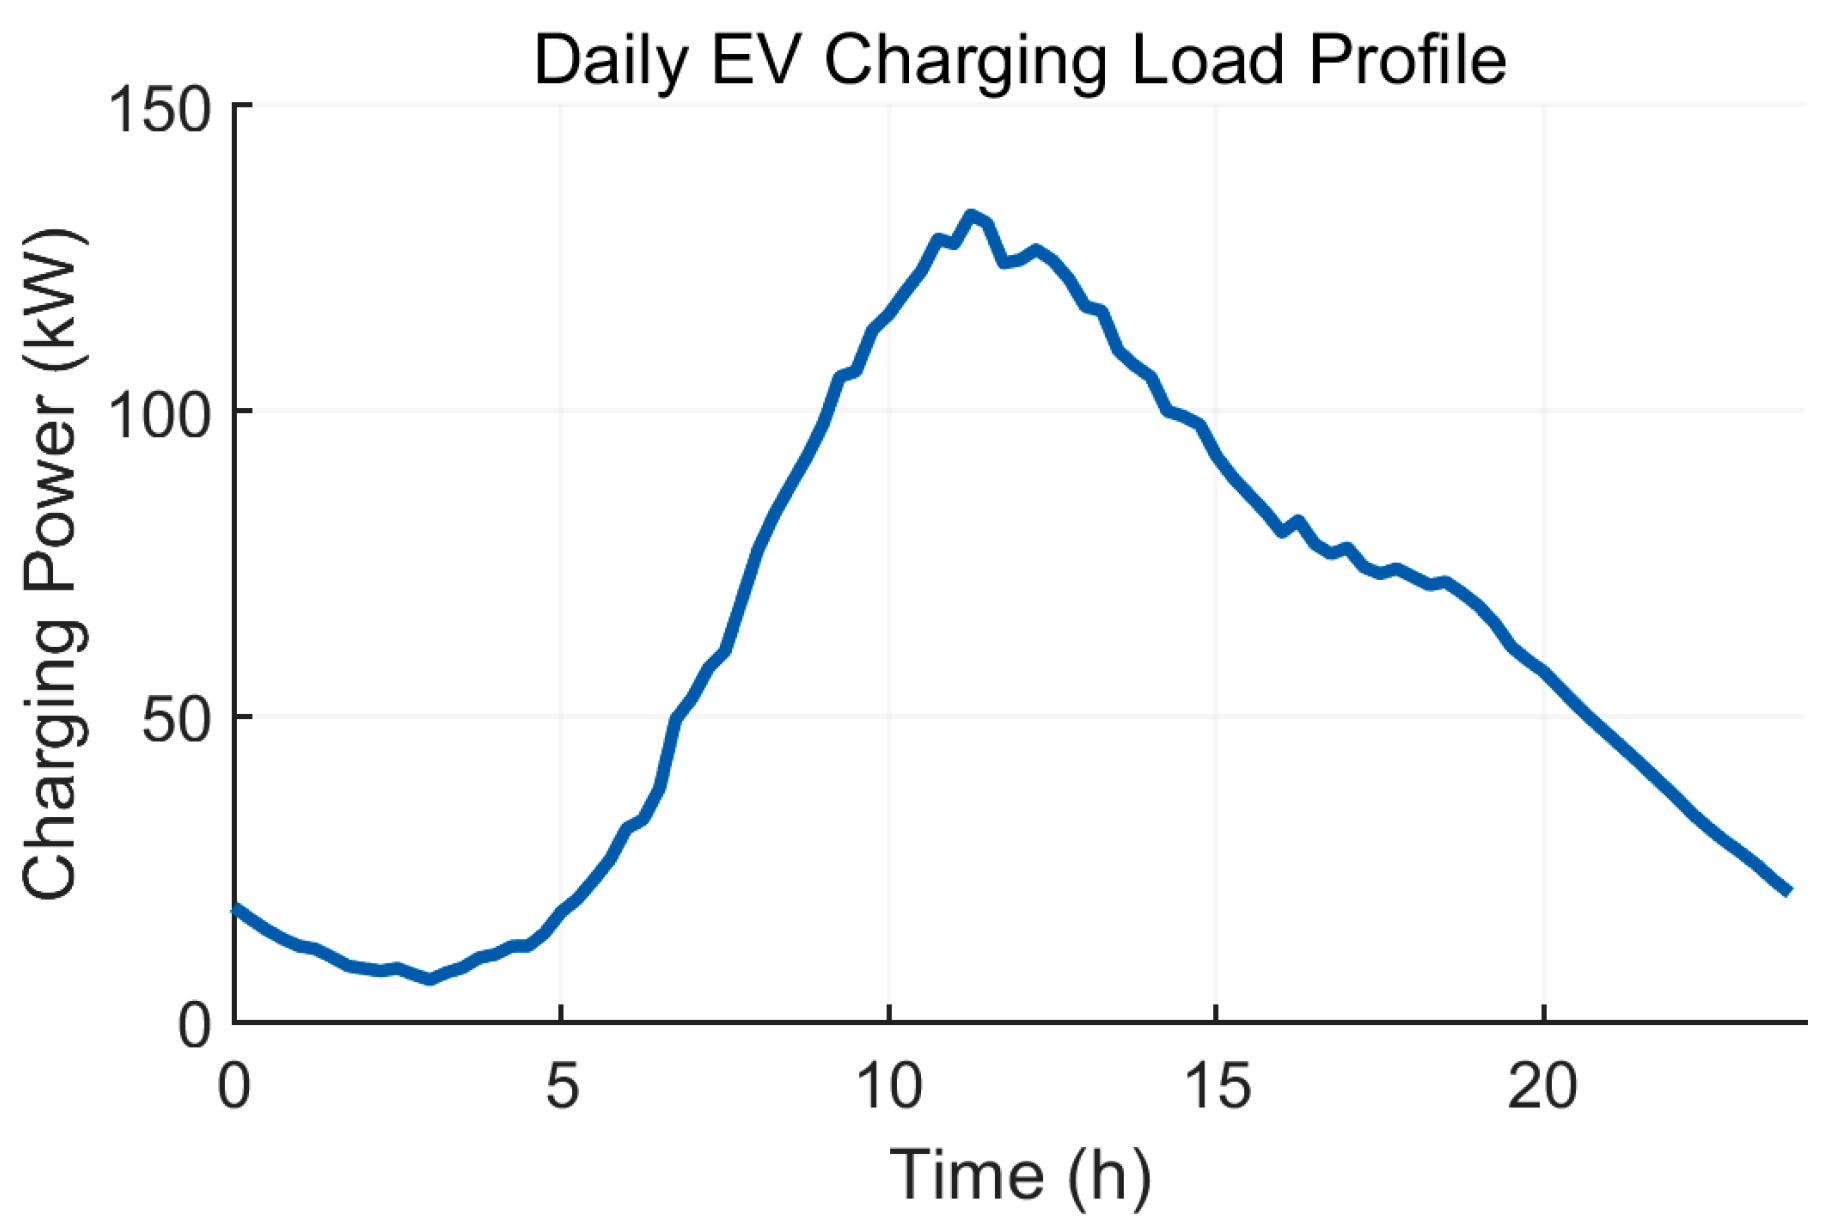
In this paper, the Monte Carlo method is adopted to conduct 500 stochastic simulations of the charging behavior of 200 vehicles. The daily travel distance and arrival time of each vehicle are sampled according to the above distributions and substituted into Equation (6) to calculate the charging duration. The charging power of each time interval is then superimposed, and the average value is taken to obtain the typical daily charging load profile, with a time resolution of 15 min. The resulting curve is shown in Figure 2.

2.4. Optimal Dispatch Model

This research centers on two core optimization targets: one is to lower grid power purchase expenditures for cost-efficient operation of the photovoltaic–storage–charging composite station, and the other is to mitigate grid-side power fluctuations to boost the stability of distribution networks.

2.4.1. Objective Functions

(1)
Daily Operating Cost
The daily operating cost is considered the first economic optimization objective, which quantifies the net electricity exchange cost between the charging station and the utility grid, including both grid purchase expenditure and feed-in revenue. Since the time-of-use (TOU) purchase price and selling price differ, they are accounted for independently. The objective function is formulated as Equation (7):
F 1 = t = 1 T P b u y ( t ) c b u y ( t ) Δ t t = 1 T P s e l l ( t ) c s e l l Δ t
where P b u y ( t ) and P s e l l ( t ) are the power purchased from and sold to the grid at time slot t, in kW, respectively; c b u y ( t ) is the TOU electricity price at time slot t, with peak, flat, and valley prices set to 1.074, 0.671, and 0.316 CNY/kWh, respectively; c s e l l is the fixed PV feed-in tariff, set to 0.42 CNY/kWh; T = 96 denotes the total number of time slots in one day; and Δ t = 0.25   h represents the scheduling time step.
(2)
Minimization of Grid-Connected Power Fluctuations
Bidirectional power exchange between the charging station and the utility grid (i.e., grid purchase and electricity feed-in) will have impacts on the distribution network. Thus, the second objective is set to minimize power fluctuation at the grid connection point, so as to reduce grid integration impacts and improve operational security and stability. The fluctuation level is measured by the variance of full-day grid-connected power, as shown in Equation (8):
F 2 = 1 T t = 1 T P g r i d ( t ) P ¯ g r i d 2
where F 2 is the power fluctuation index at the grid connection point, in kW2; a smaller value indicates smoother power exchange throughout the day.   P g r i d ( t ) = P b u y ( t ) P s e l l ( t ) represents the net power exchanged between the station and the utility grid at time slot t, in kW, where positive values denote power purchased from the grid and negative values denote power fed into the grid. P ¯ g r i d denotes the average value of daily grid-interactive power, in kW.
To eliminate the dimensional and magnitude differences between the daily operating cost F 1 and the grid-connected power fluctuation F 2 this paper adopts a baseline-normalized linear weighting method to construct the comprehensive objective function as follows:
min F = w 1 F 1 F 1 0 + w 2 F 2 F 2 0
where F 1 0   and   F 2 0 are the reference values of daily power purchase cost and grid-connected power fluctuation under the no-storage scenario, respectively; w 1 and w 2 are the weight coefficients, satisfying w 1 + w 2 = 1 . In this paper, w 1 and w 2 are set to 0.3 and 0.7, respectively.

2.4.2. Constraints

(1)
Power Balance Constraint:
P p v ( t ) + P b u y ( t ) + P b a t , d ( t ) = P e v ( t ) + P b a t , c ( t ) + P s e l l ( t )
where P p v ( t ) is the PV output power at time slot t, in kW; P b u y ( t ) is the power purchased from the grid at time slot t, in kW; P b a t , d ( t ) is the energy storage discharging power at time slot t, in kW; P e v ( t ) is the EV charging load at time slot t, in kW; P b a t , c ( t ) is the energy storage charging power at time slot t, in kW; and P s e l l ( t ) is the power sold to the grid at time slot t, in kW.
(2)
Energy storage charging/discharging power constraints
The charge and discharge power of the energy storage system shall not exceed its rated power. Moreover, to avoid unnecessary losses, simultaneous charging and discharging of the energy storage system are prohibited within the same time slot.
0 P b a t , c ( t ) P b a t N
0 P b a t , d ( t ) P b a t N
P b a t , c t P b a t , d t = 0
where P b a t , c ( t ) and P b a t , d ( t ) denote the charging and discharging power of the energy storage system at time slot t, in kW; and P b a t N stands for the rated power of the energy storage system, in kW.
(3)
State of Charge (SOC) Constraints
To prevent overcharging and over-discharging of the energy storage battery and to ensure its safe operation, the state of charge at each time slot shall be maintained within a reasonable range:
S O C m i n S O C ( t ) S O C m a x
where S O C ( t ) is the state of charge of the energy storage system at time slot t.
The SOC evolves dynamically in real time with charging and discharging activities. Based on the principle of energy conservation, the iterative update formula for the SOC at each time slot is established as follows:
S O C ( t + 1 ) = S O C ( t ) + η c P b a t , c ( t ) Δ t E b a t P b a t , d ( t ) Δ t η d E b a t
where η c and η d denote the charging efficiency and discharging efficiency of the energy storage system, respectively; and E b a t represents its rated capacity, in kWh.
(4)
Grid-connection point power-exchange constraints
The power exchange between the charging station and the public distribution network must comply with the transformer capacity limits to prevent grid voltage fluctuations, equipment overloading, and other issues caused by grid-connected power violations, thereby ensuring the operational stability of the distribution network. The net power at the grid connection point is determined by the difference between the power purchased from the grid and the power sold to the grid:
P g r i d ( t ) = P b u y ( t ) P s e l l ( t )
P g _ m a x P g r i d ( t ) P g _ m a x
where P g r i d ( t ) represents the power exchanged at the grid tie node during time slot t, in kW; and P g _ m a x notes the maximum permitted grid-connected power, set to 500 kW.
(5)
Grid power purchase and sale constraints
Both grid purchasing power and grid selling power are positive physical quantities, and no negative power exchange occurs. Therefore, non-negative constraints are imposed on both the purchasing and selling power, and the charging station is not allowed to purchase from or sell electricity to the grid simultaneously within the same time slot:
P b u y t 0 ,     P s e l l ( t ) 0
P b u y ( t ) P s e l l ( t ) = 0
where P b u y ( t ) and P s e l l ( t ) are the power purchased from and sold to the grid at time slot t, respectively, in kW, both of which are non-negative.
(6)
Daily cycle balance constraint
To guarantee that the scheduling problem remains solvable on a daily recurring basis, the SOC at the final time step must be restored to its starting level:
S O C ( 96 ) = S O C ( 0 ) = 0.5

3. Improved Particle Swarm Optimization Algorithm Based on PriceSOC Initialization

The optimal energy scheduling problem for photovoltaic–storage–charging integrated stations involves charging/discharging mutual exclusion constraints, power purchase/sale mutual exclusion constraints, and SOC temporal coupling constraints, exhibiting nonlinear and multi-constrained characteristics. Particle swarm optimization (PSO), as a classic swarm intelligence algorithm, offers advantages such as few parameters, simple structure, and relatively fast convergence. It has been widely applied in various power system optimization problems, including microgrid energy management, energy storage optimization, and electric vehicle charging scheduling. Therefore, this paper adopts PSO to solve the problem.

3.1. Fundamentals of Particle Swarm Optimization

As a population-based stochastic search technique, PSO was originally introduced by Kennedy and Eberhart in 1995, drawing inspiration from the coordinated movement observed in bird flocks. Within this framework, every candidate solution to the target optimization problem is represented as a “particle” moving through the decision space, with its status fully described by two attributes: current position and velocity. At each iteration, the particle adjusts its trajectory by referring to two reference points: its own historically best position (pbest) and the best position discovered so far by the entire swarm (gbest). Through this mechanism, the swarm collectively converges toward the global optimum. The corresponding velocity and position update rules are provided in Equations (21) and (22), respectively:
v i k + 1 = w v i k + c 1 r 1 P b e s t , i k x i k + c 2 r 2 G b e s t k x i k
x i k + 1 = x i k + v i k + 1
where v i k and x i k represent the velocity and position of the i-th particle at the k-th iteration, respectively. The parameter w corresponds to the inertia weight coefficient, which controls the impact of the current velocity on particle motion in the subsequent iteration and is set to 0.7 in this study. This value is widely adopted in relevant studies on particle swarm optimization, as it can can achieve a good balance between convergence speed and search accuracy. c 1 and c 2 stand for the cognitive and social acceleration coefficients, which quantify the effects of the individual historical optimum and global swarm optimum, both assigned a value of 1.5, which falls within the commonly used range [1.5, 2.0] that guarantees algorithm convergence, maintaining a balance between the individual cognition and social cognition of particles. r 1 and r 2 are random variables uniformly distributed over the interval [ 0 , 1 ] . The population size N of the PSO algorithm is set to 40. This value is determined by combining the dimension of decision variables and the commonly adopted range in similar energy storage optimal scheduling studies, which balances optimization accuracy and computational efficiency.

3.2. Electricity PriceSOC Joint Guided Initialization Improvement Strategy

The standard PSO generates the initial population through complete random sampling, resulting in uneven particle distribution across the search space. For the energy storage scheduling model constructed in this paper, randomly produced power sequences frequently exhibit disordered operation modes: charging during peak electricity price periods and discharging during valley price periods. Most particles fall into inferior solution regions characterized by high power purchase costs and severe grid-connected fluctuations. As the algorithm iterates repeatedly within this low-quality search space, it tends to converge prematurely to local optima and yields suboptimal scheduling results.

3.2.1. Improvement Idea

Aiming at the scheduling characteristics of PV–storage–charging integrated charging stations, this paper improves the standard PSO only from the perspective of population initialization and proposes an electricity PriceSOC joint guided initialization strategy named PriceSOC. The method leverages engineering prior knowledge that the peak–valley periods of time-of-use (TOU) electricity prices highly coincide with the station load profiles: during valley price periods, the system load is low and grid power purchase costs are cheap, which is suitable for energy storage charging and energy accumulation; during peak price periods, the load demand rises and electricity purchase costs become high, at which point, discharging the stored energy can effectively reduce power purchase costs, while also mitigating fluctuations in grid-connected power via peak shaving and valley filling. Based on this economic rule, smooth and feasible energy storage SOC trajectories are generated step by step, and further converted into charge–discharge power sequences in reverse. This procedure purposefully produces high-quality initial particles consistent with practical operation characteristics, fundamentally reducing the risk of premature convergence of the algorithm.
To balance population diversity and solution quality, a hybrid initialization scheme is adopted in this work. Specifically, 50% of particles in the population are generated via the proposed PriceSOC guidance, and the remaining 50% are initialized randomly. This design prevents population homogenization and avoids the algorithm being trapped in local optima.

3.2.2. Implementation Steps for the Proposed Initialization Strategy

(1)
Segmented Setting of Target SOC Values
The whole day is divided into peak, flat and valley periods according to the time-of-use (TOU) tariff. In this work, the peak periods are 8:00–11:00 and 18:00–21:00, with a tariff of 1.074 CNY/kWh; the valley period ranges from 22:00 to 6:00 of the next day at 0.316 CNY/kWh; and the remaining time is defined as flat periods, with a tariff of 0.671 CNY/kWh. Following the economic scheduling principle of “charging at valley prices and discharging at peak prices”, the target SOC for each time segment is set as follows:
  • (1)
    Valley periods: S O C t a r g e t = 0.9 , which guides continuous energy storage charging to fully utilize low-cost grid electricity;
    (2)
    Peak periods: S O C t a r g e t = 0.1 , which triggers persistent energy storage discharge to cut electricity purchase during high-price hours;
    (3)
    Flat transition periods: S O C t a r g e t = 0.5 , which maintains stable battery energy and avoids unnecessary charge–discharge losses.
(2)
Construction of Guided SOC Trajectories with Random Perturbations
Taking the initial SOC of 0.5 as the starting point, continuous SOC curves are generated through period-by-period recursion, and the recursive formula is given as follows:
S O C ( t ) = S O C ( t 1 ) + p u l l ( S O C t a r g e t ( t ) S O C ( t 1 ) ) + ε
where p u l l denotes the traction coefficient, which controls the gentle convergence of SOC toward the target value and prevents abrupt energy fluctuations. The traction coefficients for peak, valley, and flat periods are set to 0.025, 0.02, and 0.01, respectively. ε represents a small uniform random disturbance with ε [ 0.01 , 0.01 ] . It generates differentiated SOC trajectories for distinct particles to sustain population diversity and avoid complete particle homogenization that weakens search capability. The SOC curves produced by this recursive method rise and fall smoothly, and the corresponding energy storage charge–discharge power avoids sharp fluctuations, which inherently helps mitigate grid-connected power volatility.
(3)
Closed-Loop Smooth Correction of Terminal SOC
Random disturbances will cause the terminal SOC at the end of the scheduling cycle to deviate from the initial value of 0.5, violating the constraint of daily cyclic scheduling. In this paper, the total SOC deviation over the whole day is evenly distributed to the last 20 time intervals for gradual offset. The SOC remains smooth throughout the correction process without introducing instantaneous high-power spikes that impair grid-connection stability, and the terminal SOC is forced to return to 0.5 at the end of the scheduling horizon.
(4)
Derivation of Energy Storage Charge–Discharge Power Sequences from SOC Trajectories
Calculate the SOC variation between adjacent time intervals: Δ S O C ( t ) = S O C ( t ) S O C ( t 1 ) . Combined with the rated capacity of energy storage, charging and discharging efficiencies, and scheduling time step, the energy storage power of each time interval can be derived. First, a signed intermediate variable P b a t ( t ) or battery power is defined with the following sign convention:
P b a t ( t ) < 0 : the energy storage system is in charging mode;
P b a t ( t ) > 0 : the energy storage system is in discharging mode.
When Δ S O C ( t ) > 0 , the SOC rises and the energy storage system is in charging mode:
P bat ( t ) = Δ SOC   E bat η c   Δ t
When Δ S O C ( t ) < 0 , the SOC declines, and the energy storage system is in discharging mode:
P b a t ( t ) = Δ S O C η d E b a t Δ t
The above formulas calculate the basic power values corresponding to SOC variations, which are then clamped within the range [ - P batN ,     P batN ] . Here, E b a t stands for the rated capacity of the energy storage system, and η c and η d denote its charging and discharging efficiencies, respectively.
To be consistent with the variable definitions of the scheduling model in Section 2, the signed intermediate variable P b a t ( t ) needs to be converted into separate charging and discharging power variables adopted in the model, and the conversion rule is given in Equation (26):
P b a t , c t = P b a t t , P b a t t < 0   ( c h a r g i n g ) P b a t , d t = P b a t t , P b a t t > 0   ( d i s c h a r g i n g ) P b a t , c ( t ) = 0 , P b a t , d ( t ) = 0 , P b a t ( t ) = 0
The power values of all 96 daily intervals are concatenated into a 96-dimensional vector, which represents a complete intra-day charge–discharge scheduling scheme of energy storage and corresponds to an individual particle in the PSO algorithm.

3.2.3. Sensitivity Analysis

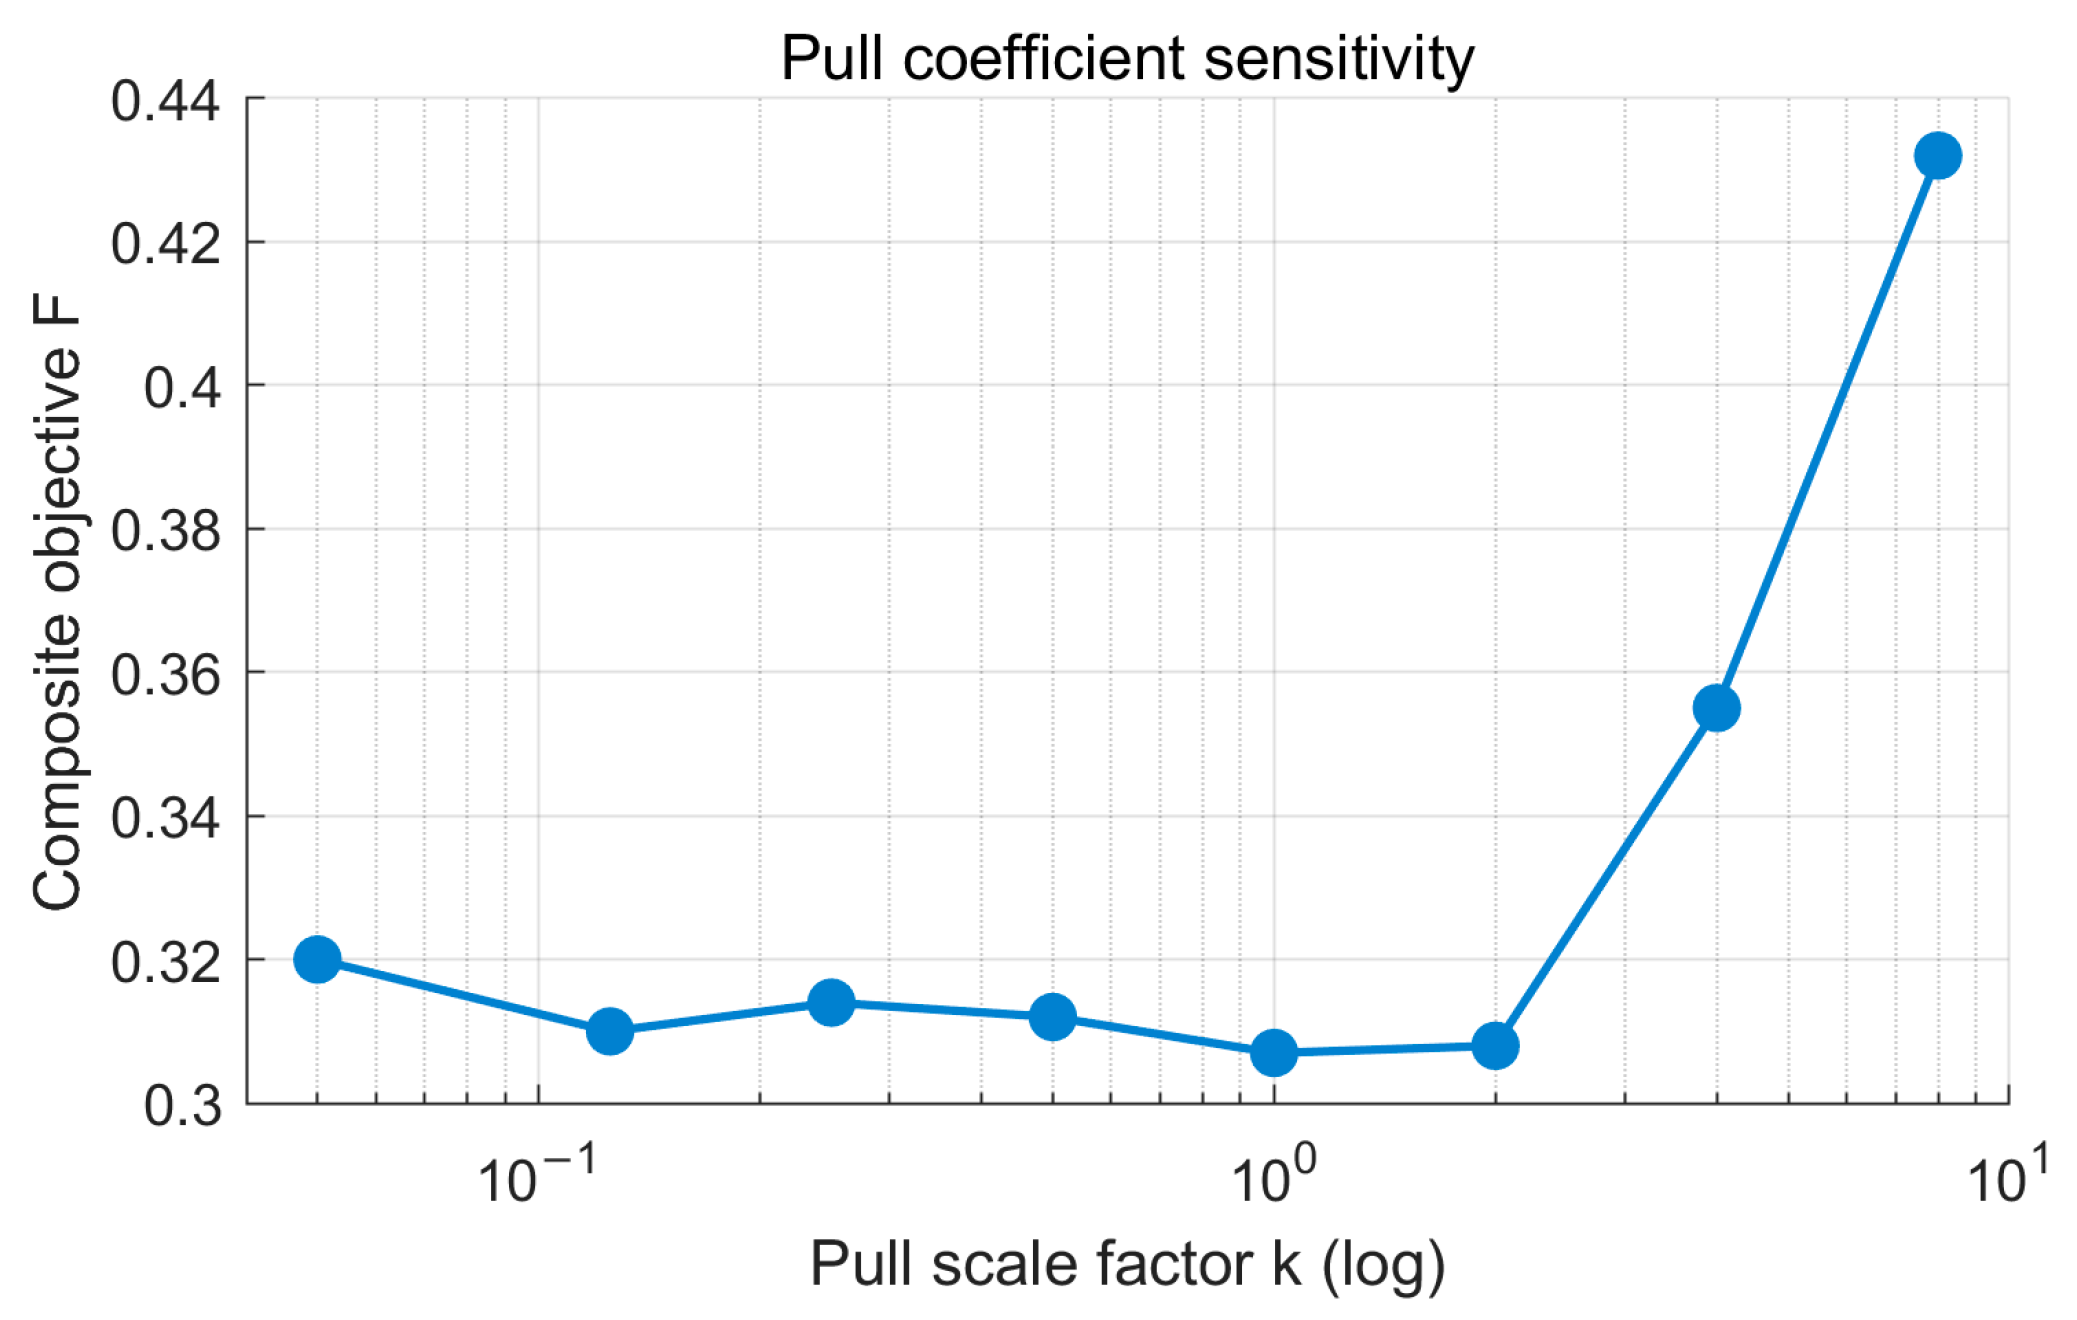
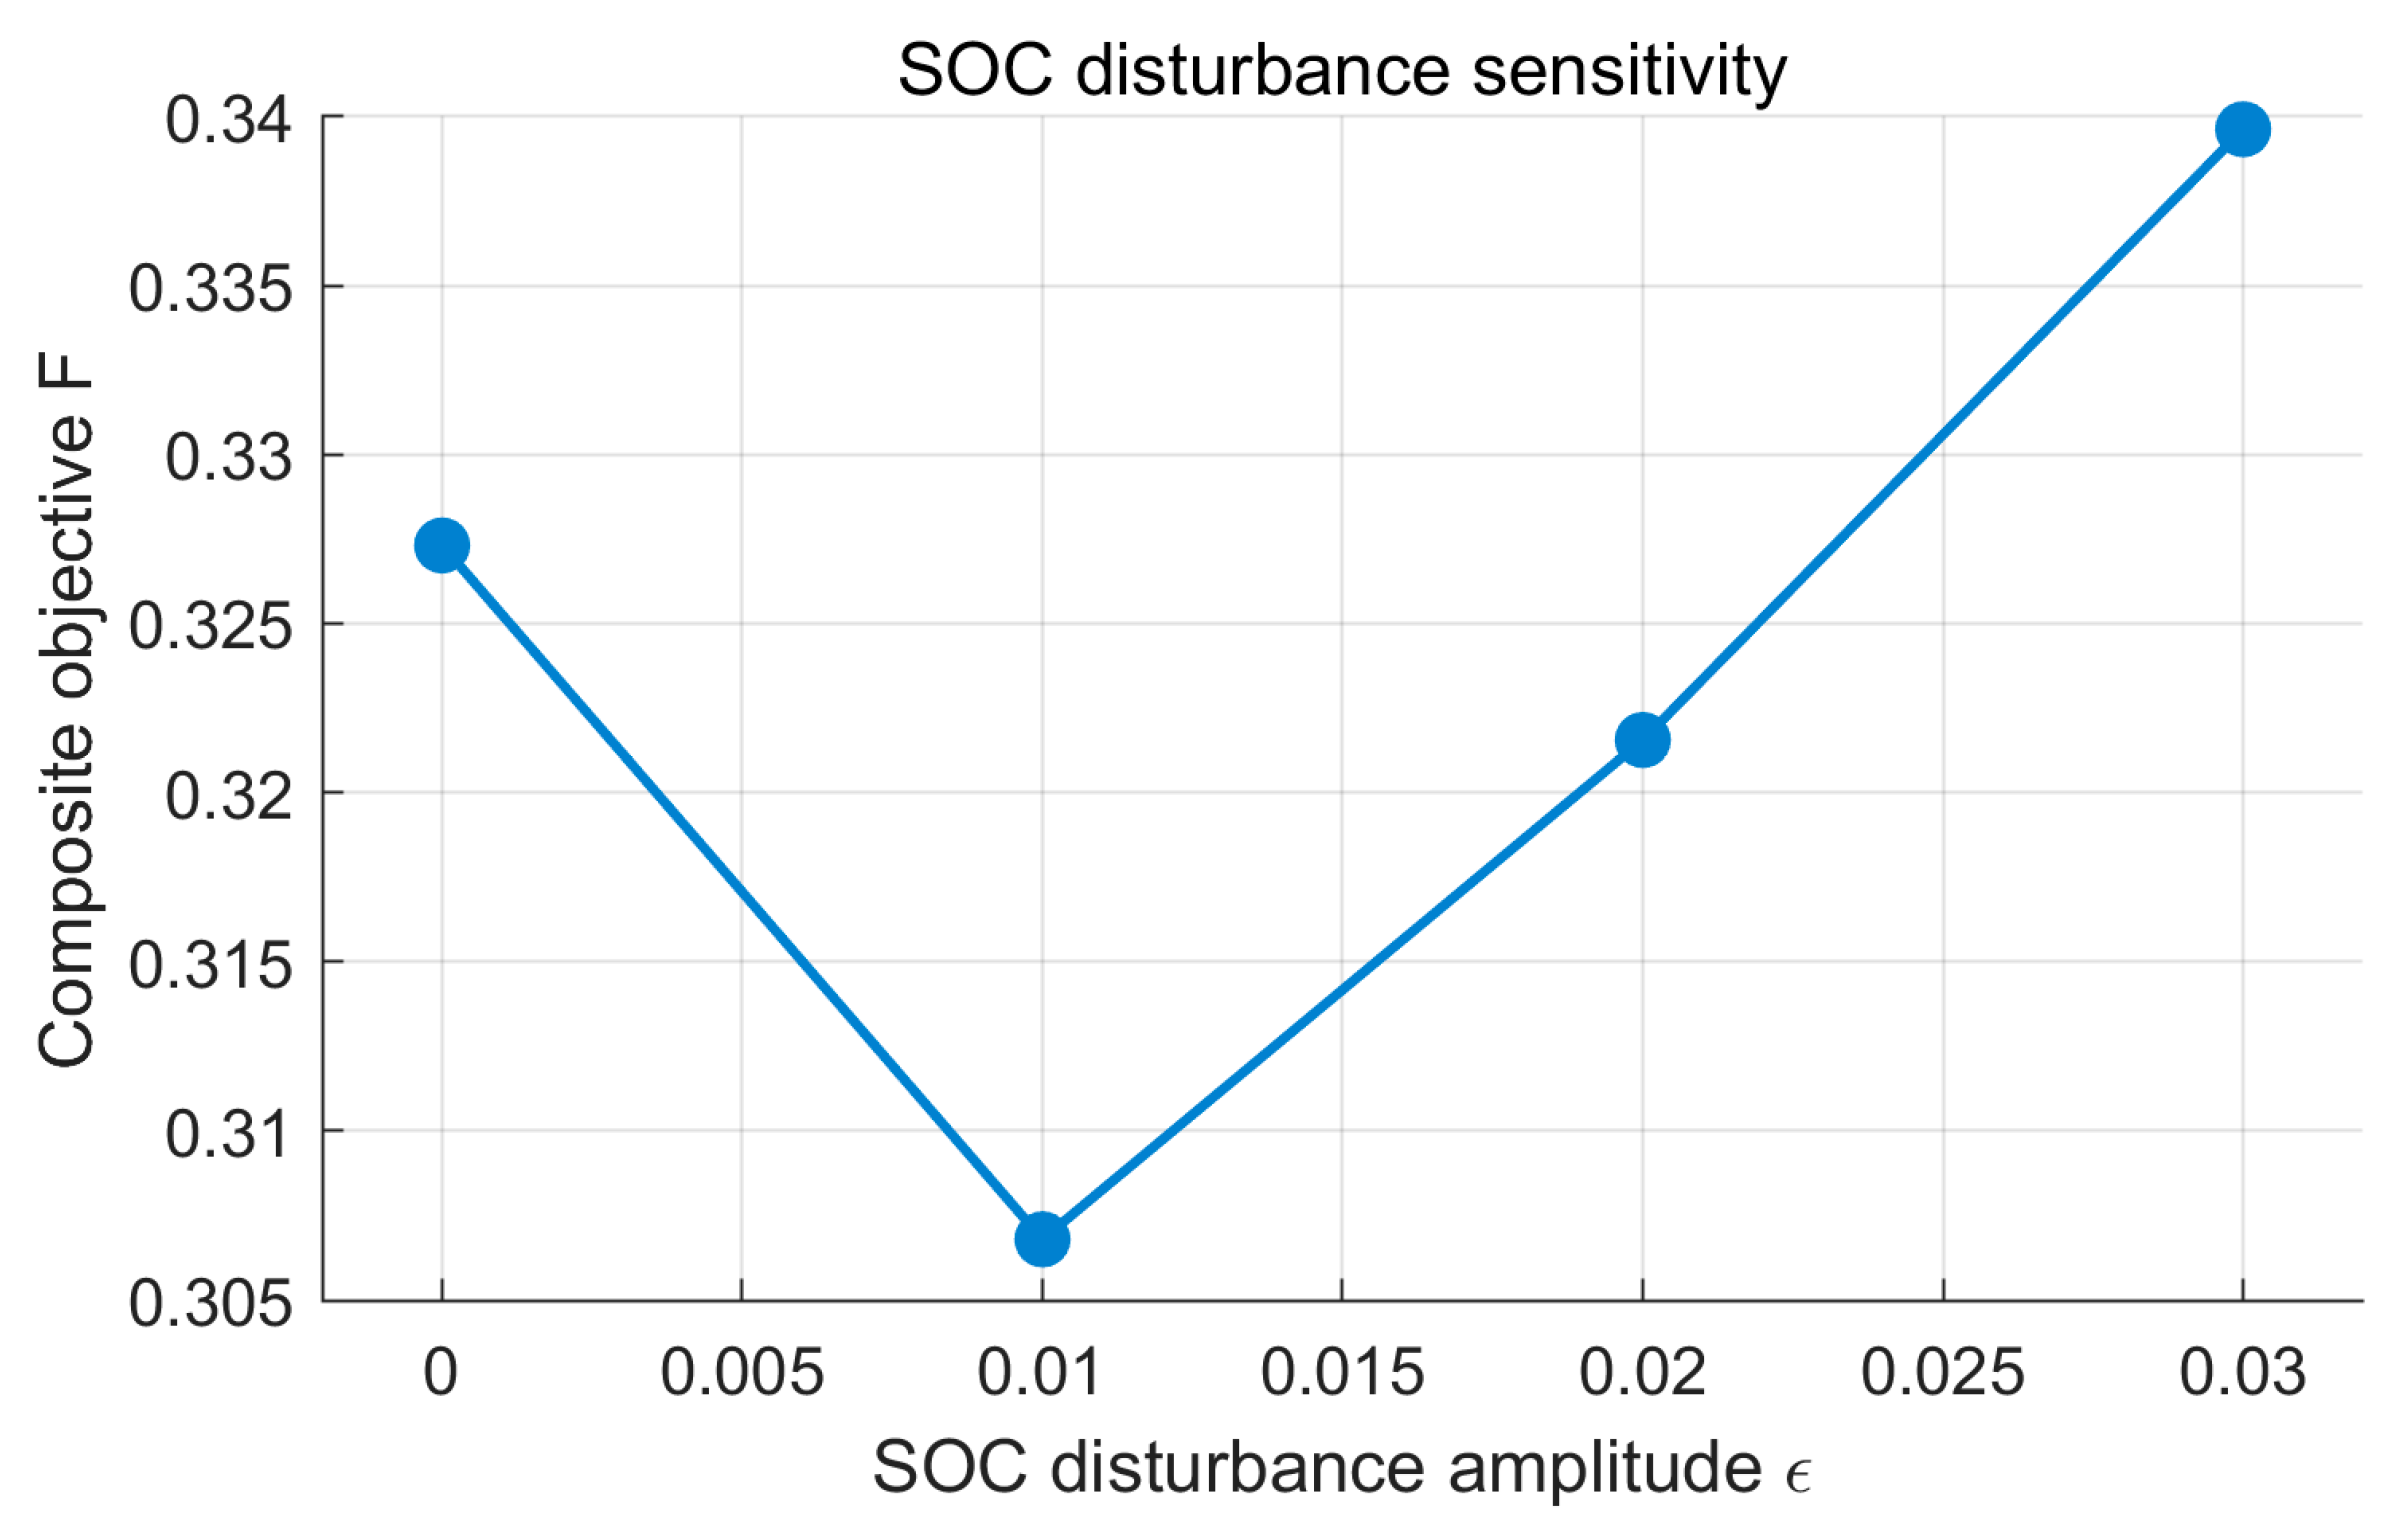
The proposed PriceSOC strategy in this paper contains two core parameters, namely the traction coefficient pull and the random perturbation amplitude ε , whose values affect the final optimization performance of the algorithm. To verify the rationality of the selected parameter values and evaluate the parameter sensitivity of the algorithm, single-factor sensitivity analyses are carried out for the traction coefficient and random perturbation amplitude respectively. The corresponding results are illustrated in Figure 3 and Figure 4.
This paper adopts a unified scaling factor k to synchronously scale the baseline traction coefficients of peak, valley and flat periods (0.025, 0.02 and 0.01). The values of the comprehensive objective function F under different k are recorded. It can be observed from Figure 3 that when k ≤ 0.05, the traction effect is too weak to drive sufficient charge and discharge power of the energy storage system, which restricts the peak-shaving and valley-filling regulation capability and leads to a relatively high value of F. As k increases, F gradually declines and reaches its minimum near k = 1 (corresponding to 0.025 for peak periods, 0.02 for valley periods and 0.01 for flat periods). When k 4 , the excessive traction force causes drastic fluctuations in battery power and significantly amplifies grid-connected power volatility, resulting in a rapid rise in F . Meanwhile, F varies gently over a wide range of k ∈ [0.125, 2], demonstrating favorable robustness of the traction coefficient within this interval. The above analysis verifies that the selected k = 1 (baseline coefficients: 0.025 for peak, 0.02 for valley, 0.01 for flat) balances effective trajectory guidance and stable system operation, which is a reasonable parameter setting.
It can be seen from Figure 4 that when ε = 0 , all guided particles share identical SOC trajectories, resulting in the loss of population diversity and the maximum value of the comprehensive objective function F . As ε rises to 0.01, moderate discrepancies are introduced among particles, the population diversity improves, and F drops to its minimum value. When ε further increases to 0.02 and 0.03, excessive random perturbations distort the valley-charging and peak-discharging SOC guidance trajectories, and F climbs gradually. The above results reveal that ε = 0.01 achieves a favorable trade-off between maintaining population diversity and preserving stable guidance trajectories, which justifies the selection of ε = 0.01 in this paper.

4. Simulation and Results Analysis

4.1. Basic Simulation Settings

To verify the constructed multi-objective scheduling model for photovoltaic–storage–charging systems and the proposed electricity PriceSOC joint guided initialization PSO algorithm, a day-ahead scheduling simulation model for photovoltaic–storage–charging integrated charging stations is built based on MATLAB R2024a. Simulations are performed with a 15 min scheduling interval, resulting in a total of 96 time slots throughout the day. The configuration parameters of the photovoltaic–storage–charging system described above are adopted for simulation. The parameter settings of the PSO algorithm are listed as follows: the population size is set to 40, and the maximum number of iterations is 300; the inertia weight is 0.7, and the learning factors c 1   a n d   c 2 are both set to 1.5. The PriceSOC traction coefficients for peak, valley and flat periods are 0.025, 0.02 and 0.01 respectively, and the random perturbation amplitude of SOC is ε = 0.01 . The iteration terminates when the maximum iteration number of 300 is reached, and MATLAB R2024a is used as the simulation software. Five comparative simulation scenarios are established to fully validate the performance and cross-algorithm generalizability of the proposed initialization strategy:
Scenario 1: No energy storage equipment is configured (NoStor), serving as the benchmark case for system operation.
Scenario 2: Standard PSO with purely random initialization (Std PSO).
Scenario 3: PWLCM chaotic-initialized PSO (Chaotic PSO).
Scenario 4: The proposed PriceSOC-initialized improved PSO.
Scenario 5: Grey Wolf Optimizer (GWO), Harris Hawks Optimizer (HHO), and Sparrow Search Algorithm (SSA).
Scenarios 2–4 are designed to compare the optimization performance of different population initialization methods under the PSO framework, while Scenario 5 is adopted to verify the performance gap between the algorithm proposed in this paper and mainstream optimization algorithms proposed in recent years.

4.2. Main Case Analysis

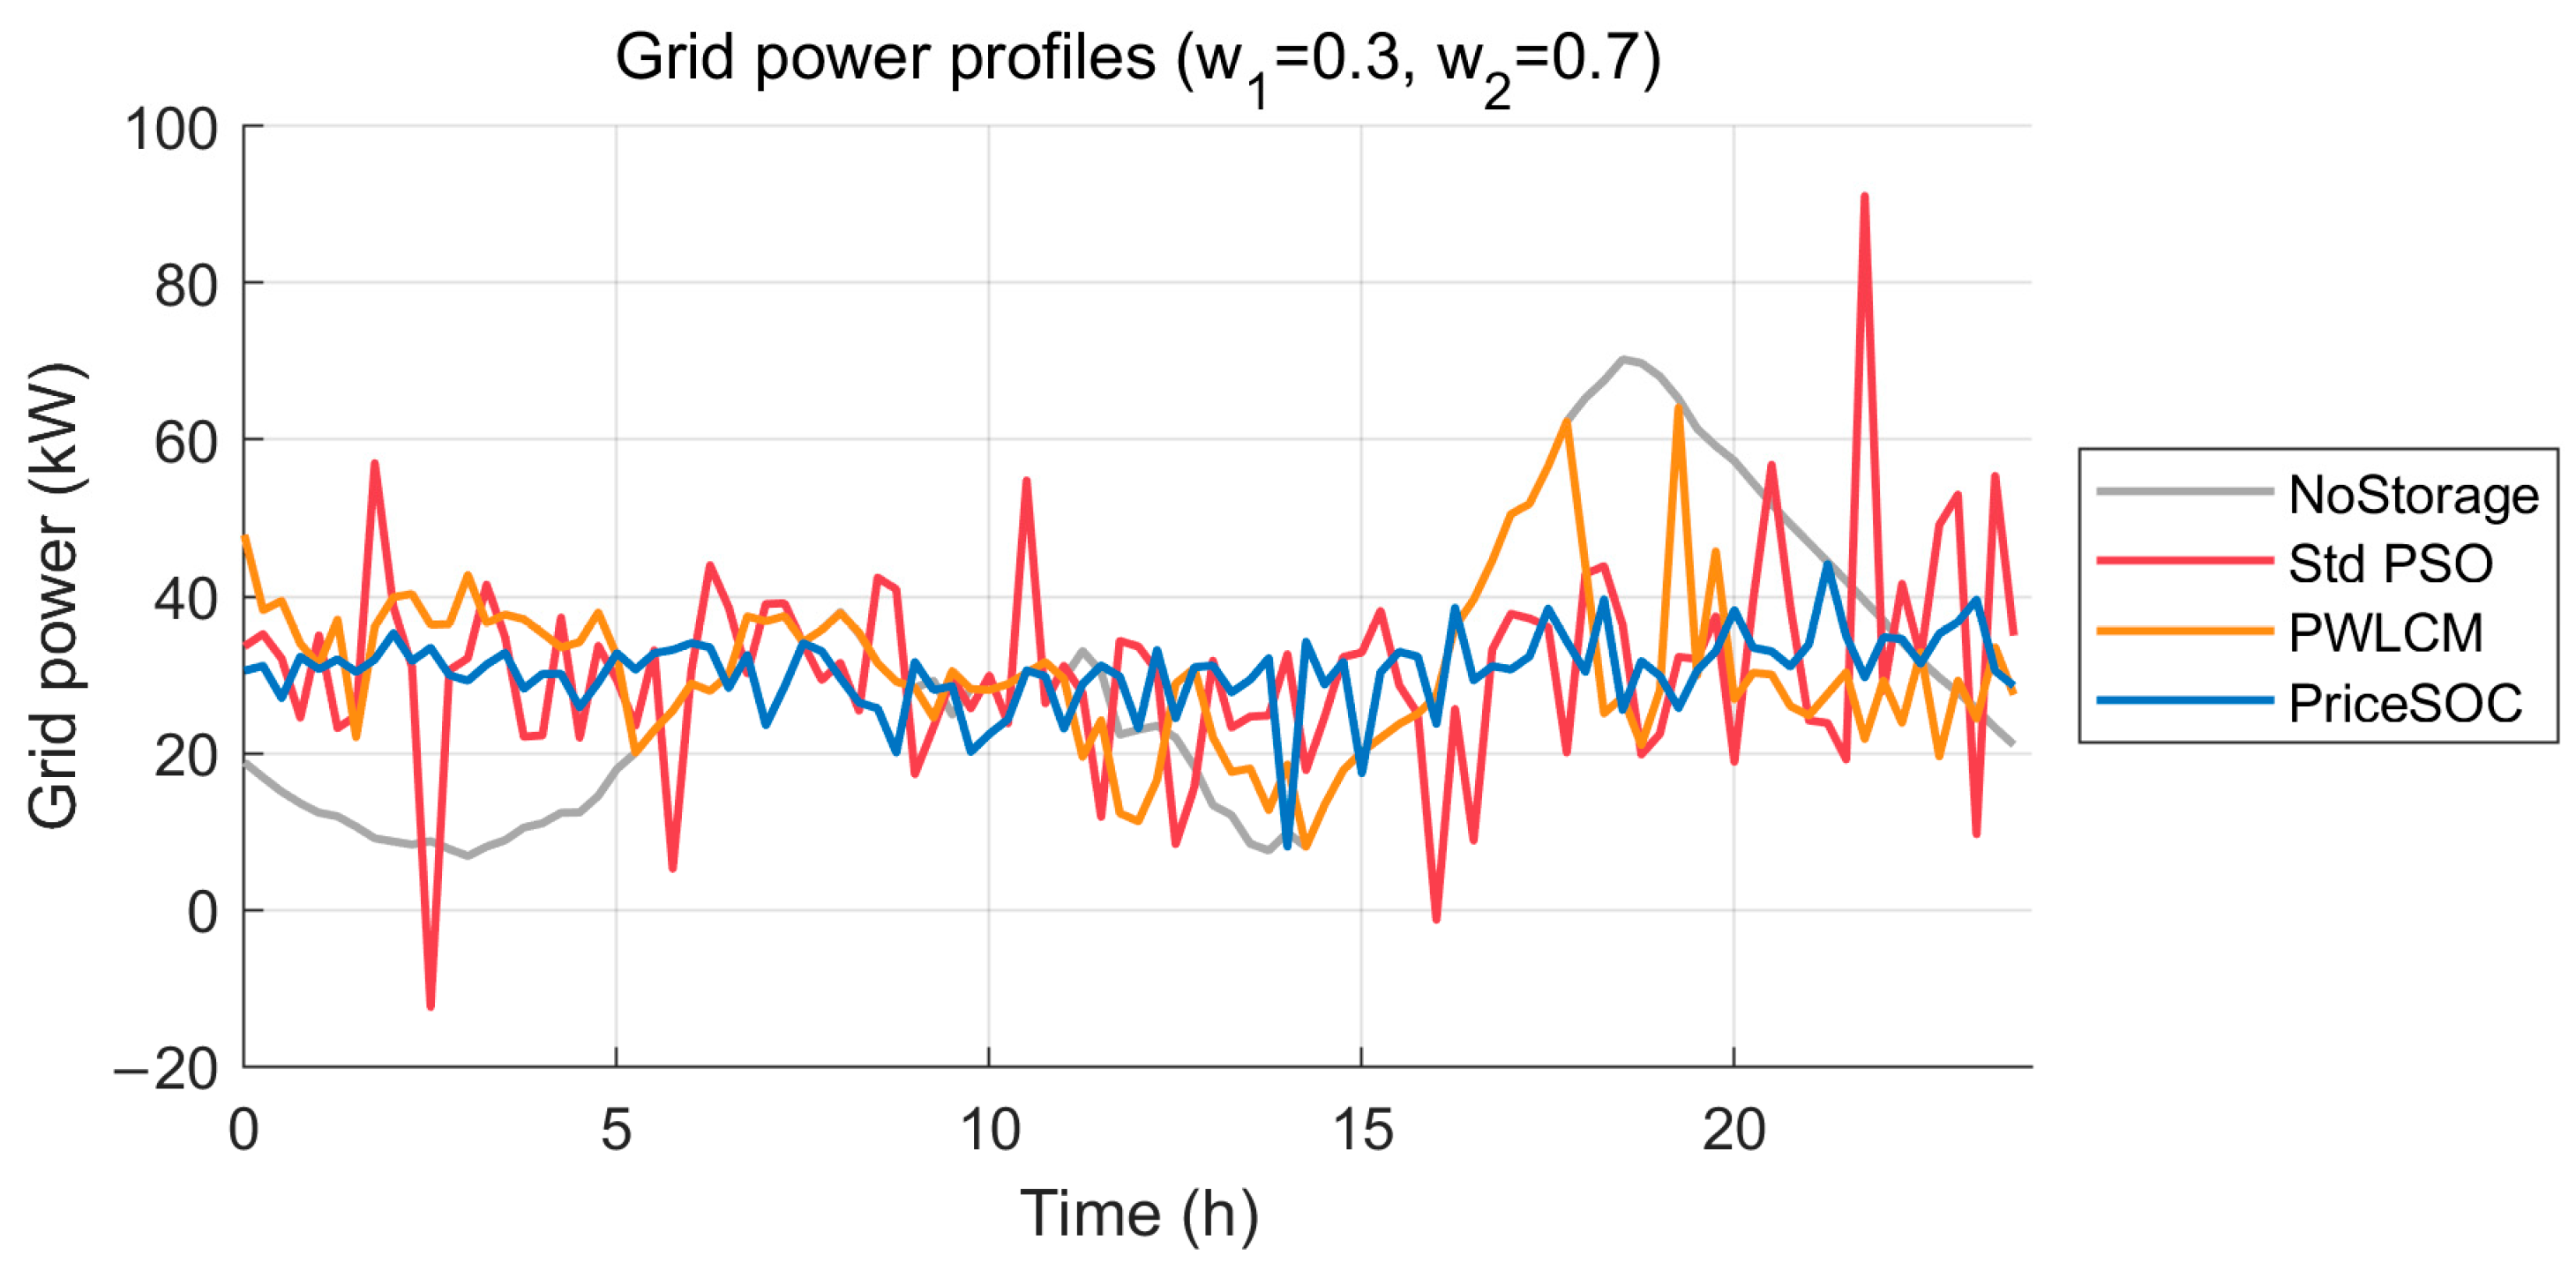
To intuitively compare the optimization effects of different initialization strategies on the temporal characteristics of grid-connected power at charging stations, Figure 5 presents the grid-connected power curves under four schemes including the no-energy-storage mode, standard PSO, PWLCM-PSO and PriceSOC-PSO, with the weight combination of w 1 = 0.3 and w 2 = 0.7 .
As illustrated in Figure 5, in the scenario without energy storage, the grid-connected power is directly determined by the difference between photovoltaic output and electric vehicle load, leading to drastically fluctuating curves. After introducing energy storage for optimal scheduling, all three PSO algorithms can mitigate grid-connected power fluctuations via peak shaving and valley filling of energy storage. Among them, standard PSO with random initialization achieves limited optimization performance, and several obvious sharp peaks still exist on the curve. The PWLCM chaotic initialization slightly improves the optimization results by enhancing population ergodicity and reducing burrs on the curve. The proposed PriceSOC-PSO in this paper delivers the most prominent fluctuation suppression effect. The all-day grid-connected power curve remains generally smooth, which effectively eliminates sudden power surges caused by load peaks.
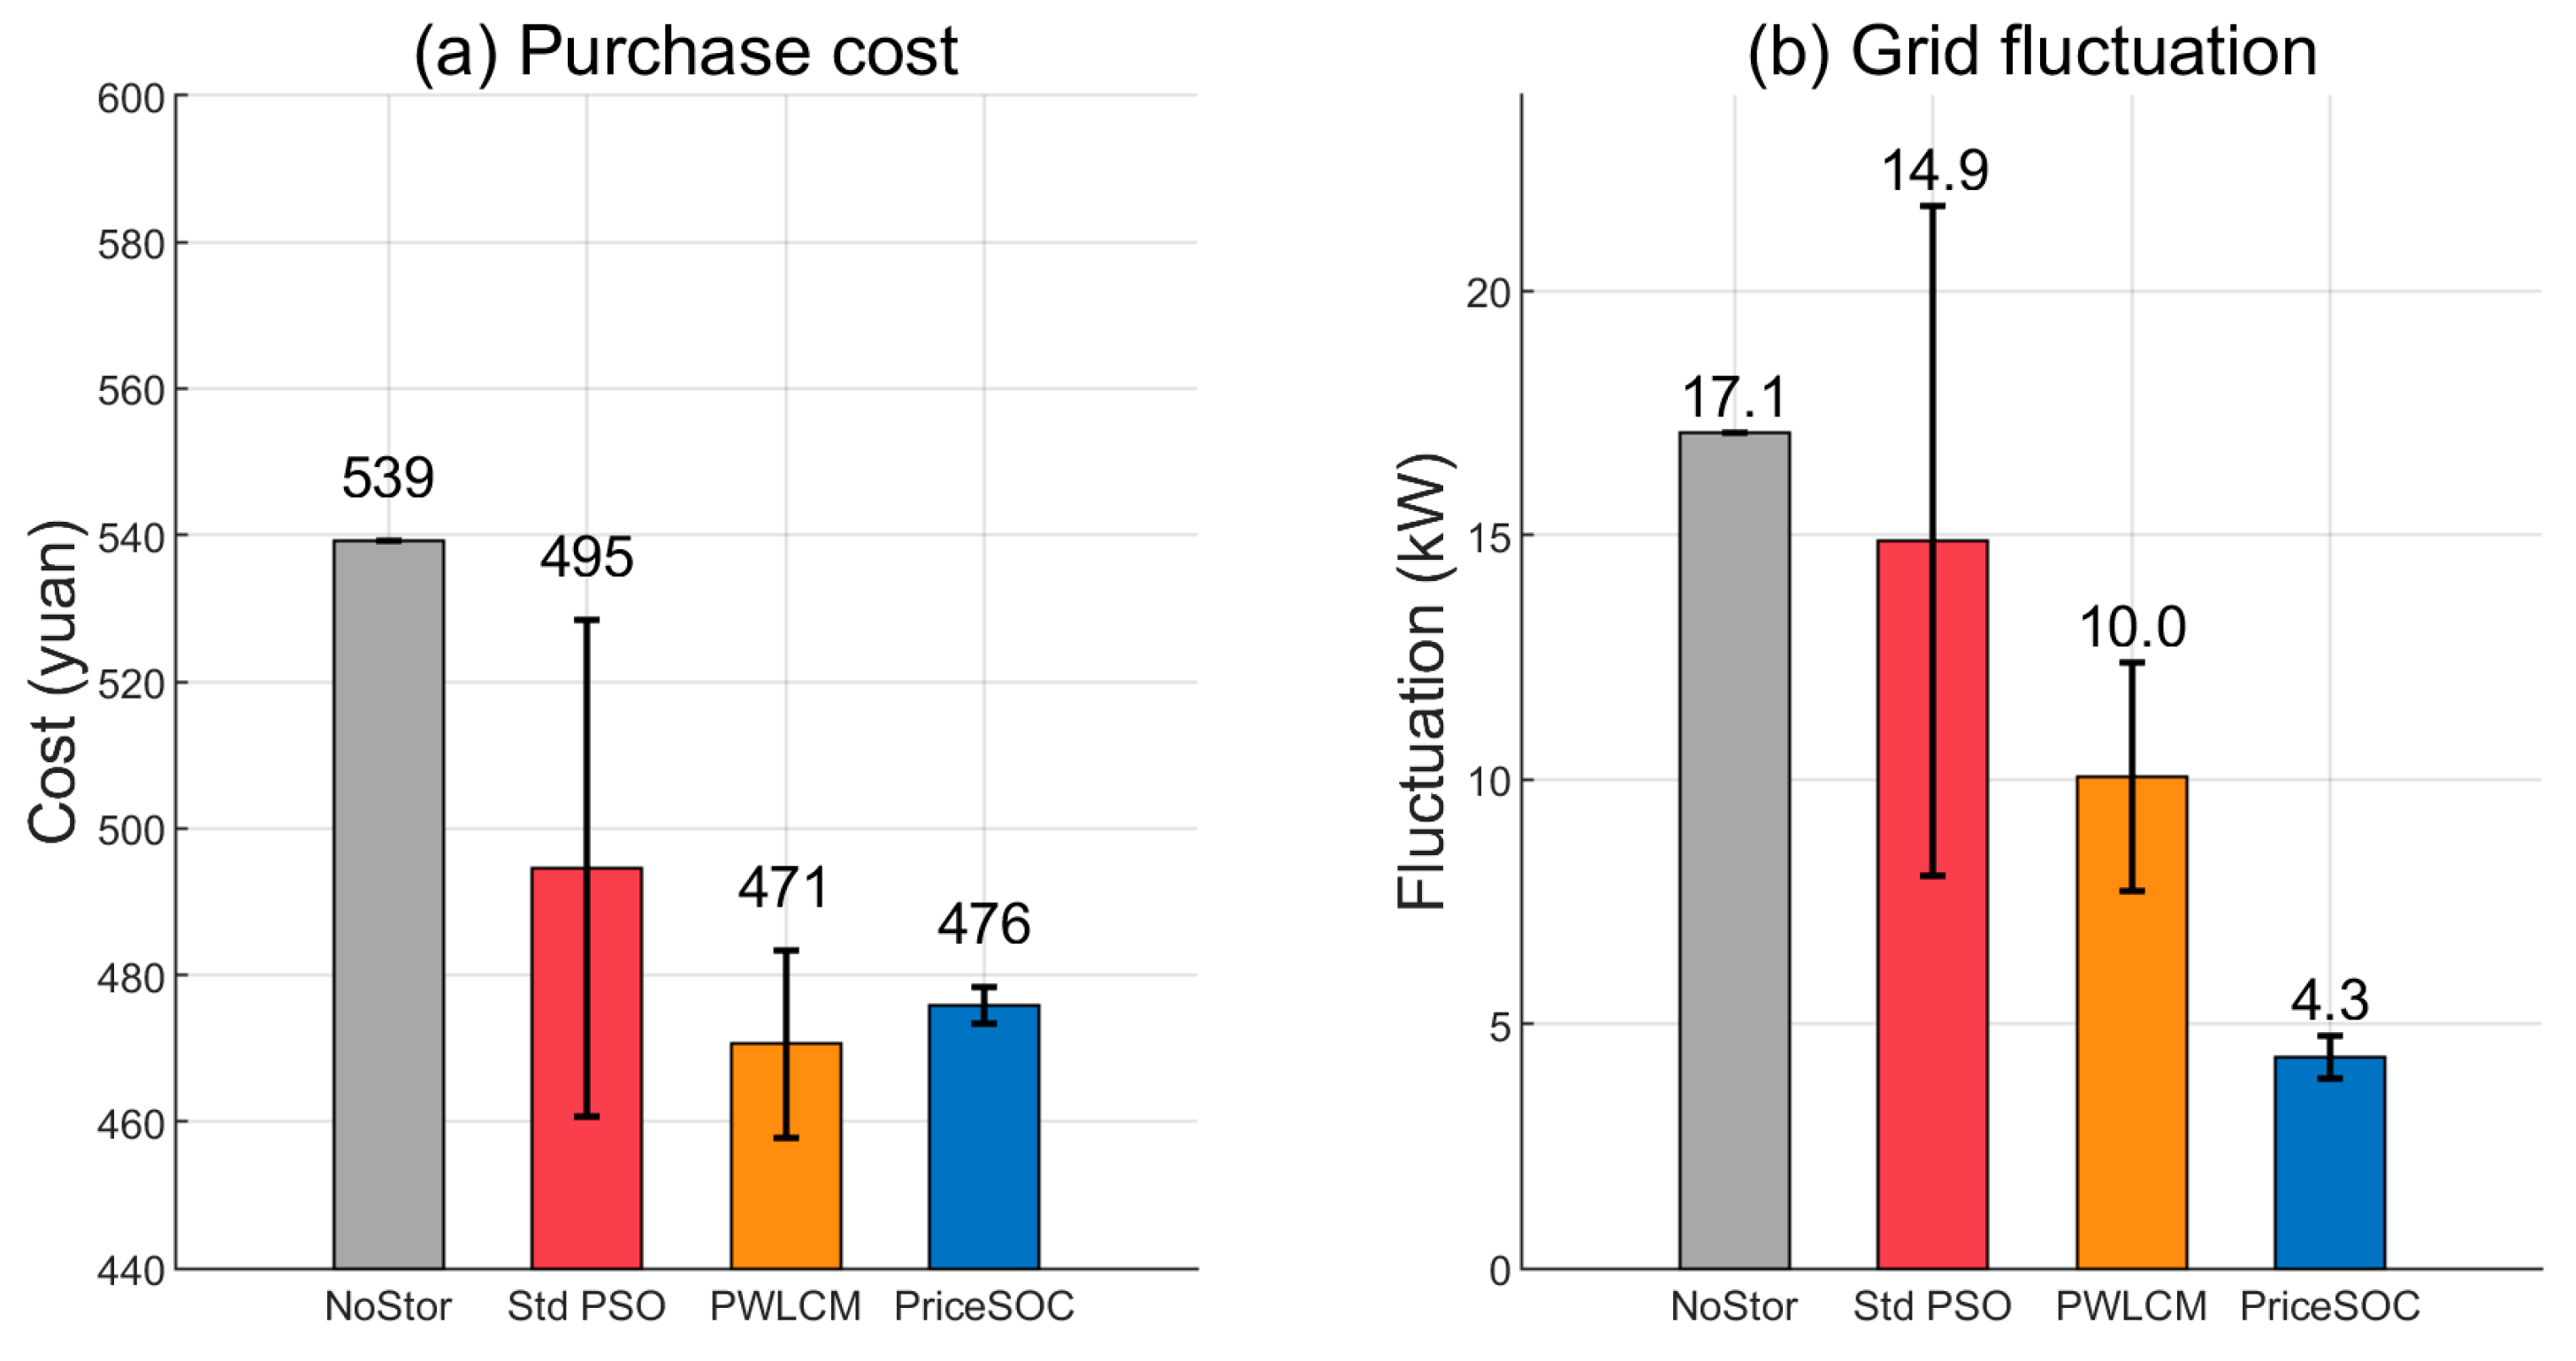
To quantitatively compare the optimization performance of different schemes in terms of economic benefit and grid-connection stability, Figure 6 illustrates the daily electricity purchase cost and grid-connected power fluctuation indicators under various scheduling strategies.
Figure 6 presents a statistical comparison of two indicators, namely economic performance and grid connection stability (mean values ± standard deviations obtained from multiple independent runs), with detailed numerical results listed in Table 2. In the case without energy storage, the daily net electricity purchase cost of the charging station reaches 539 CNY, and the standard deviation of grid-connected power is 17.1 kW, which corresponds to the highest operating cost and severest grid impact among all schemes. After energy storage-based optimal scheduling is adopted, both indicators are improved to varying degrees for the three PSO algorithms. The proposed PriceSOC-PSO achieves the optimal comprehensive performance, with an average daily electricity purchase cost of 476 CNY. Although this value is slightly higher than that of PWLCM-PSO (471 CNY), the proposed algorithm exhibits superior solution stability. Its average standard deviation of grid-connected power is merely 4.3 kW, outperforming the other four schemes.
It can be concluded that PriceSOC-PSO balances the requirements of economic scheduling and grid power smoothing and achieves the best comprehensive optimization performance. Meanwhile, the standard deviations of all indicators are extremely small, demonstrating its remarkably superior solution stability compared with the comparative algorithms.
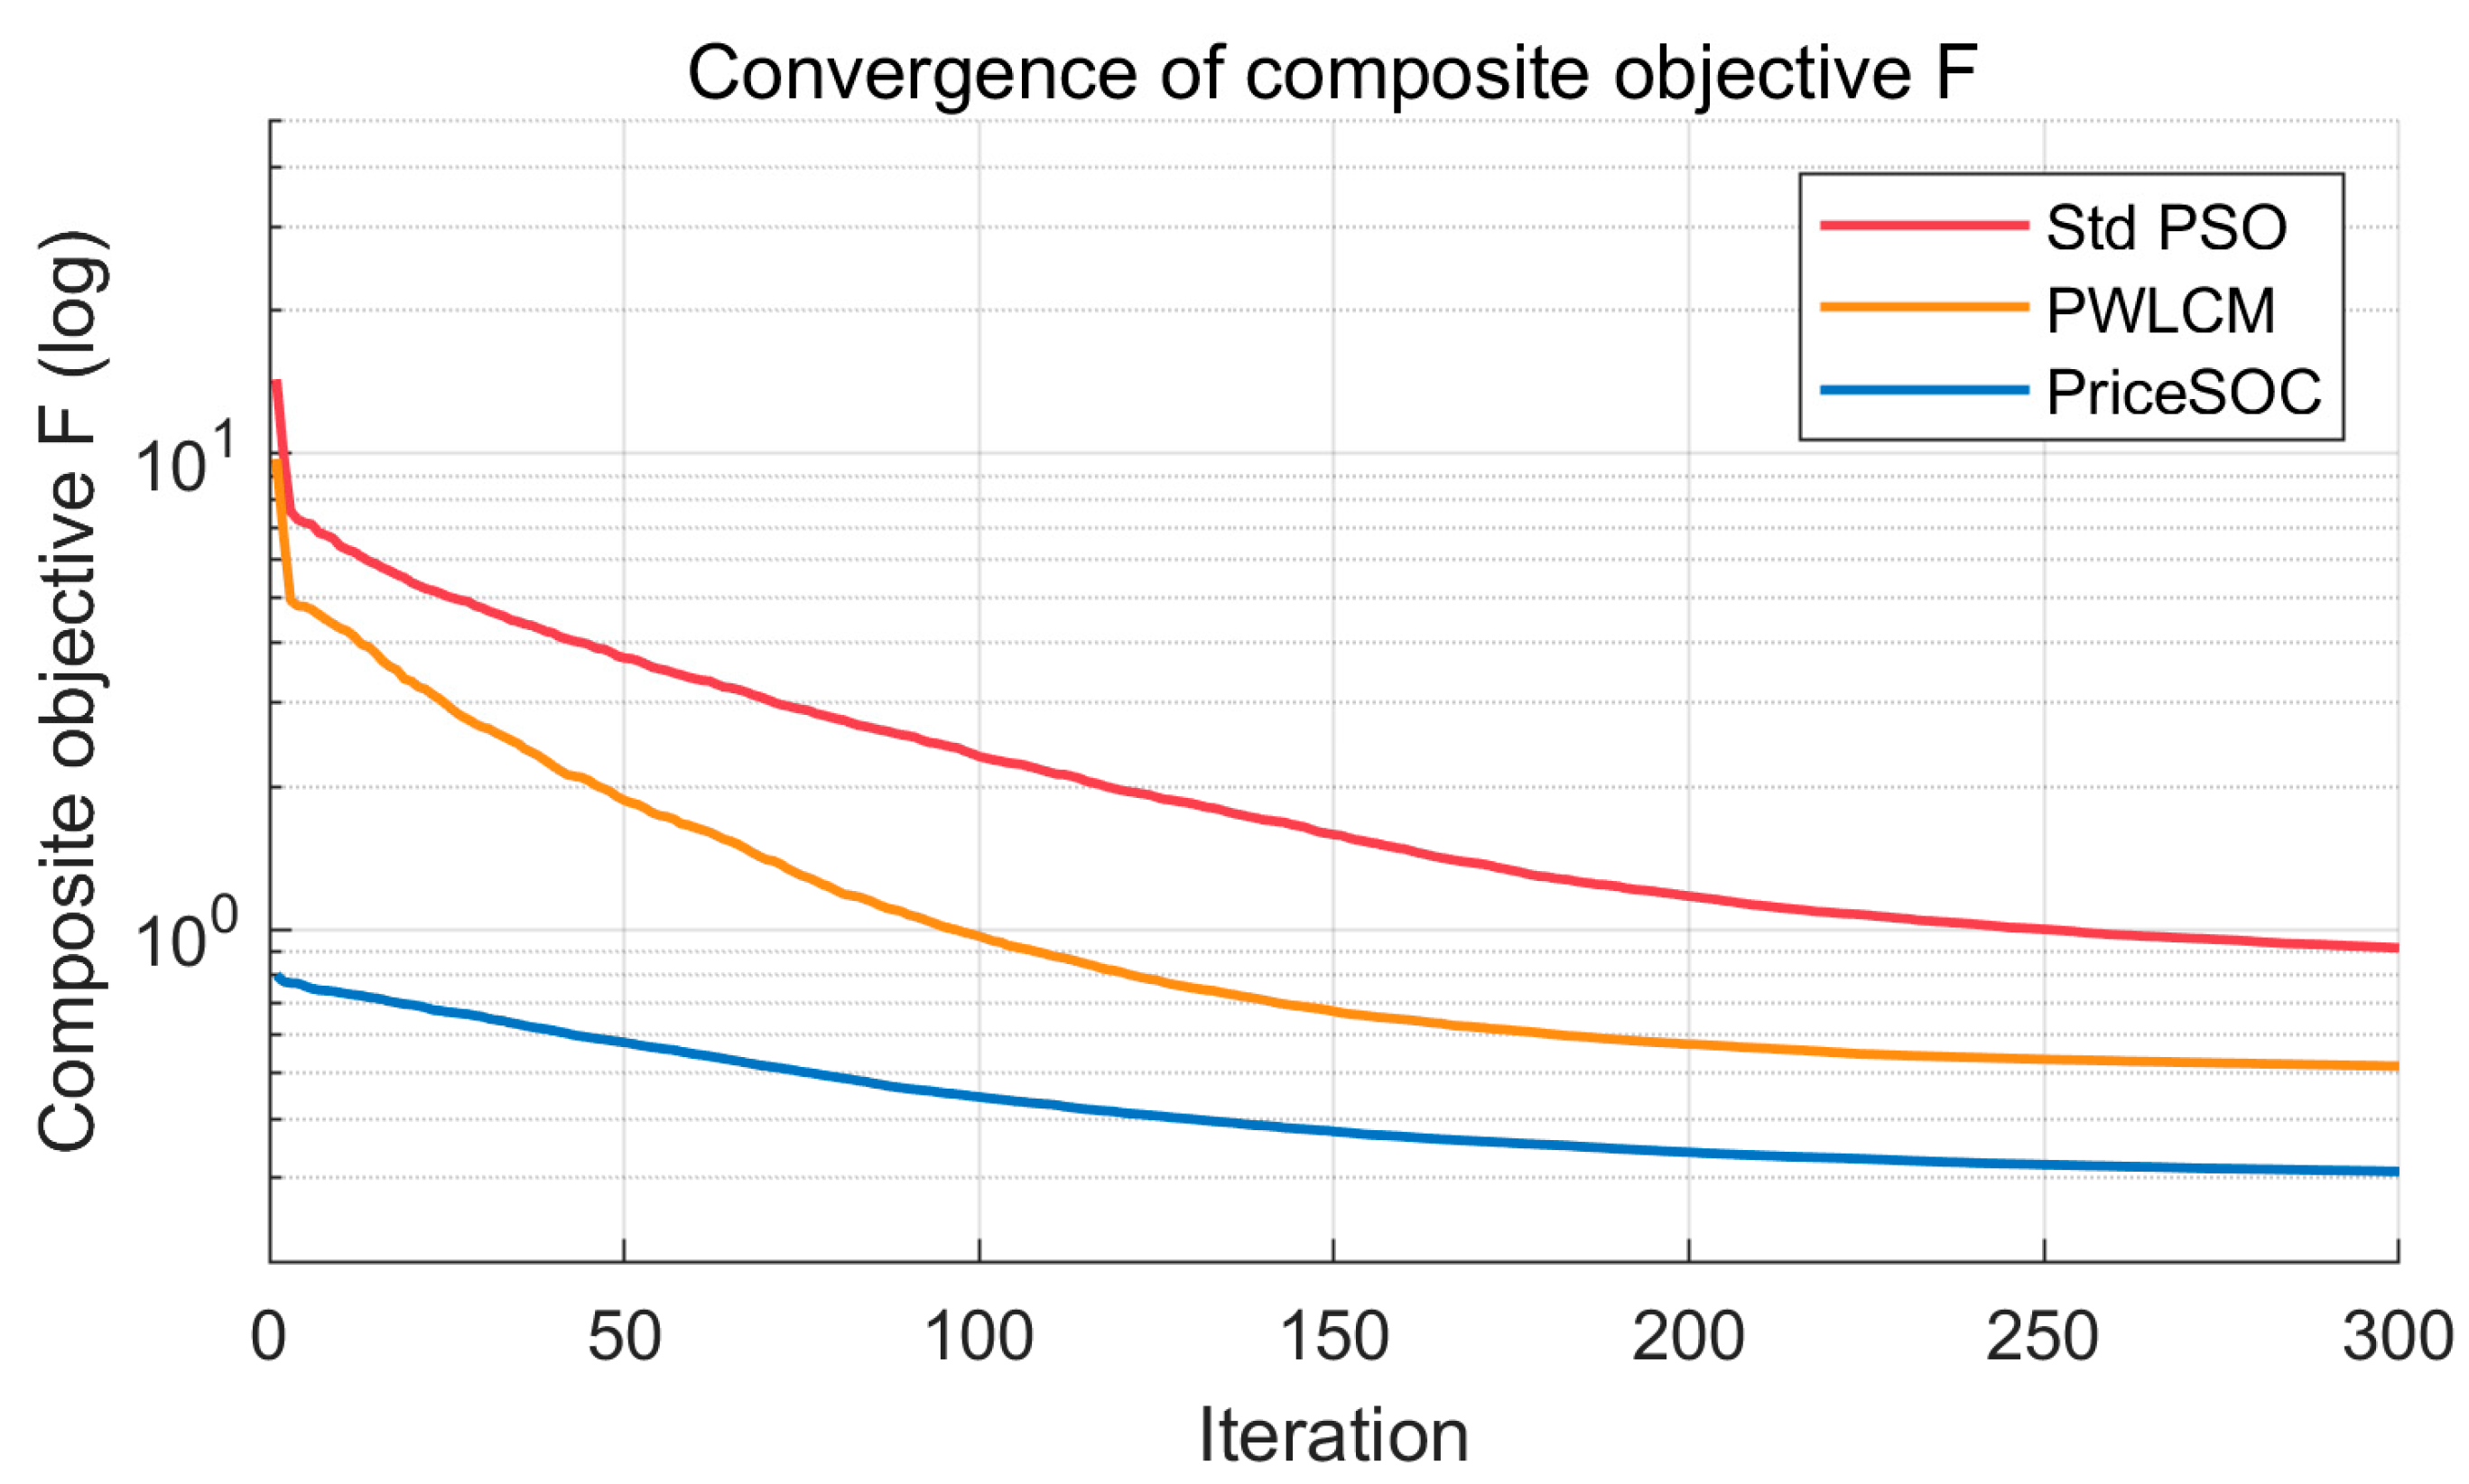
To verify the effect of the PriceSOC initialization strategy on the algorithm’s convergence performance, Figure 7 depicts the variation curves of the objective function value versus the iteration number under the three initialization strategies.
It can be observed from Figure 7 that the initial comprehensive objective values of standard PSO and PWLCM-PSO are relatively high, and a large number of iterations are required to gradually search and approach the region of high-quality solutions. In contrast, PriceSOC-PSO achieves the lowest initial comprehensive objective value among the three algorithms. This benefit stems from the electricity PriceSOC-guided initialization, which directly generates an initial population close to high-quality solution regions. Particles start searching in the vicinity of favorable solutions, so the algorithm converges to a lower steady-state objective value with fewer iterations.

4.3. Sensitivity Analysis of Objective Weight

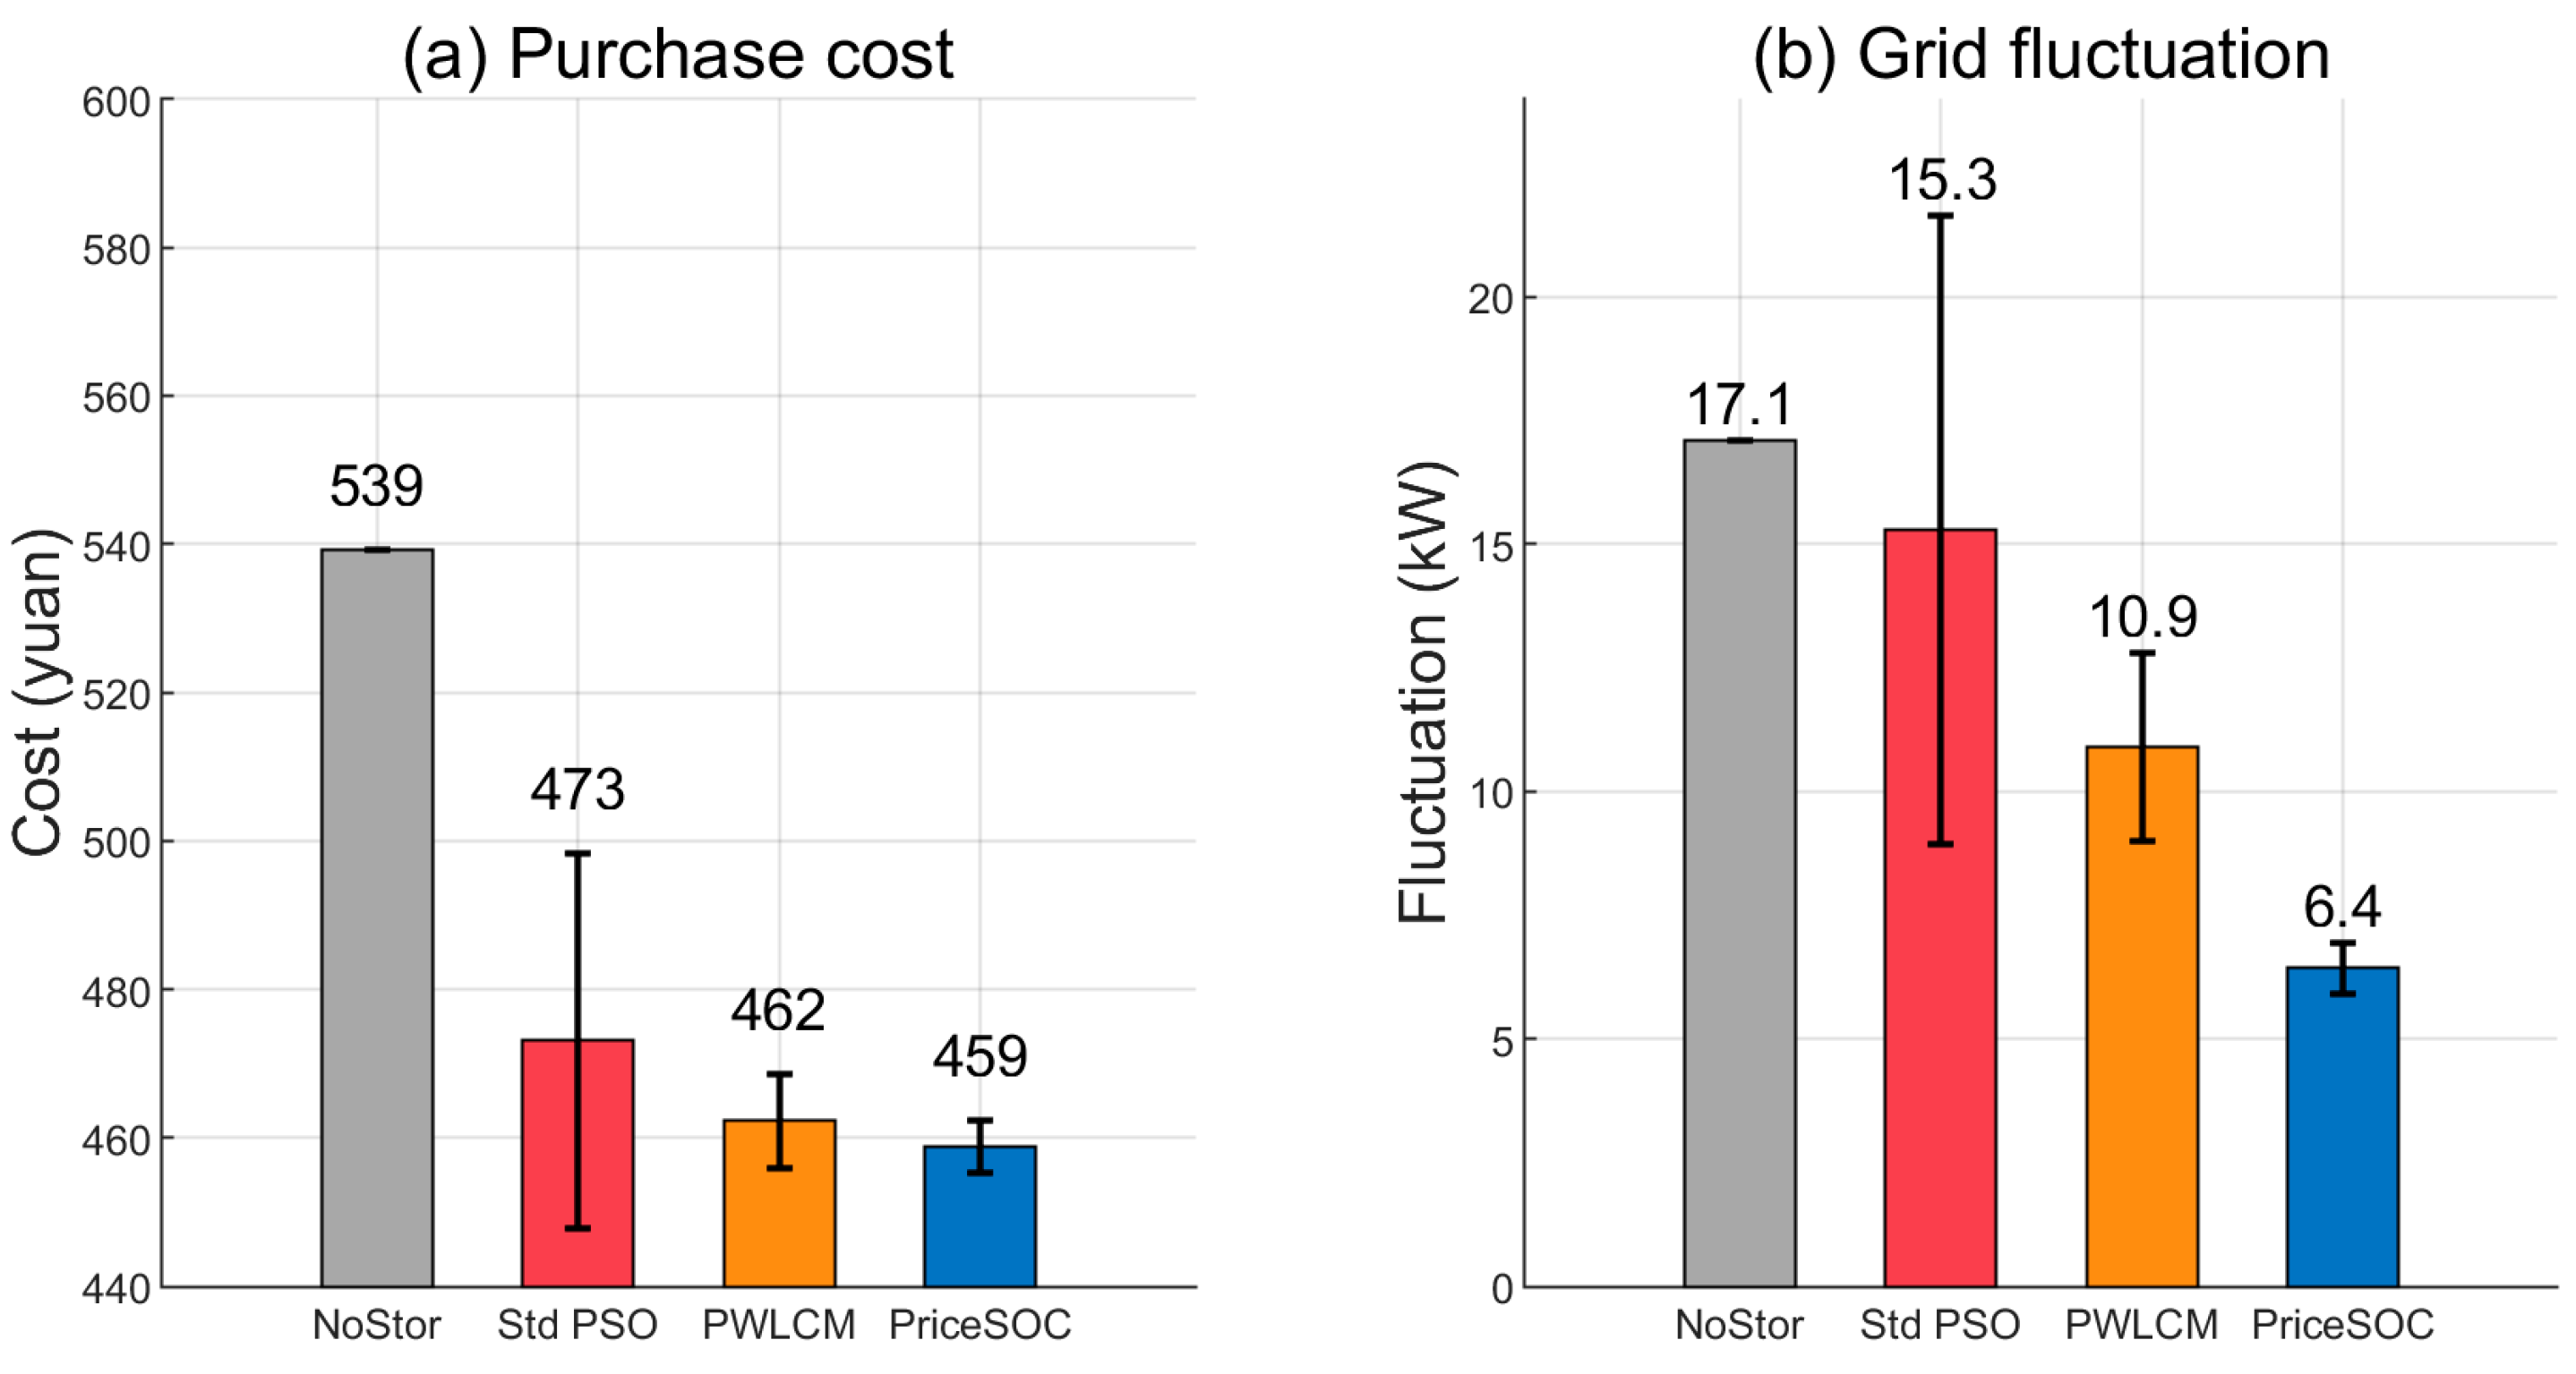
To verify the adaptability of the proposed scheduling strategy under different objective preferences, this section further carries out comparative analysis with the economic-oriented weight combination w 1 = 0.7 ,   w 2 = 0.3 . The corresponding quantitative indicators are shown in Figure 8.
A comparison of the main-case results shows that the average daily net electricity purchase cost of all schemes decreases after increasing the weight of the economic-performance indicator. For PriceSOC-PSO, the average cost drops to 459 CNY, while the grid-connected power fluctuation increases accordingly, rising from 4.3 kW to 6.4 kW.
Horizontal comparison among the three initialization strategies reveals that PriceSOC-PSO still outperforms random initialization and PWLCM chaotic initialization in terms of both daily electricity purchase cost and grid-connected power fluctuation after adjusting objective weights. This demonstrates that the performance improvement of the proposed electricity PriceSOC joint guided initialization strategy is independent of specific weight configurations. It possesses satisfactory robustness and can satisfy the scheduling demands of PV–storage–charging stations with diverse operational preferences.

4.4. Algorithm Comparison and Analysis

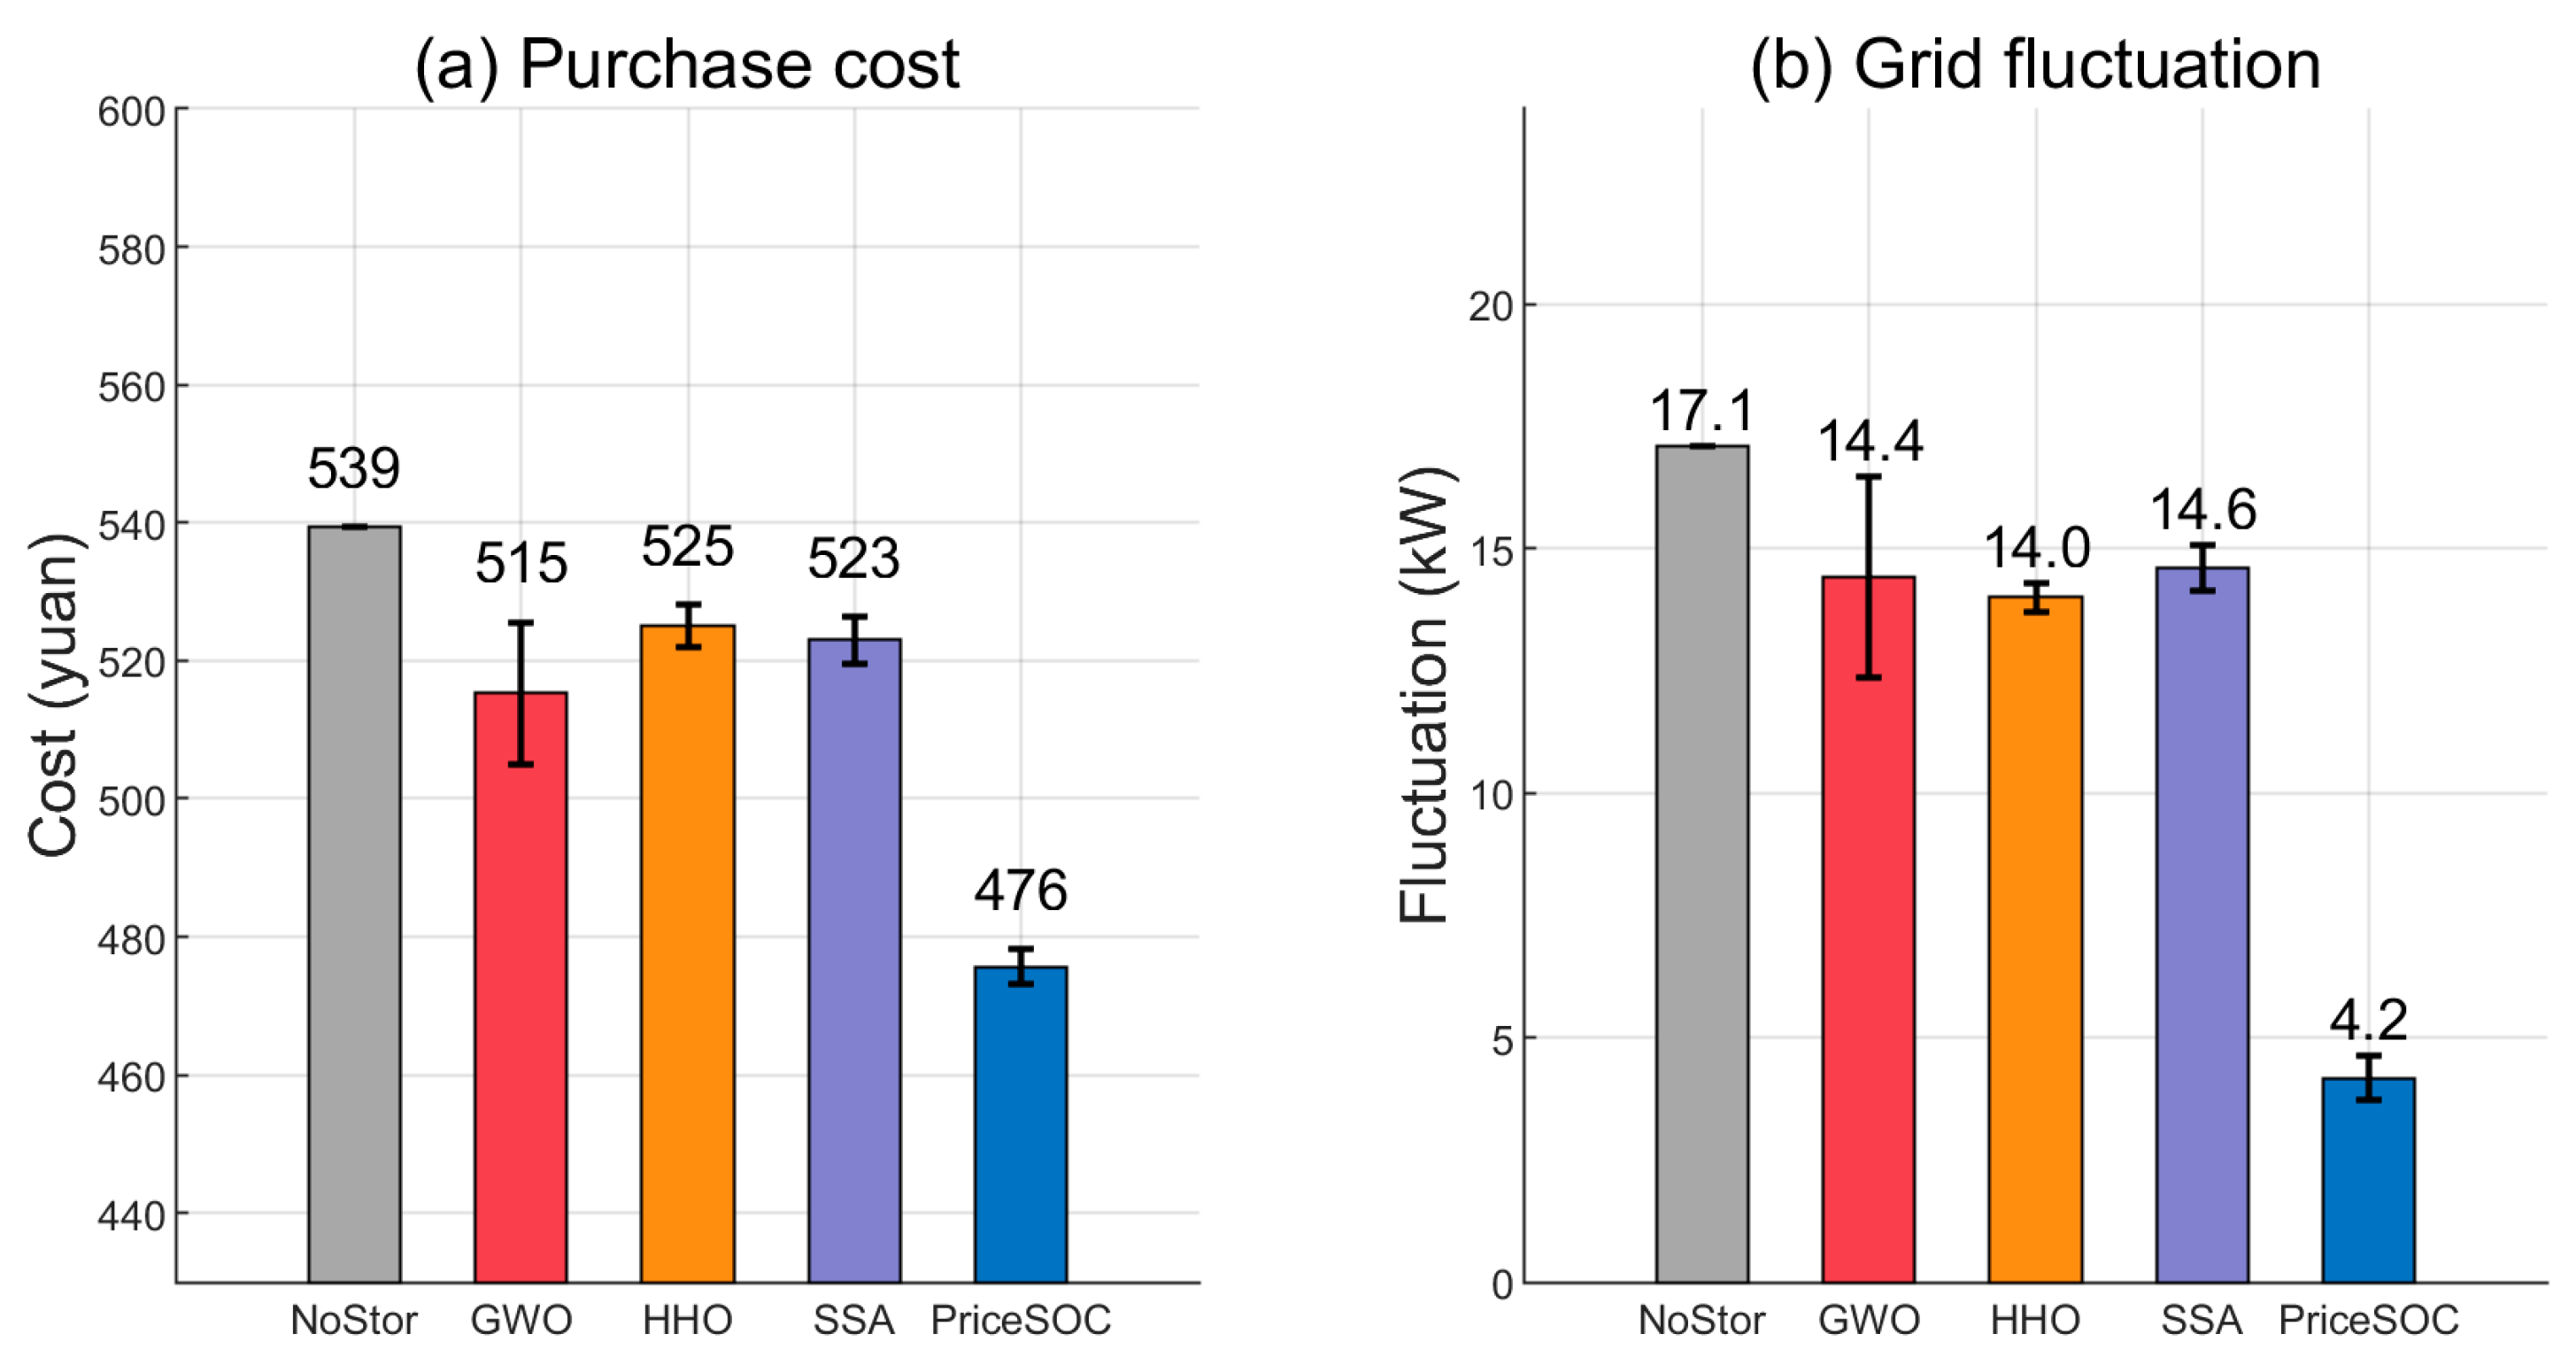
To further evaluate the performance of the proposed PriceSOC initialization strategy and to meet the common comparison requirements of mainstream optimization algorithms in recent years, three widely used metaheuristic algorithms, namely Grey Wolf Optimizer (GWO), Harris Hawks Optimizer (HHO), and the Sparrow Search Algorithm (SSA), are introduced for comparative analysis in this paper. The comparison results are presented in Figure 9 and Table 3.
Combined with the results in Figure 9 and Table 3, it can be seen that the three mainstream metaheuristic algorithms GWO, HHO and SSA can reduce the charging station’s electricity purchase cost and suppress grid-connected power fluctuations to a certain extent compared with the benchmark case without energy storage. However, their overall optimization performance is limited. In contrast to the above comparative algorithms, PriceSOC-PSO achieves substantial improvements in both reducing daily electricity purchase costs and smoothing grid-connected power. Meanwhile, the standard deviations of the two indicators remain at low levels, which verifies the effectiveness and superiority of the proposed algorithm for the optimal scheduling problem of photovoltaic–storage–charging integrated charging stations.

5. Conclusions and Outlook

This paper addresses the issues of high daily power purchase costs and severe grid-connected power fluctuations in PV–storage–charging integrated charging stations. A multi-objective optimal scheduling model that balances economic performance and grid-connected stability is established, and an electricity PriceSOC joint guided initialization strategy (PriceSOC) is proposed. The main conclusions are summarized as follows:
(1)
A dual-objective optimal scheduling model is constructed, aiming to minimize the daily power purchase cost and the grid-connected power fluctuation. The two objectives are transformed into a comprehensive objective function via a baseline-normalized linear weighting method, achieving coordinated optimization between economic operation and grid-friendly performance of the charging station.
(2)
The PriceSOC strategy is proposed based on the economic principle of “valley charging, peak discharging.” High-quality initial particles conforming to engineering characteristics are systematically generated through four steps: setting SOC guidance targets by time periods, constructing SOC guidance trajectories with random disturbances step by step, performing closed-loop smooth correction at the end, and inversely calculating energy storage power sequences from SOC trajectories. This approach improves algorithm convergence speed and solution quality from the perspective of population initialization, compensating for the deficiencies of existing knowledge-free improvement strategies.
(3)
Simulation analysis reveals that PriceSOC-PSO achieves superior comprehensive scheduling performance compared with the two traditional initialization schemes, regardless of whether the optimization target prioritizes grid stability or operational economy. The proposed algorithm possesses strong robustness to various operational preferences.
(4)
Comparative results with three mainstream metaheuristic algorithms including GWO, HHO and SSA demonstrate that PriceSOC-PSO obtains the optimal values in both daily electricity purchase cost and grid-connected power fluctuation. Meanwhile, the standard deviations of the two indicators remain at low levels, which verifies the effectiveness and superiority of the proposed method for the optimal scheduling of photovoltaic–storage–charging integrated charging stations.
It should be noted that the current work still has certain limitations. First, the day-ahead scheduling is conducted based on deterministic typical-day photovoltaic output and mean forecast curves of electric vehicle charging load, which is essentially a deterministic optimization that does not consider the forecast uncertainty of either PV output or charging load. When the actual output deviates from the predicted values, the robustness of the scheduling scheme needs to be improved. Second, the proposed strategy belongs to offline day-ahead optimization, and the communication delays and data acquisition lags between the charging station, the grid, and the energy storage system are not considered during the actual execution of the scheduling scheme; thus, there may be time deviations between the issuance and execution of dispatch commands. Third, the current framework adopts a fixed-time day-ahead optimization structure and lacks a real-time perception and online adjustment mechanism for intraday operating states, which still falls short in terms of real-time adaptability to actual charging station operation.
In response to the above limitations, future research can be carried out in the following directions: (i) introduce scenario-based methods, robust optimization, or distributionally robust optimization to characterize the uncertainty of PV output and EV charging load, thereby enhancing the robustness of the scheduling scheme under forecast deviations; (ii) consider engineering constraints such as communication delays and command execution lags, and explore lightweight, low-latency online scheduling algorithms to meet real-time operational requirements; (iii) combine rolling optimization frameworks such as model predictive control to integrate day-ahead scheduling with intraday rolling correction, thereby enabling online rolling updates of the scheduling strategy; and (iv) conduct practical verification through demonstration projects or hardware-in-the-loop tests in real charging station environments to validate the engineering applicability of the proposed method under realistic communication conditions and operating scenarios.

Author Contributions

Conceptualization, H.C. and S.W.; Methodology, H.C. and S.W.; Software, H.C.; Validation, H.C. and S.W.; Formal analysis, H.C.; Investigation, H.C.; Resources, X.L.; Data curation, H.C.; Writing—original draft, H.C.; Writing—review & editing, S.W. and X.L.; Visualization, H.C.; Supervision, S.W. and X.L.; Project administration, S.W.; Funding acquisition, S.W. All authors have read and agreed to the published version of the manuscript.

Funding

This work was supported by the 2023 Liaoning Science and Technology Department Joint Plan (Grant No.2023JH2/101700264).

Data Availability Statement

The data presented in this study are available on request from the corresponding author due to privacy.

Conflicts of Interest

Author Xiaoxiao Li was employed by the company Liaoning Energy Investment (Group) Co., Ltd. The remaining authors declare that the research was conducted in the absence of any commercial or financial relationships that could be construed as a potential conflict of interest.

References

  1. Yan, Q.; Yu, G.X. Review on microgrid of integrated photovoltaic-energy storage-charging stations. J. Electr. Power Sci. Technol. 2024, 39, 1–12. [Google Scholar]
  2. Zhang, Y.Q.; Niu, Z.Y.; Li, D.W. Application and economic analysis of integrated photovoltaic-energy storage-charging technology in urban charging stations. Electr. Power Energy 2025, 46, 303–306. (In Chinese) [Google Scholar]
  3. Kang, T.; Zhu, J.R.; Feng, C.R.; Fan, M.; Ren, L.; Tang, H.G. Research on ordered charging strategy for photovoltaic-energy storage-charging integrated communities. Power Syst. Prot. Control 2024, 52, 132–142. (In Chinese) [Google Scholar]
  4. Feng, X.; Zhang, C.L.; Cui, C.G.; Guo, F.H. Scheduling optimization of islanded photovoltaic-energy storage charging stations based on Stackelberg game. Power Syst. Technol. 2022, 46, 3989–4000. (In Chinese) [Google Scholar]
  5. Zhou, C.; Liu, S.; Guo, H.M.; Li, Z.; Shi, T. Bi-Level Optimal Operation Model of Photovoltaic-Energy Storage Charging-Swapping Stations Considering Interaction Between User Charging Load and Optimal Time-of-Use Electricity Price. Southern Power System Technology 2025. Available online: https://link.cnki.net/urlid/44.1643.TK.20250822.1225.008 (accessed on 10 July 2026). (In Chinese)
  6. Xu, T.Q.; Wang, S.B.; Zhao, H.J. Joint optimization strategy of distribution network considering photovoltaic accommodation and photovoltaic-energy storage-charging configuration. J. Electr. Eng. 2025, 20, 268–279. (In Chinese) [Google Scholar]
  7. Li, P.; Yu, T.Y.; Yu, B.; Zhou, C.W.; Meng, W. Optimal operation strategy of energy storage charging piles based on improved multi-objective particle swarm optimization algorithm. J. Nanjing Univ. Inf. Sci. Technol. 2024, 16, 817–826. (In Chinese) [Google Scholar]
  8. Li, Y.P.; Wang, H.L.; Zhang, Z.C.; Li, H.W.; Wang, X.L.; Zhang, Q.F.; Zhou, T.; Zhang, P.; Chang, F.X. Optimal scheduling of the wind-photovoltaic-energy storage multi-energy complementary system considering battery service life. Energies 2023, 16, 5002. [Google Scholar] [CrossRef] [Scilit]
  9. Fang, B.L.; Li, B.; Li, X.C.; Jia, Y.Z.; Xu, W.Z.; Liao, Y. Multi-objective comprehensive charging/discharging scheduling strategy for electric vehicles based on the improved particle swarm optimization algorithm. Front. Energy Res. 2021, 9, 811964. [Google Scholar] [CrossRef] [Scilit]
  10. Dong, A.; Lee, S.K. The study of an improved particle swarm optimization algorithm applied to economic dispatch in microgrids. Electronics 2024, 13, 4086. [Google Scholar] [CrossRef] [Scilit]
  11. Zhou, G.Z.; Ye, C.; Cheng, H.Y.; Zhang, S.L.; Liu, X. Multi-objective energy optimization for photovoltaic storage charging station. In Proceedings of the 2025 International Conference on Electrical Automation and Artificial Intelligence (ICEAAI), Guangzhou, China, 10–12 January 2025. [Google Scholar] [CrossRef] [Scilit]
  12. Chen, K.M.; Xiao, X.; Tian, P.G.; Feng, K.; Sun, P. Comprehensive optimization method for planning and operation of building-integrated photovoltaic and energy storage systems. Proc. Chin. Soc. Electr. Eng. 2023, 43, 5001–5012. (In Chinese) [Google Scholar] [CrossRef]
  13. Korab, R.; Połomski, M.; Naczyński, T. Optimal scheduling of energy storage and shiftable loads in grid-connected residential buildings with photovoltaic micro-installations. Energies 2024, 17, 5264. [Google Scholar] [CrossRef] [Scilit]
  14. Xu, Y.; Liu, J.; Cui, Z.; Liu, Z.; Dai, C.; Zang, X.; Ji, Z. Economic Scheduling Model of an Active Distribution Network Based on Chaotic Particle Swarm Optimization. Information 2024, 15, 225. [Google Scholar] [CrossRef] [Scilit]
  15. Huang, W.G.; Li, W.; Pan, X.W.; Liu, Q.M.; Yang, J. Enhanced particle swarm optimization with chaotic search for offshore micro-energy systems. Sci. Rep. 2025, 15, 1191. [Google Scholar] [CrossRef] [Scilit] [PubMed]
  16. Michailidis, P.; Michailidis, I.; Kosmatopoulos, E. Reinforcement Learning for Electric Vehicle Charging Management: Theory and Applications. Energies 2025, 18, 5225. [Google Scholar] [CrossRef] [Scilit]
  17. Chen, Y.; Xu, J. Solar and wind power data from the Chinese State Grid Renewable Energy Generation Forecasting Competition. Sci. Data 2022, 9, 577. [Google Scholar] [CrossRef] [Scilit] [PubMed]
  18. Liao, Y.C. Optimization strategy of electric vehicle charging load based on time-of-use electricity price. Mar. Electr. Electron. Technol. 2026, 46, 75–80. (In Chinese) [Google Scholar]
Figure 1. Typical daily PV-output curve.
Energies 19 04076 g001
Figure 2. EV-charging load curve.
Energies 19 04076 g002
Figure 3. Sensitivity analysis of traction coefficient.
Energies 19 04076 g003
Figure 4. Sensitivity analysis of perturbation amplitude.
Energies 19 04076 g004
Figure 5. Grid-connected power time-series diagram.
Energies 19 04076 g005
Figure 6. Dual-indicator comparative bar chart.
Energies 19 04076 g006
Figure 7. Comparison of convergence curves.
Energies 19 04076 g007
Figure 8. Dual-indicator comparative bar chart.
Energies 19 04076 g008
Figure 9. Comparison of results from different algorithms.
Energies 19 04076 g009
Table 1. Classification and parameters of electric vehicles.
Vehicle TypeProportionCharging Power (kW)
Private car40%7
Commercial vehicle60%60
Table 2. Performance comparison of different optimization strategies.
SchemeDaily Power Purchase Cost (CNY)Cost ReductionStd. Deviation of Grid-Connected Power (kW)Fluctuation Reduction
No-Storage53917.1
Standard PSO495 ± 348.2%14.9 ± 6.812.9%
PWLCM-PSO471 ± 1312.6%10.0 ± 2.341.5%
PriceSOC-PSO476 ± 311.7%4.3 ± 0.474.9%
Table 3. Comparative analysis of different algorithms.
SchemeDaily Power Purchase Cost (CNY)Cost ReductionStd. Deviation of Grid-Connected Power (kW)Fluctuation Reduction
No-Storage53917.1
GWO515 ± 104.5%14.4 ± 2.015.8%
HHO525 ± 32.6%14.0 ± 0.318.1%
SSA523 ± 33.0%14.6 ± 0.514.6%
PriceSOC476 ± 311.7%4.2 ± 0.475.4%
Disclaimer/Publisher’s Note: The statements, opinions and data contained in all publications are solely those of the individual author(s) and contributor(s) and not of MDPI and/or the editor(s). MDPI and/or the editor(s) disclaim responsibility for any injury to people or property resulting from any ideas, methods, instructions or products referred to in the content.