


Abstract
Floricultural residues represent a substantial and largely unvalorised organic stream in Europe, yet their anaerobic digestion has received limited attention. This study benchmarked the biochemical methane potential and degradation kinetics of Gerbera spp. flower residues (FRs), non-marketable apples (AW) and pig slurry (PS) under mesophilic batch conditions in mono-digestion and in five co-digestion mixtures. Mono-digestion yielded 362.5 ± 4.1 mLCH4·gVS−1 for FR, constrained by lignocellulosic recalcitrance and a high extractive content, and 320.9 ± 39.2 mLCH4·gVS−1 for AW, whose dispersion reflects the heterogeneity of non-marketable fruit; PS yielded 437.7 ± 2.6 mLCH4·gVS−1 and supplied the alkalinity that both plant residues lacked. The highest yield was obtained for the ternary mixture COAD_5 (0.30 PS, 0.45 AW, 0.25 FR on a VS basis), reaching 472.8 ± 8.6 mLCH4·gVS−1. This corresponds to a 29.1% increase over the theoretical additive potential (synergy index: 1.29 ± 0.07) and a gain of 8.0% over pig slurry mono-digestion. Once uncertainties were propagated, demonstrable synergy was confined to COAD_5 and to the binary mixture COAD_4. All treatments remained stable, with final pH between 7.40 and 7.86 and VFA-to-alkalinity ratios below 0.11. Kinetic modelling distinguished two regimes: first-order behaviour for the hydrolysis-limited and slurry-dominated substrates, and Modified Gompertz behaviour for the sugar-rich mixtures. Applied to the project site, these yields correspond to a preliminary gross scenario of the order of 481,000 Nm3 CH4·yr−1. The results establish that floricultural residues can be integrated into livestock-based anaerobic digestion without compromising process stability.
1. Introduction
Agricultural and agro-industrial intensification generates large volumes of organic waste. Valorising these streams supports the circular bioeconomy through renewable energy production, nutrient recycling, and greenhouse gas emission mitigation [1,2]. Anaerobic digestion (AD) has emerged as a widely implemented technology to achieve these goals, as it enables the conversion of biodegradable waste streams into biogas, a versatile renewable energy carrier, as well as into digestate, a nutrient-rich by-product suitable for agricultural application [3,4,5,6]. However, the efficiency of AD strongly depends on substrate composition, and mono-digestion of certain feedstocks can face significant limitations such as an imbalance in the carbon-to-nitrogen ratio (C/N), accumulation of inhibitory compounds, or insufficient buffering capacity [3,5,7]. These challenges have intensified interest in co-digestion approaches, where multiple substrates are combined to exploit complementary physicochemical and biochemical properties. The three residues examined in this work were not selected solely based on local availability, but because their limitations are mutually compensating: carbon-rich yet slowly degradable flower residues; readily fermentable yet poorly buffered apple waste; and nitrogen-rich, well-buffered pig slurry each supply what the other two lack. Their combination is therefore expected to correct the C/N imbalance of each individual stream, provide the alkalinity required to compensate for the acidification pulse from the fruit fraction, and accelerate the overall degradation kinetics relative to mono-digestion. This is the hypothesis that the present work sets out to test.
Intensive flower production in Europe generates significant residue streams, with Gerbera spp. cultivation losing 20–40% of fresh weight during processing [8]. Conventional disposal methods (e.g., landfilling and dumping) present environmental risks due to pesticide leaching and greenhouse gas emissions [9,10,11]. Although flower biomass is rich in organic matter [12], its high lignin content (2.9–27.8% w/w db) and secondary metabolites can inhibit AD microorganisms [13]. Despite these challenges, the substantial biomass availability and high organic content of flower residues make it a promising feedstock for renewable energy generation [12]. As the AD of ornamental flower residues has received limited research attention, this study evaluates Gerbera spp. flower residues in co-digestion for the first time.
Non-marketable apples, common in Europe due to post-harvest losses, are frequently used as a substrate for AD. Europe is a leading global producer of apples, and post-harvest losses account for a significant share of production [14,15]. Although their high moisture and sugar content allow high biodegradability and rapid fermentation potential, their mono-digestion often leads to volatile fatty acid (VFA) accumulation and process destabilisation [16]. In co-digestion, apple waste provides a readily degradable carbon source that complements recalcitrant or inhibitory feedstocks, enhancing methane yields and reducing lag phases.
Pig slurry is a common anaerobic digestion (AD) substrate in Europe, which hosts around 148 million pigs [17]. While its methane potential is moderate, it provides buffering capacity, essential nutrients (notably nitrogen and trace elements), and an active microbial inoculum [18,19,20]. Consequently, it acts as a stabilising matrix when co-digested with more labile or inhibitory substrates, mitigating pH fluctuations and improving process robustness [21].
Although co-digestion of fruit waste and animal manure is relatively well documented, flower residues are underrepresented in the literature. No systematic studies have explored their biogas potential combined with fruit waste and slurry, nor has kinetic modelling been applied to elucidate the degradation dynamics of such mixtures. This gap is relevant given the volume of floriculture residues in Europe and the need for valorisation strategies aligned with EU directives and renewable energy targets [22,23,24]. Furthermore, research mostly focuses on mono-substrate kinetics rather than multi-sector integration (livestock, fruit producing, and floriculture). Table 1 summarises the recent literature on flower residue AD.
Table 1.
Literature data on anaerobic digestion of flower residues, including digestion regime, co-substrate, BMP, and kinetic models applied.
This study supports a decentralised energy project in Portugal, in which a pig farm co-digests slurry with neighbouring flower and fruit waste [34]. This integration is intended to establish a renewable energy community under the EU RED III directive, allowing the farm to act as a prosumer by trading excess electricity locally to improve economic returns compared to standard grid injection [35,36].
The valorisation of these residues is not solely an energy question. Flower and fruit production, livestock rearing, and the management of the resulting organic streams are territorially co-located and interdependent, and decisions taken in one sector constrain the others. The present work addresses the energy dimension of that interdependence experimentally, whereas the water and nutrient dimensions are referred to qualitatively as context and are not assessed here.
To establish biological baselines for a future pilot reactor, this study evaluates the methane potential and degradation kinetics of co-digesting floricultural residues, fruit waste and pig slurry. Specifically, the objectives were to: (i) characterise the physicochemical properties of the individual feedstocks; (ii) determine the biochemical methane potential under mono- and co-digestion regimes; (iii) quantify synergistic or antagonistic effects; (iv) describe the methane production dynamics through kinetic modelling; and (v) establish a preliminary farm-scale mass and energy balance for the best-performing mixture.
2. Materials and Methods
2.1. Substrates and Inoculum
Fresh Gerbera spp. residues were supplied by an industrial producer of ornamental flowers (Montijo, Portugal) on the day of harvest. The residues were sun-dried to constant weight and double-milled in a knife mill through 30-mesh and 40-mesh grates. This preparation follows standard BMP practice [37,38], which requires size reduction of solid substrates to permit representative subsampling into small-volume bottles and to remove particle size as a confounding variable, so that the assay measures the ultimate methane potential under non-limiting conditions; drying additionally allowed the material to be stored without degradation between harvest and assay. The purpose of the preparation was therefore analytical comparability, not the simulation of full-scale feeding conditions. The prepared material was stored in airtight containers until use and designated as “FR”.
Non-marketable apples (AW) were provided by a commercial fruit and vegetable producer (Lourinhã, Portugal). They were processed immediately after delivery, ground to a fine pulp in a laboratory blender, and used directly in the experiments.
Pig slurry (PS) was obtained from a commercial closed-cycle pig farm housing around 4000 animals (Alcácer-do-Sal, Portugal). The PS treatment system comprises a storage tank, a solid–liquid separator, and a lagoon system. The sample was collected from the storage tank, which received and mixed PS flows from the various animal housing units. The slurry was homogenised using a blender without filtration or solid–liquid separation and stored at 4 °C until use.
The inoculum consisted of digestate collected from a full-scale anaerobic digester treating mixed sludge operating under mesophilic conditions in a municipal wastewater treatment plant in the Lisbon area (Portugal). This facility serves approximately 700,000 inhabitants, with a treatment capacity of 70,000 m3·d−1. The inoculum was previously degassed for 5 days at 37 °C to reduce residual biogas production [37,38].
2.2. Experimental Setup of Batch BMP Assays
Batch biochemical methane potential (BMP) assays were conducted using an Automatic Methane Potential Test System (AMPTS 3, BPC Instruments, Lund, Sweden). The system comprised 18 Schott reactors with 1 L total volume and 0.7 L working volume, each connected to an individual CO2 and H2S absorption unit, consisting of a 250 mL bottle containing 200 mL of 3 M NaOH with 0.4% (w/v) thymolphthalein as a pH indicator, allowing selective measurement of methane [39]. All reactors were continuously stirred at 125 rpm and maintained at mesophilic temperature (37 ± 1 °C) in a thermostatic bath. All assays had an initial organic concentration of 17 gVS·L−1 [37] and an inoculum-to-substrate ratio (ISR) fixed at 2 (based on VS). The assays were terminated when the daily methane production fell below 1% of the cumulative production [37]. This was verified for every treatment. For the flower residues, the daily production corresponded to 0.97% and 0.51% of the cumulative volume on days 17 and 18 respectively. The daily increments recorded over the final three days of the assay are reported for all treatments in Table S2.
Biogas volume for each reactor was continuously recorded by the AMPTS using a calibrated gas displacement flow cell (9 mL, BPC Core, BPC Instruments, Lund, Sweden), auto-logged into a computer (Aurora software v.1.2.6, BPC Instruments, Sweden), and normalised internally by the system software to Standard Temperature and Pressure (STP: 0 °C, 101.325 kPa) on a dry gas basis. Methane yields were blank-subtracted according to Equation (1):
where Vsample is the cumulative methane volume produced by the test reactor (mL), Vblank is the mean cumulative methane volume of the triplicate blank reactors (mL), and VSsubstrate is the mass of substrate volatile solids loaded (g).
Each assay was conducted in triplicate. All reactors were previously purged with N2 to ensure anaerobic conditions. A blank control (inoculum only) and a reference substrate control (microcrystalline cellulose, Sigma-Aldrich) were included for validation. The cellulose control yielded 403.2 ± 6.8 mLCH4·gVS−1, corresponding to 97.4% of the theoretical value of 414 mLCH4·gVS−1 and thus satisfying the validity criterion of ≥85% recommended by Holliger et al. [38].
The experimental design included mono-digestion and co-digestion assays of flower residues, non-marketable apples, and pig slurry. Substrate mixtures were prepared at varying VS-based ratios, as detailed in Table S1. The five mixtures were defined on the basis of the substrate quantities expected to be available at the project site and of preliminary carbon-to-nitrogen considerations, spanning binary and ternary combinations across a C/N range of 19 to 33. They do not constitute a formal mixture design, and the composition space was therefore sampled at five points rather than systematically.
2.3. Sample Characterisation and Analytical Parameters
Initial characterisation of substrates included measurements of total solids (TS), volatile solids (VS), pH, electrical conductivity (EC), lignin content (Klason and soluble), total Kjeldahl nitrogen (TKN), ammonium nitrogen (NH4+-N), total organic carbon (CORG), and C/N ratio. The inoculum was characterised for TS, VS, EC, and pH. The digestates were further assessed for VFAs and total alkalinity.
Determination of TS, VS, TKN, and NH4+-N analytical methods followed standard APHA procedures [40]. pH and EC were determined using a benchtop metre (Horiba, Laqua WQ-330, Kyoto, Japan) fitted with temperature-compensated probes. Total organic carbon (CORG) was calculated according to Cuetos et al. [41], and carbon-to-nitrogen ratio (C/N) by dividing CORG by TKN. Total extractives were quantified following TAPPI standard methods: solvent extraction with dichloromethane, ethanol, and water for 16 h each in a Soxhlet apparatus [42] and total lignin as the sum of Klason [43] and soluble lignin, measuring the absorbance of the hydrolysate in a spectrophotometer at 205 nm [44]. The lignin content was corrected for extractives and ash content. All characterisations were performed in triplicate using analytical-grade reagents (≥99% purity).
2.4. Data Modelling and Statistical Analysis
Statistical analyses and graphical representations were performed in Python 3.9, using the NumPy (v2.2.4), pandas (v2.2.3), SciPy (v1.15.2) and statsmodels (v0.14.6) libraries for data processing and statistical testing, and Matplotlib (v.3.10.1) for visualisation. Kinetic model fitting was carried out separately in Microsoft Excel, as described in Section 2.4.6.
The cumulative methane production data obtained from BMP assays were fitted using three widely applied nonlinear models: the Modified Gompertz Model (MGM), the First-Order Kinetic Model (FOKM) with a lag phase, and the dual-pool First-Order Kinetic Model (DP) with a lag phase.
The evaluation of synergistic or antagonistic effects in co-digestion mixtures was performed by comparing the experimental methane yield with the theoretical methane yield calculated according to Section 2.4.2 (Equation (2)).
2.4.1. Data Pre-Processing and Statistical Analysis
Experimental data were screened for anomalies using a relative standard deviation (RSD) threshold of 10% as a trigger for investigation, rather than as an acceptance criterion [38]. Replicates were excluded only where a technical failure could be independently confirmed. One reactor from the apple waste treatment was excluded on this basis: gas registration ceased after day 8, having followed the same trend as the other replicates until that point, and a defective fitting was subsequently identified upon inspection. No other observations were removed, and the apple waste treatment is therefore reported as the mean of two replicates, and all other treatments as the mean of three.
Differences in BMP between the mono-digestion and co-digestion assays were evaluated using a One-Way Analysis of Variance (ANOVA) after assessing homogeneity of variances using Levene’s test. Upon detection of unequal variances (p < 0.05), Welch’s ANOVA was employed, followed by a Games–Howell post hoc test for pairwise comparisons. Statistical significance was established at a confidence level of 95% (p < 0.05), and results were grouped using a Compact Letter Display (CLD), where substrates sharing the same letter were not statistically different.
2.4.2. Assessment of Co-Digestion Synergy
To evaluate the additive/synergistic/antagonistic effect of co-digestion, the experimental methane potential of the CO-AD mixtures was compared to the theoretical additive potential (BMPtheo), calculated according to Equation (2):
where fi is the VS fraction of substrate i in the mixture, and BMPi is the ultimate methane yield of the mono-digestion assays (mLCH4·gVS−1). The synergy index (SI) was quantified according to Equation (3):
where BMPexp (mLCH4·gVS−1) is the measured BMP of the CO-AD mixture and BMPtheo is the same as in Equation (2). Values of SI > 1 indicate synergistic enhancement of methane production, SI < 1 indicates antagonism, and SI ≈ 1 suggests additive behaviour. The synergy index quantifies the deviation from additive behaviour and is therefore not equivalent to the gain relative to the best-performing single substrate, which is reported separately as the relative difference between the mixture yield and the highest mono-digestion yield. The standard uncertainty of the synergy index was obtained by first-order propagation of the standard deviations of the mono-substrate and mixture yields through Equations (2) and (3), assuming independent errors. Synergy or antagonism was considered demonstrated only when the interval SI ± 2u excluded unity; mixtures for which it did not were described as behaving additively within experimental uncertainty. In addition, observed kinetic parameters (rate constants and lag phase) for the mixture were qualitatively compared with the weighted averages of the mono-digestions to assess potential synergistic effects on degradation dynamics.
2.4.3. Modified Gompertz Model
The Modified Gompertz equation is frequently used to describe microbial growth-associated processes in anaerobic digestion [45,46]. It is given by Equation (4).
where M(t) is the cumulative methane yield (mL·gVS−1) at time t (days), Mmax is the methane production potential (mL·gVS−1), Rmax is the maximum methane production rate (mL·gVS−1·day−1), λ is the lag phase duration (days), and e is Euler’s number.
2.4.4. First-Order Kinetic Model
To account for hydrolysis-limited degradation, data were also fitted to a First-Order Kinetic Model with a lag phase [45,46,47] (Equation (5)):
where kh (day−1) is the apparent first-order hydrolysis rate constant and the other terms are as defined above for Equation (4).
2.4.5. Dual-Pool First-Order Model with Lag
In addition to the single-pool models, the experimental data were fitted to a dual-pool First-Order Kinetic Model with a lag phase, which accounts for substrates comprising fractions with different biodegradability [45,46,47]. This model assumes that cumulative methane production arises from two distinct substrate pools: a rapidly degradable fraction (α) and a more recalcitrant fraction (1 − α), each with its own first-order degradation rate constant [47]. The model is expressed by Equation (6).
where Mmax is the ultimate methane potential (mLCH4·gVS−1); α is the fraction of the substrate that is readily degradable (dimensionless, 0–1); k1 and k2 are the first-order rate constants of the fast and slow pools (day−1), respectively; and λ is the lag phase (days).
2.4.6. Parameter Estimation and Model Evaluation
For the kinetic models, parameter estimation was conducted in Microsoft Excel using the Solver plug-in with the generalised reduced gradient (GRG) nonlinear algorithm. The objective function minimised the sum of squared errors (SSE) between observed and predicted methane yields. Initial parameter values were selected based on experimental trends: Mmax from the asymptotic methane yield, Rmax from the steepest observed slope, kh from the reported literature ranges (0.1–0.3 day−1), and λ from visual inspection of the lag phase. Constraints were imposed to ensure biological plausibility: Mmax > 0, Rmax > 0, kh > 0, k1 > 0, k2 > 0, λ ≥ 0, α ≤ 1, and k1 > k2. Derivatives were estimated by forward differences, with a convergence tolerance of 10−4 and a constraint precision of 10−6. To verify that the reported solutions corresponded to a global rather than a local minimum, the multistart option was enabled with a population size of 100.
The quality of fit was assessed using the coefficient of determination (R2), calculated using Equation (7).
where Mobs and Mpred are the observed and modelled methane yields, respectively. Model adequacy and parsimony were further compared using the Akaike information criterion (AIC) and Bayesian information criterion (BIC), calculated using Equations (8) and (9), respectively.
where n is the number of observations, SSE is the residual sum of squared errors, and k is the number of fitted parameters. Lower AIC and BIC values indicate a more parsimonious model [48].
3. Results and Discussion
3.1. Characteristics of Feedstocks and Inoculum
A clear understanding of feedstock physicochemical properties is essential for predicting degradability, process stability, and methane potential in AD [5,6,7]. Table 2 displays the main characteristics of the three substrates used: Gerbera spp. flower residues (FRs), non-marketable apples (AW), and pig slurry (PS).
Table 2.
Physicochemical characterisation of feedstocks.
Gerbera spp. residues exhibited high organic and energy-rich potential, characterised by elevated TS and VS/TS ratio (Table 2). The high extractives fraction (51.4%) is consistent with the abundance of phenolic and terpenoid compounds previously reported for ornamental flowers, which are known to inhibit methanogenesis at elevated concentrations [13,49]. Direct quantification of individual phenolics was beyond the scope of this study and is recommended for follow-up work. Lignin content was moderate (Klason 6.5% + soluble 4.7%), lower than that of woody biomass yet still sufficient to hinder hydrolysis. The C/N ratio (28) lies within the often-cited optimal window for AD, suggesting FR can serve as a carbonaceous co-substrate to balance nitrogen-rich feedstocks [3,13,49,50]. The ash fraction (7.5%) implies limited intrinsic buffering and mineral contribution compared to livestock slurry. The biomass distribution of Gerbera spp. residues analysed in this study averaged 54.3 ± 10.1% for the stem and 45.7 ± 10.1% for the flower.
Apple waste showed high water content (TS = 115.8 g·kg−1) but a high organic solid fraction (VS/TS = 0.98). Its very high C/N ratio (145) and low TKN (0.5 g·kg−1) indicate a strong carbon source that can drive rapid acidogenesis and VFA accumulation if mono-digested without adequate buffering and nutrient supplementation [15,16]. The acidic pH (3.71) and moderate electrical conductivity (2.02 mS·cm−1) reinforce the need for a stabilising co-substrate. The low ash value (0.3%) further confirms that AW provides little intrinsic buffering or micronutrients.
Pig slurry, conversely, had low solids content (TS = 42.0 g·L−1; VS = 30.9 g·L−1; VS/TS = 0.74) but was ash-rich (11.0%), with substantial TKN (3.4 g·L−1) and NH4+–N (2.3 g·L−1). These properties indicate that PS is a stabilising matrix that supplies alkalinity, macro/micronutrients, and an active microbial consortium, offsetting the acidity and nutrient scarcity of AW, while diluting potential inhibitors in FR [19,20,51,52]. Its low C/N (5) can be inhibitory at high loads but is ideal for blending with carbon-rich substrates.
Together, these profiles suggest a rational “designed synergy”: FR contributes with structural carbon but carries inhibitory risk; AW provides fast-degrading sugars that accelerate kinetics yet threaten acidification; and PS offers buffering, nutrients, and inoculum to stabilise the system. This complementarity anticipates the co-digestion outcomes discussed below and aligns with prior reports on fruit–manure mixtures and lignocellulosic co-feeds [16,19,51,53,54,55]. For context, the literature values for floral residues (Table 1) span 188–387 mLCH4·gVS−1 depending on species and pretreatment, with frequent references to phenolic inhibition and hydrolysis limits [13,25,26,27,28,29,30,31,32,33].
3.2. Methane Yields and Co-Digestion Performance
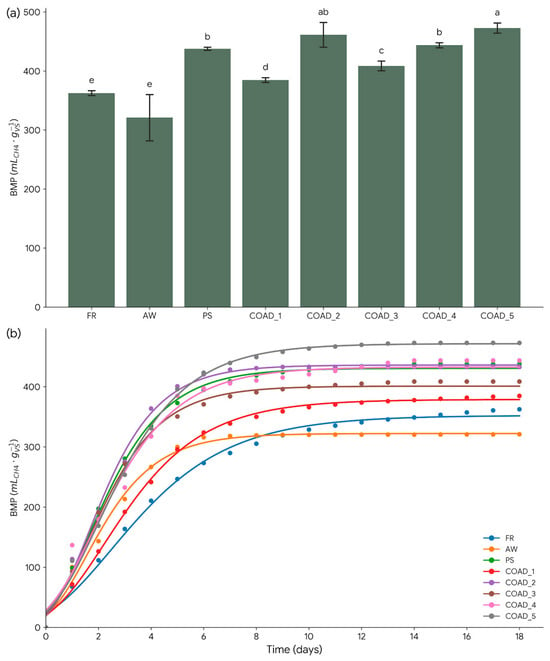
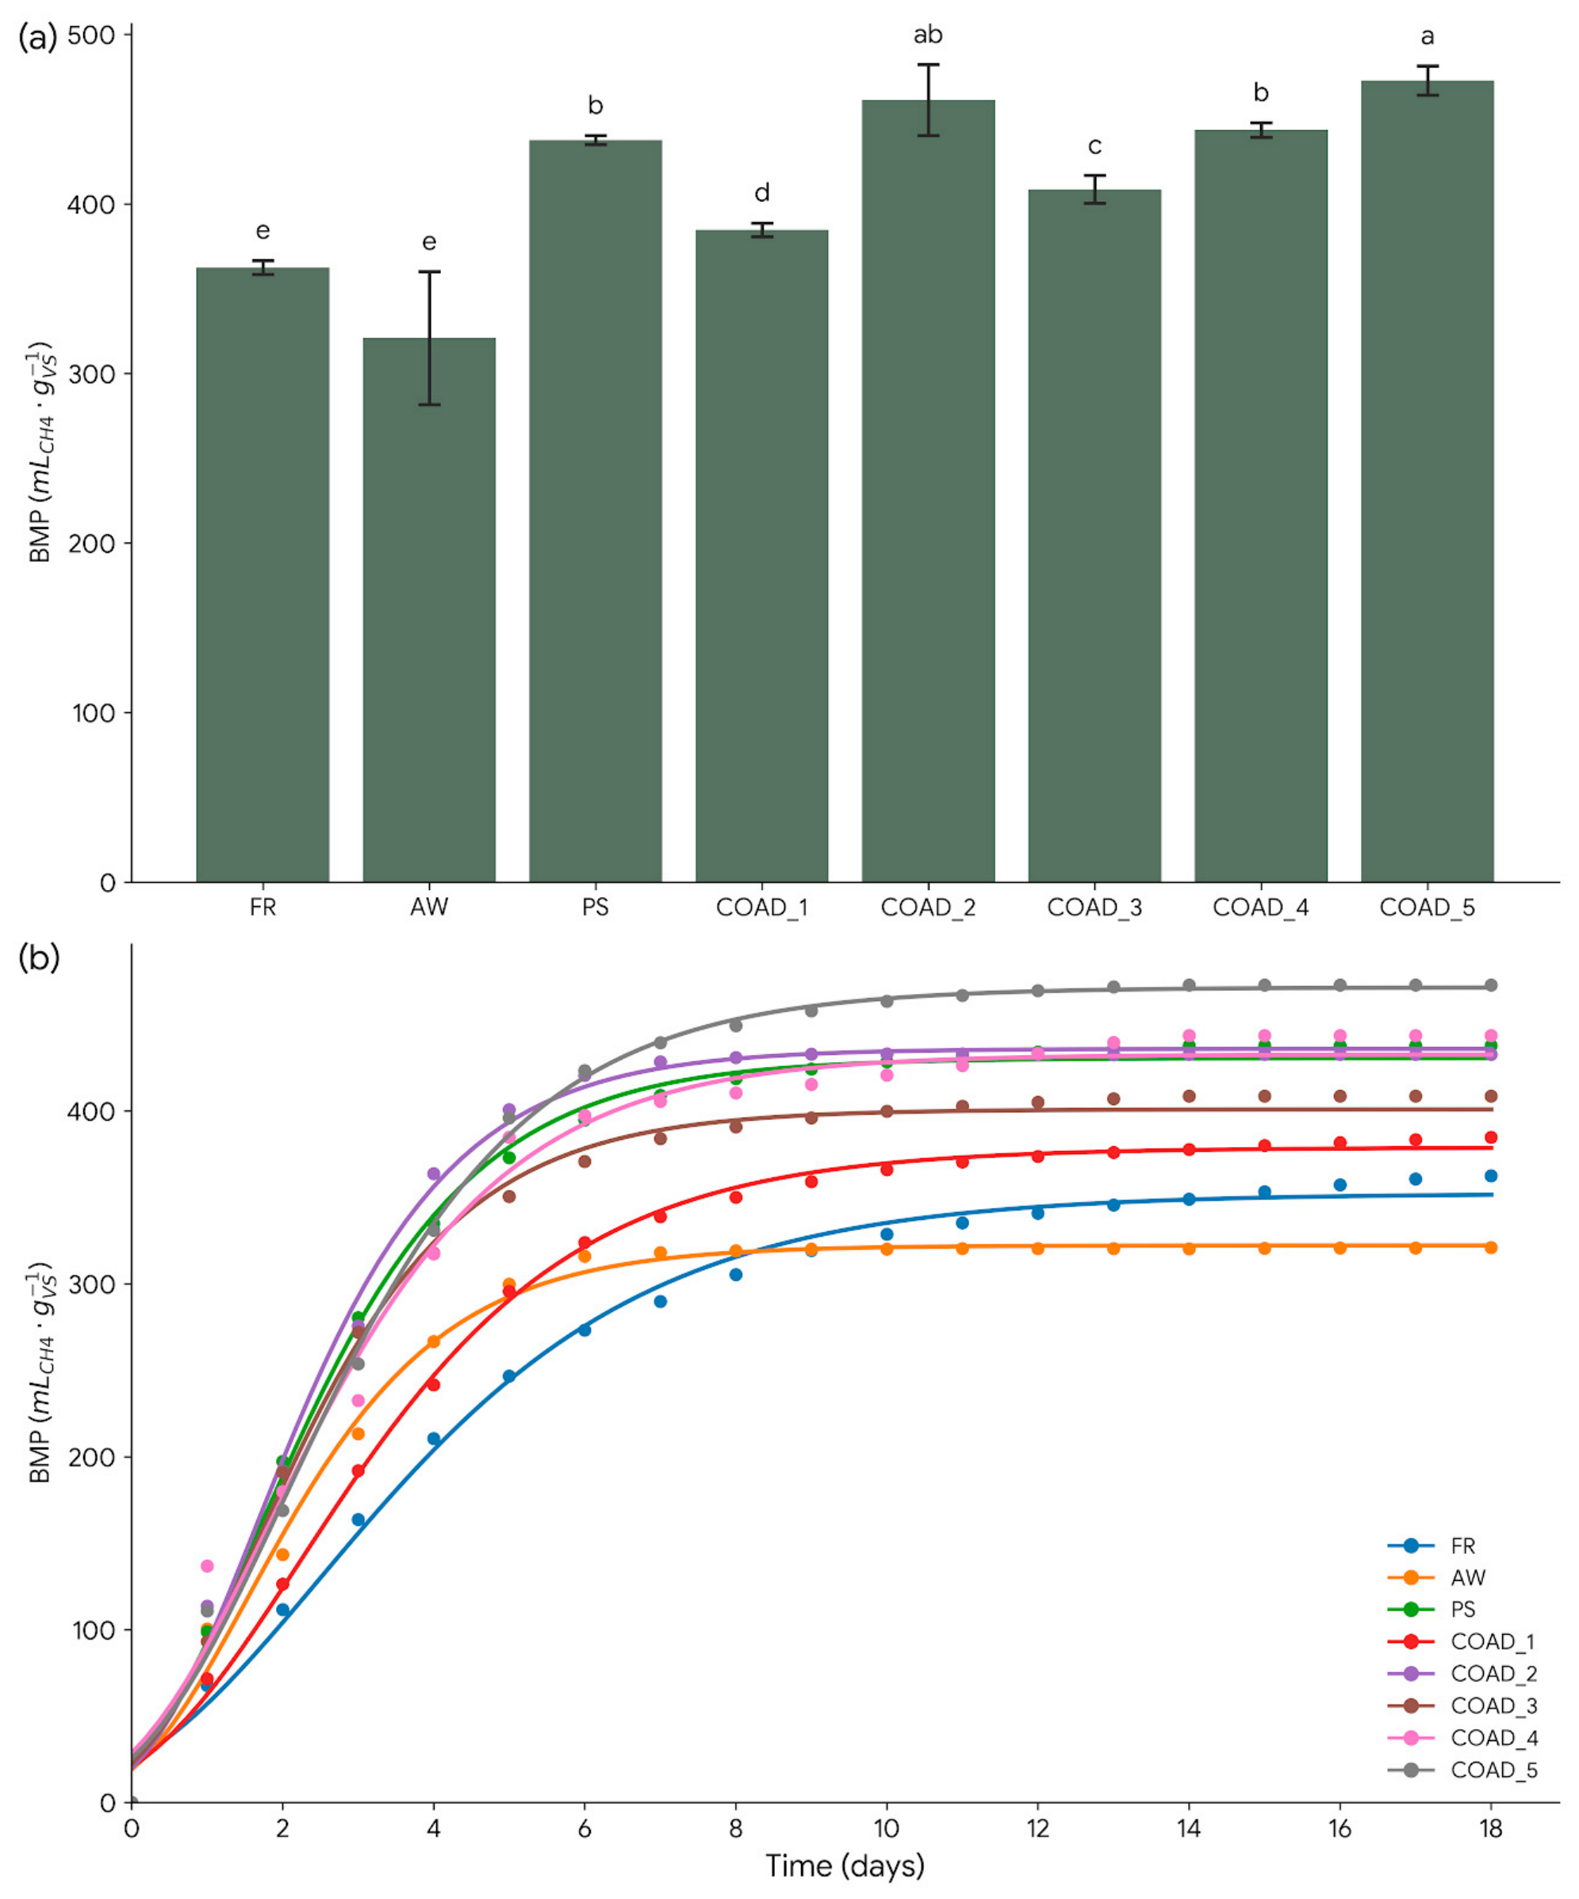
Figure 1 (cumulative methane curves) summarises performance across mono- and co-digestion assays, with key metrics compiled in Table 3. Baseline mono-digestion BMPs were 437.7 mLCH4·gVS−1 for PS, 320.9 mLCH4·gVS−1 for AW, and 362.5 mLCH4·gVS−1 for FR. Statistical analysis confirmed that FR and AW were within the same homogeneous group (‘e’) and did not differ significantly (p > 0.05). As expected, AW showed the highest VS removal (84.5%), but comparatively lower methane yield, consistent with a portion of rapidly produced VFAs not being fully converted to methane under the chosen loading and buffering conditions [15,16,55]. FR achieved moderate BMP (362.5 mLCH4·gVS−1) with substantial VS removal (72.9%), pointing to hydrolysis and/or phenolic constraints. PS delivered moderate BMP with the lowest VS removal (56.2%), highlighting its role as a stabiliser more than a high-energy feed [18,19].
Figure 1.
Biochemical methane potential (BMP) and kinetic modelling of mono-digestion (FR, AW, PS) and co-digestion (COAD_1–5) assays. (a) Cumulative methane yields at the end of the 18-day digestion period. Error bars represent standard deviations (n = 3, n = 2 for AW). Different letters above the bars denote statistically significant differences according to Welch’s ANOVA followed by the Games–Howell post hoc test (p < 0.05). (b) Cumulative methane production kinetics over time. Markers represent experimental observations, while solid lines represent the fit obtained using the Modified Gompertz Model.
Table 3.
Biochemical methane potential (BMP), volatile solids (VS) removal, C/N ratios, and synergy indices for mono-digestion and co-digestion assays of FR, AW, and PS at different mixing ratios.
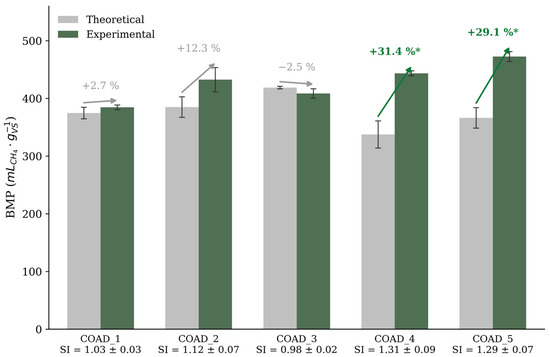
Co-digestion improved BMP and stability in most cases. The ternary mixture COAD_5 (VS basis: 0.30 PS, 0.45 AW, 0.25 FR) achieved the highest methane yield (472.8 mLCH4·gVS−1), categorised as the highest-yielding mixture tested (group ‘a’) and outperforming all mono-substrates. Synergy was quantified by comparing the experimental BMP (BMPexp) with the theoretical additive potential (BMPtheo) computed from mono-digestion yields (Figure 2). Two quantities must be distinguished. The synergy index expresses the experimental yield relative to the theoretical additive potential calculated from the mono-digestion yields and quantifies the co-digestion effect itself. The gain relative to the best single substrate expresses the practical benefit over the reference feedstock. For COAD_5 these were, respectively, a 29.1% increase over the additive prediction (SI = 1.29 ± 0.07) and an 8.0% gain over pig slurry mono-digestion (437.7 mLCH4·gVS−1). The highest synergy index of the series was obtained for the binary mixture COAD_4 (0.60 AW, 0.40 FR), which reached 443.6 mLCH4·gVS−1 with SI = 1.31 ± 0.09, but there was only a 1.4% gain over pig slurry mono-digestion, from which it was not statistically distinguishable (both group ‘b’). The contrast illustrates why the two metrics cannot be substituted for one another: COAD_4 combines the strongest synergistic effect with a negligible practical gain, whereas the ternary blend COAD_5 is the only mixture that both exceeds the additive prediction and significantly surpasses the yield of mono-digested PS.
Figure 2.
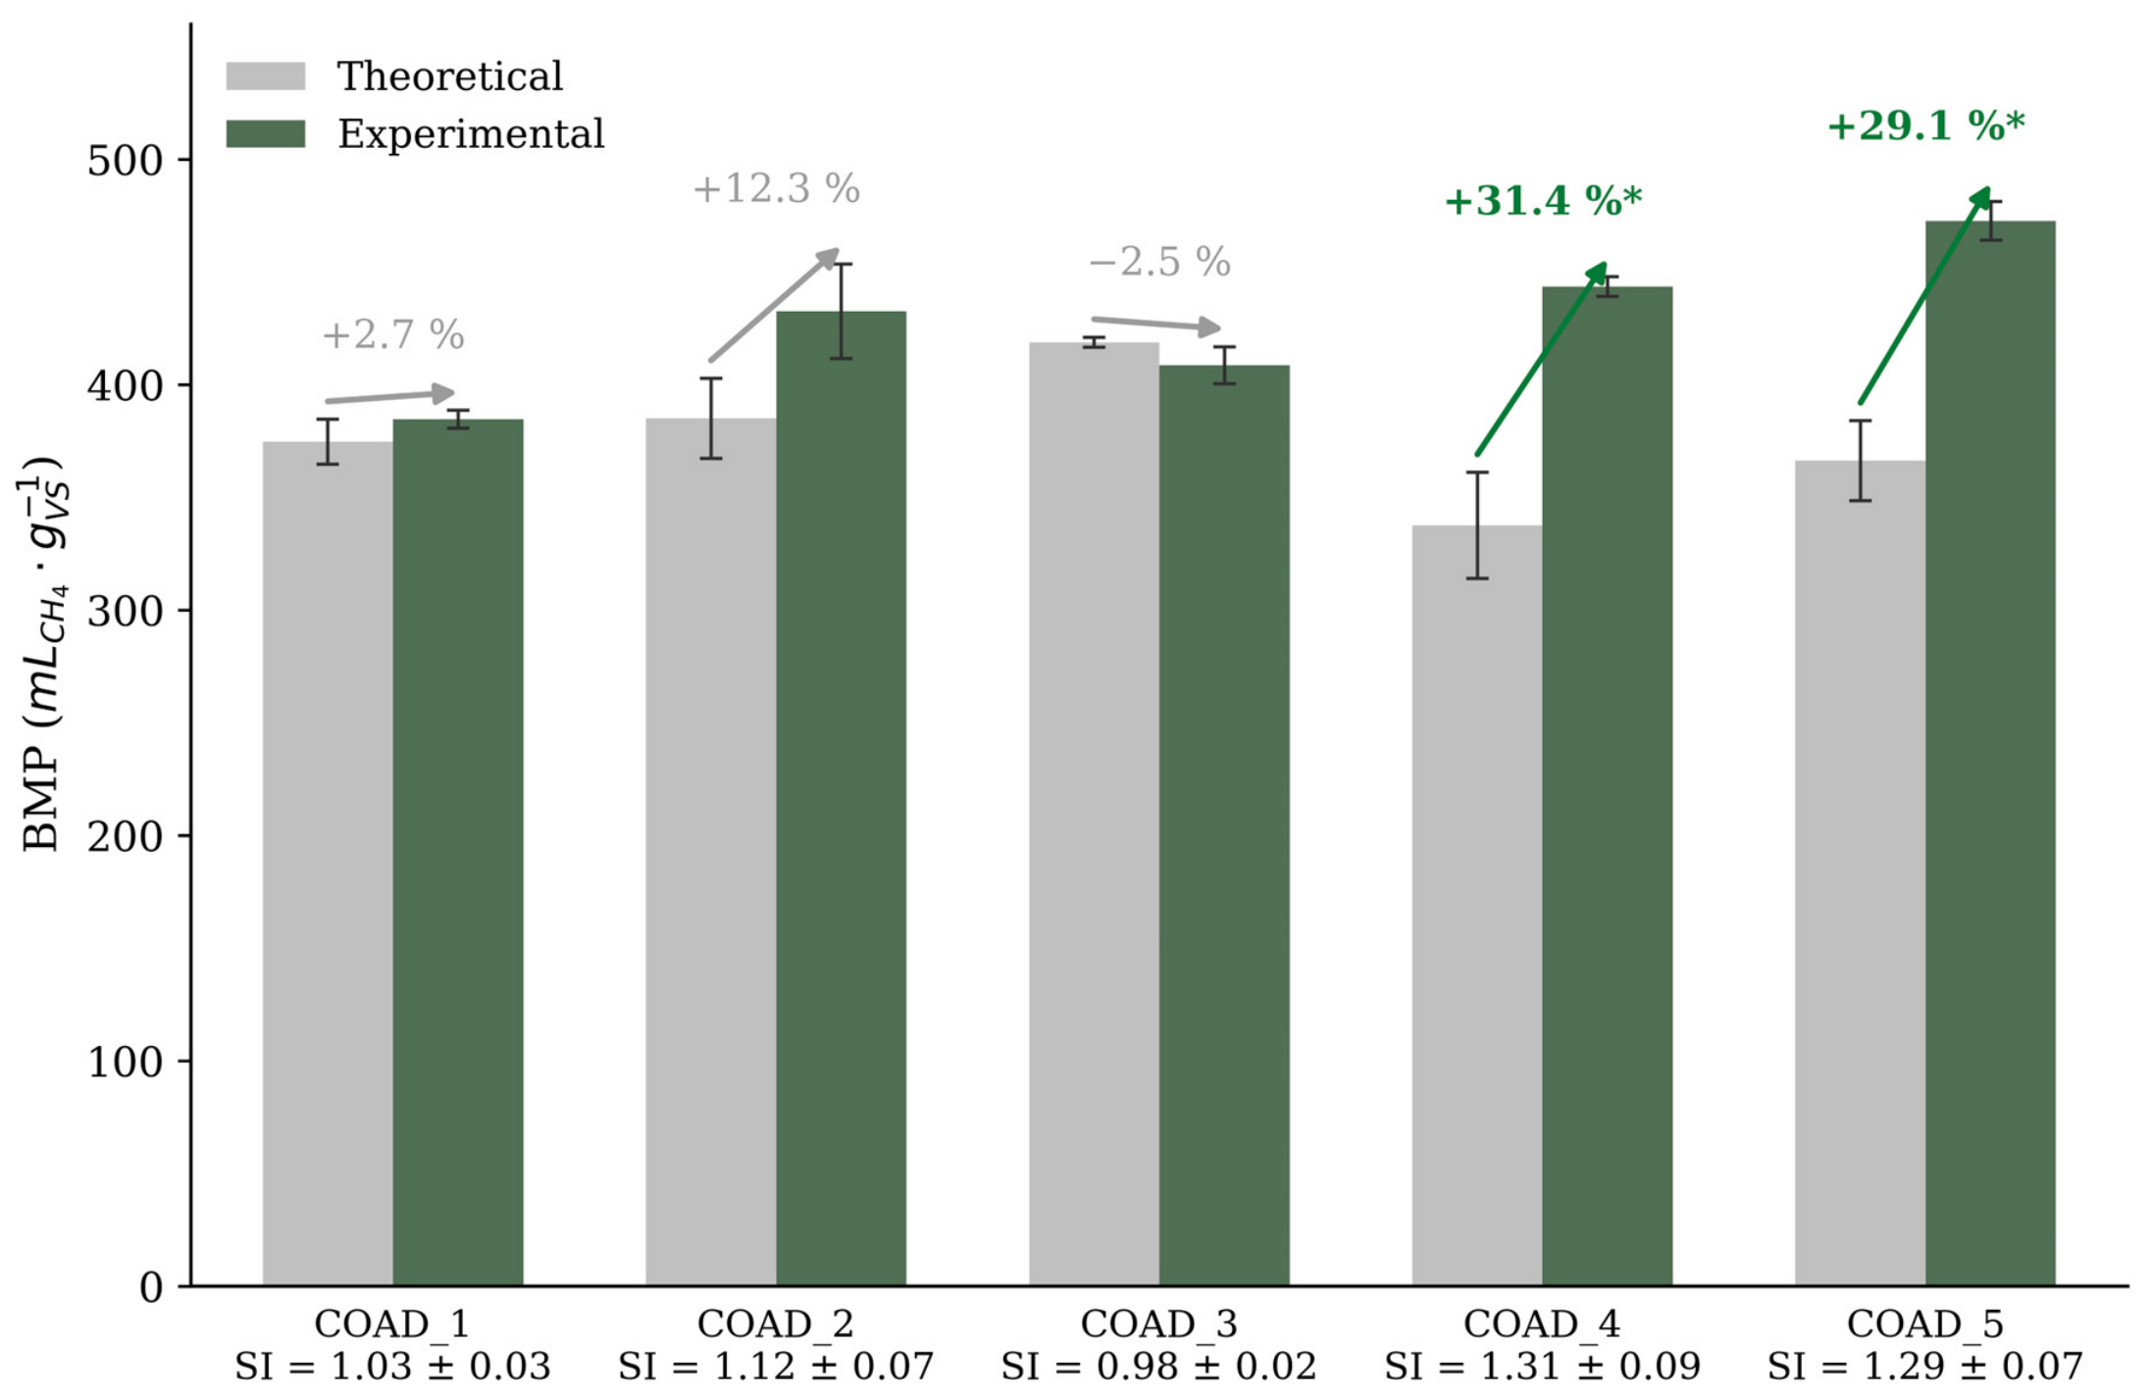
Synergistic and antagonistic effects of the co-digestion mixtures (COAD_1–5). Grey bars indicate the theoretical biochemical methane potential (BMP) calculated based on the VS fractions and yields of the individual substrates. Green bars represent the experimentally observed BMP. Arrows and percentages denote the magnitude and direction of the deviation from additive behaviour. Grey arrows denote deviations not significantly different from additive behavior; green arrows denote significant deviations. Asterisks indicate mixtures for which the synergy index differed significantly from unity (SI ± 2u).
Only COAD_4 and COAD_5 showed intervals of SI ± 2u excluding unity, and synergy is therefore claimed for these two mixtures alone. COAD_1 (SI = 1.03 ± 0.03) and COAD_2 (SI = 1.12 ± 0.07) behaved additively within experimental uncertainty, as did the high-slurry blend COAD_3 (SI = 0.98 ± 0.02), for which the apparent shortfall relative to the additive prediction was not distinguishable from additive behaviour. The uncertainty on the theoretical potential of every apple-containing mixture is dominated by the dispersion of the apple waste mono-digestion yield, which is the principal reason the moderate positive deviation of COAD_2 cannot be resolved.
Overall, these results confirm that combining carbon-rich (AW, FR) material with a nutrient- and buffer-rich matrix (PS) can outperform mono-digestion, provided that mixtures avoid excessive dilution or inhibitory dominance.
3.3. Process Stability and Synergistic Mechanisms
The degradation of organic matter and system stability reflected the composition of feedstock mixtures (Table 4). Although AW mono-digestion displayed the highest VS removal (84.5%), this did not translate into a proportional methane yield, which is consistent with rapid acidogenesis and transient VFA accumulation [15,16,20]. The apple waste treatment showed markedly greater dispersion than any other condition (RSD 12.2% against 0.6–4.8% elsewhere). This is attributable to the heterogeneity of the substrate itself, since non-marketable fruit varies in ripeness, sugar content and peel-to-flesh ratio despite homogenisation, and to the sensitivity of a rapidly acidifying sugar-dominated matrix to small differences in the effective local inoculum-to-substrate ratio [15,55]. The dispersion is therefore a characteristic of the feedstock rather than an artefact of the assay and represents a practical consideration for any scheme relying on fruit rejects as a primary substrate. Notably, this variability was substantially attenuated in every mixture containing AW, with the RSD falling to 4.8% in COAD_2, 1.8% in COAD_5 and 1.0% in COAD_4, which suggests that co-digestion confers reproducibility as well as yield. For FR mono-digestion, the lower conversion relative to its VS removal (72.9%) points to structural lignocellulosic recalcitrance and phenolic constraints [13,49]. Incorporating PS provided a stabilising matrix. While PS alone had the lowest VS removal (56.2%), its addition in co-digestion blends provided the buffering capacity and microbial consortium required to mitigate acidification, shorten lag phases, and improve overall conversion efficiency. This synergistic mechanism is highlighted in the best-performing ternary mixture COAD_5, which combined high methane production with moderate VS removal (65.6%), suggesting that synergistic effects operate by accelerating kinetics and broadening the operable inhibitory window, rather than by fully eliminating the underlying constraints. Endpoint stability indicators (Table 4) confirmed a stable regime across all mixtures, with final pH values (7.40–7.86) within the optimum range for methanogenesis [5,50,56].
Table 4.
Endpoint stability indicators of mono- and co-digestion assays, including pH, electrical conductivity (EC), alkalinity (ALK), volatile fatty acids (VFAs), and VFA/ALK ratios.
Most mixtures showed a slight pH increase from inoculation to endpoint, consistent with VFA consumption coupled to ammonification/bicarbonate formation during methanogenesis [57,58]. The AW + FR binary mixture (COAD_4) was the only one showing a slight pH decrease (7.48 to 7.40), yet it remained well within the neutral range.
Alkalinity (ALK) was clearly influenced by the proportion of PS in the mixture. PS alone exhibited the highest buffer capacity (5360 mg CaCO3·L−1), whereas COAD_4 (the only mix without PS) had the lowest ALK (3387 mg CaCO3·L−1), slightly above the inoculum (3180 mg CaCO3·L−1). This pattern reinforces the role of pig slurry as a buffering agent of the system and supports the co-digestion rationale previously discussed [18,19].
Bulk VFA concentrations at the endpoint were moderate (313–558 mg·L−1), resulting in VFA/ALK ratios between 0.09 and 0.11. These values are below the instability threshold (VFA/ALK < 0.3) [54,55,57], confirming that none of the substrates experienced persistent acidification under the chosen ISR and loading. The binary COAD_4 showed low ALK and low VFA values, maintaining a VFA/ALK ratio of 0.09; the top performers (COAD_4 and the ternary COAD_5) both finished at 0.09, illustrating that high-BMP outcomes were achieved without compromising stability.
Electrical conductivity (EC) reflected ionic strength and the extent of slurry addition: PS and PS-containing blends registered the highest EC (7.5–9.5 mS·cm−1), while COAD_4 exhibited the lowest value (6.1 mS·cm−1). This trend aligns with the contribution of bicarbonate, ammonium, and mineral ions from PS. Although EC is not a direct control parameter, its co-variation with ALK is a useful diagnostic indicator for assessing the buffering capacity in blended feeds [57,59,60].
Mechanistically, the observed synergy is attributed to three complementary factors: (i) inhibitor dilution (FR phenolics and extractives) by PS and AW; (ii) kinetic complementarity, with AW’s rapidly fermentable sugars accelerating hydrolysis/methanogenesis of the mixed matrix; and (iii) buffering and nutrient supply from PS preventing pH spikes and nutrient limitations in AW-rich blends [20,21,41,49]. Excess PS, however, can dilute the biodegradable fraction, explaining the neutral outcome in COAD_3.
3.4. Kinetic Modelling: Modified Gompertz, First-Order, and Dual-Pool Fits
All three models captured the methane production profiles with high accuracy (R2 ≥ 0.98; Table 5), consistent with the prior BMP modelling literature [13,26,29,32]. The Modified Gompertz Model (MGM) provided biologically interpretable parameters: Rmax peaked in mixed systems (COAD_2: 109.3 mLCH4·gVS−1·d−1), indicating enhanced microbial activity and improved mass transfer in blends. Lag phases (λ) were generally short; AW and FR exhibited nearly negligible lags (0–0.06 d), while PS showed slightly longer onsets (0.49–1.19 d across models). Co-digestion generally reduced or maintained short lags, with COAD_5 showing λ = 0.13 d (MGM), consistent with rapid establishment of methanogenic activity in buffered, nutrient-balanced conditions.
Table 5.
Kinetic parameters from Modified Gompertz, First-Order, and dual-pool models for mono- and co-digestion assays and goodness-of-fit statistics.
First-order fits highlighted hydrolysis limitations. AW presented the highest apparent hydrolysis constant (kh = 0.445 d−1), reflecting rapid solubilization of sugars, whereas FR was the lowest (0.225 d−1), consistent with lignin-associated recalcitrance and extractive-mediated inhibition. Co-digestion increased kh into the 0.293–0.439 d−1 range, indicating faster overall conversion than FR alone and closer to AW-like kinetics.
The dual-pool model did not resolve two distinct substrate fractions in any of the datasets. In six of the eight, the optimisation converges to k1 ≈ k2; the two exponential terms then become identical, α factors out of the expression and cancels, and the model reduces algebraically to the single first-order form. The value of α returned in these cases reflects the starting point of the optimiser rather than any property of the substrate, since any value reproduces the same curve. In the remaining two datasets (AW and COAD_5), α instead converges to its upper bound of unity, at which point the (1 − α) term vanishes and k2 ceases to influence the fit. Both approaches lead to the same outcome: in every case the dual-pool fit returns an ultimate potential and a residual sum of squares identical to those of the first-order model (Table 5), confirming that the two additional parameters do not capture any behaviour beyond that already described by the simpler model. The parameters affected are reported as not identifiable and are not interpreted.
The fact that no second pool could be resolved for any substrate or mixture is itself informative. It indicates that, at the temporal resolution afforded by daily methane measurements over an assay in which most conversion was complete within eight days, each feedstock behaved as a kinetically homogeneous matrix rather than as fast and slow fractions degrading in parallel. This is consistent with the information criteria, which penalise the two additional parameters without any compensating reduction in the residual sum of squares. A dual-pool description is therefore not warranted for these feedstocks and should be reserved for substrates exhibiting genuinely biphasic accumulation.
The kinetic analysis supports the mechanistic picture collected from BMP endpoints: (i) AW accelerates hydrolysis; (ii) PS stabilises and sustains methanogenesis; and (iii) FR supplies a slower carbon source requiring co-substrates to overcome constraints.
Although R2 values were high across all models, the information criteria provided a more discriminating assessment (Table 5). The first-order model with lag gave a lower AIC and BIC for FR, PS, COAD_3 and COAD_4, and the Modified Gompertz Model for AW, COAD_1, COAD_2 and COAD_5, with both criteria agreeing in every case. The separation was decisive for all datasets except COAD_4, where the two models differed by 1.4 AIC units and could not be meaningfully distinguished. The dual-pool model was never preferred, achieving no reduction in the residual sum of squares relative to the first-order model while carrying two additional parameters.
This pattern is interpretable rather than arbitrary. The Modified Gompertz Model was preferred for those substrates and mixtures in which a substantial readily fermentable fraction produced a pronounced acceleration phase, namely the sugar-rich apple waste and the three apple-containing blends, whose sigmoidal accumulation the model was formulated to describe. The first-order model was preferred where degradation was hydrolysis-limited from the outset, as it was for the lignocellulosic flower residues, or where the matrix was dominated by pig slurry carrying an already adapted microbial community, as in PS mono-digestion and the high-slurry blend COAD_3; in these cases, methane accumulation was close to exponential with no resolvable acceleration. COAD_4, the only mixture containing no slurry, sits between the two descriptions. Model selection should therefore follow the expected degradation behaviour of the substrate rather than a single default: the Modified Gompertz Model where a finite lag and an acceleration phase are present, and the first-order model for hydrolysis-limited profiles [45,46,47,48,61,62].
Beyond describing the experimental curves, these parameters provide a comparative basis for planning the subsequent stages of the work. The rate constants rank the substrates and mixtures by the degree to which their conversion is hydrolysis-limited, and the differences between them indicate which mixtures are likely to require longer adaptation and inform the range of retention times worth screening in semi-continuous trials. They cannot, however, be transferred directly to continuous operation: batch assays are conducted at a high inoculum-to-substrate ratio with a non-limiting biomass concentration and no biomass retention or washout dynamics, whereas performance in a continuous reactor is governed by reactor configuration, solids and biomass retention, feeding regime, accumulated inhibitor concentrations and long-term microbial adaptation. Reactor sizing and operational parameters must therefore be established from semi-continuous or continuous trials, as discussed in Section 3.7.
3.5. Comparison with the Literature and Implications for Deployment
The observed mono-digestion BMPs fit within the broad literature ranges for these feedstock classes: fruit wastes commonly yield 300–400 mLCH4·gVS−1, livestock slurries yield 300–450 mLCH4·gVS−1, and floral residues often underperform due to phenolics and lignin (200–350 mLCH4·gVS−1, species-dependent) (Table 1). The BMP obtained for Gerbera spp. residues falls within the upper range of reported values for flower residues (Table 1), outperforming those for Gerbera jamesonii reported by Pereira et al. (238–281 mLCH4·gVS−1) [13]. The co-digestion synergy achieved in this work (up to 29.1% above the theoretical additive potential, corresponding to 472.8 mLCH4·gVS−1 and an 8.0% gain over the best mono-digested substrate) compares favourably with enhancements reported for other lignin-bearing co-substrates [13,49,50,63]. This holds particular relevance given the seasonal abundance of floral residues and fruit rejects, alongside the widespread availability of pig slurry at the farm scale in Europe.
From an implementation perspective, ternary blends resembling COAD_5 offer a baseline for on-farm digesters already processing PS and seeking to valorise local floricultural and fruit side-streams. The buffering and nutrient profile of PS expands the operable loading window for AW/FR combinations, reducing risk of acidification. However, these batch results require validation under continuous operation in stirred-tank reactors (CSTRs). The preparation of the flower residues warrants explicit consideration when these results are transferred to full scale. Milling to 40 mesh increases the accessible surface area of a lignocellulosic matrix, and the yields reported here therefore represent an upper bound on what this feedstock can deliver rather than the value expected from unprepared material. Coarser griding, of the kind used in full-scale feeding systems, is generally reported to lower the methane yield of lignocellulosic substrates and, more markedly, to reduce the apparent hydrolysis rate [50,63]; solar drying may additionally cause losses of volatile compounds and some passive degradation of the readily available fraction. Both the yields and, in particular, the kinetic parameters obtained for the FR-containing mixtures would consequently be expected to be less favourable under the coarser preparation typical of farm-scale operation. The preparation strategy for the planned pilot unit has not yet been established. The energy demand of whichever preparation is adopted is one of the factors that must be accounted for in a complete energy balance, as detailed in Section 3.6. Given the moderate lignin content and high extractives in FR, supplementary pretreatment strategies could further improve hydrolysis and mitigate inhibition, warranting targeted evaluation [25,50,63].
3.6. Energy Balance and Circular Bioeconomy Potential
The co-digestion performance of the best-performing mixture (COAD_5; 0.30 PS, 0.45 AW, 0.25 FR) has implications beyond the kinetic enhancement described above for the management of regional residue streams within a circular bioeconomy framework [63,64].
To maintain the best-performing volatile solids (VS) ratio at full scale, an annual mass balance was established for the project site. The pig farm generates approximately 10,000 m3·yr−1 of slurry (30.9 ± 0.1 kg VS·m−3), corresponding to 309 t VS·yr−1. Maintaining the COAD_5 proportions would require the addition of approximately 4000 t·yr−1 of apple waste (113.2 ± 4.7 kg VS·t−1) and 320 t·yr−1 of flower residues (796.2 ± 4.6 kg VS·t−1), contributing 453 and 255 t VS·yr−1 respectively. The resulting annual load is approximately 1017 t VS·yr−1, distributed as 30.4% PS, 44.5% AW and 25.1% FR, thus reproducing the composition tested experimentally.
The scenario is dimensioned around the pig slurry because its high water content makes it far less suitable for transport than the other feedstocks, so the digester should be installed at the farm. The co-substrate quantities required are within the annual volumes reported by the floricultural and fruit producers participating in the project, both of which generate residues in excess of what this scenario would consume.
Applying the methane yield measured for COAD_5 (472.8 ± 8.6 m3 CH4·t−1 VS) to this load gives an estimated annual production of approximately 481,000 Nm3 CH4·yr−1. Taking a methane lower heating value of 9.97 kWh·Nm−3, this corresponds to a gross primary energy of approximately 4794 MWh·yr−1, of which approximately 1438 MWh·yr−1 would be recovered as electricity and approximately 2157 MWh·yr−1 as heat, assuming a combined heat and power unit with electrical and thermal conversion efficiencies of 30% and 45% respectively [65,66]. These figures are preliminary gross estimates obtained by transferring batch methane yields to full scale, and no deduction has been made for the internal energy demands of the plant.
Whether the scheme could support the proposed local renewable energy community and thereby allow the farm to move from energy consumer to energy producer [36,66] cannot be established on this basis alone. It would require a net rather than a gross energy balance, together with a matching of generation against local demand profiles and a techno-economic assessment, none of which were undertaken here. The analyses required are set out in Section 3.7.
3.7. Limitations and Future Work
The results presented here derive from mesophilic batch assays conducted at a fixed inoculum-to-substrate ratio of 2 and a single organic loading, with a non-limiting biomass concentration and no biomass retention or washout dynamics. Under these conditions the assays measure the ultimate methane potential of each substrate and mixture rather than the performance attainable in continuous operation, and the values reported should be understood as upper bounds. The flower residues were prepared in accordance with standard BMP protocols, which set the measured yields as an upper limit relative to full-scale feeding, as discussed in Section 3.5.
The five mixtures examined were selected based on local substrate availability and preliminary C/N considerations rather than through a formal experimental design. The composition space was consequently sampled at five points only, which identified the best-performing mixture among those tested but did not permit estimation of a response surface or of the binary and ternary interaction terms. A constrained mixture design over the FR-AW-PS composition space, analysed with mixture models, is required to locate a true optimum. Similarly, the kinetic parameters obtained here provide a comparative ranking of the hydrolysis-limited behaviour of the substrates and mixtures, and are useful for designing subsequent semi-continuous experiments, for instance in setting the range of retention times to be screened and in anticipating which mixtures may require longer adaptation. They do not constitute a basis for reactor sizing: hydraulic retention time, organic loading rate, start-up duration and washout risk are governed by reactor configuration, solids and biomass retention, feeding regime and long-term microbial adaptation, and must be established from semi-continuous or continuous trials.
The farm-scale figures given in Section 3.6 are a preliminary scenario estimate dimensioned on the slurry stream available at the project site, not a demonstrated outcome. A complete assessment would require a defined system boundary with the associated flows of substrates, water, energy, nutrients and digestate; a quantitative water balance distinguishing the fraction retained in the digestate from that realistically available for reuse; a full energy balance including feedstock transport, size reduction, pumping, mixing, digester heating and thermal losses, biogas cleaning, auxiliary consumption of the cogeneration unit and digestate management; and measurable indicators on the agricultural side, such as nutrient recovery, potential substitution of mineral fertilisers and the area suitable for digestate application. The trade-offs and potential conflicts between these components would need to be addressed explicitly rather than presented as a list of expected benefits. Whether the system could support a local renewable energy community likewise depends on a temporal matching of generation against local demand profiles, on the rated capacity and operating regime of the cogeneration unit, and on a techno-economic assessment, none of which were performed here. Finally, the avoided emissions and fertiliser substitution associated with the scheme are plausible but unquantified, and require a life cycle assessment against a defined baseline scenario.
4. Conclusions
Gerbera spp. residues proved a viable anaerobic digestion feedstock, yielding 362.5 ± 4.1 mLCH4·gVS−1 in mono-digestion, which is at the upper end of the range reported for floricultural biomass despite having a high extractives content and a lignocellulosic structure that limits hydrolysis. Apple waste yielded 320.9 ± 39.2 mLCH4·gVS−1, the lowest of the three and the most variable, with its rapid acidogenesis and the heterogeneity of non-marketable fruit both working against it; pig slurry yielded 437.7 ± 2.6 mLCH4·gVS−1. Their principal constraints are complementary and co-digestion relieves them: the slurry supplied the alkalinity, while the apple fraction supplied the readily fermentable carbon that the flower residues lacked.
The ternary combination exploiting this complementarity (COAD_5; 0.30 PS, 0.45 AW, 0.25 FR on a VS basis) reached 472.8 ± 8.6 mLCH4·gVS−1 and was the only mixture both to exceed its theoretical additive potential and to surpass the best single substrate significantly. The following distinction matters: the increase over additivity (29.1%, SI = 1.29 ± 0.07) measures the interaction between the substrates, whereas the gain over mono-digested slurry (8.0%) measures what a farm already digesting slurry would actually recover. COAD_4 illustrates the difference, combining the largest interaction of the series with no practical advantage over slurry alone. Once the uncertainties of the constituent yields were propagated, only these two mixtures showed synergy distinguishable from additive behaviour. Stability was maintained throughout, with a final pH between 7.40 and 7.86 and VFA-to-alkalinity ratios never exceeding 0.11, indicating that the improvement was obtained without approaching acidification.
The kinetic analysis identified two distinct degradation regimes rather than a single descriptive model: the first-order form fitting the hydrolysis-limited and slurry-dominated assays and the Modified Gompertz form fitting the sugar-rich ones. No dataset supported a two-pool description, with the dual-pool model degenerating to the first-order form in every case. Model choice for this class of feedstock should therefore follow the expected degradation behaviour rather than convention.
At the scale of the project site these yields correspond to a preliminary gross scenario of the order of 481,000 Nm3 CH4·yr−1 (Section 3.6), before any deduction for the internal energy demands of a full-scale plant. What the batch assays establish is that floricultural residues can be absorbed into an existing slurry-based digestion scheme without destabilising it, and which composition and degradation behaviour subsequent work should start from. Semi-continuous validation, a formal mixture design and a life cycle assessment remain necessary before deployment.
Supplementary Materials
The following supporting information can be downloaded at https://www.mdpi.com/article/10.3390/en19173946/s1: Table S1. Experimental bottle loading and mixture compositions for the batch BMP assays. Table S2. Cumulative methane yield over the final four days of the BMP assays and the corresponding daily production, expressed as the increment relative to the cumulative yield of the same day.
Author Contributions
Conceptualization, M.N. and R.F.; methodology, M.N. and R.F.; validation, M.N. and R.F.; formal analysis, M.N., M.R.P., C.C.S. and R.F.; investigation, M.N., M.R.P., C.C.S. and R.F.; resources, R.F.; data curation, M.N., M.R.P., C.C.S. and R.F.; writing—original draft preparation, M.N.; writing—review and editing, M.R.P., C.C.S. and R.F.; visualisation, M.N.; supervision, M.N. and R.F.; project administration, R.F.; funding acquisition, R.F. All authors have read and agreed to the published version of the manuscript.
Funding
This work was supported by FCT—Fundação para a Ciência e Tecnologia, I.P., through project UID/04129/2025 (https://doi.org/10.54499/UID/04129/2025) of LEAF—Linking Landscape, Environment, Agriculture and Food, and by the RE-FEED project funded under PRR/IFAP/Agendas Mobilizadoras para a Inovação.
Data Availability Statement
The original contributions presented in this study are included in the article/Supplementary Material. Further inquiries can be directed to the corresponding author.
Acknowledgments
The authors gratefully acknowledge LEAF—Linking Landscape, Environment, Agriculture and Food Research Centre; TERRA—Associated Laboratory for Sustainability and Territory; and ISA—Universidade de Lisboa for providing financial support, laboratory facilities, equipment, and workspace essential for conducting this research. The authors also thank the industrial partners who kindly supplied the substrates and inoculum used in the experiments.
Conflicts of Interest
The authors declare no conflicts of interest.
Abbreviations
The following abbreviations are used in this manuscript:
| AD | Anaerobic Digestion |
| AIC | Akaike Information Criterion |
| ALK | Alkalinity |
| AMPTS | Automatic Methane Potential Test System |
| ANOVA | Analysis of Variance |
| AW | Apple Waste |
| BIC | Bayesian Information Criterion |
| BMP | Biochemical Methane Potential |
| C/N | Carbon-to-Nitrogen Ratio |
| CHP | Combined Heat and Power |
| CLD | Compact Letter Display |
| C_ORG | Total Organic Carbon |
| CSTR | Continuous Stirred-Tank Reactor |
| DP | Dual-Pool First-Order Kinetic Model |
| EC | Electrical Conductivity |
| FOKM | First-Order Kinetic Model |
| FR | Flower Residue (Gerbera spp.) |
| GRG | Generalised Reduced Gradient |
| ISR | Inoculum-to-Substrate Ratio |
| MGM | Modified Gompertz Model |
| PS | Pig Slurry |
| REC | Renewable Energy Community |
| RED III | Renewable Energy Directive III |
| RMSE | Root Mean Square Error |
| RSD | Relative Standard Deviation |
| SI | Synergy Index |
| SSE | Sum of Squared Errors |
| TKN | Total Kjeldahl Nitrogen |
| TS | Total Solids |
| VFA | Volatile Fatty Acid |
| VS | Volatile Solids |
References
- Duque-Acevedo, M.; Belmonte-Ureña, L.J.; Cortés-García, F.J.; Camacho-Ferre, F. Agricultural Waste: Review of the Evolution, Approaches and Perspectives on Alternative Uses. Glob. Ecol. Conserv. 2020, 22, e00902. [Google Scholar] [CrossRef] [Scilit]
- Godfray, H.C.J.; Beddington, J.R.; Crute, I.R.; Haddad, L.; Lawrence, D.; Muir, J.F.; Pretty, J.; Robinson, S.; Thomas, S.M.; Toulmin, C. Food Security: The Challenge of Feeding 9 Billion People. Science 2010, 327, 812–818. [Google Scholar] [CrossRef] [Scilit] [PubMed]
- Kaur, G.; Yadav, N.; Kumar, S. Anaerobic Digestion: A Sustainable Biochemical Approach to Convert Biomass to Bioenergy. In Biomass Energy for Sustainable Development; Taylor & Francis Group: Abingdon, UK, 2024; pp. 111–126. [Google Scholar] [CrossRef] [Scilit]
- Hublin, A.; Schneider, D.R.; Džodan, J. Utilization of Biogas Produced by Anaerobic Digestion of Agro-Industrial Waste: Energy, Economic and Environmental Effects. Waste Manag. Res. 2014, 32, 626–633. [Google Scholar] [CrossRef] [Scilit] [PubMed]
- Uddin, M.M.; Wright, M.M. Anaerobic Digestion Fundamentals, Challenges, and Technological Advances. Phys. Sci. Rev. 2023, 8, 2819–2837. [Google Scholar] [CrossRef] [Scilit]
- Alengebawy, A.; Ran, Y.; Osman, A.I.; Jin, K.; Samer, M.; Ai, P. Anaerobic Digestion of Agricultural Waste for Biogas Production and Sustainable Bioenergy Recovery: A Review. Environ. Chem. Lett. 2024, 22, 2641–2668. [Google Scholar] [CrossRef] [Scilit]
- Appels, L.; Lauwers, J.; Degrve, J.; Helsen, L.; Lievens, B.; Willems, K.; Van Impe, J.; Dewil, R. Anaerobic Digestion in Global Bio-Energy Production: Potential and Research Challenges. Renew. Sustain. Energy Rev. 2011, 15, 4295–4301. [Google Scholar] [CrossRef] [Scilit]
- Rashed, N.M.; Memon, S.A.; Turki, S.M.A.; Shalaby, T.A.; El-Mogy, M.M. An Analysis of Conventional and Modern Packaging Approaches for Cut Flowers: A Review Article. Front. Plant Sci. 2024, 15, 1371100. [Google Scholar] [CrossRef] [Scilit] [PubMed]
- Dutta, S.; Kumar, M.S. Potential of Value-Added Chemicals Extracted from Floral Waste: A Review. J. Clean. Prod. 2021, 294, 126280. [Google Scholar] [CrossRef] [Scilit]
- Ryntathiang, I.; Shajni Krishna, G.M.; Sekar, S.; Behera, A.; Selvan, S.T.; Jothinathan, M.K.D. Bioenergy and Valuable Products from Floral Waste-Sustainable Approach. Int. Res. J. Multidiscip. Scope 2024, 5, 531–541. [Google Scholar] [CrossRef] [Scilit]
- Kumar Gupta, V.; Kumar, R.; Dhanker, R.; Kamble, S.S.; Mohamed, H.I. Sustainable Management of Floral Waste to Reduce Environmental Pollution by Conversion to Value-Added Products and Their Applications in the Synthesizing of Nanomaterials: A Review. Water Air Soil Pollut. 2024, 235, 436. [Google Scholar] [CrossRef] [Scilit]
- Popich, M.R.; Nogueira, M.; Fragoso, R. Anaerobic Digestion of Flower Waste: A Review on Biomethane Potential, Process Optimization, and Sustainability Perspectives. Energies 2026, 19, 289. [Google Scholar] [CrossRef] [Scilit]
- Pereira, T.D.S.; Catenacci, A.; Guerreschi, A.; Bellandi, G.; Malpei, F. Biochemical Characterization and Anaerobic Degradability of Flower Wastes: Preliminary Assessment and Statistical Interpretation towards Energy Recovery. Sci. Total Environ. 2022, 830, 154842. [Google Scholar] [CrossRef] [Scilit] [PubMed]
- Monlau, F.; Sambusiti, C.; Ficara, E.; Aboulkas, A.; Barakat, A.; Carrère, H. New Opportunities for Agricultural Digestate Valorization: Current Situation and Perspectives. Energy Environ. Sci. 2015, 8, 2600–2621. [Google Scholar] [CrossRef] [Scilit]
- Ampese, L.C.; Sganzerla, W.G.; Di Domenico Ziero, H.; Costa, J.M.; Martins, G.; Forster-Carneiro, T. Valorization of Apple Pomace for Biogas Production: A Leading Anaerobic Biorefinery Approach for a Circular Bioeconomy. Biomass Convers. Biorefin. 2024, 14, 14843–14857. [Google Scholar] [CrossRef] [Scilit]
- Kell, C.J.K.; Sempiira, J.E.; Gottumukkala, L.; van Rensburg, E.; Louw, T.; Görgens, J. Anaerobic Co-Digestion of Apple Juice Processing Waste with Manure and Corn Stover; Impact on Biogas and Methane Yield. Waste Biomass Valorization 2025, 17, 1323–1331. [Google Scholar] [CrossRef] [Scilit]
- EPRS (European Parliamentary Research Service); Augère-Granier, M.-L. The EU Pig Meat Sector; EU: Brussels, Belgium, 2020. [Google Scholar]
- Marchetti, R.; Vasmara, C.; Orsi, A. Inoculum Production from Pig Slurry for Potential Use in Agricultural Biogas Plants. Sustain. Energy Technol. Assess. 2022, 52, 102310. [Google Scholar] [CrossRef] [Scilit]
- Marchetti, R.; Vasmara, C.; Fiume, F. Pig Slurry Improves the Anaerobic Digestion of Waste Cooking Oil. Appl. Microbiol. Biotechnol. 2019, 103, 8267–8279. [Google Scholar] [CrossRef] [Scilit] [PubMed]
- Azevedo, A.; Gominho, J.; Duarte, E. Performance of Anaerobic Co-Digestion of Pig Slurry with Pineapple (Ananas comosus) Bio-Waste Residues. Waste Biomass Valorization 2021, 12, 303–311. [Google Scholar] [CrossRef] [Scilit]
- Astals, S.; Nolla-Ardèvol, V.; Mata-Alvarez, J. Thermophilic Co-Digestion of Pig Manure and Crude Glycerol: Process Performance and Digestate Stability. J. Biotechnol. 2013, 166, 97–104. [Google Scholar] [CrossRef] [Scilit] [PubMed]
- European Commission. EU Decision-2011/753; EU: Brussels, Belgium, 2011. [Google Scholar]
- European Commission. Green Paper on the Management of Bio-Waste in the European Union; EU: Brussels, Belgium, 2008. [Google Scholar]
- European Commission. Renewable Energy Directive-Directive EU 2023/2413; EU: Brussels, Belgium, 2023. [Google Scholar]
- Liang, Y.G.; Cheng, B.; Si, Y.B.; Cao, D.J.; Li, D.L.; Chen, J.F. Effect of Solid-State NaOH Pretreatment on Methane Production from Thermophilic Semi-Dry Anaerobic Digestion of Rose Stalk. Water Sci. Technol. 2016, 73, 2913–2920. [Google Scholar] [CrossRef] [Scilit] [PubMed]
- Poveda-Giraldo, J.A.; Cardona Alzate, C.A. A Biorefinery for the Valorization of Marigold (Calendula officinalis) Residues to Produce Biogas and Phenolic Compounds. Food Bioprod. Process. 2021, 125, 91–104. [Google Scholar] [CrossRef] [Scilit]
- Pandey, K.P.; Dhoble, A.S. Impact of Fungal Pretreatment on Methane Enhancement and Microbiome Dynamics in the Anaerobic Digestion of Floral Waste. Biomass Bioenergy 2025, 197, 107817. [Google Scholar] [CrossRef] [Scilit]
- Zhurka, M.; Spyridonidis, A.; Vasiliadou, I.A.; Stamatelatou, K.; Ferrer, I.; Eskicioglu, C.; Antonopoulou, G.; Battimelli, A. Biogas Production from Sunflower Head and Stalk Residues: Effect of Alkaline Pretreatment. Molecules 2019, 25, 164. [Google Scholar] [CrossRef] [Scilit] [PubMed]
- Monlau, F.; Barakat, A.; Steyer, J.P.; Carrere, H. Comparison of Seven Types of Thermo-Chemical Pretreatments on the Structural Features and Anaerobic Digestion of Sunflower Stalks. Bioresour. Technol. 2012, 120, 241–247. [Google Scholar] [CrossRef] [Scilit] [PubMed]
- Hashemi, S.S.; Karimi, K.; Mirmohamadsadeghi, S. Hydrothermal Pretreatment of Safflower Straw to Enhance Biogas Production. Energy 2019, 172, 545–554. [Google Scholar] [CrossRef] [Scilit]
- Frankowski, J.; Zaborowicz, M.; Dach, J.; Czekała, W.; Przybył, J. Biological Waste Management in the Case of a Pandemic Emergency and Other Natural Disasters. Determination of Bioenergy Production from Floricultural Waste and Modeling of Methane Production Using Deep Neural Modeling Methods. Energies 2020, 13, 3014. [Google Scholar] [CrossRef] [Scilit]
- Saha, B.; Sathyan, A.; Mazumder, P.; Choudhury, S.P.; Kalamdhad, A.S.; Khwairakpam, M.; Mishra, U. Biochemical Methane Potential (BMP) Test for Ageratum Conyzoides to Optimize Ideal Food to Microorganism (F/M) Ratio. J. Environ. Chem. Eng. 2018, 6, 5135–5140. [Google Scholar] [CrossRef] [Scilit]
- Schmidt, A.; Lemaigre, S.; Delfosse, P.; von Francken-Welz, H.; Emmerling, C. Biochemical Methane Potential (BMP) of Six Perennial Energy Crops Cultivated at Three Different Locations in W-Germany. Biomass Convers. Biorefin. 2018, 8, 873–888. [Google Scholar] [CrossRef] [Scilit]
- Fragoso, R.; Bastos, J.; Brito, P.; Moreira, O.; Duarte, E. REFEED-Renewable Energy Production at Farm Level for Energy Efficiency and Defossilization. In Springer Proceedings in Earth and Environmental Sciences; Springer: Berlin/Heidelberg, Germany, 2023. [Google Scholar]
- European Parliament; The Council of the European Union. Directive (EU) 2023/2413 of the European Parliament and of the Council of 18 October 2023 Amending Directive (EU) 2018/2001, Regulation (EU) 2018/1999 and Directive 98/70/EC as Regards the Promotion of Energy from Renewable Sources, and Repealing Council Directive (EU) 2015/652. Official Journal of the European Union, 31 October 2023.
- Rego, N.; Castro, R.; Lagarto, J. Sustainable Energy Trading and Fair Benefit Allocation in Renewable Energy Communities: A Simulation Model for Portugal. Util. Policy 2025, 96, 101986. [Google Scholar] [CrossRef] [Scilit]
- VDI 4630; Fermentation of Organic Substances—Substrate Characterisation, Sampling, Data Collection, Fermentation Tests. VDI Standards: Düsseldorf, Germany, 2016.
- Holliger, C.; Alves, M.; Andrade, D.; Angelidaki, I.; Astals, S.; Baier, U.; Bougrier, C.; Buffière, P.; Carballa, M.; De Wilde, V.; et al. Towards a Standardization of Biomethane Potential Tests. Water Sci. Technol. 2016, 74, 2515–2522. [Google Scholar] [CrossRef] [Scilit] [PubMed]
- Carrillo-Reyes, J.; Buitrón, G.; Moreno-Andrade, I.; Tapia-Rodríguez, A.C.; Palomo-Briones, R.; Razo-Flores, E.; Aguilar-Juárez, O.; Arreola-Vargas, J.; Bernet, N.; Braga, A.F.M.; et al. Standardized Protocol for Determination of Biohydrogen Potential. MethodsX 2020, 7, 100754. [Google Scholar] [CrossRef] [Scilit] [PubMed]
- American Public Health Association. Standard Methods for the Examination of Water and Wastewater; American Public Health Association: Washington, DC, USA, 2018. [Google Scholar]
- Cuetos, M.J.; Fernández, C.; Gómez, X.; Morán, A. Anaerobic Co-Digestion of Swine Manure with Energy Crop Residues. Biotechnol. Bioprocess Eng. 2011, 16, 1044–1052. [Google Scholar] [CrossRef] [Scilit]
- TAPPI T 204 Cm-07; Standard Test Method for Solvent Extractives of Wood and Pulp. Technical Association of the Pulp and Paper Industry: Peachtree Corners, GA, USA, 2007.
- TAPPI T 222 Om-21; Standard Test Method for Acid-Insoluble Lignin in Wood and Pulp. Technical Association of the Pulp and Paper Industry: Peachtree Corners, GA, USA, 2021.
- TAPPI UM 205 Om-93; Standard Test Method for Physical Tests of Pulp. Technical Association of the Pulp and Paper Industry: Peachtree Corners, GA, USA, 1993.
- Ali, A.; Keerio, H.A.; Abro, O.A.; Noor, M.; Panhwar, S.; Mahar, R.B. A Study of Mathematical Models Used in Anaerobic Digestion of Organic Refuse. VFAST Trans. Math. 2024, 12, 150–163. [Google Scholar] [CrossRef] [Scilit]
- Brulé, M.; Oechsner, H.; Jungbluth, T. Exponential Model Describing Methane Production Kinetics in Batch Anaerobic Digestion: A Tool for Evaluation of Biochemical Methane Potential Assays. Bioprocess Biosyst. Eng. 2014, 37, 1759–1770. [Google Scholar] [CrossRef] [Scilit] [PubMed]
- Gouveia, B.; Duarte, E.; dos Santos, A.; Fernandes, E. Dual-Pool, Three-Phase Kinetic Model of Anaerobic Digestion in Batch Mode. Heliyon 2022, 8, e09194. [Google Scholar] [CrossRef] [Scilit] [PubMed]
- Emiliano, P.C.; Vivanco, M.J.F.; De Menezes, F.S. Information Criteria: How Do They Behave in Different Models? Comput. Stat. Data Anal. 2014, 69, 141–153. [Google Scholar] [CrossRef] [Scilit]
- Singh, P.; Bajpai, U. Anaerobic Digestion of Flower Waste for Methane Production: An Alternative Energy Source. Environ. Prog. Sustain. Energy 2012, 31, 637–641. [Google Scholar] [CrossRef] [Scilit]
- Wang, J.; Liu, S.; Feng, K.; Lou, Y.; Ma, J.; Xing, D. Anaerobic Digestion of Lignocellulosic Biomass: Process Intensification and Artificial Intelligence. Renew. Sustain. Energy Rev. 2025, 210, 115264. [Google Scholar] [CrossRef] [Scilit]
- Macedo, A.; Fragoso, R.; Silva, I.; Gomes, T.; Martins, C.F.; Freire, J.B.; Duarte, E. Mango Peel Nanofiltration Concentrates to Enhance Anaerobic Digestion of Slurry from Piglets Fed with Laminaria. Membranes 2023, 13, 371. [Google Scholar] [CrossRef] [Scilit] [PubMed]
- Silva, I.; Lapa, N.; Ribeiro, H.; Duarte, E. Pig Slurry Anaerobic Digestion: The Role of Biochar as an Additive Towards Biogas and Digestate Improvement. Appl. Sci. 2025, 15, 1037. [Google Scholar] [CrossRef] [Scilit]
- Agarwal, A.; Paritosh, K.; Dangayach, P.; Gehlot, P.; Pareek, N.; Vivekanand, V. Hydrothermal, Acidic, and Alkaline Pretreatment of Waste Flower-Mix for Enhanced Biogas Production: A Comparative Assessment. Biomass Convers. Biorefin. 2021, 1, 29697–29705. [Google Scholar] [CrossRef] [Scilit]
- Kulkarni Milind, B.; Ghanegaonkar, P.M. Anaerobic Digestion of Floral Waste and Methane Enrichment: A Sustainable Approach for Waste to Energy Conversion. J. Solid Waste Technol. Manag. 2020, 46, 299–303. [Google Scholar] [CrossRef] [Scilit]
- Ji, C.; Kong, C.X.; Mei, Z.L.; Li, J. A Review of the Anaerobic Digestion of Fruit and Vegetable Waste. Appl. Biochem. Biotechnol. 2017, 183, 906–922. [Google Scholar] [CrossRef] [Scilit] [PubMed]
- He, K.; Liu, Y.; Tian, L.; He, W.; Cheng, Q. Review in Anaerobic Digestion of Food Waste. Heliyon 2024, 10, e28200. [Google Scholar] [CrossRef] [Scilit] [PubMed]
- Shyan, L.L.; Mat Nanyan, N.S.; Ismail, N.; Al-Gheethi, A.; T. Nguyen, H.H.; Vo, D.V.N.; El Enshasy, H.A. Effort to Mitigate Volatile Fatty Acid Inhibition by Using Mixed Inoculum and Compost for the Degradation of Food Waste and the Production of Biogas. Sustainability 2023, 15, 1185. [Google Scholar] [CrossRef] [Scilit]
- Tang, R.; Zhang, Q.; Chen, Y.D.; Bai, W.J.; Xu, J.J.; Pang, Y.; An, Y.; Zhou, Z.; Hu, Z.H. Deciphering Pathogens Inactivation Mechanism during Anaerobic Co-Digestion of Food Waste and Waste Activated Sludge: The Role of PH. Chem. Eng. J. 2024, 498, 155197. [Google Scholar] [CrossRef] [Scilit]
- Meng, X.; Yu, D.; Wei, Y.; Zhang, Y.; Zhang, Q.; Wang, Z.; Liu, J.; Wang, Y. Endogenous Ternary PH Buffer System with Ammonia-Carbonates-VFAs in High Solid Anaerobic Digestion of Swine Manure: An Alternative for Alleviating Ammonia Inhibition? Process Biochem. 2018, 69, 144–152. [Google Scholar] [CrossRef] [Scilit]
- Aceves-Lara, C.A.; Latrille, E.; Conte, T.; Steyer, J.P. Online Estimation of VFA, Alkalinity and Bicarbonate Concentrations by Electrical Conductivity Measurement during Anaerobic Fermentation. Water Sci. Technol. 2012, 65, 1281–1289. [Google Scholar] [CrossRef] [Scilit] [PubMed]
- Mousa, H.; Silwadi, M. Predicting Biogas Production by Anaerobic Digestion of Organic Wastes through Kinetic Modeling. Theor. Found. Chem. Eng. 2023, 57, 1394–1402. [Google Scholar] [CrossRef] [Scilit]
- Syaichurrozi, I.B.; Sumardiono, S. Kinetic Model of Biogas Yield Production from Vinasse at Various Initial PH: Comparison between Modified Gompertz Model and First Order Kinetic Model. Res. J. Appl. Sci. Eng. Technol. 2014, 7, 2798–2805. [Google Scholar] [CrossRef] [Scilit]
- Karthikeyan, P.K.; Bandulasena, H.C.H.; Radu, T. A Comparative Analysis of Pre-Treatment Technologies for Enhanced Biogas Production from Anaerobic Digestion of Lignocellulosic Waste. Ind. Crops Prod. 2024, 215, 118591. [Google Scholar] [CrossRef] [Scilit]
- Cândido, D.; Bolsan, A.C.; Hollas, C.E.; Venturin, B.; Tápparo, D.C.; Bonassa, G.; Antes, F.G.; Steinmetz, R.L.R.; Bortoli, M.; Kunz, A. Integration of Swine Manure Anaerobic Digestion and Digestate Nutrients Removal/Recovery under a Circular Economy Concept. J. Environ. Manag. 2022, 301, 113825. [Google Scholar] [CrossRef] [Scilit] [PubMed]
- Negro, V.; Noussan, M.; Chiaramonti, D. Alternative Options for Biogas-to-Energy: A Comparison of Electricity and Biomethane Generation Based on the Real Operation of a Production Site. Appl. Energy 2025, 377, 124687. [Google Scholar] [CrossRef] [Scilit]
- Nik Zad, A.; Zainali, S.; Croci, M.; Guezgouz, M.; Impollonia, G.; Elia Campana, P.; Amaducci, S. Techno-Economic Optimization of Agrivoltaic-Powered Anaerobic Digestion Plant for Biomethane Production. Energy Convers. Manag. 2026, 348, 120791. [Google Scholar] [CrossRef] [Scilit]

Disclaimer/Publisher’s Note: The statements, opinions and data contained in all publications are solely those of the individual author(s) and contributor(s) and not of MDPI and/or the editor(s). MDPI and/or the editor(s) disclaim responsibility for any injury to people or property resulting from any ideas, methods, instructions or products referred to in the content. |
© 2026 by the authors. Licensee MDPI, Basel, Switzerland. This article is an open access article distributed under the terms and conditions of the Creative Commons Attribution (CC BY) license.