


Abstract
Renewable power plants connected to low-system-strength grids are increasingly dominated by inverter-based resources (IBRs). Their point of common coupling (PCC) voltage is therefore shaped not only by reactive-power support but also by active-power ramps, network impedance, short-circuit capacity, and converter limits. Conventional Q-V droop control, fixed power-factor control, Volt/VAR control, and fixed active-power/reactive-power (P/Q) decoupling schemes often absorb active-power excursions into the voltage error, which can drive excessive reactive-power injection during fault clearing, post-fault power recovery, and phase-angle disturbances. Here, an active-power–voltage-coupling-aware reactive-power compensation (APVQ-RC) method is proposed for plant-level voltage control. The method estimates local P-V and Q-V voltage sensitivities online, reconstructs an effective voltage error, and produces a capacity-constrained reactive-power reference through smooth coupling activation. The reduced-order evaluation includes estimator conditioning, excitation screening, sensitivity-estimation error and empirical 95% estimator-error intervals, sensitivity to the smoothing factor and window length, measurement noise, converter capability saturation, and computational timing. Under P-V-coupled transients, APVQ-RC reduces voltage overshoot and reactive-power compensation energy while retaining Q-V-like support during voltage-sag-dominated events. Compared with the best scanned fixed P/Q baseline, it reduces overshoot, reactive-power compensation energy, and reactive-power peak by 42.03%, 60.35%, and 8.90%, respectively; the representative single-step calculation time is 0.0188 ms within a 1 ms control cycle. These results indicate millisecond-scale plant-level feasibility within the reduced model, while electromagnetic-transient, hardware-in-the-loop, and field validation remain necessary before deployment.
1. Introduction
Power systems with high renewable penetration are moving from distributed interconnection towards plant-level aggregation of inverter-based resources (IBRs). As synchronous machine capacity is displaced, lower system strength and reduced inertia make the PCC voltage more sensitive to current injection, impedance angle, and converter controls [1,2,3,4]. In this setting, voltage regulation is no longer governed by reactive power alone; it is also affected by active-power trajectories and converter operating limits.
Utility-scale renewable plants contain heterogeneous assets, including wind turbines, photovoltaic inverters, energy storage systems, static var generator (SVG) units, static synchronous compensators (STATCOMs), and plant-level controllers. Active-power fluctuations, post-fault recovery ramps, power limits, and changing reactive-power headroom can all perturb PCC voltage [1,2,3,4,5,6,7]. In low-system-strength grids, the resulting voltage response is a coupled P-V/Q-V process rather than a purely reactive-power regulation problem.
The linearized weak-grid power-flow relation contains both the RΔP and XΔQ components of PCC-voltage variation. As the short-circuit ratio (SCR) decreases, the R/X ratio increases, or post-fault active-power recovery becomes faster, the active-power term can be comparable with the reactive-power term. Active power is therefore a dynamic state that can reshape local voltage, not a slow independent variable that can be ignored in reactive-power compensation.
At the system level, renewable-rich integrated energy systems are also exposed to uncertainty from renewable generation, hydrogen-powered vehicle demand, and coupled microgrid-transportation operation [8]. Such uncertainty appears at the plant controller as time-varying active-power ramps, variable converter headroom, and shifting operating points. This reinforces the need for online P-V/Q-V sensitivity estimation rather than a fixed feedforward coefficient.
Existing studies have examined system-strength assessment based on SCR, impedance modeling, inverter synchronization stability, phase-locked-loop (PLL) interactions, grid-forming and grid-following control, Q-V droop, Volt/VAR curves, SVG/STATCOM support, inverter current limiting, and plant-level reactive-power coordination [5,6,7,9,10,11,12,13,14,15,16,17,18,19,20,21,22,23,24,25,26,27]. These studies establish that renewable-rich voltage control depends on network strength, impedance characteristics, converter dynamics, and available reactive-power capacity.
Three gaps remain. First, conventional voltage controllers may conflate external voltage faults with active-power-induced voltage offsets. Second, fixed P/Q decoupling or fixed active-power feedforward is sensitive to SCR, R/X, and the operating point. Third, impedance-based stability analysis has not been translated into a lightweight online error-reconstruction law that can be embedded in a plant-level reactive-power controller. APVQ-RC is developed to close this control-oriented gap.
2. Materials and Methods
2.1. Equivalent Weak-Grid Model
A reduced-order discrete weak-grid equivalent is adopted to represent the local dynamic relation between the renewable plant and the external grid. The model is not intended to replace a detailed electromagnetic-transient (EMT) model; instead, it isolates the millisecond-scale PCC-voltage response to active-power variation, reactive-power variation, and exogenous voltage disturbance [28].
The renewable plant is represented as an aggregated grid-connected source. The PCC-voltage increment is driven jointly by active-power increments, reactive-power increments, and unmeasured external disturbances. Equation (1) defines the incremental model used throughout the analysis:
In Equation (1), k is the discrete sampling index; ΔV(k) denotes the PCC voltage variation during the k-th sampling interval; ΔP(k) and ΔQ(k) denote active- and reactive-power increments, respectively; d(k) represents external disturbances that cannot be directly explained by plant power, such as voltage sags, phase-angle jumps, or fault clearing; and SVP(k) and SVQ(k) are the local sensitivities of PCC voltage to active- and reactive-power increments. Voltage is expressed in p.u., P in MW, and Q in MVar; consequently, SVP and SVQ have units of p.u./MW and p.u./MVar in the reported simulations. Equation (2) defines SCR = Ssc/SN, where Ssc is the short-circuit capacity at the grid-connection point and SN is the plant power base used for SCR calculation. In Equations (3) and (4), yW is the voltage-increment observation vector within window W, XW is the regression matrix composed of ΔP and ΔQ, = [SVP SVQ]T is the parameter vector, represents measurement noise and unmodeled residuals, and is the Tikhonov regularization coefficient, which stabilizes the least-squares estimate when the regression matrix is ill conditioned. The regression is solved after numerical normalization, so is dimensionless in the implemented normal equation.
A larger absolute SVP indicates that a given active-power perturbation produces a larger equivalent voltage deviation at the PCC, whereas a larger absolute SVQ indicates stronger reactive-voltage sensitivity. Lower SCR and larger R/X increase the relative importance of active-power effects. The SCR and R/X scans therefore test whether APVQ-RC remains effective across different levels of grid strength and impedance coupling.
2.2. Baseline Controllers
Two representative baselines are used. Conventional Q-V control maps the PCC-voltage error to a reactive-power command through a proportional–integral channel. The fixed P/Q decoupling baseline augments Q-V control with a constant active-power feedforward term. These baselines are deliberately simple and broadly used, which makes them appropriate references for isolating the effect of online sensitivity-based error reconstruction.
In Equation (5), QQV(k) is the reactive-power reference generated by conventional Q-V control, Q0 is the steady-state reactive-power base value, Kv is the voltage proportional gain, Ki is the integral gain, Vref is the reference voltage, V(k) is the measured PCC voltage, and Ts is the sampling period. In Equation (6), Qdec(k) is the reactive-power reference of the fixed P/Q decoupling controller, and Kdec is the fixed decoupling coefficient.
The Q-V controller converts voltage error directly into reactive-power support. It is effective during voltage-sag-dominated events, but can overreact when active-power ramps dominate the measured voltage deviation.
The fixed P/Q decoupling baseline acknowledges that active-power variation affects voltage control, but represents this effect with a single constant coefficient. Because SVP and SVQ vary with SCR, R/X, operating point, and controller state, a fixed Kdec cannot remain locally optimal across disturbance types. The Kdec scan therefore tests the limits of a nonadaptive feedforward approximation.
2.3. APVQ-RC Adaptive Reactive-Power Compensation Controller
APVQ-RC acts by reconstructing the voltage error before the reactive-power target is updated. At each sampling instant, it estimates the active- and reactive-power contributions to PCC-voltage variation and removes the active-power-induced equivalent voltage component from the raw error when the P-V channel is dominant. The control kernel consists of a sliding-window least-squares estimator, a scalar activation law, and a capacity-limited PI channel, making it suitable for periodic plant-level control.
At each sample, the controller measures V(k), P(k), and Q(k), forms ΔP(k), ΔQ(k), and ΔV(k), and estimates SVP and SVQ over the accepted sliding window. It then computes λPV(k) and α(k), reconstructs the effective voltage error in the reactive-control direction, and updates the APVQ-RC reactive-power reference. The sliding window is updated at every sample, so the controller does not wait for a full window before issuing the 1 ms reactive-power reference.
The online APVQ-RC update procedure is implemented at every sampling instant as follows: (i) sample V(k), P(k), and Q(k); (ii) compute ΔP(k), ΔQ(k), and ΔV(k); (iii) update the sliding window and retain only samples satisfying the voltage-jump and excitation criteria; (iv) solve the regularized estimator in Equation (4), reject the update when cond > 1012 or the minimum singular value of XW is below 1 × 10⁻⁴, and otherwise project and smooth SVP and SVQ; (v) compute λPV(k), α(k), and the effective error eeff(k); (vi) update the leaky PI state with anti-windup; (vii) enforce the instantaneous P-Q capability curve with active-power priority and reactive-power saturation; and (viii) send Qref(k) to the plant-level reactive-power actuator while storing the accepted states for the next sample.
During the first W samples, the estimator uses all available valid increments after at least eight accepted samples have been collected; before that point, nominal weak-grid sensitivities are used. Samples are admitted only when the voltage jump is below 0.04 p.u. and the window contains sufficient P/Q excitation. The condition number of the regularized normal matrix and the minimum singular value of the regression matrix are monitored; ill-conditioned updates are rejected and the previous bounded estimate is retained.
The estimator does not assume unconditional invertibility. Numerical robustness is obtained by Tikhonov regularization, excitation screening, condition-number rejection, projection, and exponential smoothing. Thus, poorly excited or noise-dominated windows do not force an unreliable matrix inversion; they hold the last admissible sensitivity estimate until informative data become available.
In Equation (7), is a coupling-strength index for measured P- and Q-channel voltage components. The numerator estimates the active-power contribution to PCC-voltage variation, whereas the denominator represents the reactive-power contribution with zero-avoidance regularization. Equation (8) maps λPV(k) to the continuous activation factor , and Equation (9) defines the effective voltage error from the raw error .
Equation (7) is not used as a stand-alone fault classifier. The unmeasured disturbance d(k) is excluded from the denominator because it is not a controllable measured input. Large exogenous voltage jumps are handled by sample screening, while the raw Q-V path remains active during voltage-sag-dominated events. Under mixed disturbances, λPV quantifies the filtered P-channel contribution to the measured voltage variation rather than the physical origin of every voltage component. Near-zero ΔQ is regularized by and constrained by the P-Q capability limiter, whereas sign-inconsistent or rapidly varying sensitivity estimates are bounded by projection, smoothing, and condition-number rejection.
A larger λPV indicates that the measured transient is dominated by the active-power channel; a smaller λPV indicates voltage-sag dominance or insufficient reactive support.
A continuous activation law is used instead of a hard threshold because active-power ramps and voltage faults often overlap in plant operation. Smooth activation avoids threshold chatter and preserves continuity of the reactive-power command.
The sign in Equation (9) follows the adopted reactive-control convention. Positive ΔP denotes increasing active-power injection from the plant to the grid, and positive ΔQ denotes increasing capacitive reactive-power injection. Under the weak-grid equivalent, positive SVPΔP raises the active-power-related PCC-voltage component; this component should therefore be removed from the voltage error seen by the reactive-power channel. APVQ-RC consequently uses .
Bounded operation is enforced by three mechanisms. First, is constrained between zero and unity, preventing unbounded amplification of the active-power correction. Second, the integral state uses activation-dependent leakage, magnitude limiting, and rollback anti-windup under saturation. Third, the reactive-power reference is clipped by the instantaneous P-Q capability envelope, so the command remains physically feasible for the converter.
The sliding-window estimator has only two regressors, ΔP and ΔQ. With a 50-sample window, the computation is a small regularized least-squares problem followed by scalar updates. The window length affects variance and smoothing, but not the 1 ms update cadence of the reactive-power reference [24].
When active-power disturbances dominate the voltage variation, λPV increases, α approaches unity, and the active-power-induced equivalent voltage component is removed from the raw error. When voltage sag dominates or active power is nearly steady, λPV approaches zero and the controller smoothly reverts toward Q-V support. This continuous reversion avoids threshold-induced chatter while preserving fast low-voltage support.
A representative online calculation is reported at 1.020 s in the active-power step-down case, where no external voltage disturbance is applied. At this instant, ΔP and ΔQ are −0.479 MW and 0.067 MVar, and the measured ΔV is −0.001107 p.u. The 50-sample estimator has a regularized condition number of 1649.99. The smoothed estimates are SVP = 0.000705 p.u./MW and SVQ = 0.001020 p.u./MVar, giving active- and reactive-channel voltage components of −0.000337 p.u. and 6.84 × 10⁻⁵ p.u. The resulting and α are 4.86 and 0.82934, respectively. The effective PI input changes from eraw = 0.023223 p.u. to eeff = 0.023503 p.u., illustrating the sample-level P-V correction.
The Q-V-like operating region is defined by the activation level. For α < 0.1, the corresponding coupling index satisfies λPV < 0.111. Under the nominal SCR = 2 and R/X = 1.0 condition, the median sensitivities are SVP = 0.0016 p.u./MW and SVQ = 0.0027 p.u./MVar. Thus, for a simultaneous 30 MVar reactive-power increment, active-power variation below approximately 5.63 MW per control sample keeps the controller in the Q-V-like region.
2.4. Evaluation Metrics
In Equation (12), is the maximum voltage overshoot and reflects the degree to which the voltage exceeds its reference after fault clearing. In Equation (13), is the reactive compensation energy and measures the intensity of reactive resources mobilized during a disturbance; a smaller indicates less reactive-power misoperation and less reactive-power tailing. In Equation (14), is the post-clearing oscillation index, which evaluates the accumulated voltage deviation from the reference during a time interval after fault clearing.
This study also reports the recovery time Trec, defined as the time required for the PCC voltage to recover to 0.9 per unit (p.u.). Recovery time quantifies practical low-voltage support speed within the reduced-model setting. Overshoot and describe recovery quality, describes reactive-power control cost, and the four metrics together avoid one-sided conclusions based on a single indicator.
3. Simulation Setup
The test design covers four control properties: voltage-sag support, adaptation beyond a fixed feedforward coefficient, millisecond-scale computational feasibility, and engineering boundaries requiring higher-fidelity validation. The cases include fault recovery, disturbance-type comparison, weak-grid and fixed-baseline scans, noise robustness, plant-parameter uncertainty, and timing tests.
The tests are mechanism-oriented. The reduced-order weak-grid equivalent is used to compare error reconstruction and reactive-power overcompensation under controlled conditions; EMT, hardware-in-the-loop, and field tests are required for deployment-level validation.
3.1. Parameter Settings
The test system uses a 1 ms sampling period over 2 s. The base apparent power is Sb = 100 MVA, with P0 = 100 MW, Q0 = 0 MVar, and V0 = Vref = 1.0 p.u.; Sb is used for per-unit normalization and SCR calculation, not as the instantaneous converter rating. The default grid is SCR = 2 and R/X = 1.0, and the scans use SCR = [1.5,2,3,5] and R/X = [0.1,0.5,1.0]. The converter rating is Srated = 135 MVA with an active-priority P-Q capability limit.
The dynamic plant model used to generate P(k), Q(k), and V(k) is a first-order discrete equivalent. Active power tracks its disturbance command with time constant τP; reactive-power output tracks Qref with time constant τQ; and PCC voltage follows the weak-grid static operating point with time constant τV. A P-Q capability check is applied at every sample with active-current priority, so the reactive-power command is saturated to the remaining apparent-power headroom.
To assess real-time feasibility, the test was designed with 100,000 repeated controller updates using double precision. The reported time includes only the control-law calculation and excludes sampling, communication, and actuator delays; end-to-end latency must be verified on the target platform. Table 1 reports 0.0188 ms as the representative single-step time. A repeated timing run gave a mean of 0.0156 ms, a 95th percentile of 0.0194 ms, a 99th percentile of 0.0374 ms, and a maximum of 1.4151 ms, with the maximum attributed to operating-system scheduling jitter rather than deterministic arithmetic workload.
Table 1.
Control-cycle and response-speed indices.
The parameter values were selected for implementability, interpretability, and preservation of low-voltage support, rather than to reproduce a single favorable waveform. Kv and Ki retain the response speed of conventional Q-V control. The window length W, smoothing factor β, projection bounds, and regularization coefficient μ suppress sensitivity-estimation noise. The zero-avoidance term and the P-Q capability limiter avoid numerical singularity and infeasible commands. Table 2 lists the resulting settings.
Table 2.
APVQ-RC implementation parameters.
3.2. Baselines and Robustness Tests
The baselines are conventional Q-V control, fixed P/Q decoupling, and APVQ-RC. The fixed coefficient Kdec is scanned over [0, 0.005, 0.012, 0.02, 0.04, 0.08] under the same capacity and anti-windup constraints, and the best value is selected separately for each metric. Thus, the comparison represents a single-coefficient, nonadaptive feedforward baseline.
Robustness tests vary SCR, R/X, fixed Kdec, measurement noise, actuator time constants, and P-Q capability stress. Here, σV, σP, and σQ are the standard deviations of voltage, active-power, and reactive-power measurement noise; τP and τQ are first-order actuator time constants; and RMSE is the root-mean-square error between estimated and known reduced-model sensitivities. Under high noise, APVQ-RC keeps lower mean OV and EQ than Q-V control (4.743% and 7.961 MVar·s versus 9.419% and 21.508 MVar·s). The SVP/SVQ estimator RMSEs are 5.11 × 10⁻³ and 1.85 × 10⁻³, and the median/95th-percentile condition numbers are 87.0 and 8.15 × 10⁴, indicating that ill-conditioned windows are screened before estimation.
Sensitivity to β and W is evaluated with β = 0.85, 0.90, 0.95, and 0.98 and W = 30, 50, 80, and 100. Across the 16 combinations, Trec remains 12 ms, OV changes only from 5.238% to 5.570%, EQ from 8.424 to 8.621 MVar·s, and peak Q from 61.834 to 63.540 MVar. Therefore, β and W mainly tune estimator smoothness and delay, while the 1 ms command update is retained.
4. Results and Discussion
4.1. Default Weak-Grid Fault-Recovery Case
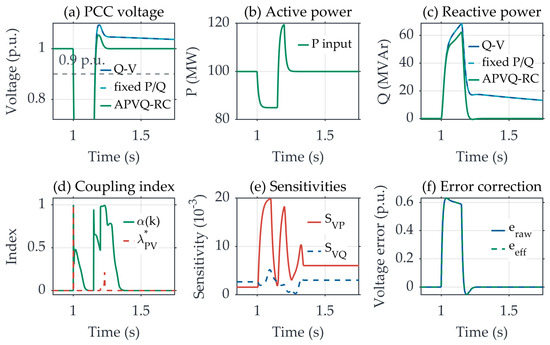
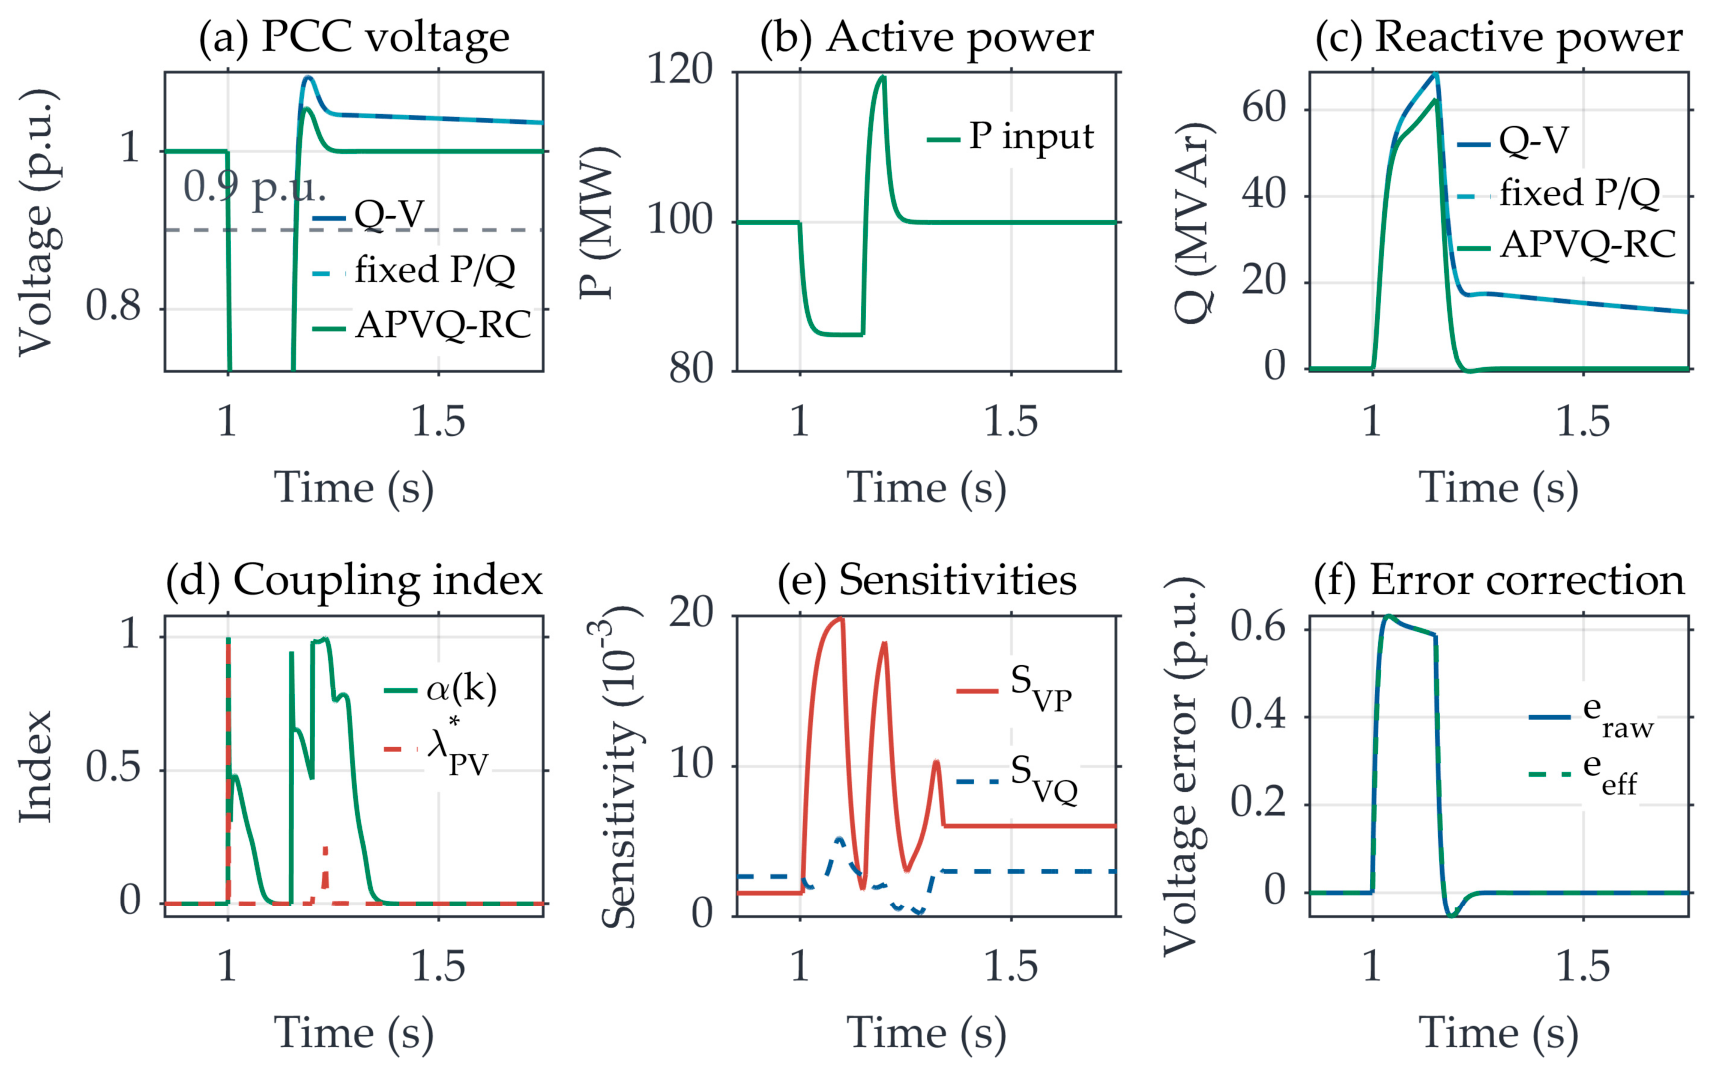
The default case isolates the interaction among fault clearing, active-power recovery, voltage overshoot, and reactive-power tailing. Figure 1 resolves the voltage, power, activation, sensitivity, and error-reconstruction dynamics.
Figure 1.
Fault-recovery mechanism of APVQ-RC under low-system-strength conditions.
Figure 1a indicates that APVQ-RC preserves low-voltage support during the fault and suppresses post-clearing overshoot during active-power recovery. Figure 1b,c link this overshoot to the active-power ramp and reactive-power tailing, confirming that the measured voltage error contains a P-channel component.
Figure 1d–f show that λPV and α provide event-dependent activation. SVP and SVQ set the local scale for error reconstruction, allowing the controller to replace the raw voltage error with an effective error aligned with the required reactive-power support. In Figure 1d, λPV* denotes the normalized P-V coupling index, i.e., λPV/max(λPV); it is plotted for direct comparison with α(k), whereas APVQ-RC evaluates the activation law using the unnormalized coupling index.
4.2. Response Comparison Under Different Disturbance Types
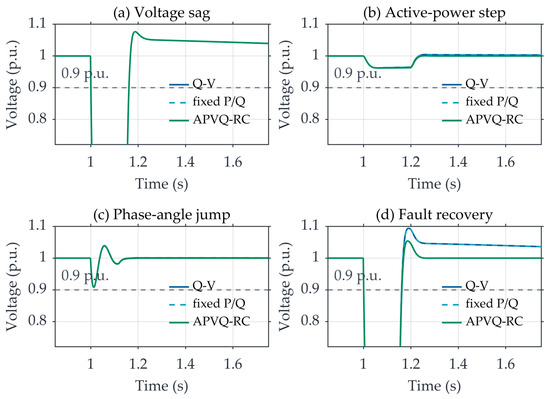
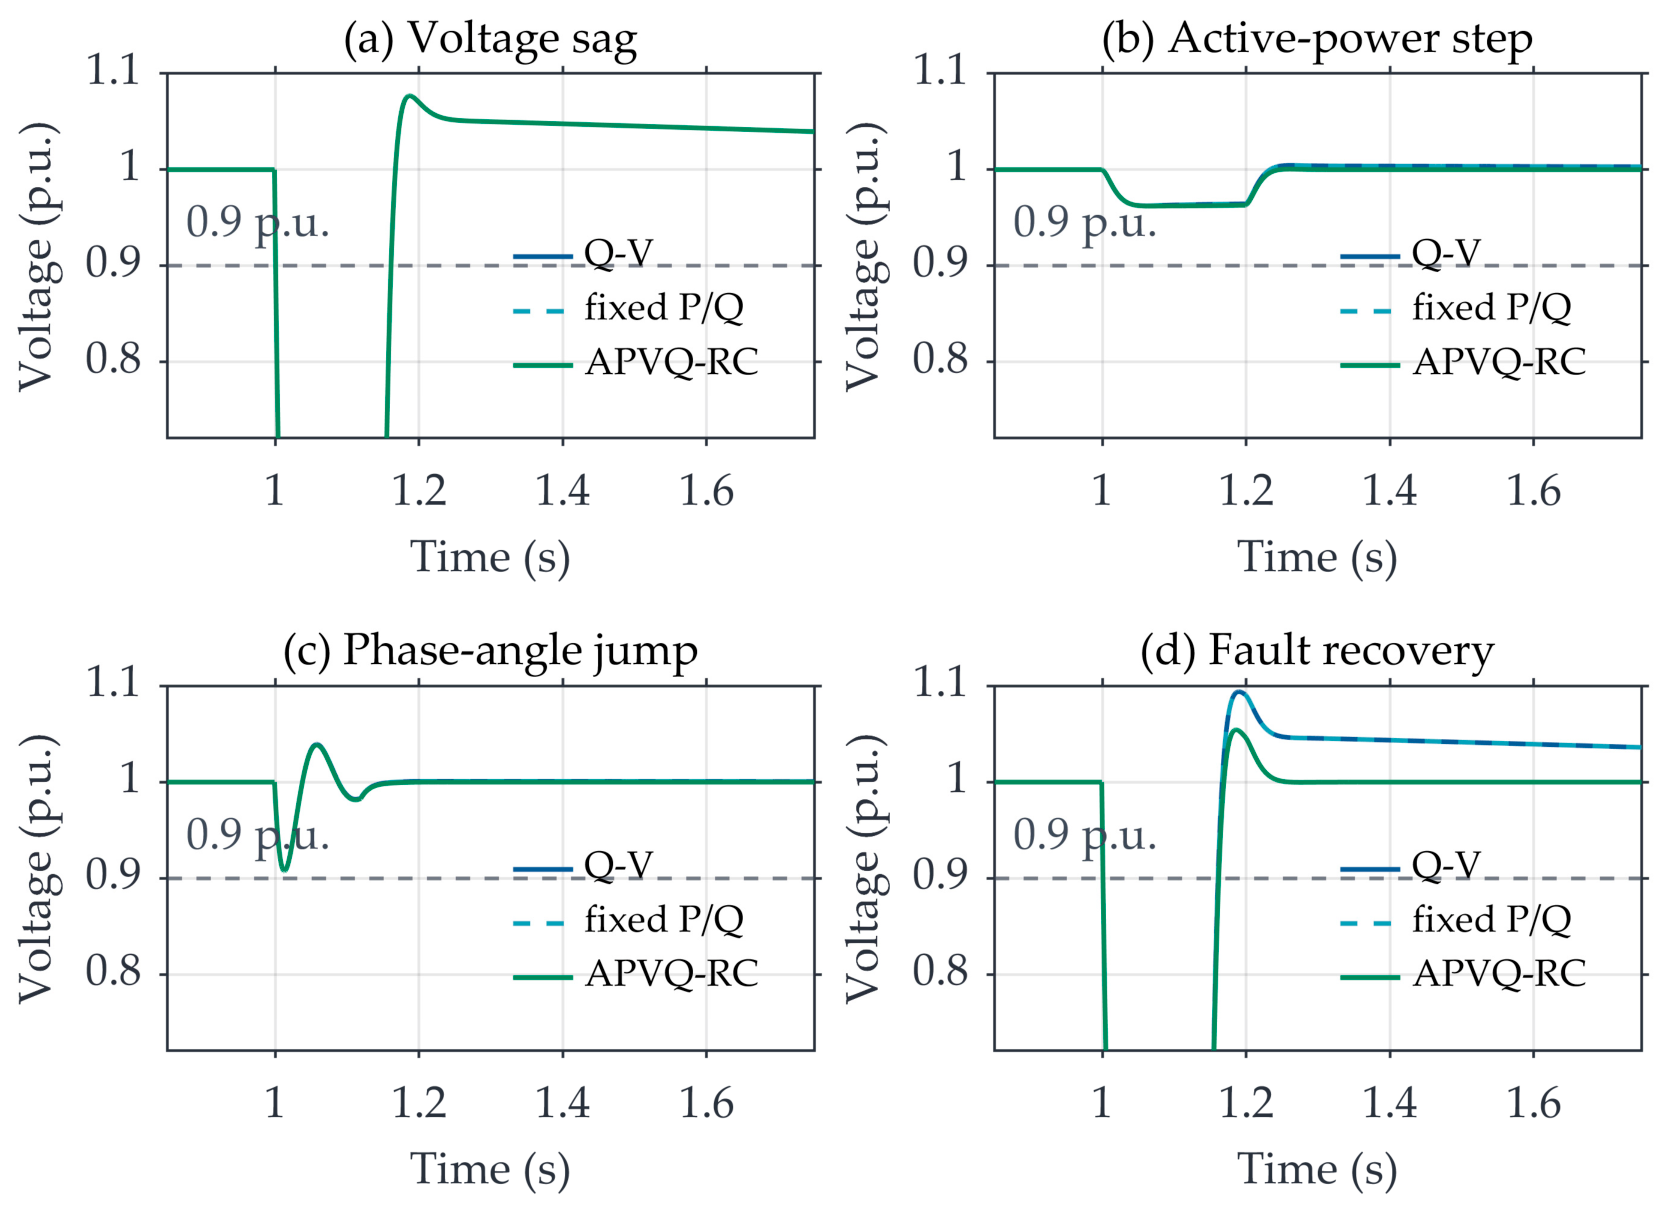
Figure 2 defines the disturbance-dependent operating boundary of APVQ-RC. Under a voltage-sag-dominated event, Figure 2a shows smooth reversion toward conventional Q-V support. Under active-power steps, phase-angle disturbances, and fault recovery, Figure 2b–d show that error reconstruction suppresses reactive-power overcompensation.
Figure 2.
Event-dependent APVQ-RC responses under representative disturbances.
The results indicate that APVQ-RC preserves necessary reactive-power support when λPV is small. When the P-channel contribution increases, the controller separates the active-power-related voltage component from the Q-V loop, thereby reducing overshoot and reactive-power cost.
4.3. Metric Comparison and Control Cost
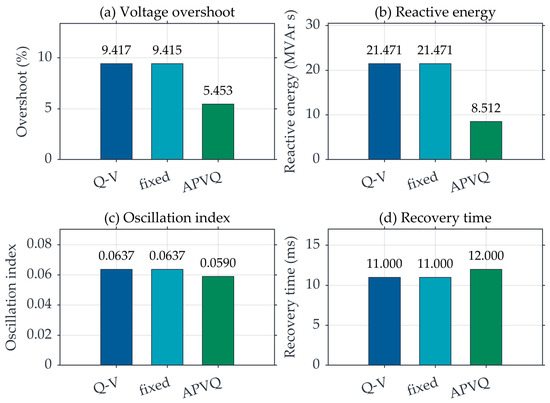
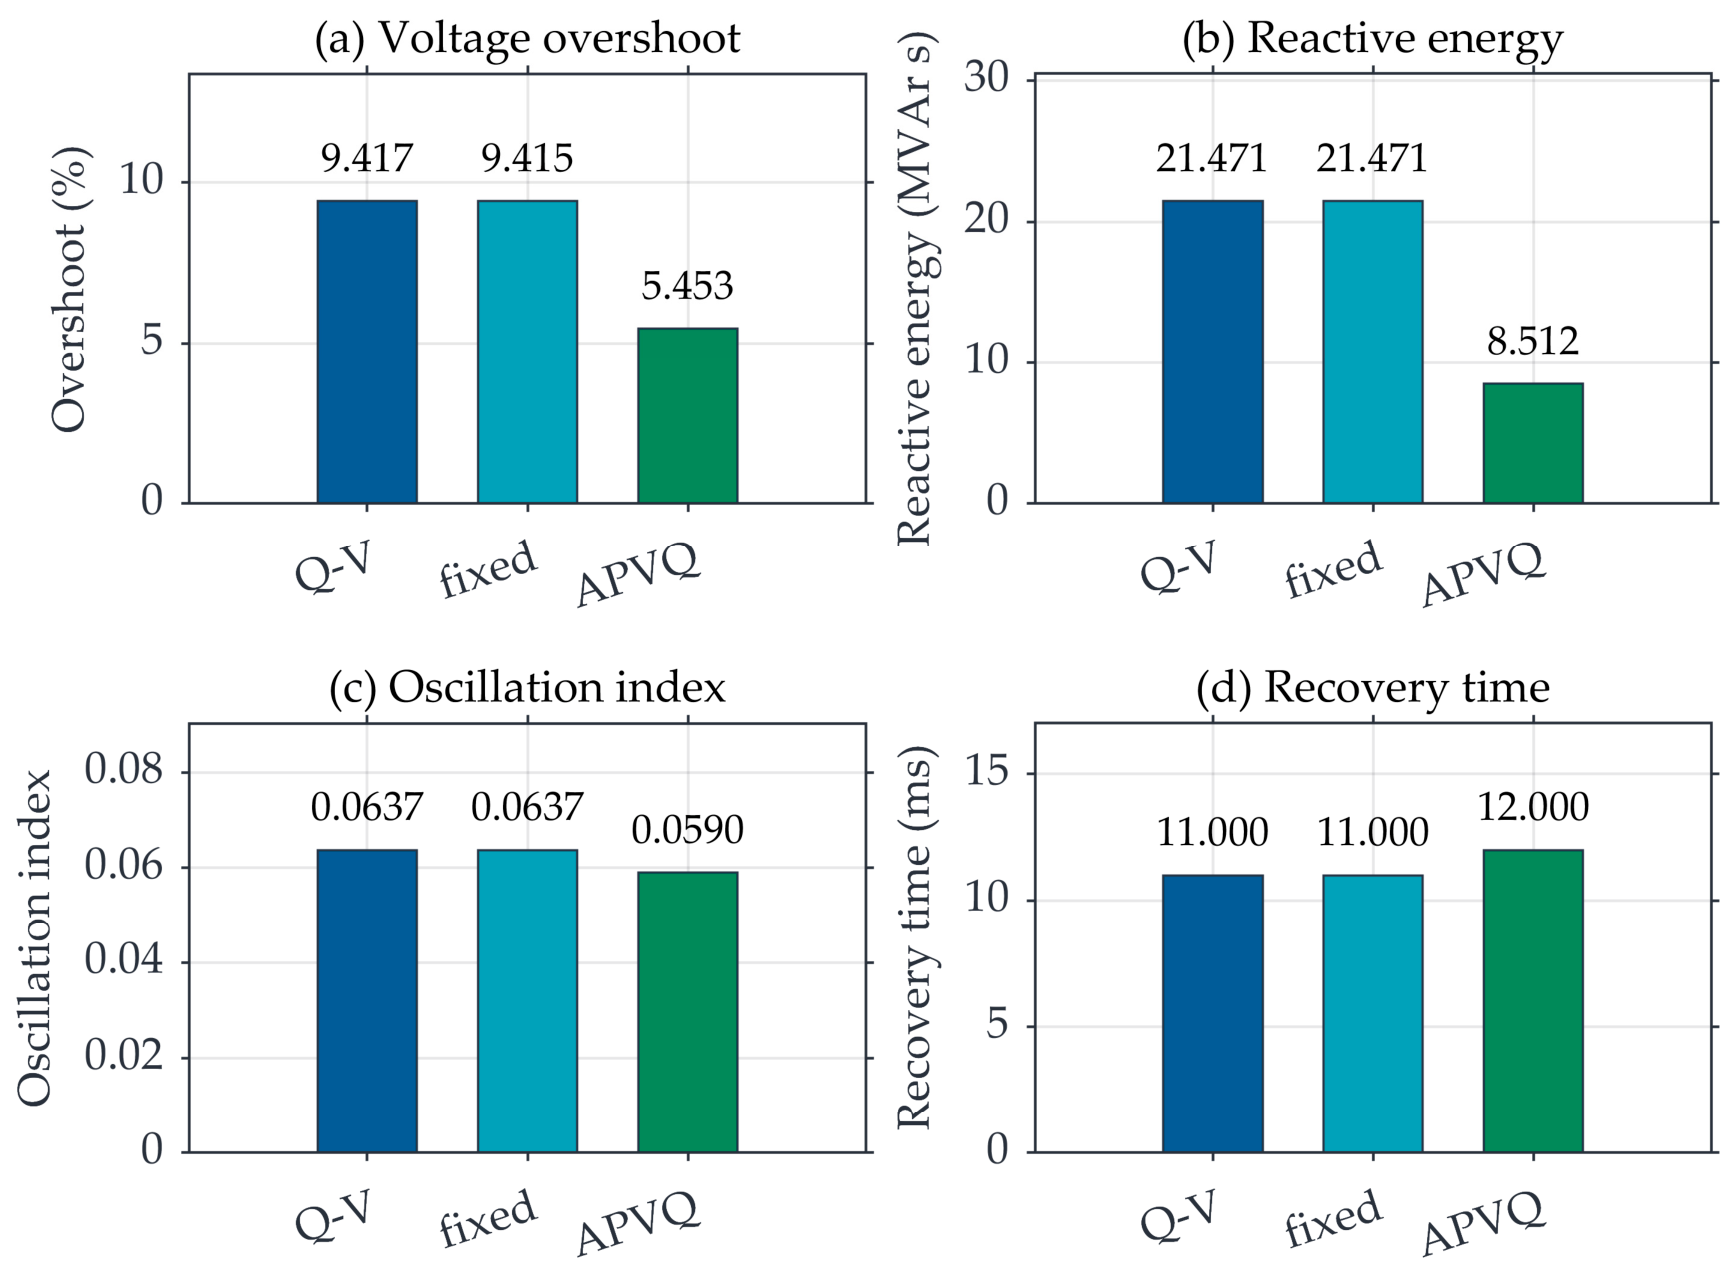
Figure 3 benchmarks voltage overshoot, reactive-power compensation energy, post-clearing oscillation, and recovery speed. The metric set indicates that APVQ-RC reduces P-V-coupling-induced overcompensation while keeping recovery on a tens-of-milliseconds time scale.
Figure 3.
Metric-level benchmarking and real-time feasibility in the default case.
4.4. Fixed Decoupling Parameter Scan
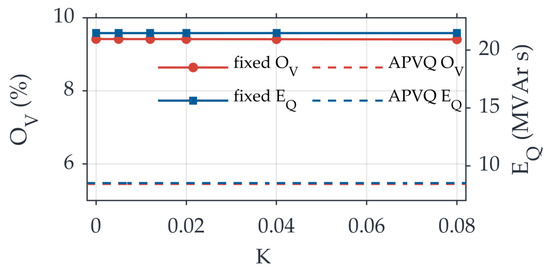
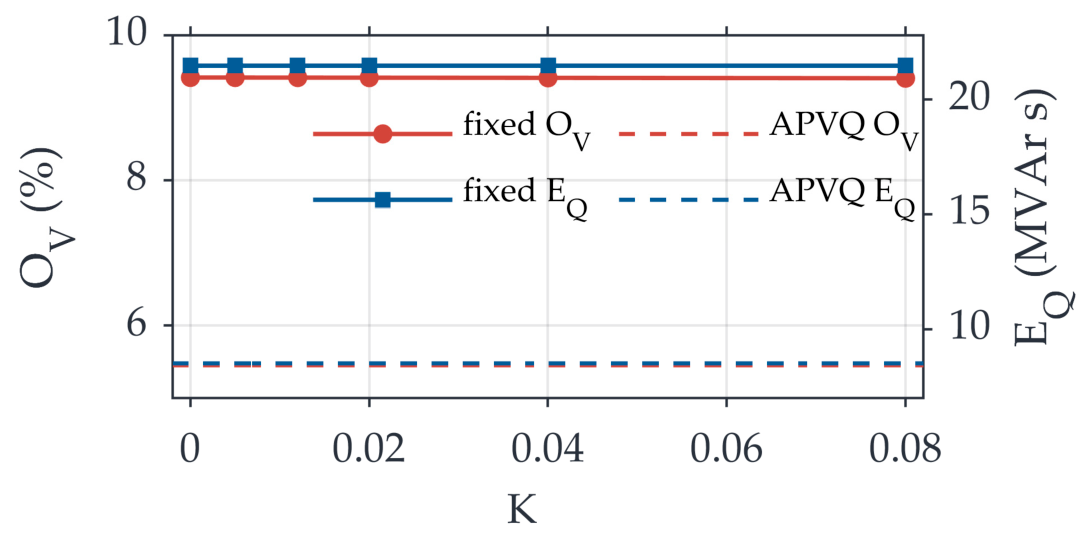
Figure 4 quantifies the range over which a fixed feedforward gain can compensate P-V coupling. Because Qdec = QQV + KdecΔP, Kdec is a reactive-power-per-active-power coefficient with units of MVar/MW. The tested interval Kdec = [0, 0.08] represents a same-sign damping feedforward range under the adopted sign convention, rather than a full signed gain-scheduling search. The nearly horizontal curves indicate that a single fixed coefficient has limited adaptability across the tested operating conditions.
Figure 4.
Fixed P/Q feedforward-gain scan.
The fixed-gain comparison is restricted to a representative single-coefficient feedforward baseline. More elaborate fixed-control designs, including negative-gain scans, piecewise Kdec, offline optimized Kdec, gain scheduling, adaptive feedforward control, and model-predictive voltage control, may perform better when tuned under matched constraints. The contribution of APVQ-RC is the online estimation of SVP/SVQ, smooth activation by λPV and α, and effective-error reconstruction during fault recovery.
The quantitative comparison is therefore limited to the reduced-order benchmarks with identical constraints and tuning objectives. Within this scope, the results support the adaptability of APVQ-RC against the representative baselines considered here; broader comparisons require matched converter limits, delays, disturbance profiles, and tuning objectives.
4.5. Coupling Relation, Control Trade-Off, and Model Consistency
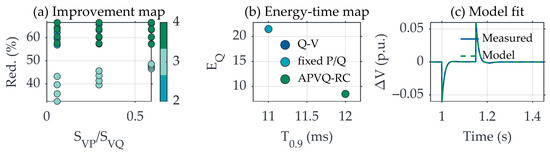
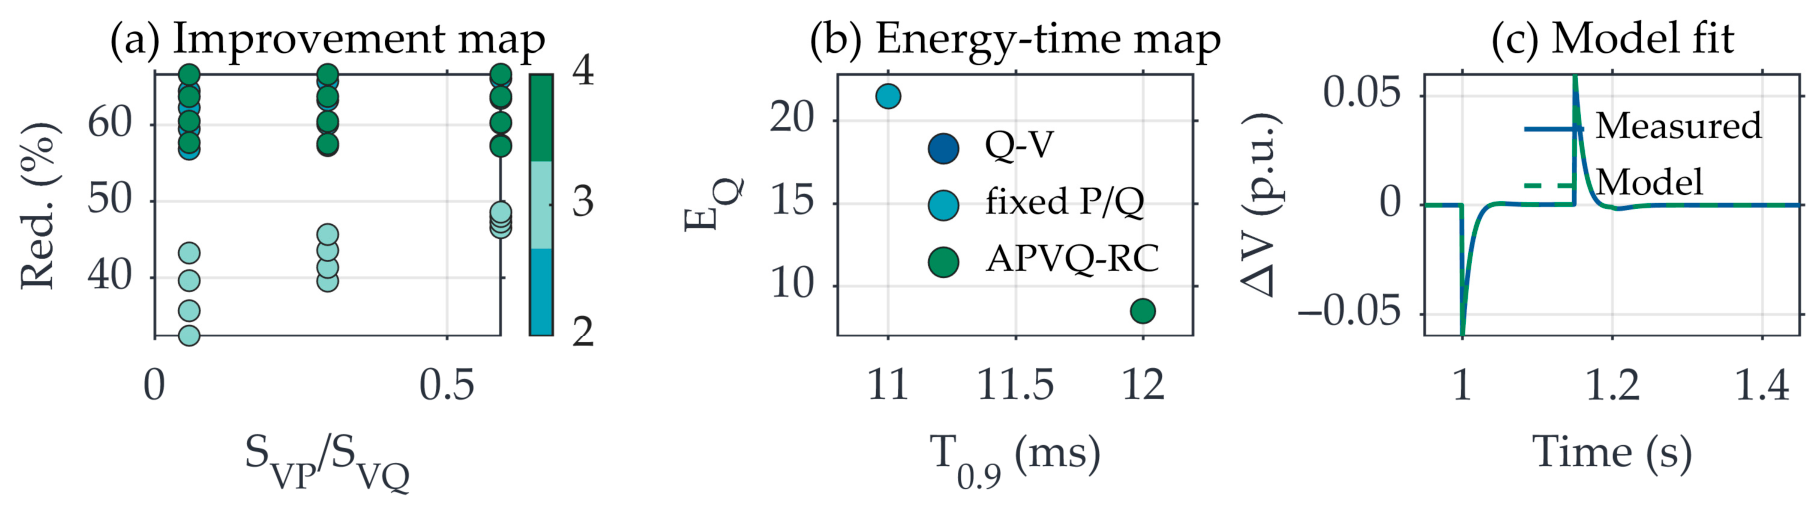
Figure 5 connects coupling strength, control cost, and reduced-model consistency. Figure 5a relates the P-V coupling ratio to performance improvement, Figure 5b gives the recovery-speed/reactive-power-cost trade-off, and Figure 5c compares simulated voltage increments with equivalent-model predictions. This consistency check supports the reduced-order implementation but does not replace nonlinear EMT, hardware-in-the-loop, or field validation.
Figure 5.
Coupling strength, control cost, and reduced-model consistency.
Figure 5 further indicates that SVP/SVQ is a local measure of P-V participation rather than a stand-alone predictor of performance gain. The results support local sensitivity-based error reconstruction within the discrete equivalent controller, while independent nonlinear converter-grid studies remain necessary for deployment-level claims.
The EMT-dependent phenomena most likely to alter the response are PLL bandwidth, converter current limiting and priority logic, inner current-loop saturation, PWM and switching delay, measurement filtering, communication delay, protection blocking, and multi-converter interactions. These effects can change the apparent SVP/SVQ, introduce phase lag among P, Q, and V, or clip the reactive-power command at the capability limit.
5. Comparison with Existing Methods and Methodological Advantages
The results in Section 4 show that APVQ-RC differs from Q-V control, fixed P/Q decoupling, and optimization-based methods in error construction, parameter adaptability, smooth reversion to Q-V support, and real-time implementation. By estimating the active-power contribution before issuing the reactive-power command, APVQ-RC reduces overcompensation and parameter-mismatch risk with low computational burden.
Unlike conventional Q-V control, APVQ-RC separates the active-power-induced equivalent voltage component before reactive-power regulation. Figure 1 and Figure 3 show lower overshoot and reactive-power compensation energy with millisecond-scale recovery. Compared with the best scanned fixed P/Q baseline in the default reduced-order benchmark, APVQ-RC reduces OV, EQ, Qpeak, and OscV by 42.03%, 60.35%, 8.90%, and 7.40%, respectively. Online voltage-sensitivity estimation and adaptive activation therefore avoid the mismatch of a single Kdec across SCR, R/X, and disturbance types within the tested constraints.
APVQ-RC also provides event-dependent activation and smooth reversion to Q-V support. Figure 2a shows Q-V-like support during a voltage-sag-dominated event, whereas Figure 2b–d show that error reconstruction activates when P-V coupling strengthens. The 0.0188 ms single-step time in Table 1 provides computational margin within a 1 ms control cycle.
Relative to published impedance-reshaping, PLL-stability-enhancement, Volt/VAR optimization, and data-driven dispatch methods [9,10,11,12,13,14,15,16,17,18,19,20,21,22,23,24,25,26], APVQ-RC is a local plant-level correction rather than a network-wide optimizer. It requires only VPCC, P, and Q measurements, solves a two-regressor regularized estimator, and retains an explicit Q-V support path. The quantitative claims are therefore confined to the identical reduced-order benchmarks reported here.
6. Conclusions
This study develops a fast adaptive reactive-power compensation method for renewable power plants under dynamic active-power–voltage coupling. The main conclusions are as follows.
- (1)
- In low-system-strength grids, PCC voltage is affected by reactive-power support, post-fault active-power recovery, phase-angle disturbances, and plant-output variation. APVQ-RC estimates local P-V/Q-V sensitivities online and converts the active-power-related voltage component into an effective-error correction for reactive-power compensation.
- (2)
- Compared with conventional Q-V control and the representative fixed P/Q baseline, APVQ-RC reconstructs the voltage error according to the coupling state. When active-power disturbances participate in the transient, it reduces post-clearing voltage overshoot and reactive-power compensation energy while maintaining recovery on a tens-of-milliseconds time scale under identical reduced-model constraints.
- (3)
- APVQ-RC provides event-dependent activation and smooth reversion to Q-V support. During voltage-sag-dominated events, the coupling factor remains low and the response stays close to Q-V control; during active-power steps, phase-angle disturbances, or fault recovery, error reconstruction becomes active.
- (4)
- Multi-disturbance, weak-grid, fixed-parameter, noise, uncertainty, and timing tests support the conclusions within the equivalent model. APVQ-RC updates the reactive-power reference every 1 ms, with a representative single-step calculation time of 0.0188 ms and a 95th-percentile repeated-run time of 0.0194 ms. Estimator-error diagnostics, condition-number monitoring, excitation screening, sensitivity scanning of the smoothing factor and window length, and P-Q capability handling define the present applicability boundary. Further validation using nonlinear EMT models, hardware-in-the-loop tests, and field data is required for deployment.
Author Contributions
Conceptualization, J.L. and C.Y.; methodology, J.L.; validation, M.X., J.L. and X.X.; formal analysis, Y.A.; investigation, Q.H.; data curation, Y.G.; writing—original draft preparation, J.L.; writing—review and editing, M.X. and C.Y.; supervision, X.X. All authors have read and agreed to the published version of the manuscript.
Funding
This research was funded by the Science and Technology Project of State Grid Hubei Electric Power Co., Ltd., grant number B31532257735.
Data Availability Statement
The original contributions presented in this study are included in the article. Further inquiries can be directed to the corresponding author.
Conflicts of Interest
Authors Jiacheng Li, Chang Ye, Menghan Xiao, Xun Xu, Yuqi Ao, Qixiang Huang and Yuwei Gui were employed by the company State Grid Hubei Electric Power Research Institute. The remaining authors declare that the research was conducted in the absence of any commercial or financial relationships that could be construed as a potential conflict of interest. The authors declare that this study received funding from State Grid Hubei Electric Power Co. The funder was not involved in the study design, collection, analysis, interpretation of data, the writing of this article or the decision to submit it for publication.
Abbreviations
The following abbreviations are used in this manuscript:
| PCC | Point of common coupling |
| Q-V | Reactive-power–voltage |
| P-V | Active-power–voltage |
| P/Q | Active-power/reactive-power |
| APVQ-RC | Active-power–voltage-coupling-aware reactive-power compensation |
| SVG | Static var generator |
| STATCOM | Static synchronous compensator |
| R/X | Resistance-to-reactance ratio |
| SCR | Short-circuit ratio |
| PLL | Phase-locked-loop |
| EMT | Electromagnetic transient |
| PWM | Pulse-width modulation |
| PI | Proportional–integral |
References
- Haegel, N.M.; Kurtz, S.R. Global progress toward renewable electricity: Tracking the role of solar. IEEE J. Photovolt. 2021, 11, 1335–1342. [Google Scholar] [CrossRef] [Scilit]
- Zhang, H.; Xiang, W.; Lin, W.; Wen, J. Grid Forming Converters in Renewable Energy Sources Dominated Power Grid: Control Strategy, Stability, Application, and Challenges. J. Mod. Power Syst. Clean. Energy 2021, 9, 1239–1256. [Google Scholar] [CrossRef] [Scilit]
- Strunz, K.; Almunem, K.; Wulkow, C.; Kuschke, M.; Valescudero, M.; Guillaud, X. Enabling 100% Renewable Power Systems Through Power Electronic Grid-Forming Converter and Control: System Integration for Security, Stability, and Application to Europe. Proc. IEEE 2023, 111, 891–915. [Google Scholar] [CrossRef] [Scilit]
- Ahmed, F.; Al Kez, D.; McLoone, S.; Best, R.J.; Cameron, C.; Foley, A. Dynamic grid stability in low carbon power systems with minimum inertia. Renew. Energy 2023, 210, 486–506. [Google Scholar] [CrossRef] [Scilit]
- Qays, M.O.; Ahmad, I.; Habibi, D.; Aziz, A.; Mahmoud, T. System strength shortfall challenges for renewable energy-based power systems: A review. Renew. Sustain. Energy Rev. 2023, 183, 113447. [Google Scholar] [CrossRef] [Scilit]
- Aljarrah, R.; Bany Fawaz, B.; Salem, Q.; Karimi, M.; Marzooghi, H.; Azizipanah-Abarghooee, R. Issues and Challenges of Grid-Following Converters Interfacing Renewable Energy Sources in Low-Inertia Systems: A Review. IEEE Access 2024, 12, 5534–5561. [Google Scholar] [CrossRef] [Scilit]
- Bahrani, B.; Ravanji, M.H.; Kroposki, B.; Ramasubramanian, D.; Guillaud, X.; Prevost, T.; Cutululis, N.-A. Grid-Forming Inverter-Based Resource Research Landscape: Understanding the Key Assets for Renewable-Rich Power Systems. IEEE Power Energy Mag. 2024, 22, 18–29. [Google Scholar] [CrossRef] [Scilit]
- Tan, B.; Liang, Z.; Chung, C.Y.; Dong, H.; Yin, X.; Rayeem, S.K.; Zhu, J. Uncertainty-aware approaches toward managing hydrogen-powered vehicles and renewable energy units in microgrid-transportation networks. IEEE Trans. Transp. Electrif. 2026; early access. [CrossRef] [Scilit]
- Huang, L.; Wu, C.; Zhou, D.; Blaabjerg, F. A Double-PLLs-Based Impedance Reshaping Method for Extending Stability Range of Grid-Following Inverter Under Weak Grid. IEEE Trans. Power Electron. 2022, 37, 4091–4104. [Google Scholar] [CrossRef] [Scilit]
- Lin, X.; Yu, J.; Yu, R.; Zhang, J.; Yan, Z.; Wen, H. Improving Small-Signal Stability of Grid-Connected Inverter Under Weak Grid by Decoupling Phase-Lock Loop and Grid Impedance. IEEE Trans. Ind. Electron. 2022, 69, 7040–7053. [Google Scholar] [CrossRef] [Scilit]
- Taul, M.G.; Wu, C.; Chou, S.-F.; Blaabjerg, F. Optimal Controller Design for Transient Stability Enhancement of Grid-Following Converters Under Weak-Grid Conditions. IEEE Trans. Power Electron. 2021, 36, 10251–10264. [Google Scholar] [CrossRef] [Scilit]
- Bahrani, B. Power-Synchronized Grid-Following Inverter Without a Phase-Locked Loop. IEEE Access 2021, 9, 112163–112176. [Google Scholar] [CrossRef] [Scilit]
- Mohammed, N.; Zhou, W.; Bahrani, B. Comparison of PLL-Based and PLL-Less Control Strategies for Grid-Following Inverters Considering Time and Frequency Domain Analysis. IEEE Access 2022, 10, 80518–80538. [Google Scholar] [CrossRef] [Scilit]
- Mohammed, N.; Zhou, W.; Bahrani, B. Double-Synchronous-Reference-Frame-Based Power-Synchronized PLL-Less Grid-Following Inverters for Unbalanced Grid Faults. IEEE Open J. Power Electron. 2023, 4, 474–486. [Google Scholar] [CrossRef] [Scilit]
- Fang, J.; Deng, H.; Goetz, S.M. Grid Impedance Estimation Through Grid-Forming Power Converters. IEEE Trans. Power Electron. 2021, 36, 2094–2104. [Google Scholar] [CrossRef] [Scilit]
- Li, C.; Liu, W.; Liang, J.; Ding, X.; Cipcigan, L.M. Improved Grid Impedance Compensation for Phase-Locked Loop to Stabilize the Very-Weak-Grid Connection of VSIs. IEEE Trans. Power Deliv. 2022, 37, 3863–3872. [Google Scholar] [CrossRef] [Scilit]
- Baeckeland, N.; Chatterjee, D.; Lu, M.; Johnson, B.; Seo, G.-S. Overcurrent Limiting in Grid-Forming Inverters: A Comprehensive Review and Discussion. IEEE Trans. Power Electron. 2024, 39, 14493–14517. [Google Scholar] [CrossRef] [Scilit]
- Chen, J.; Gong, Q.; Zhang, Y.; Fawad, M.; Wang, S.; Li, C.; Liang, J. Comprehensive Assessment of Transient Stability for Grid-Forming Converters Considering Current Limitations, Inertia and Damping Effects. CSEE J. Power Energy Syst. 2025, 11, 1–12. [Google Scholar] [CrossRef] [Scilit]
- Savasci, A.; Inaolaji, A.; Paudyal, S. Two-Stage Volt-VAr Optimization of Distribution Grids with Smart Inverters and Legacy Devices. IEEE Trans. Ind. Appl. 2022, 58, 5711–5723. [Google Scholar] [CrossRef] [Scilit]
- Xu, R.; Zhang, C.; Xu, Y.; Dong, Z.Y.; Zhang, R. Multi-Objective Hierarchically-Coordinated Volt/Var Control for Active Distribution Networks with Droop-Controlled PV Inverters. IEEE Trans. Smart Grid 2022, 13, 998–1011. [Google Scholar] [CrossRef] [Scilit]
- Wang, Z.; Zhang, B.; Mobtahej, M.; Baziar, A.; Khan, B. Advanced Reactive Power Compensation of Wind Power Plant Using PMU Data. IEEE Access 2021, 9, 67006–67014. [Google Scholar] [CrossRef] [Scilit]
- Guo, L.; Liu, Z.; Wang, Z.; Li, X.; Liu, Y.; Zhang, Y.; Zang, X.; Wang, C. Model-Free Optimal Volt-VAR Control of Wind Farm Based on Data-Driven Lift-Dimension Linear Power Flow. CSEE J. Power Energy Syst. 2025, 11, 91–101. [Google Scholar] [CrossRef] [Scilit]
- Allahmoradi, S.; Afrasiabi, S.; Liang, X.; Zhao, J.; Shahidehpour, M. Data-Driven Volt/VAR Optimization for Modern Distribution Networks: A Review. IEEE Access 2024, 12, 71184–71204. [Google Scholar] [CrossRef] [Scilit]
- Wang, H.; Liang, Y.; Yao, Y.; Zhao, J.; Ding, F. Online Model-Free DER Dispatch Via Adaptive Voltage Sensitivity Estimation and Chance-Constrained Programming. IEEE Trans. Power Syst. 2024, 39, 7318–7330. [Google Scholar] [CrossRef] [Scilit]
- Cao, D.; Zhao, J.; Hu, W.; Ding, F.; Huang, Q.; Chen, Z. Attention Enabled Multi-Agent DRL for Decentralized Volt-VAR Control of Active Distribution System Using PV Inverters and SVCs. IEEE Trans. Sustain. Energy 2021, 12, 1582–1592. [Google Scholar] [CrossRef] [Scilit]
- Guo, Y.; Gao, H.; Wang, D.; Wu, Q. Online Optimal Feedback Voltage Control of Wind Farms: Decentralized and Asynchronous Implementations. IEEE Trans. Sustain. Energy 2021, 12, 1489–1492. [Google Scholar] [CrossRef] [Scilit]
- Sun, J. Impedance-Based Stability Criterion for Grid-Connected Inverters. IEEE Trans. Power Electron. 2011, 26, 3075–3078. [Google Scholar] [CrossRef] [Scilit]
- Milano, F. Power System Modelling and Scripting; Springer: Berlin, Germany, 2010. [Google Scholar]

Disclaimer/Publisher’s Note: The statements, opinions and data contained in all publications are solely those of the individual author(s) and contributor(s) and not of MDPI and/or the editor(s). MDPI and/or the editor(s) disclaim responsibility for any injury to people or property resulting from any ideas, methods, instructions or products referred to in the content. |
© 2026 by the authors. Licensee MDPI, Basel, Switzerland. This article is an open access article distributed under the terms and conditions of the Creative Commons Attribution (CC BY) license.