


Abstract
Anti-islanding certification is generally reported as pass or fail, although response times across the active- and reactive-power (P-Q) matrix contain additional information. We analyzed 925 Condition-A measurements from 37 grid-connected photovoltaic (PV) inverters tested under Korean Industrial Standard KS C 8565 at 60 Hz. A signed 5 × 5 map and within-product contrasts used each inverter as its own reference. Relatively long responses followed the ΔQ = 0 row rather than the balanced cell alone. Mean response was 0.221 s at balance, 0.140 s at signed |ΔQ| = 10% endpoints, and 0.208 s at signed |ΔP| = 10% endpoints. The direct P- versus Q-axis difference was 0.068 s (95% confidence interval (CI), 0.040–0.095 s; p < 0.001). Across the matrix, the ΔQ = 0 row exceeded the |ΔQ| = 10% rows by 0.061 s (95% CI, 0.036–0.085 s; p < 0.001). All values met the 0.5 s criterion. Reactive-power balance, rather than a single balanced cell, therefore marked a corridor of relatively long compliant response. This analysis converts certification records ordinarily summarized as pass/fail outcomes into a directional performance profile. The analysis procedure, but not the numerical PV response times, is proposed for future grid-connected power conversion system (PCS) testing, which requires separate charge- and discharge-mode validation.
1. Introduction
Distributed energy resources (DERs) are changing distribution networks from passive, one-way systems into networks with many power-electronic sources. Distributed photovoltaic (PV) generation, energy storage systems (ESSs), electric vehicles, and controllable loads are increasingly connected behind customer meters [1]. The International Energy Agency projects that utility-scale and distributed solar PV will account for nearly 80% of worldwide renewable-capacity expansion during 2025–2030, with distributed applications representing 42% of PV growth [2]. Battery deployment is also accelerating as costs fall and power systems require more flexibility, energy shifting, and rapid balancing [3]. At each grid-connected PV or ESS interface, the inverter or power conversion system (PCS) converts direct-current (DC) energy and executes the protection and control functions presented to the utility. Its behavior therefore affects whether expanding DER capacity can be integrated safely and predictably.
As DER penetration increases, the grid-facing converter must do more than transfer power efficiently. It must control active and reactive power, satisfy voltage and frequency requirements, respond correctly to abnormal grid conditions, and cease energizing an unintended island. These functions are covered by interconnection and test frameworks including Korean Industrial Standard (KS) C 8565, International Electrotechnical Commission (IEC) 61727 and IEC 62116, and the Institute of Electrical and Electronics Engineers (IEEE) Standard 1547 series [4,5,6,7,8,9,10,11]. Anti-islanding performance is especially important because a converter that continues to energize an isolated section can leave conductors live, permit uncontrolled voltage or frequency, and expose equipment to out-of-phase reconnection. The relevant requirement is therefore not only that islanding is detected, but that the grid contribution ceases within a prescribed time.
KS C 8565 is important in this context because it is the domestic product standard used in the Korean renewable-energy equipment certification system. That system combines product testing with factory assessment and is linked to government-supported deployment and public procurement of certified equipment [6]. For grid-connected PV inverters, the standard supplies a common 60 Hz laboratory procedure, a tuned load, a prescribed active- and reactive-power test matrix, and a 0.5 s anti-islanding criterion [4,5]. The resulting certification records are thus more than local pass/fail documents: when analyzed consistently, they provide a structured empirical basis for comparing how commercial inverters respond across the same demanding islanding conditions.
The laboratory test creates a difficult detection condition by matching inverter output with a resonant resistor–inductor–capacitor (RLC) load. When active- and reactive-power mismatches are small, voltage and frequency can remain near their normal ranges after the utility path opens. This behavior underlies the non-detection zone (NDZ) concept and motivates passive, active, and hybrid detection methods based on voltage, frequency, phase, impedance, or injected perturbations [12,13,14,15,16,17,18,19,20,21,22,23,24,25,26,27,28,29,30,31]. The observed response time is an end-to-end terminal quantity: it spans island formation, detection logic, the controller decision, gate blocking or switch operation, and decay of the output current to the measurement endpoint. A single compliant value therefore answers whether the time limit was met, whereas the set of values across the P-Q matrix can also show where the protection acts relatively more slowly or rapidly.
Prior experimental studies have examined parallel-inverter interaction, grid-support and voltage-control functions, ride-through behavior, and candidate laboratory detection methods [32,33,34,35,36,37,38,39]. Broader work on converter control and high-renewable power systems has likewise shown that interconnection behavior depends on control architecture and system context [40,41]. These studies establish the physical and control-system importance of islanding detection, but they do not answer a practical certification question: whether complete standardized P-Q matrices from a set of commercial products share a directional response-time structure. Unlike these prior studies, which typically instrument one or a few inverters under researcher-controlled conditions, the present analysis reuses complete certification test matrices already recorded from a diverse commercial product set and converts them into a signed, product-paired directional profile without additional testing. This offers certification laboratories a way to extract more information from records they already generate, and offers manufacturers a comparable diagnostic signature across hardware or firmware revisions.
Routine certification reporting usually reduces each test to compliance with the prescribed limit. That practice is appropriate for product acceptance but discards the spatial information contained in the matrix. It also makes the balanced point appear to be the sole difficult condition, even though nearby points may form a broader region of relatively long response. A matrix-level analysis that retains signed active- and reactive-power departures and compares conditions within the same product can test this possibility without changing the underlying certification procedure or inferring proprietary detection algorithms.
In this study, we tested whether the relatively long-response region in the Condition-A matrix was confined to the balanced point or extended preferentially along one axis. We hypothesized that departure from reactive-power balance would reduce response time more strongly than an equal-magnitude departure in active power. Complete 5 × 5 matrices from 37 grid-connected PV inverter products were analyzed using signed cell maps and within-product contrasts. The main result was a reactive-power-balance corridor: relatively long, but compliant, responses extended along ΔQ = 0, while equal departures in ΔQ shortened response more consistently than departures in ΔP. The contribution is an empirical verification method that converts certification records ordinarily summarized as pass/fail outcomes into a directional performance profile and defines a testable analysis framework for future PCS charge- and discharge-mode validation.
2. Test Background
2.1. Anti-Islanding Function and Response-Time Measurement
In the tested configuration, the inverter, utility source, and tuned RLC load were connected in parallel. After the load was adjusted under the applicable KS C 8565 procedure, the utility path was opened. The response-time interval started at that opening event and ended at the operational current-cessation endpoint. The endpoint was identified as current cessation: the point at which the applicable single- or three-phase alternating-current (AC) output-current waveform or waveforms reached and remained at the oscilloscope display’s zero-current baseline, indicating that inverter output current had fully ceased. This endpoint was read directly against that single zero-current reference, without a separate numeric current threshold, and the definition was applied consistently to the certification records analyzed here.
The measured interval represents end-to-end protection performance at the converter terminals rather than a separately observed internal detection delay. It can include development of the islanded electrical state, accumulation by the detection logic, the controller decision, switch opening or gate blocking, and current decay to the operational endpoint. These contributions were not separated because the certification measurement concerns the final grid-facing response. This distinction is important: two products may both comply with the same limit while showing different locations and gradients of relatively long response within the prescribed P-Q matrix.
KS C 8565 requires the inverter to detect islanding and either open its switch or block its gates within 0.5 s of utility-path opening [4,5]. IEC 62116 provides the broader international test framework for islanding-prevention measures, while IEEE 1547 and IEEE 1547.1 address DER interconnection performance and conformance testing [7,9,10]. In this study, the 0.5 s value remains the compliance threshold. The measured response-time landscape is a second, descriptive layer of evidence used to compare the relative behavior of compliant test points; it does not replace or redefine the acceptance rule.
2.2. Why the P and Q Directions Can Differ
For an ideal parallel-RLC load, the steady-state relations are P = V2/R and Q = V2(1/(ωL) − ωC), subject to the adopted reactive-power sign convention. Near resonance, these relations provide a first-order circuit-level basis for comparing the P and Q directions in the test matrix. Commercial inverters may also use active or hybrid methods that perturb voltage, frequency, phase, current, or impedance [15,16,17,18,19,20,21,22,23,24,25,26,27]. The directional results reported here describe the response measured in the KS test circuit and do not identify the proprietary detection algorithm of any product.
2.3. Relevance to Grid-Connected PCS Testing
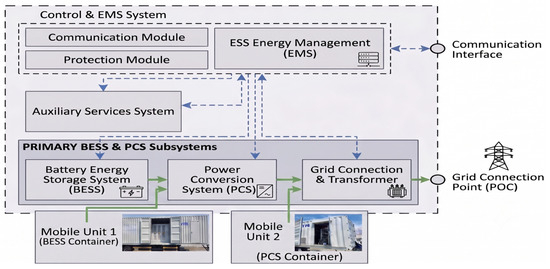
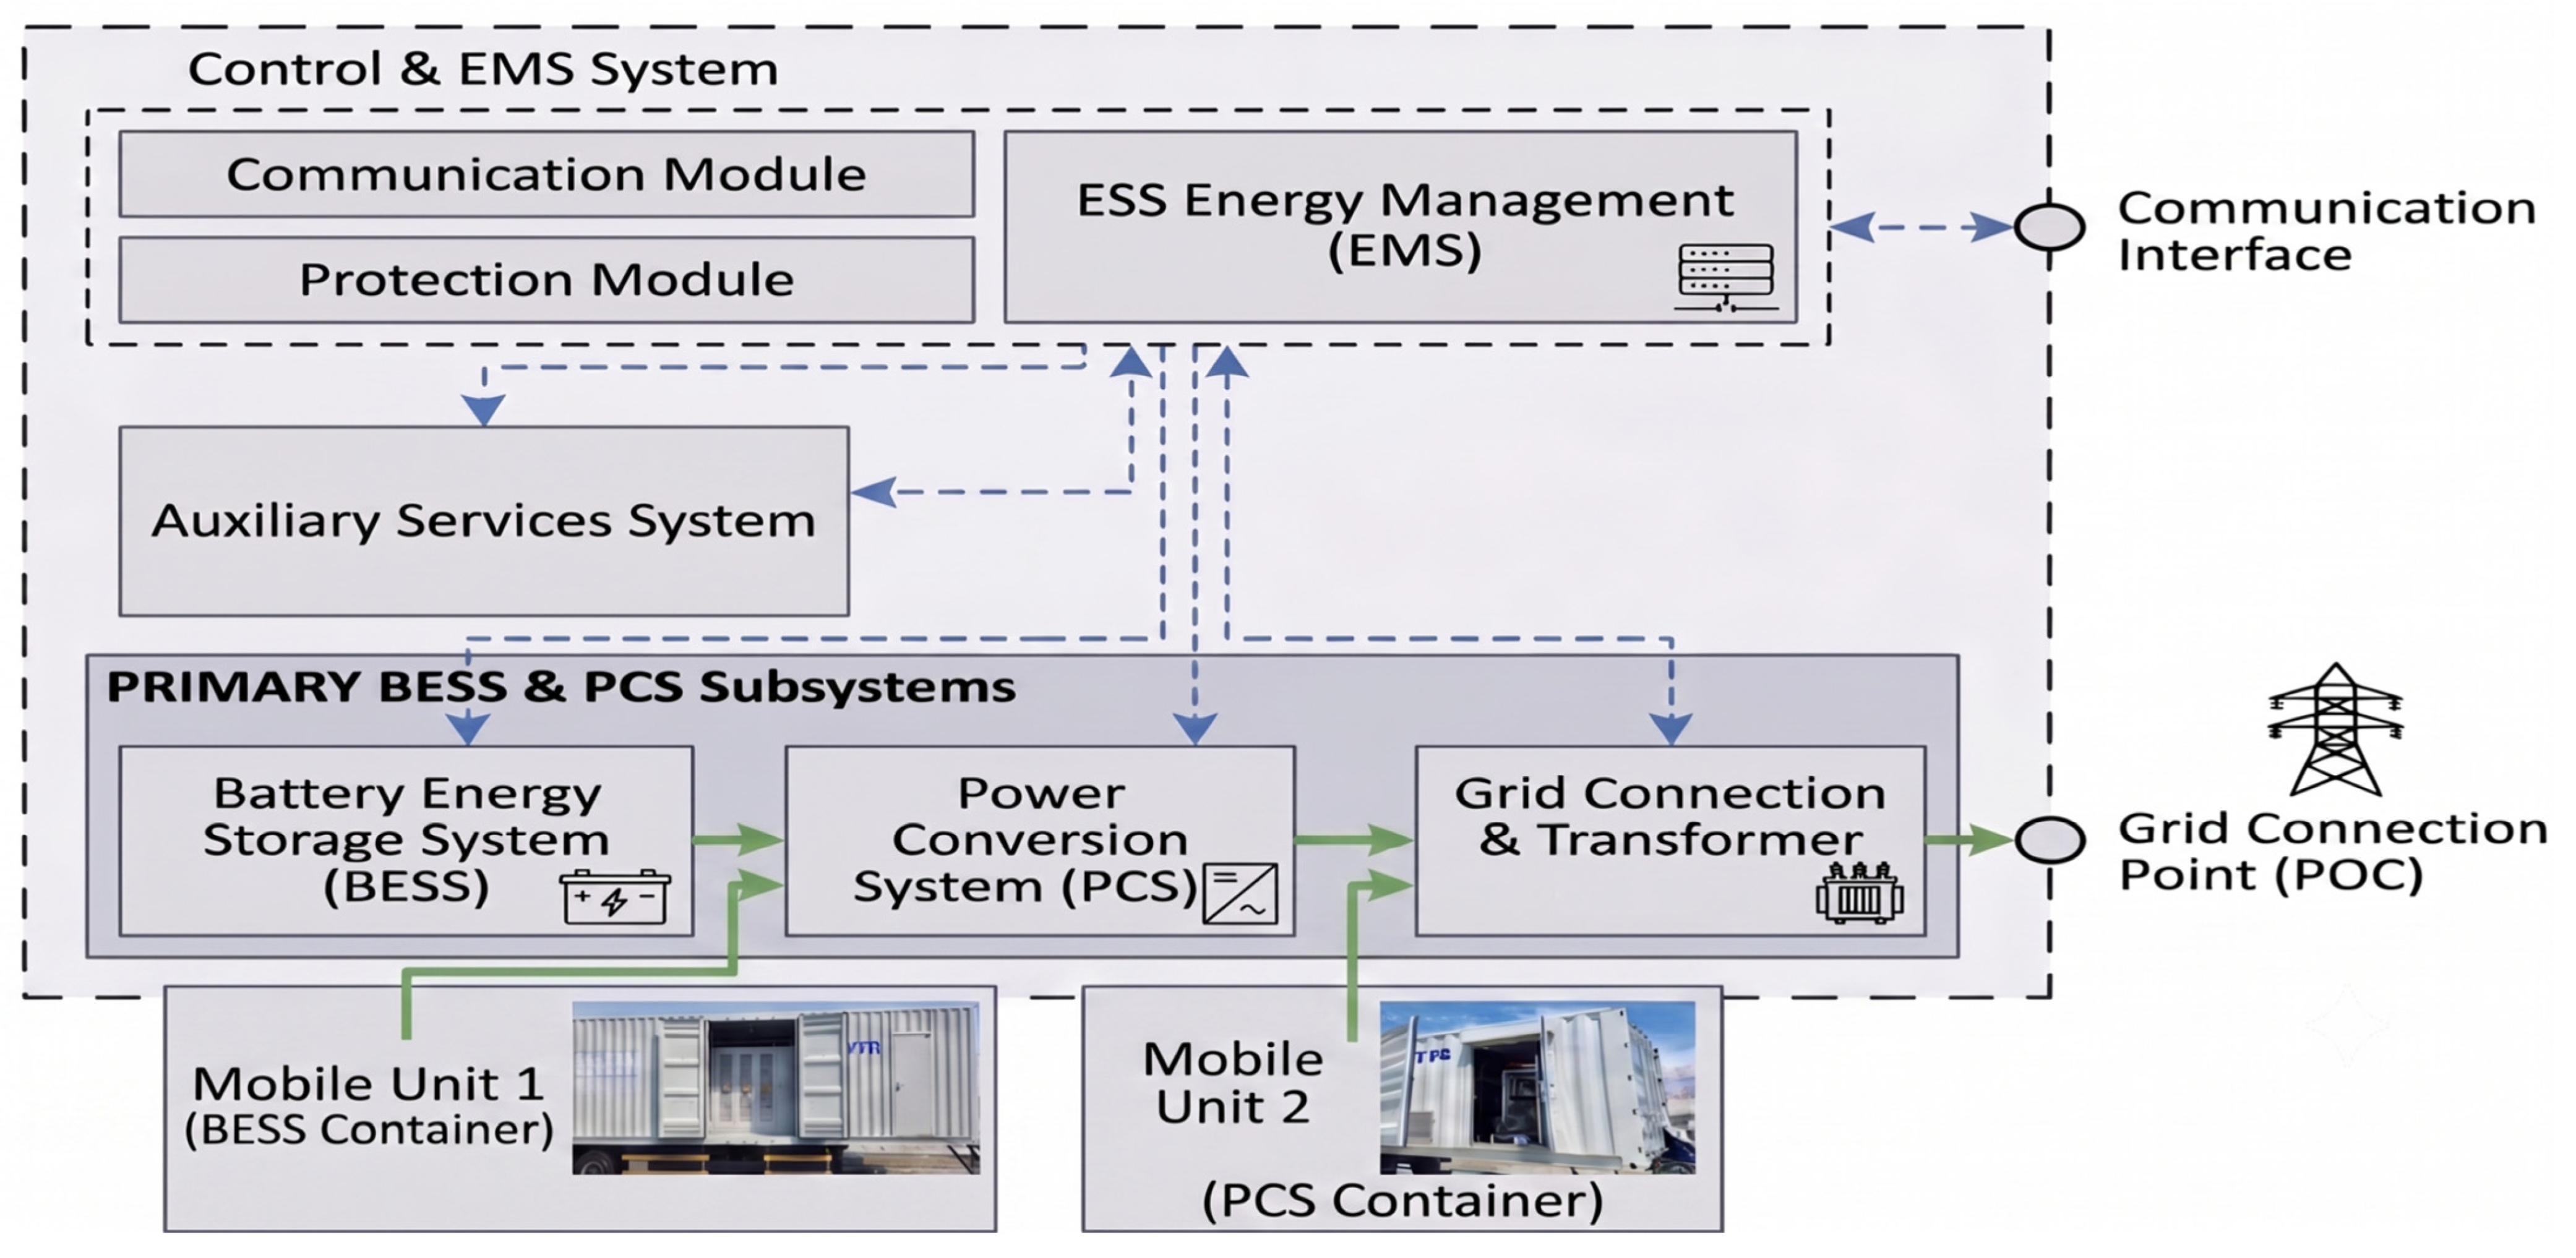
Although the empirical sample consists exclusively of PV inverters, an ESS presents a related grid-facing conversion interface: its PCS is the bidirectional link that exchanges active and reactive power with the utility. Anti-islanding performance is therefore exercised at the PCS-grid interface. A PCS can, however, operate in charge, discharge, reactive-power control, transition, grid-following, and grid-forming modes that are absent from the present dataset [11,40,42,43,44]. Figure 1 defines the prospective ESS-PCS application boundary. Accordingly, the transferable contribution is the signed-matrix and within-product analysis procedure, not the numerical PV response times. PCS application requires prospective validation in each relevant power-flow and control mode.
Figure 1.
Conceptual system-level architecture of an energy storage system (ESS) and its power conversion system (PCS) grid interface. BESS, battery energy storage system; EMS, energy management system; GCP, grid-connection and transformer subsystem; POC, grid point of connection. Dashed blue arrows denote control and communication signal paths; solid green arrows denote power flow paths.
3. Materials and Methods
3.1. Dataset and Analysis Unit
The dataset comprised third-party certification results from one accredited laboratory and included 37 anonymized grid-connected PV inverter products from nine manufacturers. Product type was verified from the laboratory records and original test reports. One measured value was available for each of the 25 Condition-A P-Q points per product, yielding 37 × 25 = 925 observations. Conditions B and C were not included because they do not form the same 5 × 5 matrix.
This study analyzes anti-islanding response times documented in issued certification test reports for grid-connected PV inverters. The findings are specific to the investigated Condition-A records and test configuration. The analysis concerns the response values documented in the issued test reports and was not designed to evaluate trial-level repeatability. Further work using data from additional laboratories and operating conditions would be useful to assess the broader applicability of the observed response-time pattern.
The study was designed to characterize the spatial and directional structure of response time within the prescribed Condition-A matrix. The product was treated as the analysis unit so that each directional contrast compared measurements from the same inverter.
Table 1 summarizes the tested PV-inverter set by rated-output group. The set included six single-phase and 31 three-phase products.
Table 1.
Product distribution by rated output. Note: All 37 products and all 925 Condition-A observations were included in the analysis.
3.2. Standard, Test Conditions, and Instrumentation
Testing followed the applicable KS C 8565 anti-islanding procedure using a parallel RLC load tuned to a nominal quality factor Qf = 1. At the load resonant frequency, Qf was defined as
where PR is the active power dissipated by the resistive branch and QL and QC are the reactive powers of the inductive and capacitive branches, respectively; at resonance, QL = QC [4,5]. Switch opening or gate blocking must occur within 0.5 s of utility-path opening. Under the governing procedure, Condition A specifies rated output, a prescribed input-voltage condition, and a 5 × 5 combination of active- and reactive-power imbalance. The signed imbalance coordinates were calculated relative to rated inverter output as
where Pinv and Qinv are the inverter’s active- and reactive-power output, Pload and Qload are the load’s active- and reactive-power consumption, and Prated is the inverter’s rated output power. All 25 points were available for every product, and the laboratory grid frequency was fixed at 60 Hz.
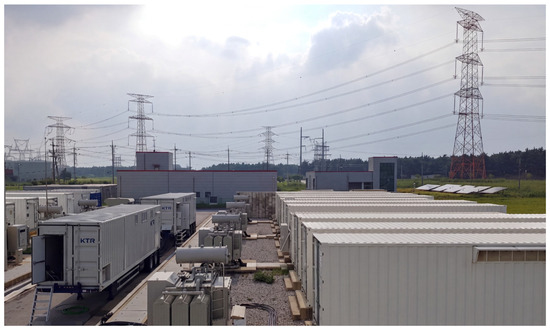
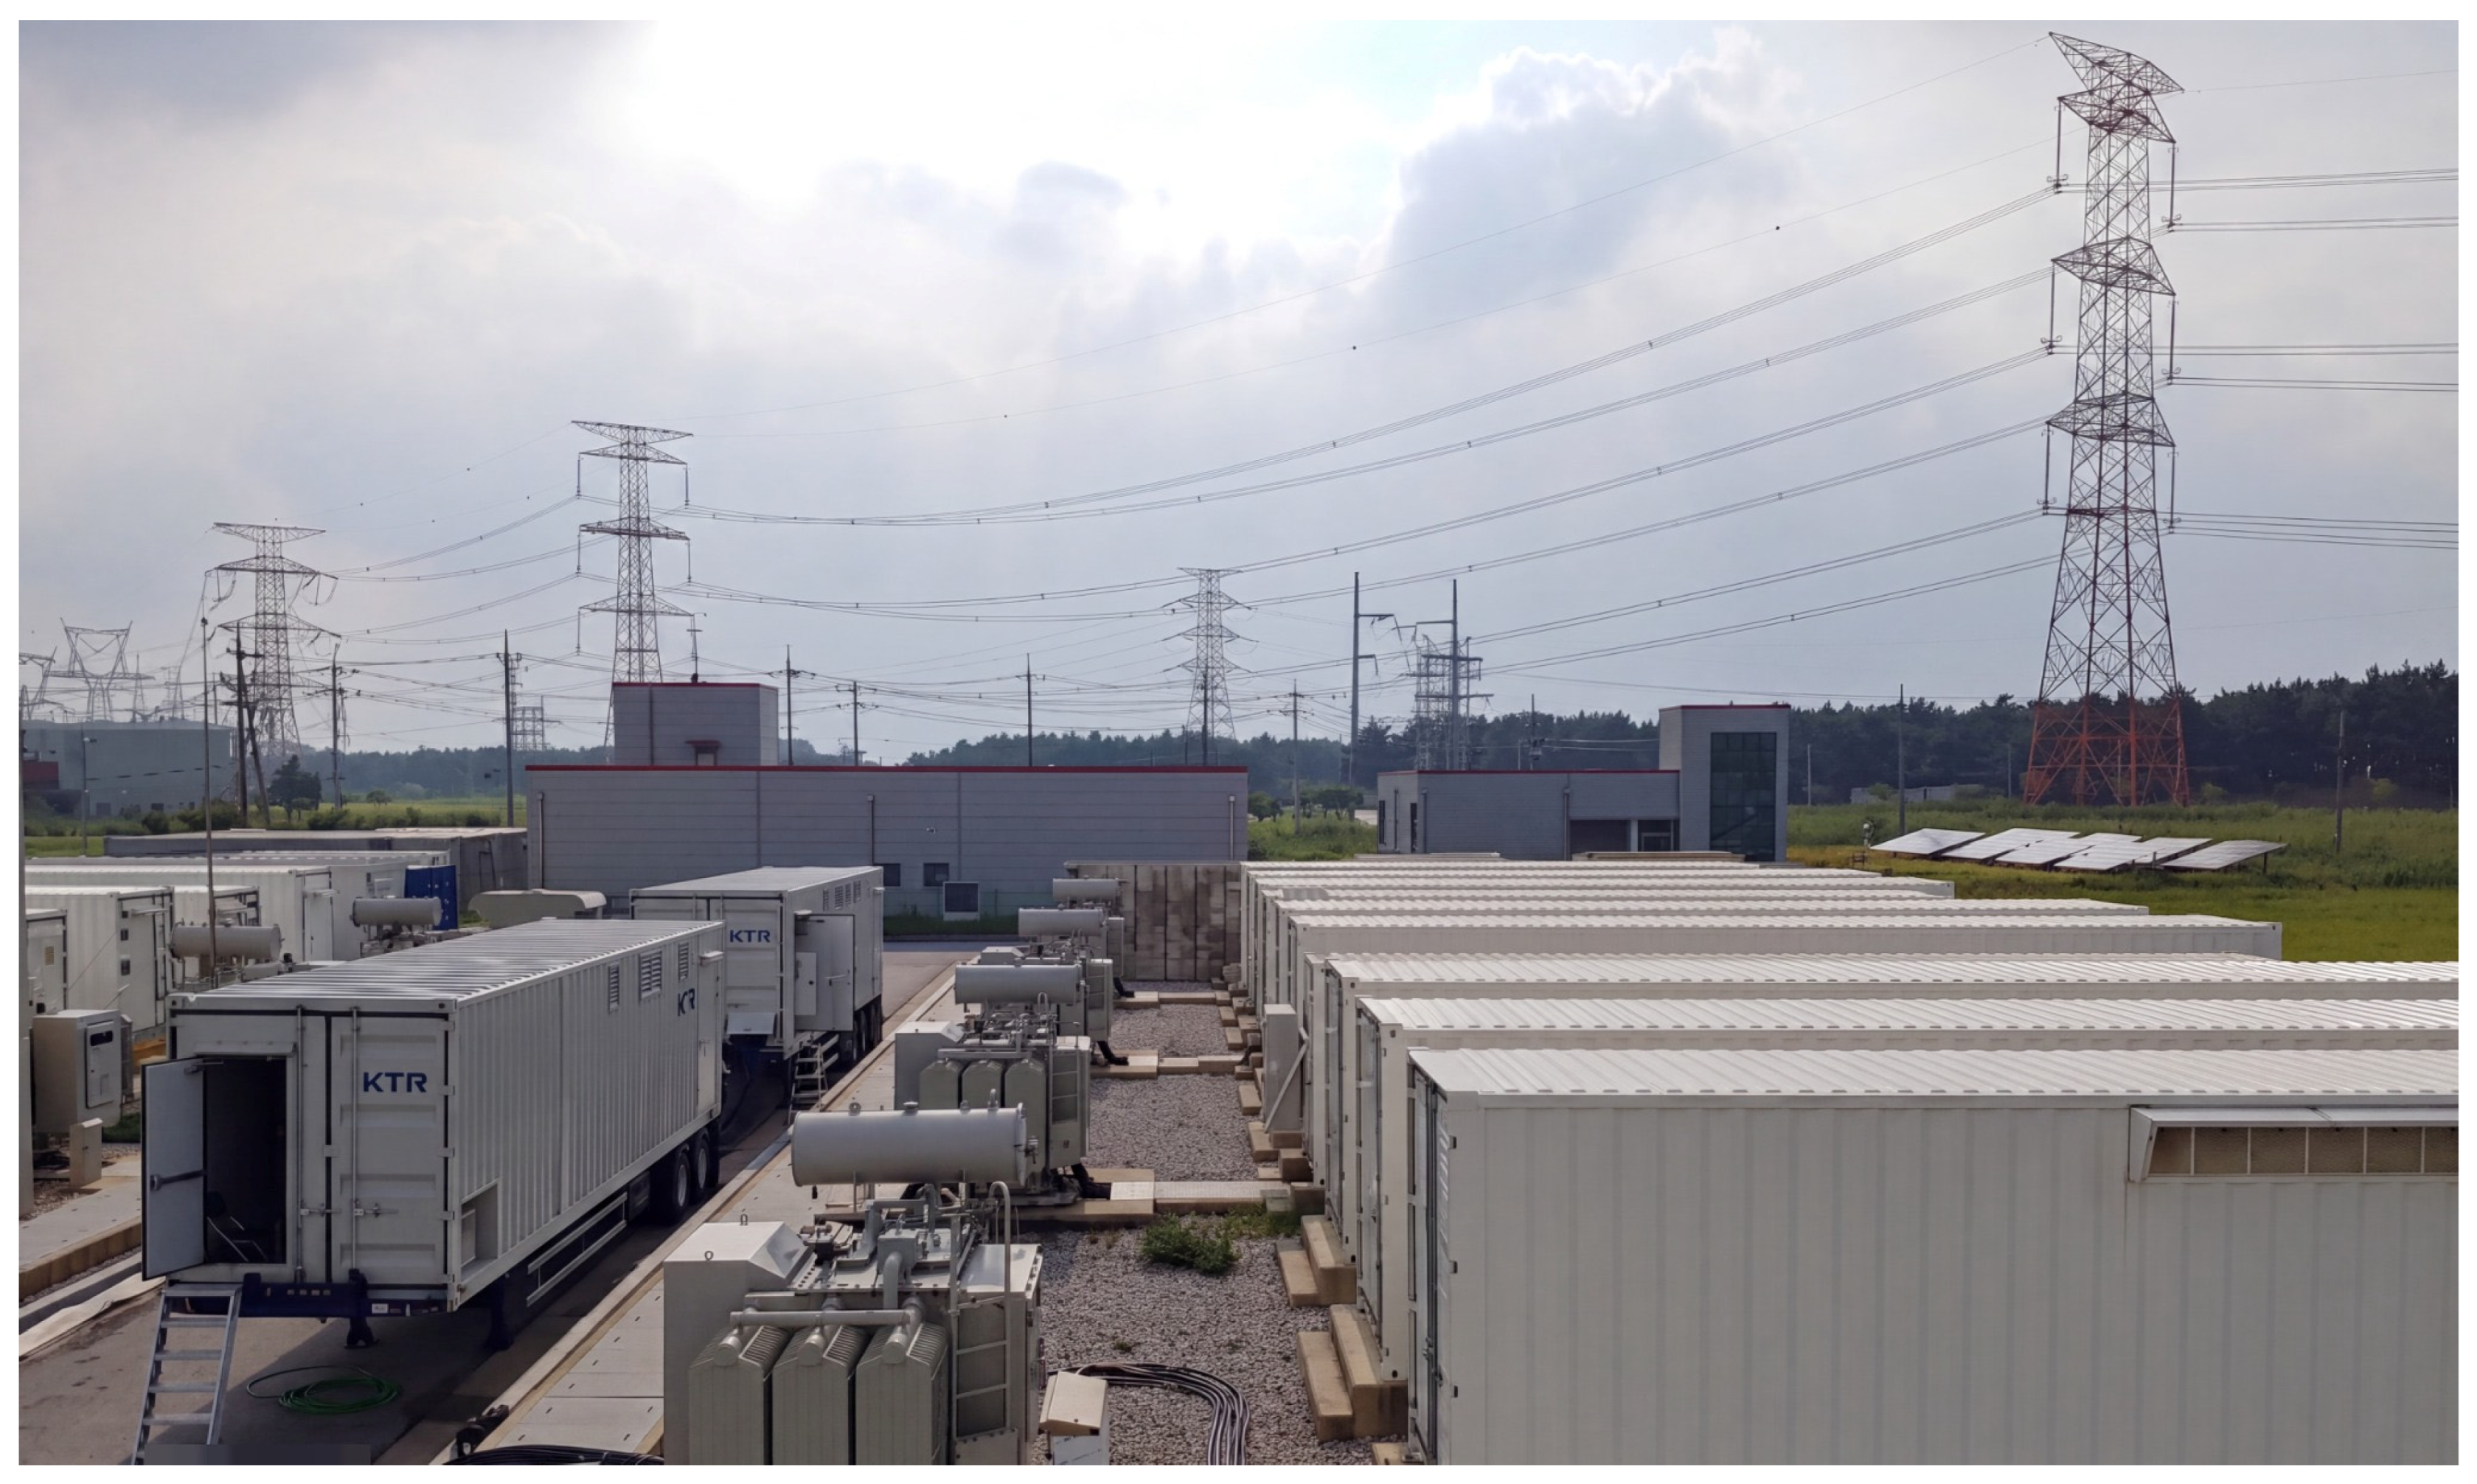
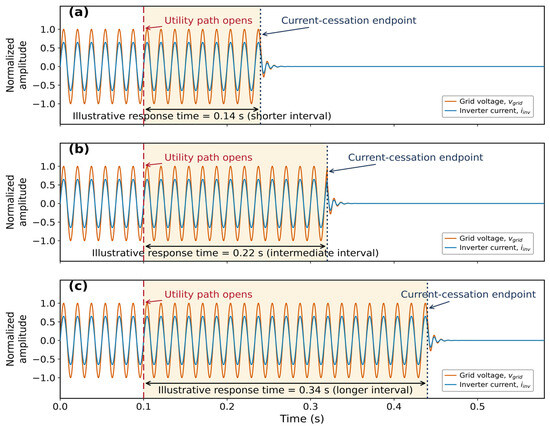
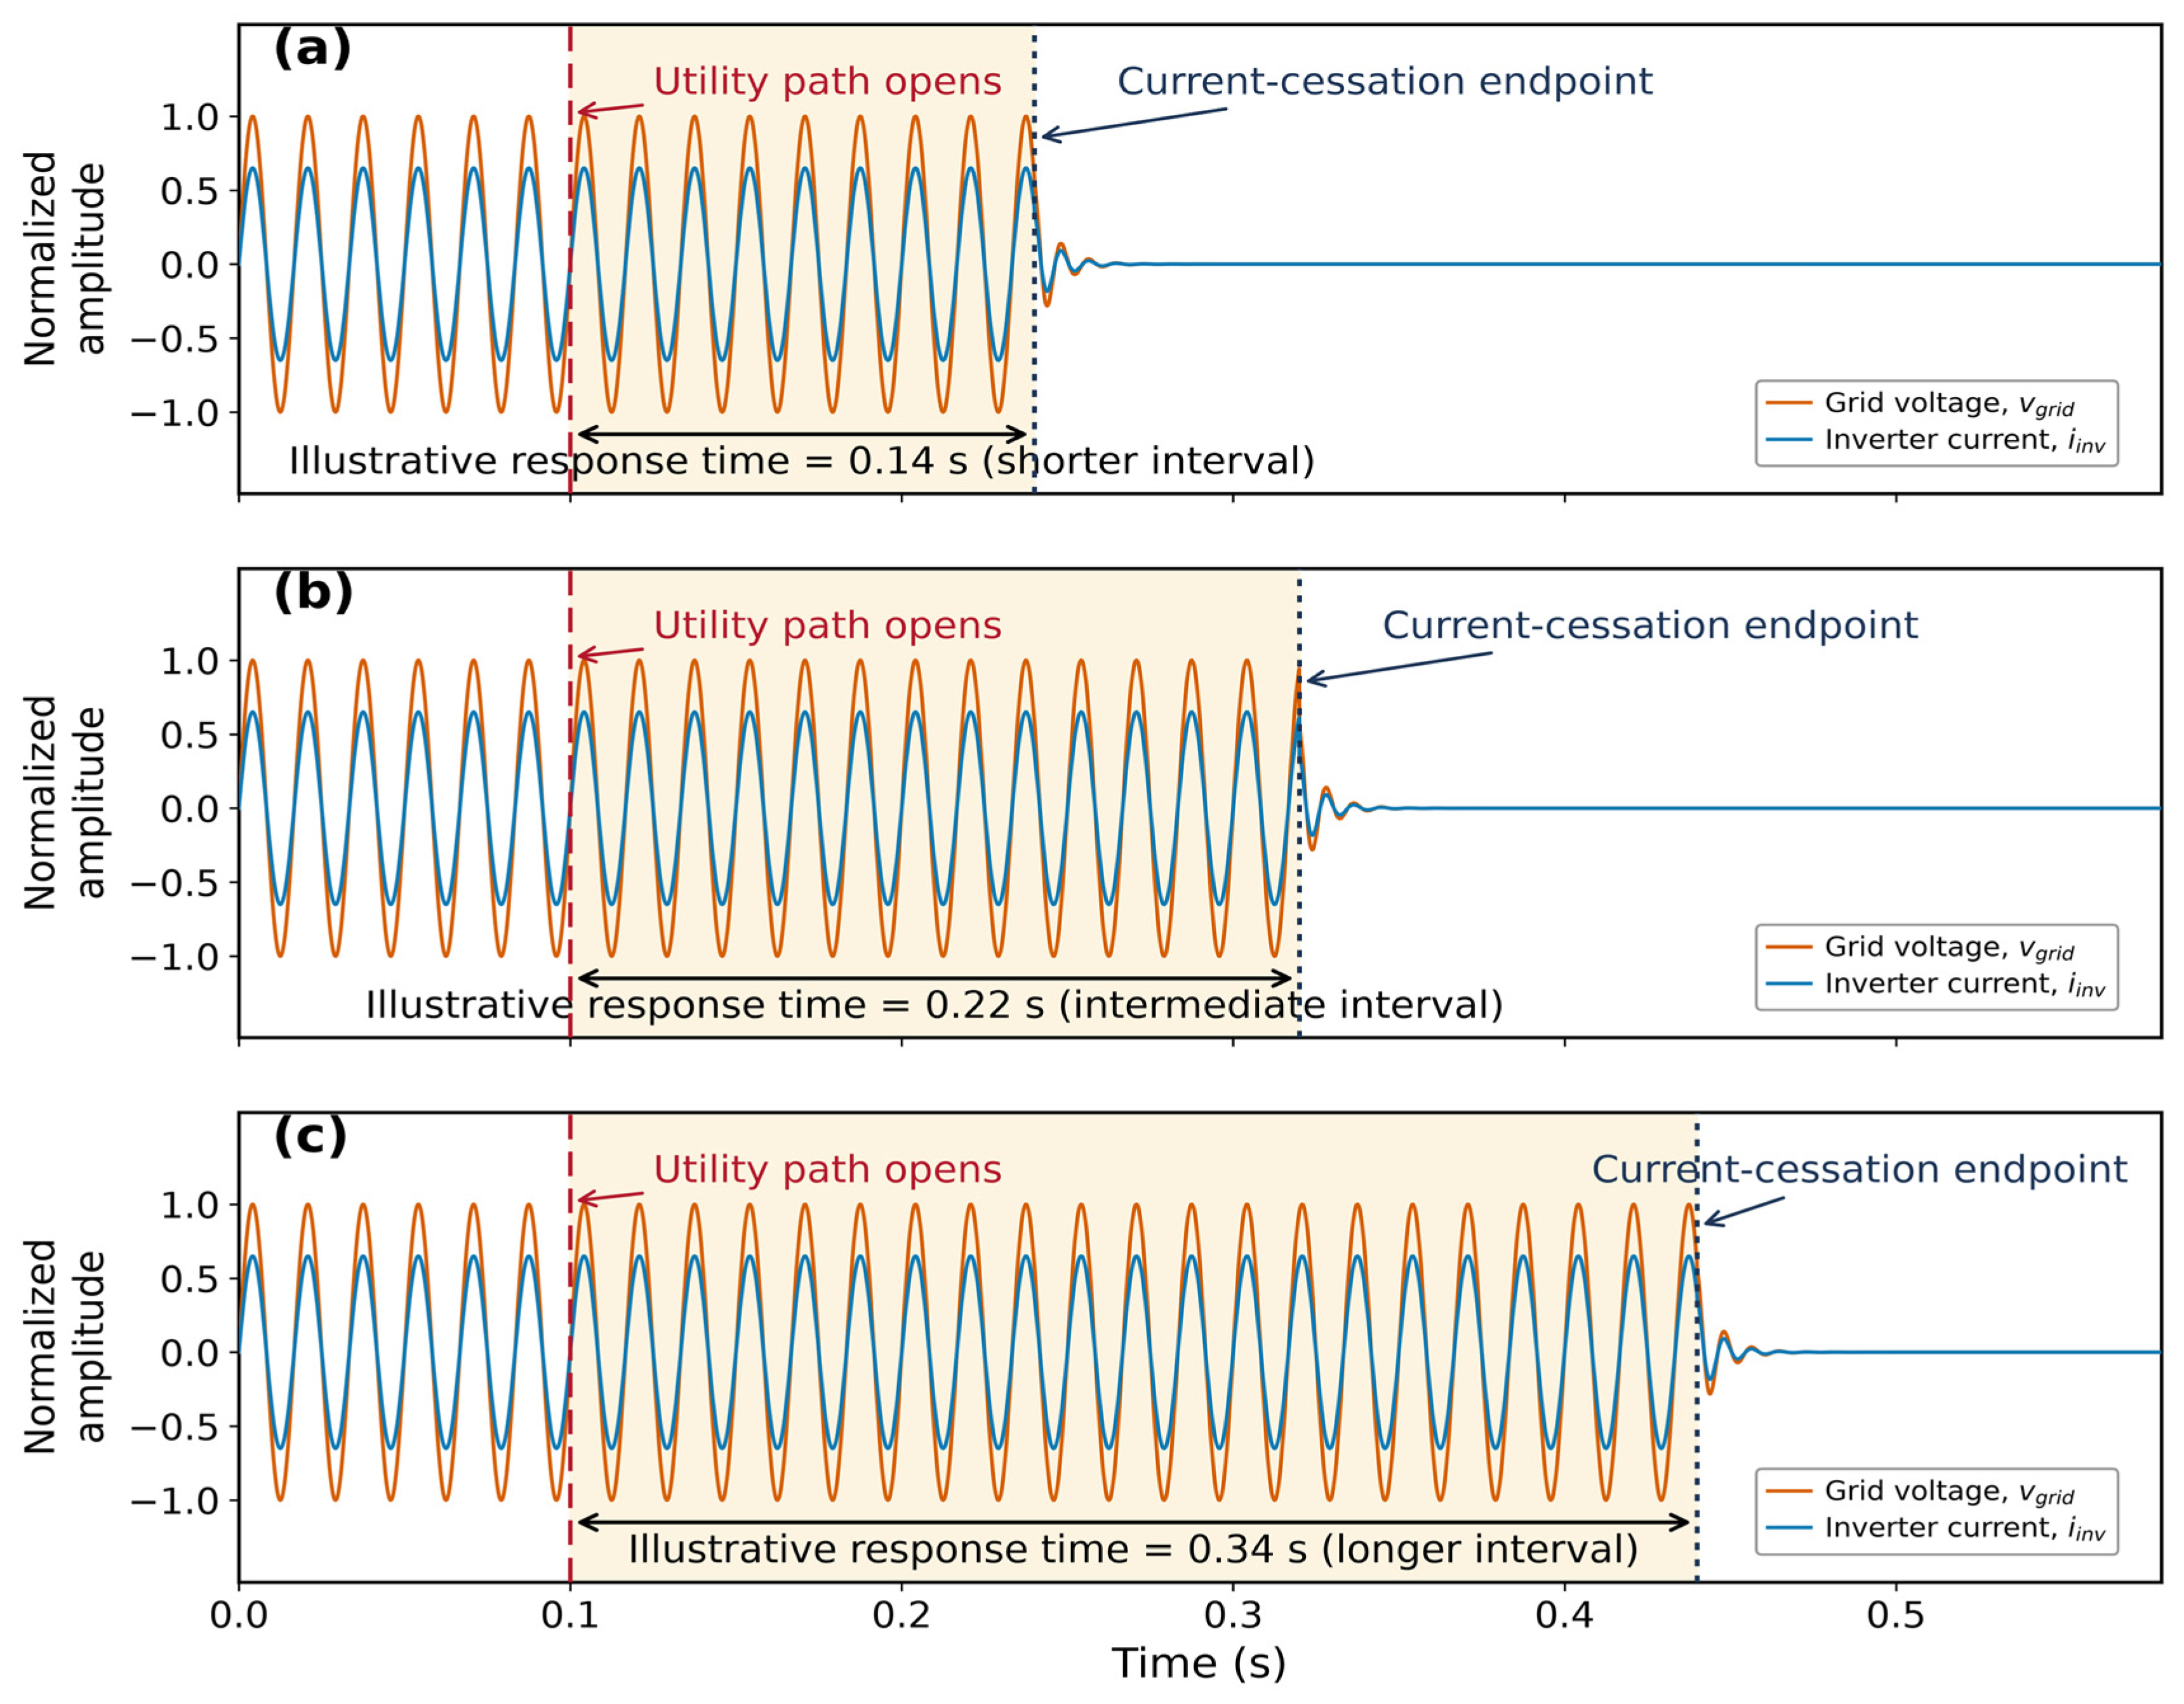
Waveforms were acquired with a Teledyne LeCroy WaveRunner 9054 oscilloscope (Teledyne LeCroy, Chestnut Ridge, NY, USA). Grid voltage was measured using Teledyne LeCroy high-voltage differential probes (models HVD3106A, HVD3106, or HVD3206). Depending on the test configuration, AC output current was measured using Danisense current transducers (models DS600 or DL2000ID; Danisense, Taastrup, Denmark) or a Yokogawa CT1000 current transducer (Yokogawa Electric Corporation, Musashino, Tokyo, Japan). Response time was determined from utility-path opening to the operational current-cessation endpoint described in Section 2.1, and the issued response-time values were recorded to 0.01 s. The grid-connection test facility containing the mobile 1 MW-class DC equipment (power unit: Elektro-Automatik (EA), Viersen, Germany; mobile container built in-house by KTR) is shown in Figure 2, and Figure 3 illustrates the two timing markers used in the measurement. Waveforms were captured at a 500 kS/s sampling rate, with the oscilloscope trigger derived from the opening of the utility-simulator output contactor at the terminal block, marking utility-path opening (t = 0). Phase configuration was identified from the number of active voltage and current channels recorded (three phases for three-phase products, one phase for single-phase products); the same trigger and current-cessation criterion were then applied uniformly across both configurations, without phase-specific adjustment. Response-time values are reported to 0.01 s; at the 500 kS/s acquisition rate used throughout, the oscilloscope’s sample interval is 2 μs, three orders of magnitude finer than this reporting resolution. The reported precision is therefore set by the recording convention rather than by acquisition timing, and instrument-level effects such as probe response time and trigger jitter are negligible at this timescale relative to the reported values.
Figure 2.
Grid-connection test facility containing the mobile 1 MW-class DC test equipment used as part of the test infrastructure.
Figure 3.
Illustration of the response-time measurement convention: (a) a shorter interval; (b) an intermediate interval; and (c) a longer interval. The orange trace is normalized grid voltage, the blue trace is normalized inverter alternating-current (AC) output current, the red dashed line marks utility-path opening, and the navy dotted line marks the operational current-cessation endpoint. The shaded interval is the measured response time. The traces and stated intervals are schematic examples used only to define the timing convention; they are not measured product waveforms or statistical summaries.
The common test condition and measurement chain are summarized in Table 2.
Table 2.
Data-supported test and measurement information.
3.3. Statistical Analysis
The product was the primary analysis unit. Cell means and standard deviations were calculated across 37 products for each measured P-Q combination. For product i, let Ti(p,q) denote the response time at the signed imbalance cell (ΔP = p, ΔQ = q), where p and q are percentage-point values. The balanced value and the two endpoint means were defined as
The product-level Q-axis decrease, P-axis decrease, and direct directional contrast were calculated as follows:
A positive axis decrease indicates a shorter endpoint response than at the balanced point. A positive direct directional contrast means that, for a given product, the mean response at the two signed |ΔQ| = 10% endpoints was shorter than the corresponding mean at the two signed |ΔP| = 10% endpoints. This sign does not denote compliance status or positive power flow. For each contrast, the product-level mean and its 95% t confidence interval were calculated as
The direct directional contrast was treated as the primary contrast, while the Q-axis and P-axis decreases were component contrasts. The matched ±10% points were used for the direct contrast because they are the largest equal-magnitude signed departures available on both axes of the prescribed matrix. As a complementary matrix-level comparison, and to test whether the relatively slow region extended across the ΔQ = 0 corridor, let S = {−10, −5, 0, 5, 10}; the following secondary product-level contrast was calculated:
The 95% t confidence intervals summarize mean product-level contrasts. Recorded response times were resolved to 0.01 s, producing a substantial share of exact ties across paired conditions; a nonparametric approach with explicit tie handling was therefore selected a priori, rather than after formally testing the normality of paired differences. For the Wilcoxon tests, recorded times were converted to integer centiseconds and each contrast was expressed with an integer common numerator before ranking, so that exact ties were preserved. Two-sided Wilcoxon signed-rank tests then assessed whether the paired contrast distributions were centered on zero using SciPy with zero_method = ‘wilcox’ and method = ‘auto’. As a sensitivity analysis for shared manufacturer platforms, the primary direct contrasts were averaged within each of the nine manufacturers and evaluated with the same two-sided Wilcoxon procedure.
A within-product Spearman correlation between radial distance from the balanced point, d, and response time was calculated as a secondary descriptive measure, where
In Equation (8), and are signed percentage-point values. Spearman coefficients used average ranks for ties. Radial distance removes directional information, so it was not used for the primary hypothesis. Signed profiles and product-paired contrasts remained the principal analyses. Capacity, wiring configuration, and manufacturer entered the analysis as descriptive covariates, not as causal explanatory factors.
Python 3.12.13, with pandas 2.2.3 and SciPy 1.17.0, was used for the analysis, and figures were produced in Matplotlib 3.10.8. The underlying code computes the reported cell means, confidence intervals, Wilcoxon tests, and product-level correlations directly from the anonymized Condition-A dataset.
Generative AI tools were not used to generate or modify source data, define the statistical hypotheses, select the reported results, or perform the inferential analyses. They were used after the analyses to assist with language editing, formatting checks, review of figure labels, and independent verification of reported calculations. All numerical results were computed from the source dataset using the analysis workflow described above and were reviewed by the authors.
4. Results
4.1. Completeness and Overall Distribution
All 37 products had a complete 25-cell Condition-A matrix, with no missing response-time values or duplicate product-condition combinations. All 925 measured values satisfied the 0.5 s criterion. Response times spanned 0.03 to 0.47 s, averaging 0.170 s with a median of 0.150 s.
4.2. Measured Response-Time Landscape
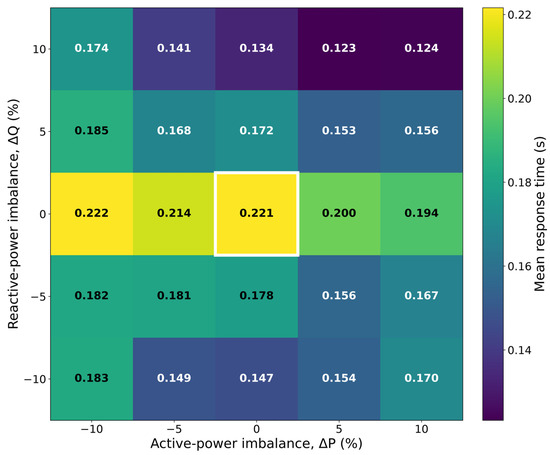
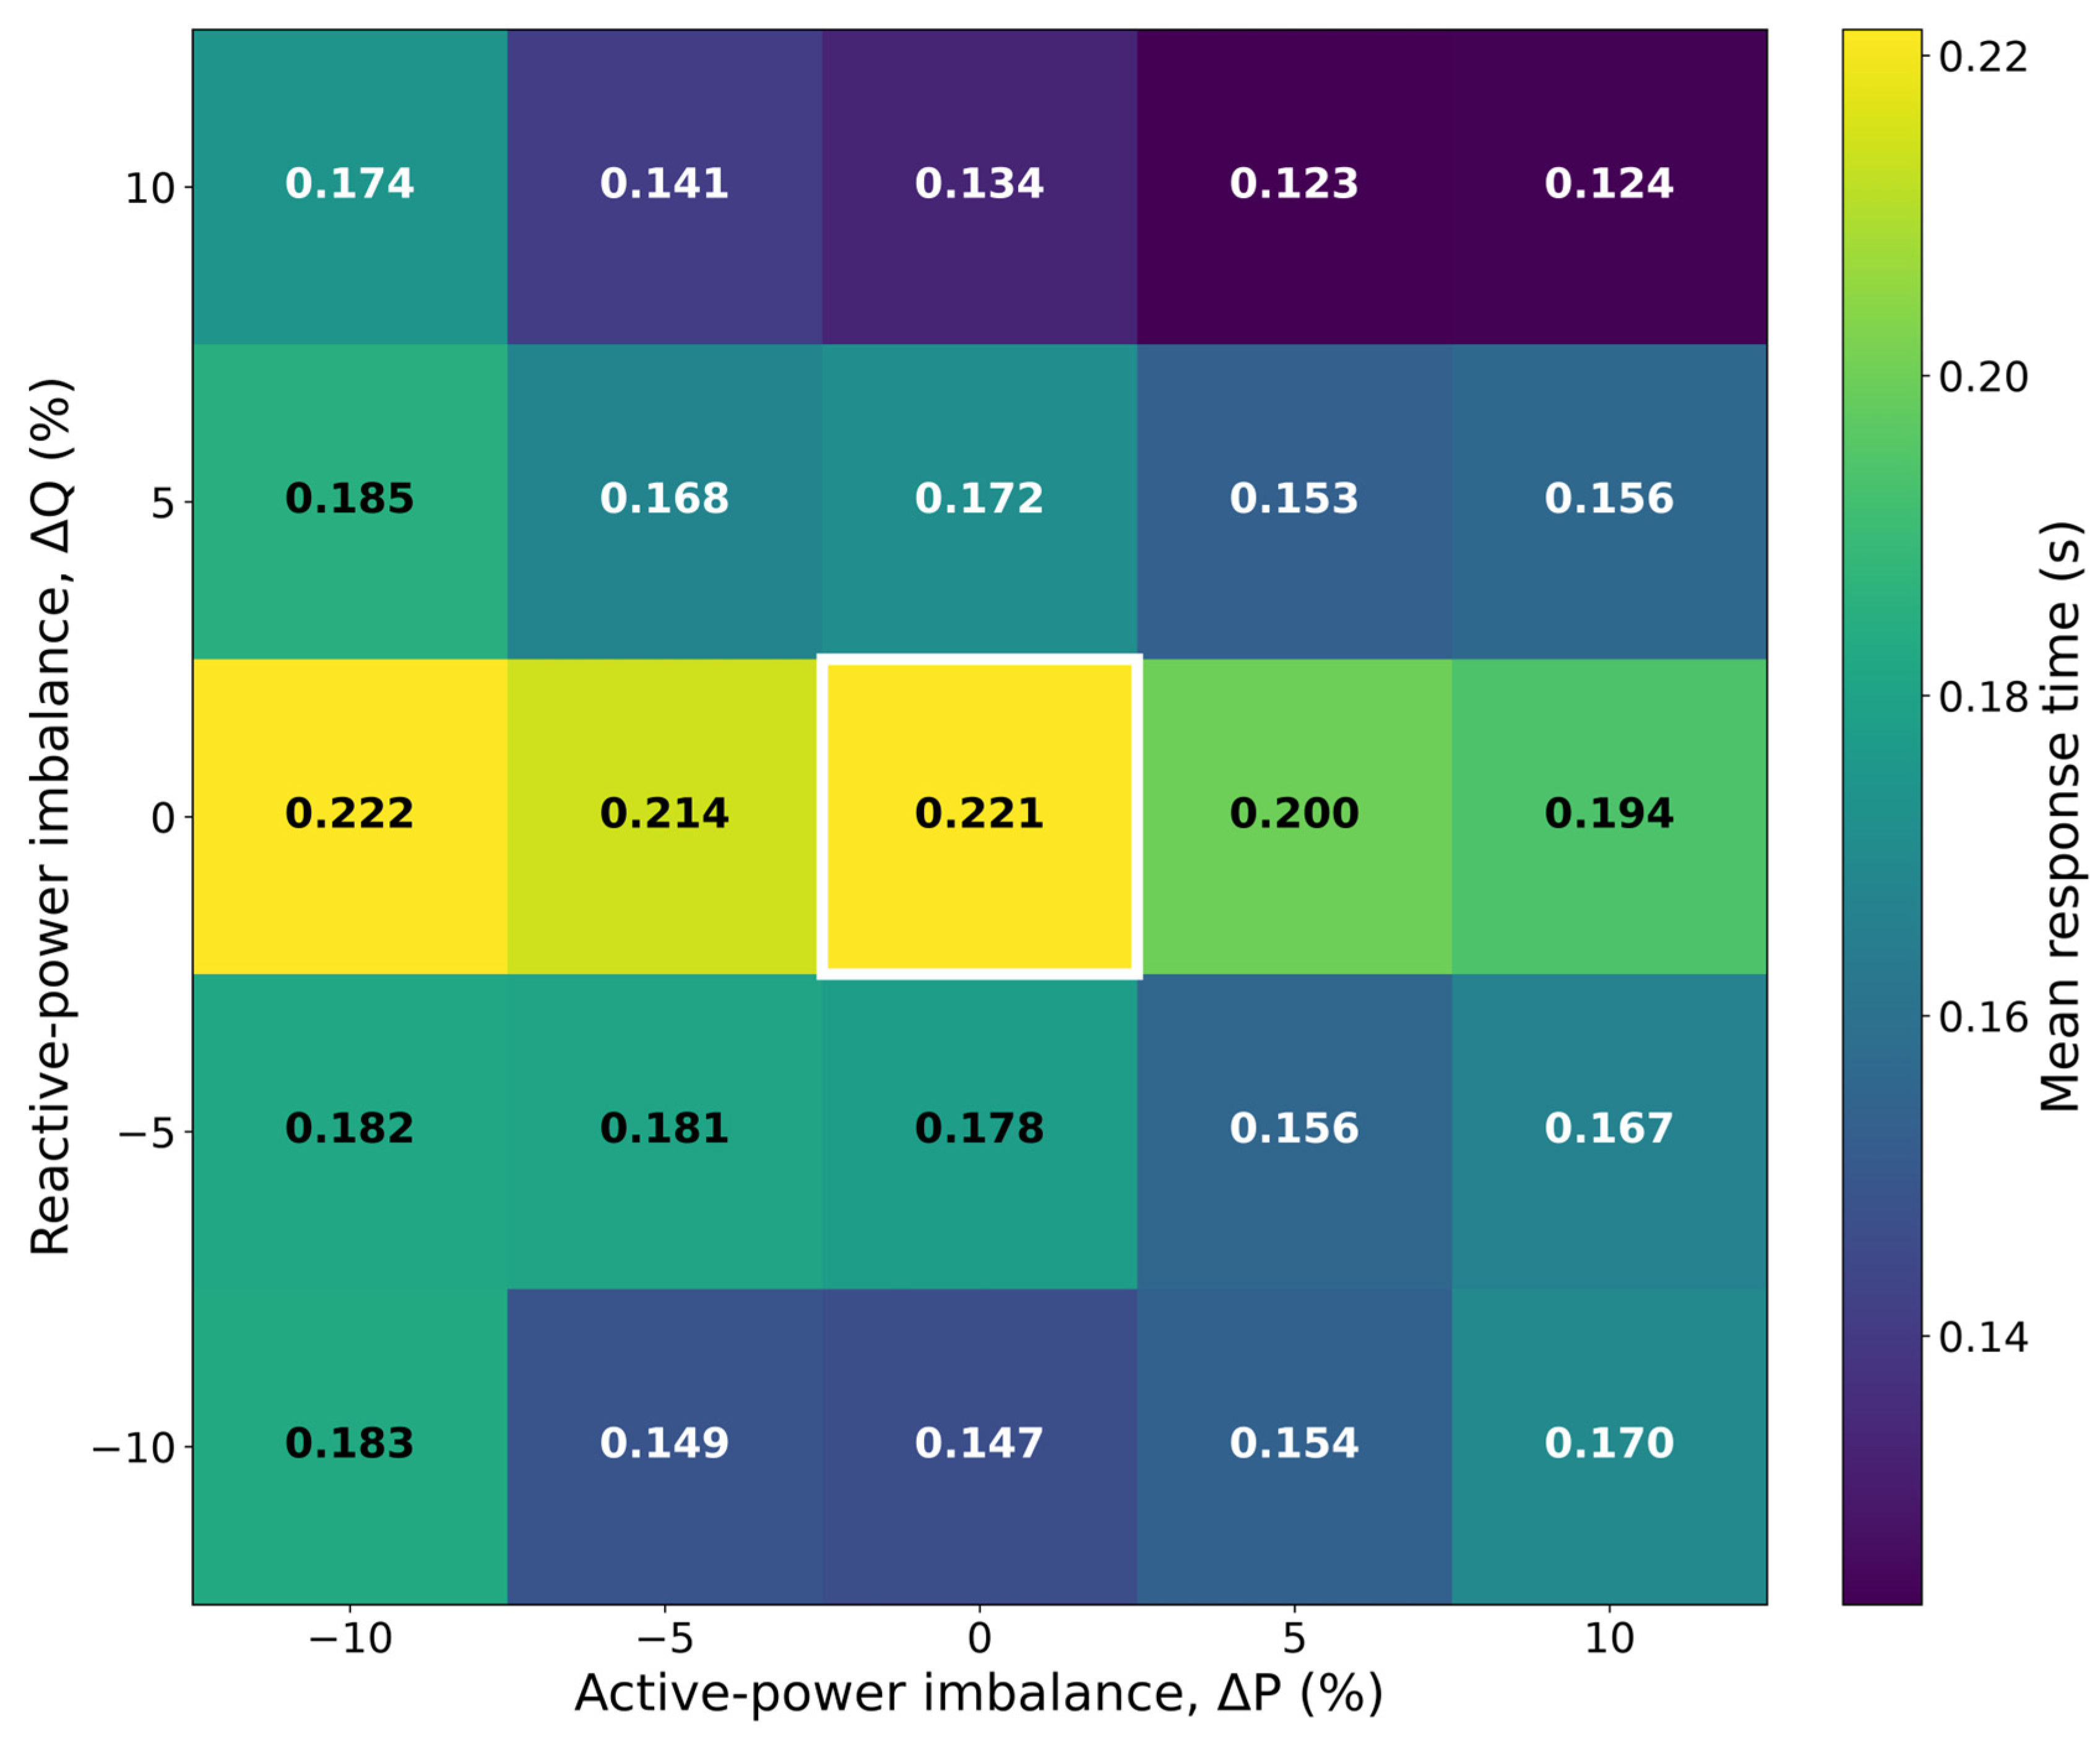
The measured cell means form a directional pattern rather than a smooth radial surface (Figure 4).
Figure 4.
Mean measured response time at each of the 25 Condition-A cells. Values are direct cell means across 37 products. The white outline identifies the balanced cell. No interpolation or unmeasured response surface is shown.
Long mean response times formed a corridor around reactive-power balance, ΔQ = 0. The balanced-point mean was 0.221 s, while the highest cell mean was 0.222 s at ΔP = −10%, ΔQ = 0%. The unrounded group means differed by less than 0.001 s; accordingly, no unique slowest cell was assigned on the basis of this numerical difference. The longer group means extended across the ΔQ = 0 corridor.
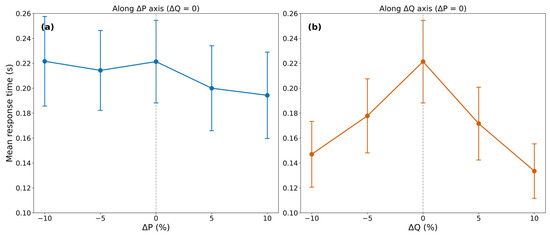
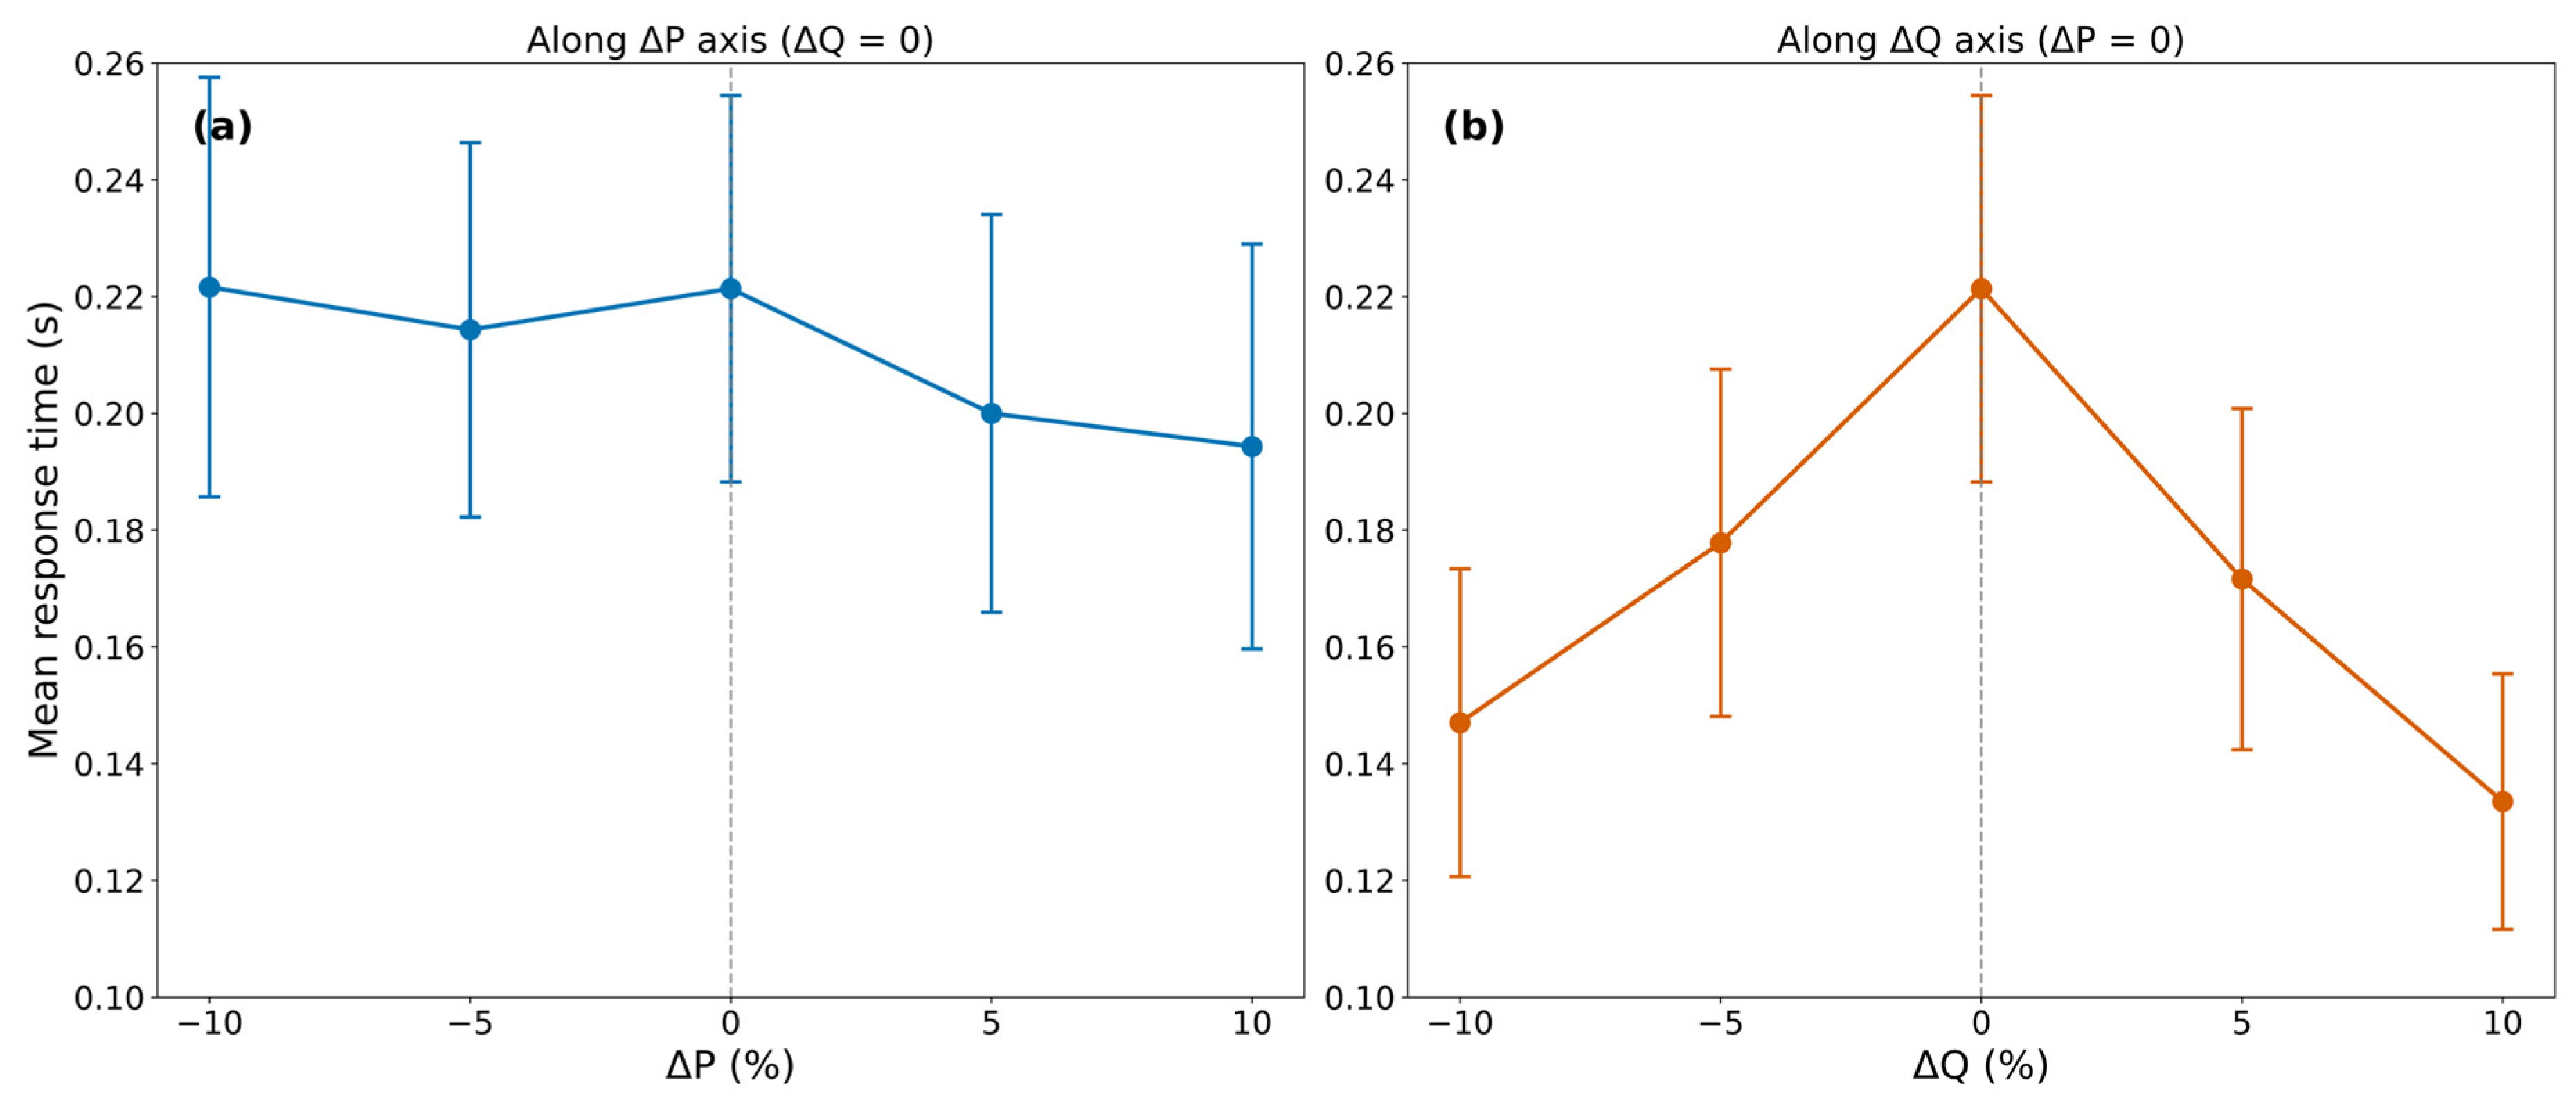
Moving away from the corridor in the ΔQ direction produced a clear decline. At ΔP = 0, means were 0.147, 0.178, 0.221, 0.172, and 0.134 s for ΔQ = −10, −5, 0, +5, and +10%, respectively. Along ΔQ = 0, the corresponding means across ΔP = −10 to +10% ranged only from 0.194 to 0.222 s. Figure 5 displays the signed axis profiles rather than folding positive and negative directions into absolute values.
Figure 5.
Signed axis profiles through the balanced point: (a) response along the ΔP axis at ΔQ = 0; and (b) response along the ΔQ axis at ΔP = 0. Markers are means across 37 products, and error bars are two-sided 95% t confidence intervals for between-product means. The vertical dashed line identifies the balanced axis position.
A product-paired corridor contrast supported this descriptive pattern. The mean response across the five ΔQ = 0 cells was 0.210 s, compared with 0.150 s across the ten cells in the two signed |ΔQ| = 10% rows. The mean difference was 0.061 s (95% CI 0.036–0.085 s; Wilcoxon p < 0.001) and was positive in 32 of 37 products.
4.3. Product-Paired Directional Contrasts
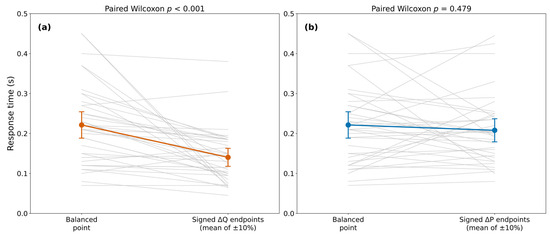
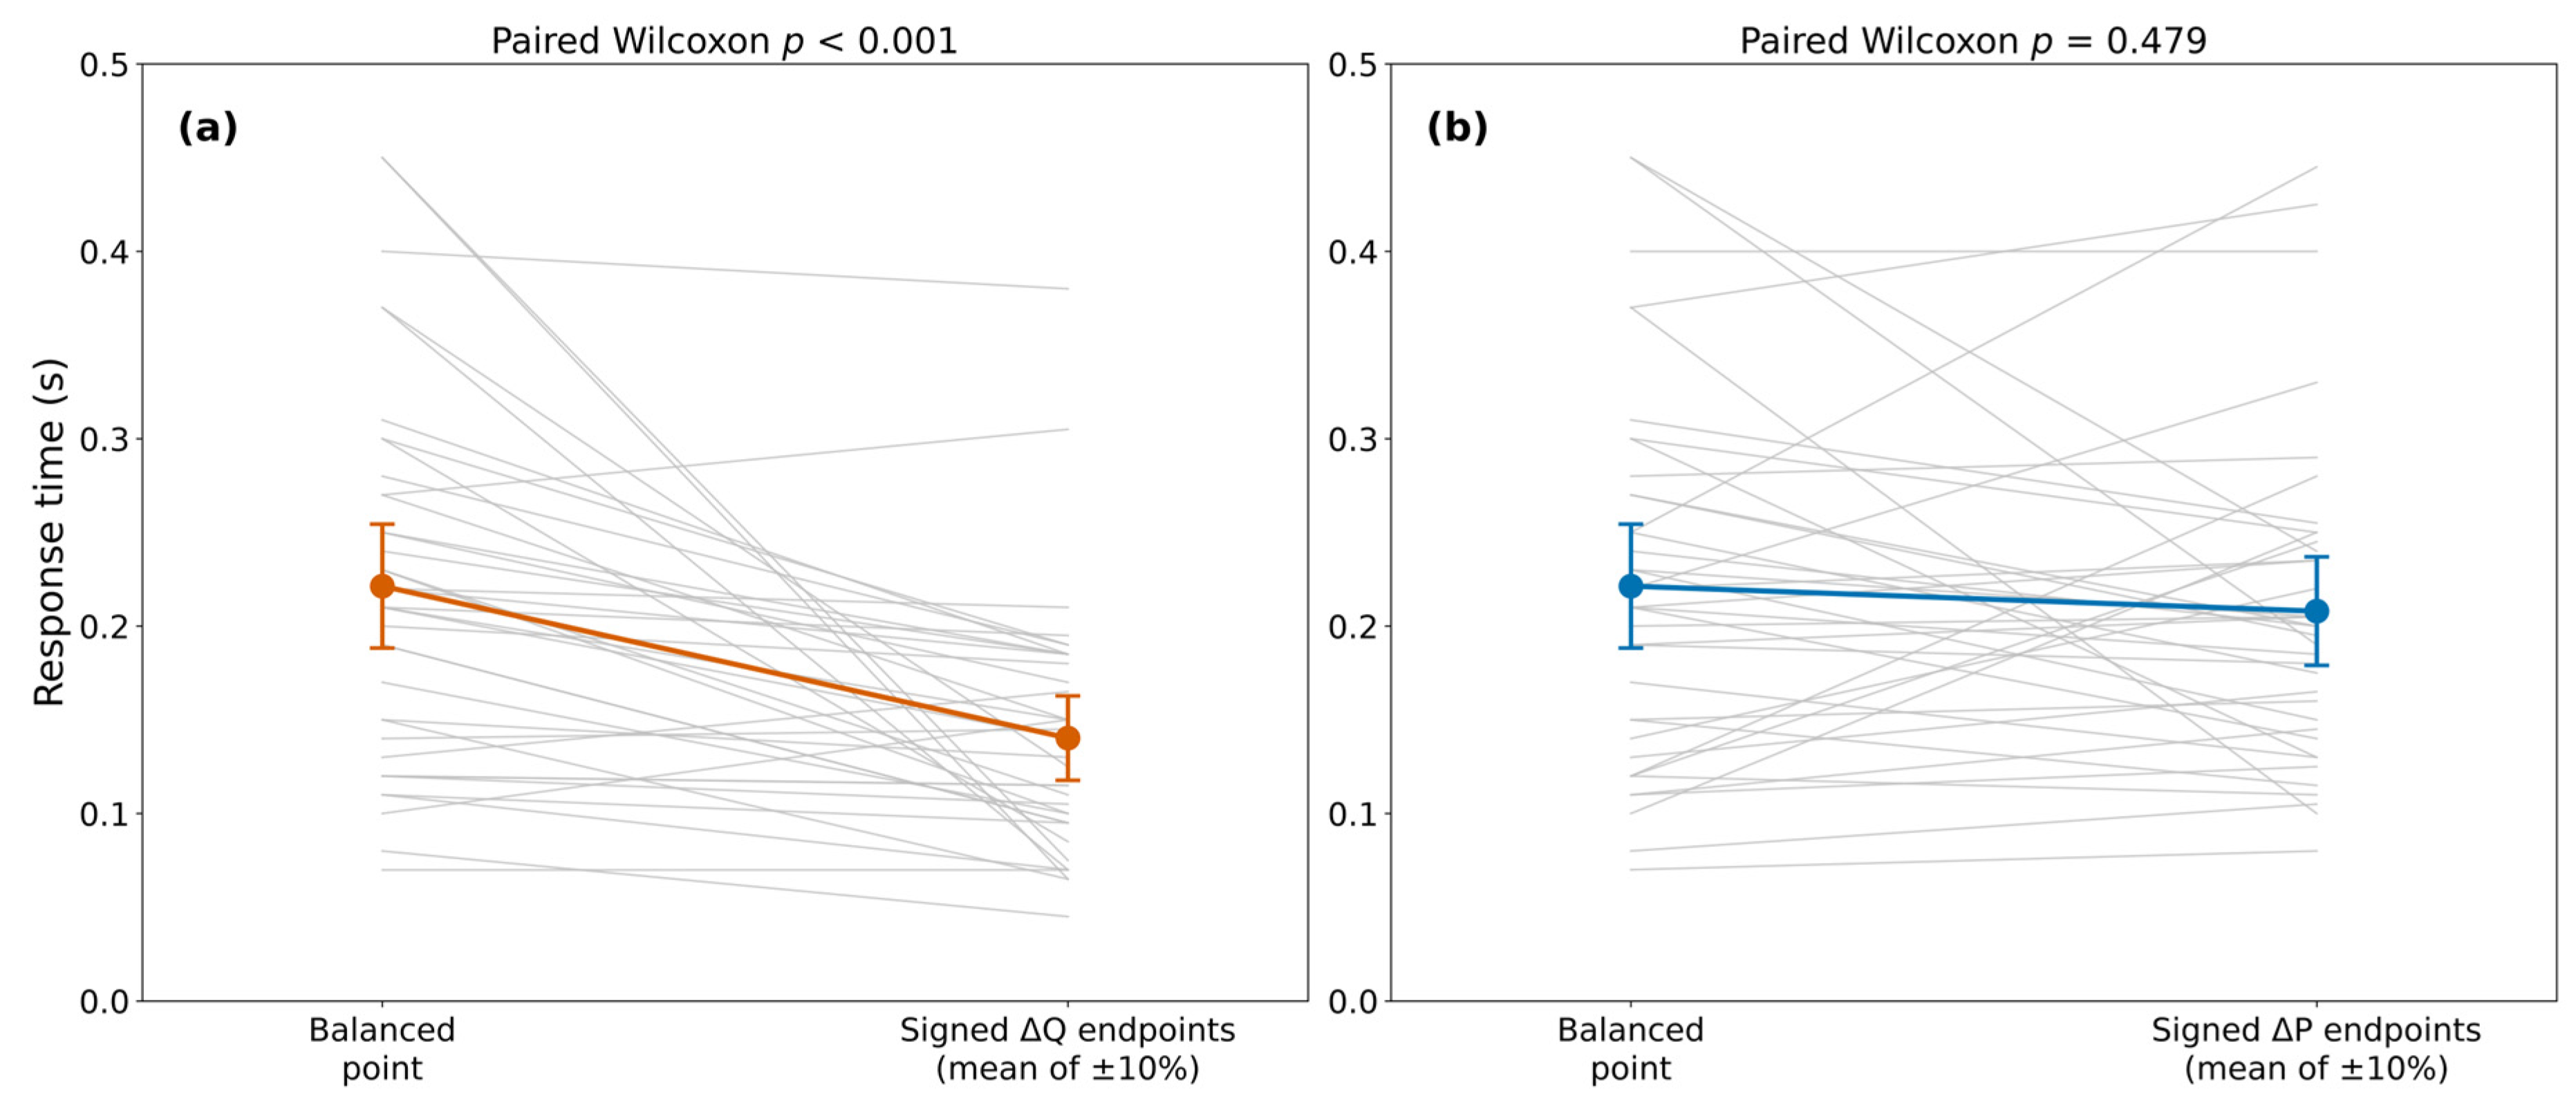
The paired plots show a more consistent product-level decrease along the Q axis than along the P axis (Figure 6).
Figure 6.
Product-paired comparisons: (a) the balanced point versus the mean of the two signed |ΔQ| = 10% endpoints at ΔP = 0; and (b) the balanced point versus the mean of the two signed |ΔP| = 10% endpoints at ΔQ = 0. Thin gray lines show individual products; colored markers show means with two-sided 95% t confidence intervals.
Table 3 summarizes the product-paired directional and corridor contrasts.
Table 3.
Product-paired directional and corridor contrasts, n = 37 products.
For the primary ΔQ-axis component contrast, 32 products were positive, one showed no difference, and four were negative (p < 0.001). For the ΔP-axis component contrast, 18 were positive, one showed no difference, and 18 were negative (p = 0.479). The direct contrast defined in Equation (5) was positive for 31 products, showed no difference for one, and was negative for five (Table 3), yielding a mean difference of 0.068 s (95% CI 0.040–0.095 s; p < 0.001). Thus, the decrease away from reactive-power balance was larger than the change at the same active-power imbalance magnitude. A manufacturer-aggregated sensitivity analysis preserved the direction: eight of nine manufacturer means were positive (Wilcoxon p = 0.0078).
4.4. Within-Product Pattern
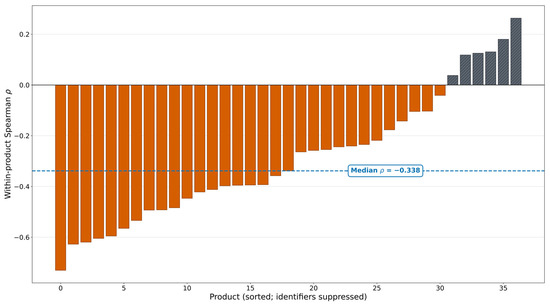
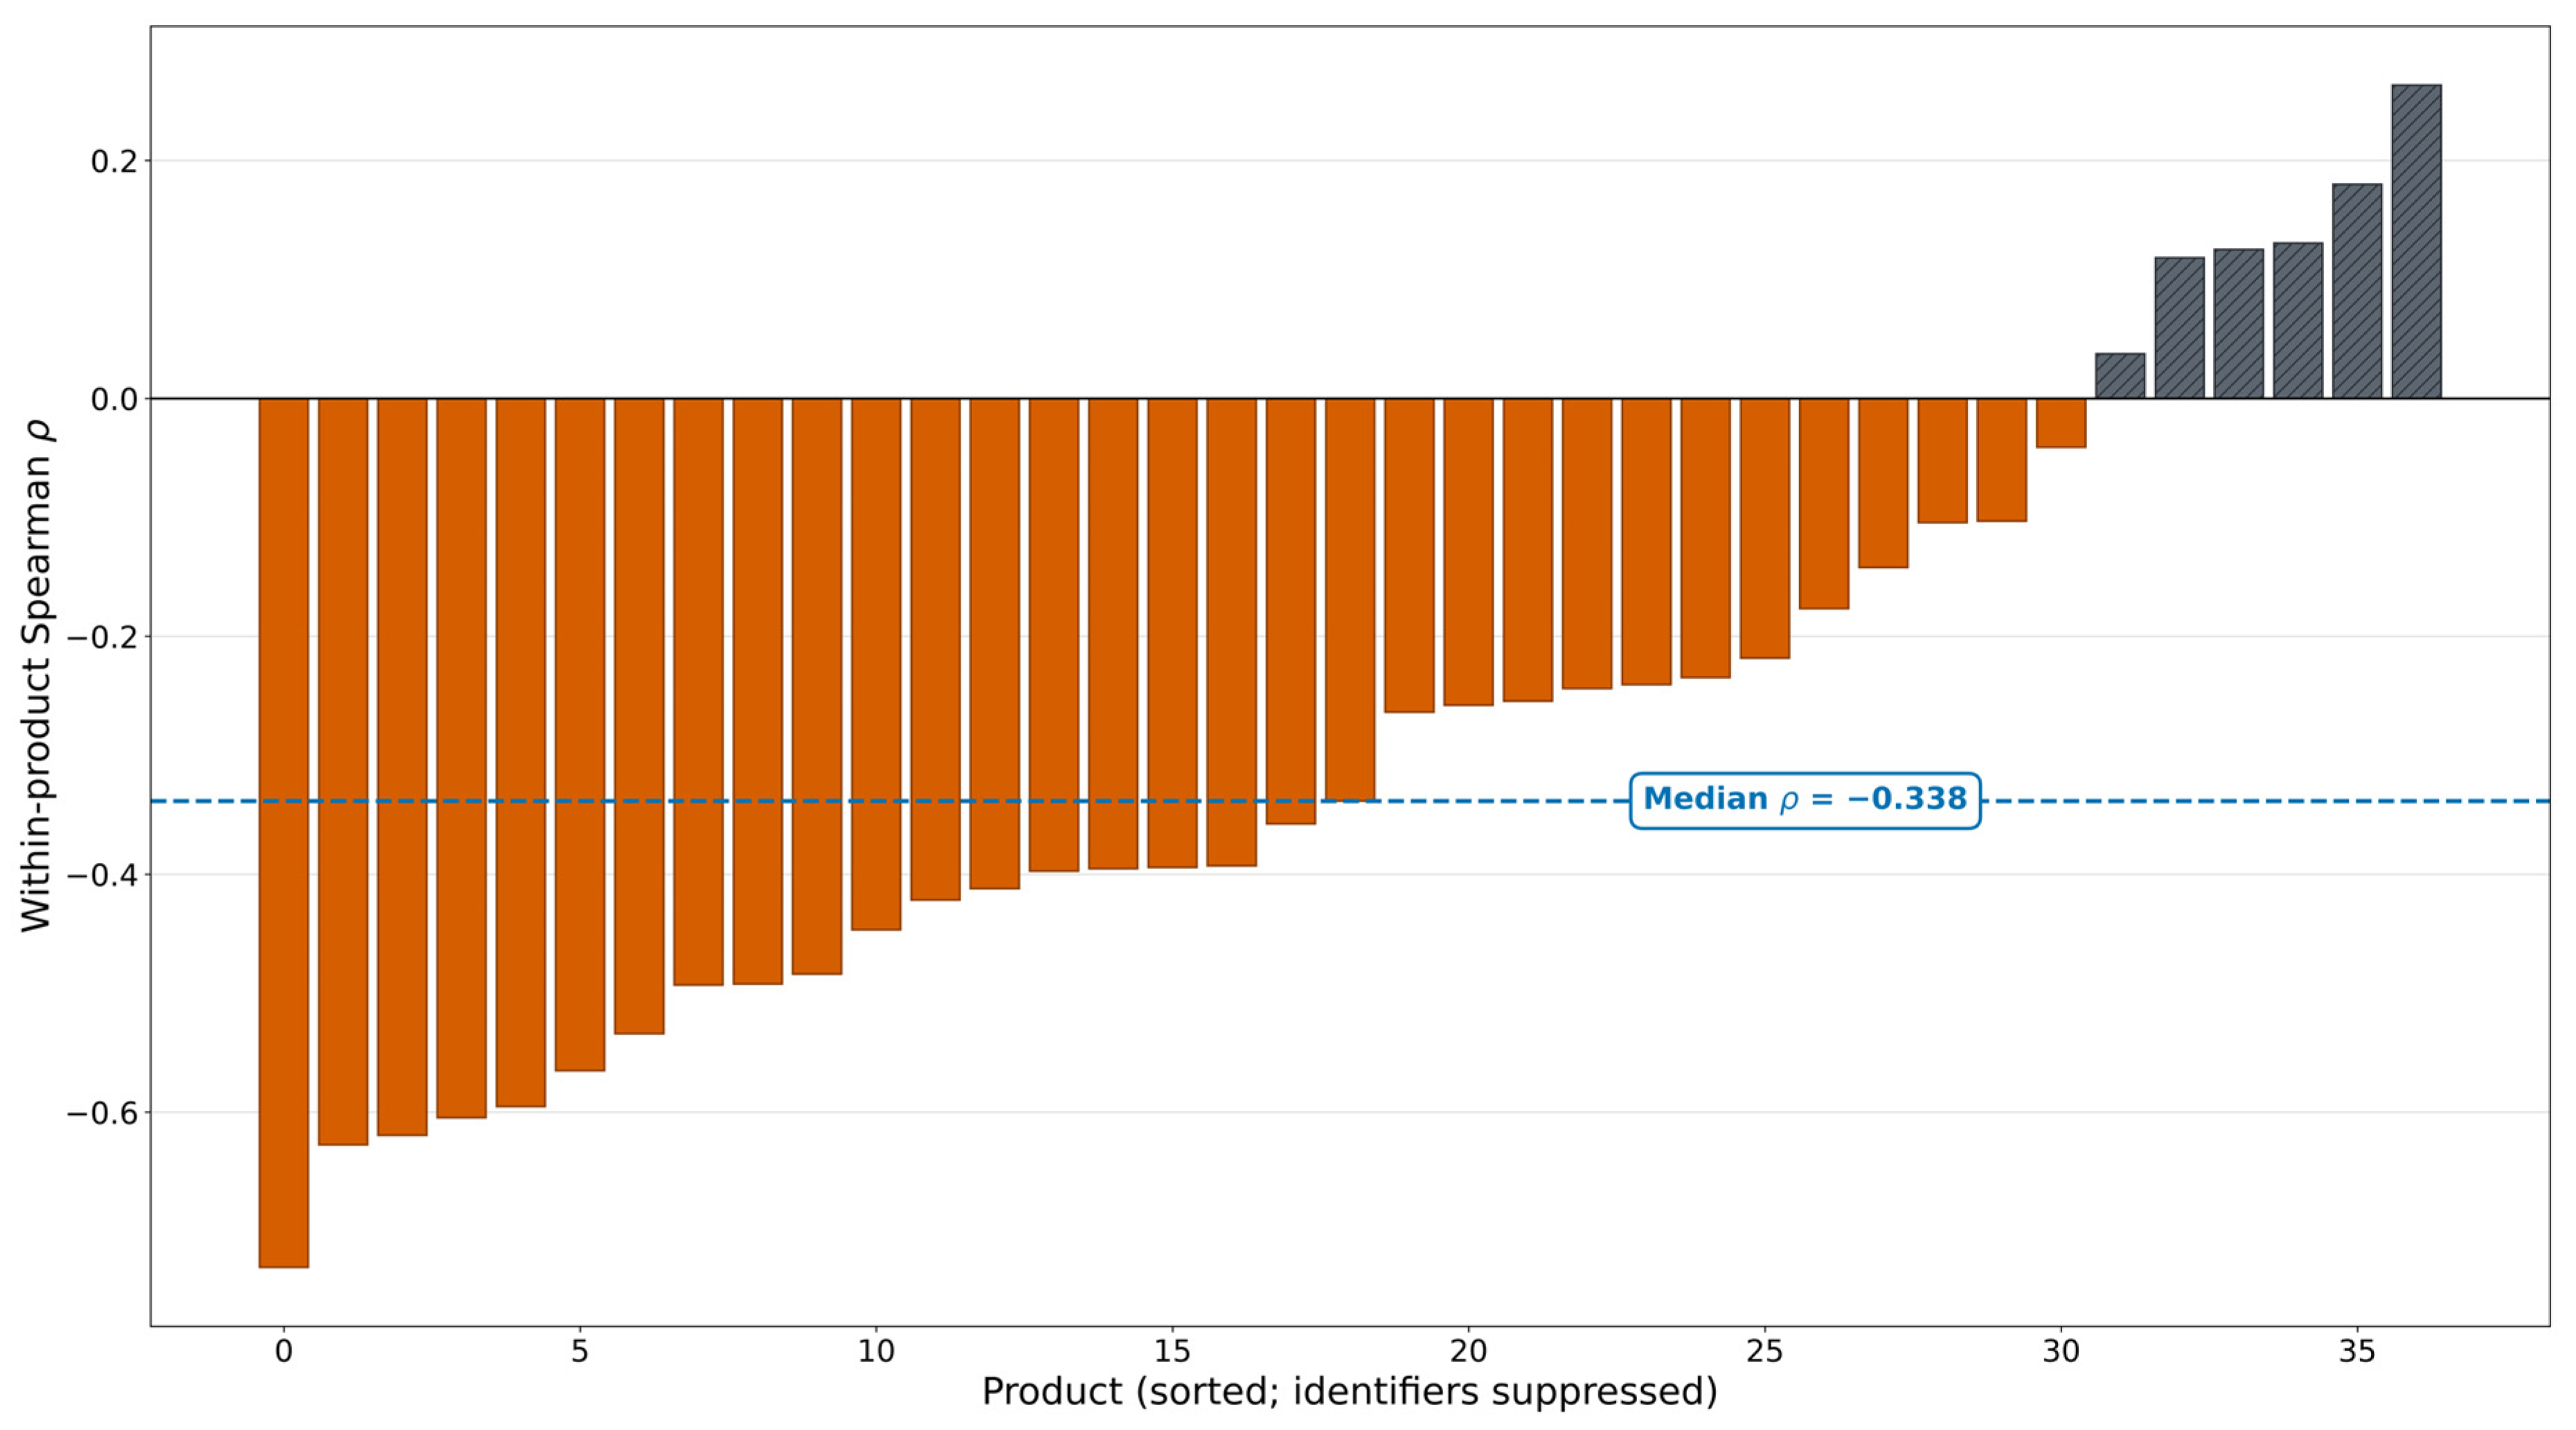
The product-level radial correlations are predominantly negative but vary widely, confirming that radial distance is descriptive rather than directional (Figure 7).
Figure 7.
Descriptive within-product Spearman correlations between radial distance from the balanced point and measured response time. Products are sorted by Spearman coefficient (ρ); identifiers are suppressed. Orange bars denote negative coefficients, and hatched gray bars denote nonnegative coefficients. The blue dashed line and boxed annotation identify the median. The statistic summarizes monotonic association but does not preserve the difference between the ΔP and ΔQ axes.
Considering the radial-distance correlation specifically, 31 of the 37 products showed a negative distance–time relationship, and the median product-level ρ was −0.338. The balanced point tied for the product maximum in seven products and was a strict maximum in four. Response time generally decreased with distance from the center, with most of the change occurring along the ΔQ direction.
5. Discussion
5.1. Main Finding: A Reactive-Power-Balance Corridor
Across the 37 products, relatively long compliant responses were organized mainly by reactive-power balance. The balanced cell was not uniquely slow: similar group means persisted as ΔP changed along ΔQ = 0, whereas response time decreased when ΔQ moved away from zero. The matched-magnitude comparison also showed that active- and reactive-power departures should not be combined into a single distance-from-balance measure. Within the measured 5 × 5 matrix, the most informative feature was a reactive-power-balance corridor rather than one worst-case cell or a radial approximation of an NDZ.
The observed directional pattern is consistent with the steady-state balance relations of the parallel-RLC test circuit. Near resonance, this coupling separates by axis, with active-power-balance tracking voltage magnitude and reactive-power balance tracking frequency. This first-order circuit-level relation provides a plausible basis for the P-Q anisotropy, but it does not establish the cause of the measured response times. Positive and negative directions were not perfectly symmetric, so folding the data into |ΔP|, |ΔQ|, or radial distance would hide part of the measured response. The result does not identify the internal detection algorithm of any product, but it shows that the prescribed coordinates retain a circuit-level directional structure across products with different proprietary protection implementations. The figures therefore show measured cells and signed profiles without interpolation between untested points.
Previous experimental studies emphasized multi-inverter interaction, grid-support functions, parallel operation, or candidate detection methods [32,33,34,35,36,37,38,39]. The present study differs by analyzing complete standardized 25-cell matrices from 37 commercial PV-inverter products and treating each product as the paired unit. This design identifies a cross-product directional structure without requiring disclosure of proprietary product identities or detection algorithms.
5.2. Implications for Certification Reporting
The compliance criterion and the response-time profile answer different questions. The 0.5 s limit establishes whether a product passes the anti-islanding requirement; the signed matrix identifies where its response becomes relatively slower or faster within the prescribed conditions. Reporting the cell map together with the paired Q- and P-axis contrasts would preserve the acceptance rule while making the certification record more informative for laboratories and manufacturers comparing hardware, firmware, or control-setting changes.
For routine reporting, three items capture the observed structure: the balanced-point value, the signed axis profiles, and the paired Q- versus P-axis contrast. Together they distinguish the nominal balance condition, the reactive-power-balance corridor, and the directional response pattern.
5.3. Implications for PCS Grid-Connection Testing
PCS work could use the same signed mapping and within-product comparison procedure, not the numerical PV response times. A prospective PCS matrix should separate charge and discharge, reactive-power or power-factor control, and grid-following and grid-forming operation [11,40,42,43,44,45]. Grid-forming operation, in which the converter actively sets terminal voltage and frequency rather than following the grid, is becoming increasingly relevant for storage-based grid support and may require its own anti-islanding characterization, distinct from the grid-following behavior captured here.
Two questions follow for a PCS protocol: whether the relatively slow ΔQ = 0 corridor persists, and whether positive and negative imbalance directions remain unequal. Both require PCS-specific confirmation in each power-flow direction.
Discharge can be tested with the conventional islanding-load arrangement. Charge testing requires a topology that can supply power to the PCS, such as a bidirectional source/sink or a controlled co-located DER; a passive load bank alone cannot sustain the charging condition. The record should preserve operating mode, commanded power, actual power-flow sign, and reactive-power-control mode [11,44].
Parallel PV-storage experiments show that charging level and inverter interaction can affect islanding detection at a common point of coupling [45]. Applying the same signed matrix in charge and discharge operation would test whether the observed corridor persists, narrows, or shifts.
5.4. Scope, Transferability, and Future PCS Validation
The empirical conclusion applies to the tested PV-inverter set and the standardized Condition-A matrix. Its purpose is to identify a cross-product directional pattern at the converter terminals, not to infer any manufacturer’s proprietary detection algorithm or to transfer the observed response times directly to a different converter class. The sample is a non-probability, single-laboratory certification set with unbalanced manufacturer representation (one to ten products per manufacturer group), and per-test protocol metadata beyond the summary in Table 2—such as achieved tuning tolerance, ambient conditions, and probe assignment—was not retained in the analysis file. The complete matrices and common laboratory procedure provide a consistent basis for the present within-product comparisons.
The next validation step is a prospective, multi-laboratory study that applies the same signed mapping to a broader product set. Replication across laboratories and manufacturer groups would test the stability of the reactive-power-balance corridor, while additional waveform captures and finer timing records would support comparisons of endpoint definition and short-term repeatability. These additions extend the present evidence rather than alter its matrix-level conclusion.
For PCS testing, the prospective record should preserve charge or discharge state, commanded and measured power-flow sign, reactive-power or power-factor control mode, grid-following or grid-forming operation, the achieved RLC tuning condition, and the two response-time markers. Applying the signed matrix separately in these modes would determine whether the PV-derived ΔQ = 0 corridor persists, shifts, or separates by operating state. In this way, the present scope defines concrete PCS test requirements and a reproducible route for future generalization.
6. Conclusions
Analysis of complete 5 × 5 Condition-A matrices from 37 PV inverter products showed that relatively long compliant anti-islanding responses followed the reactive-power-balance row rather than being confined to the exact P-Q balanced point. Mean response at the matched |ΔQ| = 10% endpoints was shorter than at the matched |ΔP| = 10% endpoints by 0.068 s, and the mean response along ΔQ = 0 exceeded that of the two |ΔQ| = 10% rows by 0.061 s. The direct contrast was positive in 31 products, zero in one, and negative in five; eight of nine manufacturer-level means retained the same positive direction. All 925 measured values met the 0.5 s criterion.
The finding changes how the test matrix can be read. The center cell alone does not characterize the relatively long-response region, and active- and reactive-power imbalance should not be reduced to a single radial measure. Signed cell mapping and within-product contrasts extend routine certification results from binary compliance evidence to a directional performance profile without changing the 0.5 s acceptance criterion. The numerical findings apply to the tested PV-inverter set. For PCS applications, the contribution is the signed-matrix analysis procedure—not numerical transfer of the PV results—which should be validated separately under charge, discharge, reactive-power-control, and relevant grid-control modes.
Author Contributions
Conceptualization, D.K. and M.K.; methodology, Y.R. and D.K.; formal analysis, Y.R. and D.K.; investigation, Y.R., D.K., K.K., Y.K., S.P. and I.J.; resources, D.K.; data curation, D.K.; writing—original draft preparation, Y.R. and D.K.; writing—review and editing, all authors; visualization, D.K.; supervision, M.K.; project administration, D.K. All authors have read and agreed to the published version of the manuscript.
Funding
This work was supported by the Korea Institute of Energy Technology Evaluation and Planning (KETEP) and the Ministry of Climate, Energy & Environment (MCEE) of the Republic of Korea (NO. RS-2025-16064197).
Data Availability Statement
The original contributions presented in the study are included in the article; further inquiries can be directed to the corresponding author.
Conflicts of Interest
The authors are employed by the Korea Testing & Research Institute (KTR), the accredited laboratory that generated the certification records analyzed in this study. The authors declare no other commercial or financial relationships that could be construed as a potential conflict of interest.
References
- International Energy Agency. Unlocking the Potential of Distributed Energy Resources; IEA: Paris, France, 2022. [Google Scholar]
- International Energy Agency. Renewables 2025; IEA: Paris, France, 2025. [Google Scholar]
- International Energy Agency. Battery Storage Is Scaling Up and Taking on a Larger System Role. Available online: https://www.iea.org/commentaries/battery-storage-is-scaling-up-and-taking-on-a-larger-system-role (accessed on 17 July 2026).
- KS C 8565:2024; Photovoltaic Inverters, Anti-Islanding Prevention Function Test. Korean Agency for Technology and Standards: Eumseong, Republic of Korea, 2024.
- KS C 8565:2023; Photovoltaic Inverters, Anti-Islanding Prevention Function Test. Korean Agency for Technology and Standards: Eumseong, Republic of Korea, 2023.
- Korea Energy Agency; New and Renewable Energy Center. KS Certification Standards and Audit Criteria for Renewable-Energy Equipment: KS C 8565, Photovoltaic Inverters. Available online: https://www.knrec.or.kr/biz/introduce/new_cert/intro_energyks.do?gubun=D (accessed on 12 July 2026).
- IEC 62116:2014; Utility-Interconnected Photovoltaic Inverters: Test Procedure of Islanding Prevention Measures. International Electrotechnical Commission: Geneva, Switzerland, 2014.
- IEC 61727:2004; Photovoltaic (PV) Systems-Characteristics of the Utility Interface. International Electrotechnical Commission: Geneva, Switzerland, 2004.
- IEEE Std 1547-2018; IEEE Standard for Interconnection and Interoperability of Distributed Energy Resources with Associated Electric Power Systems Interfaces. Institute of Electrical and Electronics Engineers: Piscataway, NJ, USA, 2018.
- IEEE Std 1547.1-2020; IEEE Standard Conformance Test Procedures for Equipment Interconnecting Distributed Energy Resources with Electric Power Systems and Associated Interfaces. Institute of Electrical and Electronics Engineers: Piscataway, NJ, USA, 2020.
- IEEE Std 1547.9-2022; IEEE Guide for Using IEEE Std 1547 for Interconnection of Energy Storage Distributed Energy Resources with Electric Power Systems. Institute of Electrical and Electronics Engineers: Piscataway, NJ, USA, 2022.
- Bower, W.; Ropp, M. Evaluation of Islanding Detection Methods for Photovoltaic Utility-Interactive Power Systems; Report IEA-PVPS T5-09; IEA PVPS: Paris, France, 2002. [Google Scholar]
- Bower, W.; Whitaker, C.; Erdman, W.; Behnke, M.; Fitzgerald, M. Performance Test Protocol for Evaluating Inverters Used in Grid-Connected Photovoltaic Systems; Sandia National Laboratories: Albuquerque, NM, USA, 2004. [Google Scholar]
- Ye, Z.; Kolwalkar, A.; Zhang, Y.; Du, P.; Walling, R. Evaluation of anti-islanding schemes based on nondetection zone concept. IEEE Trans. Power Electron. 2004, 19, 1171–1176. [Google Scholar] [CrossRef] [Scilit]
- John, V.; Ye, Z.; Kolwalkar, A. Investigation of anti-islanding protection of power converter based distributed generators using frequency domain analysis. IEEE Trans. Power Electron. 2004, 19, 1177–1183. [Google Scholar] [CrossRef] [Scilit]
- Ropp, M.E.; Begovic, M.; Rohatgi, A. Analysis and performance assessment of the active frequency drift method of islanding prevention. IEEE Trans. Energy Convers. 1999, 14, 810–816. [Google Scholar] [CrossRef] [Scilit]
- Hung, G.K.; Chang, C.C.; Chen, C.L. Automatic phase-shift method for islanding detection of grid-connected photovoltaic inverters. IEEE Trans. Energy Convers. 2003, 18, 169–173. [Google Scholar] [CrossRef] [Scilit]
- Lopes, L.A.C.; Sun, H. Performance assessment of active frequency drifting islanding detection methods. IEEE Trans. Energy Convers. 2006, 21, 171–180. [Google Scholar] [CrossRef] [Scilit]
- Zeineldin, H.H.; Kirtley, J.L. A simple technique for islanding detection with negligible nondetection zone. IEEE Trans. Power Deliv. 2009, 24, 779–786. [Google Scholar] [CrossRef] [Scilit]
- Zeineldin, H.H.; Kirtley, J.L. Performance of the OVP/UVP and OFP/UFP method with voltage- and frequency-dependent loads. IEEE Trans. Power Deliv. 2009, 24, 772–778. [Google Scholar] [CrossRef] [Scilit]
- Zeineldin, H.H.; Salama, M.M.A. Impact of load frequency dependence on the NDZ and performance of the SFS islanding detection method. IEEE Trans. Ind. Electron. 2011, 58, 139–146. [Google Scholar] [CrossRef] [Scilit]
- Freitas, W.; Xu, W.; Affonso, C.M.; Huang, Z. Comparative analysis between ROCOF and vector surge relays for distributed generation applications. IEEE Trans. Power Deliv. 2005, 20, 1315–1324. [Google Scholar] [CrossRef] [Scilit]
- Vieira, J.C.M.; Freitas, W.; Xu, W.; Morelato, A. Performance of frequency relays for distributed generation protection. IEEE Trans. Power Deliv. 2006, 21, 1120–1127. [Google Scholar] [CrossRef] [Scilit]
- Lopes, L.A.C.; Zhang, Y. Islanding detection assessment of multi-inverter systems with active frequency drifting methods. IEEE Trans. Power Deliv. 2008, 23, 480–486. [Google Scholar] [CrossRef] [Scilit]
- Yafaoui, A.; Wu, B.; Kouro, S. Improved active frequency drift anti-islanding detection method for grid-connected photovoltaic systems. IEEE Trans. Power Electron. 2012, 27, 2367–2375. [Google Scholar] [CrossRef] [Scilit]
- Reigosa, D.D.; Briz, F.; Charro, C.B.; García, P.; Guerrero, J.M. Active islanding detection using high-frequency signal injection. IEEE Trans. Ind. Appl. 2012, 48, 1588–1597. [Google Scholar] [CrossRef] [Scilit]
- Liu, N.; Aljankawey, A.; Diduch, C.; Chang, L.; Su, J. Passive islanding detection approach based on tracking the frequency-dependent impedance change. IEEE Trans. Power Deliv. 2015, 30, 2570–2580. [Google Scholar] [CrossRef] [Scilit]
- Khamis, A.; Shareef, H.; Bizkevelci, E.; Khatib, T. A review of islanding detection techniques for renewable distributed generation systems. Renew. Sustain. Energy Rev. 2013, 28, 483–493. [Google Scholar] [CrossRef] [Scilit]
- Velasco, D.; Trujillo, C.L.; Garcerá, G.; Figueres, E. Review of anti-islanding techniques in distributed generators. Renew. Sustain. Energy Rev. 2010, 14, 1608–1614. [Google Scholar] [CrossRef] [Scilit]
- Kim, M.-S.; Haider, R.; Cho, G.-J.; Kim, C.-H.; Won, C.-Y.; Chai, J.-S. Comprehensive review of islanding detection methods for distributed generation systems. Energies 2019, 12, 837. [Google Scholar] [CrossRef] [Scilit]
- Cebollero, J.A.; Cañete, D.; Martín-Arroyo, S.; García-Gracia, M.; Leite, H. A survey of islanding detection methods for microgrids and assessment of non-detection zones in comparison with grid codes. Energies 2022, 15, 460. [Google Scholar] [CrossRef] [Scilit]
- Hoke, A.; Nelson, A.; Miller, B.; Chakraborty, S.; Bell, F.; McCarty, M. Experimental Evaluation of PV Inverter Anti-Islanding with Grid Support Functions in Multi-Inverter Island Scenarios; NREL/TP-5D00-66732; National Renewable Energy Laboratory: Golden, CO, USA, 2016. [Google Scholar] [CrossRef] [Scilit]
- Barczentewicz, S.; Lerch, T.; Wętuła, A. Disturbances in parallelly operating PV inverters while islanding state detection. Energies 2025, 18, 5556. [Google Scholar] [CrossRef] [Scilit]
- Chmielowiec, K.; Piszczek, A.; Topolski, Ł. Experimental insights into islanding detection in PV inverters: Foundations for a parallel-operation test standard. Sensors 2025, 25, 7582. [Google Scholar] [CrossRef] [Scilit] [PubMed]
- Llonch-Masachs, M.; Heredero-Peris, D.; Chillón-Antón, C.; Montesinos-Miracle, D.; Villafáfila-Robles, R. Impedance measurement and detection frequency bandwidth: A valid island detection proposal for voltage-controlled inverters. Appl. Sci. 2019, 9, 1146. [Google Scholar] [CrossRef] [Scilit]
- Ramos, C.R.; Zorzela, G.C.; Marchesan, G.; Freitas-Gutierres, L.F.; Cardoso, G., Jr. Impacts of output voltage control on photovoltaic generation islanding detection function. Electr. Power Syst. Res. 2024, 235, 110897. [Google Scholar] [CrossRef] [Scilit]
- Barczentewicz, S.; Lerch, T.; Bień, A.; Duda, K. Laboratory evaluation of a phasor-based islanding detection method. Energies 2021, 14, 1953. [Google Scholar] [CrossRef] [Scilit]
- Ropp, M.; Schultz, D.; Neely, J.C.; Gonzalez, S. Effect of Grid Support Functions and VRT/FRT Capability on Autonomous Anti-Islanding Schemes in Photovoltaic Converters. In Proceedings of the 2016 IEEE 43rd Photovoltaic Specialists Conference (PVSC), Portland, OR, USA, 5–10 June 2016; pp. 1853–1856. [Google Scholar] [CrossRef] [Scilit]
- Ropp, M.; Perlenfein, S.; Schutz, D.; Mouw, C.; Neely, J.C.; Rashkin, L.J.; Gonzalez, S. Evaluation of Multi-Inverter Anti-Islanding with Grid Support and Ride-Through and Investigation of Island Detection Alternatives; Report SAND2019-0499; Sandia National Laboratories: Albuquerque, NM, USA, 2018. [Google Scholar] [CrossRef] [Scilit]
- Blaabjerg, F.; Teodorescu, R.; Liserre, M.; Timbus, A.V. Overview of control and grid synchronization for distributed power generation systems. IEEE Trans. Ind. Electron. 2006, 53, 1398–1409. [Google Scholar] [CrossRef] [Scilit]
- Kroposki, B.; Johnson, B.; Zhang, Y.; Gevorgian, V.; Denholm, P.; Hodge, B.-M.; Hannegan, B. Achieving a 100% renewable grid: Operating electric power systems with extremely high levels of variable renewable energy. IEEE Power Energy Mag. 2017, 15, 61–73. [Google Scholar] [CrossRef] [Scilit]
- EN 50549-1:2019; Requirements for Generating Plants to Be Connected in Parallel with Distribution Networks-Part 1: Connection to a LV Distribution Network. European Committee for Electrotechnical Standardization: Brussels, Belgium, 2019.
- IEEE Std 2030.2.1-2019; IEEE Guide for Design, Operation, and Maintenance of Battery Energy Storage Systems, Both Stationary and Mobile, and Applications Integrated with Electric Power Systems. Institute of Electrical and Electronics Engineers: Piscataway, NJ, USA, 2019.
- IEC 62933-2-1:2017; Electrical Energy Storage Systems-Part 2-1: Unit Parameters and Testing Methods-General Specification. International Electrotechnical Commission: Geneva, Switzerland, 2017.
- Lim, J.R.; Hwang, H.M.; Shin, W.G.; Song, H.-J.; Ju, Y.-C.; Jung, Y.S.; Kang, G.H.; Ko, S.W. Case Studies for Non-Detection of Islanding by Grid-Connected In-Parallel Photovoltaic and Electrical Energy Storage Systems Inverters. Appl. Sci. 2019, 9, 817. [Google Scholar] [CrossRef] [Scilit]

Disclaimer/Publisher’s Note: The statements, opinions and data contained in all publications are solely those of the individual author(s) and contributor(s) and not of MDPI and/or the editor(s). MDPI and/or the editor(s) disclaim responsibility for any injury to people or property resulting from any ideas, methods, instructions or products referred to in the content. |
© 2026 by the authors. Licensee MDPI, Basel, Switzerland. This article is an open access article distributed under the terms and conditions of the Creative Commons Attribution (CC BY) license.