


Abstract
Centralized hot water systems in university dormitories can provide significant energy flexibility through demand response (DR). Thus far, however, existing studies have mainly focused on system-level optimization and have failed to provide a quantitative framework that accounts for individual users’ DR participation behavior and the associated uncertainty. In this paper, we develop a data-driven approach to evaluate demand-side flexibility and quantify the uncertainty that arises as a result of user participation. A clustering-based stochastic load prediction model is proposed and validated using real operational data, serving as the baseline for DR load shifting. Four DR strategies for students are designed based on time-of-use pricing and/or academic credit incentives. A survey of nearly 1000 students is used to calibrate participation probabilities, while a binomial distribution model characterizes the uncertainty of user participation, allowing us to derive the probability distribution and expected value of the system’s flexibility potential. Compared with the no-DR baseline, the combined price–credit incentive yields the highest flexibility, achieving a peak-shaving rate of 62.66% and thus significantly outperforming the price-only strategy. Notably, the academic credit incentive alone increases students’ willingness to participate more effectively than price signals. Furthermore, when the number of participating users exceeds 648, the fluctuation range of the estimated flexibility potential falls below 10.5%, enabling stable flexibility evaluation with a moderately large user sample.
1. Introduction
In striving to reduce carbon emissions, China is actively transitioning its energy infrastructure from fossil fuels to zero-carbon sources [1,2]. Due to the growth of time-variable energy capacity, future energy systems need to provide sufficient flexibility [3,4]. The Smart Integrated Energy System (SIES) combines energy supply, demand and storage units with intelligent applications [5,6], enabling interactions and collaborative management between these units and thus enhancing system efficiency and flexibility [7,8,9]. Demand response (DR) management is an effective and economic method used to achieve energy flexibility [10,11], typically through price- and incentive-based schemes [12,13,14,15]. Its primary goal is to lower peak electricity loads and enhance energy efficiency as customers modify their energy usage and contribute to demand-side flexibility [16,17]. DR has been extensively applied across heating, cooling, and electric systems, demonstrating its versatility as a flexibility resource [18], and various optimization frameworks have been developed to support DR decision-making under conditions of uncertainty [19]. However, quantifying the actual flexibility potential based on users’ voluntary participation remains a key challenge.
Centralized hot water systems are regarded as important flexible resources when managed through DR. Unlike ordinary residential buildings, university dormitories are densely occupied with relatively concentrated hot water usage patterns, making them promising candidates for DR implementation [20]. However, optimizing the flexibility potential of such systems requires accurate load prediction and a clear understanding of user participation behavior.
Load prediction is essential for characterizing flexibility potential. With the development of SIES, massive operational data have enabled data-driven forecasting techniques [21], among which clustering-based methods are widely adopted [22]. For example, a clustering decision tree model combined with adaptive multiple linear regression was proposed to identify building operation conditions and train condition-specific models, achieving accuracy improvements over conventional black-box algorithms [23]. Other studies [24,25,26] have combined time-series clustering with machine learning for residential electricity load forecasting using smart meter data. While these studies demonstrate the effectiveness of data-driven clustering methods, they primarily focus on physical building characteristics and operational parameters, overlooking the uncertainty inherent in individual users’ DR participation behavior.
The price-responsive nature of flexible thermal loads has attracted considerable attention from researchers. For instance, Reihani et al. [27] developed a mathematical model for scheduling price-sensitive residential storage devices and loads with thermal inertia—including water heaters and air conditioners—to obtain optimal operation under time-varying price signals. Similarly, Gelažanskas and Gamage [28] proposed a DR technique using smart residential hot water heaters that forecast water consumption at the dwelling level, demonstrating the potential of distributed thermal energy storage for grid flexibility. These studies confirm that residential water heaters can serve as effective flexible resources when subject to price signals. However, they are primarily optimization-oriented and rely on deterministic or forecast-based assumptions of user behavior.
From a physical or operational perspective, a limited number of studies have directly quantified the inherent flexibility of hot water systems. Rao et al. [20] evaluated university dormitory hot water flexibility based on available storage capacity. Balint and Kazmi [29] quantified the inherent flexibility of residential hot water systems and identified key determinants. Fischer et al. [30] conducted simulation-based flexibility assessments for residential heat pump pools. These studies primarily address system-configuration flexibility, with limited analysis of user participation in DR.
Beyond thermal system-focused studies, nonintrusive load monitoring (NILM) has enabled appliance-level flexibility evaluation in hybrid microgrids. Liang et al. [31] proposed a dual-task NILM framework that performs appliance state detection and power consumption estimation, incorporating contextual drivers such as temperature and humidity, and embedding the disaggregated results into a robust optimization framework for scheduling demand-side flexibility under renewable energy uncertainty. While NILM-based approaches offer valuable insights into consumption insights, they do not directly capture the stochastic nature of users’ voluntary DR participation behavior.
Furthermore, existing studies on incentive-based DR and energy flexibility have generally assumed that users’ DR participation remains constant [32]. In reality, users’ response behaviors might be influenced by individual habits, preferences, and other factors, resulting in fluctuations and uncertainty in energy flexibility potential [14,33]. The uncertainty of DR participation has been extensively studied in the power systems domain, offering valuable methodological references. Wang et al. [34] evaluated residential DR potential through a comprehensive multi-objective optimization framework considering user comfort and incentives. Recent contributions include a Kano model for customer satisfaction in DR [35] and a Markov-based bounded rationality model for user participation prediction under uncertainty [36].
Recent studies have enabled further enhancement of models for DR uncertainty and behavioral flexibility in campus and building contexts [37,38,39]. Shen [37] developed a low-carbon optimal dispatch model for campus integrated energy systems that accounts for flexible supply–demand interactions. Wang et al. [39] proposed an uncertainty-aware agent-based modeling framework that captures behavior-driven uncertainties and their impacts on flexibility assessment. These studies have advanced campus energy management, yet they focus on system-level optimization without explicitly quantifying individual participation willingness through behavioral data.
To better position this study within the existing literature, Table 1 summarizes the key differences between representative studies and this work across five dimensions: research object, user behavior modeling, incentive design, flexibility metrics, and uncertainty quantification. As shown in the table, existing studies primarily focus on system configuration optimization or appliance-level load disaggregation, and dedicate only limited attention to the explicit modeling of users’ voluntary DR participation behavior and its resulting uncertainty.
Table 1.
Comparison between this study and existing literature on building energy flexibility.
To address this gap, in this study, we develop a data-driven framework to evaluate the demand-side flexibility potential and its associated uncertainties. Firstly, a clustering-based stochastic load prediction model is established, accounting for seasonal patterns, academic vacation schedules, and random factors; it is validated using field operational data. Secondly, four DR strategies considering time-of-use pricing and academic credit incentives are introduced for students, and nearly 1000 valid questionnaires are collected to quantify participation willingness. Next, a binomial distribution model is constructed to characterize the uncertainty of DR participation, with model parameters calibrated based on the questionnaire data. Finally, the probability distribution and expected value of the system’s flexibility potential are determined, and the impact of user sample size on the uncertainty range is quantified.
2. Methods
2.1. Approach Framework
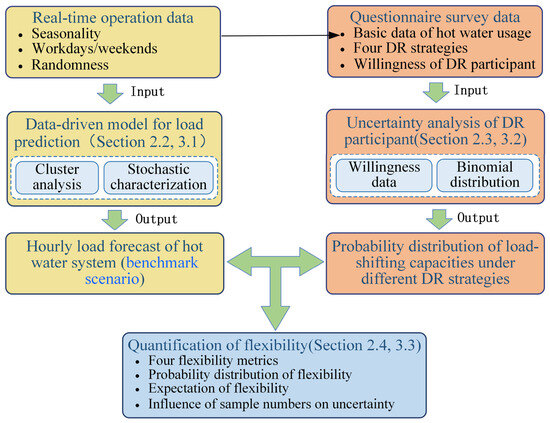
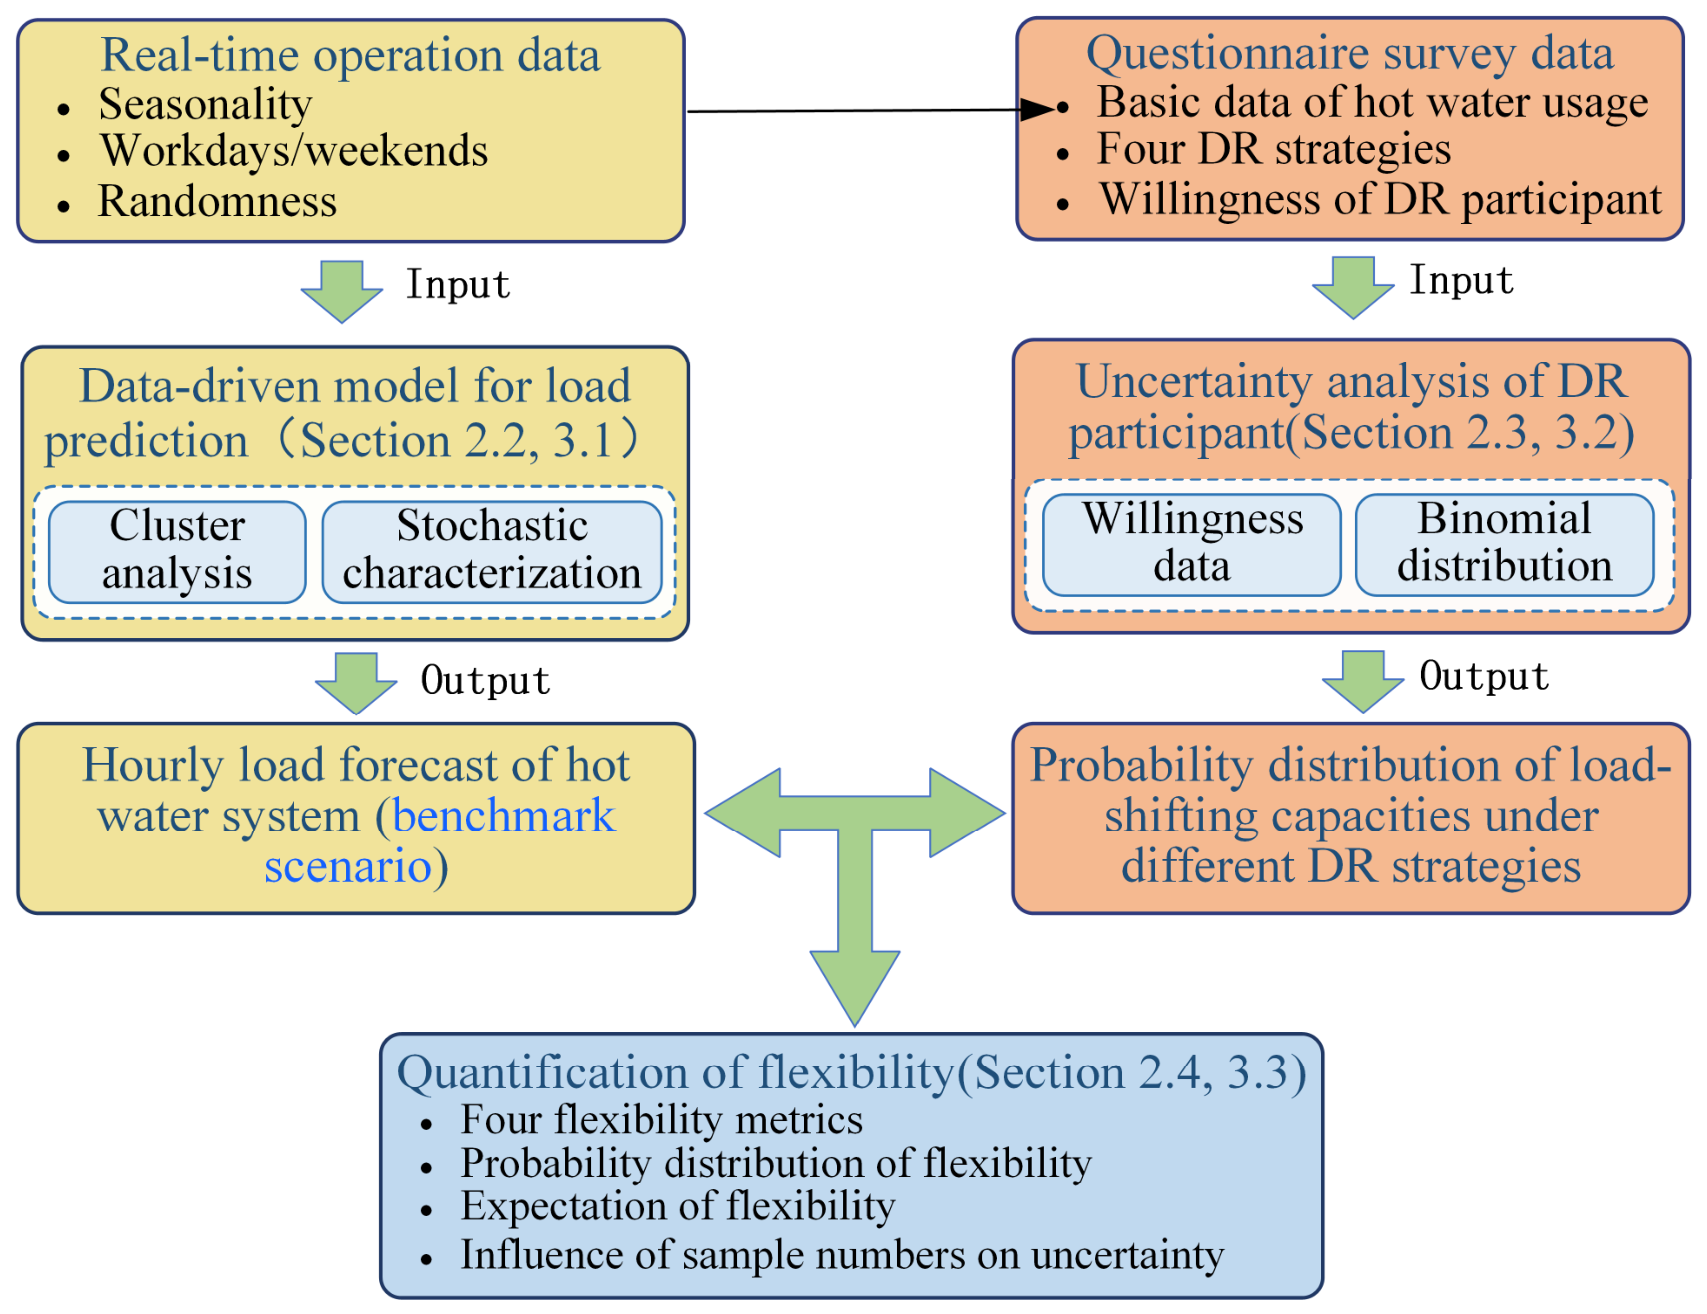
The research framework of this study is presented in Figure 1. Basic data on hot water usage patterns and DR participation willingness (under four DR strategies) are collected through field investigations and structured questionnaires, accounting for both seasonal variations and user schedules. These data are normalized to develop a data-driven predictive model that incorporates stochastic elements. The model enables hourly forecasting of hot water system loads, while the binomial distribution is applied to derive the probability distribution of load-shifting capacities. Finally, the flexibility of centralized hot water systems is quantified by integrating the forecasted load data with the derived probability distributions.
Figure 1.
Analysis framework for characterizing the flexibility of centralized hot water systems. Yellow: Load prediction (based on operational data). Orange: Load shifting capacity calculation (based on survey). Bottom blue: Flexibility quantification and sensitivity analysis.
The DR modeling in this study comprises four components: (i) a data-driven model for load prediction; (ii) incentive-based DR strategies; (iii) a probabilistic model characterizing the uncertainty of user participation; and (iv) flexibility metrics defined as load-shifting quantities. This modeling framework is designed for flexibility assessment under DR participation uncertainty and is distinct from optimization-based scheduling models. Constraint-based system optimization is a complementary direction that can be addressed in future work.
2.2. Data-Driven Method for Load Prediction
2.2.1. Cluster Analysis
A key step in cluster analysis is to identify the optimal number of clusters, which requires a thorough consideration of various factors including the clustering algorithms, assessment metrics, and subjective influences. Considering that the dataset has obvious seasonal characteristics (cooling, heating, and transition seasons) and occupancy characteristics (term or vacation), we use a direct clustering approach to simplify the model. Using Python 3.11.0, we segment the dataset into eight different periods (as listed in Table 2) according to the division of the heating and cooling seasons in Beijing, as well as the university’s term-vacation calendar. To improve the clustering effect, the data for each category are normalized by using Equation (1) [40]:
where is the normalized value; is the measured value; and are the maximum and minimum values of the measured data, respectively.
Table 2.
Clustering scheme considering the seasonal characteristics and term-vacation schedule.
2.2.2. Stochastic Characterization
To enhance the prediction accuracy, the stochastic characteristics of students’ hot water usage is considered, and the random factors are added into the model. By statistically analyzing the distribution density, the mean value and the standard deviation of the measured hourly hot water usage data at a specific moment, we can obtain random factors, as described in Equation (2).
where is the stochastic factor of hot water usage for category k at time t; γ denotes the probability distribution function; μ stands for the mathematical expectation; and σ is the standard deviation of the statistical data. Combining the clustering approach and stochastic factors, the equation for predicting hourly hot water demand can be expressed as follows:
where represents the predicted hourly hot water demand, m3/h; denotes the hot water usage for category k at time t, m3/h; and is the stochastic factor for category k at time t.
Summing the predicted hourly hot water demand for the entire year yields the annual total demand:
where represents the predicted annual total hot water demand, m3; s is the number of categories; m is the number of days in each category; and n is the total hours in a day.
2.3. Survey to Determine DR Participation
2.3.1. DR Strategies
DR strategies are implemented as load-shifting actions that redistribute hourly hot water usage while maintaining the total daily demand, without altering the overall consumption volume and supply temperature. We propose four incentive-based [12,13,14] DR strategies (A, B, C, and D) based on time-of-use electricity pricing and the university’s credit reward system to encourage students’ DR participation. These strategies are listed in Table 3. According to the time-of-use electricity pricing in Beijing, we divide the day into three periods: the peak period (10:00–15:00; 18:00–21:00, referred as Period 1); the flat period (7:00–10:00; 15:00–18:00; 21:00–23:00, Period 2); and the valley period (23:00–7:00, Period 3). In strategies A and B, price incentives are considered at different levels; in strategy C, an academic credit incentive is adopted; and in strategy D, both price and academic credit incentives are involved. The aim of these strategies is to encourage students to shift their hot water usage from Period 1 to Periods 2 or 3, which would increase the energy flexibility of centralized hot water systems.
Table 3.
DR strategies based on price and academic credit incentives.
The price levels in Table 3 are derived from the time-of-use electricity tariff in Beijing and the current hot water pricing policy of the university (benchmark price: RMB 0.12/min). The academic credit incentive is proposed as a conceptual mechanism based on the university’s existing regulations on extracurricular competence and quality credits, which allow for non-monetary rewards to encourage sustainable student behavior. The incentive is conceptualized as an extracurricular practice credit rather than a course-grade credit and would be administered automatically through the university’s smart energy platform. The platform can track students’ hot water usage patterns via student cards and calculate the incentive credit based on the proportion of off-peak usage. Administrative approval will follow standard university procedures for extracurricular credit programs. Importantly, participation is voluntary; students who choose not to adjust their usage patterns will not be penalized, and those who do participate will receive additional credits. This design mitigates fairness and ethical concerns, as the credit serves as a positive incentive rather than a compulsory requirement. This incentive structure is both administratively and technically feasible, as it aligns with existing university policies and infrastructure.
2.3.2. Questionnaires
The questionnaire collected basic student information (gender, educational background, and dormitory number), hot water usage habits across seasons, and willingness to participate under each DR strategy. A sample question is, “How many times do you shower per week in different seasons? If the hot water price during Period 1 increases to RMB 0.20/min, shifting your shower to Period 2 would save 40% of the cost, and shifting to Period 3 would save 80%. Would you adjust your shower time? What is the approximate probability of your adjustment?”
The survey was distributed through both online channels (WeChat groups for graduate and undergraduate students) and on-site distribution (teaching buildings and dormitories), ensuring broad coverage across genders, grade levels, and dormitory locations. To ensure data quality, the questionnaire was designed with simplified questions and clear instructions regarding its research purpose. A validity check was conducted by excluding responses with a completion time of less than 1 min (normal completion time: 3–6 min). Based on these criteria, 965 valid responses were retained out of the 1185 collected, yielding an effective response rate of 81.4%. The sample size of 965 out of 12,621 total students provides a 99% confidence level with a margin of error of approximately ±4.0%, indicating sufficient representativeness for the study population.
2.3.3. Uncertainty Analysis of DR Participation
User participation in an incentivized DR program is often regarded as a random variable following a normal distribution to represent the uncertainty in response behavior [27]. Binomial distribution functions are also frequently employed to simplify complex statistical scenarios. The feasibility of using normal and binomial distributions to characterize the uncertainty of students’ willingness to participate is explored in this study.
On the one hand, a student’s willingness to participate (probability of DR participation) is considered a normally distributed random variable, as described in Equation (5).
where represents the mean value of the DR willingness and is the standard deviation of the willingness. The participation percentage is defined as the ratio of DR participants to the total number of participants. The probability of DR participation of a group of students at a certain percentage range can be obtained by cumulating probability density of during the corresponding interval.
On the other hand, the number of student participants is regarded as obeying a binomial distribution, as described in Equation (6).
where n denotes the total number of participants and represents the mean value of students’ willingness to participate. The response probabilities for varying numbers of participants can be calculated using the probability function of the binomial distribution.
The binomial distribution assumes that each student’s decision to participate is independent and is governed by the same mean willingness probability (), which is estimated directly from the survey responses. This assumption is reasonable in the present context, as the questionnaire was administered to students from different dormitories with no communication among respondents regarding their participation choices, and no external factors were identified that would systematically differentiate individual willingness beyond the observed variability.
2.4. Quantification of Flexibility Potential
2.4.1. Definition of Flexibility Metrics
To evaluate the flexibility potential of centralized hot water systems in university dormitories with regard to different DR strategies, we use the following four flexibility metrics [41]: peak-shaving volume; valley-filling volume; peak-shaving rate; and the ratio of peak-shaving to valley-filling.
Peak-shaving volume reflects the reduction in hot water demand during peak periods for a certain DR scenario, as indicated in Equation (7).
where represents hot water peak-shaving volume, m3; is the hot water demand during peak periods for the benchmark scenario without considering DR strategies, m3; and is the hot water demand during peak periods for the DR scenario, m3.
The valley-filling volume presents the increase in hot water demand during the valley periods for a DR scenario, as defined by Equation (8).
where denotes the hot water valley-filling volume, m3; is the hot water demand during valley periods for the DR scenario, m3; and is the hot water demand during the corresponding time for the benchmark scenario without considering DR strategies, m3.
The peak-shaving rate is calculated as the ratio of peak-shaving volume under a DR scenario to hot water demand during peak periods under the benchmark scenario, defined as Equation (9).
where represents the hot water peak-shaving rate, quantifying the efficiency of flexible load management in reducing strain on the power grid by changing fixed power demands into adjustable usage during critical operational periods.
The peak-shaving to valley-filling ratio is the proportion of peak-shaving volume to valley-filling volume for DR scenarios, as indicated in Equation (10).
where denotes the ratio of hot water peak-shaving to valley-filling, characterizing the dynamic equilibrium between grid-stress reduction and energy-resource optimization in DR operations.
2.4.2. Uncertainty Quantification Method
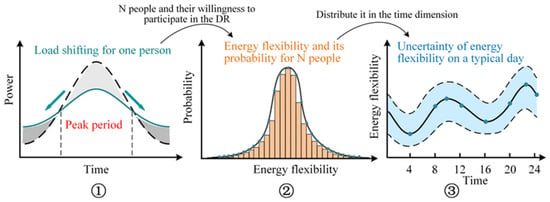
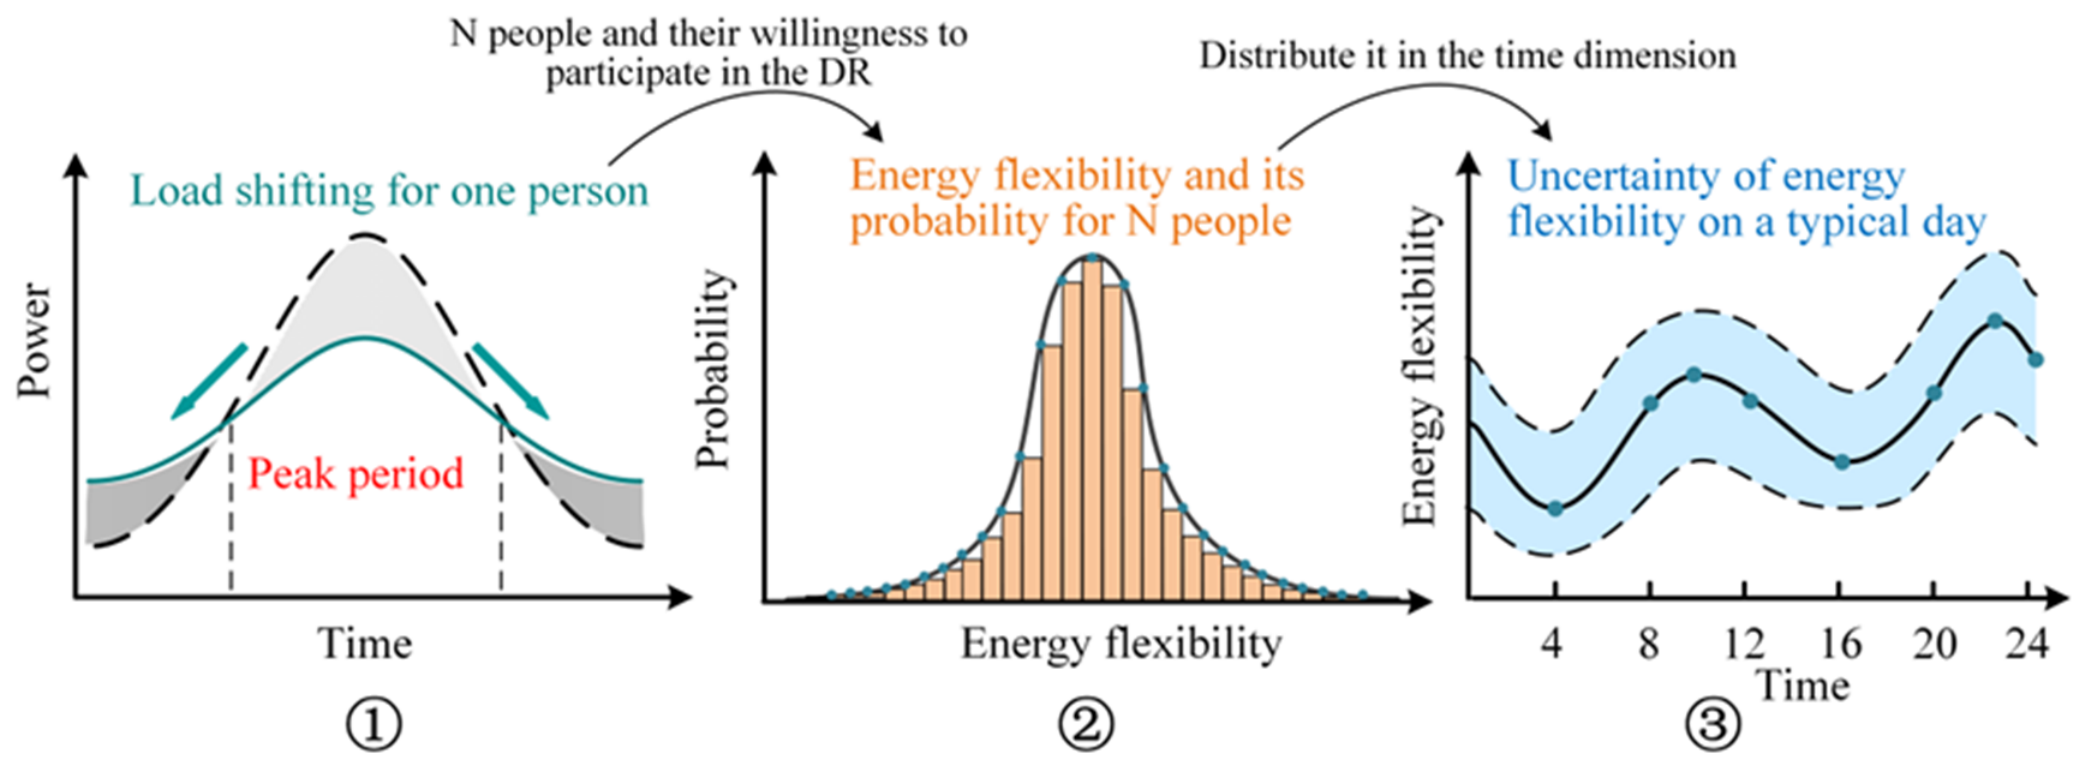
Figure 2 illustrates the process for quantifying the uncertainty of flexibility potential. Step ① represents an individual performing load transfer. Individuals willing to participate in a DR strategy will transfer their hot water usage from peak to other periods. As the number of participants (N) increases, the response probability of user groups is calculated using a probabilistic statistical analysis method, as shown in Step ②. Step ③ depicts the user group’s energy flexibility and uncertainty over time.
Figure 2.
Scheme for quantifying uncertainty of energy flexibility.
The uncertainty of the system’s flexibility is defined as follows:
where , , and represent the maximum, and minimum, and average values of peak load shaving capacity, respectively, at a certain confidence level. In this study, a 99% confidence level is adopted to provide a conservative estimate of the flexibility uncertainty, ensuring robustness in practical DR program design where reliability is critical.
2.5. Field Investigation
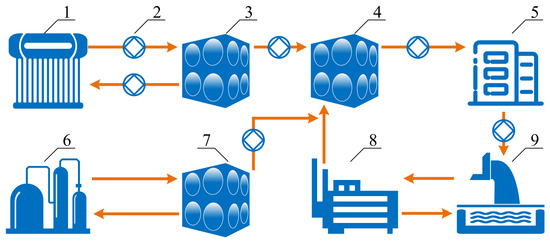
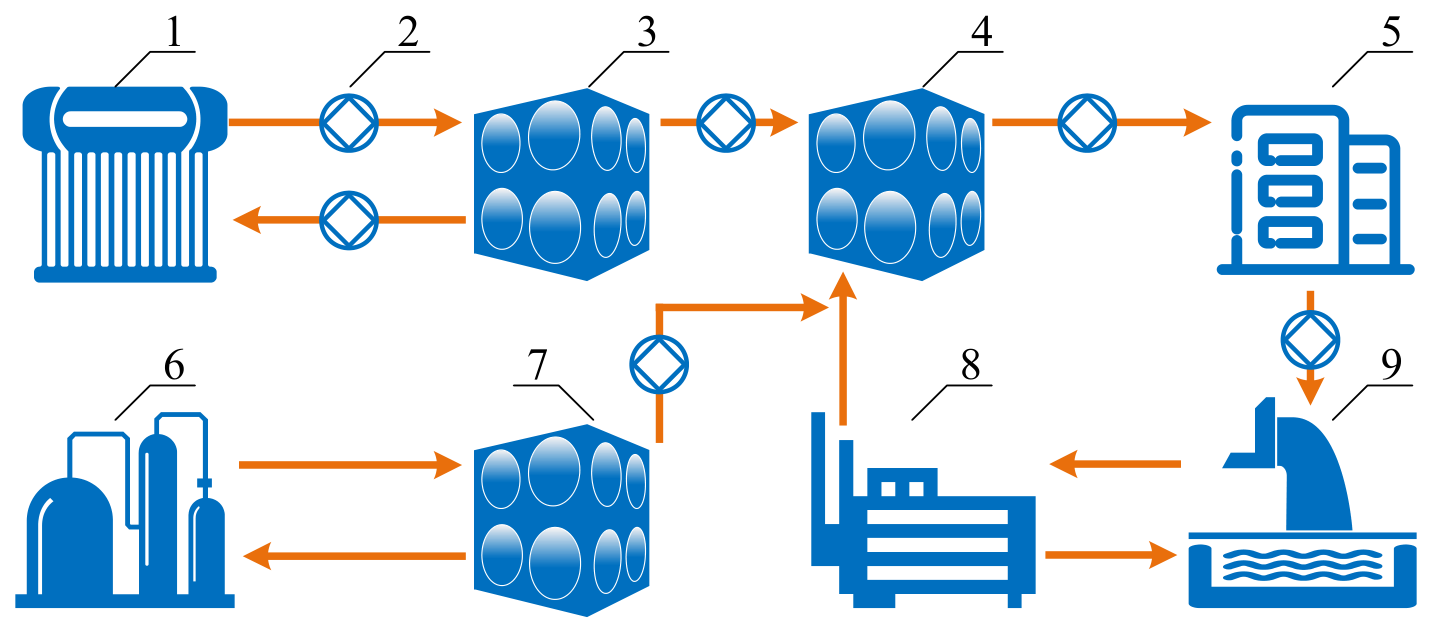
The above-mentioned method is implemented for the centralized hot water system of a university in Beijing. As part of a renewable energy-use demonstration project, the hot water system integrates multiple renewable energy sources, including solar thermal systems, sewage-source heat pumps, ground-source heat pumps, and air-source heat pumps, as shown in Figure 3. The configuration parameters of each heat source are listed in Table 4. This platform provides hot water for 12,621 students spread across 10 dormitories (Buildings 4–12 and 16).
Figure 3.
Diagram showing the various energy sources of the centralized hot water system. 1. Solar collector; 2. circulating water pump; 3. solar water tank; 4. thermostatic water tank; 5. dormitory buildings; 6. ground-source heat pump; 7. ground-source heat pump water tank; 8. sewage-source heat pump; and 9. sewage pool.
Table 4.
Configuration parameters of the centralized hot water system.
3. Results and Discussion
3.1. Load Prediction
3.1.1. Data Acquisition
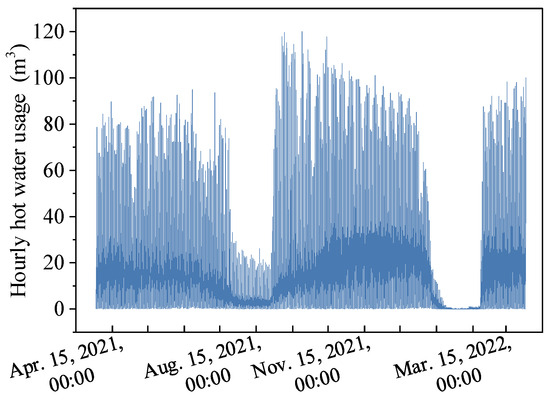
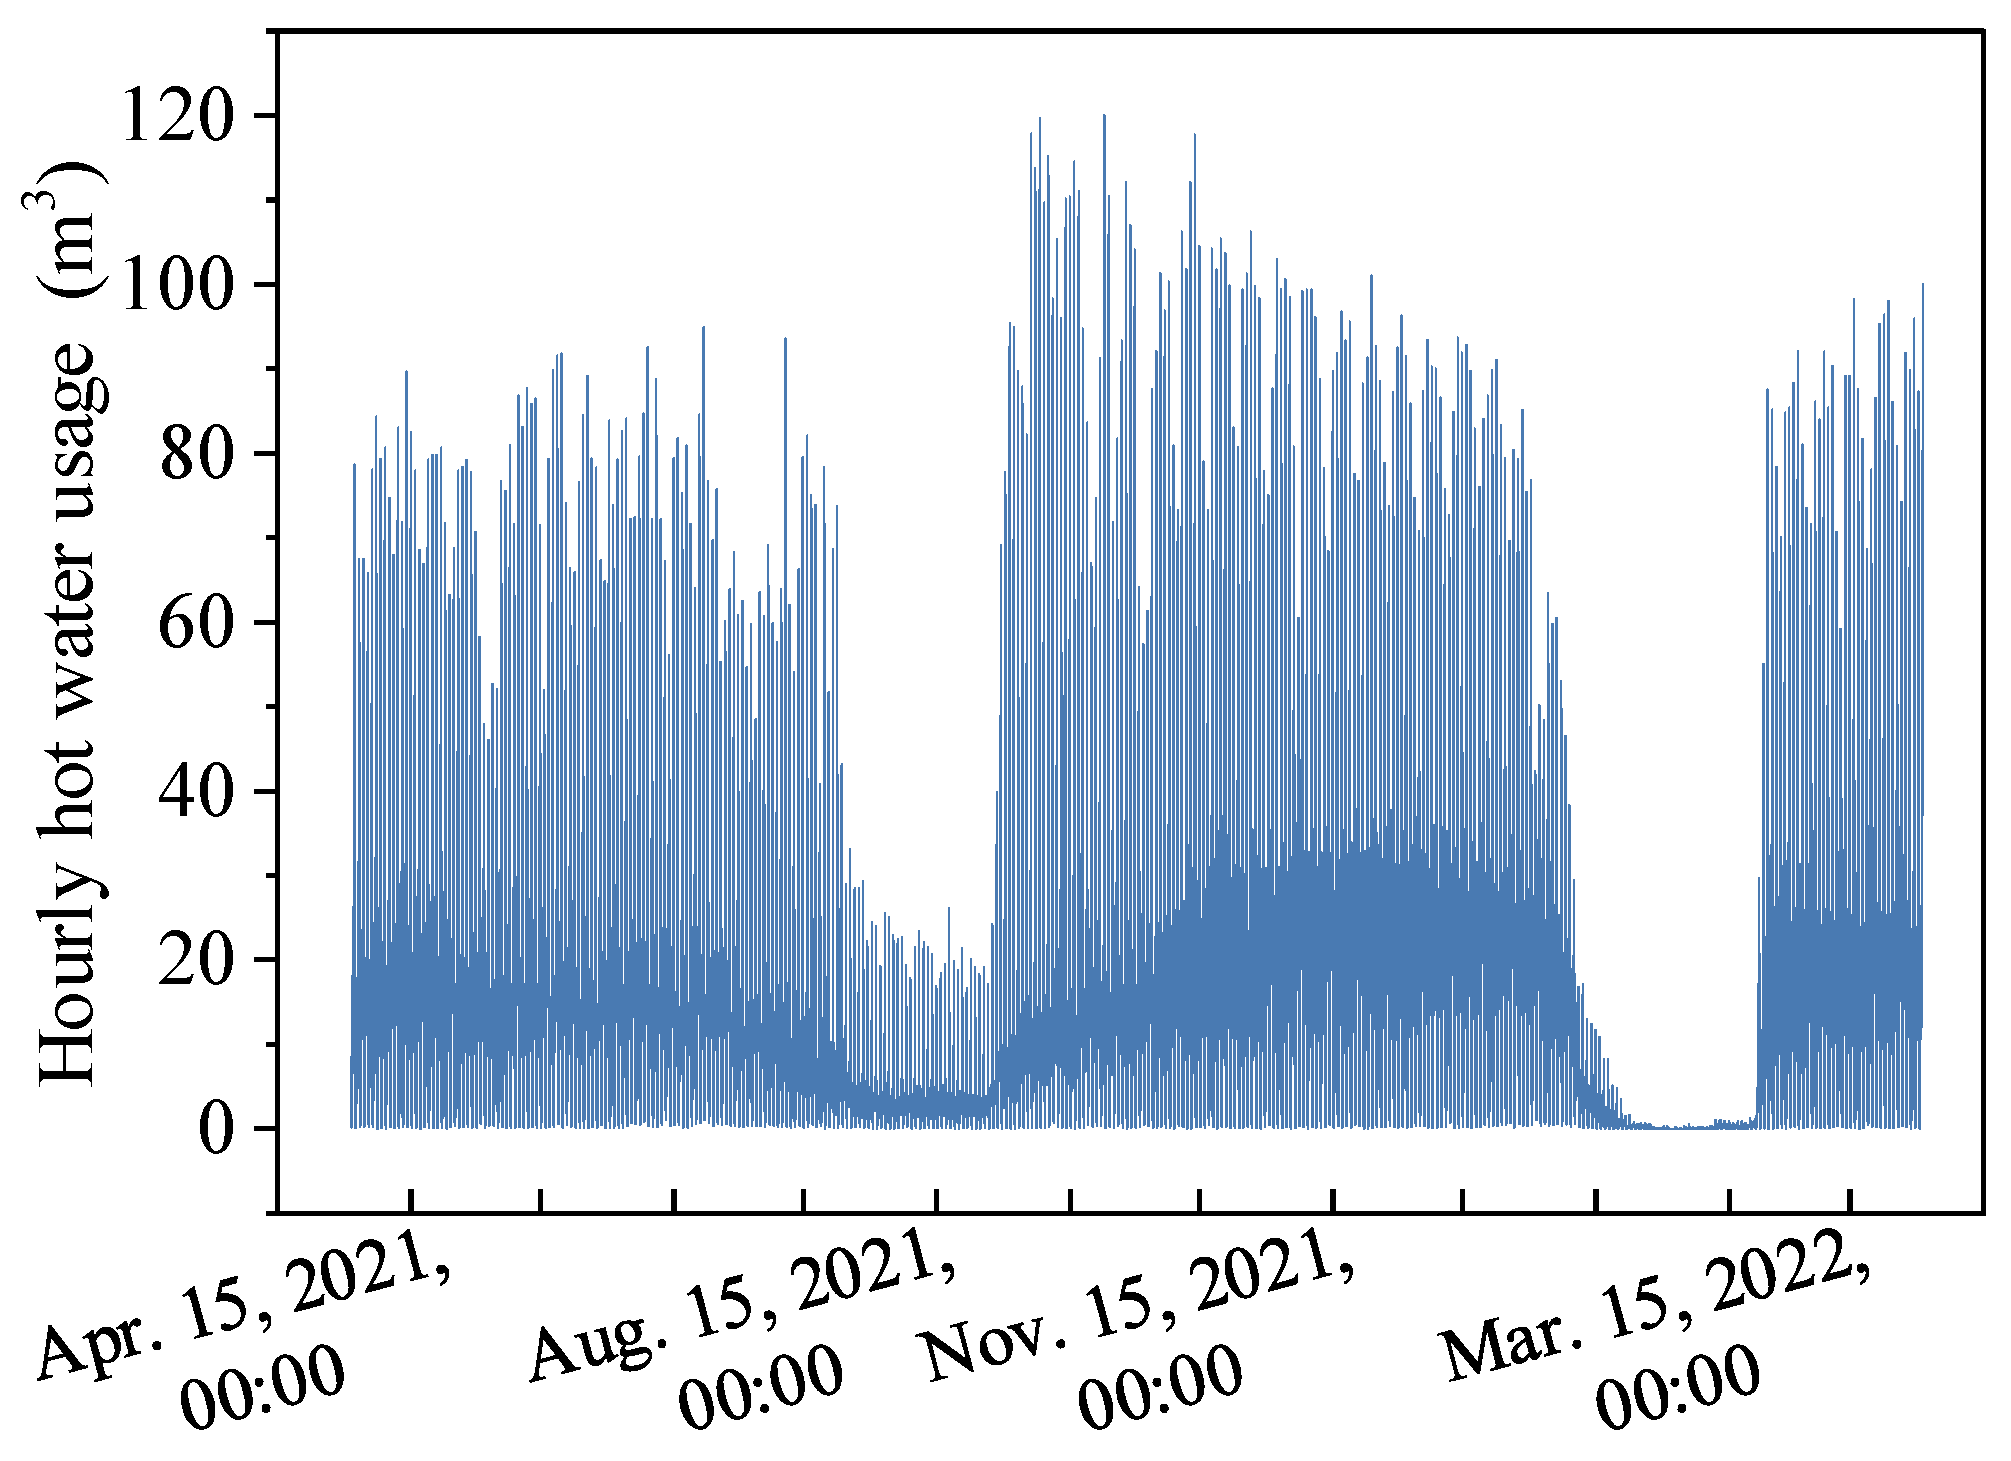
The real-time operational data of the centralized hot water system were collected from a monitoring platform. The data needed to be cleaned and processed prior to analysis. For example, outliers that were three standard deviations from the mean were removed, and missing values were inserted using linear interpolation. We obtained the hourly hot water usage data from 1 April 2021, to 1 April 2022, as shown in Figure 4.
Figure 4.
Real-time hourly hot water usage.
3.1.2. Clustering Results
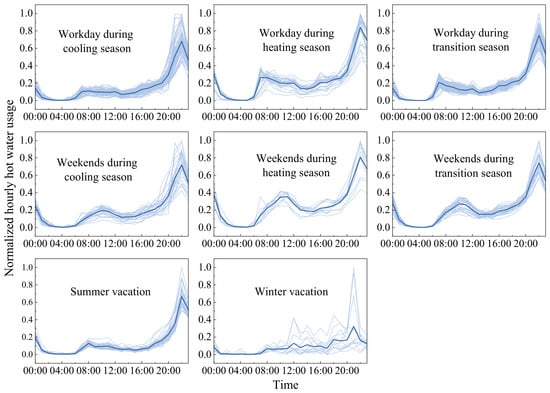
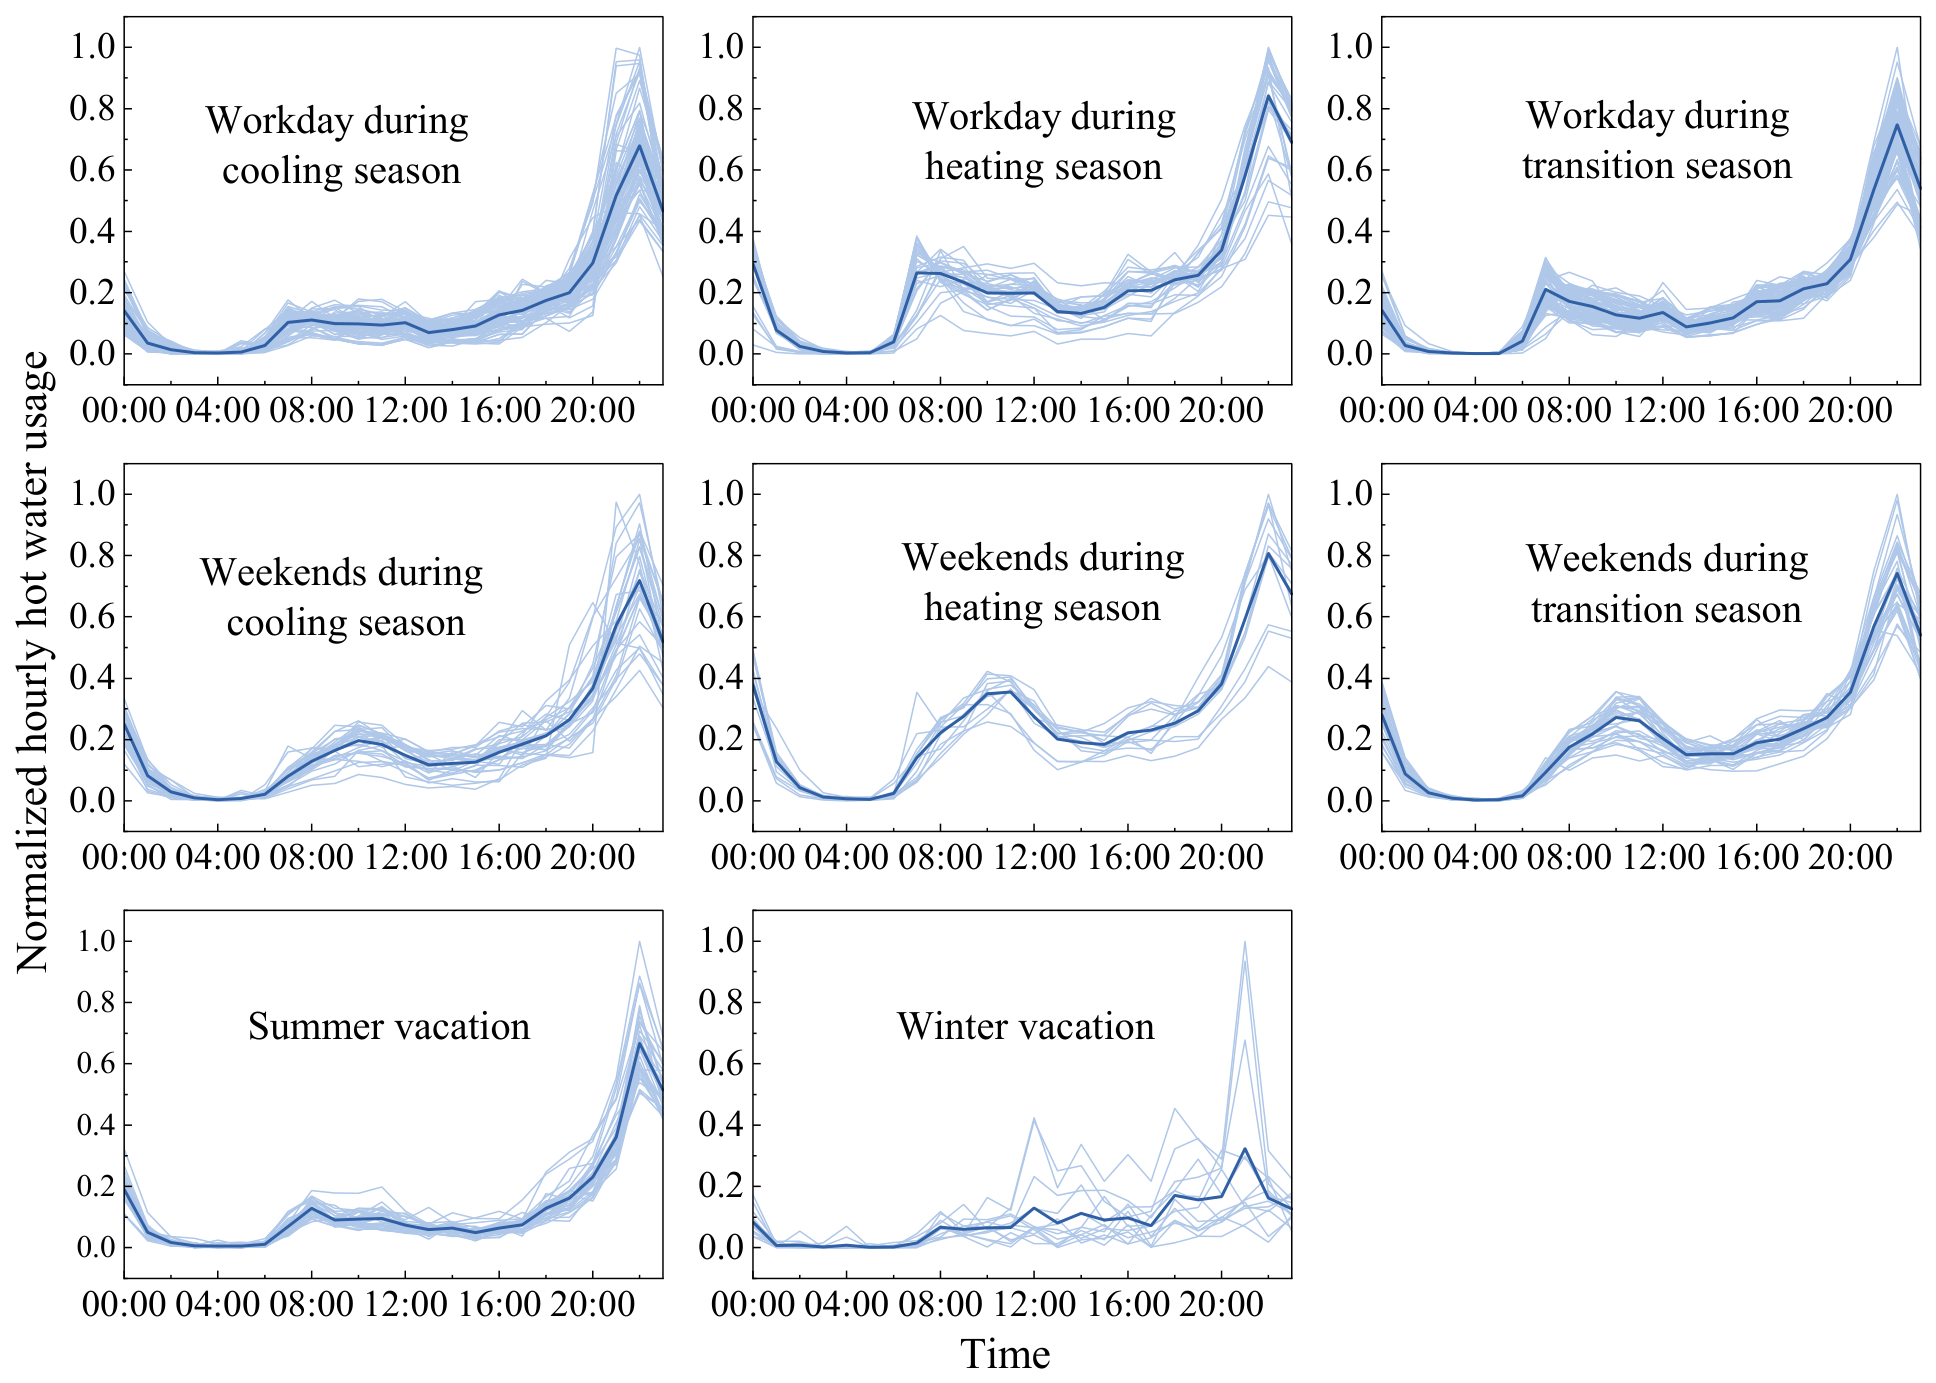
Using the clustering method described in Section 2.2.1, with the data described in Section 3.1.1, we obtained the clustering results for hot water usage, as shown in Figure 5.
Figure 5.
Clustering results of normalized hot water usage.
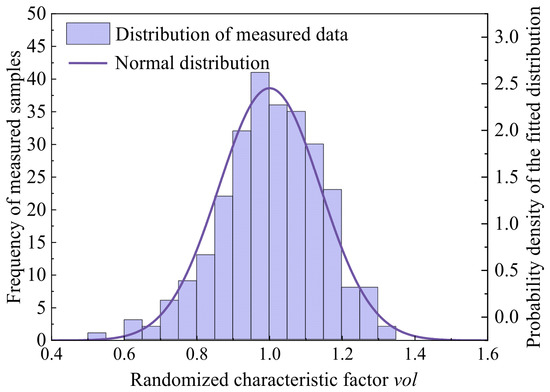
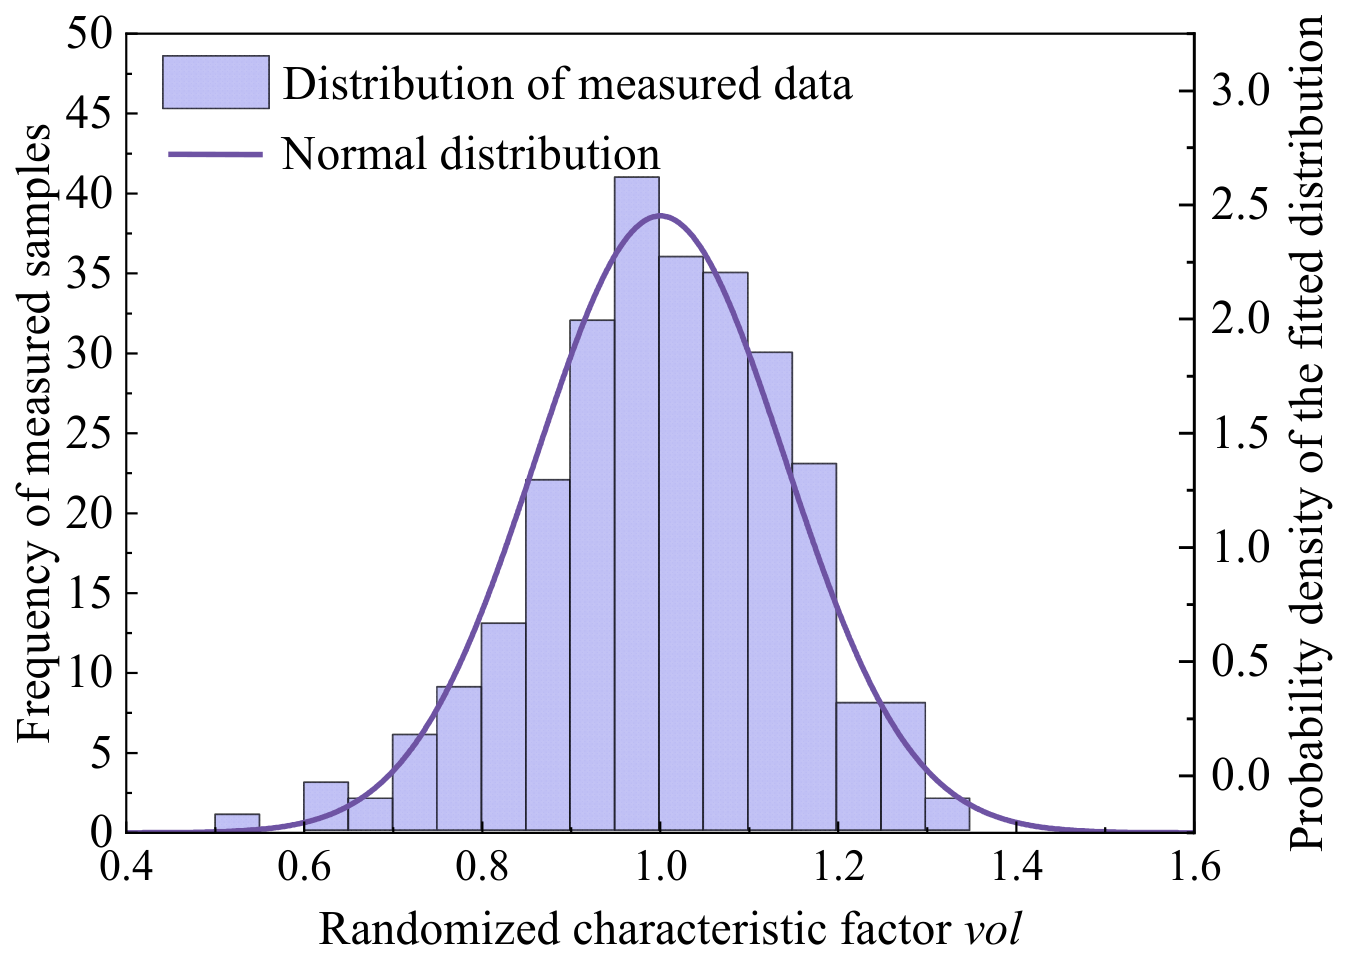
Typical hot water consumption curves for these eight categories are derived by applying the average value method to the clustering results. Appendix Figure A1 provides typical normalized hot water usage curves for eight categories, and the findings indicate that the variation in hot water usage coincides with students’ schedules. Taking the hot water usage at 3 pm for Category 5 defined in Table 1 as an example, Figure 6 shows the frequency distribution of the measured data and the corresponding fitted distribution curve of hot water usage. The stochastic characteristics of hot water usage fit well with a normal distribution.
Figure 6.
Distribution characterization of the measured hot water usage.
Thus, the stochastic factors in Equation (2) are calculated according to measured statistical data and normal distribution analysis. The model used to predict hourly hot water demand for each category is obtained via Equation (3), which can be described as an expectation curve with a distribution band. Figure A2 shows the hourly distribution band of hot water demand in the benchmark scenario.
3.1.3. Validation of the Clustering Statistical Model
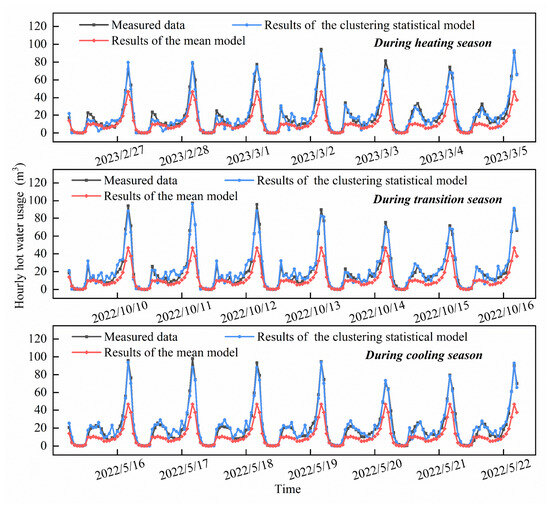
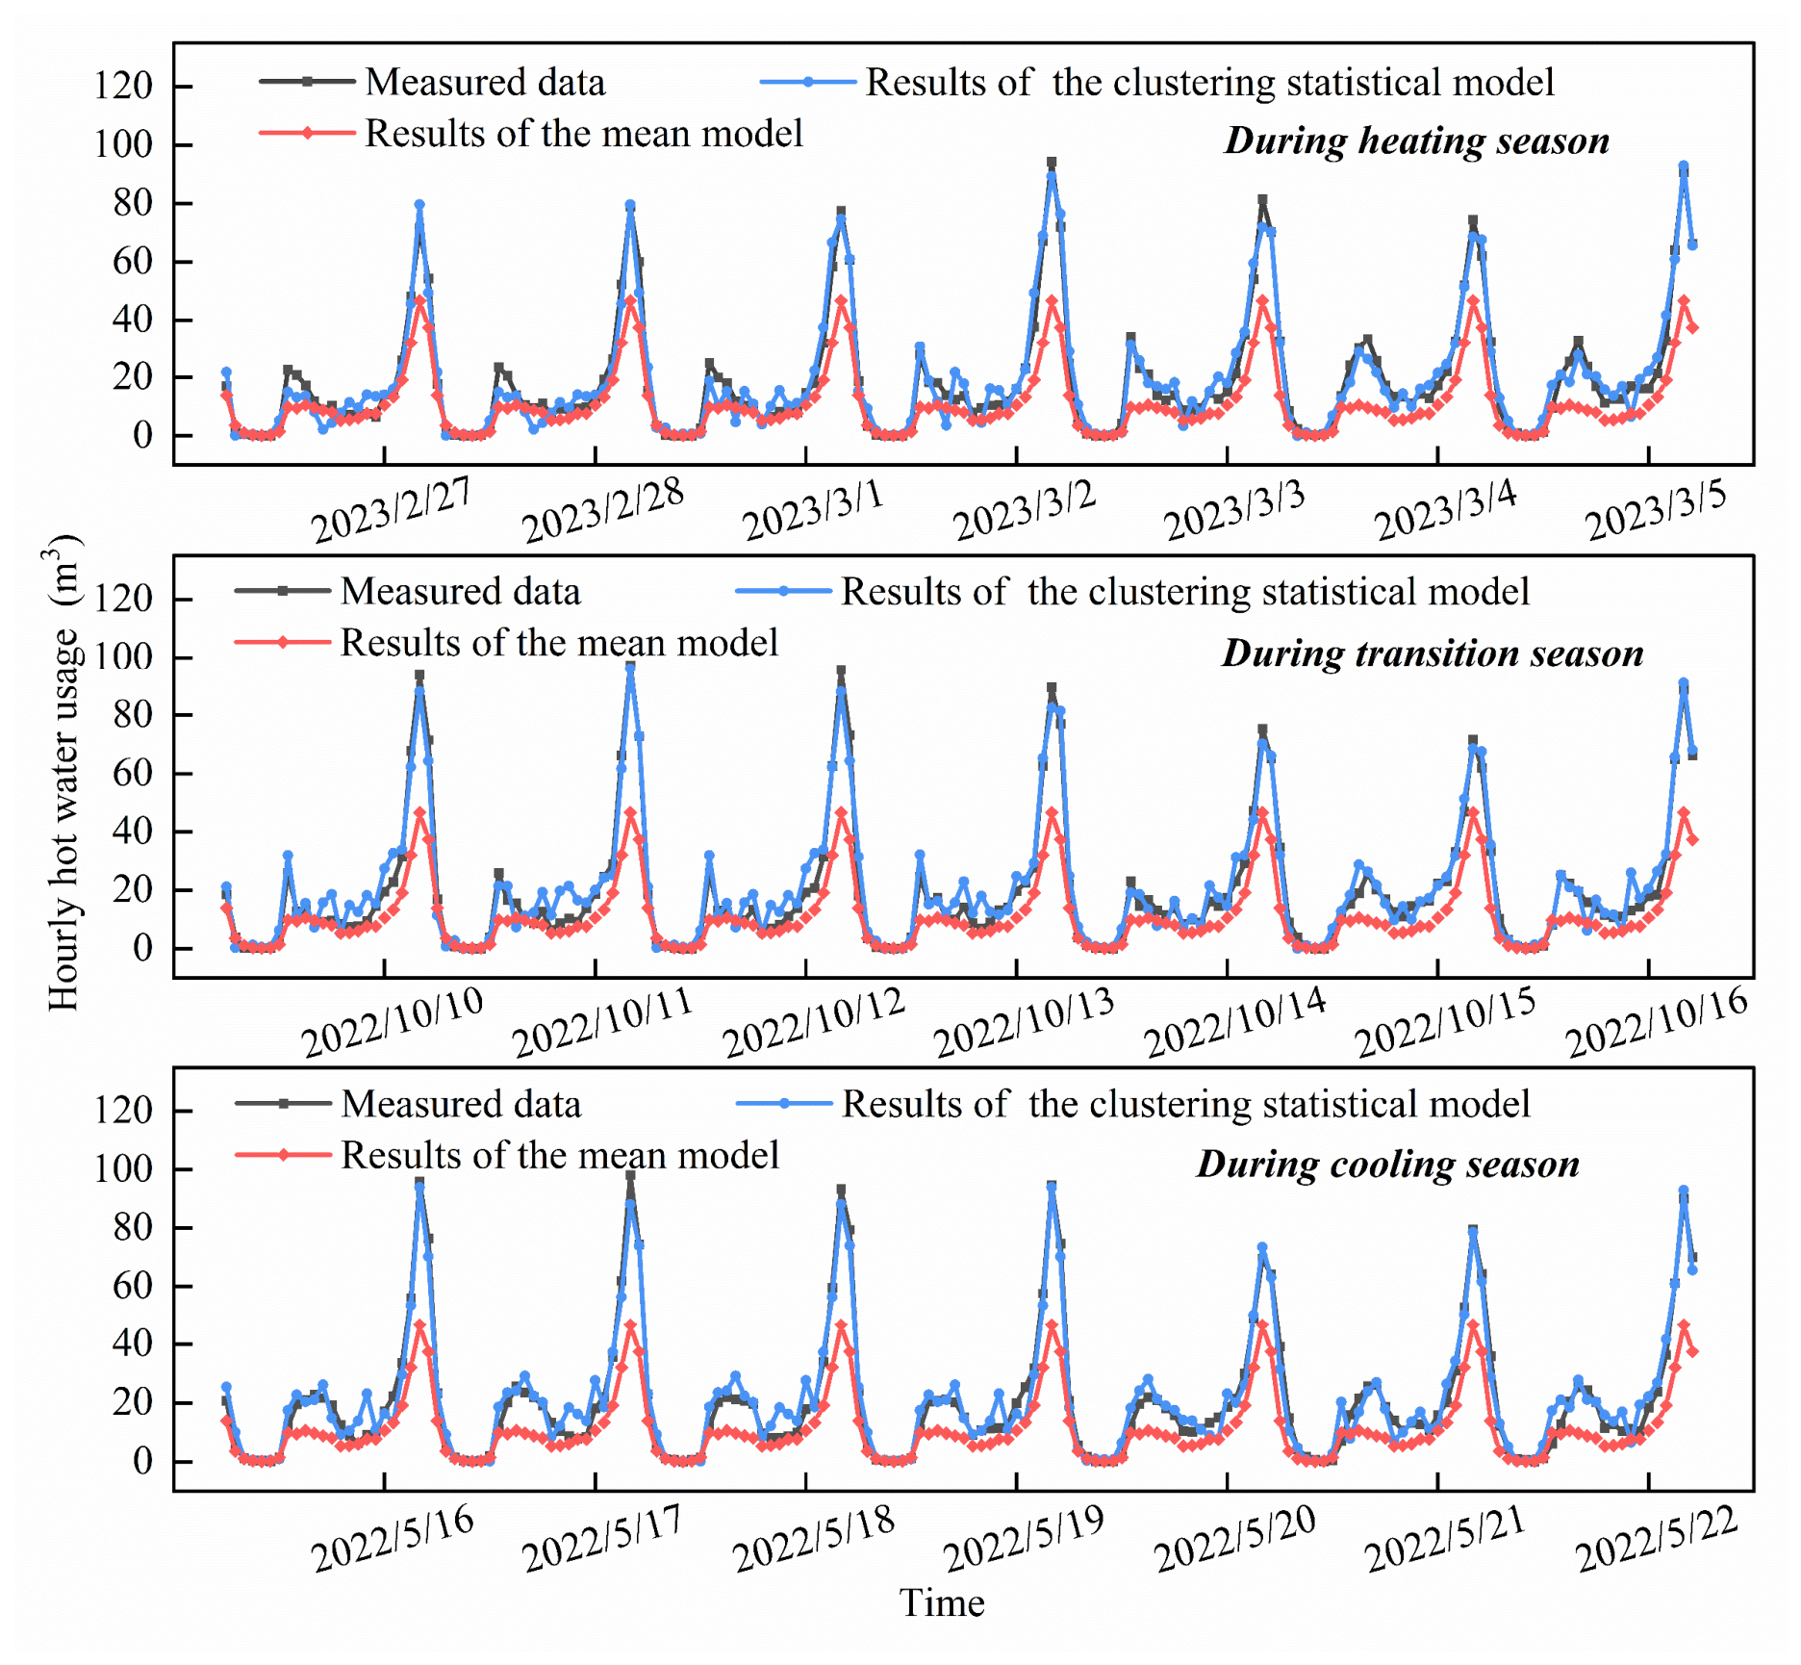
The model is validated using measured data. The training dataset for the clustering statistical model covers the hourly hot water usage from 1 April 2021 to 1 April 2022, while the validation dataset contains data from 16 May to 22 May 2022 (a typical week during the cooling season), 27 February to 5 March 2023 (a typical week during the heating season), and 10 October to 16 October 2022 (a typical week during the transition season).
The mean value model, which assumes that the daily hot water usage is uniformly distributed throughout the year, is used for comparison. Contrasting it with the results of the mean value model reveals better agreement between the measured data and the results of the clustering statistical model, as shown in Figure 7. Figure A3 presents the duration curves of measured and predicted hot water usage during typical weeks. Furthermore, the root mean square error (RMSE), maximum relative error of the load delay curve (MREdc), mean absolute error (MAE), and correlation coefficient (R2) are used to evaluate the models’ accuracy. The results are listed in Table 5. The clustering statistical model significantly outperforms the mean value model.
Figure 7.
Measured and predicted hourly hot water usage during typical weeks.
Table 5.
Model performance evaluation results.
3.2. Consumer Behavior
The questionnaire survey described in Section 2.3.2 was conducted among students at the studied university. The 1185 collected questionnaires were screened according to how long they took to complete (normally 3~6 min). Questionnaires with a completion time of less than 1 min were considered invalid. After these were omitted, 965 valid questionnaires were available for analysis.
3.2.1. Hot Water Usage
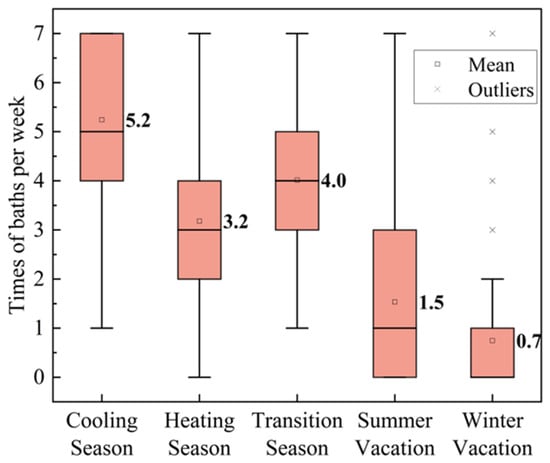
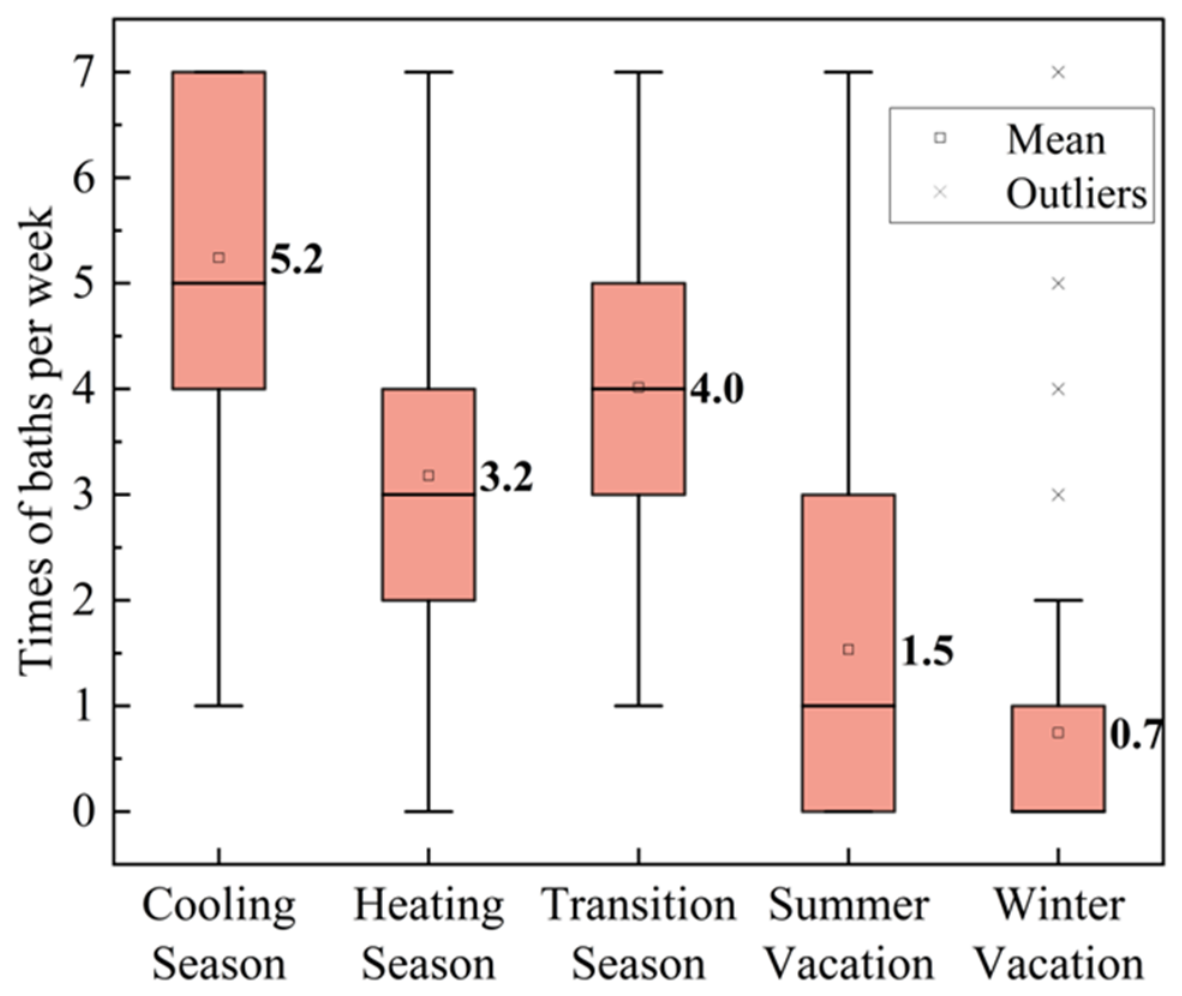
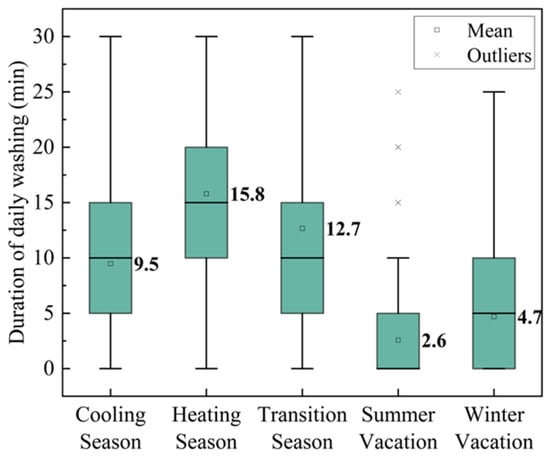
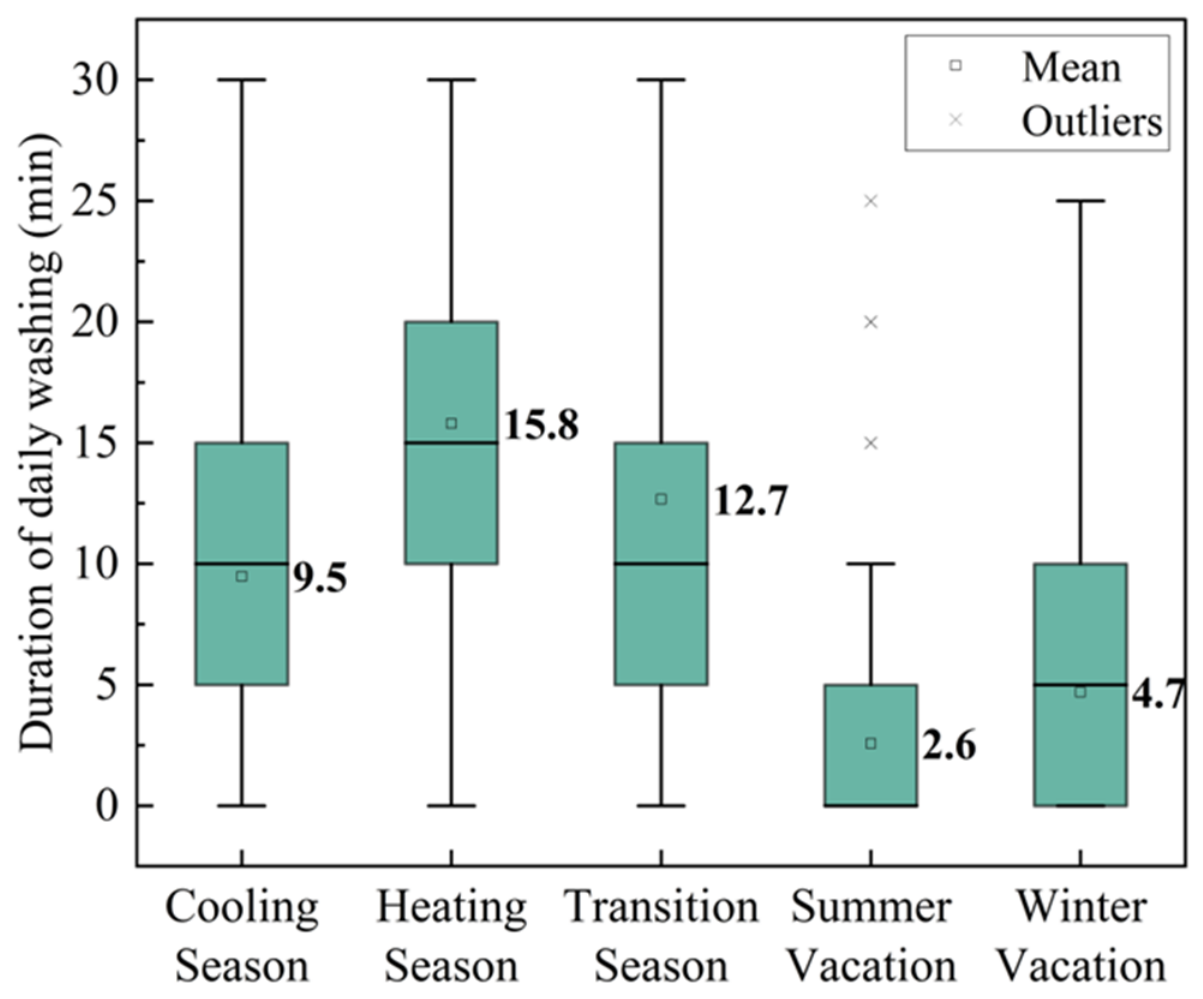
The questionnaire asked students to report how long they spent washing every day, as well as their bathing frequency. The results are presented in Figure 8 and Figure 9, respectively. Then, in combination with the measured data, the proportions of hot water usage for bathing and washing were calculated and summarized in Figure A4, providing the basis for calculating the energy flexibility potential of bathing and washing.
Figure 8.
Average number of baths/showers per week in different seasons.
Figure 9.
Duration of daily washing in different seasons.
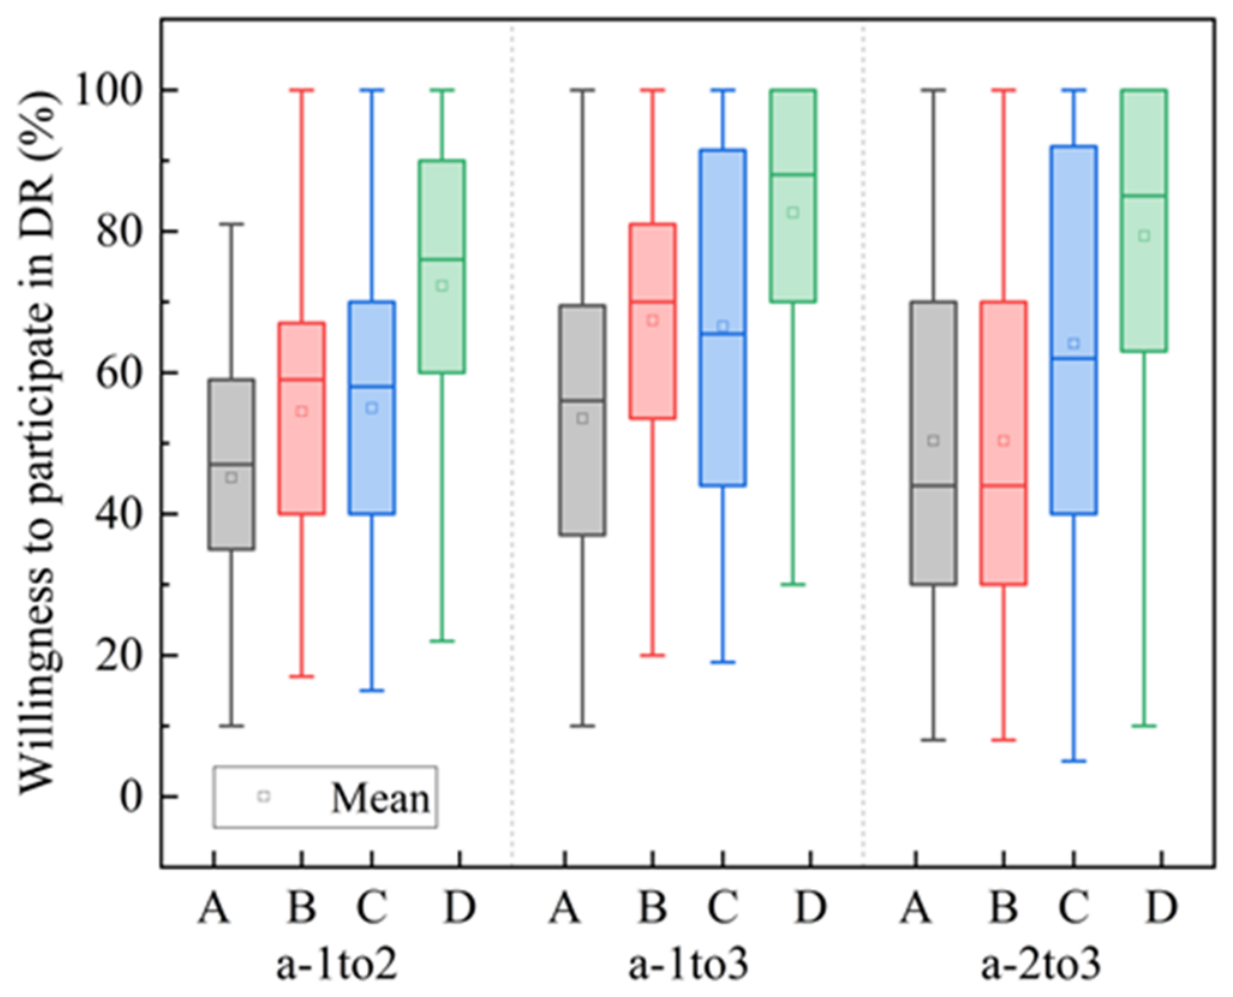
3.2.2. Willingness for DR Participation
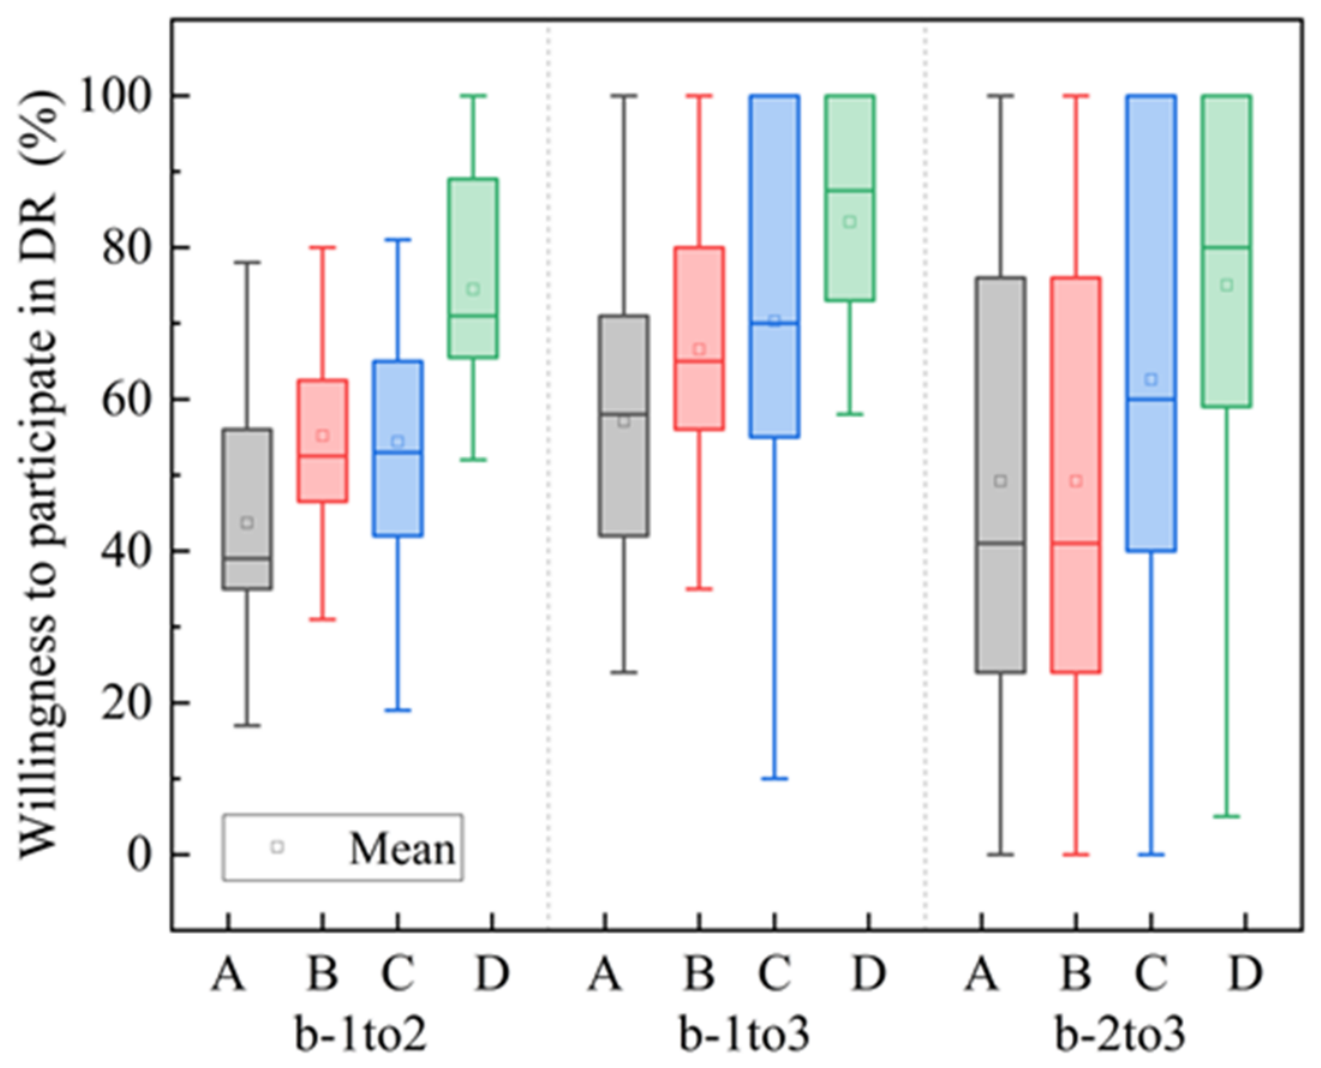
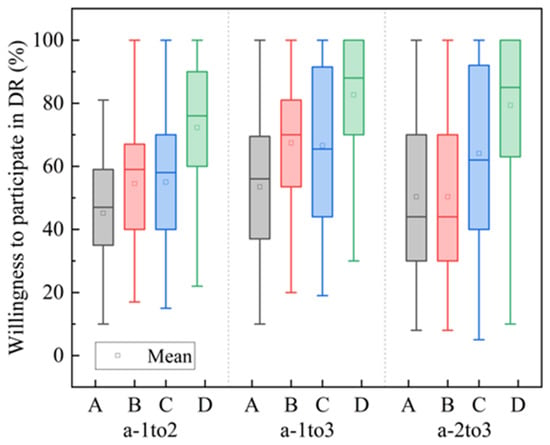
The questionnaires also asked students to record their willingness to participate in DR, as shown in Figure 10. Students expressed that they were least willing to participate in strategy A and most willing to employ strategy D. Similarly, Figure A5 describes the students’ willingness to participate in the different DR strategies related to washing. In these figures, A, B, C, and D denote the four DR strategies listed in Table 3; ‘a’ denotes the bathing condition, ‘b’ represents the washing condition, and the response behavior transferring from Period 1 to Period 2 is labeled as ‘1to2’.
Figure 10.
Students’ willingness to participate in the different DR strategies for bathing.
The sensitivity of participation willingness to the incentive level can be observed by comparing Strategies A and B, both of which are price-based but differ in price magnitude. When the peak-period price increases from 0.20 RMB/min (strategy A) to 0.40 RMB/min (strategy B), the proportion of students willing to shift their usage from peak to valley periods increases by approximately 20%, indicating that willingness to participate is responsive to the strength of the price signal.
3.2.3. Probability Distribution of DR Participation
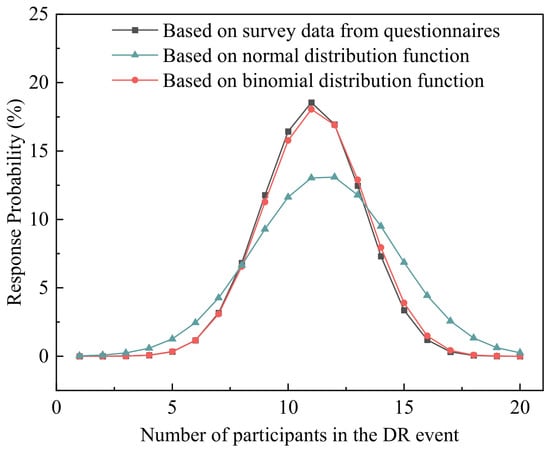
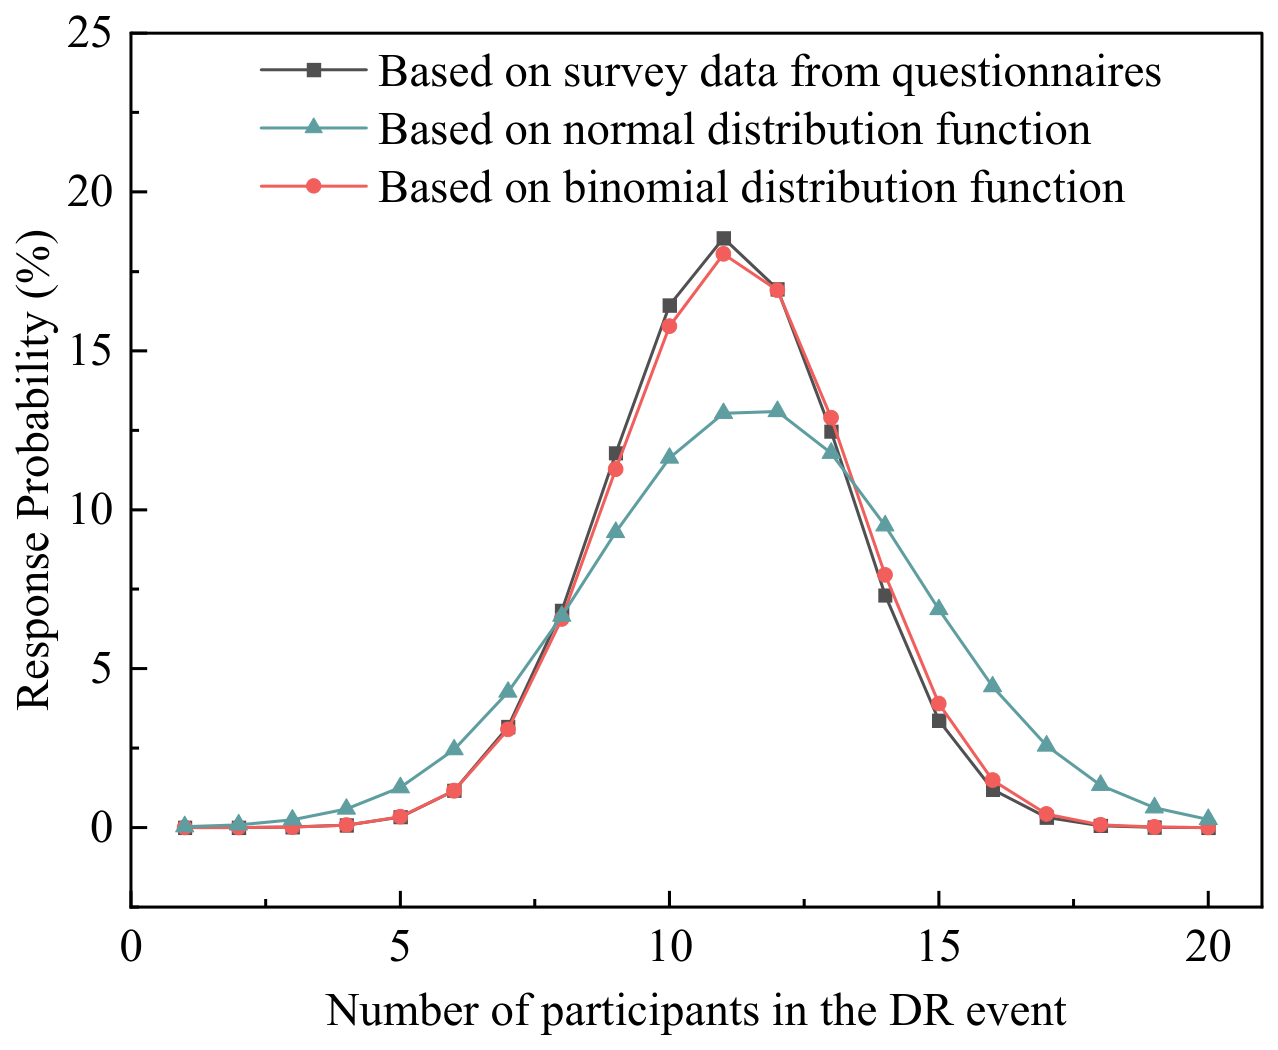
Taking the case of response behavior from 1 to 2 under strategy B as an example, the response probabilities obtained from Equations (5) and (6) are compared as shown in Figure 11. The results from the binomial distribution-based probability function show better agreement with the survey statistics, so we use this function to describe the uncertainty of students’ DR participation behavior in this study. The binomial distribution assumes that each student’s participation decision is independent and is governed by the same mean willingness probability (), which is estimated directly from the survey responses. This assumption is reasonable in the present context, as the questionnaire was administered to students from different dormitories with no communication among respondents regarding their participation choices, and no external factors were identified that would systematically differentiate individual willingness beyond the observed variability.
Figure 11.
Probability distribution of DR participants.
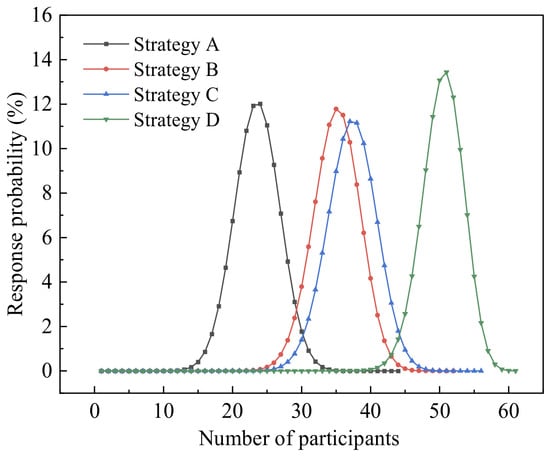
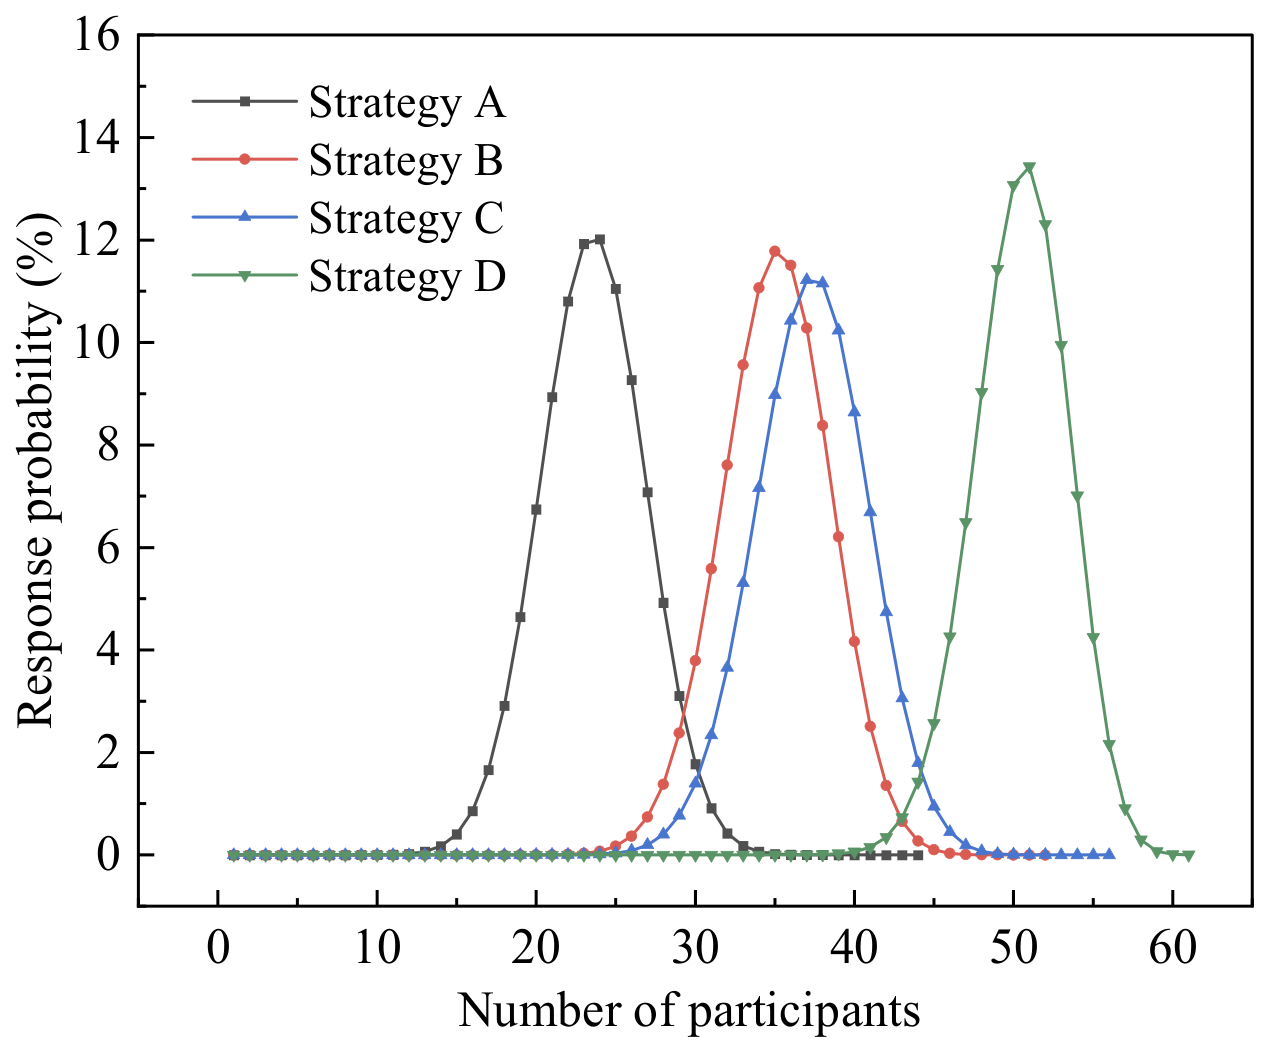
Based on the survey data regarding students’ willingness to participate in the various DR strategies, the response probabilities for different numbers of participants were obtained using the binomial distribution function. Figure 12 indicates the distribution of DR probabilities corresponding to the response behavior ‘a-1to3’ during the transition season.
Figure 12.
Probability distribution of DR participants for different numbers of participants.
3.3. Analysis of Flexibility
3.3.1. Probability Distribution of Flexibility
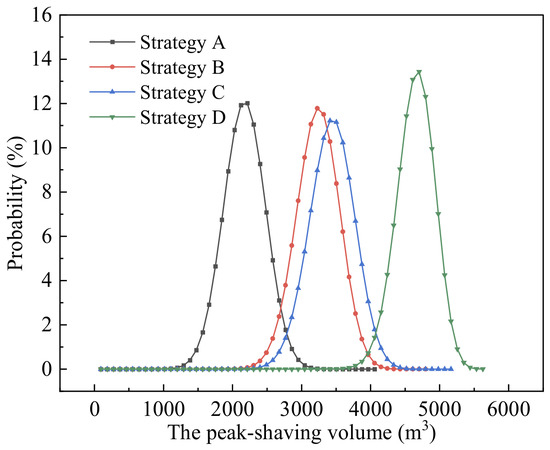
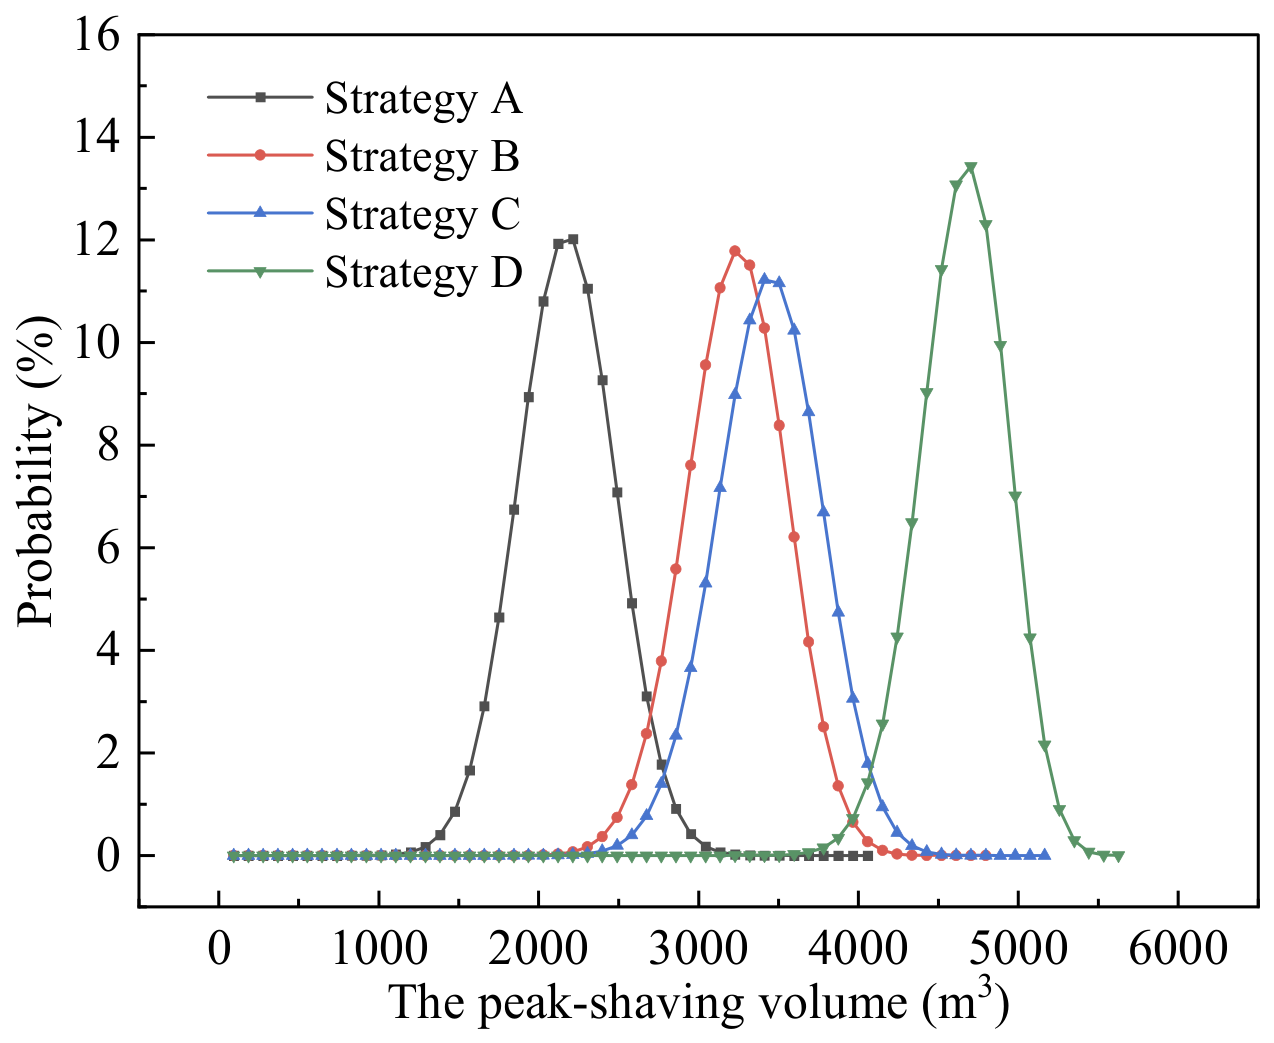
Due to the uncertainty regarding students’ willingness to participate, the centralized hot water systems’ flexibility potential is also uncertain. By combining the cluster statistical model for load prediction and the probability distribution of DR participation, we obtain the probability distributions of flexibility metrics for the hot water system under different DR strategies. Taking the analysis of DR behavior ‘a-1to3’ during the cooling season as an example, we obtain the probability distribution of the peak-shaving volume under different DR strategies, as indicated in Figure 13.
Figure 13.
Probability distribution of the peak-shaving volume during the cooling season (a-1to3).
3.3.2. Expectation of Flexibility
- (1)
- Annual flexibility
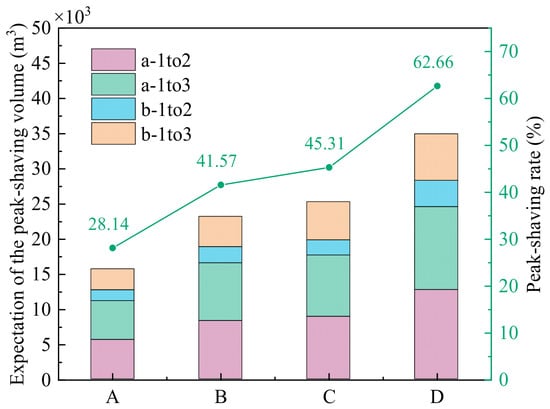
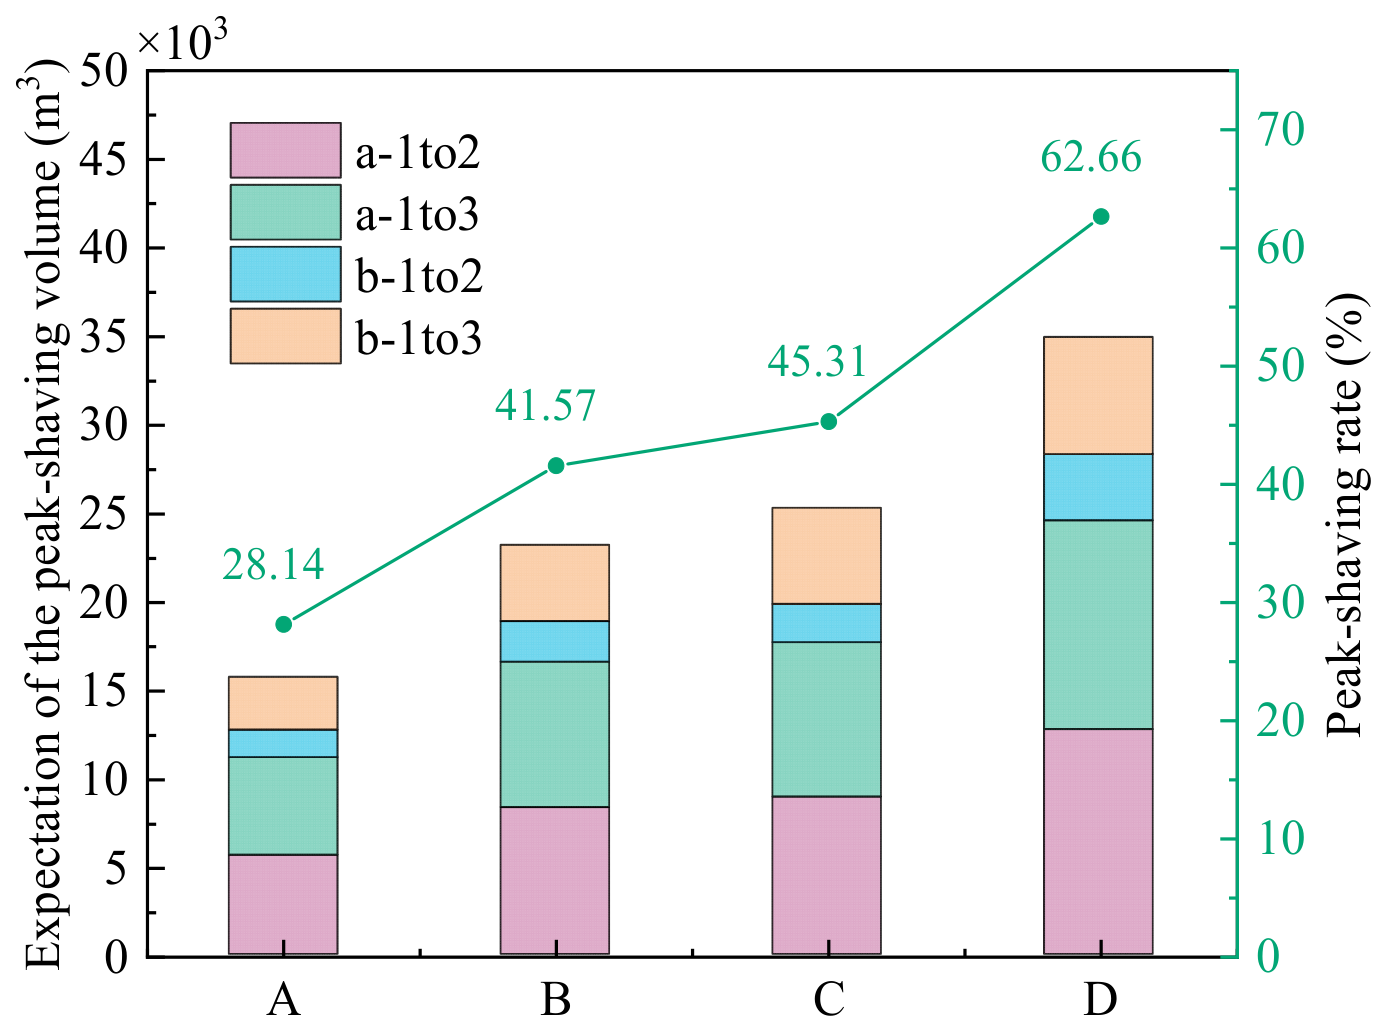
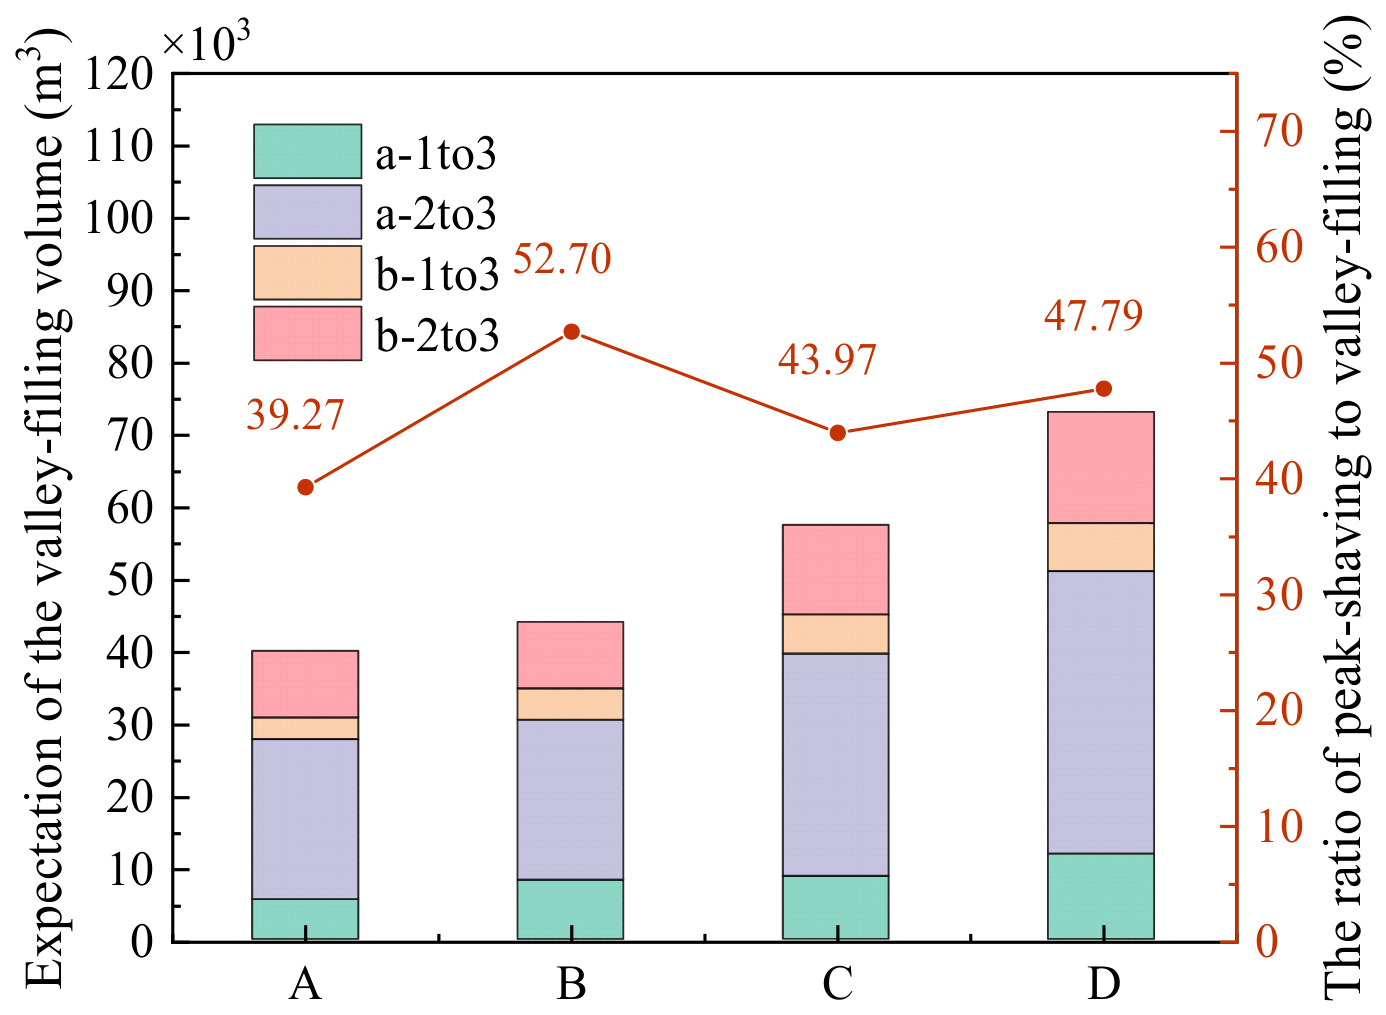
Based on the flexibility metrics and the binomial distribution function, we obtain the expectations of annual flexibility metrics for the hot water system. These results are shown in Figure 14 and Figure 15.
Figure 14.
Expectation of the peak-shaving volume and the peak-shaving rate under various DR strategies.
Figure 15.
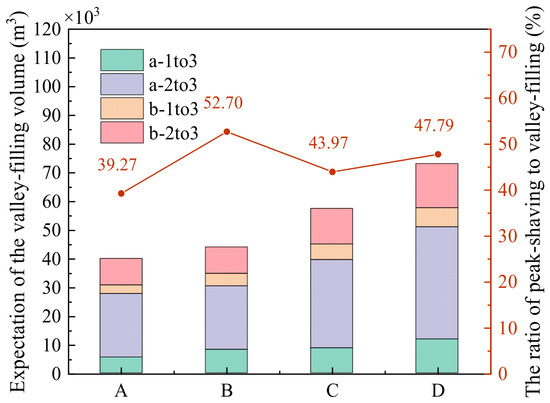
Expectation of the valley-filling volume and the ratio of peak-shaving to valley-filling under various DR strategies.
The peak-shaving volume, valley-filling volume, and peak-shaving rates show a gradual increase from DR strategy A to strategy D. Strategy A has the lowest peak-shaving rate (28.14%), while strategy D has the highest peak-shaving rate (62.66%)—approximately 2.2 times greater than that achieved with strategy A. The combined incentive strategy (D) yields the highest flexibility, as expected, because it integrates both price and academic credit incentives. However, the more notable result is illustrated by the comparison between strategies B and C: academic credit incentive alone (strategy C) increases students’ willingness to participate more effectively than the enhanced price signal (strategy B), despite strategy B offering a more than threefold price increase during peak periods (0.40 vs. 0.12 RMB/min). This suggests that non-monetary incentives can be particularly effective in institutional settings where students respond to academic rewards, offering a cost-efficient alternative to price-based DR programs.
Notably, the ratio of peak-shaving to valley-filling for strategies A through D ranges from 39% to 53%, largely because over 80% of the students choose to participate in DR behavior ‘2to3’. Strategy B has the highest peak-shaving to valley-filling ratio, indicating that a smaller amount of filling capacity is required to achieve the same peak-shaving for this strategy. This is because the incentive for strategy B led to significantly higher peak-shaving for the DR behavior ‘1to2’.
- (2)
- Seasonal flexibility
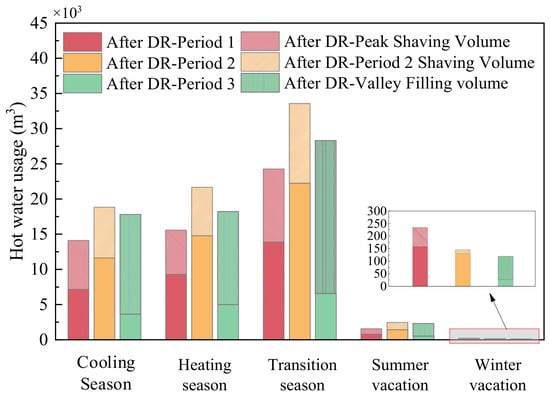
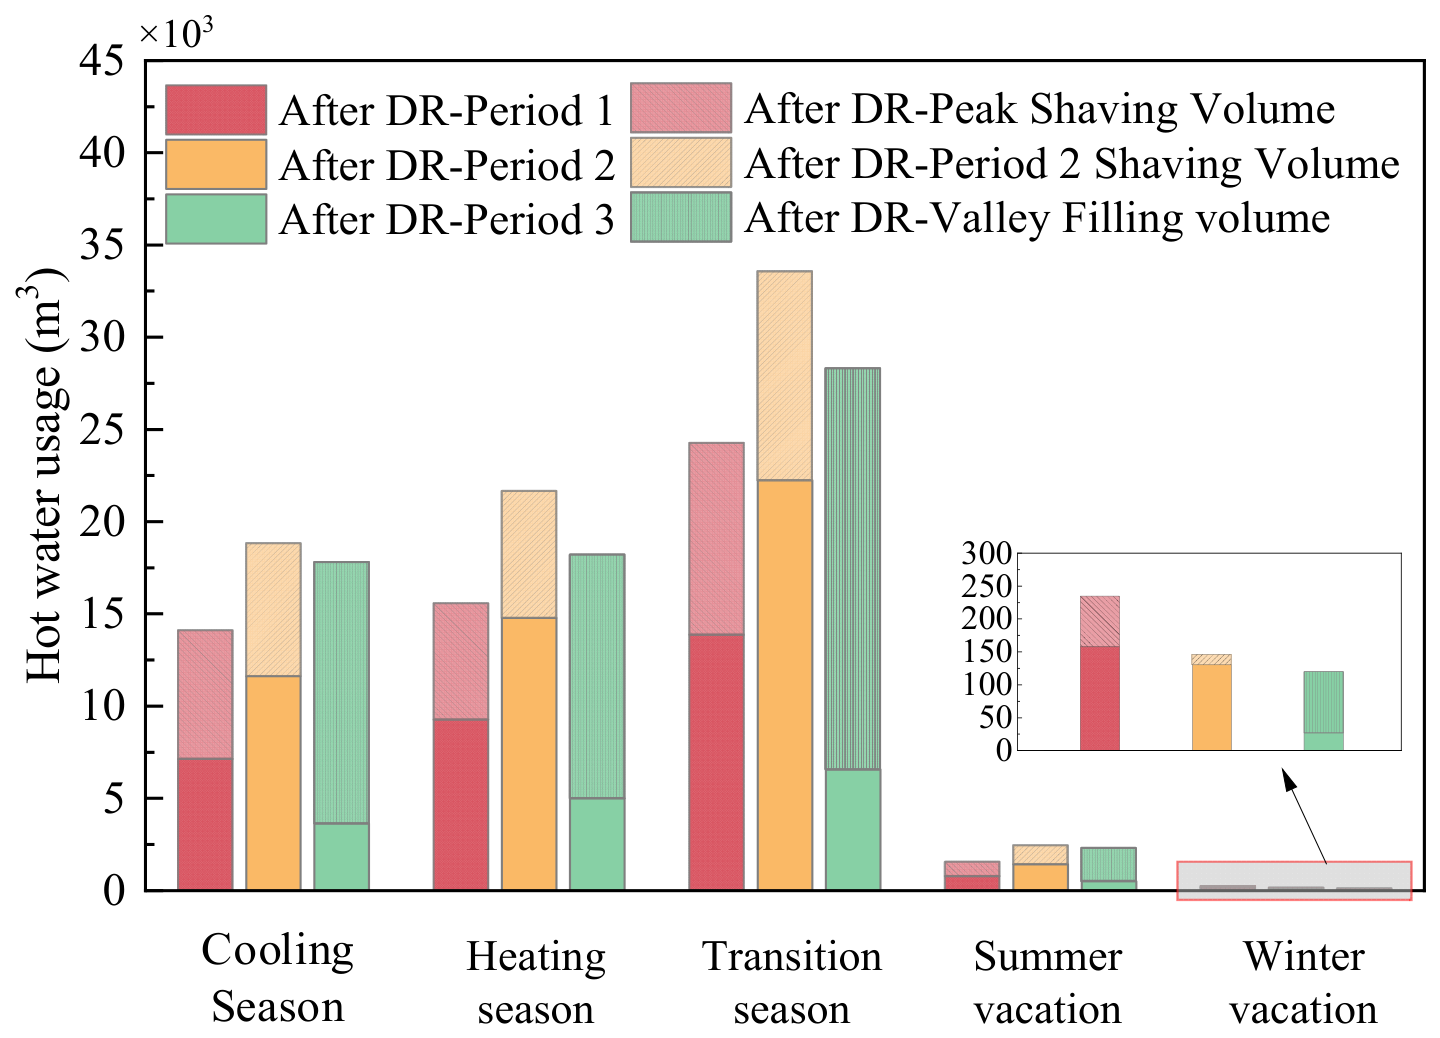
Adopting DR strategy D caused the flexibility potential of the hot water system to vary from season to season. Figure 16 shows the peak-shaving volume of hot water for DR strategy D during the different seasons. It indicates that the peak-shaving volume is higher during the transition and cooling season and lower during the heating season.
Figure 16.
Peak-shaving volume of hot water following the implementation of strategy D during different seasons.
- (3)
- Daily flexibility
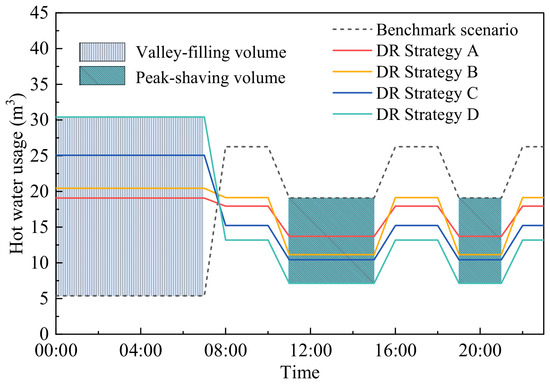
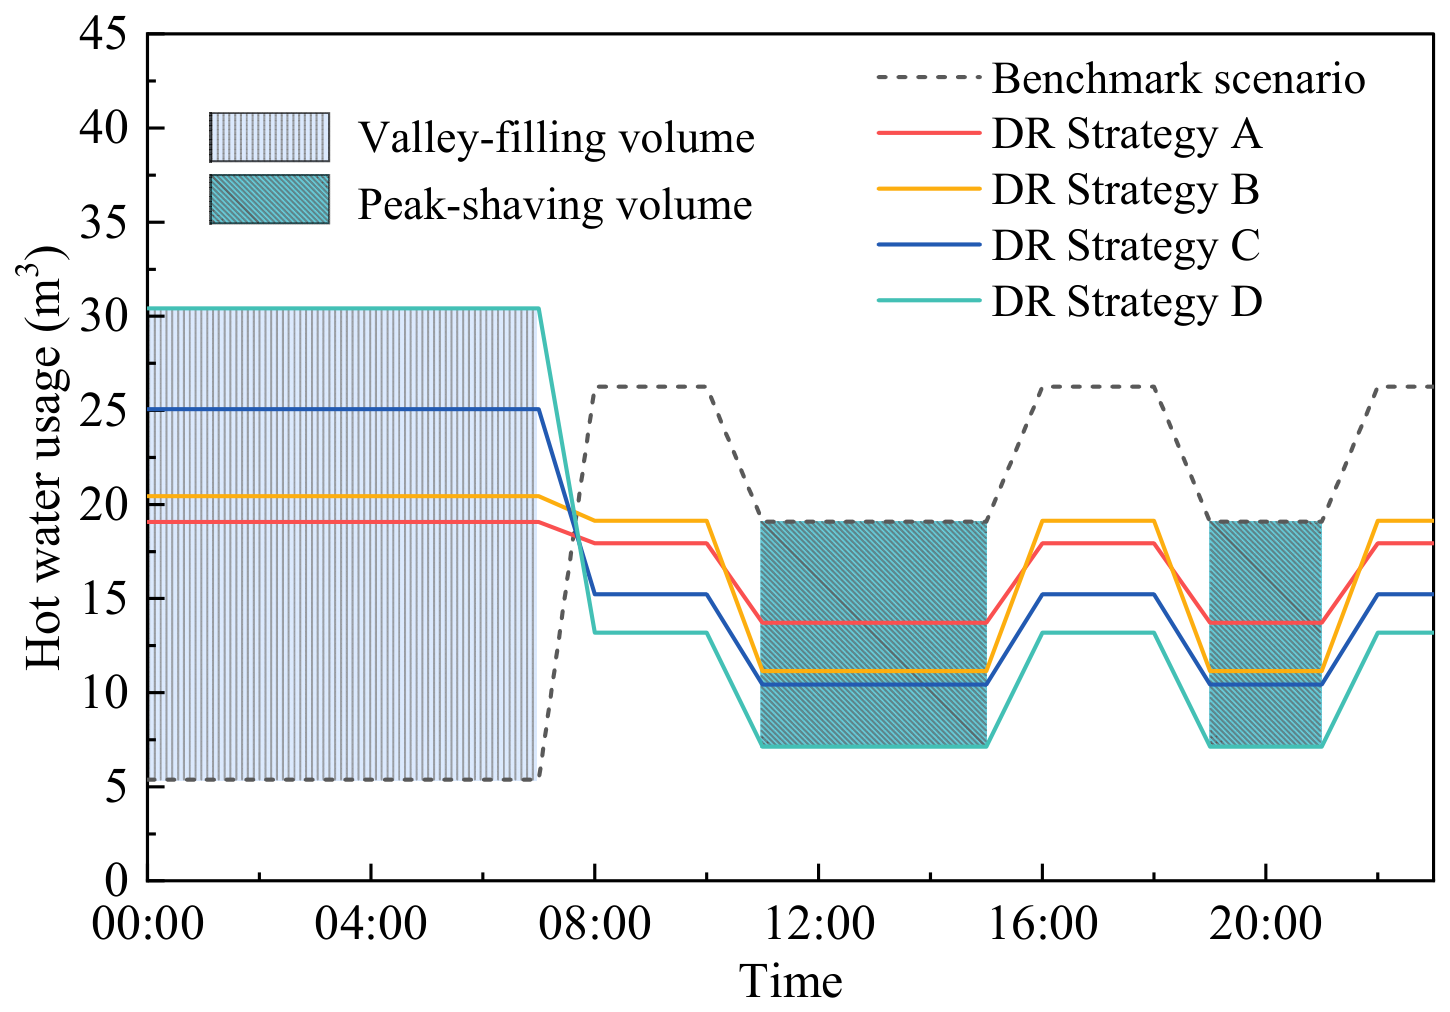
Figure 17 illustrates the daily hot water demand curves along with the peak-shaving volume and valley-filling volume when different DR strategies are implemented. It shows that strategy D, which combines hot water price adjustment with academic credit incentives, achieves the best peak-shaving effect. Additionally, academic credit incentives have proven to be more effective than price adjustments in terms of increasing students’ willingness to participate.
Figure 17.
The daily load shifting of hourly hot water usage for the different DR strategies.
In practical applications, the feasibility of the load-shifting strategies depends on the physical constraints of the hot water system. In this study, the hot water storage tank was sized to meet daily demand, and the load-shifting quantities remained well within the storage capacity. Time preferences were accounted for through the questionnaire, as students self-reported their willingness to adjust their usage times. Pipe network temperature safety requirements were not limiting factors in this specific system configuration, as the shifting occurred on the demand side without altering supply temperatures. The heat source capacity and pipe network flowrate, however, were designed to meet peak demand. As shown in Figure 17, strategy D required a 16% increase in heat source capacity, while other strategies remained within the existing capacity. In the context of practical implementation, this constraint should be evaluated against the specific system’s design margins and operational flexibility.
It should be noted that the load-shifting strategies presented in Figure 17 are conducted based on the current grid conditions, in which the daytime/noon period typically corresponds to peak electricity demand. Under high photovoltaic (PV) penetration scenarios, however, this period may become a renewable-rich or low-net-load period, in which case the preferred direction of load shifting could reverse, i.e., shifting toward rather than away from the daytime period may be more beneficial for grid integration. While this study does not explicitly consider PV generation or renewable supply profiles, the proposed flexibility quantification framework remains applicable; the optimal shifting direction can be adjusted by redefining the target periods according to the specific renewable generation patterns.
- (4)
- Economic implications of DR strategies
To compare the flexibility benefits with potential implementation costs, a typical-day economic analysis was conducted from two perspectives: students (total hot water charges) and system operator (electricity costs and net revenue after hot water charge adjustments). Table 6 summarizes the results for each DR strategy. From the student perspective, Strategies A and D reduce total hot water charges by 7.03% and 25.36%, respectively, while Strategy B increases charges by 24.43%, and Strategy C has no effect on student expenses. From the operator perspective, Strategies A–D reduce electricity costs by 19.66–38.35%, and net revenue remains positive even after accounting for the reduction in hot water charges. These results indicate that well-designed price or non-price incentive policies can deliver mutual benefits to both students and system operators.
Table 6.
Economic performance of different DR strategies (typical-day analysis).
3.3.3. Sensitivity Analysis of Uncertainty
To assess the uncertainty evaluation’s sensitivity to key input variables, the uncertainty range was analyzed under varying sample sizes and confidence levels.
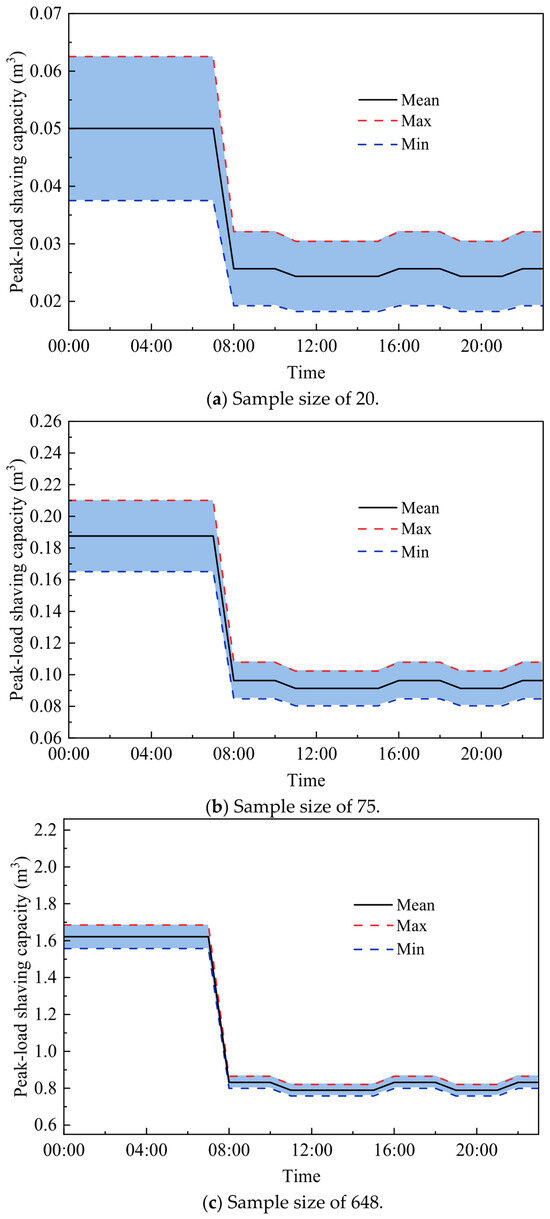
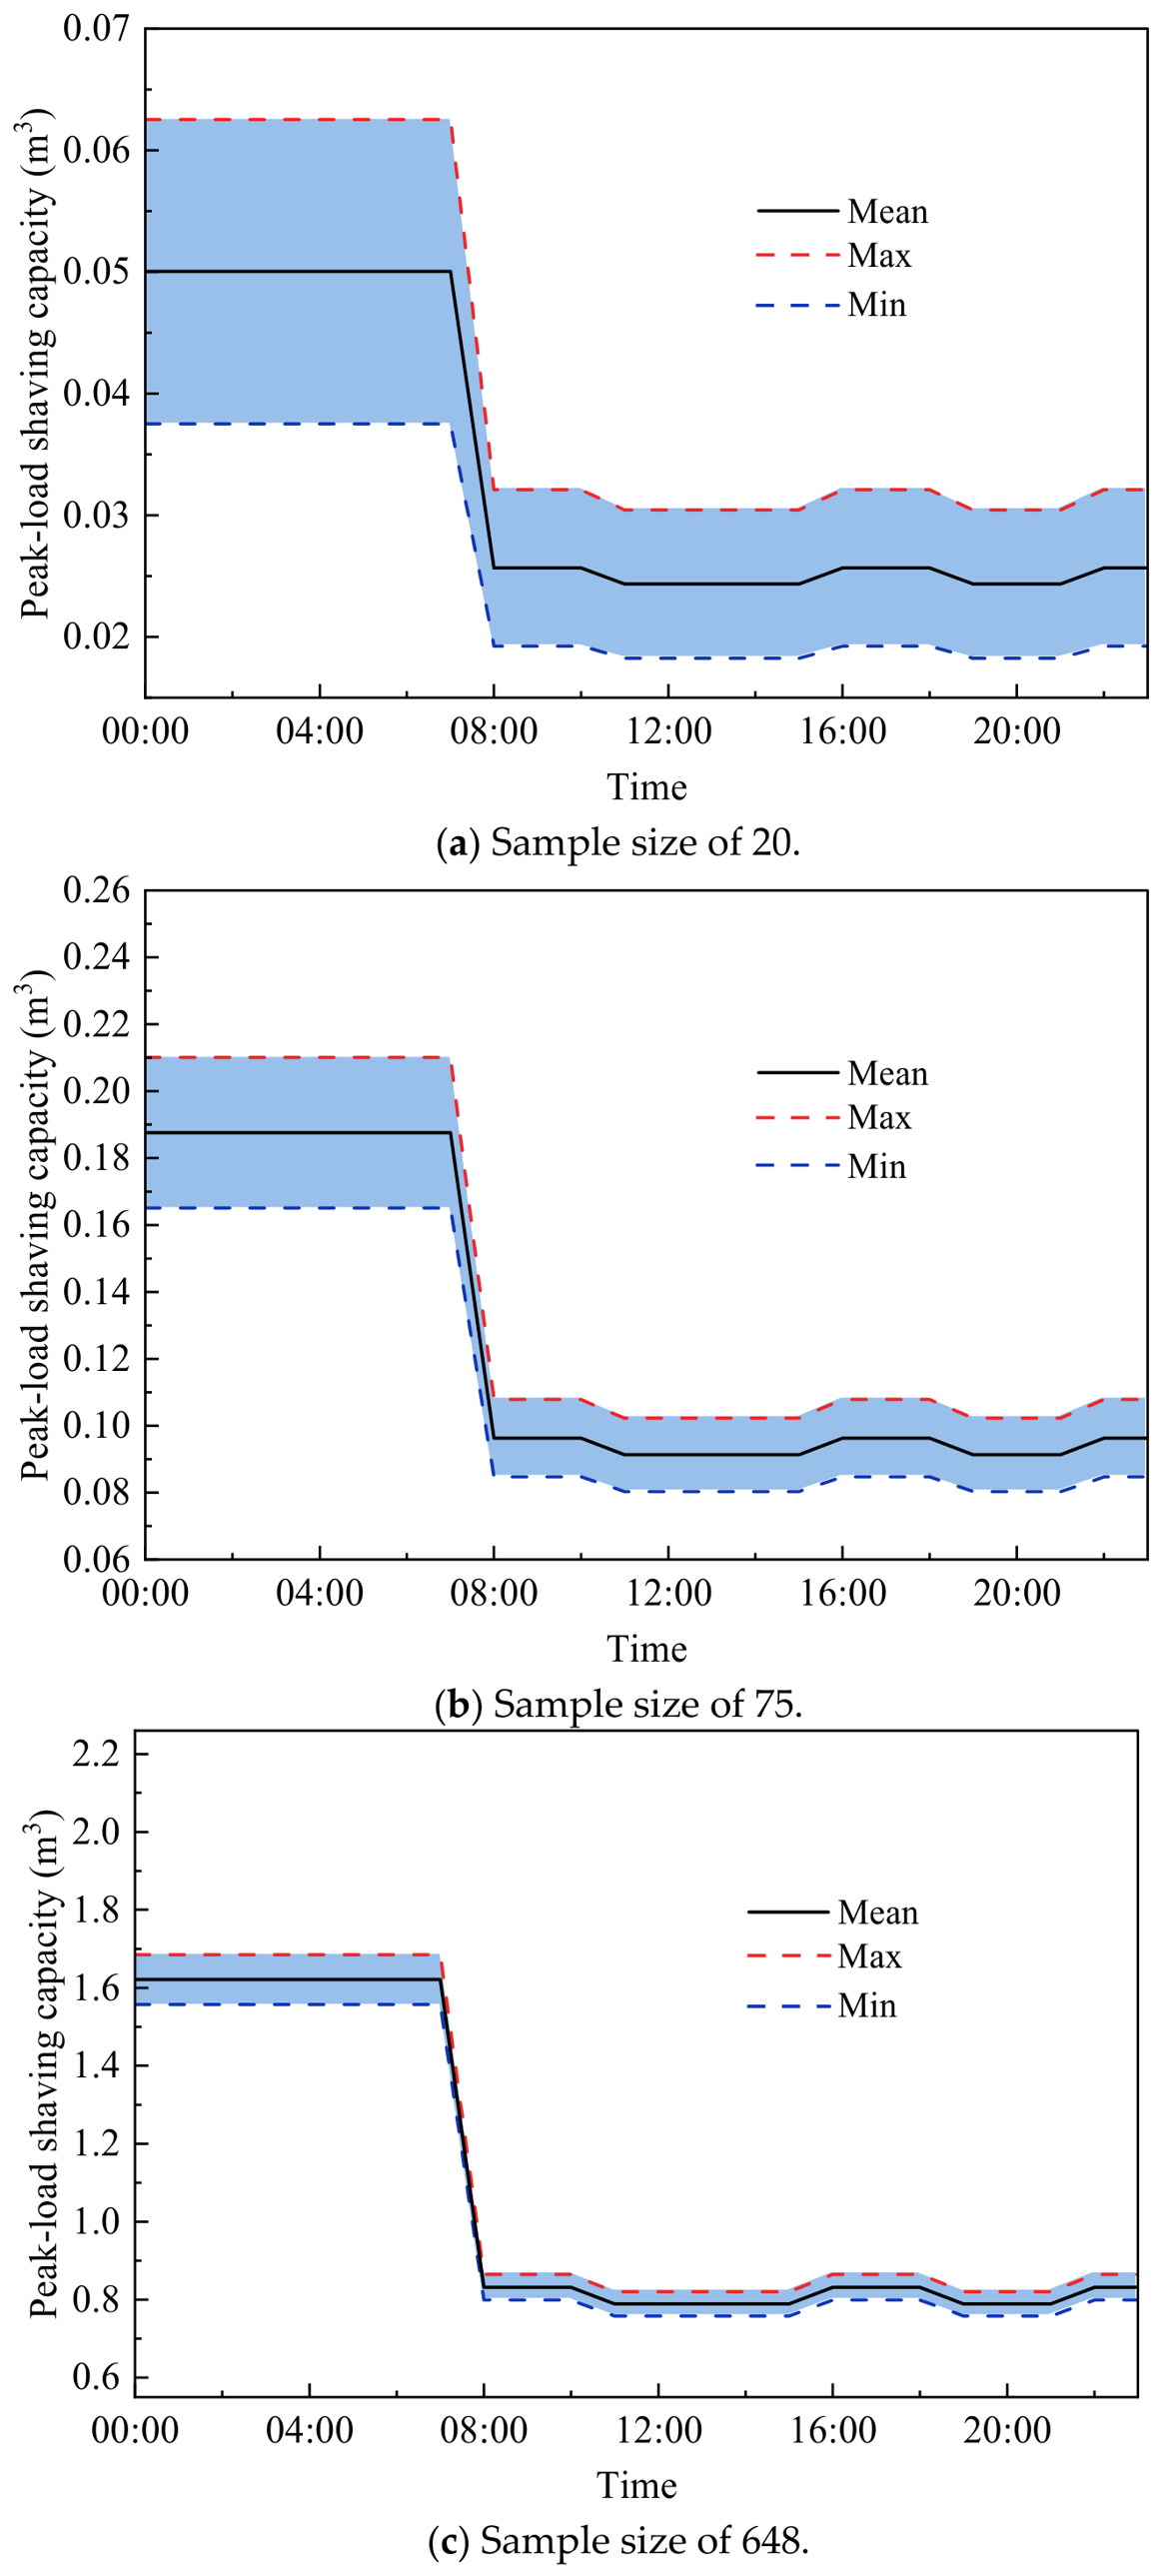
Analyzing the probability distribution of flexibility allowed us to determine the fluctuation ranges of peak-load shaving capacity for different sample sizes. Figure 18 showcases an obvious decrease in the fluctuation range as the sample size increases. Quantified by Equation (11), the uncertainty of the system’s flexibility is 80%, 33.3%, and 10.5% for sample sizes of 20, 75, and 648, respectively, indicating that the flexibility estimation stabilizes once the sample size exceeds a certain threshold.
Figure 18.
Uncertainty of peak-load shaving capacity for different sample sizes. The blue shaded area represents the variation range of the peak-load shaving capacity at each time point.
The flexibility uncertainty range is expected to vary under different confidence levels, presenting a trade-off between estimation robustness and interval width. At a lower confidence level (e.g., 95%), the expected fluctuation range will be narrower. Nevertheless, the 99%-based threshold (648 users) offers a conservative and safer practical reference for engineering applications, and the key trend—that uncertainty decreases with increasing sample size—remains unchanged regardless of the confidence level.
3.4. Comparison with Existing Studies
To contextualize the numerical results obtained in this study, the key findings are compared with those reported in the existing literature.
Regarding load prediction accuracy, the proposed clustering-based stochastic model achieves a maximum relative error of 6.46% on the load duration curve, substantially outperforming the mean value model (52.47% maximum error). This result is also competitive with other data-driven approaches reported in the literature [23].
In terms of DR effectiveness, the peak-shaving rate of 62.66% achieved by the combined price–credit incentive strategy (strategy D) significantly outperforms the price-only strategy (28.14%). While direct quantitative comparisons with existing studies are challenging due to differences in system configurations and evaluation metrics, the results obtained in this study are broadly consistent with the magnitude of flexibility potential reported in similar studies [20,30]. To provide a more direct quantitative comparison, Rao et al. [20] evaluated the energy flexibility of a similar university hot water system serving 1808 students, reporting an hourly maximum available storage capacity of 160 kWh (0.088 kWh/student). In this study, the hourly available storage capacity under Strategy D was approximately 419 kWh for a system serving 12,621 students (0.033 kWh/student). This indicates that behavioral flexibility reaches nearly 40% of the physical upper bound highlights the substantial contribution of user participation to system flexibility.
Regarding uncertainty quantification, the finding that the flexibility uncertainty range falls below 10.5% when there are more than 648 participating users provides a practical threshold for DR program design. To the authors’ knowledge, this is the first study to establish such a sample size threshold for stable flexibility evaluation in university hot water systems.
3.5. Applicability of the Proposed Framework
The proposed framework was demonstrated on a single university campus with specific occupancy patterns and system configurations. The entire procedure runs within approximately 10–15 s on a standard personal computer (Intel Core i7-11700 @ 2.50 GHz), demonstrating its practical applicability without requiring high-performance computing resources.
The numerical results may vary depending on system scale, user demographics, and local incentive structures. Nevertheless, the overall methodology—combining clustering-based load prediction, questionnaire-based participation modeling, and binomial distribution for uncertainty quantification—is transferable to other institutional settings. Given historical hourly water usage data from the monitoring platform, the proposed load prediction model can be directly applied to different centralized hot water systems. For other public institutions such as hospitals or primary and secondary schools, the non-price incentive framework offers a useful reference for designing behavioral DR programs, and the same flexibility evaluation and uncertainty quantification procedures can be adopted.
3.6. Limitations and Future Work
Several aspects of this study are beyond the current scope of our research and warrant further investigation.
Firstly, while the binomial distribution model captures the aggregate uncertainty of participation, it assumes that participation decisions are made independently. In a dormitory setting, peer influence, shared academic schedules, and common daily routines may introduce behavioral correlations that the current model is unable to capture. In future, we could extend the model by incorporating such interdependencies; for example, through hierarchical or social network-based approaches.
Secondly, the current DR strategies are designed based on time-of-use electricity pricing. Future work could consider the dynamic output characteristics of the energy source configuration (e.g., solar thermal and PV systems) to determine the load-shifting periods that maximize renewable energy integration. To this end, the load-shifting problem could be formulated as a system-level optimization framework that accounts for supply–demand matching and operational constraints, with the objective of minimizing operational costs or maximizing renewable energy penetration.
Furthermore, AI-based adaptive DR control, such as reinforcement learning or deep neural network approaches, could be explored to enable real-time strategy adjustment based on evolving user behavior patterns and system states. These extensions would further enhance the practical applicability of the proposed framework in dynamic campus energy management systems.
4. Conclusions
Centralized hot water systems represent a significant source of energy flexibility when managed through DR. In this study, we developed a clustering-based stochastic load prediction model to forecast hourly hot water usage over a full year. Using this model, combined with survey data and probabilistic analysis, we quantified both the flexibility potential of a centralized hot water system in university dormitories and its associated uncertainty. The effects of different DR strategies, seasonal variations, and user sample size on flexibility were systematically investigated. The main findings are summarized as follows:
- (1)
- The proposed load prediction model is validated against field operational data. The maximum relative error between the predicted and measured hourly load profiles was 6.46%, confirming its reliability.
- (2)
- Survey results from 1000 student residents showed that the academic-credit incentive alone (strategy C) effectively increased students’ willingness to participate in DR compared with the time-of-use price incentive alone (strategy B). The combined price-credit incentive (strategy D) yielded the highest flexibility, achieving a peak-shaving rate of 62.66% relative to the no-DR baseline.
- (3)
- The demand-side flexibility of the centralized hot water system exhibited pronounced seasonal characteristics. Specifically, the peak-shaving volume was higher during the cooling season and transition season and lower during the heating season.
- (4)
- The binomial distribution effectively characterized the uncertainty of students’ willingness to participate. The fluctuation range of the system’s flexibility potential decreased rapidly from 80% to 10.5% as the number of participating users increased from 20 to 648, providing a practical threshold (648 users) for stable flexibility evaluation of centralized hot water systems in university dormitories.
Author Contributions
Methodology, B.X.; validation, Z.L. and N.L.; formal analysis, Y.D.; investigation, Z.L. and Q.L.; resources, N.L.; data curation, Q.L.; writing—original draft preparation, Y.D.; writing—review and editing, Z.L. and B.X.; supervision, B.X.; funding acquisition, B.X. All authors have read and agreed to the published version of the manuscript.
Funding
This research was funded by the National Natural Science Foundation of China, grant number 52278106.
Institutional Review Board Statement
This study involved anonymous questionnaire surveys on hot water usage habits and willingness to participate in demand response programs. No personally identifiable information was collected, and no intervention was performed on human subjects. According to the relevant Chinese research ethics guidelines, purely anonymous questionnaire-based studies that do not cause harm to human subjects and do not involve sensitive personal information or commercial interests may be exempted from ethical review. The study was conducted in accordance with the principles of the Declaration of Helsinki and the relevant Chinese research ethics guidelines.
Informed Consent Statement
All participants were informed of the study objectives, the voluntary nature of their participation, and the anonymity of data collection prior to completing the questionnaire. Informed consent was obtained from all participants involved in the study.
Data Availability Statement
The original contributions presented in the study are included in the article, further inquiries can be directed to the corresponding author.
Conflicts of Interest
Author Ning Li was employed by the company China Construction Technology Consulting Group, Jianke Public Facility Operation Management Co., Ltd. The remaining authors declare that this research was conducted in the absence of any commercial or financial relationships that could be construed as a potential conflict of interest.
Abbreviations
The following abbreviations are used in this manuscript:
| SIES | Smart integrated energy system |
| DR | Demand response |
| RMSE | Root mean square error |
| NILM | Nonintrusive load monitoring |
| MREdc | Maximum relative error of the load delay curve |
| MAE | Mean absolute error |
| PV | Photovoltaic |
Appendix A
Figure A1.
Typical normalized hot water usage curves for 8 categories.
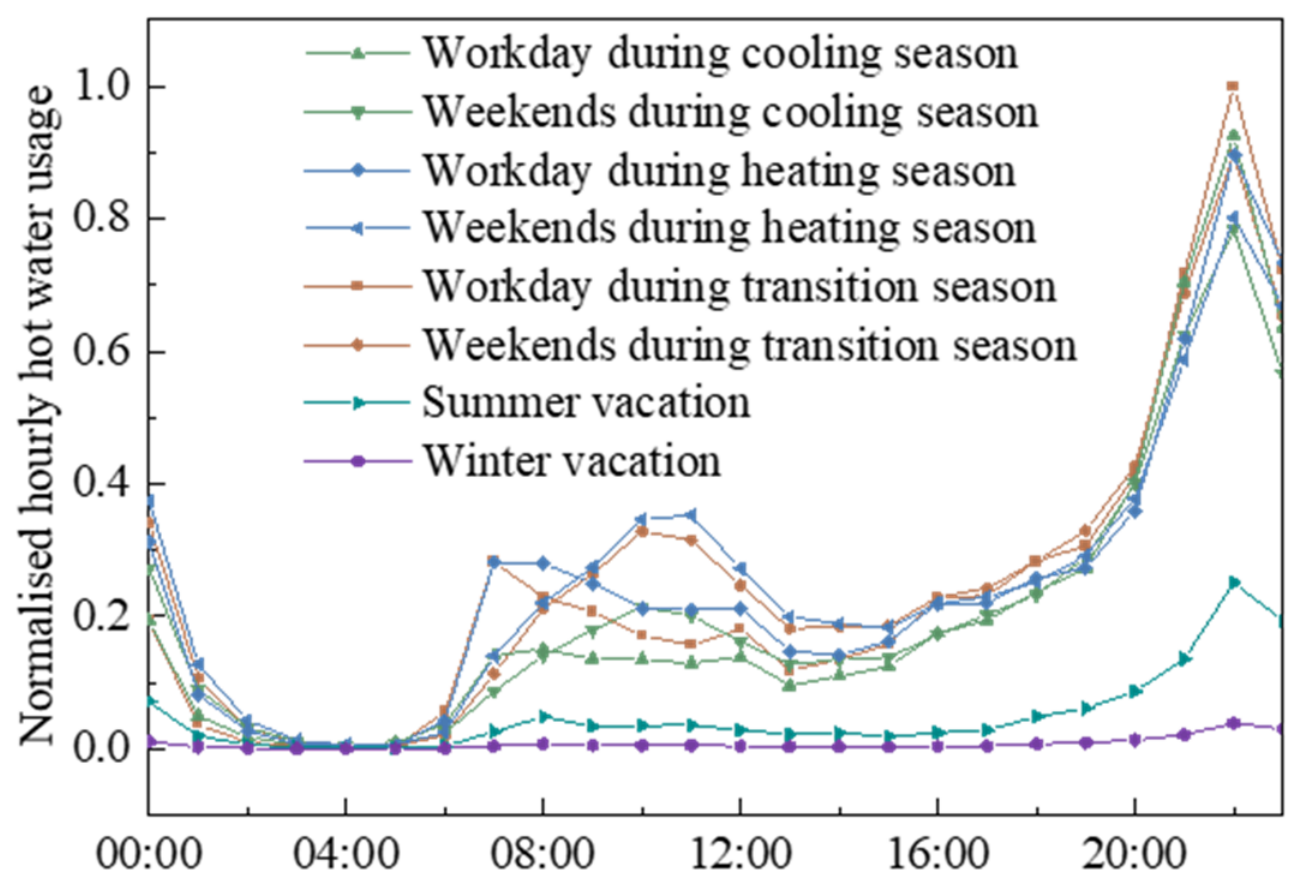
Figure A2.
The hourly distribution band of hot water demand in the benchmark scenario.
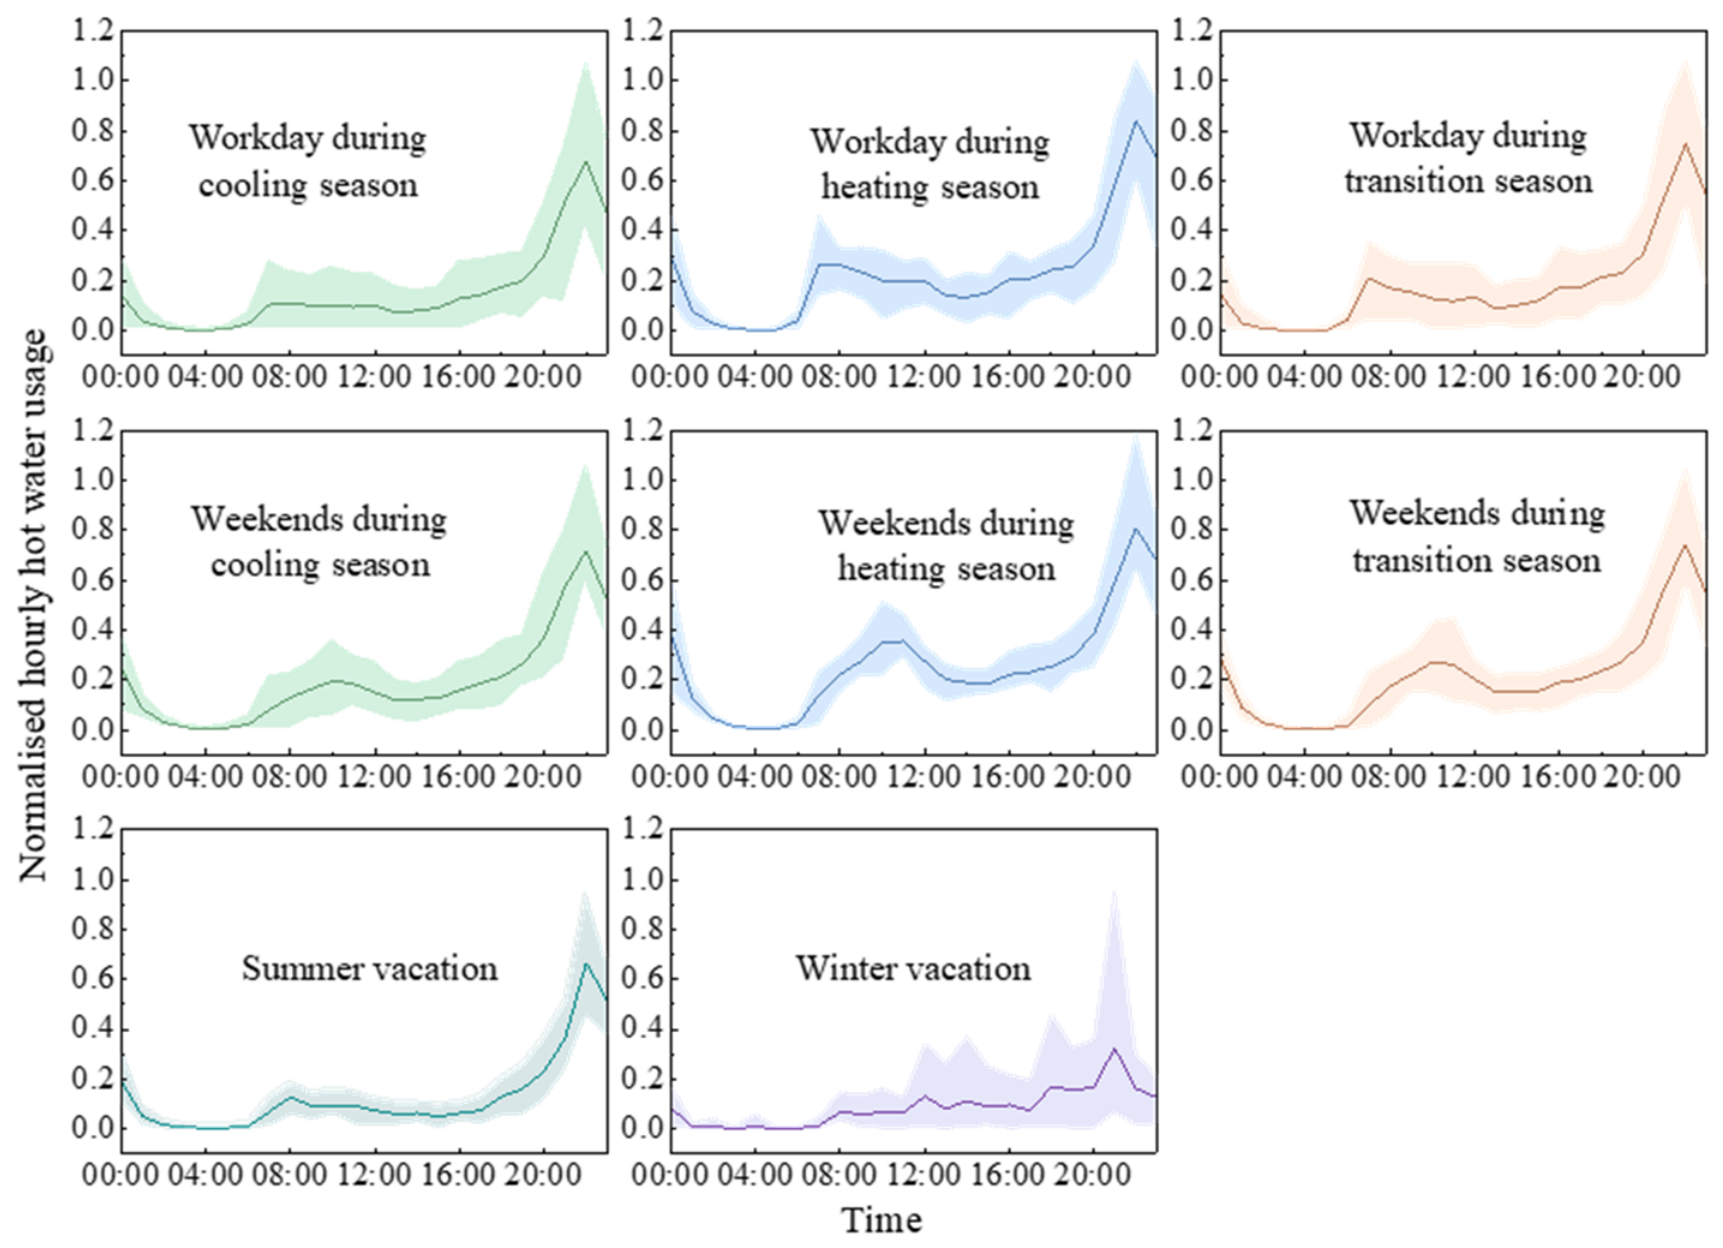
Figure A3.
Duration curves of measured and predicted hot water usage during typical weeks.
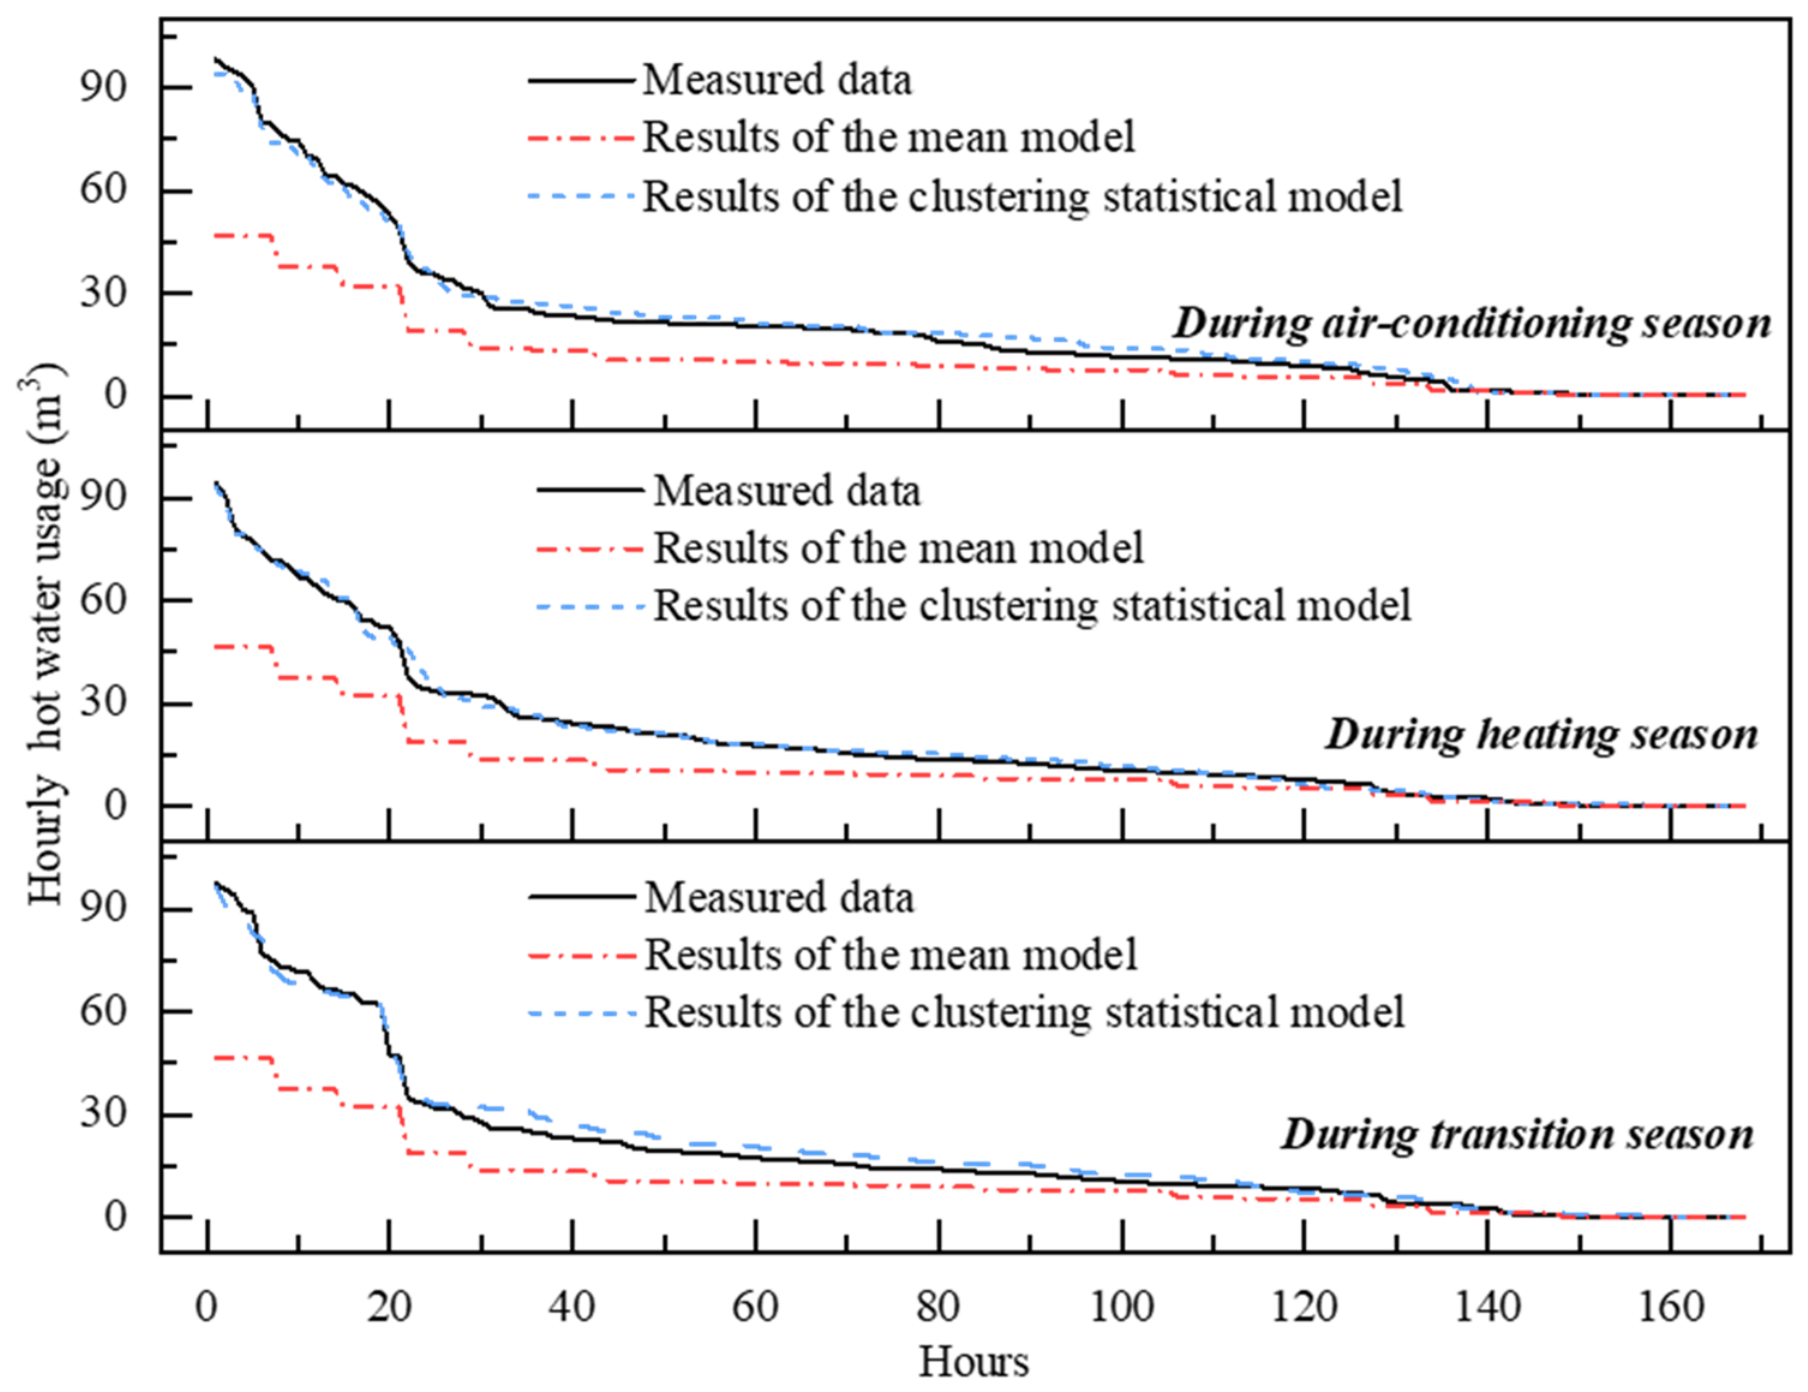
Figure A4.
Percentage of hot water demand for bathing and washing in different seasons.
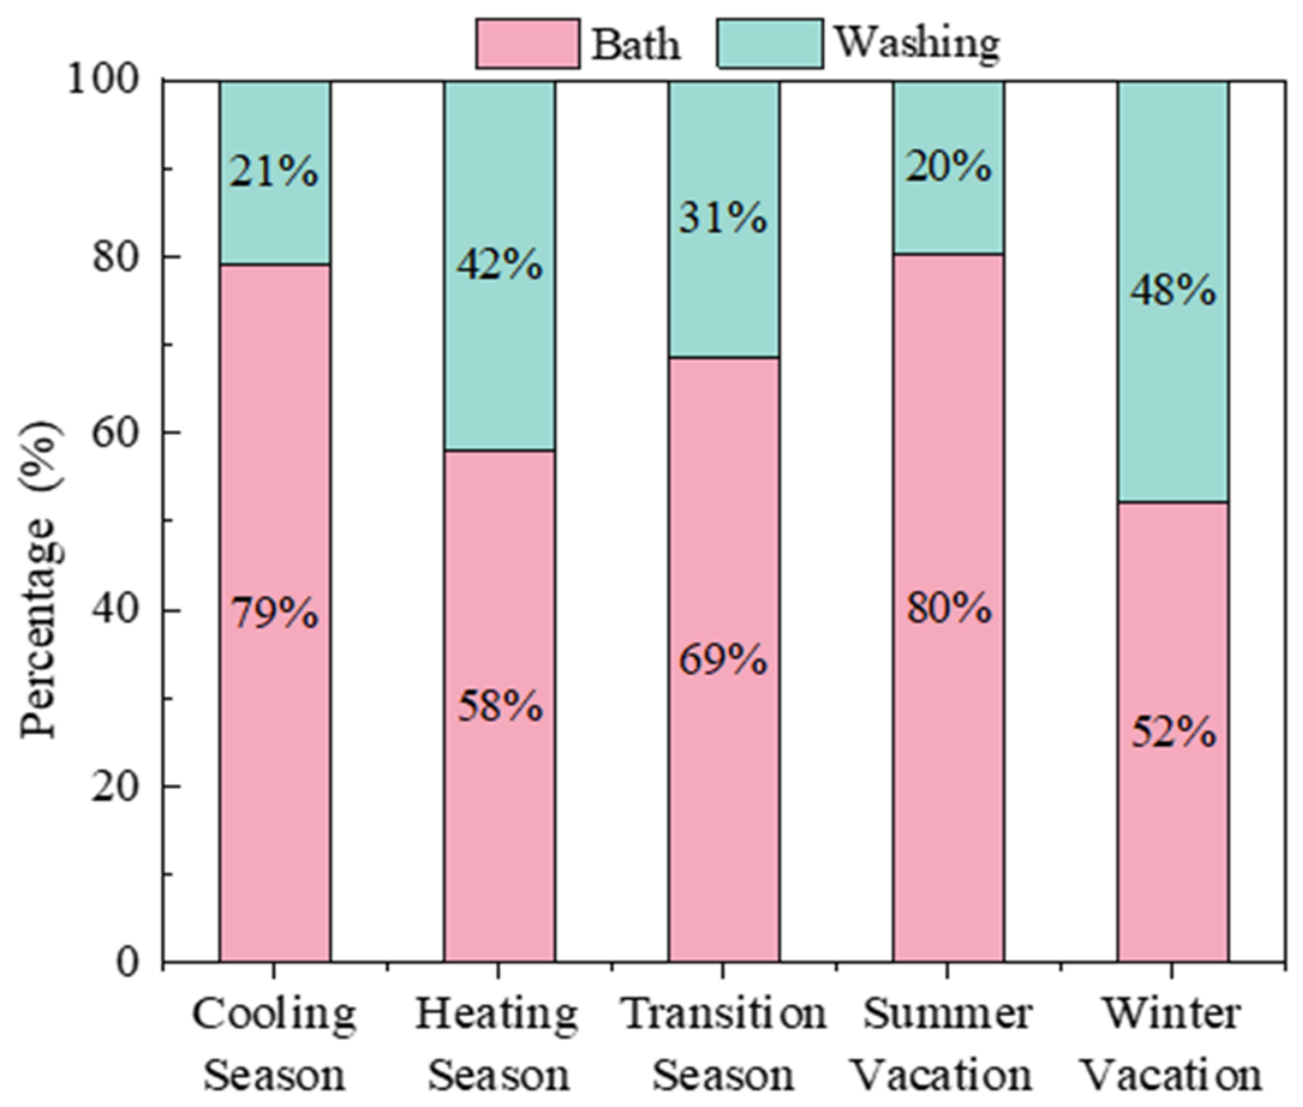
Figure A5.
Students’ willingness to participate in the different DR strategies for washing.
References
- Li, N.; Chen, W.; Zhang, Q. Provincial pathways to carbon-neutral energy systems in China considering interprovincial electricity transmission development. Appl. Energy 2024, 375, 123953. [Google Scholar] [CrossRef] [Scilit]
- He, J.; Li, Z.; Zhang, X.; Wang, H.; Dong, W.; Du, E.; Chang, S.; Ou, X.; Guo, S.; Tian, Z.; et al. Towards carbon neutrality: A study on China’s long-term low-carbon transition pathways and strategies. Environ. Sci. Ecotechnol. 2022, 9, 100134. [Google Scholar] [CrossRef] [Scilit] [PubMed]
- Adewuyi, O.B.; Aki, H. Optimal planning for high renewable energy integration considering demand response, uncertainties, and operational performance flexibility. Energy 2024, 313, 134021. [Google Scholar] [CrossRef] [Scilit]
- Wagner, L.P.; Reinpold, L.M.; Kilthau, M.; Fay, A. A systematic review of modeling approaches for flexible energy resources. Renew. Sust. Energy Rev. 2023, 184, 113541. [Google Scholar] [CrossRef] [Scilit]
- Karimi, H.; Jadid, S. Multi-layer energy management of smart integrated-energy microgrid systems considering generation and demand-side flexibility. Appl. Energy 2023, 339, 120984. [Google Scholar] [CrossRef] [Scilit]
- Xu, Y.; Yan, C.; Liu, H. Smart energy systems: A critical review on design and operation optimization. Sustain. Cities Soc. 2020, 62, 102369. [Google Scholar] [CrossRef] [Scilit]
- Dincer, I.; Acar, C. Smart energy systems for a sustainable future. Appl. Energy 2017, 194, 225–235. [Google Scholar] [CrossRef] [Scilit]
- Wang, N.; Liu, Z.; Heijinen, P.; Warnier, M. A peer-to-peer market mechanism incorporating multi-energy coupling and cooperative behaviors. Appl. Energy 2022, 311, 118572. [Google Scholar] [CrossRef] [Scilit]
- Jia, J.; Li, H.; Wu, D.; Guo, J.; Jiang, L.; Fan, Z. Multi-objective optimization study of regional integrated energy systems coupled with renewable energy, energy storage, and inter-station energy sharing. Renew. Energ. 2024, 225, 120328. [Google Scholar] [CrossRef] [Scilit]
- Amadeh, A.; Lee, Z.E.; Zhang, K.M. Quantifying demand flexibility of building energy systems under uncertainty. Energy 2022, 246, 123291. [Google Scholar] [CrossRef] [Scilit]
- Li, Y.; Wang, C.; Li, G.; Chen, C. Optimal scheduling of integrated demand response-enabled integrated energy systems with uncertain renewable generations: A Stackelberg game approach. Energy Convers. Manag. 2021, 235, 113996. [Google Scholar] [CrossRef] [Scilit]
- Niu, J.; Tian, Z.; Zhu, J.; Yue, L. Implementation of a price-driven demand response in a distributed energy system with multi-energy flexibility measures. Energy Convers. Manag. 2020, 208, 112575. [Google Scholar] [CrossRef] [Scilit]
- Kiptoo, M.K.; Lotfy, M.E.; Adewuyi, O.B.; Conteh, A.; Howlader, A.M.; Senjyu, T. Integrated approach for optimal techno-economic planning for high renewable energy-based isolated microgrid considering cost of energy storage and demand response strategies. Energy Convers. Manag. 2020, 215, 112917. [Google Scholar] [CrossRef] [Scilit]
- Ma, S.; Liu, H.; Wang, N.; Huang, L.; Goh, H.H. Incentive-based demand response under incomplete information based on the deep deterministic policy gradient. Appl. Energy 2023, 351, 121838. [Google Scholar] [CrossRef] [Scilit]
- Silva, C.; Faria, P.; Vale, Z.; Corchado, J.M. Demand response performance and uncertainty: A systematic literature review. Energy Strateg. Rev. 2022, 41, 100857. [Google Scholar] [CrossRef] [Scilit]
- Vahid-Ghavidel, M.; Javadi, M.S.; Gough, M.; Santos, S.F.; Shafie-khah, M.; Catalão, J.P.S. Demand response programs in multi-energy systems: A review. Energies 2020, 13, 4332. [Google Scholar] [CrossRef] [Scilit]
- Mancini, F.; Romano, S.; Lo Basso, G.; Cimaglia, J.; de Santoli, L. How the Italian residential sector could contribute to load flexibility in demand response activities: A methodology for residential clustering and developing a flexibility strategy. Energies 2020, 13, 3359. [Google Scholar] [CrossRef] [Scilit]
- Tang, G.; Zhao, Z.; Schulte, F.; Iris, C. Smart charging with demand response and energy peak shaving for reefer containers with Internet-of-Things. Int. J. Prod. Res. 2025, 63, 7460–7485. [Google Scholar] [CrossRef] [Scilit]
- Iris, C.; Lam, J.S.L. Optimal energy management and operations planning in seaports with smart grid while harnessing renewable energy under uncertainty. Omega 2021, 103, 102445. [Google Scholar] [CrossRef] [Scilit]
- Rao, Z.; Chen, S.; Lun, I.; Shen, L.; Yu, A.; Fu, H. Energy flexibility characteristics of centralized hot water system in university dormitories. Build. Sim. 2023, 16, 641–662. [Google Scholar] [CrossRef] [Scilit]
- Zhu, J.; Dong, H.; Zheng, W.; Li, S.; Huang, Y.; Xi, L. Review and prospect of data-driven techniques for load forecasting in integrated energy systems. Appl. Energy 2022, 321, 119269. [Google Scholar] [CrossRef] [Scilit]
- Chen, S.; Wang, L.L.; Li, J.; Zhou, G.; Zhou, X. A training pattern recognition algorithm based on weight clustering for improving cooling load prediction accuracy of HVAC system. J. Bulid. Eng. 2022, 52, 104445. [Google Scholar] [CrossRef] [Scilit]
- Zhang, C.; Hoes, P.J.; Wang, S.; Zhao, Y. Intrinsically interpretable machine learning-based building energy load prediction method with high accuracy and strong interpretability. Energy Built. Environ. 2026, 7, 94–114. [Google Scholar] [CrossRef] [Scilit]
- Kim, H.; Park, S.; Kim, S. Time-series clustering and forecasting household electricity demand using smart meter data. Energy Rep. 2023, 9, 4111–4121. [Google Scholar] [CrossRef] [Scilit]
- Dab, K.; Henao, N.; Nagarsheth, S.; Dubé, Y.; Sansregret, S.; Agbossou, K. Consensus-based time-series clustering approach to short-term load forecasting for residential electricity demand. Energy Build. 2023, 229, 113550. [Google Scholar] [CrossRef] [Scilit]
- Han, D.; Bai, H.; Wang, Y.; Bu, F.; Zhang, J. Day-ahead aggregated load forecasting based on household smart meter data. Energy Rep. 2023, 9, 149–158. [Google Scholar] [CrossRef] [Scilit]
- Reihani, E.; Sepasi, S.; Ghorbani, R. Scheduling of price-sensitive residential storage devices and loads with thermal inertia in distribution grid. Appl. Energy 2016, 183, 636–644. [Google Scholar] [CrossRef] [Scilit]
- Gelažanskas, L.; Gamage, K.A.A. Distributed energy storage using residential hot water heaters. Energies 2016, 9, 127. [Google Scholar] [CrossRef] [Scilit]
- Balint, A.A.; Kazmi, H.S. Determinants of energy flexibility in residential hot water systems. Energy Build. 2019, 188, 188–189, 286–296. [Google Scholar] [CrossRef] [Scilit]
- Fischer, D.; Wolf, T.; Wapler, J.; Hollinger, R.; Madani, H. Model-based flexibility assessment of a residential heat pump pool. Energy 2017, 118, 853–864. [Google Scholar] [CrossRef] [Scilit]
- Liang, Z.; Chung, C.Y.; Yin, X.; Fu, X.; Wang, Q.; Zhu, J. Robust energy management of hybrid microgrids via a nonintrusive load monitoring framework with dual-task learning. IEEE Trans. Smart Grid 2026. Early Access. [Google Scholar] [CrossRef] [Scilit]
- Salgado-Bravo, M.; Negrete-Pincetic, M.; Kiprakis, A. Demand-side energy flexibility estimation for day-ahead models. Appl. Energy 2023, 347, 121502. [Google Scholar] [CrossRef] [Scilit]
- Allison, J.; Bell, K.; Clarke, J.; Cowie, A.; Elsayed, A.; Flett, G.; Oluleye, G.; Hawkes, A.; Hawker, G.; Kelly, N.; et al. Assessing domestic heat storage requirements for energy flexibility over varying timescales. Appl. Therm. Eng. 2018, 136, 602–616. [Google Scholar] [CrossRef] [Scilit]
- Wang, T.; Wang, J.; Zhao, Y.; Shu, J.; Chen, J. Multi-objective residential load dispatch based on comprehensive demand response potential and multi-dimensional user comfort. Electr. Pow. Syst. Res. 2023, 220, 109331. [Google Scholar] [CrossRef] [Scilit]
- Malehmirchegini, L.; Farzaneh, H.H. Incentive-based demand response modeling in a day-ahead wholesale electricity market in Japan, considering the impact of customer satisfaction on social welfare and profitability. Sustain. Energy Grids Netw. 2023, 34, 101044. [Google Scholar] [CrossRef] [Scilit]
- Zhao, X.; Liu, X.; Ji, Z.; Li, F.; Liu, G. Decision analysis of load aggregator considering dynamic behavior of residential users. Electr. Power 2024, 57, 179–189. (In Chinese) [Google Scholar]
- Shen, J. Low-carbon optimal dispatch of campus integrated energy system considering flexible interactions between supply and demand. Int. J. Electr. Power Energy Syst. 2024, 156, 109776. [Google Scholar] [CrossRef] [Scilit]
- Sheng, X.; Lin, S.; Liang, W.; Pan, Y.; Liu, M. Interval Economic Dispatch for Commercial Campus Integrated Energy System with Demand Response Considering Multiple Uncertainties. CSEE J. Power Energy Syst. 2025, 11, 1297–1311. [Google Scholar] [CrossRef] [Scilit]
- Wang, Y.; Yu, J.; Chen, D. Uncertainty-Aware Agent-Based Modeling of Building Multi-Energy Demand with Integrated Flexibility Assessment. Electronics 2026, 15, 719. [Google Scholar] [CrossRef] [Scilit]
- Ding, Y.; Bai, Y.; Tian, Z.; Wang, Q.; Su, H. Coordinated optimization of robustness and flexibility of building heating systems for demand response control considering prediction uncertainty. Appl. Therm. Eng. 2023, 223, 120024. [Google Scholar] [CrossRef] [Scilit]
- Tang, H.; Wang, S. Energy flexibility quantification of grid-responsive buildings: Energy flexibility index and assessment of their effectiveness for applications. Energy 2021, 211, 119756. [Google Scholar] [CrossRef] [Scilit]

Disclaimer/Publisher’s Note: The statements, opinions and data contained in all publications are solely those of the individual author(s) and contributor(s) and not of MDPI and/or the editor(s). MDPI and/or the editor(s) disclaim responsibility for any injury to people or property resulting from any ideas, methods, instructions or products referred to in the content. |
© 2026 by the authors. Licensee MDPI, Basel, Switzerland. This article is an open access article distributed under the terms and conditions of the Creative Commons Attribution (CC BY) license.