


Abstract
To alleviate renewable energy curtailment and the high operating costs arising from the temporal and spatial mismatch of distributed generation, this paper develops a cross-park dispatch optimization approach for power systems under the joint participation of carbon trading and green certificate trading (GCT). The proposed approach aims to improve system flexibility and economic performance in coordinated multi-park operation. Specifically, adjustable resources in different parks are dispatched in a coordinated manner, and the total comprehensive operating cost is taken as the optimization objective. In addition, the Alternating Direction Method of Multipliers (ADMM) is adopted to determine inter-park electricity trading prices and exchanged power in a distributed framework. Furthermore, an asymmetric bargaining model is introduced to distribute the cooperative benefits, ensuring a balance between fairness and incentive compatibility. Simulation results demonstrate that inter-park electricity interaction reduces generation costs by 5.29%. The integration of carbon and green certificate trading further reduces costs by 7.4%. After asymmetric bargaining-based benefit allocation, the operating costs of parks with higher contributions decrease by up to 10.34%. The results conclude that the proposed strategy effectively leverages the complementary advantages of multi-park resources and optimizes the synergy between carbon markets, green certificate markets, and physical dispatch.
1. Introduction
In the context of the worldwide energy transition and sustainability goals, integrated energy systems in parks have gradually become an important vehicle for advancing the energy revolution [1,2]. They are evolving from independent operation of single parks to cooperative alliances featuring multi-park coordination and complementarity [3,4]. However, in multi-park scenarios, energy supply and demand exhibit significant spatiotemporal heterogeneity [5]. Restricted by regional resources and conditions, renewable energy generation and load generally show an inverse distribution [6,7], and the output of different renewable sources varies over time [8]. This makes it difficult for multi-park power systems to effectively accommodate renewable energy [9,10], imposing spatiotemporal constraints on their optimal operation [11,12]. Therefore, establishing cross-park dispatch optimization strategies incorporating energy storage systems has become an urgent need [13,14].
In terms of cross-park coordination and optimal scheduling, Chen et al. [15] proposed a low-carbon optimization dispatch model for multi-park new power systems. The model incorporates carbon emission cost pricing and carbon emission allowance constraints to study the impact of cross-park optimal dispatch under carbon constraints. Liu et al. [16] selected a grid connecting two parks as a practical case, comprehensively considered the operational characteristics and influencing factors of renewable energy accommodation, and proposed a cross-park renewable energy accommodation strategy. Dong et al. [17] proposed a day-ahead and intra-day bi-level coordinated operation framework for multi-park integrated energy systems, which explicitly considers wind and solar forecasting uncertainties and dynamically coordinates inter-park electricity transactions to enhance operational flexibility. Ma et al. [18] proposed a two-stage dispatching strategy for park-level integrated energy systems based on a master–slave–cooperative hybrid game model, enabling coordinated energy sharing among interconnected parks while reducing system operating costs and improving dispatch performance. Zheng et al. [19] proposed a sharding-based asynchronous coordination framework for secure and scalable peer-to-peer energy trading, which addresses communication delays and false data injection attacks while improving the scalability and communication efficiency of distributed energy trading. Yang et al. [20] proposed a hierarchical bidding strategy for heterogeneous power-to-hydrogen (P2H) loads and wind power. The proposed framework integrates state-driven load aggregation and switching-time scheduling to improve bidding flexibility, load aggregation accuracy, and renewable energy utilization. Li et al. [21] developed a receding-horizon D-optimal input design framework for wireless power transfer systems. By combining recursive least-squares estimation with sequential quadratic programming, the proposed method improved the accuracy and efficiency of system identification through optimal excitation signal design.
Regarding carbon–green certificate markets, Zhang et al. [22] presented a cooperative game-based dispatch strategy incorporating carbon trading and green certificates for multi-region systems, forming a multi-agent alliance to optimize regional carbon emissions and utilization of wind and solar power. Yan et al. [23] considered the uncertainty of renewable energy generation and proposed a stochastic optimal dispatch model that includes carbon emission trading and green certificates, deriving a dispatch strategy that balances the interests of all parties. Li et al. [24] established an assessment method for the integrated trading of green certificates, carbon allowances, and electricity considering demand-side flexibility, and analyzed how different factors affect the trading outcomes. Zhang et al. [25] established a low-carbon optimal dispatch model for integrated energy systems by incorporating carbon–green certificate trading, achieving flexible and low-carbon system operation. Xu et al. [26] proposed a risk-aware low-carbon optimization framework for hydrogen-oriented integrated energy systems, incorporating stochastic programming and conditional value-at-risk (CVaR) to address renewable energy uncertainties and improve economic and environmental performance.
Although considerable progress has been made in cross-park dispatch optimization and low-carbon market-based operation, several research gaps remain unresolved. First, most existing cross-park dispatch studies mainly focus on power exchange, renewable energy accommodation, or operation cost reduction, while the low-carbon economic value of renewable generation under coupled carbon and green certificate markets is not fully reflected in the dispatch process. Second, studies on carbon trading and green certificate trading usually emphasize market-based cost adjustment or emission reduction, but they are not sufficiently integrated with inter-park physical power-sharing among heterogeneous parks. Third, although distributed optimization and cooperative bargaining methods have been widely applied in energy systems, and considerable attention has also been paid to system modeling, their integrated application in coordinating inter-park power exchange and allocating cooperative benefits according to heterogeneous park contributions under a coupled electricity–carbon–green certificate framework remains insufficiently explored.
To address these gaps, this paper proposes a cross-park dispatch optimization framework for hybrid energy storage power systems considering carbon–green certificate trading. The main contributions are summarized as follows:
- (1)
- A cross-park cooperative dispatch framework integrating renewable energy sharing, carbon emission trading, and green certificate trading is established. Different from existing studies that mainly consider power exchange optimization or low-carbon operation from a single perspective, the proposed framework jointly considers the interaction between physical energy scheduling and low-carbon market mechanisms. By incorporating electricity value, carbon reduction value, and green certificate value into the dispatch process, the proposed framework provides a more comprehensive evaluation of renewable energy utilization in multi-park systems.
- (2)
- A distributed solution framework based on the Alternating Direction Method of Multipliers (ADMM) is adopted to coordinate inter-park power exchange and transaction price determination while preserving the local decision-making autonomy of individual parks. Compared with centralized optimization methods requiring complete information sharing, the proposed framework enables multiple parks to independently optimize their local resources and achieve coordinated operation through limited information interaction, improving the applicability of cooperative dispatch in multi-agent energy systems.
- (3)
- A cooperative benefit allocation mechanism based on asymmetric bargaining is incorporated into the dispatch framework to redistribute cooperative gains among parks with different energy contributions. Considering that different parks may play different roles in cross-park energy interaction, the proposed mechanism allocates cooperative benefits according to their contribution differences, thereby reducing the imbalance of benefit distribution and enhancing the willingness of heterogeneous parks to participate in long-term cooperation.
Table 1 summarizes the main characteristics of representative studies and compares them with the proposed method. As shown in Table 1, existing studies have primarily focused on the operational optimization of individual energy systems, cross-park-coordinated dispatch, electricity–carbon–green certificate trading mechanisms, and system modeling and optimal design. However, limited attention has been paid to integrating cross-park power exchange, coupled electricity–carbon–green certificate markets, distributed optimization, and cooperative benefit allocation within a unified dispatch framework. Compared with existing studies, the proposed method establishes a unified cross-park-coordinated dispatch framework by jointly considering inter-park physical power sharing, carbon–green certificate market incentives, distributed transaction coordination, and contribution-based cooperative benefit allocation, thereby achieving coordinated optimization of economic performance, low-carbon operation, and cooperation fairness.
Table 1.
Comparison of representative studies and this work.
2. Concept Proposal
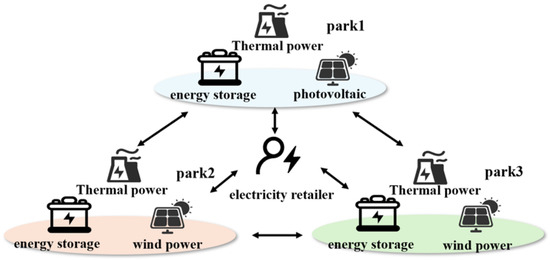
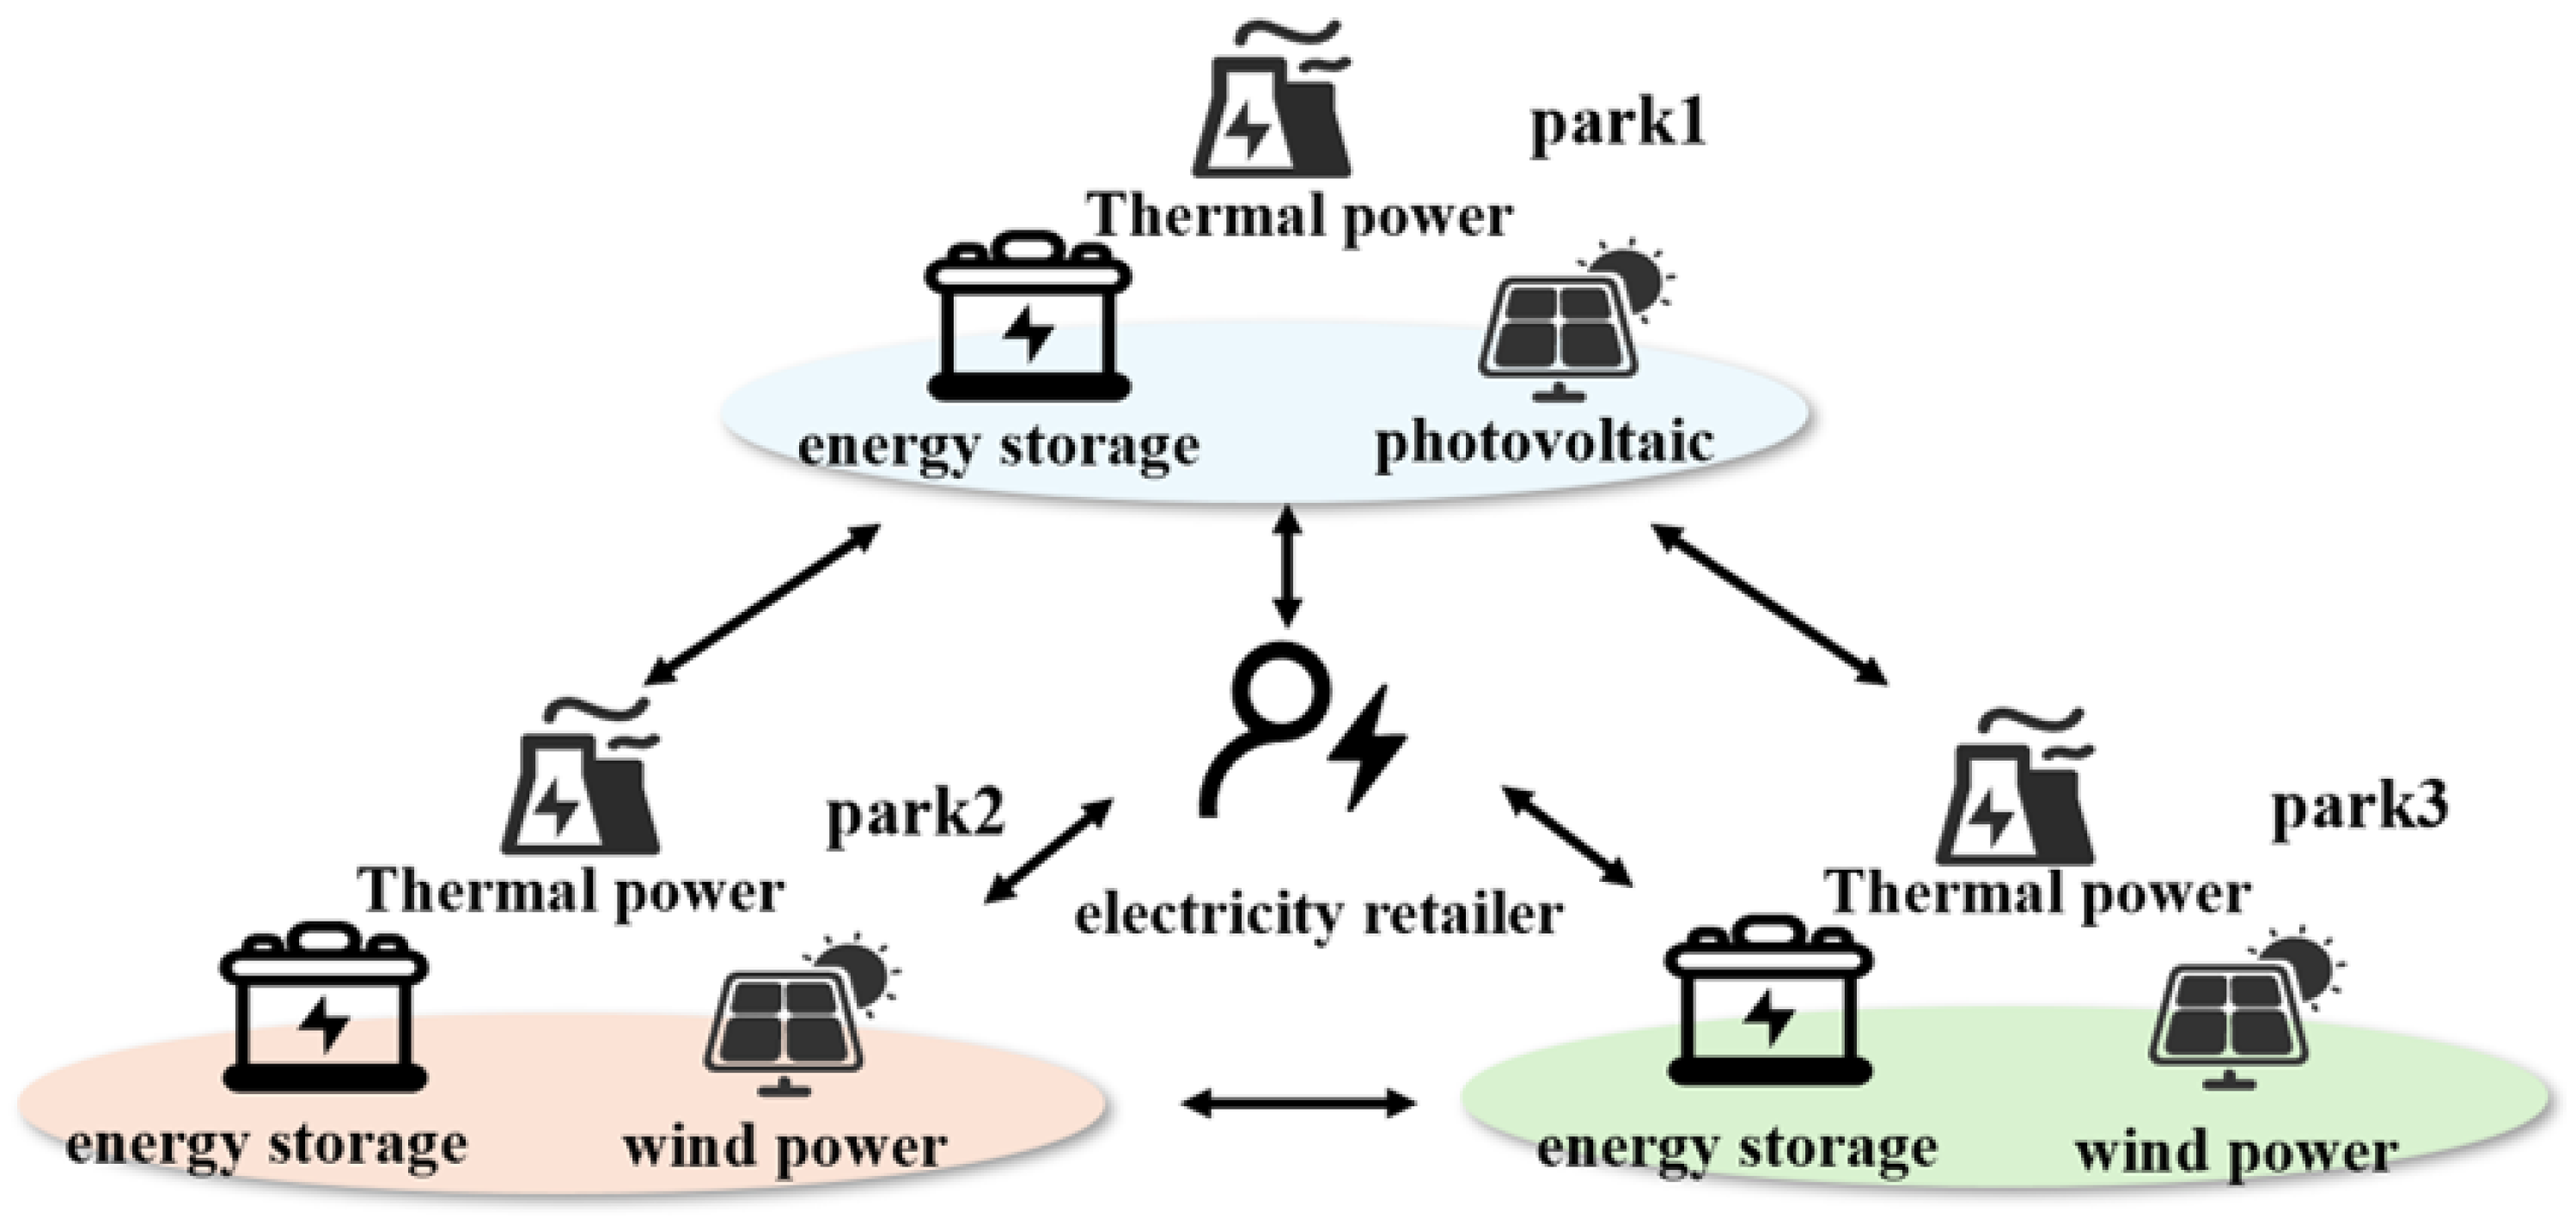
This paper considers an interactive framework between multiple industrial parks and a power retailer within the same regional electricity trading area, as shown in Figure 1. The participating parks are assumed to be geographically adjacent and interconnected through a local power interaction network. Their differences mainly arise from renewable energy portfolios, load characteristics, and generation profiles. Specifically, Park 1 is PV-dominated, whereas Parks 2 and 3 are wind-dominated, providing complementary renewable energy outputs. Each park satisfies its local demand through on-site generation and can trade electricity with both the power retailer and neighboring parks when power deficits or surpluses occur. Detailed transmission issues, such as transmission losses, network congestion, wheeling charges, and power flow constraints, are not explicitly modeled; instead, the inter-park interaction capability is represented by exchanged power limits.
Figure 1.
System structure diagram.
The energy trading mechanism is based on regional peer-to-peer (P2P) bilateral trading. Parks purchase electricity from or sell electricity to the power retailer according to retail electricity prices, while inter-park exchanged power and transaction prices are coordinated through the proposed ADMM-based distributed optimization framework.
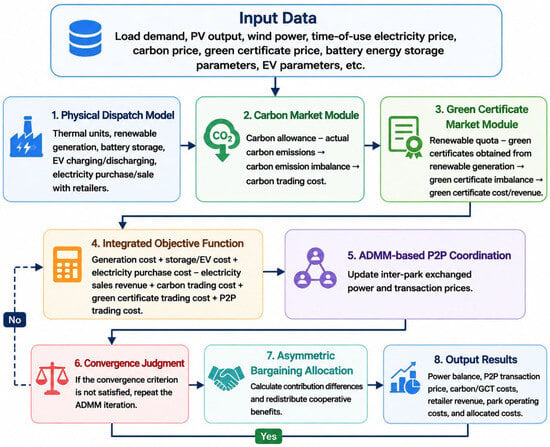
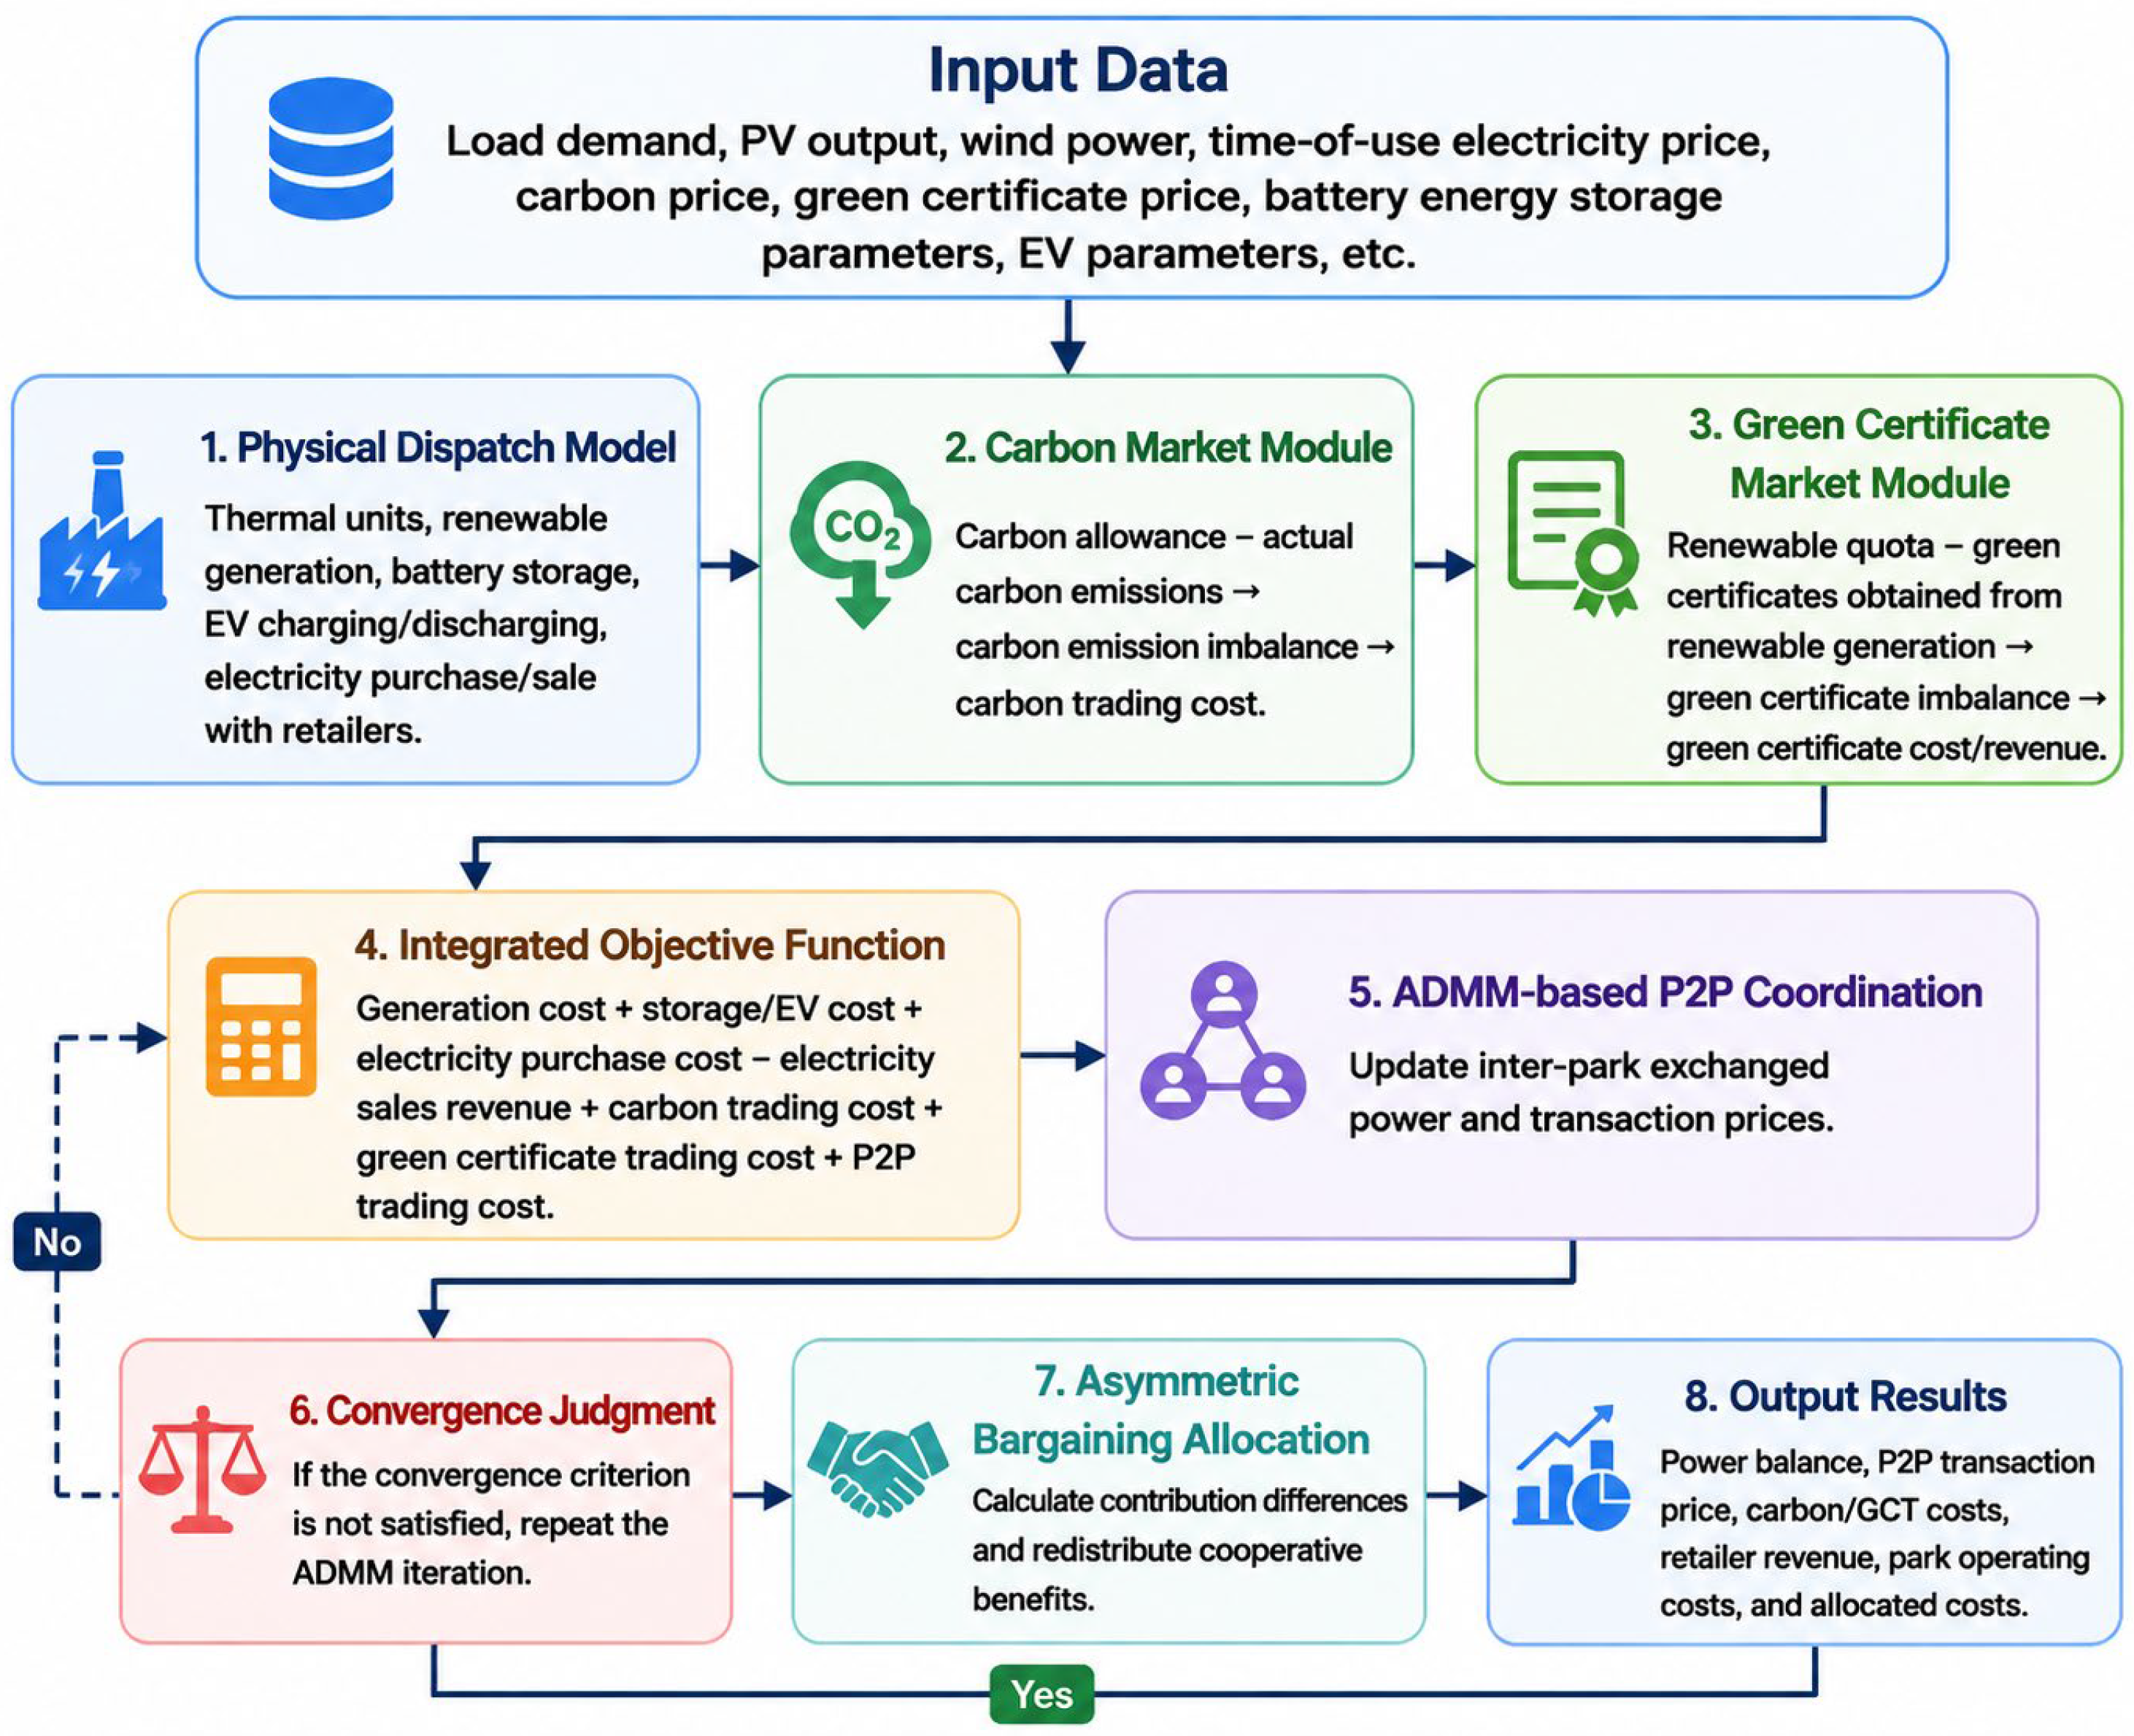
Figure 2 presents the overall optimization framework, consisting of three coupled modules: physical dispatch, low-carbon market, and cooperative coordination. The physical dispatch module optimizes local generation, renewable energy utilization, hybrid energy storage, EV charging/discharging, retailer transactions, and inter-park P2P power exchange. The low-carbon market module evaluates carbon trading and green certificate trading costs, while the cooperative coordination module determines exchanged power, transaction prices, and cooperative benefit allocation. The hybrid energy storage and EV models are established using calibrated parameters obtained from representative operating data and engineering specifications. Since this study focuses on day-ahead dispatch optimization, these parameters remain fixed during each scheduling horizon. Carbon trading and green certificate trading are coupled with the physical dispatch through the optimization objective, allowing different renewable energy portfolios to generate different economic incentives that indirectly influence hybrid energy storage scheduling and inter-park P2P power exchange without altering the physical storage constraints.
Figure 2.
Overall framework of the proposed cross-park dispatch optimization model.
3. Model
3.1. Carbon Emission Quota Model
Promoting the coordinated development of the carbon market and the green certificate market is essential for achieving the “dual carbon” goals [27]. Currently, the primary method for carbon quota allocation in the domestic context is free allocation [28]. This paper employs the benchmarking method to determine the free allocation of carbon quotas for different parks. For this study, the electricity purchased from retailers is considered to come from thermal power sources. Consequently, carbon emissions for each park mainly stem from local thermal power generation and electricity procured from the power retailer. The carbon emission quota is as follows [29]:
where Ec,i is carbon emission allowance of park i, Ebuy,i is carbon emission allowance from purchased electricity, Ee,i is carbon emission allowance from thermal power generation Pbuy,i is volume of purchased electricity, Pe,i is generation output of thermal power, δa is carbon emission allowance per unit of electric power.
The actual carbon emissions for each park are calculated as:
where Ecr,i represents the actual carbon emissions of park i, Ebuyr,i is the carbon emissions of purchased electricity, Eer,i is the carbon emissions of thermal power generation, and ωa is the carbon emission factor per unit of electric power.
The tradable carbon emission allowances are expressed as:
3.2. Stepwise Carbon Trading Model
A stepped carbon trading model is introduced into the carbon trading system. When the carbon emissions of a park exceed its carbon emission allowance, additional carbon emission rights must be purchased from the carbon market. According to the corresponding emission interval, the higher the excess emissions, the higher the cost of purchasing carbon emission rights. When carbon emissions are lower than the carbon emission allowance, surplus carbon emission rights can be sold on the carbon market based on the corresponding carbon emission interval [30]. For the analysis in this paper, the benchmark carbon trading price is set at 36.75 $·t−1, while the carbon price growth coefficient and interval length are determined as 25% and 50 t, respectively. The stepped carbon trading model is expressed as Equation (4).
where xC denotes the base carbon trading price, v represents the carbon price growth coefficient, and ΔL stands for the length of the carbon price interval.
3.3. New Energy Quota Model
A green certificate is a tradable instrument issued in association with renewable electricity generation. In addition to selling electricity through the power market, renewable energy producers can also receive corresponding green certificates based on their generation output, thereby obtaining extra revenue [31]
The renewable portfolio standard is a policy measure that specifies and ensures a required proportion of new energy in total power demand, so as to promote the development and utilization of new energy and reduce dependence on traditional energy sources [32]. The new energy quota index for each park is defined as Equation (5).
where Gr,i is new energy quota index of park i; μ is new energy quota coefficient; PLOAD,t is required electrical load during the dispatch period.
The green certificate index of the park is expressed as Equation (6).
where Gs,i is green certificate index of park i; Pren,t is on-grid power of renewable energy during the dispatch period.
The tradable green certificate index is given by Equation (7).
3.4. Stepped Green Certificate Model
Similar to the stepped carbon trading mechanism, a stepped green certificate trading mechanism is adopted. When the green certificates held by a park are insufficient to meet the new energy quota, additional green certificates must be purchased from the green certificate market. When the held green certificates exceed the new energy quota, surplus certificates can be sold for profit.
Under the stepped trading mechanism, the more green certificates exceed the required quota, the higher the revenue per certificate; conversely, the larger the certificate deficit, the higher the cost of purchasing certificates. In this paper, the base price of green certificates is set at 11.76 $ per certificate, the price growth coefficient is 25%, and the price interval length is 100 certificates. The stepped green certificate trading mechanism is expressed as Equation (8).
where xGCT is base price of green certificates; b is green certificate price growth coefficient; ΔU is length of green certificate price interval.
3.5. Battery Energy Storage Model
The battery energy storage model is expressed as follows [33].
where Et is the capacity of the energy storage device at time t; Et−1 is the capacity of the energy storage device at time t − 1; Pc, Pd is charging and discharging power, respectively; ηc, ηd is charging efficiency and discharging efficiency; is time duration of power interaction of the energy storage station.
3.6. Electric Vehicle Model
Electric vehicles are modeled as flexible demand-side resources participating in charging, discharging, and off-grid states. Their charging/discharging behavior is constrained by the arrival/departure time distribution, daily driving mileage, SOC limits, rated battery capacity, and charging/discharging power limits. The detailed probability distributions and discharging duration equations are provided in Appendix A.
The probability density function of daily driving mileage of EVs is given by [34].
where μL = 3.2 and σL = 0.88.
The charging duration of an EV is expressed as Equation (12) [35].
where SOCs is initial state of charge at the beginning of charging, related to daily driving mileage and battery discharge; Tcd is charging duration; is charging power; is charging efficiency.
EVs have three operating states: charging, discharging, and off-grid. The power interaction between an EV and the dispatched park can be expressed as [36].
where is interactive power between the EV and the charging station during period t; denotes the off-grid power of the EV and is equal to 0; , and are binary variables, among which only one is equal to 1 at any moment.
In the optimization model, the EVs within each park are represented as an aggregated equivalent fleet rather than being modeled individually. The mutually exclusive binary variables in Equations (13) and (14) therefore describe the charging, discharging, and off-grid states of the aggregated EV fleet at each time period.
The log-normal mileage distribution and deterministic charging-duration model are adopted to characterize the aggregated charging behavior of EV users in the day-ahead scheduling framework. Since this study focuses on deterministic dispatch under known statistical information, the corresponding distribution parameters are assumed to remain fixed during each scheduling horizon. Accordingly, the ADMM-based distributed optimization and the subsequent asymmetric bargaining allocation are both performed under the expected operating conditions.
Unlike stationary battery energy storage systems, the aggregated EV fleet is modeled as a mobile flexible resource whose availability depends on users’ travel behavior. The EV fleet and stationary storage are represented by independent variables and constraints, ensuring that no storage capacity is double-counted. The off-grid state is treated as an availability constraint, while carbon trading and green certificate trading only affect the economic objective without altering the physical operating constraints of either resource.
4. Optimize Scheduling Model
4.1. Objective Function
The optimization objective is to reduce the total generation and operation costs of the three industrial parks to the lowest level. This comprehensive cost includes generation costs, operational costs of energy storage systems, carbon trading costs, and green certificate trading costs. Additionally, it accounts for the costs associated with inter-park energy interactions, as well as the expenses from power purchases and the revenues from electricity sales. The objective function is defined as follows.
where Cb denotes the operation and maintenance (O&M) cost associated with power generation; Cc is the carbon trading cost; CGCT denotes the green certificate trading cost; CBUY and CSELL are the power purchase cost and electricity sales revenue, respectively; and Ctr represents the inter-park power trading cost. The formulations for carbon trading and green certificate trading costs are detailed in Equations (4) and (8), respectively.
Generation and Maintenance Costs [37]:
where Ce,t represents the thermal power generation cost, a, b, and c are the power generation cost coefficients, Cren,t denotes the operation and maintenance (O&M) cost of new energy, Kren is the O&M cost coefficient of new energy, KESS stands for the O&M cost coefficient of energy storage systems, and KEV represents the discharge subsidy for electric vehicles.
P2P Bilateral Trading Cost:
where uP2P,t represents the inter-park P2P transaction price coordinated among participating parks, PP2P,t denotes the corresponding exchanged power in the bilateral P2P trading process. A positive value indicates power export, while a negative value indicates power import.
Power purchase cost and electricity sales revenue:
4.2. Constraints
Power balance constraints:
Power purchase and sale constraints [38]:
To minimize energy losses, each park prioritizes meeting its own internal demand. When a park purchases power to cover a generation deficit, it is prohibited from selling electricity to other parks. Conversely, when a park exports surplus generation, it cannot purchase electricity from other parks.
where US,t, UJ,t, UBUY,t, and USELL,t are binary variables representing the status of power delivery, power reception, and electricity purchase from or sale to retailers at time t, respectively.
Output constraints:
where Pe,tmin and Pe,tmax represent the lower and upper output limits of thermal power units at time t, respectively; PPV,t represents the photovoltaic (PV) power output at time t, while PPV,tmin and PPV,tmax are the corresponding minimum and maximum PV power output limits; Pw,t denotes the wind power output at time t, and Pw,tmin and Pw,tmax refer to the minimum and maximum output limits of wind power, respectively.
Thermal unit ramping constraints:
where Re denotes the ramping rate limit of thermal power units.
Energy storage constraints:
where E denotes the energy storage capacity; Emax and Emin indicate the upper and lower capacity limits of the energy storage system, respectively; ηcha and ηdis are the charging and discharging efficiencies, respectively; and ρc is a binary variable (0–1 variable) that takes the value of 0 for discharging and 1 for charging.
Inter-park P2P power interaction constraints:
where PP2P,max and PP2P,min denote the upper and lower limits of the interactive power, respectively; P1P2P,t, P2P2P,t, P3P2P,t represent the power interaction quantities of Park 1, Park 2, and Park 3 at time t, respectively.
Power regulation amplitude constraints:
4.3. ADMM Algorithm and Nash Bargaining Method
In the cross-park dispatch problem, heterogeneous parks have different renewable energy resources, load characteristics, and flexible assets, leading to diverse operational decisions and cooperative benefits. Although inter-park coordination can improve renewable energy utilization and reduce operating costs, two challenges remain. First, centralized optimization requires complete information sharing among parks, limiting its applicability in multi-agent energy systems. Second, different contributions to energy sharing may result in unequal cooperative benefits, requiring an effective mechanism for distributed decision-making and fair benefit allocation.
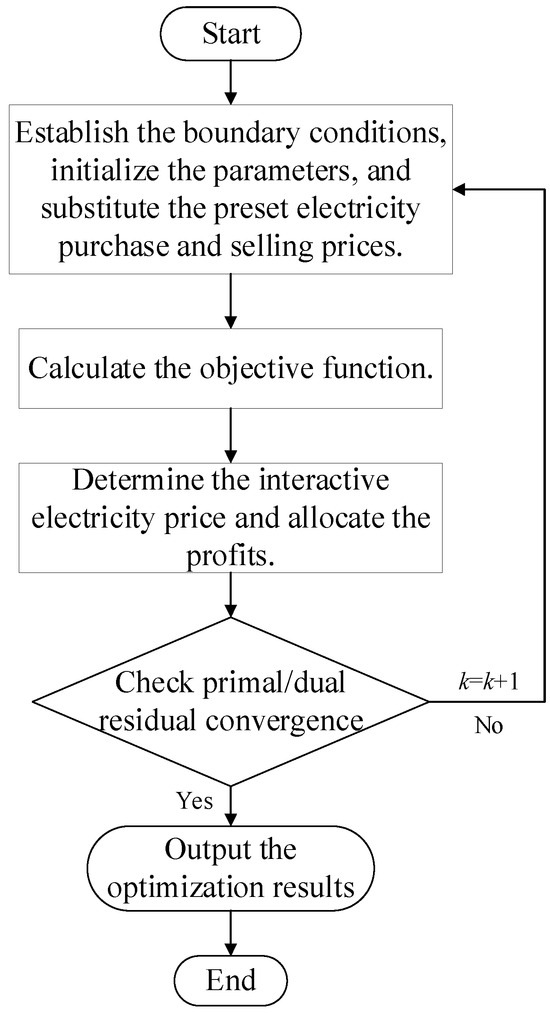
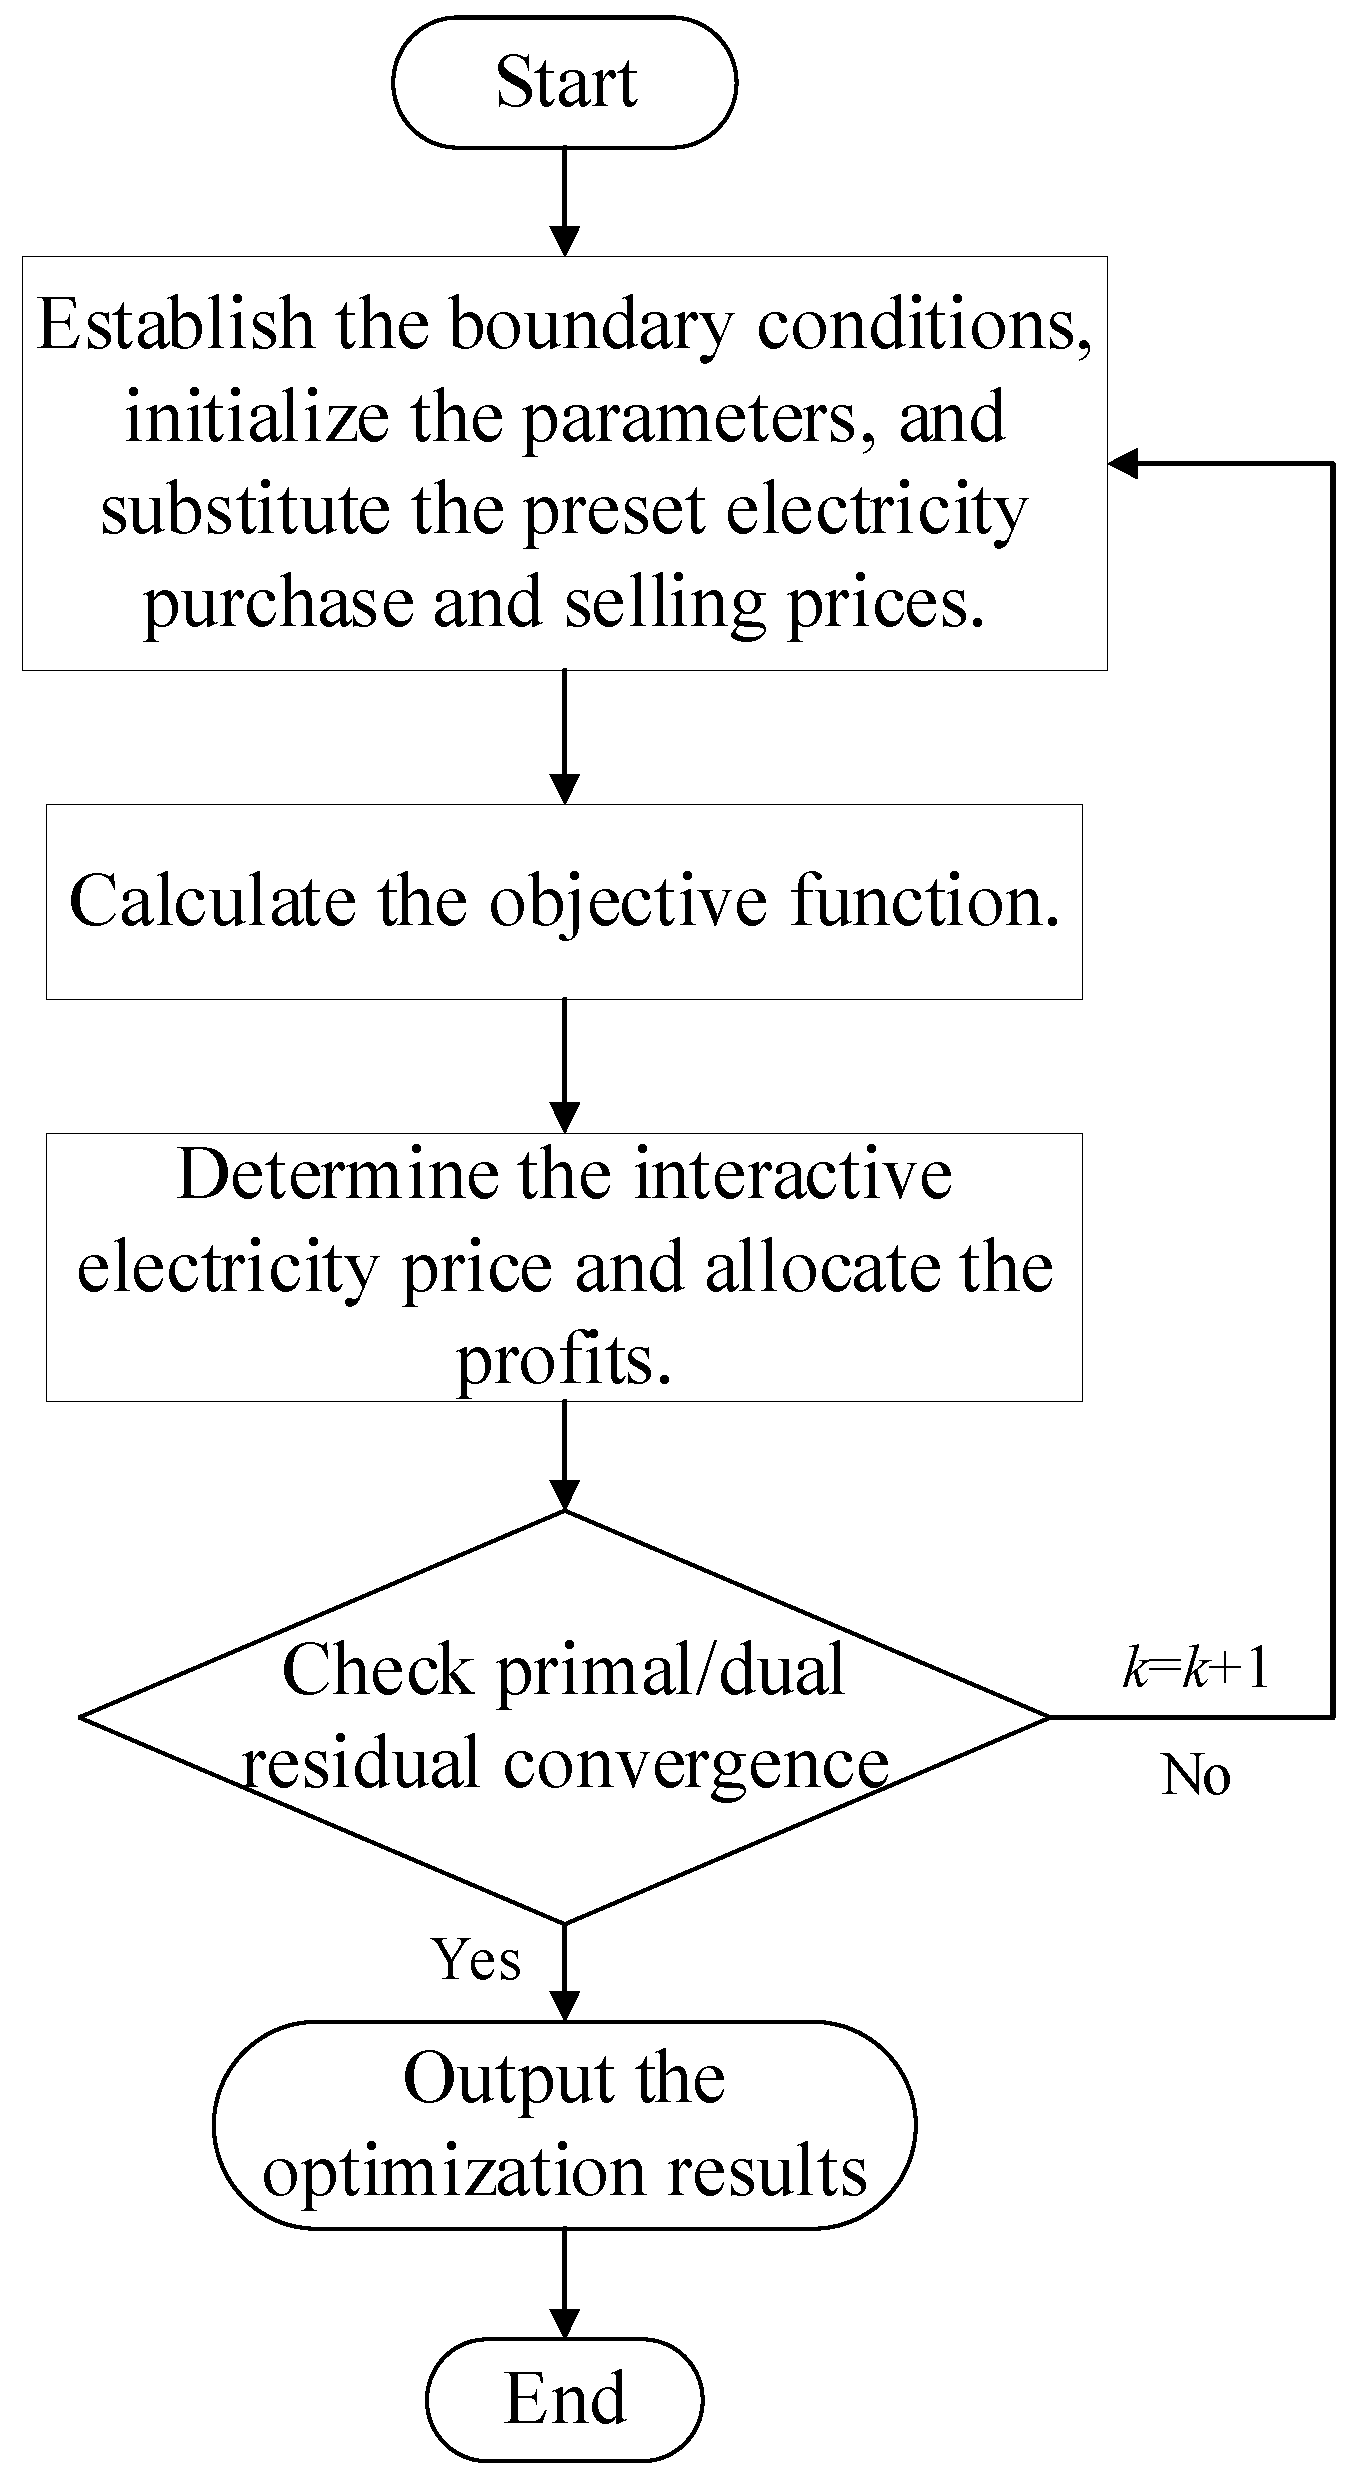
To address these issues, an ADMM-based distributed coordination strategy and an asymmetric bargaining-based benefit allocation mechanism are integrated into the proposed cross-park dispatch framework. The framework jointly considers local generation, energy storage, electric vehicle flexibility, inter-park power exchange, and carbon–green certificate trading. The solution process consists of two stages: distributed dispatch optimization and cooperative benefit allocation. In the first stage, ADMM is applied to coordinate inter-park exchanged power and transaction prices while preserving local decision autonomy. Each park independently solves its local dispatch problem, and consistency constraints with iterative multiplier updates ensure coordinated power exchange without requiring complete information sharing. The detailed ADMM formulation, including the augmented Lagrange function and the Lagrange-multiplier update rule, is provided in Appendix B. During each iteration, the Lagrange multipliers are updated according to the bilateral power consistency constraints to reduce the mismatch between exchanged power decisions among different parks. Since the stepped carbon trading and green certificate trading models introduce piecewise cost characteristics into the local optimization problems, the convergence of the distributed coordination process is evaluated using both primal and dual residuals rather than objective function variation alone. The overall solution framework and the interaction between the two stages are illustrated in Figure 3.
Figure 3.
Structure diagram of the dispatch optimization model.
After obtaining the optimal dispatch results, the asymmetric bargaining mechanism is introduced to redistribute cooperative benefits among participating parks. Since parks may act as electricity suppliers or receivers [39], bargaining weights are determined according to their contributions to renewable energy sharing and cost reduction. This mechanism enables more reasonable benefit allocation, improves incentive compatibility, and encourages long-term cross-park cooperation. The detailed bargaining model is presented in Appendix C.
4.4. ADMM Implementation and Computational Analysis
To improve the reproducibility of the proposed distributed solution framework, this subsection further describes the implementation details, convergence criteria, penalty parameter selection, and computational characteristics of the ADMM algorithm. In the proposed model, the inter-park P2P exchanged power is the main coupling variable among different parks. Each park independently solves its own local dispatch subproblem based on the current transaction price, exchanged power information, and Lagrange multiplier. The Lagrange multipliers are then updated to reduce the mismatch of bilateral power interaction among parks. In this study, the storage parameters and EV characteristics are assumed to be known before optimization and remain unchanged during each scheduling horizon. Consequently, the ADMM iterations optimize dispatch decisions using fixed physical models, while future implementations may integrate online parameter identification techniques to periodically update the storage models when operating conditions or market signals vary significantly.
The convergence of the proposed distributed coordination framework is evaluated by both the primal residual and the dual residual. The primal residual reflects the consistency of bilateral exchanged power among different parks, whereas the dual residual measures the variation in the coupling variables between two successive iterations. Only when both residuals simultaneously satisfy the prescribed tolerances, is the distributed solution regarded as converged.
For each pair of interacting parks, the exchanged power should satisfy the bilateral balance condition. For example, if Pij,t denotes the power exported from park i to park j at time t, and Pji,t denotes the power exported from park j to park i, the following consistency condition should be satisfied:
During the ADMM iteration, the primal residual is used to measure the violation of the bilateral power interaction balance. It can be expressed as:
where rk is the primal residual at iteration k, ε denotes the set of inter-park interaction links, and denotes the set of dispatch periods. A smaller primal residual indicates that the exchanged power decisions of paired parks are more consistent.
The dual residual is used to measure the variation in coupling variables between two consecutive iterations. It is defined as:
where sk is the dual residual, ρ is the penalty parameter, and is the vector of inter-park exchanged power at iteration k.
The ADMM iteration is terminated when both the primal residual and the dual residual are smaller than the predefined tolerances, or when the maximum number of iterations is reached. The stopping criterion is given by:
where εpri and εdual are the primal and dual residual tolerances, respectively. In this study, the absolute tolerance and relative tolerance are set as εabs = 10−4 and εrel = 10−3, respectively. The maximum number of iterations is set as Kmax = 200. Under the baseline scenario, the ADMM algorithm converges after 37 iterations, indicating that the proposed distributed coordination method can obtain stable exchanged power and transaction prices within a reasonable number of iterations.
The penalty parameter ρ has an important influence on the convergence speed of ADMM. Although adaptive penalty parameter adjustment strategies can accelerate ADMM convergence, they may introduce additional tuning requirements, especially for optimization problems containing piecewise non-smooth carbon trading and green certificate trading costs. Therefore, this study adopts a fixed penalty parameter strategy and determines the value of ρ through sensitivity analysis. The tested values of ρ include 0.1, 0.5, 1, 2, 5, and 10. The corresponding number of iterations, computation time, and objective values are summarized in Table 2. The results indicate that ρ = 1.0 provides a satisfactory balance between convergence speed and computational efficiency.
Table 2.
Sensitivity of ADMM convergence to penalty parameter ρ.
To further evaluate the computational characteristics of the proposed method, the ADMM-based distributed optimization framework is compared with the centralized optimization method. As shown in Table 3, the ADMM-based distributed optimization method obtains an objective value very close to that of the centralized optimization method, with an objective gap of only 0.003%. Compared with centralized optimization, the ADMM-based method decomposes the original problem into three park-level subproblems and reduces the computation time from 18.6 s to 12.8 s. Although the distributed method requires iterative information exchange, it reduces the scale of each local optimization problem and improves the scalability of the proposed framework for multi-park applications.
Table 3.
Computational comparison between centralized optimization and ADMM-based distributed optimization.
The centralized optimization method solves the entire multi-park problem at once, so its computational burden increases rapidly with the number of parks, time periods, and coupling constraints. The ADMM-based distributed method requires iterative information exchange, but each local subproblem is smaller and can be solved independently. If the local subproblems are solved in parallel, the computational time of each iteration is mainly determined by the park with the largest local subproblem. Therefore, the ADMM-based framework is more suitable for multi-park systems in which different parks retain local decision-making autonomy while participating in coordinated dispatch.
The computational complexity of the proposed ADMM framework mainly depends on the scale of each local park-level mixed-integer optimization problem rather than the overall system size. Since the coupling variables among parks are limited to exchanged power and transaction prices, each park can independently solve its local problem without increasing the decision dimension of other parks. Although binary EV states and hybrid energy-storage dynamics increase the complexity of local subproblems, the aggregated EV fleet model avoids a significant increase in binary variables, and the storage dynamics only introduce local time-coupled constraints. Therefore, the proposed framework maintains good scalability as the number of participating parks increases, with the communication burden mainly determined by the exchanged coupling variables and interaction links among parks.
5. Case Study and Results Analysis
5.1. Case Descriptions
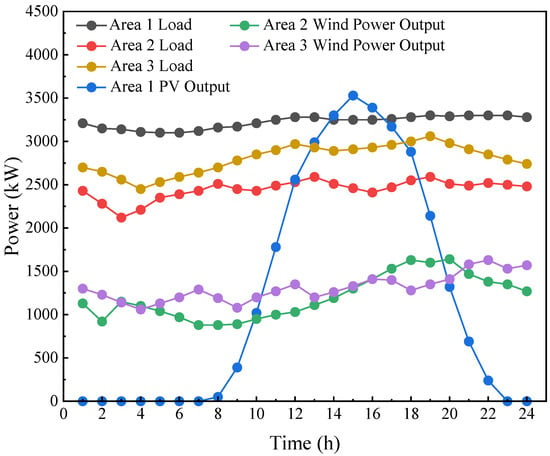
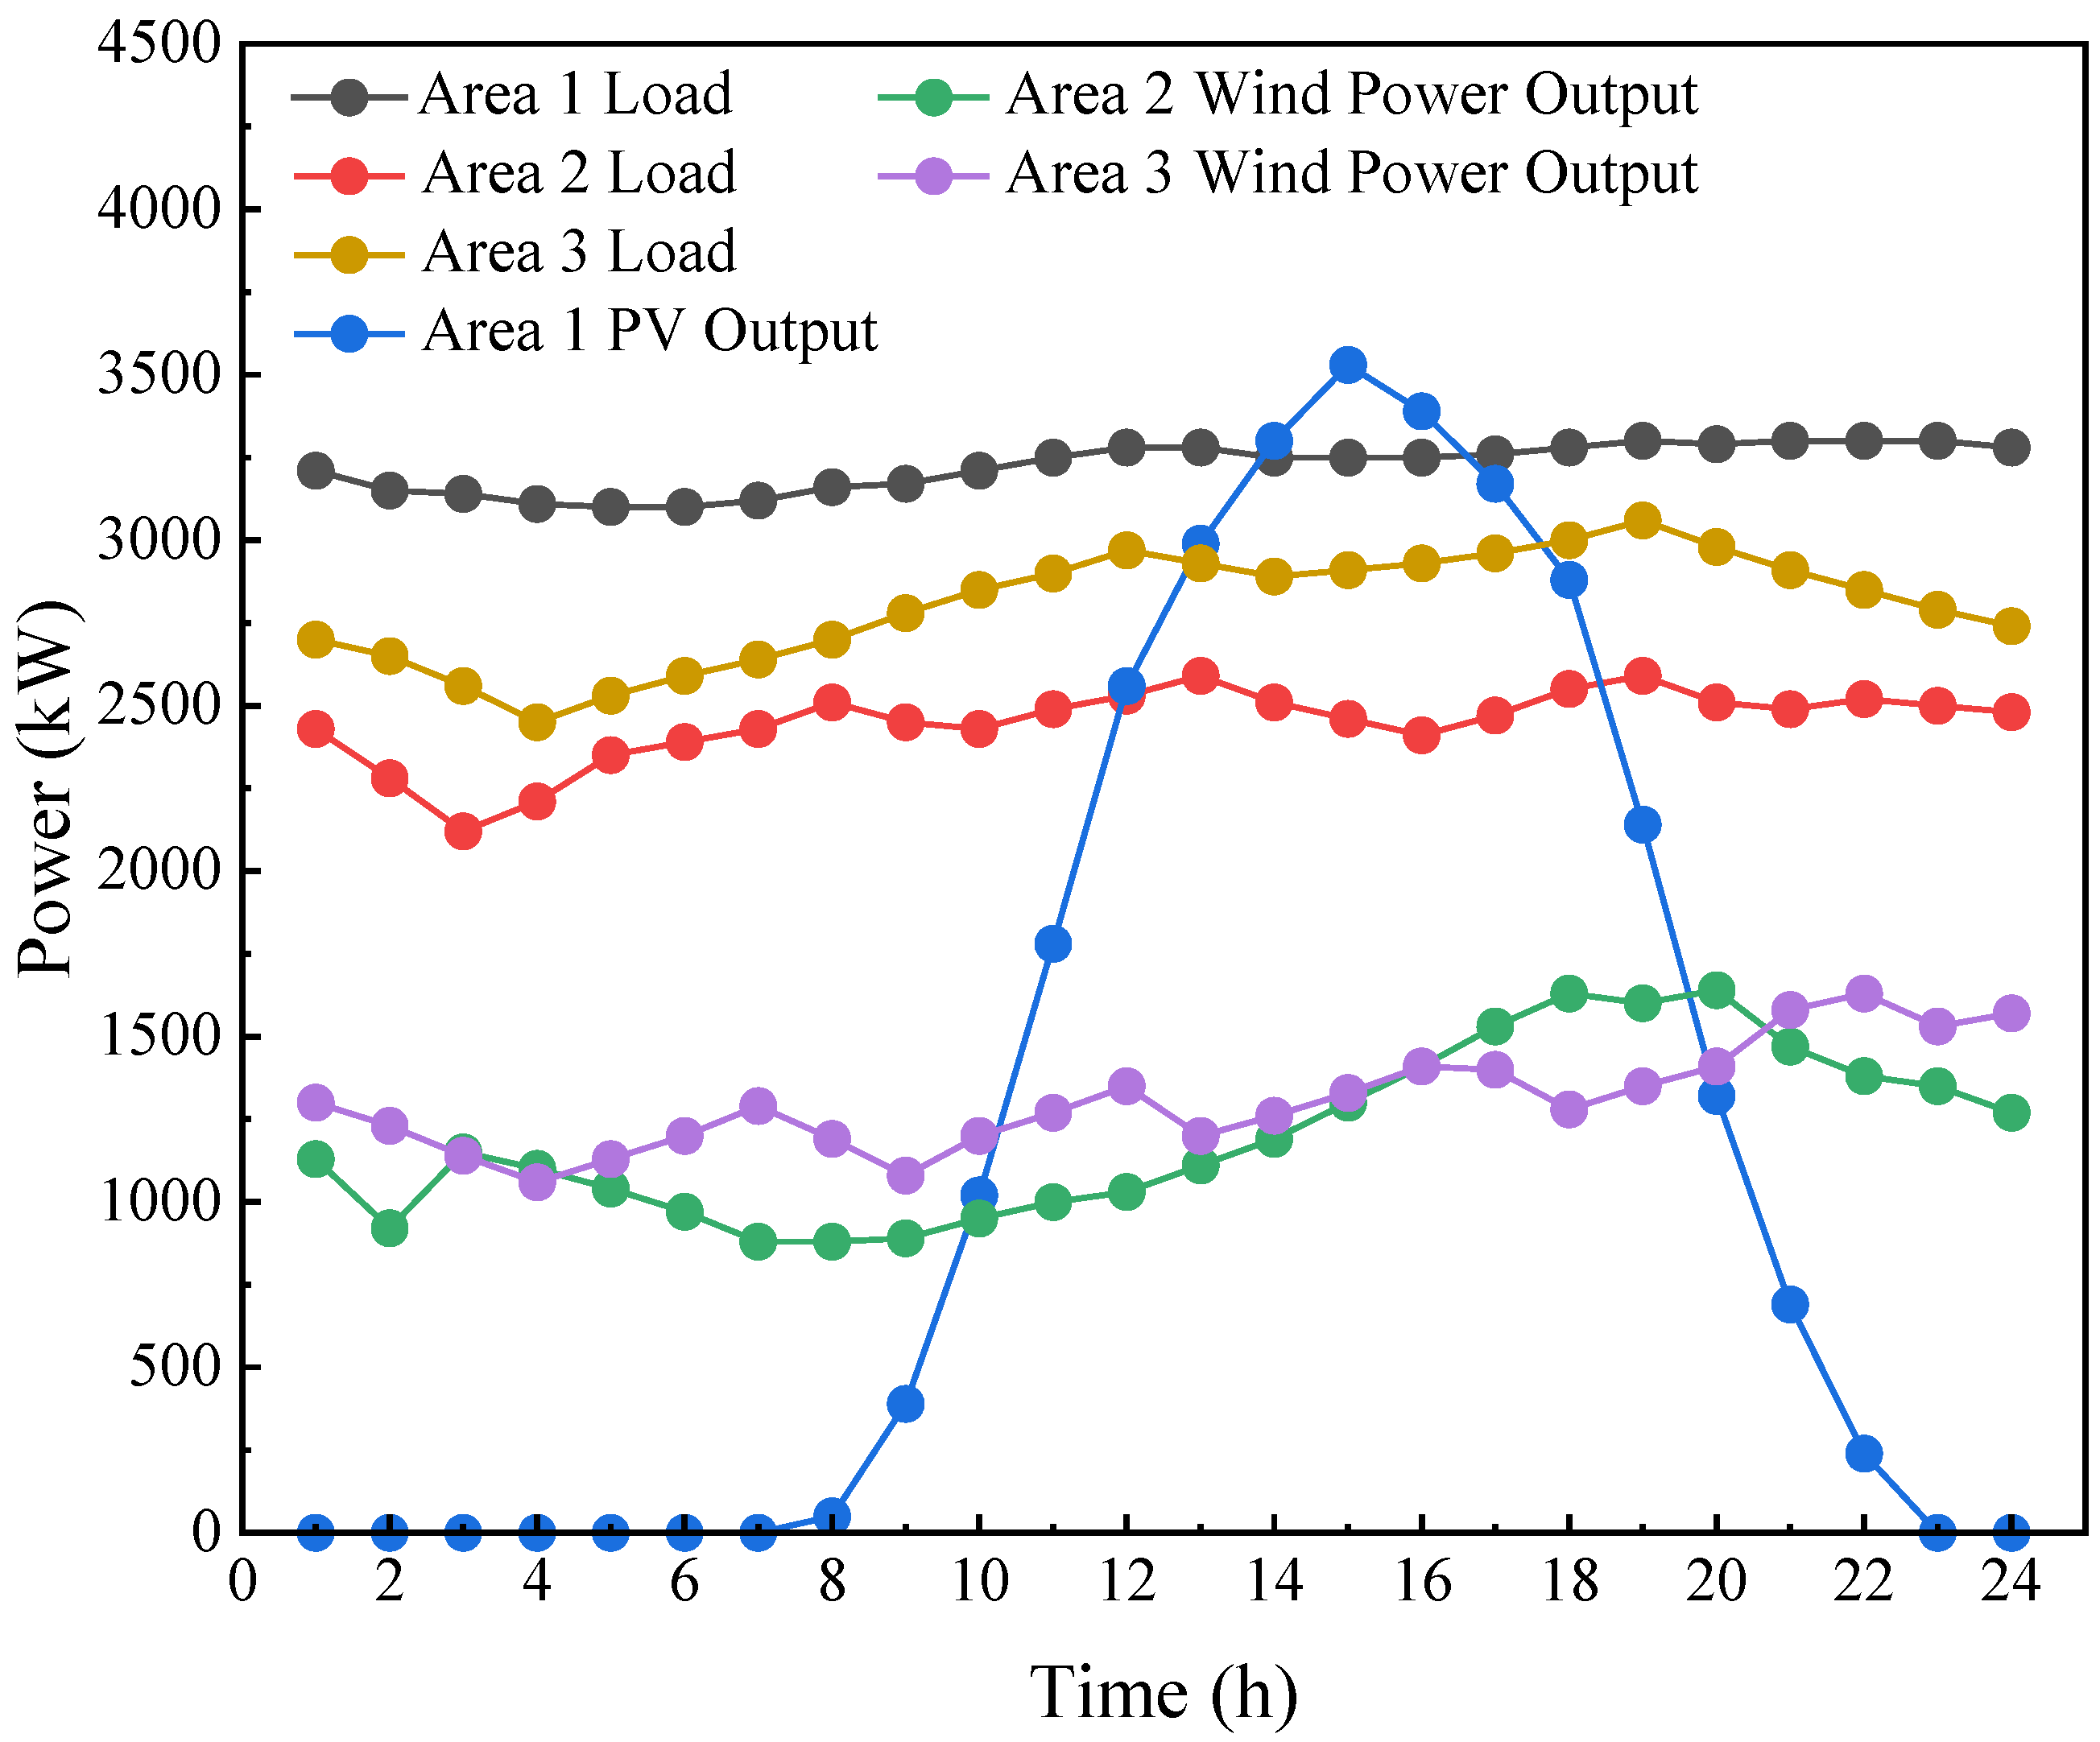
The load profiles and renewable generation profiles used in this case study are derived from the typical operating data of a regional industrial park cluster in China. Due to data confidentiality and commercial information protection, the specific location and enterprise names are anonymized. Park 1 is equipped with 8 MW of photovoltaic capacity, 10 MW of thermal power capacity, and 650 kW of energy storage. For Park 2, the installed capacities of wind power, thermal power, and energy storage are 5 MW, 8 MW, and 550 kW, respectively. Park 3 has 4 MW of wind power capacity, 7 MW of thermal power capacity, and 600 kW of energy storage. The numbers of electric vehicles in Parks 1, 2, and 3 are assumed to be 150, 130, and 140, respectively. The maximum charging and discharging power of each electric vehicle is 5 kW, and the corresponding charging/discharging efficiency is 90%. The carbon trading price is specified as 250 yuan·t−1, with a trading interval of 50 t, a price growth rate of 0.25, and a carbon quota coefficient of 0.798 kg·kWh−1. The green certificate price is set at 80 yuan per certificate, while the renewable quota coefficient, price interval, and price growth rate are taken as 0.3, 100 certificates, and 0.25, respectively. The load demand and renewable generation profiles of each park are presented in Figure 4. In addition, the user electricity price follows a time-of-use tariff scheme, in which the day is divided into peak, valley, and flat periods, and the corresponding tariff values are listed in Table 4.
Figure 4.
Load demand and renewable generation profiles of the three parks.
Table 4.
Time of use electricity price for the power grid.
To improve the transparency of the case study, the main assumptions and parameter sources are summarized in Appendix D. For parameters that are difficult to obtain directly from public market data, representative assumptions are adopted according to the scale of the studied industrial parks and further examined through sensitivity and robustness analyses.
To examine the effectiveness of the proposed model, three comparative scenarios are designed:
- Scenario 1: Optimizing based on the carbon market without cross-park power exchange.
- Scenario 2: Optimizing based on the carbon market with cross-park power exchange.
- Scenario 3: Optimizing based on the joint participation of the carbon market, green certificate market, and cross-park power exchange
5.2. Power Analysis
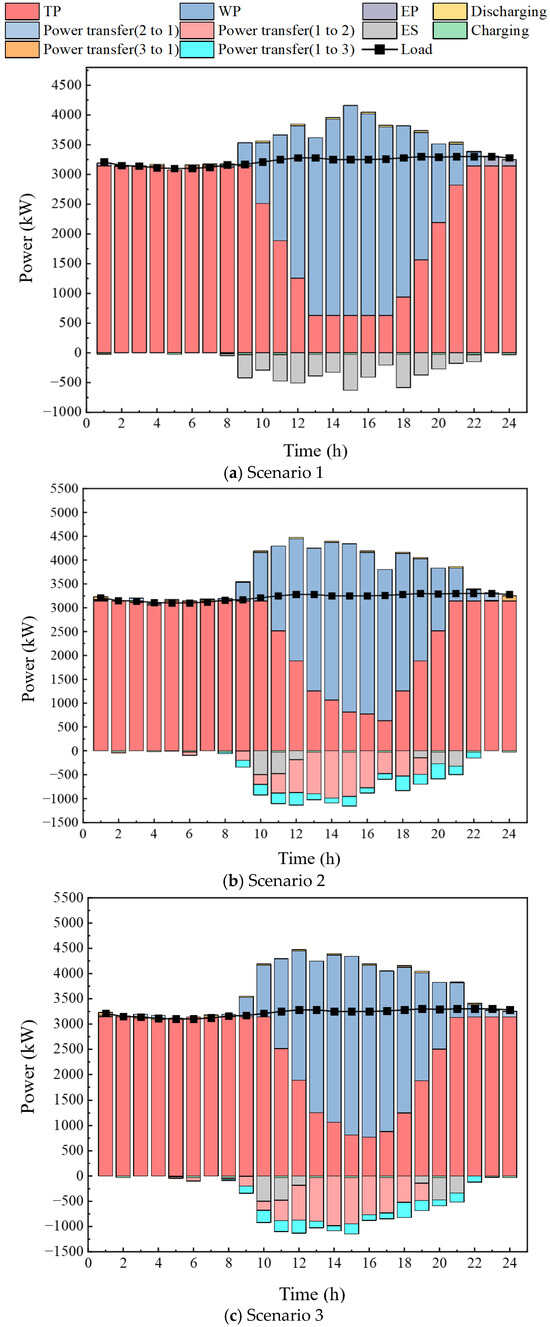
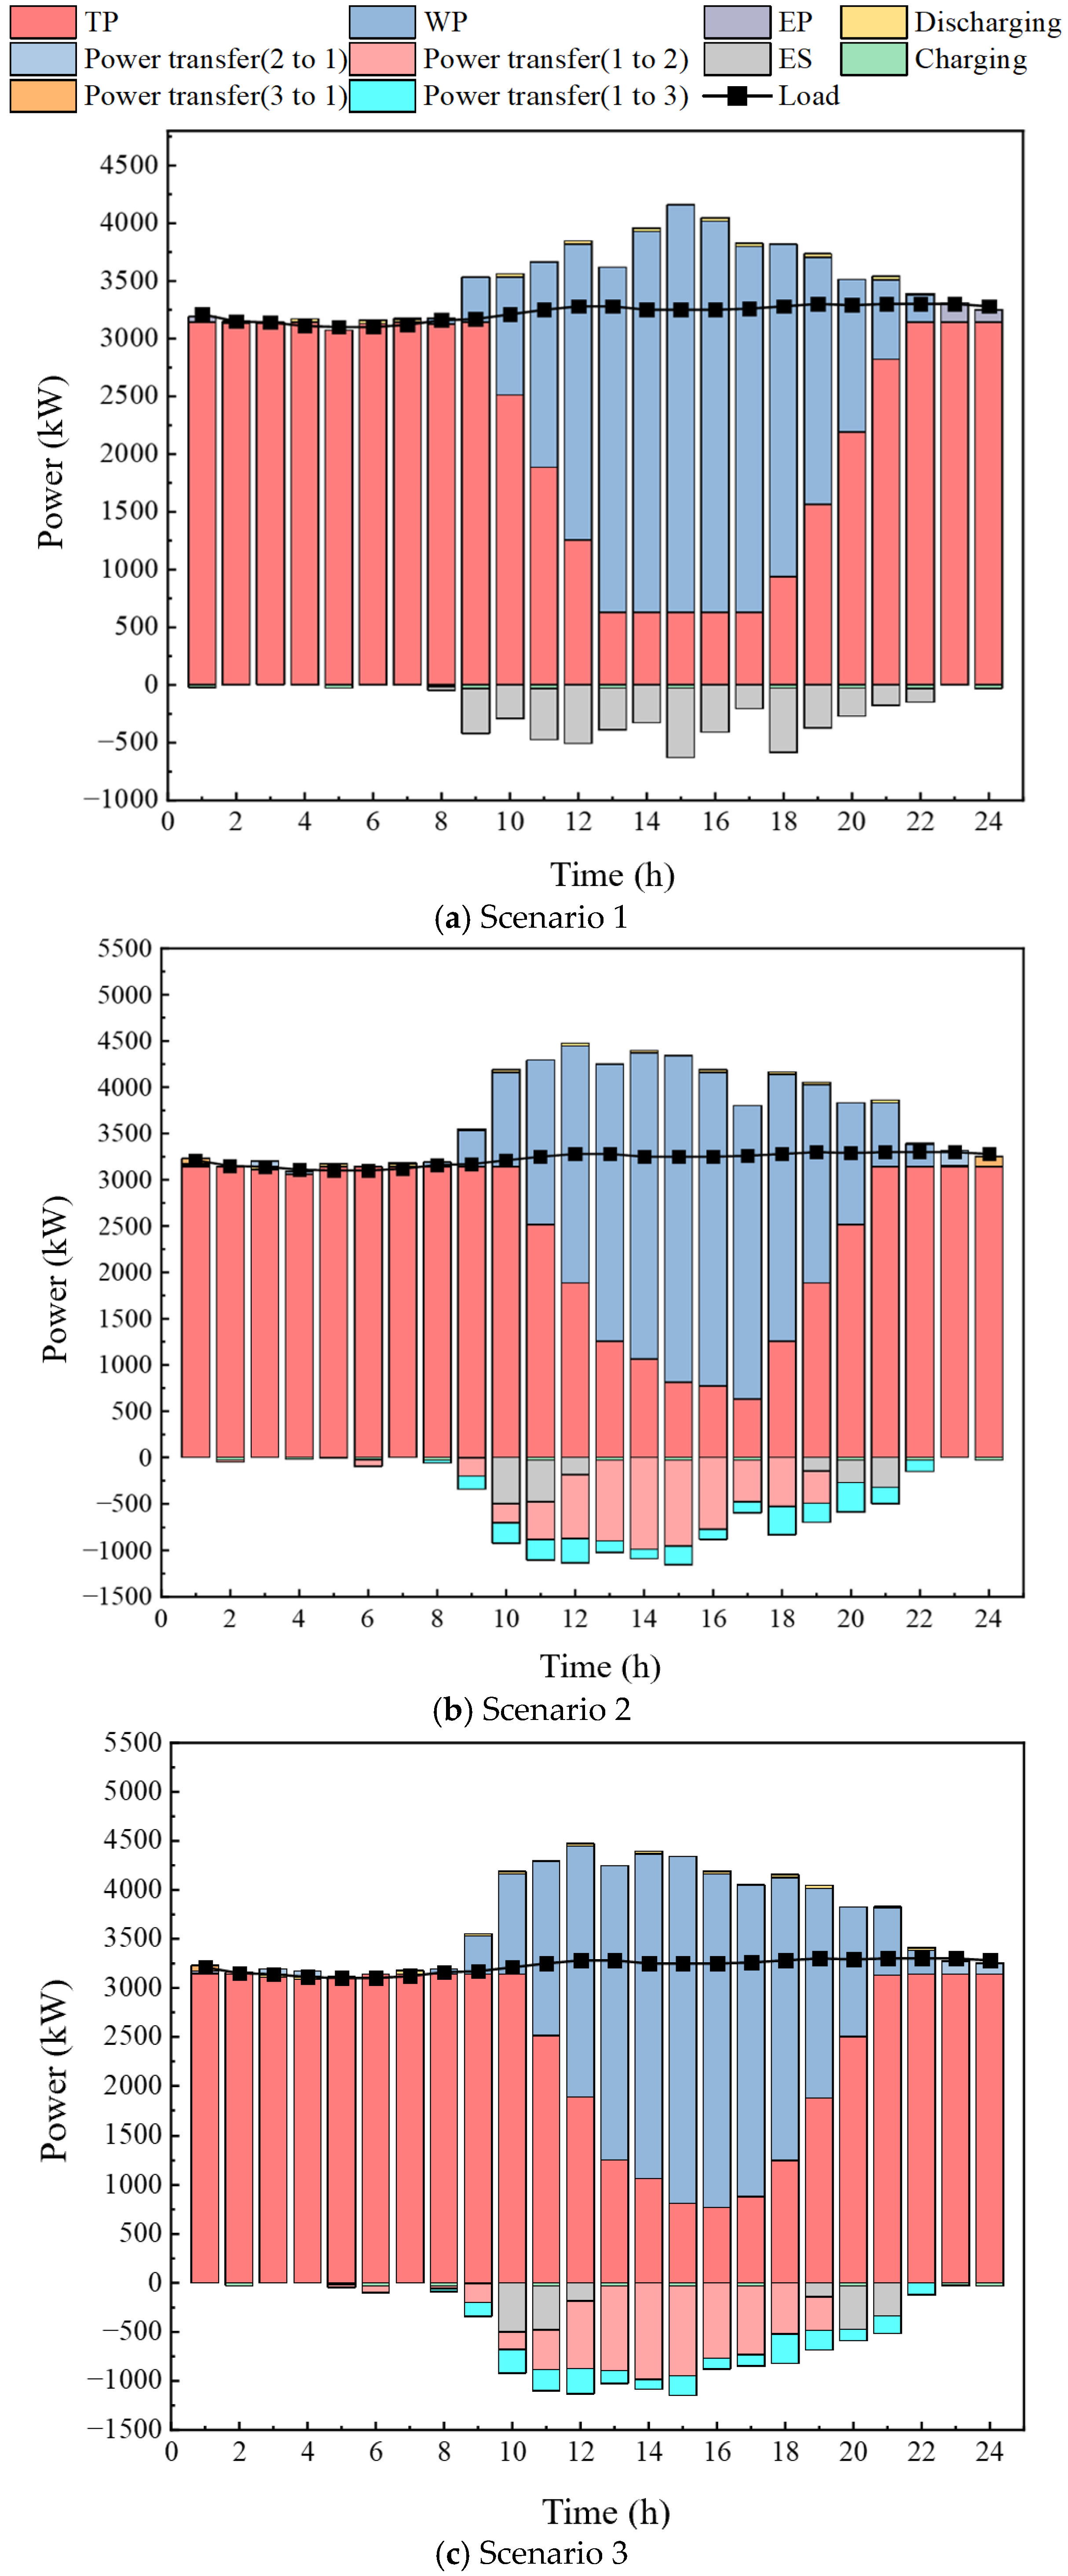
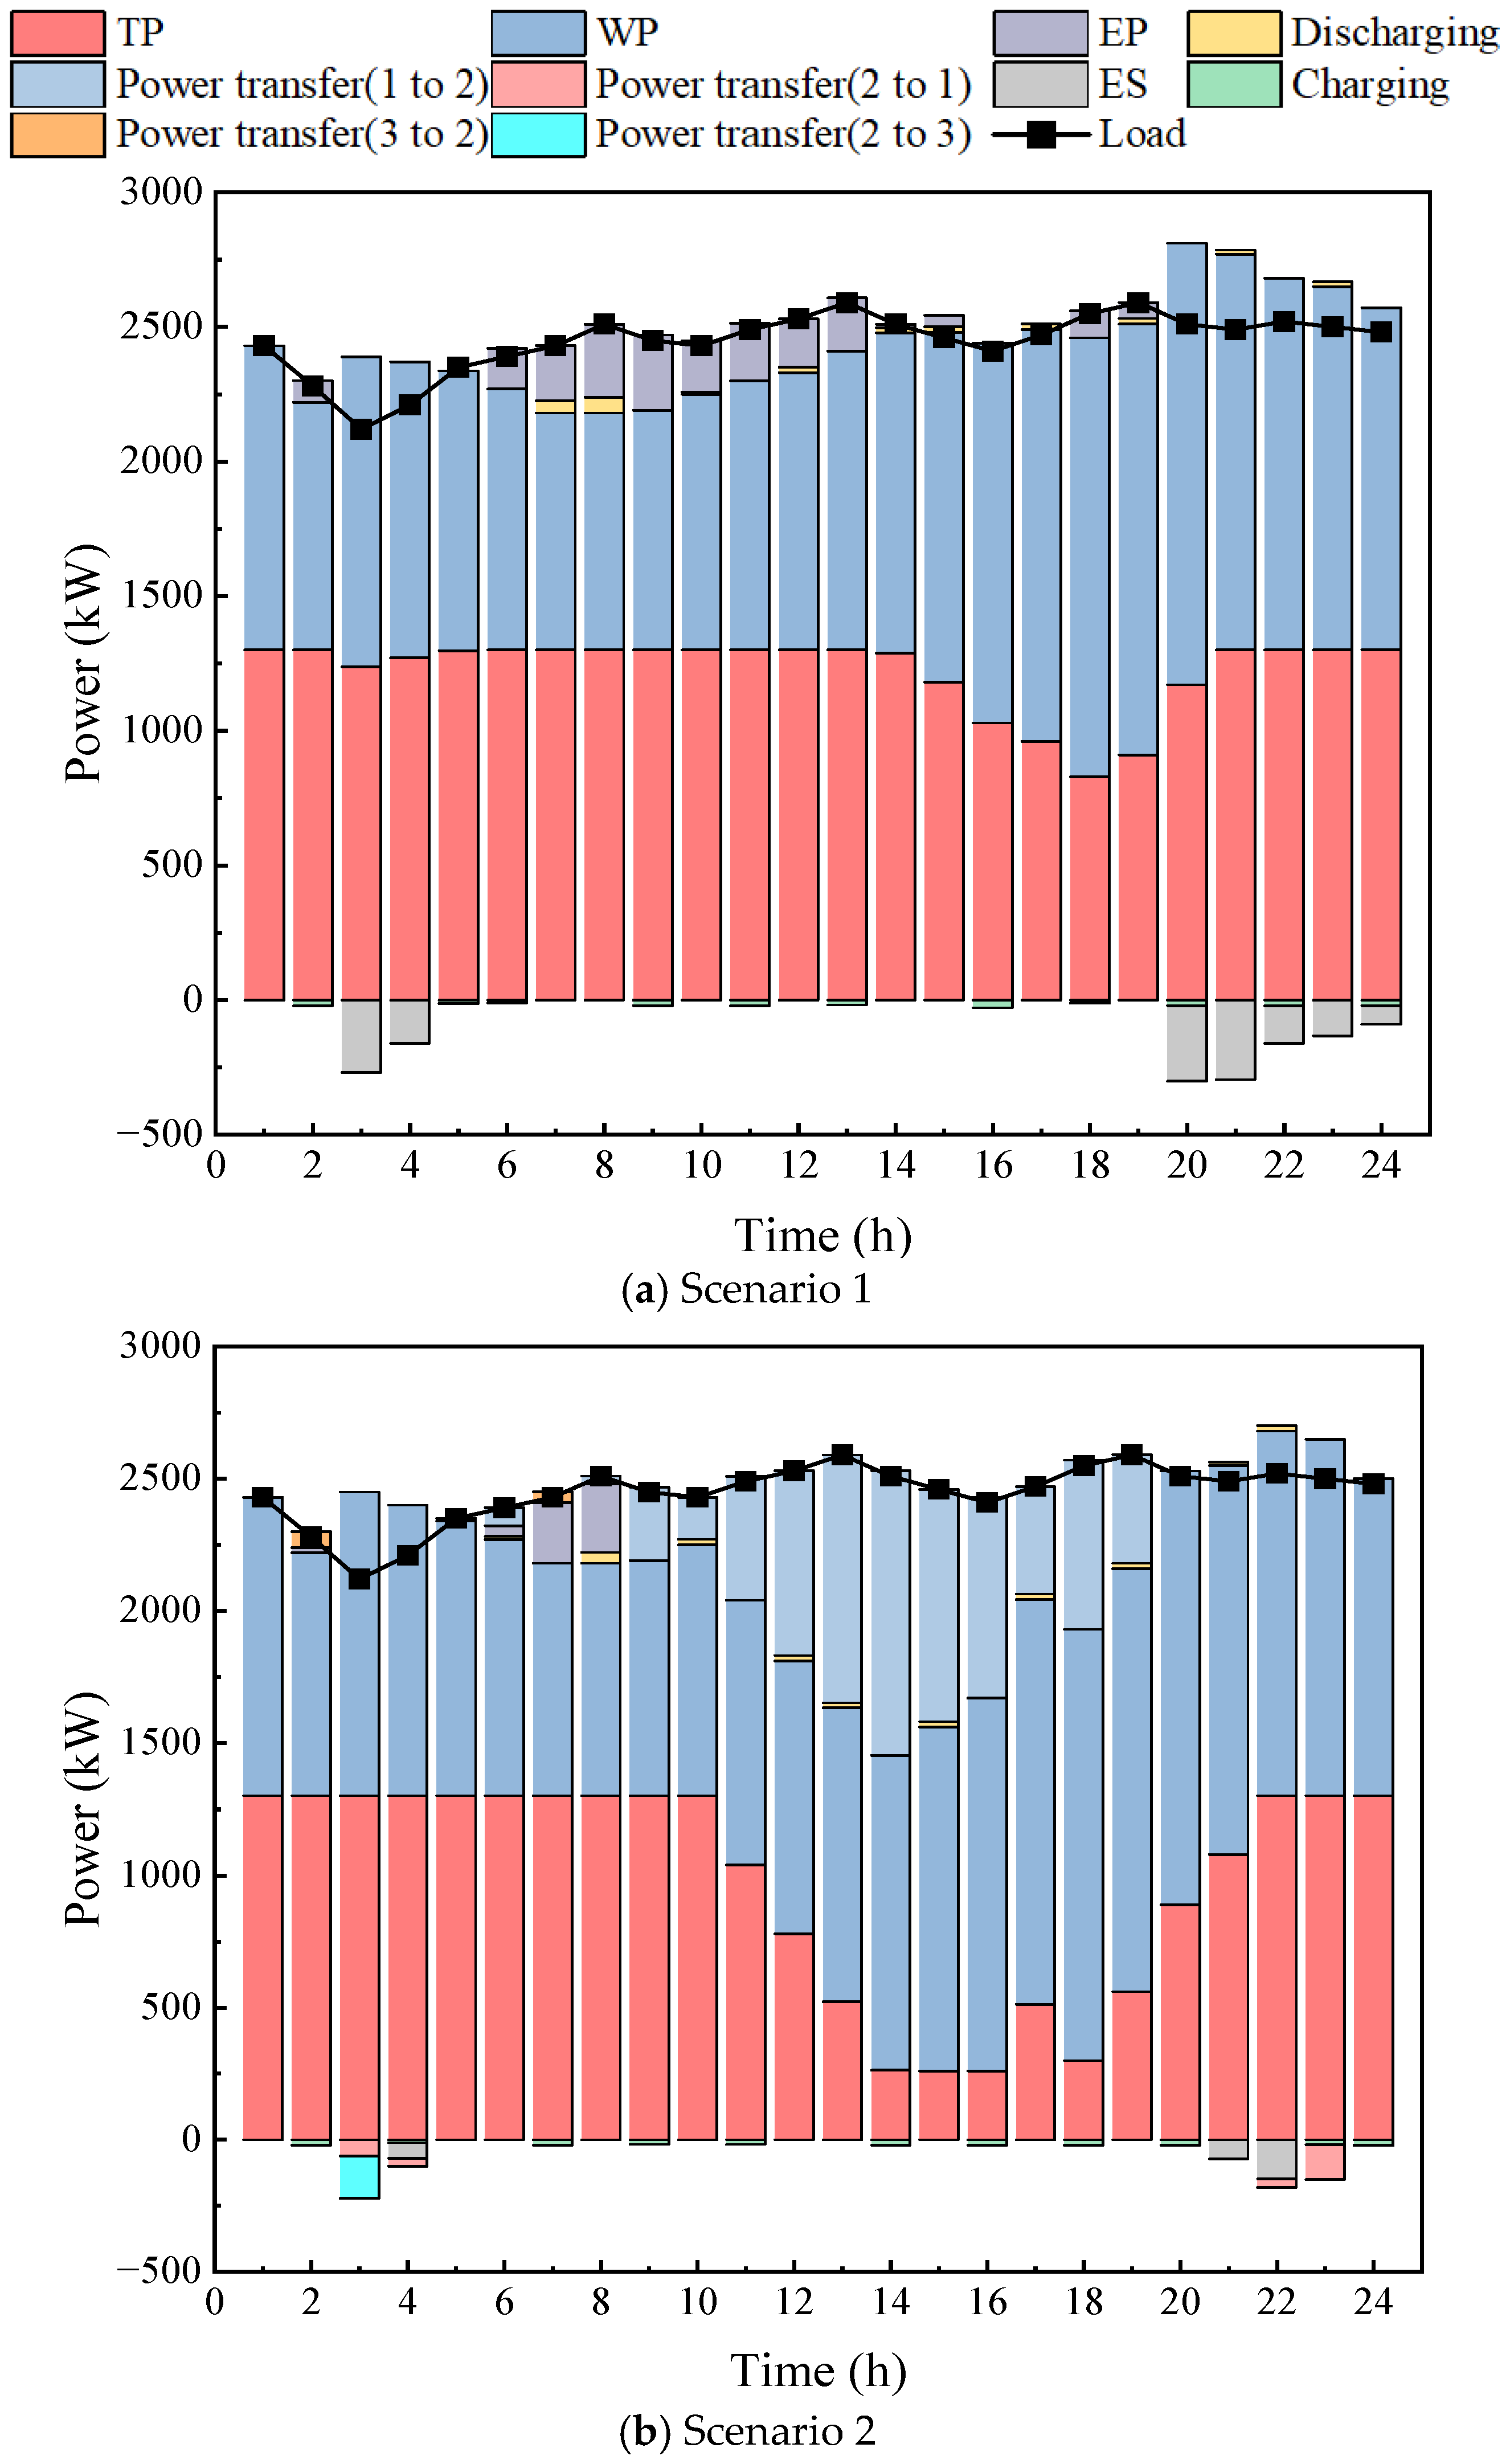
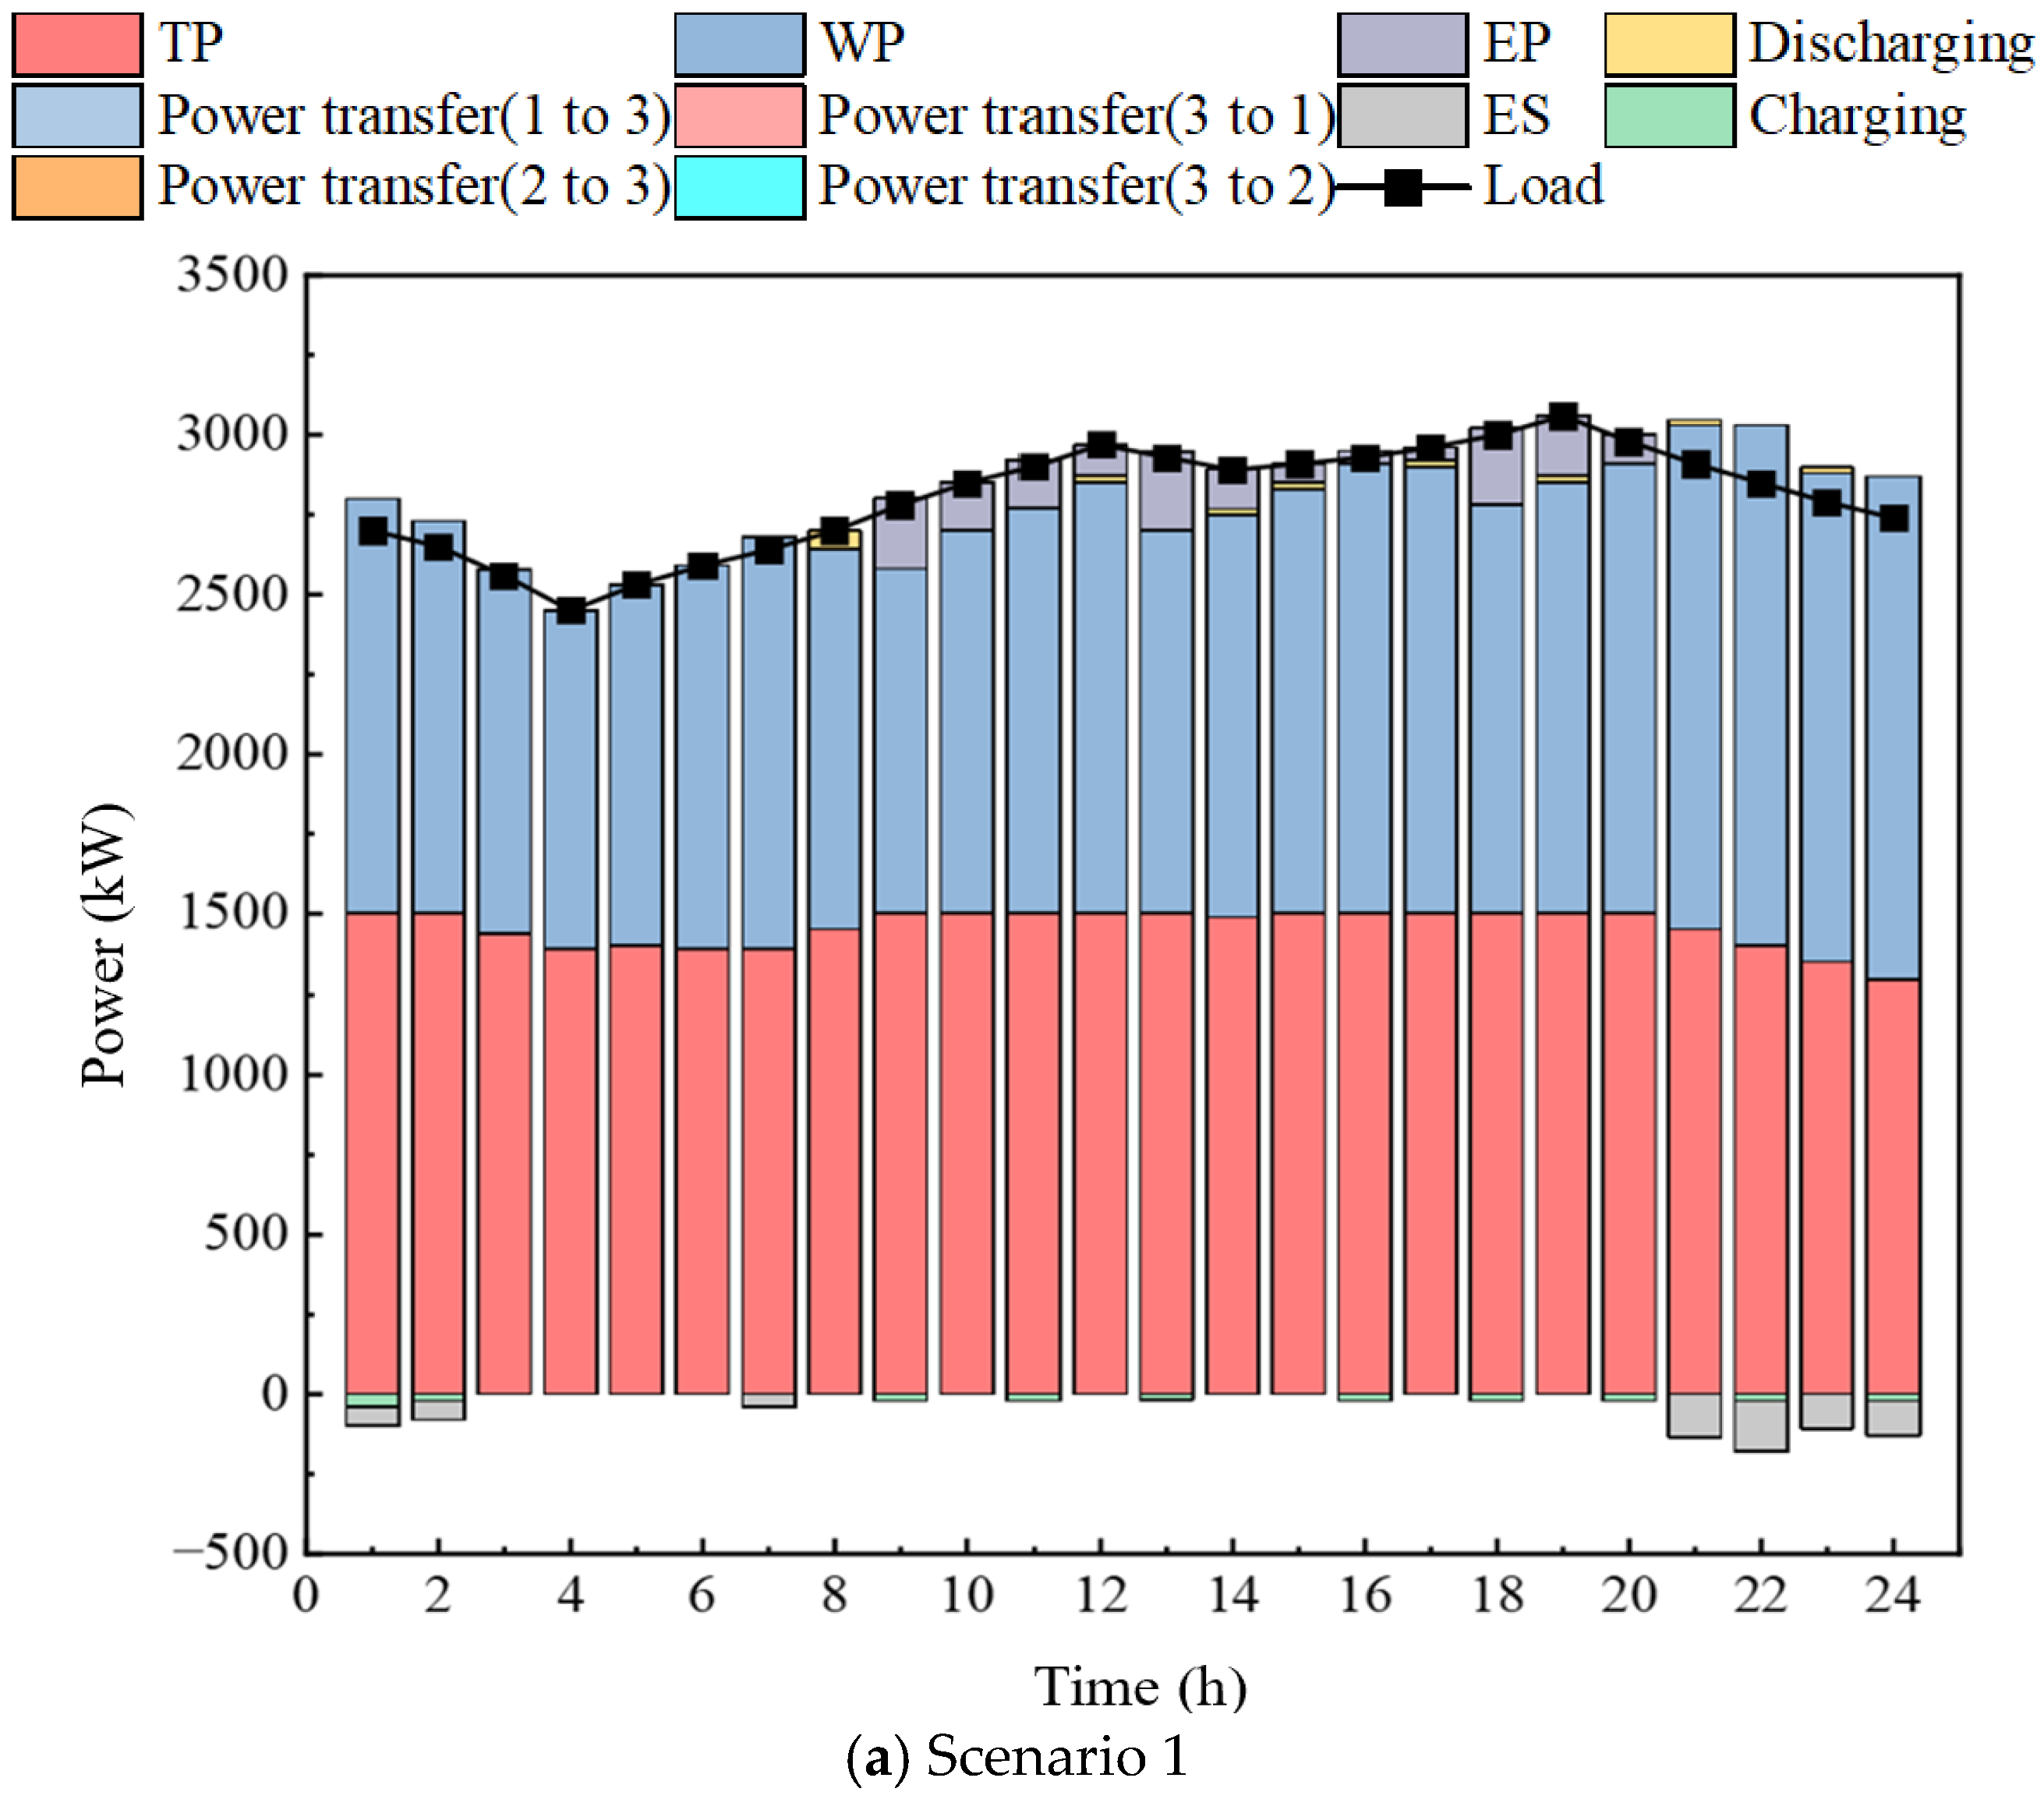
The power balance results of Park 1 under different scenarios are shown in Figure 5. Scenario 1 indicates that, under high renewable generation conditions, the system’s ability to absorb renewable energy remains insufficient. Compared with Scenario 1, Scenarios 2 and 3 allow Park 1 to participate in inter-park power exchange, through which excess photovoltaic power produced during the daytime is delivered to Parks 2 and 3. During nighttime periods without photovoltaic generation, Park 1 is able to receive surplus wind power from Parks 2 and 3, thus decreasing its electricity purchase and sale volumes.
Figure 5.
Power balance results of Park 1 under different scenarios.
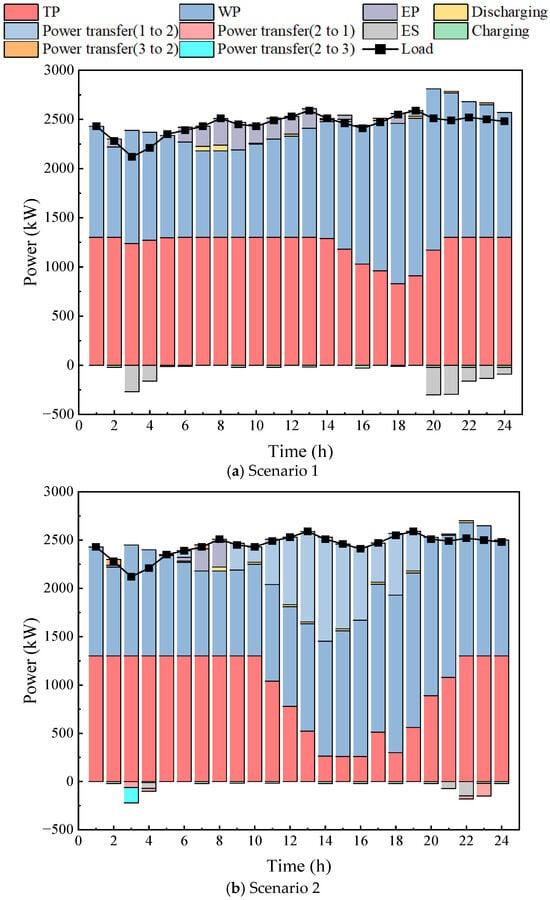
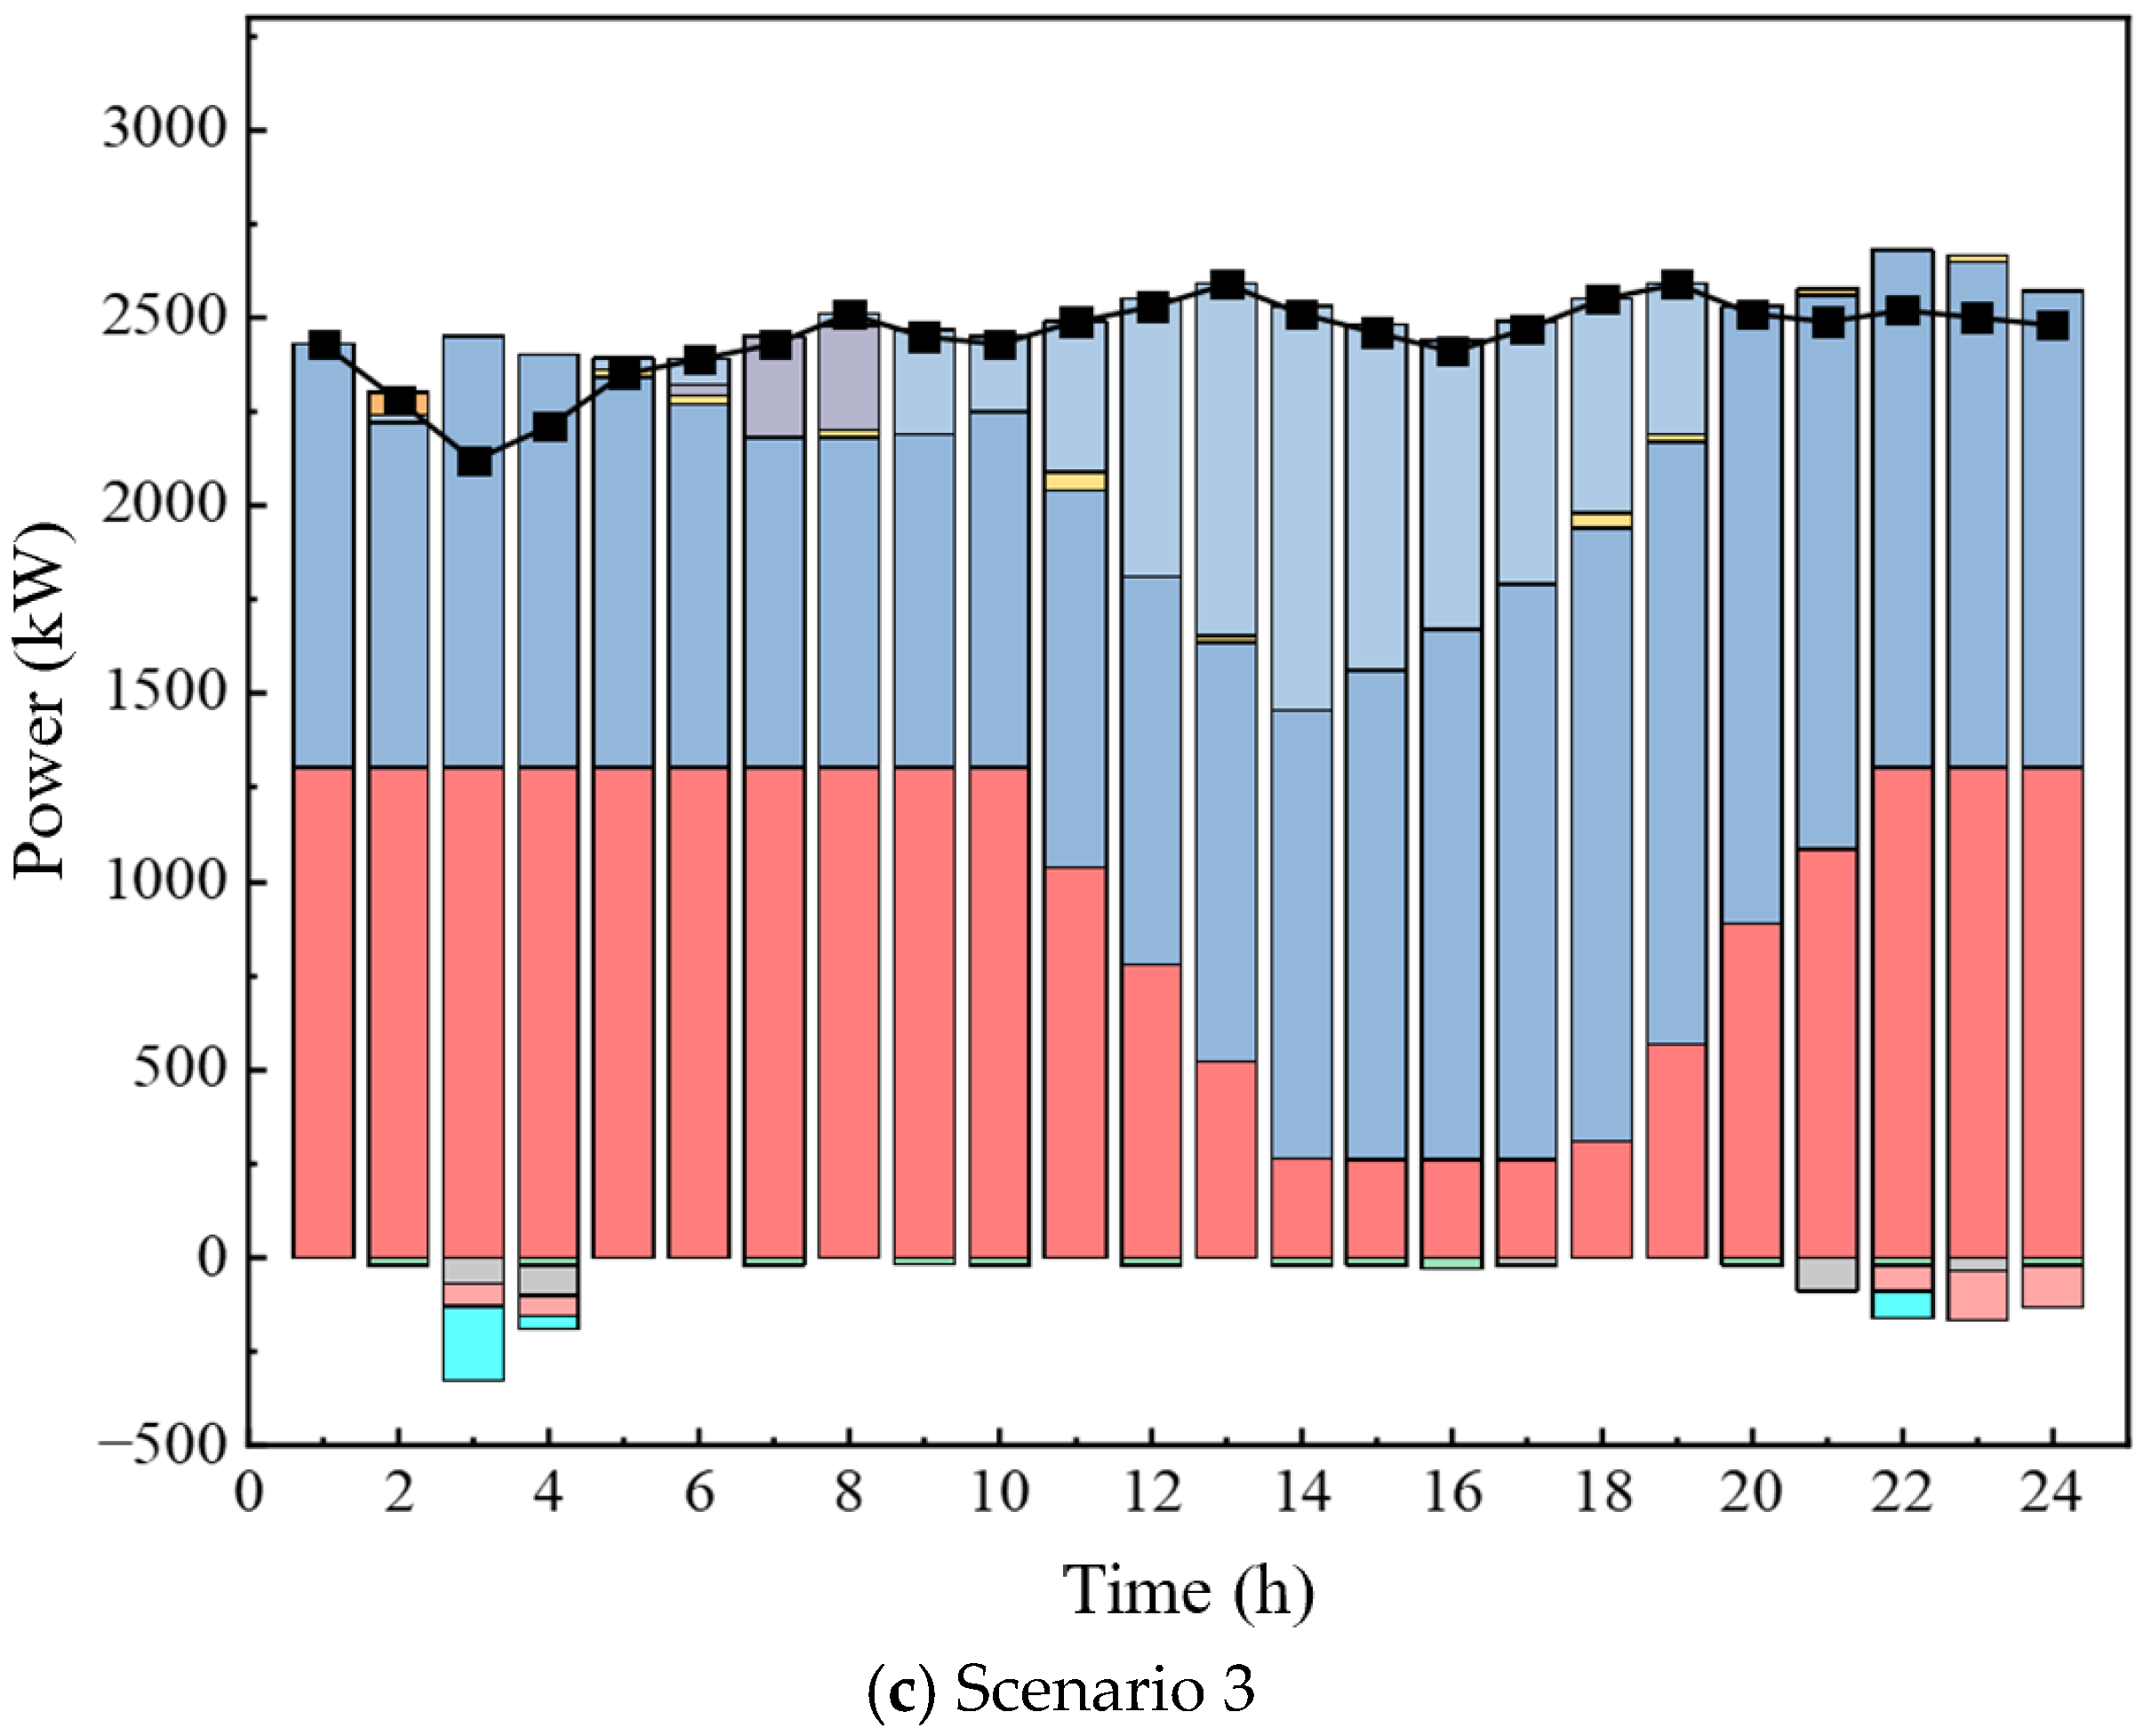
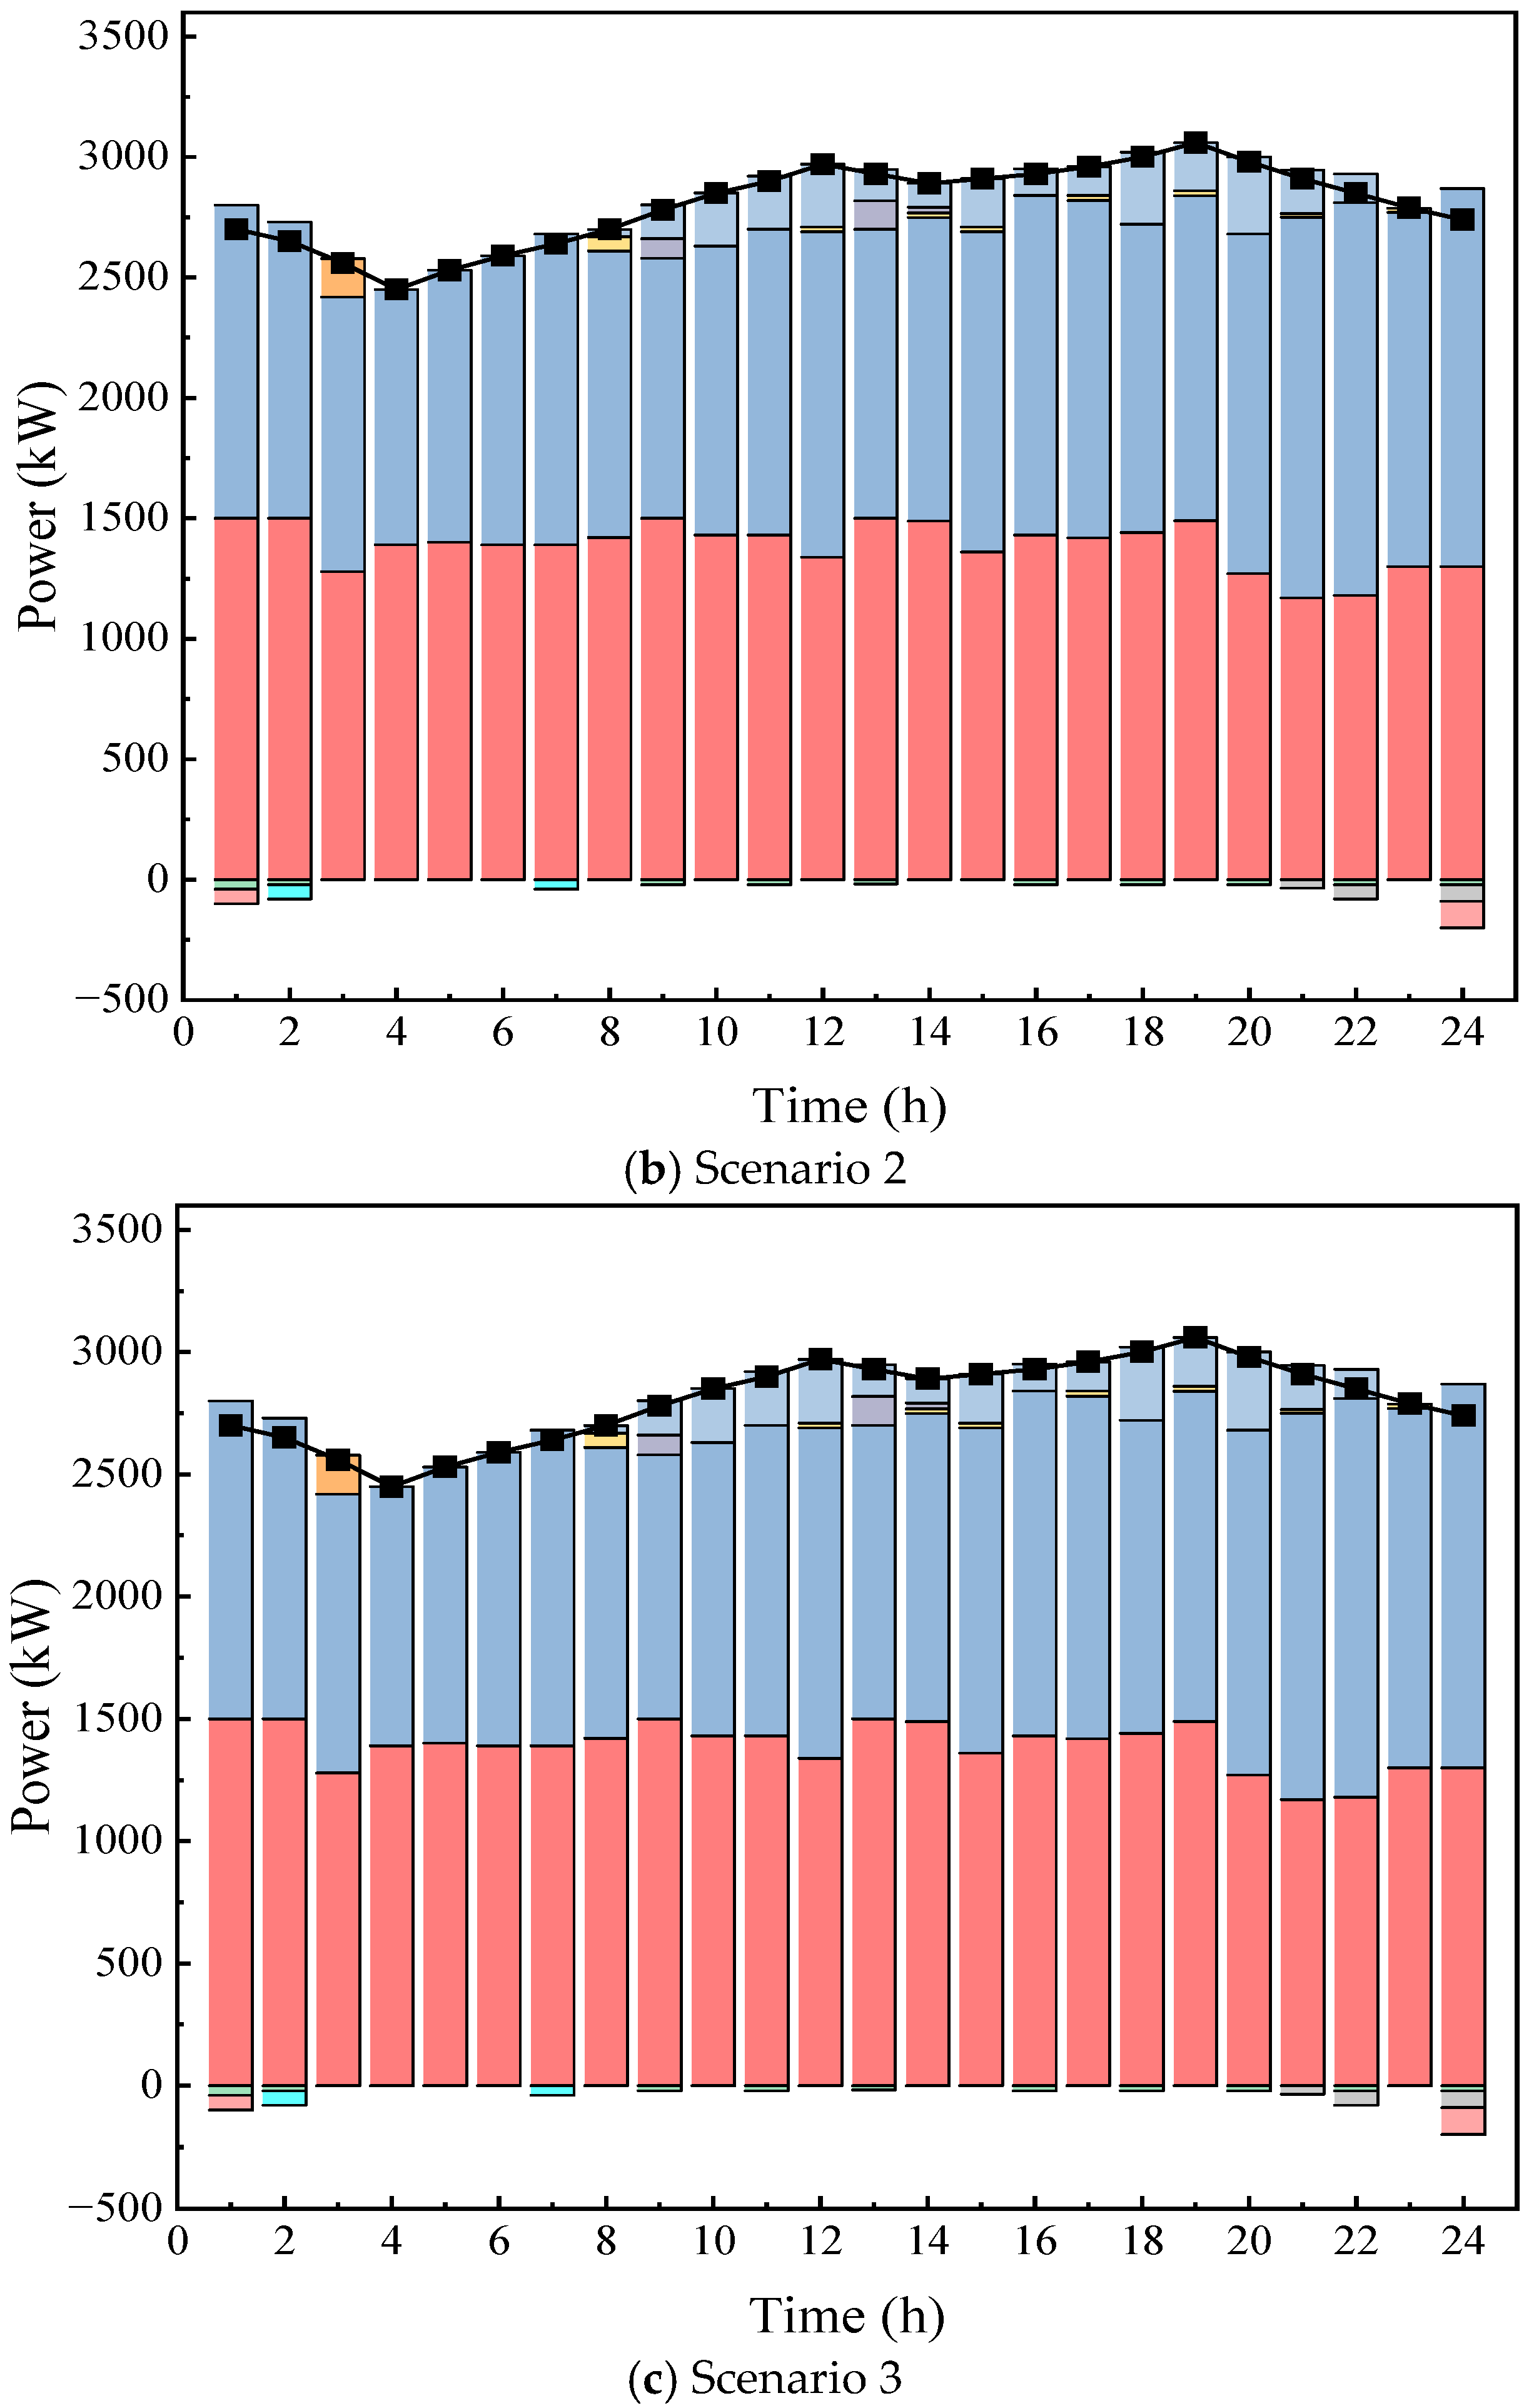
The power balance diagram of Park 2 under different scenarios is illustrated in Figure 6. In Scenario 1, where no power interaction is conducted, due to the limited absorption capacity of the energy storage system for new energy, the system relies on external electricity sales to absorb the surplus new energy output. Compared with Scenario 1, in Scenarios 2 and 3, when the wind power output of Park 2 is relatively small during the daytime, Park 2 can meet its load demand by relying on the surplus photovoltaic power from Park 1. During the early morning and late evening, when the wind power output is surplus, Park 2 conducts power interaction with Park 3, which reduces the electricity purchase and sales volume of Park 2, as well as the thermal power output, thereby lowering the power generation cost.
Figure 6.
Power balance results of Park 2 under different scenarios.
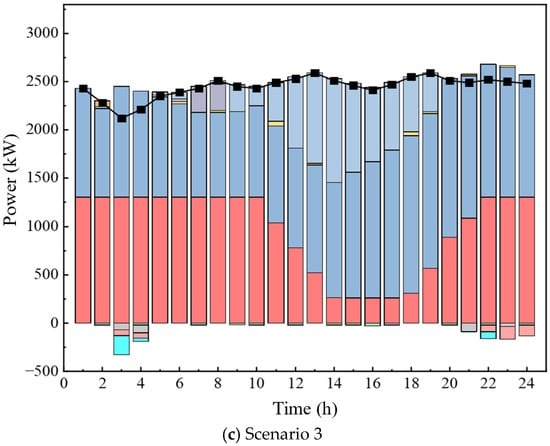
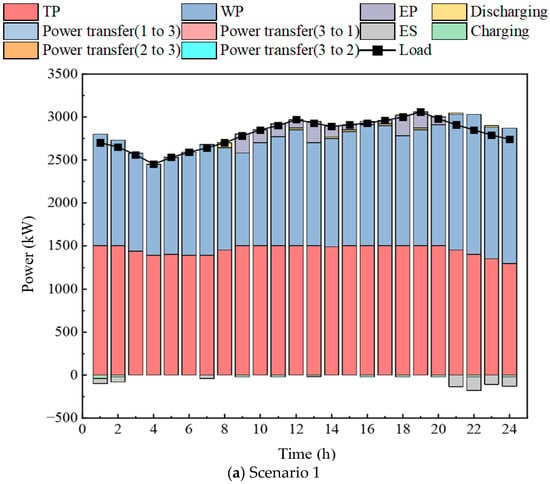
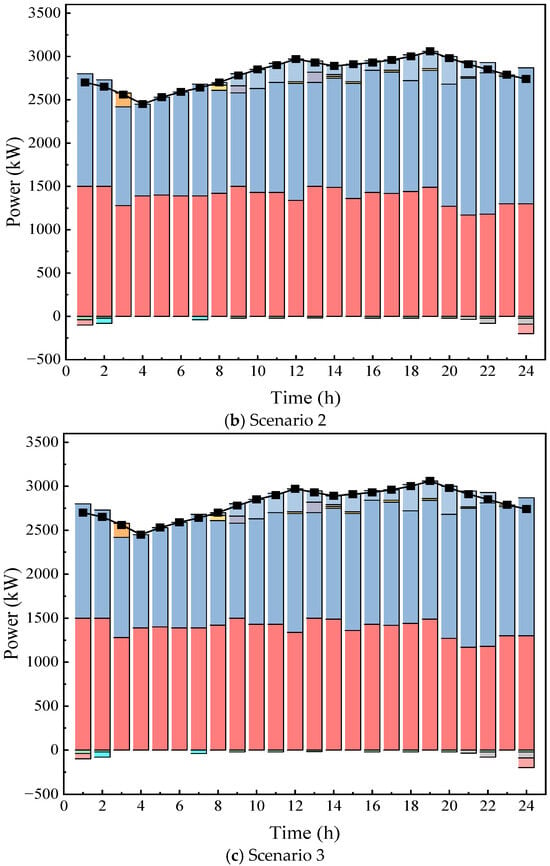
The power balance diagram of Park 3 under different scenarios is illustrated in Figure 7. Similarly, it can be observed that without power interaction in Scenario 1, the system has poor absorption capacity for surplus new energy. In Scenarios 2 and 3, after Park 3 conducts power interaction with Parks 1 and 2, the purchase volume, sales volume, and thermal power unit output of Park 3 all decrease, which not only reduces the power generation cost but also improves energy utilization efficiency.
Figure 7.
Power balance results of Park 3 under different scenarios.
The power balance results further reveal the operational mechanism of the proposed cross-park dispatch strategy. In Scenario 1, each park mainly relies on its own local generation and transactions with the retailer, which limits the utilization of surplus renewable power. In contrast, Scenarios 2 and 3 enable inter-park P2P power exchange. During daytime periods, surplus PV power from Park 1 can be transferred to wind-dominated parks, while during nighttime and low-PV periods, surplus wind power from Parks 2 and 3 can support Park 1. This bidirectional power interaction reduces the dependence on thermal generation and external electricity purchases. Therefore, the cost reduction is not only caused by price differences but also by the temporal complementarity between PV and wind generation and the coordinated use of flexible resources.
5.3. Economic Analysis
5.3.1. Cost Optimization Analysis
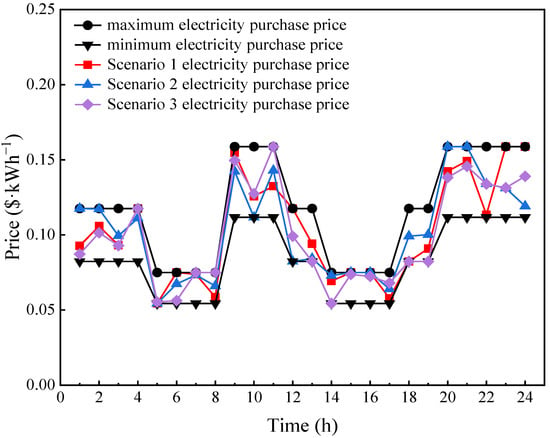
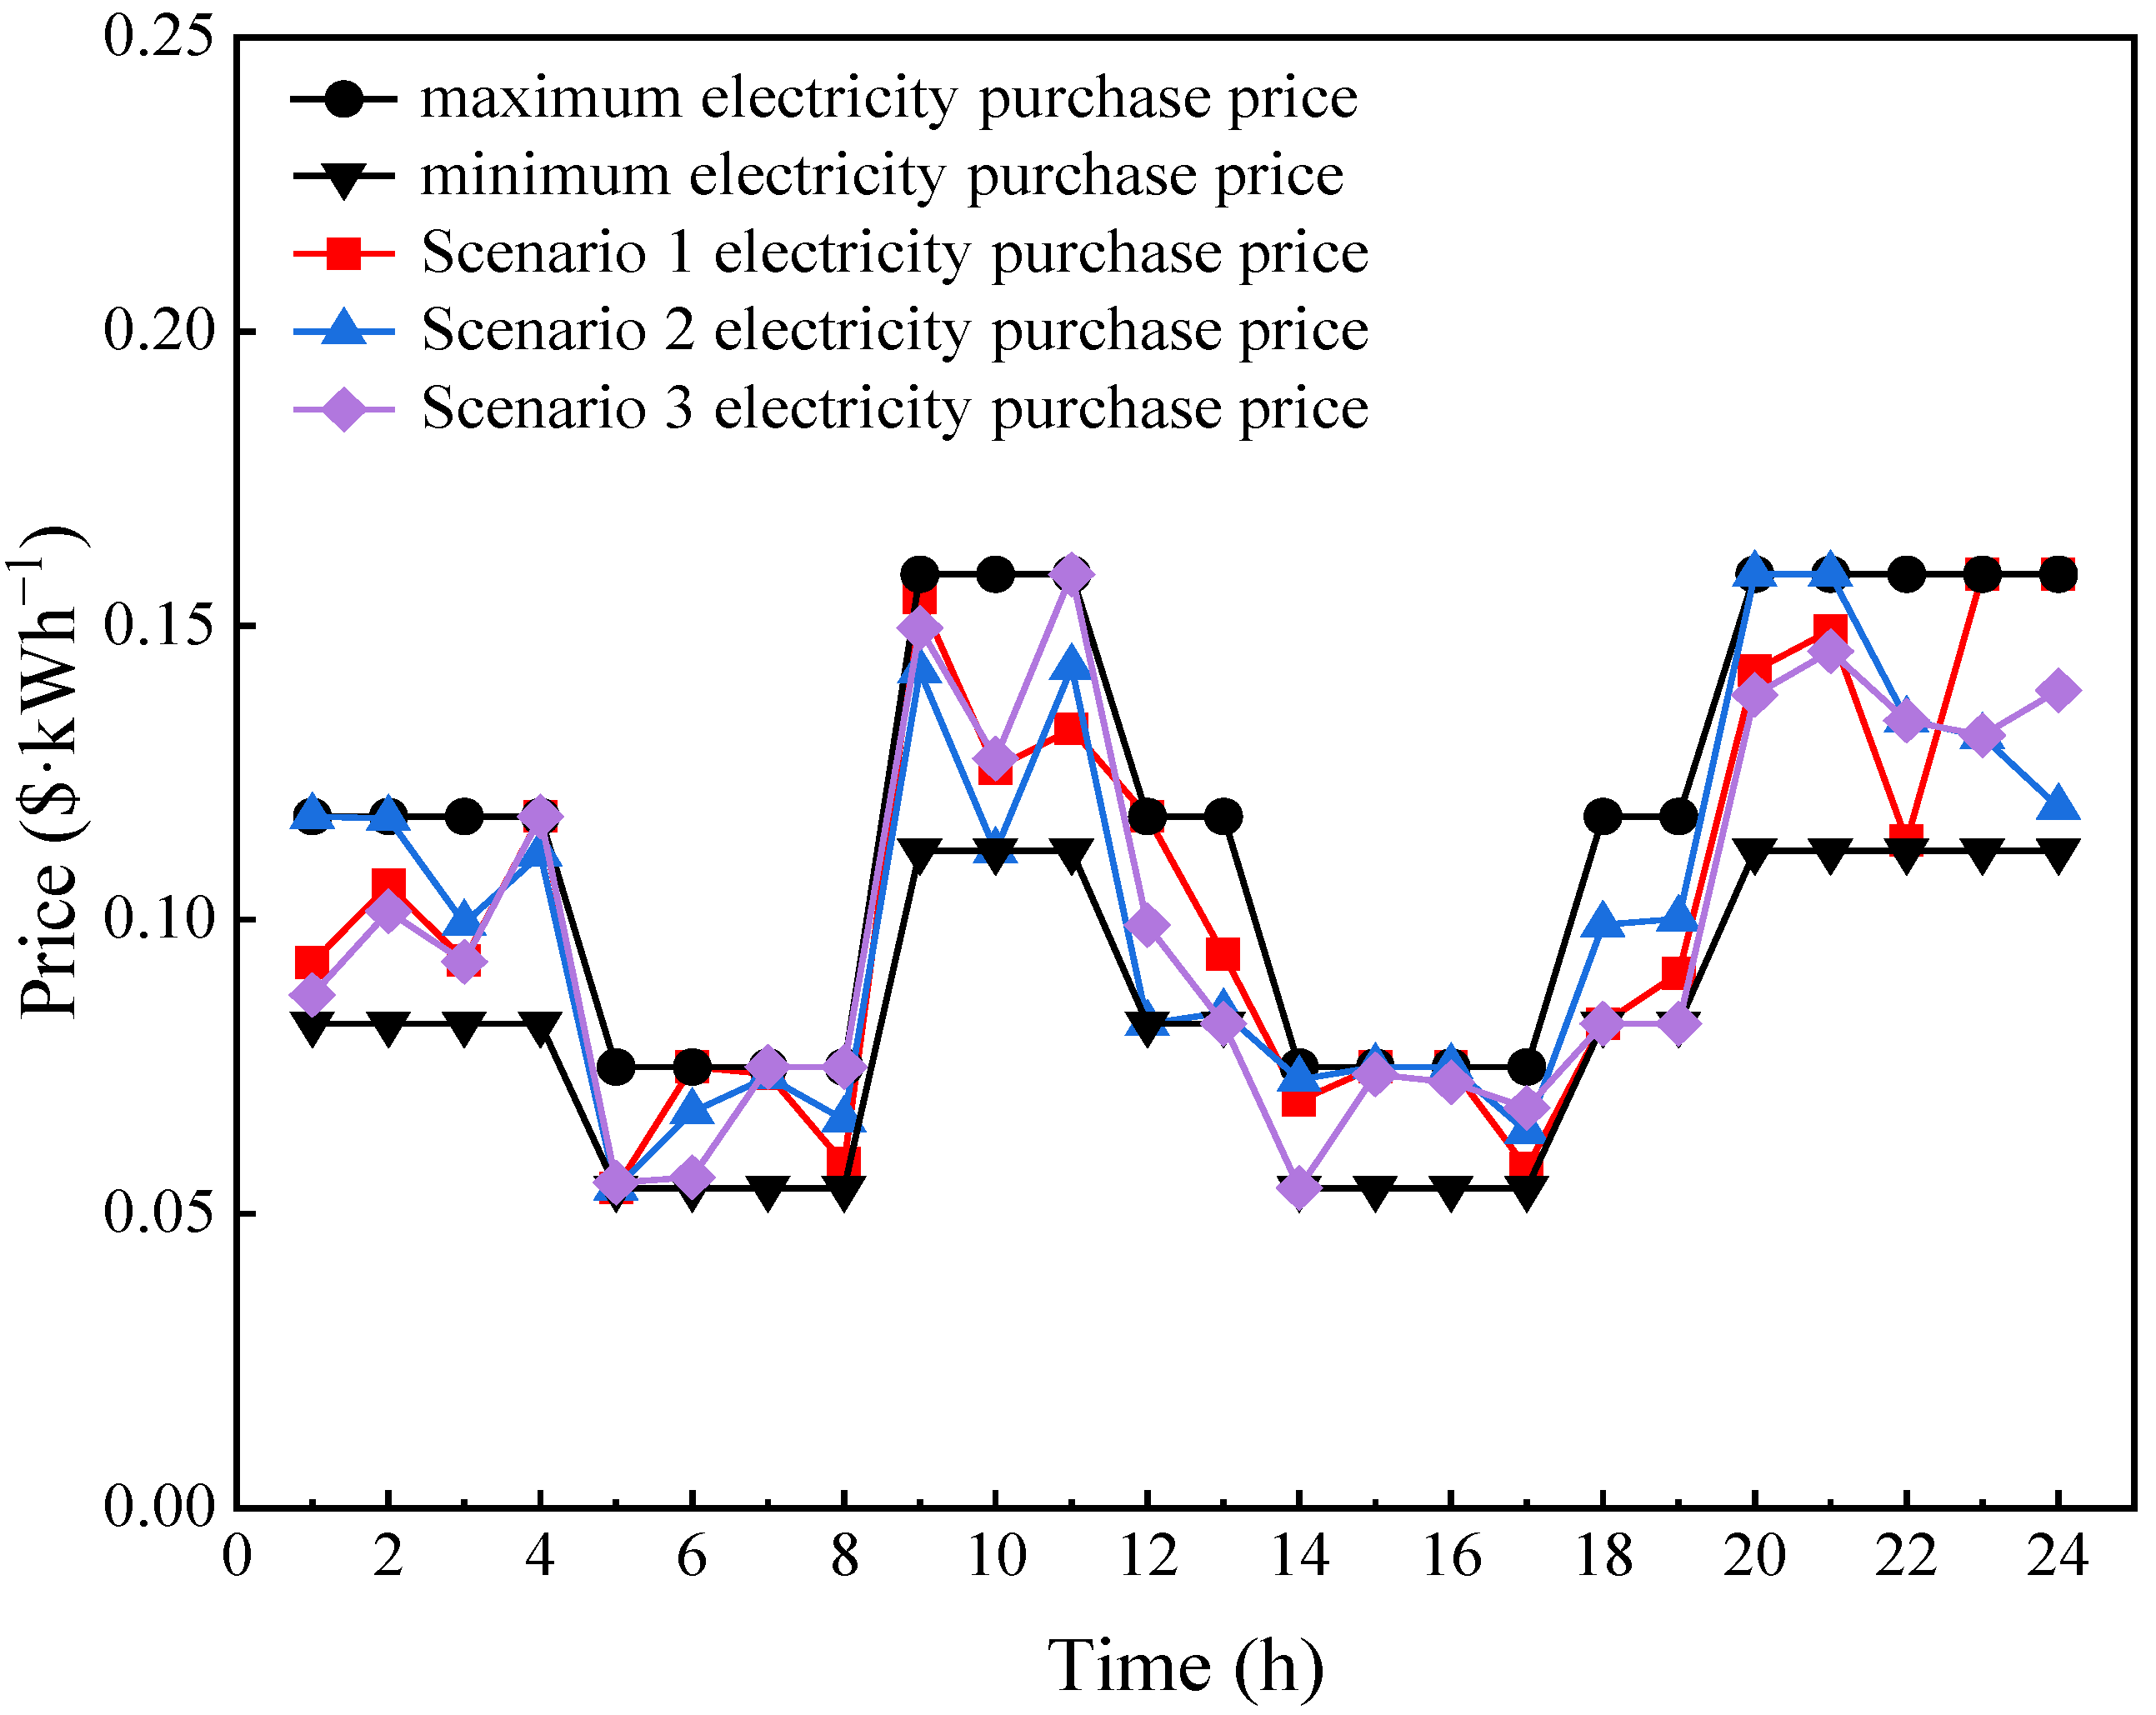
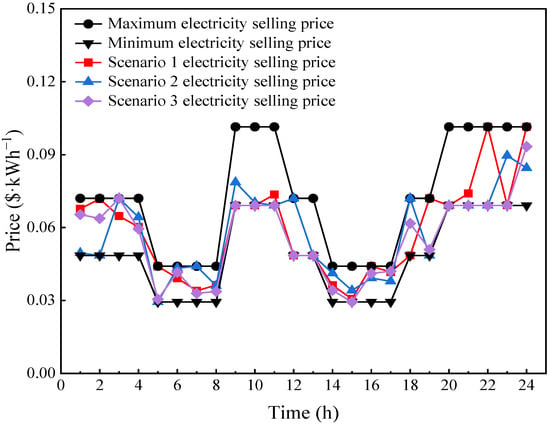
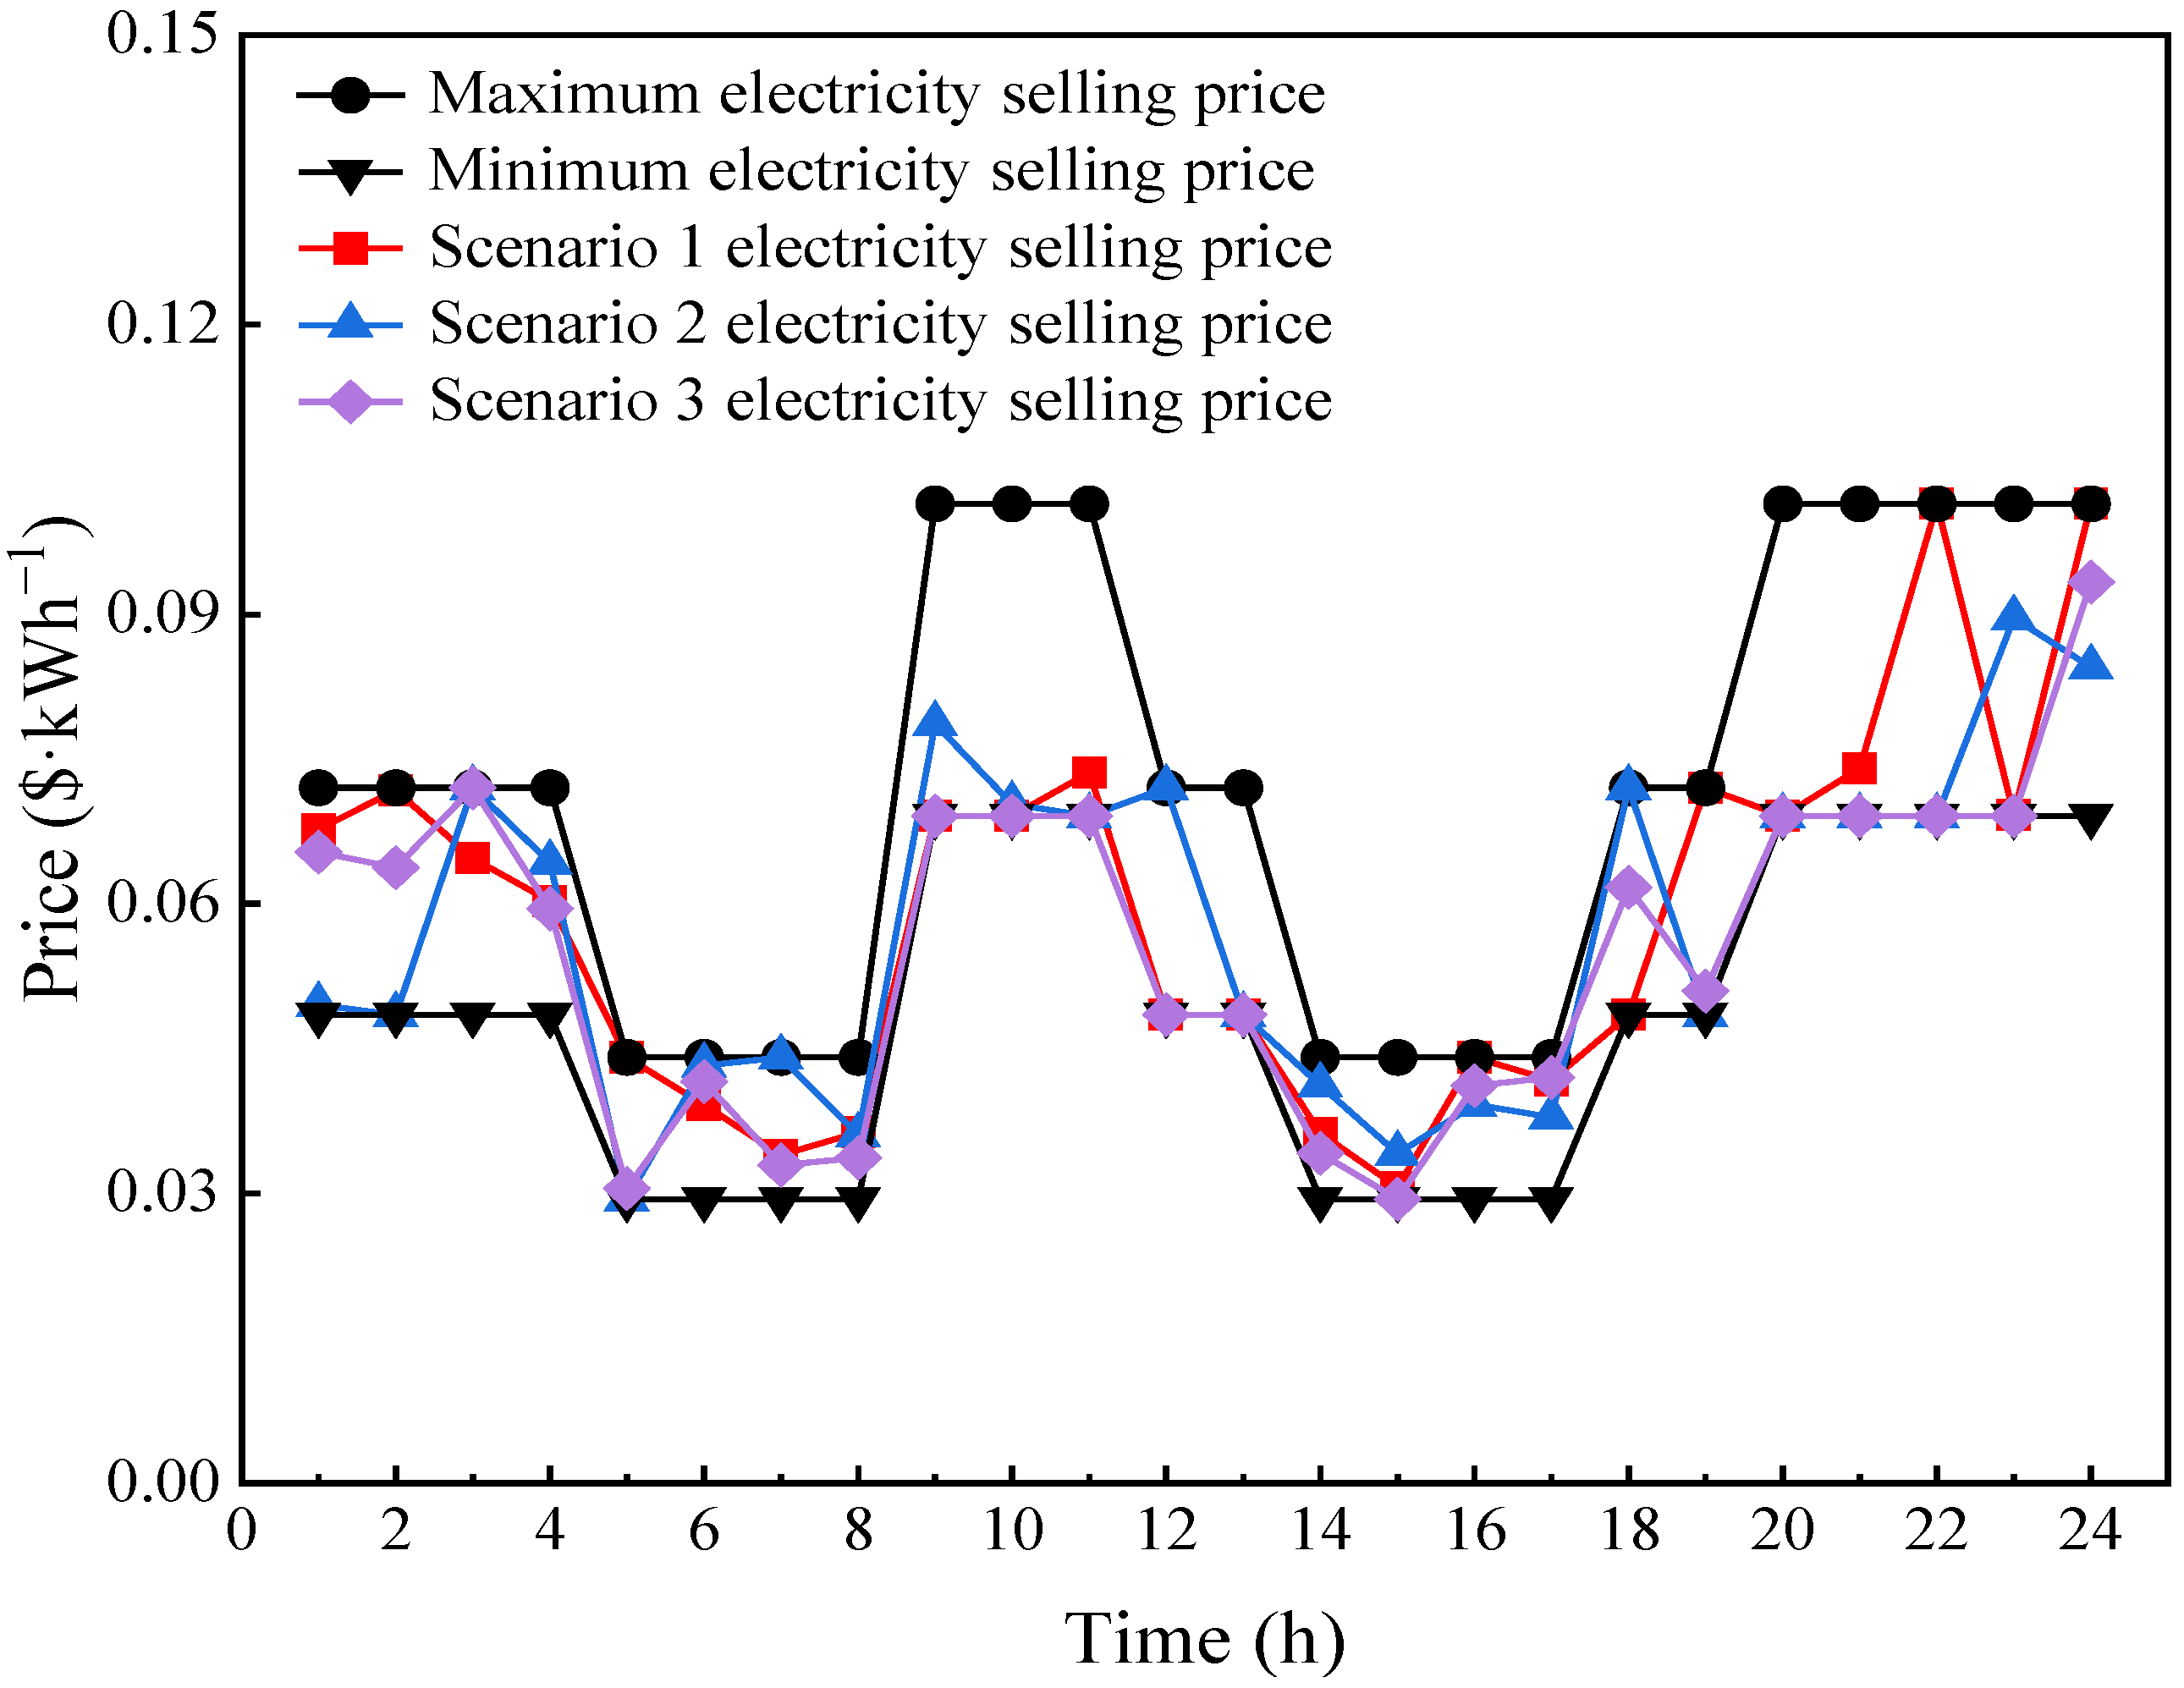
The electricity purchase price and electricity sales price under different scenarios are shown in Figure 8 and Figure 9, respectively. Combined with the power balance diagrams, it can be seen that in Scenarios 2 and 3, during the periods of 1:00–2:00 and 7:00–8:00 when there is electricity purchase demand, the average electricity price set by the power retailer is higher than that in Scenario 1 to obtain higher returns. During the main electricity sales periods of 10:00–12:00 and 20:00–22:00, the average electricity price set by the power retailer is lower than that in Scenario 1 to reduce the electricity purchase cost.
Figure 8.
Electricity purchase prices in different scenarios.
Figure 9.
Electricity selling prices in different scenarios.
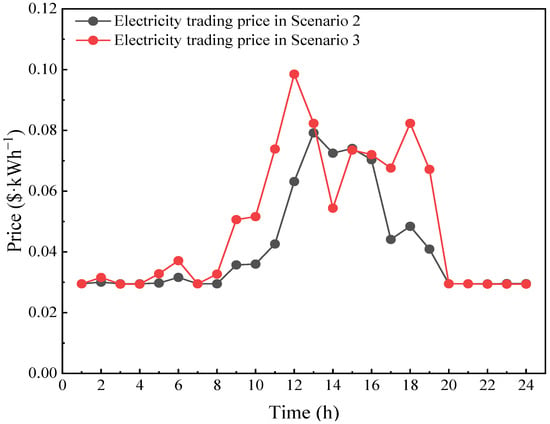
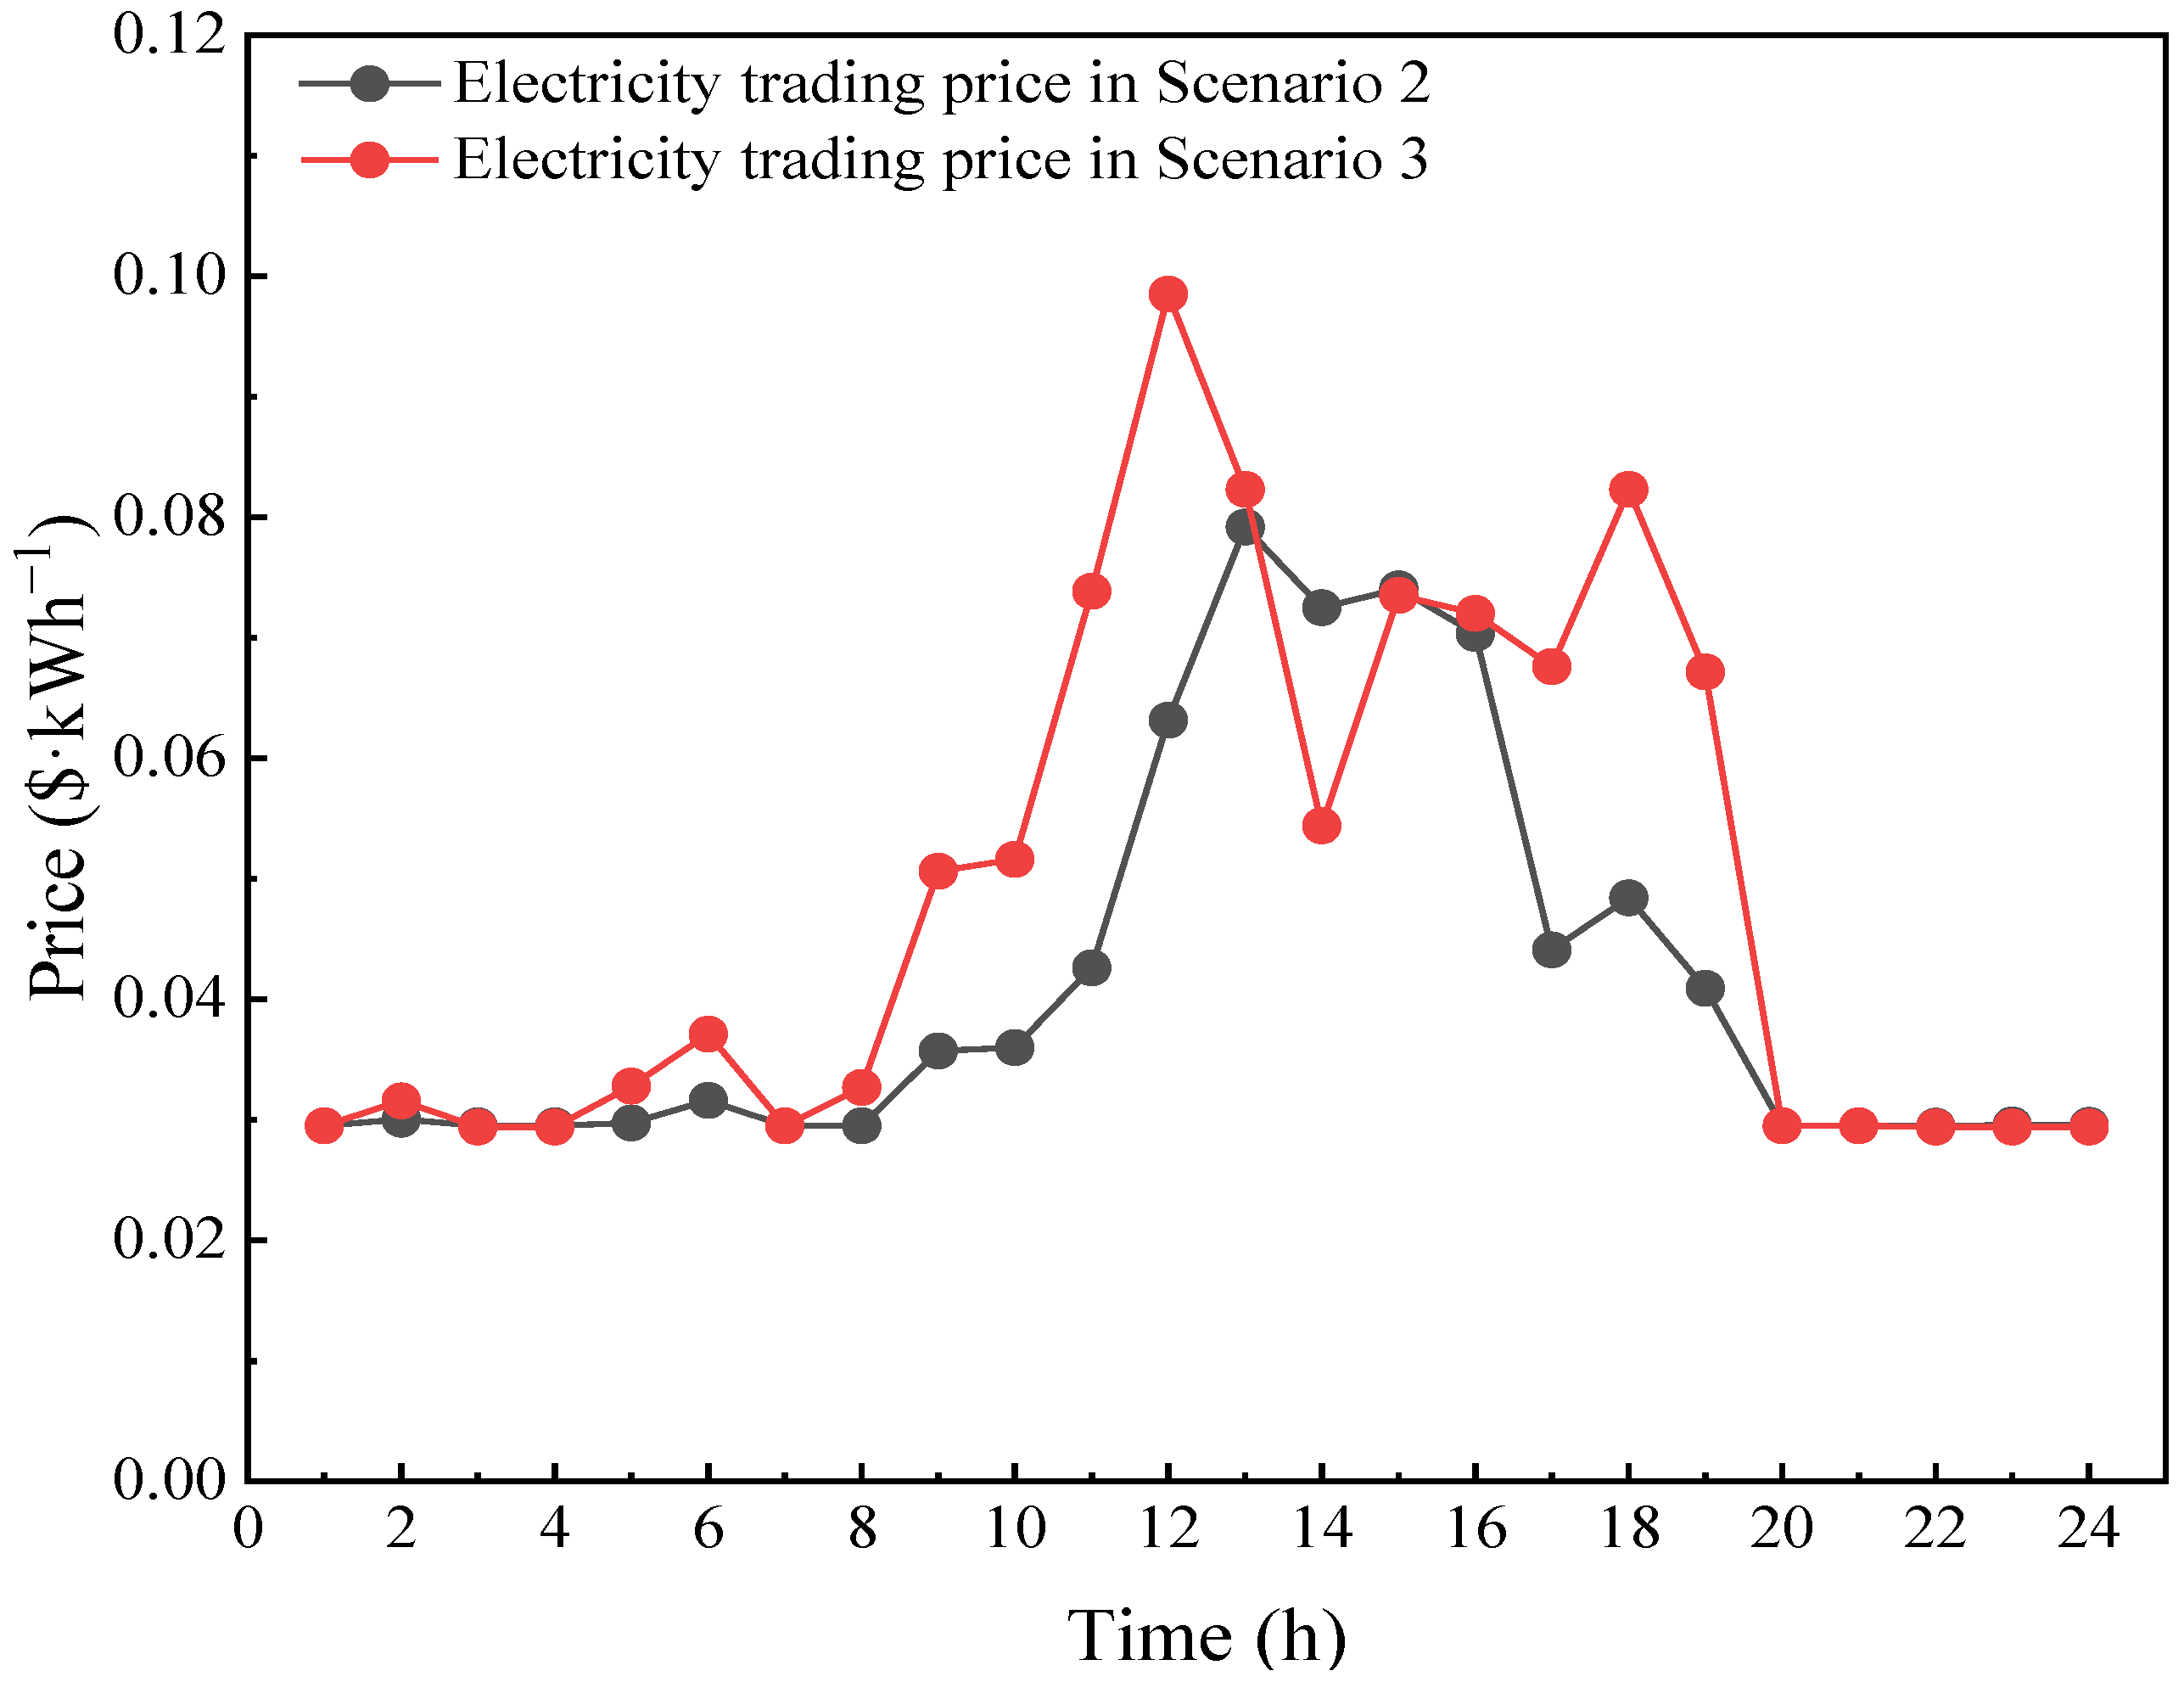
The interaction electricity prices in Scenarios 2 and 3 are shown in Figure 10. The interaction electricity price exhibits an upward trend followed by a downward trend. The interaction electricity prices in Scenarios 2 and 3 are lower than the electricity purchase price set by the power retailer, which enables effective power interaction between the parks and further reduces the power generation cost.
Figure 10.
Cross-park interactive electricity price.
The revenues of electricity retailers and the operational costs of each park under different scenarios are summarized in Table 5. A comparative analysis reveals that in Scenario 2, the implementation of inter-park power interaction reduces the parks’ dependence on electricity retailers, leading to a decline in retailer profits. Following this interaction, the total system cost decreased by 5.29%. Notably, the generation cost for Park 1 increased because its surplus power was diverted to inter-park trading rather than being sold back to the grid.
Table 5.
Revenue of power grid operators in various scenarios and costs in different regions.
With the introduction of green certificate trading (GCT), renewable energy generation yields additional revenue, further optimizing system economics. Consequently, the total system cost in Scenario 3 decreased by 7.4% compared to Scenario 2 and 12.69% compared to Scenario 1. As illustrated in Figure 3, despite Park 1 contributing a significant volume of electricity during interactions, its individual cost remained high. To address this, asymmetric bargaining was employed to redistribute benefits based on the functional roles of each park. Post-redistribution, the costs for Park 1 in Scenarios 2 and 3 were reduced by 9.17% and 10.34%, respectively. Although certain parks incur higher costs after the redistribution of collaborative gains, their final costs remain lower than those under standalone operation, thereby ensuring a robust participation incentive.
These results suggest that the proposed framework can support multi-park energy management in two ways. First, inter-park power exchange reduces reliance on external retailers by utilizing the temporal complementarity of photovoltaic and wind power. Surplus renewable power from one park can be consumed by another park with power shortages. Second, carbon–green certificate trading enables renewable generation to be valued not only for electricity production but also for its carbon reduction and green certificate benefits. Therefore, the framework can coordinate energy sharing and low-carbon market participation simultaneously.
5.3.2. Carbon and Green Certificate Trading Costs Analysis
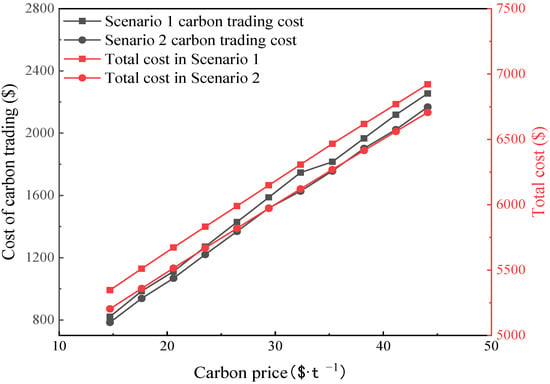
The relationship between carbon price, carbon trading costs, and total costs is illustrated in Figure 11. At lower carbon prices, carbon trading costs remain relatively modest. However, as the carbon price escalates, the total costs for both Scenario 1 and Scenario 2 exhibit a clear upward trend, as higher prices increase the expenditure required to purchase carbon quotas. Because inter-park power interaction effectively reduces carbon emissions, both the total cost and the carbon trading cost in Scenario 2 remain consistently lower than those in Scenario 1.
Figure 11.
The relationship between carbon price and carbon trading cost and total cost.
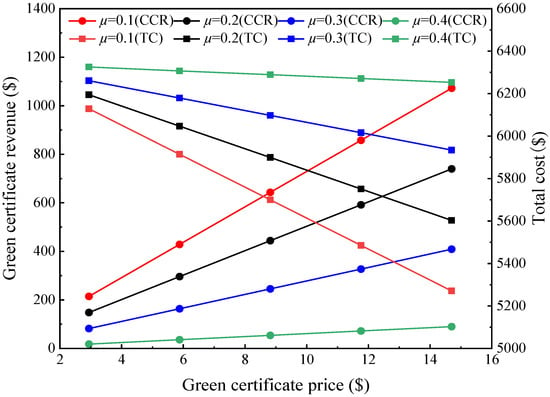
Figure 12 illustrates the relationship between green certificate (GEC) prices, GEC revenues, and system costs under different renewable energy quota coefficients. As observed, an increase in GEC prices leads to a corresponding reduction in total system costs. This occurs because higher GEC prices enhance the economic viability of renewable energy generation, thereby offsetting overall operational expenditures.
Figure 12.
Effects of green certificate price on GCT revenue and total operating cost under different renewable quota coefficients.
Conversely, at a constant GEC price, an increase in the quota ratio results in diminished revenues from the GEC market, which drives the total cost upward. Furthermore, the sensitivity of the total system cost to changes in the renewable energy quota intensifies as GEC prices rise. If the quota coefficient is set excessively high, certain parks may cease to derive profit from the GEC market; in such cases, their operational costs may even increase in tandem with GEC prices. Consequently, as the renewable energy quota ratio continues to climb, the net income generated from green certificates tends to decline.
5.4. Sensitivity Analysis
5.4.1. Sensitivity Analysis of the Proposed Framework
To provide a more comprehensive validation of the proposed dispatch framework, two additional sensitivity scenarios are developed based on Scenario 3, which represents the complete proposed framework integrating cross-park power exchange, carbon trading, green certificate trading, ADMM-based distributed coordination, and asymmetric bargaining. The additional scenarios are designed to evaluate the influence of the cooperative benefit allocation mechanism and the sensitivity of the proposed framework to variations in carbon market conditions.
The detailed settings of the two additional scenarios are summarized as follows.
- Scenario 4: The proposed dispatch framework without the asymmetric bargaining mechanism. The physical dispatch process, including cross-park power exchange, carbon trading, and green certificate trading, remains unchanged, while the cooperative benefits are equally distributed among the three participating parks instead of being allocated according to their individual contributions.
- Scenario 5: Carbon price sensitivity analysis. Based on Scenario 3, the benchmark carbon trading price is varied by ±20% to evaluate the influence of different carbon market conditions. Specifically, the benchmark carbon price of 250 yuan·t−1 is adjusted to 200 yuan·t−1 and 300 yuan·t−1, representing the low-price and high-price cases, respectively.
As shown in Table 6, compared with Scenario 3, Scenario 4 yields the same total operating cost, indicating that the asymmetric bargaining mechanism mainly affects the distribution of cooperative benefits rather than the physical dispatch decisions, while improving the fairness and incentive compatibility of benefit allocation. This confirms that the proposed benefit allocation strategy can encourage long-term cooperation among heterogeneous parks without sacrificing dispatch economy. For Scenario 5, varying the carbon price by ±20% changes the total operating cost from 8006.42 $ to 8112.73 $, corresponding to −0.64% and +0.68%, respectively. Although carbon price fluctuations directly affect carbon trading costs, their impact on the overall operating cost remains limited, indicating that the proposed framework is not overly sensitive to moderate market price variations. Overall, the proposed distributed dispatch framework maintains stable operational performance under different carbon market conditions while effectively coordinating cross-park power exchange, carbon trading, and green certificate trading, thereby demonstrating its practical applicability.
Table 6.
Results of extended scenarios.
5.4.2. Robustness Analysis
To further examine the robustness of the proposed framework, this subsection discusses its response trends under representative parameter variations. Since the model involves generation dispatch, energy storage operation, EV charging/discharging, carbon trading, green certificate trading, P2P power exchange, and asymmetric benefit allocation, each robustness scenario would require re-optimization. Therefore, this discussion focuses on qualitative response trends rather than assuming linear changes in numerical results.
As summarized in Table 7, four types of variations are considered: higher renewable penetration, stronger carbon constraints, different EV penetration rates, and varying battery energy storage capacities. With higher renewable penetration, the complementarity between PV-rich and wind-rich parks becomes more important, and surplus renewable power can be transferred through P2P exchange to improve accommodation and reduce external purchases. Under stronger carbon constraints, carbon trading costs may increase, especially for parks relying more on thermal power or retailer purchases; however, coordinated renewable utilization, storage operation, and inter-park exchange can help mitigate this impact.
Table 7.
Robustness test settings and expected response trends.
Changes in EV penetration affect demand-side flexibility. Higher EV penetration provides more flexible charging and discharging resources for peak shaving and renewable accommodation, while lower EV penetration weakens system regulation capability. Similarly, larger battery storage capacity improves renewable absorption and inter-temporal energy shifting, but its marginal benefit may decline when the capacity becomes sufficiently large.
Overall, the proposed framework shows adaptability under different renewable penetration levels, carbon constraint strengths, EV penetration rates, and storage capacity settings, indicating its potential applicability under various operating and policy conditions.
5.5. Practical Applicability Analysis of the Proposed Framework
To further evaluate the practical applicability of the proposed framework, an engineering-oriented analysis is conducted from the perspectives of representative operating data, operational feasibility, and computational performance.
The case studies are performed using representative operational datasets, including renewable generation profiles, electricity demand, electricity prices, carbon trading prices, and green certificate prices. The obtained dispatch results satisfy all practical operating constraints, including power balance, hybrid energy storage charging/discharging limits, state-of-charge constraints, and inter-park transmission capacity limits, indicating that the optimized schedules are directly applicable from an engineering perspective. The resulting dispatch behaviors are also consistent with practical energy management principles, where surplus renewable energy is preferentially stored or exchanged through inter-park P2P trading, while stored energy is released during peak-load periods to reduce external electricity purchases, operating costs, and carbon emissions.
Beyond the economic benefits demonstrated in the case studies, the proposed framework provides an integrated mechanism that coordinates physical dispatch, inter-park energy sharing, carbon and green certificate trading, and contribution-based benefit allocation. The ADMM-based distributed coordination strategy preserves local decision-making autonomy while enabling efficient inter-park cooperation, and the asymmetric bargaining mechanism improves the fairness and sustainability of cooperative operation.
Compared with the centralized optimization approach, the proposed ADMM-based distributed framework achieves an almost identical objective value with a shorter computation time, demonstrating its suitability for practical online scheduling. Overall, the representative operating data, engineering constraint verification, reasonable dispatch behaviors, and computational efficiency provide strong evidence for the practical applicability of the proposed framework.
6. Conclusions
The increasing penetration of renewable energy sources in power systems, alongside the rapid growth of decentralized demand-side resources, presents significant challenges to the economic, operational, and reliability aspects of grid management. These changes also place greater pressure on the flexibility of system operations, requiring the development of more advanced strategies to optimize system performance. This chapter introduces a cross-park dispatch strategy that addresses these challenges by reducing operational costs and optimizing the integration and output of multi-energy resources. In this framework, asymmetric bargaining mechanisms and integrated carbon and green certificate markets play key roles in enhancing economic efficiency and aligning energy-sharing goals with carbon reduction objectives. Therefore, the proposed strategy is not a simple combination of existing methods, but a coordinated dispatch framework that links physical electricity interaction, low-carbon market mechanisms, distributed price coordination, and contribution-based benefit allocation for heterogeneous park clusters. The main conclusions of the research are as follows:
- (1)
- The proposed cross-park dispatch framework effectively utilizes the temporal complementarity between photovoltaic-dominated and wind-dominated parks. Compared with the non-interaction scenario, inter-park power exchange reduces the total system cost by 5.29%, indicating that coordinated power sharing can improve renewable energy accommodation and reduce dependence on external electricity retailers.
- (2)
- The integration of carbon trading and green certificate trading further improves the economic performance of the system. Compared with the scenario considering only carbon trading and cross-park exchange, the total cost is reduced by 7.4%. Compared with the standalone carbon-market scenario, the total cost reduction reaches 12.69%, demonstrating the synergistic effect between physical power exchange and low-carbon market mechanisms.
- (3)
- The asymmetric bargaining mechanism improves the fairness and incentive compatibility of cooperative dispatch. After benefit redistribution, the cost of the park with a higher contribution is reduced by up to 10.34%, while all parks still maintain lower costs than under independent operation. This result indicates that contribution-based benefit allocation is essential for sustaining long-term cross-park cooperation.
- (4)
- Although the proposed framework demonstrates clear economic and coordination benefits, several limitations should be acknowledged. First, the case study is based on a representative three-park system, and the geographical network constraints, transmission losses, wheeling charges, and congestion effects are simplified by using upper and lower limits of inter-park exchanged power. Therefore, future studies should further incorporate detailed distribution network constraints and more realistic P2P transaction rules. Second, the current model mainly focuses on day-ahead dispatch under representative operating data. The impacts of renewable generation uncertainty, load forecasting errors, and real-time market fluctuations should be further considered through stochastic or robust optimization methods. Third, although the ADMM-based distributed method improves scalability by decomposing the centralized problem into park-level subproblems, the computational burden will still increase when the number of parks, time periods, flexible resources, and market constraints becomes larger. Future research will therefore focus on parallel computing, adaptive penalty parameter selection, and large-scale multi-park validation. In addition, the investment cost of flexible resources, long-term capacity planning, and the coupling among electricity, carbon, and green certificate markets under different policy scenarios will also be further investigated. These extensions can improve the practical applicability of the proposed framework in larger regional integrated energy systems.
Author Contributions
Conceptualization, C.F. and Y.W.; methodology, H.C.; validation, W.W., L.Y. and F.Z.; formal analysis, H.C.; investigation, C.F.; resources, C.F.; data curation, Y.W.; writing—original draft preparation, S.R.; writing—review and editing, S.R.; visualization, L.Y.; supervision, C.F.; project administration, C.F.; funding acquisition, C.F. All authors have read and agreed to the published version of the manuscript.
Funding
This work was supported by Science and technology project of State Grid Hebei Electric Power Co., Ltd. (No. kj2024-059).
Data Availability Statement
The data supporting the findings of this study are available from the corresponding author upon reasonable request. These data include the simulation input data, model parameters, load profiles, renewable generation profiles, and optimization results used in the case study.
Conflicts of Interest
Author Chunxian Feng, Yifeng Wang, Wenxue Wang, Long Yuan and Feifei Zhang were employed by the company State Grid Hebei Electric Power. The remaining authors declare that the research was conducted in the absence of any commercial or financial relationships that could be construed as a potential conflict of interest. The authors declare that this study received funding from State Grid Hebei Electric Power Company. The funder was not involved in the study design, collection, analysis, interpretation of data, the writing of this article or the decision to submit it for publication..
Abbreviations
The following abbreviations are used in this manuscript:
| ADMM | Alternating Direction Method of Multipliers |
| CET | Carbon Emission Trading |
| GCT | Green Certificate Trading |
| P2P | Peer-to-peer |
| ESS | Energy storage system |
| EV | Electric vehicle |
| V2G | Vehicle-to-grid |
| TOU | Time-of-use electricity price |
| SOC | State of charge |
Symbol
The following Symbol are used in this manuscript:
| C | cost ($) |
| E | Carbon emission (t) |
| G | index |
| x | green certificates |
| P | Power (MW) |
| U | Utility |
| K | Cost coefficient ($·MWh−1) |
| r | Market price ($·MWh−1) |
| μ | Mean/quota coefficient |
| σ | Standard deviation |
| η | Efficiency |
| R | Regulation limit (MW·h−1) |
| Q | EV power consumption |
| δ | variance |
| ω | Carbon emission factor (t·MWh−1) |
| a, b, c | EV status |
| λ | Lagrange multiplier |
| ρ | Penalty parameter |
| ε | Convergence tolerance |
| s | Bargaining weight |
Subscripts
The following Subscripts are used in this manuscript:
| t | Time period index |
| buy | Purchased electricity |
| sell | Electricity sales |
| e | Thermal power generation |
| ren | Renewable energy |
| cr | Actual carbon emissions |
| er | Actual emissions from thermal power |
| cha | Charging |
| dis | Discharging |
| max | Maximum value |
| min | Minimum value |
| S | Power delivery/supply |
| J/R | t Power reception/receiving |
| sd | Electricity purchased from retailer/grid |
| gd | Electricity sold to retailer/grid |
| 0 | Initial value or non-participation benchmark |
Appendix A. Electric Vehicle Modeling Details
The arrival and departure times of EVs at charging stations follow regular patterns, which can be expressed as Equation (A1):
where xt is arrival or departure time of an EV, is variance; μ mean value.
The discharging duration of an EV is expressed as Equation (A2):
where Tfd is discharging time of the EV, , denote the upper and lower limits of the EV battery state of charge, C is rated capacity of the EV battery, is discharging power, is discharging efficiency, Ln is daily driving mileage of the EV, Q is power consumption per 100 km of the EV.
Appendix B. Detailed ADMM Solution Procedure
Cost-minimization subproblem
where Ci denotes the cost of park i.
During the cost solution process, the sum of electricity transaction costs satisfies Ctr = 0. The problem is solved using the ADMM algorithm with the following steps:
Step 1: Construct the augmented Lagrangian function
where λ1-2,1 is the Lagrange multiplier and ρ1 is the penalty parameter.
Step 2: Update variables
Let k be the number of iterations. Variables are updated according to the following equations:
Step 3: Update the Lagrange multiplier
Step 4: Check the convergence condition.
The algorithm ends when the iteration count reaches its upper limit.
Appendix C. Asymmetric Bargaining Derivation
Benefit allocation subproblem
The model is developed based on Nash bargaining theory:
where Ui and Ui0 represent the utility of bargaining subject park i and the bargaining breakdown point, respectively.
The power supplied and received by each park, denoted PS and PR respectively, are expressed as:
The bargaining power is defined as:
where PS,max and PR,max are the maximum power supplied and received among all parks, respectively. From Equation (9), it can be concluded that the more power a park supplies, the higher its bargaining weight.
A benefit allocation model based on asymmetric bargaining is constructed as:
where Ci is the operating cost of park i with power interaction, and Ci0 is the operating cost of park i without cross-park power interaction.
The objective function maximizes the gain in benefits obtained by participating in cross-park power interaction compared with non-participation. As the natural logarithm is monotonically increasing, taking the logarithm of the objective function leaves the optimal solution unchanged. Meanwhile, the logarithmic transformation helps convert the product-form objective into a summation form, facilitating the solution process. By taking the logarithm of Equation (A13), the maximization problem can be transformed into:
The interactive electricity price constraint is given by:
The subsequent solution procedure is the same as that of the cost-minimization subproblem.
Appendix D. Main Simulation Parameters and Data Sources
In this paper, The carbon trading price, green certificate price, quota coefficients, and stepped price growth parameters are selected based on a combination of empirical market references, policy-oriented parameter settings, and values commonly adopted in previous studies. The main simulation parameters and data sources are shown in Table A1.
Table A1.
Main simulation parameters and data sources.
References
- Sharma, U.; Kirrolia, S.A.; Bishnoi, R.N. Advancing sustainable hydrogen: Technological, environmental, and policy perspectives for the global energy transition. Sustain. Chem. One World 2026, 9, 100191. [Google Scholar] [CrossRef] [Scilit]
- Zhang, Y.; Guo, C.X.; Yin, J.B.; Li, F.; Wang, C.T.; Tang, X. Research on the optimal configuration of an electricity-gas multi-energy storage system of the regional integrated energy system. Zhejiang Electr. Power 2023, 42, 60–69. [Google Scholar]
- Kang, J.N.; Liu, L.; Liu, L.C.; Wei, Y.M. Operation strategy for a net-zero emissions park microgrid with multi-stakeholders: A multi-objective with bi-level optimization approach. Energy 2025, 321, 135524. [Google Scholar] [CrossRef] [Scilit]
- Xu, K.; Liu, C.; Xu, W.; Zeng, J.; Shao, F. Low-carbon and economic optimization of a source-load-storage system based on Stackelberg game and chance constraints. Sci. Technol. Energy Transit. 2025, 80, 44. [Google Scholar] [CrossRef] [Scilit]
- Chen, J.; Zhou, Z.L.; Zhang, Q.L.; Niu, Z.W.; Xie, L.W. Optimization and Scheduling Strategy for Integrated Energy Systems Across Parks Based on Spatiotemporal Correlation Pricing Mechanism. Shandong Electr. Power Technol. 2025, 52, 1–15. [Google Scholar]
- Luderer, G.; Madeddu, S.; Merfort, L.; Ueckerdt, F.; Pehl, M.; Pietzcker, R.; Rottoli, M.; Schreyer, F.; Bauer, N.; Baumstark, L.; et al. Impact of declining renewable energy costs on electrification in low-emission scenarios. Nat. Energy 2022, 7, 32–42. [Google Scholar] [CrossRef] [Scilit]
- Yang, Z.K.; Zhang, M.M. Breaking transmission barriers among provinces: A unified power system planning in China to achieve carbon neutrality. Comput. Ind. Eng. 2026, 213, 111771. [Google Scholar] [CrossRef] [Scilit]
- Wei, Z.B.; Jin, W.J.; Zhang, T.L.; Zheng, J.Y.; Luo, C.H.; Zhang, X.Y. A Low-Carbon Economic Dispatch Model for Multi-Area Interconnected Power Systems Considering the Low-Carbon Response Capability of Loads. Electr. Power 2026, 59, 1–13. [Google Scholar]
- Li, H.; Han, Y.M. Coordinated Optimal Scheduling of Distribution Networks and Multiple Microgrids Considering Renewable Energy Uncertainty. Trans. China Electrotech. Soc. 2025, 40, 5571–5588. [Google Scholar]
- Yan, R.J.; Wang, J.J.; Huo, S.J.; Qin, Y.; Zhang, J.; Tang, S.; Wang, Y.; Liu, Y.; Zhou, L. Flexibility improvement and stochastic multi-scenario hybrid optimization for an integrated energy system with high-proportion renewable energy. Energy 2023, 263, 125779. [Google Scholar] [CrossRef] [Scilit]
- Peng, C.; Hu, S.; Zhang, Z.; Pang, N.; Zhang, Y.; Wang, Y.; Xue, C.; Wang, B. A Coordinated Operation Strategy for Multi-Virtual Power Plants and Load Aggregation Under Electricity Market Gaming. IEEE Open Access J. Power Energy 2026, 13, 519–529. [Google Scholar] [CrossRef] [Scilit]
- Zhang, S.; Li, H.J.; Zhang, W.L.; Li, X.; Sun, Z. Research on inter-regional renewable energy accommodation assessment method based on time series production simulation. Acta Energ. Solaris Sin. 2021, 42, 126–130. [Google Scholar]
- Gao, J.W.; Gao, F.J.; Yang, Y.; Wu, H.Y.; Zhang, Y.; Liang, P.C. Configuration optimization and benefit allocation model of multi-park integrated energy systems considering electric vehicle charging station to assist services of shared energy storage power station. J. Clean. Prod. 2022, 336, 130381. [Google Scholar] [CrossRef] [Scilit]
- Ren, Z.C.; Ma, R.G.; Long, C.; Chen, B.; Lv, X.H.; Li, H.Q.; Gao, L.Y. Collaborative Optimization of Park Integrated Energy System based on Shared Energy Storage. In Proceedings of the 2022 Asian Conference on Frontiers of Power and Energy (ACFPE), Chengdu, China, 21–23 October 2022; Volume 2022, pp. 619–624. [Google Scholar]
- Ma, C.Y.; Chen, H.Y.; Xiao, D.L. Cross-region optimal dispatch of new power system considering carbon constraints. Smart Power 2024, 52, 38–45. [Google Scholar]
- Liu, X.Z.; Wang, H.H.; Deng, W.S.; Guo, Z.; Ding, G. Cross-regional new energy consumption strategy considering different time scales. South. Power Syst. Technol. 2023, 17, 37–46, 56. [Google Scholar]
- Dong, Y.; WuKen, E.; Zhang, H.; Ren, P.; Zhou, X. Bi-level coordinated operation optimization of multi-park integrated energy systems considering categorized demand response and uncertainty: A unified adaptive robust optimization approach. Renew. Energy 2025, 241, 122331. [Google Scholar] [CrossRef] [Scilit]
- Ma, L.; Xie, L.R.; Ye, J.H.; Bian, Y. Two-stage dispatching strategy for park-level integrated energy systems based on a master-slave-cooperative hybrid game model. Renew. Energy 2024, 232, 120971. [Google Scholar] [CrossRef] [Scilit]
- Zheng, J.H.; Tao, X.; Li, Z.; Liang, H.; Sun, Z. Sharding-based asynchronous coordination for secure and scalable peer-to-peer energy trading under delays and attacks. IEEE Trans. Smart Grid 2026. [Google Scholar] [CrossRef] [Scilit]
- Yang, Y.; Yan, G.; Mu, G.; Chen, Z. Hierarchical bidding strategy for heterogeneous P2H loads and wind power: State-driven aggregation and switching time scheduling. Energy 2025, 334, 137766. [Google Scholar] [CrossRef] [Scilit]
- Li, Z.; Deng, Q.; Chen, F.; Sun, P.; Liu, J.; Hu, W.; Zhou, H. Receding horizon D-optimal input design for identification of wireless power transfer systems. IEEE J. Emerg. Sel. Top. Power Electron. 2023, 11, 3597–3606. [Google Scholar] [CrossRef] [Scilit]
- Zhang, T.; Wang, J.; Mei, X.; Wang, L.Y.; Liu, W.L. Optimal scheduling of multi-agent and multi-park cooperative game considering carbon-green certificate. Electr. Power Autom. Equip. 2024, 44, 129–135, 153. [Google Scholar]
- Yan, S.Z.; Wang, W.Q.; Li, X.Z.; Lv, H.; Fan, T.; Aikepaer, S. Stochastic optimal scheduling strategy of cross-regional carbon emissions trading and green certificate trading market based on stackelberg game. Renew. Energy 2023, 219, 119268. [Google Scholar] [CrossRef] [Scilit]
- Li, J.F.; He, X.T.; Niu, W.; Liu, X. Analysis of the joint trading of local green power certificates, carbon emissions rights, and electricity considering demand flexibility. Int. J. Electr. Power Energy Syst. 2024, 155, 109653. [Google Scholar] [CrossRef] [Scilit]
- Zhang, C.L.; Wang, S.; Ge, S.N.; Pan, D.; Zhang, Y. Optimal scheduling of integrated energy systems considering flexible demand response and carbon emission-green certificate joint trading. Electr. Power 2024, 57, 14–25. [Google Scholar]
- Xu, G.M.; Yang, Z.X. Risk-aware low carbon optimization of hydrogen-oriented multi-energy system with linear approximation of bi-product fuel cell. Energy 2025, 334, 137581. [Google Scholar] [CrossRef] [Scilit]
- Chen, T.N.; Li, W.X.; Li, Y.; Yu, Y.L.; Liao, W.; Cai, Y.J. Review on coupling mechanism of carbon green certificate and power market under the background of carbon peaking and carbon neutrality. Guangdong Electr. Power 2024, 37, 14–25. [Google Scholar]
- Chen, X.L.; Cao, X.M.; Chen, J.; Liu, J.; Zhang, Y.; Bao, H. Optimized dispatch of park integrated energy system with thermoelectric flexible response under green certificate-carbon trading mechanism. Electr. Power 2024, 57, 110–120. [Google Scholar]
- Zeng, X.Q.; Wang, J.; Zhou, Y.; Li, H.J. Optimal configuration and operation of the regional integrated energy system considering carbon emission and integrated demand response. Front. Energy Res. 2023, 11, 1218035. [Google Scholar] [CrossRef] [Scilit]
- Jiang, X.P.; Lu, S.L.; Wang, J.; Zhang, Y.; Bao, Z.; Yu, M. Park-level integrated energy system planning considering tiered carbon trading and optimal construction timing. Electr. Meas. Instrum. 2023, 60, 11–19. [Google Scholar]
- Fan, Y.Q.; Ding, T.; Sun, Y.G.; He, Y.K.; Wang, C.X.; Wang, Y.Q.; Chen, T.; Liu, J. Review and Cogitation for Worldwide Spot Market Development to Promote Renewable Energy Accommodation. Proc. CSEE 2021, 41, 1729–1752. [Google Scholar]
- An, J.T.; Liu, W.L.; Lin, Y.J.; Zhang, Q.; Wang, X.; Kang, J. Optimization scheduling of hydrogen-containing integrated energy system under green certificate-carbon trading integration mechanism. Acta Energ. Solaris Sin. 2024, 45, 104–114. [Google Scholar]
- Li, Y.B.; Ge, S.J.M.; Wu, J.; Zhu, L.; Xu, G. A grid-forming energy storage primary frequency regulation method considering SOC constraints and active frequency modulation coefficients. Electr. Power 2026, 59, 164–175. [Google Scholar]
- Zhou, M.L.; Cheng, J.J. Optimized charging strategy for large-scale electric vehicles. Int. J. Low-Carbon Technol. 2023, 18, 1318–1323. [Google Scholar] [CrossRef] [Scilit]
- Wang, K.; Li, W.H.; Wang, Z.F.; Jiang, J.Z.; Cheng, W.J.; Lu, J.Y. Aggregation and Disaggregation Method for Flexible Capacity of Electric Vehicles Based on Two-Stage Robust Optimization. Autom. Electr. Power Syst. 2025, 49, 115–124. [Google Scholar]
- Chen, L.C.; Fan, H.; Guo, X.; Liang, J.F. Reliability evaluation of park microgrid with EV charging station running in islanding state. Electr. Power Sci. Technol. 2021, 36, 100–108. [Google Scholar]
- Zhou, Z.; Du, E.; Zhang, N.; Nielsen, C.P.; Lu, X.; Xiao, J.; Wu, J.; Kang, C. Cost increase in the electricity supply to achieve carbon neutrality in China. Nat. Commun. 2022, 13, 3179. [Google Scholar] [CrossRef] [Scilit] [PubMed]
- Kong, X.Y.; Yang, Z.Y.; Liu, Z.Y.; Gao, B.; Zhuang, Z.; Duan, M. A Low-Carbon Dispatch Decision-Making Method for Industrial Park Users Considering Production Characteristics. Electr. Power 2026, 59, 37–47. [Google Scholar]
- Cui, S.C.; Wang, Y.W.; Liu, X.K.; Wang, Z.; Xiao, J.-W. Economic storage sharing framework: Asymmetric bargaining-based energy cooperation. IEEE Trans. Ind. Inform. 2021, 17, 7489–7500. [Google Scholar] [CrossRef] [Scilit]

Disclaimer/Publisher’s Note: The statements, opinions and data contained in all publications are solely those of the individual author(s) and contributor(s) and not of MDPI and/or the editor(s). MDPI and/or the editor(s) disclaim responsibility for any injury to people or property resulting from any ideas, methods, instructions or products referred to in the content. |
© 2026 by the authors. Licensee MDPI, Basel, Switzerland. This article is an open access article distributed under the terms and conditions of the Creative Commons Attribution (CC BY) license.