


Abstract
Room-temperature sodium–sulfur batteries have broad prospects, but Na2S cathodes suffer from poor electrochemical performance and insufficient air stability. By introducing Na2SeO3 as a precursor, a Na2Se/Na2S@CNF composite cathode is prepared. TEM reveals continuous heterojunction interfaces. Electrochemical performance is significantly enhanced: the initial charge capacity reaches 664 mAh g−1, and the reversible capacities at 0.2, 0.5, 1, 2, 3, and 5 C rates are 774, 722, 636, 574, 494, and 396 mAh g−1 respectively, with a reversible capacity of 600 mAh g−1 after 300 cycles at 1 C.
1. Introduction
The pressing global challenges of the greenhouse effect and energy crisis demand a swift transition away from fossil fuels. Renewable energy sources—solar, wind, tidal, and biomass—offer abundant, clean alternatives, but their intermittent electricity generation requires reliable energy storage systems. In this context, room-temperature sodium–sulfur (RT Na–S) batteries have attracted growing interest due to their high theoretical energy density (1274 Wh kg−1), low cost, and resource abundance. However, the practical application of Na2S cathodes is hindered by their poor electronic conductivity and limited air stability, which severely compromise electrochemical performance [1,2,3,4,5,6,7,8,9].
To overcome these drawbacks, researchers have explored the use of chalcogen congeners of sulfur—selenium and tellurium—which form sodium chalcogenides (Na2Se, Na2Te) with superior conductivity. For instance, Wu Yuping’s group designed a Na2S/Na2Te heterostructure embedded in a carbon matrix via a simple carbothermic reaction [10]. This structure provides abundant electron/ion diffusion channels and catalytic surfaces for polysulfide conversion, significantly improving active material utilization and mitigating the shuttle effect. Similar strategies have been applied to organosulfur cathodes. In one study, selenium was introduced as a “eutectic accelerator” into sulfurized polyacrylonitrile (S@pPAN) [11]. The resulting Se0.08S0.92@pPAN composite forms Se–S bonds uniformly dispersed within the conductive PAN framework. Selenium doping simultaneously enhances electronic conductivity, increases the sodium-ion diffusion coefficient, and lowers the diffusion energy barrier and reaction overpotential. Consequently, the cathode exhibits excellent cycling stability and rate capability in both ether- and ester-based electrolytes, with selenium itself contributing additional capacity.
Another approach involves the room-temperature sodium–selenium disulfide (Na–SeS2) system. Substituting elemental sulfur with SeS2 significantly improves overall conductivity. To suppress polysulfide/polyselenide shuttling, Xu Maowen’s team designed a core–shell Co9S8@SiO2/C host material [12]. The hollow interior accommodates volume expansion, while the outer SiO2 shell and Co9S8 particles synergistically adsorb soluble species, effectively confining them. Combined with in situ/ex situ characterizations, this work elucidated the reaction mechanism and paved the way for the further development of Na–SeS2 batteries.
Inspired by these advances, we introduce selenium into sodium sulfide cathodes by incorporating sodium selenite (Na2SeO3) into the electrospinning precursor, successfully constructing a Na2Se/Na2S@CNF composite. In this material, both Na2Se and Na2S are uniformly dispersed within the carbon nanofibers and form a closely contacted heterojunction interface. Benefiting from selenium’s stronger metallic character and higher electronic conductivity, this architecture establishes an efficient electron transport network and synergistically enhances the redox kinetics of sulfur species, thereby improving the overall electrochemical performance of the cathode. Electrochemical tests show that the introduction of Na2Se significantly increases the initial charge capacity from 408.0 mAh g−1 to 664 mAh g−1 at 0.1 C, confirming that it effectively lowers the initial energy barrier for Na2S activation. In rate performance tests, this cathode delivered reversible capacities of 774, 722, 636, 574, 494, and 396 mAh g−1 at 0.2, 0.5, 1, 2, 3, and 5 C, respectively, and when the current was returned to 0.2 C, the capacity quickly rebounded, demonstrating excellent rate tolerance. After 300 cycles at a high rate of 1 C (1 C = 1675 mA g−1), it still maintained a high capacity of 600 mAh g−1, far superior to that of the undoped Na2S@CNFs (347 mAh g−1).
2. Materials and Methods
2.1. Preparation of Freestanding Na2Se/Na2S@CNF Cathodes
Firstly, PVP (K88-K96) (1.200 g) and Na2SO4 (0.480 g) were dissolved in a mixed solvent of water, and Na2SeO3 (0.073 g) and F127 (0.020 g) were then added to the solution (F127 was added as a surfactant to enhance the dispersion of Na2SO4 and Na2SeO3 in the precursor solution, preventing particle agglomeration during the solvent evaporation process [13]). The resulting solution was electrospun at a voltage of 21 kV and a flow rate of 0.7 mL h−1 to prepare Na2SO4- Na2SeO3-PVP nanofibers on an aluminum foil collector. The prepared nanofiber membrane was subsequently preoxidized at 170 °C for 12 h with a heating rate of 2 °C min−1. Finally, it was annealed at 780 °C under an Ar atmosphere for 2 h to obtain a self-supporting Na2Se/Na2S@CNF cathode. For comparison, the Na2S@CNF cathode was prepared following a similar procedure.
The areal loading of the Na2S is approximately 1 mg cm−2.
2.2. Characterization
To investigate the nucleation and decomposition behavior of Na2S, a battery was assembled using the aforementioned active material as the working electrode and a sodium foil as the counter electrode. Then, 50 µL 0.2 M Na2S6 in DME was used as the catholyte (sulfur and Na2S were dissolved in DME solution at a molar ratio of 5:1, and then stirred overnight, resulting in a dark brown solution), with an additional 25 µL 1 M NaFSI DME serving as the anolyte. During nucleation testing, the cell was first discharged to 1.0 V at a constant current of 1/24 C (1 C = 1675 mA g−1), and then the potential was held constant at 0.8 V until the current dropped below 10−5 A.
2.3. Electrochemical Measurements
XRD patterns were collected on a D8 diffractometer (Bruker, Berlin, Germany) with Cu Kα radiation in the 2θ range of 10–80° to identify the crystalline phases. The morphologies and element distribution were assessed by Scanning Electron Microscopy (SEM) (Regulus 8230, Hitachi, Ltd., Chiyoda, Japan) and Transmission Electron Microscopy (TEM) (Tecnai G2 F20 S-TWIN, Thermo Fisher Scientific, Waltham, MA, USA), with microscopes equipped with an EDS detector. Raman spectroscopy was tested with 532 nm laser excitation (LABRAM, HR). XPS analysis was conducted using an ESCALAB 250Xi spectrometer (VG, Altrincham, UK) with Al Kα radiation. In order to exclude the surface contamination, the XPS was tested after Ar+ etching for 2 min. The samples were first washed using DIGLYME and dried under vacuum, and then transferred into the analysis chamber by a vacuum transfer device.
CR2032 coin cells were assembled in an argon-filled glove box (<1 ppm O2 and H2O) using glass fiber (GF/A) separators. The electrolyte was 80 μL localized high-concentration electrolyte (LHCE, NaFSI: DME: TTE = 1:1.2:1, by molar ratio) (a locally high-concentration electrolyte was selected to measure the electrochemical performance since it is suitable for RT Na-S batteries by suppressing the polysulfide shuttle effect and preventing sodium dendrite growth) [14]. The activation number of cycles was five. All cycling and rate performance tests were conducted using a Neware battery test system (NIHW-200-160CH-8, Shenzhen Neware Technology Co. Ltd., Shenzhen, China) at a voltage range of 0.8–2.8 V (vs. Na+/Na). The active materials were calculated based on the sulfur-equivalent mass. Electrochemical Impedance Spectroscopy (EIS) was carried out on a VPM300 analyzer (Bio-logic, Seyssinet-Pariset, France). The cyclic voltammetry (CV) measurements were evaluated using the same electrochemical workstation at various scan rates from 0.1 to 0.5 mV s−1 over the potential range from 0.8 V to 2.8 V. The Randles–Sevcik equation was used to identify the Na+ diffusion coefficient. First, an initial formation cycle was performed by charging to 3.2 V and then discharging to 0.8 V at 0.1 C. Subsequently, the cells were activated by 5 additional charge/discharge cycles within the normal voltage window of 0.8–2.8 V. All subsequent long-term cycling tests were carried out strictly between 0.8 V and 2.8 V.
Galvanostatic Intermittent Titration Technique (GITT) test: The assembled Na-S batteries were cycled at 0.1 C for 20 cycles to achieve a stable state. Then, GITT tests were performed by applying a 5 min discharge or charge at 0.1 C followed by a 50 min rest period in the potential range from 0.8 V to 2.8 V.
2.4. Calculation Details
In the calculations, Ip is the peak current (mA); ν is the scanning rate (mV s−1); A is the surface area of the electrode; D is the diffusion coefficient of the active substance; and C is the concentration of the active substance. Ip is proportional to v1/2, and the slope, diffusion coefficient of the active substance D, can be calculated by fitting the data.
Theoretical expressions of the current–time transients of four classic electrochemical deposition models were presented as follows [15]:
3. Results and Discussion
3.1. Material Characterization Analysis
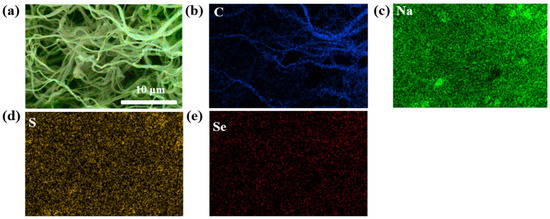
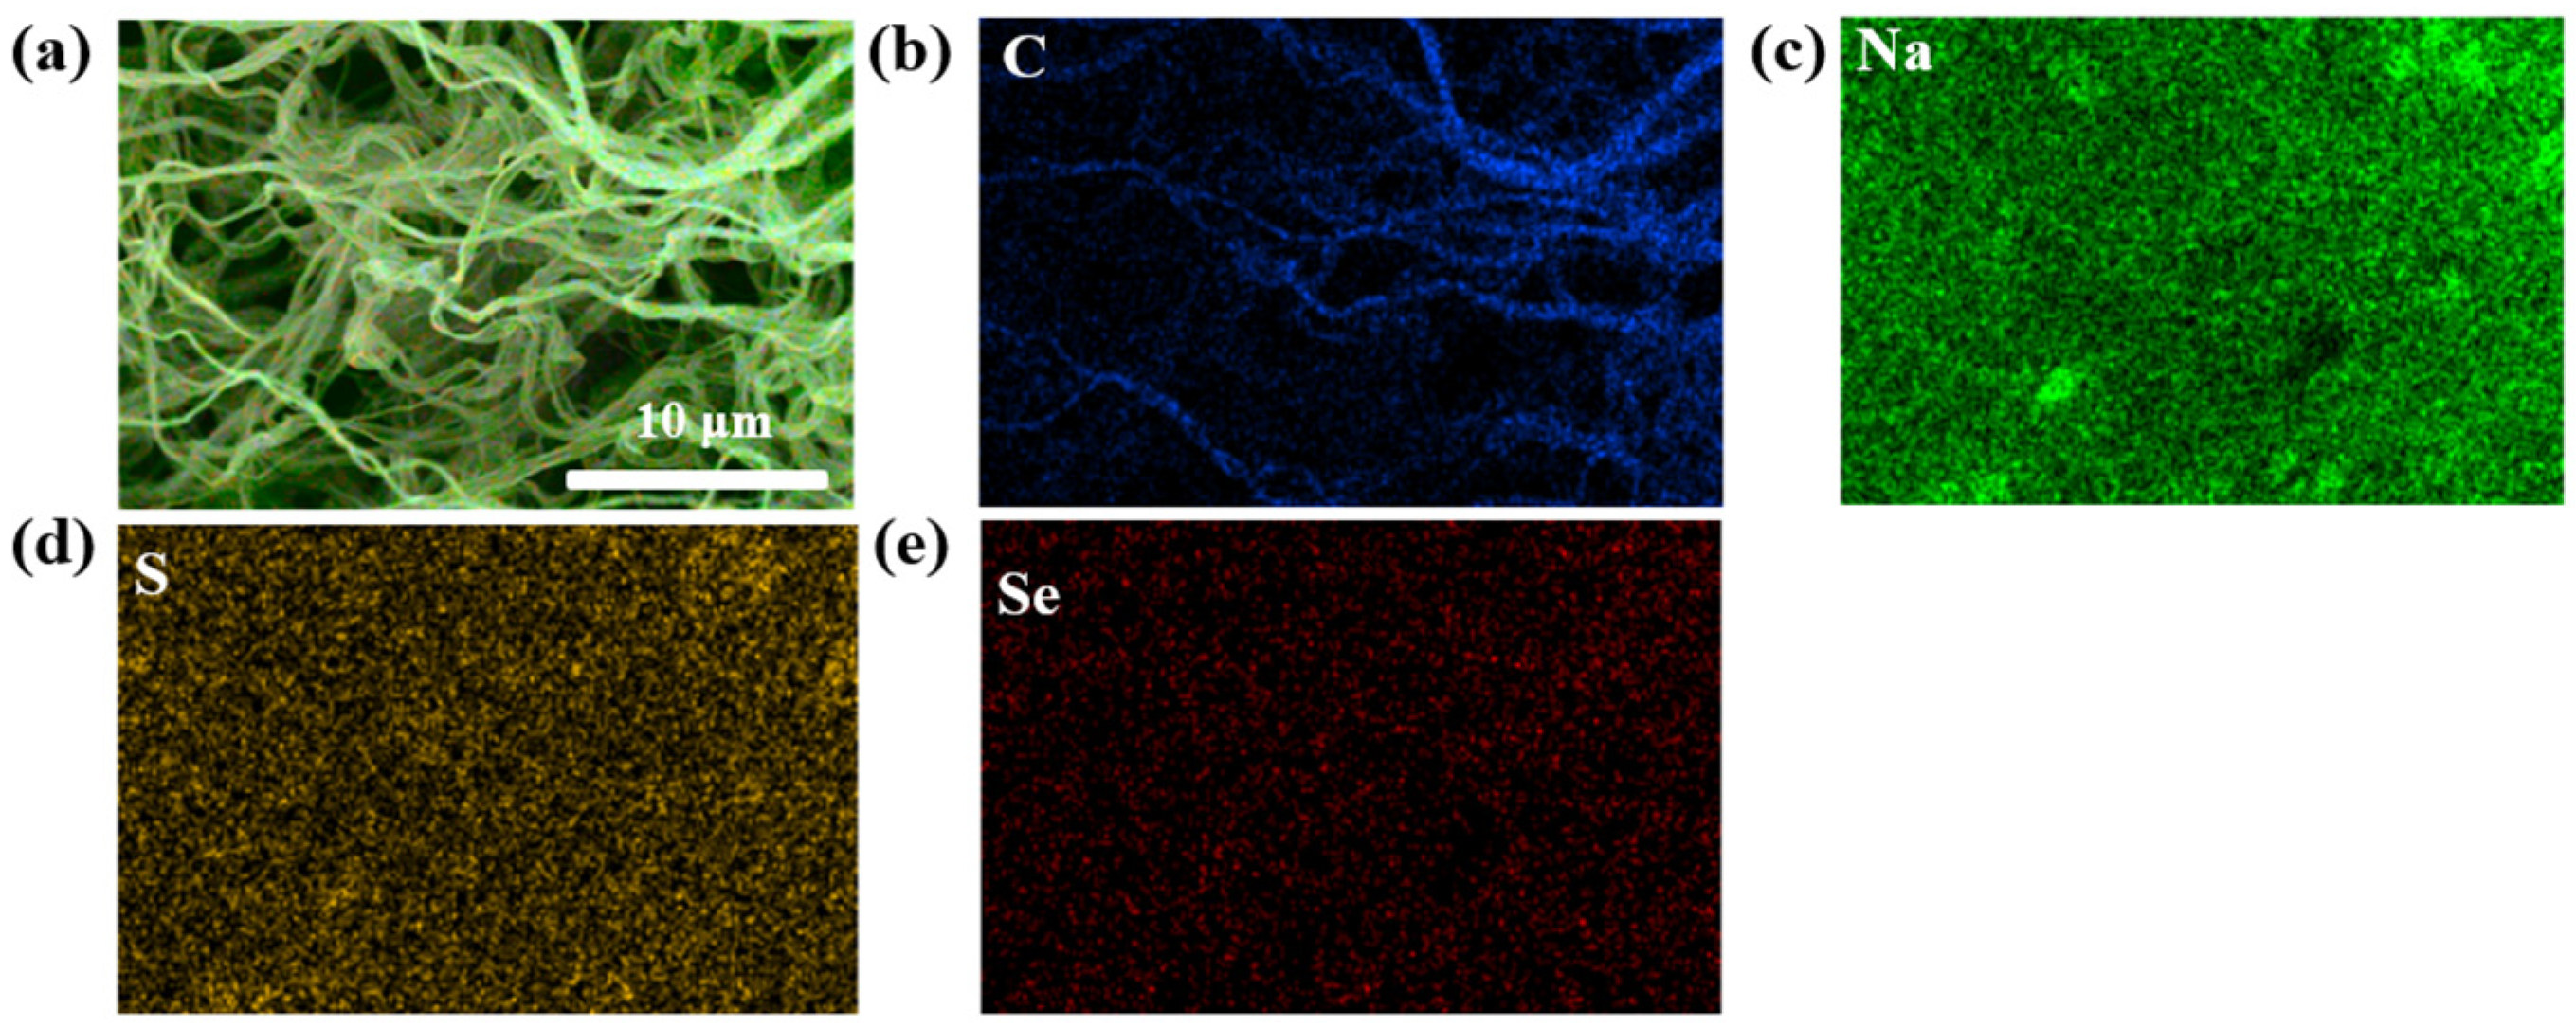
The morphology and internal structural characteristics of the Na2Se/Na2S@CNFs were characterized by SEM, TEM, and XRD. Figure 1 shows that nanofibers were successfully prepared, with no obvious particles observed, indicating that the products were all encapsulated within the nanofibers.
Figure 1.
(a) SEM image and EDS surface distribution mappings of (b) C, (c) Na, (d) S, and (e) Se of Na2Se/Na2S@CNFs.
For comparison, Na2S@CNF samples without the addition of Na2SeO3 were also prepared in the experiment. Both samples exhibited similar nanofiber morphologies, demonstrating that the introduction of Na2SeO3 did not alter the carbon structure of the nanofibers. EDS and elemental mapping revealed, in detail, the distribution of C, Se, Na, and S elements within the Na2Se/Na2S@CNFs. The results show that C, Se, Na, and S are uniformly distributed throughout the composite, which also indicates the homogeneity of the active materials (Na2S and Na2Se) within the nanofibers. Since the electronic conductivity of Na2Se is superior to that of Na2S, the uniform distribution of Na2Se enhances the material’s conductivity, lowers the initial reaction energy barrier of the Na2S cathode, and improves the battery performance.
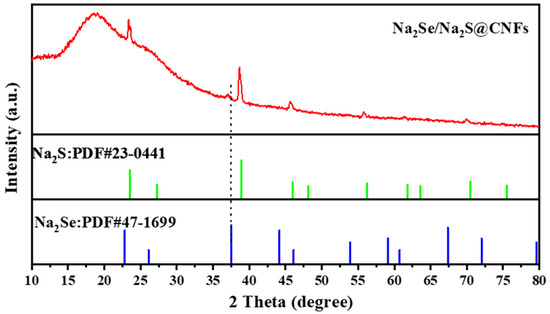
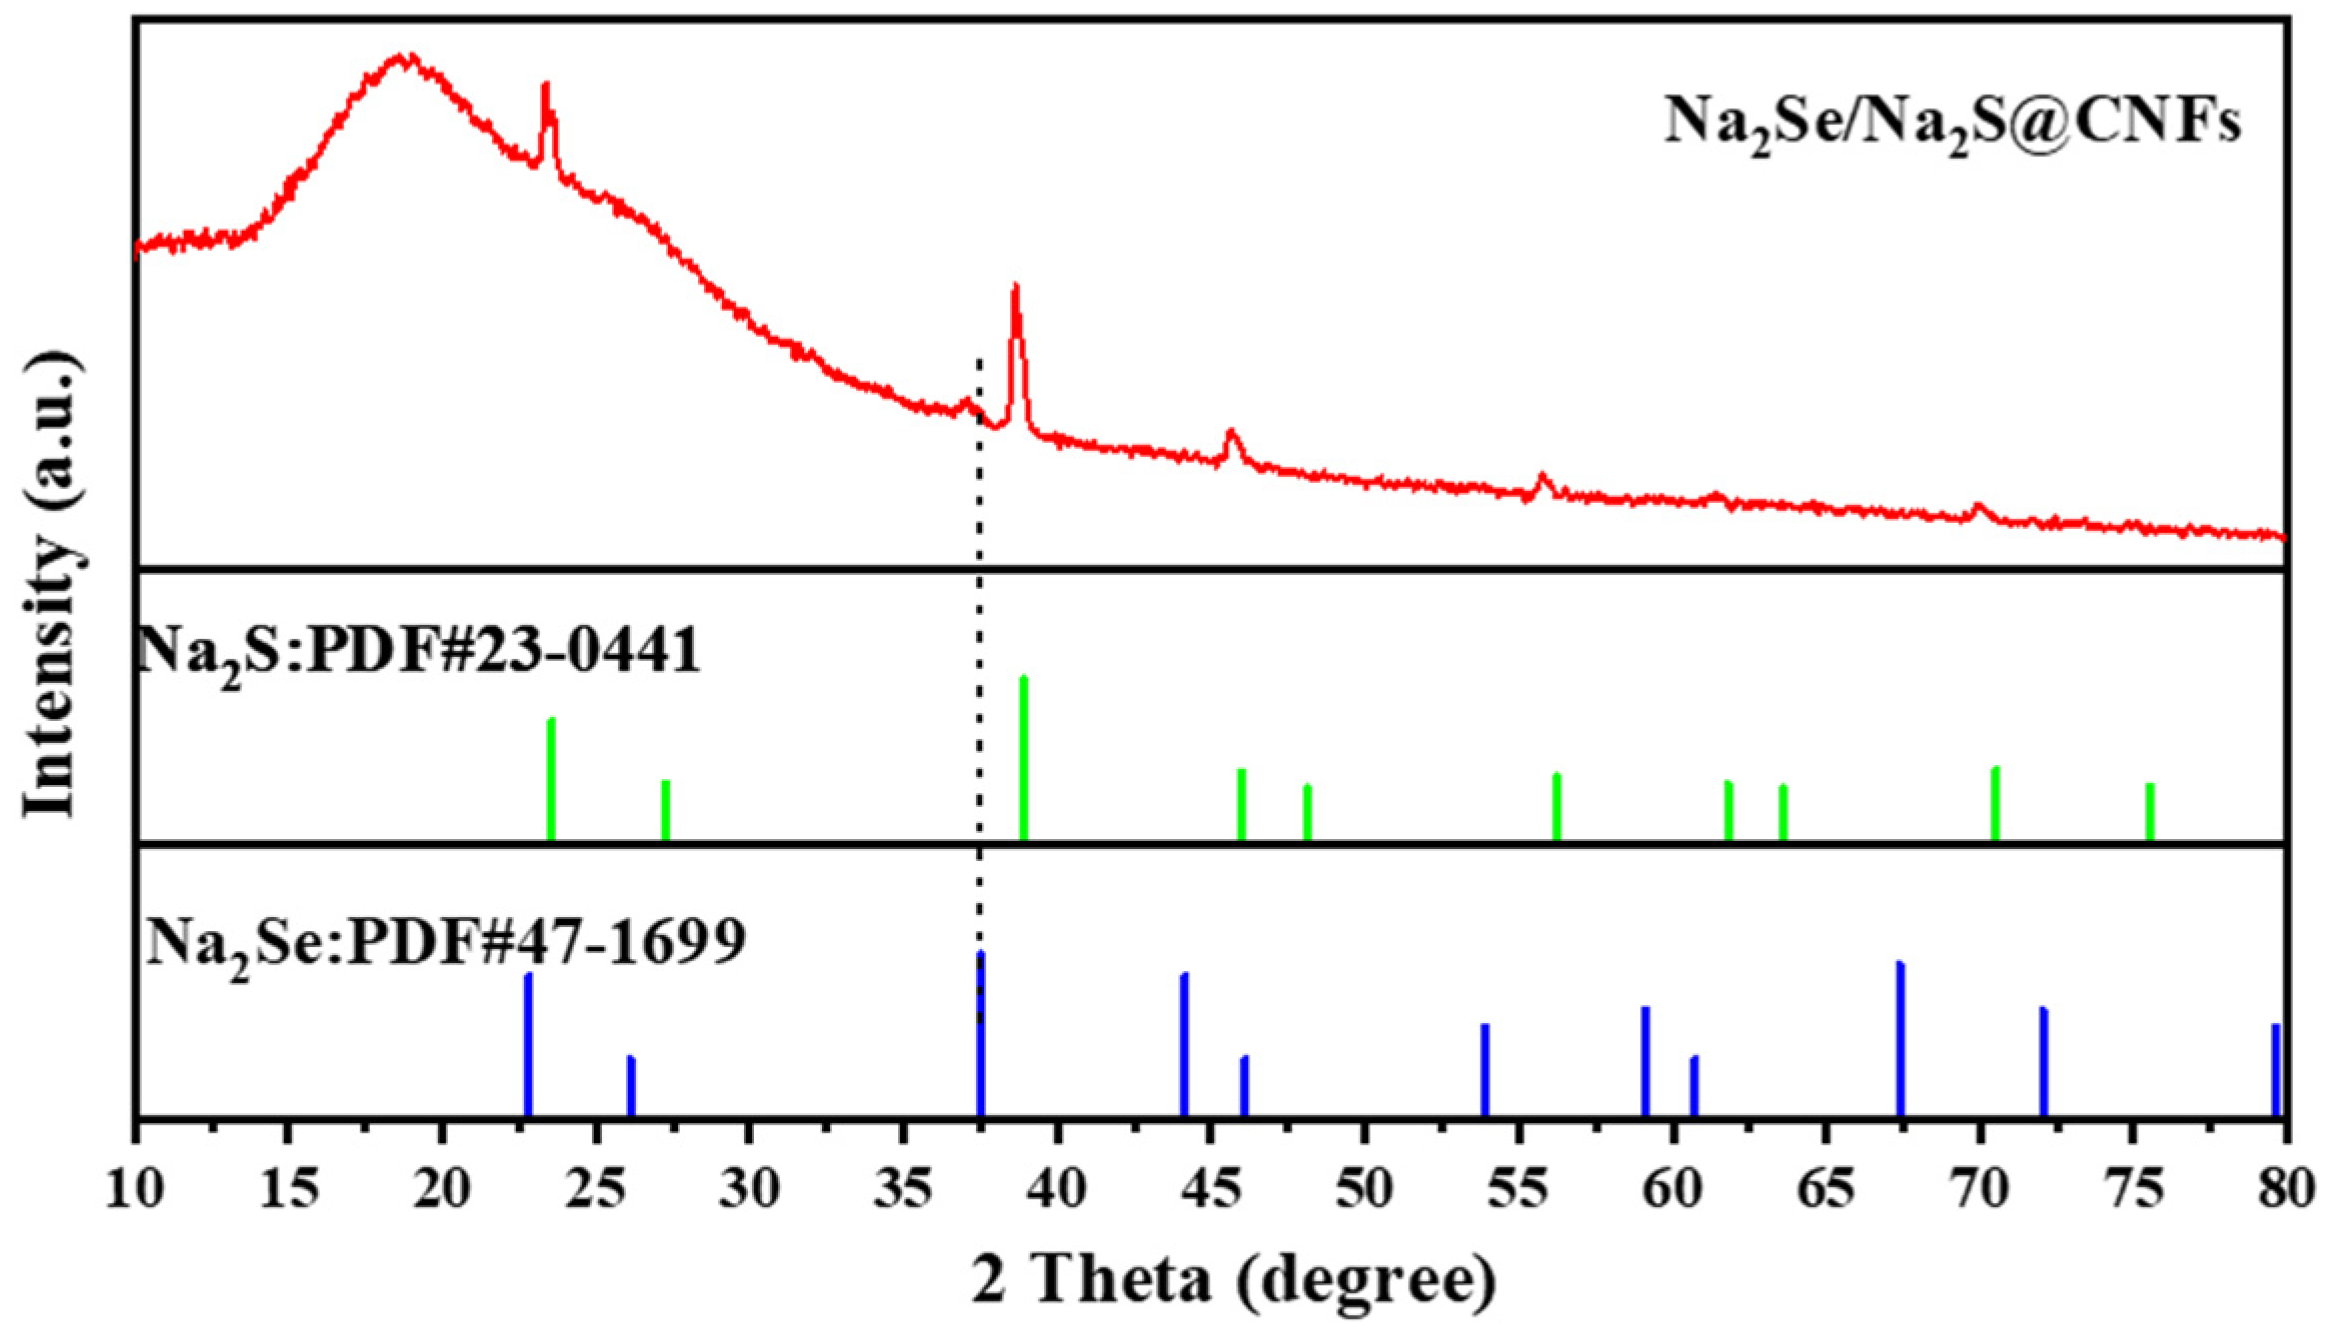
As shown in Figure 2, the XRD of the Na2Se/Na2S@CNF composite is basically consistent with the standard pattern of Na2S (PDF#23-0441). No diffraction peaks of Na2SO4 are observed, indicating a high conversion rate during the carbothermic reduction process. Compared with the standard pattern of Na2Se (PDF#47-1669), only one main peak is present for Na2Se, and this diffraction peak is broadened, which may be attributed to the relatively small content and small particle size of Na2Se. Apart from Na2S and Na2Se, no other impurity peaks are found in the XRD pattern, confirming that the material has been successfully prepared.
Figure 2.
XRD pattern of Na2Se/Na2S@CNFs.
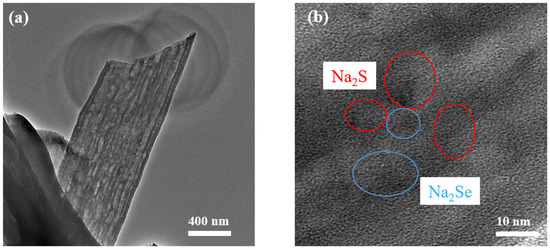
A microstructural analysis of the material was carried out by TEM. Figure 3a shows that the diameter of the Na2Se/Na2S@CNF composite nanofibers is approximately 700 nm. TEM analysis also reveals that the fiber diameters of the two samples differ considerably. As shown in Figure 3b, Na2S and Na2Se are dispersed as fine particles within the nanofibers of the Na2Se/Na2S@CNFs. Meanwhile, the lattice fringes of Na2S and Na2Se are continuous at the interface with no obvious gaps, indicating that Na2S and Na2Se exist in the material in the form of heterojunctions.
Figure 3.
(a) TEM and (b) HRTEM images of Na2Se/Na2S@CNFs.
The lattice fringe spacings observed in the TEM images are 0.341 nm and 0.327 nm, corresponding to the (200) crystal planes of Na2Se and Na2S, respectively. These results were verified by fast Fourier-transform (FFT) patterns and inverse FFT analysis (Figure S1).
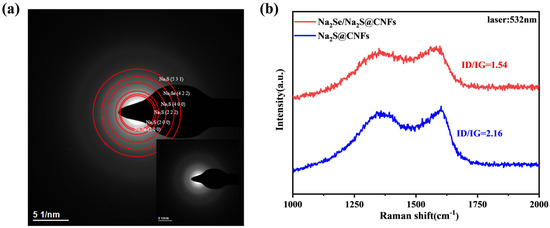
To further investigate the microcrystalline structure of the Na2Se/Na2S@CNF material, a selected area electron diffraction (SAED) analysis was performed (Figure 4a). In the SAED pattern, no sharp and clear diffraction rings were observed; instead, diffuse diffraction halos predominated, indicating that the overall crystallinity of the sample was limited. This is consistent with the amorphous nature of the carbon nanofiber matrix and the small grain size of the active components.
Figure 4.
(a) SAED image and (b) Raman spectroscopy of Na2Se/Na2S@CNFs.
The Raman analysis (Figure 4b) shows that there are characteristic peaks at 1354 cm−1 and 1594 cm−1, corresponding to the D band (disordered structure) and G band (ordered structure) of graphite, respectively. The ID/IG ratio of Na2Se/Na2S@CNFs is lower than that of Na2S@CNFs, indicating that the introduction of Na2Se promotes the graphitization of the carbon matrix to a certain extent, which is beneficial to electron conduction.
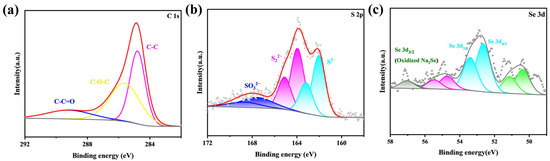
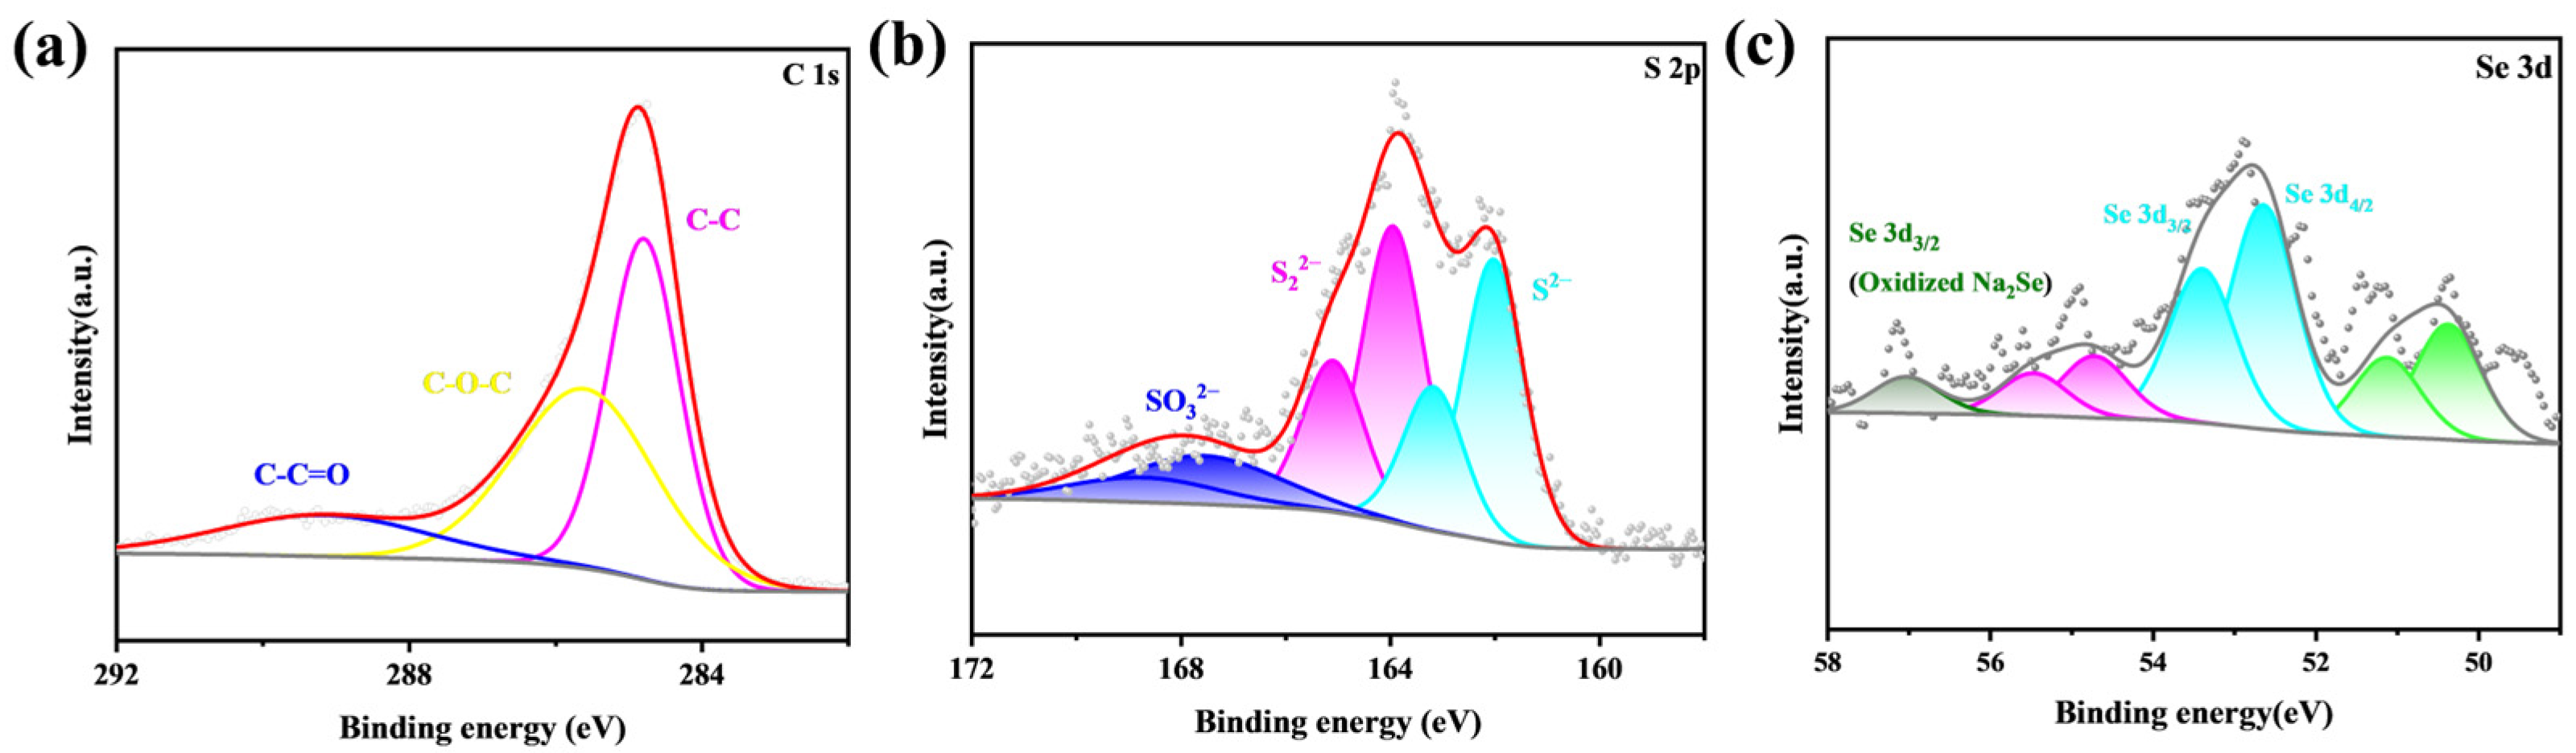
In the Na2Se/Na2S@CNFs (Figure 5), the S 2p spectrum shows doublets at 161.9 eV and 163.2 eV, which can be assigned to S2− originating from Na2S in the sample, whereas the doublets at 163.8 eV and 165.1 eV correspond to S22−, attributable to Na2S2 (which may be formed by the partial decomposition of Na2S during high-temperature heating). The Se 3d spectrum confirms the presence of Na2Se in the sample [16]. Compared with Na2Se/Na2S@CNFs, in the S 2p spectrum of Na2S@CNFs, the doublets with binding energies at 161.3 eV and 162.5 eV arise from Na2S in the sample; the doublets at 163.3 eV and 164.4 eV originate from Na2S2. In addition, the doublets at higher binding energies are attributed to the partial oxidation of Na2S in air or unreduced Na2SO4. The Na2S content in Na2Se/Na2S@CNFs was determined by calculating the mass change before and after water washing: the total mass fraction of the active components (Na2S and Na2Se) in the composite is approximately 66 wt%. Among them, the mass fraction of Na2S is about 55 wt%, from which the molar ratio of Na2S to Na2Se is estimated to be approximately 8:1 (Table S1).
Figure 5.
High-resolution XPS spectra of (a) C 1s, (b) S 2p and (c) Se 3d for Na2Se/Na2S@CNFs.
3.2. Electrochemical Performance Analysis
To more objectively evaluate the influence of the intrinsic structural design of the cathode material on electrochemical performance and to eliminate, as much as possible, interference from the electrolyte on the test results, this study employed a superior localized high-concentration electrolyte (LHCE) for cell assembly and testing.
This electrolyte can effectively suppress polysulfide shuttling, thereby more faithfully reflecting the performance advantages of the as-prepared cathode materials. Likewise, prior to cycling, the Na2Se/Na2S@CNF cathode was subjected to an activation treatment by charging from the open-circuit voltage to 3.2 V, in order to overcome the high energy barrier required for Na2S activation, activate part of the difficult-to-activate Na2S, increase the capacity of the sodium–sulfur battery, and thereby enable better performance during subsequent cycling [17].
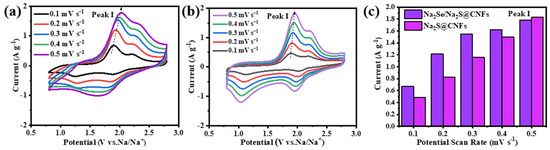
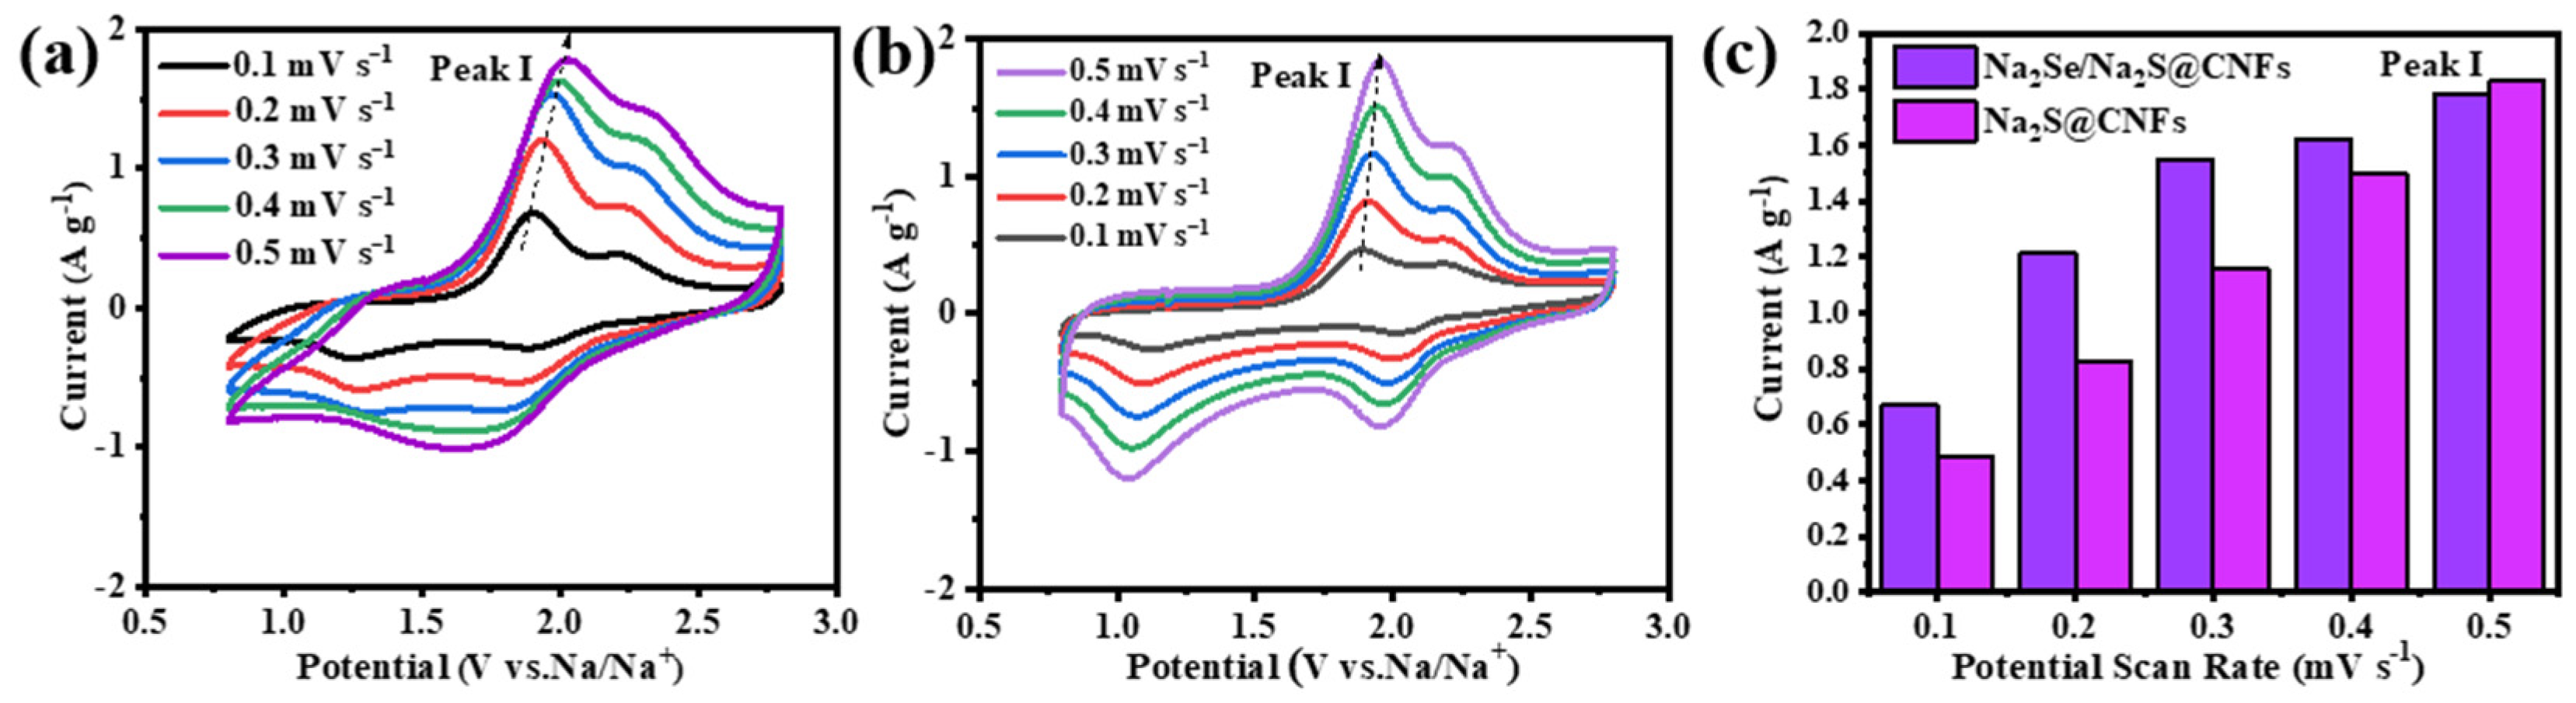
As shown in Figure S2, the initial charge–discharge curves of the Na2Se/Na2S@CNF cathode at 0.1 C indicate that the initial charge capacity of this cathode is 664 mAh g−1, higher than the 408.0 mAh g−1 of Na2S@CNFs. This is attributed to the stronger metallic character and better conductivity of selenium; the introduction of Na2Se improves the electronic conductivity of the material, allowing Na2S to release a higher capacity during activation. The electrochemical reaction mechanism of the Na2Se/Na2S@CNF cathode was investigated by CV. Compared with Na2S@CNFs, Na2Se/Na2S@CNFs exhibit smaller voltage polarization and a sharper oxidation peak, indicating that Na2Se lowers the reaction energy barrier and accelerates charge transfer. The Na+ diffusion kinetics were analyzed from CV curves at different scan rates (Figure 6a,b). At low scan rates, Na2Se/Na2S@CNFs and Na2S@CNFs show similar oxidation and reduction peaks; however, as the scan rate increases, the reduction peak of Na2Se/Na2S@CNFs changes. Further comparison of the peak current of oxidation peak I (Figure 6c) shows that Na2Se/Na2S@CNFs exhibit higher peak currents at different scan rates, indicating that Na2Se improves the conversion reaction kinetics of Na2S.
Figure 6.
CV curves of (a) Na2Se/Na2S@CNFs and (b) Na2S@CNFs tested at different scan rates; (c) peak currents of the electrochemical process (I: Na2Sx → S8).
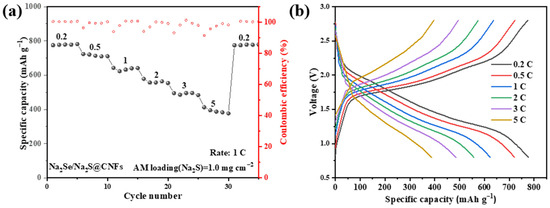
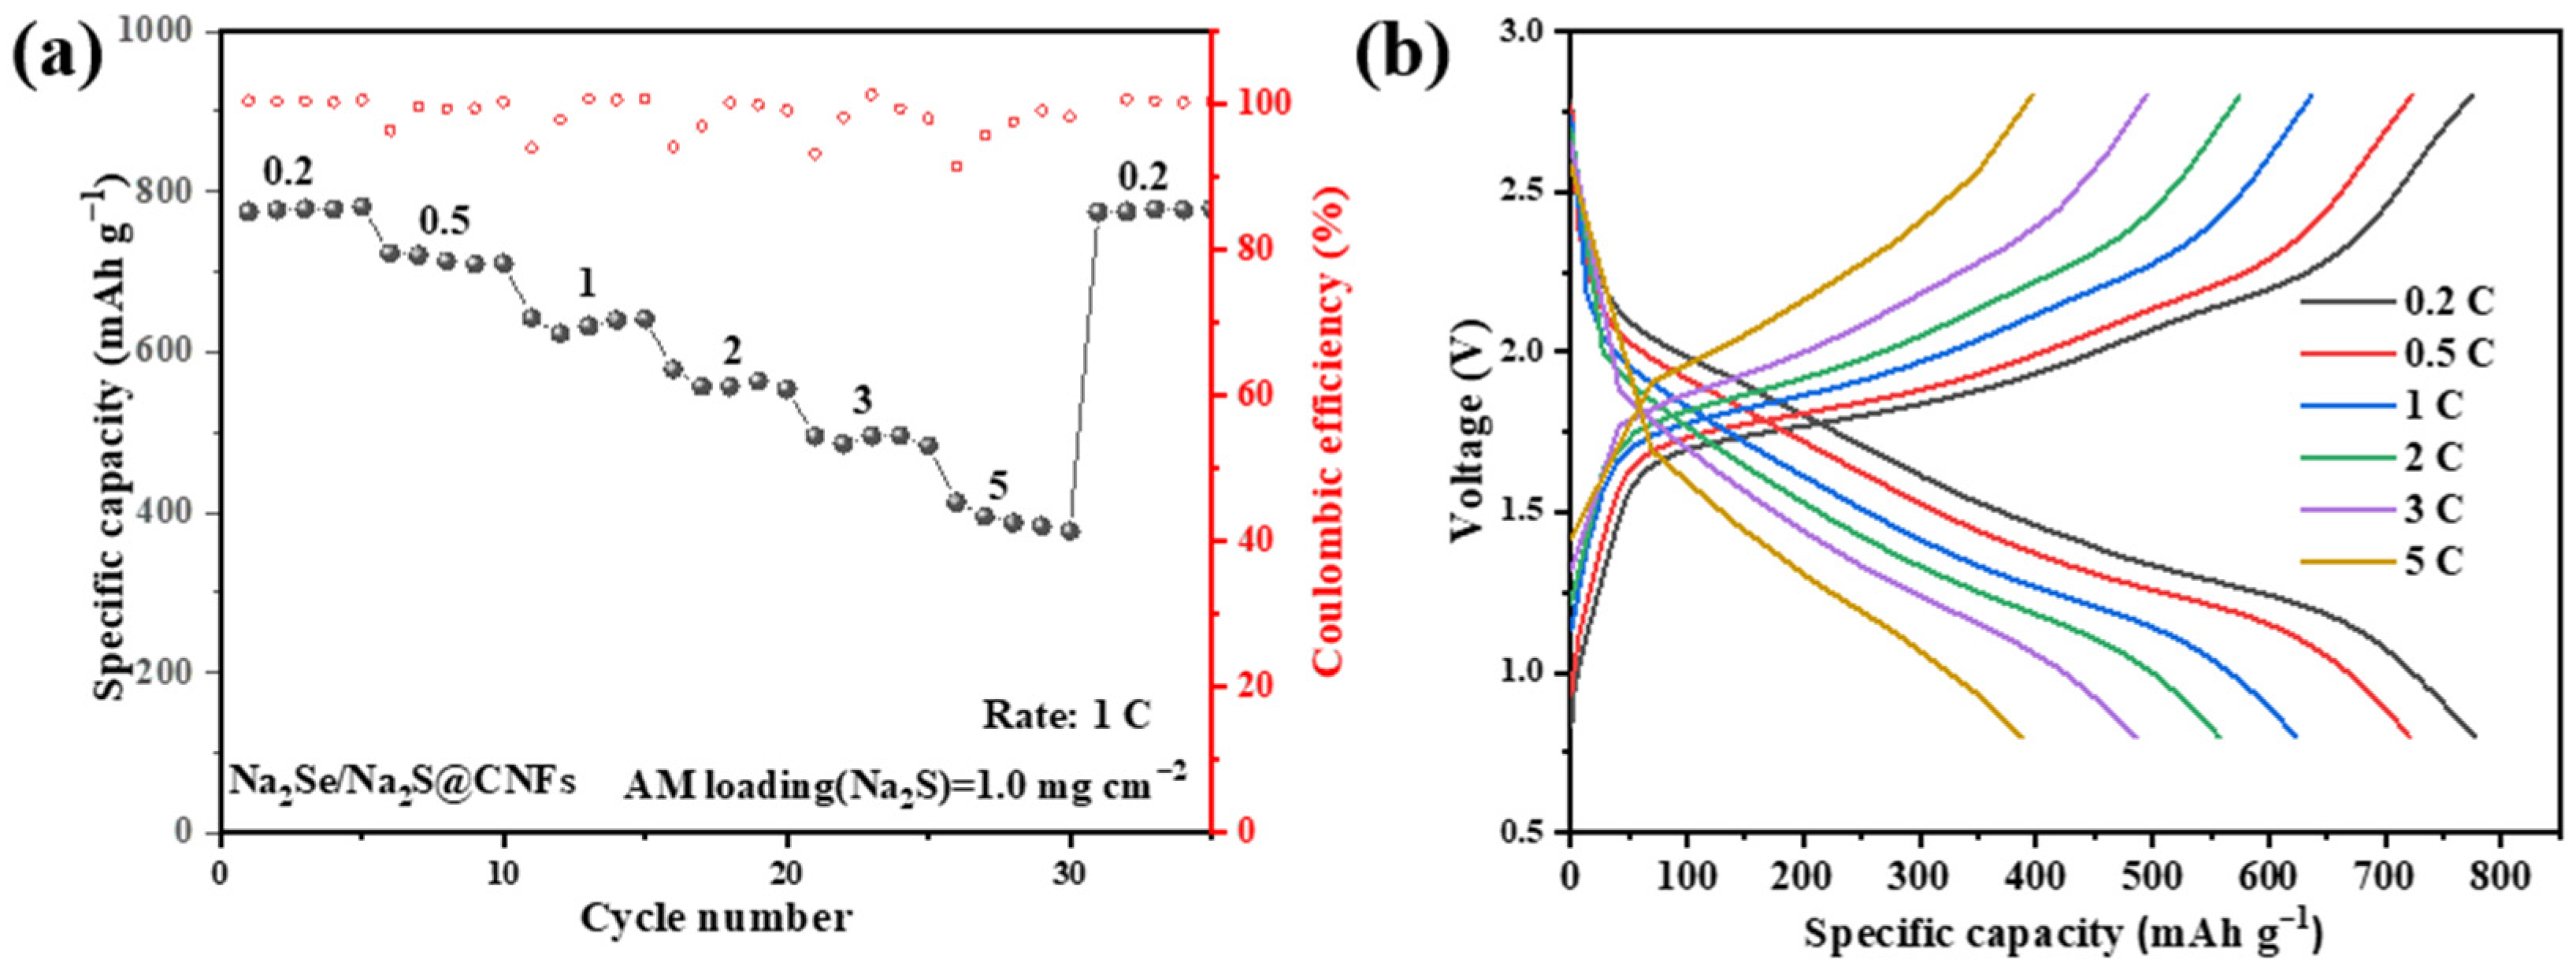
As shown in Figure 7a, the Na2Se/Na2S@CNF cathode material exhibits excellent rate performance. At current densities of 0.2, 0.5, 1, 2, 3, and 5 C, the reversible specific capacities are 774, 722, 636, 574, 494, and 396 mAh g−1, respectively. When the current density is returned from 5 C to 0.2 C, the specific capacity quickly recovers to its original level, indicating the superior rate capability of the Na2Se/Na2S@CNF material and its potential for good adaptability and reliability in practical applications. In addition, the charge–discharge curves of Na2Se/Na2S@CNFs at different current densities (Figure 7b) remain essentially stable.
Figure 7.
(a) Rate performance of Na2Se/Na2S@CNFs at current rate from 0.2 to 5 C; (b) charge–discharge curves of Na2Se/Na2S@CNFs at different current rates.
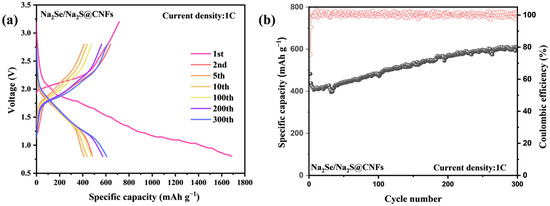
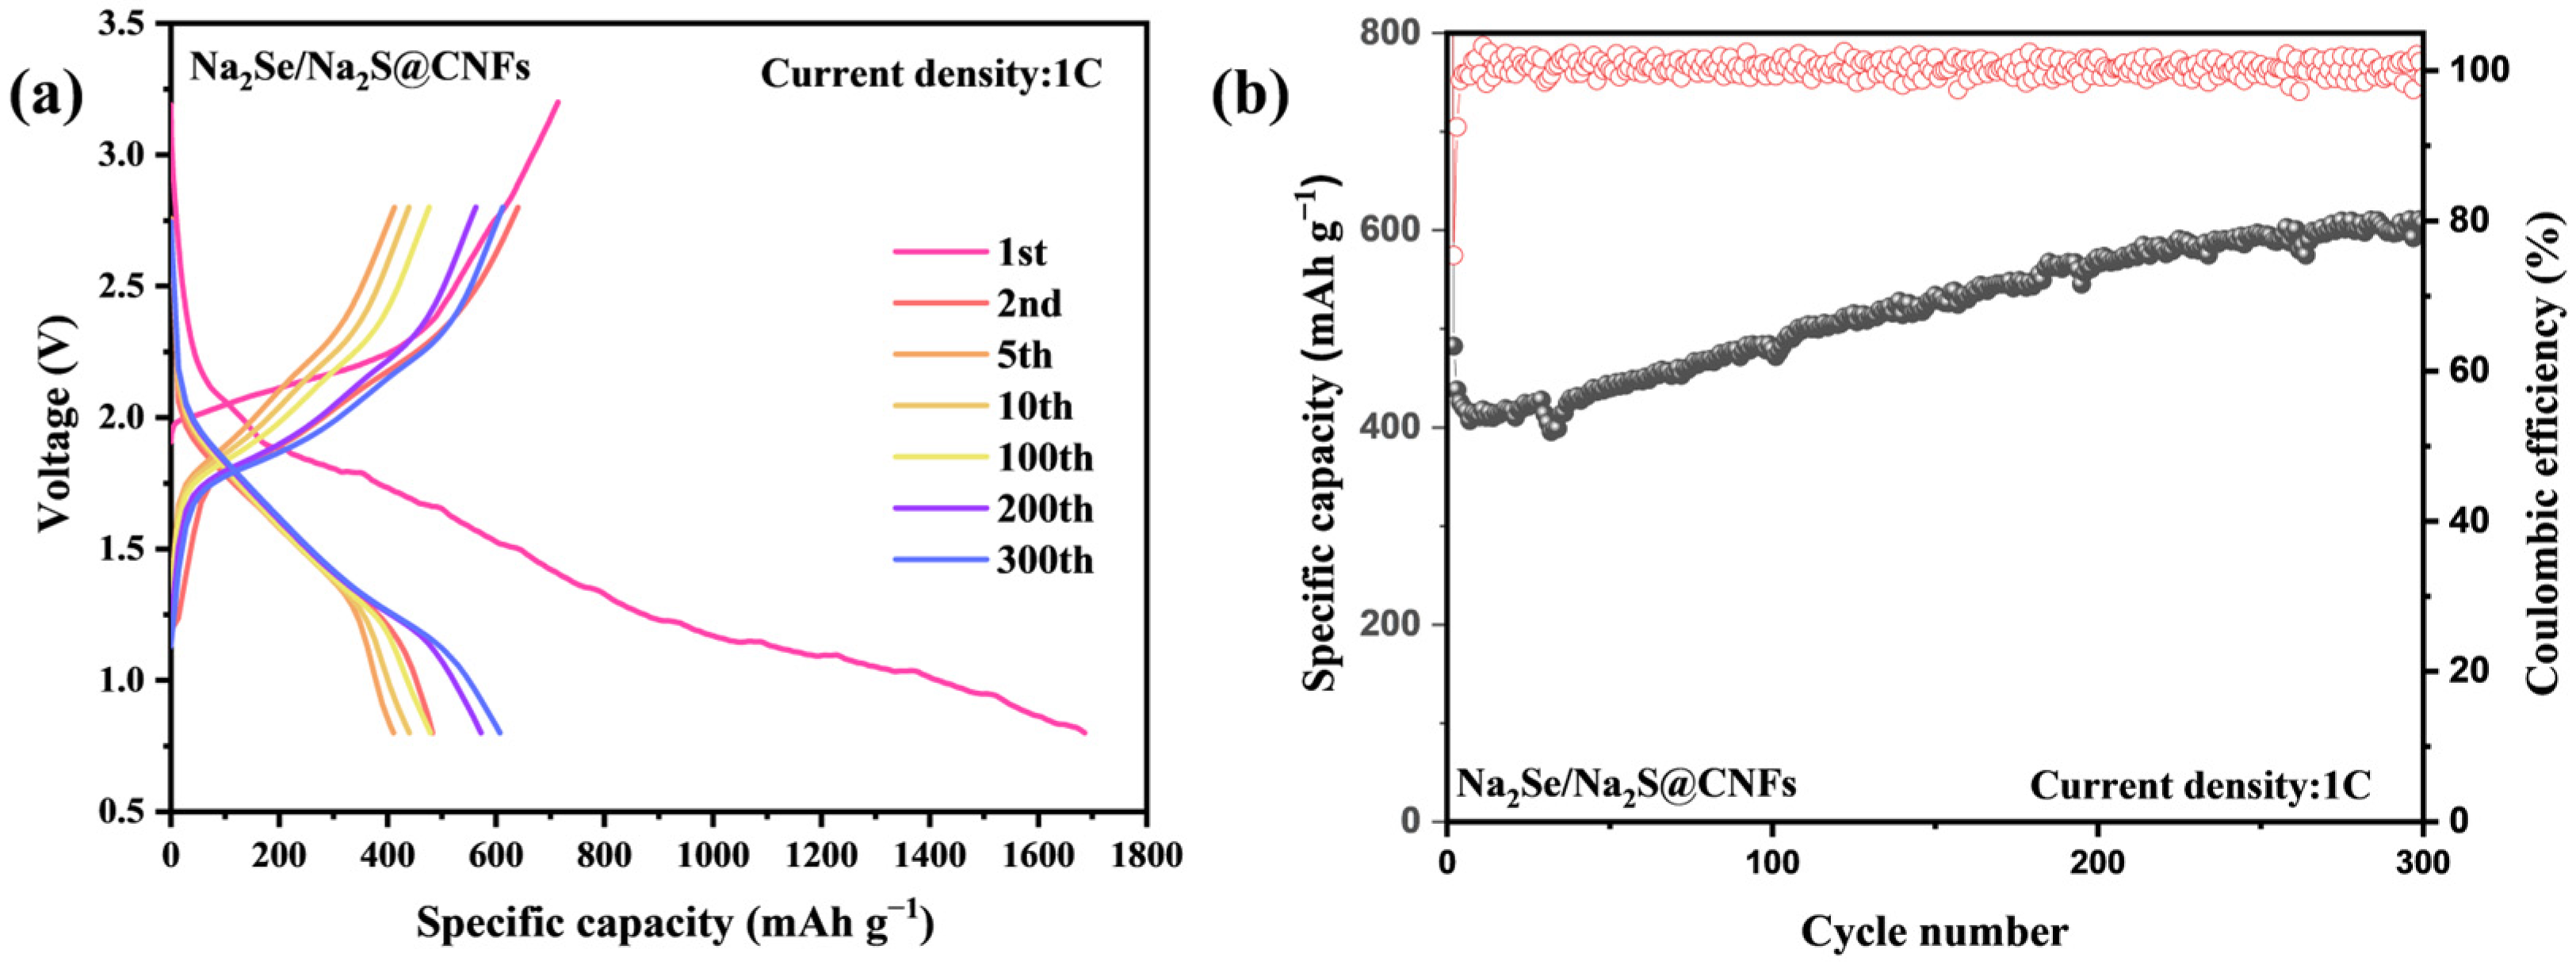
The Na2Se/Na2S@CNF sample exhibits outstanding cycling performance. After 300 cycles at 1 C, it still maintains a high reversible capacity of 600 mAh g−1 (Figure 8), far exceeding the capacity retention of Na2S@CNFs (347 mAh g−1). These results demonstrate that the Na2Se/Na2S@CNF cathode material exhibits excellent capacity delivery and remarkable cycling stability.
Figure 8.
(a) Charge–discharge curves of Na2Se/Na2S@CNFs at different cycle numbers; (b) long-cycle performance of Na2Se/Na2S@CNFs at 1 C.
As shown in Figure S3, after 50 cycles at 0.1 C, the fiber morphology of the Na2Se/Na2S@CNF cathode remains intact, with no obvious structural collapse or agglomeration. Meanwhile, the elemental mapping results show that C, Se, Na, and S are highly uniformly distributed in the cathode. The battery capacity increases during the cycling process. This phenomenon is primarily attributed to the gradual activation of the electrode material during the initial cycling stages. As the charge–discharge process proceeds, the electrolyte progressively penetrates deeper into the porous carbon nanofiber network, wetting more of the Na2S/Na2Se active sites that were initially inaccessible. This also indirectly reflects the homogeneity of the active material distribution within the material. This evidence fully demonstrates the structural stability of the fiber material, and although the introduced Na2Se is relatively small in amount, its uniform distribution helps accelerate the conversion and redistribution of polysulfides during cycling. Such a uniform and stable electrode structure is the foundation for ensuring the long-term cycling life of the battery.
3.3. Reaction Kinetics Analysis
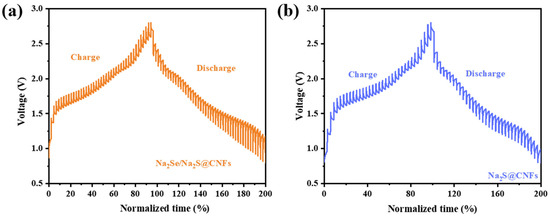
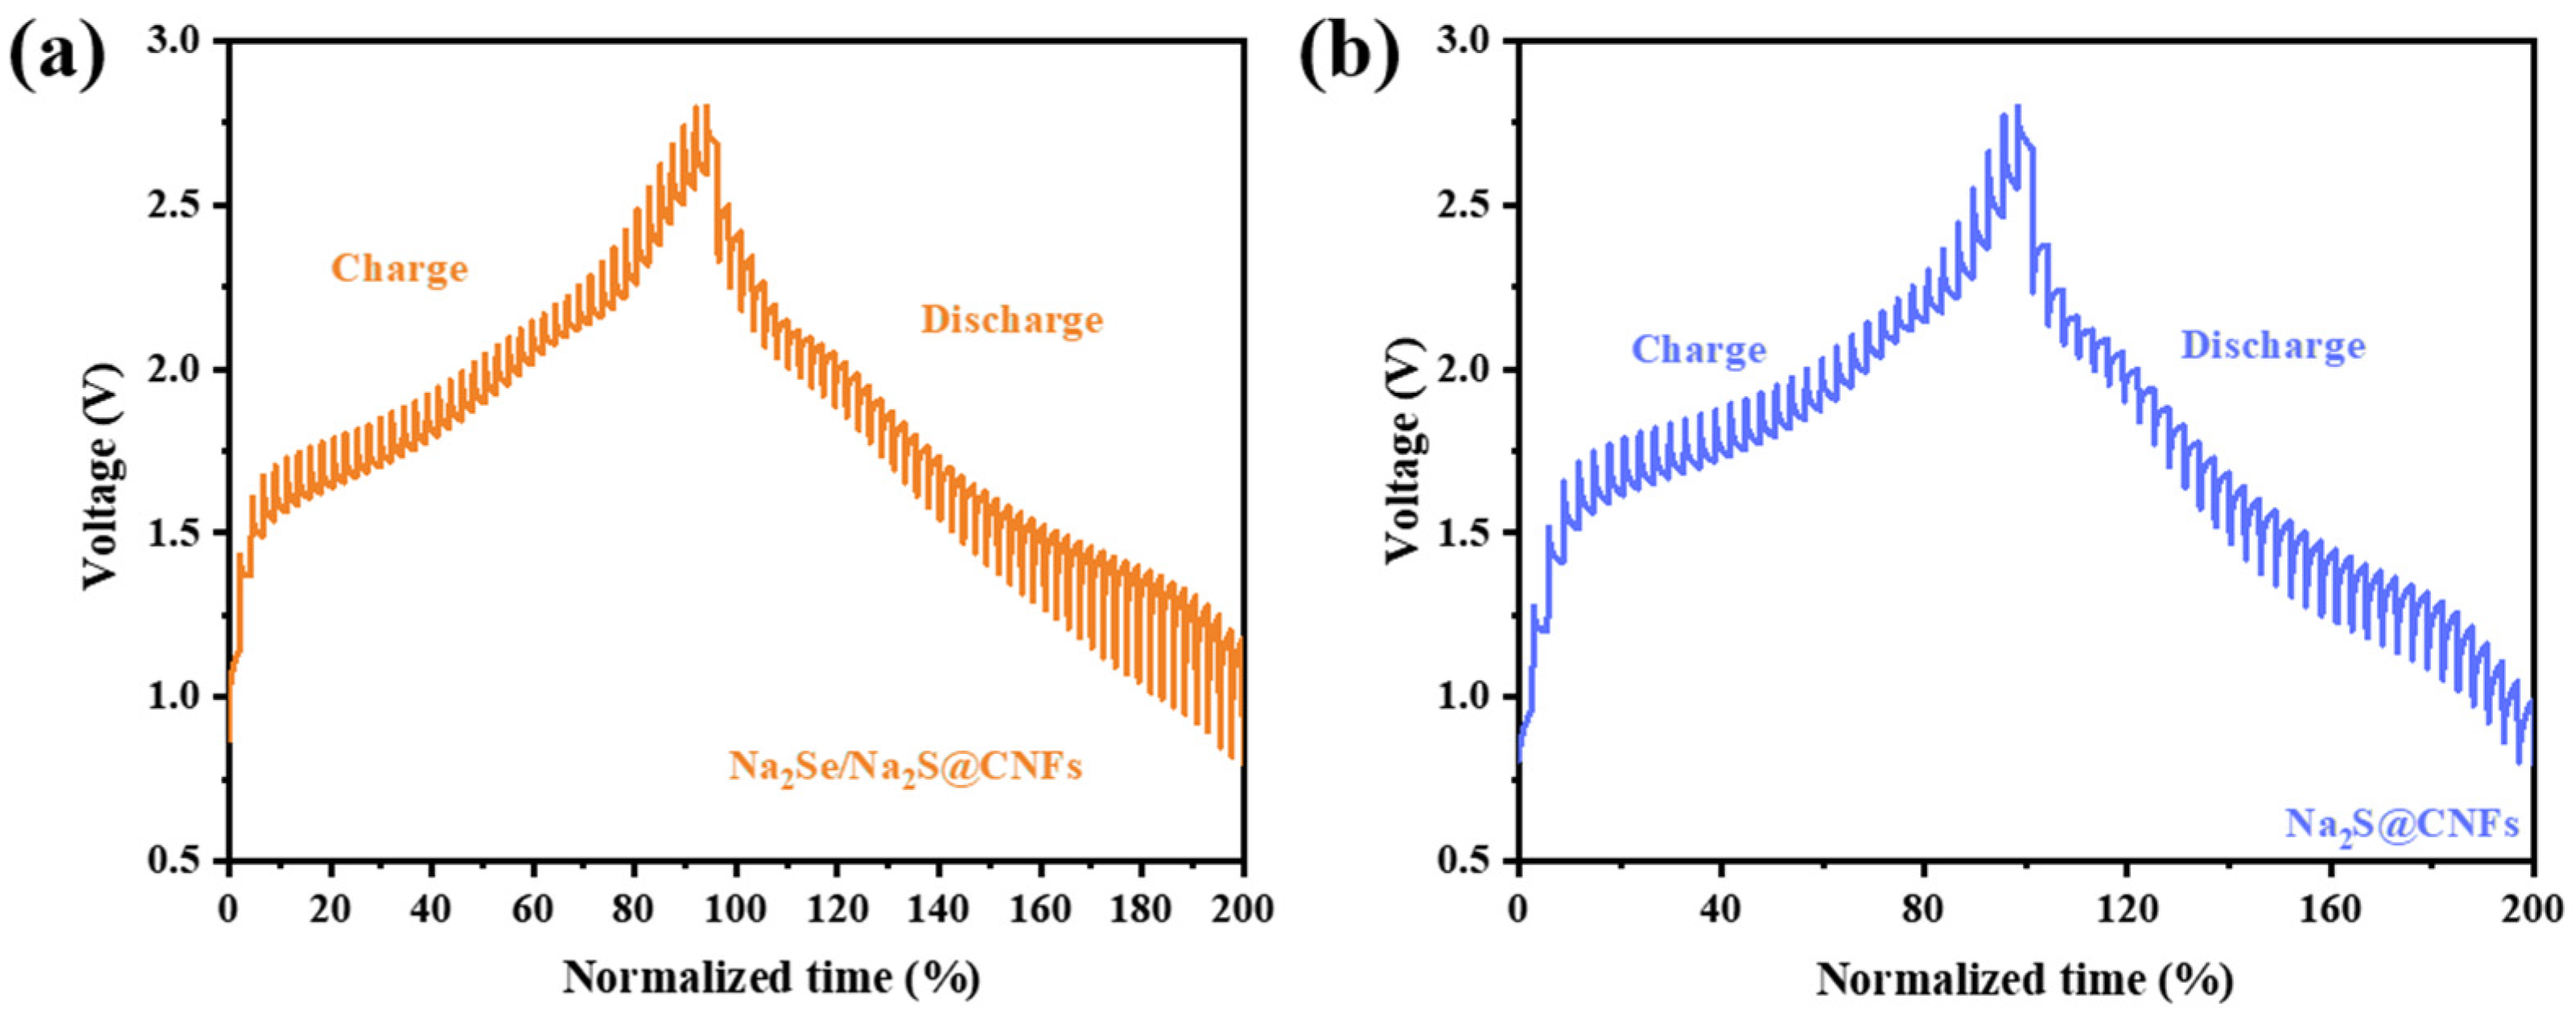
As mentioned above, Na2Se reduces electrochemical polarization and facilitates Na2S activation during the activation process, thereby promoting the oxidative decomposition of Na2S, improving the utilization of active materials, and releasing more capacity. To further reveal the differences in Na+ diffusion kinetics among different host materials, GITT was employed to characterize the electrodes (Figure 9).
Figure 9.
GITT curve of (a) Na2Se/Na2S@CNFs and (b) Na2S@CNFs.
The GITT curves clearly show that Na2Se/Na2S@CNFs exhibit lower polarization voltage during charge–discharge cycling, indicating faster ion diffusion kinetics and better electrochemical reaction reversibility, thus further confirming the significant promoting effect of Na2Se introduction on the reaction kinetics.
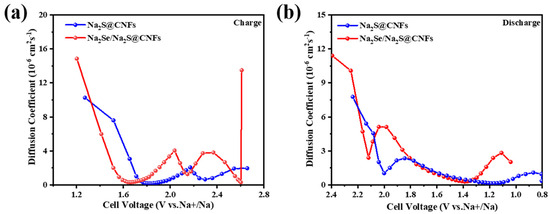
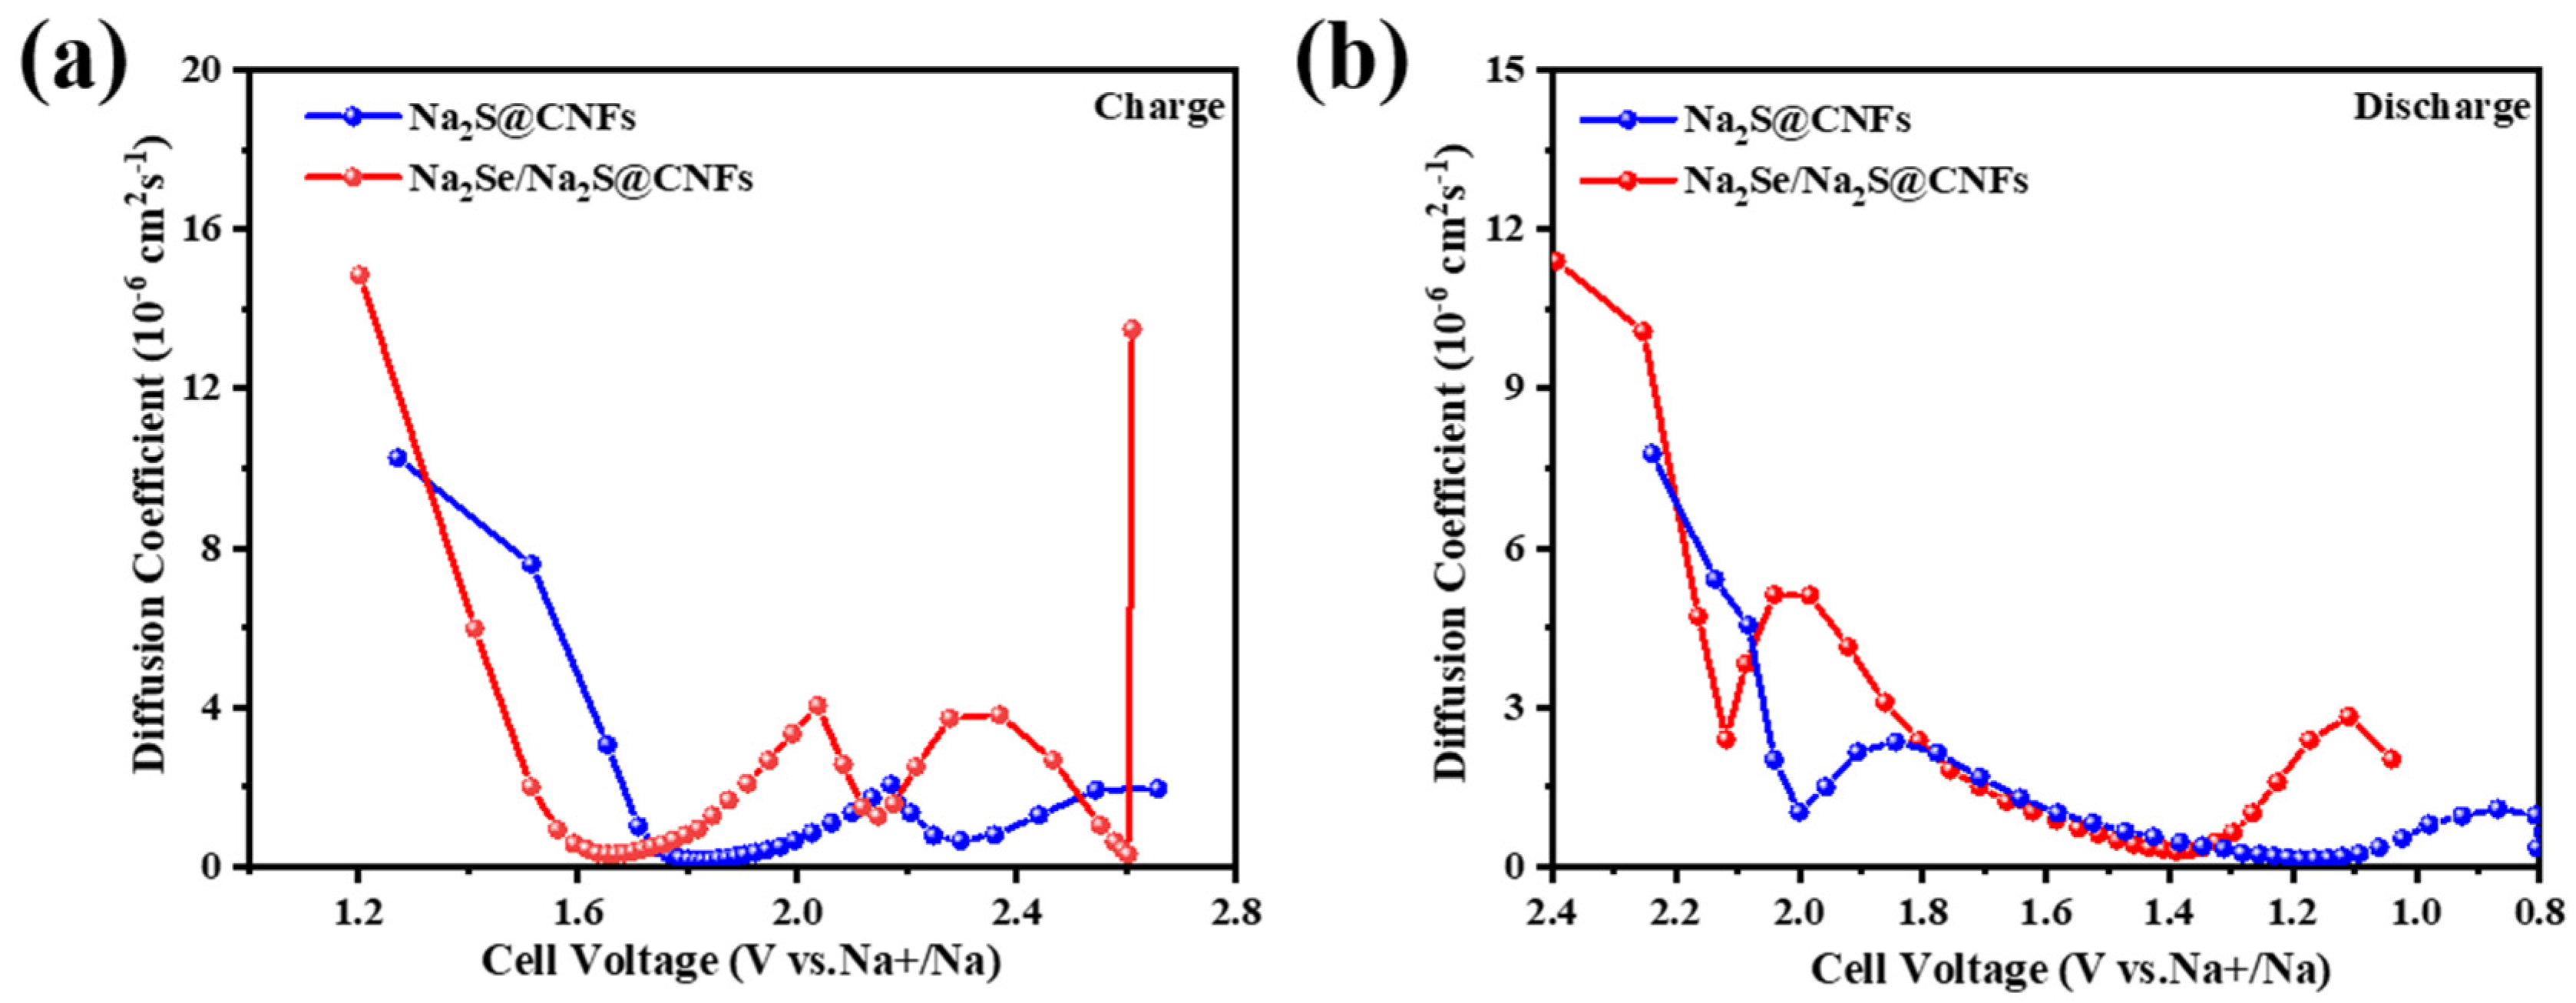
To further investigate the kinetic performance of the electrode materials, the sodium-ion diffusion coefficient (DNa+) was calculated and compared using GITT data combined with Fick’s second law. This diffusion rate is a physical quantity used to measure the speed of sodium-ion movement within the electrode material; a faster rate implies that the battery can withstand higher charge/discharge currents, enabling fast charging or high-power output. As shown in Figure 10, at the initial stage of charging, the DNa+ value of Na2Se/Na2S@CNFs is significantly higher than that of Na2S@CNFs. In the subsequent low-voltage region, its DNa+ is slightly lower than that of the comparison sample, but immediately afterwards, in a relatively large high-voltage region, its diffusion coefficient is clearly higher than that of Na2S@CNFs. This result directly demonstrates that the presence of Na2Se significantly promotes the activation of Na2S and its conversion kinetics. During the discharge process, the DNa+ of Na2Se/Na2S@CNFs is also higher than that of Na2S@CNFs at the initial stage, and when discharged to the low-voltage region of 0.8 V, its diffusion coefficient still maintains an advantage.
Figure 10.
Calculated Na+ diffusion coefficients for Na2Se/Na2S@CNFs||Na and Na2S@CNFs||Na batteries under (a) charging and (b) discharging.
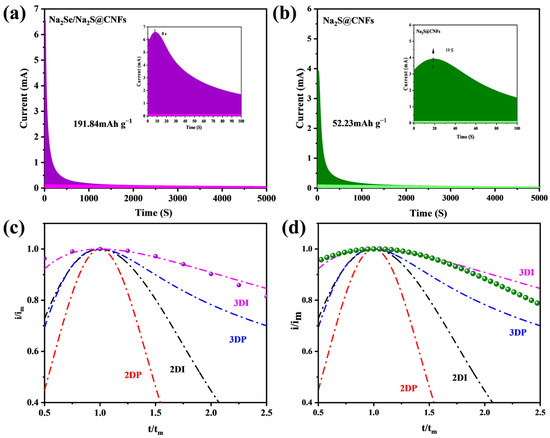
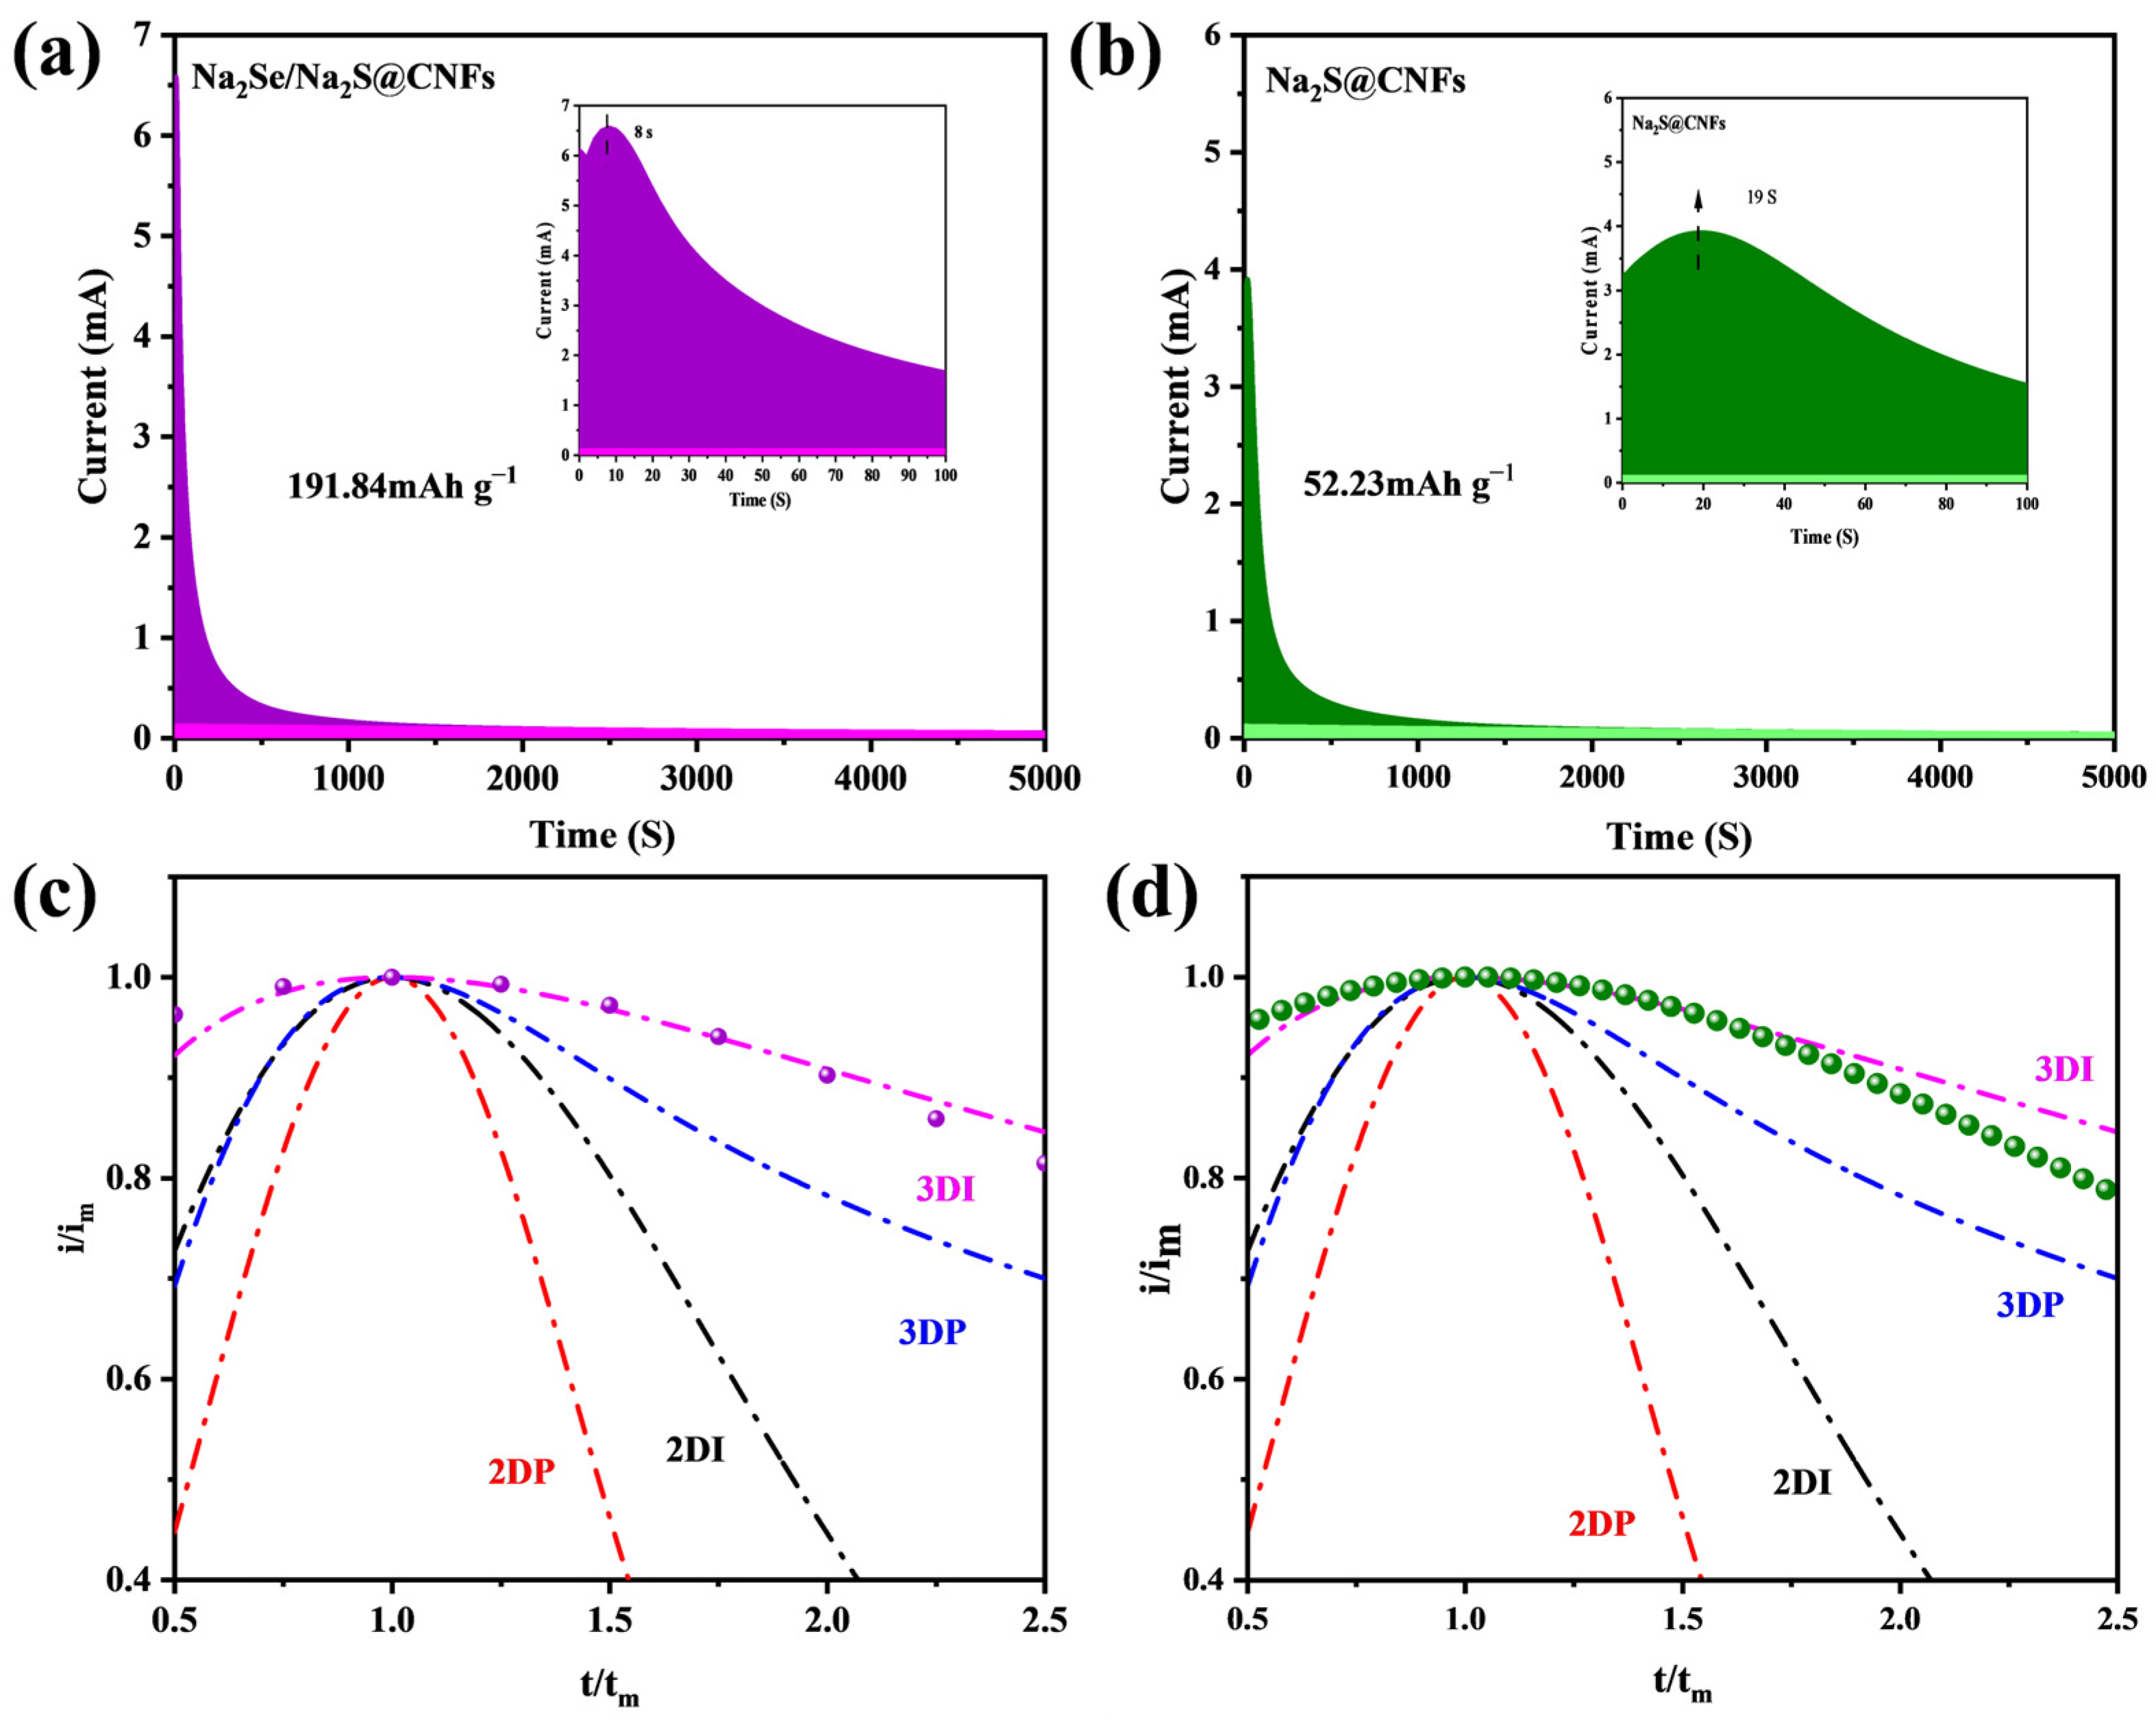
To further investigate the electrodeposition kinetics of Na2S, we studied the nucleation efficiency of Na2S through potentiostatic nucleation analysis. The conversion of short-chain Na2S2 to Na2S is the main source of capacity during discharge. To distinguish the electrodeposition of Na2S from the reduction of Na2S6 in the solution, the battery was first galvanostatically discharged to 1.0 V at C/24 rate, followed by electrodeposition at a fixed potential of 0.8 V.
The nucleation capacity calculated according to Faraday’s law shows that the nucleation capacity of Na2Se/Na2S@CNFs is 191.84 mAh g−1, which is greater than the 52.23 mAh g−1 of Na2S@CNFs. In addition, the Na2Se/Na2S@CNF cathode exhibits an earlier nucleation response, fully demonstrating that Na2Se has excellent electrocatalytic activity toward short-chain sodium polysulfides, effectively accelerating the reduction kinetics of Na2S (Figure 11a,b). The superior kinetics can promote the conversion of short-chain Na2S2 to Na2S, which can provide more capacity for the battery during discharge. To further explore the regulation mechanism of Na2Se/Na2S@CNFs on the deposition pathway of Na2S, we analyzed the dimensionless current–time transient curves obtained from potentiostatic discharge and fitted them to four classical electrochemical deposition models (Figure 11c,d). Among them, the 2D instantaneous nucleation and 2D progressive nucleation models involve two-dimensional planar growth, while the 3D instantaneous nucleation and 3D progressive nucleation models describe diffusion-controlled three-dimensional hemispherical nucleation and growth. The fitting results indicate that the Na2S precipitation process on both electrodes does not conform to the 2D nucleation models, suggesting that the nucleation process may not depend on specific crystal planes. The deposition process on Na2Se/Na2S@CNFs conforms to the 3D instantaneous nucleation model, whereas the deposition behavior on Na2S@CNFs lies between 3D instantaneous nucleation and 3D progressive nucleation. This result strongly demonstrates that the generated Na2Se exerts a significant synergistic regulation effect on Na2S nucleation, guiding it toward a more uniform and kinetically favorable instantaneous nucleation mode.
Figure 11.
Na2S nucleation tests based on (a) Na2Se/Na2S@CNFs and (b) Na2S@CNFs; dimensionless current–time transient curves for (c) Na2Se/Na2S@CNFs and (d) Na2S@CNFs.
The elemental distribution indicates that the material deposited on the cathode surface is Na2S. Compared with the irregular, blocky Na2S growth morphology on the Na2S@CNF cathode, the Na2Se/Na2S@CNF electrode surface forms a flat and uniform Na2S deposition layer (Figures S4 and S5), indicating that Na2Se induces a more uniform and denser nucleation process.
To investigate the kinetic issues during the charge–discharge process, in situ EIS measurements were employed. As shown in Figures S6 and S7, the impedance of the Na2Se/Na2S@CNFs cathode throughout the entire charge–discharge process is lower than that of Na2S@CNFs. This is because the introduction of Na2Se increases the electronic conductivity of the cathode and simultaneously accelerates the conversion of NaPSs, directly reducing the electron transport resistance within the electrode. The impedance of the Na2Se/Na2S@CNF cathode gradually decreases during charging, which is attributed to the extraction of sodium ions, leading to the progressive oxidation of poorly conductive Na2S into polysulfides and, ultimately, to elemental sulfur. During discharge, the impedance gradually increases because insulating Na2S gradually deposits on the electrode surface and on the nanofibers, covering active sites and physically blocking electron transport pathways. However, the presence of Na2Se enhances the conductivity of the insulating products throughout the charge–discharge process and promotes the conversion of intermediates, thereby suppressing excessively rapid impedance growth. This is the intrinsic reason why the Na2Se/Na2S@CNF electrode exhibits excellent rate performance and cycling stability.
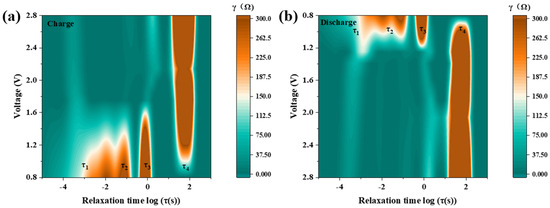
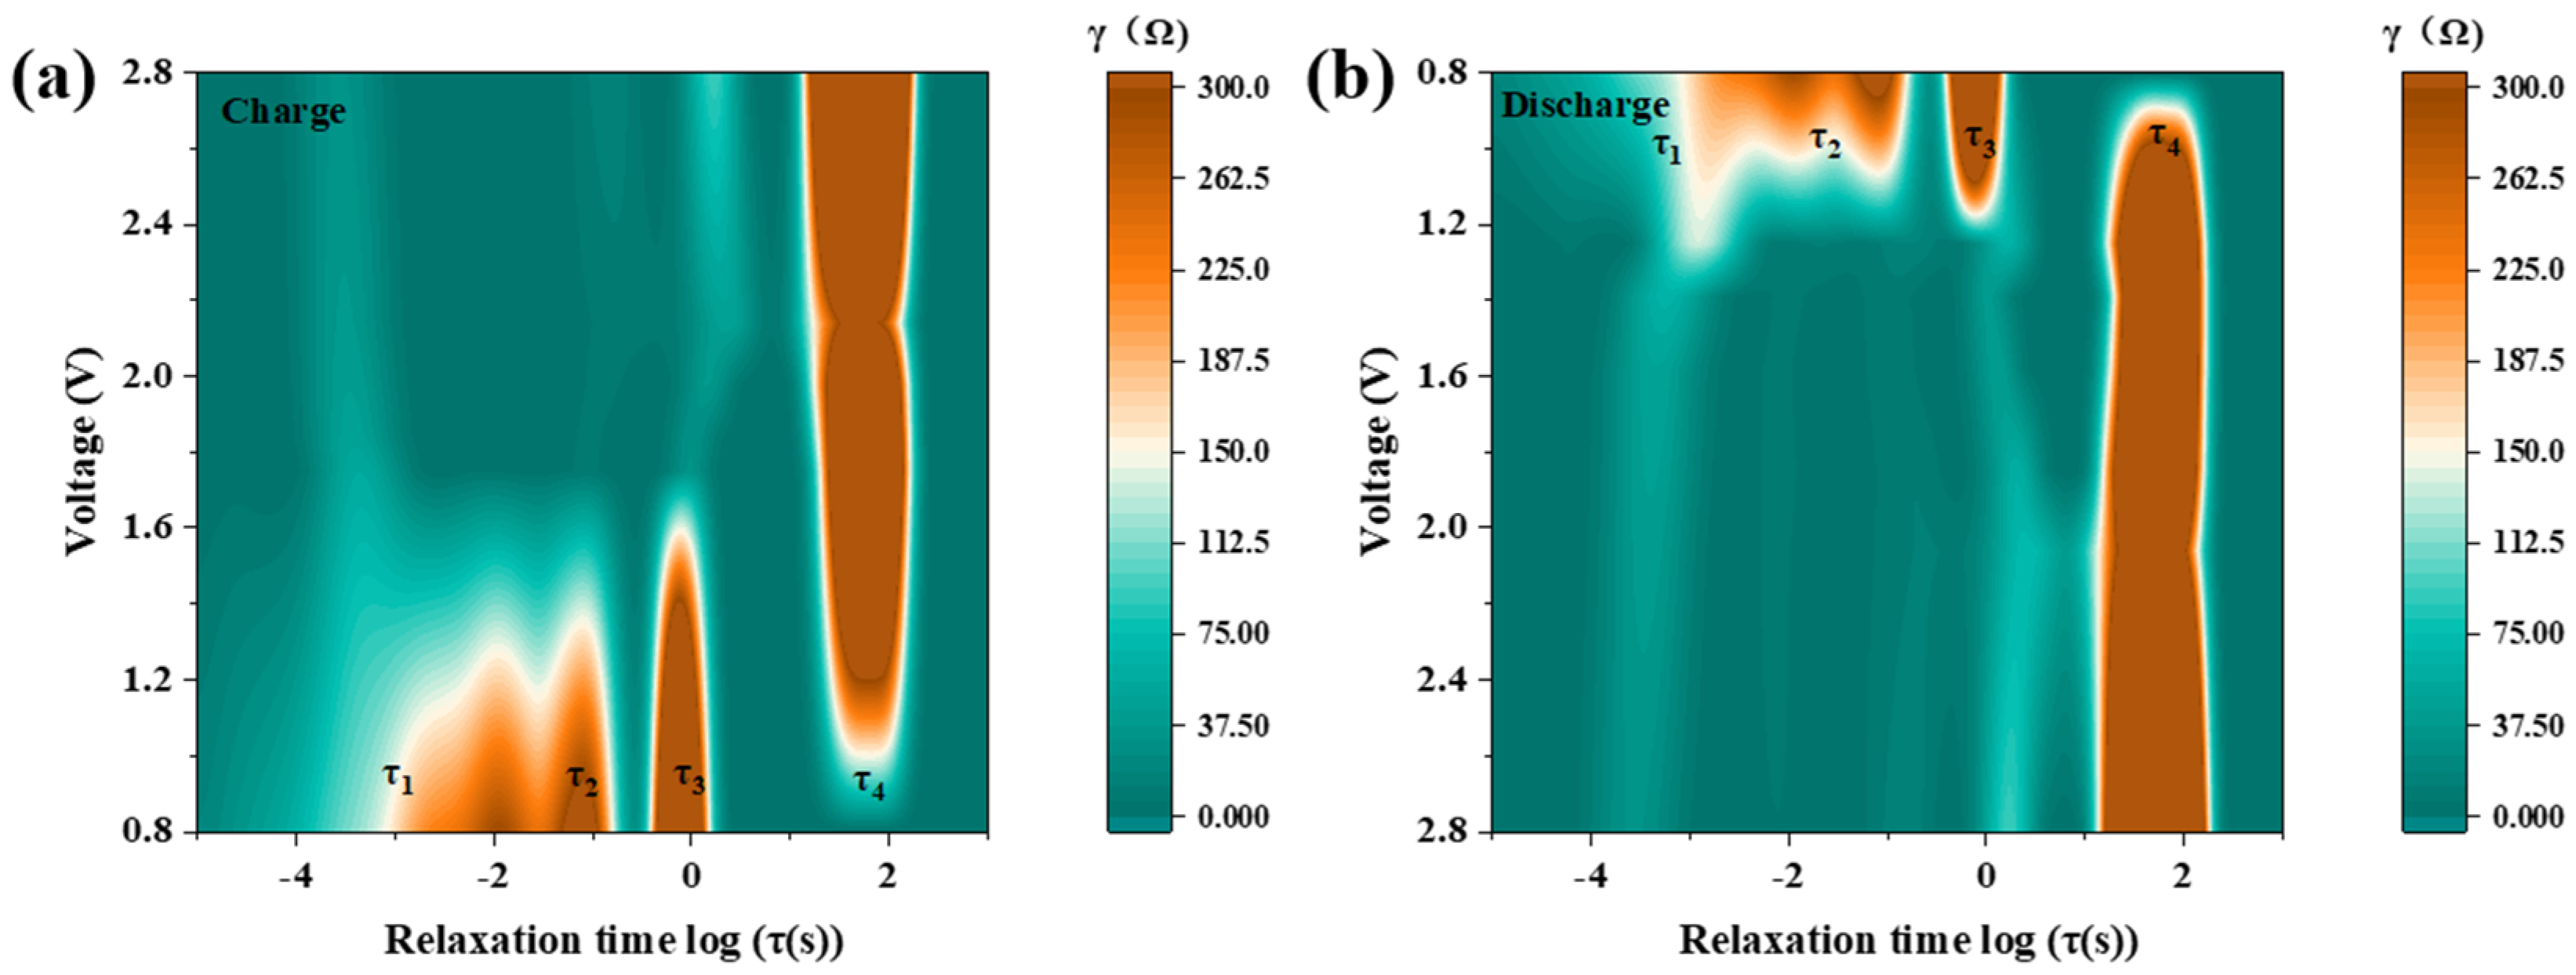
The DRT method was further employed to conduct an in-depth analysis of the impedance evolution during the charge–discharge cycling process (Figure 12). DRT decomposes the total impedance into different time scales, and the four observed characteristic time constants correspond to the cathode charge-transfer impedance (τ1, τ2), polysulfide diffusion impedance (τ3), and ionic diffusion impedance (τ4), respectively [18].
Figure 12.
DRT analyses of Na2Se/Na2S@CNFs during (a) charging and (b) discharging processes.
At the initial stage of charging (Na2S → short-chain NaPSs), Na2Se/Na2S@CNFs exhibit a relatively high τ1 value, which is attributed to the fact that the electrode surface is covered with insulating Na2S, requiring electrons to pass through the Na2S layer to initiate the desodiation reaction. However, its τ4 value is lower, because Na2Se may contribute to improved apparent ion-transport kinetics.
When charged to approximately 1.2 V, all impedance values except τ4 decrease, as Na2S is gradually consumed and kinetically more favorable short-chain polysulfides are generated. The recovery of the conductive network makes charge transfer exceptionally facile. As the charging voltage reaches around 2.4 V, the concentration of polysulfides in the cathode region decreases, and the reduction in reactant concentration leads to an increase in the impedance value corresponding to τ3 in the DRT. For Na2Se/Na2S@CNFs, because it can rapidly convert these polysulfides, the increase in τ3 is much smaller than that of the comparison sample.
When charging approaches 2.8 V, the impedance does not rise sharply compared with Na2S@CNFs. This is attributed to the electronic conductivity provided by Se, ensuring that even at high potentials, charge can be transferred rapidly to complete the final reaction steps. Therefore, the presence of Se effectively suppresses interface degradation caused by sluggish kinetics through improving electronic conductivity and catalyzing polysulfide conversion.
As the reaction proceeds to the discharge stage (S8 → NaPSs → Na2S), NaPSs are gradually reduced, eventually depositing solid, highly insulating Na2S on the electrode surface. Although the impedance of Na2Se/Na2S@CNFs increases during discharge, compared with Na2S@CNFs, the increases in τ1, τ2, and τ3 for Na2Se/Na2S@CNFs are smaller and their final values are lower. In Na2S@CNFs, due to the lack of catalysis from Na2Se, polysulfide conversion is slower, which may lead to uneven Na2S deposition and the formation of large agglomerates. In contrast, the slower impedance rise in Na2Se/Na2S@CNFs demonstrates that Na2Se can improve conductivity and catalyze conversion, also playing a critical role in optimizing kinetics and suppressing interface degradation during discharge.
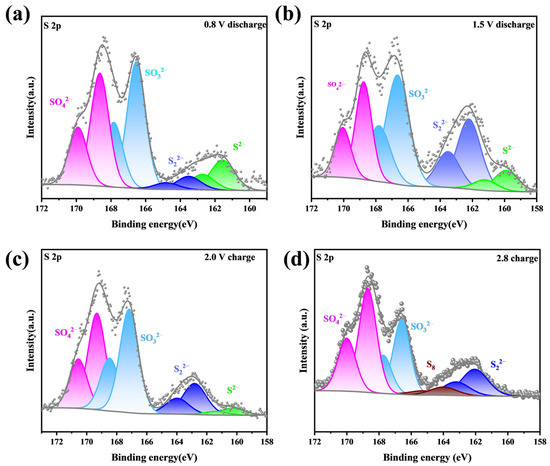
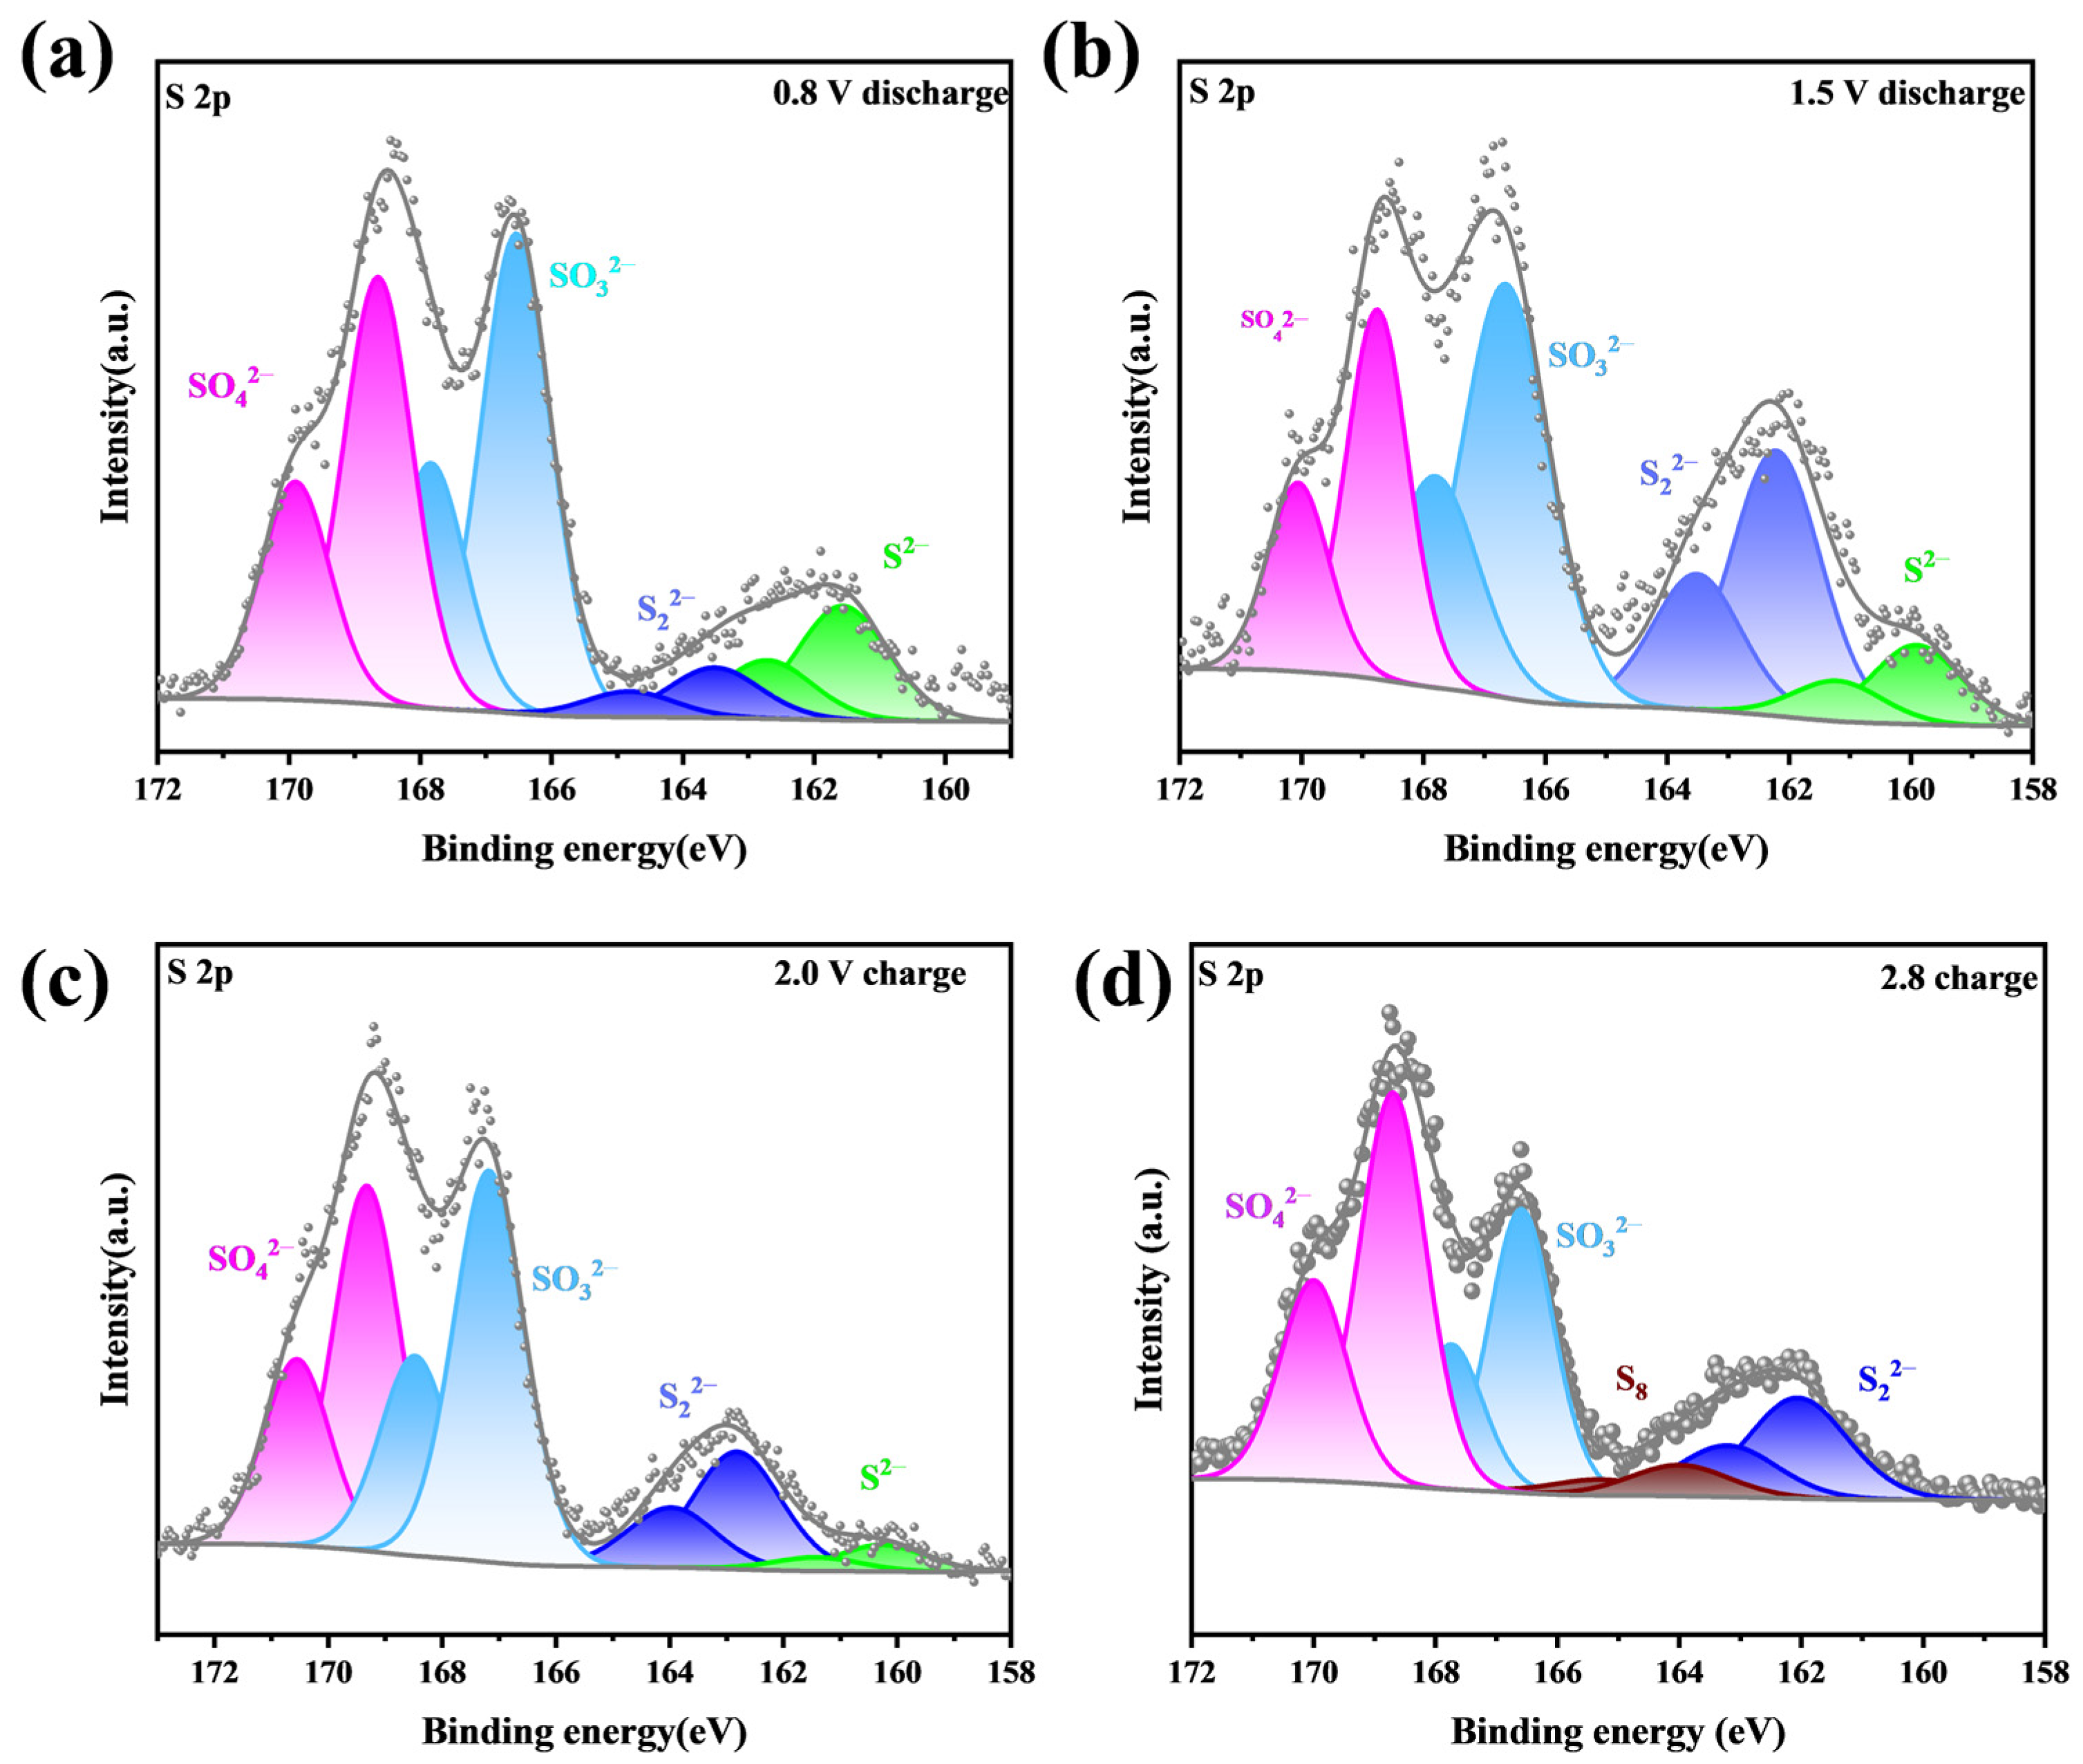
To further elucidate the state of the Na2Se/Na2S@CNF material at different potentials, ex situ XPS was employed to analyze the evolution of intermediates during charge–discharge (Figure 13). When the battery is charged to 2.0 V, characteristic doublets corresponding to both Na2S and sodium polysulfides are present in the sample, indicating the onset of oxidation of the solid-state discharge product. When charged to 2.8 V, the characteristic peaks of Na2S in the Na2Se/Na2S@CNF electrode disappear completely and are converted to S8 peaks, indicating that the reaction is nearly complete. In contrast, the doublets at 160.1 eV and 161.1 eV persist in Na2S@CNFs, indicating the presence of unreacted Na2S. The introduction of Na2Se significantly improves the reaction kinetics of this step by enhancing the electronic conductivity of Na2S, effectively promoting the reaction process and thus improving the utilization of active materials. When discharged to 1.5 V, the S8 in the Na2Se/Na2S@CNF electrode has been completely reduced to short-chain NaPSs, whereas the control Na2S@CNF sample still shows obvious residual S8 signals, indicating sluggish reaction kinetics in the absence of Na2Se. Until the final discharge state of 0.8 V, no S8 signal is detected in either sample, confirming the completeness of the reaction. The introduction of Na2Se improves the ionic/electronic conductivity of the cathode and optimizes the redox kinetics of the sulfur cathode, which is key to enhancing the overall reaction efficiency.
Figure 13.
(a) S 2p spectra of Na2Se/Na2S@CNFs charged to 2.0 V; (b) S 2p spectra of Na2Se/Na2S@CNFs charged to 2.8 V; (c) S 2p spectra of Na2Se/Na2S@CNFs discharged to 1.5 V; (d) S 2p spectra of Na2Se/Na2S@CNFs discharged to 0.8 V.
4. Conclusions
In this study, Na2Se/Na2S@CNF composite cathode materials were successfully fabricated, and their structural features and electrochemical performance were systematically investigated. The results reveal that the porous carbon coating and the highly graphitized carbon fiber skeleton synergistically construct an efficient electron/ion transport network while potentially helping mitigate polysulfide loss. More importantly, the Na2Se component induces Na2S to grow via a three-dimensional instantaneous nucleation mode, forming a uniform and compact deposition layer, which significantly enhances the active material utilization and cycling stability. Benefiting from these advantages, the Na2Se/Na2S@CNFs deliver a specific capacity of 396 mAh g−1 at a high rate of 5 C and retain 600 mAh g−1 after 300 cycles at 1 C, demonstrating outstanding rate capability and long-term cycling stability. In future work, we will systematically optimize the electrode architecture to achieve higher areal loadings and evaluate the electrochemical performance under practical conditions, including lean electrolyte and high-mass-loading configurations. This work provides new insights into the design of cathode materials for room-temperature sodium–sulfur batteries.
Supplementary Materials
The following supporting information can be downloaded at: https://www.mdpi.com/article/10.3390/en19163762/s1, Figure S1. (a) FFT Spectrum of Na2Se; (b) lattice stripes of Na2Se; (c) FFT Spectrum of Na2S; (d) lattice stripes of Na2S. Figure S2. Charge-discharge curves of (a) Na2Se/Na2S@CNFs and (b) Na2S@CNFs batteries at a 0.1 C rate during the first cycle; CV curves of (c) Na2Se/Na2S@CNFs and (d) Na2S@CNFs tested at 0.1 mV s−1. Figure S3. (a) SEM image and EDS surface distribution mappings of (b) C, (c) O, (d) Na, (e) S, and (f) Se of Na2Se/Na2S@CNFs after 50 cycles at 0.1 C. Figure S4. (a) SEM image of the Na2S deposition layer on Na2Se/Na2S@CNFs and EDS surface distribution mappings of (b) C, (c) Se, (d) Na, and (e) S. Figure S5. SEM image of the Na2S deposition layer on Na2S@CNFs. Figure S6. (a) Charge-discharge curves and (b) impedance at different voltages of Na2Se/Na2S@CNF. Figure S7. (a) Charge-discharge curves and (b) impedance at different voltages of Na2S@CNF. Table S1. Mass ratio of Na2Se/Na2S in Na2Se/Na2S @CNFs.
Author Contributions
Conceptualization, X.Z.; methodology, G.S.; software, X.Z.; validation, X.Z.; formal analysis, X.Z.; investigation, X.Z.; resources, X.Z.; data curation, X.Z.; writing—original draft preparation, X.Z.; writing—review and editing, X.Z.; visualization, X.Z.; supervision, S.L.; project administration, Y.C.; funding acquisition, J.X. All authors have read and agreed to the published version of the manuscript.
Funding
This work was financially supported by the Jiangsu Provincial Science and Technology Program (Major Project) [Grant Number: BG 2024020 and BG 2025022], the Suzhou Science and Technology Program [SYG2024073 and SYG2024027], and the Fundamental Research Funds for the Central Universities [B250201115]. XPS characterizations were supported by Nano-X (Vacuum Interconnected Nanotech Workstation, Chinese Academy of Sciences, Suzhou 215123, China).
Data Availability Statement
The data presented in this study are available on request from the corresponding author due to privacy.
Acknowledgments
The authors gratefully thank Suwan Lu and Guochao Sun for providing technical support.
Conflicts of Interest
The authors declare no conflicts of interest.
References
- Li, Z.; Wang, C.; Ling, F.; Wang, L.; Bai, R.; Shao, Y.; Chen, Q.; Yuan, H.; Yu, Y.; Tan, Y. Room-Temperature Sodium-Sulfur Batteries: Rules for Catalyst Selection and Electrode Design. Adv. Mater. 2022, 34, 2204214. [Google Scholar] [CrossRef] [Scilit]
- Yu, X.F.; Shao, D.Y.; Xu, J.; Cao, J. Recent advances in carbon-based sulfur host materials for lithium-sulfur batteries. Microstructures 2024, 4, 2024030. [Google Scholar] [CrossRef] [Scilit]
- Chen, H.; Wu, J.; Li, M.; Zhao, J.; Li, Z.; Wang, M.; Li, X.; Li, C.; Chen, X.; Li, X.; et al. Heterogeneous structure design for stable Li/Na metal batteries: Progress and prospects. eScience 2025, 5, 100281. [Google Scholar] [CrossRef] [Scilit]
- Jiang, Y.; Zheng, Y.; Tong, L.; Zuo, K.; Tu, M.; Chen, S.; Chen, X.; Wu, J.; Chen, Q.; Li, X.; et al. Coupling Lattice Strain and Sulfur Vacancy in Tin Monosulfide/Reduced Graphene Oxide Composite for High-Performance Sodium-Ion Storage. Energy Environ. Mater. 2025, 8, e12891. [Google Scholar] [CrossRef] [Scilit]
- Wang, M.; Lv, S.; Li, M.; Li, X.; Li, C.; Li, Z.; Chen, X.; Wu, J.; Li, X.; Chen, Y.; et al. A Heterogeneous Quasi-solid-State Hybrid Electrolyte Constructed from Electrospun Nanofibers Enables Robust Electrode/Electrolyte Interfaces for Stable Lithium Metal Batteries. Adv. Fiber Mater. 2024, 6, 727–738. [Google Scholar] [CrossRef] [Scilit]
- Celadon, A.; Sun, H.; Sun, S.; Zhang, G. Batteries for electric vehicles: Technical advancements, environmental challenges, and market perspectives. SusMat 2024, 4, e234. [Google Scholar] [CrossRef] [Scilit]
- Chen, Z.; Yu, Q.; Wang, W.; Zhang, J. Interface Engineering Strategies for Shuttle Mitigation in Alkali Metal–Sulfur Batteries: A Comparative Review from Li–S to Na–S and K–S Systems. Nano-Micro Lett. 2026, 18, 167. [Google Scholar] [CrossRef] [Scilit] [PubMed]
- Chen, Y.; Zhang, C.; Li, C.; Gao, T.; Li, Y.; Jiang, Y.; Niu, J.; Zhang, M.; Yao, S. Enhanced Polysulfide Immobilization and Conversion Enabled by N/O/P Co-Doped Hollow Carbon Nanofibers Hosts in Room-Temperature Na-S Batteries. Carbon 2026, 251, 121354. [Google Scholar] [CrossRef] [Scilit]
- Wang, Y.; Indubala, E.; Ma, C.; Zhang, C.; Xiao, L.; Lv, B.; Yao, S. Electrospun heteroatoms-doped porous carbon nanofiber networks as free-standing and binder-free electrode for room temperature sodium sulfur batteries. J. Energy Storage 2025, 121, 116575. [Google Scholar] [CrossRef] [Scilit]
- Gao, W.; Su, L.; Yu, Y.; Lu, Y.; Liu, X.; Peng, Y.; Xiong, X.; He, J.; Chen, Y.; Wu, Y. Stable Dendrite-Free Room Temperature Sodium-Sulfur Batteries Enabled by a Novel Sodium Thiotellurate Interface. Angew. Chem. Int. Ed. 2024, 63, e202412287. [Google Scholar] [CrossRef] [Scilit] [PubMed]
- Wang, L.; Chen, X.; Li, S.; Yang, J.; Sun, Y.; Peng, L.; Shan, B.; Xie, J. Effect of eutectic accelerator in selenium-doped sulfurized polyacrylonitrile for high performance room temperature sodium-sulfur batteries. J. Mater. Chem. A 2019, 7, 12732–12739. [Google Scholar] [CrossRef] [Scilit]
- Yang, T.; Qi, Y.; Zhong, W.; Tao, M.; Guo, B.; Wu, Y.; Bao, M.; Xu, M. A strategy for polysulfides/polyselenides protection based on Co9S8@SiO2/C host in Na-SeS2 batteries. Adv. Funct. Mater. 2021, 31, 2001952. [Google Scholar] [CrossRef] [Scilit]
- Zhao, Z.; Wang, X.; Jing, X.; Zhao, Y.; Lan, K.; Zhang, W.; Duan, L.; Guo, D.; Wang, C.; Peng, L.; et al. General Synthesis of Ultrafine Monodispersed Hybrid Nanoparticles from Highly Stable Monomicelles. Adv. Mater. 2021, 33, 2100820. [Google Scholar] [CrossRef] [Scilit] [PubMed]
- Jin, B.; Lai, T.; Manthiram, A. Locally Confined Polysulfide-Reactive Electrolytes for Shuttle-Free Sodium–Sulfur Batteries. J. Am. Chem. Soc. 2025, 147, 26414–26424. [Google Scholar] [CrossRef] [Scilit] [PubMed]
- Yao, Z.; Fan, X.; Kong, L. Electrochemical deposition of Li2S2/Li2S in aprotic Li–S batteries. Particuology 2024, 90, 516–521. [Google Scholar] [CrossRef] [Scilit]
- Shin, N.H.; Lim, Y.J.; Kim, C.; Kim, E.Y.; Jeong, Y.R.; Cho, H.; Park, M.-S.; Lee, S.H. An efficient method for selective syntheses of sodium selenide and dialkyl selenides. Molecules 2022, 27, 5224. [Google Scholar] [CrossRef] [Scilit] [PubMed]
- Ye, H.; Li, M.; Liu, T.; Li, Y.; Lu, J. Activating Li2S as the Lithium-Containing Cathode in Lithium–Sulfur Batteries. ACS Energy Lett. 2020, 5, 2234–2245. [Google Scholar] [CrossRef] [Scilit]
- Soni, R.; Robinson, J.B.; Shearing, P.R.; Brett, D.J.L.; Rettie, A.J.E.; Miller, T.S. Lithium-Sulfur Battery Diagnostics through Distribution of Relaxation Times Analysis. Energy Storage Mater. 2022, 51, 97–107. [Google Scholar] [CrossRef] [Scilit]
Disclaimer/Publisher’s Note: The statements, opinions and data contained in all publications are solely those of the individual author(s) and contributor(s) and not of MDPI and/or the editor(s). MDPI and/or the editor(s) disclaim responsibility for any injury to people or property resulting from any ideas, methods, instructions or products referred to in the content. |
© 2026 by the authors. Licensee MDPI, Basel, Switzerland. This article is an open access article distributed under the terms and conditions of the Creative Commons Attribution (CC BY) license.