


Abstract
The integration of large-scale distributed energy resources (DERs) into distribution networks (DNs) brings challenges to the effective control of DNs. In traditional approaches, mathematical or reinforcement learning (RL)-based solution algorithms are commonly used. However, the exponential increase in the number of DERs reduces the effectiveness of these strategies. Mathematical methods struggle to cope with the dynamic uncertainty caused by the high penetration of renewable energy, while RL algorithms relying on global data training may violate multi-agent privacy protocols. This paper proposes a DNs cooperative optimization method based on resource aggregation and RL. To reduce optimization dimensionality and ensure the privacy of resource data, a dynamic aggregation strategy is employed to aggregate a large number of distributed energy resources into aggregated entities, and the adjustable active–reactive power boundaries of each aggregated entity are derived. To fully exploit the regulation capability of DNs, data centers (DCs), as novel devices, are considered as flexible loads. To improve the convergence speed of model training and decision-making accuracy, evolution strategies (ES) and prioritized experience replay (PER) are integrated into the Soft Actor-Critic (SAC) algorithm, respectively. The proposed method is validated on the IEEE 33-bus and IEEE 123-bus systems. The results demonstrate the effectiveness and superiority of the proposed method in ensuring the secure operation of DNs.
1. Introduction
1.1. Background
By the end of 2025, China’s distributed photovoltaic installed capacity had reached 530 GW, while the nation’s cumulative installed wind power capacity had reached 640 GW, indicating a significant trend toward large-scale distributed energy integration [1]. However, while high renewable penetration brings green benefits, it also profoundly changes power system operation. In Spain, renewables accounted for 55.5% of generation in 2025, yet declining inertia and weak dynamic voltage support have become serious concerns. On April 28 that year, many inverter-based resources failed to provide reactive/voltage support during high PV output, leading to a major blackout on the Iberian Peninsula. This shows that as renewable penetration rises, operational uncertainty grows, and extreme weather combined with supply–demand stress can easily trigger cascading failures. In contrast, a grid with good voltage levels and low losses under normal operation ages more slowly, operates more healthily, and offers better initial conditions for coping with emergencies and achieving rapid recovery.
In China, as distributed PV penetration keeps increasing, the source–load imbalance in distribution networks worsens, making voltage violations and network losses more prominent. Thus, how to effectively control vast, scattered distributed energy resources and coordinate optimal dispatch among multiple stakeholders has become a key challenge that urgently needs to be solved.
With the widespread adoption of artificial intelligence (AI), the number and load of data centers (DCs) are growing rapidly, presenting new potential for the management of DNs. In 2022, DCs of China consumed 270 billion kWh of electricity, accounting for 3% of the total societal electricity consumption [2]. By 2030, it is projected that the total electricity consumption of DCs of China will reach approximately 525.76 billion kilowatt-hours, accounting for 4.8% of the total societal electricity consumption [3]. Typically, the adjustable load ratio within DCs can exceed 20% [4], and through coordinated optimization of computing, power, and thermal systems, a carbon emission reduction of 38.5% can be achieved [5]. However, a variety of optimization and control methods cannot directly and effectively control a large number of DCs and RES. Meanwhile, since the power consumption values of DCs can reflect a wealth of information about customers, directly reporting their regulation capabilities to the Distribution Systems Operator (DSO) is prone to causing data privacy leakage.
Currently, the control of dispatchable resources in distribution networks remains primarily device-level independent regulation, without the formation of system-level coordinated optimization. Specifically, branch switches are used for network reconfiguration to alter power flow distribution [6]; photovoltaic inverters can regulate reactive power [7]; capacitor banks provide discrete reactive power compensation through switching operations to support voltage [8]; energy storage systems (ESS) leverage their fast bidirectional charging/discharging capabilities for peak shaving and voltage support [9]; and electric vehicle charging stations regulate active power through coordinated charging control [10]. Although device-level independent regulation can effectively adjust local areas, the regulation capability of individual devices is limited. Moreover, with the integration of large-scale devices, existing optimization algorithms cannot rapidly and effectively solve large-scale, complex distribution network optimization problems, making it difficult to achieve global secure and economic operation under high-penetration distributed energy resource integration scenarios.
The coordinated optimization of distribution networks is an optimization problem. To explore its control strategies, the problem must be solved under specific practical conditions. The algorithms for solving optimization problems mainly fall into three categories: mathematical programming, physics-inspired heuristics, and intelligent optimization [11]. Mathematical programming methods, such as nonlinear optimal power flow, often face the curse of dimensionality when dealing with large-scale, non-convex distribution network optimization problems involving mixed discrete variables, making it difficult to obtain a global optimal solution within a limited time, whereas linear optimal power flow struggles to accurately capture the nonlinear characteristics in actual system operation as well as the switching logic of discrete devices. Physics-inspired heuristic algorithms are prone to getting trapped in local optima and are highly dependent on accurate physical models and parameters [12]. In contrast, intelligent algorithms, particularly reinforcement learning, have gradually gained attention. Reinforcement learning offers unique advantages in real-time decision-making and adaptive optimization [13]. However, current reinforcement learning algorithms still suffer from low sample efficiency and convergence difficulties during the training phase, and their solution optimality and computational efficiency require further improvement.
1.2. Previous Research
This part delves into the research status quo and existing problems of DC, VPP aggregation, and multi-agent deep reinforcement learning (MADRL). DCs can be regarded as a type of flexible load that is regulable in both time and space, and they can be incorporated into the operation of power systems as an important demand response resource [14]. Studies on the planning of DCs primarily focus on determining their locations and capacities with a long-term perspective. Ref. [15] takes into account various uncertainties and network constraints during the expansion planning process to determine the locations and capacities of DCs. Ref. [16] proposes the need for expansion planning of DCs to meet the development of data networks. Most studies on the operational optimization of DCs leverage their regulation potential to improve economic benefits [17]. Ref. [18] reduces the operational costs of microgrids based on the demand response capability of DCs. Refs. [19,20] achieve cost and emission reductions by shifting the workloads of DCs to fully absorb renewable energy. Ref. [21] utilizes the flexibility of DCs’ energy consumption to optimize power flow within the system. Specifically, DCs have the potential to reduce network losses, alleviate network congestion, etc. However, the full exploitation of this flexibility in DNs has not been thoroughly explored, nor have methods been established for the effective control of large-scale DCs.
Current MADRL has gained considerable attention and application in real-time DN optimal operation, owing to its model-free nature and adaptive decision-making capability [22]. For instance, Ref. [7] develops a voltage regulation framework incorporating transactive energy, where the reactive power outputs of renewable energy sources (RES) and ESS are controlled to improve the economic performance of DNs under voltage constraints. However, while such studies confirm the feasibility of MADRL in DN control problems, they often neglect the scalability of the proposed methods [23]. To enhance scalability, reference [24] introduces a distributed variant of the proximal policy optimization algorithm specifically designed for electric vehicle charging coordination. However, its effectiveness has only been validated when directly controlling a few devices, and has not been verified under the access of hundreds or thousands of energy resources. Moreover, the training phase still requires the collection of RES data, which does not fundamentally eliminate the potential threat of data leakage [25].
In summary, there is currently a lack of a MADRL-based scheduling framework tailored for large-scale distributed generators. Such a framework would help effectively exploit the regulation potential of distribution networks and achieve fast and efficient solutions in scenarios involving large-scale DERs and DCs connected to DNs.
1.3. Contributions
In the above literature, it can be observed that MADRL methods for real-time active and reactive power cooperative optimization in DNs under large-scale resource integration are relatively new and have not yet considered the regulation capabilities of novel devices such as data centers. To fill these research gaps, this paper proposes a real-time active and reactive power cooperative optimization method for DNs based on large-scale resource aggregation, aiming to reduce the voltage violation rate and network loss in DNs. Compared with existing methods, the main contributions of this paper are summarized as follows:
- (1)
- A real-time active and reactive power cooperative optimization method for DNs based on large-scale resource aggregation is proposed. The total power aggregated from large-scale resources is used as the input for designing the MADRL model, enabling effective control of large-scale resources within the region, preserving the data privacy of individual resources, and reducing voltage violation rates and network losses without requiring communication.
- (2)
- A control method is proposed that utilizes data centers as novel control devices. DCs, serving as flexible loads, can further unlock the regulation potential of DNs.
- (3)
- We propose integrating ES and PER techniques into the SAC algorithm. By incorporating the concept of population evolution, ES enhances global exploration capability to avoid falling into local optima, while PER prioritizes sampling high-value experience samples to improve training efficiency and stability, thereby significantly accelerating convergence and enhancing decision-making quality.
The effectiveness of the proposed model is validated on the IEEE 33-bus and IEEE 123-bus systems. By evaluating metrics such as voltage violation rate and network loss, it is demonstrated that the proposed model outperforms other benchmark models, including the model without aggregation and MADRL models employing various algorithms.
The remainder of this paper is organized as follows. Section 2 introduces the proposed model, including the aggregation of massive distributed resources, the mathematical modeling of multi-region cooperative optimization for DNs, and the formulation as a Partially Observable Markov Decision Process (POMDP). Section 3 presents the improved MADRL algorithm. Section 4 validates the effectiveness of the proposed method in controlling a large number of distributed resources by comparing it with device-level independent control approaches, and also demonstrates the effectiveness and superiority of the improved algorithm through comparison with multiple benchmark algorithms. Section 5 concludes the paper.
2. Optimization Model
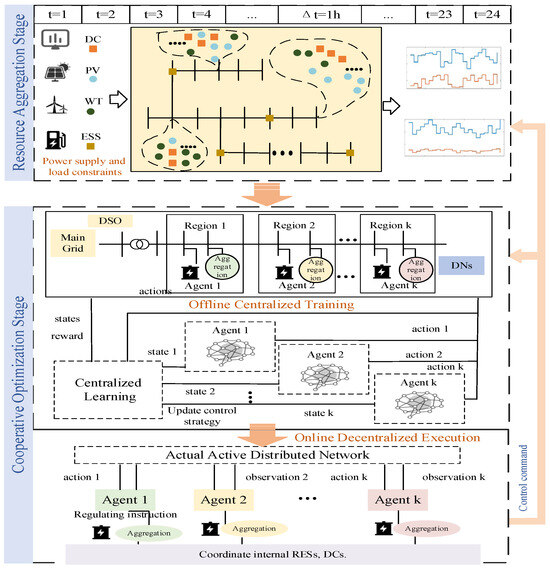
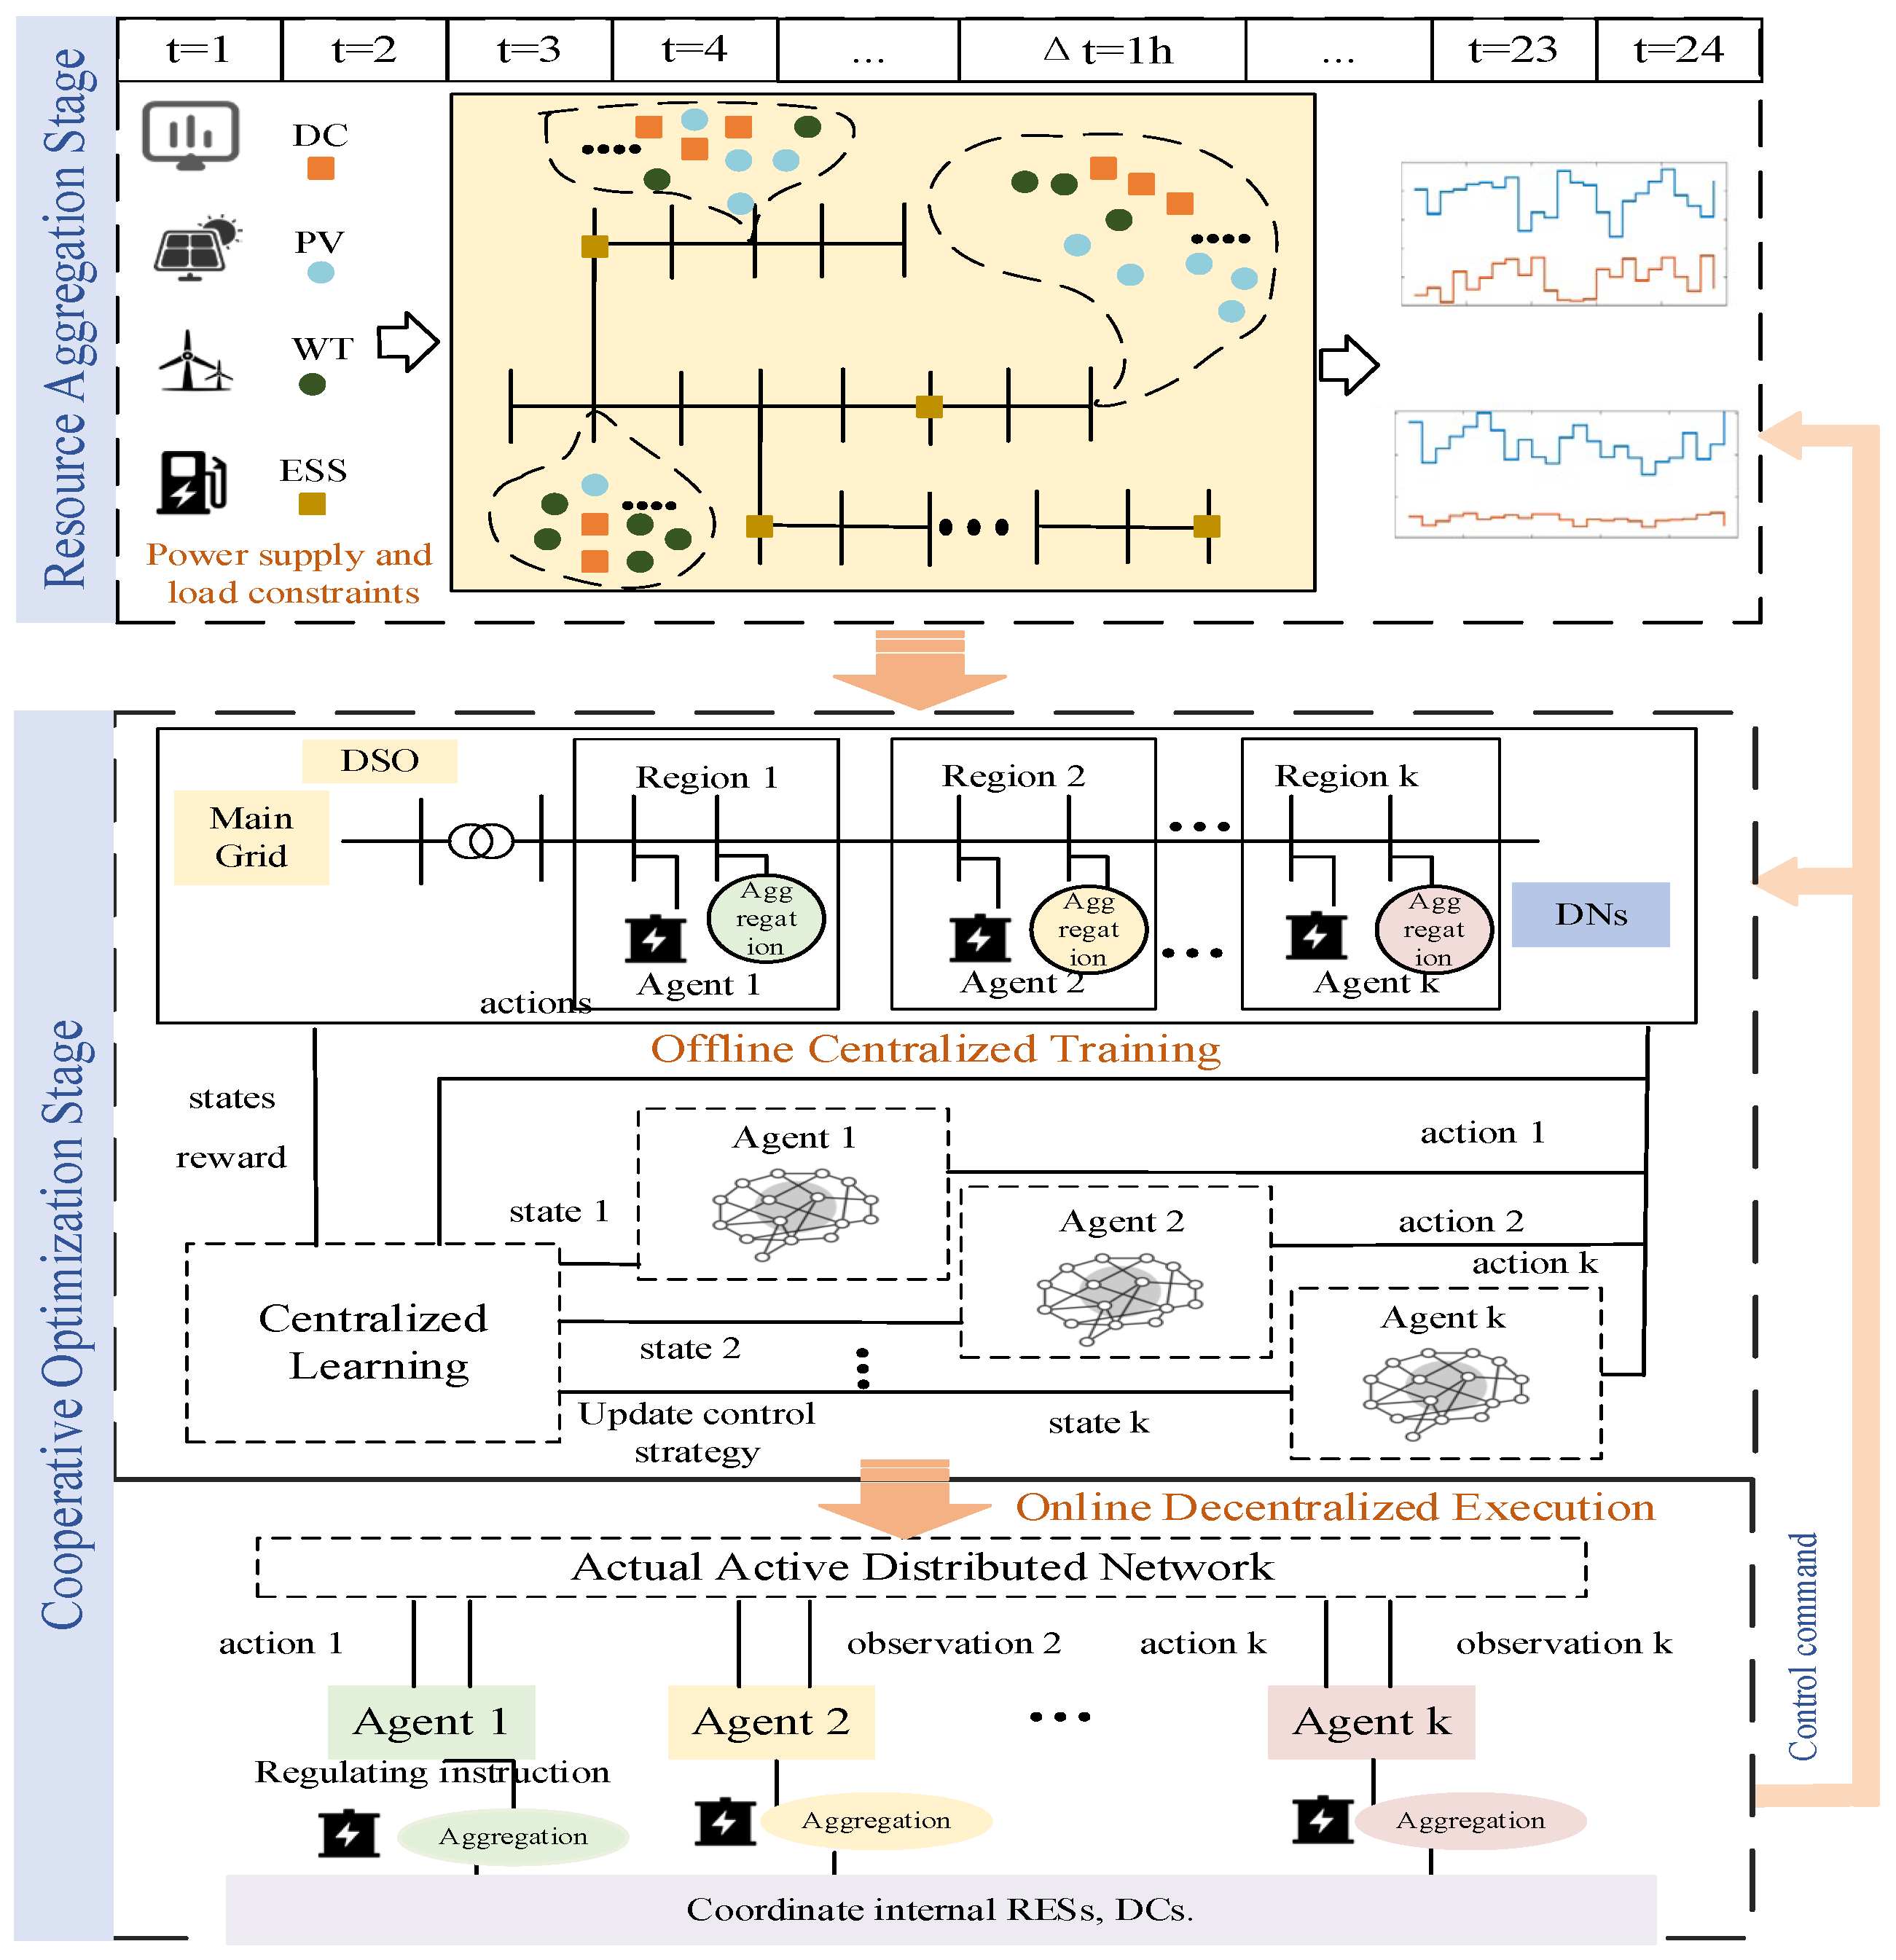
The recent power outages in Spain have highlighted critical vulnerabilities in systems with high penetration of renewable energy. The reasons include (1) rapid voltage fluctuations caused by intermittent generation, (2) delayed response of centralized control under emergency conditions, and (3) insufficient coordination among numerous distributed resources. These challenges call for a decentralized, fast-acting, and adaptive voltage regulation scheme. To address (1) rapid voltage fluctuations caused by intermittent generation, the method proposed in this paper is illustrated in Figure 1. First, in the stage of large-scale resource aggregation within a region, DC, PV, and WT are aggregated to obtain the total controllable power of all resources in the region. Meanwhile, instead of reporting all resource data to the DSO, the region only provides its total dispatchable power. Based on the MADRL method, each agent independently controls a different region, and the optimality of decision-making is enhanced through inter-agent cooperation. Finally, based on the decision results, the DSO issues control commands to each region.
Figure 1.
MADRL-based cooperative optimization of DNs with massive resource aggregation.
To address (2) delayed response of centralized control under emergency conditions and (3) insufficient coordination among numerous distributed resources, this method leverages aggregation to achieve effective control over large-scale resource integration, and enhances scalability from the following three aspects: (1) computational dimension—aggregation reduces the high-dimensional individual control problem to a low-dimensional regional-level problem, fundamentally alleviating the curse of dimensionality; (2) communication dimension—each region only uploads the aggregated total power rather than individual device data, avoiding frequent data exchange between massive devices and the main station; (3) architectural dimension—the adopted centralized training with decentralized execution (CTDE) framework enables fully parallel decision-making by all agents during online execution, such that the overall computation time does not grow with the number of network bues but depends only on the decision time of a single region.
Furthermore, by providing the dispatchable range of the overall regional resources rather than the data of individual resources, data privacy protection is achieved. Notably, the proposed method only issues dispatch commands to each region without intervening in its internal control, allowing the region to manage its internal resources according to its own specific conditions. Furthermore, when new distributed resources are added within a region, only the aggregation model parameters of that region need to be updated, without altering the overall framework or retraining all agents, which further enhances the engineering scalability of the method.
The method can serve as a last-line defense against cascading voltage collapse, as it operates locally and adapts to real-time conditions, which is exactly what the Spanish system lacked during the event.
2.1. Aggregation of a Large Number of Resources
PVs and WTs are RESs with adjustable potential. Meanwhile, the rapid development of CDs has also made them significant new adjustable loads in DNs. In contrast to existing studies, this paper first aggregates a large number of WTs, PVs, and DCs connected to the same DN bus to obtain their total power, and then employs MADRL to control the aggregated total power, rather than using MADRL to individually control each independent WT, PV, and DC. It is worth noting that, due to the relatively small scale of network connections among DERs compared to the DN system, the network topology and power losses are neglected.
DCs can be either distributed or centralized in type, and they are regarded as time-scale adjustable loads. The effectiveness of the proposed method depends solely on the regulation capacity and response characteristics of the DCs. The power regulation constraints for WTs, PVs, and DCs are presented as follows.
where and are the adjusted active power after aggregation at time ; and are the adjusted active power after aggregation at time ; , , and are the adjusted active maximum power of WTs and PVs; is the adjusted active power of DCs, which is constrained by the adjusted active maximum power limits of the DCs, and .
where and are the adjusted active power after aggregation on bus at time .
The adjustable ranges of active and reactive power after aggregation are expressed as follows.
In this section, a large number of WTs, PVs, and DCs are aggregated. Compared to the complex distribution network, the interconnecting lines among these resources are shorter, and the power transmitted is smaller; therefore, the network topology among the resources is neglected. The aggregation of a large number of resources yields the ranges and regulatory constraints of the total active and reactive power, which serve as the action space and constraints for the controlled objects in the MADRL framework, and they vary dynamically.
2.2. Optimization Objectives and Constraints of DNs
This section formulates a cooperative optimization framework for DNs, aiming to avoid voltage violations and reduce the network losses of DNs. The optimization issue is formulated as follows:
where represents the network loss; represents the profit of the transactive energy between DNs and the main grid. , are the target coefficients of voltage penalty and profit, respectively.
where the real and complex components of branch admittance at time are expressed by and ; is the complex component of the voltage phasor and is the real component of the voltage phasor on bus at time . The constraint equations should primarily focus on the regulation range of the regional resource aggregation. , , , represent the active and reactive power regulation range of the region. is the state of charge (SoC) of the ESSs installed on bus at time ; the output power of ESSs installed on bus at time is represented by ; indicates that the ESS is charging; otherwise, indicates that it is discharging; is limited by maximum charging power and maximum discharging power ; and are the charging/discharging rates; the upper and lower limits of ESSs are represented by , .
The issue is formulated as a nonlinear programming model:
min (8)
s.t. (11)–(15)
s.t. (11)–(15)
Equation (16) incorporates a multi-objective optimization function aimed at reducing network losses and avoiding voltage violations. It is solved under the constraints related to regional resource aggregation, ESSs and network operation. The decision variables of Equation (16) are denoted by . Therefore, this optimization problem can be transformed into a POMDP model.
2.3. POMDP Modeling for Optimization Strategy
We propose an optimization strategy within the MADRL framework. We model Equation (14) as a POMDP and further determine the action variables and state variables based on the variables and constraints involved. It can be described by a tuple . is the number of agents, represents the observed state value of agent , is the set of actions, is the set of global states, is the state transition function, denoted as , and is the discount factor. Then, the reward is calculated by , which can be shared. Meanwhile, let represent the environmental uncertainty, and the next new state is obtained based on the [26]. represents the policy learned by each agent, which transforms the observed state of the environment by the agent into probabilities for each possible action. is the trajectory of POMDP. Maximizing the cumulative discounted reward is the objective for each agent. The cooperative optimization problem for DNs is transformed into a POMDP, with its components defined in detail as follows.
The cooperative optimization strategy of DNs based on MADRL considering a regional feasible region can be divided into two stages: centralized training and distributed execution [27]. The multiple agents are responsible for controlling their respective regions. During the training stage, control strategies are learned through interactions between the agents and the DN environment, along with data sharing. During the execution stage, agents only need to obtain information within their respective regions to make control decisions.
- (1)
- Observation space: the observation of agent is presented by:
- (2)
- Action space: the action of the regional agent at time is represented by , which controls the output power of regional resource aggregation and ESS.
- (3)
- Constraints: the action space and observation space are constrained by the limitations imposed by regional resource aggregation and ESS.
- (4)
- Reward function: the optimization issue in this paper constructs a POMDP for multiple agents, each of which can share a reward. The reward for each agent is expressed as:
3. Proposed Method
- (1)
- Soft Actor–Critic Method Augmented by ES and PER
The SAC algorithm is particularly well-suited for the DN optimization problem considered in this study, as its two core mechanisms directly address the primary challenges of the problem. On the one hand, due to the high uncertainty in renewable energy generation, e.g., PV output and load demand, conventional gradient-based methods are prone to becoming trapped in suboptimal solutions. The maximum entropy objective of SAC encourages each agent to explore diverse actions during training, enabling more thorough evaluation of control strategies across varying operational scenarios and reducing the risk of converging to local optima [28]. On the other hand, practical distribution network operation inevitably involves communication delays and measurement noise, which can cause deterministic policies to produce volatile and unreliable control actions. The stochastic policy adopted by SAC outputs a probability distribution over actions rather than deterministic instructions [29]. By sampling from this distribution, the agent maintains stable control performance even under small disturbances, thereby ensuring robustness against real-world uncertainties.
While searching for the optimal strategy, another objective of the SAC algorithm is to incorporate an entropy term into the equation and maximize the entropy for each state [28]:
where represents the entropy function; is the temperature parameter, which controls the stochasticity of the optimal policy; the state-action or state marginal distribution of the trajectory induced by the policy is denoted by .
Finally, the entropy-regularized Bellman equation is formulated as:
where the Q-function and the soft state value function are represented by and , respectively; the value of is set within the range of (0, 1), and it serves to penalize future rewards.
The update policy is shown as follows:
where is the partition function, whose role is to normalize the numerator into a probability distribution; the degree of matching between the two probability distributions is measured using the divergence .
The parameters of the actor network and the critic network are denoted as φ and θ, respectively, which are used to adjust the policy and the soft Q-function . Minimizing the sum of squared residual errors and the soft Bellman residual is the objective for training the soft Q-function, as detailed below:
where represents a replay buffer, which is used to store and reuse the experience data from the interactions between the agent and the environment. The update makes use of a target soft Q-function with parameters .
The gradient of Equation (28) can be expressed as follow.
Finally, the policy parameters φ can be learned by directly minimizing the expected .
where is which is obtained by a neural network; is an input noise vector, .
Automatic entropy adjustment dynamically balances exploration and exploitation in the policy by optimizing the α, calculating the gradient of α by minimizing Equation (33):
where is called the minimum entropy constant.
- (2)
- ES technique
By combining ES with RL, this paper leverages the strengths of both approaches. ES enhances exploration diversity and sampling efficiency, while the integration of gradient information from RL mitigates ES’s limitation in handling high-dimensional problems. Additionally, ES introduces beneficial redundancy and robustness through elitism. This hybrid strategy not only improves sample diversity and learning stability but also accelerates convergence. Notably, it proves particularly effective in problems with long episodic horizons.
Specifically, we adopt a multivariate Gaussian distribution as the sampling distribution for the actor individuals, where is the mean vector and is the covariance matrix. The initialization step before training proceeds as follows: is set to the zero vector 0, and is set to the identity matrix . This process can be expressed as:
The ES draws actor individuals from during generation , with representing the population size of the actor. The above sampling operation can be expressed as:
During training, all ES actor individuals take actions in the environment, and their fitness values are evaluated. The population is then updated in two ways: gradient-updated actor individuals are incorporated, and ES actor individuals with the lowest are removed. Consequently, gradient-based actors and ES actors jointly populate the actor pool.
Next, from the population, the ES identifies K elite actor individuals that possess the highest fitness values , which are represented as . Subsequently, the distribution is updated using the fitness weights and these elite individuals according to the following procedure:
At the final stage of each generation, interactions with the environment are performed by the RL agent. Through these interactions, a loss-minimization procedure updates the critic network , and a sampled policy gradient updates the actor network . The resulting , , and the updated are then used as the starting point for the next generation. This entire process is repeated until convergence is reached.
- (3)
- PER technique
PER technique assigns larger weights to more significant samples, making them more likely to be selected multiple times during training [30]. By integrating ES and PER into the SAC algorithm, the model’s training speed, decision-making capability, and scalability are enhanced.
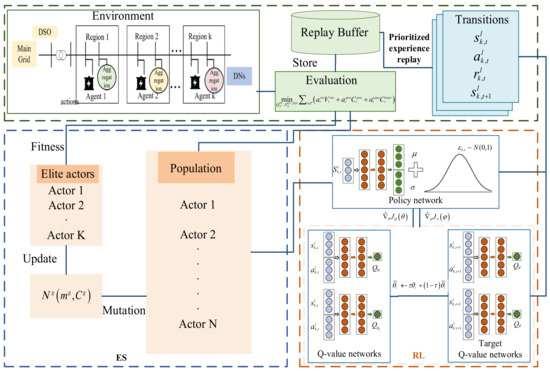
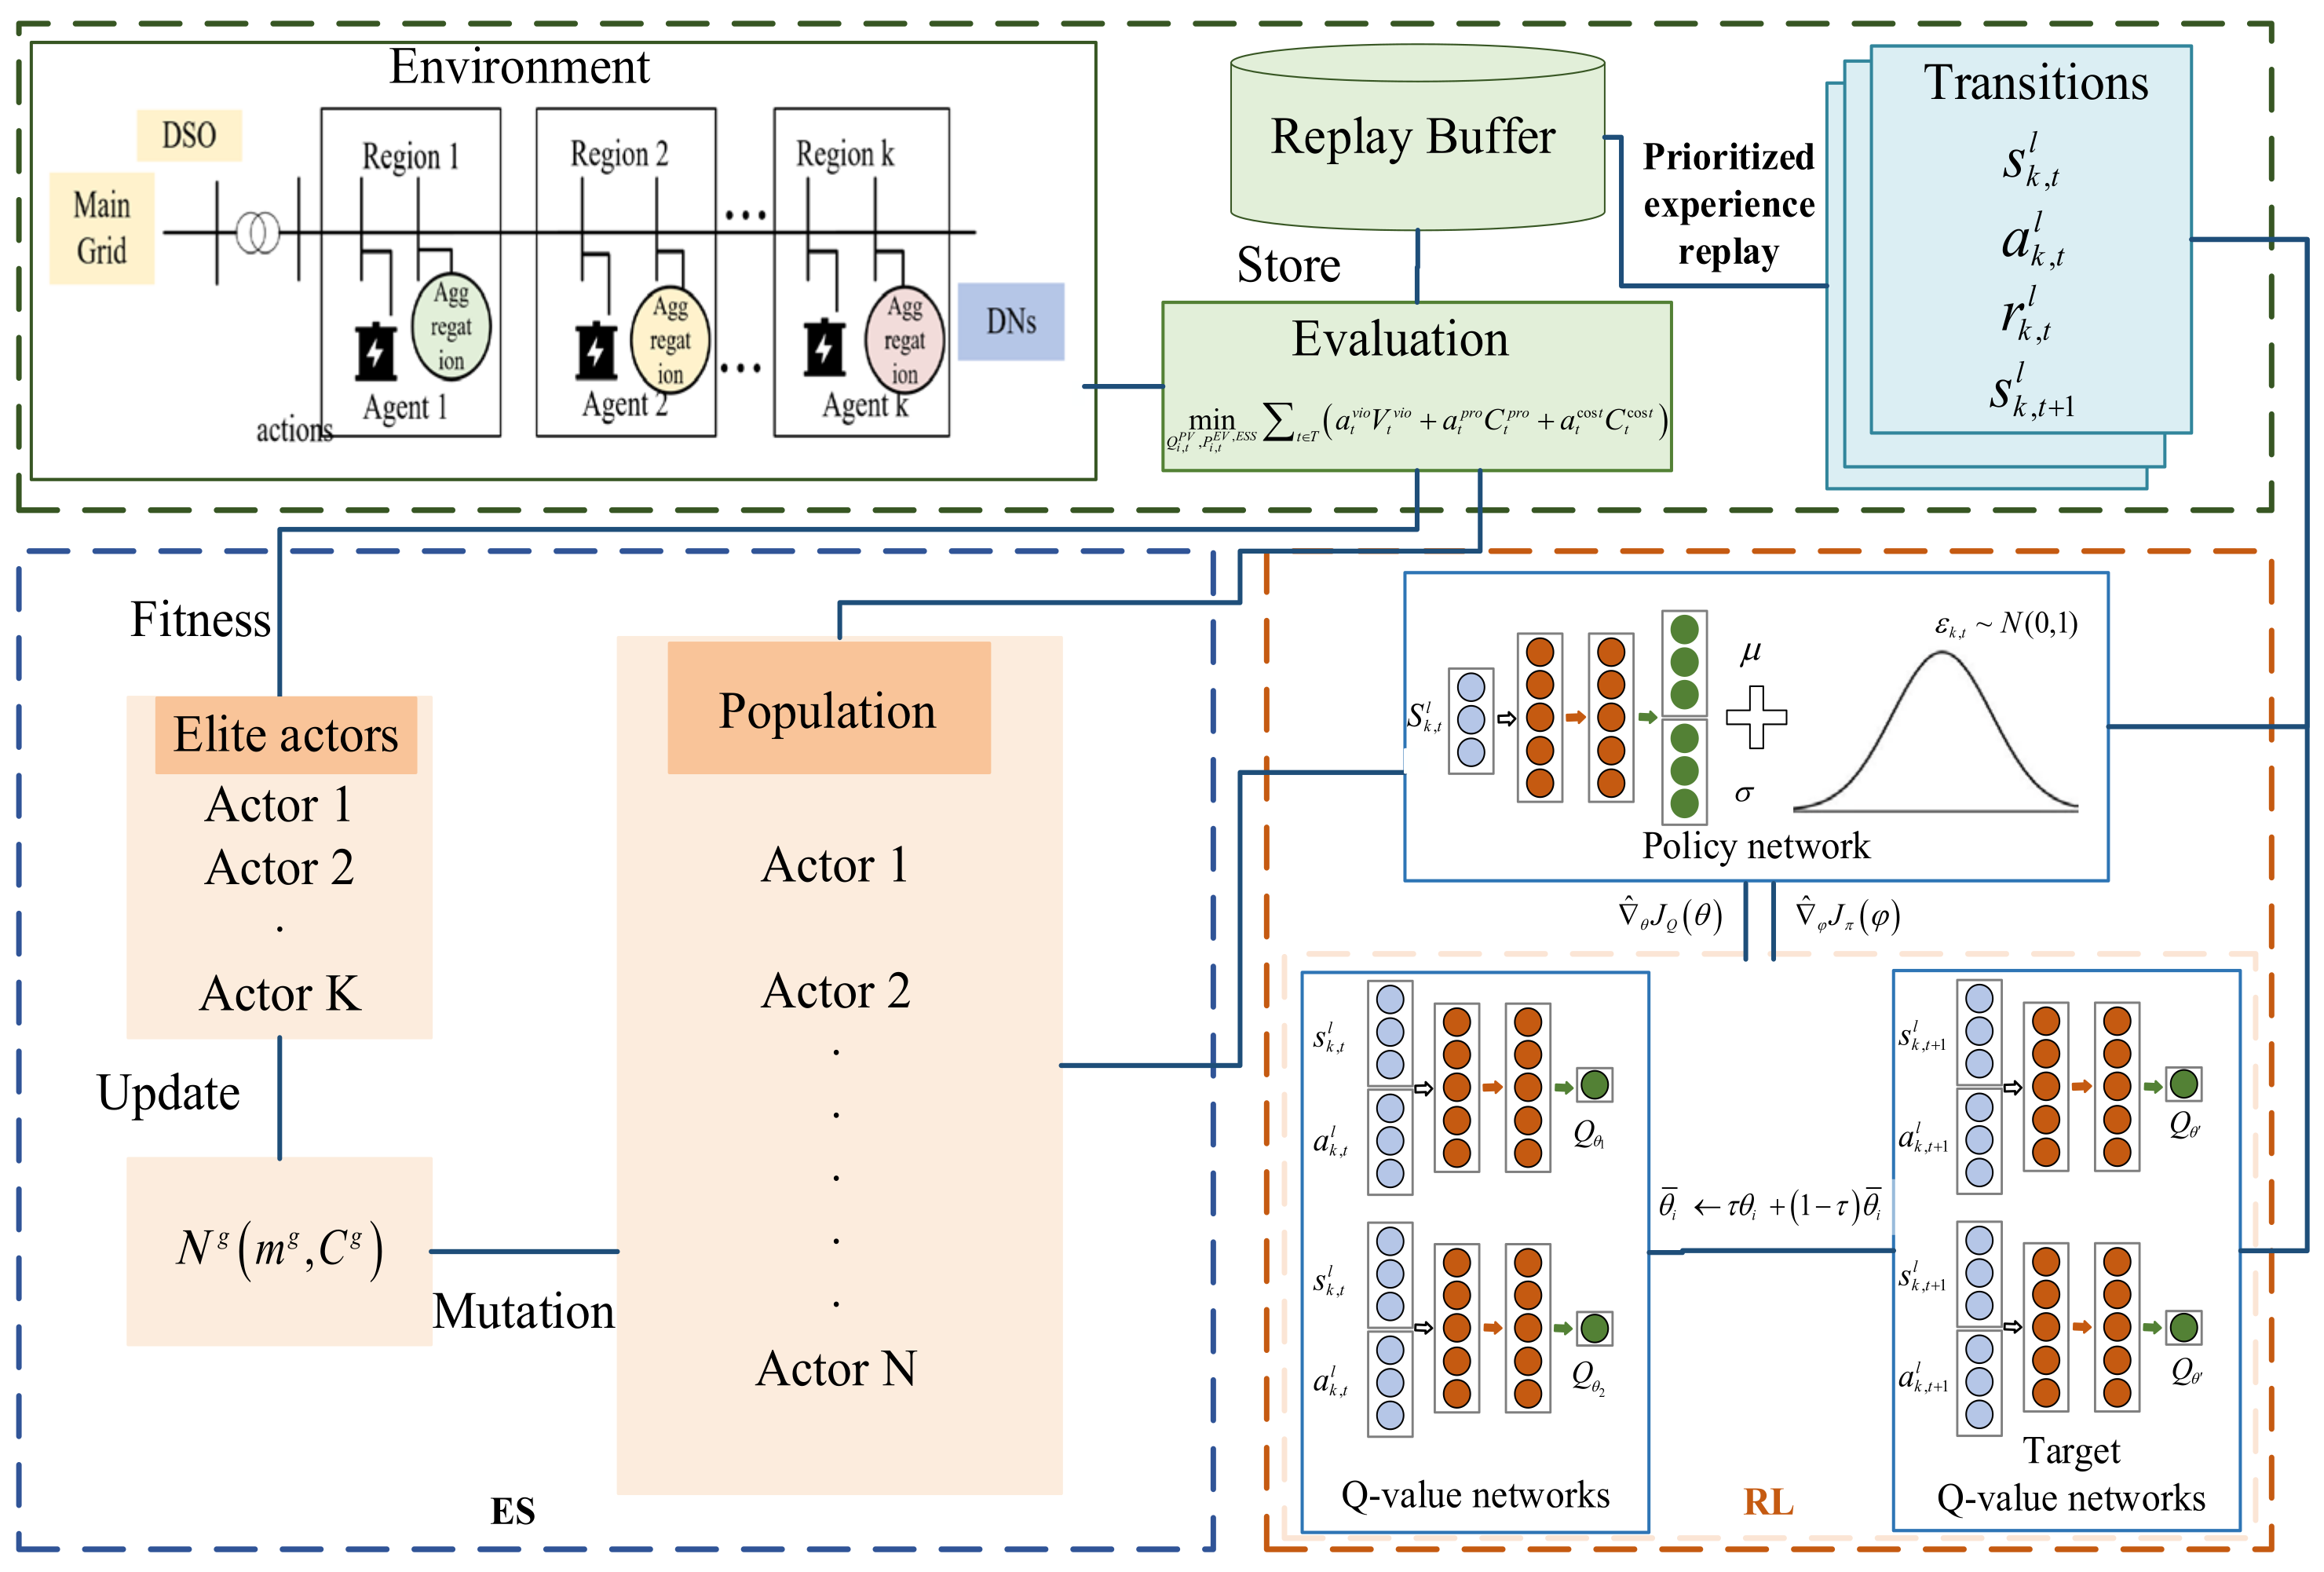
The centralized training framework of ES-PER-SAC is depicted in Figure 2.
Figure 2.
Centralized training framework of the ES-PER-SAC.
4. Case Studies
In this section, the proposed model is validated on the IEEE 33-bus and 123-bus systems. Subsection A first introduces the number of regional aggregated resources, their access locations, comparative models, and parameter settings. The training process and decision-making results are presented in Subsections B and C, respectively. Subsection D presents the network loss and voltage violation rate, while Subsection E provides an analysis of the training time and decision-making time of different algorithms used in the model.
4.1. Corresponding Setting
The performance of the proposed model was tested on both the IEEE 33-bus and IEEE 123-bus systems. All algorithms were implemented using MATLAB 2022b running on a 64-bit laptop equipped with a 2.20 GHz CPU, 16 GB of RAM, and an Nvidia RTX4050 GPU.
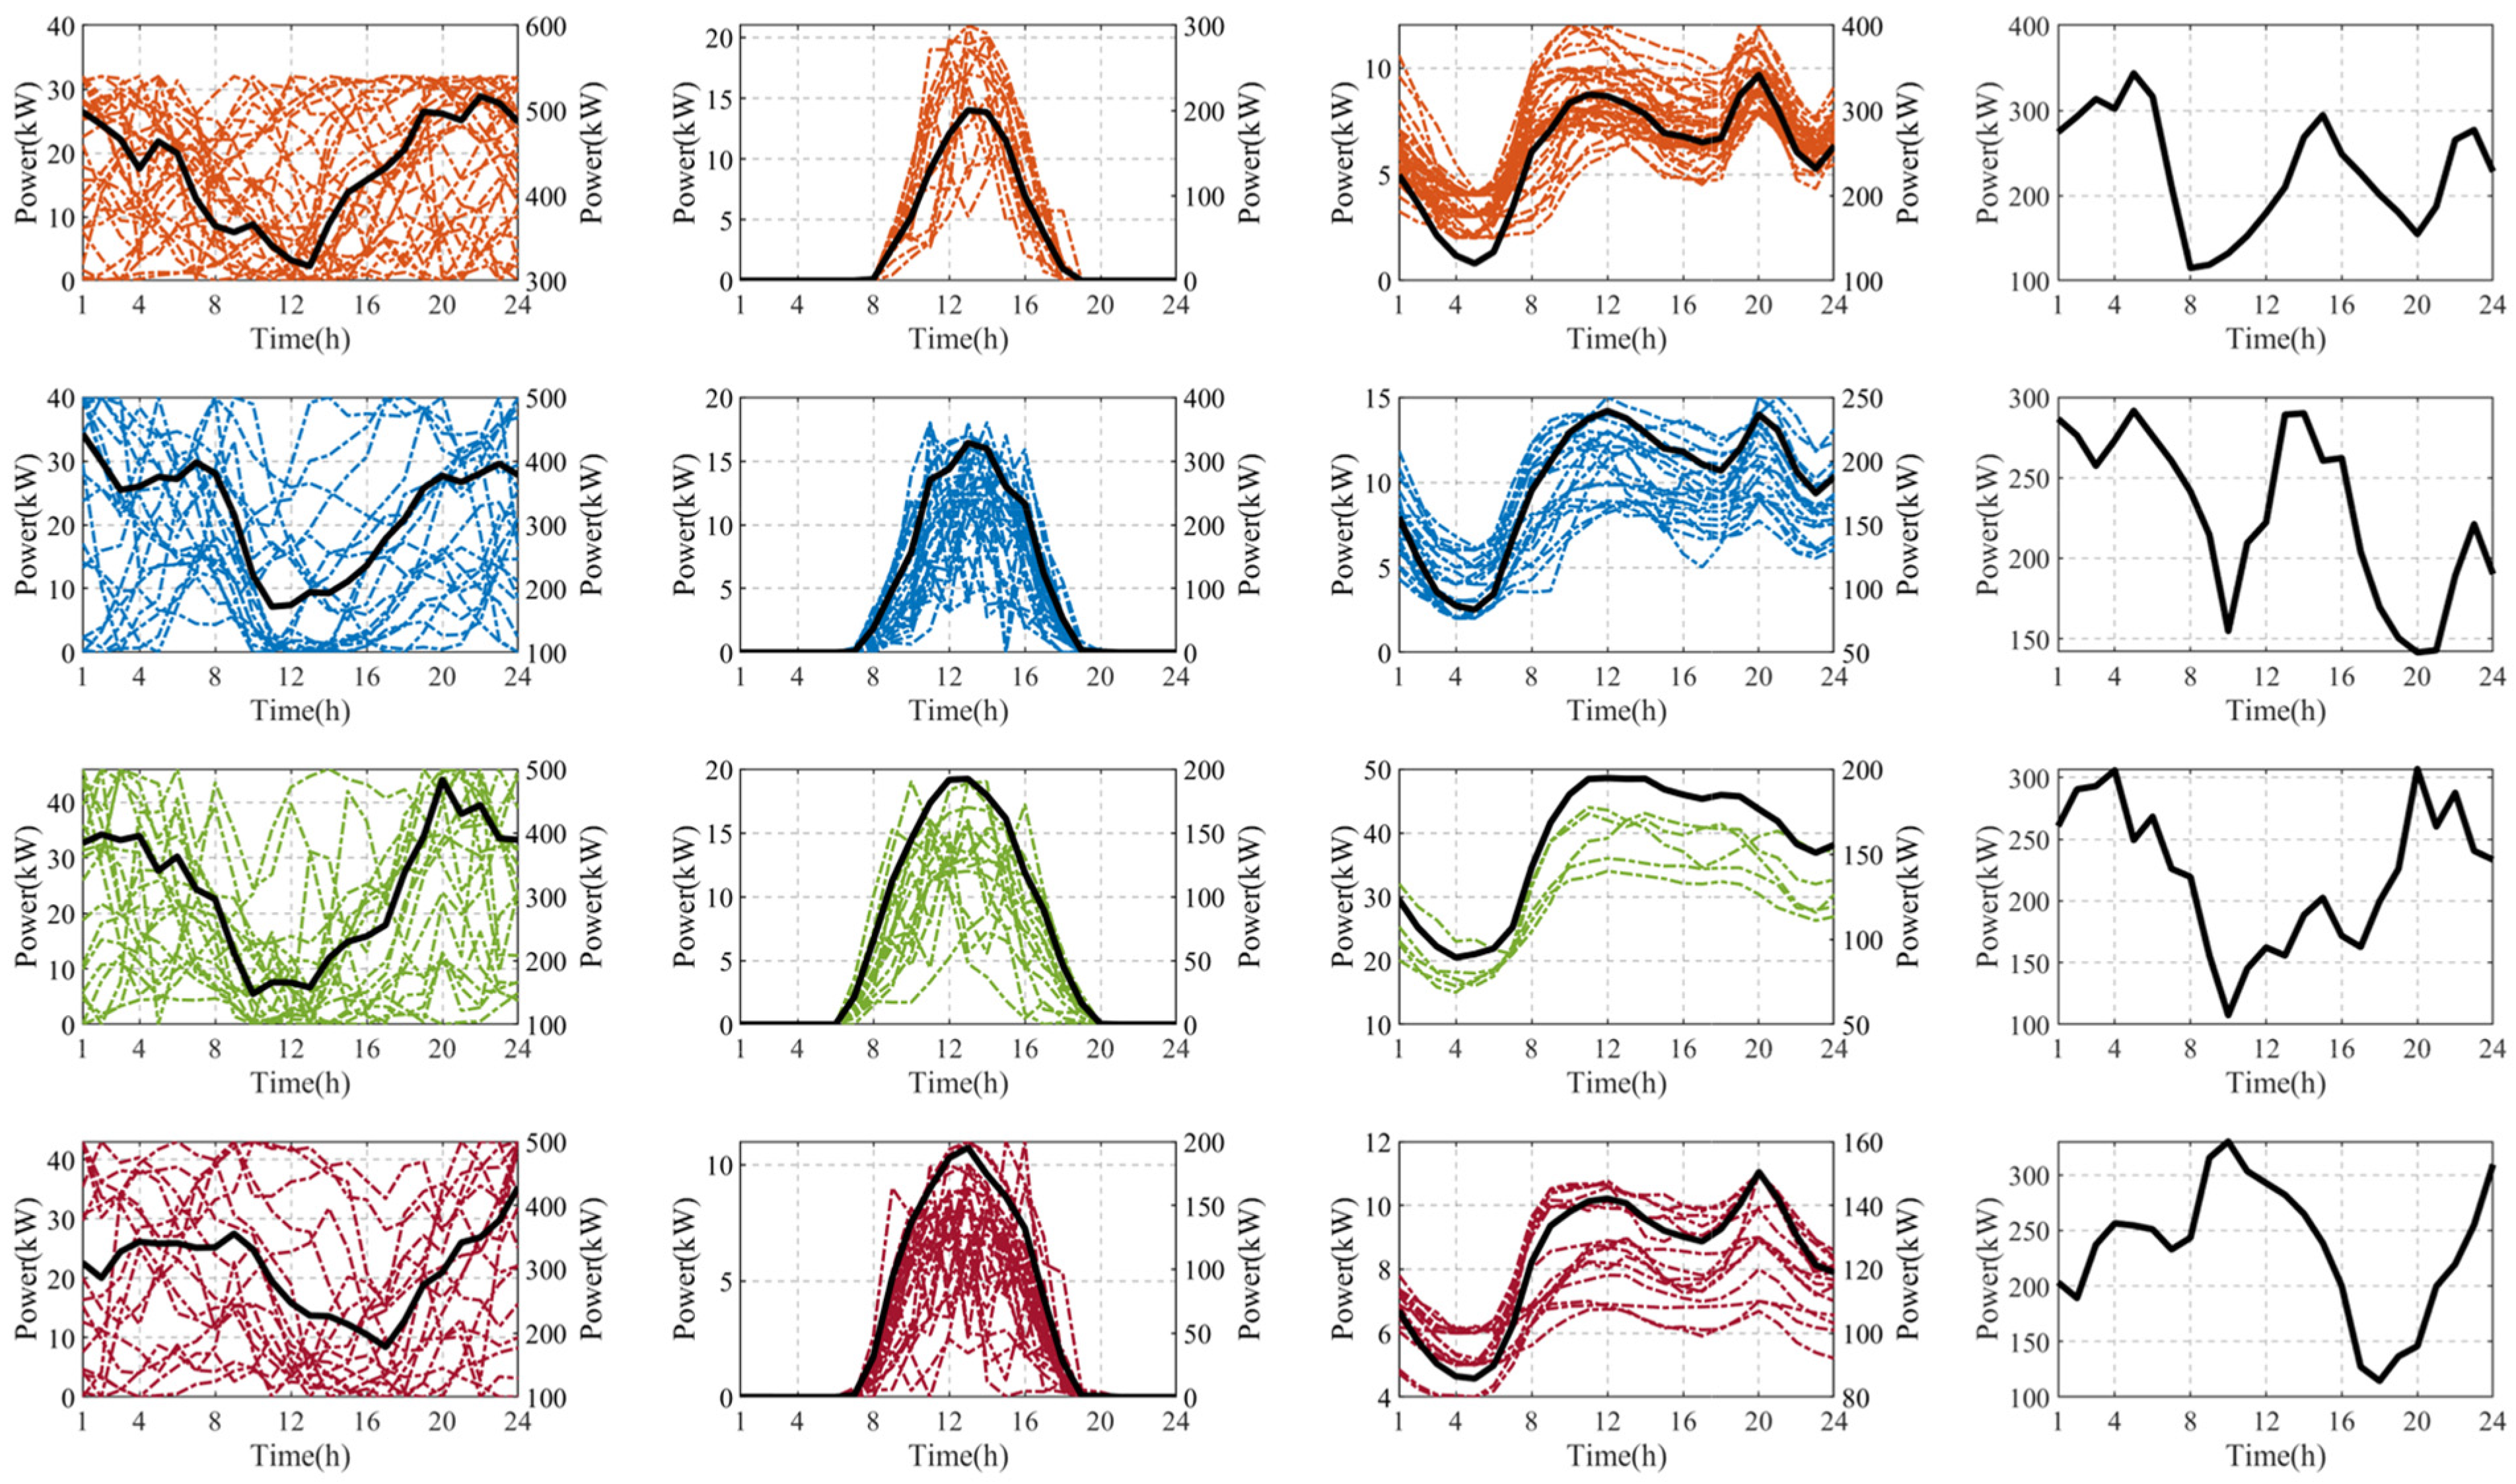
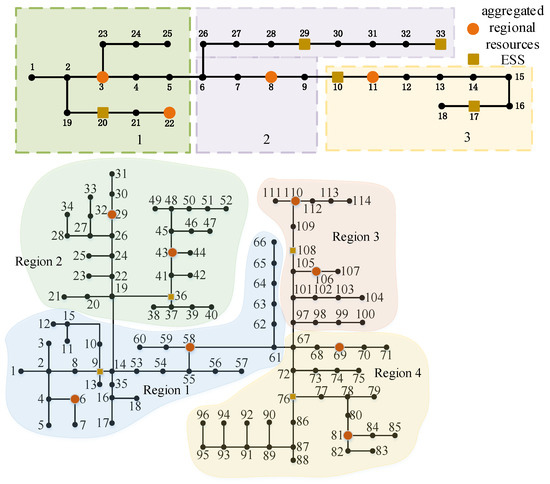
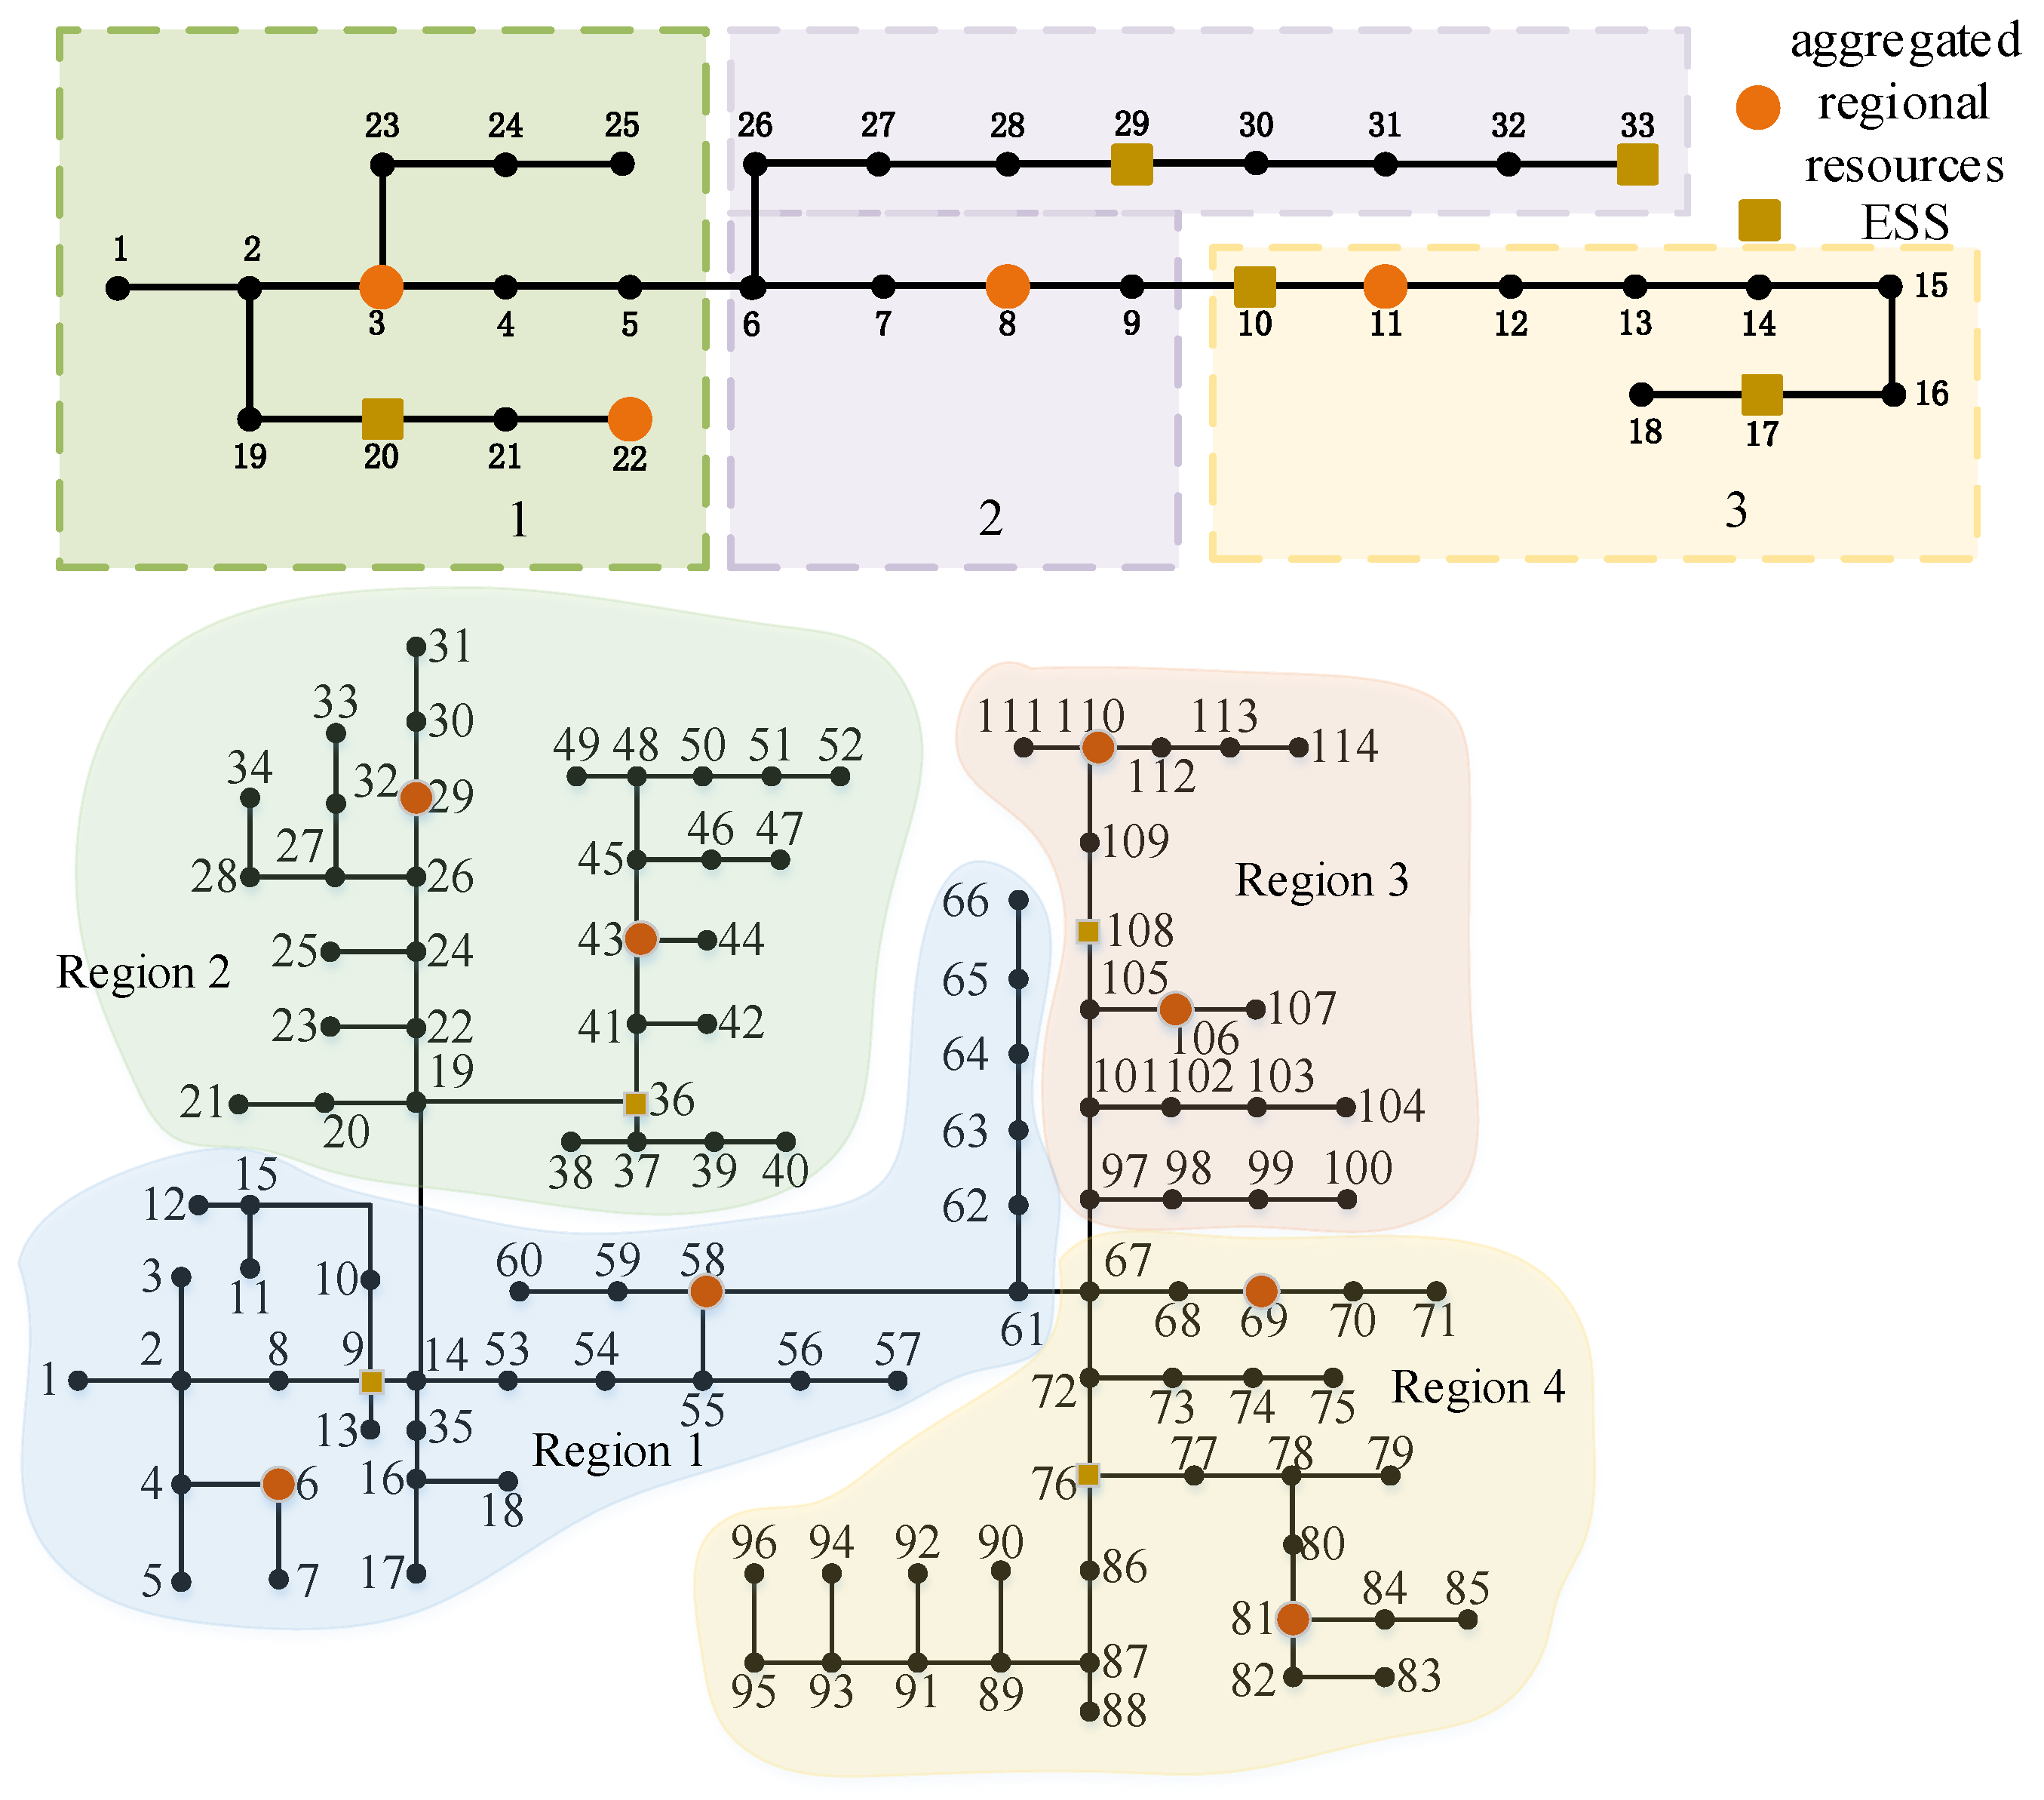
Table 1 lists the total number of aggregated resources and the resource parameters in each region. The primary resources considered in this paper include WTs, PVs, ESSs, and DCs. The detailed curves of the aggregated resources are shown in Figure A1 in Appendix A. Figure 3 illustrates the results of partitioning the DN based on its functional areas, along with the access buses of energy storage systems and aggregated regional resources into the DN.
Table 1.
The specific resources aggregated by each region.
Figure 3.
The partitioning of DNs, regional resource aggregation and ESS access buses.
To demonstrate the effectiveness of the proposed model from multiple aspects, we set up four sets of comparative cases: (a) multiple types of resources are not aggregated but are directly connected to the nodes of the DN; (b) resources are aggregated and connected to nodes, but the MADRL adopts the SAC algorithm; (c) resources are aggregated and connected to nodes, but the MADRL adopts the Deep Deterministic Policy Gradient (DDPG) algorithm; (d) resources are aggregated and connected to nodes, but the MADRL adopts the Twin Delayed Deep Deterministic Policy Gradient (TD3) algorithm. Table 2 presents the hyperparameter settings for the different comparative models.
Table 2.
Hyperparameter settings.
4.2. Training Process and Performance
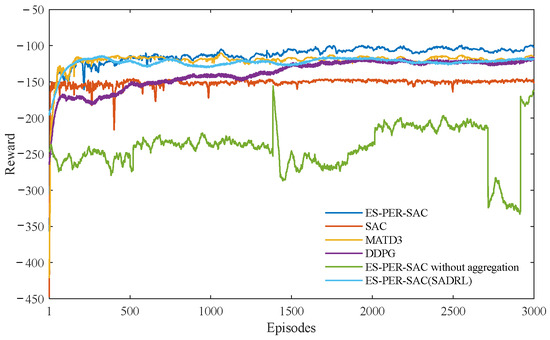
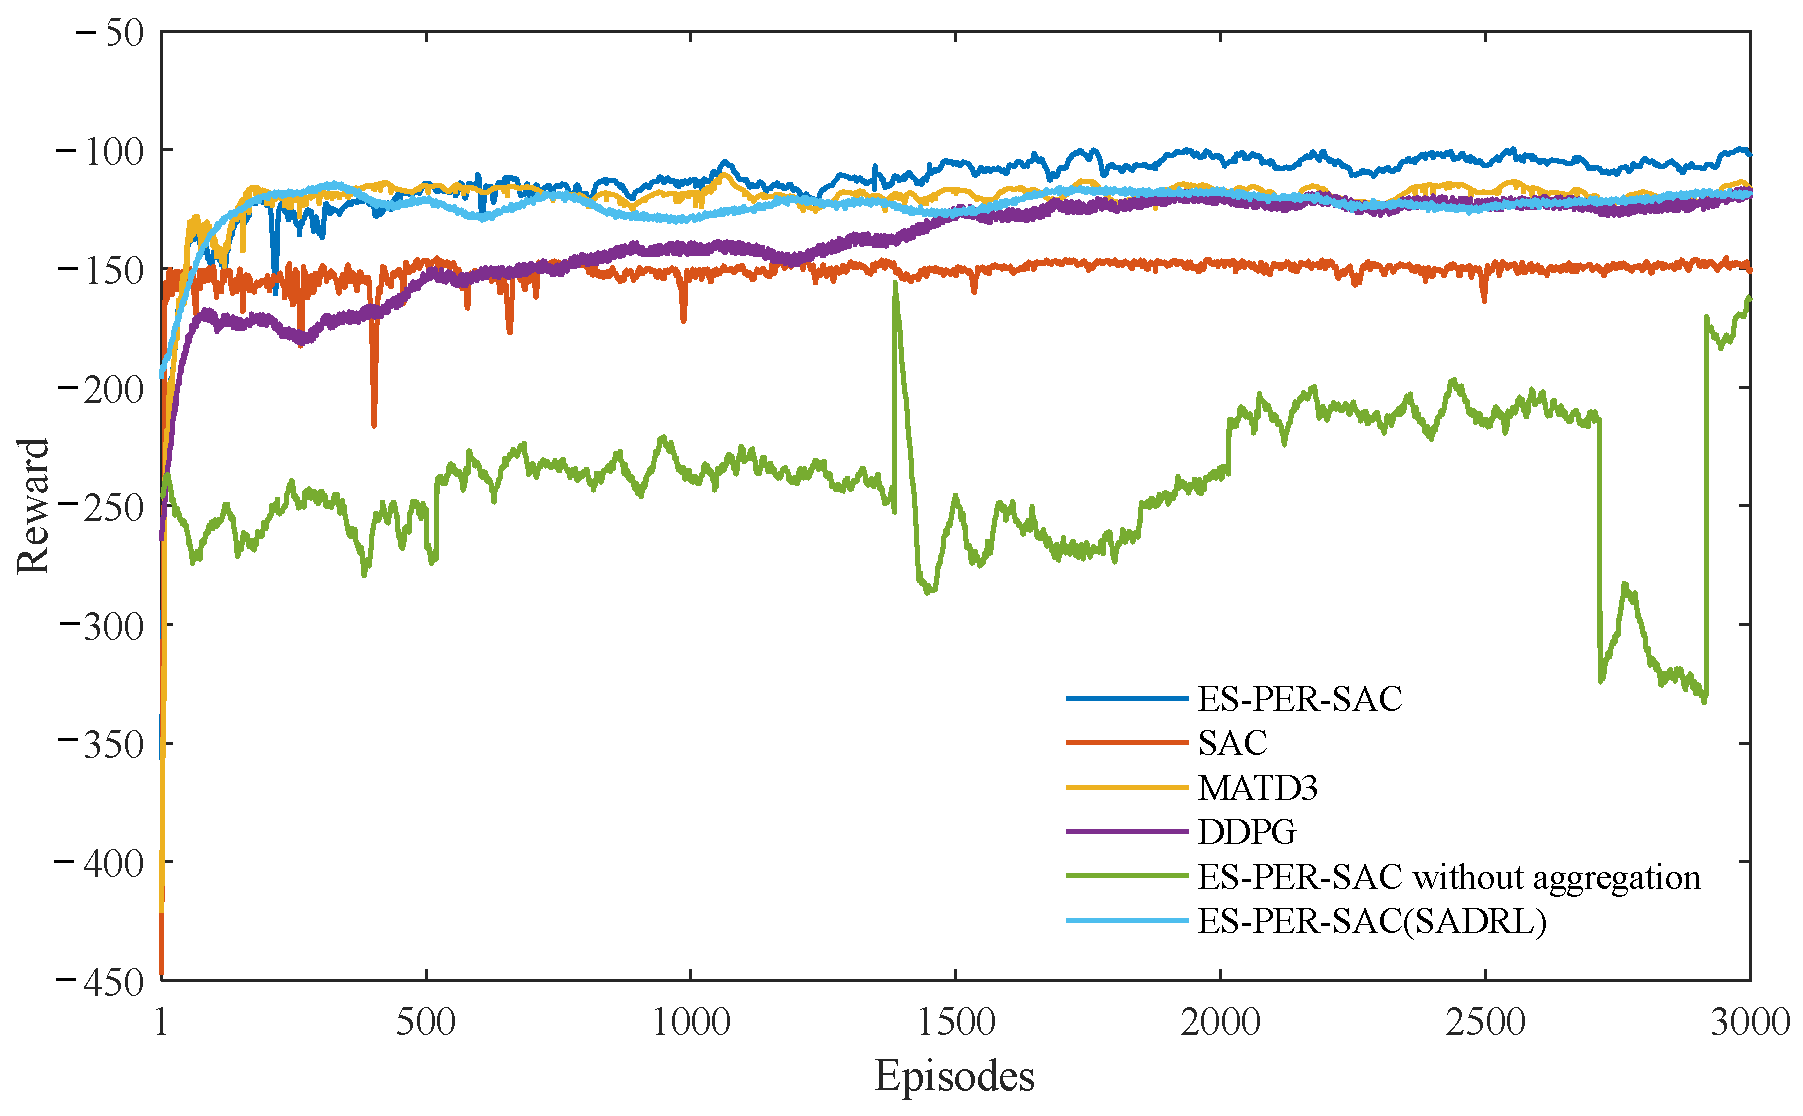
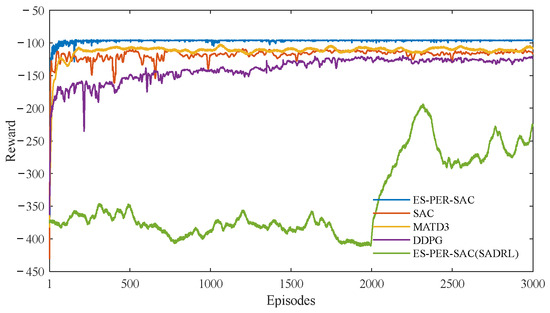
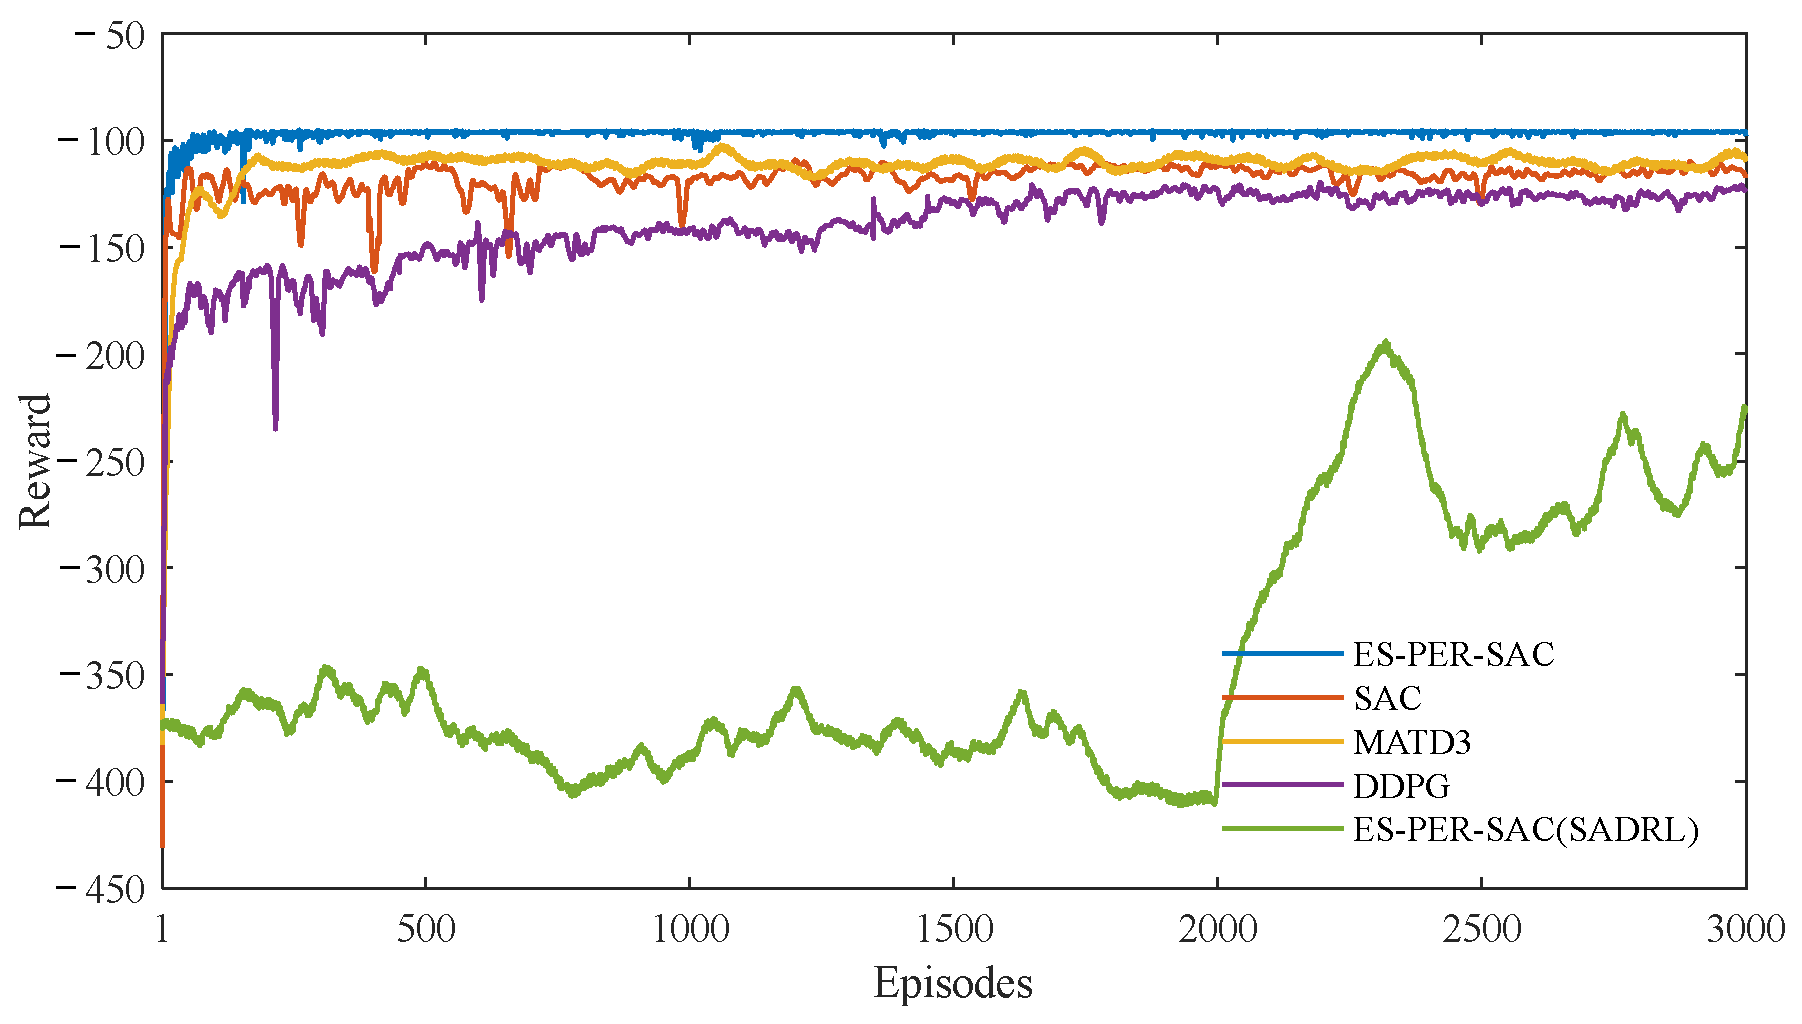
To demonstrate the convergence, effectiveness, and optimality of the proposed model, Figure 4 and Figure 5 illustrate the training processes of multiple algorithms, namely ES-PER-SAC, ES-PER-SAC (without aggregation), SAC, MATD3, MADDPG and ES-PER-SAC (SADRL) on the IEEE 33-bus and IEEE 123-bus systems, respectively. The following conclusions can be drawn:
Figure 4.
Algorithmic training comparisons in IEEE 33-bus.
Figure 5.
Algorithmic training comparisons in IEEE 123-bus.
- It can be observed from ES-PER-SAC (SADRL) that the single-agent-based method is still capable of achieving convergence in the relatively small-scale IEEE 33-bus system. However, when applied to the larger IEEE 123-bus system, this single-agent approach fails to converge effectively. In contrast, the MADRL framework adopted in this paper partitions the entire network into multiple subregions, with each agent responsible for a specific region. This decomposition strategy significantly reduces the dimensionality of the action and observation spaces for each individual agent, thereby facilitating more efficient exploration and faster convergence. Moreover, although each agent operates independently, the CTDE paradigm enables inter-agent cooperation during the training phase, allowing the agents to learn coordinated strategies that approximate the global optimum.
- In the absence of resource aggregation, each agent directly controls dozens of resources in the IEEE 33-bus system, and the algorithm fails to achieve effective convergence. In contrast, all other algorithms based on resource aggregation eventually converge. Therefore, in the context of rapidly increasing distributed energy resources, resource aggregation is beneficial for enhancing model scalability. Moreover, since ES-PER-SAC (without aggregation) cannot be effectively controlled in the IEEE 33-bus system, it is not applied to the IEEE 123-bus system.
- Comparing the volatility of the training processes among the algorithms, all four algorithms exhibit a gradually increasing trend. ES-PER-SAC and SAC show a relatively fast increase with stable fluctuations, while MATD3 and MADDPG also display a gradual upward trend but with greater volatility, which stabilizes after 1000 episodes.
- Comparing the final converged optimal values, PER-PS-SAC ultimately converges to approximately −115/−95; SAC converges to around −150/−120; MATD3 and MADDPG converge to about −130/−120 and −140/−150, respectively. These results indicate that the introduction of ES and PER techniques accelerates training convergence and enhances decision-making optimality.
4.3. Results of Decision-Making
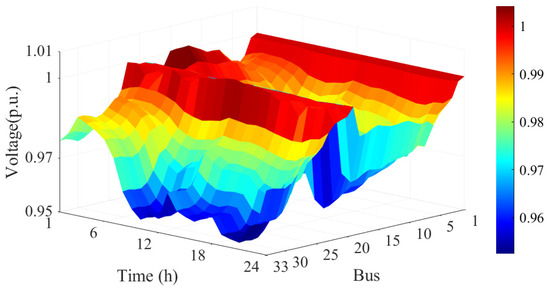
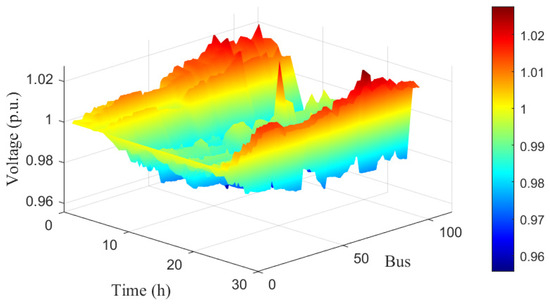
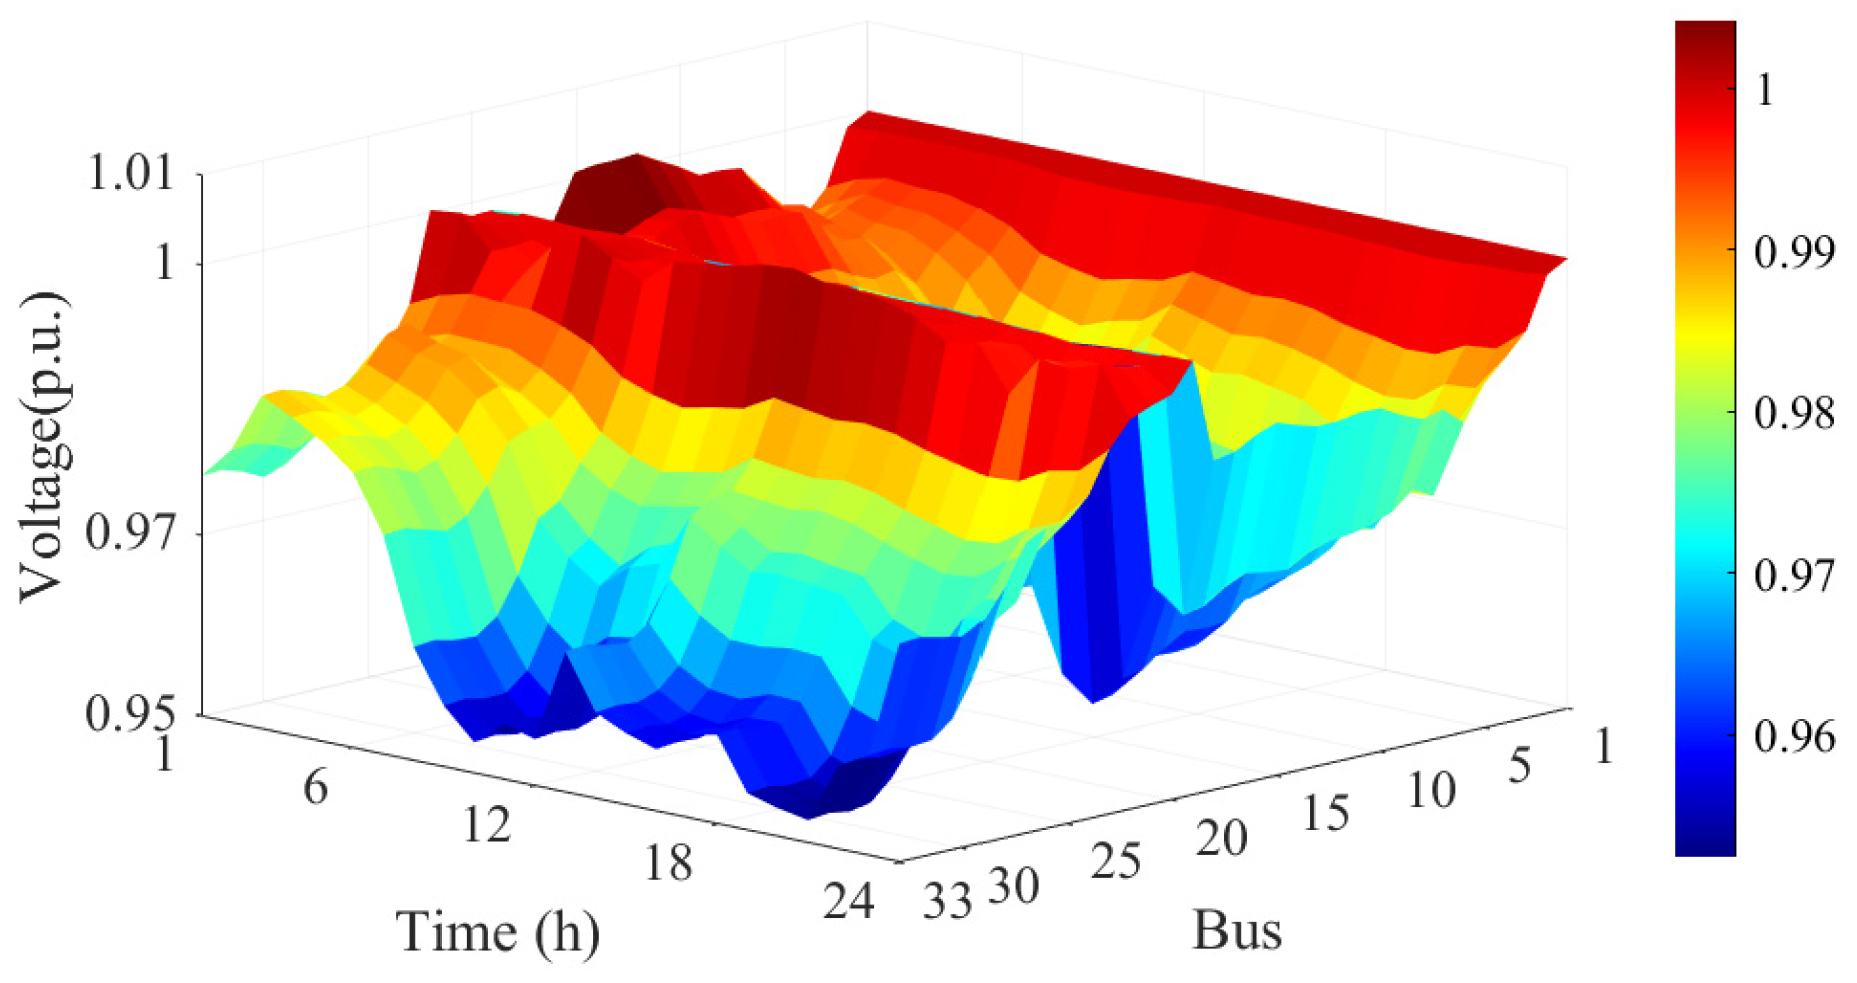
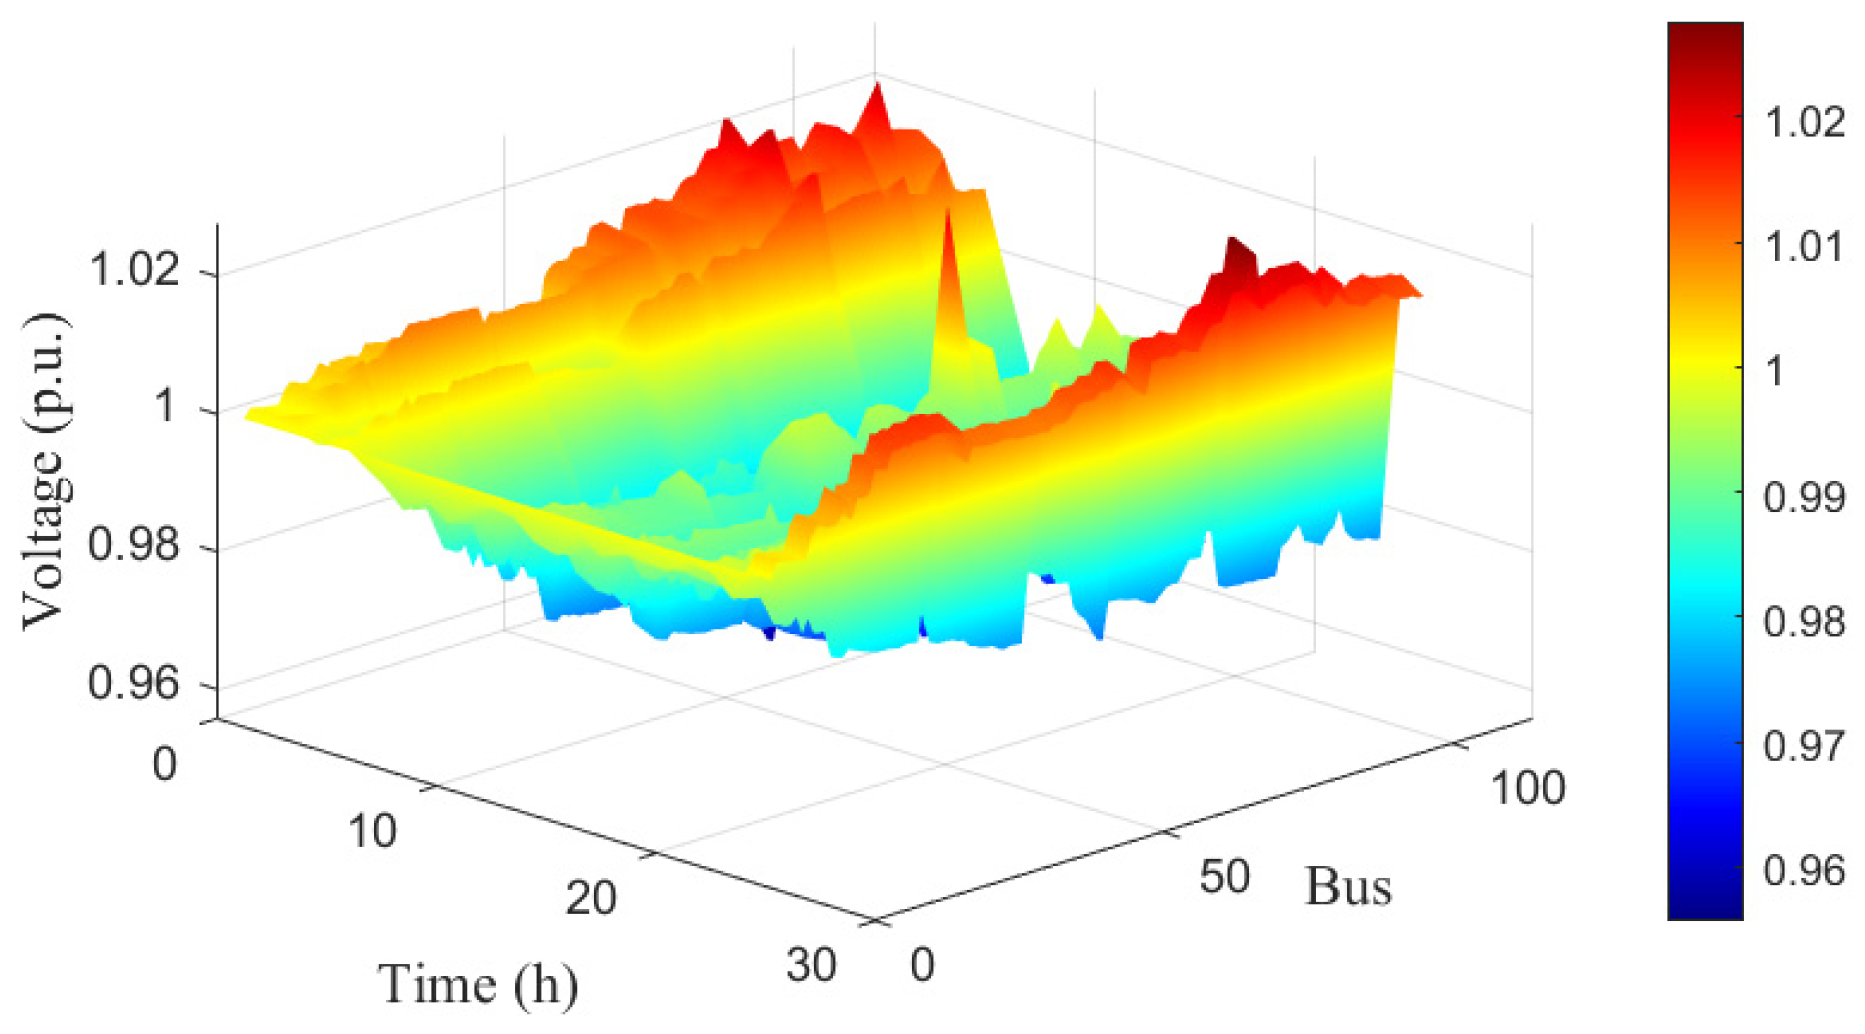
The voltage of the DNs is constrained by the reward function. When the voltage exceeds these limits, the reward will be reduced. The voltage at each node at every time step should be maintained within the range of [0.95, 1.05] p.u. Figure 6 presents three-dimensional voltage plots for two distribution networks of different scales. The voltages at all nodes of the DNs remain within the reasonable range over the 24 h period and do not exceed the limits. The maximum voltage values in the two networks occur at bus 11 and bus 81, with values of 1.012/1.046, respectively, while the minimum voltage values are 0.951/0.957. The proposed model effectively achieves voltage regulation.
Figure 6.
Hourly voltage data for each bus in IEEE 33/123-bus systems.
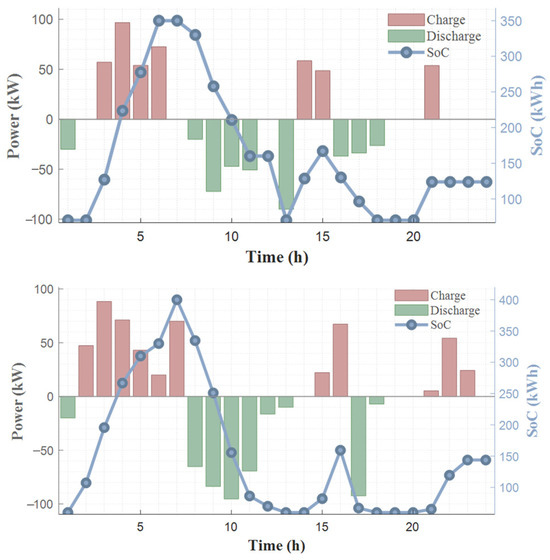
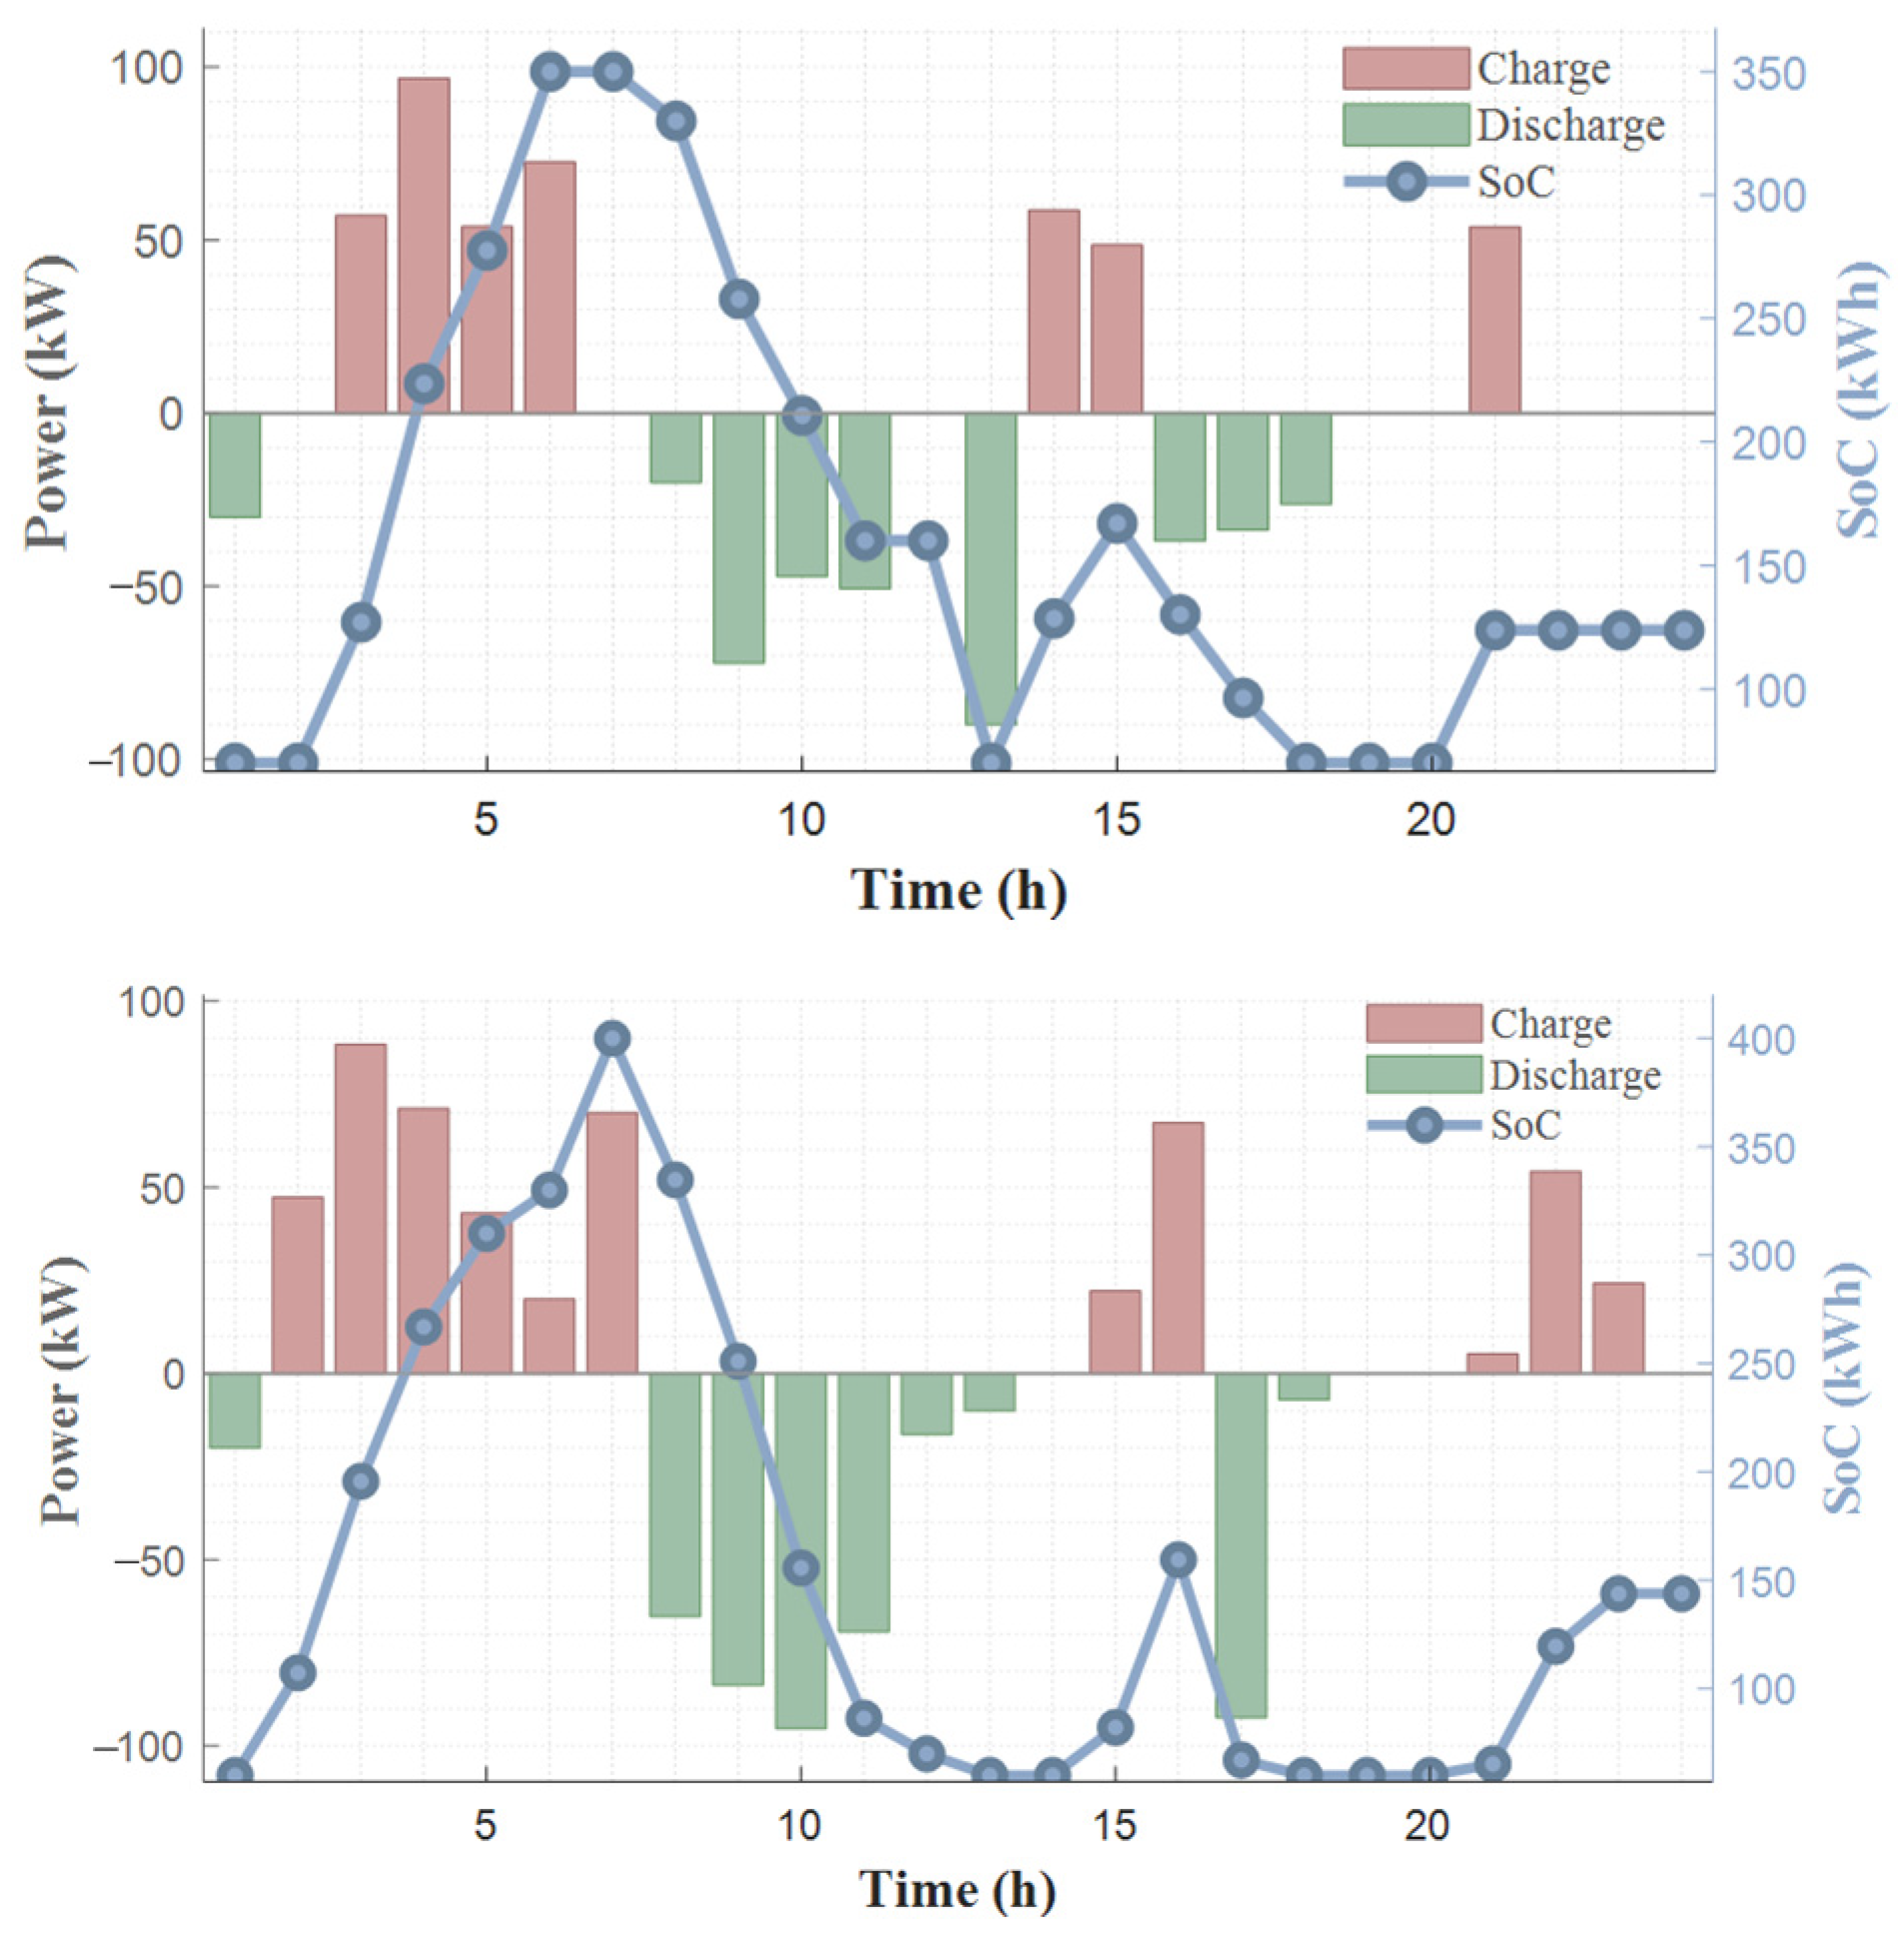
Figure 7 illustrates the SoC and charging/discharging power of the ESS in the IEEE 33/123-bus systems. It can be observed that both the charging/discharging actions and the SoC satisfy the constraints. Influenced by the reward function, the ESS operates to further achieve voltage regulation and reduce network losses.
Figure 7.
Charging/discharging power and SoC of the ESS.
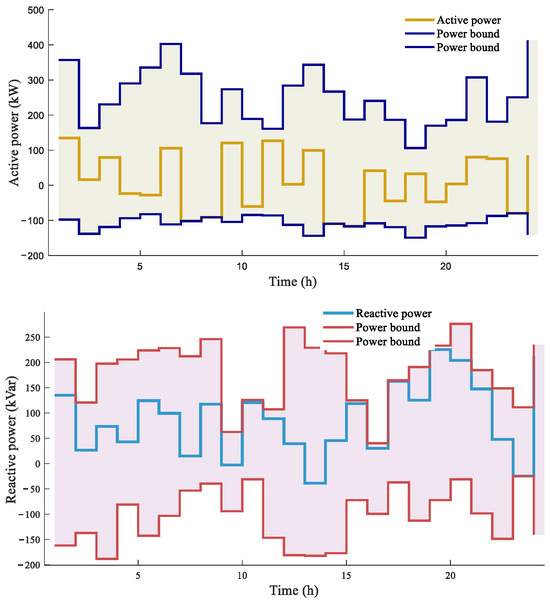
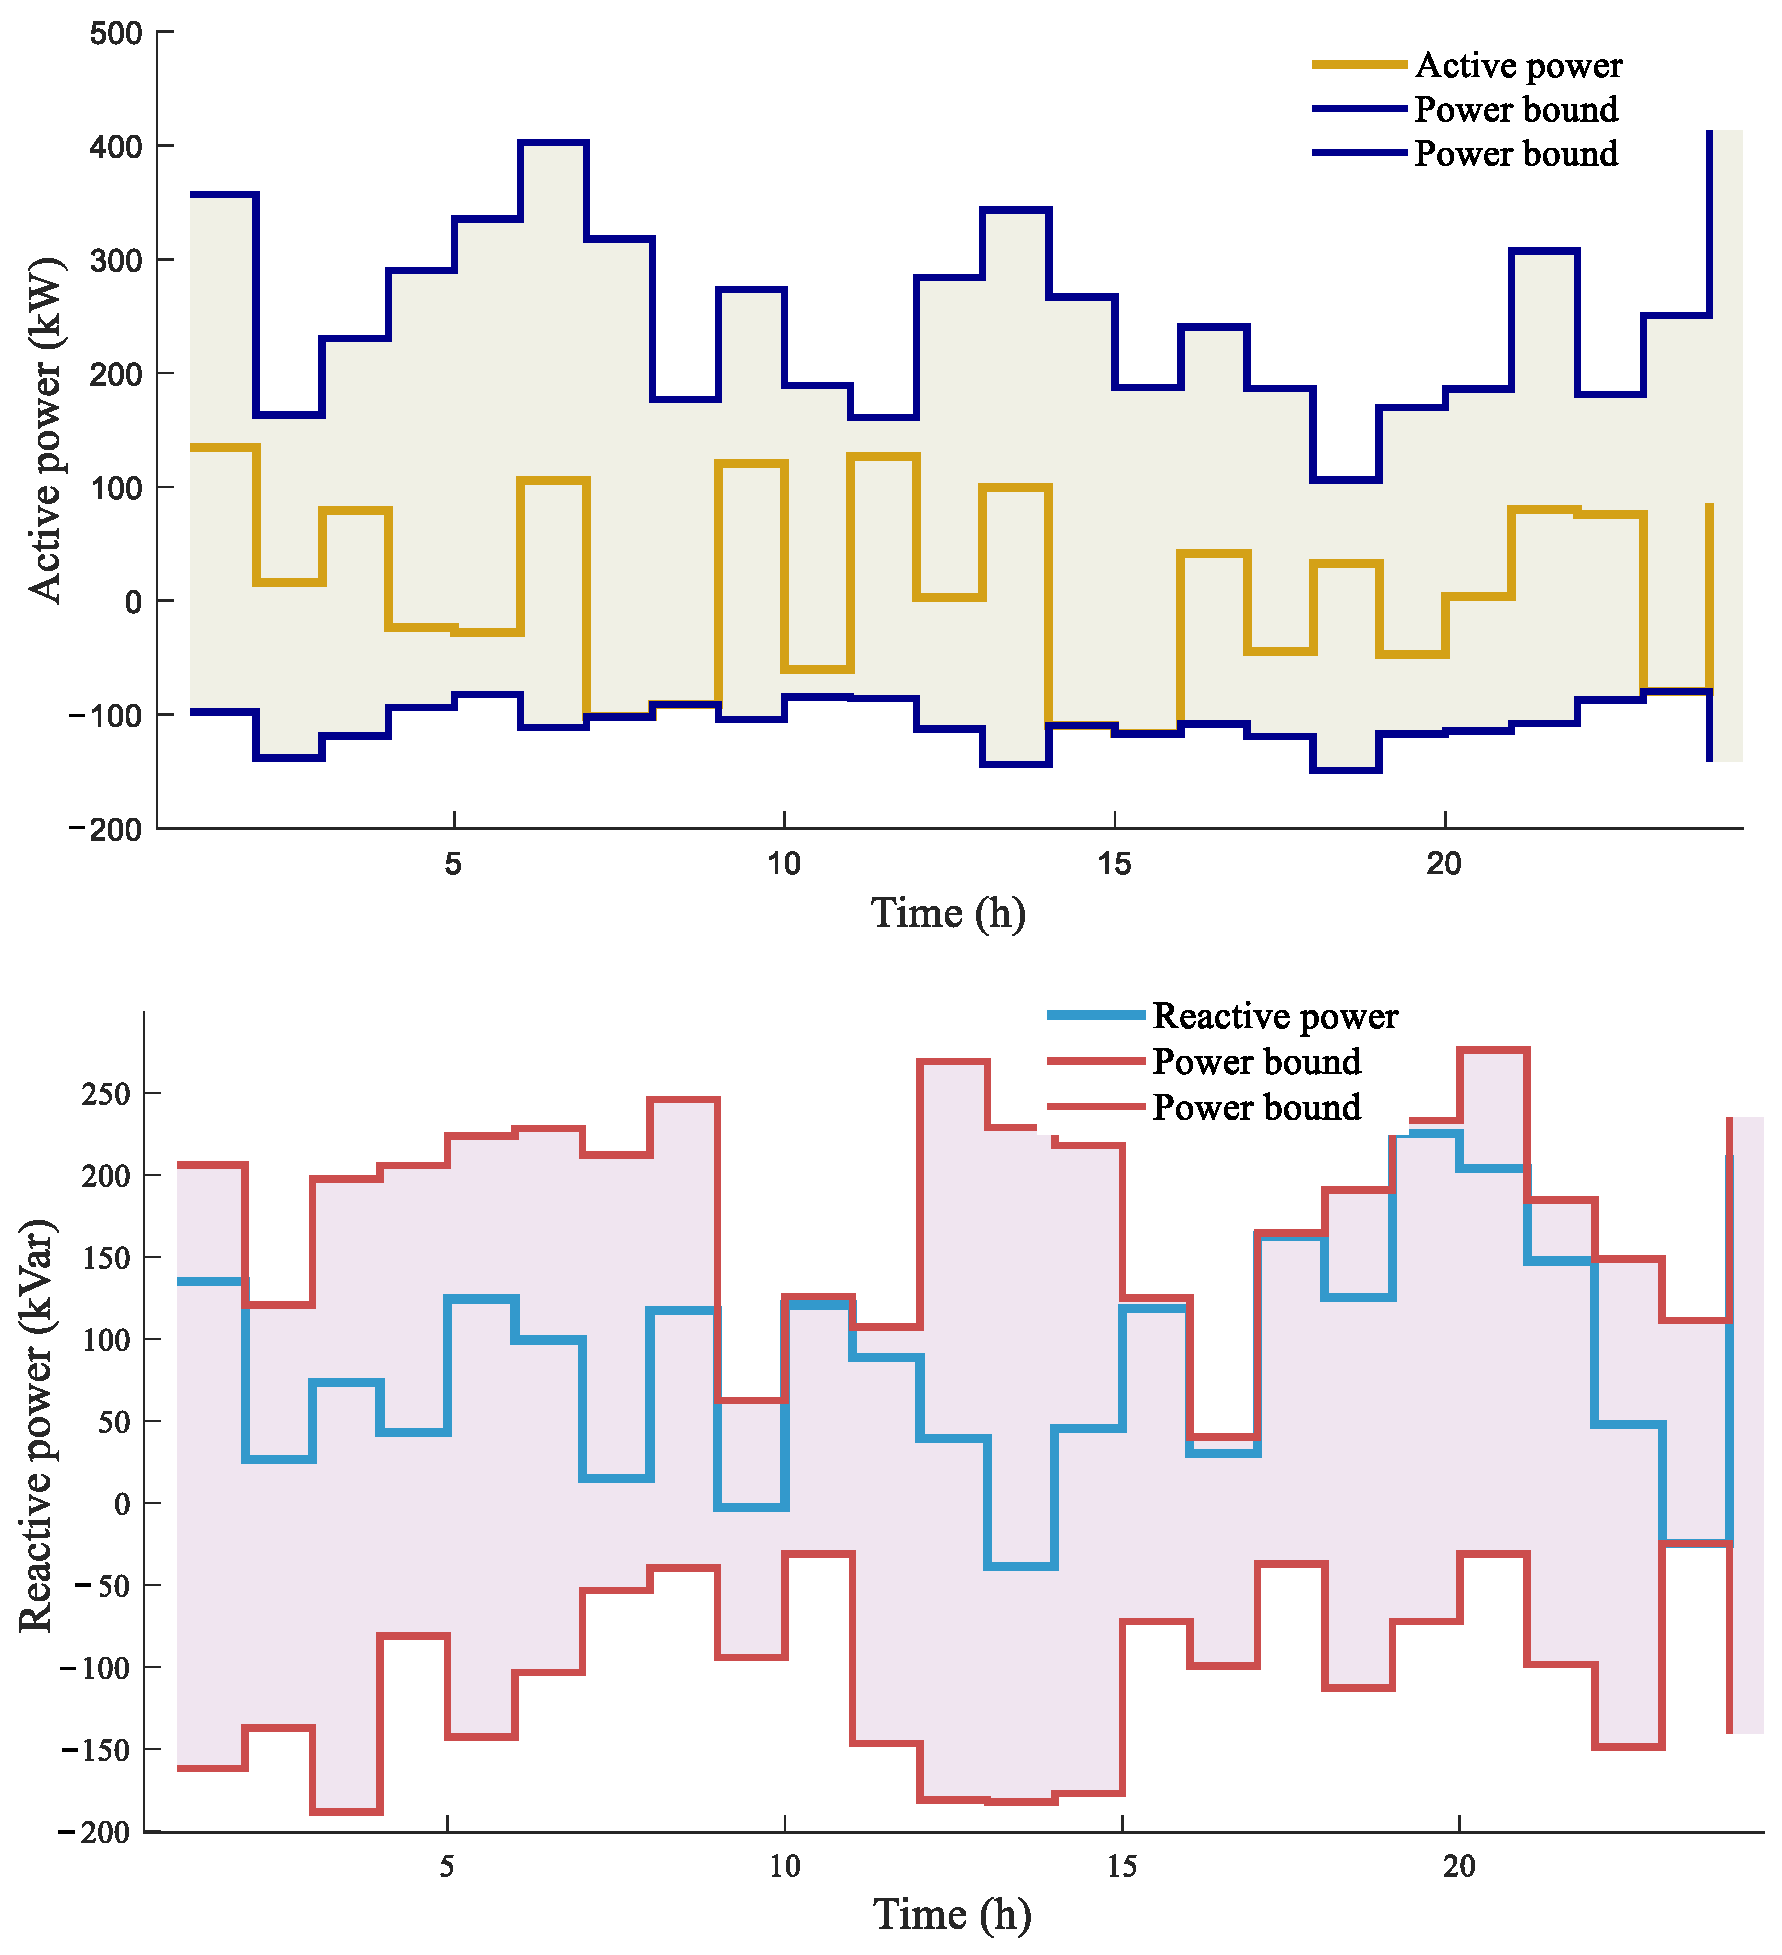
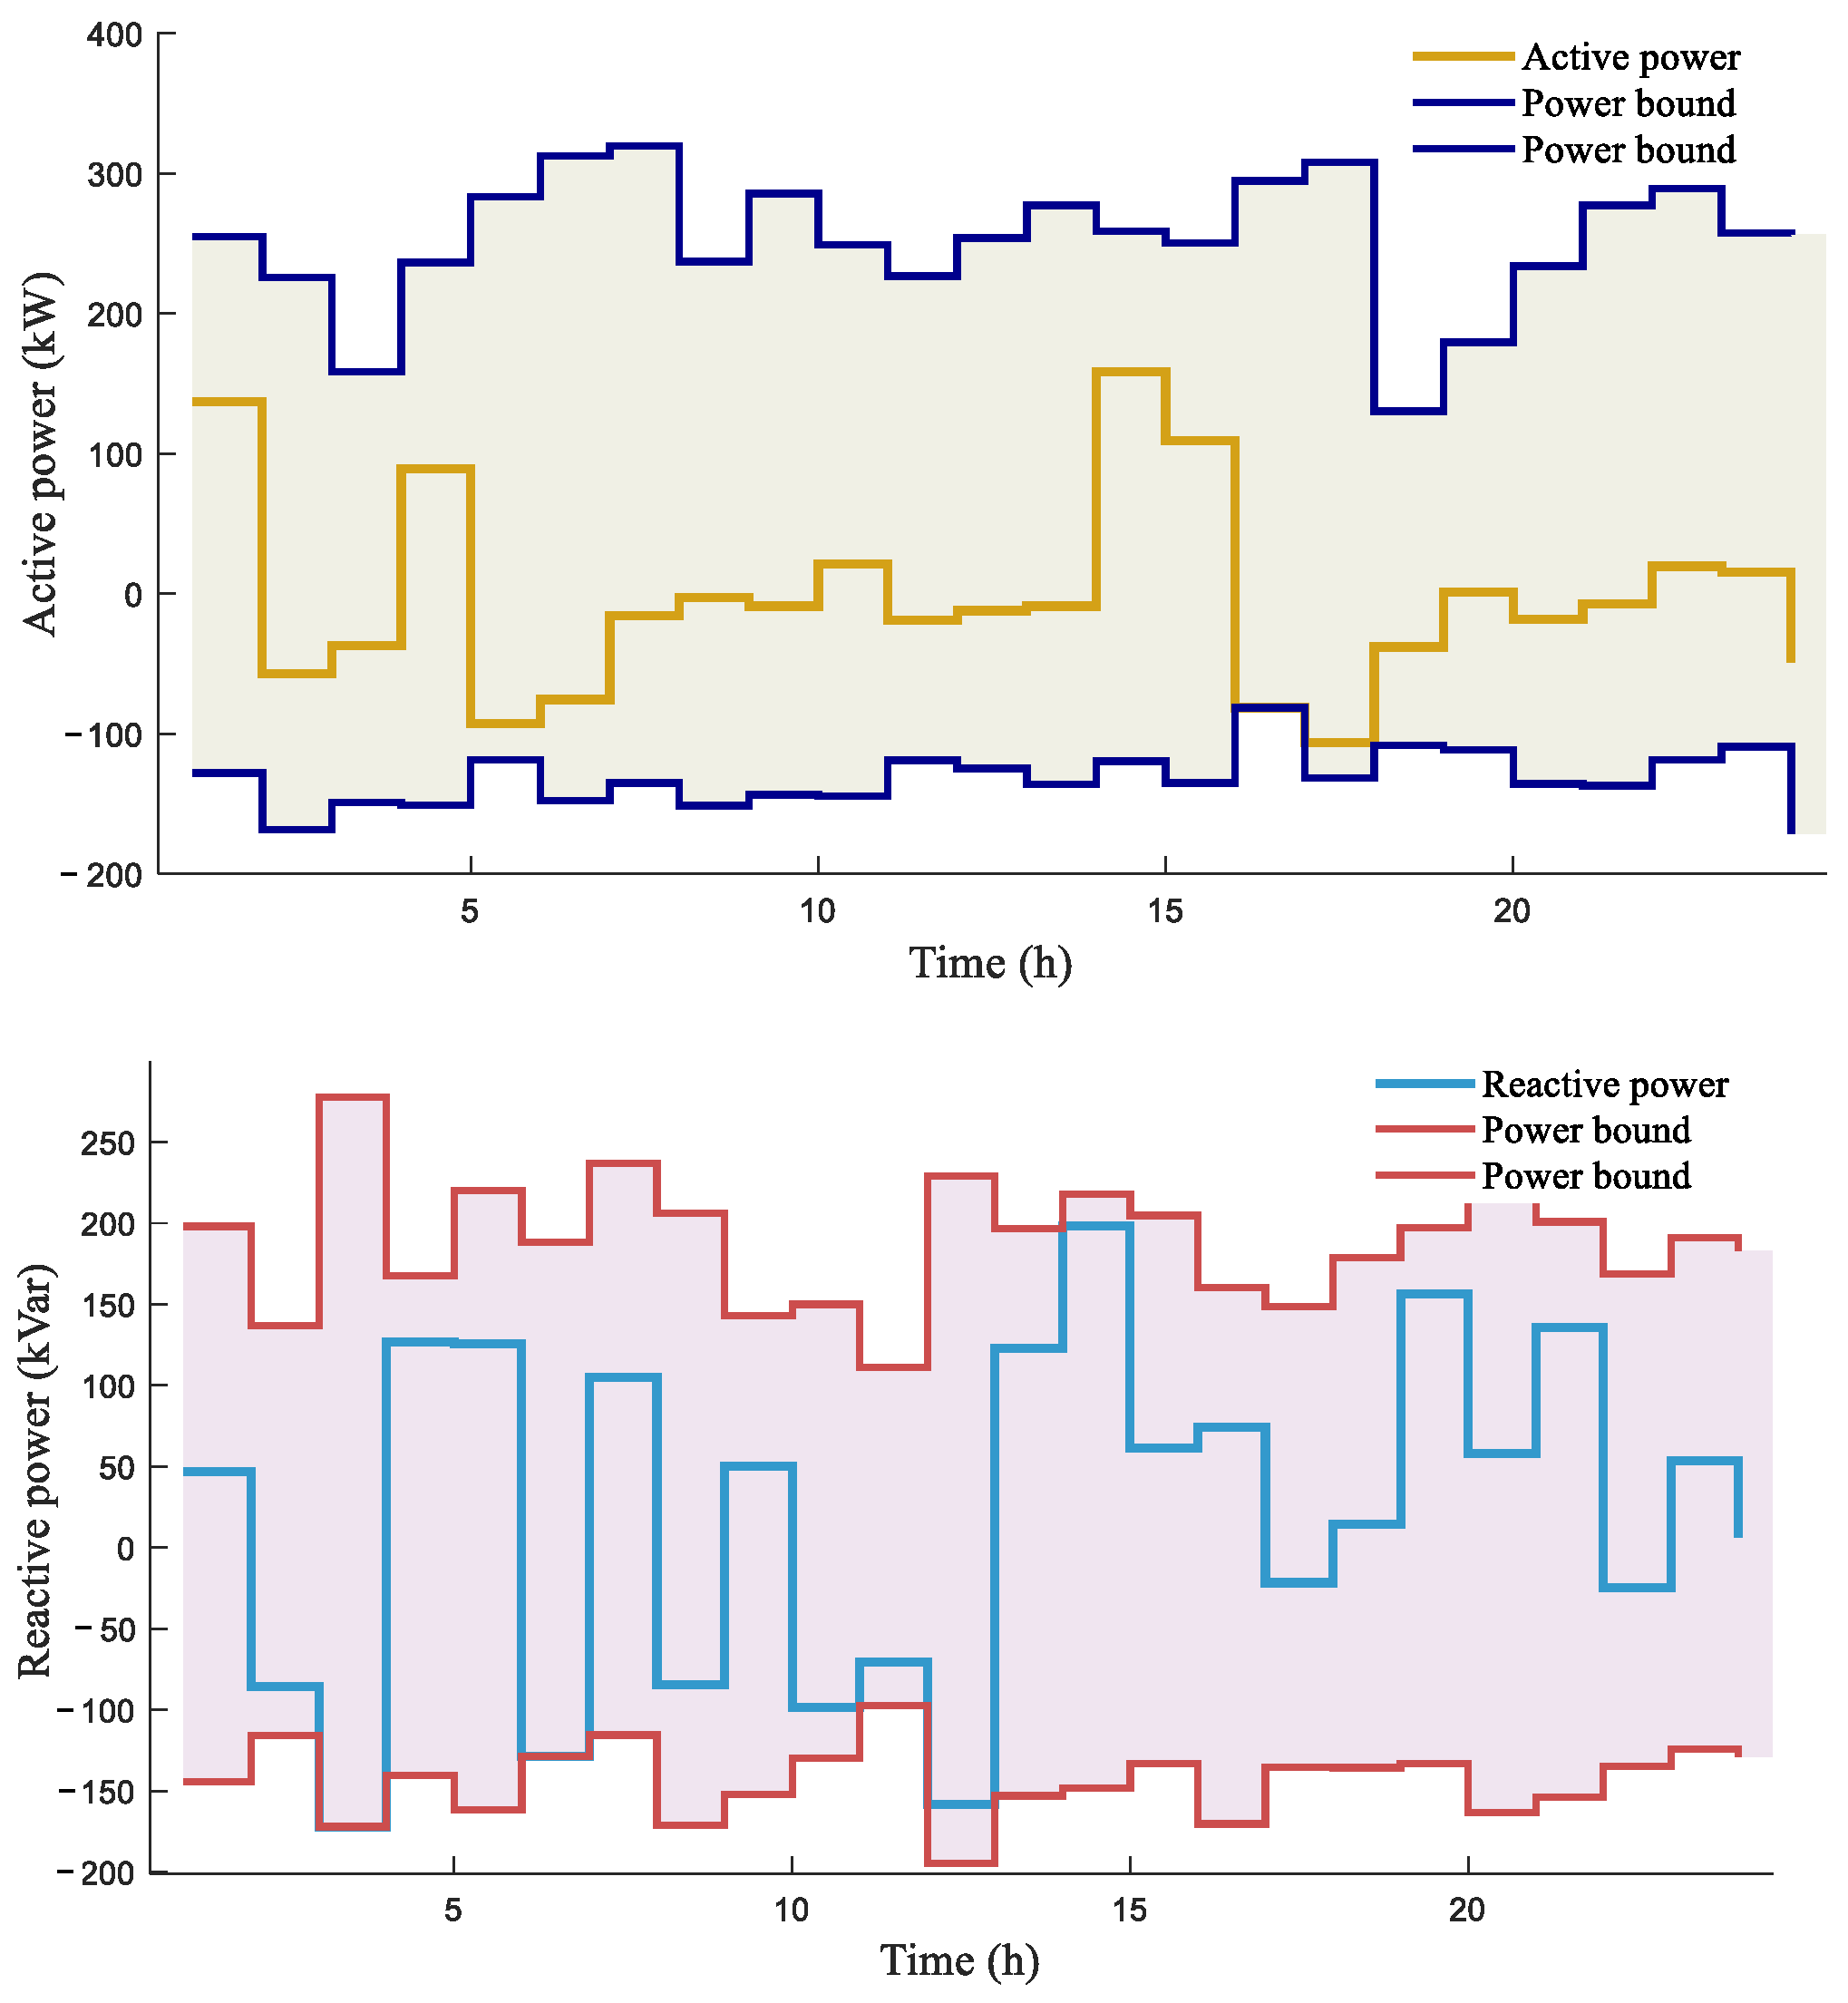
Figure 8 respectively illustrate the upper and lower limits of the aggregated active power and reactive power of the resources at bus 11 in the IEEE 33-bus system, along with the decision-making results of the model. A negative value after resource aggregation indicates the amount of electricity that can be fed into the DN, while a positive value indicates the amount of electricity absorbed from the network. Since the aggregated resources only include distributed photovoltaics, wind power, and loads without any temporal coupling, both active and reactive power are solely constrained by their respective upper and lower limits. It can be observed that during periods of high voltage, the decision-making results for the aggregated resources decrease significantly, whereas at other times, they are influenced by the combined effects of voltage and network losses.
Figure 8.
Decision-making results for active and reactive power outputs of Bus 11.
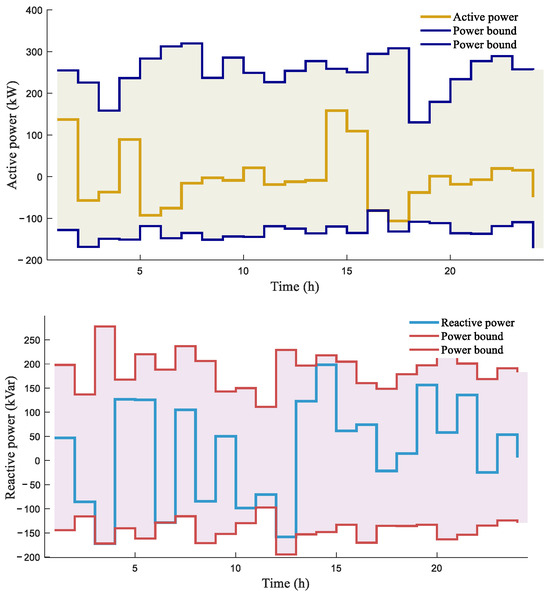
To further analyze the decision-making values of the aggregated resources, Figure 9 presents the resource aggregation results at bus 58 in the IEEE 123-bus system, along with the resource control results based on MADRL. Similar to Figure 8, the decision-making results for both active and reactive power lie within the upper and lower limits of active/reactive power, demonstrating the accuracy of the model.
Figure 9.
Decision-making results for active and reactive power outputs of Bus 58.
4.4. The Network Losses and Voltage Violation Rate of DNs
Table 3 presents the network losses and voltage violation rates obtained from the decision-making results of the proposed model in two different-scale networks over one-day and seven-day horizons. It can be observed that our model is capable of minimizing network losses while effectively avoiding voltage violations. In both the IEEE 33-bus and IEEE 123-bus test systems, the proposed method achieves the lowest network losses and effectively prevents voltage violations, with the network losses over the one-day horizon reduced by approximately 11.7% and 21.5%, respectively, compared to other algorithms. Overall, the decision-making results of our model outperform those of the other comparative algorithms.
Table 3.
Comparison of network loss and voltage violation rate in IEEE 33/123-bus using different algorithms.
4.5. Training and Decision-Making Speed
In addition to the effectiveness and reliability of the model, training speed and computational speed are equally crucial, as they determine the model’s practicality and the time scale of problems it can address. Table 4 presents the training and decision-making times of different algorithms on two distinct systems: the IEEE 33-bus and IEEE 123-bus systems. It can be observed that as the network scale increases, the model generally requires longer training and decision-making times. Compared with various other algorithms, our model integrates ES and PER techniques into the SAC algorithm, thereby improving both training speed and computational speed. Typically, the MADRL decision-making time is within one second, demonstrating the feasibility and effectiveness of the model for real-time optimization and control of DNs across various time scales.
Table 4.
Training time and decision-making time of different algorithms on IEEE 33/123-bus systems.
Notably, unlike conventional centralized optimization methods whose computation time typically grows exponentially or quadratically with the number of nodes, the online decision time of the proposed method increases only marginally with network scale, as it depends primarily on the inference time of individual agents operating in parallel. This further confirms the scalability of the proposed approach for practical large-scale distribution systems.
4.6. Impact of Different Reward Functions on the Results
As shown in Table 5, when the reward function is designed to consider only voltage violations, the resulting network losses over the seven-day period are as high as 15,963.24 kW and 9374.16 kW, respectively. Conversely, when the objective function is configured to minimize network losses alone, the voltage violation rates reach 12.5% and 6.5%, respectively, over the same period. By contrast, the proposed method achieves a voltage violation rate of 0%, while reducing the network losses to 14,018.79 kW and 6719.86 kW. These results clearly indicate that the reward function design exerts a substantial influence on the overall performance.
Table 5.
Results of different reward functions on IEEE 33/123-bus systems.
Based on the above analysis, we recommend that system operators in regions with high renewable penetration, e.g., Spain, prioritize the deployment of distributed learning-based voltage controllers over centralized model-based ones. Moreover, the aggregation strategy adopted in our framework can be integrated into existing SCADA/EMS systems with only minor hardware upgrades, as it requires only local measurements and sparse inter-agent communication. These measures can significantly reduce the probability of blackouts triggered by voltage issues.
5. Conclusions
This paper proposes a real-time active and reactive power cooperative optimization method for DNs based on large-scale resource aggregation to address the challenge of real-time effective control under large-scale distributed energy resource integration. First, DCs, as novel devices, are considered as flexible loads and incorporated into dispatchable resources to further exploit the regulation potential of DNs. Second, the total power aggregated from a large number of regional distributed resources is used as the input to the MADRL model, which protects the data privacy of individual devices and reduces voltage violation rates and network losses without requiring communication. Finally, ES and PER are integrated into the SAC algorithm. ES enhances global exploration capability through population evolution to avoid falling into local optima, while PER improves training efficiency and stability by prioritizing high-value experience samples, thereby accelerating convergence and enhancing decision-making quality. The results demonstrate that, compared with other methods, the proposed method achieves a voltage violation rate of 0% and achieves an average network loss reduction of 16.6% on both the IEEE 33-bus and IEEE 123-bus systems, confirming its effectiveness and superiority. Future work can further explore the collaborative scheduling potential arising from the spatiotemporal migration of computing tasks in data centers.
Author Contributions
Methodology, X.Z., Y.C., Y.Y. and Y.Z.; Software, P.Y. and Y.Y.; Formal analysis, J.X.; Investigation, J.X., X.Z. and Z.Z.; Resources, Y.Y., X.W. and J.L.; Data curation, X.W., Z.Z. and J.L.; Writing—original draft, P.Y.; Writing—review & editing, S.S. and Y.Z.; Supervision, S.S.; Funding acquisition, S.S. and Y.Z. All authors have read and agreed to the published version of the manuscript.
Funding
This work was supported by the Science and Technology Project of State Grid Shandong Electric Power Company (Grant No. 520626250014) “Research and Application of High-Reliability Power Supply and Active Grid Support Technology for Distributed Photovoltaic-Storage Substations Based on Microgrid Clusters”.
Data Availability Statement
The data presented in this study are available on request from the corresponding author. The data are not publicly available due to privacy restrictions.
Conflicts of Interest
Authors Peng Yu, Jiawei Xing, Xinbin Zuo, Yan Cheng, Yu Yi, Shunmin Sun, Xiao Wei, Zhigang Zhang and Jianxiu Li were employed by the State Grid Shandong Electric Power Research Institute. The remaining authors declare that the research was conducted in the absence of any commercial or financial relationships that could be construed as a potential conflict of interest. The authors declare that this study received funding from State Grid Shandong Electric Power Company. The funder was not involved in the study design, collection, analysis, interpretation of data, the writing of this article or the decision to submit it for publication.
Appendix A
The four colors represent the resources in four different regions. In the first column, the curves represent wind power, with the black curve denoting the sum of all wind power outputs. In the second column, the curves represent PV power, with the black curve denoting the sum of all PV outputs. In the third column, the curves represent loads, with the black curve denoting the sum of all loads. The fourth column presents the net load results for each region.
Figure A1.
Schematic diagram of resources in each region.
References
- Qiu, S. Renewable Energy Accounts for Over 60% of China’s Installed Capacity. China Energy Storage Network, 27 February 2026. Available online: https://www.escn.com.cn/news/show-2239301.html (accessed on 15 March 2026).
- “Research Report on the Development of Green Computing in China,” June 2024. Available online: https://www.caict.ac.cn/kxyj/qwfb/ztbg/202507/P020250724397149741659.pdf (accessed on 15 March 2026).
- Wang, Y.; Tang, H.; Wei, Y.; Han, K.; Han, T.; Lin, J.; Han, Y. Comprehensive Energy Consumption and Flexibility Forecast of Data Centers in China. J. Beijing Inst. Technol. (Soc. Sci. Ed.) 2025, 27, 12–18. [Google Scholar] [CrossRef]
- Caprara, A.; Yu, Y.; Teng, F.; Junyent-Ferré, A.; Bullich-Massagué, E.; Aragüés-Peñalba, M. Data center workload flexibility for power system demand response: Evidence from Alibaba traces. Int. J. Electr. Power Energy Syst. 2026, 178, 111940. [Google Scholar] [CrossRef] [Scilit]
- Wang, Y.; Lin, J. Comprehensive evaluation of all-element flexibility resources in data centers: Considering synergistic benefits of computing, electricity, and heat. Appl. Energy 2025, 399, 126442. [Google Scholar] [CrossRef] [Scilit]
- Xu, J.; Gao, H.; Wang, R.; Liu, J. Real-Time Operation Optimization in Active Distribution Networks Based on Multi-Agent Deep Reinforcement Learning. J. Mod. Power Syst. Clean Energy 2024, 12, 886–899. [Google Scholar] [CrossRef] [Scilit]
- Wang, S.; Sheng, W.; Shang, Y.; Liu, K. Distribution network voltage control considering virtual power plants cooperative optimization with transactive energy. Appl. Energy 2024, 371, 123680. [Google Scholar] [CrossRef] [Scilit]
- Sun, X.; Qiu, J. Two-Stage Volt/Var Control in Active Distribution Networks with Multi-Agent Deep Reinforcement Learning Method. IEEE Trans. Smart Grid 2021, 12, 2903–2912. [Google Scholar] [CrossRef] [Scilit]
- Sun, X.; Qiu, J.; Yi, Y.; Tao, Y. Cost-Effective Coordinated Voltage Control in Active Distribution Networks with Photovoltaics and Mobile Energy Storage Systems. IEEE Trans. Sustain. Energy 2022, 13, 501–513. [Google Scholar] [CrossRef] [Scilit]
- Sun, X.; Qiu, J. A customized voltage control strategy for electric vehicles in distribution networks with reinforcement learning method. IEEE Trans. Ind. Inform. 2021, 17, 6852–6863. [Google Scholar] [CrossRef] [Scilit]
- Lavrov, M.; Glushankov, E.I.; Kondrashov, Z.; Rylov, E. Study of Signal Processing Algorithms in Antenna Arrays Based on Heuristic Optimization Methods. In 2024 Systems of Signal Synchronization, Generating and Processing in Telecommunications (SYNCHROINFO), Vyborg, Russian Federation; IEEE: Piscataway, NJ, USA, 2024; pp. 1–5. [Google Scholar] [CrossRef] [Scilit]
- Ren, J.; Zeng, Y.; Qin, C. Practical Dynamic Security Region Model: A Hybrid Physical Model-Driven and Data-Driven Approach. IEEE Trans. Power Syst. 2025, 40, 728–739. [Google Scholar] [CrossRef] [Scilit]
- Zhou, Y.; Zhou, L.; Sheng, X.; Gu, D.; Shen, W.; Chen, Q. Deep reinforcement learning based reactive power regulation and its optimization in power grids. Appl. Math. Nonlinear Sci. 2024, 9. [Google Scholar] [CrossRef] [Scilit]
- Kamiya, G. Data Centres and Data Transmission Networks; Rep. 20.500.12592/r5cdxj; International Energy Agency: Paris, France, 2020; Available online: https://academized.com/blog/data-centres-and-data-transmission-networks (accessed on 15 March 2026).
- Vafamehr, A.; Khodayar, M.E.; Manshadi, S.D.; Ahmad, I.; Lin, J. A Framework for Expansion Planning of Data Centers in Electricity and Data Networks Under Uncertainty. IEEE Trans. Smart Grid 2017, 10, 305–316. [Google Scholar] [CrossRef] [Scilit]
- Breaking Barriers to Data Center Growth. Available online: https://web-assets.bcg.com/pdf-src/prod-live/breaking-barriers-data-center-growth.pdf (accessed on 15 March 2026).
- Chen, M.; Gao, C.; Song, M.; Chen, S.; Li, D.; Liu, Q. Internet data centers participating in demand response: A comprehensive review. Renew. Sustain. Energy Rev. 2020, 117, 109466. [Google Scholar] [CrossRef] [Scilit]
- Li, J.; Qi, W. Toward Optimal Operation of Internet Data Center Microgrid. IEEE Trans. Smart Grid 2018, 9, 971–979. [Google Scholar] [CrossRef] [Scilit]
- Chen, M.; Gao, C.; Shahidehpour, M.; Li, Z.; Chen, S.; Li, D. Internet data center load modeling for demand response considering the coupling of multiple regulation methods. IEEE Trans. Smart Grid 2021, 12, 2060–2076. [Google Scholar] [CrossRef] [Scilit]
- Goiri, Í.; Le, K.; Nguyen, T.D.; Guitart, J.; Torres, J.; Bianchini, R. Green Hadoop: Leveraging green energy in data processing frameworks. In Proceedings of the 7th ACM European Conference on Computer Systems; ACM: New York, NY, USA, 2012; pp. 57–70. [Google Scholar]
- Li, C.; Zheng, K.; Guo, H.; Kang, C.; Chen, Q. Computation-Power Coupled Modeling for IDCs and Collaborative Optimization in ADNs. IEEE Trans. Smart Grid 2024, 15, 2762–2775. [Google Scholar] [CrossRef] [Scilit]
- Tao, Y.; Dong, Z.Y.; Qiu, J.; Lai, S.; Sun, X.; Ruan, J.; Lin, J.; Zhao, J. Human-in-the-loop Reinforcement Learning Method for Volt/Var Control in Active Distribution Network with Safe Operation Mechanism. IEEE Trans. Sustain. Energy 2025, 17, 498–512. [Google Scholar] [CrossRef] [Scilit]
- Kabir, F.; Gao, Y.; Yu, N. Reinforcement learning-based smart inverter control with polar action space in power distribution systems. In 2021 IEEE Conference on Control Technology and Applications (CCTA); IEEE: Piscataway, NJ, USA, 2021; pp. 315–322. [Google Scholar]
- Liu, H.; Wu, W. Two-stage deep reinforcement learning for inverter-based volt-var control in active distribution networks. IEEE Trans. Smart Grid 2021, 12, 2037–2047. [Google Scholar] [CrossRef] [Scilit]
- Cao, D.; Hu, W.; Xu, X.; Wu, Q.; Huang, Q.; Chen, Z.; Blaabjerg, F. Deep reinforcement learning based approach for optimal power flow of distribution networks embedded with renewable energy and storage devices. J. Mod. Power Syst. Clean Energy 2021, 9, 1101–1110. [Google Scholar] [CrossRef] [Scilit]
- Ahmadi, C.; Chen, J.-L. Survey on Reinforcement Learning Techniques for Enhancing Security and Efficiency in Zero Trust Networks. In Proceedings of the 2024 10th International Conference on Applied System Innovation (ICASI), Kyoto, Japan, 17–21 April 2024; pp. 427–429. [Google Scholar]
- Sutton, R.S.; Barto, A.G. Reinforcement Learning: An Introduction. IEEE Trans. Neural Netw. 1998, 9, 1054. [Google Scholar] [CrossRef] [Scilit]
- Hu, D.; Ye, Z.; Gao, Y.; Ye, Z.; Peng, Y.; Yu, N. Multi-agent deep reinforcement learning for voltage control with coordinated active and reactive power optimization. IEEE Trans. Smart Grid 2022, 13, 4873–4886. [Google Scholar] [CrossRef] [Scilit]
- Haarnoja, T.; Zhou, A.; Abbeel, P.; Levine, S. Soft actor-critic: Off-policy maximum entropy deep reinforcement learning with a stochastic actor. In International Conference on Machine Learning; PMLR: Cambridge, MA, USA, 2018; Volume 80, pp. 1861–1870. [Google Scholar]
- Schaul, T.; Quan, J.; Antonoglou, I.; Silver, D. Prioritized experience replay. arXiv 2015, arXiv:1511.05952.2015. [Google Scholar] [CrossRef] [Scilit]

Disclaimer/Publisher’s Note: The statements, opinions and data contained in all publications are solely those of the individual author(s) and contributor(s) and not of MDPI and/or the editor(s). MDPI and/or the editor(s) disclaim responsibility for any injury to people or property resulting from any ideas, methods, instructions or products referred to in the content. |
© 2026 by the authors. Licensee MDPI, Basel, Switzerland. This article is an open access article distributed under the terms and conditions of the Creative Commons Attribution (CC BY) license.