


Abstract
The escalating penetration of distributed photovoltaic (PV) systems has intensified grid-connected voltage violations, posing severe challenges to the stability of distribution networks. This paper first investigates the mechanisms of voltage violations at 35 kV substations and 380 V consumer-side terminals under high-penetration scenarios. It is demonstrated that PV integration elevates line voltage, with the voltage profile at any given node being governed by the equivalent net load—defined as the offset between total demand and PV generation—downstream of that node. Subsequently, the impacts of critical operating conditions, including PV penetration levels, line impedance, and dynamic meteorological variations, are quantitatively analyzed. Simulation results characterize voltage fluctuation patterns under diverse variables, such as varying PV outputs, line parameters, and interconnection points, thereby validating the theoretical derivation. Finally, an integrated management strategy, coupling coordinated reactor compensation with voltage-source inverter (VSI) control, is proposed. Simulation results across multi-dimensional complex scenarios verify the effectiveness of the proposed strategy in suppressing voltage violations and enhancing grid resilience.
1. Introduction
Driven by the synergy between global energy transitions and China’s “Dual Carbon” strategic goals, the development of new-generation power systems has entered a critical phase. In this context, the integration of distributed photovoltaic (PV) systems into the distribution network has scaled rapidly. This high-proportion active power injection has fundamentally altered the traditional radial topology of distribution networks, rendering power flow distribution and voltage operation characteristics highly stochastic and complex [1,2,3,4]. Furthermore, under the influence of volatile operating environments, voltage violation patterns at various nodes exhibit significant heterogeneity and nonlinearity across diverse operating conditions. This multi-dimensional interplay renders conventional, single-dimensional voltage analysis inadequate for capturing the realistic operation of distribution substations. Consequently, there is an urgent need for systematic research into the multi-dimensional evolutionary mechanisms of voltage profiles under high-proportion distributed PV integration.
References [5,6,7] mainly focuses on the impact of high-proportion photovoltaic access on the operating status of distribution transformers. High-proportion distributed photovoltaic access causes voltage increases, altering the load state of distribution transformers and lines, and affecting the safe operation of transformer equipment. However, such studies mostly focus on transformer overload or thermal aging issues, and do not sufficiently analyze the mechanism of 380 V user-side voltage limit exceedance under multi-factor coupling. References [8,9,10] focus on analyzing voltage variation patterns under different photovoltaic penetration rates, suggesting that as photovoltaic access capacity increases, low-voltage distribution networks are more prone to issues such as voltage rises, reverse power flow, and limited photovoltaic carrying capacity. These studies mostly use photovoltaic penetration as the main variable and do not further consider the impact of high overload, line impedance differences, and changes in meteorological conditions on voltage overrun, making it difficult to fully reflect the voltage variation characteristics under multi-condition operation in actual transformer areas. References [11,12] mainly consider the effects of line impedance, network structure, and low-voltage feeder parameters on voltage distribution and voltage regulation effectiveness. Most of these studies focus on the impact of line impedance on voltage distribution, with little consideration of the relationships among photovoltaic penetration rate, load levels, and dynamic weather changes under different line impedance conditions, and especially lack further mechanistic analysis of the 380 V user-side voltage limit issue. References [13,14] focus on photovoltaic output fluctuations caused by dynamic weather changes, analyzing the effects of rapid irradiance changes, cloud shadow movements, and photovoltaic power fluctuations on distribution network voltage fluctuations and power quality. However, such studies mostly focus on the characteristics of photovoltaic output fluctuations or voltage fluctuations themselves, and the mechanisms of voltage over-limit under factors such as weather dynamics, high overload, varying photovoltaic penetration rates, and line impedance are still insufficient.
It is worth noting that although these factors have been discussed to varying degrees in the existing literature, most studies have only focused on the analysis of a single dimension or a single voltage level, as shown in Table 1.
Table 1.
Comparison of this work with representative existing studies.
The core contribution of this paper compared to the aforementioned work lies in the following: (1) A unified analysis framework covering two voltage levels of 35 kV and 380 V has been established, revealing the transmission law of voltage over-limit from the secondary side of the transformer to the user end. (2) The control variable method has been adopted to conduct systematic comparative simulations of five working condition dimensions on the same platform, quantitatively providing the sensitivity of each factor. (3) For the first time, this paper identified and quantified the new power quality hazard caused by multiple transient voltage fluctuations triggered by dynamic weather changes.
Concurrently, significant scholarly efforts have been devoted to mitigating voltage violations in high-proportion PV distribution networks. Existing studies [15,16,17] explore the use of energy storage systems (ESS); however, prohibitive installation and maintenance costs limit their practical scalability. Approaches leveraging deep learning and artificial intelligence [18,19,20,21,22] have demonstrated superior regulation precision, yet they rely heavily on large-scale datasets, which may not be readily available in all operational environments. Active power curtailment [23] provides a direct means of voltage regulation but inadvertently compromises economic efficiency by reducing power sales. Other technical solutions, such as series voltage compensation [24] and on-load tap changer (OLTC) adjustment [25], suffer from inherent drawbacks including high equipment complexity and sluggish response times, respectively.
However, the majority of existing studies focus on generic scenarios under fixed photovoltaic penetration levels, failing to fully account for the stochastic, multi-dimensional operating conditions encountered in real-world environments, such as volatile weather transitions. Furthermore, in-depth analysis of voltage behavior at the 380 V consumer-side terminal remains relatively limited. Consequently, there is a compelling necessity to investigate voltage violation mechanisms in distribution networks with high-proportion distributed PV integration under diverse, multi-dimensional operating scenarios, thereby providing a more robust foundation for grid stability and voltage regulation.
To address the aforementioned research gaps, this paper presents a comprehensive framework for analyzing and mitigating voltage violations in high-proportion PV distribution networks under diverse, multi-dimensional operating conditions. The primary contributions of this paper are summarized as follows:
- Multi-Dimensional Mechanism Analysis: This paper systematically investigates the voltage violation mechanisms by accounting for complex, real-world operational factors, including high-overload scenarios, varying PV penetration levels, diverse line impedance characteristics, and dynamic meteorological variations. A refined, multi-dimensional simulation model is developed to characterize these non-linear behaviors accurately.
- Focus on Consumer-Side Voltage Profile: Going beyond typical substation-level analysis, this paper provides a granular assessment of voltage violations at the 380 V consumer-side terminals, addressing a critical yet often overlooked aspect of distribution grid stability.
- Integrated Mitigation Strategy: A coordinated control strategy, coupling shunt reactor compensation with voltage-source inverter (VSI) regulation, is proposed. This approach offers a timely and effective solution for mitigating voltage violations across a wide range of complex operating conditions, ensuring grid resilience under high-proportion PV integration.
2. Impact Analysis of High-Proportion Distributed PV Integration on Distribution Network Voltage
For ease of expression, the following symbols will be uniformly used throughout the text: represents the voltage at the connection point, represents the upper limit of the national standard voltage (the upper limit value for a 380 V system is 407 V), represents the rated voltage (380 V); represents the active power output of photovoltaic, represents reactive power; and respectively represent the resistance and reactance of the line, and represents the voltage deviation rate. The definitions of each symbol will be given for the first time.
To simplify the theoretical derivation, the following assumptions are made in this paper: (i) The reactance of the low-voltage line is much smaller than the resistance (); this assumption is based on the actual structural characteristics of low-voltage lines, which are short in geometry and have compact conductor arrangement. (ii) The power factor on the user side is not less than 0.95, which is in line with the actual operation level of low-voltage distribution networks in China.
2.1. Mechanism Analysis of Voltage Violations in 35 kV Distribution Substations
To investigate voltage overshoot issues in actual distribution networks, this paper constructs a 35 kV distribution network model that includes three voltage levels: 35 kV, 10 kV, and 380 V. The 10 kV and 380 V busbars carry and loads, respectively, and the 380 V busbar is equipped with distributed PV systems, as shown in Figure 1. Using Figure 1 as an example, this paper analyzes the voltage behavior of the distribution network under PV grid-connected conditions.
Figure 1.
35 kV Distribution Network with Distributed Photovoltaic Access Conditions.
According to Ohm’s law, we have:
where is the voltage drop on the 380 V line, is the secondary voltage of Transformer , is the user-side 380 V bus voltage, is the total user-side impedance, and is the total user-side current.
Furthermore, we obtain Equation (2):
where and are the total active and reactive power consumed on the user side, respectively; and are the power fed back by distributed PV; and is the line impedance.
Due to the short geometric dimensions of the lines and the compact arrangement of the conductors in low-voltage lines, the inductive reactance of the line is much smaller than its resistance. The ratio of can reach as high as 10 to 20. Therefore, Equation (2) can be simplified to:
From (3), when , , and , a voltage violation occurs in the distribution network.
For the 10 kV side, we obtain Equations (4) and (5):
where is the load on the 10 kV bus, is the 10 kV bus voltage, and is the voltage drop on the 10 kV line.
In practical systems, the ratio of load on the 10 kV side busbar to photovoltaic capacity is very large, so we usually have , and thus . That is, the integration of distributed PV has a negligible impact on the 10 kV voltage, so the voltage can be considered constant. Therefore, the study of voltage violations on the 380 V low-voltage side is particularly important.
2.2. Analysis of the Voltage Exceedance Mechanism at the User Side of 380 V System
In practice, the large-scale integration of distributed PV systems poses significant challenges for voltage levels on the customer side at the end of power lines. Moreover, the analysis in Section 2 A reveals that the impact of PV integration on the 380 V low-voltage side voltage is far greater than that on the 10 kV side.
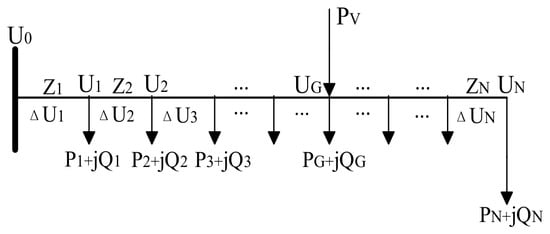
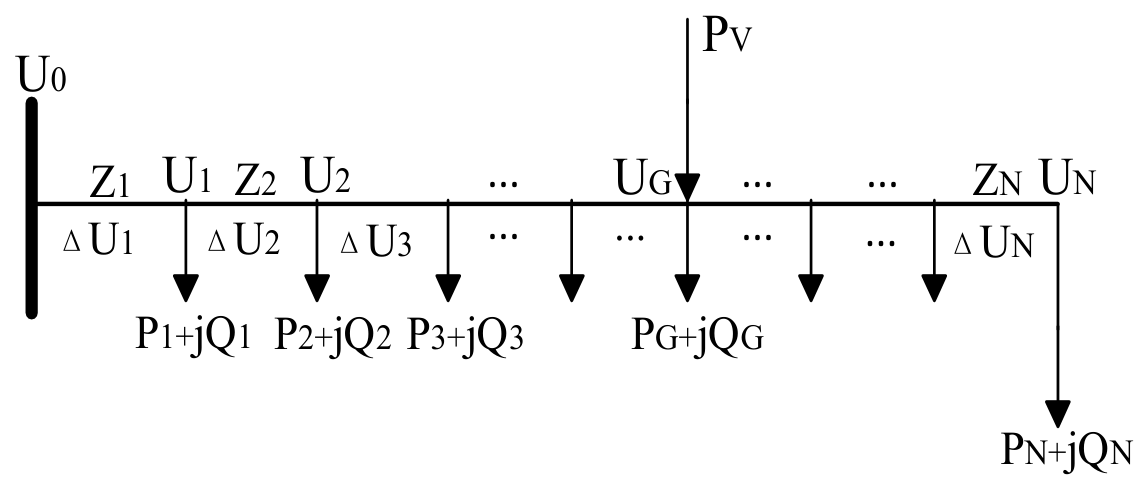
Therefore, this paper uses the model shown in Figure 2 as an example to conduct a more detailed analysis of voltage overshoot on the customer side.
Figure 2.
Distribution of Users on Low-Voltage Lines.
Figure 2 shows the load distribution of customers along a low voltage line. There are customer loads on the line, and the power of the Nth customer is . The initial voltage of the line is , and the voltage magnitude at the Nth customer load is . The line impedance is . A PV system is connected at customer G, with a capacity of .
2.2.1. Voltage Analysis Without PV for All Customers
Defining the positive direction of active and reactive power as flowing toward the load, the voltage drop between customer and customer is
where and are the resistance and reactance per unit length of the line, respectively, and is the length of the line between customer and customer .
Since the active and reactive power consumption of customers is always positive in practice, Equation (6) is invariably positive. This indicates that the line voltage is negatively correlated with the distance from the source to the customer.
2.2.2. Voltage Analysis with PV for Some Customers
- Assuming that PV is connected at customer G, the voltage of customer located before customer G is
Since the line impedance is small in practice and the power factor of customers is generally above 0.95. It can be obtained that . The reactive power can be neglected, and Equation (7) simplifies to:
From (8), the integration of distributed PV raises the voltage of customers located before the PV connection point, and the magnitude of this voltage boost depends on the PV output level, the customer load, the line length, and the line impedance.
- 2.
- Assuming that PV is connected at customer G, the voltage of customer located after customer G is
From Equation (10), the voltage at customer is always lower than that at customer ; that is, the voltage of customers downstream of the PV connection point decreases gradually.
In summary, the following conclusions can be drawn:
- Without PV integration, the line voltage decreases gradually.
- With PV integration, the voltage at the PV connection point is a local maximum, and the voltage decreases gradually on both sides of the connection point.
- PV integration raises the voltage of customers, and the magnitude of the voltage boost depends on factors such as the PV output, the load level, and the line parameters.
3. Simulation Results and Analysis
3.1. Simulation Analysis of Voltage Violations Under Multi-Dimensional Conditions in a 35 kV Distribution Network
First, a typical reverse heavy overload condition is established. Based on this, the PV penetration rate and line impedance are adjusted, dynamic weather variations are introduced, and extremely light loads are imposed, thereby obtaining the voltage dynamic characteristic analysis under four different operating conditions.
3.1.1. Simulation Analysis of a Reverse Heavy Overload Model
The PV penetration rate is set to 75%, the line impedance , there are no dynamic weather variations, and the customer load is 50 kW, as shown in Figure 3, where the PV penetration rate is defined as the ratio of PV power to total power.
Figure 3.
Voltage Limit Exceeding Situation of Reverse Repeated Overload Model.
From Figure 3, the system operates in conventional load supply mode with no PV integration during 0–0.5 s. At , the PV system is connected to the grid, causing a sudden increase in line current and a simultaneous jump in the voltage at the line end, leading to a voltage violation.
3.1.2. Impact of PV Penetration Rate on Distribution Network Voltage
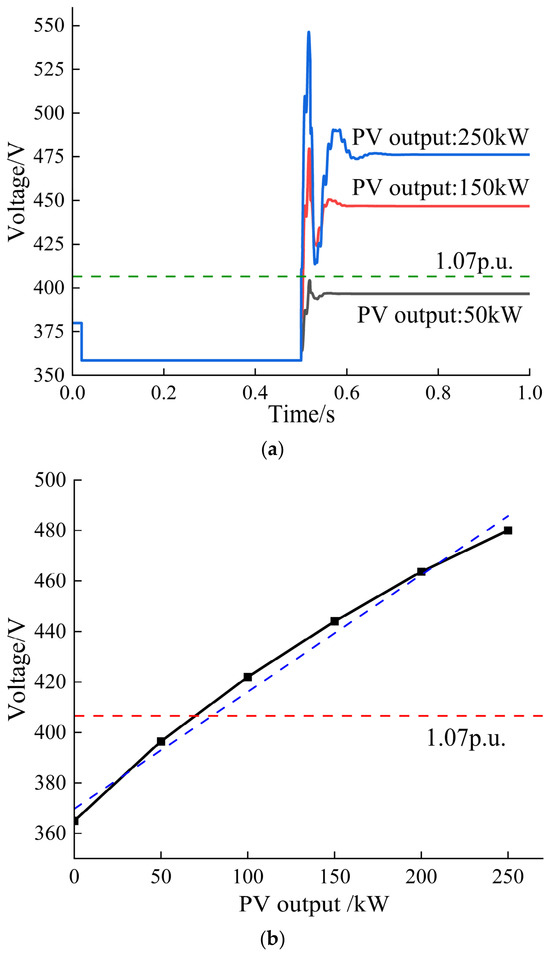
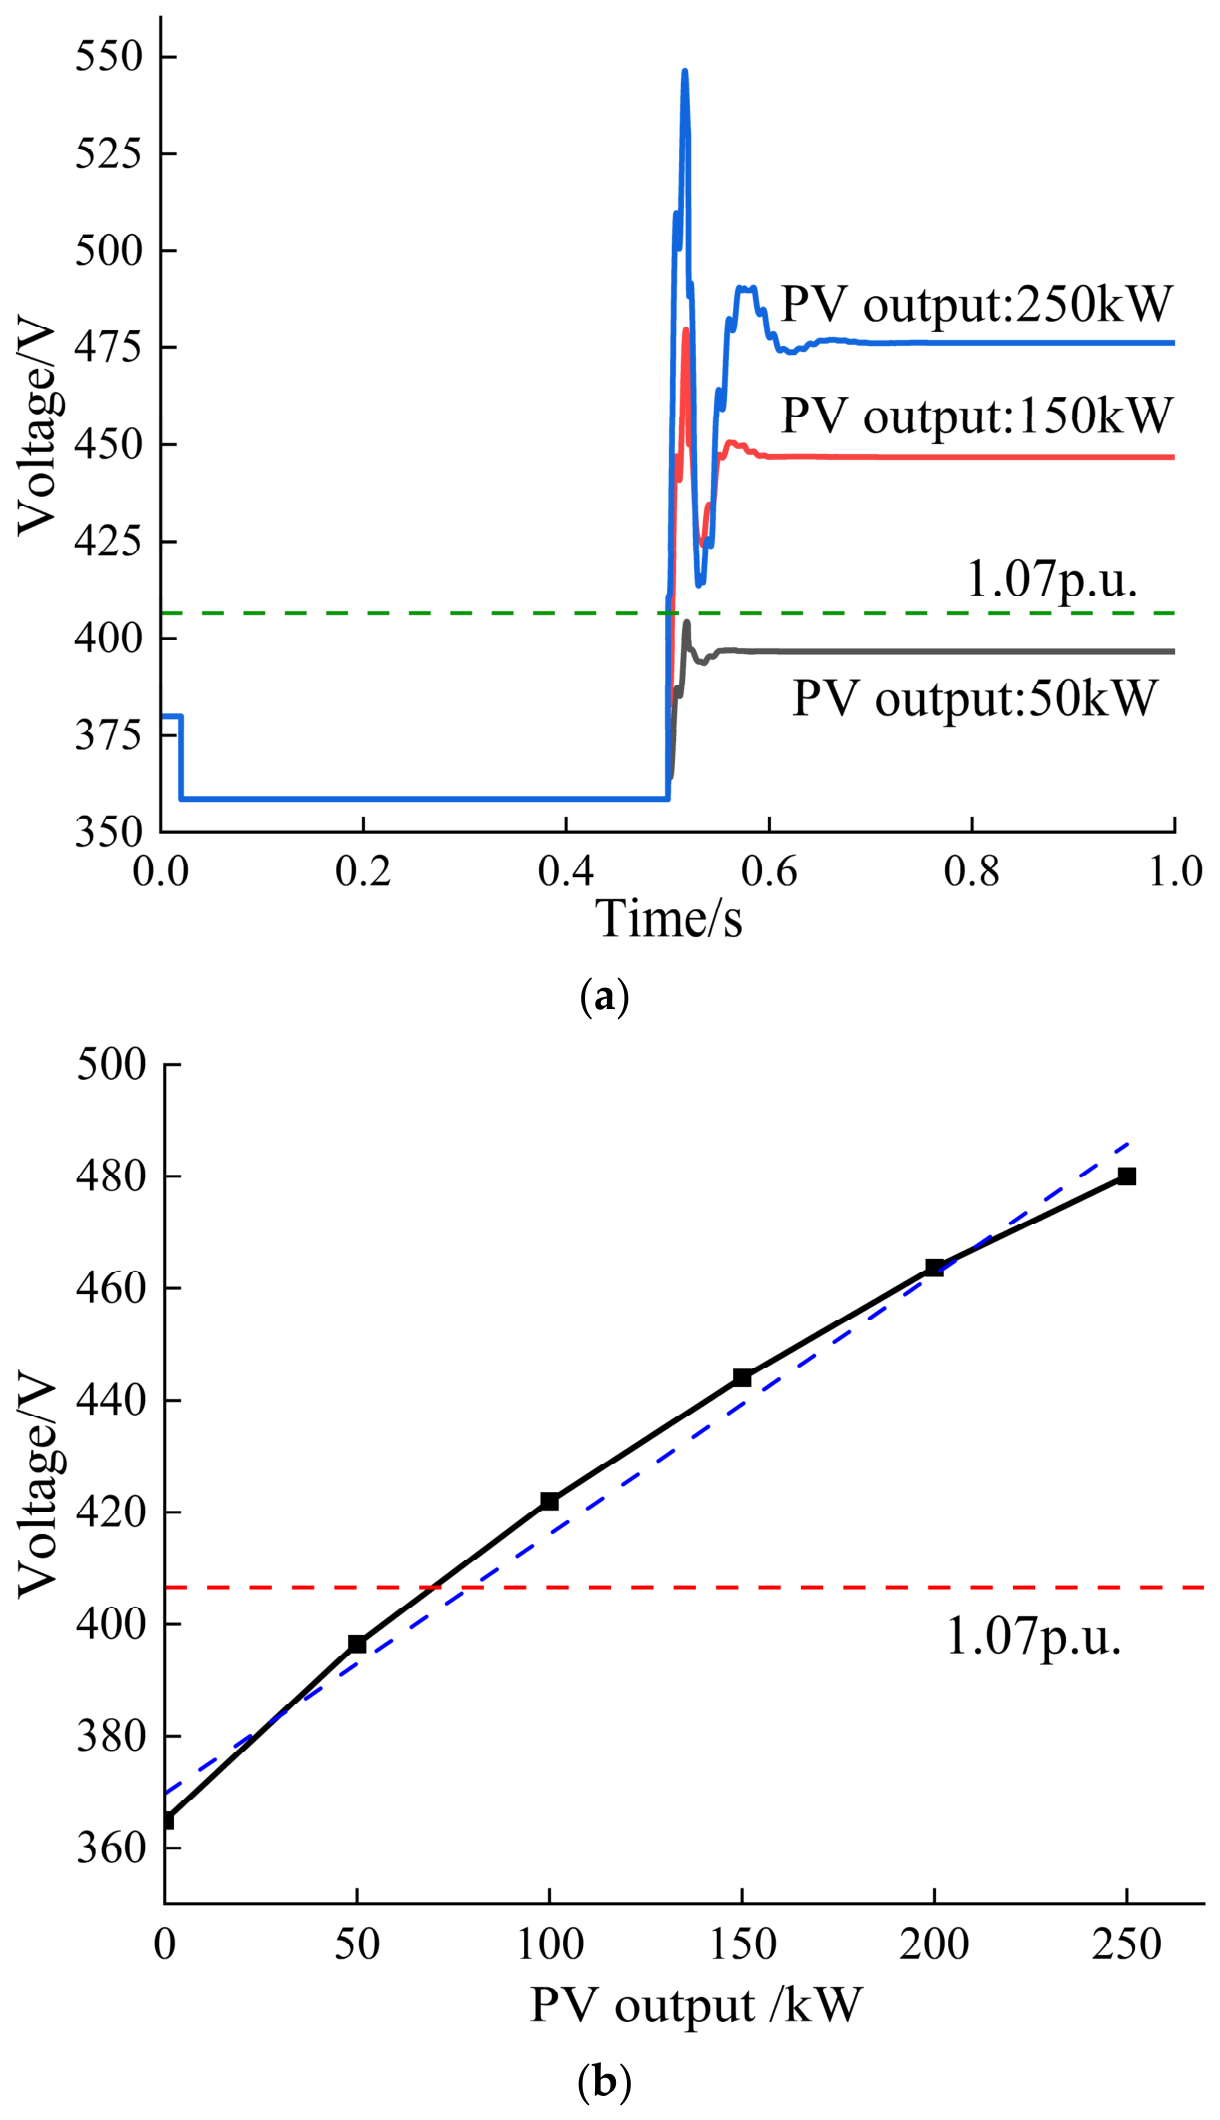
Using the control variable method, the line impedance is kept at and the base load at 50 kW, while three scenarios—low, medium, and high PV penetration rates—are set. The simulation results are presented in Figure 4.
Figure 4.
Voltage variations under different photovoltaic penetration rates. (a) Comparison of Transient Voltage Responses under Different PV Penetration Rates; (b) Sensitivity Analysis of Steady-State Voltage to PV Power.
As shown in Figure 4, the voltage at the end of the distribution network exhibits a highly linear relationship with the injected PV power. As the PV penetration rate increases, voltage violations become increasingly severe. This severe overvoltage not only causes magnetic saturation of the transformer core but also damages equipment insulation, potentially leading to serious power accidents.
3.1.3. Impact of Line Impedance on Distribution Network Voltage
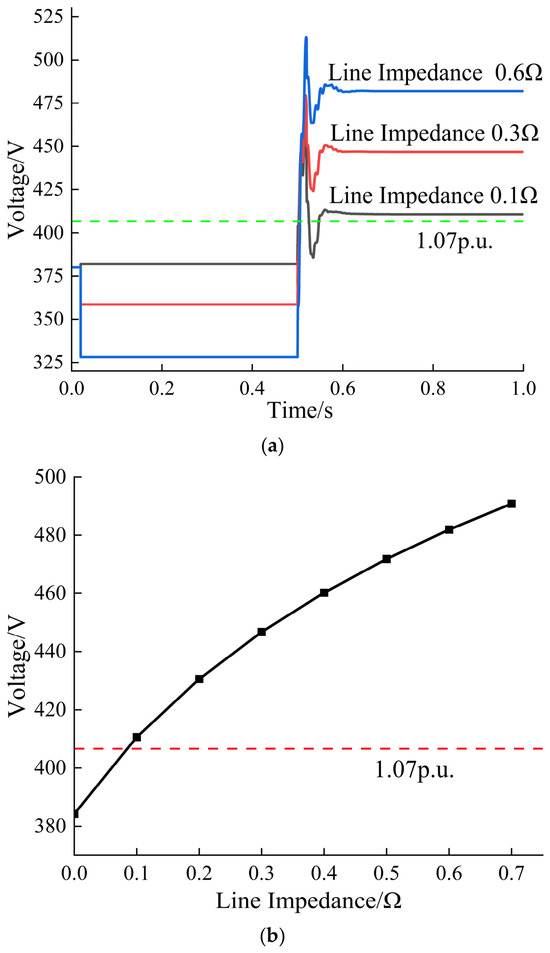
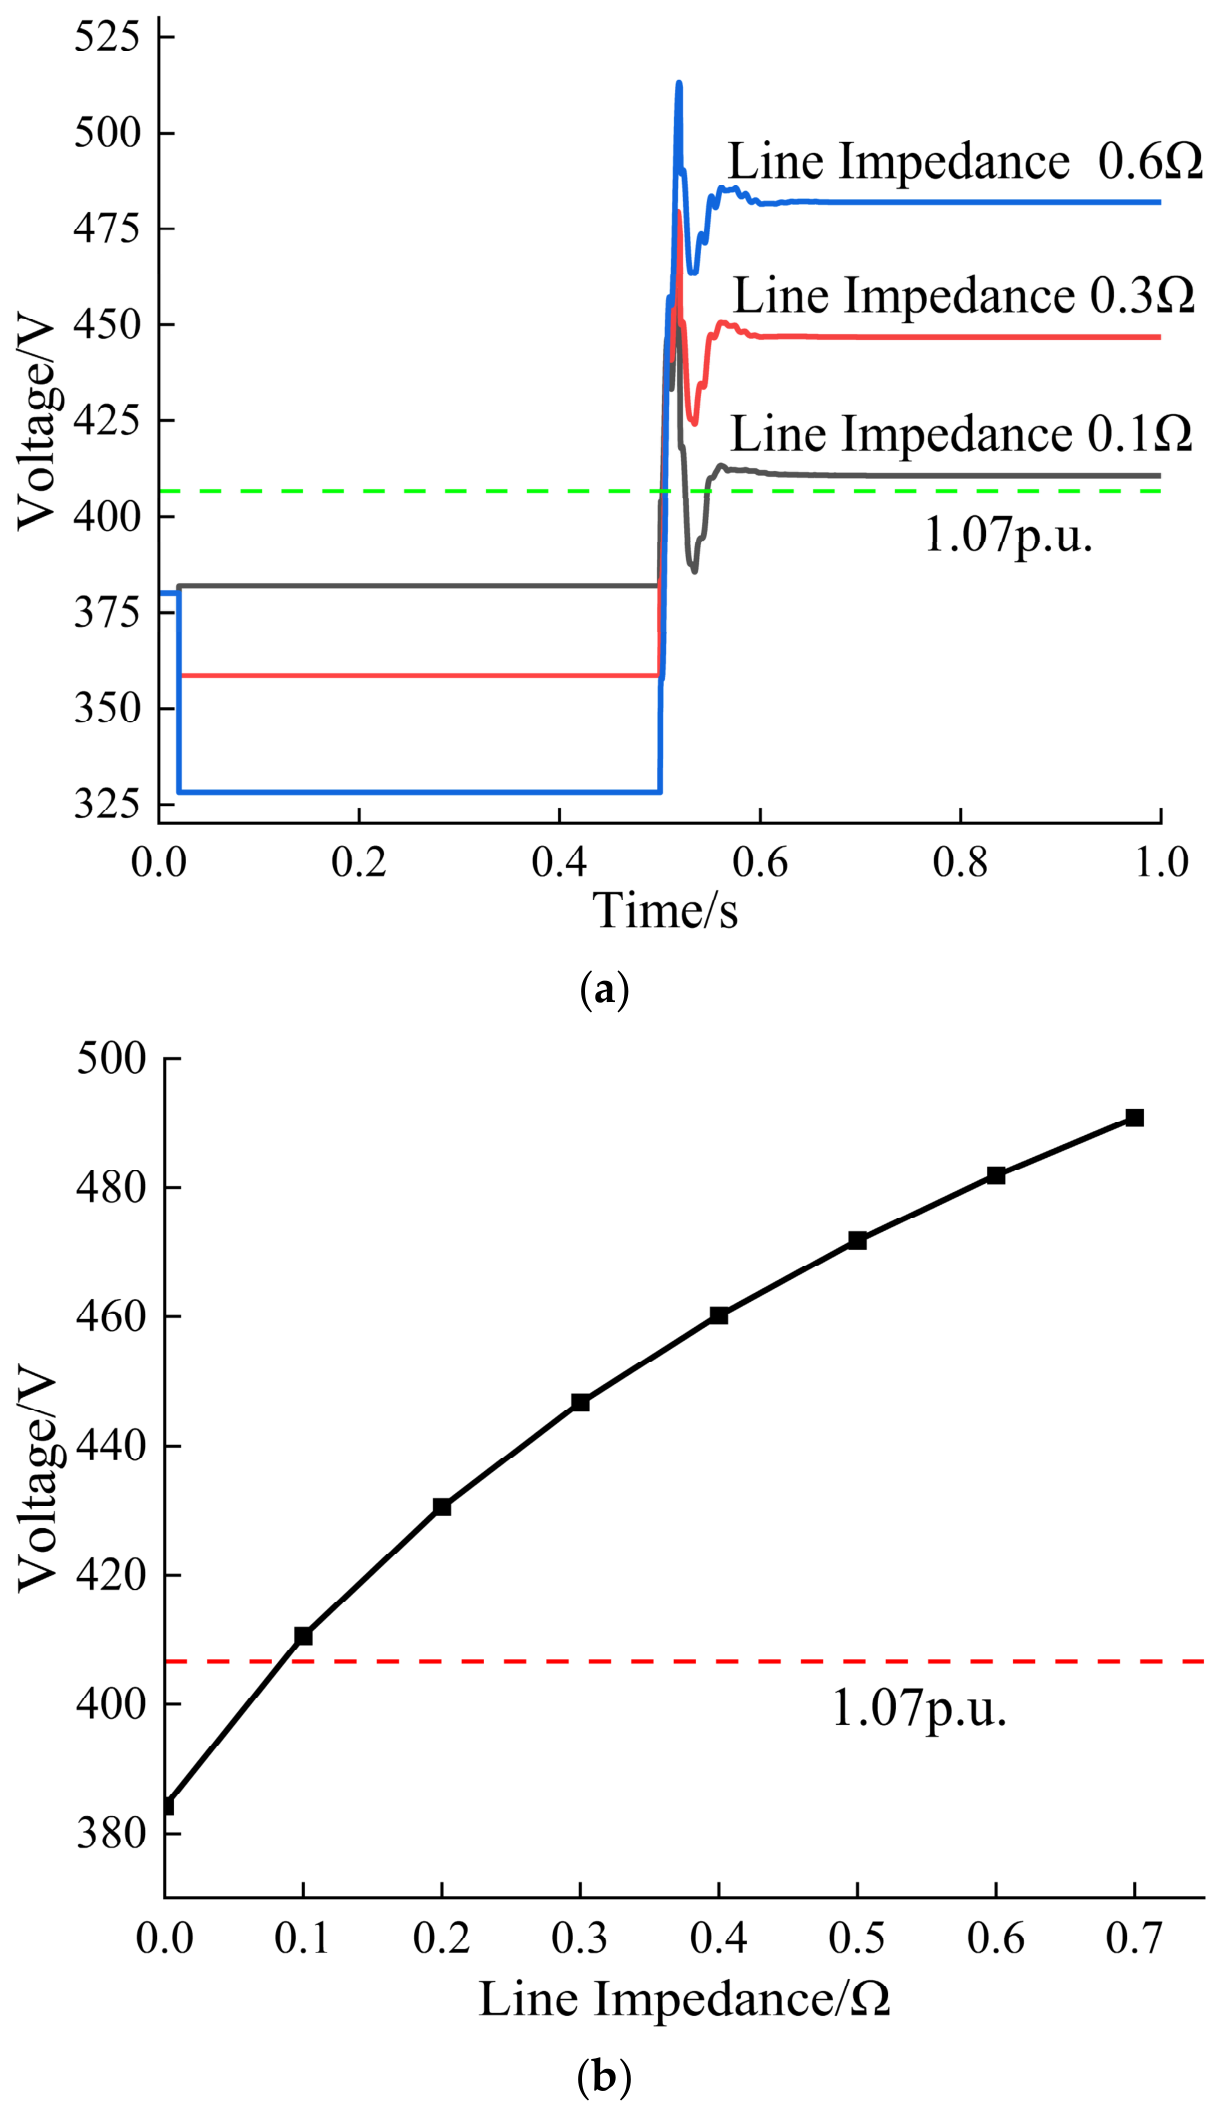
To facilitate the investigation of how line impedance affects PV hosting capacity differently, the PV penetration rate is fixed at 75% and the load power at 50 kW. Three typical impedance scenarios—, , and —are selected for comparative simulation. The voltage responses under different impedance conditions are shown in Figure 5.
Figure 5.
Voltage variation of the distribution network under different line impedance conditions. (a) Comparison of Transient Voltage Responses under Different Line Impedances; (b) Sensitivity Analysis of Steady-State Voltage to Line Impedance.
As shown in Figure 5, line impedance is also a key sensitive parameter determining the voltage rise magnitude, and it exhibits a positive correlation with the voltage.
This spatial distribution characteristic confirms a pronounced end-of-line effect in distributed PV integration. Line impedance forms a critical spatial constraint on the PV hosting capacity. The weak point at the end-user side of the distribution network is a primary area for voltage regulation; therefore, a more in-depth investigation of the voltage conditions on the 380 V user side will be carried out in the subsequent work.
3.1.4. Impact of Dynamic Weather Variations on Distribution Network Voltage
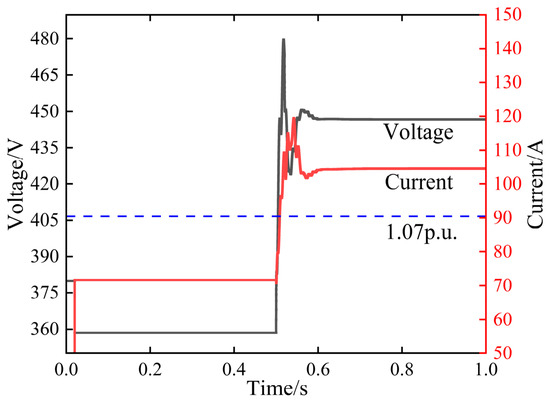
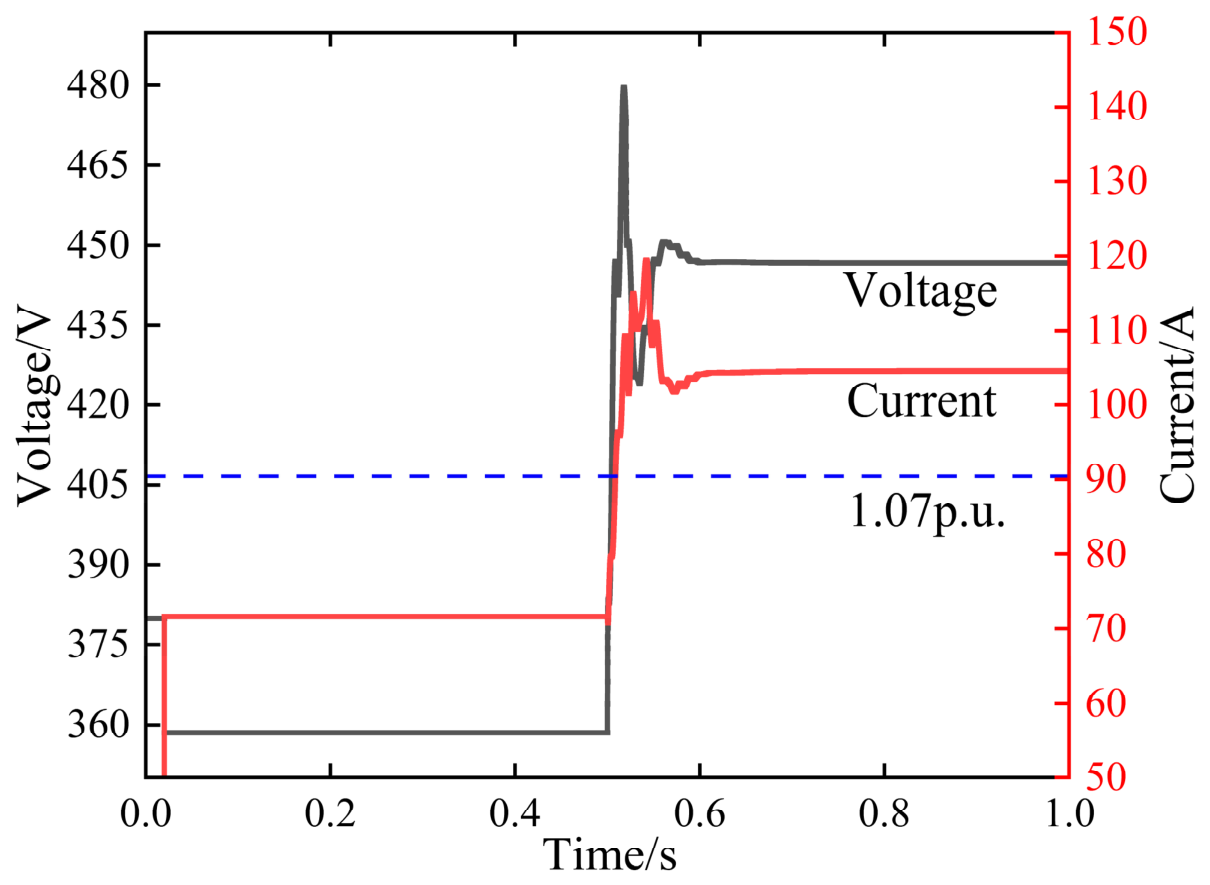
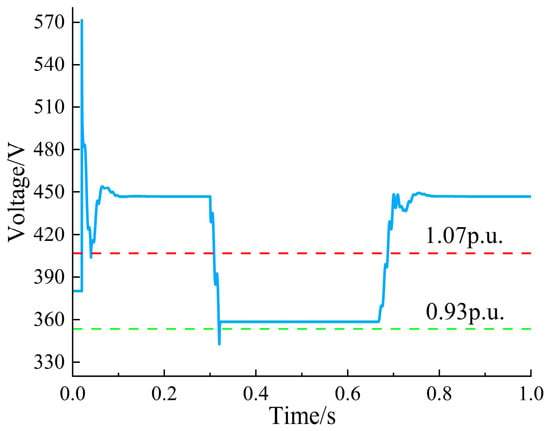
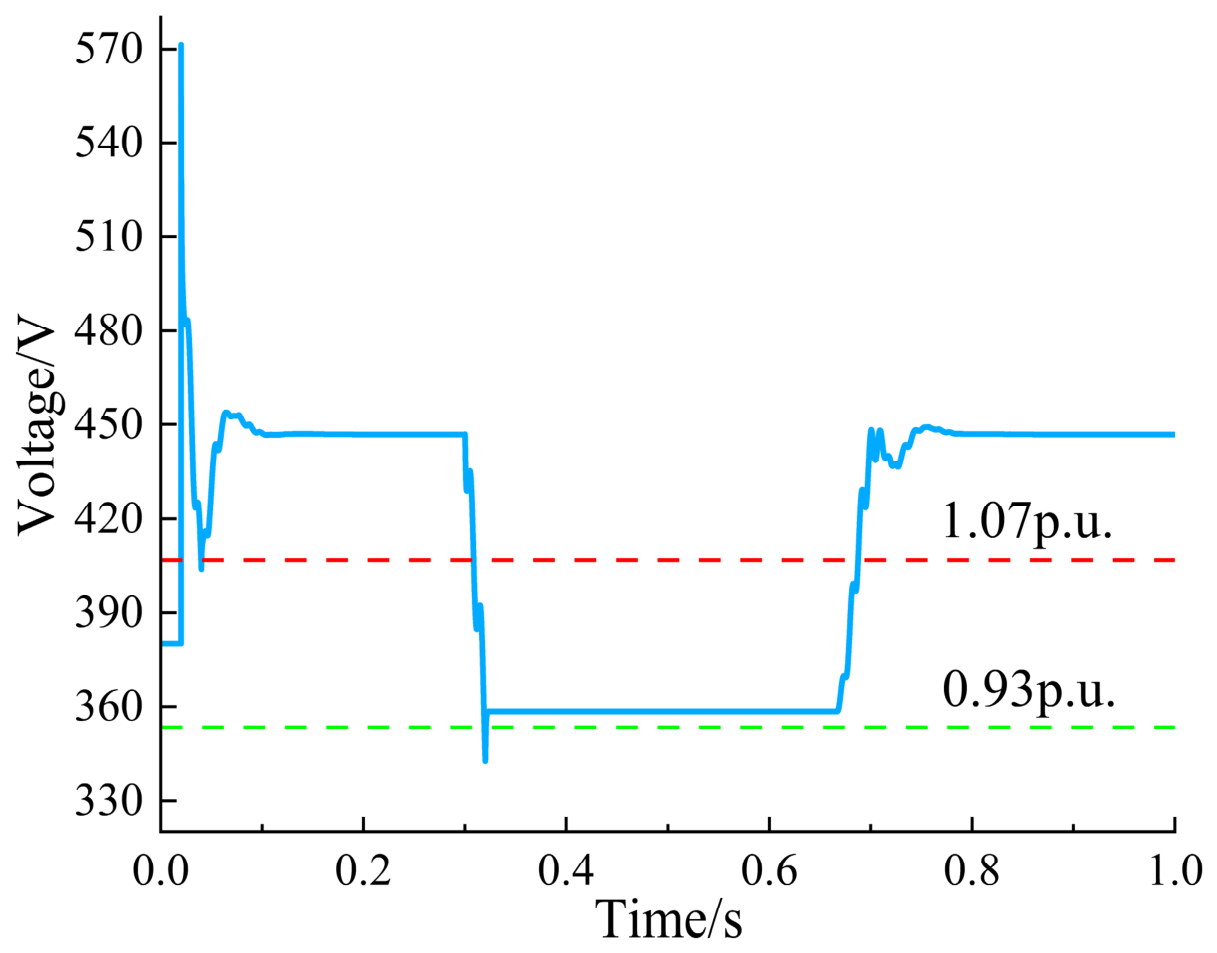
Considering the intermittent nature of PV generation, the PV penetration rate is fixed at 75% and the line impedance at . The system is simulated to experience cloud shading during 0.3–0.7 s and full generation at other times, i.e., a typical meteorological evolution of “sunny-cloudy shading-sunny.” The voltage and current responses during this weather variation are shown in Figure 6.
Figure 6.
Transient characteristics of distribution network voltage and current under cloud shading conditions.
It should be noted that the ‘sunny-cloud cover-sunny’ scenario adopted in this paper is a first-order simplified approximation of the variability of actual weather conditions. The purpose of using this simplified scenario is to qualitatively explain the internal mechanism of transient voltage fluctuations caused by irradiance changes, rather than to quantitatively characterize actual random photovoltaic power generation.
As can be seen from Figure 6, during the sunny period, PV integration leads to severe voltage violations. When cloud shading occurs, the system voltage returns to a safe operating range. The PV output fluctuations caused by cloud shading force the system to switch repeatedly between violation and safe states, generating a higher number of transient voltage variations and significantly affecting normal grid operation.
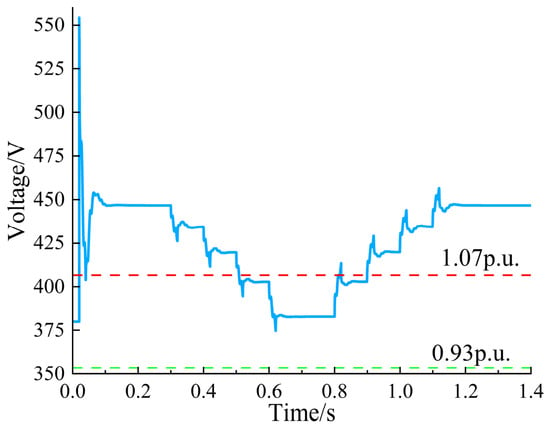
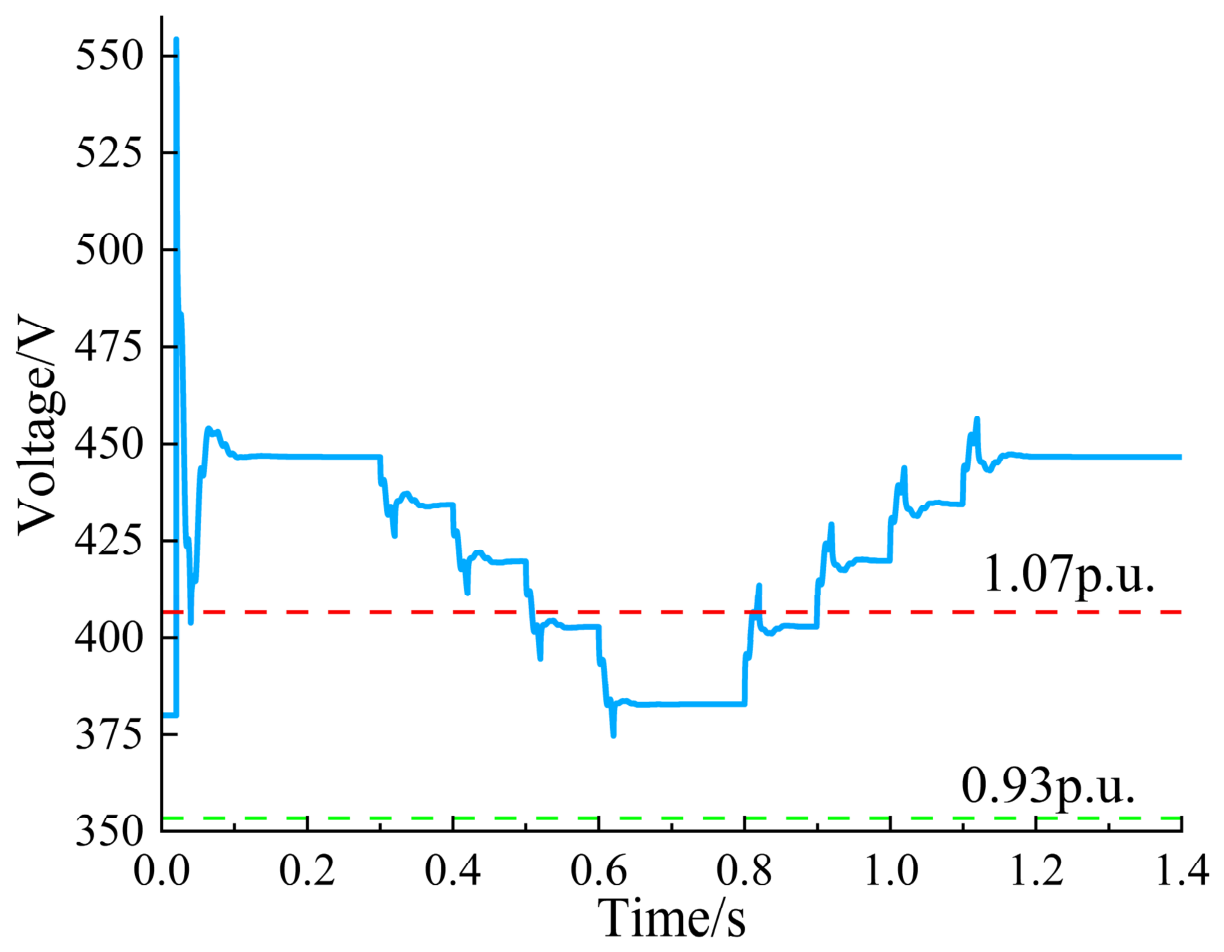
In order to make the simulation closer to the actual irradiance variation curve, this paper simulated the situation where the irradiance linearly decreased from 100% to 20% within 0.3–0.8 s, and then recovered to 100% within 0.8–1.3 s, as shown in Figure 7. It can be seen that the voltage change is more gradual but still has significant fluctuations.
Figure 7.
Voltage Changes under Different Irradiation Intensities.
In summary, although cloud shading temporarily alleviates the steady-state overvoltage problem, the intense voltage fluctuations it induces become a new power quality concern.
3.2. Simulation Analysis of the Impact of High-Penetration Distributed PV on 380 V User-Side Voltage
As shown in the simulation study in Section 3.1.3, the end-user area at the line terminal is a voltage weak point and is more sensitive to high-penetration PV integration. Meanwhile, the analysis of the low-voltage line in Section 2.2 has also yielded corresponding conclusions. Therefore, the system shown in Figure 2 is taken as a case study for simulation analysis and verification.
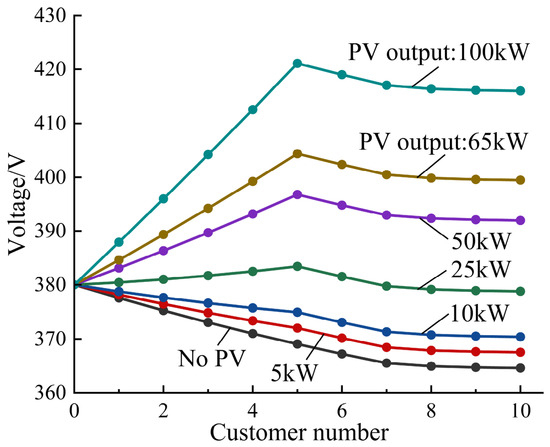
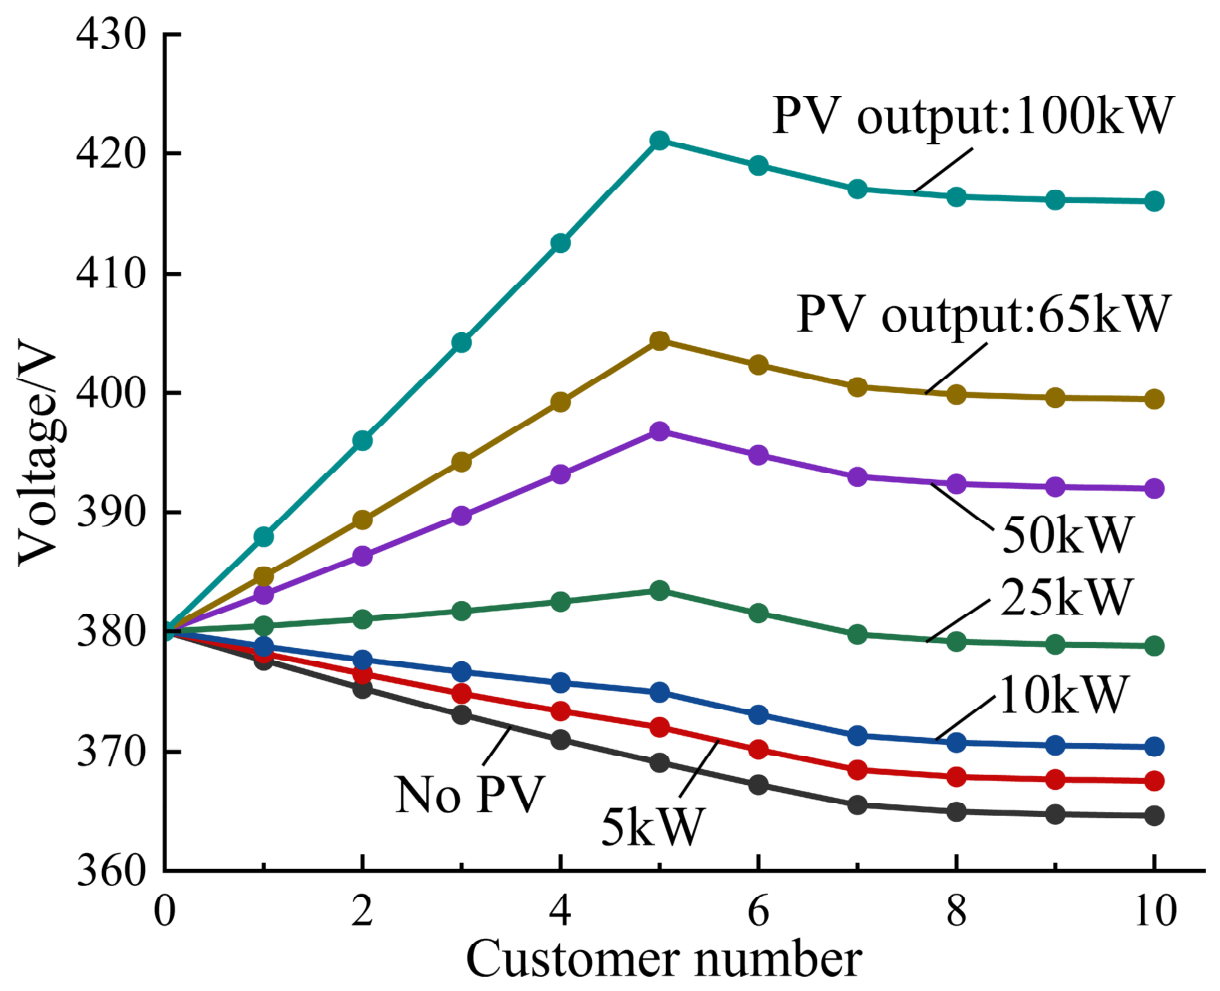
The line voltage level is set to 380 V. There are 10 customers along the line, each consuming 1 kW of active power and no reactive power. The per-unit-length impedance of the line is 1.132 + j0.396 Ω/km, and the distance between every two adjacent customers is 400 m. Customer 5 is connected with distributed PV.
Simulations were conducted for customer 5 with different PV capacities. The resulting voltage profiles are presented in Figure 8.
Figure 8.
Voltages at various points along the line after customer 5 integrates PV with different capacities.
As can be seen from Figure 8, the line voltage exhibits a certain correlation with the PV output. As the PV output increases, the voltage profile along the line changes in the following patterns: (1) it gradually decreases; (2) it first decreases, then increases, and then decreases again; (3) it first increases and then decreases. In the second and third cases, the voltage at the PV connection point is the highest along the entire line. When the PV output reaches 65 kW, the voltage at the connection point is approximately 406 V, which is the upper limit specified by the national standard. Therefore, the maximum allowable PV capacity for customer 5 is 65 kW.
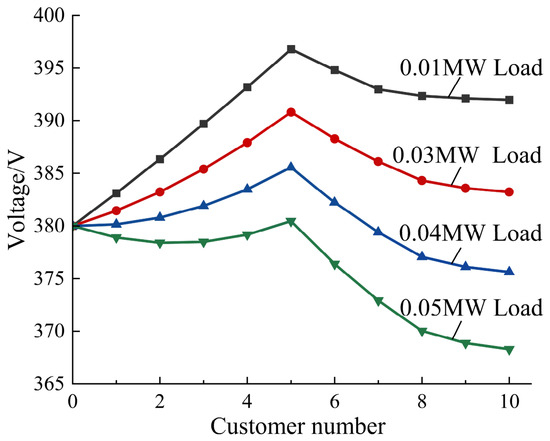
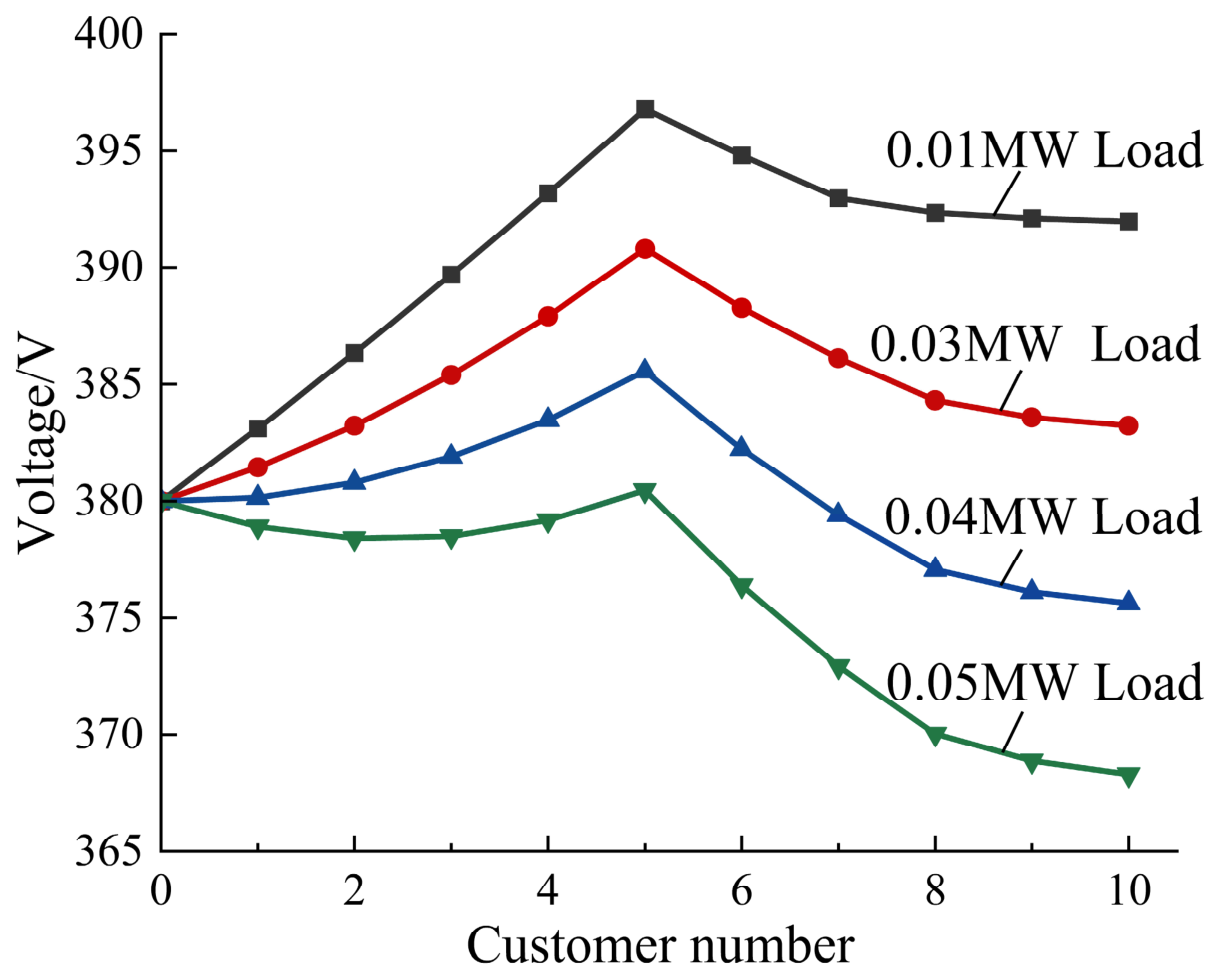
By varying the load of the customers along the line and performing simulations, Figure 9 is obtained.
Figure 9.
Voltages at various points along the line after PV integration under different load levels.
As can be seen from Figure 9, the voltage rise magnitude depends on the customer load level: the smaller the load, the larger the voltage rise, showing a negative correlation. Varying the load of the customers does not change the fact that the highest voltage along the line is at the PV connection point.
Simulations were conducted by varying the relevant line parameters, and the results are shown in Figure 10.
Figure 10.
Voltages at various points along the line after PV integration under different line lengths.
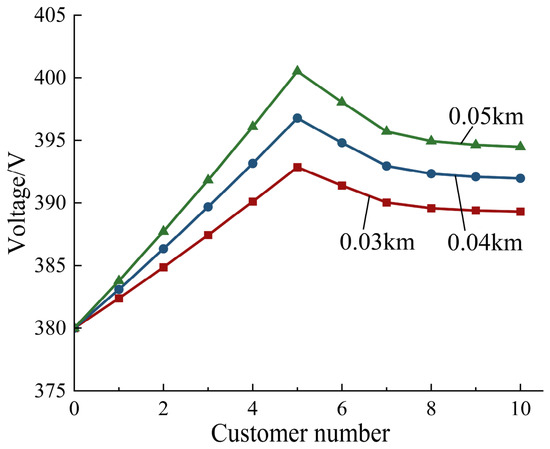
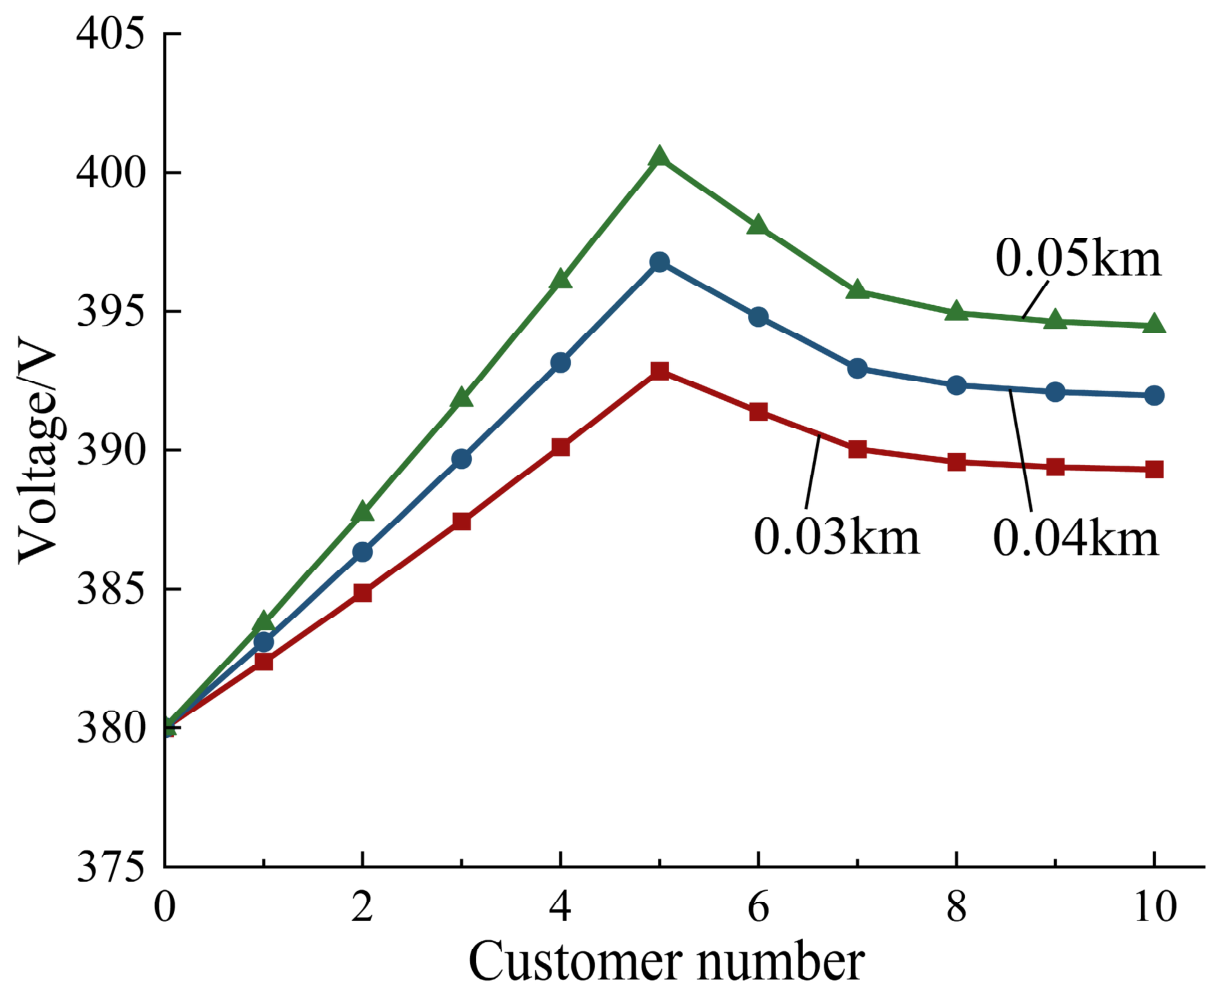
As shown in Figure 10, the voltage rise magnitude is related to the line parameters: the longer the line, the greater the voltage rise, indicating a positive correlation. The voltage at the PV connection point is the highest along the line, regardless of the line length.
Simulations were conducted by varying the PV connection location, with PV connected at different positions along the line. The results are shown in Figure 11.
Figure 11.
Voltages at various points along the line after PV integration at different customers.
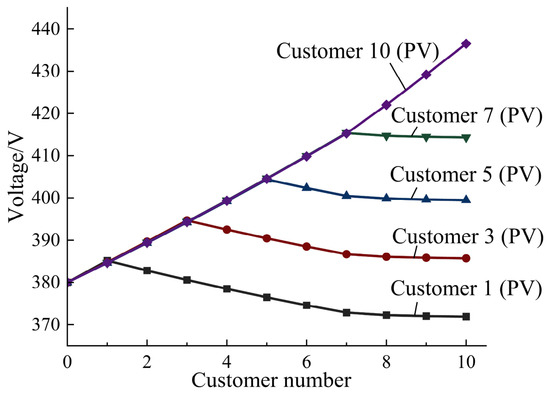
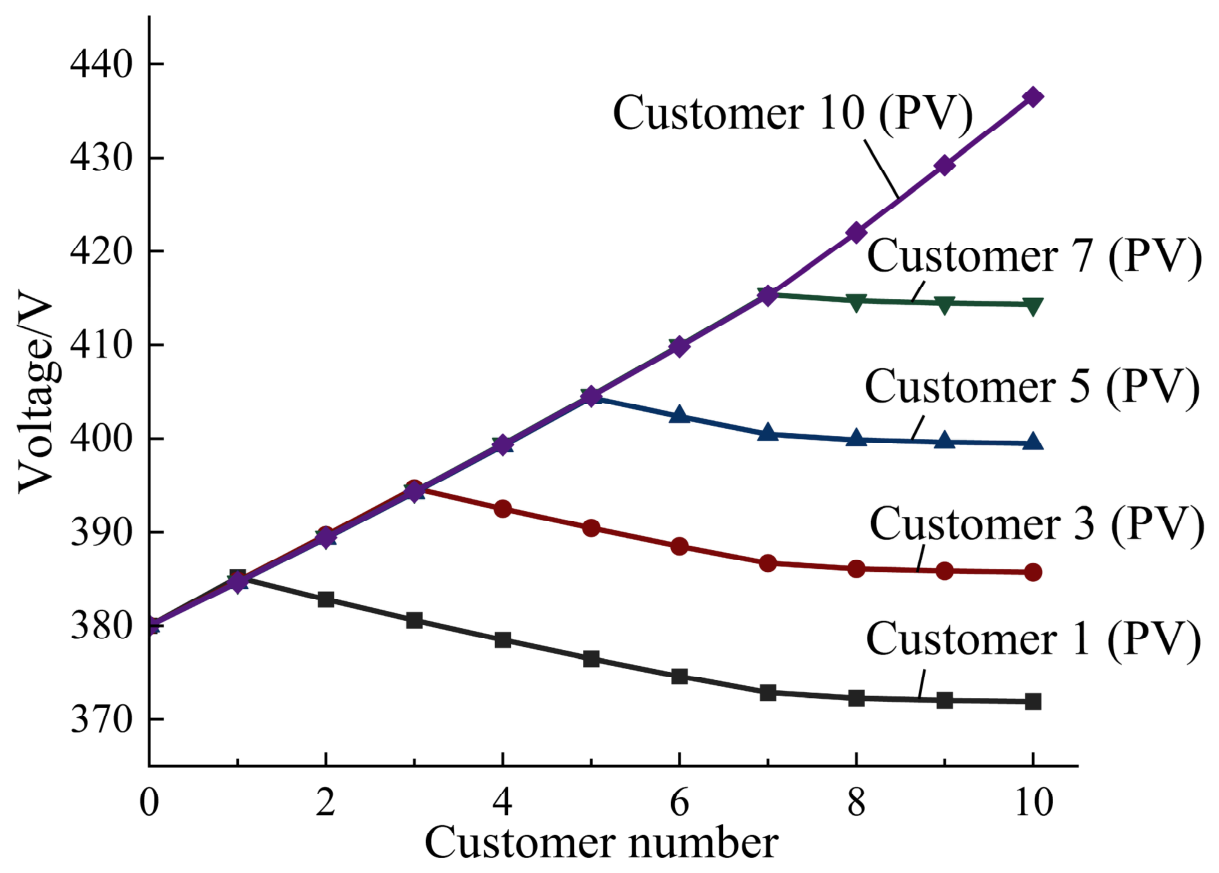
As shown in Figure 11, the PV connection location affects the line voltage differently. The closer the connection point is to the end of the line, the greater the voltage rise, and the voltage at the PV connection point is the highest along the line.
4. Mitigation of Voltage Violations in High-PV Distribution Networks
4.1. Reactor Compensation
Based on the above analysis, the impact of distributed PV integration on voltage is closely related to the low-voltage bus voltage, PV output, customer load, connection location, and resistance and reactance. Accordingly, this paper proposes a reactor compensation method targeting the above influencing factors.
4.1.1. Reactor Compensation for 35 kV Distribution Networks
According to , the voltage rise is linear as increases. Therefore, the required reactive power compensation should also increase linearly with .
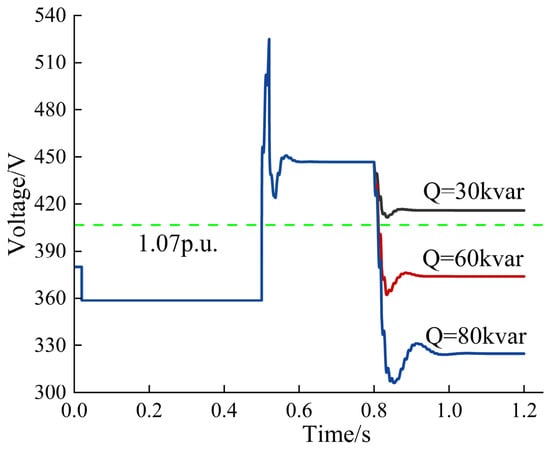
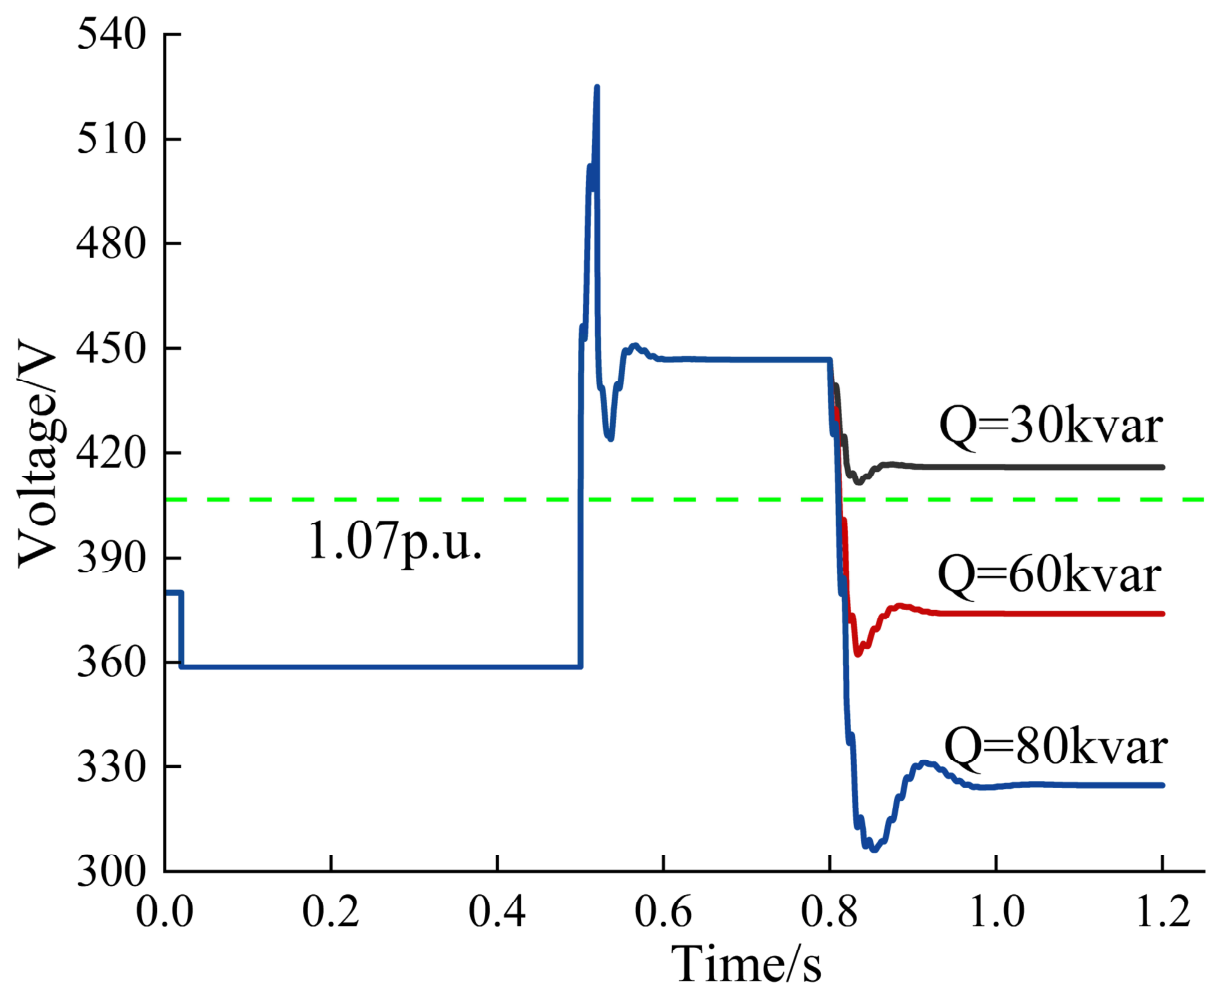
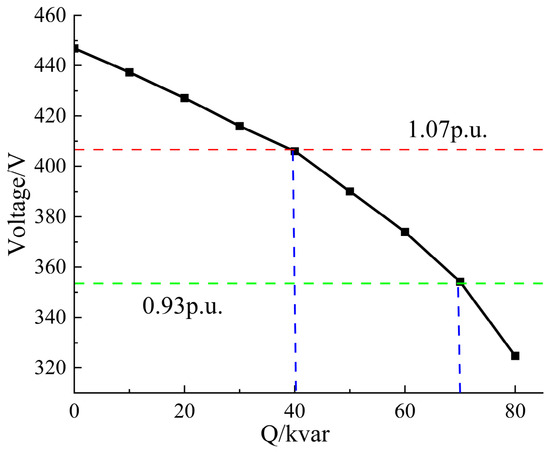
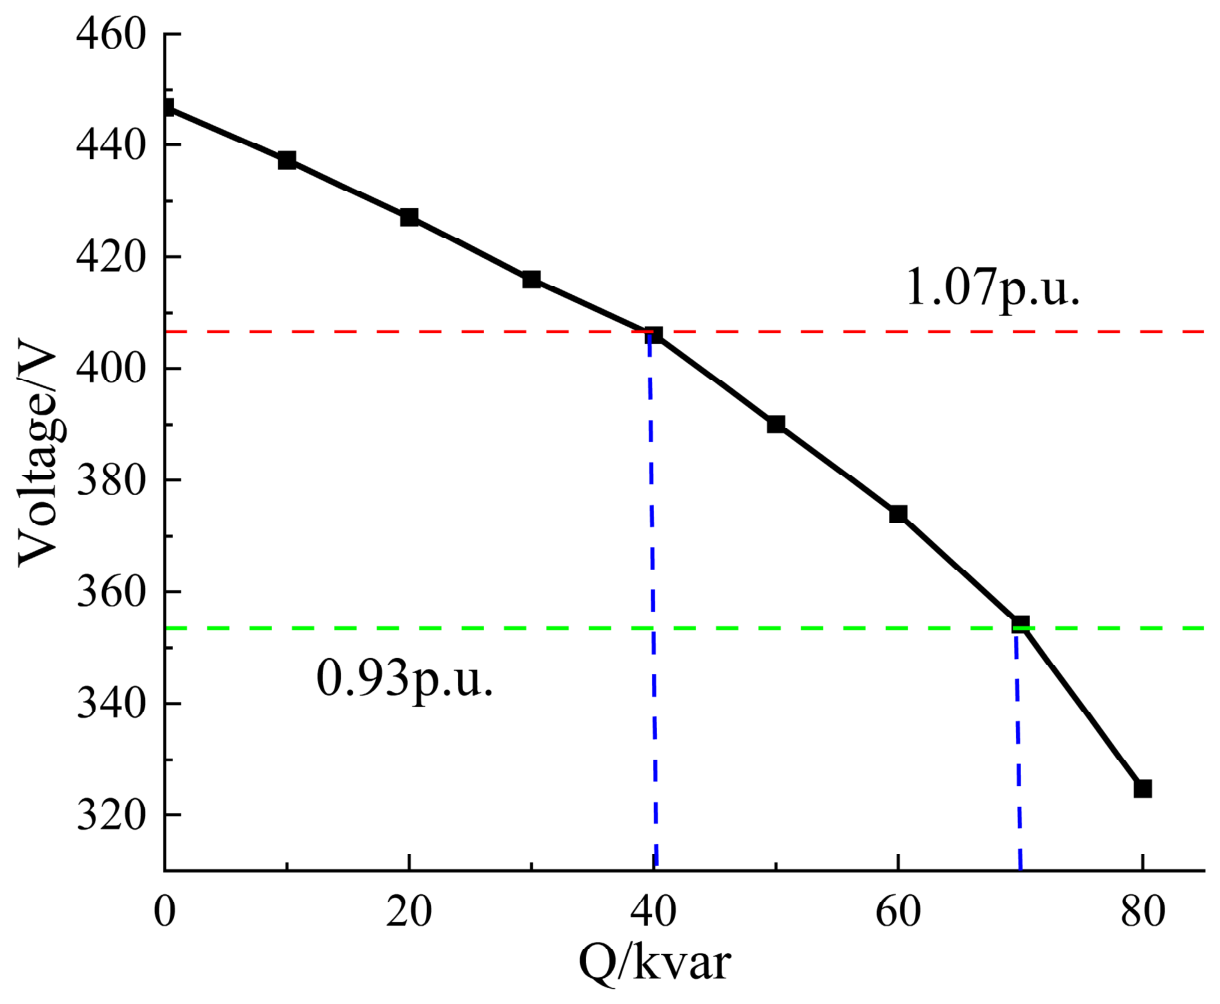
The lower limit of the reactive power compensation is determined by the upper voltage limit (the national standard upper limit of 1.07 p. u. [26]), so it must be sufficient to reduce the voltage to below 407 V. The upper limit of the reactive power compensation is jointly determined by the inverter capacity and the lower voltage limit (0.93 p. u.).
Simulations of reactive power compensation in the distribution network under the condition of 150 kW PV integration yield Figure 12.
Figure 12.
Impact of different reactive power compensation levels on voltage.
Figure 12 reveals the impact of different reactive power compensation amounts on the voltage at the point of interconnection under a 150 kW PV output condition. As shown in the figure, when photovoltaic power generation was connected at 0.5 s, the voltage exceeded the limit to around 440 V. At 0.8 s, reactive power compensation was carried out, with capacities of 30 kvar, 60 kvar, and 90 kvar, respectively. By observing the steady-state voltage values after compensation, it can be found that the larger the compensation capacity, the lower the steady-state voltage of the line. When the compensation capacity was 60 kvar, the steady-state voltage drop of the line was 380 V, indicating a good compensation effect. A sensitivity analysis of the reactive power compensation amount to the voltage yields Figure 13.
Figure 13.
Sensitivity of voltage to reactive power compensation under PV integration.
Figure 13 presents the relationship between different reactive power compensation amounts and the corresponding voltage, together with the associated sensitivity analysis. As shown in the figure, as the amount of reactive power compensation increases, the steady-state voltage value of the line continuously decreases, and the curve shows a distinct linear downward trend. The curve exhibits a clear linear downward trend. It can be observed from the figure that the optimal reactive power compensation range for this system should be defined as [40, 70] kvar. This range not only ensures that the voltage does not exceed the upper limit, but also provides sufficient safety margin to prevent the system from entering the undervoltage region due to fluctuations.
4.1.2. Reactor Compensation for the 380 V User Side
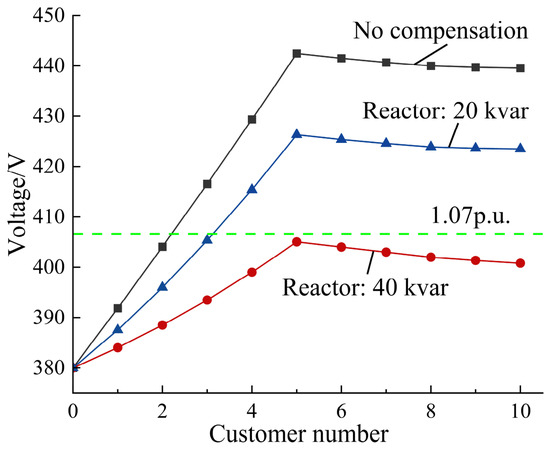
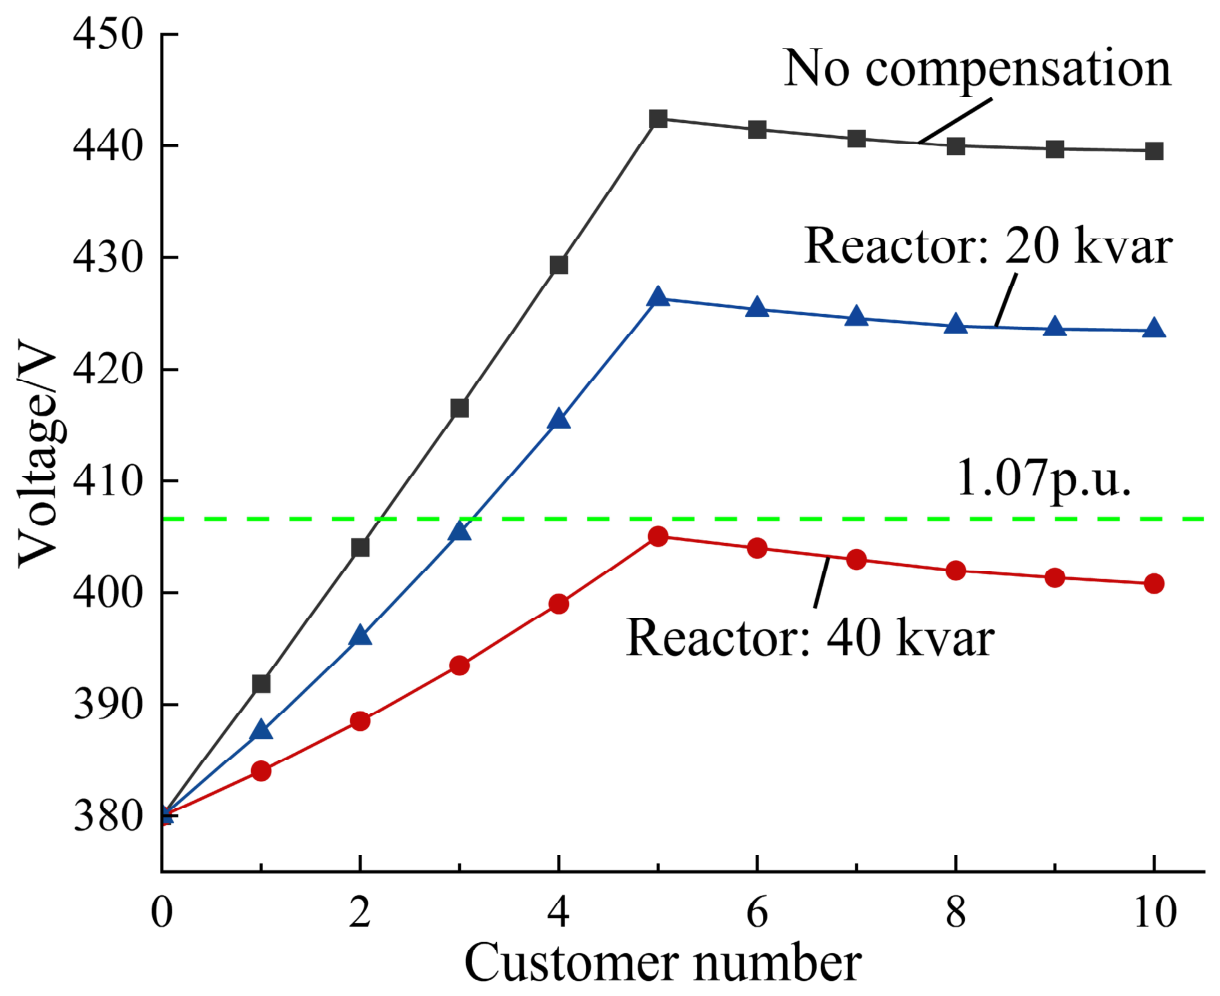
To further investigate the impact of reactor compensation on voltage, reactor compensation is applied to the 380 V user side at the end of the distribution line. For customer 5 in Section 3.2, after integrating 150 kW of PV, reactor compensation with various capacities is implemented; the results are shown in Figure 14.
Figure 14.
Reactor compensation results.
Figure 14 shows the results after reactance compensation for users with 380 V voltage exceeding the limit. As can be seen from Figure 14, as the capacity of the reactance compensator increases, the steady-state voltage of each user on the user side shows a downward trend. When the capacity of the compensating reactor is 40 kvar, the highest voltage of user 5 is 406 V, and the voltages of the other users are all lower than 406 V, meeting the requirements of the national standard for voltage deviation. This is the lower limit value of reactance compensation. Therefore, a reactance compensator capacity of 40 kvar is the lower limit value of the reactance compensator capacity for the 380 V user side.
Through the simulation analysis of reactor compensation for the 35 kV distribution network and the 380 V user side, it is found that under the PV output conditions of this system, the optimal compensation range of the reactor is [40, 70] kvar.
4.2. Voltage Control Compensation Using Inverters
To achieve more precise voltage control and more effectively mitigate voltage violations, this paper also adopts an inverter voltage control method. Specifically, a grid-connected voltage source inverter (VSI) is employed to further regulate the voltage. This approach not only converts the DC power from the PV source into AC power but also adjusts the system voltage by controlling active and reactive power, thereby addressing the voltage violation problem.
When inverters actually participate in distribution network voltage regulation, their control system usually adopts a “power outer loop + current inner loop” dual closed-loop structure. When the reactive power instruction undergoes a step change, due to the limited bandwidth of the current loop and control delay, the actual output reactive power of the inverter cannot jump instantaneously but instead transitions smoothly and may be accompanied by slight overshoot dynamics. Since the dynamic characteristics of the inverter are mainly determined by the LC filter, they can be equated to a second-order system composed of output LC filter components, which can be approximated by the second-order system in classical control theory.
The overall dynamic characteristics of the inverter from reactive instruction input to actual reactive output approximate a second-order system, with the transfer function being:
Here, is the reactive power command, is the actual output reactive power, ωn is the undamped natural frequency, and ζ is the damping ratio.
According to Formula (11), when 0 < ζ < 1, the system is underdamped, the response curve changes smoothly, and one overshoot occurs, corresponding to the inverter voltage, “first drops slightly past the head, then slightly rebounds”.
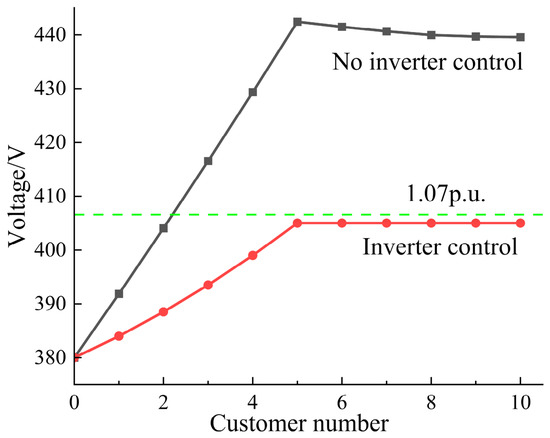
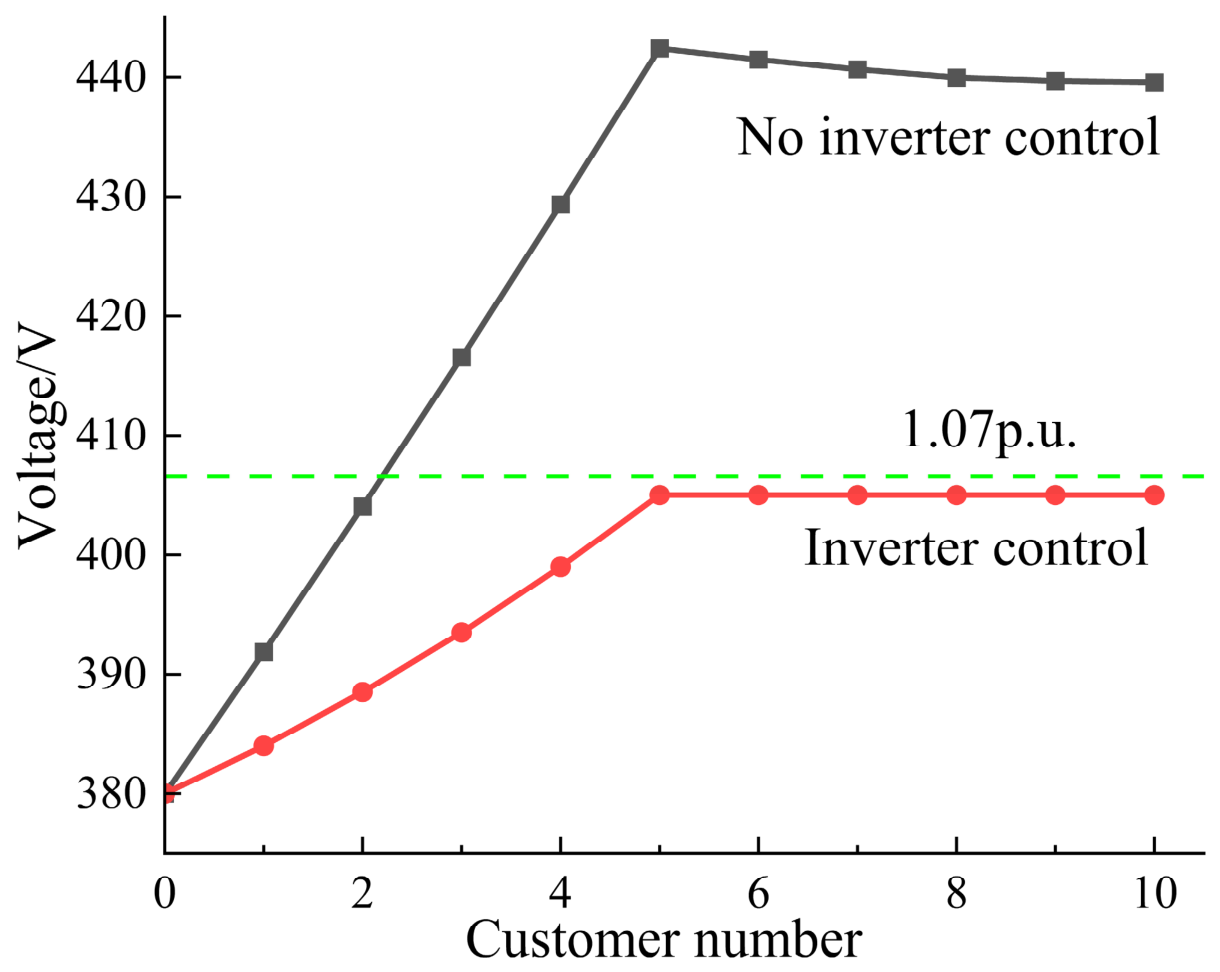
Figure 15 shows the scheme in which the 150 kW PV inverter connected to customer 5 adopts voltage source control, with the control voltage set to the national standard upper limit of 406 V.
Figure 15.
Inverter compensation results.
As shown in Figure 15, under the voltage source control scheme of the inverter, the line voltage is controlled at 406 V, satisfying the national standard for voltage deviation.
4.3. Practical Constraints and Engineering Considerations for Reactors and Inverters
4.3.1. Inverter Apparent Power Capacity Constraint
The reactive power output capability of the photovoltaic inverter is constrained by its rated apparent power. Let the rated apparent power of the inverter be S, and the current active power output be P. Then the maximum reactive power output that can be achieved is:
This relationship implies that when the PV system operates at full active power, the reactive power capacity available for voltage regulation is zero; as active power output decreases, the available reactive power capacity gradually increases. For the 150 kW PV system studied in this work, assuming a rated power factor of 0.9, the rated apparent power is kVA. At full active power (150 kW), the maximum reactive power output is kvar; at 50% active power (75 kW), it increases to kvar. The proposed compensation interval of [40, 70] kvar is well within the reactive power capability of the inverter, ensuring that the control strategy does not fail due to reactive power commands exceeding the inverter capacity.
4.3.2. Loss Analysis
The additional line losses introduced by the reactor compensation can be estimated using Equation (13):
Here, Q represents the compensation capacity, R is the total resistance of the line, and V is the line voltage. Based on the calculation in this article (with a total line resistance of 4.075 Ω and a compensation capacity of 40 kvar), the additional loss is approximately 45.1 W, accounting for 0.45% of the total load of the feeder (10 kW). The switching loss caused by the reactive power control of the inverter is usually 0.5% to 1.5% of the rated power, which is comparable to the increase in line loss caused by reactor compensation. Overall, the additional loss introduced by the compensation measures is acceptable in terms of safety benefits compared to the safety benefits brought by voltage limit management.
4.3.3. Power Factor Constraint
According to GB/T 29319-2024 “Technical Specifications for the Connection of Photovoltaic Power Generation Systems to Distribution Networks” [27], the power factor of the photovoltaic power generation system should be continuously adjustable within the range of leading 0.95 to lagging 0.95. The local standard of Shenzhen City, DB4403/T 514-2024 [28], further stipulates: When the active power output of distributed photovoltaic exceeds 50% of the rated power, the power factor should not be less than 0.98 (leading or lagging). The adjustable range of the power factor for typical inverters is ±0.8. In the strategies proposed in this article, the reactive power compensation of 40–70 kvar is designed to ensure that the power factor at the connection point is above 0.95, meeting the requirements of national and industry standards.
4.3.4. Coordination and Cooperation Between Reactors and Inverters
Reactor compensation provides discrete stepwise regulation, while inverter control offers continuous smooth adjustment. In this paper, a hierarchical coordinated control architecture is adopted:
Reactor (coarse-tuning layer): Provides baseline reactive power compensation (40 kvar) to reduce the point of common coupling (PCC) voltage below the national standard upper limit, undertaking the primary task of steady-state overvoltage mitigation;
Inverter (fine-tuning layer): On the basis of reactor compensation, performs dynamic fine-tuning according to real-time voltage deviations to cope with transient voltage fluctuations caused by weather variations and load changes.
The advantages of this hierarchical architecture are twofold: it avoids frequent reactor switching, while ensuring that the inverter does not operate at its reactive power limits for extended periods.
4.3.5. Priority Strategy Between Active and Reactive Power
Due to the apparent power constraint of the inverter, a trade-off exists between active power delivery and reactive power support. This paper adopts a control priority strategy with reactive power prioritized and active power curtailment as the last resort:
- The remaining capacity of the inverter is preferentially utilized for reactive power regulation.
- If reactive power regulation alone is insufficient to eliminate the overvoltage violation, reactor switching-on is coordinated.
This priority strategy minimizes the loss of photovoltaic generation and ensures the economic benefits of the power station.
4.3.6. Grid Compliance
The reactor compensation and inverter compensation regulations adopted in this article follow the requirements for power factor stipulated in the GB/T 29319-2024 standard and the requirements for voltage deviation values in the DL/T 1208-2013 [26] standard, and comply with the national grid connection technical requirements.
4.4. Quantitative Performance Metric Evaluation
To further quantitatively evaluate the effectiveness of the governance strategies proposed in this paper, this section defines the following three quantitative performance indicators, and provides specific numerical values based on the simulation data.
- (1)
- Overvoltage violation reduction rate
The overvoltage violation amplitude is defined as , where . Before compensation, , exceeding the limit by 8.0 V. After 40 kvar reactor compensation, the voltage is reduced to 405.2 V, completely eliminating the violation. The violation reduction rate reaches 100%.
- (2)
- Voltage deviation rate improvement
The voltage deviation rate is defined as . It is improved from 9.21% (exceeding the national standard limit of ±7%) before compensation to 6.63% (within the standard) after compensation, representing a reduction of 2.58 percentage points.
- (3)
- PV hosting capacity enhancement
With 40 kvar reactor compensation, the maximum PV hosting capacity at User 5 increases from 50 kW to 80 kW, achieving an improvement rate of 60%.
- (4)
- Regulation sensitivity
From the sensitivity analysis in Figure 12, the regulation sensitivity of reactive power compensation on the PCC voltage is approximately −0.30 V/kvar.
The above metrics are summarized in Table 2.
Table 2.
Summary of quantitative performance metric.
4.5. Comparative Analysis of Different Voltage Control Methods
To comprehensively evaluate the engineering practical value of the proposed reactor–inverter coordinated mitigation strategy, this section systematically compares it with three representative existing voltage regulation methods: OLTC coordination control, active power curtailment, and energy storage-based solutions.
The above three methods have all been applied to varying extents in voltage regulation of distribution networks with high-proportion distributed PV integration. OLTC coordination control adjusts the voltage level by regulating transformer taps, which is suitable for a wide range of voltage regulation, but suffers from slow mechanical response speed. Active power curtailment control requires low equipment investment and provides stable voltage regulation performance, but inevitably causes economic losses. Energy storage-based solutions utilize the bidirectional active/reactive power regulation capability of battery energy storage systems, achieving remarkable voltage regulation performance, but incur high capital and maintenance costs. Table 3 provides a comprehensive comparison of the four methods across six key dimensions.
Table 3.
Comprehensive quantitative comparison of the proposed method with conventional voltage regulation approaches.
As shown in Table 3, the proposed method achieves the best overall performance in terms of overvoltage elimination rate (100%), response speed (<0.05 s), active power loss (0%), and equipment cost. It is the only approach that simultaneously achieves 100% overvoltage elimination, zero active power loss, fast response (<0.05 s), and low cost with low complexity. OLTC coordination, while achieving approximately 90% elimination, suffers from mechanical response delays (2–5 s) that make it difficult to cope with rapid PV output fluctuations. Energy storage-based solutions achieve good regulation performance (~95%), but their high investment and maintenance costs limit their engineering applicability. Active power curtailment can achieve 100% overvoltage elimination, but incurs 5–15% electricity sales losses, resulting in poor economic performance. The proposed method achieves the same voltage regulation effect as active power curtailment (100% elimination rate) without curtailing active power, while offering both economic viability and engineering practicality.
It should be noted that the proposed method also has certain limitations:
- (1)
- Reactor compensation provides discrete stepwise reactive power support and cannot achieve continuously smooth reactive power regulation.
- (2)
- The proposed strategy is primarily designed for overvoltage scenarios caused by distributed PV integration, and its applicability to undervoltage conditions caused by heavy load conditions is limited. These limitations point toward directions for future improvement.
5. Conclusions
This paper addresses the voltage violation problem caused by high-proportion distributed PV integration into distribution networks. A unified cross-voltage-level analytical framework covering both the 35 kV substation and the 380 V user-side feeder is established. Starting from multi-dimensional operating conditions (PV penetration level, line impedance, dynamic weather, load magnitude, and integration location), the coupling propagation mechanism of voltage violations is systematically revealed, and a coordinated mitigation strategy combining reactor compensation and inverter control is proposed. The main conclusions are as follows:
- (1)
- Cross-voltage-level coupling mechanism. The impact of distributed PV integration on the 35 kV substation voltage is limited, but its effect on the 380 V user-side terminal voltage is significant. At the PV integration point, the voltage reaches a local maximum and gradually decreases toward both sides. The voltage rise amplitude is collectively determined by PV output, line impedance, load magnitude, and integration location. This finding extends existing studies from isolated medium-voltage or low-voltage analyses to a cross-voltage-level coupled perspective.
- (2)
- Quantitative influence laws of multi-dimensional operating conditions. ① PV penetration level exhibits a highly linear positive correlation with voltage rise; for every 10% increase in penetration, the terminal voltage rises by approximately 5.2 V. ② Line impedance shows a positive correlation with voltage rise; doubling the line length increases the voltage rise amplitude by approximately 95%. ③ The closer the PV integration location is to the line end, the more significant the voltage rise effect becomes, with the terminal voltage weak point being most sensitive to PV integration. ④ Load magnitude is negatively correlated with voltage rise; under light-load conditions, the risk of voltage violation increases significantly.
- (3)
- Secondary hazard of dynamic weather. Although dynamic weather changes (“sunny—cloudy—sunny”) temporarily alleviate steady-state overvoltage during cloud shading, the multiple rapid voltage state transitions between “violation—safe—violation” introduce a new power-quality hazard—severe transient voltage fluctuations. This phenomenon has not been identified in previous static weather analyses and represents a new issue first quantitatively revealed in this work.
- (4)
- Quantified mitigation effectiveness. The proposed reactor–inverter coordinated strategy can effectively suppress voltage violations under multi-dimensional and complex operating conditions. Quantitative evaluation demonstrates that after 40 kvar reactor compensation, the PCC voltage is reduced from 415.0 V to 405.2 V, achieving a 100% overvoltage elimination rate; the voltage deviation rate is improved from 9.21% to 6.63% (a reduction of 2.58 percentage points); the PV hosting capacity is increased from 50 kW to 80 kW (an improvement of 60%); the compensation regulation sensitivity is approximately −0.30 V/kvar; and the settling time is improved from 0.12 s to 0.04 s (a reduction of 66.7%).
- (5)
- Comparison with existing methods. Compared with OLTC coordination control, active power curtailment, and energy storage-based solutions, the proposed method exhibits comprehensive advantages in overvoltage elimination rate (100%), response speed (<0.05 s), active power loss (0%), and economic viability (low cost).
- (6)
- Practical constraints and engineering applicability. Practical constraint analysis shows that the proposed [40, 70] kvar compensation interval is well within the apparent power capacity of the 150 kW PV inverter (maximum reactive power of approximately 73 kVar at full active power). The additional line loss is only about 0.45%, and the power factor at the PCC meets the ±0.95 requirement of GB/T 29319-2024, demonstrating good engineering feasibility. The reactor provides baseline coarse tuning, while the inverter provides dynamic fine-tuning. The hierarchical coordination mechanism avoids equipment overload and frequent switching.
This study has certain limitations that require further investigation:
- (1)
- This paper does not include an economic analysis; future work will conduct an in-depth economic evaluation of the proposed model.
- (2)
- The dynamic weather analysis adopts a simplified ramp model; future work will incorporate measured solar irradiance data and stochastic weather generation models for refined validation.
The National Energy Administration’s “Compilation of Typical Power Quality Management Cases in the Power Industry” has listed “Voltage Overreach Control Practice in High-Permeability Photovoltaic Transformer Areas of Lianyungang, Jiangsu” as a typical case of power quality management. Public information shows that in areas such as Lianyungang in Jiangsu and Weihai in Shandong, to address voltage issues caused by high permeability in photovoltaic stations and seasonal loads, reactive power compensation devices and grid-forming SVG devices were used in voltage-exceeding transformer areas, achieving stable voltage compliance. Such engineering practices show that in low-voltage distribution networks with large numbers of distributed photovoltaic connections, using reactive power compensation devices or dynamic compensation equipment such as voltage source inverters can reduce the risk of voltage exceeding limits on the user side. Application results in Jiangsu and Shandong are basically consistent with the conclusions obtained from the simulations in this paper, namely that dynamic reactive power compensation and voltage source inverter compensation can effectively improve the voltage quality of distribution networks under high photovoltaic connection conditions [29].
Author Contributions
Conceptualization and methodology, Z.X., J.G. and R.L.; investigation, Z.X., J.G., R.L., X.F. and J.Y.; software and validation, Y.C. and H.L.; writing—original draft preparation, Y.C. and H.L.; writing—review and editing, Y.C., H.L. and Q.L.; supervision, H.L. and Q.L. All authors have read and agreed to the published version of the manuscript.
Funding
This research was funded by State Grid Jiangsu Electric Power Research Institute Co., Ltd., Nanjing, China, grant number J2025161.
Data Availability Statement
The data supporting the findings of this study are included in this article. Further information can be obtained from the corresponding author upon reasonable request.
Conflicts of Interest
Authors Zhitong Xue, Jiahao Guo, Ruihuang Liu, Xin Fang and Jianyu Yu were employed by the company State Grid Jiangsu Electric Power Co., Ltd., Electric Power Research Institute. The remaining authors declare that the research was conducted in the absence of any commercial or financial relationships that could be construed as a potential conflict of interest. The authors declare that this study received funding from State Grid Jiangsu Electric Power Company’s Science and Technology Project “Research on Overload and Voltage Regulation Capabilities of 10kV Distribution Transformers to Support Flexible and Reliable Distribution Networks” (J2025161). The funder was not involved in the study design, collection, analysis, interpretation of data, the writing of this article or the decision to submit it for publication.
References
- Feng, J. Analysis of voltage violation suppression strategies for low-voltage distribution networks with distributed photovoltaic integration. Power Equip. Manag. 2025, 23, 86–88. [Google Scholar]
- Gao, Y.; Yun, Y.; Shi, C. Active voltage violation mitigation method based on a novel inverter. Power Electron. Technol. 2026, 2, 1–8. [Google Scholar]
- Wang, X. Voltage violation suppression strategy for distributed photovoltaic grid integration. Energy New Obs. 2025, 9, 89–90. [Google Scholar]
- Sun, W.; Pan, M.; Zhu, N.; Lu, W.; Xu, M.; Jiang, F. Analysis and countermeasures of voltage violation in distribution networks under high-penetration distributed photovoltaic integration. Transformer 2025, 62, 47–54. [Google Scholar]
- Pezeshki, H.; Wolfs, P.J.; Ledwich, G. Impact of High PV Penetration on Distribution Transformer Insulation Life. IEEE Trans. Power Deliv. 2014, 29, 1212–1220. [Google Scholar] [CrossRef] [Scilit]
- El Batawy, S.A.; Morsi, W.G. On the Impact of High Penetration of Rooftop Solar Photovoltaics on the Aging of Distribution Transformers. Can. J. Electr. Comput. Eng. 2017, 40, 93–100. [Google Scholar] [CrossRef] [Scilit]
- Awadallah, M.A.; Venkatesh, B.; Singh, B.N. Impact of Solar Panels on Power Quality of Distribution Networks and Transformers. Can. J. Electr. Comput. Eng. 2015, 38, 45–51. [Google Scholar] [CrossRef] [Scilit]
- Torquato, R.; Salles, D.; Pereira, C.O.; Meira, P.C.M.; Freitas, W. A Comprehensive Assessment of PV Hosting Capacity on Low Voltage Distribution Systems. IEEE Trans. Power Deliv. 2018, 33, 1002–1012. [Google Scholar] [CrossRef] [Scilit]
- Aziz, T.; Ketjoy, N. PV Penetration Limits in Low Voltage Networks and Voltage Variations. IEEE Access 2017, 5, 16784–16792. [Google Scholar] [CrossRef] [Scilit]
- Tonkoski, R.; Turcotte, D.; El-Fouly, T.H.M. Impact of high PV penetration on voltage profiles in residential neighborhoods. IEEE Trans. Sustain. Energy 2012, 3, 518–527. [Google Scholar] [CrossRef] [Scilit]
- Carvalho, P.M.S.; Correia, P.F.; Ferreira, L.A.F.M. Distributed reactive power generation control for voltage rise mitigation in distribution networks. IEEE Trans. Power Syst. 2008, 23, 766–772. [Google Scholar] [CrossRef] [Scilit]
- Demirok, E.; González, P.C.; Frederiksen, K.H.B.; Sera, D.; Rodriguez, P.; Teodorescu, R. Local Reactive Power Control Methods for Overvoltage Prevention of Distributed Solar Inverters in Low-Voltage Grids. IEEE J. Photovolt. 2011, 1, 174–182. [Google Scholar] [CrossRef] [Scilit]
- Woyte, A.; Van Thong, V.; Belmans, R.; Nijs, J. Voltage fluctuations on distribution level introduced by photovoltaic systems. IEEE Trans. Energy Convers. 2006, 21, 202–209. [Google Scholar] [CrossRef] [Scilit]
- Brinkel, N.; Gerritsma, M.; AlSkaif, T.; Lampropoulos, I.; van Voorden, A.; Fidder, H.; van Sark, W. Impact of rapid PV fluctuations on power quality in the low-voltage grid and mitigation strategies using electric vehicles. Int. J. Electr. Power Energy Syst. 2020, 118, 105741. [Google Scholar] [CrossRef] [Scilit]
- Ke, B.; Qin, Z.; Fu, K.; Guo, J.; Xia, J.; Yu, M. Coordinated control of photovoltaic and energy storage considering voltage violation in distribution networks. Electron. Des. Eng. 2025, 33, 157–160+166. [Google Scholar]
- Li, Z.; Liang, Q.; Zhang, J. Voltage control of distribution network based on coordination of energy storage active power and OLTC. South. Power Syst. Technol. 2024, 18, 89–97. [Google Scholar]
- Zhang, Y.; Zhang, Y.; Xie, Z.; Yang, J.; Jiang, Y. Coordinated voltage control strategy involving distributed photovoltaic and energy storage. J. Shanghai Univ. Electr. Power 2026, 42, 39–46. [Google Scholar]
- Shen, S.; Zhong, Q.; Xu, Z.; Wang, G.; Li, H.; Wang, L. User low-voltage violation pattern mining method based on hierarchical affinity propagation clustering. Electr. Power Eng. Technol. 2025, 44, 30–38. [Google Scholar]
- Wang, W.; Yang, Y.; Ji, Z.; Han, X.; Cai, Q. Green substation photovoltaic accommodation operation strategy guided by reactive power monitoring. Electr. Power Eng. Technol. 2026, 45, 41–50. [Google Scholar]
- Zhu, Z.; Chen, C.; Zhang, X. Voltage control method for distribution network based on graph deep reinforcement learning. Electr. Power Autom. Equip. 2026, 46, 137–145. [Google Scholar]
- Yang, L.; Wang, X.; Wang, Z.; Zhao, W.; Li, P.; Li, M. Data-driven voltage coordination control strategy for low-voltage station areas with high proportion of household photovoltaics. Electr. Drive 2025, 55, 51–60. [Google Scholar]
- Wang, C.; Zhao, Y.; Wang, J.; Liu, Z.; Liu, C. Research on voltage control method for low-voltage active distribution networks based on TCN-LSTM-SE neural network. Distrib. Util. 2025, 42, 48–58. [Google Scholar]
- Jin, W.; Wang, W.; Chen, Y.; Zhang, Q.; Zhao, J.; Wang, N. Global voltage comprehensive optimization strategy for distribution network considering active power curtailment of distributed photovoltaic. J. Yanshan Univ. 2020, 44, 164–172. [Google Scholar]
- Sun, W.; He, G.; Liu, C.; Feng, S. Review of voltage violation solutions for distribution networks with high-penetration distributed photovoltaic. Mod. Electr. Power 2024, 41, 302–309. [Google Scholar]
- Wang, Z.; Zhu, S.; Zhou, S.; Huang, R.; Wang, L. Impact of distributed generation on voltage distribution in distribution networks. Autom. Electr. Power Syst. 2004, 16, 56–60. [Google Scholar]
- DL/T 1208-2013; Technical Guide for Power Quality Assessment—Deviation of Supply Voltage. National Energy Administration: Beijing, China, 2013.
- GB/T 29319-2024; Technical Requirements for Connecting Photovoltaic Power System to Distribution Network. State Administration for Market Regulation, Standardization Administration of the People’s Republic of China: Beijing, China, 2024.
- DB4403/T 514-2024; Technical Specification for Distributed Photovoltaic Power Generation System Connected to Power Grid. Shenzhen Administration for Market Regulation: Shenzhen, China, 2024.
- Power Reliability Management and Engineering Quality Supervision Center, National Energy Administration. Compilation of Typical Cases of Power Quality Management in the Power Industry; Government Report; National Energy Administration: Beijing, China, 2025; pp. 183–190, 281–287.



Disclaimer/Publisher’s Note: The statements, opinions and data contained in all publications are solely those of the individual author(s) and contributor(s) and not of MDPI and/or the editor(s). MDPI and/or the editor(s) disclaim responsibility for any injury to people or property resulting from any ideas, methods, instructions or products referred to in the content. |
© 2026 by the authors. Licensee MDPI, Basel, Switzerland. This article is an open access article distributed under the terms and conditions of the Creative Commons Attribution (CC BY) license.