


Abstract
Renewable wind power output is characterized by strong randomness, volatility, and spatial dependence, which makes accurate two-adjacent wind farm scenario generation essential for stochastic dispatch and secure operation of power systems. To describe the joint uncertainty of wind farm outputs without directly constructing a complicated joint probability distribution, this paper proposes a Copula-based scenario generation method for two correlated wind farm outputs. Historically measured output data of two wind farms are first transformed into pseudo-observations through non-parametric marginal distribution estimation. Six bivariate Copula tools, including Gaussian Copula, t-Copula, Empirical Copula, Frank Copula, Clayton Copula, and Gumbel Copula, are then compared in terms of correlation coefficient, Spearman coefficient, Kendall coefficient, degrees of freedom, and distance from the Empirical Copula. The results show that the Bivariate t-Copula achieves the smallest fitting distance among all parametric Copula models and can effectively characterize the strong correlation and tail dependence between the two wind farms. Based on the fitted t-Copula, random samples are generated in the Copula space, transformed into wind power output samples through inverse marginal functions, and reduced into six representative scenarios using K-means clustering. Finally, the generated scenarios are introduced into an optimal power flow model with wind scenarios on the IEEE 30-bus system. The calculation results show that the proposed method can provide representative wind power inputs and effectively reflect the influence of wind power uncertainty on conventional unit dispatch. The proposed approach provides a practical reference for scenario generation and stochastic operation analysis of power systems with two correlated wind farms.
1. Introduction
With the large-scale grid integration of new energy wind power and the clustered development of regional multiple wind farms, the source-side uncertainty of power systems has increased significantly, bringing severe challenges to power grid safety dispatch, power flow optimization, and risk prevention [1]. As a core theory for optimization problems with uncertain variables, stochastic programming can effectively quantify the randomness of wind power output and provide reliable theoretical support for the optimal operation decision of wind-integrated power systems, which has been widely adopted in new energy power dispatch research [2]. Existing studies mostly adopt the Here-and-Now (HN) modeling framework, which constructs stochastic optimization models by introducing chance constraints and expected objective functions. The HN model can realize advanced decision-making before the realization of stochastic variables, forming an effective technical scheme for stochastic optimization of power systems with wind power integration [3]. Relevant research further optimizes the solution strategy of the HN model and improves the theoretical system of stochastic scheduling for new energy power grids [4].
Different from the advanced decision-making mode of the HN model, the Wait-and-See (WS) scenario-based modeling method provides another mainstream solution for wind power stochastic optimization [5,6]. This method constructs typical output scenario sets based on historical wind power measured data, approximates the probability distribution of original stochastic variables through discrete scenarios, and formulates targeted optimal regulation strategies, which are more in line with the actual operation decision-making logic of power grids [7,8]. The optimization accuracy of the WS model depends heavily on the fitting degree between generated scenarios and the original probability and spatial correlation characteristics of wind power output. Therefore, constructing high-precision and high-fidelity multi-wind farm scenarios is the key prerequisite for ensuring the optimization performance of the WS model [9,10].
At present, wind power scenario generation technologies have formed a complete research system, including the Monte Carlo method, improved approximate Monte Carlo method, moment matching method, and optimal scenario generation method [11,12]. These methods have simple principles and high computational efficiency, which are suitable for univariate scenario simulation of single wind farms and can meet the stochastic simulation requirements of simple power systems [13,14]. However, they show prominent limitations in multi-wind farm collaborative modeling. Most traditional multivariate modeling methods are simple extensions of univariate distribution models, which generally require all wind farm outputs to follow the same distribution form [15,16]. In actual wind farm clusters, wind farms with different geographical conditions and installed capacities have heterogeneous output distribution characteristics, accompanied by complex nonlinear spatial correlation and tail dependence [17,18]. Traditional methods cannot accurately describe the joint stochastic law of multi-wind farm output, easily resulting in distorted scenarios and biased power system optimization results [19].
Recent scenario generation studies have further explored high-dimensional dependence modeling and data-driven probabilistic generation. Vine Copula-based methods can flexibly construct high-dimensional dependence structures through pairwise Copula decompositions and are suitable for systems involving multiple dependent variables [20]. VARMA-Copula models further incorporate temporal correlation and cross-correlation, which are useful for generating spatio-temporal wind power scenarios [21]. In addition, generative models, such as GAN-based scenario generation methods, have shown strong nonlinear distribution-learning capability for day-ahead wind power scenario generation [22]. Transformer-based and other deep learning models have also been applied to wind power forecasting and probabilistic modeling by extracting complex spatio-temporal features [23]. Recent power-system studies have also combined probabilistic forecasting with Gaussian Copula for high-dimensional day-ahead scenario generation of load, wind, and solar power [24] and proposed high-dimensional wind/PV scenario-generation methods that preserve spatio-temporal correlations [25]. Diffusion-based scenario-generation models have further been developed for controllable joint source-load scenarios [26] and renewable energy scenarios with pattern-guided controllability [27]. However, these methods usually require larger training datasets, more complex model structures, and additional hyperparameter tuning. In contrast, the present study focuses on a measured two-wind-farm case and aims to provide an interpretable and reproducible scenario generation workflow that can be directly embedded into OPF-WS analysis. A comparison of representative wind power scenario generation methods is provided in Appendix B, Table A5, to further clarify the positioning of the proposed method with respect to recent approaches.
It should be noted that non-parametric marginal estimation, Copula modeling, Monte Carlo sampling, and clustering-based scenario reduction have been widely used in uncertainty modeling and scenario generation. Therefore, this paper does not aim to develop a new Copula family or a new clustering algorithm. Instead, the focus is to construct a complete and reproducible scenario generation workflow for measured multi-wind-farm outputs, in which the marginal distribution characteristics, dependence-structure selection, representative scenario reduction, and OPF-oriented application are consistently linked. Different from studies that select a single Copula model a priori, this work uses the Empirical Copula as a non-parametric benchmark and compares several candidate Copula models to identify the dependence model that best matches the measured joint output characteristics of WF1 and WF2.
To address the above limitations, this paper proposes a t-Copula-based scenario generation method for two correlated wind farms’ output and applies the generated scenarios to optimal power flow analysis. The main contributions of this paper are summarized as follows:
- (1).
- A data-driven scenario generation framework for the outputs of two correlated wind farms is constructed. The framework decouples the marginal distribution estimation of different wind farms from the modeling of their dependence structure. This makes it suitable for wind farms with heterogeneous output distributions and avoids directly constructing a complicated joint probability distribution.
- (2).
- An empirical-benchmark-based Copula model selection procedure is provided. Six Copula models, including Gaussian Copula, t-Copula, Empirical Copula, Frank Copula, Clayton Copula, and Gumbel Copula, are compared using correlation-related indicators and the fitting distance from the Empirical Copula. The comparison shows that the Bivariate t-Copula better captures the strong dependence and symmetric tail dependence of the measured WF1-WF2 output data.
- (3).
- A complete scenario-generation-to-dispatch application is developed. Based on the selected Bivariate t-Copula, random samples are generated, transformed into wind power output samples, and reduced into representative scenarios with occurrence probabilities. These scenarios are then introduced into an optimal power flow with wind scenarios (OPF-WS) model to analyze the influence of wind power uncertainty on conventional generator dispatch.
The remainder of this paper is organized as follows. Section 2 introduces the WS scenario optimization model for power systems with two correlated wind farms. Section 3 analyzes the output dependence of wind farms and selects the appropriate Copula function. Section 4 presents the t-Copula-based scenario generation method. Section 5 applies the generated scenarios to the OPF-WS model and discusses the calculation results. Section 6 concludes this paper.
4. Scenario Optimization Method Based on t-Copula Function
4.1. Scenario Definition
Scenario generation aims to approximate the continuous joint probability distribution of wind farm outputs by a finite set of discrete scenarios. For the two wind farms, WF1 and WF2, a scenario set can be defined as
where x1s and x2s denote the output levels of WF1 and WF2 in the sss-th scenario, respectively; ps is the corresponding occurrence probability; and S is the total number of retained scenarios. The scenario probabilities satisfy
According to the Copula theory, the joint cumulative distribution function of WF1 and WF2 can be expressed by the marginal distribution functions and the dependence structure. Let F1(x1) and F2(x2) be the marginal cumulative distribution functions of WF1 and WF2, respectively. Then the joint distribution function can be written as
where Ct(·) denotes the Bivariate t-Copula function, ρ is the correlation coefficient, and ν is the degrees of freedom. By defining
and the joint distribution can be equivalently expressed as
where tν−1(·) is the inverse cumulative distribution function of the univariate Student’s t distribution with degree of freedom ν, and tρ,ν(·,·) is the bivariate Student’s t cumulative distribution function with correlation coefficient ρ and degree of freedom ν.
After the Bivariate t-Copula is discretized, a generated Copula sample can be denoted as
where Ngen is the number of generated samples. Since ui = Fi(xi), the corresponding wind power output samples can be obtained by the inverse transformation of the marginal distributions:
Thus, the generated sample in the original output space is
In this way, the samples generated from the Bivariate t-Copula can preserve both the marginal distribution characteristics of each wind farm and the dependence structure between WF1 and WF2.
4.2. Algorithm Procedure
The basic idea of scenario generation based on the Bivariate t-Copula is as follows. First, the marginal distributions of WF1 and WF2 are estimated from historical wind power data. Then, the Bivariate t-Copula is constructed using the estimated correlation coefficient and the degrees of freedom. After that, random samples satisfying the t-Copula dependence structure are generated and transformed into wind power output samples through the inverse marginal distribution functions. Finally, scenario reduction is performed to obtain a limited number of representative scenarios and their probabilities.
The specific procedure is described as follows.
Step 1: Estimate the marginal distributions of WF1 and WF2.
Based on the historical measured output data, the marginal cumulative distribution functions of WF1 and WF2 are estimated as
The corresponding pseudo-observations are obtained by
where n is the number of historical samples.
Step 2: Construct the Bivariate t-Copula model.
According to the model evaluation results, the Bivariate t-Copula is selected to describe the joint dependence between WF1 and WF2. Its parameters are estimated as
where is the estimated correlation coefficient and is the estimated degree of freedom. Therefore, the fitted joint distribution model can be written as
Step 3: Generate random samples from the fitted t-Copula.
A total of Ngen random samples are generated from the fitted Bivariate t-Copula:
These samples are distributed in the unit square [0, 1]2 and contain the dependence structure between WF1 and WF2.
Step 4: Transform Copula samples into wind power output samples.
The generated Copula samples are transformed into the original wind power output space by the inverse marginal distribution functions:
Thus, the generated wind power sample matrix can be expressed as
Each row of represents one possible joint output state of WF1 and WF2.
Step 5: Reduce the generated samples to representative scenarios.
To reduce the computational burden while preserving the main distribution characteristics, the generated Ngen samples are clustered into S groups by the K-means clustering method. Let Gs denote the set of samples belonging to the sss-th cluster. The representative scenario of the sss-th cluster is obtained as
The probability of the s-th scenario is calculated by the proportion of samples in the corresponding cluster:
where Ns is the number of samples in Gs. Therefore, the final scenario set can be obtained as
The above procedure ensures that the generated scenarios retain the marginal distribution characteristics of each wind farm, the t-Copula-based dependence structure between WF1 and WF2, and the probability information of representative joint output states. Since the Bivariate t-Copula can describe symmetric tail dependence, the generated scenarios are more suitable for representing simultaneous high-output and low-output variations in the two wind farms.
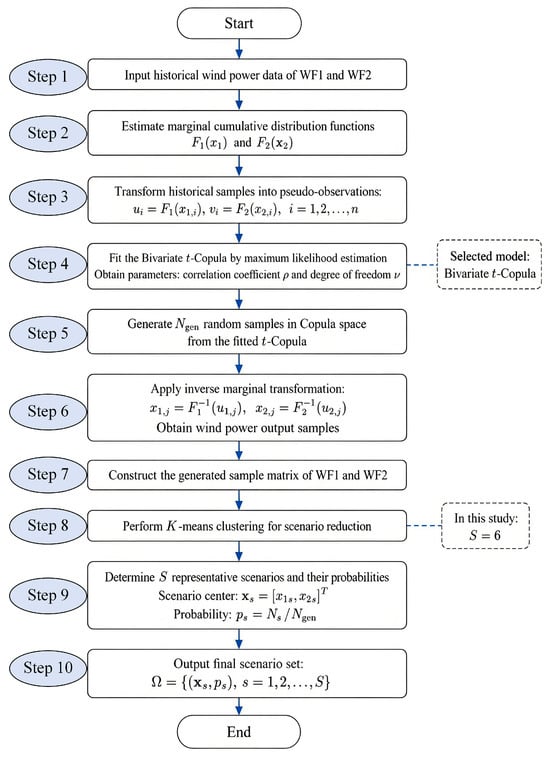
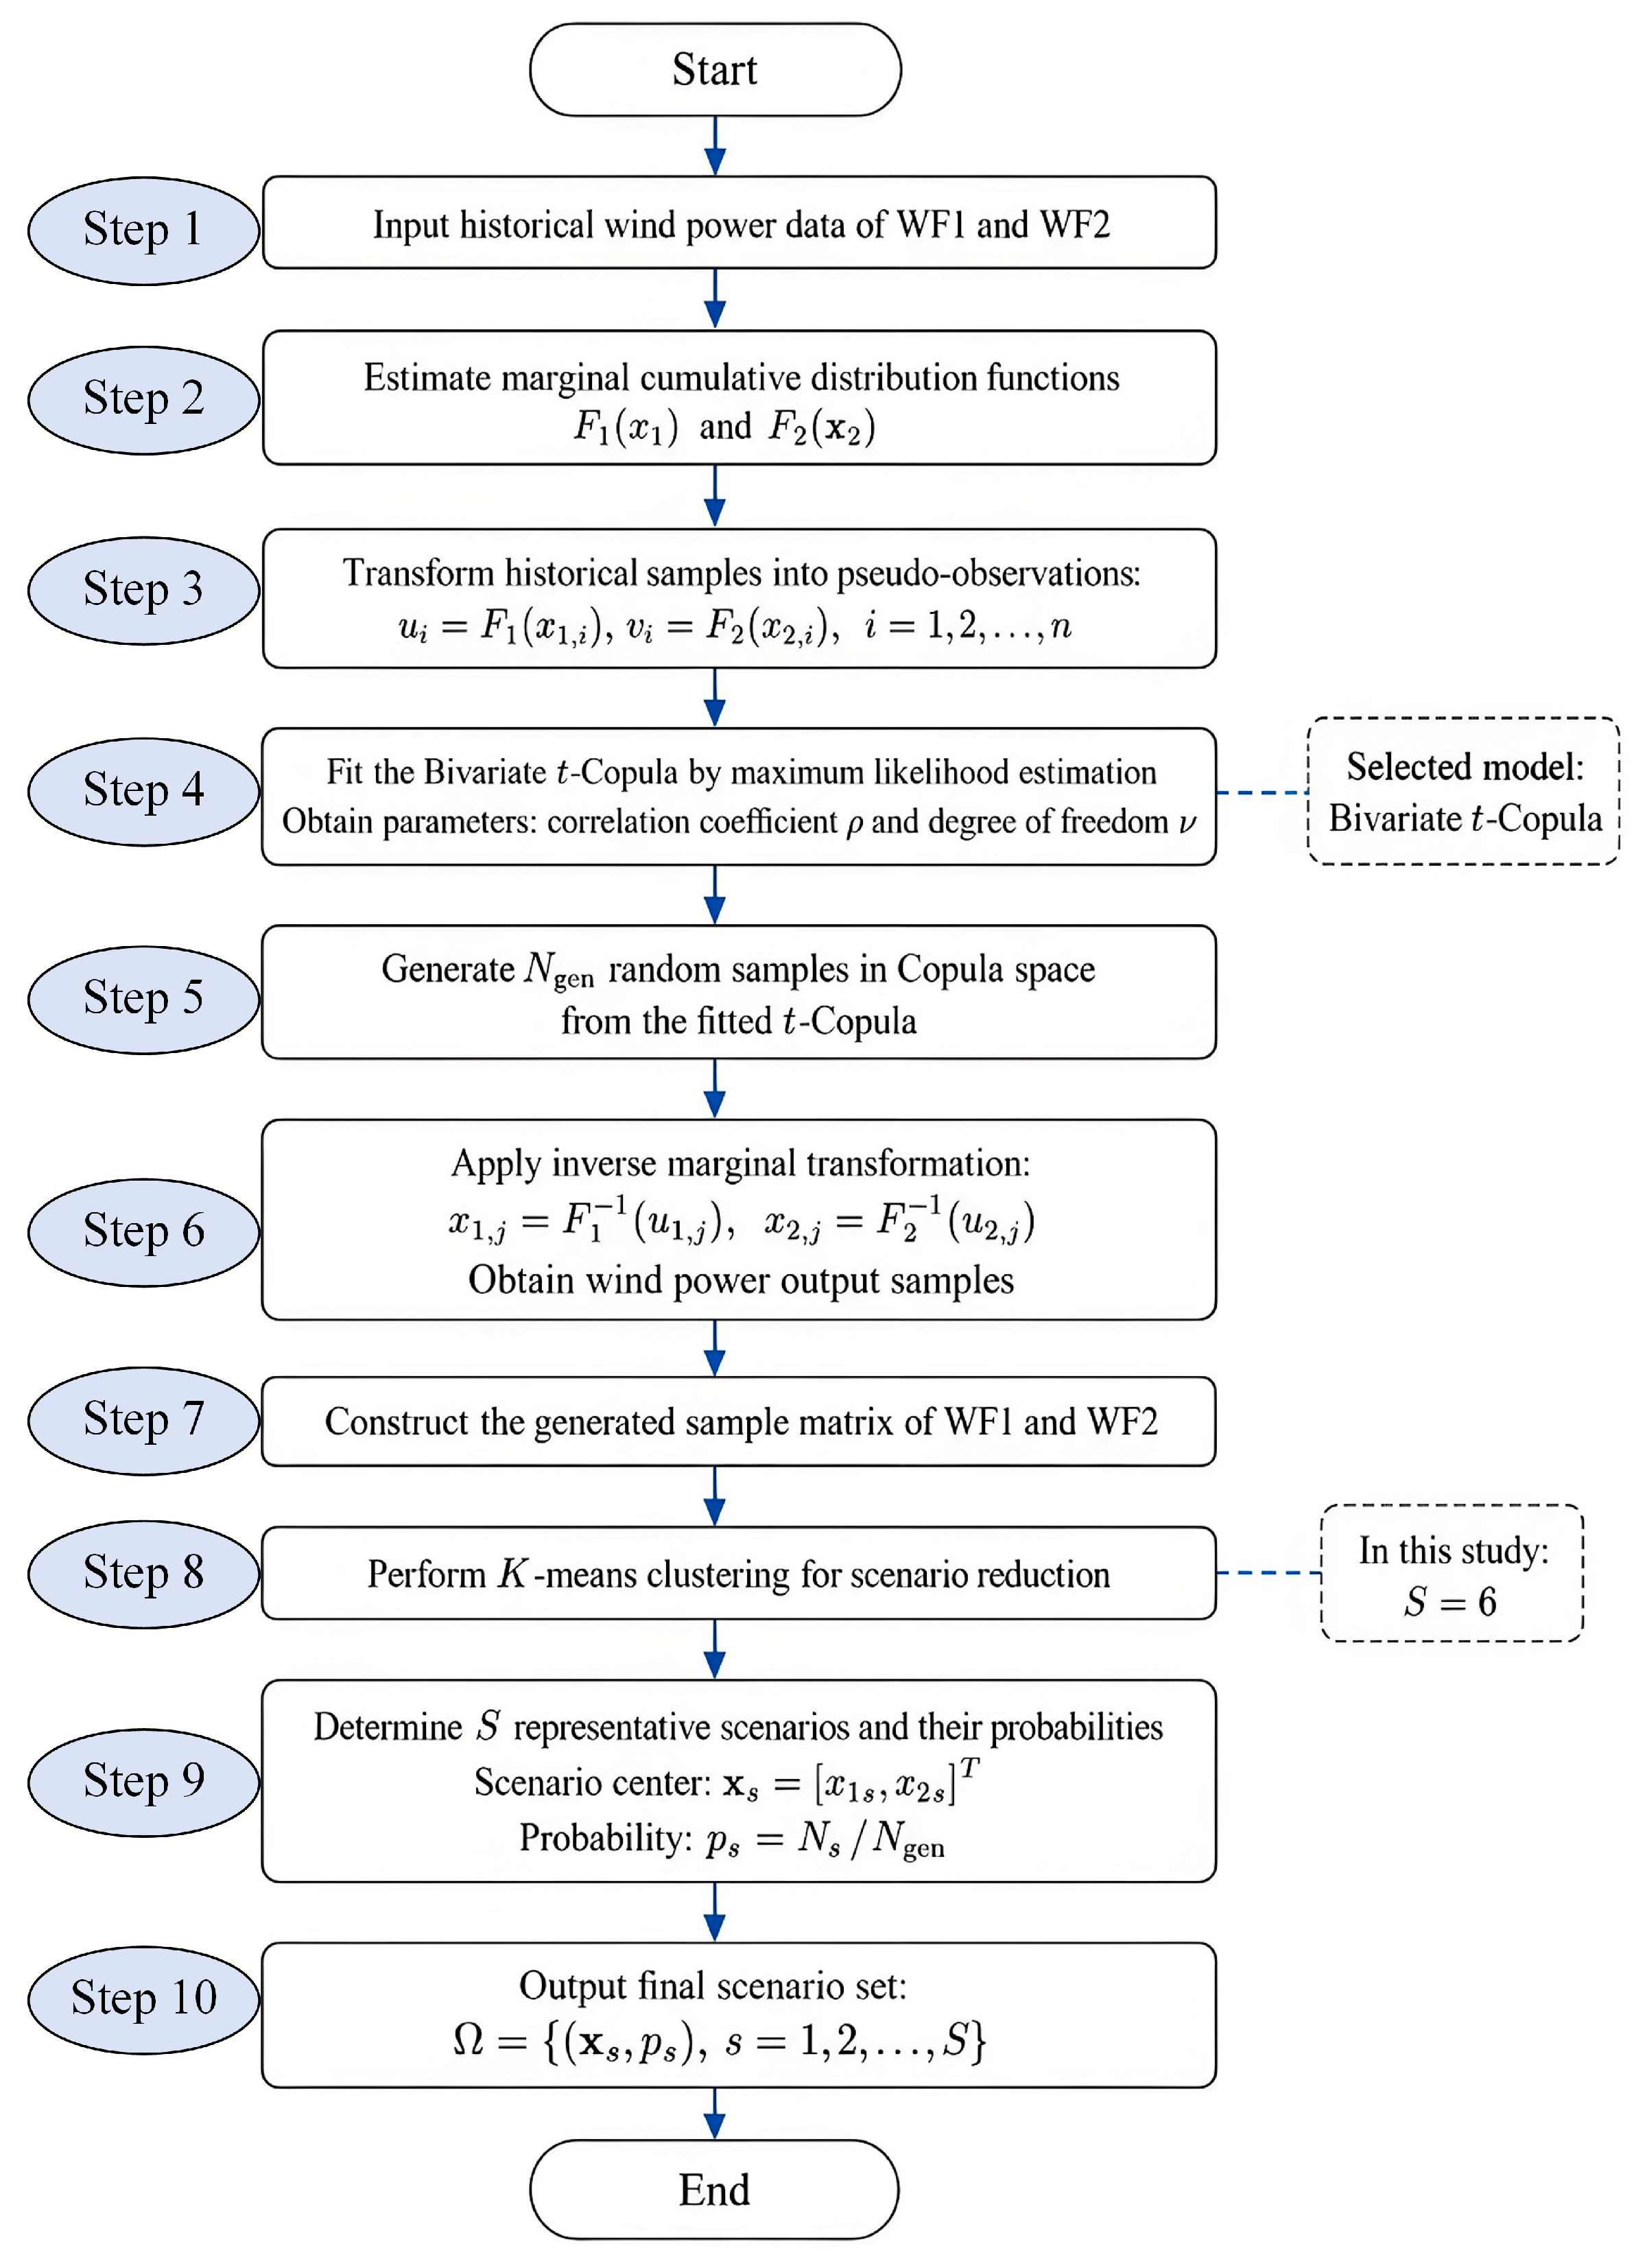
As illustrated in Figure 5, the proposed t-Copula-based wind power scenario generation procedure consists of marginal distribution estimation, t-Copula parameter identification, random sample generation in the Copula space, inverse marginal transformation, and K-means-based scenario reduction.
Figure 5.
Flowchart of the t-Copula-based wind power scenario generation procedure.
4.3. Calculation Results
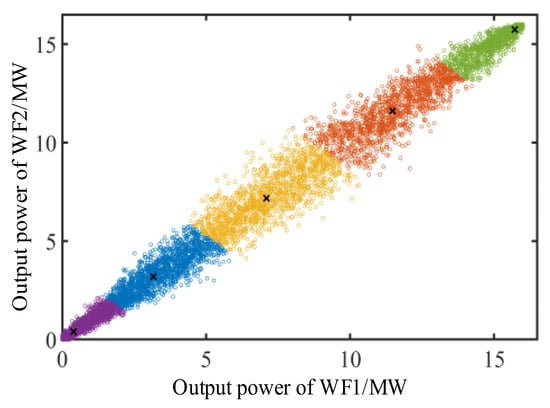
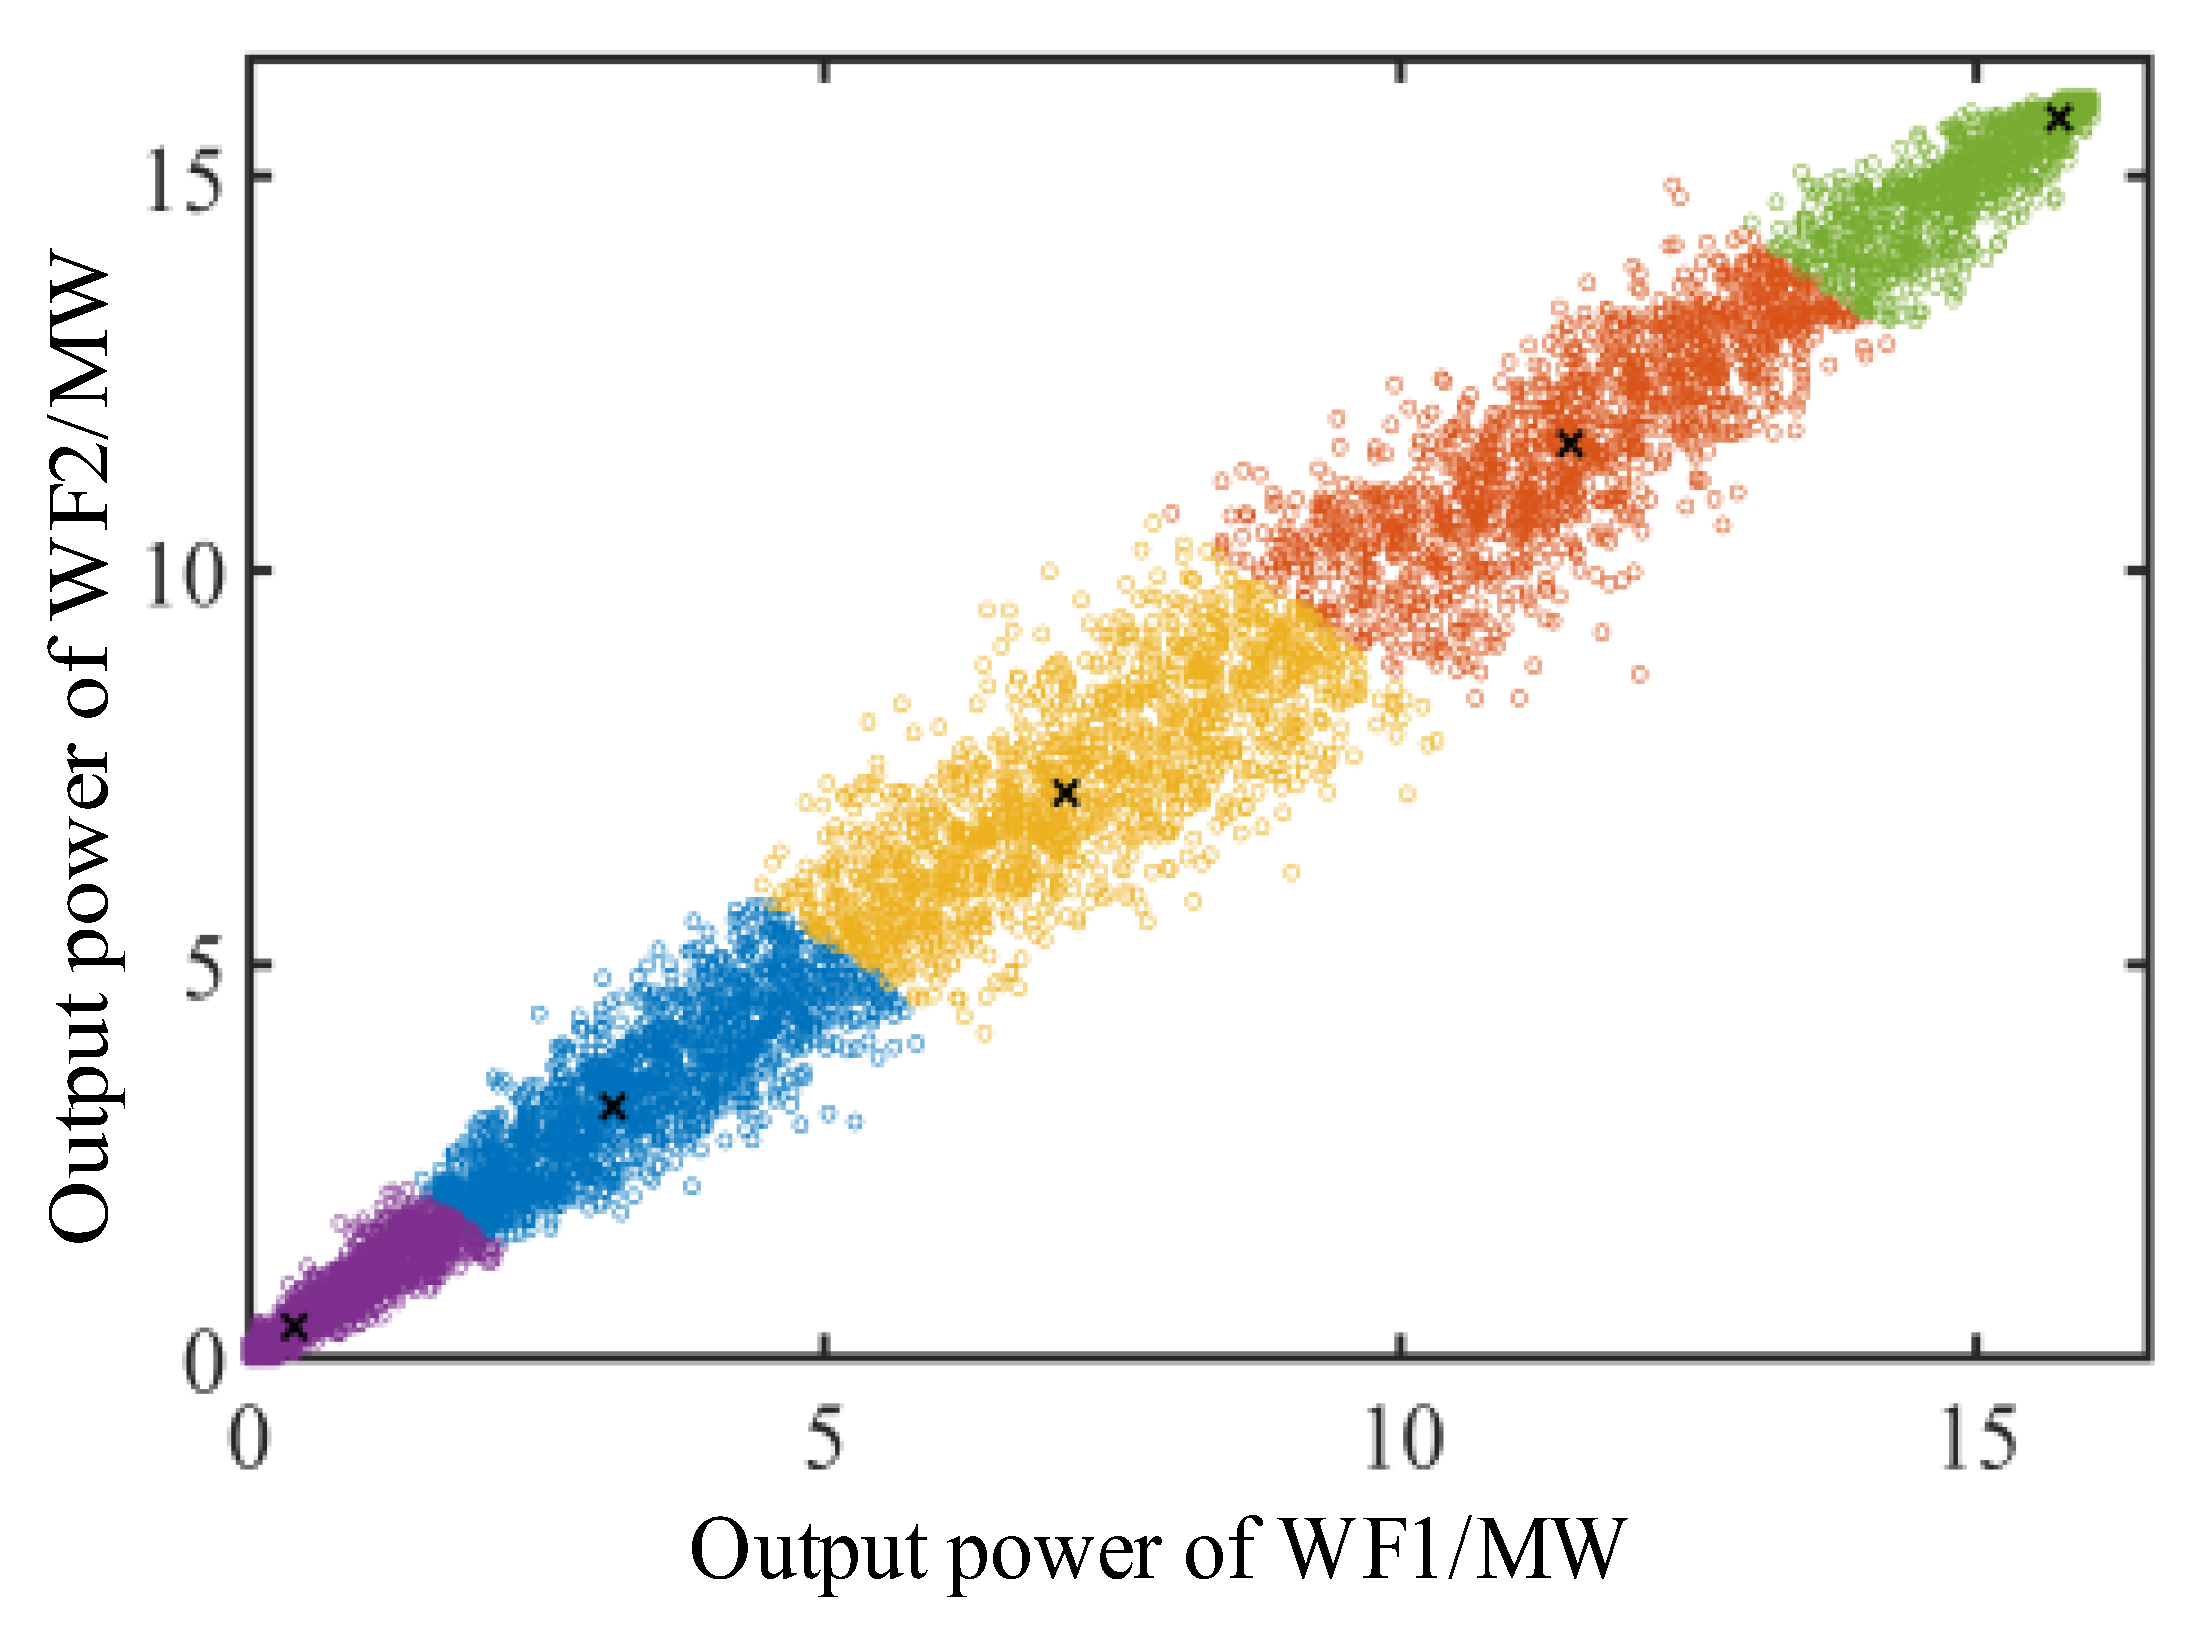
Based on the measured wind power data of WF1 and WF2, the Bivariate t-Copula model selected in the previous section is used to generate stochastic wind power scenarios. A total of 100,000 samples satisfying the fitted t-Copula distribution are first generated in the Copula space. Then, the K-means clustering method is adopted to reduce the generated samples into six representative scenarios. The cluster centers in the Copula space are denoted by u and v, and the corresponding wind power scenarios are obtained through the inverse transformation of the marginal distribution functions.
After the random samples are generated from the fitted Bivariate t-Copula and transformed into the original wind power output space, the K-means clustering method is adopted to reduce the generated samples into representative scenarios. The clustering result is shown in Figure 6, where the horizontal axis represents the output power of WF1 and the vertical axis represents the output power of WF2. Each point denotes one generated joint output state of the two wind farms, while the black crosses represent the cluster centers obtained by K-means clustering, which are used as the representative wind power scenarios. The generated samples are mainly distributed along a clear diagonal band, indicating a strong positive dependence between the outputs of WF1 and WF2. It can also be observed that the selected scenario centers cover the low-output, medium-output, and high-output regions, demonstrating that the reduced scenario set preserves the main joint variation characteristics of the generated wind power samples.
Figure 6.
Scenario reduction results of t-Copula-generated joint wind power samples based on K-means clustering.
The generated representative scenarios and their probabilities are listed in Table 4.
Table 4.
Generated wind power scenarios based on the Bivariate t-Copula.
As shown in Table 4, the representative scenarios cover the full output range from near-zero wind power to high wind power. Scenario 1 corresponds to the low-output condition, while Scenario 6 represents the high-output condition of the two wind farms. The intermediate scenarios describe different medium-output levels. Therefore, the reduced scenario set can retain the main distribution characteristics of the original generated samples.
The obtained Copula centers of u and v are very close in all scenarios. This result is consistent with the strong positive correlation identified in the parameter estimation and model evaluation results. It indicates that WF1 and WF2 tend to exhibit synchronized output variations under similar meteorological conditions. In other words, low-output and high-output states are likely to occur simultaneously in the two wind farms, rather than independently.
The probabilities of the six scenarios are also relatively balanced, ranging from 0.1576 to 0.1815. This means that the scenario reduction process does not lead to an excessive concentration of probability in a single scenario. The probability of Scenario 6 is slightly higher than the others, indicating that the high-output state has a relatively larger occurrence probability in the generated sample set. However, the difference among scenario probabilities is not significant, and the generated scenario set can provide a balanced representation of different wind power output levels.
From the perspective of wind power dispatching and stochastic optimization, the generated scenarios provide a compact description of the uncertain joint output of WF1 and WF2. The low-output scenarios can be used to evaluate the reserve requirement and power balance risk, while the high-output scenarios can be used to analyze wind power accommodation and possible curtailment conditions. Therefore, the obtained scenario set can support the subsequent optimization and operation analysis of power systems with two correlated wind farms.
4.4. Quantitative Evaluation of Generated Scenarios
To further evaluate the quality of the generated representative scenarios, several quantitative metrics are introduced to compare the reduced scenario set with the historical wind power samples. These metrics are used to assess whether the generated scenarios can preserve the marginal distribution characteristics, joint distribution similarity, statistical moments, and dependence structure of the original WF1 and WF2 output data.
Let the historical wind power samples be denoted by H = {(x1i,x2i)}i = 1n, and let the reduced scenario set be denoted by Ω = {(x1s,x2s), ps}s = 1S, where ps is the probability of the s-th representative scenario. For each wind farm, the first-order Wasserstein distance is used to evaluate the marginal distribution deviation between the historical samples and the reduced scenarios:
where and denote the empirical marginal distribution of the historical samples and the weighted marginal distribution of the reduced scenarios, respectively. A smaller Wasserstein distance indicates better preservation of the marginal distribution.
The Kullback–Leibler divergence is adopted to measure the similarity between the joint probability distributions of the historical samples and the generated scenarios. The joint distributions are estimated using the same two-dimensional histogram bins, and a small positive constant ε is introduced to avoid zero-probability bins:
where Pab and Qab are the joint probabilities of the historical samples and the reduced scenarios in the (a,b)-th bin, respectively. A smaller value of DKL(P||Q) indicates a higher similarity between the two joint distributions.
To evaluate statistical moment preservation, the relative errors of the mean and standard deviation are calculated as
where μH,k and σH,k are the mean and standard deviation of the historical samples, while μH,k and σH,k are the probability-weighted mean and standard deviation of the reduced scenarios.
In addition, the preservation of the dependence structure between WF1 and WF2 is evaluated by the absolute errors of Pearson, Spearman, and Kendall coefficients:
where c represents the Pearson correlation coefficient, Spearman coefficient, or Kendall coefficient. A smaller value of Δc indicates that the reduced scenarios better retain the dependence structure of the original wind power data.
The quantitative evaluation results are summarized in Table 5. It can be observed that the generated representative scenarios maintain small marginal distribution deviations, limited statistical moment errors, and small dependence-preservation errors. This demonstrates that the proposed t-Copula-based scenario generation and reduction procedure can effectively retain the main probabilistic and dependence characteristics of the historical two-wind-farm output data.
Table 5.
Quantitative evaluation of the generated representative scenarios.
It can be observed from Table 5 that the generated representative scenarios maintain small marginal distribution deviations, limited statistical moment errors, and small dependence-preservation errors. This demonstrates that the proposed t-Copula-based scenario generation and reduction procedure can effectively retain the main probabilistic and dependence characteristics of the historical two-wind-farm output data.
4.5. Sensitivity Analysis of Sample Size and Scenario Number
To justify the selection of the number of generated samples and retained representative scenarios, a sensitivity analysis is conducted with respect to Ngen and S. The number of generated samples affects the statistical stability of the Copula-based random sampling process, while the number of retained scenarios determines the balance between scenario representation accuracy and OPF computational burden. In this study, the average Wasserstein distance, moment-preservation error, dependence-preservation error, and expected operating-cost deviation are used as evaluation indicators.
The average Wasserstein distance is calculated as:
where W1,1 and W1,2 are the Wasserstein distances of WF1 and WF2, respectively. The average moment-preservation error is defined as
where eμ,k and eσ,k denote the relative errors of the mean and standard deviation of the k-th wind farm. The dependence-preservation error is calculated by averaging the absolute errors of Pearson, Spearman, and Kendall coefficients:
In addition, the expected operating-cost deviation is used to evaluate the influence of scenario reduction on the OPF-WS application:
where FΩ is the probability-weighted expected operating cost obtained from the reduced scenario set, and Fref is the reference expected operating cost obtained from a larger scenario set.
Based on the above indicators, the sensitivity of the generated sample size is first analyzed by varying Ngen from 10,000 to 200,000 while keeping the number of retained scenarios fixed at S = 6. The results are summarized in Table 6.
Table 6.
Sensitivity analysis with respect to the number of generated samples.
As shown in Table 6, increasing Ngen improves the statistical stability of the generated samples. When Ngen increases from 10,000 to 100,000, the average Wasserstein distance decreases from 0.5264 MW to 0.3106 MW, the moment-preservation error decreases from 2.76% to 1.50%, and the dependence-preservation error decreases from 0.0048 to 0.0019. However, when Ngen further increases from 100,000 to 200,000, the improvement becomes relatively limited. The expected cost deviation only decreases from 0.74% to 0.68%, indicating that the OPF-oriented results have become stable. Therefore, Ngen = 100,000 is selected to balance sampling stability and computational efficiency.
Furthermore, to evaluate the influence of the retained scenario number, Ngen is fixed at 100,000, and the number of representative scenarios, S, is varied from 4 to 10. The corresponding results are listed in Table 7.
Table 7.
Sensitivity analysis with respect to the number of retained scenarios.
The influence of the retained scenario number S is shown in Table 7. Increasing S improves the representation accuracy of the reduced scenario set, as reflected by the decreasing Wasserstein distance, moment-preservation error, and dependence-preservation error. However, a larger S also increases the number of deterministic OPF subproblems. Compared with S = 4, retaining 6 scenarios significantly improves the scenario quality, while the improvement becomes more moderate when S increases from 6 to 8 or 10. Therefore, S = 6 is selected in this study as a reasonable compromise between scenario representation accuracy and OPF computational burden.
5. Application Case of the Generated Scenarios
5.1. OPF-WS Model
To further verify the effectiveness of the generated wind power scenarios in power system operation, the representative scenarios obtained by the t-Copula-based scenario generation method are introduced into an optimal power flow model with wind scenarios, denoted as the OPF-WS model. The purpose of the OPF-WS model is to determine the optimal dispatching scheme of conventional generators under different wind power output scenarios while satisfying the security constraints of the power system.
In the conventional OPF model, wind power outputs are usually treated as uncertain variables. In this study, the uncertainty of wind power is represented by the generated discrete scenarios. For each scenario, the wind power outputs of WF1 and WF2 are taken as known inputs, and the corresponding optimal dispatching result of conventional generators is obtained.
The objective function is to minimize the total fuel cost of conventional generating units. Since the generation cost of wind power is not considered in this study, the optimization objective is expressed as
where PGi is the active power output of the i-th conventional generator; a0i, a1i, and a2i are the fuel cost coefficients of the generator; and SG denotes the set of conventional generators.
The OPF-WS model is subject to the following constraints:
where SB is the set of system buses; SG is the set of conventional generators; SW is the set of wind farms; SR is the set of reactive power compensation devices; and SL is the set of transmission lines. PDi and QDi denote the active and reactive loads at bus i, respectively. PWis and QWis are the active and reactive wind power injections under the s-th scenario. Ui and θi are the voltage magnitude and phase angle of bus i, respectively, and θij = θi − θj. Gij and Bij are the conductance and susceptance elements of the bus admittance matrix. The symbols with upper and lower bars denote the upper and lower limits of the corresponding variables.
In (45), the first two equations represent the active and reactive power balance constraints at each bus. The remaining inequalities represent the active power output limits of conventional generators, the wind power output limits, the reactive power limits, the bus voltage limits, and the transmission line power flow constraints. For each wind power scenario generated in the previous section, the corresponding wind power outputs PWis are substituted into the OPF-WS model, and the optimal generation dispatching scheme can be obtained.
It should be noted that the OPF-WS model used in this paper is a steady-state stochastic dispatch model rather than a time-domain dynamic model of wind turbine/converter systems. The generated wind power scenarios are used as scenario-dependent active power injections of WF1 and WF2. Reactive power injections and bus voltages are considered through the OPF power-balance equations, reactive power limits, voltage limits, and line-flow constraints. However, internal wind turbine and converter dynamic variables, such as rotor speed and DC-link voltage, are not included in the present model. Therefore, the following case study focuses on the applicability of the generated scenarios for steady-state dispatch analysis, rather than on the dynamic robust responses of wind farm control systems.
5.2. Calculation Results
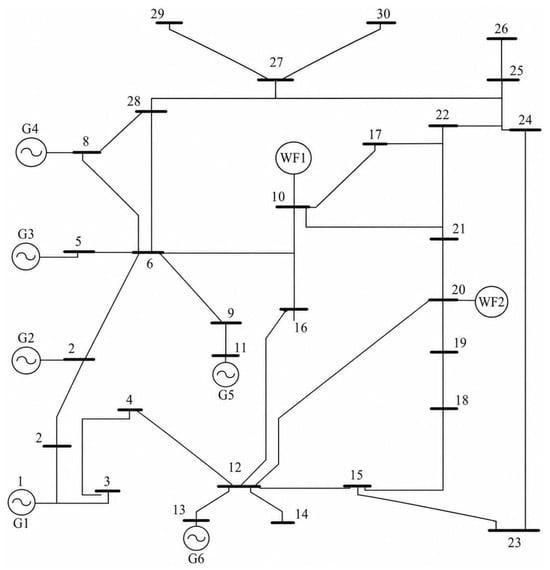
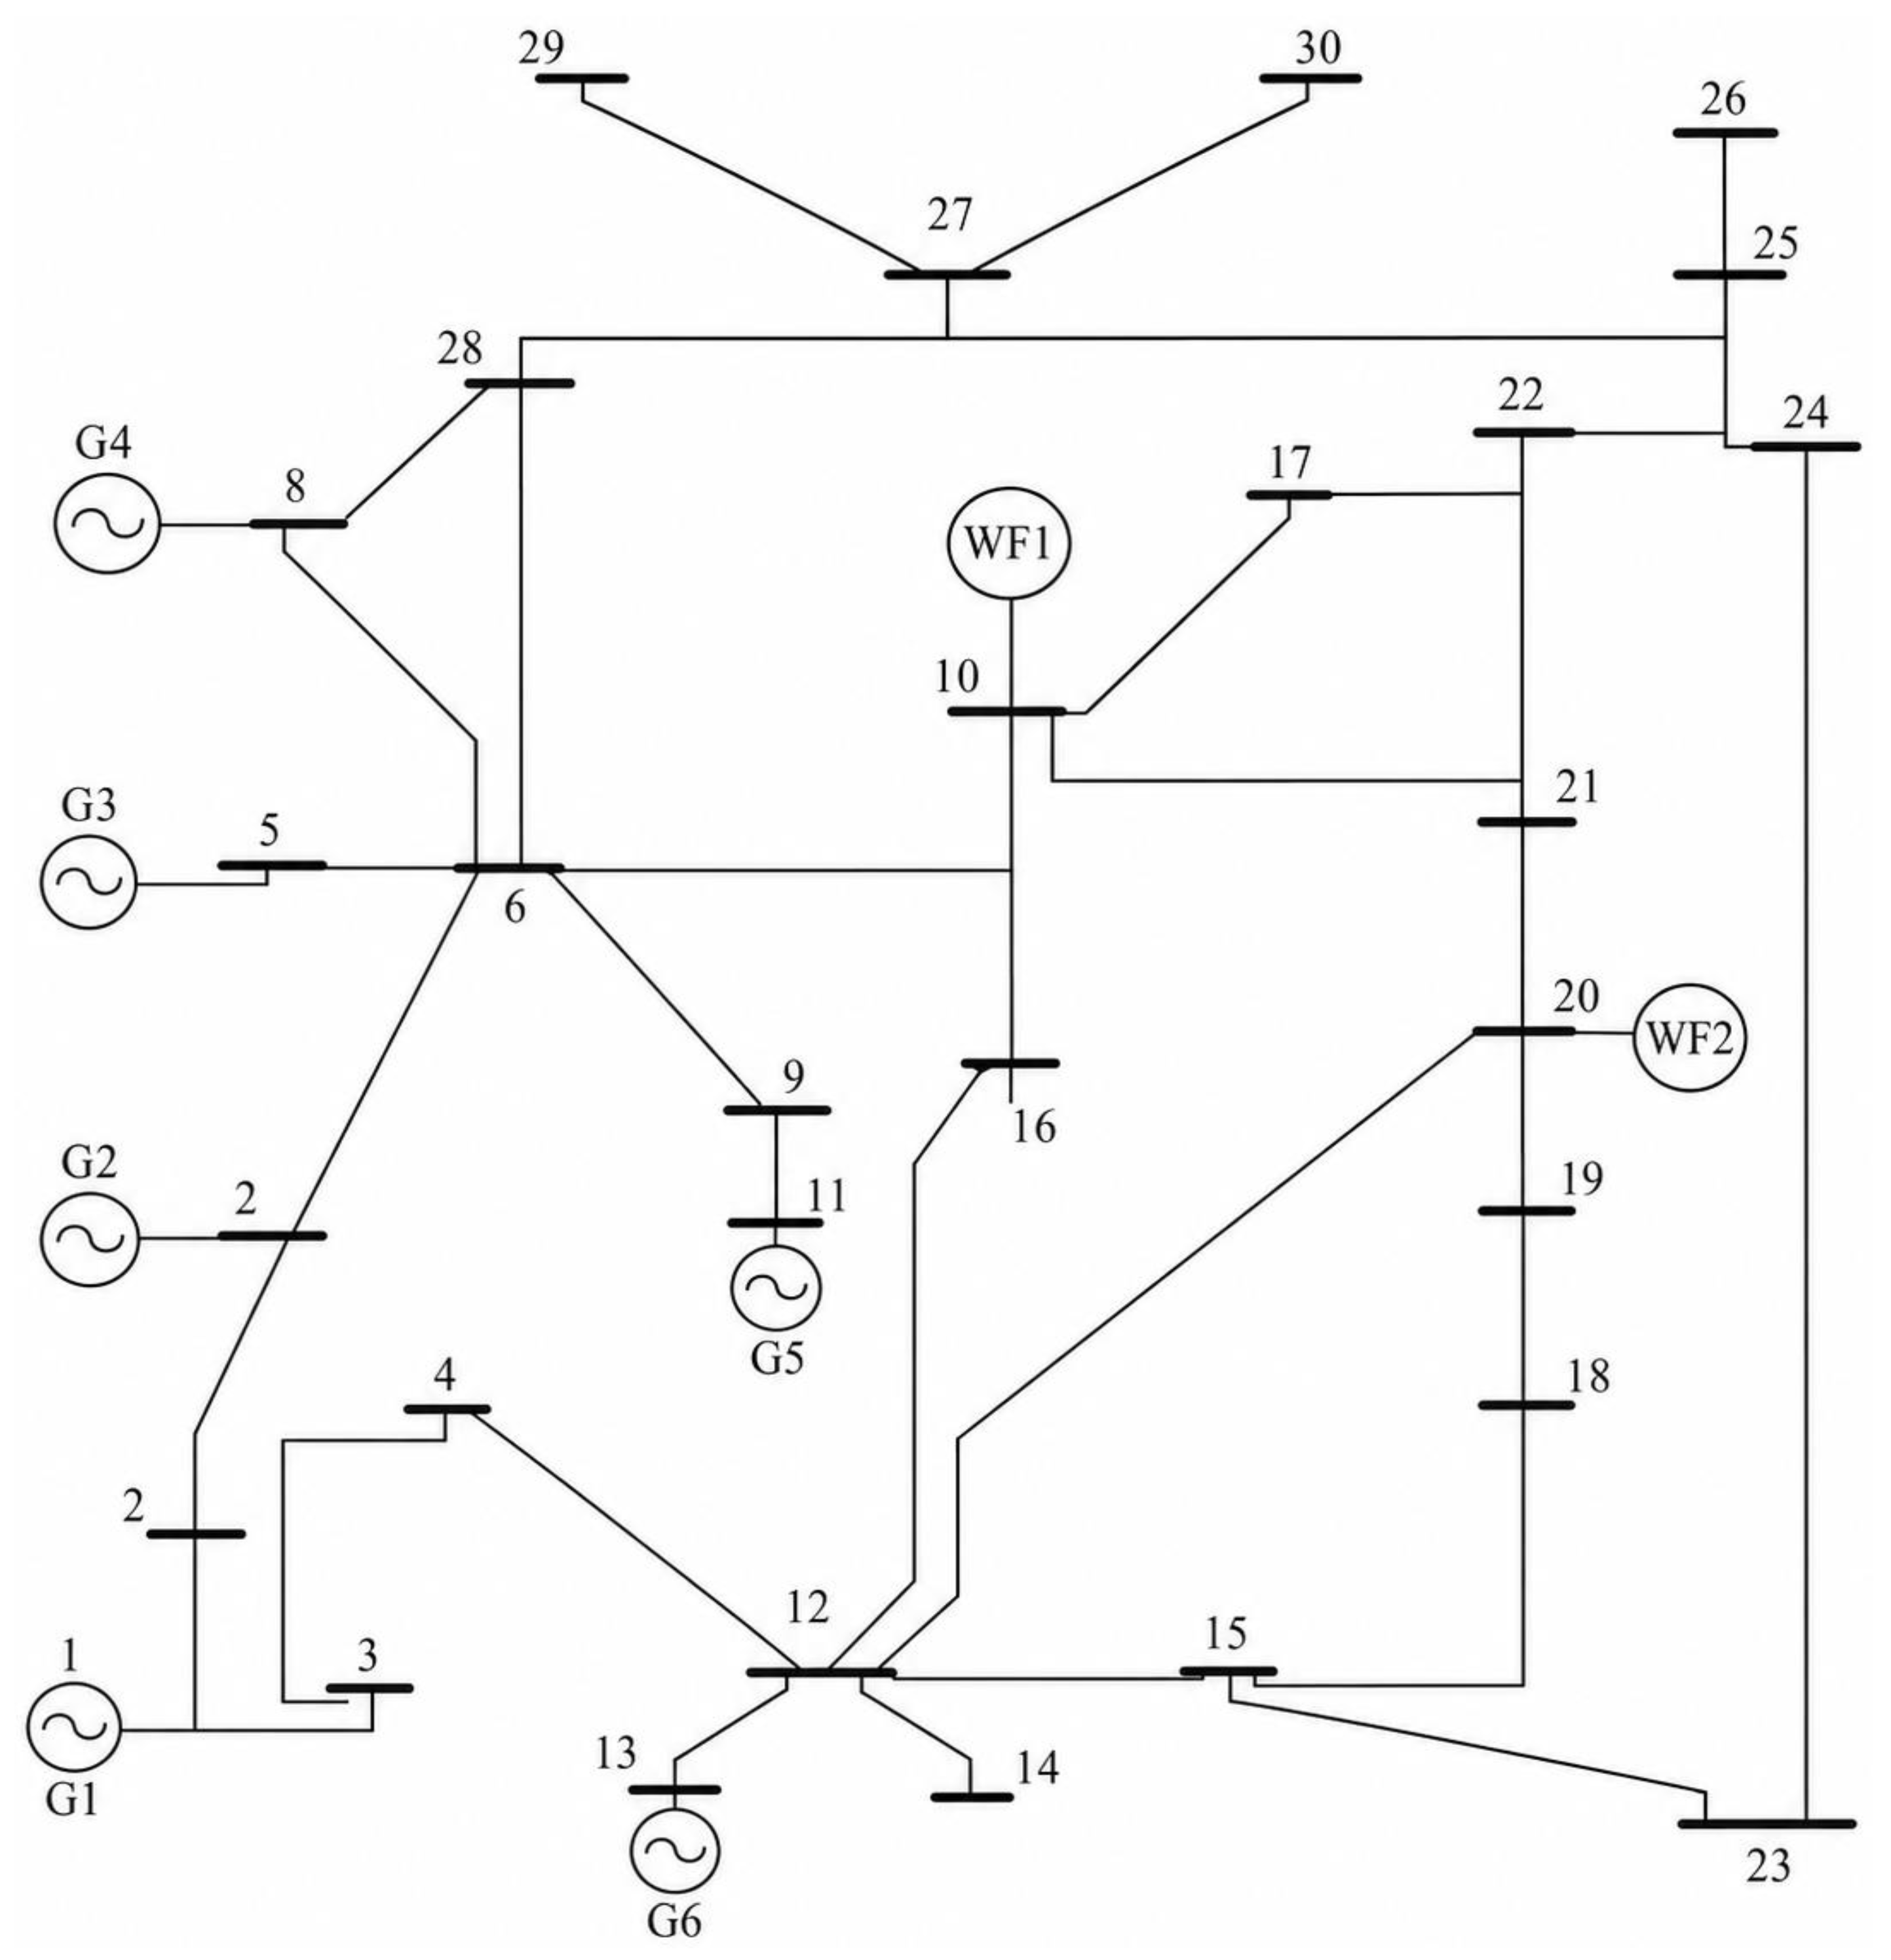
The IEEE 30-bus system is used as the test system to evaluate the applicability of the generated wind power scenarios in power system dispatch. The two wind farms, WF1 and WF2, are connected to bus 10 and bus 20, respectively, as shown in Figure 7. The historical wind power data of WF1 and WF2 are used to construct the t-Copula model, and the representative wind power scenarios obtained in Section 4.3 are introduced into the OPF-WS model.
Figure 7.
Graph of the IEEE 30-bus system (WF1 and WF2 are connected to bus 10 and bus 20, respectively. The detailed branch parameters, including rl, xl, bl, and Slmax, are listed in Appendix A, Table A3, according to the corresponding from-bus and to-bus pairs.).
To improve the reproducibility of the case study, the main model-system parameters and simulation settings are summarized in Table 8. The generated wind power scenarios listed in Table 4 are used as active power injections of WF1 and WF2 in the OPF-WS model. Except for the added wind power injections, the standard IEEE 30-bus system settings are retained, including the bus data, branch data, generator limits, voltage limits, and generation cost coefficients. The detailed IEEE 30-bus system data are provided in the Supplementary Materials to facilitate replication by peers.
Table 8.
Reproducibility settings of the case study.
Figure 7 shows the topology of the IEEE 30-bus system with two wind farms. The generated wind power scenarios reflect different joint output levels of WF1 and WF2, including low-output, medium-output, and high-output operating conditions. Therefore, they can be used to evaluate the dispatching performance of the power system under different wind power fluctuation states.
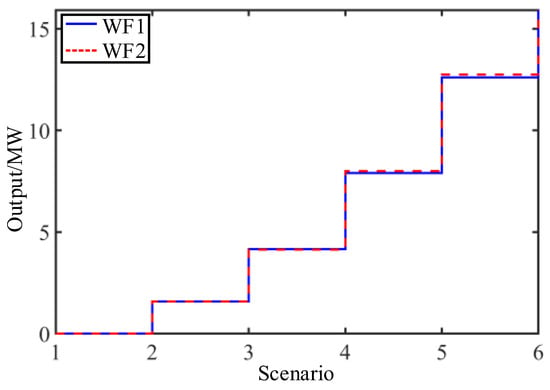
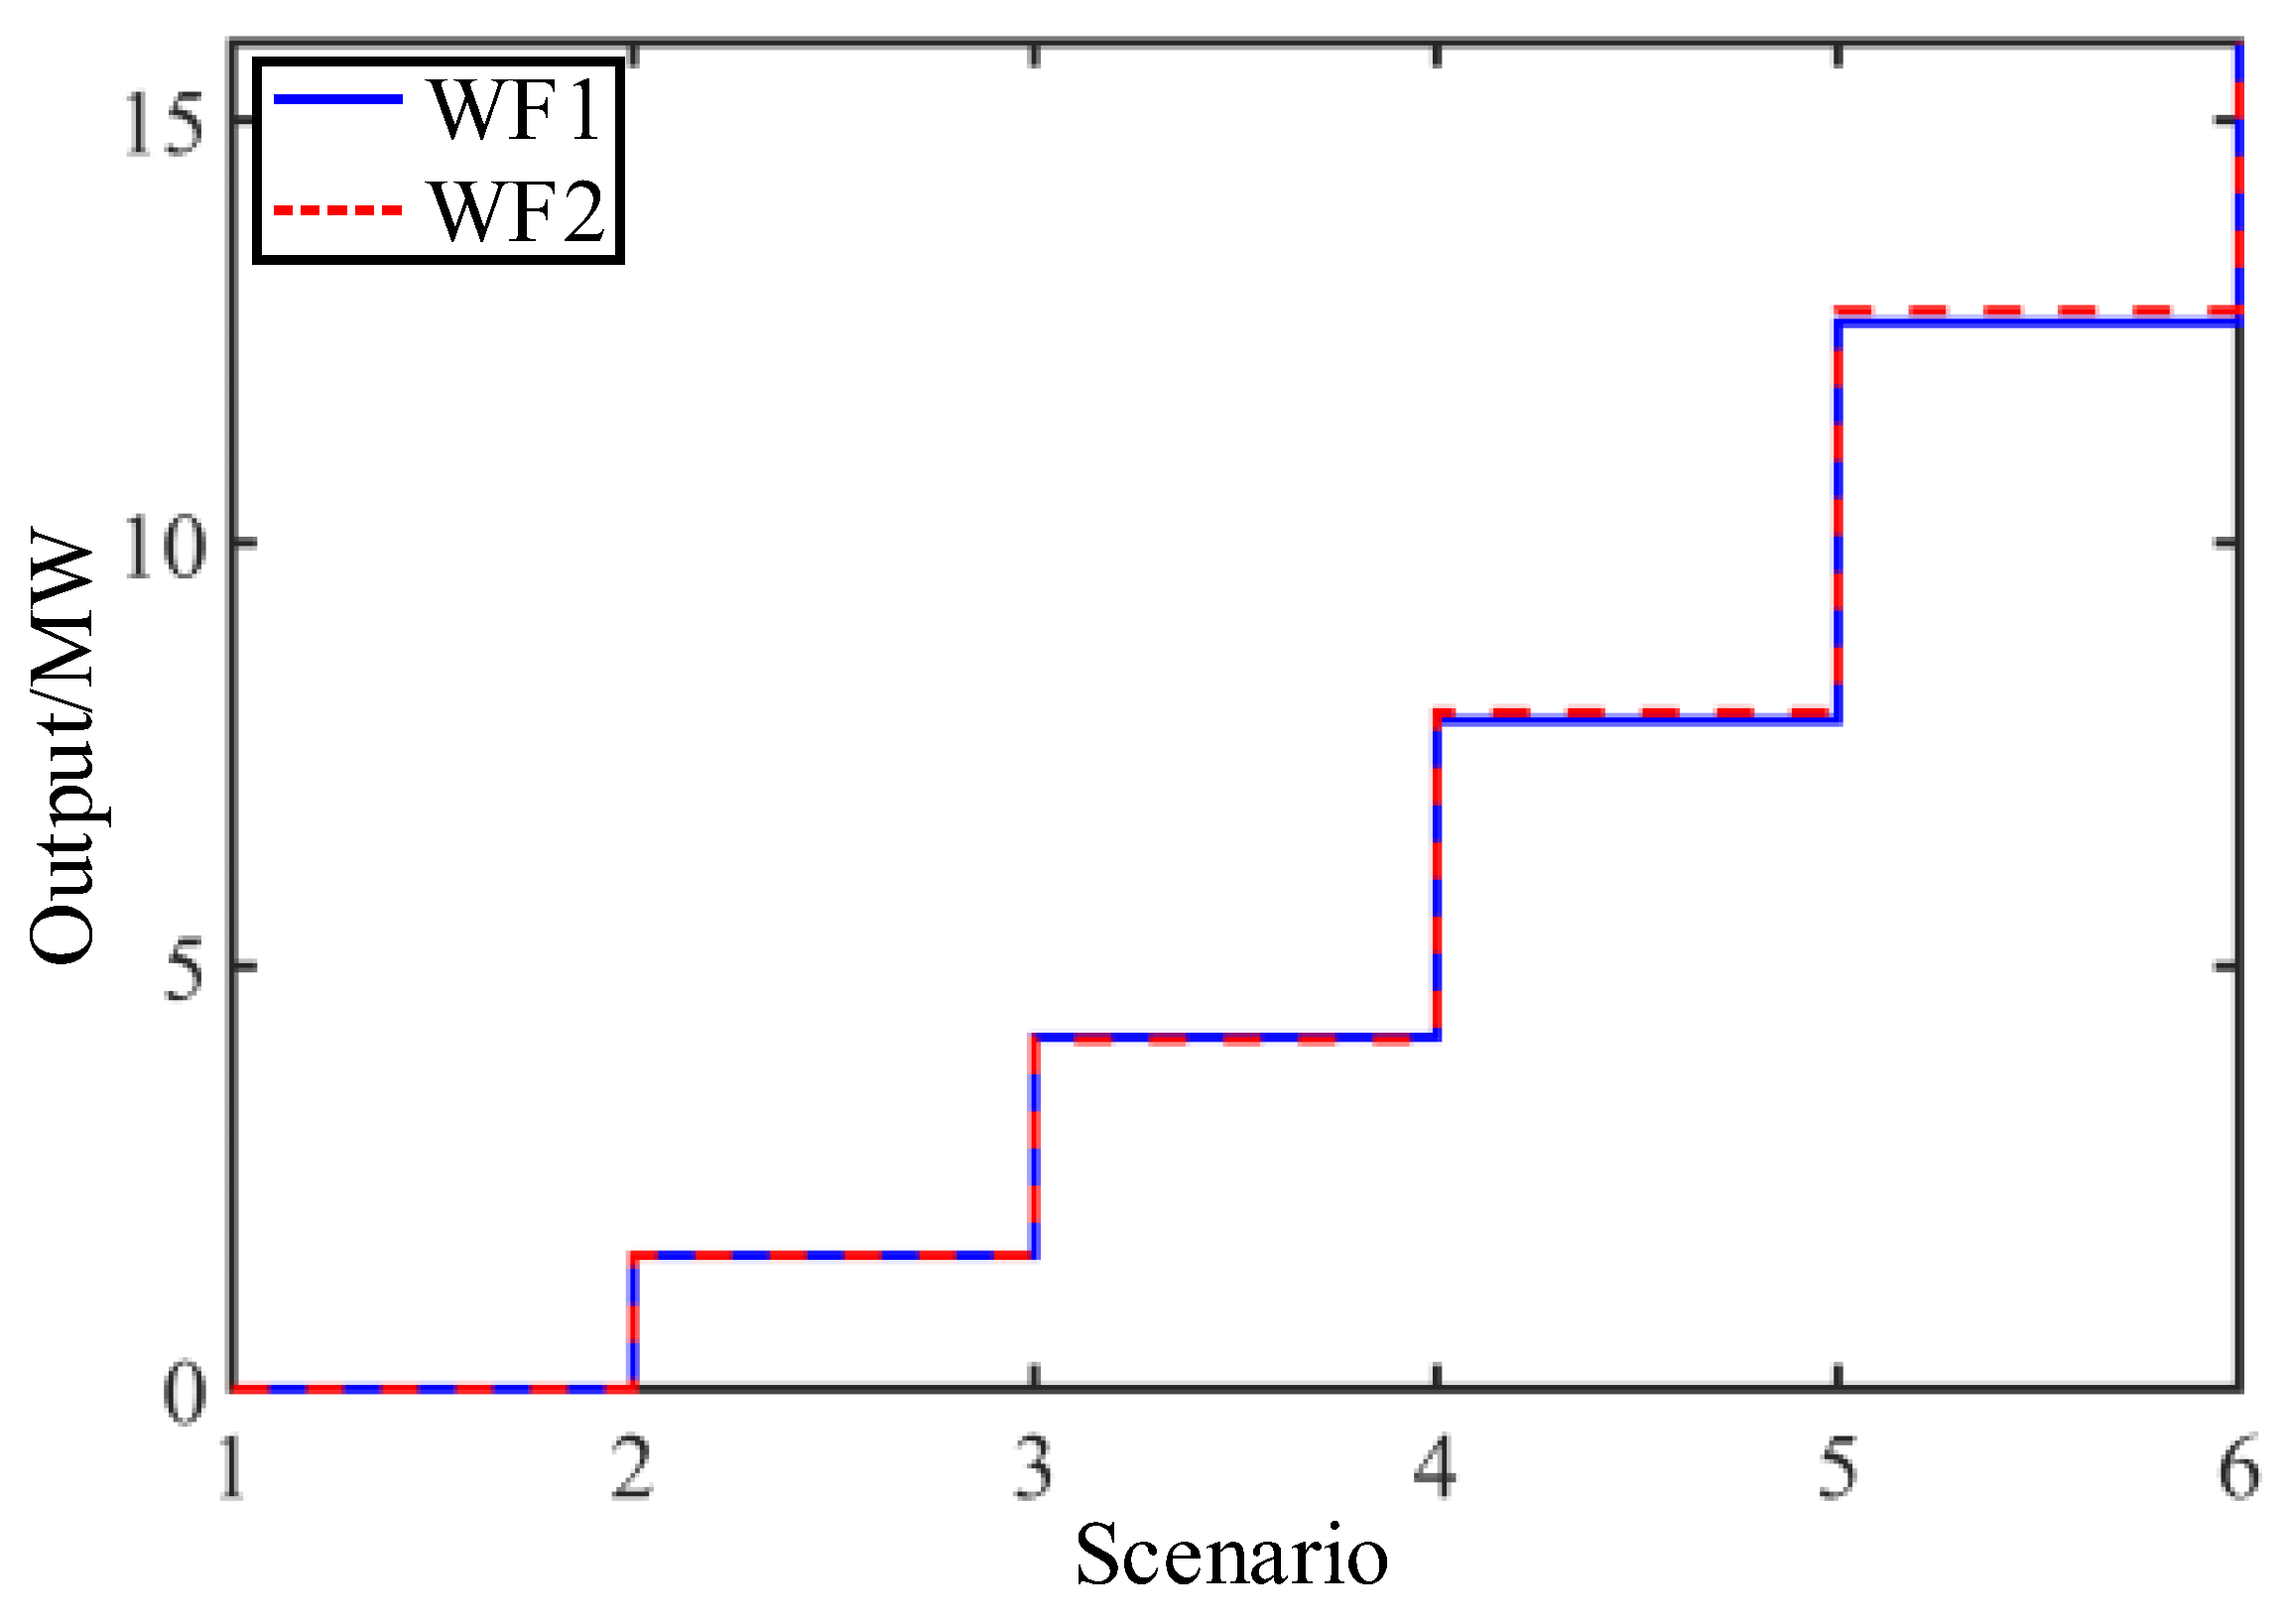
The generated scenarios shown in Figure 8 are substituted into the OPF-WS model one by one. For each scenario, the active power outputs of WF1 and WF2 are fixed according to the corresponding scenario values, and the conventional generator outputs are optimized by solving the OPF problem. The calculation results are summarized in Table 9.
Figure 8.
Generated wind power scenarios of WF1 and WF2.
Table 9.
Computing results.
From the calculation results in Table 8, it can be observed that the generated wind power scenarios have a direct influence on the optimal dispatching results of conventional generators. When the wind power output is low, as in Scenario 1, WF1 and WF2 only provide 0.0056 MW and 0.0088 MW, respectively. Under this condition, the conventional generators are required to supply more active power to satisfy the system load demand. For example, the outputs of G3, G5, and G6 reach 0.7584 p.u., 0.7485 p.u., and 0.2986 p.u., respectively.
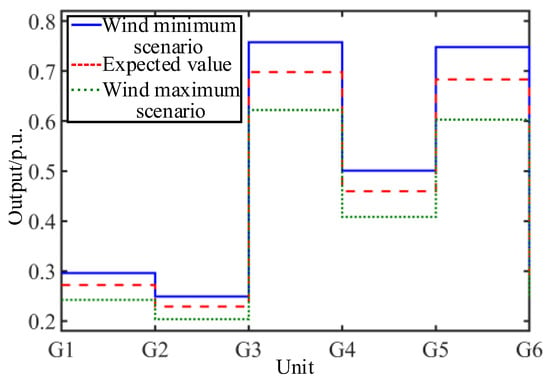
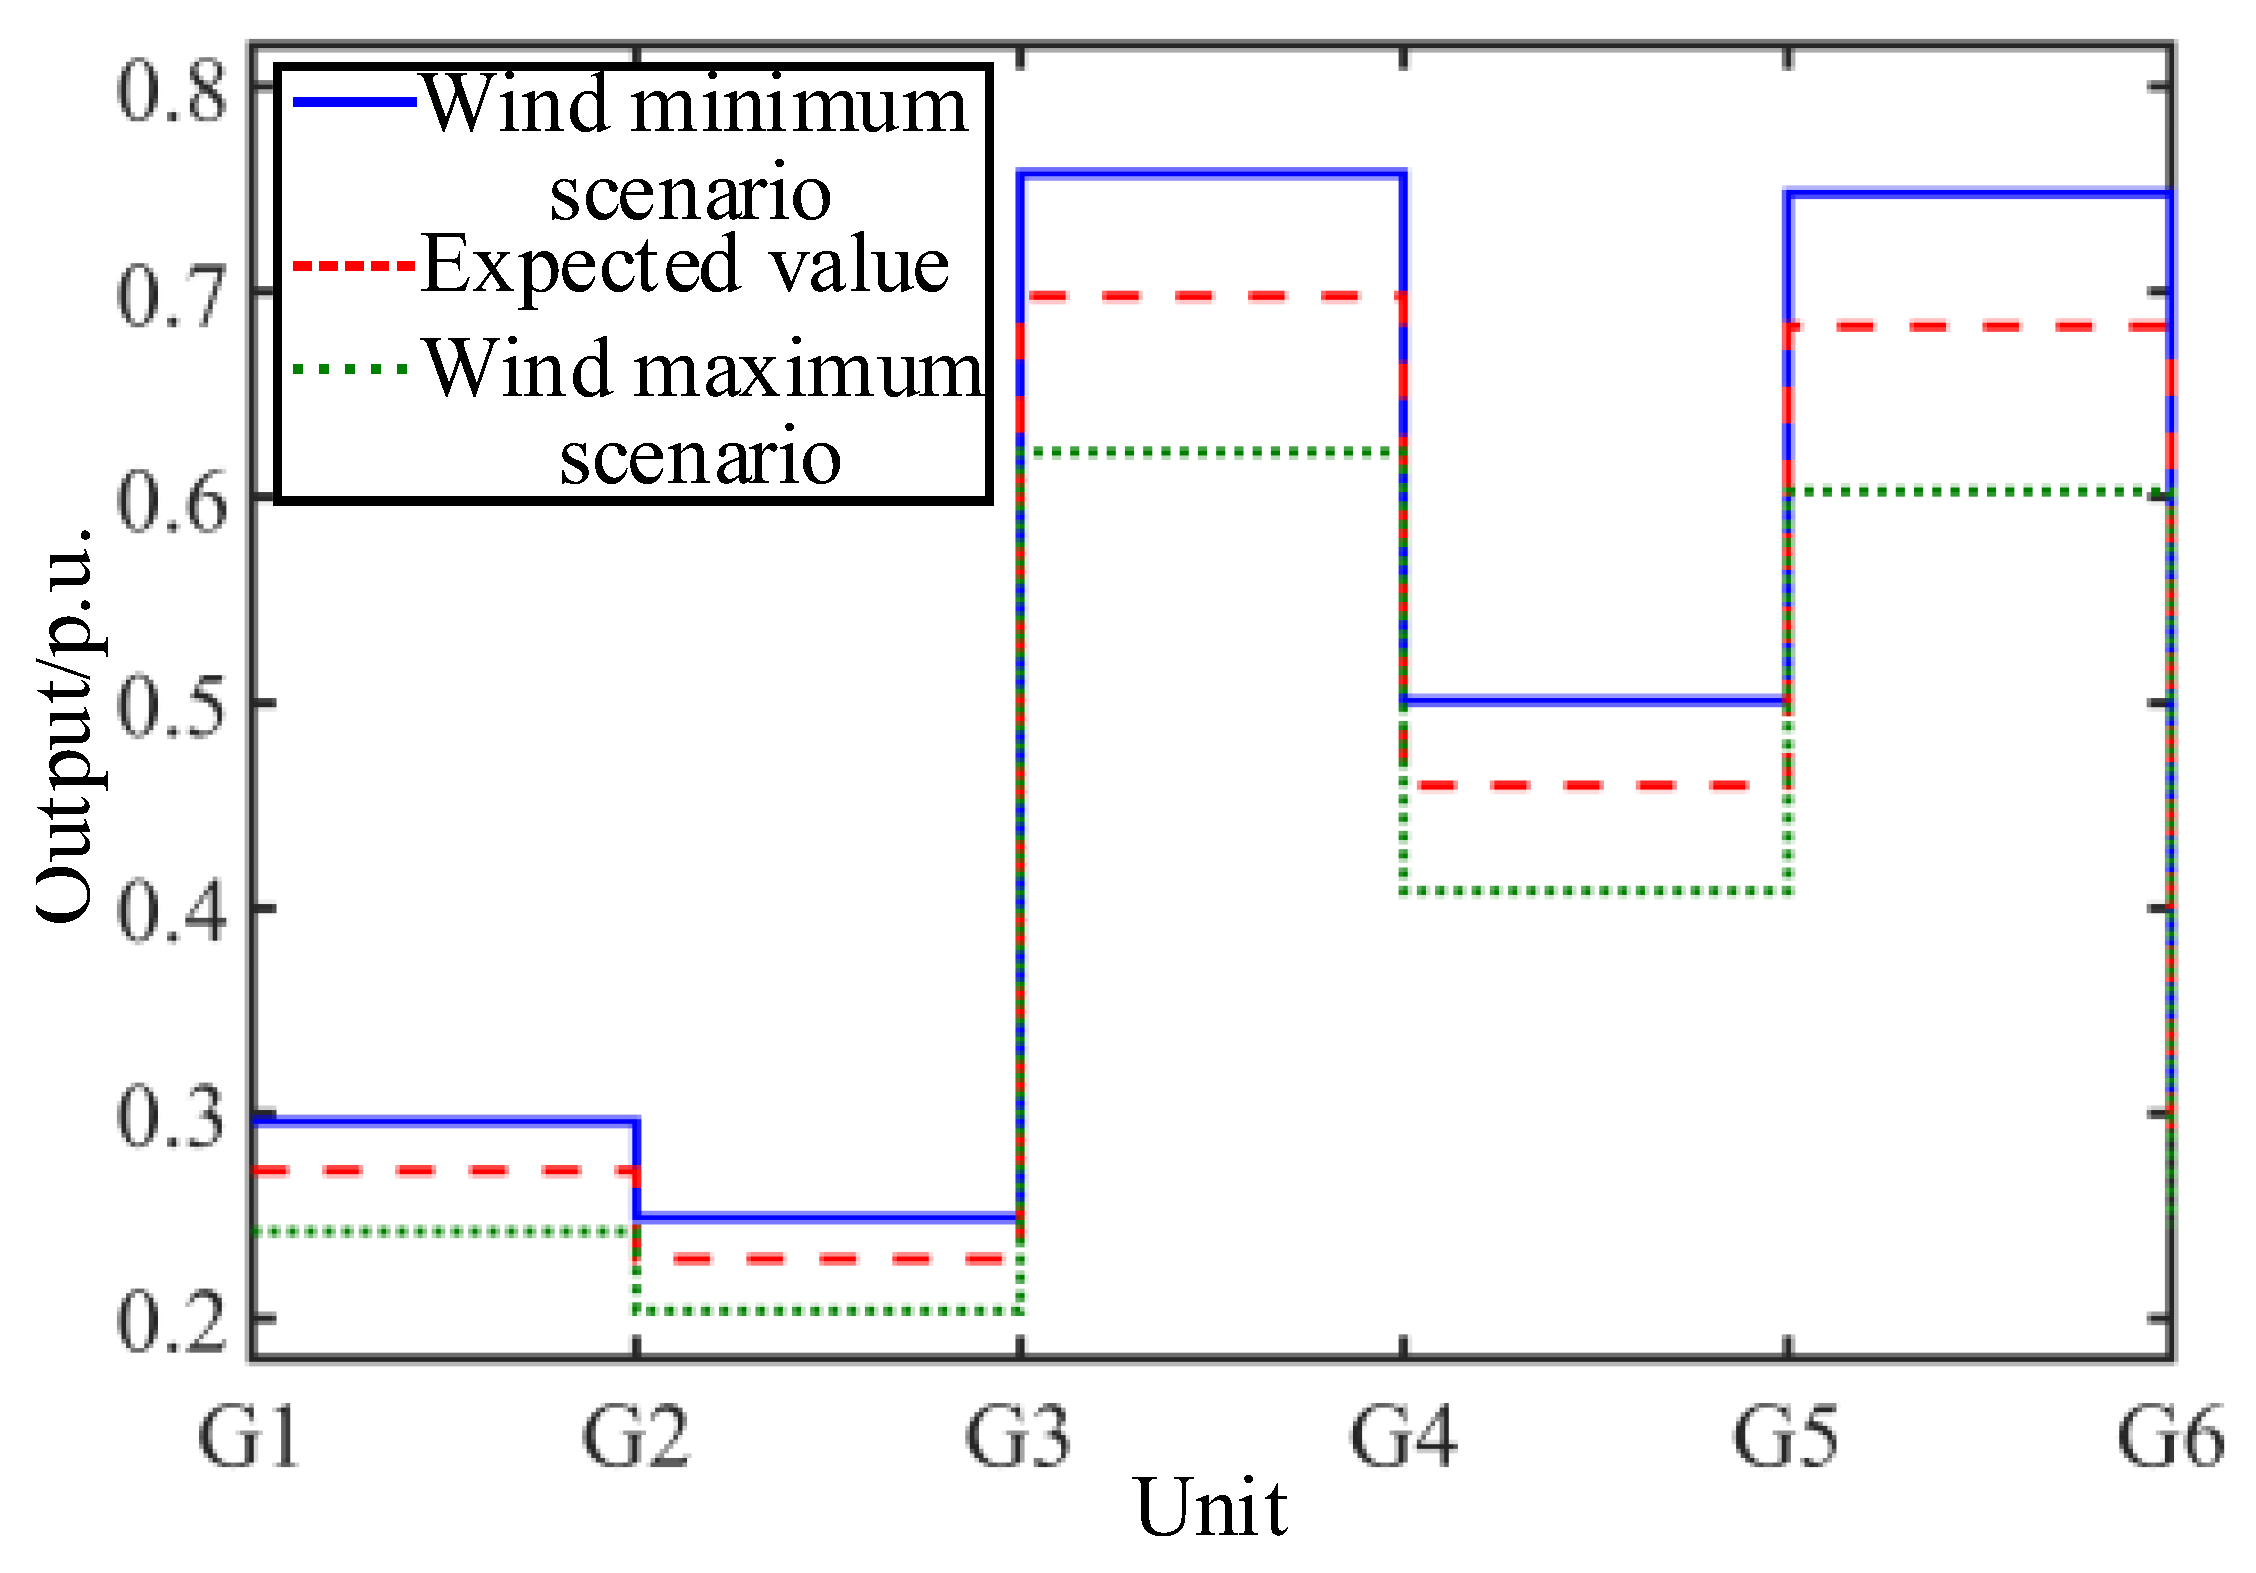
The Max and Min rows in Table 8 correspond to the maximum and minimum wind power output scenarios, respectively. It should be noted that the maximum wind power scenario leads to relatively lower conventional generator outputs, whereas the minimum wind power scenario requires higher conventional generator outputs. The expected output row E gives the probability-weighted average dispatching result under all generated scenarios. For instance, the expected outputs of G1, G3, and G5 are 0.2721 p.u., 0.6977 p.u., and 0.6837 p.u., respectively, while the expected wind power outputs of WF1 and WF2 are 7.0376 MW and 7.0761 MW.
Figure 9 further illustrates the dispatching variation in conventional generators under different wind power conditions. The generator outputs under the minimum wind power scenario are generally higher than those under the maximum wind power scenario, and the expected dispatching curve lies between these two boundary conditions. This result shows that the generated scenarios can effectively reflect the influence of wind power uncertainty on conventional unit dispatch.
Figure 9.
Unit output of each scene.
To further evaluate the practical value of the generated scenarios, several operational performance indicators are introduced in addition to the generator dispatch results. For the s-th wind power scenario, the total operating cost is calculated using the OPF objective function:
where PGi,s is the active power output of the i-th conventional generator under the s-th scenario. The total active network loss is calculated as:
where PWi,s is the wind power injection under the s-th scenario, and PDi is the active load at bus i. The wind power penetration ratio is defined as:
To describe the voltage profile and transmission loading condition, the voltage deviation index and maximum branch loading ratio are further defined as:
where NB is the number of buses, Ui,s is the voltage magnitude of bus i, Sl,s is the apparent power flow of branch l, and Slmax is the corresponding branch flow limit. The calculated operational performance indicators are summarized in Table 10.
Table 10.
Operational performance indicators under different wind power scenarios.
As shown in Table 10, the operating cost decreases as the total wind power output increases, which is consistent with the reduction in conventional generator output. However, the additional indicators provide more detailed operational information. The active network loss varies with the spatial distribution and magnitude of wind power injections, indicating that different wind power scenarios may lead to different power flow patterns. The wind power penetration ratio increases from low-output scenarios to high-output scenarios, while the voltage deviation index and maximum branch loading ratio remain within acceptable ranges. This demonstrates that the generated representative scenarios can be used not only to reflect the uncertainty of wind power output, but also to evaluate its influence on economic dispatch, network losses, voltage profiles, and transmission loading conditions.
From the perspective of stochastic operation, the expected-value row provides a probability-weighted assessment of system performance under the generated scenario set. Therefore, the proposed t-Copula-based scenario generation method can provide useful scenario inputs for OPF-WS analysis and support more comprehensive operational decision-making under wind power uncertainty.
Therefore, the t-Copula-based scenario generation method can provide representative wind power inputs for the OPF-WS model. By substituting the generated scenarios into the optimal power flow calculation, the uncertainty of WF1 and WF2 is transformed into a finite number of deterministic dispatching cases. This provides a practical basis for evaluating unit output adjustment, reserve requirements, and secure operation of power systems with two correlated wind farms.
6. Conclusions
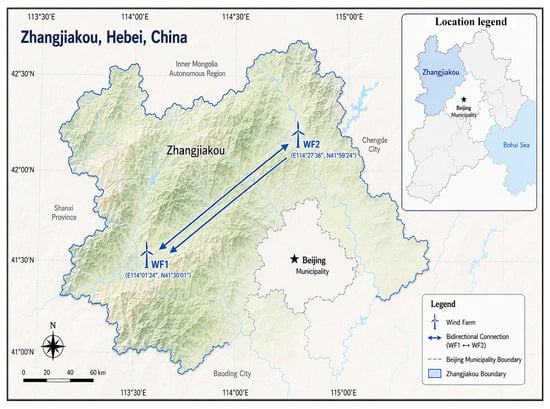
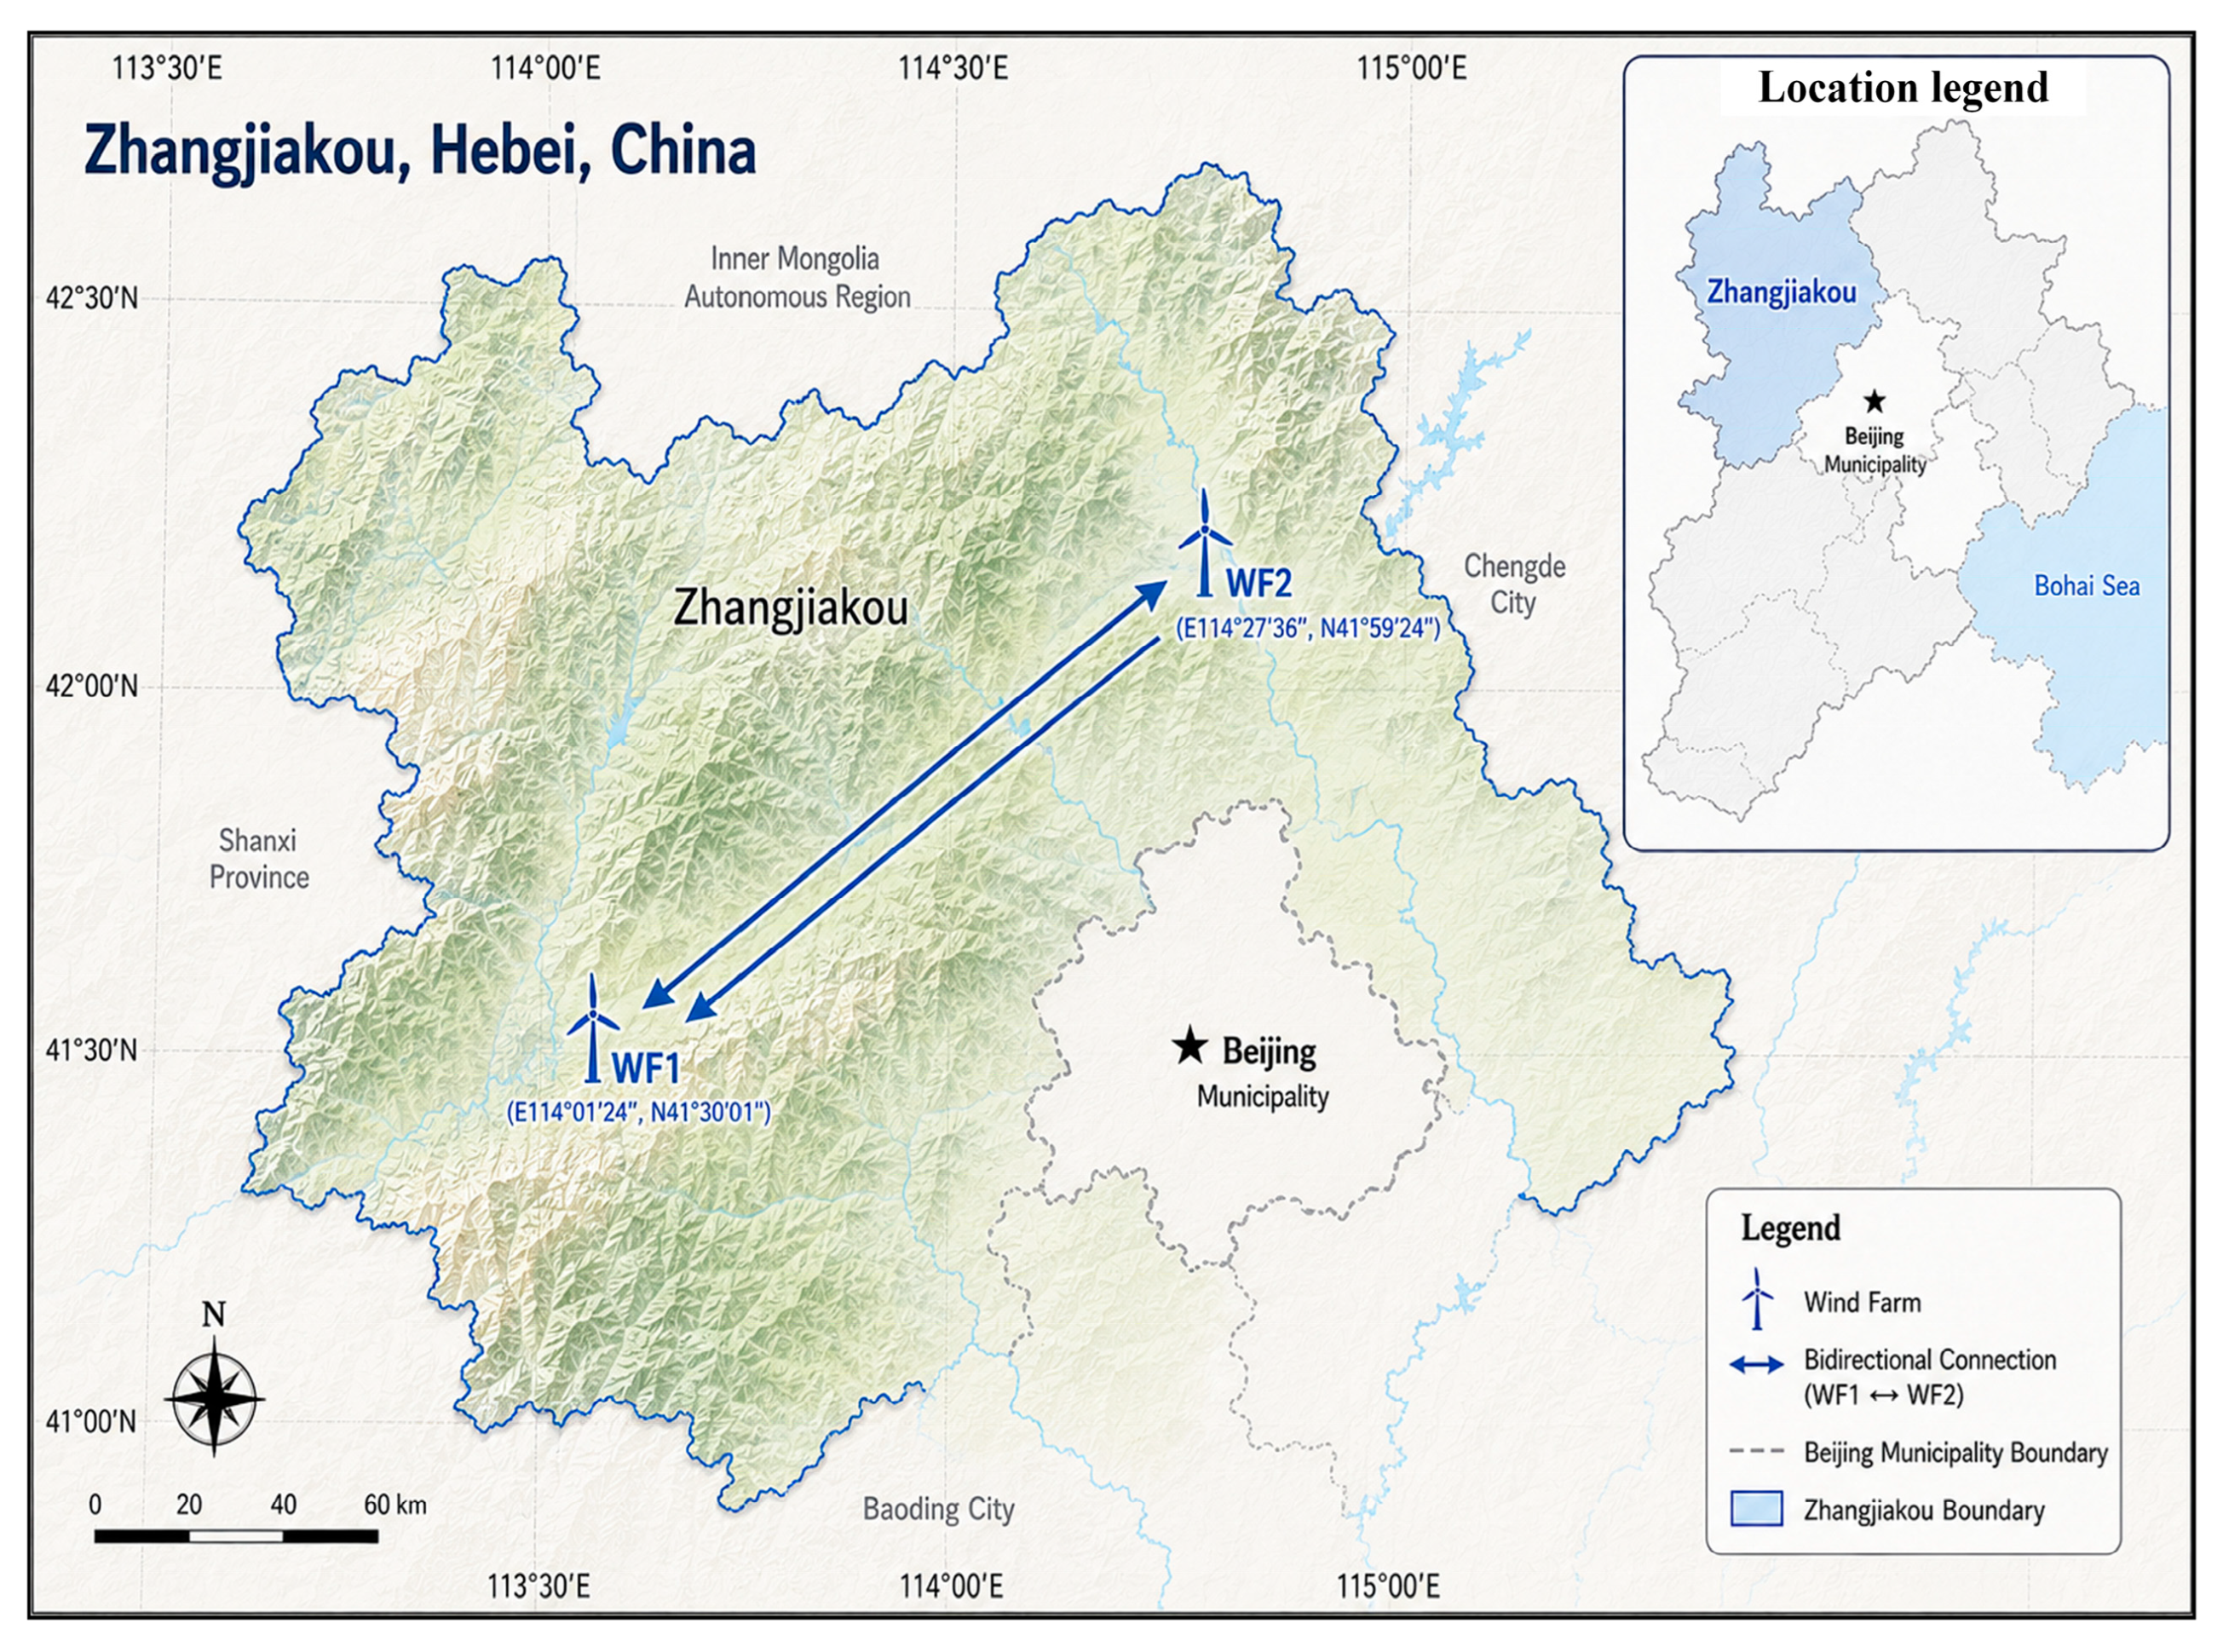
This paper proposes a Copula-based scenario generation method for two correlated wind farms’ output and applies it to stochastic operation analysis of power systems. Based on the measured output data of WF1 and WF2 in Zhangjiakou, northern Hebei, the marginal cumulative distribution functions are obtained through non-parametric estimation. Then, six Copula tools are compared to characterize the dependence structure between the two wind farms, including Gaussian Copula, t-Copula, Empirical Copula, Frank Copula, Clayton Copula, and Gumbel Copula.
The fitting results show that WF1 and WF2 have a strong positive dependence. Among the parametric Copula models, the Bivariate t-Copula achieves the smallest fitting distance from the Empirical Copula and shows good consistency in correlation, Spearman, and Kendall indicators. Therefore, the Bivariate t-Copula is selected as the preferred model for scenario generation. Based on the fitted t-Copula, random samples are generated in the Copula space and transformed into wind power output samples through inverse marginal distribution functions, from which a finite set of representative scenarios and corresponding probabilities are obtained.
The generated scenarios are further introduced into the OPF-WS model based on the IEEE 30-bus system. The calculation results show that different wind power scenarios directly affect the dispatching results of conventional generators. As wind power output increases, the required active power output of conventional units decreases accordingly. Therefore, the proposed t-Copula-based scenario generation method can provide representative wind power inputs for stochastic dispatch and support unit output adjustment, reserve assessment, and secure operation of power systems with two correlated wind farms.
Although the present study focuses on two adjacent wind farms and adopts a Bivariate t-Copula model, the proposed scenario-generation workflow provides a basis for higher-dimensional and spatio-temporal extensions. Future work will investigate multivariate t-Copulas, Vine Copulas, VARMA-Copula models, and deep generative approaches to model larger wind farm clusters with more complex spatial and temporal dependence structures. In addition, the generated scenarios can be further combined with detailed wind turbine and converter dynamic models to evaluate the robust responses of active power, reactive power, rotor speed, DC-link voltage, and terminal voltage under wind power and grid disturbances.
Author Contributions
Conceptualization, R.H., X.Y. and Y.D.; methodology, R.H., C.X. and W.Y.; software, R.H., X.Y. and C.X.; validation, R.H., Y.D. and W.Y.; formal analysis, X.Y., Y.D. and W.Z.; investigation, R.H., C.X. and W.Y.; resources, R.H. and X.Y.; data curation, R.H. and W.Z.; writing—original draft preparation, R.H., X.Y. and Y.D.; writing—review and editing, R.H., C.X. and W.Y.; visualization, R.H. and W.Z.; supervision, X.Y. and Y.D.; project administration, R.H. and W.Y.; funding acquisition, R.H. and X.Y. All authors have read and agreed to the published version of the manuscript.
Funding
This research was funded by the Research on Energy Storage and Reactive Power Compensation Configuration Methods and Control Strategies for New Energy Aggregation Stations, grant number EDRI-PS-ZLYJ-2025-104.
Data Availability Statement
The original contributions presented in this study are included in the article. Further inquiries can be directed to the corresponding authors.
Conflicts of Interest
Authors R.H., X.Y., Y.D., C.X., and W.Y. were employed by the company Energy Development Research Institute, CSG. The remaining authors declare that the research was conducted in the absence of any commercial or financial relationships that could be construed as a potential conflict of interest.
Appendix A. Parameters of the IEEE 30-Bus OPF-WS Test System
The detailed parameters of the IEEE 30-bus test system used in the OPF-WS case study are provided in this appendix to improve reproducibility. The system’s base capacity is 100 MVA. The two wind farms, WF1 and WF2, are connected to bus 10 and bus 20, respectively. The wind power outputs generated by the t-Copula-based scenario generation method are treated as active power injections in the OPF-WS model. The generation cost of wind farms is not considered in the objective function.
Table A1.
Active and reactive power limits of conventional generators.
Table A2.
Load and voltage-limit parameters of the IEEE 30-bus system.
Table A3.
Branch parameters and line-flow limits of the IEEE 30-bus system.
Table A4.
Generation cost coefficients of conventional generators.
Appendix B. Comparison of Representative Wind Power Scenario Generation Methods
Table A5.
Comparison of representative wind power scenario generation methods.
As shown in Table A5, different scenario generation methods have different applicable conditions. Vine Copula and VARMA-Copula models are advantageous for high-dimensional or spatio-temporal dependence modeling, while GAN-based and deep learning-based approaches are more suitable when sufficient training data and computational resources are available. The proposed framework does not aim to replace these methods in all application scenarios. Instead, it provides a simple, interpretable, and reproducible solution for two correlated wind farms, where the fitted t-Copula can capture strong dependence and symmetric tail dependence, and the generated representative scenarios can be directly used in OPF-WS analysis.
References
- Dahal, S.; Hegglid, G.J.; Kristiansen, J.; Chhetri, B.B.; Mishra, S.; Oyvang, T. Integrating multiple slack bus operations and metaheuristic techniques for power flow optimization. Sci. Rep. 2025, 15, 16821. [Google Scholar] [CrossRef] [Scilit] [PubMed]
- Jin, W.; Wang, P.; Yuan, J. Key role and optimization dispatch research of technical virtual power plants in the new energy era. Energies 2024, 17, 5796. [Google Scholar] [CrossRef] [Scilit]
- Zhan, Y.; Wang, L.; Xie, X. Wind power integration capacity analysis considering sub/super-synchronous oscillation stability constraint. IEEE Trans. Ind. Appl. 2025, 61, 2782–2790. [Google Scholar] [CrossRef] [Scilit]
- Carlucci, S.; Erba, S.; Pagliano, L.; de Dear, R. ASHRAE likelihood of dissatisfaction: A new right-here and right-now thermal comfort index for assessing the likelihood of dissatisfaction according to the ASHRAE adaptive comfort model. Energy Build. 2021, 250, 111286. [Google Scholar] [CrossRef] [Scilit]
- Liu, X. Economic load dispatch constrained by wind power availability: A wait-and-see approach. IEEE Trans. Smart Grid 2010, 1, 347–355. [Google Scholar] [CrossRef] [Scilit]
- Hooda, P.; Prakash, P. Enhanced risk-based strategy for microgrid market participation using three-stage stochastic optimization. J. Electr. Eng. Technol. 2025, 21, 315–336. [Google Scholar] [CrossRef] [Scilit]
- López-Garza, E.; Domínguez-Cruz, R.F.; Martell-Chávez, F.; Salgado-Tránsito, I. Fuzzy logic and linear programming-based power grid-enhanced economical dispatch for sustainable and stable grid operation in Eastern Mexico. Energies 2022, 15, 4069. [Google Scholar] [CrossRef] [Scilit]
- Shufian, A.; Shib, S.K.; Dipto, D.R.; Rahman, M.T.; Hannan, N.; Fattah, S.A. Fuzzy logic-controlled three-phase dynamic voltage restorer for enhancing voltage stabilization and power quality. Int. J. Electr. Power Energy Syst. 2025, 166, 110517. [Google Scholar] [CrossRef] [Scilit]
- Chen, Y.; Wang, D.; Li, J.; Fan, H.; Li, J.; Luo, D.; Li, L. A SSSC optimal configuration method to enhance available transfer capability considering multi-wind farm access. IET Renew. Power Gener. 2023, 17, 3777–3792. [Google Scholar] [CrossRef] [Scilit]
- Baas, P.; Verzijlbergh, R.; van Dorp, P.; Jonker, H. Investigating energy production and wake losses of multi-gigawatt offshore wind farms with atmospheric large-eddy simulation. Wind Energy Sci. 2023, 8, 787–805. [Google Scholar] [CrossRef] [Scilit]
- Al-Duais, F.S.; Al-Sharpi, R.S. A unique Markov chain Monte Carlo method for forecasting wind power utilizing time series model. Alex. Eng. J. 2023, 74, 51–63. [Google Scholar] [CrossRef] [Scilit]
- Abdoos, A.A.; Abdoos, H.; Kazemitabar, J.; Mobashsher, M.M.; Khaloo, H. An intelligent hybrid method based on Monte Carlo simulation for short-term probabilistic wind power prediction. Energy 2023, 278, 127914. [Google Scholar] [CrossRef] [Scilit]
- Shao, B.; Zhao, S.; Gao, B.; Yang, Y.; Blaabjerg, F. Adequacy of the single-generator equivalent model for stability analysis in wind farms with VSC-HVDC systems. IEEE Trans. Energy Convers. 2021, 36, 907–918. [Google Scholar] [CrossRef] [Scilit]
- Zhang, W.; Wang, Y.; Zeeshan, M.; Han, F.; Song, K. Super-twisting sliding mode control of grid-side inverters for wind power generation systems with parameter perturbation. Int. J. Electr. Power Energy Syst. 2025, 165, 110501. [Google Scholar] [CrossRef] [Scilit]
- Silveira, F.V.J.; Gomes-Silva, F.; de Brito, C.R.; Jale, J.S.; de Gusmao, F.R.S.; Xavier, S.F.A., Jr.; Rocha, J.S. Modelling wind speed with a univariate probability distribution depending on two baseline functions. Hacet. J. Math. Stat. 2023, 52, 808–827. [Google Scholar] [CrossRef] [Scilit]
- Sharma, K.C.; Gupta, A.; Bhakar, R. Wind power scenario generation considering spatiotemporal correlations: A distribution free hybrid VARMA-Copula approach. Smart Grids Sustain. Energy 2023, 8, 17. [Google Scholar] [CrossRef] [Scilit]
- Zhang, J.; Guo, Y.; Dong, Y.; Bastidas-Arteaga, E. Coupling aerodynamic wake effects with corrosion-fatigue degradation for system-level reliability assessment of floating offshore wind farms. Renew. Energy 2026, 269, 125884. [Google Scholar]
- Zhu, X.; Xiao, H.; Zhu, L.; Li, Y.; Gao, X.; Sun, Q.; Wang, H. A graph neural model for predicting wind speed behavior based on the effect of wind speed point coupling. Energy 2025, 336, 138174. [Google Scholar] [CrossRef] [Scilit]
- Wang, X.; Zhou, J.S.; Qin, B.; Guo, L.Z. Coordinated power smoothing control strategy of multi-wind turbines and energy storage systems in wind farm based on MADRL. IEEE Trans. Sustain. Energy 2024, 15, 368–380. [Google Scholar] [CrossRef] [Scilit]
- Zhang, D.; Xie, X.; Hao, Z.; Liu, W.; Han, X.; Li, Q. A regular-vine copula-based evidence theory model for structural reliability analysis involving multidimensional parameter correlation. Comput. Meth. Appl. Mech. Eng. 2025, 444, 118152. [Google Scholar] [CrossRef] [Scilit]
- Song, C.; Yuan, Y.; Dai, L. Distributionally robust optimization of virtual power plant bidding strategies considering discrete scenario-based uncertainties in day-ahead market prices and wind powers. Electr. Power Syst. Res. 2025, 248, 111977. [Google Scholar] [CrossRef] [Scilit]
- Ye, L.; Peng, Y.S.; Li, Y.L.; Li, Z. A novel informer-time-series generative adversarial networks for day-ahead scenario generation of wind power. Appl. Energy 2024, 364, 123182. [Google Scholar] [CrossRef] [Scilit]
- Zhang, Z.; Sun, Z.; Guo, H.; Guo, P.; Yang, X.; Yang, P. Short-term multi-step wind power prediction model based on Pt-Transformer neural network integrating spatio-temporal feature and sparse attention. Electr. Power Syst. Res. 2025, 248, 111970. [Google Scholar] [CrossRef] [Scilit]
- Zhang, H.; Zandehshahvar, R.; Tanneau, M.; Van Hentenryck, P. Weather-informed probabilistic forecasting and scenario generation in power systems. Appl. Energy 2025, 384, 125369. [Google Scholar] [CrossRef] [Scilit]
- Tan, J.; Zhang, J.; Liu, H.; Lan, B. A high dimensional uncertain scenario generating method for wind power and photovoltaic considering spatiotemporal correlation. Energy 2025, 340, 139224. [Google Scholar] [CrossRef] [Scilit]
- Zhao, W.; Shao, Z.; Yang, S.; Lu, X. A novel conditional diffusion model for joint source-load scenario generation considering both diversity and controllability. Appl. Energy 2025, 377, 124555. [Google Scholar] [CrossRef] [Scilit]
- Dong, X.; Sun, Y.; Yang, Y.; Mao, Z. Controllable renewable energy scenario generation based on pattern-guided diffusion models. Appl. Energy 2025, 398, 126446. [Google Scholar] [CrossRef] [Scilit]
- Kuschinski, N.; Jara, A. Grid-uniform copulas and rectangle exchanges: Bayesian model and inference for a rich class of copula functions. Bayesian Anal. 2025, 20, 1357–1384. [Google Scholar] [CrossRef] [Scilit]
- Bai, Z.; Wei, H.; Xiao, Y.; Song, S.; Kucherenko, S. A vine copula-based global sensitivity analysis method for structures with multidimensional dependent variables. Mathematics 2021, 9, 2489. [Google Scholar] [CrossRef] [Scilit]
- Ansari, J.; Rüschendorf, L. Sklar’s theorem, copula products, and ordering results in factor models. Depend. Model. 2021, 9, 267–306. [Google Scholar] [CrossRef] [Scilit]
- Li, Q.; Ni, P.H.; Du, X.L.; Han, Q. Bayesian model updating with variational inference and Gaussian copula model. Comput. Methods Appl. Mech. Eng. 2025, 438, 117842. [Google Scholar] [CrossRef] [Scilit]
- Wang, Z.Y.; Dong, Z.L. How does the time-varying network structure evolve between the EU carbon futures prices and industrial and energy-related indices? A study based on a time-varying t-copula. Int. J. Energy Res. 2023, 2023, 6696059. [Google Scholar] [CrossRef] [Scilit]
- Sreekumar, S.; Sharma, K.C.; Bhakar, R. Gumbel copula based aggregated net load forecasting for modern power systems. IET Gener. Transm. Distrib. 2018, 12, 4348–4358. [Google Scholar] [CrossRef] [Scilit]
- Adu-Ntim, J.K.; Omari-Sasu, A.Y.; Boateng, M.A.; Mensah, I.A. A novel bivariate regression model derived from the Clayton copula and the Odd Dagum-G family and its application. Sci. Afr. 2025, 28, e02761. [Google Scholar] [CrossRef] [Scilit]
- Lin, S.F.; Liu, C.T.; Shen, Y.W.; Li, F.X.; Li, D.D.; Fu, Y. Stochastic planning of integrated energy system via Frank-Copula function and scenario reduction. IEEE Trans. Smart Grid 2022, 13, 202–212. [Google Scholar] [CrossRef] [Scilit]
- Inan, G.E. Parameter estimation for doubly geometric process with inverse Gaussian distribution and its applications. Fluct. Noise Lett. 2025, 24, 4. [Google Scholar] [CrossRef] [Scilit]
- Bücher, A.; Pakzad, C. The empirical copula process in high dimensions: Stute’s representation and applications. Ann. Stat. 2025, 53, 2462–2487. [Google Scholar] [CrossRef] [Scilit]

Disclaimer/Publisher’s Note: The statements, opinions and data contained in all publications are solely those of the individual author(s) and contributor(s) and not of MDPI and/or the editor(s). MDPI and/or the editor(s) disclaim responsibility for any injury to people or property resulting from any ideas, methods, instructions or products referred to in the content. |
© 2026 by the authors. Licensee MDPI, Basel, Switzerland. This article is an open access article distributed under the terms and conditions of the Creative Commons Attribution (CC BY) license.