


Abstract
Salt precipitation and pore clogging near CO2 injection wells can reduce injectivity during geological storage in saline formations; yet, the combined effects of CO2 phase state, flow rate, and humidity remain insufficiently resolved at the core scale. This study investigated CO2-induced pore-structure alteration in brine-saturated artificial sandstone containing shale/clay interbeds and carbonate cementation. Eight CO2 core-flooding experiments were conducted under controlled phase-state, flow-rate, and humidity conditions, and each core was imaged before and after displacement using X-ray CT. Pressure response, apparent flow resistance, CT-derived porosity change, and salt-enriched phase distribution were evaluated. CO2 flooding caused substantial porosity loss in all tests. In the phase-state series, porosity reductions ranged from 40.75% to 50.21%, with the largest reduction under supercritical CO2. In the flow-rate series, the largest porosity reduction was 56.52%, whereas the highest apparent flow resistance occurred at the lowest flow rate. The humidity comparison showed the strongest contrast: dry supercritical CO2 reduced porosity by 46.45%, whereas wet supercritical CO2 reduced it by only 15.68%. These results indicate that CO2 humidity strongly controls pore-volume preservation and that humidified CO2 can mitigate evaporation-driven salt-related injectivity impairment.
1. Introduction
Geological CO2 storage in deep saline aquifers is a major route for large-scale carbon management and is widely recognized as an effective strategy for reducing anthropogenic CO2 emissions [1,2,3]. However, its feasibility is controlled not only by storage capacity and containment security, but also by sustainable well injectivity [4]. Injectivity is particularly sensitive to near-wellbore alteration because even localized permeability impairment around the injection interval can increase pressure buildup and reduce the achievable CO2 injection rate. Among the physical and geochemical processes that may impair injectivity, salt precipitation during dry or undersaturated CO2 injection has been identified as one of the most critical and least straightforward mechanisms [5]. When dry CO2 flows through a brine-saturated porous medium, water can evaporate from the resident brine into the CO2-rich phase. As evaporation proceeds, the brine becomes progressively more saline until dissolved salts exceed their solubility limit and precipitate within the pore space. The resulting halite or salt-enriched deposits can reduce pore volume, restrict pore throats, and decrease permeability near the injection well. Numerical studies have shown that this process is governed by coupled displacement, evaporation, capillary backflow, molecular diffusion, and salt precipitation, and that mitigation may be possible through pre-flushing or by reducing the evaporative capacity of the injected CO2 stream [6,7].
The severity of salt-induced injectivity impairment remains debated because precipitation does not depend only on the amount of salt available, but also on where the precipitate forms within the pore network. Giorgis et al. showed that halite precipitation may have minor effects when brine mobility is low, whereas mobile brine can recharge the evaporation front through capillary pressure gradients and generate localized permeability loss near the wellbore [8]. Peysson et al. experimentally demonstrated that drying, capillary forces, and rock permeability control water-saturation evolution and salt deposition during gas injection into brine-saturated sandstones [9]. These studies indicate that the same apparent porosity reduction may produce different hydraulic consequences depending on pore-throat blockage and connected-flow-path alteration.
Recent pore-scale and micromodel studies have further shown that CO2 phase state, injection rate, and surface properties can significantly alter the morphology and distribution of salt deposits. Nooraiepour et al. demonstrated that CO2 phase state and flow rate influence salt accumulation patterns in fractured shale micromodels, with micrometer-scale halite crystals capable of partially or completely clogging fracture apertures [10]. He et al. showed that injection rate and wettability jointly control whether salt precipitates as severe ex situ blockage or as more distributed in situ deposits, with higher flow rates potentially suppressing capillary reflow under certain conditions [11]. However, the effect of flow rate remains non-unique: higher flow may reduce capillary backflow, but it may also increase evaporation intensity and redistribute salt over a broader domain [4,10].
X-ray micro-computed tomography has become essential for resolving these pore-scale mechanisms in real rock samples. Akindipe et al. used micro-CT imaging to identify stages of evaporative drying and showed that CO2 injection rate and rock heterogeneity influence the timing, extent, and spatial pattern of salt precipitation in sandstone and carbonate rocks [11]. Ott et al. further demonstrated that multi-porosity rocks can experience much stronger permeability impairment than well-sorted sandstones because capillary-driven transport can move brine from micro- to macro-porous regions, causing salt to precipitate in CO2-conductive flow paths [12]. At the field scale, Guyant et al. showed that permeability structure and well-completion design influence brine flux, pressure buildup, and whether salt precipitation becomes localized or distributed around the injection interval [13].
CO2 humidity has recently received renewed attention as a possible strategy to mitigate salt precipitation. If the injected CO2 is partially or fully saturated with water, its capacity to evaporate formation brine is reduced, suppressing the salinity increase that drives halite precipitation. Papi et al. proposed a dissolved-water CO2 injection and showed numerically that water-saturated CO2 could reduce salt precipitation nearly to zero, while CO2 containing 2000 ppmv dissolved water reduced precipitation to approximately one-third of the dry-CO2 case [14]. Nevertheless, humid CO2 injection introduces operational challenges, including corrosion, hydrate formation, and water-dropout risks, so the pore-scale benefit of humidity control must be evaluated against flow-assurance constraints.
Despite these advances, there remains a need for controlled core-scale experiments that jointly evaluate CO2 phase state, injection flow rate, and CO2 humidity while directly linking pressure response to CT-resolved pore-structure alteration. Existing studies often isolate one factor, use micromodels rather than rock-like porous media, or focus on numerical prediction without direct pre- and post-displacement pore-volume comparison. In particular, fewer studies have examined how dry and wet CO2 affect salt-related pore clogging in heterogeneous carbonate-cemented sandstone analogues representative of near-wellbore reservoir conditions.
This study addresses this gap using controlled CO2–brine core-flooding experiments combined with pre- and post-displacement CT imaging. Artificial sandstone cores with carbonate cementation and shale/clay interbeds were used as controlled heterogeneous porous media. The main objective was to evaluate how CO2 phase state, injection flow rate, and CO2 humidity affect pore-structure alteration, salt-enriched phase distribution, pressure response, and apparent flow resistance during CO2 injection into brine-saturated sandstone. Specifically, the study aimed to link hydraulic measurements with CT-derived pore-scale observations in order to improve understanding of salt-related injectivity impairment under controlled laboratory conditions.
2. Materials and Methods
2.1. Experiment Design
The experimental program was designed to investigate salt-related pore clogging, pore-structure alteration, and injectivity impairment during CO2 injection into brine-saturated artificial sandstone. The study combined controlled CO2–brine coreflooding with pre- and post-displacement X-ray computed tomography (CT), enabling both the hydraulic response and the internal pore-scale alteration of each core to be evaluated before and after CO2 exposure.
The experimental design focused on three controlling variables: CO2 phase state, injection flow rate, and CO2 humidity. Tests A1–A3 evaluated phase-state effects, tests B1–B3 evaluated flow-rate effects under supercritical dry CO2, and tests C–D isolated the effect of CO2 humidity under otherwise comparable supercritical conditions, as summarized in Table 1. The detailed operating conditions for the phase-state experiments are summarized in Table 2.
Table 1.
Experimental design matrix.
Table 2.
Experimental conditions for the CO2 phase-state experiments.
A total of nine artificial sandstone cores were prepared for the experimental program. Eight cores were assigned to CO2 injection tests, whereas one core was retained as a backup sample. Each flooded core was subjected to CT scanning before and after CO2 displacement, resulting in sixteen CT datasets. The main objectives of the experimental design were to visualize the spatial distribution of salt precipitation within the core volume, quantify changes in pore structure and flow capacity before and after coreflooding, and evaluate the relationship between pore clogging geometry and injectivity reduction.
2.2. Artificial Sandstone Core Samples
Laboratory-fabricated artificial sandstone cores were used as controlled and repeatable porous media for the CO2–brine core-flooding experiments. The samples were designed as simplified sandstone analogues rather than direct replicas of a specific reservoir rock. According to the experimental report, the artificial cores were prepared to reproduce the heterogeneous characteristics of sandstone containing shale/clay thin interbeds and carbonate cementation. This design was selected to provide a controllable pore system in which salt precipitation, CO2–brine–rock interaction, and pore-structure alteration could be compared under different CO2 phase-state, flow-rate, and humidity conditions.
The cores consisted of a sandstone framework with alternating shale/clay-rich layers and carbonate cementation. The carbonate-cemented component was included because carbonate cement can react with CO2-acidified brine, whereas the shale/clay-rich interbeds introduce heterogeneity similar to that encountered in layered sandstone reservoirs. The samples therefore represent high-permeability heterogeneous sandstone analogues suitable for comparative laboratory analysis. However, because the exact mineral mass fractions and grain-size distribution were not available from the fabrication report, the results are interpreted as controlled core-scale evidence for artificial sandstone analogues and should not be treated as direct field-scale predictions for a specific reservoir lithology.
All cores were machined into standard cylindrical plugs with a diameter of 25 mm and a length of 50 mm. The end faces were ground to improve parallelism, ensure reliable sealing in the core holder, and improve repeatability during axial flow experiments. The geometric bulk volume of each core was approximately 24.54 cm3. A total of nine cores were prepared: eight cores were used for CO2 displacement experiments, and one core was retained as a backup sample.
The core set was divided into three petrophysical groups. Group A was used for the CO2 phase-state experiments and had a nominal permeability of 1500 mD and porosity of 28%. Group B was used for the flow-rate experiments and had a nominal permeability of 1200 mD and porosity of 25%. Groups C and D were used for the humidity comparison experiments and had a nominal permeability of 1000 mD and porosity of 22%. Based on the bulk volume and nominal porosity values, the corresponding pore volumes were approximately 6.87 cm3 for the 28% porosity cores, 6.14 cm3 for the 25% porosity cores, and 5.40 cm3 for the 22% porosity cores.
The use of artificial cores provided high inter-sample consistency in geometry, bedding structure, and target petrophysical properties. This enabled the effects of CO2 phase state, injection flow rate, and humidity to be isolated more clearly than would be possible with highly variable natural rock samples. At the same time, the analogue nature of the samples is acknowledged as a limitation: the experiments reproduce selected hydraulic and textural features of heterogeneous sandstone, but they do not fully capture the mineralogical complexity, grain-size distribution, and diagenetic variability of natural reservoir rocks.
2.3. Experimental Equipment and Analytical Software
The CO2–brine displacement experiments were conducted using a high-temperature and high-pressure core-flooding system coupled with pre- and post-displacement CT imaging. The major experimental equipment and analytical tools are summarized in Table 3. The system was configured to control CO2 injection pressure, back pressure, flow rate, temperature, and humidity state, while CT imaging and tomographic software were used to characterize internal pore-structure alteration after flooding.
Table 3.
Experimental equipment and analytical tools.
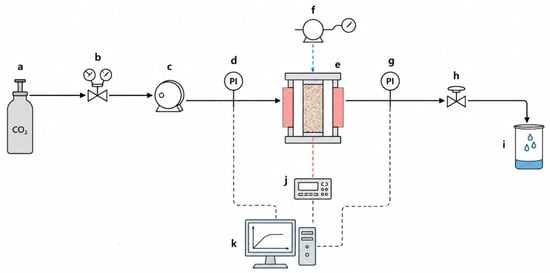
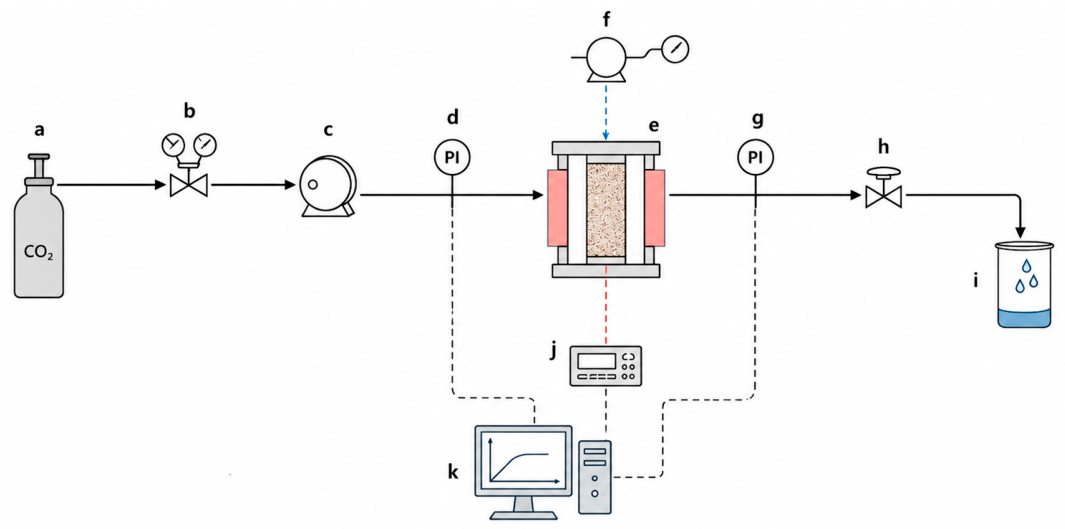
The schematic configuration of the high-pressure CO2–brine core-flooding system is shown in Figure 1. The apparatus consisted of a high-precision injection pump, a back-pressure pump, a cylindrical core holder, a confining-pressure pump, a back-pressure valve, a six-port valve, and high-pressure flow lines. The injection pump delivered CO2 to the upstream end of the core at controlled flow rates, whereas the back-pressure pump and back-pressure valve maintained stable downstream pressure and helped preserve the prescribed CO2 phase state during displacement. The core holder accommodated the cylindrical sandstone plug and enabled axial flow through the sample. The confining-pressure pump applied radial pressure to the core-holder sleeve to ensure sealing and simulate in situ stress conditions.
Figure 1.
Schematic diagram of the high-pressure CO2–brine core-flooding system used in this study. The experimental setup consists of (a) CO2 cylinder, (b) pressure regulator, (c) high-precision injection pump, (d) inlet pressure transducer, (e) heated core holder, (f) confining-pressure pump, (g) outlet pressure transducer, (h) back-pressure regulator, (i) effluent collector, (j) temperature controller, and (k) data acquisition system. Solid lines indicate the CO2 flow path, blue dashed line denotes confining-pressure connection, red dashed line denotes temperature control, and black dashed lines indicate signal and data connection.
The flow system was assembled using 1/8-inch stainless-steel capillary tubing and CO2/brine-resistant high-pressure hoses. Compression fittings, filters, check valves, and pressure and temperature sensors were installed to ensure stable operation and real-time monitoring. Heating or insulation jackets were used where necessary to reduce dead-volume effects and prevent condensation during high-pressure and high-temperature operation.
CT imaging was performed using a micro-CT scanner. The CT setup consisted of an X-ray source, a sample stage, and an X-ray detector. For the sandstone cores used in this study, the reported scanning resolution was 14.79 μm.
Tomographic reconstruction and image analysis were performed using a combination of specialized software packages. Avizo 2023.1 (Thermo Fisher Scientific, Waltham, MA, USA) was used as the primary platform for three-dimensional volume visualization, region-of-interest (ROI) selection, grayscale filtering, threshold segmentation, pore-space extraction, digital rock reconstruction, Boolean comparison, and CT observation porosity calculation. VGStudio MAX 2023.2 (Volume Graphics GmbH, Heidelberg, Germany) was used to verify reconstructed CT volumes and inspect internal structural continuity. Dragonfly 2022.2 (Object Research Systems (ORS) Inc., Montreal, QC, Canada) was employed for three-dimensional rendering and qualitative visualization of pore-space and salt-enriched phase distributions. ImageJ 1.54 (National Institutes of Health, Bethesda, MD, USA) was used for two-dimensional image inspection and grayscale histogram evaluation during threshold optimization. MATLAB R2023b (MathWorks Inc., Natick, MA, USA) was used for data processing, quantitative analysis, and preparation of plots derived from the CT and pressure datasets.
2.4. Core Preparation and Brine Saturation
Before CO2 displacement, all artificial sandstone cores were prepared using the same drying, loading, vacuuming, and brine-saturation procedure to ensure comparable initial conditions among the tests. The core end faces were ground before the experiment to improve parallelism, promote reliable sealing in the core holder, and reduce end-effect artifacts during axial flow.
The cores were first dried at 60 °C to constant weight and then cooled to room temperature. After drying, each core was loaded into the cylindrical core holder described in Section 2.3. Radial confinement was applied through the confining-pressure system to ensure sleeve sealing and prevent bypass flow along the core surface. The confining pressure was maintained above the pore pressure during saturation and displacement.
After loading, the core was evacuated for at least 4 h to remove air from the pore space. Brine saturation was then performed by injecting 6000 ppm NaCl solution from the downstream end of the core following at least 4 h of vacuum evacuation. Reverse saturation was adopted to improve brine invasion into the pore network and minimize trapped gas. Saturation was continued until no additional increase in sample mass was observed and the calculated pore volume remained constant, indicating that no further brine uptake occurred under the applied laboratory procedure.
The initial brine-saturated condition provided the reference state for subsequent CO2 displacement and CT comparison. This procedure ensured that the observed post-flooding changes in pore structure, pressure response, and injectivity could be attributed to CO2–brine–rock interaction, evaporation-driven salt precipitation, and flow-induced pore alteration rather than inconsistent initial saturation conditions.
Although the adopted vacuum-saturation procedure is commonly used for laboratory core-flooding experiments, residual gas trapped within isolated micropores cannot be completely excluded. Therefore, the initial saturation state should be interpreted as the maximum attainable saturation under the applied laboratory protocol.
2.5. CO2 Core-Flooding Procedure
After brine saturation and pore-volume calibration, CO2 displacement was conducted using the high-pressure core-flooding apparatus described in Section 2.3. The system consisted of an upstream high-precision injection pump, a downstream back-pressure pump and back-pressure valve, a six-way valve, and 1/8-inch stainless-steel corrosion-resistant tubing. The core-flooding configuration enabled controlled CO2 displacement through the brine-saturated sandstone cores under prescribed phase-state, flow-rate, and humidity conditions.
The CO2 displacement experiments were performed according to the phase–flow rate–humidity matrix described in Section 2.1. For each test, the temperature and pressure were adjusted to establish the assigned CO2 condition, including gaseous, liquid, or supercritical CO2. The baseline supercritical condition was 60 °C and 8 MPa. After the target temperature and pressure were established, the six-way valve was switched to the CO2 injection line.
Dry CO2 was prepared by passing CO2 through a molecular-sieve drying tower before injection. Wet CO2 was generated by passing CO2 through a constant-temperature saturator in full contact with 6000 ppm NaCl solution before entering the core-flooding system. This configuration allowed the experiments to compare dry- and wet-CO2 displacement while maintaining the same brine chemistry used during core saturation.
The injection pump was operated at the target flow rate assigned to each experimental group. Flow-rate tests were conducted at 5, 15, or 25 cm3 min−1, whereas the humidity comparison tests were conducted at a fixed flow rate of 20 cm3 min−1. For each test condition, a low-flow CO2 pre-flush of 0.3–0.5 pore volumes were first performed to eliminate transient effects. Continuous CO2 injection was then carried out at the target flow rate for at least 5 pore volumes.
Produced fluids were discharged through the downstream back-pressure valve after pressure stabilization and collected for subsequent assessment. This procedure provided a controlled basis for comparing the effects of CO2 phase state, injection flow rate, and CO2 humidity on pore-structure alteration, salt-related clogging, and injectivity response.
2.6. Pre and Post-Displacement CT Scanning
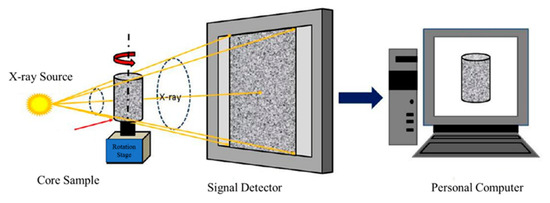
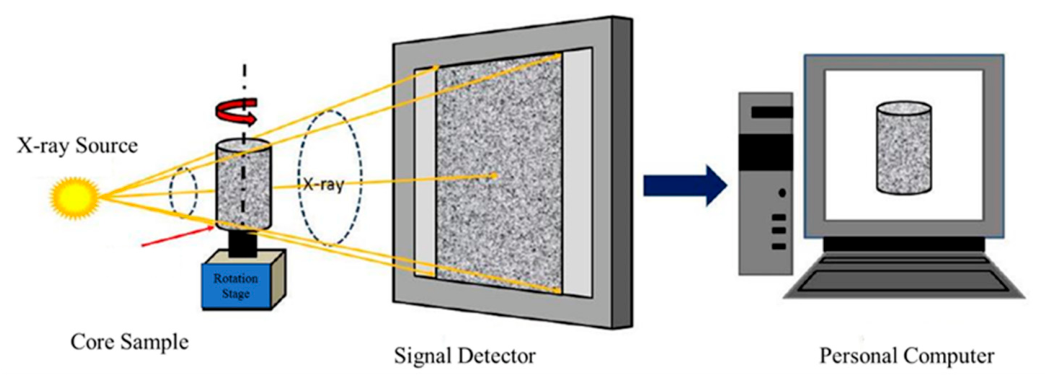
Pre- and post-displacement X-ray computed tomography (CT) was performed to visualize internal pore-structure changes caused by CO2 flooding. Each core assigned to CO2 displacement was scanned before and after the core-flooding experiment, allowing the post-displacement pore structure to be compared directly with the initial brine-saturated reference state. The CT scanning configuration is shown in Figure 2.
Figure 2.
Principle of X-ray CT scanning.
The CT method is based on the attenuation of X-rays as they pass through materials with different densities and compositions. During scanning, the core sample was placed on the rotation stage between the X-ray source and the detector. X-rays emitted from the source passed through the rotating core, and the attenuated signal was recorded by the detector at multiple projection angles. The projection data were then reconstructed into cross-sectional grayscale images representing the internal structure of the core.
The attenuation of X-rays passing through the sample follows the Beer–Lambert law, which relates the transmitted X-ray intensity to the line integral of the local attenuation coefficient [15]. The relationship can be expressed as:
where I represents the transmitted X-ray intensity measured by the detector, I0 represents the incident X-ray intensity emitted by the source, γ(s) is the local attenuation coefficient characterizing the X-ray absorption capacity of the material at position s, which denotes the spatial coordinate along the X-ray beam path through the core sample.
2.7. CT Image Processing and Digital Rock Reconstruction
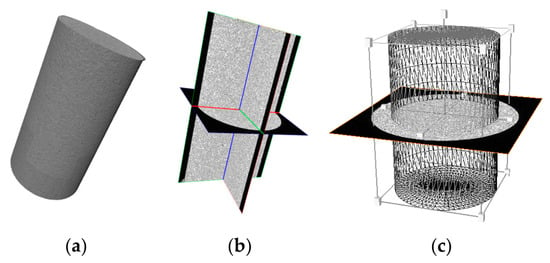
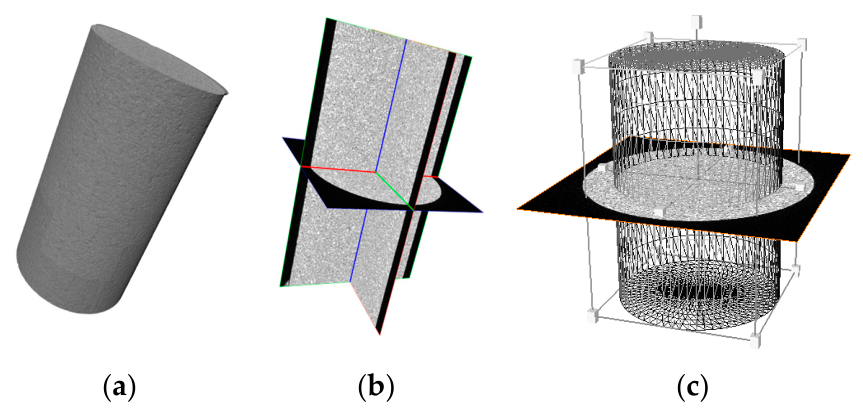
The reconstructed CT image stacks were processed to extract the pore space and generate three-dimensional digital rock models for pre- and post-displacement comparison. Because grayscale CT images provide only an approximate separation between pores, rock matrix, and denser mineral phases, image processing was required to reduce noise, enhance phase contrast, and obtain reproducible segmentation results. The CT image-processing examples are illustrated in Figure 3.
Figure 3.
CT volume inspection and region-of-interest selection workflow: (a) reconstructed three-dimensional CT volume of the sandstone core; (b) orthogonal grayscale slice inspection used to verify internal structure and image orientation; and (c) region of interest selected for subsequent filtering, threshold segmentation, pore-space extraction, and digital rock reconstruction.
The processing sequence consisted of volume inspection, region-of-interest selection, grayscale filtering, contrast enhancement, threshold segmentation, pore-space extraction, and three-dimensional reconstruction. First, the reconstructed CT volume was inspected in three dimensions and through orthogonal grayscale slices to verify sample orientation, image quality, and internal structural continuity. A representative analysis region was then selected from the reconstructed volume to avoid boundary artifacts near the core surface and end faces. The same cylindrical ROI was defined for both the pre- and post-displacement datasets using the external core boundaries as geometric references. This ensured that quantitative analysis was performed on identical sample volumes before and after CO2 flooding.
Grayscale filtering was applied before segmentation to reduce image noise and improve the signal-to-noise ratio. The filtering tools available in Avizo included median filter, non-local means filter, and anisotropic diffusion filter. Median filtering was used to suppress isolated noise points, non-local means filtering reduced noise by considering similarity across the image volume, and anisotropic diffusion filtering smoothed grayscale variations while preserving pore–matrix boundaries and structural edges. Identical filtering procedures and processing parameters were applied to the corresponding pre- and post-displacement datasets of each core to ensure consistency throughout the image-processing workflow.
After filtering, image contrast was enhanced using the unsharp masking module to improve grayscale separation between pore space, matrix, and high-density phases. The enhanced grayscale images were then segmented using histogram-based thresholding. Binary thresholding was applied to separate pore space from the solid matrix, whereas multi-threshold segmentation was used when additional grayscale classes were required to distinguish dense mineral or salt-related phases from the background matrix. The same thresholding strategy was applied to the corresponding pre- and post-displacement datasets of each core to minimize processing-related bias during quantitative comparison.
Following segmentation, the pore space was extracted from the selected image volume and reconstructed as a three-dimensional digital rock model. Three-dimensional visualization was performed in Avizo using volume-rendering tools. The same processing logic was applied to the pre- and post-displacement CT datasets to ensure that observed differences reflected CO2-induced pore-structure alteration rather than inconsistent image-processing parameters.
When grayscale overlap prevented unique separation of precipitated halite from carbonate cement or other dense mineral components, the segmented high-density phase was interpreted conservatively as a dense mineral or salt-enriched phase. This conservative interpretation was used to avoid overestimating halite precipitation based solely on grayscale contrast. Because identical ROI selection, filtering procedures, and thresholding strategies were applied to each pre-/post-displacement image pair, the resulting CT-derived porosity values provide a consistent basis for relative comparison among the experimental conditions. However, a formal threshold-sensitivity analysis was not performed; therefore, the reported porosity values should be interpreted as comparative indicators rather than absolute measurements.
Because grayscale overlap between precipitated halite and carbonate cement prevents complete phase discrimination, the segmented salt-enriched phase should be interpreted as a relative rather than an absolute measure of salt accumulation. Consequently, the CT-derived porosity values may include a systematic uncertainty associated with grayscale threshold selection. As the present study did not include mineralogical validation (e.g., SEM-EDS or XRD) or sensitivity analysis of segmentation thresholds, the magnitude of this uncertainty cannot be quantified reliably. Therefore, the reported CT-derived porosity changes are interpreted as comparative indicators for evaluating relative pore-structure alteration among the experimental groups rather than absolute measurements of precipitated salt volume.
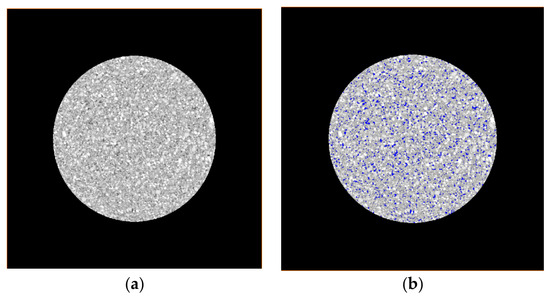
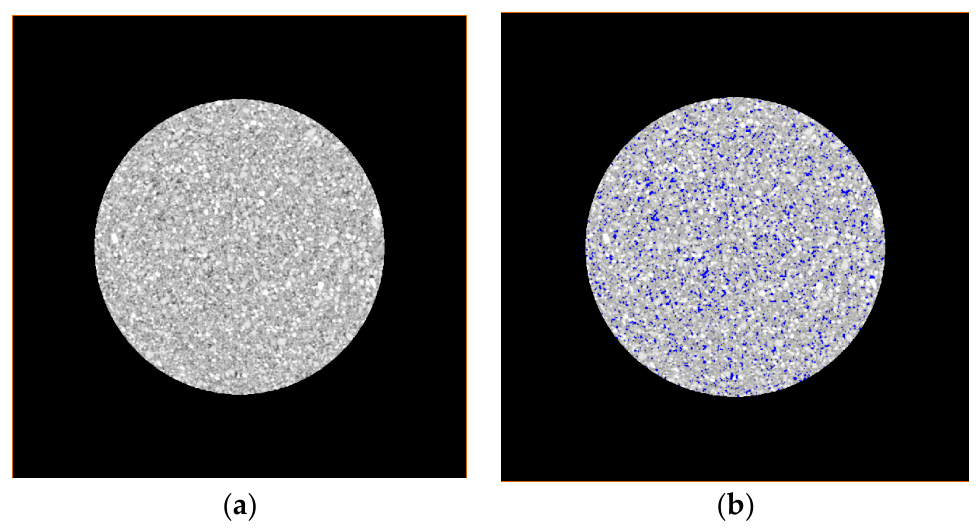
After grayscale filtering and contrast enhancement, threshold segmentation was applied to separate the pore phase from the solid matrix. The segmentation step converted the grayscale CT image into a classified image in which pore voxels were isolated for subsequent pore-volume extraction and digital rock reconstruction. The threshold segmentation procedure is illustrated in Figure 4.
Figure 4.
Threshold segmentation of CT images for pore-space extraction: (a) original grayscale CT slice before segmentation; and (b) threshold-segmented image showing the extracted pore phase used for subsequent pore-volume reconstruction. The blue regions represent the segmented pore space identified by the thresholding procedure, while the gray regions correspond to the solid rock matrix.
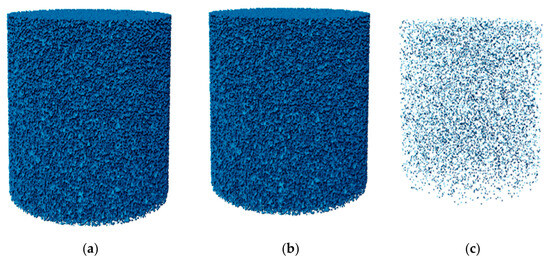
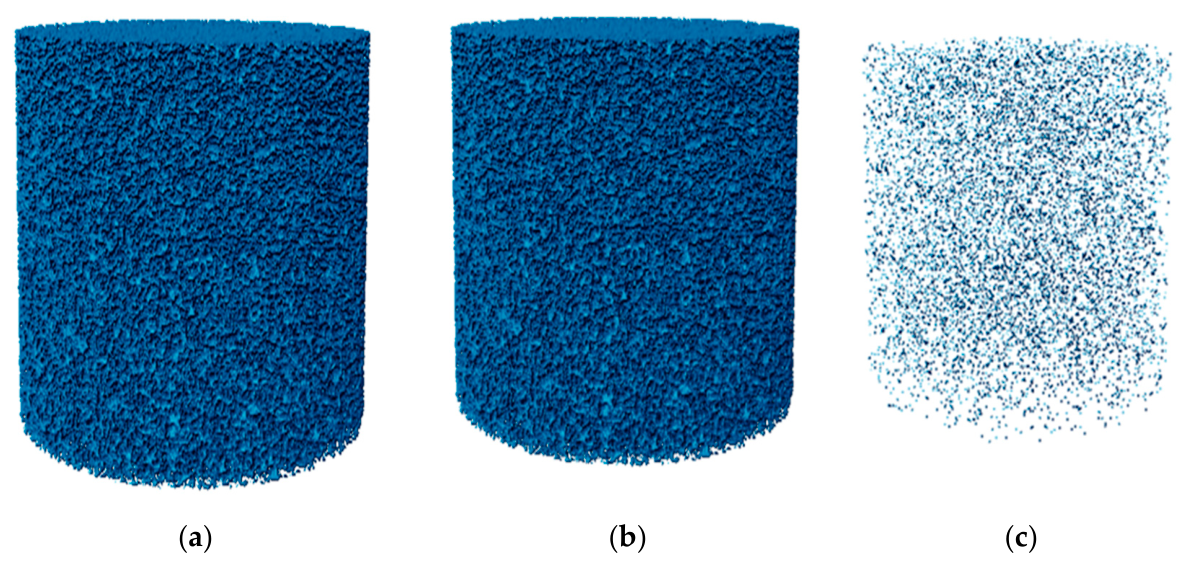
Three-dimensional visualization pore phase was reconstructed into a three-dimensional pore-volume model for both pre- and post-displacement CT datasets. To visualize pore-structure alteration caused by CO2 flooding, Boolean comparison was applied to the reconstructed pore volumes before and after the experiment within the selected region of interest. This operation identified the spatial distribution of pore-volume change after displacement, as shown in Figure 5. The same region of interest was used for the pre- and post-displacement datasets to ensure consistent comparison of pore-volume changes.
Figure 5.
Boolean pore-volume comparison before and after CO2 displacement: (a) reconstructed pore volume before the experiment; (b) reconstructed pore volume after the experiment; and (c) Boolean-derived pore-volume difference showing the spatial distribution of pore-space alteration after flooding.
2.8. Data Reduction and Analysis Metrics
The hydraulic response during CO2 core flooding was evaluated from the recorded inlet pressure, downstream back pressure, injection flow rate, temperature, and cumulative injected volume. The pressure difference across the core was calculated as:
where Pin is the inlet pressure (MPa), Pout is the downstream outlet pressure or back pressure (MPa), and is the pressure difference across the core (MPa).
To compare experiments conducted at different flow rates, the apparent flow resistance was calculated as:
where Rf is the apparent flow resistance (MPa·min·cm−3) and Q is the imposed CO2 injection flow rate (cm3·min−1). This parameter was used as a core-scale indicator of flow impairment; higher Rf values indicate greater resistance to CO2 flow through the brine-saturated core.
The apparent flow resistance was introduced as a simplified engineering indicator to facilitate comparison of hydraulic responses within experimental groups conducted under identical fluid conditions. Because this parameter does not account for variations in CO2 viscosity or density, it should not be interpreted as an intrinsic rock-flow property or equivalent permeability. In particular, comparisons between gaseous, liquid, and supercritical CO2 should be interpreted qualitatively, whereas quantitative comparisons based on apparent flow resistance are restricted to experiments performed under the same CO2 phase.
The CT datasets were analyzed within the selected region of interest described in Section 2.7. The segmented pore volumes obtained from threshold segmentation and Boolean comparison, as illustrated in Figure 4 and Figure 5, were used to evaluate pore-structure alteration before and after CO2 displacement. All quantitative comparisons were performed using identical image-processing parameters for the corresponding pre- and post-displacement datasets. CT observation porosity was calculated as:
where ϕCT is the CT-derived porosity (dimensionless, reported as %), Vpore is the segmented pore volume (dimensionless, reported as %), and VROI is the analyzed region-of-interest volume (mm3).
The change in reconstructed pore volumes porosity after CO2 flooding was calculated as:
where ϕCT,pre and ϕCT,post are the three-dimensional reconstruction porosities before and after CO2 displacement, respectively (dimensionless, reported as %). These pressure-derived and CT-derived metrics were used to relate the hydraulic response of the cores to pore-scale alteration caused by CO2–brine–rock interaction and salt-related pore clogging.
Although sample mass was monitored during routine experimental preparation and handling, the present study did not include gravimetric quantification of precipitated salt. Therefore, the analysis of salt accumulation was based on CT-derived image segmentation and Boolean comparison of the pre- and post-displacement datasets. The segmented salt-enriched phase was interpreted as a relative indicator of pore-scale salt accumulation and pore-structure alteration rather than an absolute mass-balance measurement.
3. Results
3.1. Overall Pressure Response During CO2 Core Flooding
The hydraulic response of the brine-saturated sandstone cores during CO2 displacement is summarized in Table 4. The measured pressure difference across the cores ranged from 0.90 to 1.08 MPa among all tests, indicating that all displacement experiments produced measurable flow resistance under the imposed pressure, temperature, flow-rate, and humidity conditions. To enable comparison between experiments conducted at different injection rates, the apparent flow resistance was calculated by normalizing the differential pressure by the imposed CO2 flow rate.
Table 4.
Summary of CO2 core-flooding pressure.
In the phase-state test series A1–A3, where the injection rate was 25 cm3 min−1, the measured differential pressure varied from 0.90 to 1.08 MPa. The highest pressure difference was recorded for A1, whereas the lowest value was recorded for A2. Because these tests were performed at the same nominal flow rate, the apparent flow resistance followed the same trend as the measured differential pressure.
In the flow-rate test series B1–B3, the measured differential pressures were relatively close, ranging from 0.92 to 1.03 MPa. However, normalization by injection rate revealed a substantially higher apparent flow resistance for B1, which was conducted at 5 cm3 min−1. This behavior is consistent with the longer residence time of dry CO2 within the pore network at lower injection rates. The extended CO2–brine contact may promote brine evaporation and local salt enrichment, resulting in partial pore-throat blockage and increased hydraulic resistance. Consequently, a higher inlet pressure was required to maintain flow through the core despite the lower imposed injection rate. This confirms that differential pressure alone is insufficient for comparing tests conducted at different flow rates and that the flow-rate-normalized resistance provides a more consistent hydraulic indicator.
In the humidity comparison tests, dry supercritical CO2 injection in test C produced a differential pressure of 1.02 MPa, whereas wet supercritical CO2 injection in test D produced a slightly lower differential pressure of 0.97 MPa. The corresponding apparent flow resistance values were 0.051 and 0.049 MPa min cm−3, respectively. This difference indicates a modest but measurable hydraulic contrast between dry- and wet-CO2 displacement under otherwise comparable supercritical conditions.
The injection-pressure curves were grouped according to the experimental variable to avoid overplotting and to preserve direct comparison within each test series.
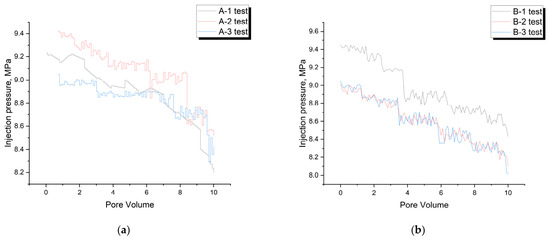
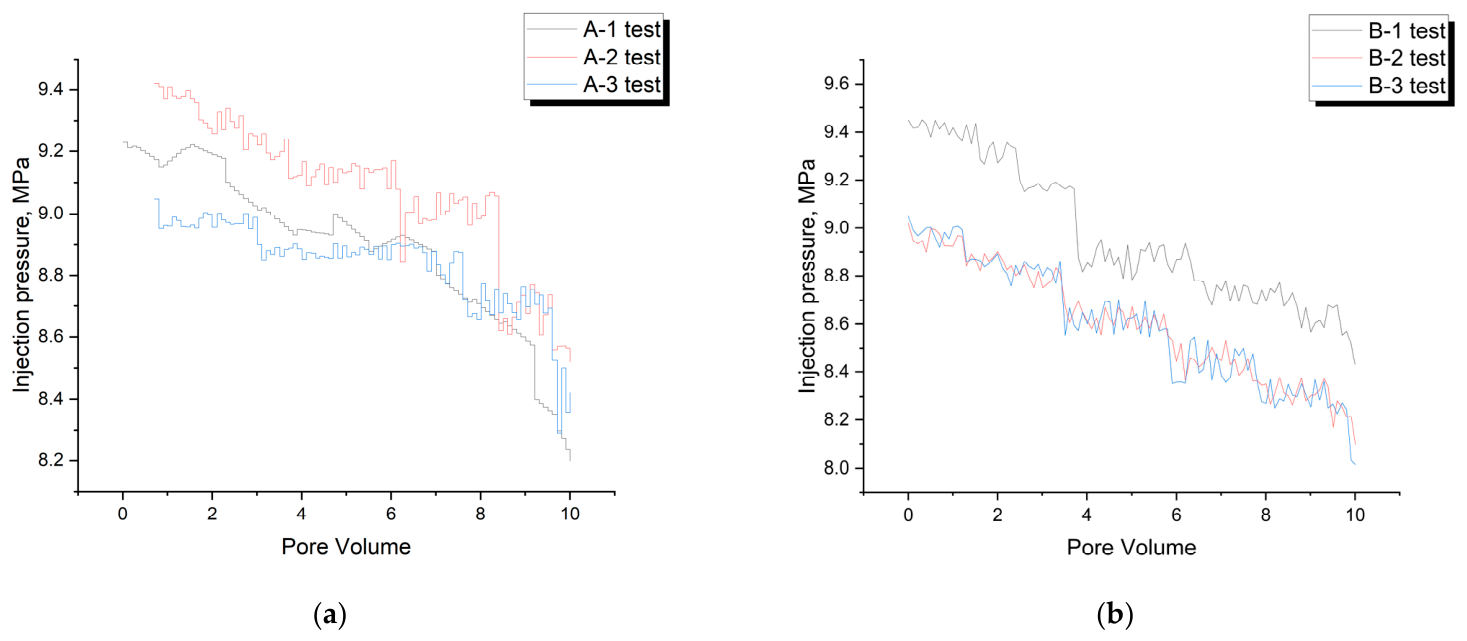
The injection-pressure curves are presented separately for each experimental series to avoid direct comparison between core groups with different initial petrophysical properties. Figure 6a presents the pressure evolution for the phase-state experiments (Group A), in which only the CO2 phase state was varied while the initial core properties remained constant. Figure 6b presents the flow-rate experiments (Group B), in which only the injection flow rate was varied for cores with identical nominal porosity and permeability. Therefore, comparisons are restricted to each experimental group independently.
Figure 6.
Injection-pressure evolution during CO2 core flooding as a function of injected pore volume: (a) phase-state tests A1–A3; and (b) flow-rate tests B1–B3.
In the phase-state series, the three tests exhibited distinct injection-pressure trajectories over the displacement interval. A2 showed the highest injection pressure during most of the test, whereas A1 and A3 remained lower and approached similar pressure levels after approximately six pore volumes. A pressure decline was observed toward the final stage of displacement in all three phase-state tests, indicating a progressive change in hydraulic response during continued CO2 injection.
In the flow-rate series, B1 maintained a higher injection pressure than B2 and B3 over most of the displacement interval, despite being conducted at the lowest nominal injection rate. In contrast, B2 and B3 showed similar pressure trajectories and progressively decreased with increasing injected pore volume. These trends indicate that pressure evolution alone should be interpreted together with flow-rate-normalized resistance, which is summarized in Table 4.
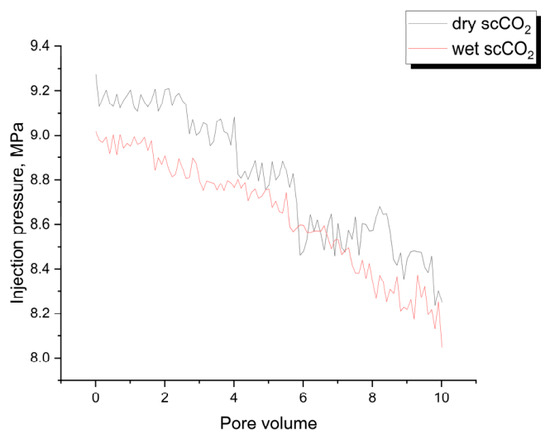
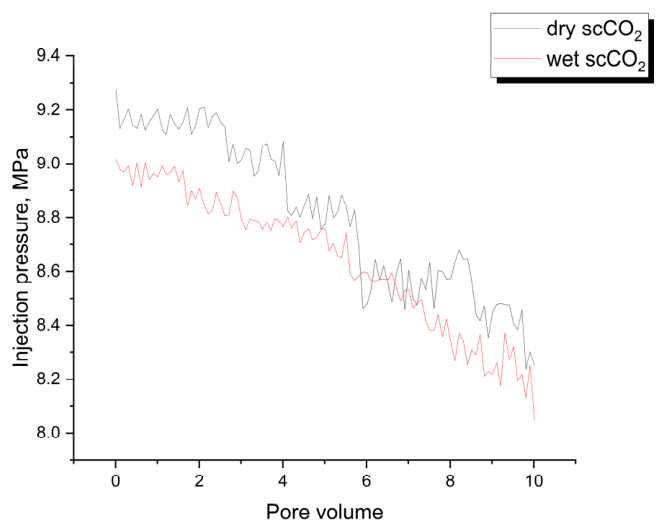
The humidity comparison was plotted separately because tests C and D directly isolate the effect of CO2 water content under otherwise comparable supercritical conditions. Both tests were conducted at 60 °C, 8 MPa, and 20 cm3 min−1, whereas the injected CO2 stream was changed from dry-CO2 in test C to wet CO2 in test D. Figure 7 shows the corresponding injection-pressure evolution as a function of injected pore volume.
Figure 7.
Injection-pressure evolution during dry and wet supercritical CO2 flooding as a function of injected pore volume.
The dry-scCO2 test C produced a slightly higher stabilized pressure response than the wet-scCO2 test D. The summarized differential pressure was 1.02 MPa for C and 0.97 MPa for D, corresponding to apparent flow resistance values of 0.051 and 0.049 MPa min cm−3, respectively. Although the hydraulic contrast between the two tests was modest, the consistently higher resistance in the dry-scCO2 case indicates that CO2 humidity influenced the displacement response. This pressure behavior was therefore evaluated together with the CT-derived pore-structure changes to distinguish evaporation-driven pore clogging from wet-scCO2 displacement behavior.
3.2. Phase-State Experiments (Group A)
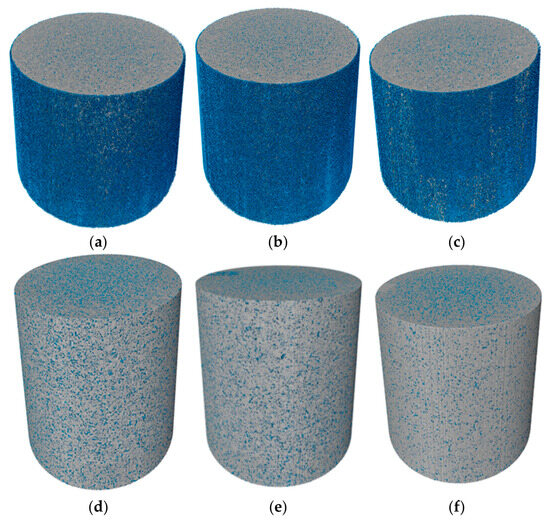
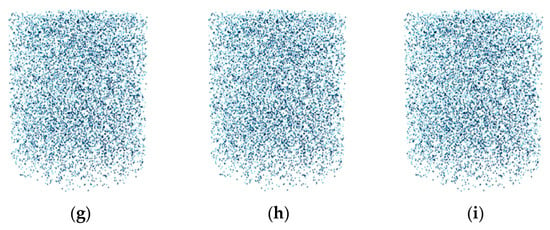
To evaluate the effect of CO2 phase state on pore-scale alteration, the pre- and post-displacement CT reconstructions of tests A1–A3 were compared. These tests were assigned to the phase-state series and were conducted on cores with the same nominal petrophysical properties. The CT datasets included pre- and post-experiment pore/matrix reconstructions for A1, A2, and A3, allowing the spatial redistribution of pore space and salt-enriched material to be assessed after CO2 displacement. Figure 8 shows the reconstructed pore/matrix structure before and after flooding together with the segmented salt-enriched phase for the three phase-state tests.
Figure 8.
CT-derived pore-structure alteration and salt-enriched phase distribution in the CO2 phase-state tests: (a–c) pre-displacement pore/matrix reconstructions for A1, A2, and A3, respectively; (d–f) post-displacement pore/matrix reconstructions for A1, A2, and A3, respectively; and (g–i) segmented salt-enriched phase distributions after CO2 displacement for A1, A2, and A3, respectively.
The reconstructed pore volumes confirmed substantial pore-volume loss in all three phase-state tests. The initial porosity of the A-series cores was 28.00% before CO2 displacement. After flooding, the porosity decreased to 16.31% in A1, 16.59% in A2, and 13.94% in A3. This corresponds to absolute porosity losses of 11.69, 11.41, and 14.06 percentage points, respectively. Expressed relative to the initial porosity, the porosity reductions were 41.75% for A1, 40.75% for A2, and 50.21% for A3. Thus, A3 exhibited the largest porosity reduction among the phase-state tests, whereas A2 showed the smallest reduction.
The pore-space distribution salt-enriched phase shown in Figure 9 was spatially heterogeneous rather than uniformly distributed throughout the reconstructed core volume. This indicates that pore-space reduction was controlled by local flow pathways, pore-scale heterogeneity, and phase-dependent CO2–brine interaction. The strongest CT-derived porosity loss occurred in A3, where the post-displacement porosity decreased to 13.94%, suggesting more pronounced pore-volume impairment under the supercritical CO2 condition. In contrast, A1 and A2 retained slightly higher post-displacement porosities of 16.31% and 16.59%, respectively.
Figure 9.
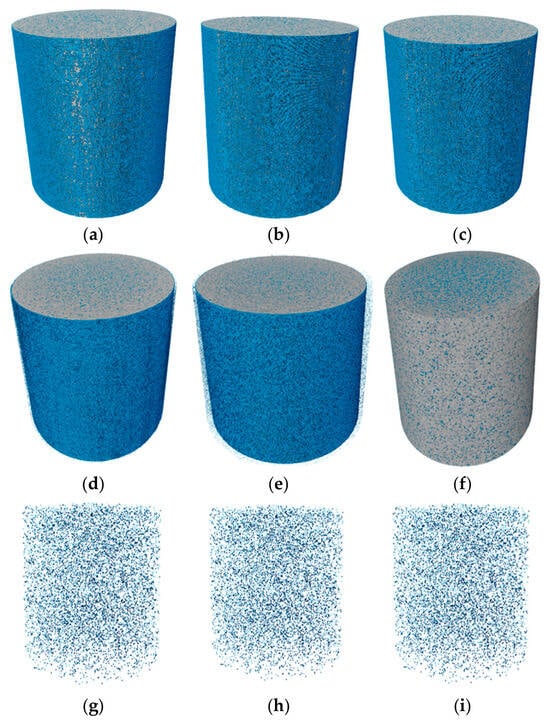
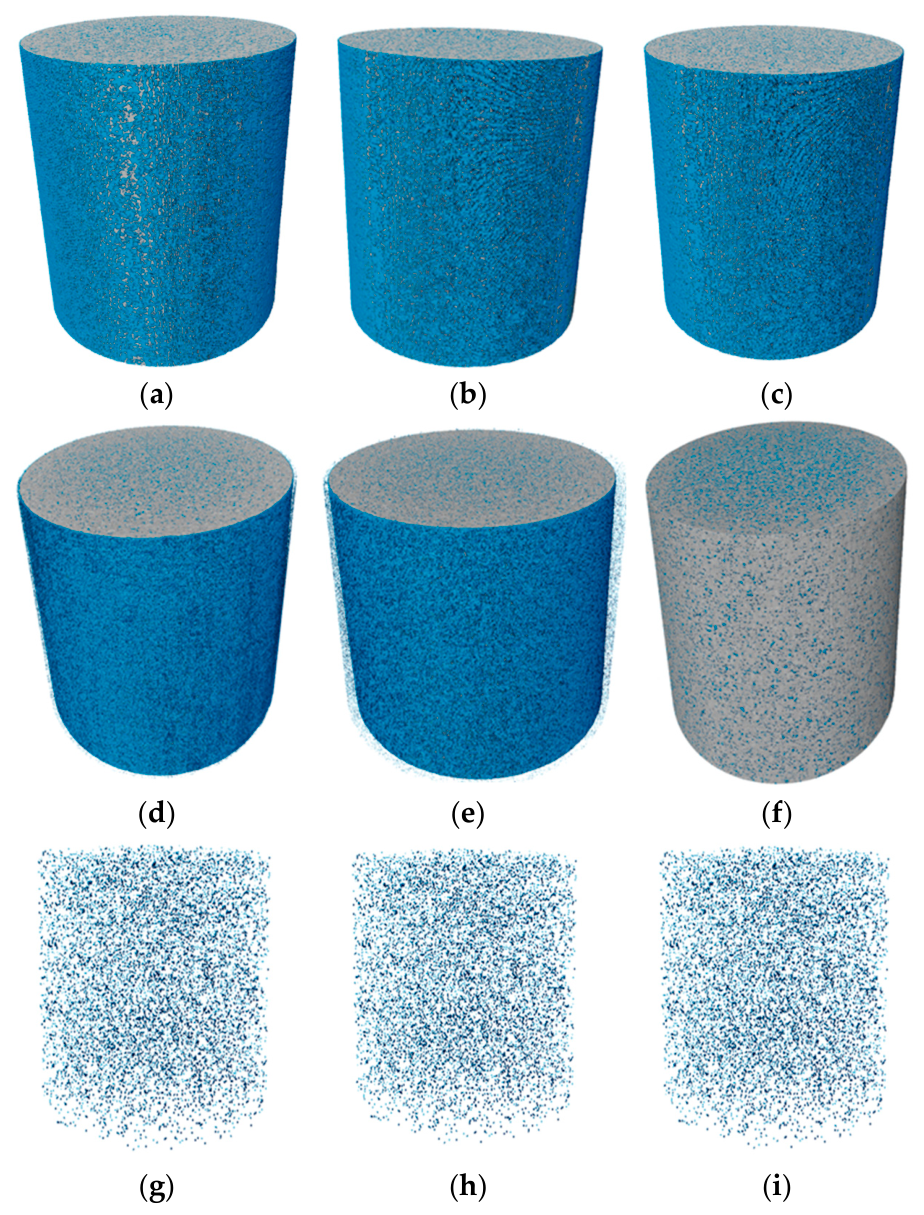
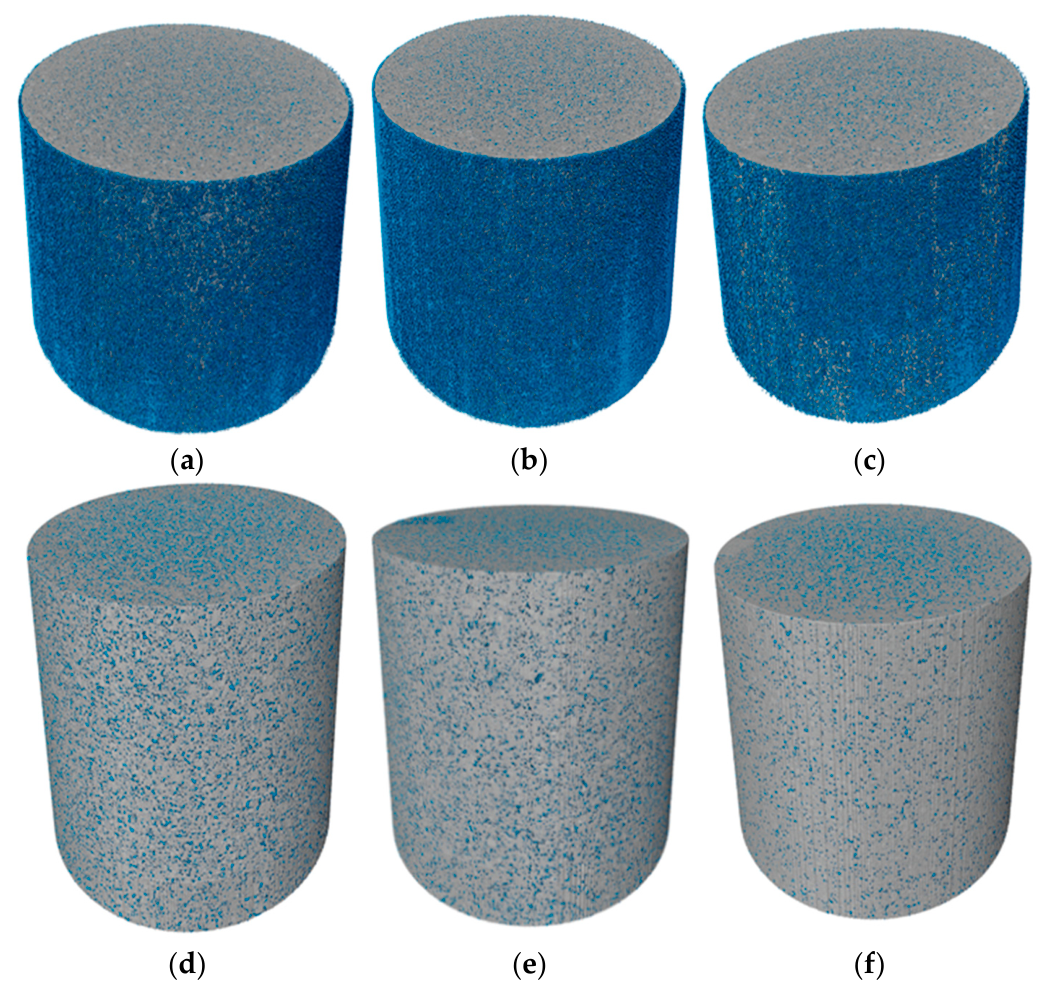
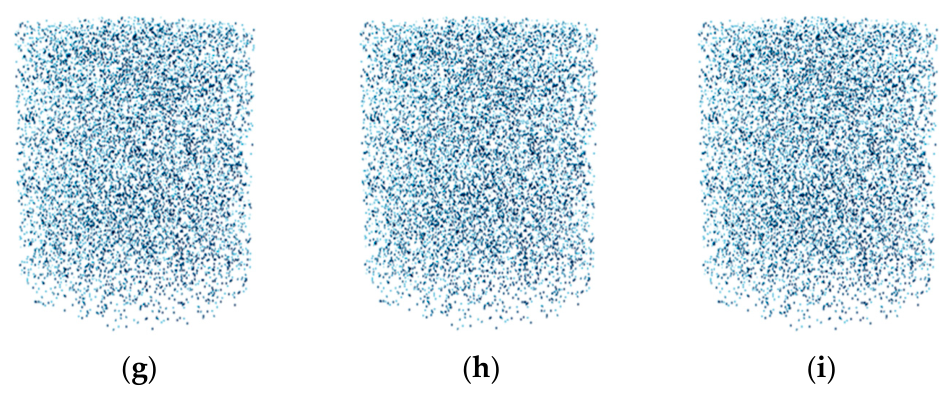
CT-derived pore-structure alteration and salt-enriched phase distribution in the CO2 flow-rate tests: (a–c) pre-displacement pore/matrix reconstructions for B1, B2, and B3, respectively; (d–f) post-displacement pore/matrix reconstructions for B1, B2, and B3, respectively; and (g–i) segmented salt-enriched phase distributions after CO2 displacement for B1, B2, and B3, respectively.
When these Quantitative CT measurements indicate changes are considered together with the hydraulic response reported in Section 3.1, the phase-state tests show that pore-structure alteration and pressure behavior do not scale identically. A1 produced the highest measured differential pressure among the phase-state tests, whereas A3 produced the largest CT-derived porosity reduction. This distinction suggests that the pressure response was influenced not only by total pore-volume loss, but also by the spatial distribution of clogged pore throats, connected-pore reduction, and local salt accumulation within preferential flow pathways. The observed phase-state dependence can be explained by differences in the thermophysical properties of CO2. Variations in CO2 density and water-carrying capacity influence the extent of brine evaporation and the subsequent increase in local brine salinity. Under conditions favoring stronger evaporation, dissolved salts reach supersaturation more rapidly and precipitate within the pore network. Consequently, pore throats become progressively constricted, reducing pore connectivity and increasing hydraulic resistance. This mechanism explains why pore-volume loss and pressure response are not directly proportional, as the spatial distribution of salt precipitation is more important than the total volume of precipitated material.
3.3. Flow-Rate Experiments (Group B)
To evaluate the effect of injection flow rate on pore-scale alteration, the pre- and post-displacement CT reconstructions of tests B1–B3 were compared. These tests were conducted under the same nominal supercritical dry CO2 condition of 60 °C and 8 MPa, whereas the injection rate was varied from 5 to 15 and 25 cm3 min−1. The B-series cores had the same nominal initial porosity of 25.00%, which allowed the flow-rate effect to be assessed under comparable initial pore-volume conditions. Figure 9 shows the reconstructed pore/matrix structure before and after CO2 displacement together with the segmented salt-enriched phase for the three flow-rate tests.
The CT observations indicate porosity analysis showed substantial pore-volume loss in all three flow-rate tests. The initial porosity of the B-series cores was 25.00% before CO2 displacement. After flooding, the porosity decreased to 12.58% in B1, 10.87% in B2, and 15.89% in B3. These values correspond to absolute porosity losses of 12.42, 14.13, and 9.11 percentage points, respectively. Expressed relative to the initial porosity, the porosity reductions were 49.68% for B1, 56.52% for B2, and 36.44% for B3. Therefore, B2 exhibited the largest CT-derived porosity reduction, whereas B3 showed the smallest reduction among the flow-rate tests.
The comparison between CT analysis revealed porosity reduction and flow-rate-normalized resistance indicates that pore-volume loss and hydraulic impairment did not vary identically with injection rate. B2 showed the largest porosity reduction, whereas B1 showed the highest apparent flow resistance. This distinction suggests that the hydraulic response was governed not only by the total loss of segmented pore volume, but also by the spatial distribution of pore-throat blockage, connected-pore impairment, and salt-enriched phase accumulation along preferential flow paths. The segmented salt-enriched phase in Figure 10 further indicates that pore alteration was spatially heterogeneous rather than uniformly distributed throughout the reconstructed volume.
Figure 10.
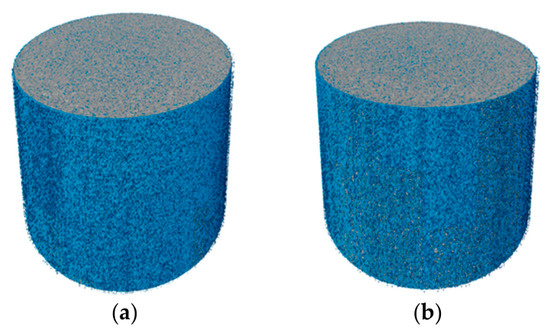
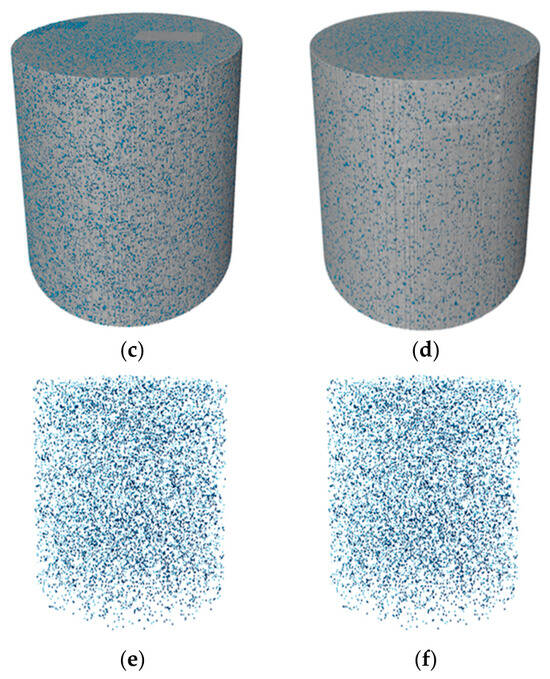
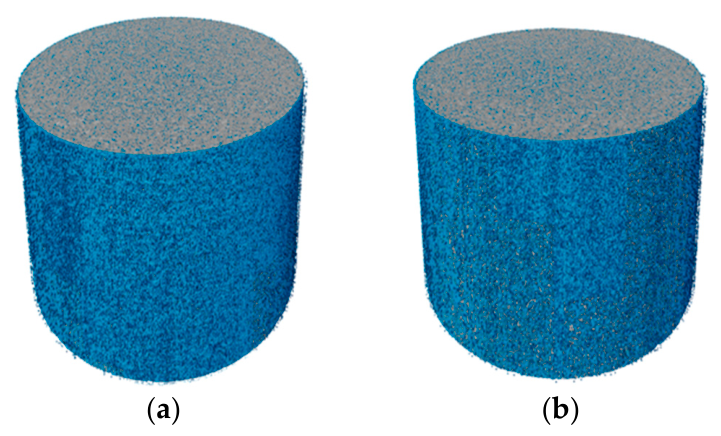
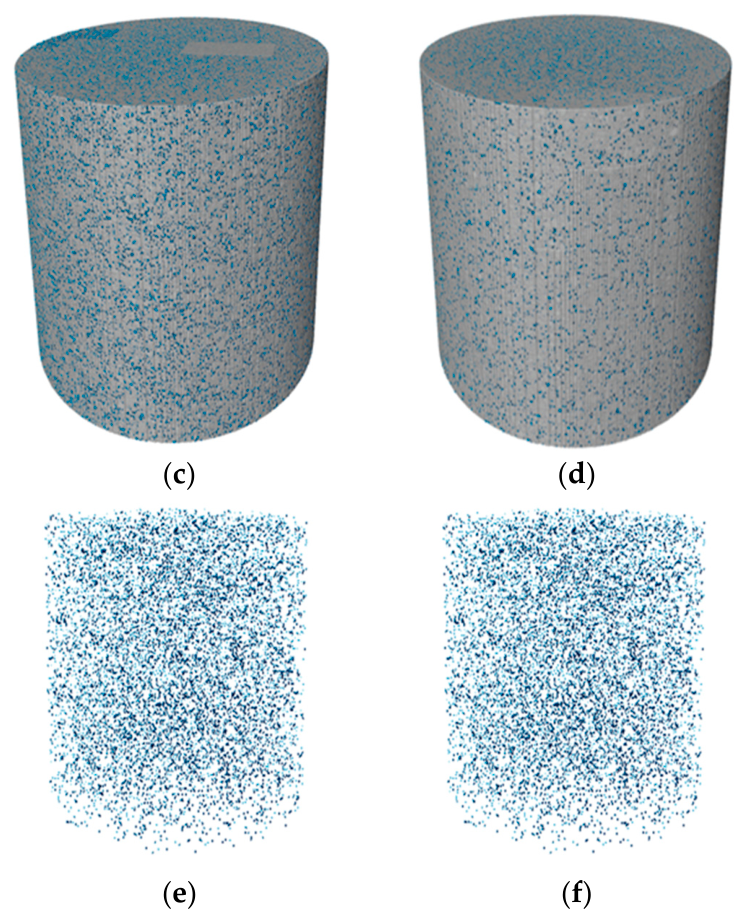
CT-derived pore-structure alteration and salt-enriched phase distribution in the humidity tests: (a–d) pre- and post-displacement pore/matrix reconstructions for dry supercritical CO2 test C; and (e,f) segmented salt-enriched phase after wet-CO2 displacement.
The reconstructed models salt-enriched phase in Figure 9 was spatially heterogeneous in all three B-series samples. This indicates that pore-volume loss and salt accumulation were controlled by local flow pathways and pore-scale heterogeneity rather than occurring uniformly throughout the core. The quantitative CT measurements reductions should therefore be interpreted together with the flow-rate-normalized resistance: porosity loss quantifies the volumetric change in the segmented pore phase, whereas apparent flow resistance reflects the hydraulic consequence of pore-throat blockage and connected-pore impairment. The effect of injection flow rate reflects the balance between convective transport and capillary-driven brine redistribution. At lower flow rates, the longer residence time allows stronger capillary backflow of brine toward the evaporation front, promoting localized salt accumulation near the inlet. As the flow rate increases, the evaporation front propagates further into the core and precipitation becomes more spatially distributed. Consequently, hydraulic impairment depends not only on the amount of precipitated salt but also on its location within the pore network and its ability to block connected flow pathways.
The difference between pore-volume loss and hydraulic resistance suggests that these two parameters are governed by different aspects of the pore-scale alteration process. At the intermediate injection rate (B2), the balance between convective transport and residence time likely promoted more uniform evaporation and salt precipitation throughout a larger fraction of the pore network, resulting in the greatest overall reduction in segmented pore volume. In contrast, the lowest injection rate (B1) provided a longer residence time for CO2–brine interaction near the inlet, promoting localized salt accumulation and preferential pore-throat blockage. Although the total pore-volume loss was smaller than in B2, the localized nature of the blockage more effectively restricted connected flow pathways, resulting in the highest apparent flow resistance. These observations indicate that hydraulic impairment is controlled primarily by the location and connectivity of salt deposition rather than by the total volume of precipitated salt alone.
3.4. Humidity Experiments (Groups C and D)
To evaluate the effect of CO2 humidity on pore-scale alteration, tests C and D were compared under the same nominal supercritical conditions. Both tests were conducted at 60 °C, 8 MPa, and 20 cm3 min−1 using cores with the same nominal initial properties: permeability of 1000 mD and porosity of 22.00%. The main difference between the two tests was the injected CO2 humidity state: test C was conducted with dry supercritical CO2, whereas test D was conducted with wet supercritical CO2. Figure 10 shows the pre- and post-displacement pore/matrix reconstructions together with the segmented salt-enriched phase for the two humidity cases.
The CT-derived porosity analysis showed a pronounced contrast between dry and wet supercritical CO2 displacement. The initial porosity of both humidity-test cores was 22.00% before CO2 flooding. After displacement, the porosity decreased to 11.78% in test C and to 18.55% in test D. These values correspond to absolute porosity losses of 10.22 and 3.45 percentage points, respectively. Expressed relative to the initial porosity, the porosity reductions were 46.45% for the dry-CO2 case and 15.68% for the wet-CO2 case. Therefore, dry supercritical CO2 caused approximately 2.96 times greater relative porosity reduction than wet supercritical CO2 under otherwise comparable temperature, pressure, and flow-rate conditions.
The hydraulic response was consistent with this humidity-dependent pore alteration. The dry-CO2 test C produced a differential pressure of 1.02 MPa, whereas the wet-CO2 test D produced a slightly lower differential pressure of 0.97 MPa. Because both tests were conducted at the same injection rate of 20 cm3 min−1, the corresponding apparent flow resistance decreased from 0.051 MPa min cm−3 in C to 0.049 MPa min cm−3 in D. Relative to the dry-CO2 case, the wet-CO2 case showed an approximately 4.9% lower differential pressure and apparent flow resistance.
The combined CT and pressure results indicate that CO2 humidity exerted a strong control on pore-volume preservation. The dry-CO2 case showed substantially greater CT-derived porosity loss and slightly higher hydraulic resistance, consistent with stronger evaporation-driven pore impairment. In contrast, the wet-CO2 case retained a much larger fraction of the initial pore volume, with a post-displacement porosity of 18.55% compared with 11.78% in the dry-CO2 case. This indicates that humidified CO2 mitigated pore-volume loss and reduced the severity of flow impairment under the tested supercritical conditions.
From a thermodynamic perspective, the difference between dry and wet scCO2 is governed by the vapor–liquid equilibrium of the CO2–H2O system. Dry scCO2 enters the porous medium with a low water vapor content and therefore possesses a high capacity to dissolve additional water from the resident brine until the equilibrium water content is reached. This continuous evaporation progressively concentrates dissolved salts, eventually leading to supersaturation and precipitation within the pore network. In contrast, wet CO2 is introduced close to water-vapor saturation. Because the injected fluid is already near equilibrium with respect to water, the driving force for further evaporation is substantially reduced. Consequently, the increase in brine salinity is slower, delaying or suppressing salt supersaturation and reducing pore-throat clogging.
The segmented salt-enriched phase shown in Figure 10 provides the spatial basis for interpreting this contrast. In the dry-scCO2 case, brine evaporation within the pore network can promote local salt accumulation and pore-throat blockage, whereas wet CO2 suppresses evaporation-driven salt precipitation by reducing the driving force for water vaporization. Therefore, the C–D comparison directly links CO2 humidity to salt-related pore alteration and injectivity impairment. As in the previous CT analyses, the segmented dense phase is interpreted conservatively as a salt-enriched or high-density phase unless independently validated as pure halite. The pronounced difference between the dry- and wet-scCO2 cases is attributed to the evaporation capacity of the injected fluid. Dry CO2 continuously removes water from the pore space, increasing brine salinity until salt precipitation occurs. In contrast, humidified CO2 has a reduced capacity to evaporate formation water, thereby limiting salinity buildup and delaying or suppressing salt precipitation. As a result, pore connectivity is better preserved, leading to lower hydraulic resistance and improved injectivity under otherwise identical operating conditions.
4. Conclusions
The present study demonstrates that injectivity impairment during CO2 injection is governed by the coupled effects of fluid phase behavior, transport processes, and salt precipitation within the pore network rather than by porosity reduction alone. CT observations indicate that the spatial distribution of salt accumulation and pore-throat blockage is more important for hydraulic performance than the total amount of pore-volume loss.
The experimental results further show that CO2 phase state controls the intensity of pore alteration through differences in density and water-carrying capacity, whereas injection flow rate governs the balance between evaporation-driven precipitation and capillary redistribution of brine. In addition, humidified supercritical CO2 effectively suppresses evaporation, thereby reducing salt precipitation and preserving pore connectivity.
From an engineering perspective, the results suggest that optimization of CO2 humidity and injection strategy represents a practical approach to mitigating near-wellbore injectivity impairment during geological CO2 storage. Integrating hydraulic monitoring with CT-based pore-scale characterization provides a useful framework for evaluating formation damage and designing more robust injection protocols.
The present work was performed on laboratory-fabricated sandstone analogues under controlled conditions. Although these samples provide high repeatability and allow systematic evaluation of the governing mechanisms, future work should extend the methodology to natural reservoir cores with more complex mineralogy and heterogeneity. An additional limitation of the present study is that grayscale-based CT segmentation cannot uniquely distinguish precipitated halite from carbonate cement or other dense mineral phases. Therefore, the segmented high-density regions presented in this study are interpreted as salt-enriched phases rather than confirmed halite. Future work should combine CT imaging with complementary mineralogical characterization techniques, such as SEM-EDS or XRD, together with gravimetric measurements, effluent salinity analysis, or mass-balance verification to validate phase identification and further improve the quantitative assessment of salt precipitation.
Author Contributions
Conceptualization, D.D. and F.K.; methodology, F.K. and Z.Z.; software, F.K. and N.Z.; validation, D.D., F.K. and Z.Z.; formal analysis, F.K., N.Z., J.I. and I.G.; investigation, Z.Z., F.K. and N.Z.; resources, D.D., Z.Z. and D.A.; data curation, F.K., N.Z., J.I. and I.G.; writing—original draft preparation, F.K.; writing—review and editing, D.D., F.K., J.I. and D.A.; visualization, F.K. and N.Z.; supervision, D.D. and Z.Z.; project administration, D.A.; funding acquisition, D.D. All authors have read and agreed to the published version of the manuscript.
Funding
This research was funded by the Ministry of Science and Higher Education of the Republic of Kazakhstan, grant number AP23489740. The article was prepared as part of the project titled “Research salt precipitation’s impact on CO2 injection wells injectivity and improvement of salt precipitation model for effective CO2 sequestration”, funded under the 2024–2026 grant competition for scientific and/or scientific and technical projects. APC: The APC was funded by the same grant (AP23489740).
Data Availability Statement
The data presented in this study are available on request from the corresponding author due to privacy.
Acknowledgments
The authors gratefully thank Zuguo Li and Manyi Lu from China University of Petroleum (Beijing) for providing technical support during the experimental campaign, including assistance with laboratory setup, equipment operation, sample handling, and CT-scanning workflow.
Conflicts of Interest
The authors declare no conflicts of interest.
Abbreviations
The following abbreviations are used in this manuscript:
| CCS | Carbon capture and storage |
| Micro CT | Micro-computed tomography |
| ROI | Region of interest |
| PV | Pore volume |
| ppm | Parts per million |
| ppmv | Parts per million by volume |
References
- Li, Q.; You, D.; Li, Q.; Wang, F.; Wang, Y.; Yang, Y. Analysis of Sedimentation Behavior and Influencing Factors of Solid Particles in CO2 Fracturing Fluid. Processes 2025, 13, 4049. [Google Scholar] [CrossRef] [Scilit]
- Li, Q.; Li, Q.; Cao, H.; Wu, J.; Wang, F.; Wang, Y. The Crack Propagation Behaviour of CO2 Fracturing Fluid in Unconventional Low Permeability Reservoirs: Factor Analysis and Mechanism Revelation. Processes 2025, 13, 159. [Google Scholar] [CrossRef] [Scilit]
- Li, Q.; Han, Y.; Liu, X.; Ansari, U.; Cheng, Y.; Yan, C. Hydrate as a by-product in CO2 leakage during the long-term sub-seabed sequestration and its role in preventing further leakage. Environ. Sci. Pollut. Res. 2022, 29, 77737–77754. [Google Scholar] [CrossRef] [Scilit] [PubMed]
- Miri, R.; Hellevang, H. Salt precipitation during CO2 storage—A review. Int. J. Greenh. Gas Control 2016, 51, 136–147. [Google Scholar] [CrossRef] [Scilit]
- Pruess, K.; Müller, N. Formation dry-out from CO2 injection into saline aquifers: 1. Effects of solids precipitation and their mitigation. Water Resour. Res. 2009, 45, W03402. [Google Scholar] [CrossRef] [Scilit]
- Muller, N.; Qi, R.; Mackie, E.; Pruess, K.; Blunt, M.J. CO2 injection impairment due to halite precipitation. Energy Procedia 2009, 1, 3507–3514. [Google Scholar] [CrossRef] [Scilit]
- Giorgis, T.; Carpita, M.; Battistelli, A. 2D modeling of salt precipitation during the injection of dry CO2 in a depleted gas reservoir. Energy Convers. Manag. 2007, 48, 1816–1826. [Google Scholar] [CrossRef] [Scilit]
- Peysson, Y.; André, L.; Azaroual, M. Well injectivity during CO2 storage operations in deep saline aquifers—Part 1: Experimental investigation of drying effects, salt precipitation and capillary forces. Int. J. Greenh. Gas Control 2014, 22, 291–300. [Google Scholar] [CrossRef] [Scilit]
- Nooraiepour, M.; Fazeli, H.; Miri, R.; Hellevang, H. Effect of CO2 phase states and flow rate on salt precipitation in shale caprocks—A microfluidic study. Environ. Sci. Technol. 2018, 52, 6050–6060. [Google Scholar] [CrossRef] [Scilit] [PubMed]
- He, D.; Jiang, P.; Xu, R. Pore-scale experimental investigation of the effect of supercritical CO2 injection rate and surface wettability on salt precipitation. Environ. Sci. Technol. 2019, 53, 14744–14751. [Google Scholar] [CrossRef] [Scilit] [PubMed]
- Akindipe, D.; Saraji, S.; Piri, M. Salt precipitation during geological sequestration of supercritical CO2 in saline aquifers: A pore-scale experimental investigation. Adv. Water Resour. 2021, 155, 104011. [Google Scholar] [CrossRef] [Scilit]
- Ott, H.; Snippe, J.; de Kloe, K. Salt precipitation due to supercritical gas injection: II. Capillary transport in multi-porosity rocks. Int. J. Greenh. Gas Control 2021, 105, 103233. [Google Scholar] [CrossRef] [Scilit]
- Guyant, E.; Han, W.S.; Kim, K.-Y.; Park, M.-H.; Kim, B.-Y. Salt precipitation and CO2/brine flow distribution under different injection well completions. Int. J. Greenh. Gas Control 2015, 37, 299–310. [Google Scholar] [CrossRef] [Scilit]
- Papi, A.; Jahanbakhsh, A.; Maroto-Valer, M.M. Preventing salt precipitation in CO2 storage processes in saline aquifers: Dissolved-water CO2 injection method. Energy Fuels 2025, 39, 3926–3941. [Google Scholar] [CrossRef] [Scilit] [PubMed]
- Buzug, T.M. Computed Tomography: From Photon Statistics to Modern Cone-Beam CT; Springer: Berlin/Heidelberg, Germany, 2008. [Google Scholar] [CrossRef] [Scilit]

Disclaimer/Publisher’s Note: The statements, opinions and data contained in all publications are solely those of the individual author(s) and contributor(s) and not of MDPI and/or the editor(s). MDPI and/or the editor(s) disclaim responsibility for any injury to people or property resulting from any ideas, methods, instructions or products referred to in the content. |
© 2026 by the authors. Licensee MDPI, Basel, Switzerland. This article is an open access article distributed under the terms and conditions of the Creative Commons Attribution (CC BY) license.