


Abstract
Japan’s residential energy transition is shaped by imported-fuel exposure, post-feed-in tariff (FIT) value erosion, tariff uncertainty, and disaster risk. This study evaluates whether a fixed 4 kW photovoltaic (PV) and 5 kWh battery energy storage system (BESS) package can create sufficient private household value over a 25-year lifecycle. The analysis uses audited 30 min electricity-demand profiles from four detached households in Kyushu and a broader 181-household demand context. A perfect-foresight mixed-integer linear programming model provides an upper-bound dispatch benchmark. Dispatch outputs are evaluated using net present value (NPV), retail-price escalation, time-of-use tariff sensitivity, value of lost load (VoLL)-based outage valuation, forecast-realism adjustment, and a third-party ownership (TPO) benchmark. PV-only investment remains profitable, with a mean NPV of JPY 338,007, whereas adding BESS lowers mean household NPV to JPY −907,448. The implied break-even BESS capital cost is JPY 39,840/kWh, far below the JPY 200,000/kWh base assumption. A +50% retail-price escalation case improves mean PV-BESS NPV by JPY 788,381 but remains below break-even. During a 72 h outage, BESS serves 84.8% of assumed critical demand. The limiting factor is insufficient monetizable household value, not technical usefulness.
1. Introduction
Japan’s post-feed-in tariff (post-FIT) residential photovoltaic (PV) market creates a new household value problem. During the feed-in tariff (FIT) period, surplus PV sold to the grid was supported by administratively determined purchase prices. Under current and post-FIT conditions, the private value of residential PV depends increasingly on avoided retail purchases, self-consumption timing, and exposure to fuel-cost and tariff changes [1,2,3,4,5,6,7,8,9]. This shift makes household electricity-demand timing more important than annual PV generation alone.
Residential battery energy storage systems (BESSs) are a common technical response to this change. By storing surplus daytime PV and discharging later, batteries can increase self-consumption, improve self-sufficiency, and support critical electricity demand during outages [10,11,12,13,14,15,16,17]. However, these operational benefits must be evaluated against capital cost, replacement cost, round-trip losses, and foregone surplus-PV sales revenue.
In Japan, residential BESS adoption is shaped simultaneously by declining surplus purchase prices, high installed battery costs, local subsidy programs, disaster-preparedness concerns, and emerging zero-initial-cost or third-party ownership offerings [18,19,20,21,22,23,24,25,26,27]. The central economic question is whether households can capture enough monetary value from that operation under current policy and market conditions.
Existing PV-BESS studies have examined tariff sensitivity, battery sizing, optimization-based dispatch, degradation, resilience, and business-model design [10,11,12,13,14,15,16,17,25,28,29,30,31,32,33,34,35,36,37,38,39,40]. Much of this work shows that BESS can increase self-consumption, reduce surplus PV sold to the grid, or improve autonomy. Less clear, especially for the current Japanese post-FIT setting, is whether the additional value of these functions is large enough to cover the battery’s capital and replacement costs. This requires separating PV-only value from the incremental value of storage rather than reporting only the combined value of a PV-BESS package.
Kyushu provides a policy-relevant setting for this assessment. The region has strong solar-resource relevance and has been central to renewable-output-control discussions, while residential households face post-FIT surplus-purchase conditions similar to those elsewhere in Japan. At the same time, Kyushu has its own retail tariff structure, fuel-cost adjustments, distributed-energy service offerings, and exposure to typhoons, heavy rainfall, earthquakes, and other hazards [9,41,42,43,44,45,46]. These features make it an informative setting for examining the interaction between PV economics, battery dispatch, and resilience value.
This paper evaluates whether incremental BESS value can justify battery capital and replacement costs under current Japanese surplus-purchase-price and retail-tariff conditions. The case is a fixed 4 kW PV and 5 kWh BESS package. The analysis separates PV-only value from storage value and tests whether bill savings, retail-price escalation, VoLL-based outage resilience, battery cost and capacity sensitivities, forecast-realism adjustment, local subsidy treatment, and a secondary TPO benchmark materially change the result. The empirical context combines 181 household electricity-demand profiles with a six-household audited 30 min detached-household dataset.
The main case uses a 4 kW PV system and a 5 kWh BESS dispatched with a fixed-capacity mixed-integer linear programming (MILP) model under perfect foresight. This upper-bound dispatch case is paired with lifecycle NPV accounting to test whether the selected battery package can recover its capital and replacement costs under current household tariff and surplus-PV sales conditions.
This paper contributes household-level evidence on the sources and limits of residential PV-BESS value in the current Japanese context. It quantifies PV-only value, incremental storage value, and the extent to which bill savings, outage resilience, subsidies, tariff exposure, and ownership design affect private cost-effectiveness.
Accordingly, the paper asks the following policy-oriented research questions:
RQ1. Under Japan’s current FIT/post-FIT surplus-purchase-price conditions and Kyushu residential retail-tariff structure, how do PV-only and PV-BESS configurations differ in lifecycle household value?
RQ2. After separating PV-only value from the incremental value of storage, what additional operational and economic value is attributable to a fixed 5 kWh BESS through increased self-consumption, reduced electricity purchased from the grid, and reallocation of surplus PV from grid sale to battery charging?
RQ3. How much outage resilience can the PV-BESSs provide in terms of critical-demand served ratio, and how does VoLL-based event valuation affect the economic interpretation of residential BESS adoption?
RQ4. Under a perfect-foresight MILP benchmark, can stacked household value justify the capital and replacement costs of residential BESS, and what boundary conditions would be required for the battery case to break even?
The remainder of the paper is organized as follows. Section 2 reviews the related literature and identifies the research gaps. Section 3 describes the modeling framework and evaluation metrics. Section 4 presents the data, parameters, and scenario assumptions. Section 5 reports the results, Section 6 discusses their implications and limitations, and Section 7 concludes the paper.
2. Literature Review
2.1. Techno-Economic Valuation of Residential PV-BESS in the FIT/Post-FIT Era
The economic interpretation of residential PV-BESSs depends strongly on the policy regime used to value surplus PV electricity. During the FIT period, administratively determined purchase prices reduced investment uncertainty and made surplus-PV sales remuneration a central part of household PV economics [6,7]. Kimura et al. (2025) [7] show that Japan’s high FIT levels affected residential solar PV investment conditions, while the Agency for Natural Resources and Energy (2019) [8] documents the institutional shift faced by residential PV owners after FIT purchase periods expire. When surplus purchase prices fall below retail purchase prices, PV value shifts toward avoided grid purchases and on-site self-consumption [8,9]. Recent studies by Cai et al. (2024) [10], Chatzigeorgiou et al. (2024) [11], and Mendes Ferreira Gomes et al. (2024) [12] show that batteries can increase self-consumption and self-sufficiency, but their economic value depends on tariff design, surplus-PV compensation, round-trip losses, battery cost, and temporal matching between generation and demand.
Japan-specific studies reach a similar conclusion while adding important local constraints. Yabe and Hayashi (2019) [15] show that storage can increase the self-use of residential PV output under low surplus-purchase-price conditions. Honda et al. (2021) [16] evaluate residential PV and battery profitability using Japanese household electricity data and show that outcomes vary with electricity-use patterns. Matsubara et al. (2025) [17] further extend this line of research by incorporating outage mitigation and battery degradation. Taken together, these studies suggest that post-FIT conditions increase the operational relevance of storage, but they do not by themselves establish that storage is economically justified. The distinction also implies that PV-BESS studies should separate the value of PV itself from the incremental value of adding storage, rather than reporting only the total value of a combined system.
Household electricity demand heterogeneity is a major reason why this conclusion remains case-dependent. Annual electricity demand is not sufficient to determine PV self-consumption or battery value, because storage utilization depends on intra-day and seasonal alignment between PV generation and household electricity demand. Qiu et al. (2022) [31] show, using individual-consumer hourly smart-meter data, that battery adoption changes residential PV consumers’ electricity-use patterns heterogeneously. Zhang et al. (2024) [32] similarly show that demand-management potential varies across households and technology combinations, while Memtimin et al. (2025) [33] provide recent evidence on Japanese household PV adoption and energy consumption. Recent residential battery-sizing studies by Gebhard et al. (2026) [13] and Khezri et al. (2022) [14] also show that high-resolution load and PV time series are important for economic sizing and self-consumption assessment. Existing distributed energy technologies, such as residential fuel cells, further change the residual load and can confound the valuation of an additional PV-BESS investment.
2.2. Dispatch Modeling and Lifecycle Cost Assumptions
Residential PV-BESS studies commonly use either rule-based dispatch or optimization-based dispatch. Rule-based models can represent intuitive strategies, such as charging from surplus PV and discharging during evening demand, but they may become restrictive when tariff structure, surplus purchase price, and technical constraints interact. Mendes Ferreira Gomes et al. (2024) [12] and Khezri et al. (2022) [14] both emphasize that storage value is sensitive to tariff and technical assumptions. This limitation is especially relevant when a lifecycle includes both higher FIT surplus purchase prices in early years and lower post-FIT purchase prices later. In such cases, a simple rule that always stores PV surplus may be less economic than immediate sale to the grid in some periods, depending on the tariff spread and round-trip efficiency.
Optimization-based approaches, especially MILP, are widely used in PV-BESS and home-energy-management studies because they can represent household energy balance, PV allocation, battery stored-energy dynamics, charging and discharging limits, binary operating states, and grid-interaction constraints within one framework. Erdinc (2023) [28] develops a rolling-horizon MILP energy-management model for residential PV and ESS operation, while Han et al. (2022) [29] apply detailed techno-economic modeling to PV-battery systems under tariff and operational assumptions. Ballesteros-Gallardo et al. (2021) [30] and Khezri et al. (2020) [34] further illustrate the use of optimization models for residential PV-storage design and capacity assessment. Capacity-optimized and fixed-package evaluations answer different questions. The former identifies a technical or economic optimum under model assumptions; the latter evaluates whether a commercially plausible package performs well for a given household and policy context.
A further modeling issue is the information assumption behind optimized dispatch. Many optimization-based studies rely on perfect foresight of PV output and household demand, which is useful for benchmarking but can overstate savings relative to deployable real-time home energy management system (HEMS) control under forecast error and behavioral uncertainty. Distinguishing perfect-foresight upper-bound value from forecast-limited operation is therefore important when interpreting BESS profitability.
Lifecycle cost assumptions also shape PV-BESS conclusions. Chatzigeorgiou et al. (2024) [11] and Khezri et al. (2022) [14] identify PV and BESS capital expenditure (CAPEX), inverter efficiency, round-trip efficiency, allowable stored-energy range, power-energy ratio, operation and maintenance (O&M) cost, replacement timing, discount rate, and residual value as important drivers of net present value (NPV) and payback. Japanese cost discussions and stationary storage policy materials provide useful benchmarks, but installed residential prices still vary by equipment type, installation conditions, subsidy eligibility, and vendor offering [18,35]. Battery degradation adds further uncertainty. Matsubara et al. (2024, 2025) [17,36] show that degradation can affect the cost-effectiveness and outage-mitigation value of Japanese residential PV/BESSs, while Orth et al. (2023) [37] document efficiency variation across residential PV-battery systems. Advanced models may represent degradation through cycle depth, average state of charge (SOC), temperature, C-rate, or semi-empirical functions, while simpler lifecycle models often use fixed lifetime and replacement assumptions for transparency. Both approaches are defensible, but they require clear reporting because degradation treatment can affect both dispatch behavior and financial interpretation.
2.3. Emerging Value Channels: Outage Resilience, Subsidies, and Business Models
Recent PV-BESS research increasingly considers value channels beyond conventional bill savings. Outage resilience is one such channel. The National Renewable Energy Laboratory (2018) [20] frames solar-plus-storage resilience in terms of avoided outage impacts, while Sun et al. (2025) [38] show that solar and batteries can provide outage backup as well as energy-cost savings for households. Residential PV-BESSs can support critical electricity demand during outages if islanding capability, available PV generation, and sufficient battery state of charge are present. However, monetizing this service is difficult. Sullivan et al. (2015) [21] provide customer-interruption-cost estimates, and Matsubara et al. (2025) [22] estimate residential VoLL in Japan, but both lines of evidence show that outage value depends on outage duration, warning time, household characteristics, and risk preferences. As a result, event-based resilience value should be distinguished from probability-weighted annual benefit unless outage probabilities are explicitly estimated.
Policy incentives provide another important value channel because residential BESS remains capital intensive. In Japan, this issue is especially relevant because installed residential battery prices remain high, while subsidy rules and service contracts vary across national and local programs. Stationary-storage policy materials from Japan’s Ministry of Economy, Trade and Industry (METI) (2025) [18] identify battery affordability as a policy concern, and Fukuoka City’s residential energy-system support program (2026) [19] illustrates how local subsidies may depend on program-specific eligibility rules. Capital subsidies can improve household economics by reducing upfront costs, but their effects depend on capacity thresholds, HEMS or demand-response requirements, stacking constraints, and whether the subsidy applies to PV, BESS, or both. Ansarin et al. (2020) [39] and Shakeel et al. (2023) [40] further show that tariff design, policy cost recovery, and household PV adoption can raise distributional issues between prosumers and non-prosumers. These studies imply that subsidy and tariff effects should be handled transparently rather than folded into a single generic profitability claim.
Business-model design has also become central to residential PV-BESS adoption. The Japan Photovoltaic Energy Association (2026) [23] describes third-party ownership (TPO) and zero-initial-cost solar services as adoption pathways that reduce upfront household CAPEX, while the International Energy Agency Photovoltaic Power Systems Programme (IEA PVPS) (2024) [24] documents the broader diffusion of PV business models. Yamashiro and Mori (2023) [25] examine combined TPO and aggregation for rooftop PV-battery systems in Miyakojima, Japan, showing that such models can affect both adoption and value allocation. Public service pages and plan lists usually disclose monthly fees, contract terms, and surplus-PV sales-rights treatment, which are sufficient for a household cash-flow benchmark [26,27]. Subsidies and TPO contracts are treated as mechanisms that reduce or reallocate household cash-flow burden.
2.4. Research Gaps and Positioning of This Study
The reviewed literature provides strong foundations for residential PV-BESS analysis, but several gaps remain for the Japanese post-FIT context. First, many studies emphasize capacity optimization, whereas actual households often face fixed commercial packages, subsidy thresholds, and contract offerings. A fixed-package analysis is therefore needed to evaluate what households are likely to purchase or contract for, rather than only what an optimization model would choose. Second, post-FIT research often focuses on low surplus purchase prices alone, while a current Japanese investment case should represent both early FIT years and later post-FIT years within the same lifecycle. This matters because revenue from surplus PV sales can be more valuable than storage in some years and less valuable in others.
Third, PV-BESS value channels are often examined separately. Bill savings, resilience, tariff exposure, and ownership structure answer different questions and can point to different conclusions. Fourth, household electricity demand heterogeneity remains difficult to interpret. High-resolution electricity-demand data can reveal differences in self-consumption and storage utilization, especially when case-study evidence is supported by broader contextual information.
This paper evaluates a fixed PV-BESS package offered to households, rather than an optimized system size, and tracks its value across both current FIT and post-FIT surplus-purchase periods. It separates PV-only value from incremental storage value and then tests how that result changes when tariff exposure, outage resilience, technology cost, and ownership structure are included.
3. Methodology
3.1. Research Framework, Scenario Structure, and Analytical Pathway
The analysis evaluates a fixed residential PV-BESS package by linking household electricity-demand data, a common technical intervention, dispatch optimization, annual value accounting, and lifecycle economic interpretation. Figure 1 summarizes this integrated pathway. The four household electricity-demand profiles define the demand side, and the fixed 4 kW PV and 5 kWh BESS package defines the technical intervention. The MILP dispatch converts interval PV and demand into grid purchases, surplus PV sold to the grid, BESS charge/discharge, and stored battery energy. These annual outputs are then embedded in a 25-year cash-flow model to calculate NPV, incremental NPV, profitability index (PI), and break-even BESS CAPEX. In Figure 1, self-consumption rate (SCR) and self-sufficiency rate (SSR), defined formally in Section 3.5.2, are annual operating indicators.
Figure 1.
Integrated analytical pathway and scenario framework.
Table 1 defines the scenario boundaries used within this pathway. S0 and S1 form the core owned-system comparison, S2–S4 test retail-price and outage-related value channels using the same 4 kW PV and 5 kWh BESS configuration, and S5a–S5b provide secondary product-package and TPO benchmarks based on a public 5 kW PV and 7.7 kWh BESS offer. The robustness checks include time-of-use (TOU) tariff sensitivity, BESS-capacity checks, the Fukuoka subsidy case, and the forecast-realism proxy. The following subsections then provide the data boundary, technical assumptions, dispatch formulation, economic metrics, and robustness modules.
Table 1.
Summary of the scenario structure and evaluation boundaries.
Figure 2 defines the annual energy-flow accounting boundary corresponding to the dispatch-output and annual-value-accounting layers in Figure 1. It includes only annual energy flows in kWh/year: PV generation is allocated to direct PV use, BESS charging, and surplus PV sold to the grid; BESS discharge and grid purchase then serve household demand. The nominal BESS capacity is 5 kWh and is not shown as an annual energy-flow quantity.
Figure 2.
Annual energy-flow accounting boundary for the 4 kW PV + 5 kWh BESS case.
3.2. Household Data and Electricity-Demand Reconstruction
The empirical material first provides a broader 181-household electricity demand background for contextualizing residential demand diversity. From the detailed audited modeling set, six detached-household datasets are screened, and four non-fuel-cell households are used for the core PV-BESS dispatch and economic calculations. The detailed inclusion boundary is reported in Section 4.1.
The six model-ready datasets are audited for timestamp consistency, observation period, time resolution, missing intervals, duplicate timestamps, negative values, apparent outliers, and available technology channels. Gross household electricity demand is either taken from a measured demand channel or reconstructed from the measured electricity balance:
where is gross household electricity demand, and are observed grid purchase and surplus PV sale, is observed PV generation, and are observed battery charge and discharge, and is observed fuel-cell generation. The PV-BESS investment analysis then uses with a common externally defined Photovoltaic Geographical Information System (PVGIS) profile for the new PV system, keeping existing equipment effects separate from the proposed investment.
3.3. PV-BESS Configuration, Tariff, and Surplus-Purchase-Price Assumptions
The main configuration is fixed at 4 kW PV and 5 kWh BESS. PV generation is represented by a common modeled Fukuoka PV profile, and BESS operation is constrained by fixed capacity, power, efficiency, stored-energy bounds, and no-grid-charging assumptions. Larger batteries are evaluated only as fixed-capacity robustness checks. The numerical values and sources are reported in Section 4.
The baseline tariff is represented as a monthly increasing-block residential tariff, while the time-of-use (TOU) case uses interval-specific energy charges. The surplus-purchase-price schedule represents a current investment lifecycle with feed-in tariff/feed-in premium (FIT/FIP) years followed by post-FIT surplus purchase years. Fixed charges are excluded from the variable-charge comparison because household contract amperage is not verified and fixed charges do not change across grid-only, PV-only, and PV-BESS operation under the same retail contract. The detailed tariff, surcharge, and surplus-purchase-price assumptions are given in Section 4.
3.4. Fixed-Capacity MILP Dispatch Model
For each household, scenario, and surplus-purchase-price period, the fixed-capacity PV-BESS dispatch is solved at 30 min resolution. The model uses the modeled PVGIS PV profile and reconstructed electricity-demand profile as known inputs. Energy-flow variables are expressed in kWh per interval; Δt is used only to convert power limits in kW to interval energy limits. In the formulation, denotes stored battery energy at interval t (kWh), while is used only when a state-of-charge fraction or percentage is required.
The notation used in the mathematical formulation is summarized in the Nomenclature section.
The objective minimizes household variable electricity cost net of revenue from surplus PV sales:
Equation (2) is written as a single net-cost summation: retail grid-purchase cost and surplus-PV sale revenue are evaluated together inside one parenthesis for each dispatch interval.
All continuous energy-flow variables are non-negative. For Juryo Dentou B, monthly electricity purchased from the grid is assigned to increasing-block variables:
where and are the first- and second-tier thresholds. For the TOU case, is interval-specific. Because the Japanese residential FIT/post-FIT arrangement considered here is a surplus-purchase scheme, direct PV self-consumption is treated as physically prior to surplus sale to the grid. The model therefore defines residual demand and surplus PV as:
The optimized residual-load and surplus-PV balances are:
Battery charging is supplied only by PV surplus, and battery discharge is assigned only to household electricity demand. Grid charging and battery discharge to the grid are not allowed; residual PV surplus is allocated between battery charging and surplus PV sold to the grid.
Stored battery energy evolves as:
with:
where the binary variable restricts the system to charging mode when , and to discharging or idle mode when , thereby preventing simultaneous charge and discharge. Battery self-discharge is neglected because the model focuses on daily PV-BESS cycling. The initial stored energy is set to , where is zero in ordinary dispatch and 20% in outage-related cases. Terminal stored energy is free, with no terminal stored-energy credit; terminal stored-energy gaps are logged to check that end-of-horizon effects do not drive reported annual savings.
3.5. Economic and Resilience Evaluation Metrics
3.5.1. Lifecycle Economic Accounting
The economic evaluation is framed as a private household energy-service investment rather than a conventional commercial revenue project. The household owner does not operate the PV-BESS package as a profit-maximizing firm; the monetized benefits are avoided grid purchases, surplus-PV sales/feed-in revenue, and, in the outage scenario, avoided outage value. Accordingly, the accounting follows discounted cash-flow and lifecycle-costing practice for energy-efficiency and renewable-energy technologies [47], while the interpretation of investment barriers is informed by the energy-efficiency-gap literature [48,49]. NPV reports the absolute discounted household value of each configuration, incremental NPV isolates the additional contribution of BESS relative to PV-only, and PI is used as a scale-normalized companion metric.
The lifecycle economic model uses a 25-year assessment horizon aligned with the residential PV lifecycle in the paper. This horizon covers FIT years 1–10 and post-FIT years 11–25. A 15-year horizon would not capture the post-FIT period sufficiently, whereas a 30-year horizon would extend beyond the PV financial evaluation period and increase uncertainty in post-FIT assumptions. The year-15 BESS replacement is treated as a warranty/service-term based scenario assumption rather than as an optimized degradation outcome. Terminal residual value is set to zero because verified household-scale resale or second-life values are not available for the modeled Japanese residential setting.
Cash inflows are defined as positive values and include avoided retail electricity purchases, surplus-PV sales/feed-in revenue, and avoided outage value when outage valuation is activated. Cash outflows are defined as negative values and include PV CAPEX, BESS CAPEX, annual O&M, the year-15 BESS replacement, and, in the TPO benchmark, the fixed service fee. This sign convention is used consistently when interpreting cash-flow components: inflows increase household value, while outflows reduce it.
The annual net cash flow is defined as , where is the present-year benefit from avoided grid purchases, surplus-PV sales/feed-in revenue, and monetized outage service, and is the present-year cost from O&M, BESS replacement, and applicable service fees. Upfront PV and BESS CAPEX are assigned to year 0. NPV is then the discounted sum of annual bill savings, feed-in revenue, outage-value benefits where applicable, O&M costs, replacement costs, and initial investment costs: , where is initial investment, r is the discount rate, and is terminal residual value. In the base model, = 0.
Annual net electricity cost is calculated as:
Annual savings are measured relative to a grid-only reference:
Lifecycle net present value (NPV) is calculated over 25 years:
where initial investment includes PV CAPEX and, for PV-BESS owned cases, BESS CAPEX; annual O&M is treated as an annual outflow; replacement cost is applied in year 15 for owned PV-BESS cases; the discount rate is 4%; and residual value is set to zero. Under this formulation, positive annual benefits must recover upfront investment, recurring costs, and the year-15 battery replacement within the 25-year lifecycle. Incremental BESS NPV is calculated as:
Profitability index (PI) is reported as a scale-normalized companion to NPV and is defined as the present value of lifecycle benefits divided by the present value of investment and lifecycle costs. A PI greater than 1 indicates that discounted benefits exceed discounted costs; a PI below 1 indicates that the investment does not recover its discounted cost base. For the storage-addition case, incremental BESS PI is calculated as incremental BESS operating value divided by the absolute present value of BESS CAPEX and discounted year-15 replacement cost. Internal rate of return (IRR) is not used as the primary indicator because the studied cases include negative and potentially non-conventional cash-flow patterns, especially year-15 replacement costs, outage-value scenarios, and TPO service fees, which can make IRR unstable, non-unique, or economically hard to interpret.
3.5.2. Operational and Resilience Metrics
Self-consumption rate (SCR) is defined as the share of PV generation consumed on site, including direct PV use and PV energy later discharged from the battery. Self-sufficiency rate (SSR) is defined as the share of household electricity demand supplied by on-site PV and PV-charged battery discharge. Both indicators are reported as annual ratios.
Retail-price escalation scenarios scale purchase prices by , where is 0%, +10%, +25%, or +50%. Surplus-purchase prices are held fixed.
Outage resilience is evaluated as event-based value rather than expected annual outage loss. Critical electricity demand is defined as:
where . For each valid outage start time, initial outage stored energy is taken from the normal reserve-constrained dispatch trajectory. During the outage, PV first serves critical electricity demand, BESS discharge covers remaining critical electricity demand subject to stored-energy and power limits, and surplus PV can recharge the BESS. The critical-demand served ratio (CLSR) and unserved critical electricity demand are:
Event value is based on avoided unserved critical electricity demand:
where denotes no islanded backup. Under this baseline, the expression is equivalent to applying VoLL to served critical-demand energy. VoLL is set to 559.9 JPY/kWh [22].
3.6. Robustness, Forecast-Realism Proxy, and TPO Benchmark
Economic robustness is assessed through fixed-capacity battery checks, the FY2026 Fukuoka City battery subsidy, and a break-even BESS CAPEX threshold [19]. Under the no-subsidy base case, the household-specific break-even gross BESS CAPEX per kWh is:
where is the present value of incremental operating savings from adding BESS to PV-only before battery capital and replacement costs, is battery capacity, and is the replacement-cost fraction. This expression assumes that the replacement battery cost scales with the initial unit BESS CAPEX and occurs in year 15. Because no separate BESS O&M is assigned in the base model, represents incremental bill savings before battery capital and replacement costs. To avoid conflict with photovoltaic (PV), the notation does not use for present value because PV denotes photovoltaic throughout the paper.
Because MILP dispatch uses perfect foresight, a forecast-realism proxy sensitivity attenuates only the incremental BESS savings relative to PV-only:
where and is the perfect-foresight PV-BESS saving. This attenuation check tests whether the BESS conclusion depends on realizing the full perfect-foresight operating value.
The secondary TPO benchmark is treated as a household cash-flow benchmark. S5a evaluates the public-offer physical package as a 25-year household-owned counterfactual, including CAPEX, O&M, year-15 battery replacement, and household revenue from surplus PV sales. S5b evaluates the same package over the public fixed-fee service term with zero upfront household CAPEX, a monthly service fee, and no household revenue from surplus PV sales. The product package, service term, and fee are specified in Section 4.5. Under the sign convention above, the monthly TPO fee is treated as a household outflow and any household-retained surplus-PV sales revenue is treated as an inflow; in S5b, surplus-PV sales revenue is assigned to the service provider and is therefore not included as a household inflow. The household TPO cash flow is:
and the 15-year TPO NPV is:
where is the fixed monthly service fee. S5b is evaluated over the public service term rather than the 25-year owned-system lifecycle.
The analysis is implemented in Python 3.12.13 using PuLP 3.3.2 and HiGHS solver via highspy 1.14.0. Data availability is described in the Data Availability Statement. Solver status, parameter settings, assumptions, and output logs were checked during model implementation.
4. Data, Parameters, and Scenario Assumptions
This section presents the empirical inputs and numerical assumptions used in the methodology. The analysis evaluates observed household electricity-demand profiles under current-policy tariff, surplus-purchase-price, cost, and resilience conditions. The larger 181-household electricity demand background establishes the demand-diversity context, followed by the six audited model-ready households and the four non-fuel-cell households used in the core dispatch and economic results.
4.1. Household Data Source and Audit
The additional 181 household electricity-demand profiles provide the broader electricity-demand-diversity context. Their annualized electricity-demand range is 2224.0–13,402.5 kWh/year, with a median of 6240.4 kWh/year, based on the available smart-meter observations.
Within this broader context, the audited modeling dataset contains six detached-household profiles with 30 min observations. Available channels include electricity purchased from the grid, surplus PV sold to the grid, PV generation, battery charge, battery discharge, measured gross electricity demand where available, fuel-cell generation, and heat-pump electricity. When measured gross electricity demand is not directly available, it is reconstructed from the audited metering channels as described in Section 3.2. The reconstructed electricity demand is used as household demand input for the current-policy techno-economic assessment, while the proposed PV-BESS is simulated using a common fixed PV profile and fixed battery capacity.
Table 2 summarizes the audit results. The four non-fuel-cell households used in the main economic model are labeled Residence 1, Residence 2, Residence 3, and Residence 4. The two audited fuel-cell households retained only for data-audit reporting are labeled Residence 5 and Residence 6. Residence 5 and Residence 6 are excluded from the main economic runs because measured residential fuel-cell generation changes residual demand and would require a separate technology-cost boundary. Heat-pump electricity is retained as part of actual household electricity demand and is relevant to PV self-consumption and storage dispatch.
Table 2.
Audited household datasets (observation period: 1 April 2017 to 31 March 2018).
The four main-model households have annual gross electricity demand from 6595.82 to 12,485.06 kWh/year and peak demand from 4.65 to 6.89 kW. Three of the four have measured heat-pump electricity of 1536.79–1801.55 kWh/year, indicating that electrified thermal demand is an important source of heterogeneity. Missing intervals are very limited, with two missing 30 min intervals for Residence 2 and three for Residence 4. These gaps are not interpolated; incomplete intervals are skipped, and the audit flag is preserved so that the sample boundary is explicit.
Peak demand values in Table 2 and Figure 3 are the maximum 30 min average demand values expressed in kW, whereas the 5 kWh BESS size is stored-energy capacity. These quantities are not directly comparable. When household demand exceeds the battery discharge power limit or available stored energy, the MILP balance supplies the residual demand through grid purchase.
Figure 3.
Main-model household electricity-demand summary: (a) annual electricity demand (MWh/year) and (b) peak demand (kW). R1, R2, R3, and R4 denote Residence 1, Residence 2, Residence 3, and Residence 4, respectively.
4.2. Solar Resource and Fixed PV Input
PV generation is represented by a common Fukuoka PVGIS-ERA5 profile for a 4.0 kWp residential system [50]. The annual output is 4851.36 kWh/system, equivalent to 1212.84 kWh/kW-year. The PVGIS setup uses a 14% system loss factor, 32-degree tilt, and 1-degree azimuth. The profile is converted to 30 min kWh and assigned to each household so that differences in model results arise from household demand timing rather than different PV sizes. NEDO METPV is treated as the official Japanese solar-radiation database context, but the implemented profile uses PVGIS because it provides an accessible online PV time series for the study location [50,51].
The fixed 4 kW PV assumption is a scenario design choice that reflects a realistic residential-scale system and keeps the comparison focused on household economic value under a common PV-BESS package. The PVGIS profile already includes system losses, so no additional inverter-loss multiplier is applied. NREL PVWatts is used only as a cross-check for PV modeling assumptions [52].
4.3. Tariff, FIT/Post-FIT Surplus-Purchase Price, and Retail Price Treatment
The main tariff case uses Kyushu Electric’s Juryo Dentou B residential tariff as the standard retail plan. The volumetric energy blocks are 18.37 JPY/kWh for the first 120 kWh/month, 23.97 JPY/kWh for 121–300 kWh/month, and 26.97 JPY/kWh above 300 kWh/month [42]. Fuel cost and related adjustment is included as a 1.24 JPY/kWh current-policy adder, and the renewable energy surcharge is included as 4.18 JPY/kWh for the May 2026–April 2027 billing period [5,43]. Fixed basic charges are not included in the variable-charge lifecycle comparison because verified household contract amperage is unavailable and fixed charges cancel when comparing PV-only and PV-BESS operation under the same retail contract.
The surplus-purchase-price schedule represents a current residential investment lifecycle. For systems below 10 kW, the lifecycle model follows the FY2026 FIT/FIP purchase-price path of 24.0 JPY/kWh in project years 1–4 and 8.3 JPY/kWh in years 5–10, followed by Kyushu Electric’s post-FIT purchase price of 7.0 JPY/kWh in years 11–25 [9,35]. The optional time-of-use sensitivity uses Kyushu Electric’s Denka de Night Select 22 tariff, with the low-price period from 22:00 to 08:00, and is interpreted as an energy-charge sensitivity because tariff eligibility, fixed charges, and all-electric contract conditions differ across households [53].
4.4. Technical and Economic Parameters
Table 3 provides a compact assumptions table for the main text. It separates technical, economic, tariff, resilience, and ownership assumptions that define the modeling boundary. The full parameter list, source notes, and scenario-specific details are retained in Appendix C Table A4.
Table 3.
Compact assumptions used in the fixed PV-BESS evaluation.
PV O&M is included in total lifecycle NPV, but it is common to the PV-only and PV-BESS cases because both include the same 4 kW PV system. No separate incremental BESS O&M item is assigned beyond the system O&M assumption; the year-15 replacement cost is modeled explicitly, and a 4% mid-range private-investment discount rate is applied. Residual value is treated as zero because verified household-scale resale or second-life values are not available for the modeled Japanese residential setting. This zero-residual assumption is noted as a limitation and a possible extension for longer-horizon NPV assessment.
4.5. Resilience, Economic Robustness, and Secondary TPO Inputs
Resilience is evaluated through event-based outage scenarios of 2, 12, 24, 48, and 72 h. The model samples all valid 30 min outage start times with complete PV and demand windows, applies the 25% critical-demand ratio, and assumes PV-BESS islanding capability with a 20% emergency reserve. The reported resilience value is based on served critical demand and VoLL [20,22].
Economic robustness inputs are kept compact. Capacity sensitivity uses the fixed 7.7, 10.0, and 13.5 kWh battery cases already defined in Table 3. Local subsidy treatment uses the FY2026 Fukuoka City residential energy-system support program: 50% of eligible battery equipment cost, subject to capacity-tier caps of 150,000 JPY for systems below 9 kWh, 300,000 JPY for 9 to below 14 kWh, and 450,000 JPY for 14 kWh or above, with the subsidy rounded down below 1000 JPY [19]. The base case remains the no-subsidy market-cost result.
The TPO/business-model case uses Sharp COCORO POWER as a public fixed-fee solar-battery benchmark: 14,520 JPY/month, 15-year service term, zero upfront cost to the household, and generated-electricity rights transferred to the service provider [26,27]. The public benchmark uses a product-aligned 5 kW PV and 7.7 kWh BESS mid-capacity package, reflecting the plan’s public PV-capacity condition and common Japanese residential solar-battery product sizes [27,57]. The analysis separates S5a, an owned 5 kW PV + 7.7 kWh BESS package counterfactual, from S5b, the fixed-fee TPO contract benchmark.
4.6. Interpretation Boundary
The principal interpretation is based on S0–S4, which share the 4 kW PV and 5 kWh BESS physical configuration defined in Section 3.2 and Section 3.4. S5a and S5b examine a public market offer with a different product package. The following results therefore distinguish the main owned-system cases from secondary sensitivity and market-offer benchmarks.
5. Results
The results first compare the PV-only and PV-BESS lifecycle economics, then examine the operating mechanism behind the battery result. Subsequent sections report retail-price escalation, outage-value, compound-stress, market-offer, and forecast-realism checks.
5.1. Observed Household Electricity-Demand Characteristics
Figure 3 summarizes the four main-model households used in the lifecycle economic analysis. Annual gross electricity demand spans 6.6–12.5 MWh/year, with Residence 3 showing the highest annual demand. Peak demand spans 4.7–6.9 kW, with Residence 2 showing the highest peak. Residence 1 is the only main-model case without measured heat-pump electricity, while Residence 2, Residence 3, and Residence 4 have measured heat-pump consumption of 1536.79–1801.55 kWh/year. The broader 181-household context shows that residential demand timing and magnitude vary substantially across households.
Figure 4 adds the daily timing dimension behind the annual and peak-demand statistics in Figure 3. The summer and winter profiles show that household demand differs not only in scale, but also by season and hour of day. These timing differences determine how much PV can be used directly, how often the BESS can be charged from surplus PV, and how much residual demand must still be supplied by grid purchase.
Figure 4.
Summer and winter daily household electricity-demand profiles. (a) Summer mean daily electricity-demand profile with the shaded band showing ±SD across households. (b) Winter mean daily electricity-demand profile with the shaded band showing ±SD across households.
5.2. Core PV-Only Economic Result Under the FIT/Post-FIT Lifecycle
The baseline FIT/post-FIT PV-only case uses a fixed 4 kW PV system for each main-model household. The surplus-purchase-price schedule is 24.0 JPY/kWh in years 1–4, 8.3 JPY/kWh in years 5–10, and 7.0 JPY/kWh in years 11–25. The PV-only case has positive NPV for all four households.
Table 4 presents the S0 reference case used as the economic baseline for incremental BESS value. The fixed 4 kW PV system produces positive NPV for all four households, while SCR and SSR vary with each household’s ability to absorb daytime PV.
Table 4.
Baseline FIT/post-FIT PV performance without BESS, S0.
Mean PV-only NPV is JPY 338,007. The highest PV-only value occurs for Residence 3, which has the largest annual electricity demand and can absorb more PV generation on site. The slight PV-generation difference for Residence 4 reflects skipped intervals associated with preserved audit gaps.
5.3. Operating Mechanism: PV-BESS Dispatch and Self-Consumption
The main PV-BESS case uses the selected 5 kWh residential BESS. This selected-capacity analysis matches the study objective: evaluating household value for a representative residential PV-BESS package. The 7.7 kWh case is reserved for the TPO mid-capacity benchmark, while 10 and 13.5 kWh cases are folded into the economic sensitivity check.
Adding the 5 kWh BESS increases PV self-consumption and reduces surplus PV sold to the grid in year 11, when the surplus purchase price is the post-FIT price of 7.0 JPY/kWh. However, higher self-consumption does not imply positive investment economics.
Table 5 translates the dispatch model into annual year-11 operating metrics. The 5 kWh BESS charges mainly from surplus PV, discharges later to meet household demand, and thereby reduces both grid purchase and surplus PV sold to the grid relative to Table 4. The larger SCR values show the technical benefit of storage, while the remaining grid purchase confirms that the battery is not sized to eliminate grid dependence.
Table 5.
PV-BESS dispatch results for selected 5 kWh battery, S1.
Figure 5 illustrates the sub-daily mechanism behind the annual totals in Table 5. PV generation first supplies contemporaneous demand, surplus PV charges the BESS when storage headroom is available, and stored energy is discharged during later demand periods. The stored-energy trace also illustrates the power and energy constraints that limit full PV shifting.
Figure 5.
Weekly PV-BESS dispatch and stored-energy profile. (a) PV generation and its allocation to direct household demand, BESS charging, and surplus PV sold to the grid. (b) Grid purchase, BESS discharge, and the retail purchase-price profile over the same week. (c) BESS charging/discharging power and stored battery energy.
Residence 3 achieves the highest year-11 SCR because its large annual electricity demand and measured heat-pump electricity create a larger residual demand sink for PV and stored energy. In contrast, Residence 1 has no measured heat-pump electricity and a lower annual electricity demand, leaving more daytime PV surplus that cannot be fully shifted by the 5 kWh battery and is therefore sold to the grid. This confirms that BESS dispatch value is shaped not only by PV surplus availability but also by the timing and magnitude of post-PV household demand.
5.4. Lifecycle NPV Bridge and Break-Even Cost
Baseline economic performance shows a clear difference between PV-only and PV-BESS. The 5 kWh battery increases annual savings, but the added battery investment and year-15 replacement cost make PV-BESS NPV negative for all four households.
Table 6 presents the PV-BESS result as a standalone investment case. The added battery increases annual savings relative to PV-only, but all four PV-BESS NPVs remain negative and discounted payback is not reached. Table 7 then decomposes this economic gap into PV-only value, incremental BESS value, and common battery outflows.
Table 6.
Baseline PV-BESS economic performance under Juryo Dentou B, S1.
Table 7.
Lifecycle NPV bridge between PV-only and PV-BESS.
The bridge table uses the signed cash-flow convention defined in Section 3.5.1. Positive values denote discounted operating benefits or inflows, and negative values denote investment or replacement outflows. The common PV CAPEX, BESS CAPEX, and discounted year-15 replacement assumptions are reported in the note below Table 7 rather than repeated as separate columns. Break-even BESS CAPEX is reported as a positive cost threshold, not as a cash-flow item. PV operating value equals PV-only NPV minus signed PV CAPEX. Incremental BESS operating value is the present value of incremental operating savings before BESS capital and replacement outflows. Incremental BESS PI is calculated as incremental BESS operating value divided by the absolute present value of BESS CAPEX plus replacement cost. The denominator is positive even though the underlying investment and replacement terms are signed outflows.
For Residence 1, PV-only NPV is JPY 140,850, while PV-BESS NPV is JPY −1,090,263. The incremental BESS NPV is therefore JPY −1,231,114. This equals JPY 324,151 of incremental BESS operating value plus common signed BESS outflows of JPY −1,000,000 for BESS CAPEX and JPY −555,265 for discounted year-15 replacement. The corresponding incremental BESS PI is 0.21, below the break-even threshold of 1. Incremental BESS PI ranges from 0.17 to 0.21, confirming that the additional storage value remains far below the discounted battery cost base.
Figure 6 places the 5 kWh result within the battery-size sensitivity. Mean PV-BESS NPV is JPY −907,448, while mean incremental NPV relative to PV-only is JPY −1,245,455. Because NPV is an absolute metric, the mean is used only as an equal-weight descriptive summary across the four case households; household-specific NPVs, incremental NPVs, PI values, and combined NPV are used for interpretation. Treating the four residences as one combined case gives PV-only NPV of JPY 1,352,027, PV-BESS NPV of JPY −3,629,792, and incremental BESS NPV of JPY −4,981,820. The battery therefore provides operational value but remains below private cost-effectiveness under the base cost assumptions.
Figure 6.
NPV and payback by battery size. (a) Mean PV-BESS NPV by BESS capacity, with error bars showing ±SD across the modeled households. (b) Mean simple payback period by BESS capacity, with the shaded range showing household-level variation and the dashed line indicating the year-15 replacement timing.
A further implication is that the simple payback period is longer than the assumed year-15 battery replacement timing for three of the four households and only marginally shorter for Residence 3. Thus, even before discounting, most cases face a scheduled battery replacement before the initial PV-BESS investment is recovered. This timing mismatch helps explain why the discounted payback is not reached in any household.
Battery-size and subsidy checks define the cost boundary. Larger BESS capacities increase annual savings but worsen mean NPV because the additional operating value is smaller than the added capital and replacement cost. The 5 kWh case has mean NPV of JPY −907,448, compared with JPY −1,633,474 for 7.7 kWh, JPY −2,280,775 for 10 kWh, and JPY −3,302,856 for 13.5 kWh. The Fukuoka City subsidy improves the 5 kWh case by JPY 150,000 per household, but mean PV-BESS NPV remains negative at JPY −757,448. Table 8 reports the break-even BESS CAPEX threshold for the 5 kWh battery addition.
Table 8.
Break-even BESS CAPEX threshold for the 5 kWh battery addition.
The optional time-of-use (TOU) tariff check is retained as a supporting tariff-design sensitivity. Relative to Juryo Dentou B, the TOU case reduces mean grid-only annual variable electricity cost from JPY 277,101 to JPY 227,364, but it also lowers the avoided-cost value of PV and BESS operation. Mean PV-only NPV decreases to JPY 251,498 and mean PV-BESS NPV decreases to JPY −1,043,912; the lower night-time price therefore does not improve BESS profitability in the tested households.
The mean break-even BESS CAPEX is about JPY 39,840/kWh. This is far below the base cost assumption of JPY 200,000/kWh and also below long-term policy target-price levels discussed in Japanese stationary-storage policy materials [18]. Under ordinary bill-savings valuation, the modeled operating value of the 5 kWh battery is too small to justify the battery addition unless installed battery costs fall substantially below current market and policy target-price levels, or unless additional value channels such as stronger subsidies, resilience willingness-to-pay, aggregation revenue, or different tariff structures are counted.
5.5. Retail-Price Escalation Sensitivity
The retail-price escalation sensitivity test improves PV-BESS economics by raising the value of avoided grid purchases.
Table 9 quantifies how retail-price escalation changes the same 5 kWh PV-BESS case. Higher retail prices increase avoided grid-purchase value and improve mean PV-BESS NPV monotonically, but the incremental NPV relative to PV-only remains negative even under G3.
Table 9.
Retail-price escalation sensitivity results, S2.
Figure 7 visualizes the same sensitivity as absolute mean PV-BESS NPV across escalation cases. Price escalation reduces the loss but does not move the 5 kWh PV-BESS case across the zero-NPV break-even boundary. The stress tests therefore support the mechanism that PV-BESS reduces household exposure to retail electricity price increases, while still leaving the 5 kWh BESS below private profitability under the base cost and replacement assumptions.
Figure 7.
NPV change under retail-price escalation sensitivity tests.
5.6. Event-Based Outage Value
Event-based outage resilience valuation is conducted for outage durations of 2, 12, 24, 48, and 72 h. The analysis assumes islanding capability, a 20% emergency reserve, critical electricity demand equal to 25% of gross household electricity demand, and VoLL of 559.9 JPY/kWh. For each outage duration, metrics are first averaged over all valid outage start times for each household and then averaged across the four main-model households; the CLSR range reports the range of household-level mean CLSR values.
Table 10 evaluates resilience as an event value rather than an annual expected value. CLSR remains high in short outages and declines with duration; the 72 h O5 case still serves 84.8% of critical demand on average but produces only JPY 8324/event under the selected VoLL. These values indicate that resilience is technically meaningful but financially limited in the base household calculation.
Table 10.
Event-based outage resilience valuation, S3.
Figure 8 presents the household-level pattern behind Table 10. Longer outage durations reduce CLSR for every residence, and the variation across households reflects differences in demand timing, PV availability during outage windows, and stored energy available at the start of the event.
Figure 8.
Critical-demand served ratio under event-based outage scenarios.
Figure 9 disaggregates the O5 72 h outage result by outage start date and start time. Lower CLSR values occur in periods and start times with weaker PV availability or less favorable stored-energy conditions. Many windows remain close to full critical-demand service. This temporal view complements Table 10 and Figure 8 by showing the heterogeneity behind the mean 72 h CLSR of 0.848. The 5 kWh BESS provides substantial critical-demand support, but the monetary event value remains modest. The valuation includes only avoided unserved critical-demand energy in a single event, without annual outage probabilities or broader willingness-to-pay premiums.
Figure 9.
Seasonal and start-time distribution of critical-demand served ratio for the 72 h outage case.
5.7. Compound Stress Case
The compound stress case combines retail-price escalation scenario value with the O5 event-based outage resilience value under S4, where daily dispatch also holds a 20% emergency reserve. The last column in Table 11 is calculated as reserve-adjusted 25-year mean annual savings plus one O5 event value; for G1 this is JPY 124,301 + JPY 8324 = JPY 132,625. Because S4 imposes the reserve constraint, these annual savings differ from the S2 retail-price escalation results in Table 9. The break-even O5 event frequency is calculated as:
where is annualized PV-BESS cost, is reserve-adjusted mean annual bill savings under S4, and is the single-event 72 h outage value. This is an annualized threshold metric rather than a probability estimate.
Table 11.
Compound stress results with O5 event value, S4.
The break-even event frequency falls as the retail-price escalation scenario increases. Resilience has household service value, but the selected VoLL and event-based valuation remain too small to make the base 5 kWh BESS case financially viable for the household.
5.8. Market-Offer Benchmark
The public TPO benchmark is retained as a secondary market-offer benchmark. It is separated into two subcases to distinguish physical package size from contract structure. S5a evaluates the product-aligned 5 kW PV and 7.7 kWh BESS package as a household-owned investment. S5b evaluates the same physical package under the public fixed-fee TPO benchmark, with zero upfront household CAPEX, a 14,520 JPY/month service fee for 15 years, and revenue from surplus PV sales assigned to the service provider.
Because S5b is evaluated over a 15-year service term, it is interpreted as a household cash-flow benchmark and is not directly comparable with the 25-year owned-system NPV.
Table 12 summarizes the product-package and TPO decomposition used to separate physical system size from contract structure.
Table 12.
Product-package and TPO contract decomposition, S5a–S5b.
The owned 5 kW PV and 7.7 kWh BESS package remains negative for all households, with a mean owned-package NPV of JPY −1,620,626 and a mean incremental NPV of about JPY −1,924,441 relative to the corresponding 5 kW PV-only case. Under the TPO fixed-fee benchmark, mean household TPO NPV is JPY −562,747. Although the negative NPV of S5b appears smaller in absolute magnitude than that of S5a, this mainly reflects the truncated 15-year service-term evaluation rather than an improvement in underlying unit economics. The relevant TPO result is that the modeled maximum affordable fee remains below the JPY 14,520/month public benchmark fee for all households.
5.9. Forecast-Realism Sensitivity
The MILP dispatch uses reconstructed household electricity-demand profiles and the modeled PVGIS PV profile as a perfect-foresight information set, so the S1 bill-savings result is an upper-bound reference case for dispatch value. This sensitivity attenuates incremental BESS savings relative to PV-only to 90%, 80%, and 70% of the perfect-foresight value before recalculating lifecycle NPV.
Table 13 evaluates how attenuating the perfect-foresight savings assumption affects PV-BESS NPV and confirms that lower realized savings further weakens the storage case.
Table 13.
Forecast-realism robustness check for the 5 kWh PV-BESS case.
The forecast-realism sensitivity confirms that perfect foresight works in favor of BESS economics. Even under the 100% upper-bound case, the mean PV-BESS NPV is negative. Lower realized savings make the NPV more negative, and all household-level PV-BESS NPVs remain below zero.
5.10. Integrated Summary of Cash Flow, Sensitivity, and Cost Structure
The preceding tables report the main economic and resilience metrics. Figure 2 defines the annual energy-flow accounting boundary in the methodology. The remaining main-text figures in this section summarize cumulative discounted cash flow, absolute mean NPV sensitivity, and annual signed cash-flow components; supplementary dispatch timing and annual heatmaps are provided in Appendix D Figure A1 and Figure A2.
Figure 10 compares cumulative discounted cash-flow trajectories. The PV-only case crosses into positive cumulative value within the lifecycle, whereas the PV-BESS case remains below zero after the year-15 battery replacement. The cumulative curves show that the technical dispatch value of storage does not recover current battery capital and replacement costs.
Figure 10.
Cumulative discounted cash-flow curves for PV-only and PV-BESS.
Figure 11 presents absolute mean PV-BESS NPV rather than only relative changes. The vertical break-even line at zero marks the profitability threshold, and the base 5 kWh case is compared with retail-price, subsidy, and battery-capacity sensitivities. Several assumptions improve the case, but the tested mean NPVs remain below break-even.
Figure 11.
Absolute mean PV-BESS NPV across sensitivity cases.
Additional weekly dispatch details and annual charge/discharge heatmaps are provided in Appendix D Figure A1 and Figure A2.
Figure 12 decomposes annual signed cash-flow components across the baseline, PV-only, PV-BESS, subsidy, and TPO cases. Electricity purchases, PV cost, BESS cost, and TPO service fees are shown as negative household outflows, while surplus-PV sales/FIT revenue is shown as a positive inflow. The net signed values use the lifecycle accounting convention defined in Section 3.5.1 and Table 7.
Figure 12.
Signed mean annual cash-flow components across ownership and package cases.
6. Discussion
6.1. Household Heterogeneity
Household differences matter because storage requires both surplus PV for charging and later residual demand that can absorb the stored energy. Residence 3 has the highest annual electricity demand and the highest PV-only NPV, because more PV generation can be used on site. It also has the least negative PV-BESS NPV among the four main households, although the 5 kWh BESS remains negative in lifecycle NPV. This pattern is consistent with Honda et al. [16] and Zhang et al. [32], who show that high-resolution demand timing and household technology combinations strongly affect PV self-consumption and demand-management value.
The exclusion of fuel-cell households preserves a consistent investment boundary, because existing fuel-cell generation would change residual demand and introduce additional technology-cost assumptions. Heat-pump electricity is retained as part of actual household demand and helps explain differences in PV self-consumption and BESS dispatch.
6.2. Post-FIT Self-Consumption Value
The PV-only results show that residential PV can remain economically attractive under the current FIT/post-FIT lifecycle. The system benefits from FIT surplus purchase prices in the early years and from self-consumption value in the later post-FIT period. This lifecycle treatment differs from a pure post-FIT-only analysis and better reflects the investment path of a household installing PV under the current price schedule.
Adding BESS increases self-consumption after the FIT period, but the incremental bill-saving value is too small relative to battery capital and replacement costs. Batteries provide operational value, but the private bill-saving channel is too narrow to pay for the battery under current installed-cost assumptions. The MILP dispatch also shows why this occurs: surplus PV is stored only when storage reduces net electricity costs relative to surplus PV sales electricity to the grid. In higher surplus-purchase-price years, immediate sale to the grid can be more valuable than round-trip-adjusted self-consumption. Thus, unlike capacity-optimization studies that search for theoretically optimal PV-BESS sizes [14,29], this fixed-package case shows that a commercially plausible battery can still struggle to reach profitability on bill savings alone. The forecast-realism sensitivity further strengthens this conclusion.
The break-even BESS CAPEX result frames the negative NPV as a boundary-condition finding. The mean threshold of JPY 39,840/kWh is far below the JPY 200,000/kWh base assumption and below long-term policy target-price levels. This indicates that ordinary household bill savings do not support the 5 kWh battery addition under the tested tariff and surplus-purchase-price assumptions. In this case, Japan’s current residential BESS price and limited monetization of resilience and flexibility are binding constraints. Future viability will likely depend on value stacking through deeper cost reductions, targeted subsidies, resilience support, demand response, virtual power plant (VPP) participation, or aggregation-based services.
6.3. Household Exposure Reduction to Retail-Price Escalation
The retail-price escalation sensitivity shows that PV-BESS reduces household exposure to retail electricity price increases. As retail prices rise from G0 to G3, mean PV-BESS NPV improves from JPY −907,448 to JPY −119,067. This improvement is substantial, but the battery remains below profitability under the base assumptions.
This is best read as an energy-security result at the household level: reduced grid purchases lower exposure to retail price increases. The escalation cases test tariff vulnerability; they are not forecasts of future electricity prices.
6.4. Event-Based Outage Resilience Value
The event-based outage resilience valuation shows that the 5 kWh BESS can provide substantial critical-demand support under the assumed outage conditions. Mean CLSR remains 0.848 for the 72 h event. Daytime PV generation recharges the battery during islanded operation, while the battery buffers PV output for evening and night-time critical demand. This service is not captured by ordinary bill-savings analysis.
The monetary value of that service depends strongly on VoLL, critical-demand definition, outage duration, start time, and islanding capability. Under the selected VoLL of 559.9 JPY/kWh, the mean O5 event value is JPY 8324. Closing the economic gap would require higher monetized resilience value, frequent severe events, stronger subsidy support, or lower battery costs.
6.5. Tariff, Economic Robustness, and Secondary TPO Interpretation
Tariff design can pull the result in two directions. The TOU sensitivity indicates that lower night-time prices can reduce ordinary household electricity costs while also reducing the avoided-cost value of PV self-consumption and battery discharge. A tariff can therefore be favorable for ordinary household bills while being less favorable for PV-BESS investment recovery.
The robustness checks are consistent with the base result. The Fukuoka City battery subsidy improves the 5 kWh case by JPY 150,000 per household, but the case remains negative. The break-even cost threshold shows that much deeper cost reduction would be required for the battery addition to become incrementally neutral relative to PV-only under ordinary bill savings. Larger batteries increase annual savings but worsen NPV because additional savings are smaller than additional capital and replacement cost. Taken together, these checks suggest that current residential BESS adoption is more likely to depend on cost reductions, stronger or better-targeted subsidies, resilience preferences, or non-bill value streams than on bill savings alone.
The TPO benchmark shows a financing issue rather than a technology-cost solution. Third-party ownership, leasing, or zero-initial-cost services can reduce the household’s initial investment barrier, which is relevant to adoption. The household still pays for the system indirectly through a fixed fee, a service tariff, or transfer of surplus-PV sales rights. S5a evaluates the public-offer package as an owned 5 kW PV and 7.7 kWh BESS investment. S5b evaluates the same physical package under the fixed-fee contract. The owned package remains negative, and the public fee exceeds the modeled avoided-purchase value for all four households.
6.6. Limitations
Several limitations follow from the study design. The main economic model uses four non-fuel-cell detached households from an audited six-household dataset. The additional 181 household electricity-demand profiles provide evidence of broader residential electricity-demand diversity, but the modeled results should still be interpreted as case-study evidence rather than population-wide estimates. The observed electricity-demand profiles are used as physical demand inputs for a current-policy investment counterfactual, not as historical bill reconstructions.
The zero residual-value treatment is a limitation. Because the replacement BESS is installed in year 15, it may retain technical value at year 25; modeling this terminal value would require verified household-scale resale, second-life, and warranty-transfer assumptions for the Japanese residential setting. This issue is therefore left for longer-horizon NPV assessment.
The dispatch model also relies on perfect foresight of the modeled PVGIS PV profile and reconstructed household electricity demand. This assumption is useful for establishing an upper-bound benchmark for BESS operation, but actual HEMS control would face demand, weather, and behavioral uncertainty. The forecast-realism sensitivity partly addresses this issue, but it does not replace a full real-time control simulation.
The scenario results depend on the selected tariff, retail-price escalation scenarios, outage durations, VoLL assumption, subsidy rules, and TPO contract terms. Battery degradation is also simplified through a fixed year-15 replacement assumption, without modeling cycle depth, temperature, or throughput-dependent aging. Future work could extend the analysis using larger household samples, detailed degradation models, probabilistic outage risk, model-predictive control, stochastic tariffs, and endogenous PV-BESS capacity optimization.
7. Conclusions
This study evaluated whether a fixed 4 kW PV and 5 kWh BESS package can create sufficient household value under Japan’s current FIT/post-FIT and residential tariff environment. Under the selected cost, tariff, surplus-purchase-price, and perfect-foresight assumptions, the fixed 5 kWh BESS does not reach private economic break-even for the four modeled Kyushu households. This conclusion is specific to the modeled households and assumptions.
The battery remains technically useful. It increases PV self-consumption, reduces electricity purchased from the grid, lowers exposure to retail-price escalation, and supports critical electricity demand during outage events. In the tested 72 h outage case, the PV-BESS serves 84.8% of assumed critical demand. These technical value channels are not sufficiently monetized under the tested household conditions.
The economic mechanism is the gap between incremental operating value and battery cost. The mean PV-BESS NPV remains negative, and the mean incremental BESS NPV relative to PV-only is JPY −1,245,455. Even the +50% retail-price escalation scenario improves but does not fully close the gap. The mean break-even BESS CAPEX of JPY 39,840/kWh is far below the JPY 200,000/kWh base assumption, showing that ordinary household bill savings alone are not enough to support the selected 5 kWh battery package.
These findings are bounded by the audited case-study sample, the fixed package size, the selected tariff and cost assumptions, the event-based outage valuation, and the perfect-foresight MILP benchmark. Future research should examine larger household samples, real-time control performance, battery degradation, stochastic outage risk, household willingness to pay for backup, and tariff or aggregation designs that could convert technical battery usefulness into monetizable household value.
Author Contributions
Conceptualization, D.W. and W.G.; methodology, D.W.; software, D.W. and J.R.; validation, D.W. and J.R.; formal analysis, D.W. and Y.L.; investigation, D.W.; resources, W.G.; data curation, J.R. and Y.L.; writing—original draft preparation, D.W.; writing—review and editing, D.W., J.R., Y.L. and W.G.; visualization, D.W.; supervision, W.G.; project administration, W.G.; funding acquisition, W.G. All authors have read and agreed to the published version of the manuscript.
Funding
This research was supported by the Japan Society for the Promotion of Science (JSPS) KAKENHI Grant-in-Aid for Research Activity Start-up (Grant No. 24K23002) and Shanghai Dianji University (Grant No. 23B0313).
Data Availability Statement
The household-level metering data used in this study are not publicly available due to privacy and data-use restrictions. Aggregated outputs and modeling assumptions are available from the corresponding author upon reasonable request.
Conflicts of Interest
The authors declare no conflicts of interest.
Abbreviations
The following abbreviations are used in this manuscript:
| Symbol | Definition |
| Time interval, lifecycle year, household, and month indices | |
| Gross electricity demand, residual demand after direct PV use, and surplus PV | |
| Electricity purchased from the grid and surplus PV electricity sold to the grid | |
| Modeled PV generation and observed PV generation in the source data | |
| Battery charge and discharge energy | |
| Stored battery energy, BESS energy capacity, and BESS power capacity | |
| Battery charge and discharge efficiencies | |
| Minimum stored-energy fraction, maximum stored-energy fraction, and emergency reserve fraction | |
| Binary charge/discharge mode variable | |
| Retail purchase price and lifecycle surplus purchase price | |
| Monthly increasing-block grid-purchase variables | |
| Annual net electricity cost, purchase cost, and revenue from surplus PV sales | |
| Annual savings, net present value, and incremental BESS NPV | |
| Critical electricity demand, served critical electricity demand, critical-demand served ratio, and unserved critical electricity demand | |
| Value of lost load and event-based outage value | |
| Break-even O5 event frequency, annualized system cost, S4 annual bill savings, and O5 event value | |
| Break-even BESS CAPEX and present value of incremental operating savings | |
| Forecast-realism attenuation factor and monthly TPO service fee |
Appendix A. Full Lifecycle Cash-Flow Accounting
Appendix A Table A1 lays out the lifecycle cash-flow accounting structure used in the owned PV and PV-BESS cases. Cash inflows are positive and cash outflows are negative; household- and scenario-specific annual bill savings are generated from the MILP dispatch and tariff post-processing described in Section 3.
Table A1.
Full lifecycle cash-flow accounting structure for owned PV and PV-BESS cases.
Appendix A Table A2 summarizes lifecycle timing without duplicating every household-year output in the main text. Household-specific annual bill-saving terms are generated from the MILP post-processing; fixed investment events, tariff periods, and discounting are stated here to support the NPV bridge in Table 7.
Table A2.
Compact 25-year lifecycle cash-flow ledger for owned PV-BESS accounting.
Appendix B. Residence 1 Worked NPV Calculation
Appendix B Table A3 provides the Residence 1 worked calculation corresponding to the lifecycle bridge table in the Results section. Values are rounded to the nearest JPY, so one-yen differences can arise from intermediate rounding.
Table A3.
Residence 1 worked NPV calculation.
The worked example shows why improved self-consumption does not deliver private break-even for Residence 1. The discounted incremental operating value of the 5 kWh BESS is smaller than the combined BESS capital and discounted replacement costs.
Appendix C. Detailed Technical, Economic, Tariff, and Resilience Assumptions
Appendix C Table A4 expands compact Table 3 and preserves the full assumption list and source treatment for transparency.
Table A4.
Detailed technical, economic, tariff, resilience, and ownership assumptions underlying compact Table 3.
Appendix D. Supplementary Dispatch and Seasonal Battery-Operation Figures
Appendix D Figure A1 and Figure A2 provide supplementary operational evidence for the representative dispatch pattern and annual battery charge–discharge timing.
Figure A1.
Weekly PV-BESS dispatch detail for the representative post-FIT period. (a) PV generation and allocation to direct household demand, BESS charging, and surplus PV sold to the grid. (b) Household demand, grid purchase, BESS discharge, and the retail purchase-price profile over the same week. (c) BESS charging/discharging power and stored battery energy over the same week.
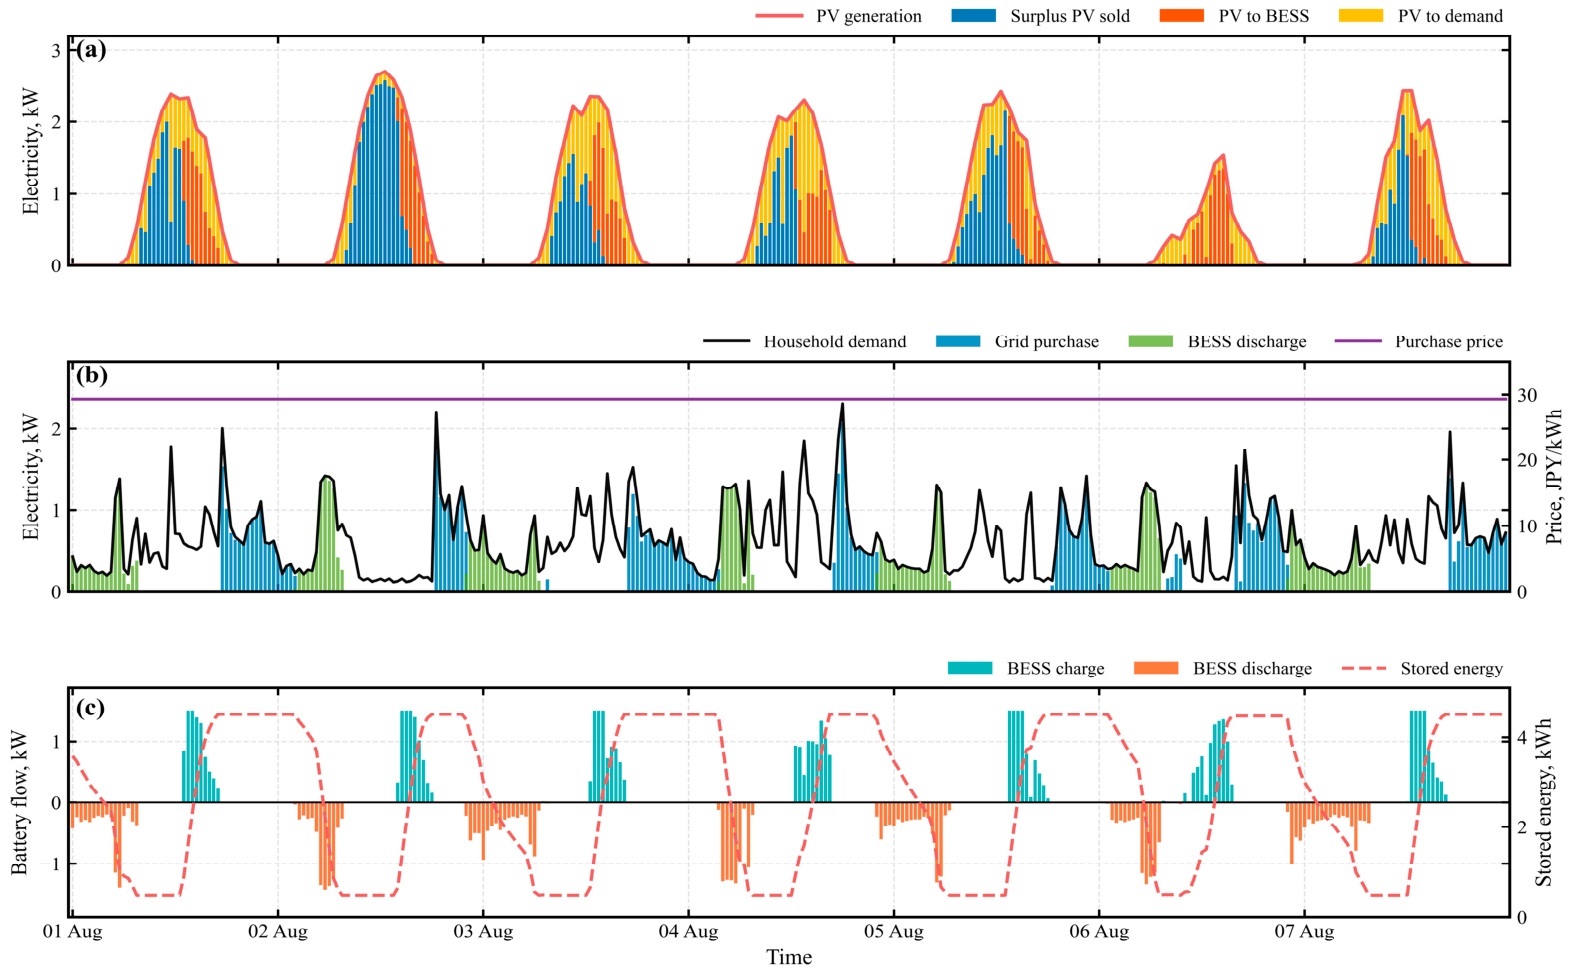
Appendix D Figure A1 provides the detailed weekly dispatch view, including PV-to-demand, PV-to-BESS, surplus PV sold to the grid, grid purchase, BESS charge/discharge, and stored battery energy.
Figure A2.
Annual scheduled BESS charging and discharging heatmaps. (a) Scheduled battery charging flow over the annual profile, showing charging concentrated around daylight PV-surplus hours. (b) Scheduled battery discharging flow over the annual profile, showing discharge concentrated in later demand periods.
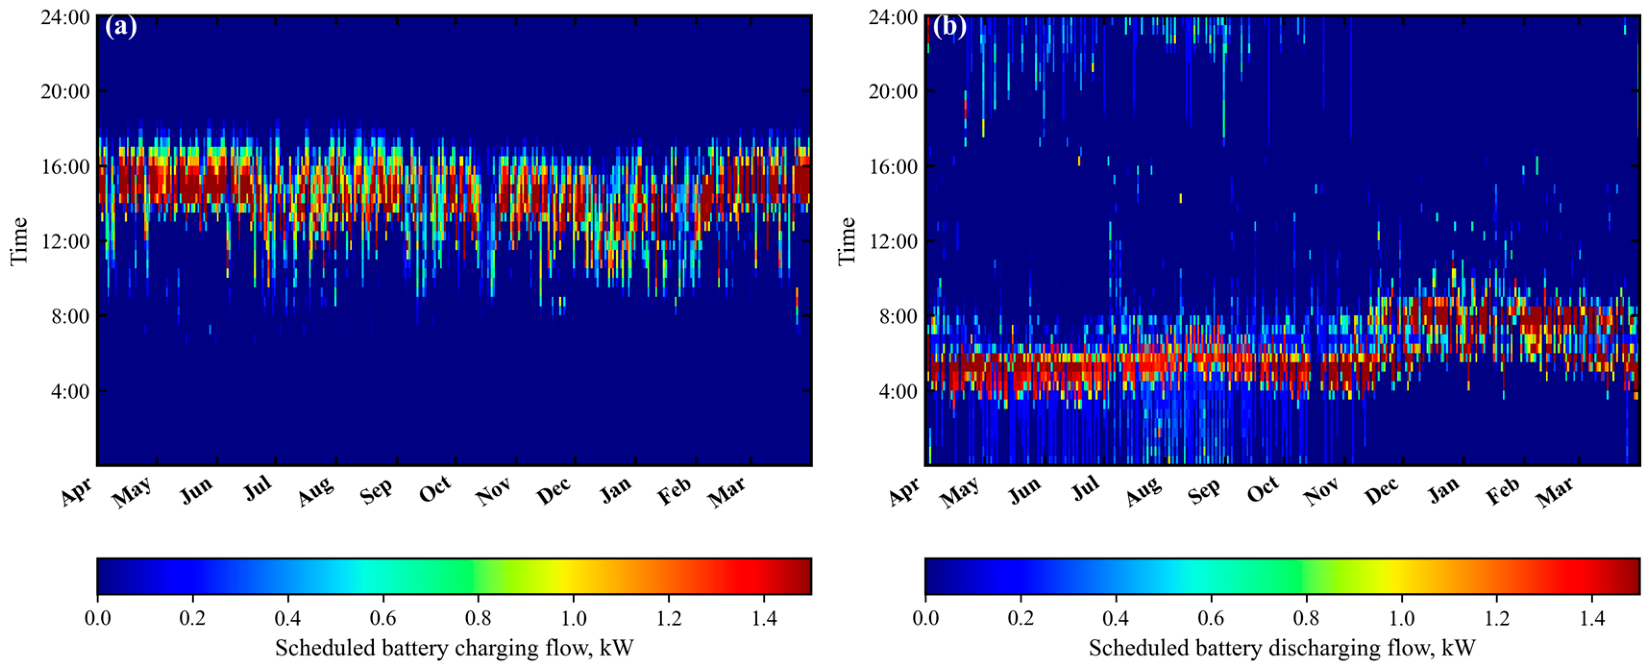
Appendix D Figure A2 extends the dispatch interpretation from a representative week to the full annual profile. Charging concentrates around daylight PV-surplus hours, while discharging is concentrated in later demand periods.
Appendix E. Figure/Table Terminology and Unit Conventions
Appendix E Table A5 summarizes terminology and unit conventions used to maintain consistency across figures, tables, and equations.
Table A5.
Figure/table terminology and unit conventions.
References
- Ministry of Economy, Trade and Industry. Cabinet Decision on the Seventh Strategic Energy Plan. Available online: https://www.meti.go.jp/english/press/2025/0218_001.html (accessed on 11 June 2026).
- Agency for Natural Resources and Energy. The Seventh Strategic Energy Plan. Available online: https://www.enecho.meti.go.jp/en/category/others/basic_plan/pdf/7th_outline.pdf (accessed on 11 June 2026).
- International Energy Agency. Japan 2021 Energy Policy Review; OECD: Paris, France, 2021. [Google Scholar] [CrossRef]
- Agency for Natural Resources and Energy. Electricity Rate Systems and Fuel Cost Adjustment. Available online: https://www.enecho.meti.go.jp/category/electricity_and_gas/electric/fee/ (accessed on 11 June 2026).
- Ministry of Economy, Trade and Industry. Announcement of the FY2026 Surcharge Rate and Purchase Prices Under Japan’s FIT and FIP Schemes. Available online: https://www.meti.go.jp/press/2025/03/20260319004/20260319004.html (accessed on 11 June 2026).
- Agency for Natural Resources and Energy. Overview of Japan’s FIT and FIP Scheme for Renewable Energy. Available online: https://www.enecho.meti.go.jp/category/saving_and_new/saiene/kaitori/ (accessed on 11 June 2026).
- Kimura, K.; Lundberg, L.; Kåberger, T. How high feed-in tariffs impacted the capital cost of solar PV in Japan. Renew. Energy 2025, 244, 122685. [Google Scholar] [CrossRef]
- Agency for Natural Resources and Energy. Information for Residential Solar PV Owners After the FIT Purchase Period Expires. Available online: https://www.enecho.meti.go.jp/category/saving_and_new/saiene/solar-2019after/ (accessed on 11 June 2026).
- Kyushu Electric Power Company. Purchase After the FIT Purchase Period Expires. Available online: https://customer.kyuden.co.jp/ja/electricity/fit/after.html?lang=en (accessed on 11 June 2026).
- Cai, Q.; Qing, J.; Xu, Q.; Shi, G.; Liang, Q.M. Techno-economic Impact of Electricity Price Mechanism and Demand Response on Residential Rooftop Photovoltaic Integration. Renew. Sustain. Energy Rev. 2024, 189, 113964. [Google Scholar] [CrossRef]
- Chatzigeorgiou, N.G.; Theocharides, S.; Makrides, G.; Georghiou, G.E. A Review on Battery Energy Storage Systems: Applications, Developments, and Research Trends of Hybrid Installations in the End-User Sector. J. Energy Storage 2024, 86, 111192. [Google Scholar] [CrossRef]
- Gomes, A.M.F.; Pinto, G.X.A.; Ruther, R. Techno-economic Assessment of Small-size Residential Solar PV + Battery Systems under Different Tariff Structures in Brazil. Sol. Energy 2024, 267, 112238. [Google Scholar] [CrossRef]
- Gebhard, T.A.; Garrido-Zafra, J.; Moreno-Munoz, A. Data-Driven Evaluation of the Economic Viability of a Residential Battery Storage System Using Grid Import and Export Measurements. Energies 2026, 19, 1072. [Google Scholar] [CrossRef]
- Khezri, R.; Mahmoudi, A.; Aki, H. Optimal Planning of Solar Photovoltaic and Battery Storage Systems for Grid-Connected Residential Sector: Review, Challenges and New Perspectives. Renew. Sustain. Energy Rev. 2022, 153, 111763. [Google Scholar] [CrossRef]
- Yabe, K.; Hayashi, Y. Economic Evaluation of Increased Self-use of PV Output Driven by Storage Battery System. IEEJ Trans. Power Energy 2019, 139, 363–371. [Google Scholar] [CrossRef]
- Honda, T.; Ozawa, A.; Wakamatsu, H. Profitability Assessment of Residential Photovoltaic Battery Systems in Japan Using Electric Power Big Data. Sustainability 2021, 13, 5370. [Google Scholar] [CrossRef]
- Matsubara, M.; Mae, M.; Matsuhashi, R. Comprehensive Benefit Evaluation of Residential Solar and Battery Systems in Japan Considering Outage Mitigation and Battery Degradation. Energies 2025, 18, 6579. [Google Scholar] [CrossRef]
- METI Study Group on Stationary Storage Systems. Report on the Results of the FY2024 Study Group for Expansion of Stationary Storage Systems. Ministry of Economy, Trade and Industry. Available online: https://www.meti.go.jp/shingikai/energy_environment/storage_system/pdf/20250307_1.pdf (accessed on 11 June 2026).
- Fukuoka City. FY2026 Fukuoka City Residential Energy System Installation Support Program. Available online: https://www.city.fukuoka.lg.jp/kankyo/j-suishin/hp/energy-system_reiwa.html (accessed on 11 June 2026).
- National Renewable Energy Laboratory. Valuing the Resilience Provided by Solar and Battery Energy Storage Systems. Available online: https://www.nrel.gov/docs/fy18osti/70679.pdf (accessed on 11 June 2026).
- Sullivan, M.J.; Schellenberg, J.; Blundell, M. Updated Value of Service Reliability Estimates for Electric Utility Customers in the United States; Lawrence Berkeley National Laboratory: Berkeley, CA, USA, 2015; Available online: https://emp.lbl.gov/publications/updated-value-service-reliability (accessed on 11 June 2026).
- Matsubara, M.; Mae, M.; Matsuhashi, R. Investigation of Residential Value of Lost Load and the Importance of Electric Loads During Outages in Japan. Energies 2025, 18, 2060. [Google Scholar] [CrossRef]
- Japan Photovoltaic Energy Association. Third-Party Ownership/Zero-Initial-Cost Solar Services for Residential PV. Available online: https://www.jpea.gr.jp/house/third_party/about/ (accessed on 11 June 2026).
- IEA PVPS Task 1. Trends in Photovoltaic Applications 2024. Available online: https://iea-pvps.org/trends_reports/trends-in-pv-applications-2024/ (accessed on 11 June 2026).
- Yamashiro, R.; Mori, A. Combined third-party ownership and aggregation business model for the adoption of rooftop solar PV–battery systems: Implications from the case of Miyakojima Island, Japan. Energy Policy 2023, 173, 113392. [Google Scholar] [CrossRef]
- Japan Photovoltaic Energy Association. Residential Third-Party Model Plan List. Available online: https://www.jpea.gr.jp/house/third_party/plan/ (accessed on 11 June 2026).
- Sharp Energy Solutions Corporation. COCORO POWER Solar-Battery Plan. Available online: https://www.sharp-sesj.co.jp/cocoro-power/ (accessed on 11 June 2026).
- Erdinc, F.G. Rolling Horizon Optimization Based Real-time Energy Management of a Residential Neighborhood Considering PV and ESS Usage Fairness. Appl. Energy 2023, 344, 121275. [Google Scholar] [CrossRef]
- Han, X.; Garrison, J.; Hug, G. Techno-economic analysis of PV-battery systems in Switzerland. Renew. Sustain. Energy Rev. 2022, 158, 112028. [Google Scholar] [CrossRef]
- Ballesteros-Gallardo, J.A.; Arcos-Vargas, A.; Núñez, F. Optimal Design Model for a Residential PV Storage System an Application to the Spanish Case. Sustainability 2021, 13, 575. [Google Scholar] [CrossRef]
- Qiu, Y.; Xing, B.; Patwardhan, A.; Hultman, N.; Zhang, H. Heterogeneous Changes in Electricity Consumption Patterns of Residential Distributed Solar Consumers Due to Battery Storage Adoption. iScience 2022, 25, 104352. [Google Scholar] [CrossRef] [PubMed]
- Zhang, X.; Liu, Y.; Li, Y.; Lv, X.; Xiao, F.; Gao, W. Analyzing variability and coordinated demand management for various flexible integrations of residential distributed energy resources. Renew. Energy 2024, 237, 121619. [Google Scholar] [CrossRef]
- Memtimin, M.; Wang, N.; Mogi, G. Solar photovoltaics adoption and its impacts on energy consumption: Evidence from Japanese households. Renew. Energy Focus 2025, 53, 100690. [Google Scholar] [CrossRef]
- Khezri, R.; Mahmoudi, A.; Haque, M.H. Optimal Capacity of Solar PV and Battery Storage for Australian Grid-Connected Households. IEEE Trans. Ind. Appl. 2020, 56, 5319–5329. [Google Scholar] [CrossRef]
- Procurement Price Calculation Committee, Ministry of Economy, Trade and Industry. Opinion on Procurement Prices and Calculation Standards from FY2026 Onward. Ministry of Economy, Trade and Industry. Available online: https://www.meti.go.jp/shingikai/santeii/pdf/20260205_1.pdf (accessed on 11 June 2026).
- Matsubara, M.; Mae, M.; Matsuhashi, R. Evaluation of Cost Effectiveness of Residential PV/BESS Systems in Japan Considering Outage Mitigation and Battery Degradation. Energy Proc. 2024, 49. [Google Scholar] [CrossRef]
- Orth, N.; Munzke, N.; Weniger, J.; Messner, C.; Schreier, R.; Mast, M.; Meissner, L.; Quaschning, V. Efficiency Characterization of 26 Residential Photovoltaic Battery Storage Systems. J. Energy Storage 2023, 65, 107299. [Google Scholar] [CrossRef]
- Sun, T.; Feng, Y.; Zanocco, C.; Flora, J.; Majumdar, A.; Rajagopal, R. Solar and battery can reduce energy costs and provide affordable outage backup for US households. Nat. Energy 2025, 10, 1025–1040. [Google Scholar] [CrossRef]
- Ansarin, M.; Ghiassi-Farrokhfal, Y.; Ketter, W.; Collins, J. Cross-subsidies among residential electricity prosumers from tariff design and metering infrastructure. Energy Policy 2020, 145, 111736. [Google Scholar] [CrossRef]
- Shakeel, S.R.; Yousaf, H.; Irfan, M.; Rajala, A. Solar PV adoption at household level: Insights based on a systematic literature review. Energy Strategy Rev. 2023, 50, 101178. [Google Scholar] [CrossRef]
- Agency for Natural Resources and Energy. Renewable Energy Output Control in the Kyushu Area. Available online: https://www.kyuden.co.jp/td/renewable-energy/purchase/control.html (accessed on 11 June 2026).
- Kyushu Electric Power Transmission and Distribution. Residential Lighting B Rate Schedule. Available online: https://www.kyuden.co.jp/td_service_user_menu_outline_juryo.html (accessed on 11 June 2026).
- Kyushu Electric Power Company. Past Fuel and Related Adjustment Unit Prices. Available online: https://customer.kyuden.co.jp/ja/electricity/system/adjustment-past-etc.html (accessed on 11 June 2026).
- Cabinet Office, Government of Japan. White Paper on Disaster Management in Japan. Available online: https://www.bousai.go.jp/kaigirep/hakusho/ (accessed on 11 June 2026).
- Japan Meteorological Agency. Weather, Climate, Earthquake, and Tsunami Information. Available online: https://www.jma.go.jp/jma/en/Activities/ (accessed on 11 June 2026).
- Hao, K.; Ialnazov, D.; Yamashiki, Y. GIS Analysis of Solar PV Locations and Disaster Risk Areas in Japan. Front. Sustain. 2021, 2, 815986. [Google Scholar] [CrossRef]
- Short, W.; Packey, D.J.; Holt, T. A Manual for the Economic Evaluation of Energy Efficiency and Renewable Energy Technologies; NREL/TP-462-5173; National Renewable Energy Laboratory: Golden, CO, USA, 1995; Available online: https://www.nrel.gov/docs/legosti/old/5173.pdf (accessed on 28 June 2026).
- Jaffe, A.B.; Stavins, R.N. The Energy-Efficiency Gap: What Does It Mean? Energy Policy 1994, 22, 804–810. [Google Scholar] [CrossRef]
- Gillingham, K.; Palmer, K. Bridging the Energy Efficiency Gap: Policy Insights from Economic Theory and Empirical Evidence. Rev. Environ. Econ. Policy 2014, 8, 18–38. [Google Scholar] [CrossRef]
- European Commission Joint Research Centre. PVGIS Online Tool and User Manual. Available online: https://re.jrc.ec.europa.eu/pvg_tools/en/ (accessed on 11 June 2026).
- New Energy and Industrial Technology Development Organization. Solar Radiation Database METPV-20. Available online: https://www.nedo.go.jp/library/nissharyou.html (accessed on 11 June 2026).
- National Renewable Energy Laboratory. PVWatts System Design Help: Inverter Efficiency. Available online: https://samrepo.nrelcloud.org/help/pvwatts_system_design.html (accessed on 11 June 2026).
- Kyushu Electric Power Company. Denka de Night Select All-Electric Residential Rate Plan. Available online: https://customer.kyuden.co.jp/ja/electricity/home-plan/denka-de-night.html (accessed on 11 June 2026).
- OMRON Social Solutions. KPBP-A Series Multi-Storage Platform Specifications. Available online: https://socialsolution.omron.com/jp/ja/products_service/energy/product/bt/kpbp_spec.html (accessed on 11 June 2026).
- DMM Energy. DMM.make Smart Residential Storage Battery. Available online: https://energy.dmm.com/smart (accessed on 11 June 2026).
- Kyocera Corporation. Enerezza Residential Battery Storage System Specifications. Available online: https://www.kyocera.co.jp/solar/products/enerezza/ (accessed on 11 June 2026).
- Nichicon Corporation. ESS-E1 Series Residential Storage System Specifications. Available online: https://www.nichicon.co.jp/products/ess/e1.html (accessed on 11 June 2026).
- Oddleifson, T.; Duwadi, K.; Pohl, E.; Gibbs, P.; Ghosh, S.; Scarpitti, C.; Weber, L. Prefeasibility Analysis of Behind-the-Meter Distributed Energy Resources in Highland Park, MI: Highland Park Pathways to Power; National Renewable Energy Laboratory: Golden, CO, USA, 2024; Available online: https://www.nrel.gov/docs/fy24osti/87988.pdf (accessed on 11 June 2026).
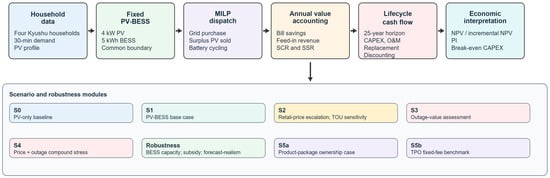
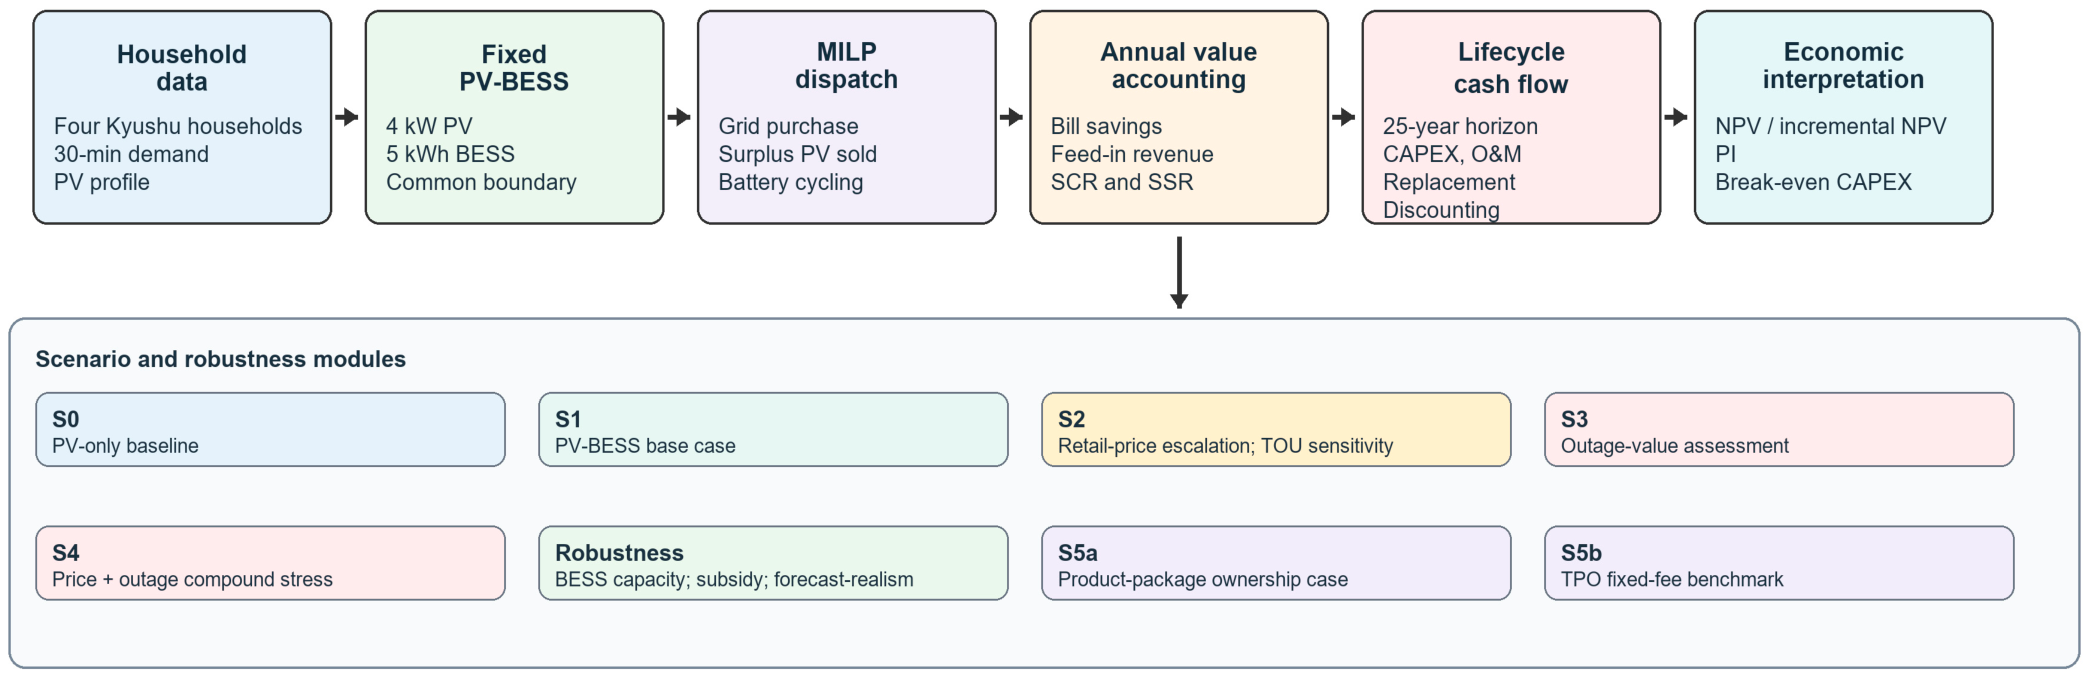
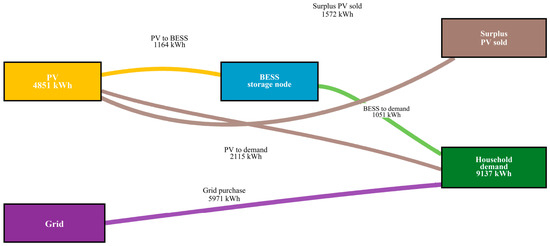
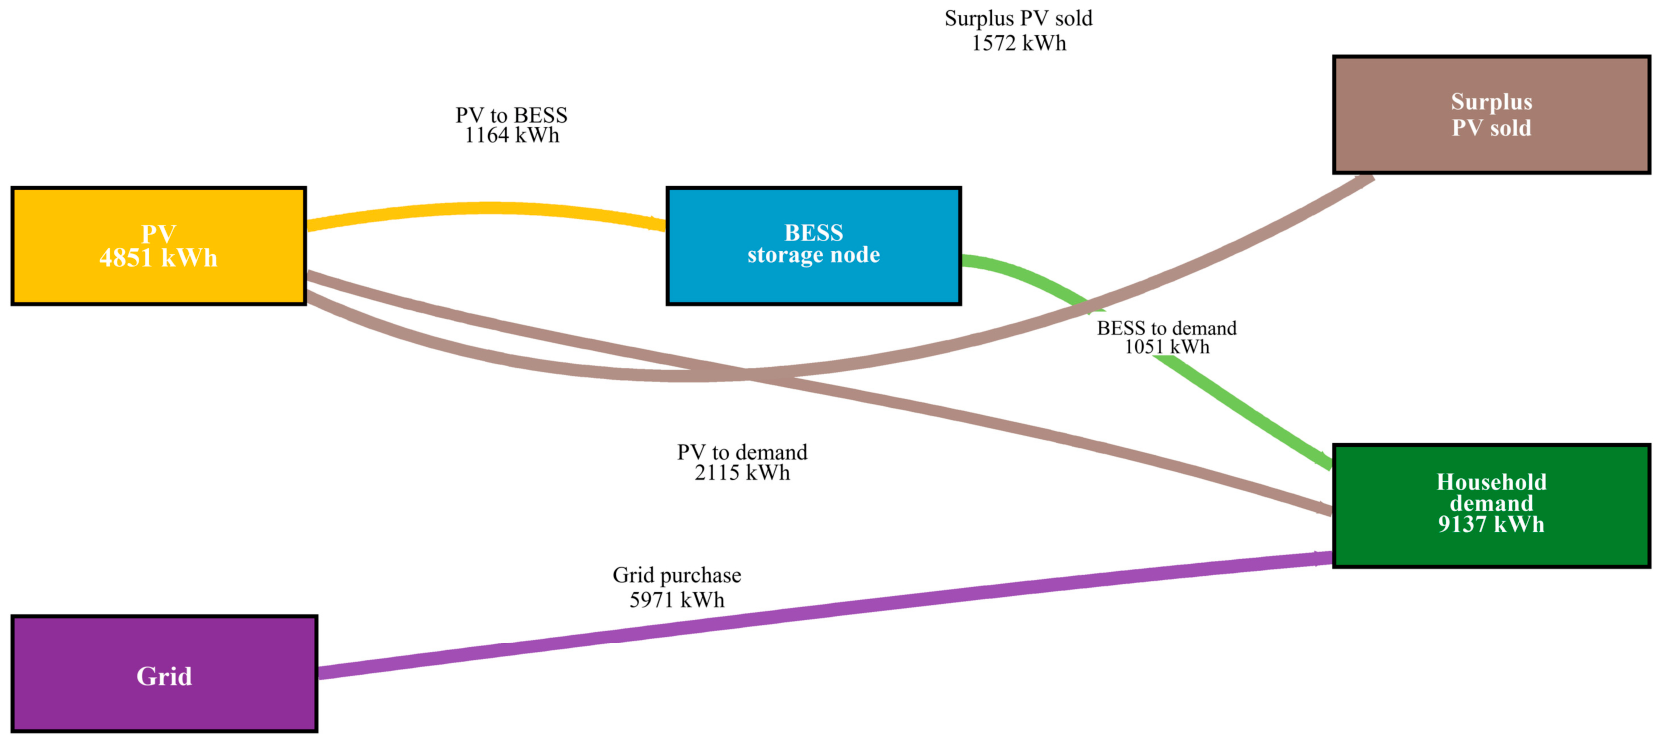
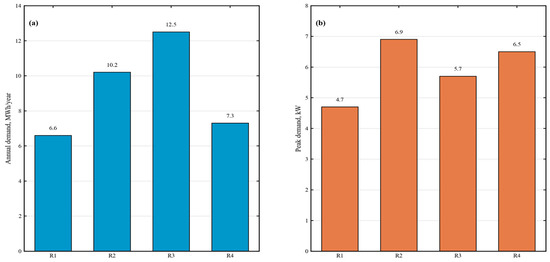
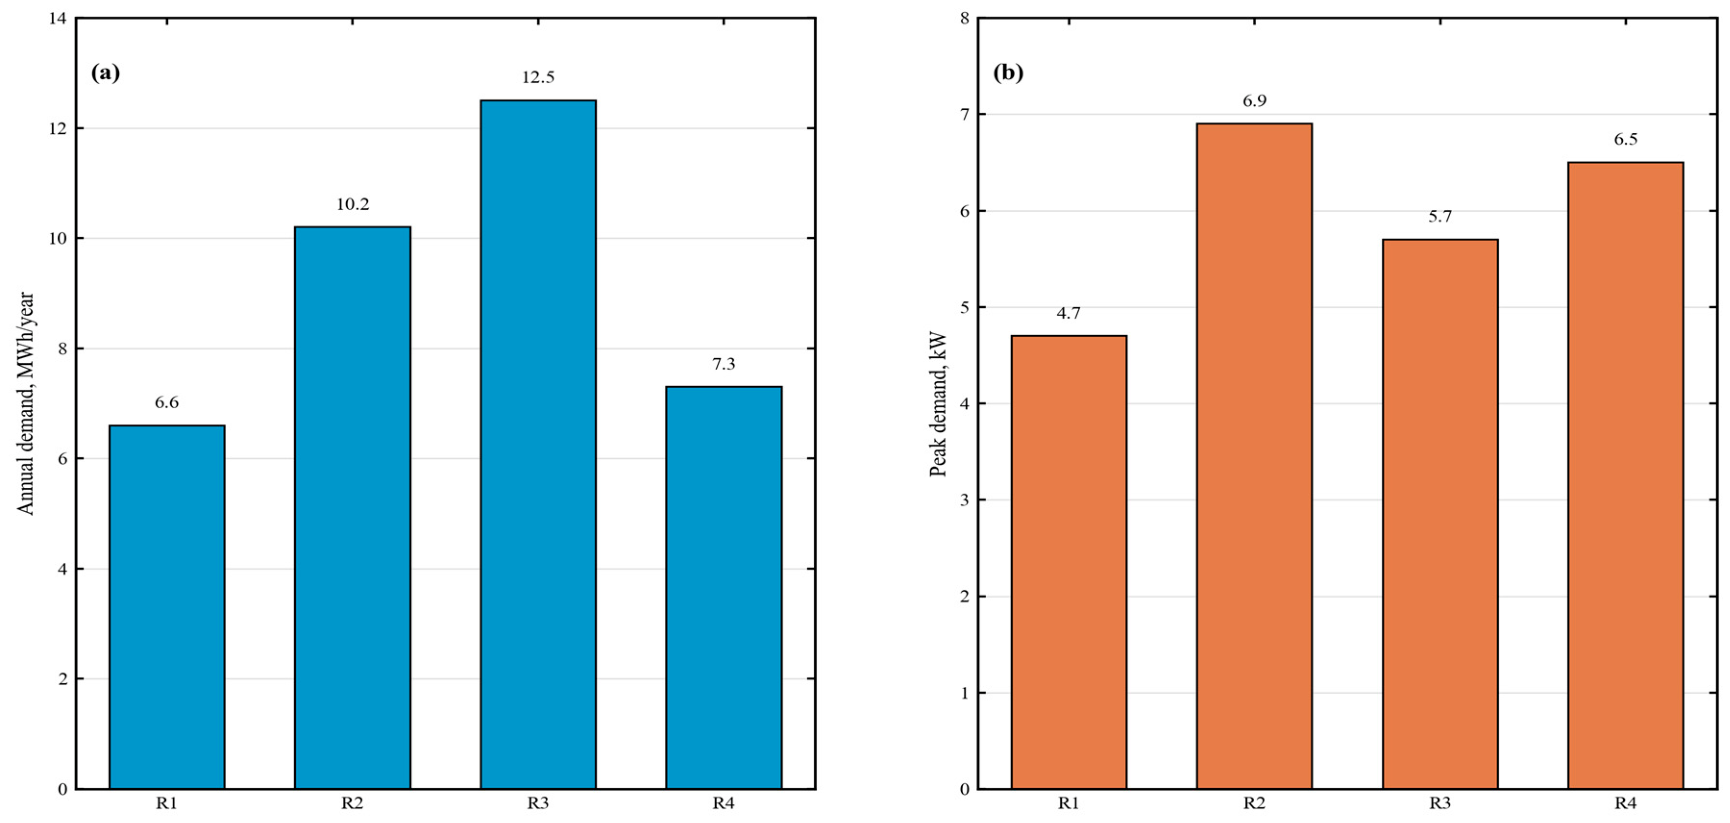
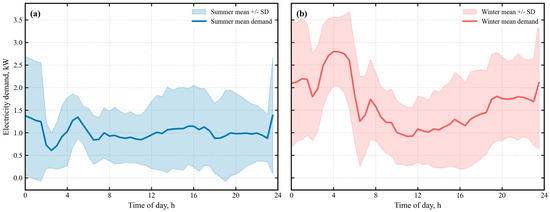
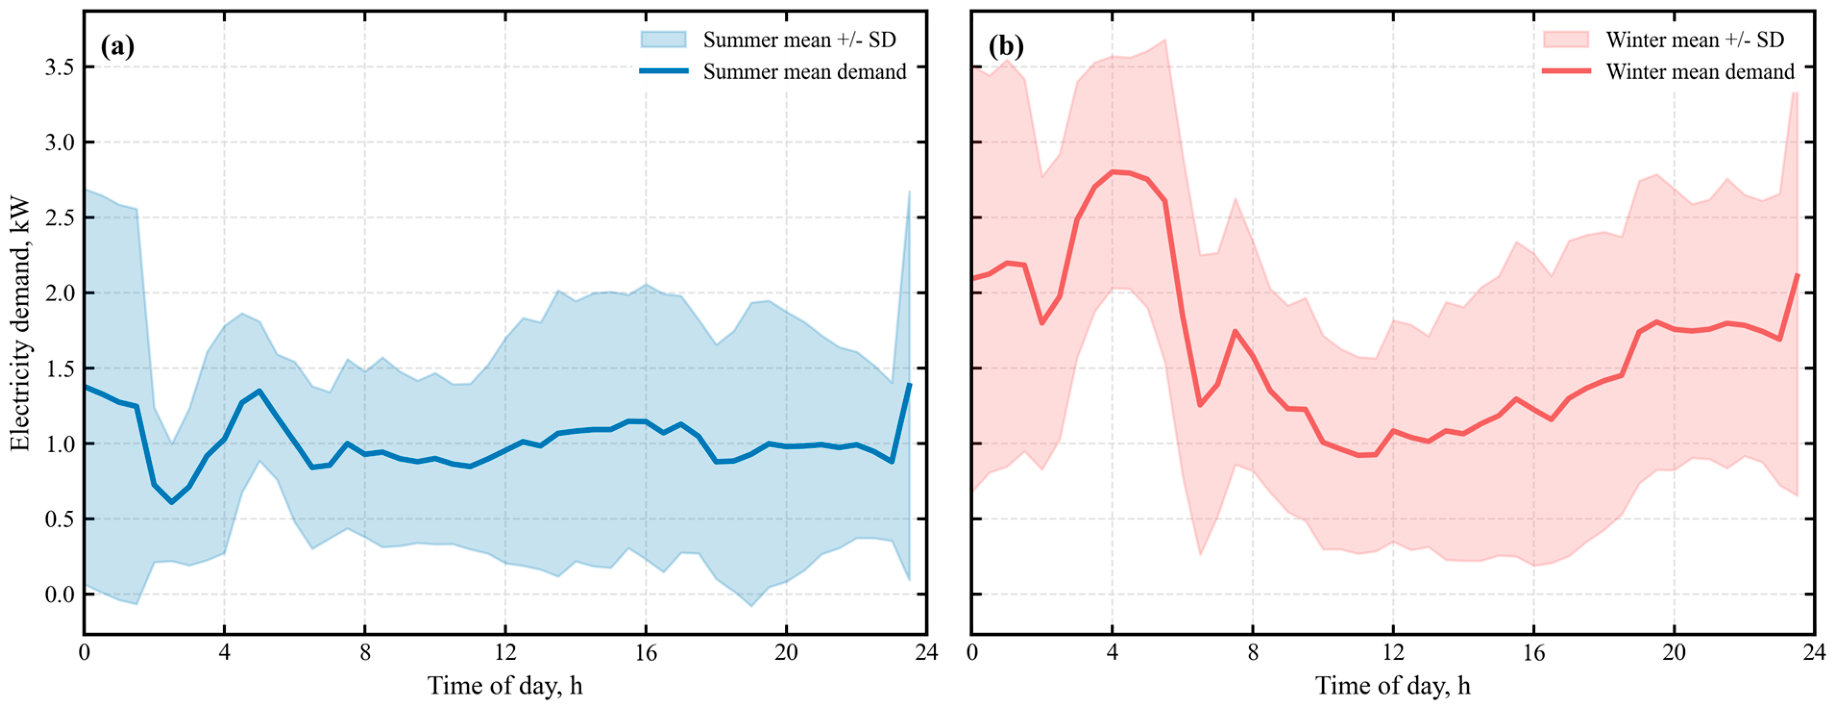
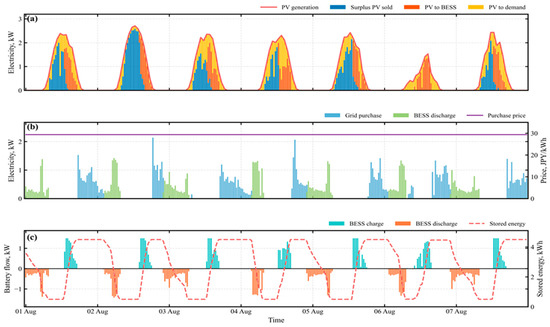
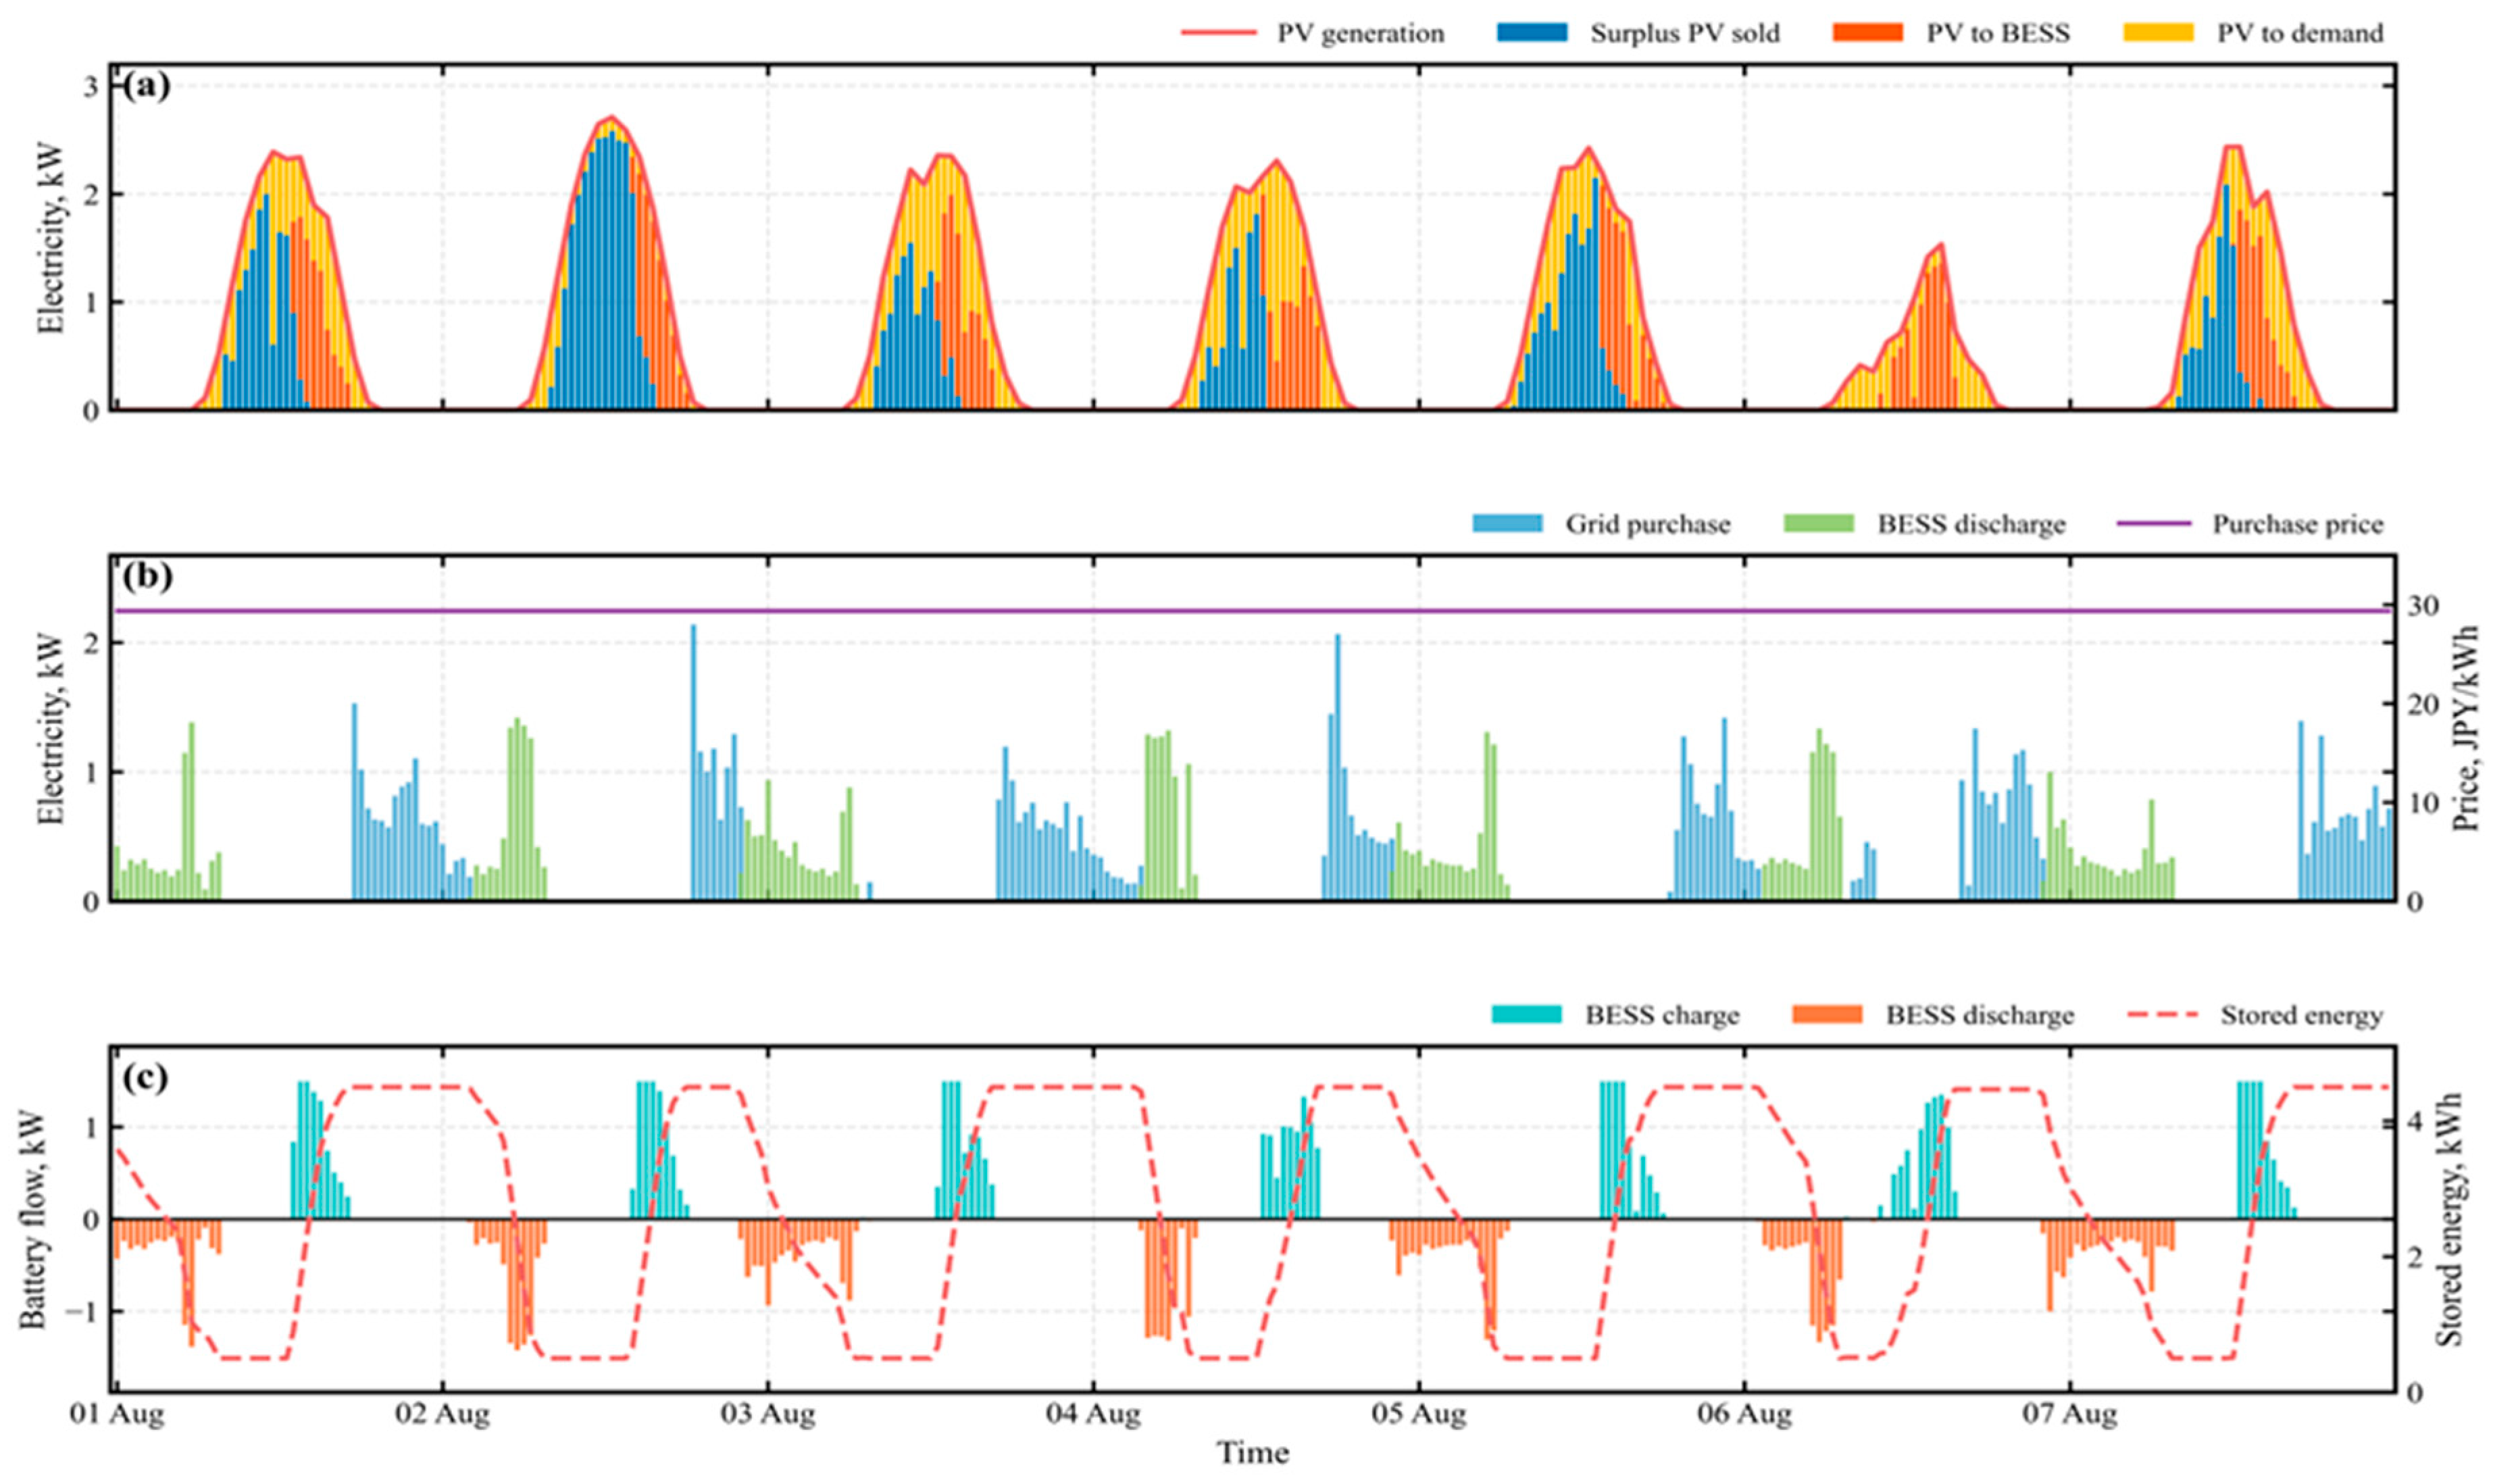
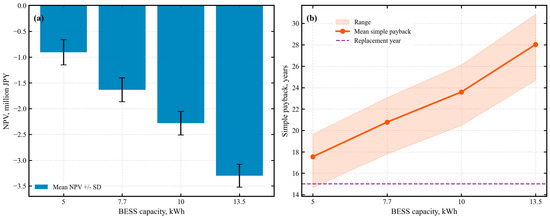
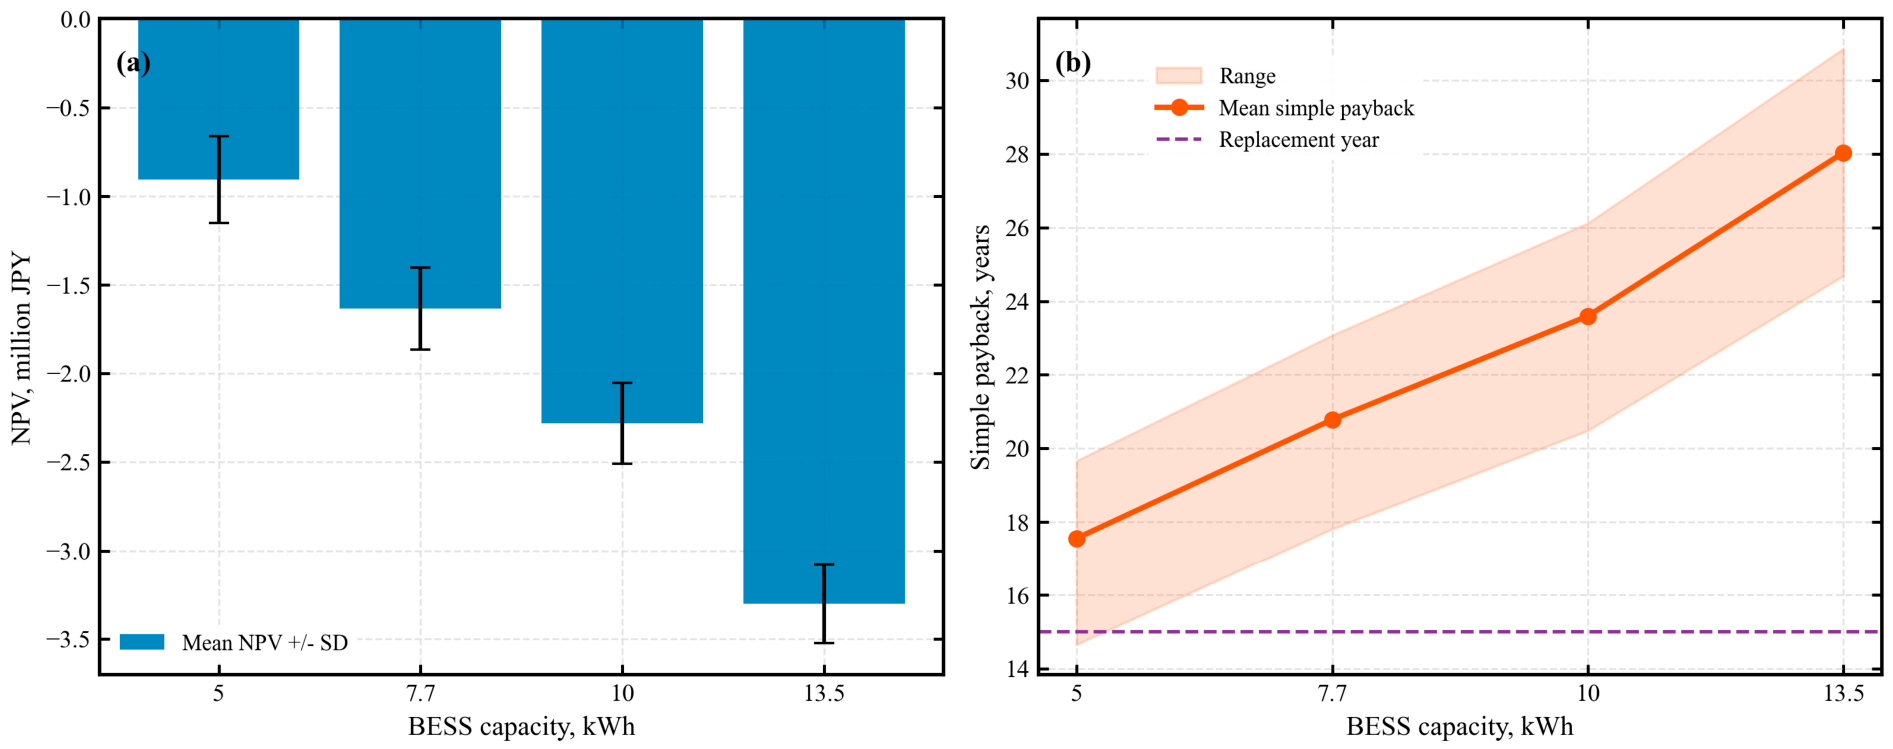
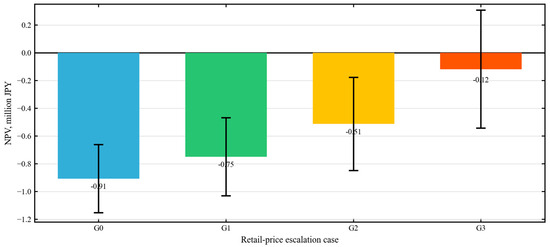
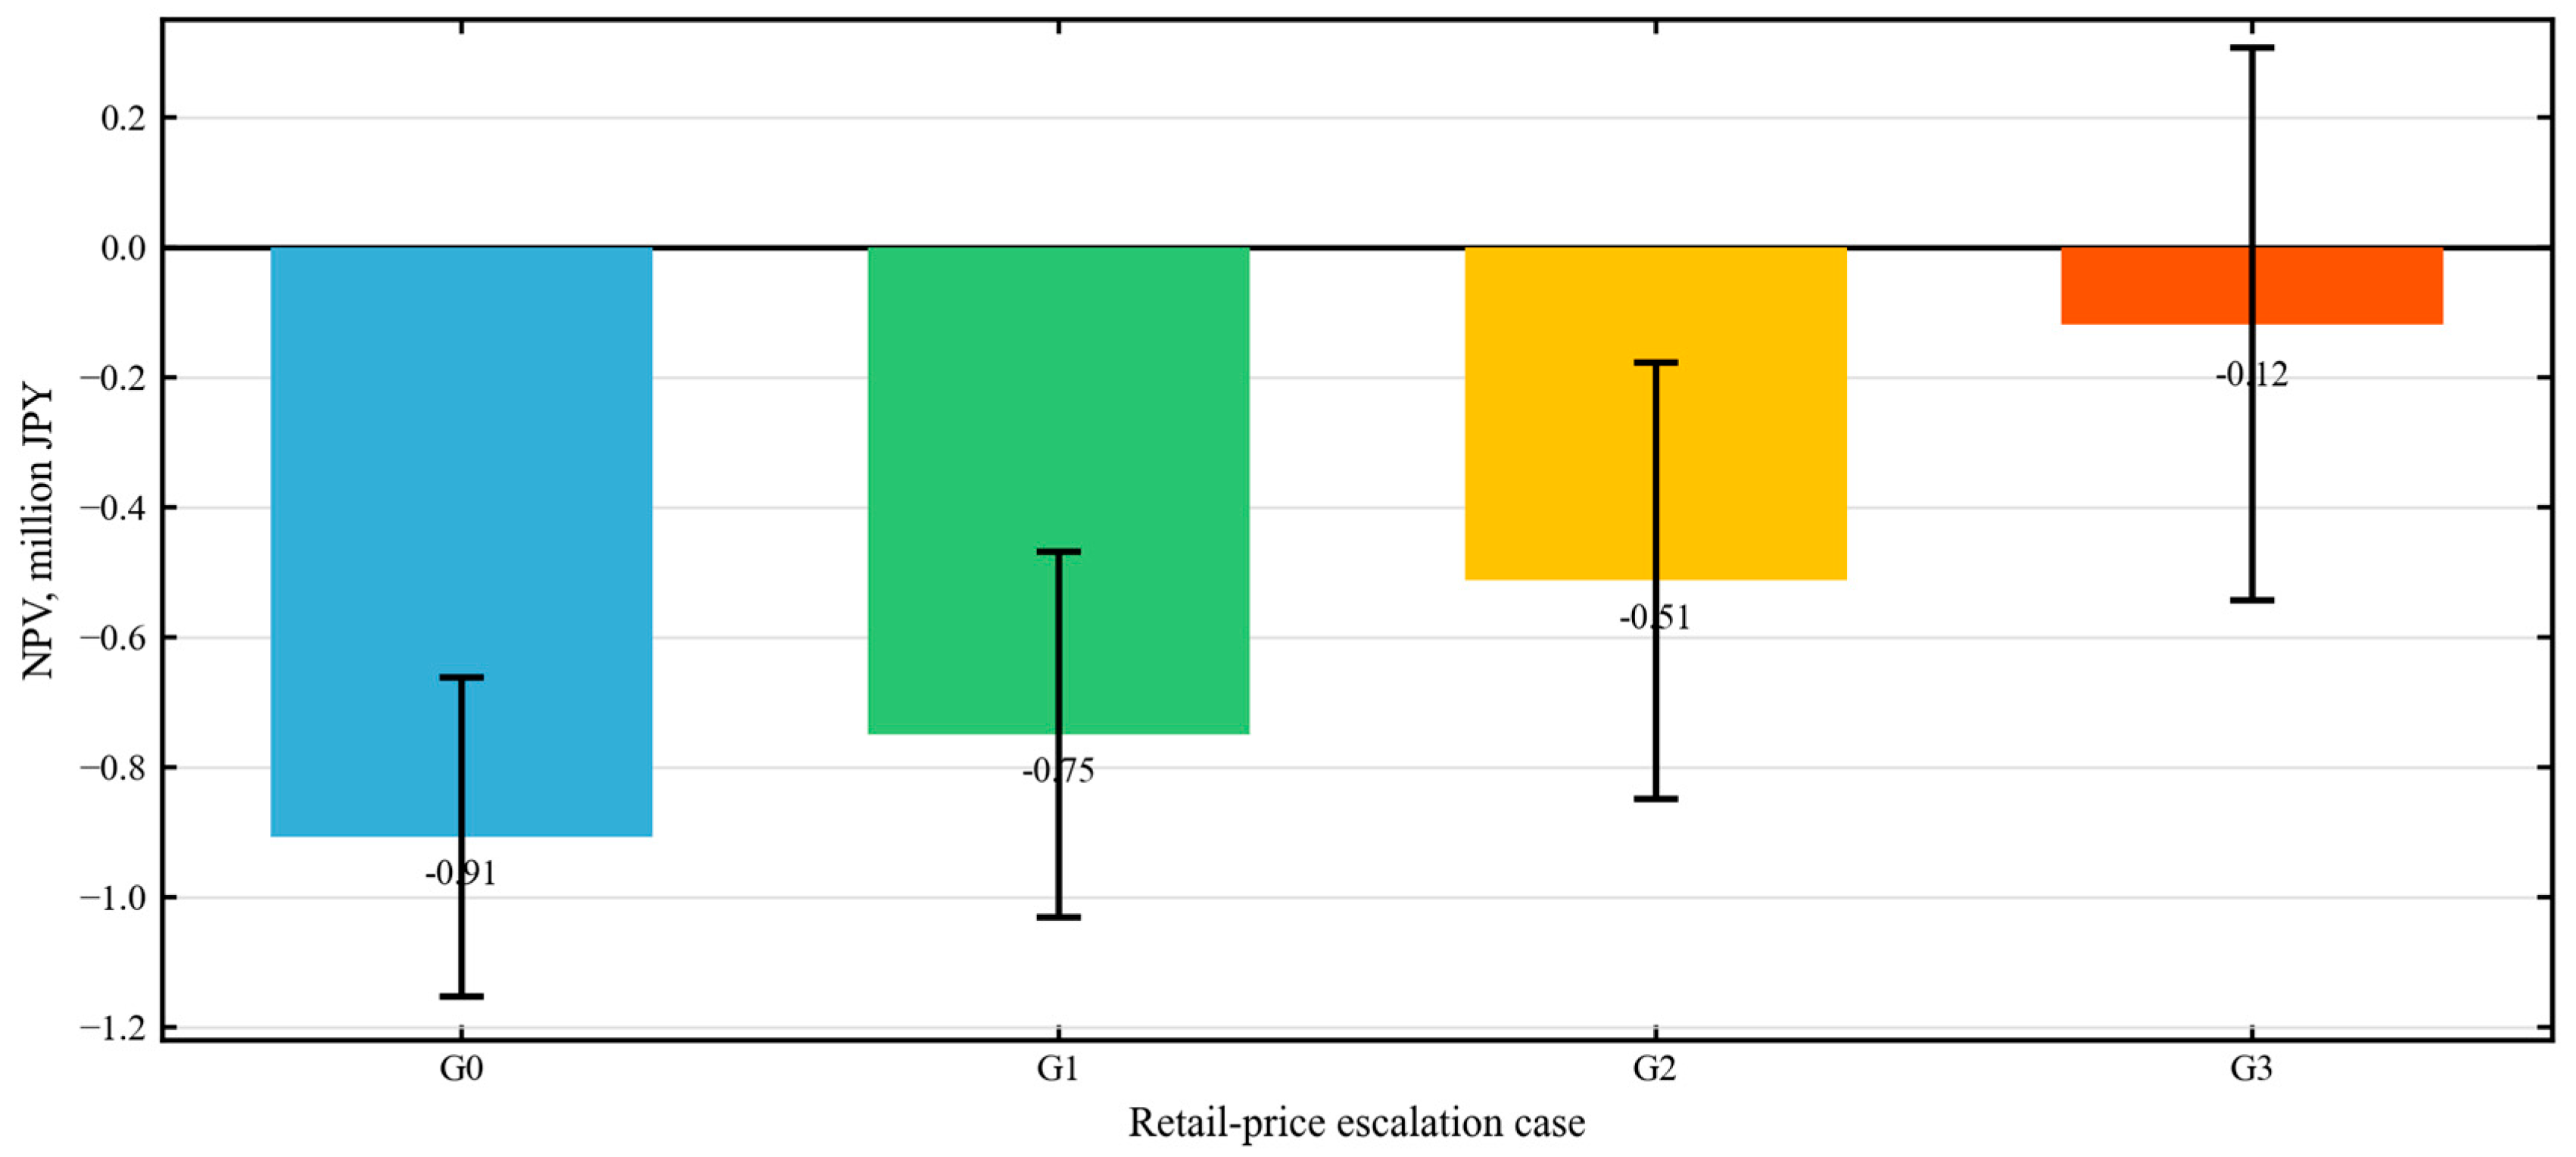
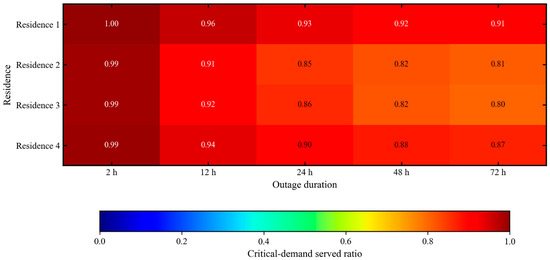
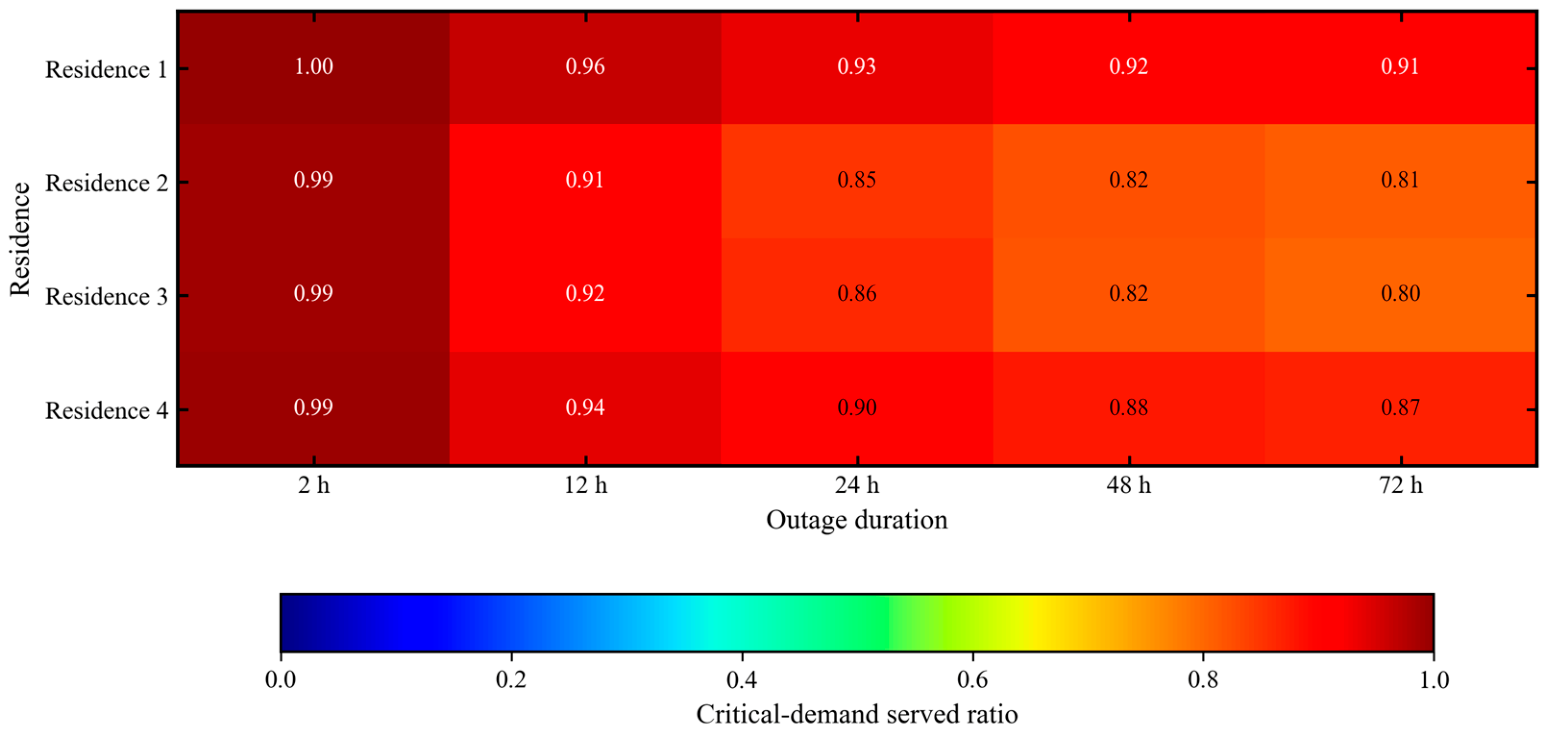
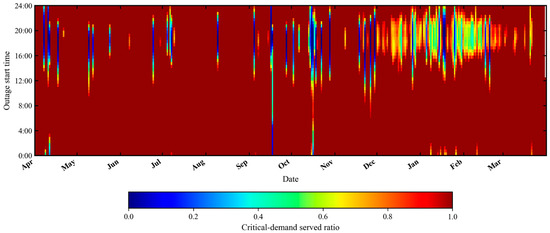
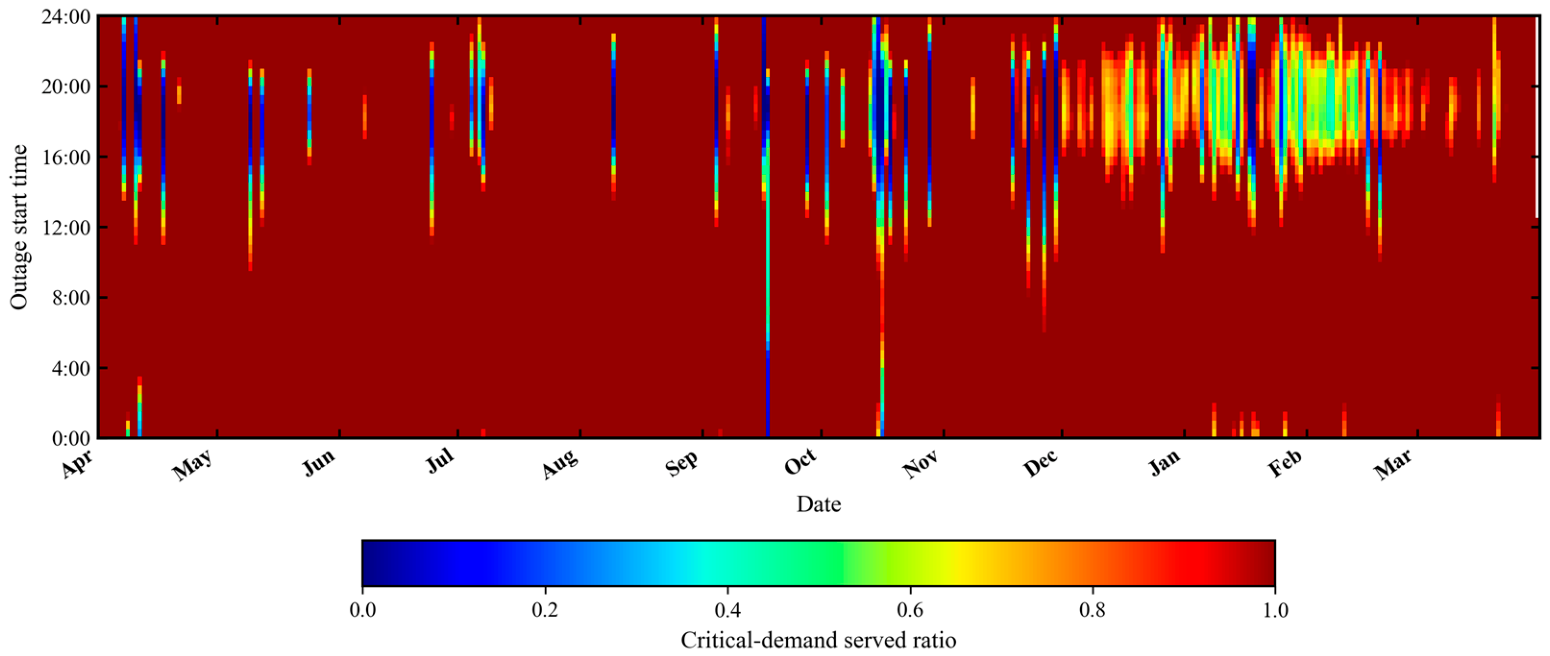
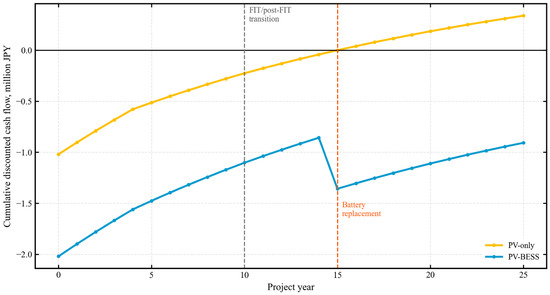
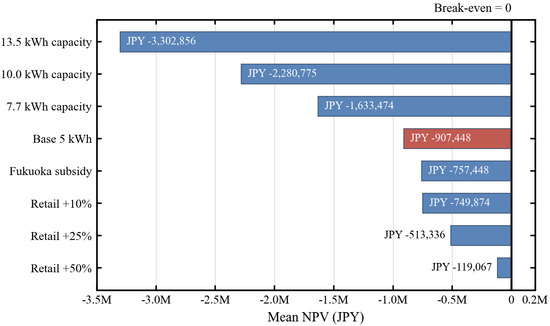
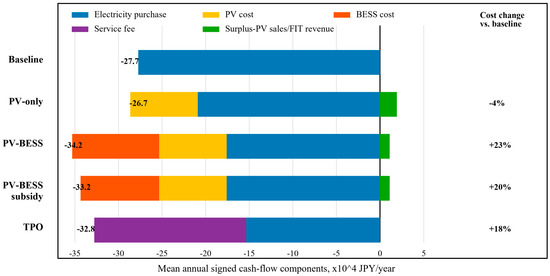
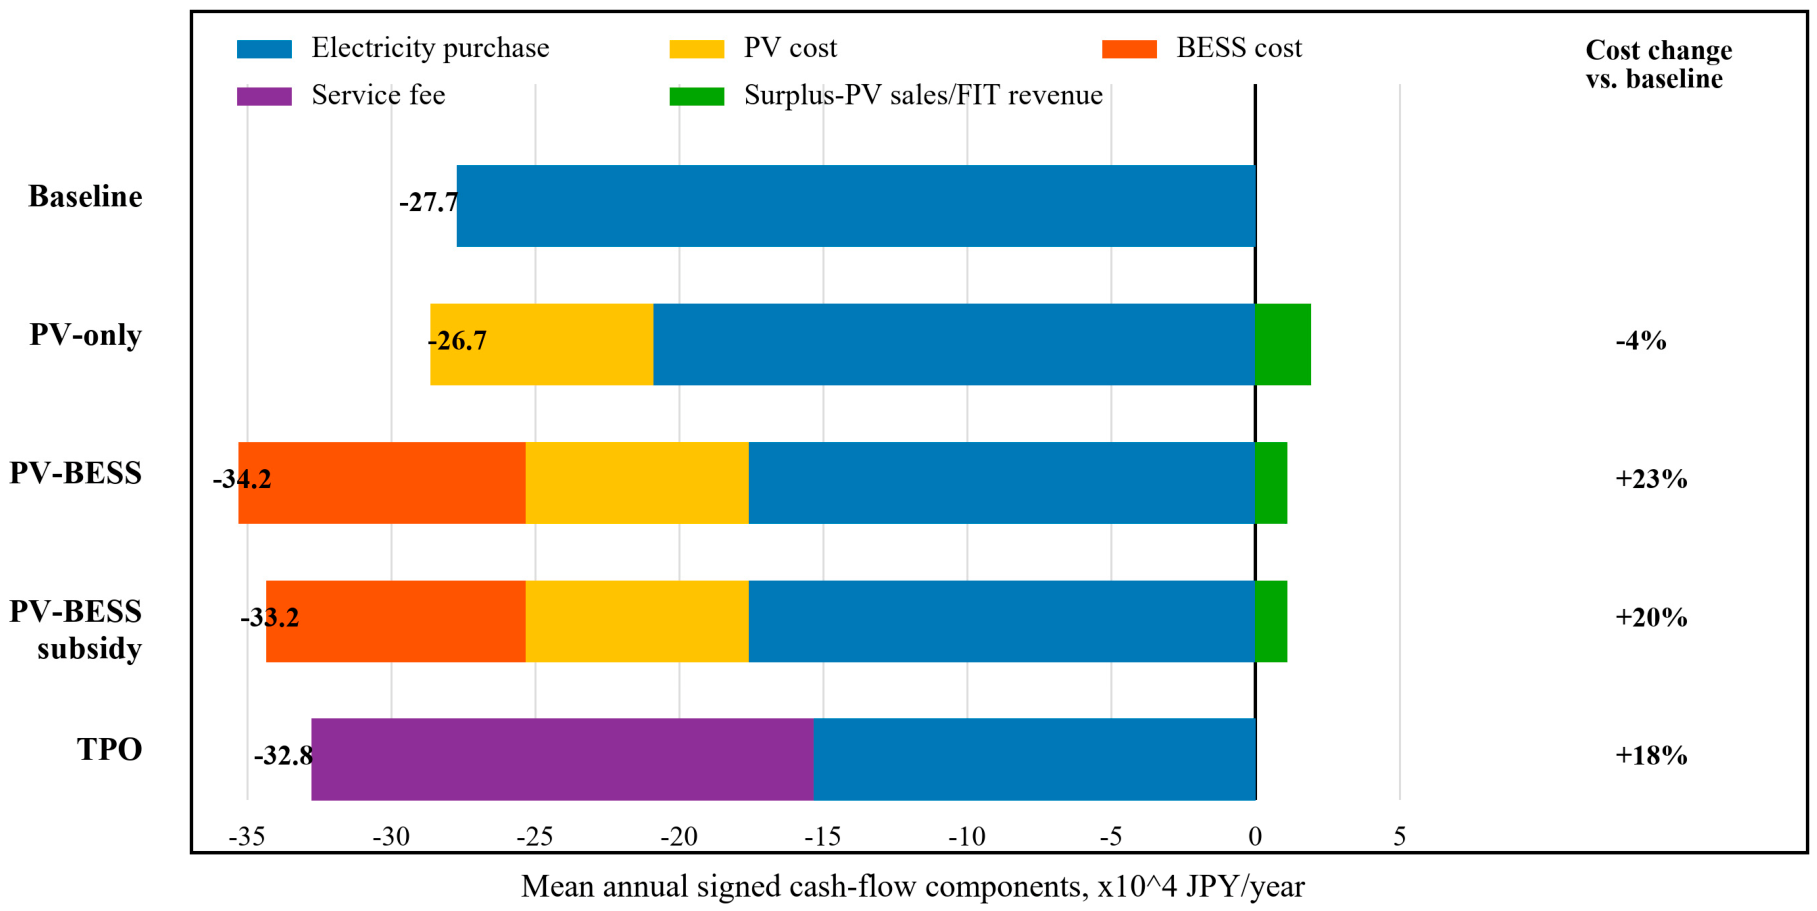

Disclaimer/Publisher’s Note: The statements, opinions and data contained in all publications are solely those of the individual author(s) and contributor(s) and not of MDPI and/or the editor(s). MDPI and/or the editor(s) disclaim responsibility for any injury to people or property resulting from any ideas, methods, instructions or products referred to in the content. |
© 2026 by the authors. Licensee MDPI, Basel, Switzerland. This article is an open access article distributed under the terms and conditions of the Creative Commons Attribution (CC BY) license.