Article

Design and Optimization of a Novel SES-HES-AFC System

1
College of Safety and Ocean Engineering, China University of Petroleum (Beijing), Beijing 102249, China
2
Key Laboratory of Oil and Gas Safety and Emergency Technology, Ministry of Emergency Management, Beijing 102249, China
3
Key Laboratory of Oil and Gas Production Equipment Quality Inspection and Health Diagnosis, State Administration for Market Regulation, Beijing 102249, China
*
Author to whom correspondence should be addressed.
Energies 2026, 19(13), 3165; https://doi.org/10.3390/en19133165
Submission received: 24 May 2026 / Revised: 25 June 2026 / Accepted: 27 June 2026 / Published: 3 July 2026
(This article belongs to the Section G: Energy and Buildings)

Abstract

Amid the global drive for carbon peaking and carbon neutrality, integrating renewable energy into building energy systems to mitigate photovoltaic (PV) intermittency and realize low-carbon energy supply has become a critical research frontier. This study proposes a novel dual-storage renewable energy system integrating solar energy storage system (SES), hydrogen energy storage system (HES), and an alkaline fuel cell (AFC). The model was validated using a two-story single-family residence as the case study, with residential load profiles and Xi’an’s climatic conditions considered under real-world scenarios. An adaptive energy management strategy is developed to dynamically coordinate PV utilization, hydrogen dispatch, and grid interaction, while recovering AFC waste heat to enhance overall efficiency. Targeting minimized lifecycle cost (LCC) and levelized cost of energy (LCOE), the GenOpt multi-objective optimization model optimizes key design parameters. Key results show 74.2% annual renewable energy penetration, 68.5% carbon reduction versus conventional systems, and robust seasonal operation: PV dominates summer supply (81.3% self-sufficiency), while AFC compensates in winter (62.4% hydrogen contribution). The system reduces annual grid dependence by 43.7% with a minimum LCOE of ~12.9 USD/MWh, bridging technical feasibility and economic practicality to provide actionable insights for building-scale renewable integration.

1. Introduction

According to the report of China Association of Building Energy Efficiency (CABEE), building energy consumption in 2022 reached 2.42 billion tons of standard coal, accounting for 44.8% of the national total [1]. The total carbon emissions from buildings and the construction industry reached 5.13 billion tons of CO2, accounting for 48.3% of the nation’s energy-related carbon emissions. In response to climate change, the Chinese government has pledged to peak carbon emissions by 2030 and attain carbon neutrality by 2060 [2]. Against this backdrop, energy consumption and carbon emissions in the building sector urgently need to be optimized through the integration of renewable energy and efficient energy storage technologies, especially the application and system integration of solar energy [3].
Photovoltaic (PV) power, as a cost-effective and technologically mature renewable energy source, has developed rapidly in China, with newly installed PV capacity exceeding 87 GW in 2022, including 36 GW of centralized PV and 51 GW of distributed PV, representing a year-on-year increase of 59.30% [4,5]. However, PV power generation is intermittent, which poses challenges to grid stability and power quality [6]. However, the increasing penetration of photovoltaic (PV) power generation may introduce intermittency and uncertainty into the power system, which can pose challenges to grid stability, voltage regulation, and power quality [7,8]. To address this issue, some local governments have introduced policies to restrict the grid connection of small-scale solar plants [9,10], making the effective utilization of curtailed solar power a key challenge in PV applications. Coupling PV systems with energy storage technologies has therefore become an important solution, among which battery energy storage systems (BESSs) are commonly used to mitigate short-term PV fluctuations, while hydrogen energy storage systems (HESs) have attracted increasing attention due to their long-duration storage potential. Pemmada et al. [11] proposed integrating distributed PV with BESS to manage intermittency and uncertainty while also reducing peak electricity demand. Zhang et al. [12] investigated optimal configurations of PV/BESS and PV/BESS/diesel generator systems for smart buildings in remote regions, aiming to minimize total system cost while maximizing reliability through comprehensive optimization modeling. Gul et al. [13] proposed installing BESS in local grids and PV systems to achieve decarbonization goals for university campuses and nearby communities, and they developed a solution using a system advisor model.
However, the limited capacity of battery storage systems restricts their ability to mitigate large-scale renewable energy fluctuations over extended periods. HESs have attracted increasing global attention as an emerging technology. They store excess electricity as hydrogen during surplus periods and regenerate electricity during peak demand via fuel cells, thereby mitigating renewable energy fluctuations and improving grid stability [14]. HESs have become a research hotspot in addressing renewable energy variability.
International studies have developed relatively mature theoretical and practical foundations for integrating PV and hydrogen storage, particularly in Europe and North America, where hydrogen storage is recognized as a critical solution to the intermittency of renewables. Welder et al. [15] studied the potential of hydrogen as a renewable energy storage carrier and concluded that hydrogen storage can promote the widespread use of renewables while ensuring energy supply stability and security. Liu et al. [16] proposed a hybrid PV-wind-battery-hydrogen storage system designed to deliver stable electricity to high-rise residential buildings. Through optimizing multiple system design parameters, the researchers determined an optimal trade-off between electricity supply reliability and system performance. Song et al. [17] proposed a PV-hydrogen storage-combined cooling, heating and power (CCHP) system, which was simulated and optimized in TRNSYS to effectively address PV power curtailment in Northeast China, and they comprehensively evaluated in terms of levelized energy cost, annual total cost, fossil energy consumption, and CO2 emissions. Izadi et al. [18] introduced a PV/wind-hydrogen-based zero-energy building system, optimized via a neural network-genetic algorithm to accommodate diverse climatic conditions. In PV-hydrogen integration, fuel cells are the preferred method for converting hydrogen into electricity, as they offer the most efficient utilization of hydrogen’s potential [19]. Babatunde et al. [20] proposed a diversified storage system integrating PV, micro wind turbines, and fuel cells, incorporating both battery and hydrogen storage, and they conducted a comprehensive economic analysis. The system offers continuous, stable power delivery, lower electricity costs, and enhanced environmental sustainability. Okundamiya et al. [21] studied a PV-hydrogen fuel cell microgrid system for Information and Communication Technology (ICT) buildings and found that it can effectively reduce electricity costs and offer both economic and environmental benefits. Pal et al. [22] developed an off-grid PV-hydrogen fuel cell power system for remote areas, optimizing system capacities to minimize the levelized cost of energy (LCOE) and net present cost.
Although previous studies have made some progress in integrating PV systems with hydrogen energy storage, most of them emphasize system integration rather than system optimization. In addition, comparative analyses between PV-battery energy storage systems (PV-BESSs) and PV-hydrogen energy storage systems (PV-HESs) are still lacking. Therefore, this paper presents a novel dual-storage renewable energy system that integrates solar energy storage and hydrogen energy storage systems based on an alkaline fuel cell (SES-HES-AFC) and performs modeling and optimization analysis using the TRNSYS 18 platform. The main contributions of this paper include the following:
  • Establishment of a multi-energy complementary system model integrating photovoltaics, solar thermal energy, and hydrogen energy; proposition of a dynamic energy scheduling strategy for multi-operating conditions; and revelation of the influence mechanism of parameters and control strategies on building energy supply performance.
  • Realization of life cycle cost optimization of the system based on GenOpt; establishment of a multi-dimensional evaluation system including electricity coverage rate, carbon emissions and levelized cost of energy; and completion of the comprehensive verification of system performance.
The remainder of this paper is organized as follows. Section 2 describes the case-study building, climatic conditions, system configuration, model validation, and control strategy. Section 3 presents the optimization variables, objective functions, constraints, and evaluation indicators. Section 4 analyzes and discusses the optimization results and system performance. Finally, Section 5 summarizes the main conclusions of this study.

2. Buildings and Methodology of the SES-HES-AFC System

2.1. Conditions in Xi’an

Xi’an is chosen as the research location in this study. Situated at 107.40–109.49° E and 33.42–34.45° N, Xi’an has a warm temperate semi-humid continental monsoon climate [15]. Its climatic data reveal pronounced seasonal cycles and year-to-year variability, characteristic of continental temperate regions.
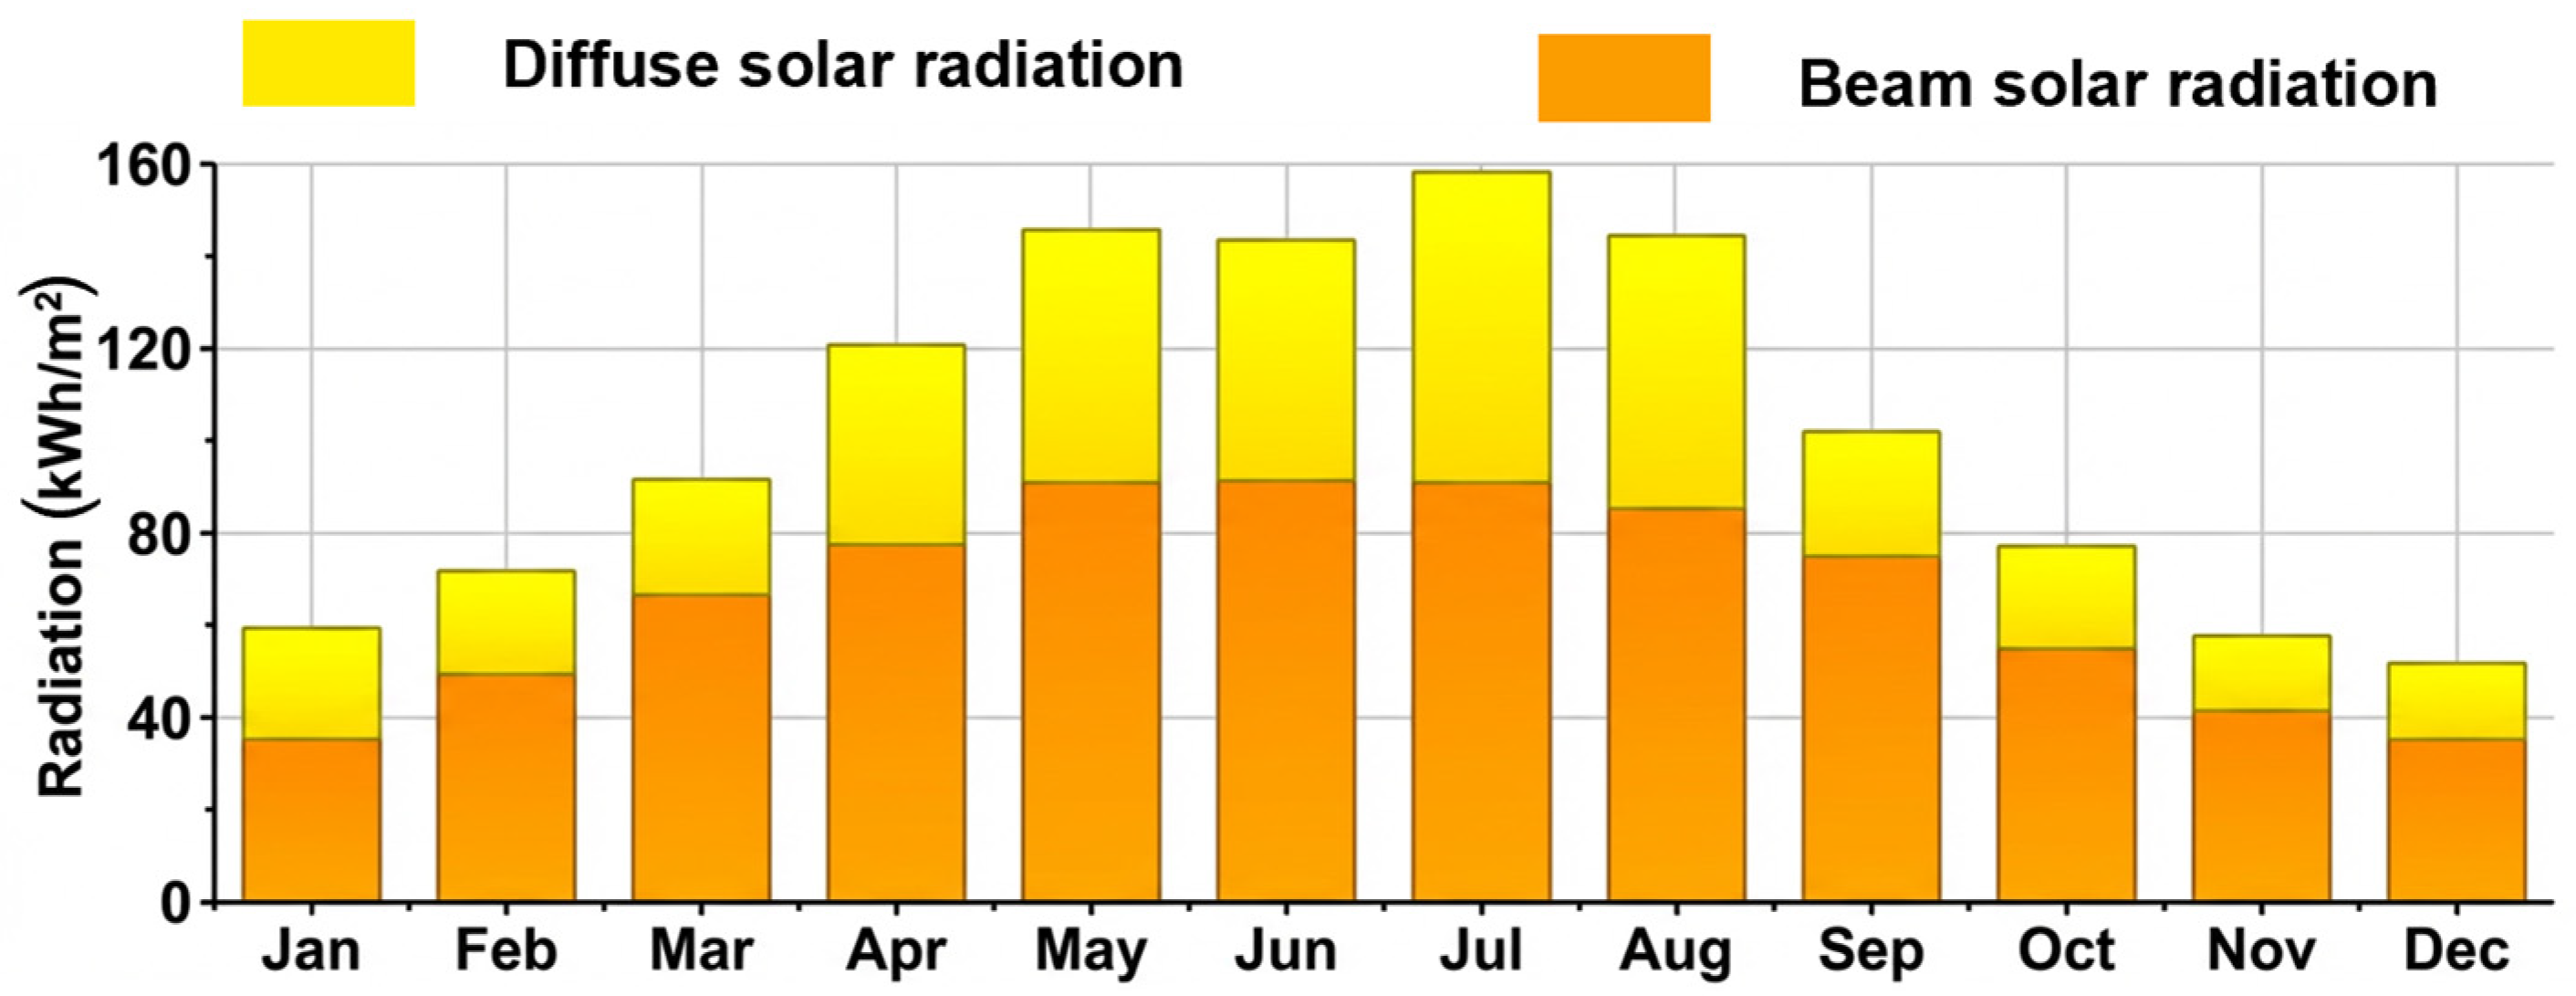
According to the solar radiation data in Figure 1, the monthly radiation distribution in Xi’an demonstrates a distinct pattern. The highest monthly radiation is observed in summer (June–August), with average values reaching 140–160 kWh/m2, mainly due to higher solar elevation and more frequent clear days. During winter (December–February), radiation declines markedly to approximately 50–70 kWh/m2 due to lower solar angles and enhanced atmospheric scattering. Moreover, Xi’an’s average daily solar radiation in June surpasses 6.5 kWh/m2, far exceeding the 2.5–3.0 kWh/m2 observed in winter, indicating strong seasonal variation and important implications for solar energy utilization.
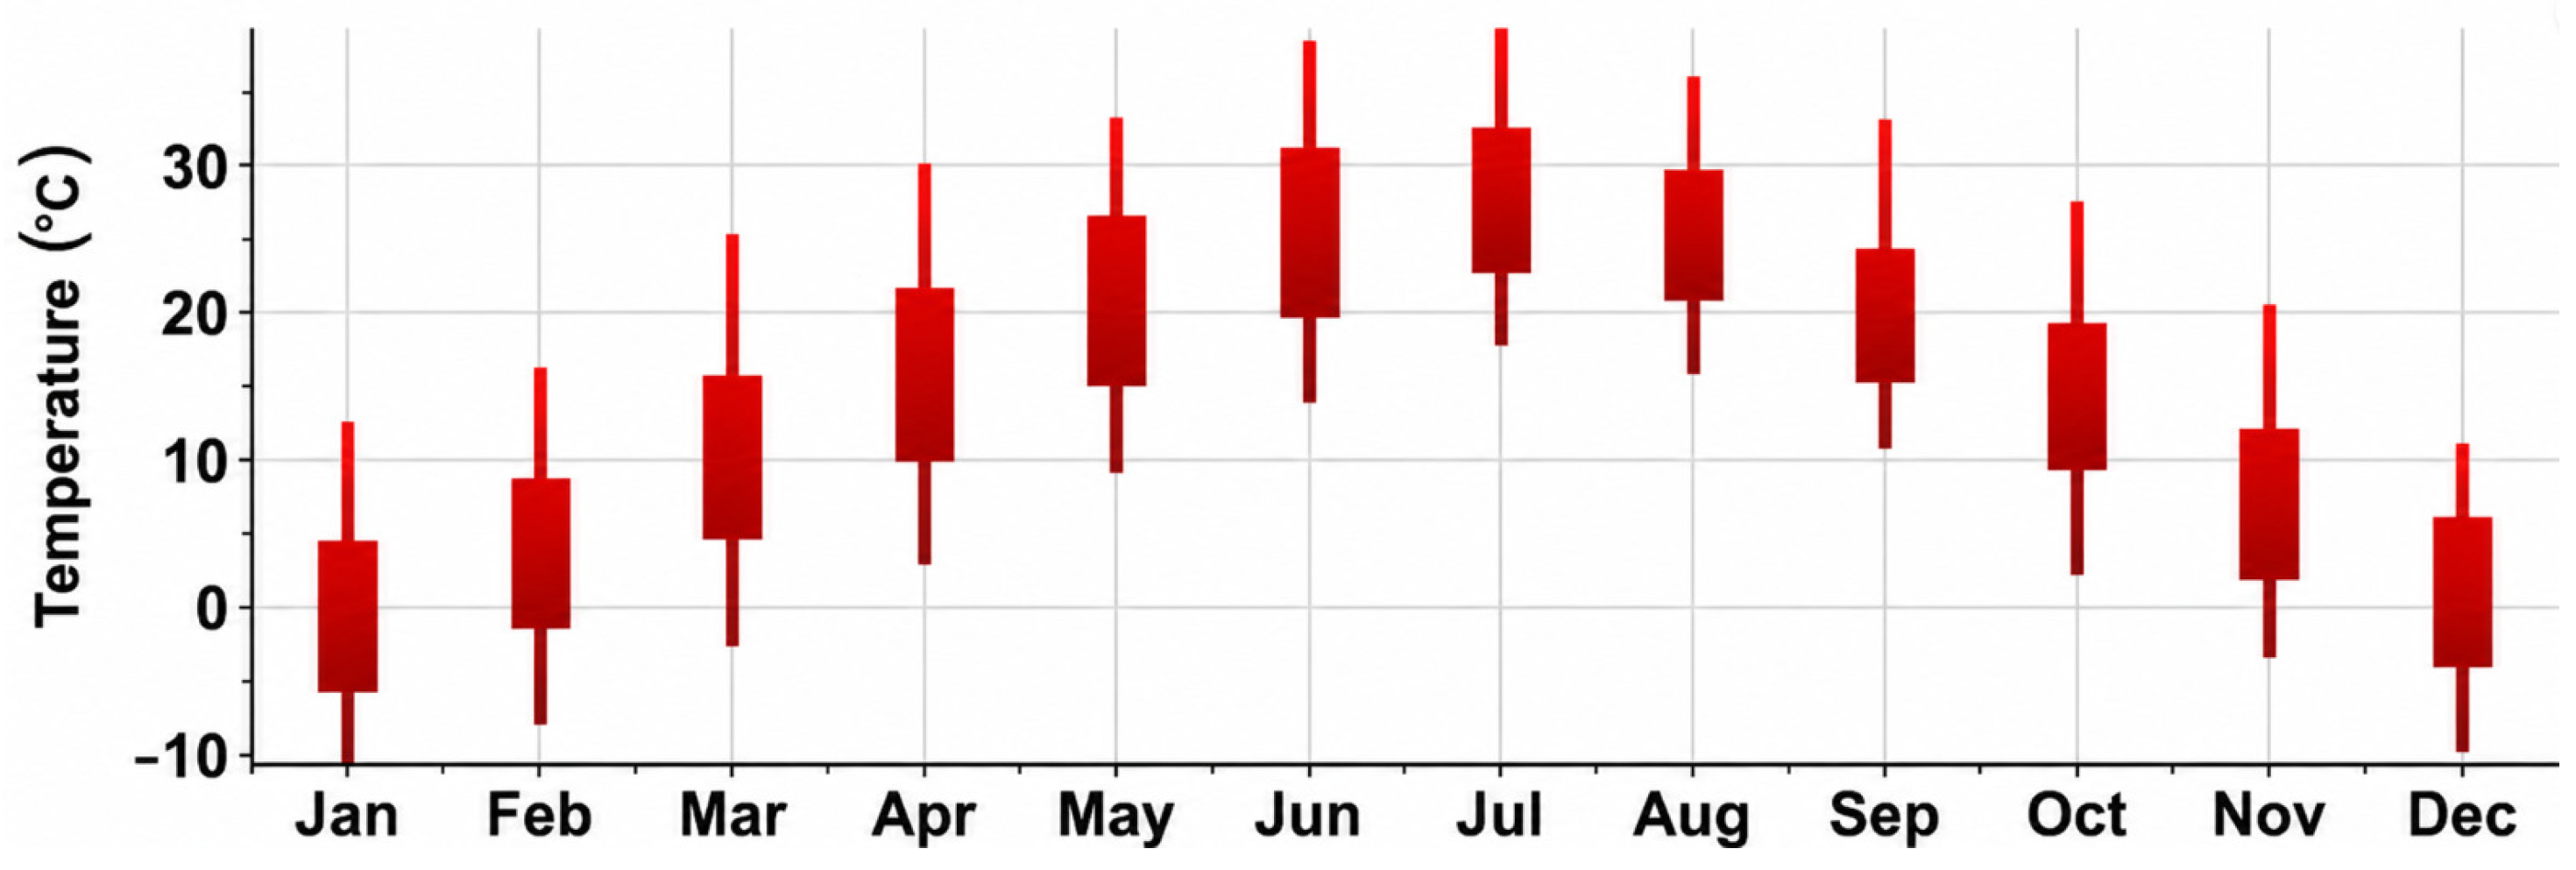
Figure 2 shows pronounced seasonal temperature differences: July reaches the annual maximum (28–30 °C), while January falls near freezing (−1 to 1 °C), with an annual amplitude of nearly 30 °C, reflecting the characteristics of a continental climate. Xi’an also exhibits a notable synchronization between radiation and temperature, with summer heat aligning with peak solar radiation and moderate transitions during spring and autumn (March–May, September–November).
Therefore, Xi’an serves as a representative reference site for exploring renewable energy applications, including seasonal PV performance and the regulation of building thermal environments under varying heating and cooling demands.

2.2. The Architectural Model and Building Information

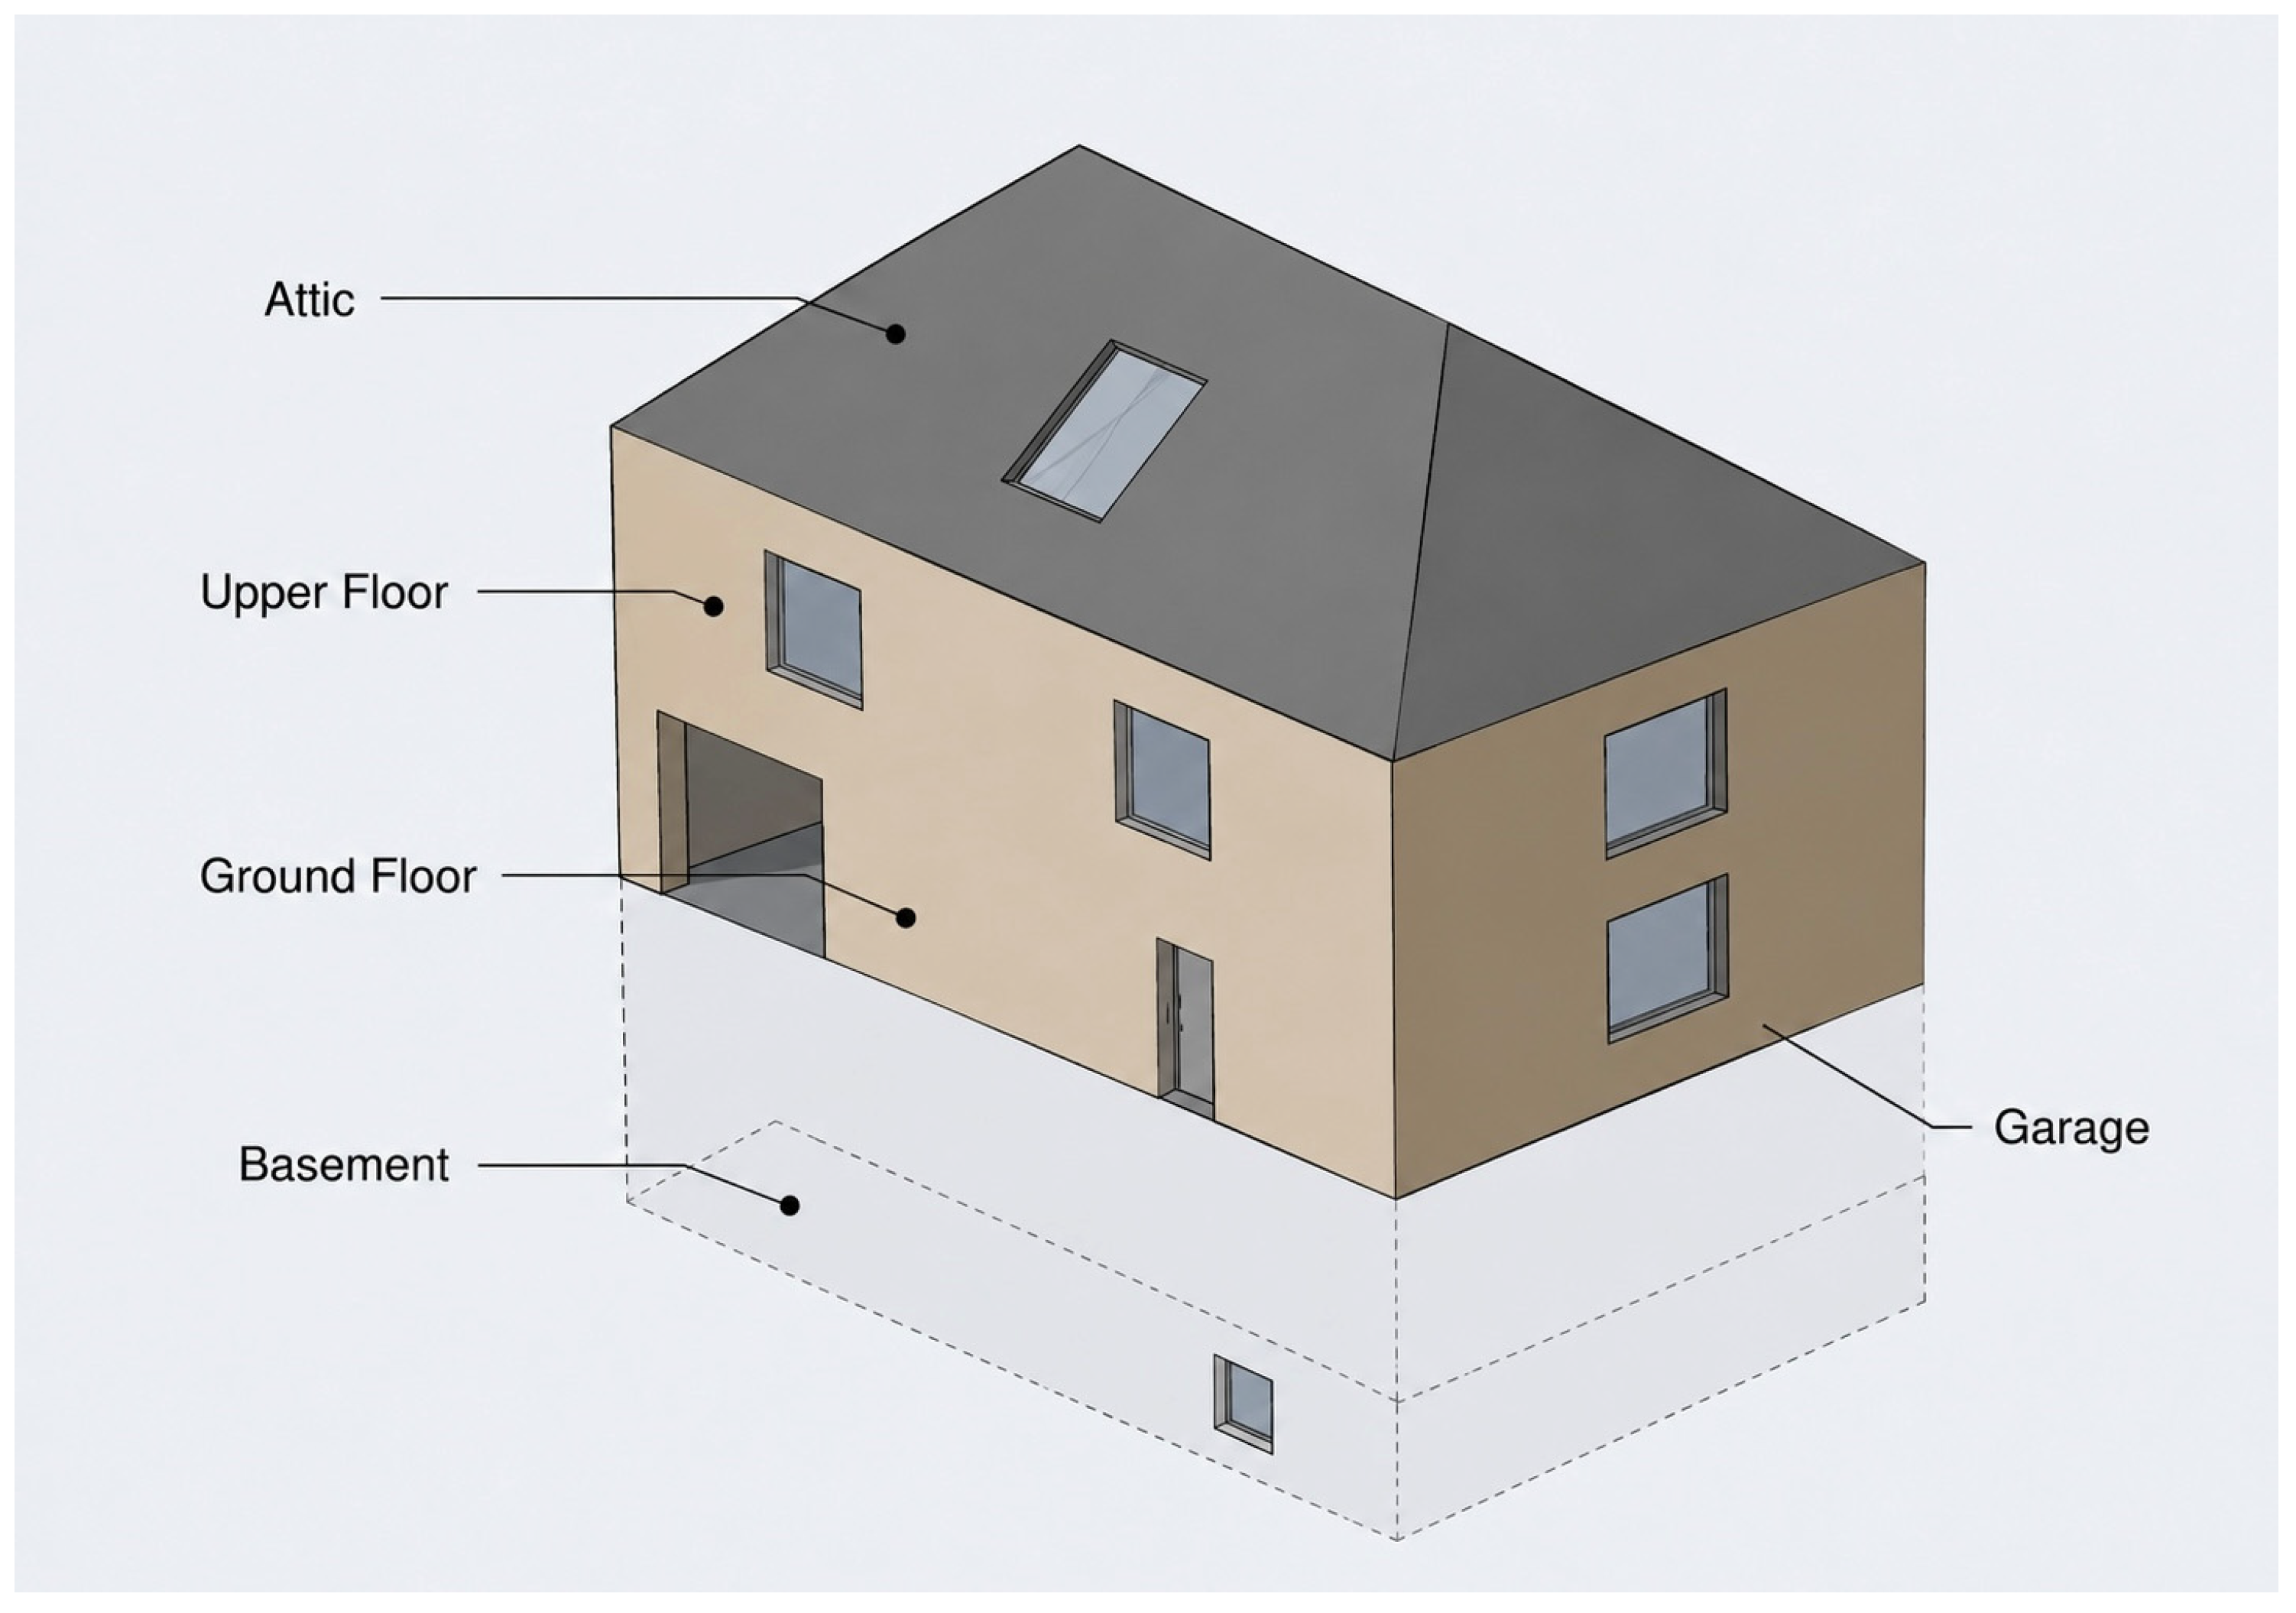
The case-study building is a two-story single-family residence, and its architectural model, thermal zoning, and main specifications are presented in Figure 3 and Table 1. The building has a total floor area of 400 m2, and each façade includes a window. The building is divided into five zones: basement, ground floor, upper floor, garage, and attic. Internal heat gains are attributed to occupants, computers, lighting, televisions, and refrigerators. Heating and cooling loads are present solely on the first and second floors. The remaining zones are subject only to internal thermal gains.
The building schedule is set as follows: weekdays from 8:00 to 18:00; closed all day on weekends; occupancy schedule from 17:00 to 8:00 the next day; and lighting schedule running all day. The indoor design temperature during heating and cooling seasons is set at 23 °C. The heating and cooling controllers are configured to 23 °C with a 2 °C control dead band. The heating period spans from October 15 to April 1. All other times of the year are regarded as the cooling season.
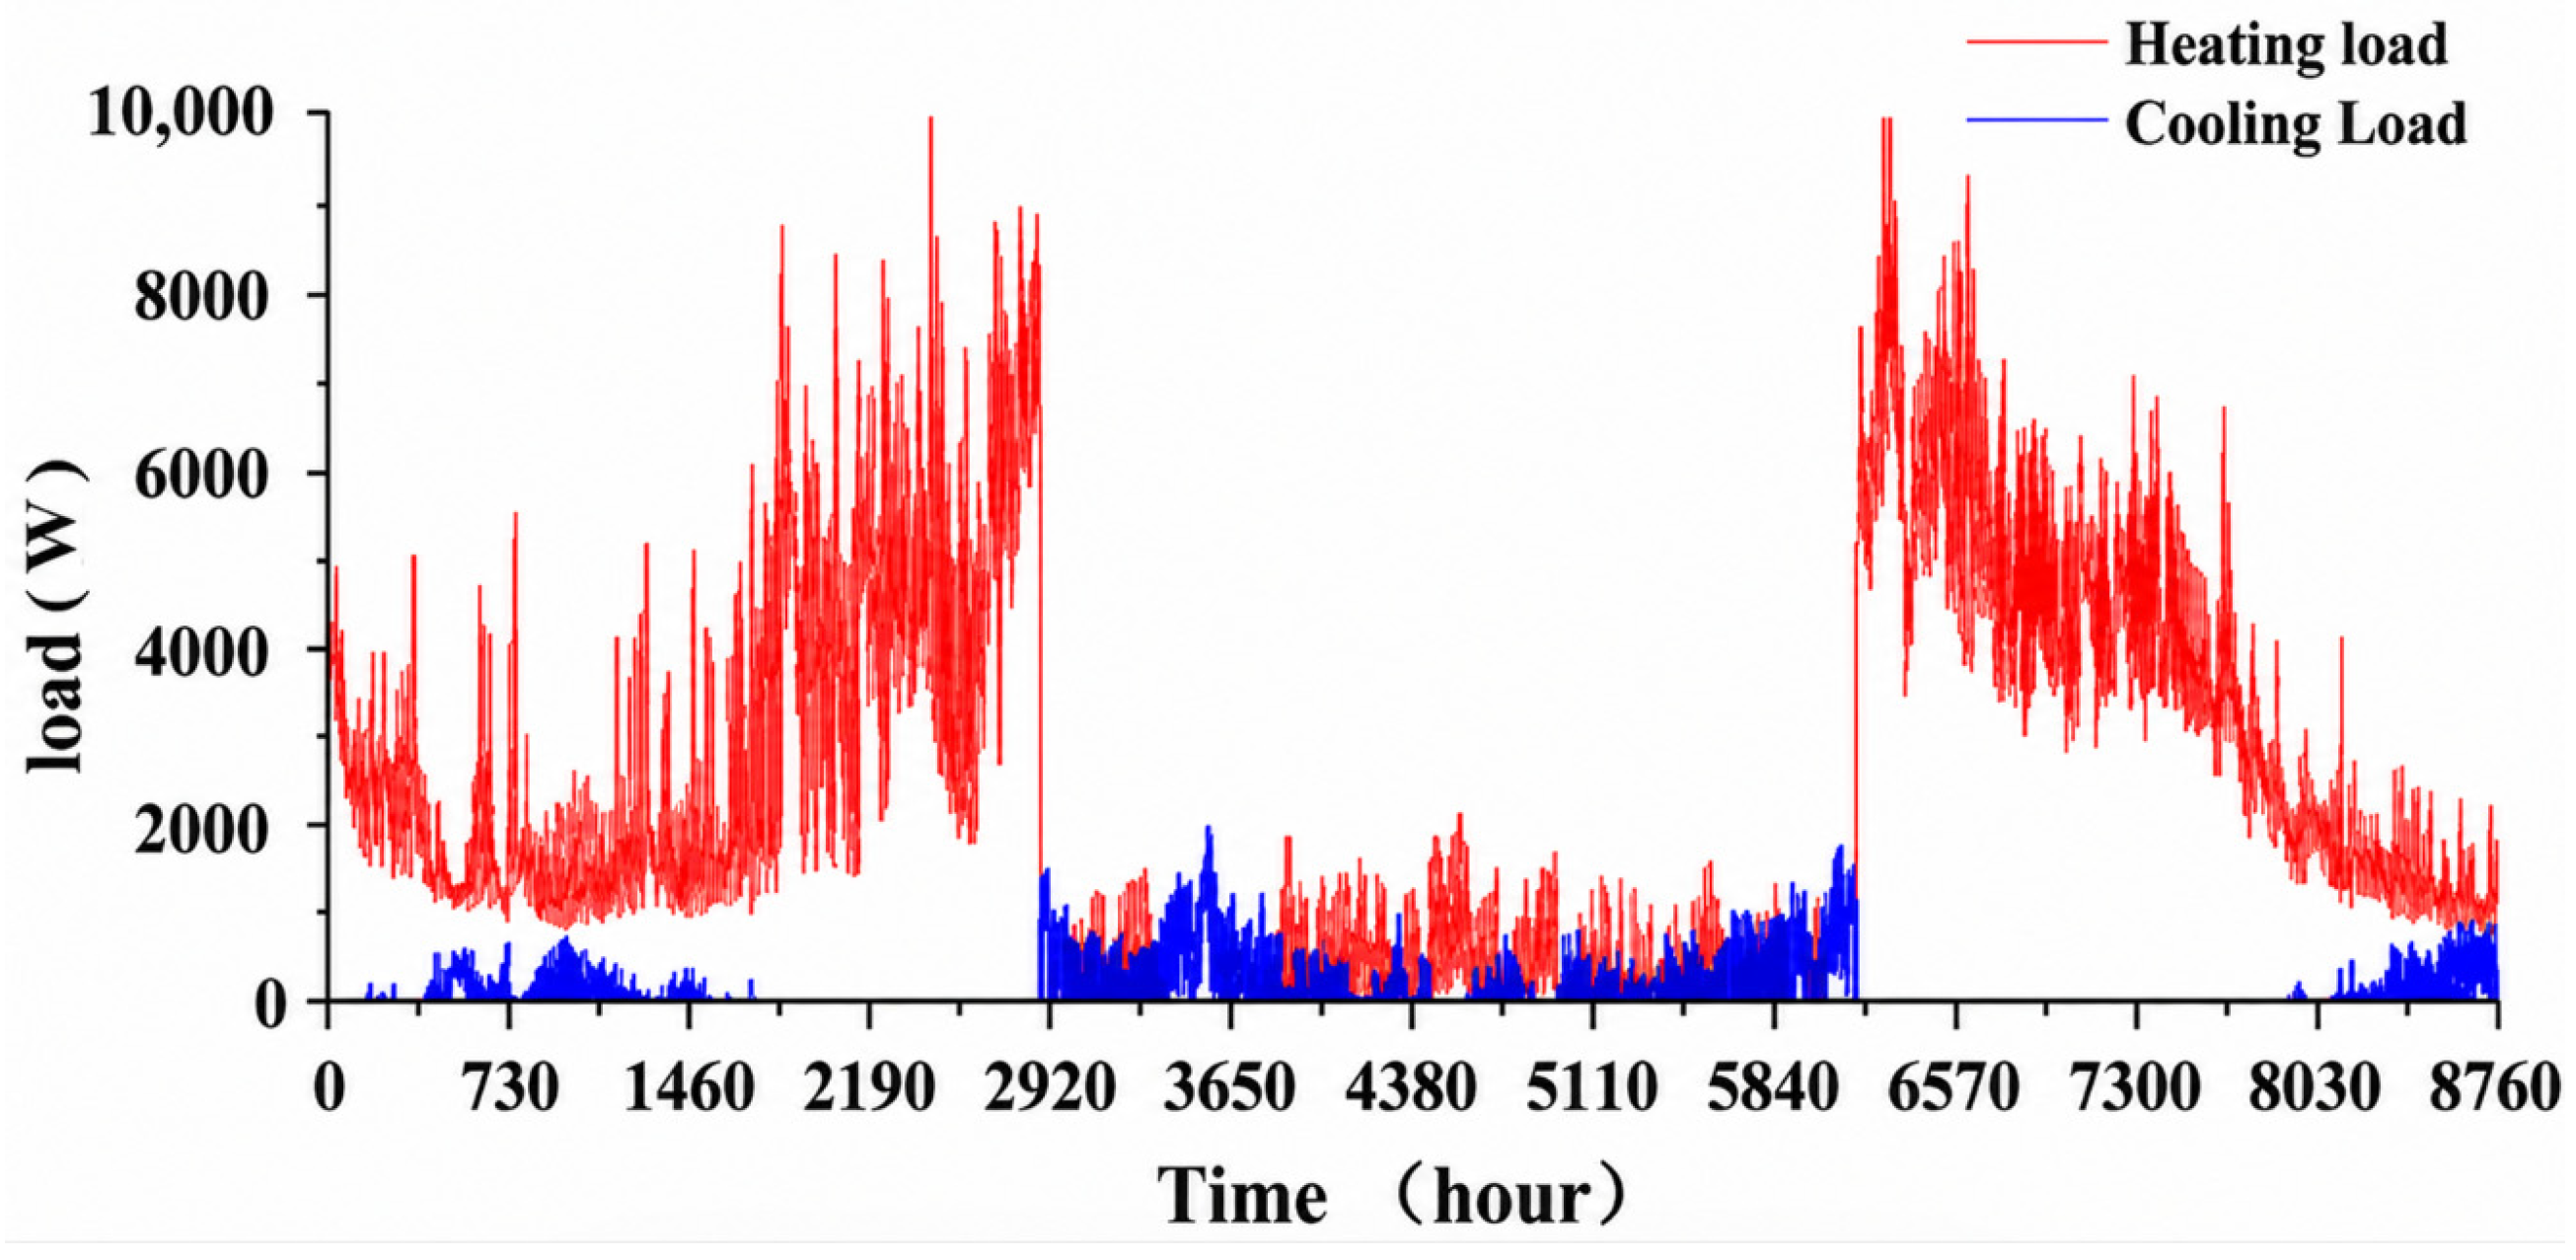
Figure 4 presents the heating and cooling load simulation results obtained from TRNBuild. Heating load is relatively high in autumn and winter, but it diminishes progressively toward the summer season. In summer, heating demand declines sharply and remains at a steady low level. In contrast, it surges again in winter before gradually decreasing. In comparison with the building’s heating and power loads, the cooling load remains relatively low. Cooling load is minimal during autumn and winter and approaches zero in the transitional seasons of spring and fall. In summer, the cooling demand rises and varies within a limited range.

2.3. System Description

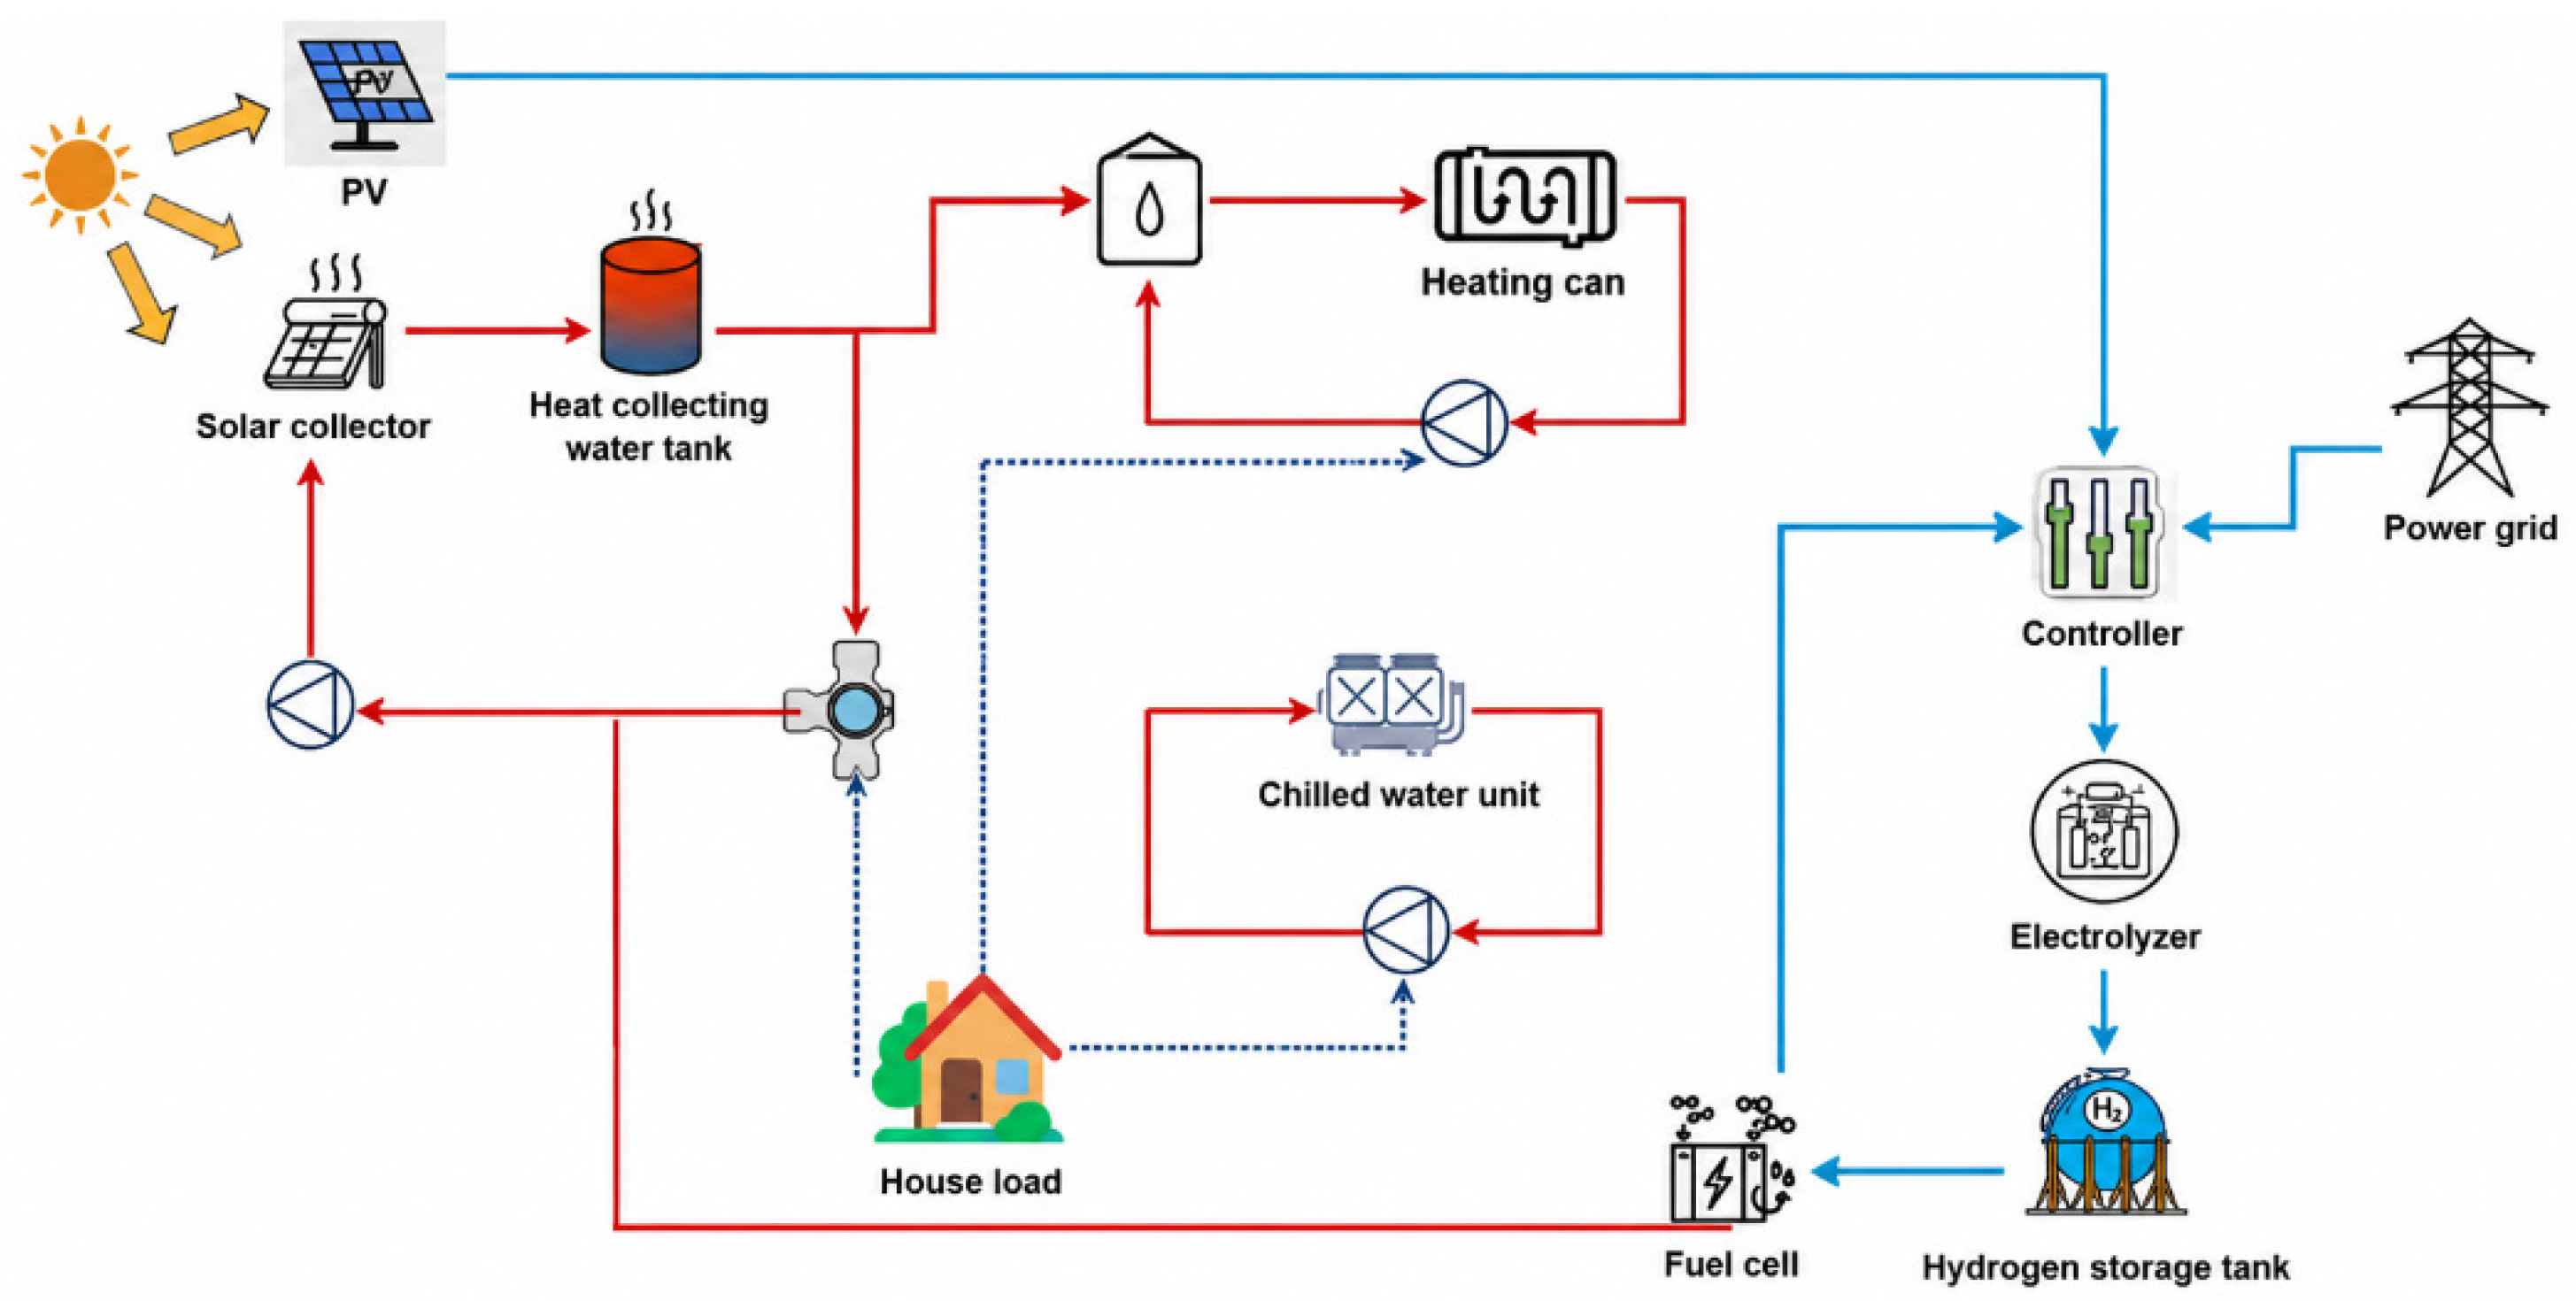
Figure 5 shows the TRNSYS (Thermal Energy System Specialists, LLC, Madison, WI, USA) model of the SES-HES-AFC system. The red arrows represent thermal energy flow, the blue arrows represent electrical energy and hydrogen flow, and the dashed arrows represent control signals or load demand signals. The main components include PV, solar flat collectors (SFCs), a heat storage tank (HCT), electric boiler (EB), electric chiller (EC), hot and cold water pumps, an electrolyzer, compressor, hydrogen storage tank, and AFC. Thermal energy harvested by the SFC is stored in the HCT and subsequently used to satisfy domestic hot water (DHW) and space-heating demands; accordingly, the design capacity of the HCT is determined in conjunction with the SFC collector area. The electric boiler (EB), as part of the heating subsystem, is powered by PV modules and supplements heating demand when solar thermal is insufficient. In contrast, the electric chiller (EC) belongs to the cooling subsystem and meets the space cooling load. The electrical energy storage component comprises a hydrogen energy storage system, with its design parameters established based on any remaining power from the photovoltaic system after fulfilling load requirements. The hydrogen stored in the HES is subsequently supplied to the AFC for electricity generation, while the waste heat released by the AFC is recovered via an internal heat exchanger and delivered to the HCT, thereby enhancing overall energy utilization efficiency of this system. A liquid-liquid plate heat exchanger is adopted in the AFC waste heat recovery system to transfer waste heat from the fuel cell stack cooling circuit to the heat storage tank (HCT). The rated heat exchange efficiency of the heat exchanger is set to 85% based on common engineering parameters of small-scale fuel cell CHP systems, which matches the default waste heat recovery parameter of the TRNSYS fuel cell module (Type173). Under rated operating conditions, the cooling water outlet temperature of the AFC ranges from 60 to 65 °C, satisfying the temperature demands of domestic hot water and space heating. The heat storage tank adopts a stratified temperature control design, with a temperature threshold of 50 °C for the domestic hot water extraction layer and a maximum storage temperature of 80 °C. In terms of control logic, the circulating pump for waste heat recovery adopts the same temperature difference control strategy as the solar thermal subsystem (Type2b controller). The pump automatically turns on to store waste heat into the HCT when the return water temperature on the AFC side is more than 5 °C higher than the water temperature at the bottom of the HCT; otherwise, the circulation stops to prevent reverse heat dissipation.

2.4. Model Validation

The AFC model adopted in this study was validated against the experimental data reported in Ref. [23]. The simulation model is highly consistent with the experimental data, indicating good usability and accuracy. The simulation results of the AFC are presented in Table 2. Relevant data verify the applicability and reliability of the AFC model in the TRNSYS environment, supporting its application in subsequent system performance analysis. The model adopts a 1 h calculation time step and receives real-time power demand signals transmitted by the system energy management controller. When the building-side power deficit exceeds the preset activation threshold (1.5 kW), the AFC is started, and its output power is dynamically regulated within the rated range according to the instantaneous power deficit. Meanwhile, waste heat generation under corresponding operating conditions is synchronously calculated based on the load rate-thermoelectric efficiency curve, realizing hourly coordinated output of electricity and heat. The model reads the real-time hydrogen storage capacity and pressure parameters of the hydrogen storage tank every hour. When the hydrogen reserve falls below the minimum operating threshold, the AFC output power will be automatically restricted, or shutdown protection will be activated. The hydrogen supply flow rate is dynamically calculated according to the electrochemical stoichiometric ratio matching the real-time power demand to guarantee the consistency between hydrogen consumption and power output. The start-stop signals and power setpoints of the AFC are issued after hourly judgment by the upper-layer energy management strategy, which takes real-time photovoltaic output, building heating and cooling loads, hydrogen tank status and other system parameters as judgment criteria. The AFC module fully participates in the 8760 h annual energy dispatch of the whole system.

2.5. Control Strategy

Table 3 details the specific components comprising the SES-HES-AFC system. Within the SES-HES-AFC system, the solar thermal collector (STC) subsystem supplies domestic hot water and space heating during the heating season. The PV subsystem supplies electricity to the EB and EC to support space heating in winter and cooling in summer. The electrolyzer, compressor, and hydrogen storage tank are all included in the HES system. Excess PV electricity is converted and stored as hydrogen in the HES. When PV output is insufficient, the AFC generates electricity by utilizing hydrogen from the HES to meet system demands.
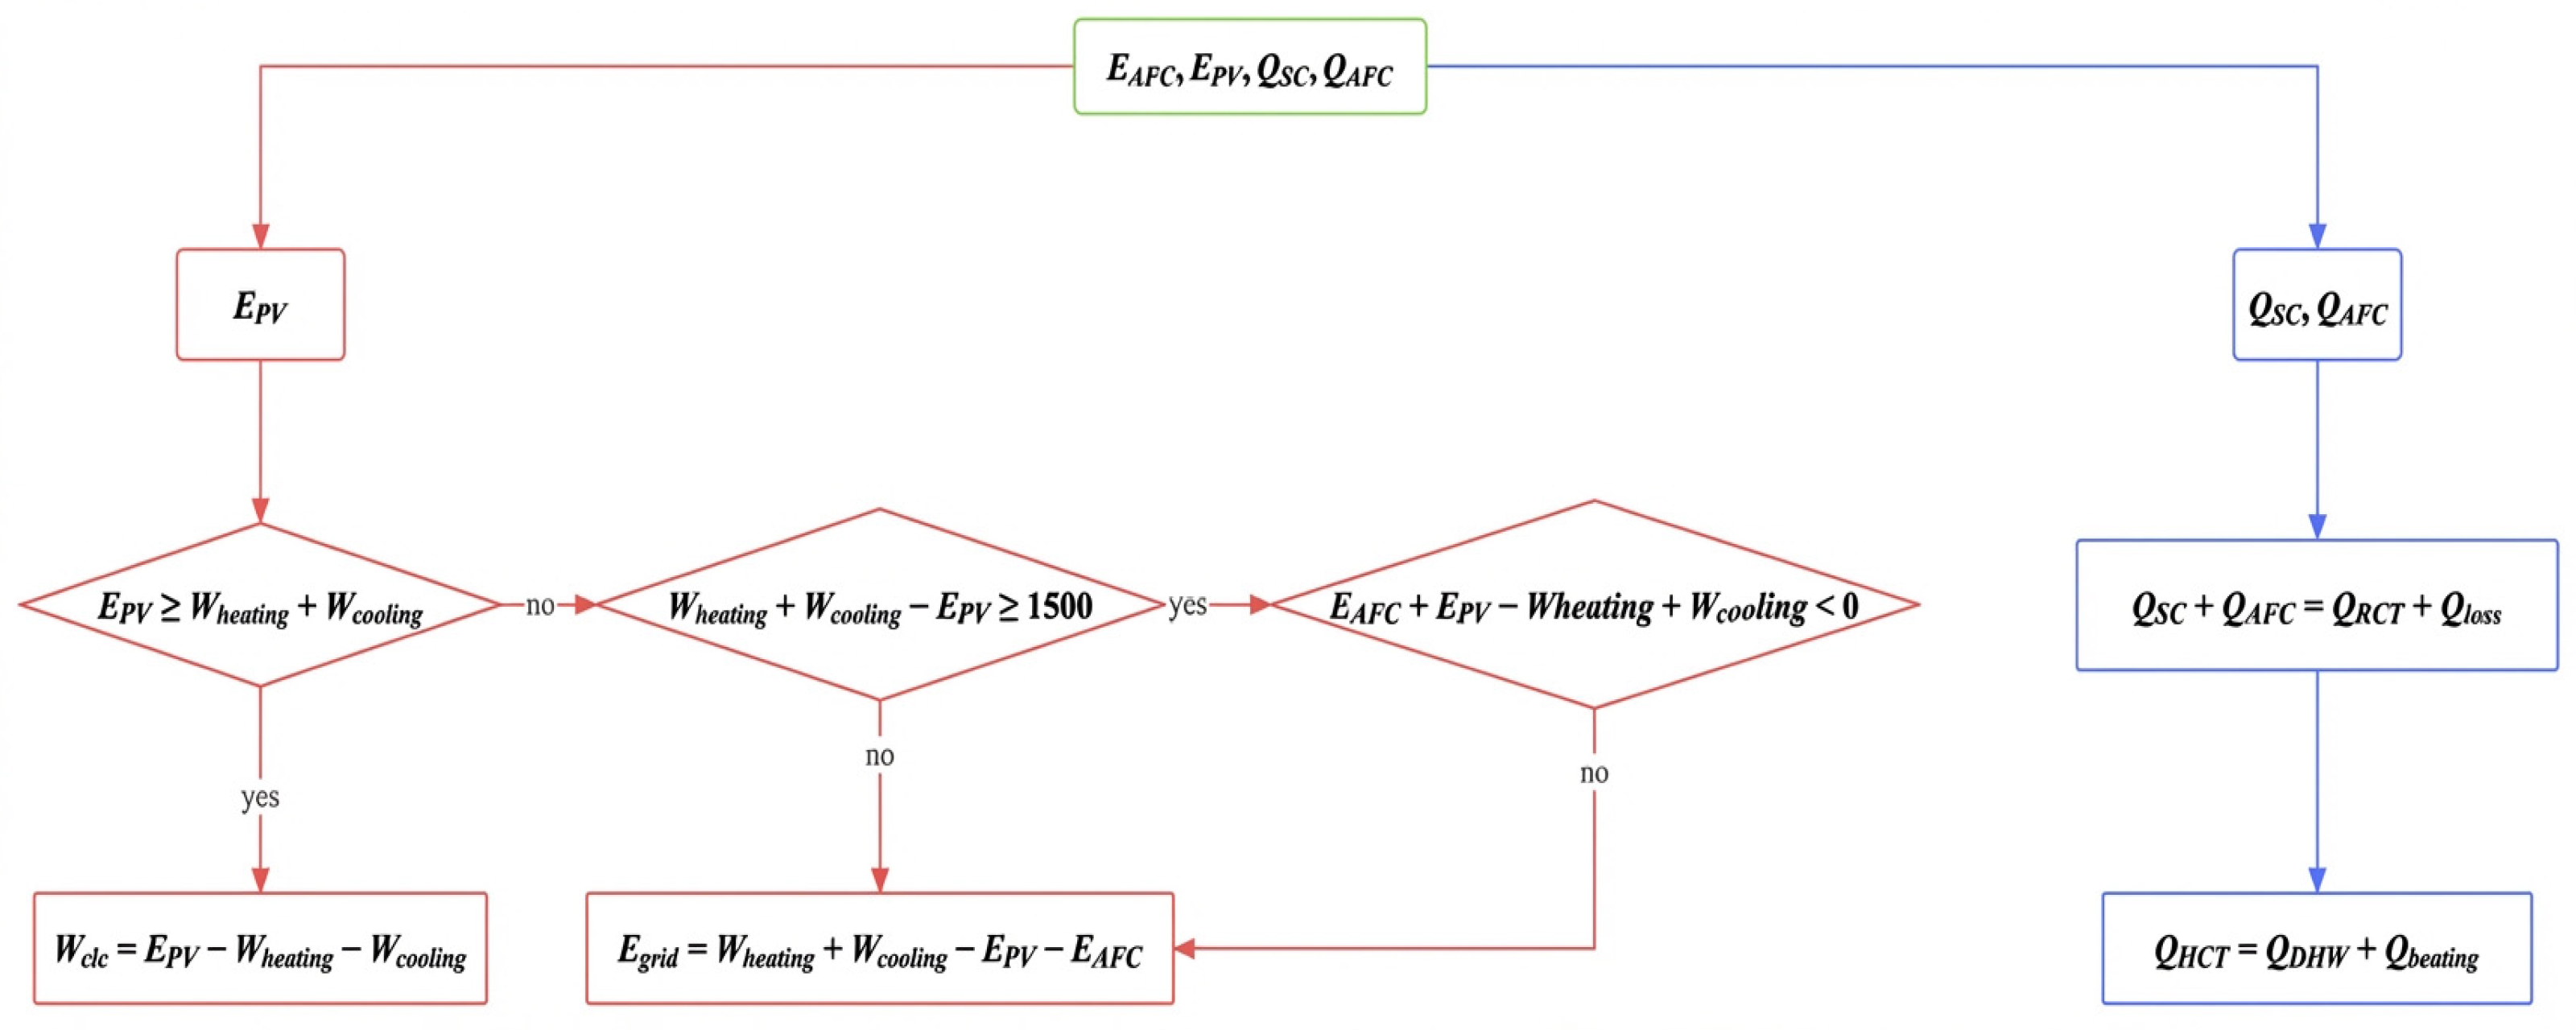
Following the principles of prioritizing electrical supply, generating hydrogen from surplus electricity, and regulating thermal storage and distribution, the system dynamically coordinates all energy modules during operation. This configuration serves to maximize renewable energy utilization, minimize grid dependency, and cut carbon emissions effectively. The comprehensive operation strategy of the system is illustrated by the flowchart in Figure 6, which clearly depicts the energy flow pathways and the logic between decision-making nodes. This figure illustrates the adaptive energy management control logic of the proposed SES-HES-AFC system in this paper, covering scheduling rules such as priority power supply by photovoltaic power generation, hydrogen production and storage using surplus PV power, the trigger threshold for AFC energy supplementation, and graded utilization of stored heat, which serves as the control framework supporting the dynamic operation of the system. Meanwhile, explanations for all symbols in the figure are in the figure caption. The electrical parameters include EPV (photovoltaic power output), Eload (system electrical load), EAFC (power output of alkaline fuel cell), Egrid (electricity purchased from the grid), and Wele (surplus photovoltaic power). The thermal parameters consist of QSC (heat output of solar collectors), QAFC (waste heat generated by alkaline fuel cell operation), QHCT (heat stored in the heat storage tank), QDHW (thermal load for domestic hot water), Qheating (space heating thermal load of the building), and Qloss (heat loss in pipelines and heat storage processes). All the above revisions have been updated to the corresponding position in Section 2.5 of the revised manuscript. For electric power dispatch, a formula is defined to calculate the power difference between hourly photovoltaic output and total system electric load, which quantifies the hierarchical decision logic of “producing hydrogen with surplus photovoltaic power”, “activating the AFC to supplement power when power deficit ≥ 1.5 kW”, and “covering minor power deficits directly via the power grid”. For thermal power dispatch, we specify the calculation method for total input thermal power composed of solar heat collection and AFC waste heat, as well as the hierarchical dispatch rules based on the 50 °C domestic hot water threshold of the heat storage tank: prioritizing domestic hot water supply, utilizing residual heat for space heating, counting excess heat as heat loss, and activating the electric boiler for heat compensation when heat supply is insufficient.
The operational principles of the SES-HES-AFC system are summarized as follows:
(a)
The power required by the heating and cooling subsystems is primarily supplied by the PV system.
(b)
When the power generated by PV is insufficient, the AFC supplies the required power for the heating and cooling subsystems. If the AFC is inactive or unable to meet the demand, the remaining power is provided by the grid.
(c)
When there is surplus power from PV, the excess electricity is used for water electrolysis to produce hydrogen.
(d)
The heat generated by the solar collector and AFC is stored in the HCT, prioritized for the DHW system, and subsequently used for space heating.

3. System Optimization and Evaluation

To ensure the system operates at an optimal state, suitable optimization variables and objective functions are chosen to perform optimization on the proposed and reference systems. In the optimization process, the TRNOPT module within TRNSYS functions as an external interface connecting TRNSYS with GenOpt, where the decision variables are optimized using the Hooke-Jeeves algorithm in GenOpt.

3.1. Optimization Variables

Different implementation strategies are adopted for various physical constraints in this study to ensure all optimization results satisfy engineering feasibility. The upper and lower bound constraints of the heat storage tank volume, rated capacity of the electric boiler and electric chiller are directly defined as Box Constraints within GenOpt. During optimization iterations, the algorithm automatically restricts variable values to the feasible range, and any solutions exceeding the boundaries are directly identified as infeasible and discarded without additional penalty terms. For the coupled constraint that the total area of Acoll and APV cannot exceed the available roof area, the exterior penalty function method is utilized. A quadratic penalty term is incorporated into the objective function LCC. When Acoll + APV exceeds the available roof area, the penalty term increases quadratically with the excess area to guide the algorithm to converge within the feasible region; when the solution lies inside the feasible region, the penalty term equals zero and does not alter the original calculation logic of the objective function.
To evaluate the energy-saving performance of the system, several key parameters are adjusted to reduce the overall system energy consumption. The operational states of the sub-systems interact during real-world operation, with the primary system performance influencing parameters including the solar collector area (Acoll), photovoltaic generation area (APV), rated capacity of HCT (Vtank), and the rated capacities of EB and EC.
Solar radiation intensity, collector area (Acoll), and APV are the key factors influencing the heat output of solar collectors and power output of PV systems. The relationship between the building’s hourly heat load and the heat provided by the solar collector determines the rated capacity of the HCT (Vtank). The rated capacities of EB and EC are influenced by the building’s hourly heating and cooling loads as well as the operation schedules of EB and EC. The rated power of the AFC in the HES-AFC subsystem is affected by the surplus power from PV. Accordingly, the design and operational parameters of the SES-HES-AFC system exhibit strong coupling; tweaking any single parameter will readily induce corresponding changes in the system’s overall energy flow and load response. To avoid optimization iterations falling into local optimal solutions due to too many weakly correlated variables, we prioritize five core variables with strong coupling and the most significant impact on system performance (collector area, Acoll; photovoltaic area, APV; heat storage tank volume, Vtank; electric boiler rated capacity, Eh; and electric chiller rated capacity, Ec) to ensure the global optimality and engineering reference value of the optimization results. The SES-HES-AFC system’s decision variables are particular, with the optimization variables detailed in Table 4.

3.2. Objective Functions and Constraints

To achieve an optimal balance between the system’s economic efficiency and energy utilization over its operational period, LCC is chosen as the optimization function in this study. LCC comprehensively accounts for all expenses incurred throughout the system’s service life and serves as a key indicator for evaluating its long-term economic performance. It is primarily composed of three components:
  • Initial investment cost (Ci): the one-time costs associated with procurement, installation, and commissioning of system components;
  • Operating cost: the electricity cost incurred during system operation;
  • Maintenance cost: the maintenance expenditures over the operational cycle, usually estimated as a fixed proportion of the initial investment.
The cost parameters of hydrogen-related components, including the electrolyzer, hydrogen compressor, and hydrogen storage tank, are referenced from techno-economic studies on PV-hydrogen hybrid systems and hydrogen energy storage systems [24,25]. These studies provide commonly accepted cost ranges for commercial electrolyzers and hydrogen storage equipment, which are consistent with the assumptions adopted in this work.
Equipment disposal and removal costs cancel each other out and thus are not included in the formula. Consequently, the optimization function can be represented as follows [26,27]:
LCC = min i 1 + i m 1 + i m 1 × m   ×   C i + C e × E OC × m   +   C MC i
where i is the annual bank loan interest rate; m is the designed operational period; C i is the initial investment cost of the equipment, with prices detailed in Table 5; C e is the electricity cost per kWh; E O C is the total annual electricity usage; and C M C is the operation and maintenance expense, which accounts for 2 % of the initial investment cost.

3.3. System Optimization Constraints

In system optimization design, in addition to defining a clear objective function, a set of reasonable constraints must be imposed to ensure the feasibility of the optimization results. Optimization constraints primarily focus on design variables and operational parameters, established according to the building’s available space, equipment capabilities, and system operational requirements as follows.
The combined area of the Acoll and APV installations must not exceed the actual available roof area of the building. Considering the effect of roof tilt angle on usable area, this constraint is expressed as
0     A coll + A PV     A cos a
where A is the total roof area, and a is the collector installation angle.
The volume upper limit of the heat storage tank (HCT) is restricted by the roof installation area and compatibility with the heat load. Considering energy balance and spatial feasibility, the rated volume of HCT is constrained by
0     V tank     0.3 Acosa
where V tank is the rated volume of HCT.
The rated capacity of the EB must fulfill the building’s maximum heating demand at peak load, accounting for equipment efficiency and pipeline thermal losses. The design capacity should satisfy
0     E h     q heating η h 1 α h
where q heating is the maximum hourly thermal load; E h is the rated capacity of EB; η h is the efficiency of EB; and α h is the thermal loss of the heating line.
The electric chiller (EC) for the building cooling system must have a rated capacity determined based on peak cooling load, system efficiency, and cooling line losses. The constraint is
0     E c     q cooling η c 1 α c
where E c is the rated capacity of EC; q cooling is the maximum hourly cooling load; η c is the chiller efficiency; and α c is the cooling line’s refrigeration loss.
The above constraints are important prerequisites for the optimal design of the SES-HES-AFC dual storage system. These constraints ensure that while minimizing the objective function, the system configuration scheme remains feasible, reliable, and economically viable.

3.4. Evaluation Parameters

This section comprehensively assesses the proposed renewable energy dual storage system with green hydrogen by using electricity coverage rate, annual carbon dioxide emissions, and LCOE as key evaluation indicators, covering energy efficiency, environmental impact, and economic viability.

3.4.1. Electricity Coverage Rate

To quantitatively evaluate the contribution proportion of renewable energy in the system, this study introduces electricity coverage rate as an important indicator to measure the system’s overall energy self-sufficiency. ECR reflects the proportion of electricity generated by renewable energy in the total system electricity demand, serving as an important indicator of system operational efficiency [28].
The expression for ECR is as follows [23,29]:
ECR   =   E PV   +   E AFC E total SES HES AFC
where EPV is the power supplied by PV, kWh; EAFC is the power supplied by AFC, kWh; and Etotal is the total electricity covering the entire system (used to drive EC and cooling pumps during cooling and EB and heating pumps during heating), kWh.

3.4.2. Annual CO2 Emissions

In this system, carbon dioxide emissions primarily result from indirect emissions associated with electricity purchased from the grid. Quantifying annual CO2 emissions is essential to assess the environmental impact of the system, evaluate its carbon footprint, and guide further emission reduction efforts [30,31].
The annual CO2 emissions are calculated in two steps: first, the total mass of CO2 is determined based on purchased electricity and the emission factor, then converted into volume. The calculation formula is as follows [32,33]:
V co 2 = M CO 2 ρ CO 2
M CO 2 = E grid * C 1000
where E g r i d is the total electricity purchased from the grid annually; M CO 2 is the total mass of CO2.

3.4.3. LCOE

To comprehensively evaluate the system’s economic performance over its life cycle, LCOE is introduced as the primary economic assessment metric. LCOE reflects the average cost per unit of electricity over the system’s lifetime, incorporating investment, operation and maintenance, and electricity purchase costs. It also facilitates cost–benefit comparisons across different energy systems [34,35].
LCOE is computed based on the Net Present Value (NPV) method, discounting all life cycle costs to their present value and dividing by the total delivered electricity. The total NPV of the system consists of three components [36,37,38,39]:
NPV total = NPV i + NPV m + NPV e
where NPVi is the NPV of the investment cost; NPV m is the NPV of the maintenance cost; and NPV e is the NPV of electricity cost.
The detailed calculation steps are [38]
NPV i = C initial
where C initial is the sum of the initial costs of all components in the system.
NPV m = f m · C initial · ( 1 + i ) m · i 1 + i m 1
where fm is the fixed ratio between maintenance and initial cost; i is the annual interest rate; and m is the system’s lifetime in years.
NPV e = C e E oc 1 m   ( 1 + i e ) m 1 ( 1 + i ) m 1
where E oc is annual purchased electricity; i e is the annual electricity price growth rate; and E OC is the annual total electricity consumption.
LCOE = NPV total · ( 1 + i ) m · i ( 1 + i ) m 1 W load
where Wload is the building’s load, kWh.

4. Results and Discussion

A uniform flat electricity price is adopted in this study primarily to focus on the multi-energy coupling mechanism, capacity configuration optimization, and operational characteristic analysis of the SES-HES-AFC system under consistent price boundary conditions, eliminating interference from electricity price fluctuations so as to highlight the inherent performance strengths of the proposed system.

4.1. Optimization of System Parameters

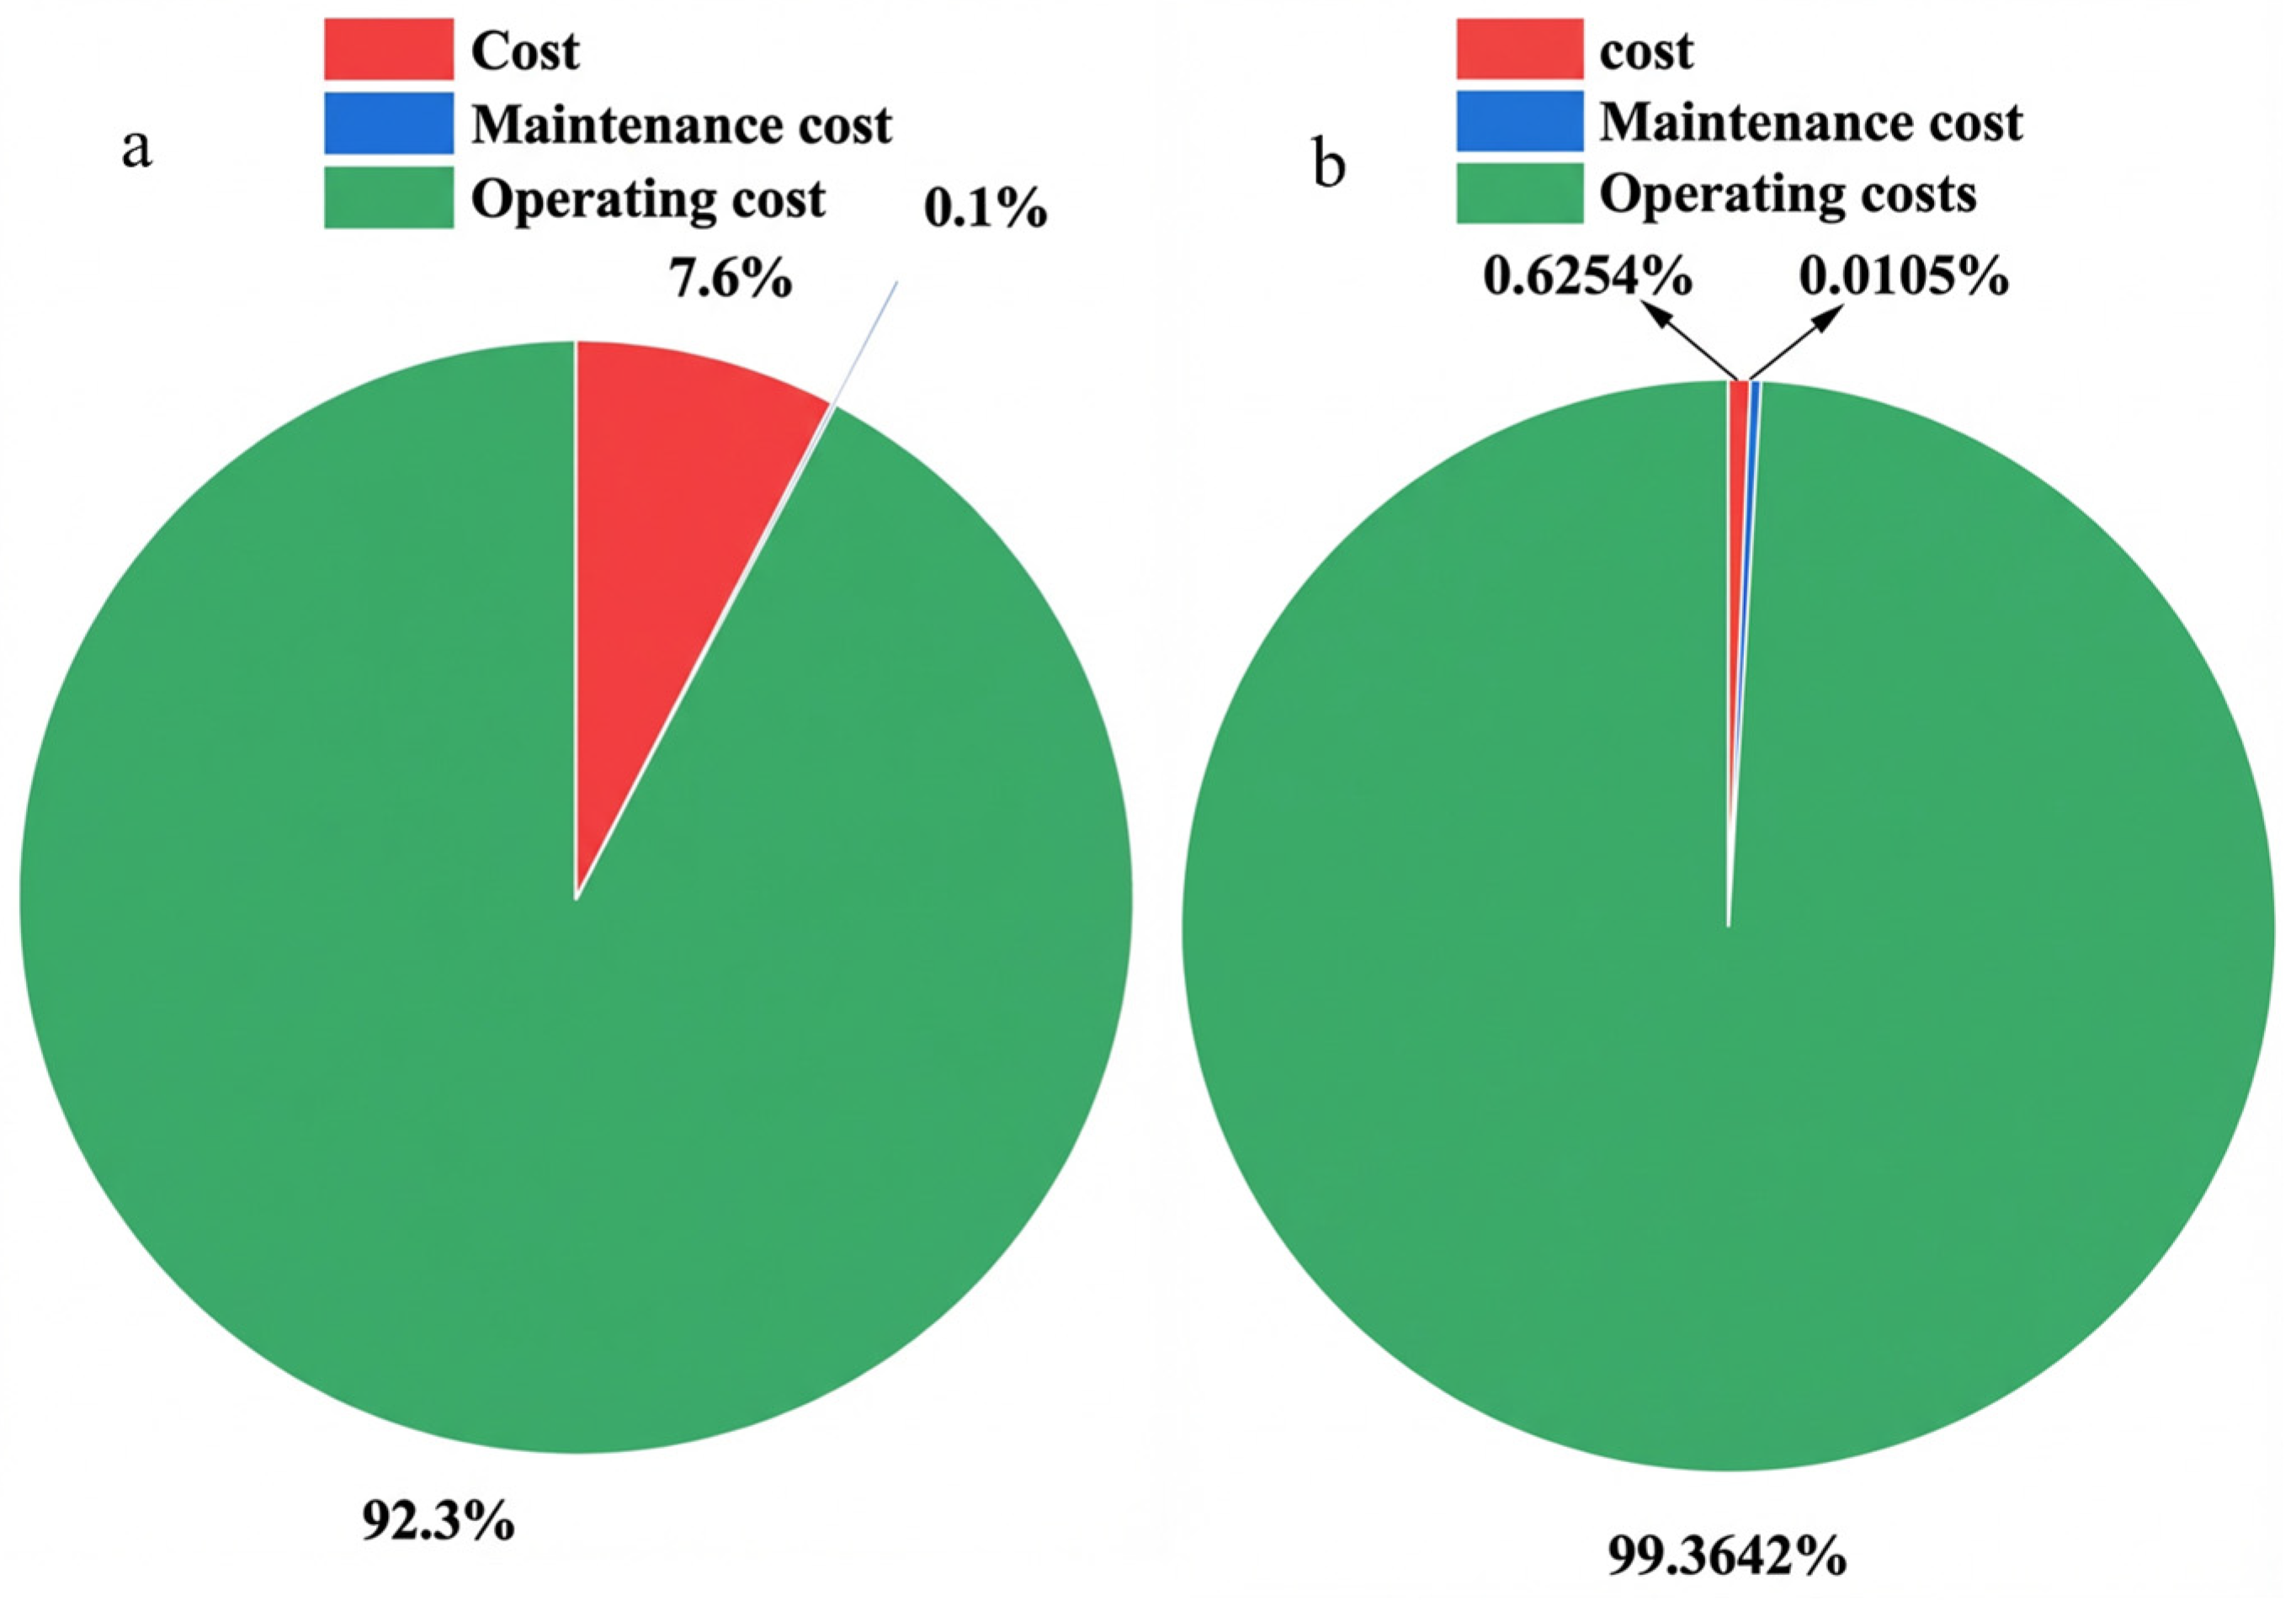
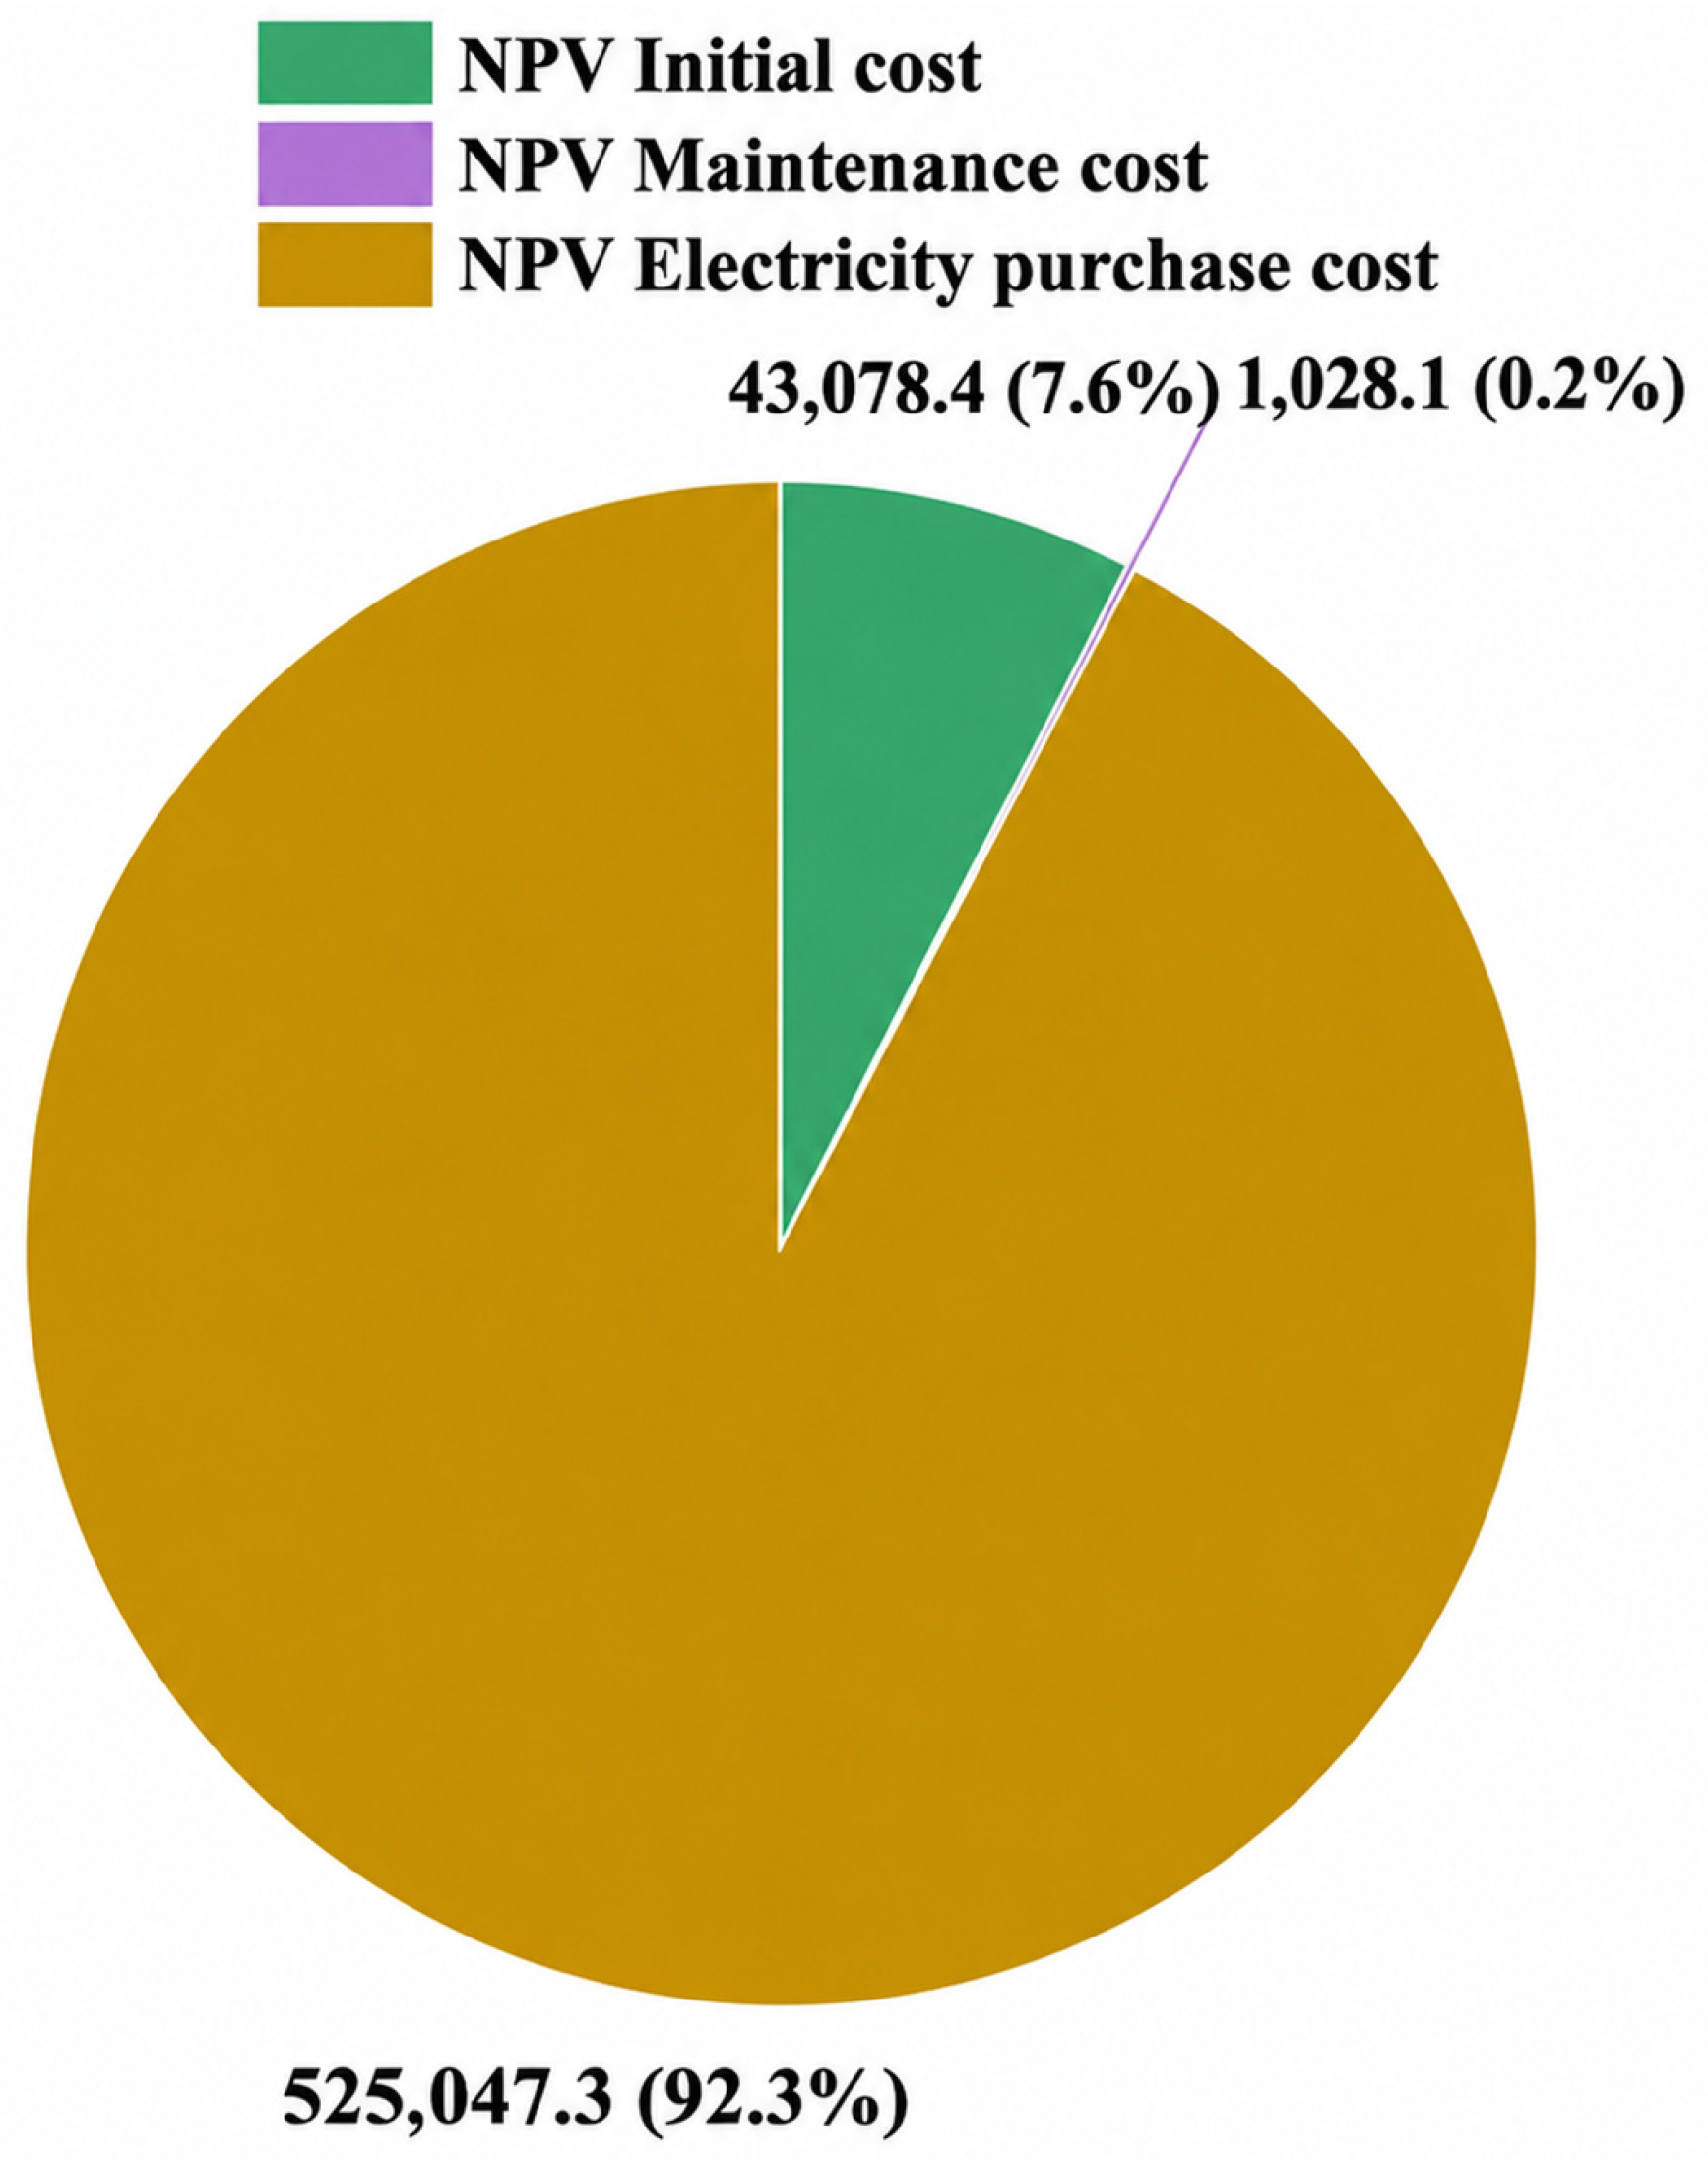
Based on the Xi’an climate conditions and building model simulation data from Section 2, the renewable dual-storage system integrated with green hydrogen was simulated, and the results were analyzed and evaluated. For a clearer illustration of the proposed system, the decision variables after optimization are shown in Table 6, with the resulting LCC being USD 471,234.82. The detailed cost breakdown is displayed in Figure 7, which also presents the cost composition before optimization, with an LCC of USD 870,383.74.
Figure 7 reveals that although the initial and maintenance costs for photovoltaic panels, solar collectors, electrolyzers, heating tanks, and electric chillers increased, the system’s reliance on grid power declined markedly, reflecting enhanced self-sufficiency. The reduction in grid electricity expenses largely offset the increased costs.
For the SES-HES-AFC system, due to the high prices of electrolyzers, compressors, and AFC units, the initial investment accounts for a large proportion of the total LCC. The optimized LCC shows an increase in capital and maintenance costs, but a decrease in operational expenditures, attributed to reduced grid electricity consumption. When the PV system in SES-HES-AFC cannot generate sufficient power, the AFC supplies part of the required energy to drive the EB/EC units, thus reducing power purchase from the grid and lowering system operating costs.

4.2. System Performance Analysis

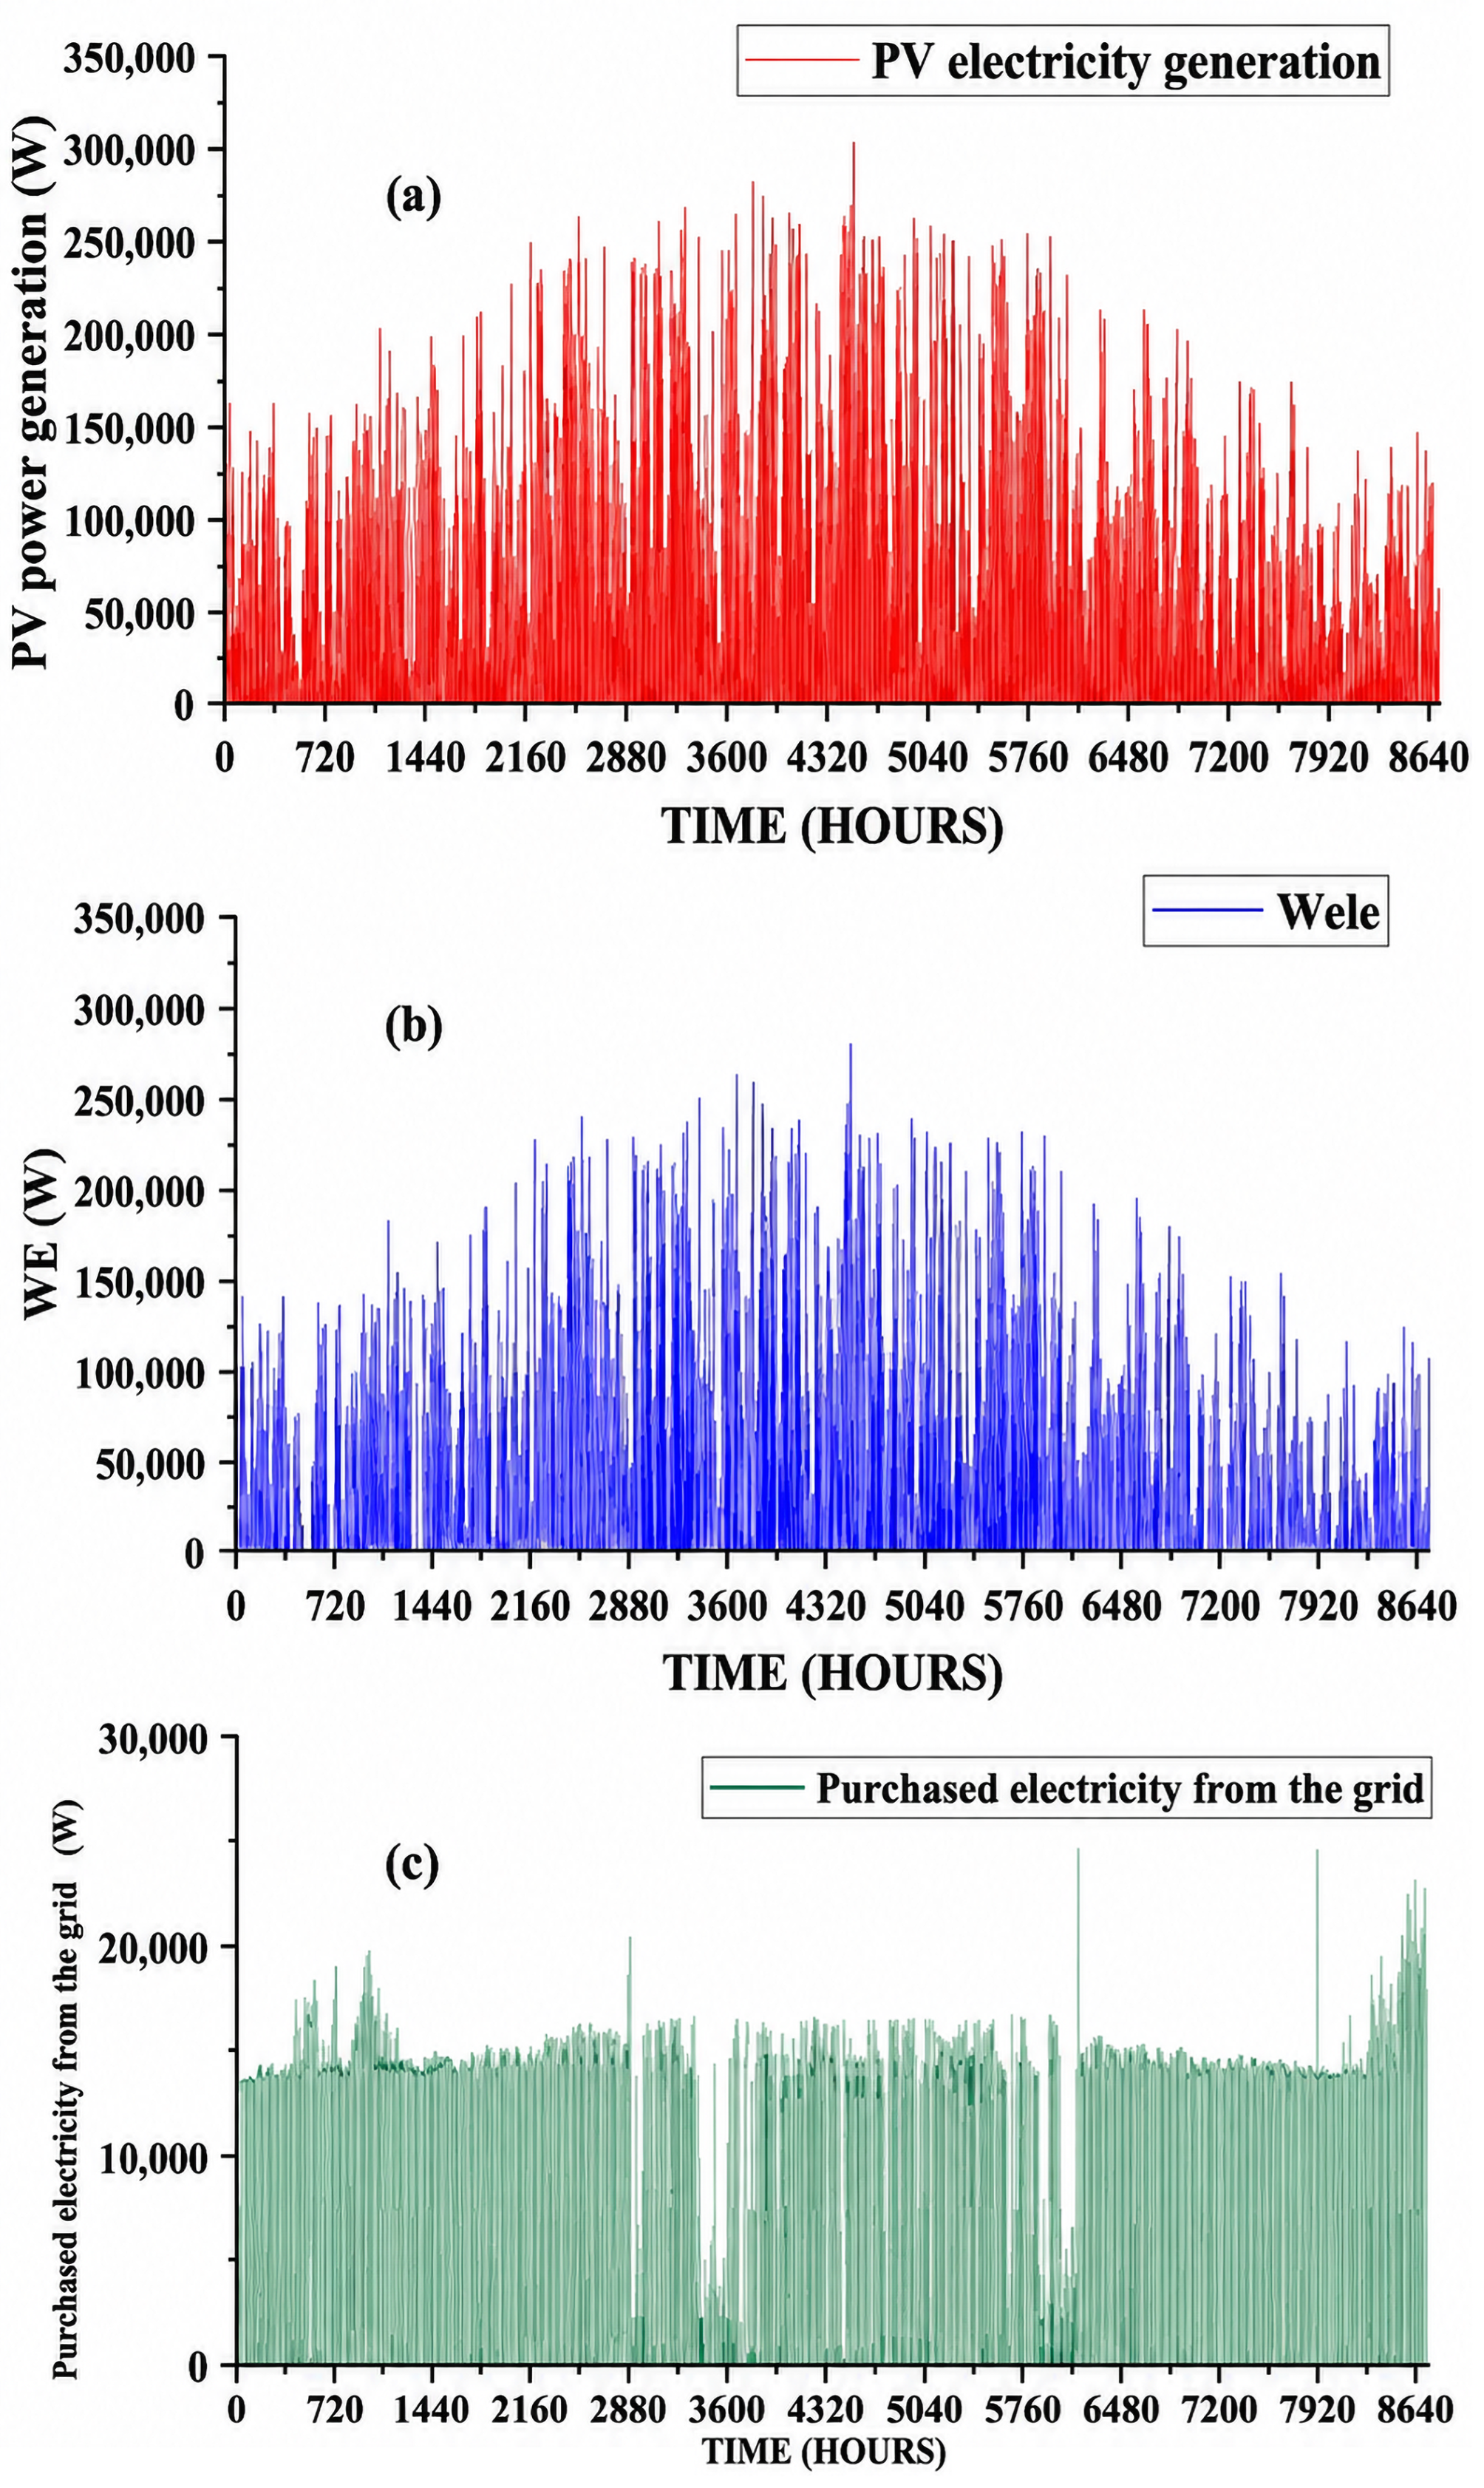
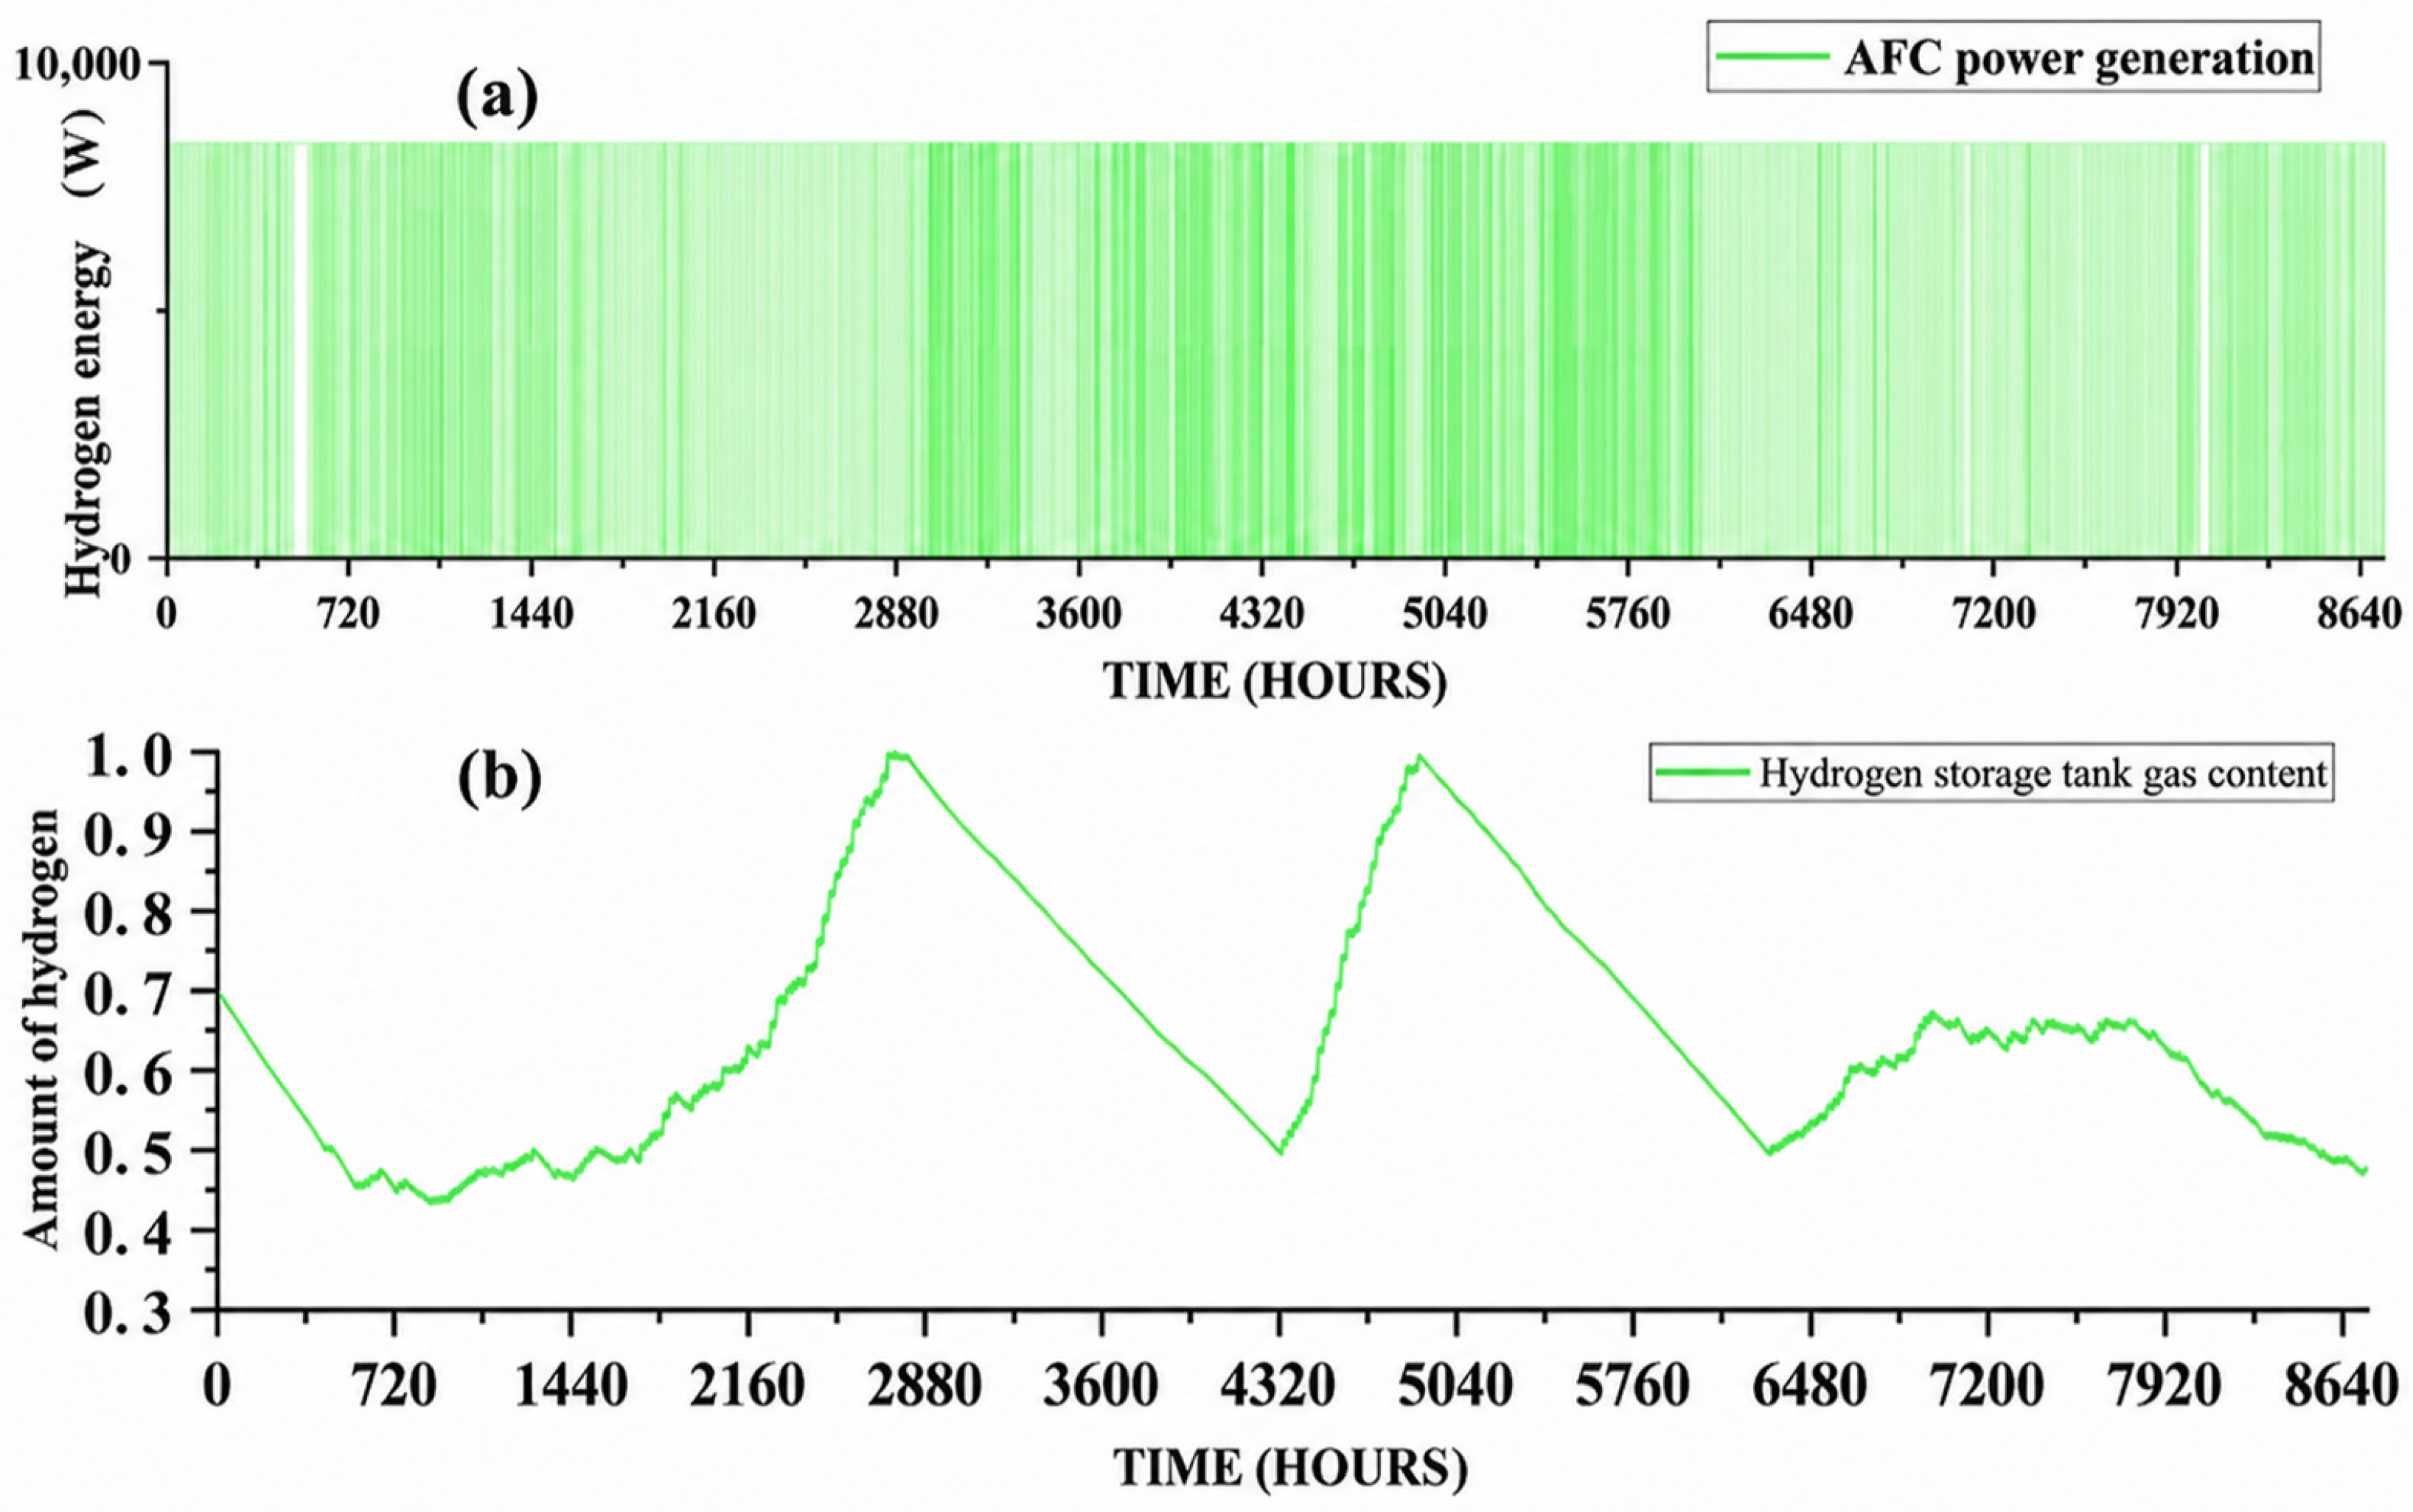
The horizontal axis ranging from 0 to 8760 h represents the hourly time series of full-year simulation performed on the TRNSYS platform, which corresponds to the hourly operation cycle covering a complete calendar year from January 1 to December 31. As shown in Figure 8a PV power generation varies with solar radiation intensity, gradually increasing in spring and summer, and reaching its peak in June. Subsequently, the PV power declines with reduced solar radiation, hitting its minimum in December. Figure 9a presents the AFC’s capacity, which is influenced by Wele (Figure 8); since Wele generally follows the PV trend, the AFC’s output complements that of the PV. Around summer, the PV generates high electricity, resulting in more surplus pow-er (Wele), which is used by the AFC to produce hydrogen via electrolysis. However, during peak heating and cooling demand in summer, PV output is insufficient, so the AFC compensates by consuming hydrogen, while additional electricity is purchased from the grid as shown in Figure 8c. Consequently, the grid power consumption reaches its annual maximum during the summer period. During winter, due to reduced PV output, energy demand is mainly met by the grid and the AFC operating on hydrogen. Figure 9b shows that the hydrogen content in the storage tank varies with AFC operation; during transitional seasons and the end of summer, AFC demand is lower, resulting in rising hydrogen levels. During both summer and winter, when thermal demands are high, the AFC offsets PV shortages, causing hydrogen levels in the tank to drop.
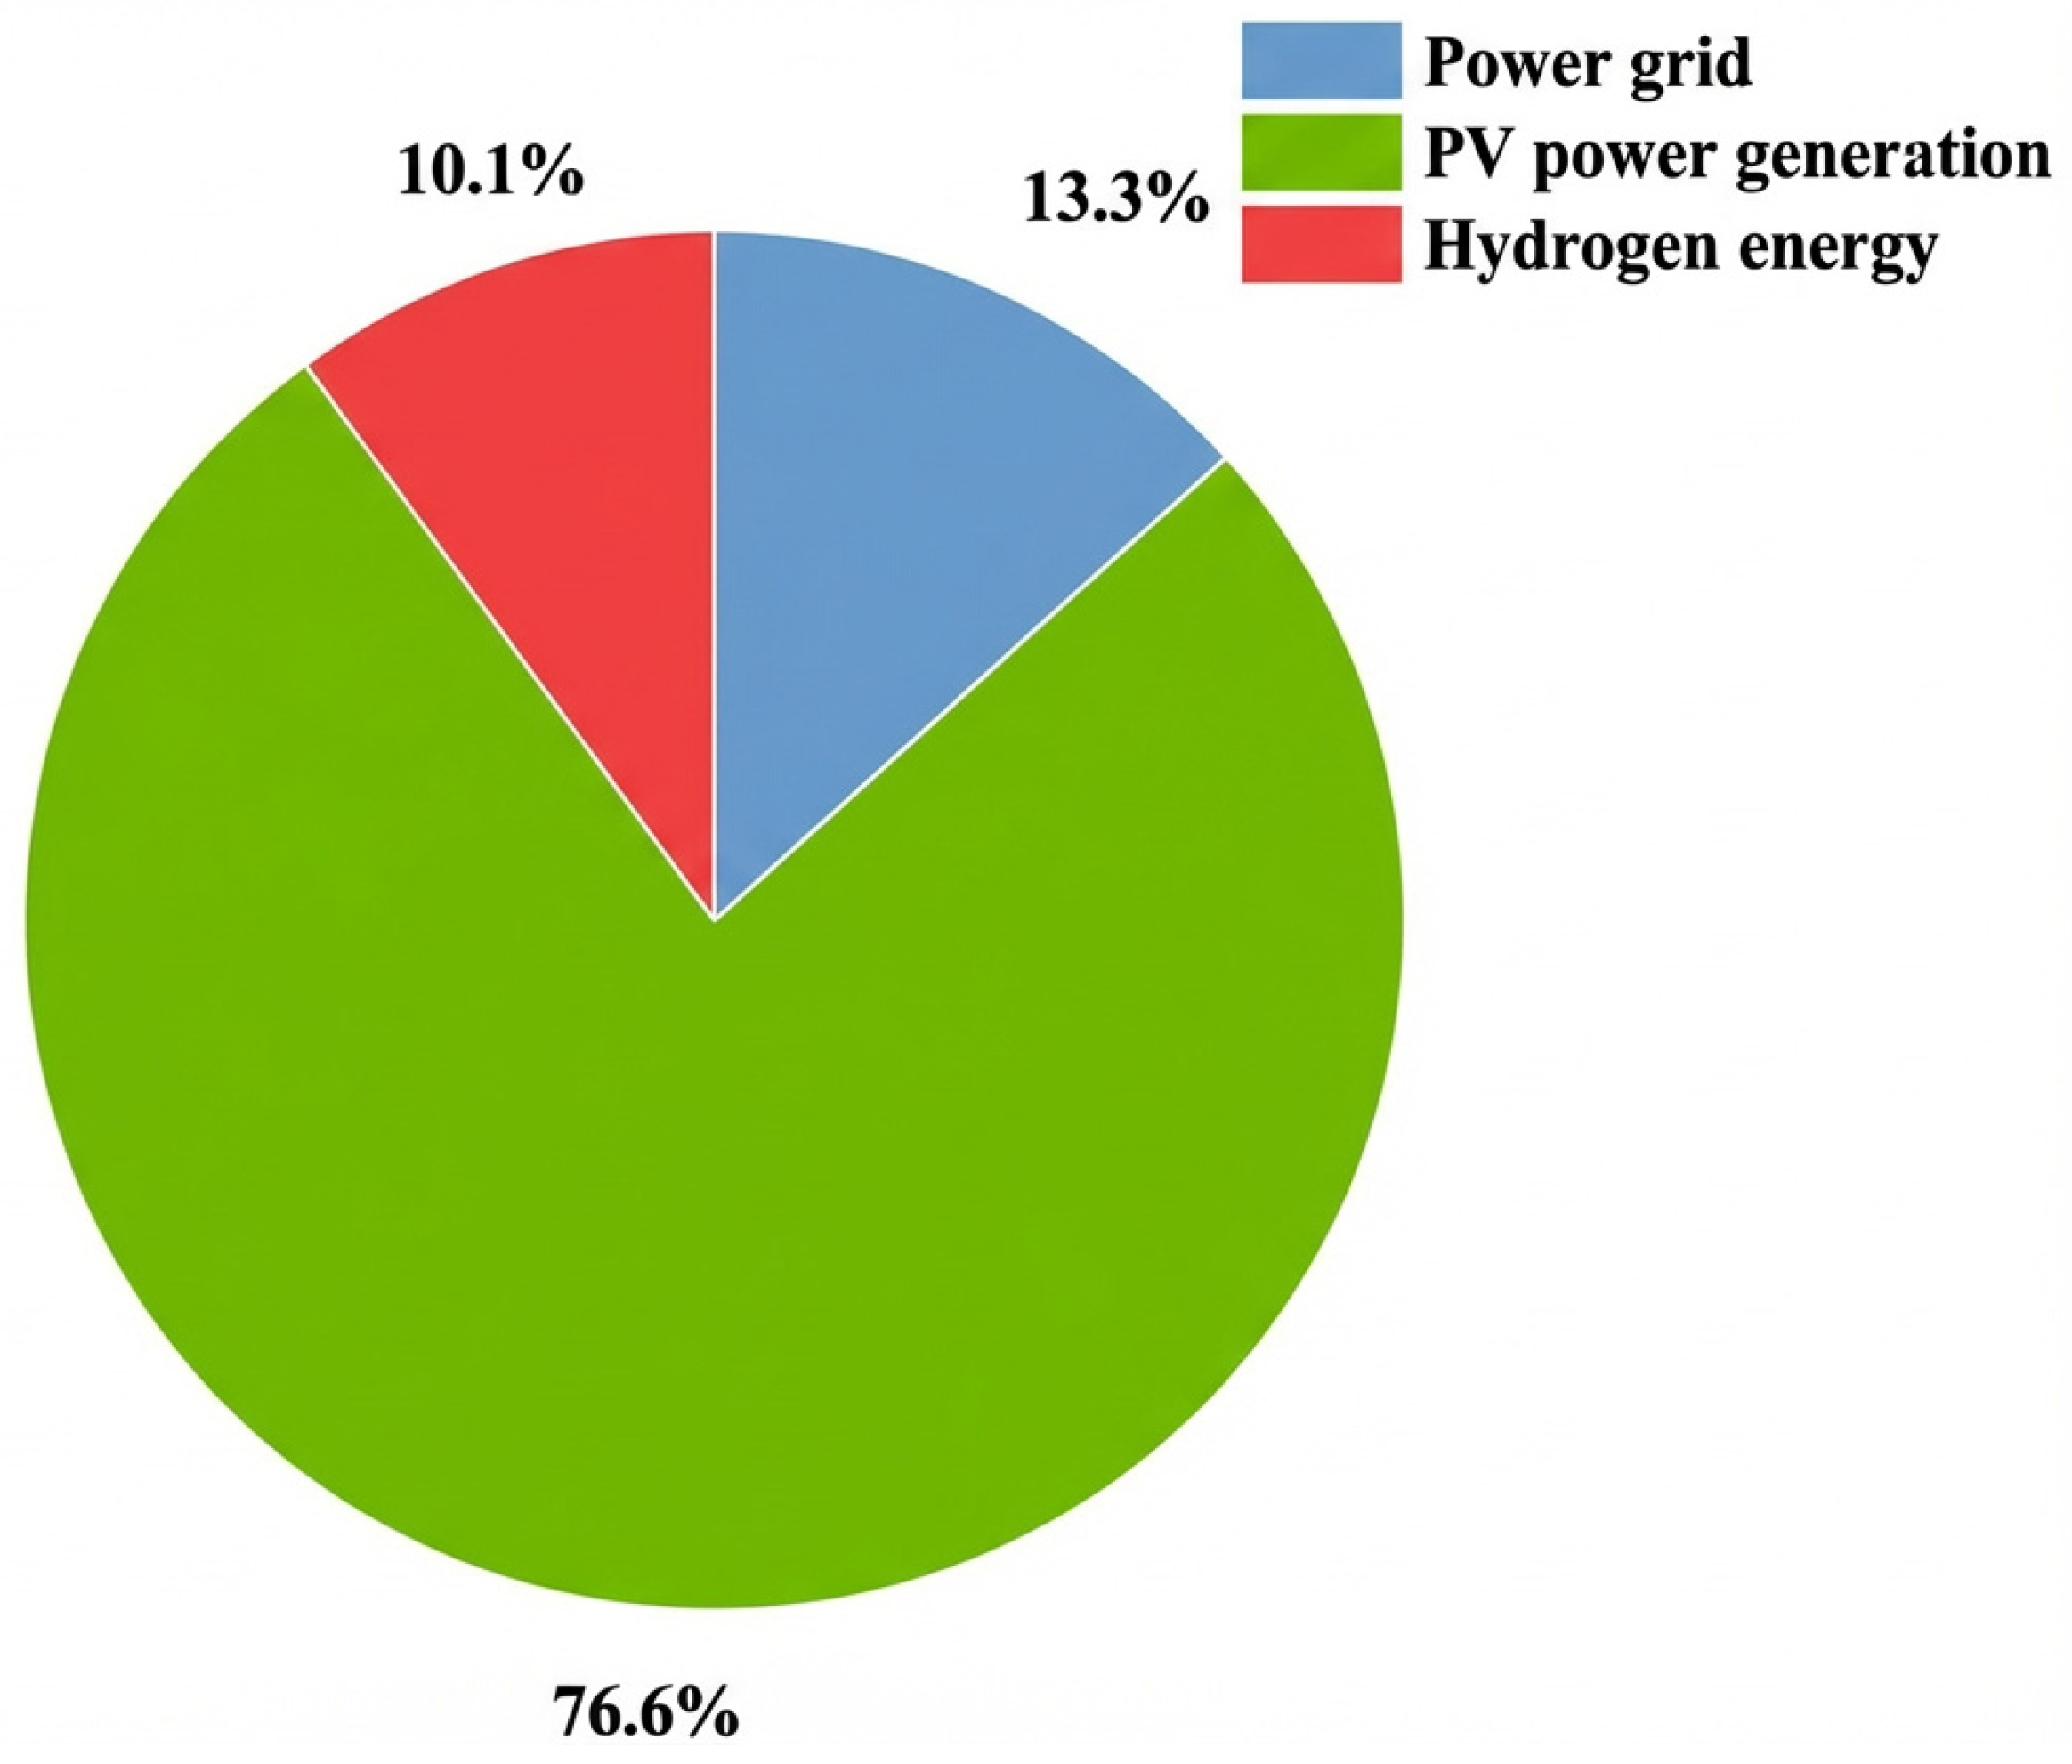
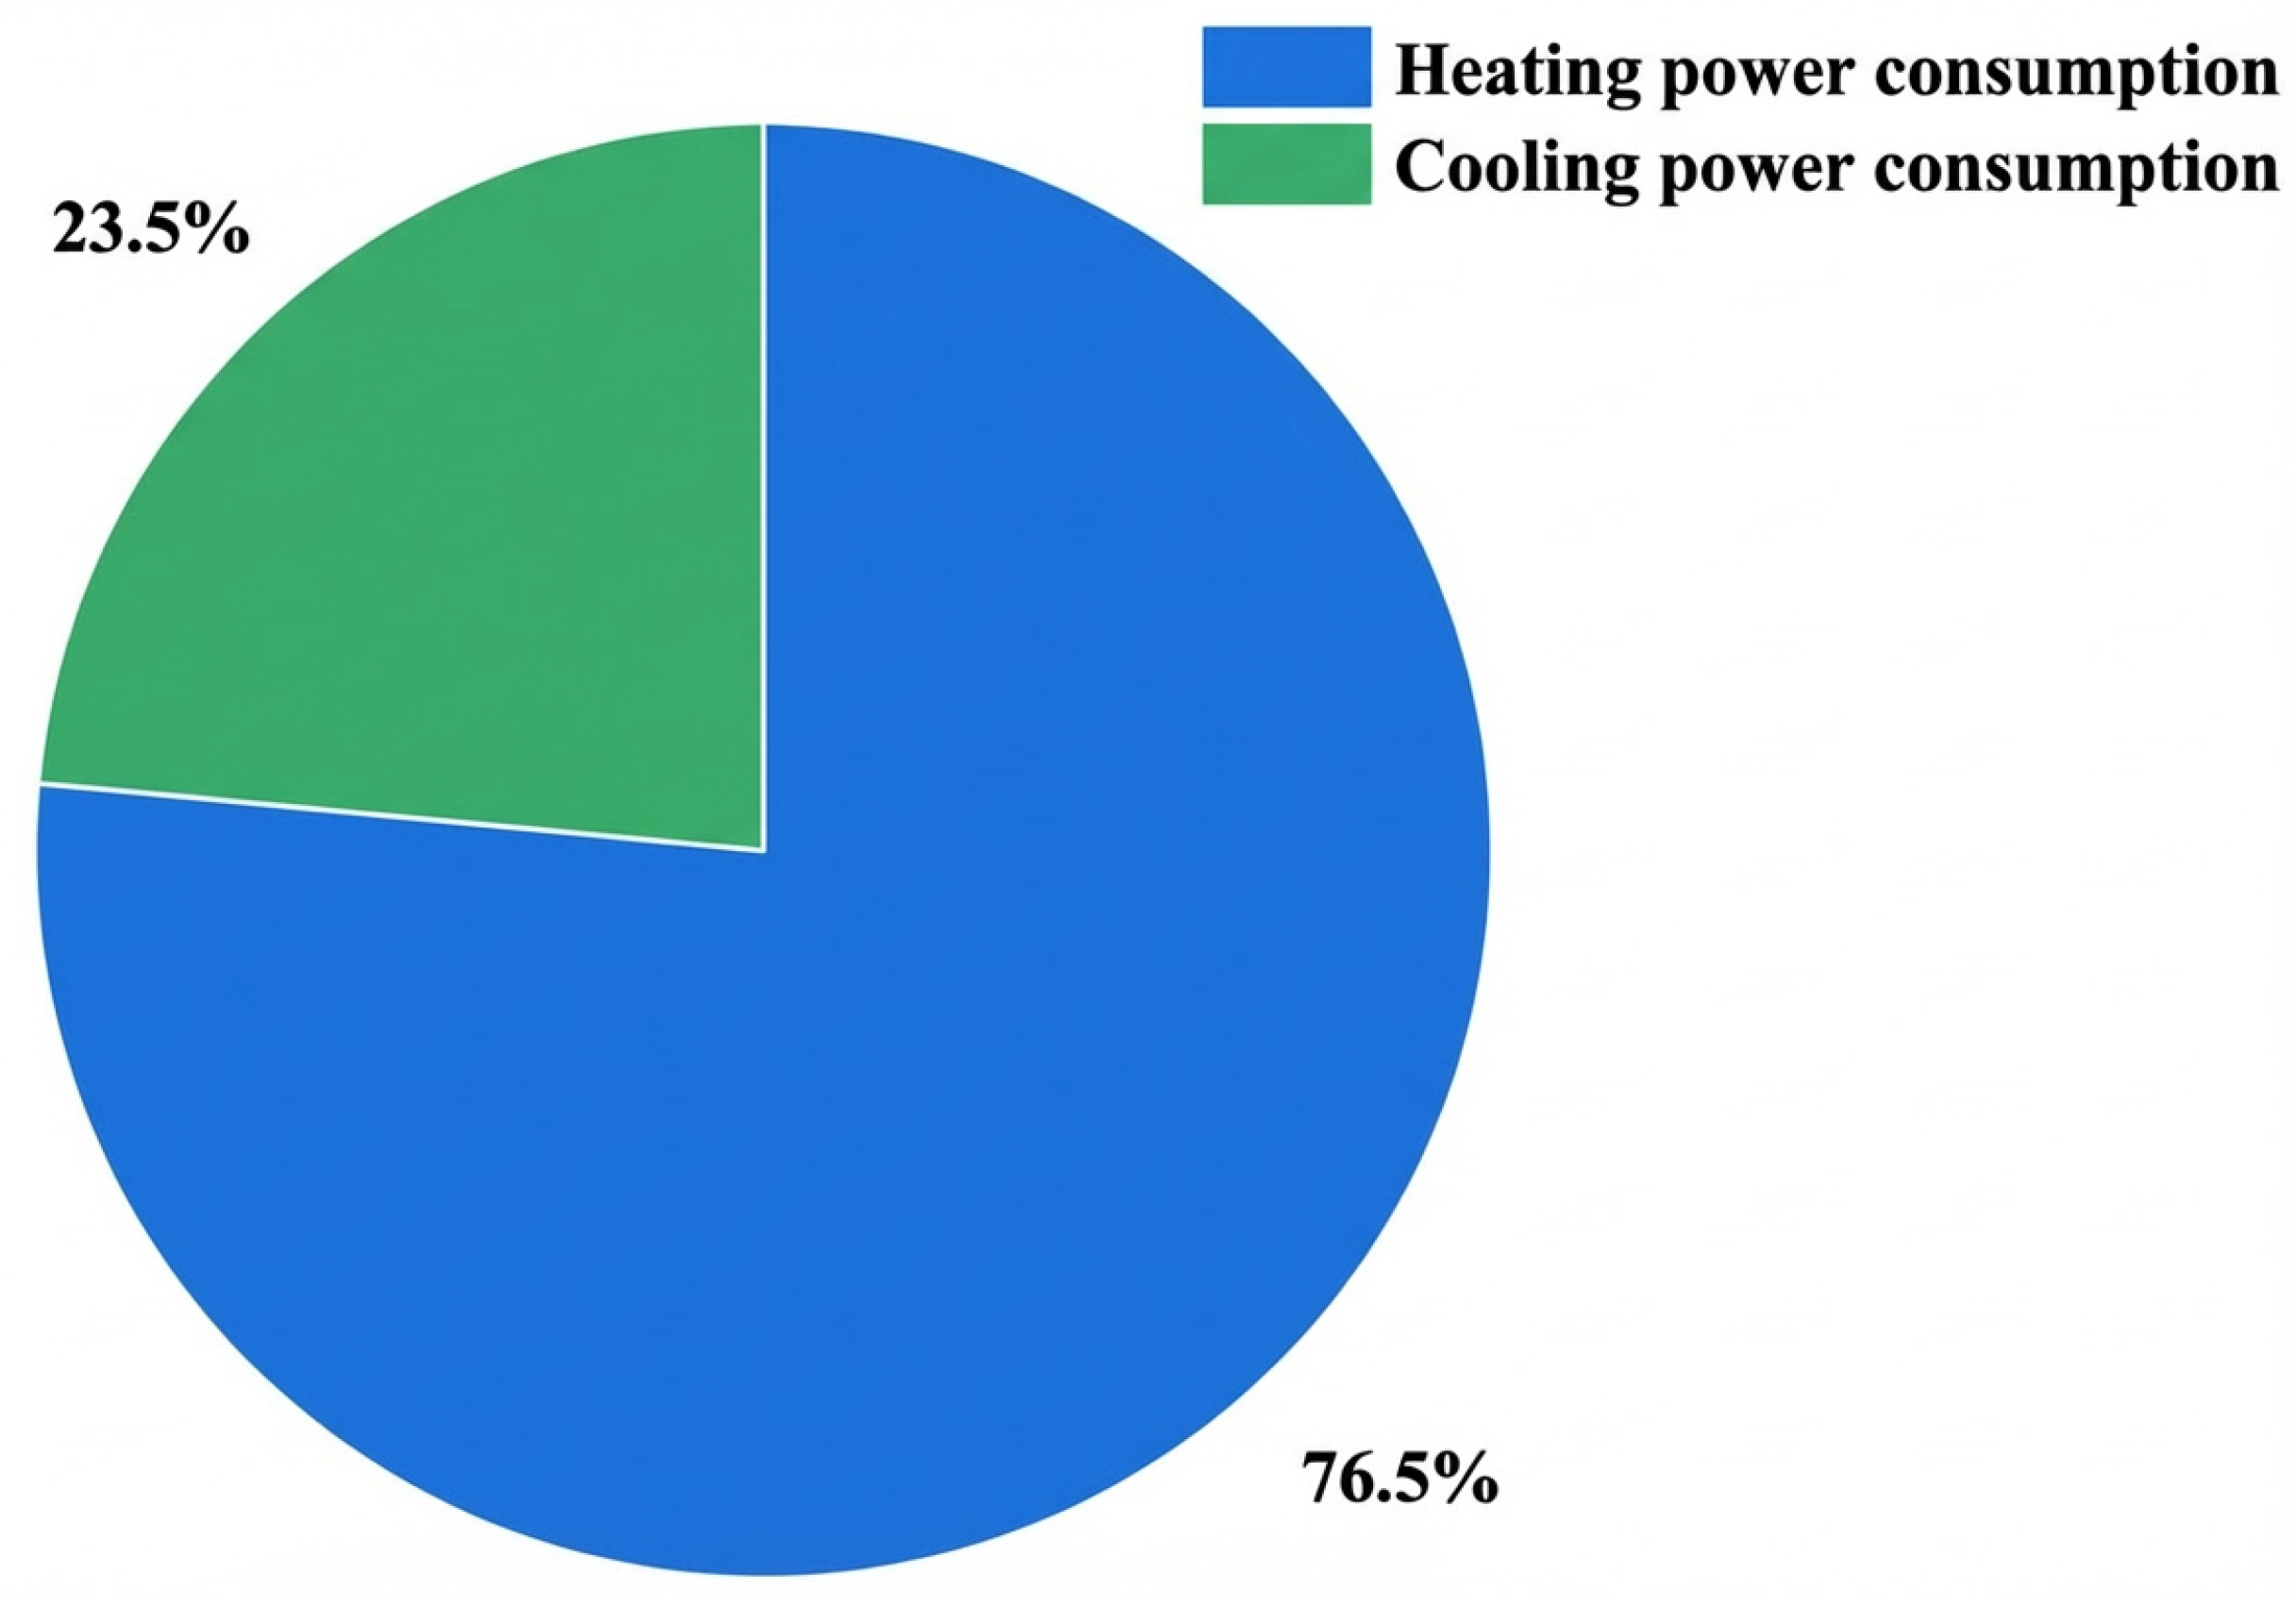
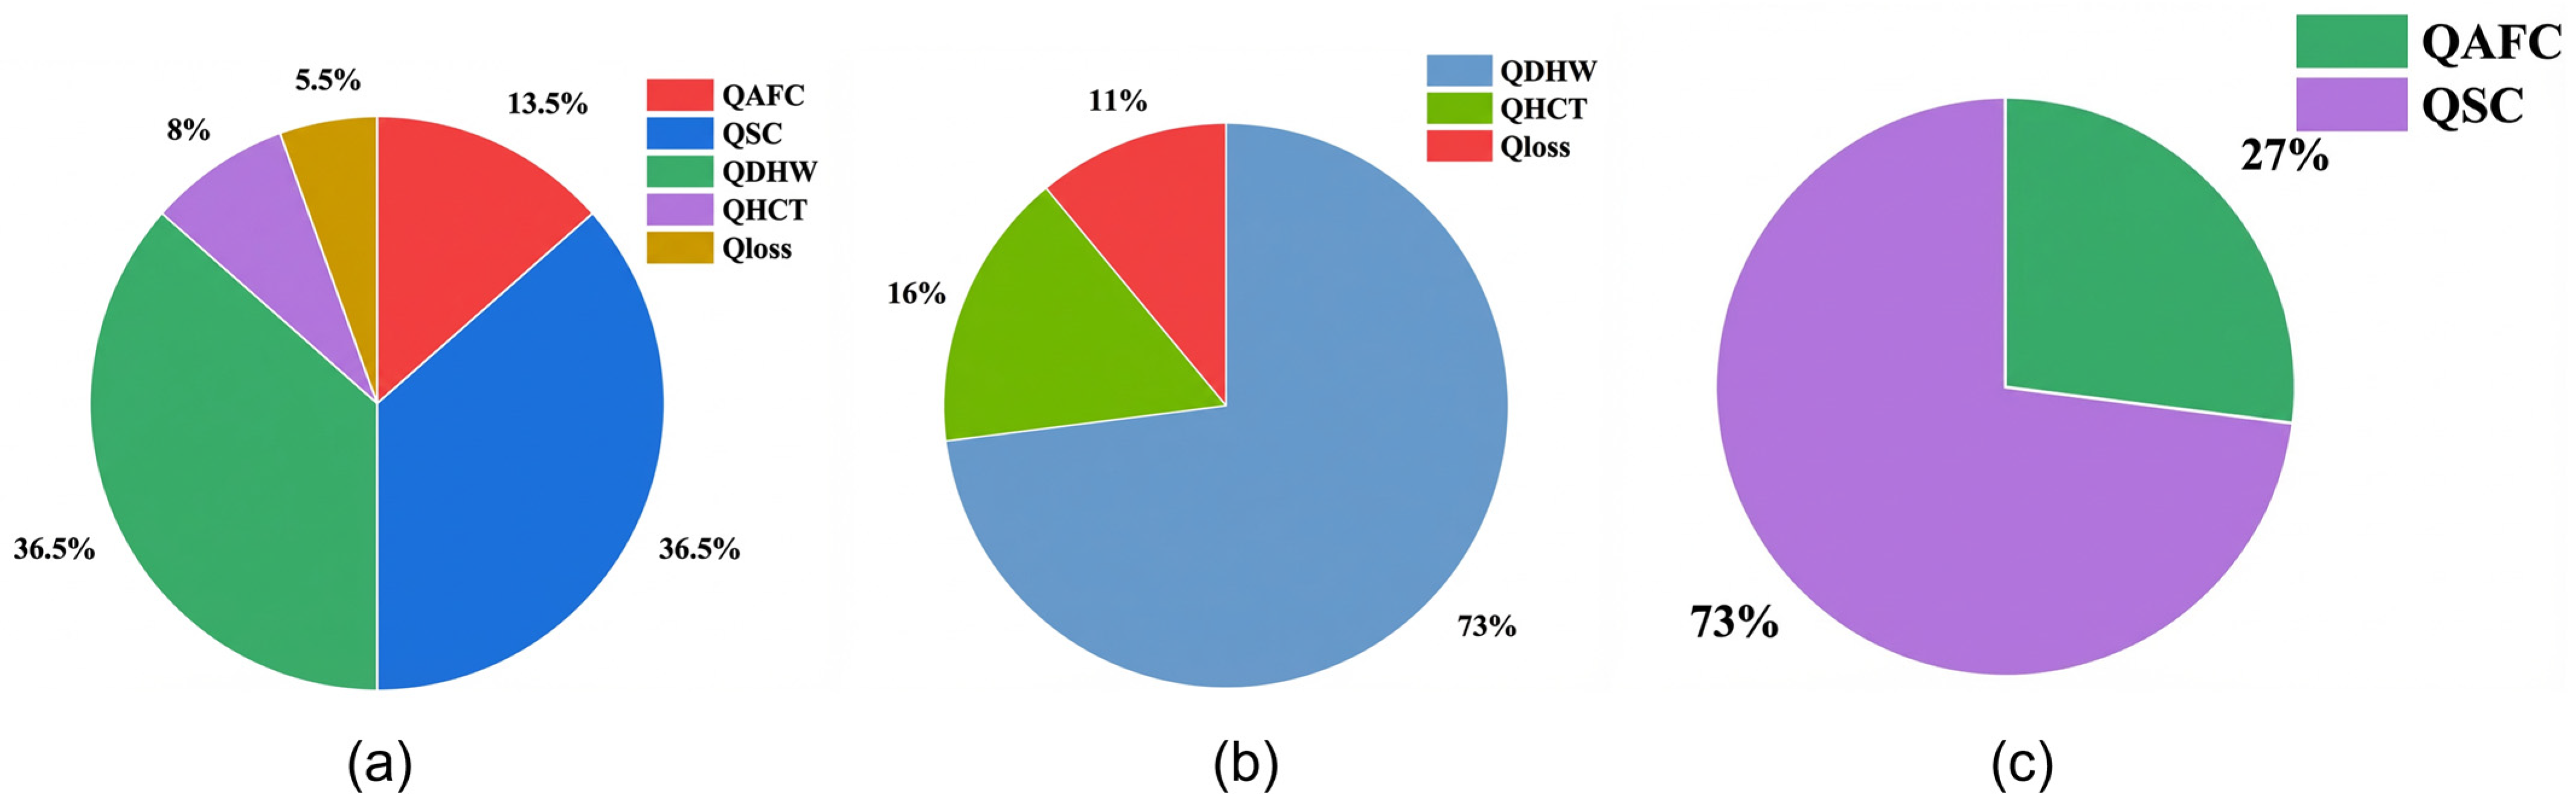
Figure 10 indicates that the system’s main energy input comes from PV electricity (76.6%), followed by hydrogen (10.1%), and grid power (13.3%). According to Figure 11, heating accounts for the largest portion of energy consumption in Xi’an, representing 76.5%. Except from April to August, the heating demand remains high, resulting in a significant energy requirement for heating. Cooling loads are mainly concentrated in summer, with minor demands in spring and autumn. where QAFC refers to heat generated by alkaline fuel cell operation, QSC denotes heat output of solar collectors, QDHW stands for thermal load of domestic hot water, QHCT represents heat stored in the heat storage tank, and Qloss means system heat loss from pipelines and heat storage units.
Figure 12a shows that the system’s thermal energy is mainly provided by the solar collector SC and the heat generated during AFC operation, primarily used for DHW. The solar collector’s heat output (Qsc) varies with solar radiation: it increases in spring and summer, reaches a peak in summer, and then decreases, dropping to the lowest level in winter as solar radiation weakens. The operation of the AFC is primarily triggered by electrical shortages. During summer and winter, the AFC compensates for energy deficits while simultaneously producing heat that is transferred to the HCT. In the transitional seasons, when cooling demand is low, the AFC mainly decomposes hydrogen to generate heat.
Figure 12b shows that 73% of the system’s thermal energy is primarily used for DHW. Since hydrogen energy is provided by the AFC, it generates heat during operation, which is transferred to the HCT. However, the thermal energy generated by the AFC is occasionally redundant and cannot be stored, thus resulting in thermal energy losses. When combined with the heat losses from the heat storage tank (HCT), the total heat loss of the system accounts for 11%, while the remaining 16% of the thermal energy is stored in the HCT. Figure 12c shows that the system’s heat supply comes from both AFC and the SC, with SC providing 73% of it. The AFC provides the remaining 27% of the total thermal energy.

4.2.1. Annual System Performance

The annual energy consumption ratio between the proposed and reference systems is shown in Figure 12b. Heat produced by the SFC is prioritized for DHW and then distributed to other uses. Electricity generated by the PV is first used to meet the heating/cooling subsystem demands. If there is surplus PV electricity, it is used to electrolyze water in the SES-HES-AFC system. When PV power is insufficient, the SES-HES-AFC provides supplementary electricity before drawing from the grid.
The Figure 12c shows that in Xi’an, most of the solar thermal energy is used for domestic hot water. Specifically, 73% goes to DHW, 16% is stored in HCT, and 11% accounts for heat loss. The decision to prioritize DHW in the HTC is rooted in core principles of building energy management and user comfort: First, DHW demand (e.g., for showers, faucets) is instantaneous and unpredictable, and any supply interruption directly causes a significant decline in user comfort, unlike space heating which has a slower thermal response and higher tolerance for temporary fluctuations. Second, from a control strategy perspective, the DHW system acts as a high-priority finite energy buffer. The HTC is first tasked with maintaining the DHW storage tank at its setpoint temperature to meet sudden demand, and only after this buffer is fully satisfied will the remaining thermal energy be allocated to the space heating circuit, which has a larger thermal mass and lower priority. This control logic ensures the most critical user demand is always met first, guaranteeing system stability and operational reliability. The PV produces 3,417,782.712 kW, and 5,689,103.02 kWh is purchased from the grid, both mainly serving the heating and cooling needs. The AFC generates a large amount of heat during operation, increasing system heat output, which is primarily used for domestic hot water. Compared to the pre-optimization case, electricity purchased from the grid is reduced by 43.7%. Also, as the AFC can generate electricity using hydrogen stored in the HES, it contributes to the system’s power and reduces dependence on the grid.

4.2.2. Operating Characteristics Under Winter Conditions

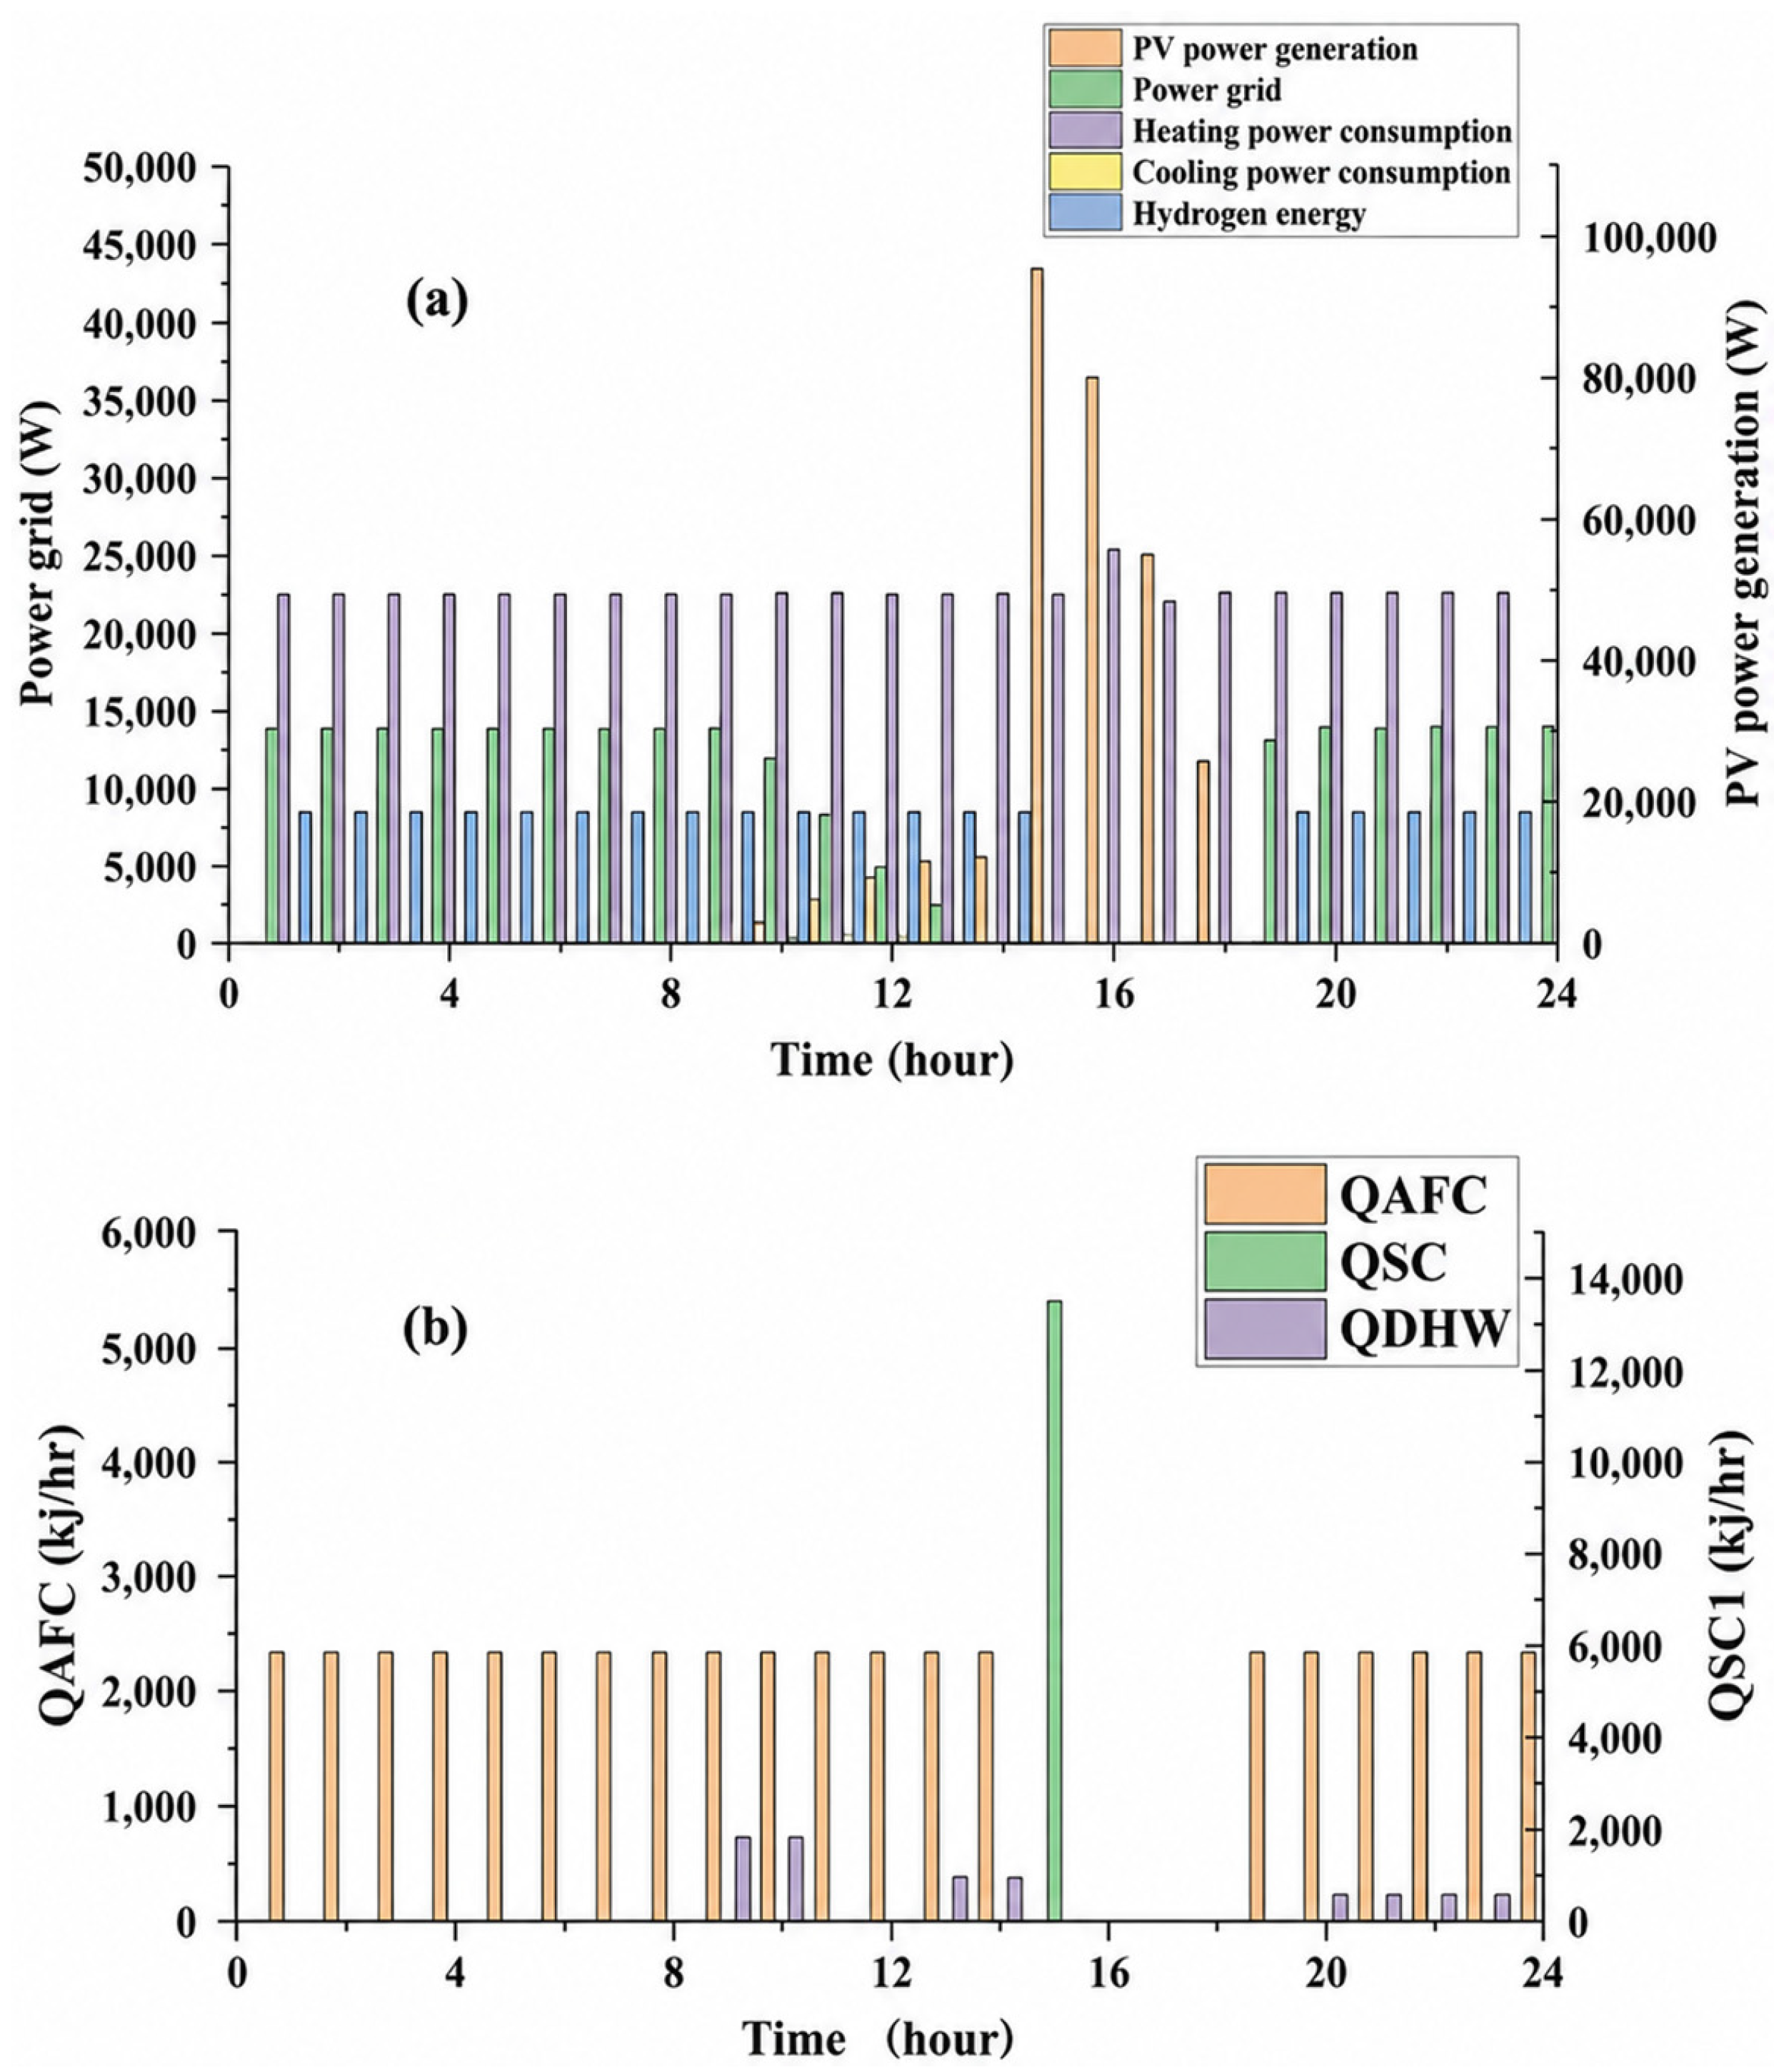
Figure 13a presents the hourly operational analysis of the system on a typical winter day in Xi’an. During winter in Xi’an, reduced solar radiation intensity and low ambient temperatures lead to a significant surge in building heating demand. The electricity output of the PV system is insufficient to meet the power requirements of the EB, thus requiring supplementary electricity from the grid to maintain heating stability. Meanwhile, the diminished winter solar radiation restricts the operational duration of the STC subsystem, which operates for only 1 h daily (concentrated at 15:00). Consequently, the energy contribution of the SFC becomes quite limited. To compensate for the deficits in both PV power generation and thermal supply, the AFC not only generates electricity but also produces thermal energy, forming a synergistic energy supply with the SFC to bridge the winter energy gap.
Figure 13b shows that in winter, the heater load dominates the total energy consumption. PV generation is far below the demand throughout the entire day and is only available for a few midday hours. Consequently, the AFC operates as the primary energy supply during winter days, consuming substantial amounts of stored hydrogen to compensate for the shortage, while its contribution is slightly reduced at midday when PV output is higher. Energy from the grid is supplied mostly at midday and in the evening, and during other periods, grid energy is roughly 1.5 times that produced by the AFC. Concerning thermal energy, the heat demand is highest in the few hours around noon, primarily met by the AFC and the HCT.

4.2.3. Operating Characteristics Under Summer Conditions

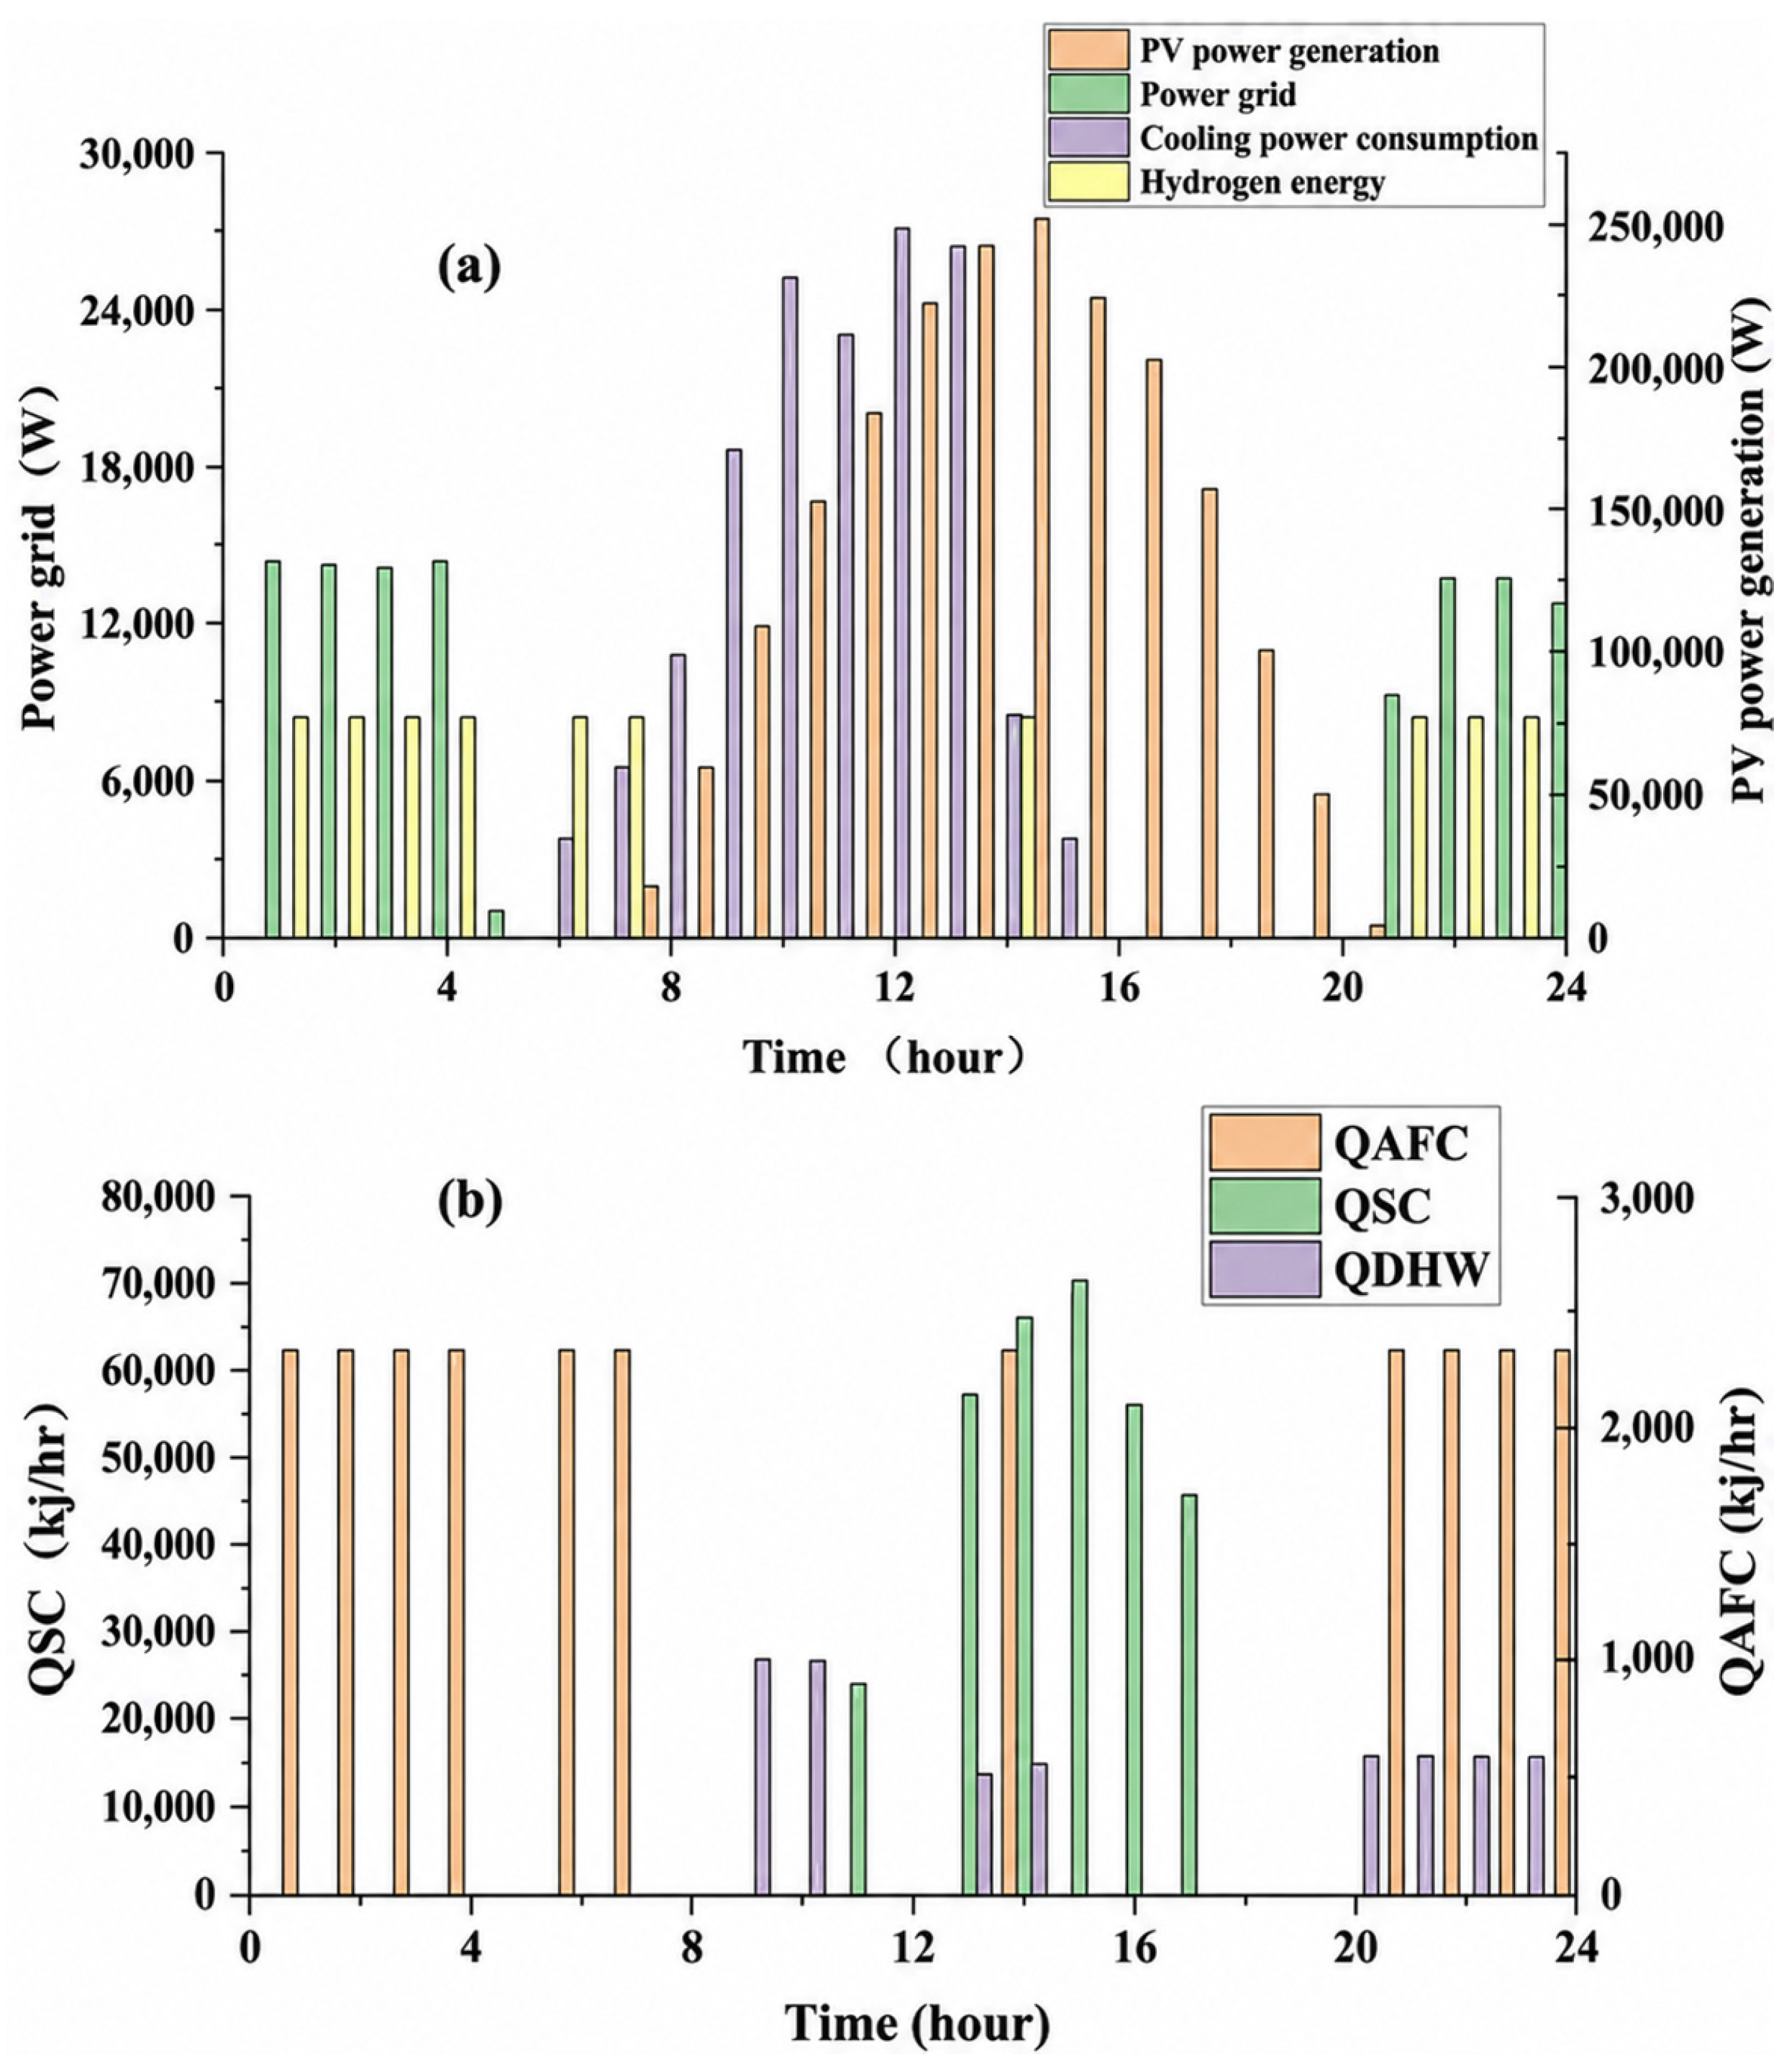
Figure 14a illustrates the hourly operation of the system on a typical summer day in Xi’an. The cooling load is covered by the EC, while domestic hot water is supplied by the SFC. During the approximately 12 h daylight period, the EC’s power demand is fully met by PV generation, with the remaining electricity needs supplemented by the grid and AFC. Surplus PV power is diverted to water electrolysis for hydrogen production. In line with the AFC’s operating principle, its runtime is determined by the power deficit that PV cannot cover—specifically, the AFC is activated when the gap between the cooling subsystem’s power demand and PV power supply exceeds 15 kWh. However, Figure 14a shows that between 8:00 and 20:00, this power gap stays under 25 kWh. As a result, AFC operation in summer on a typical day is limited to nighttime. During daytime hours, when solar radiation is strong, the EC is powered by PV, and the shortage that cannot be met by PV is supplied by the grid.
Figure 14b shows that the STC subsystem in Xi’an operates only 6 h, accounting for a small proportion of the power supply. The heat from the SFC is first stored in the HTC before being utilized for domestic hot water (DHW). Daily thermal energy demand is dominated by DHW, as the AFC only supplies heat during summer nights, leaving the HCT as the primary daytime heat source. The SFC supplements the HTC with thermal energy solely during the midday window (several hours around noon) when solar radiation is intense. When PV power output is sufficient, the system operates independently, with surplus PV electricity diverted to water electrolysis for hydrogen production. During periods of inactive PV generation, the EC is powered entirely by the grid to fulfill the cooling load.

4.2.4. Operating Characteristics on a Typical Inter-Seasonal Day

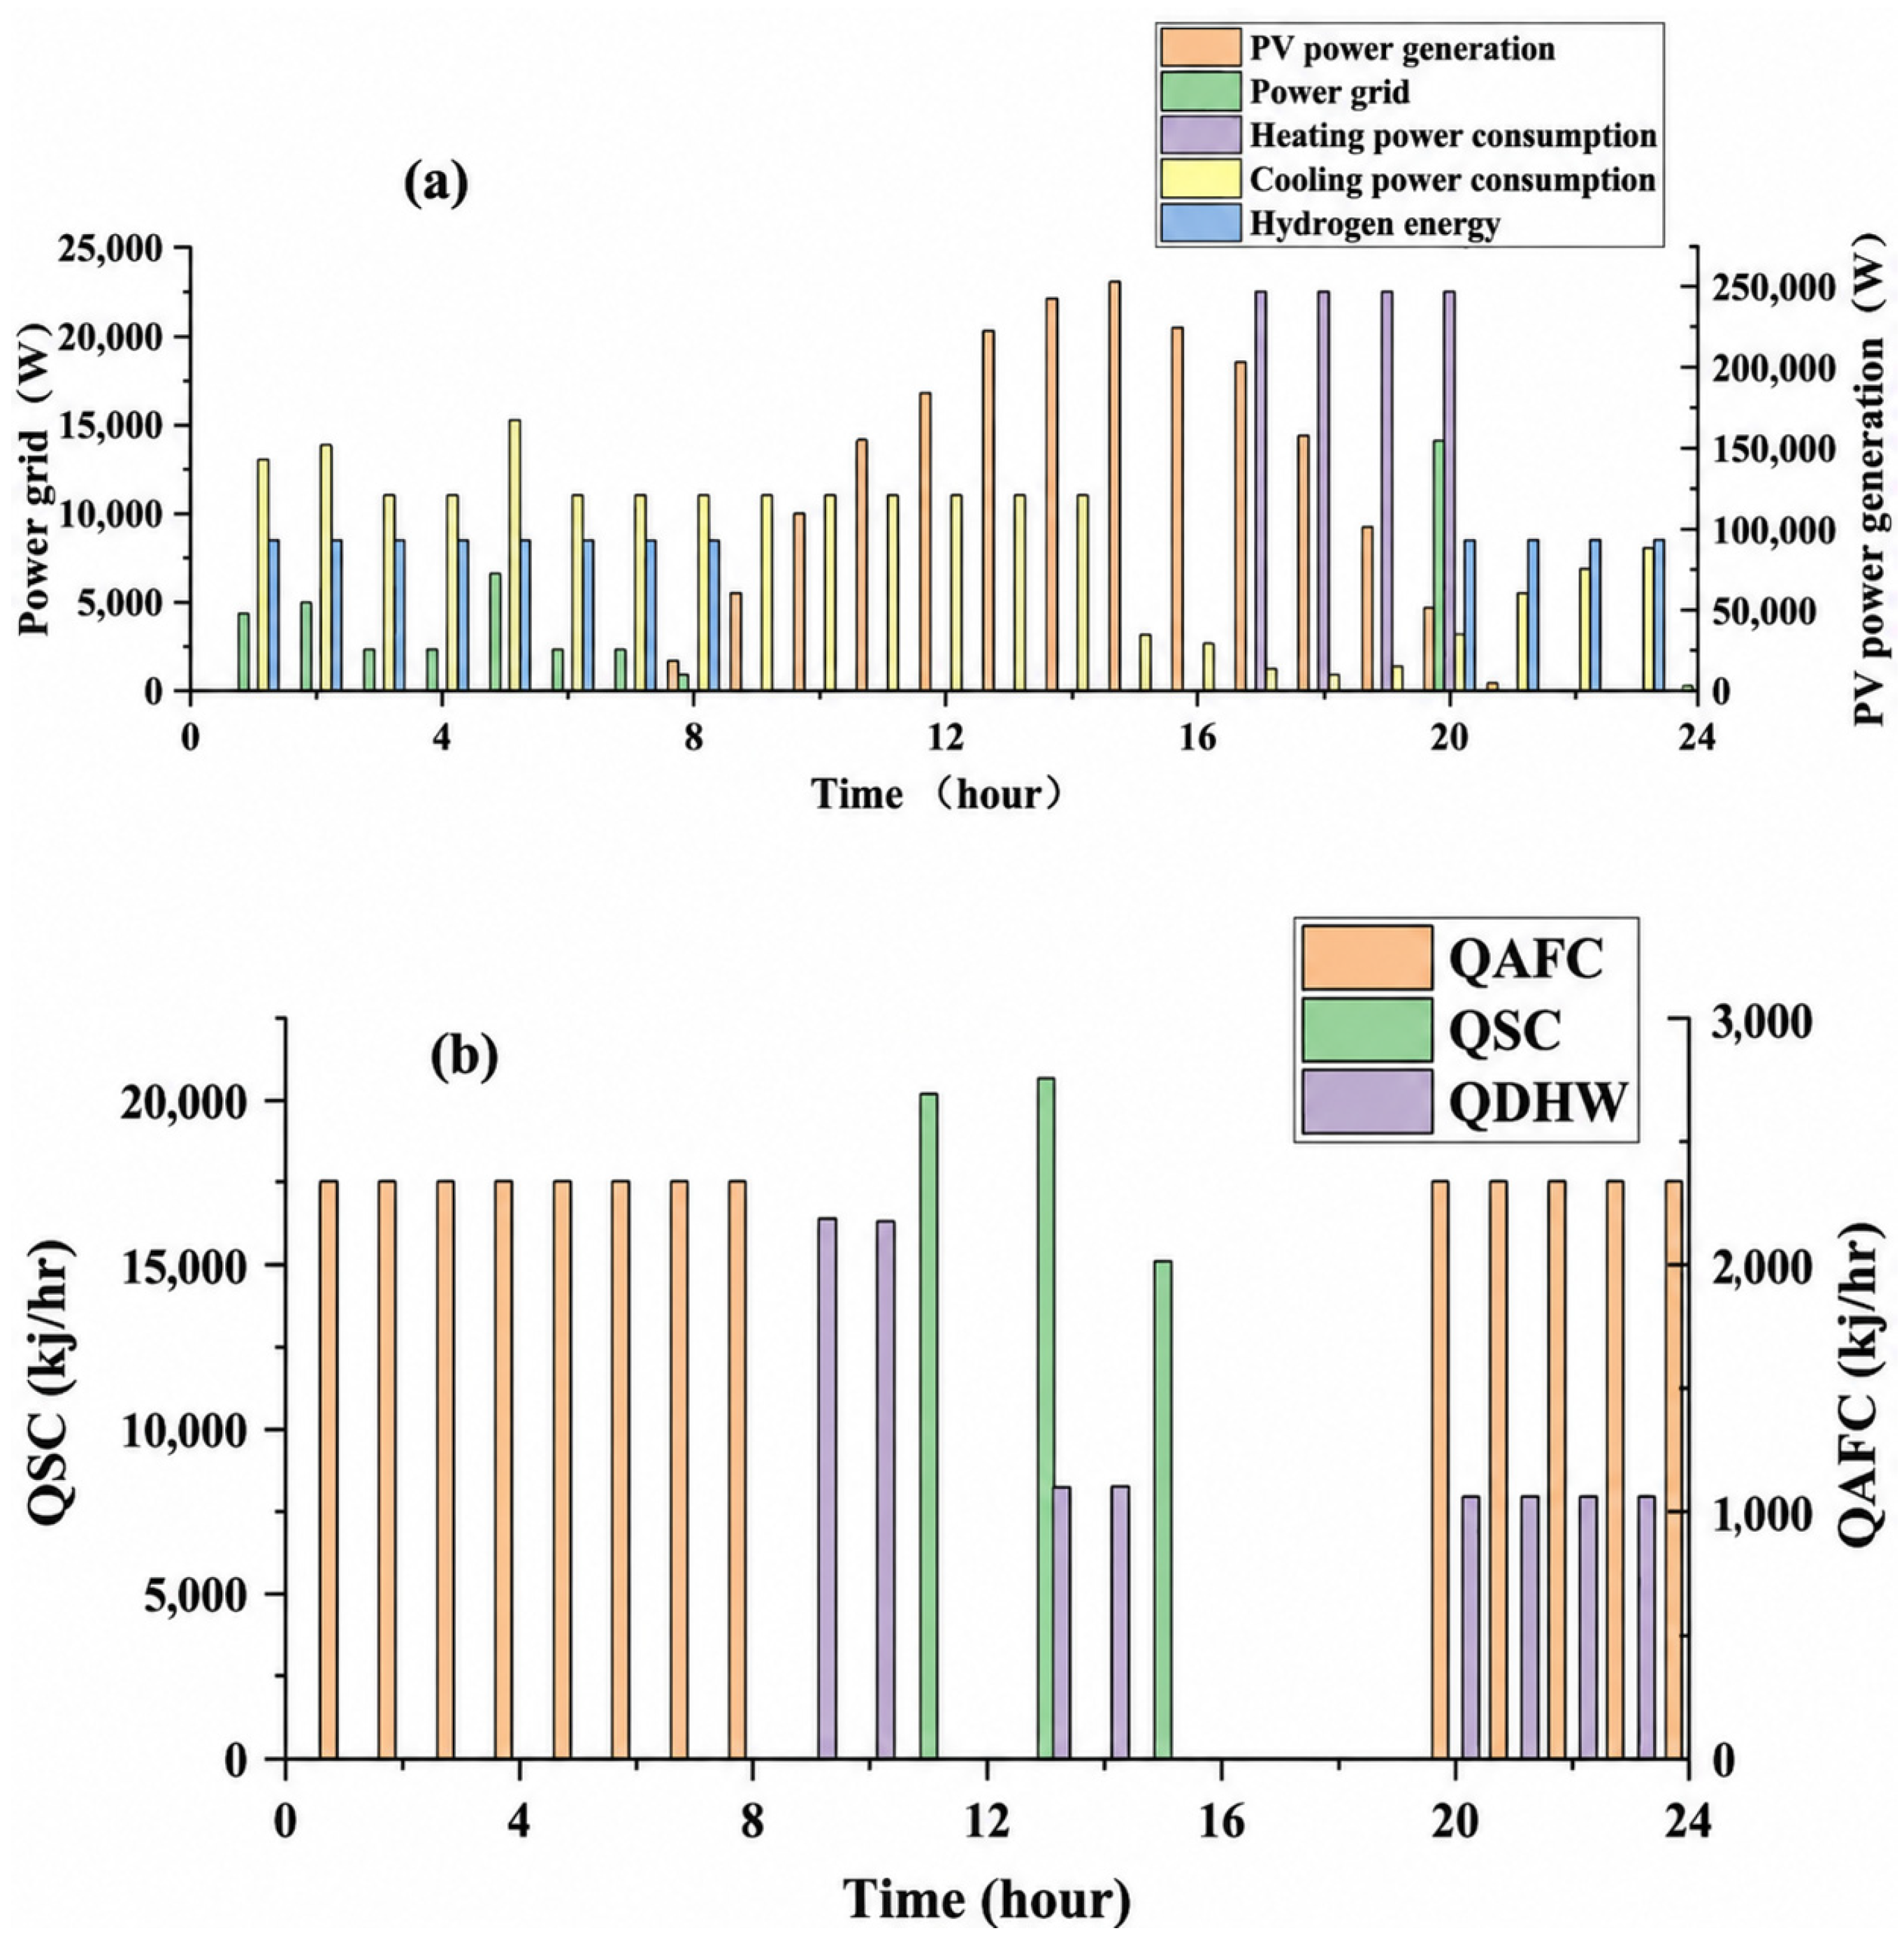
During a typical day in the transitional season (Figure 15), the heating and cooling loads in Xi’an are low. The primary energy flows consist of PV generation, AFC’s hydrogen production through electrolysis, and nighttime AFC power generation to satisfy the cooling load. The latent heat demand during several afternoon hours can be supplied by PV. At midday, with relatively low demand, PV generation fully meets the load and primarily supports water electrolysis for hydrogen production. During the rest period of the day, due to the cooling load demand and absence of PV, energy is mainly supplied by the AFC.
Due to the presence of the AFC, the surplus power generated by the photovoltaic system is used for water electrolysis to store hydrogen, thereby improving energy utilization efficiency. In Figure 15a, during the thermal energy demand rest periods of the day, domestic hot water is supplied by the HCT, while the SCT collects and stores heat in the HCT over three hours around noon. During the rest periods, AFC generates electricity to meet the cooling load while producing heat; this heat is stored in the HCT and used to satisfy thermal demands at noon and between 20:00 and 24:00.

4.3. Comprehensive Performance Evaluation

After analyzing the above system performance, a comprehensive evaluation was conducted. The ECR, annual CO2 emissions, and LCOE introduced in Section 3 are adopted as evaluation metrics to assess its technical feasibility, environmental benefits, and economic performance.

4.3.1. Analysis of Electricity Coverage Rate

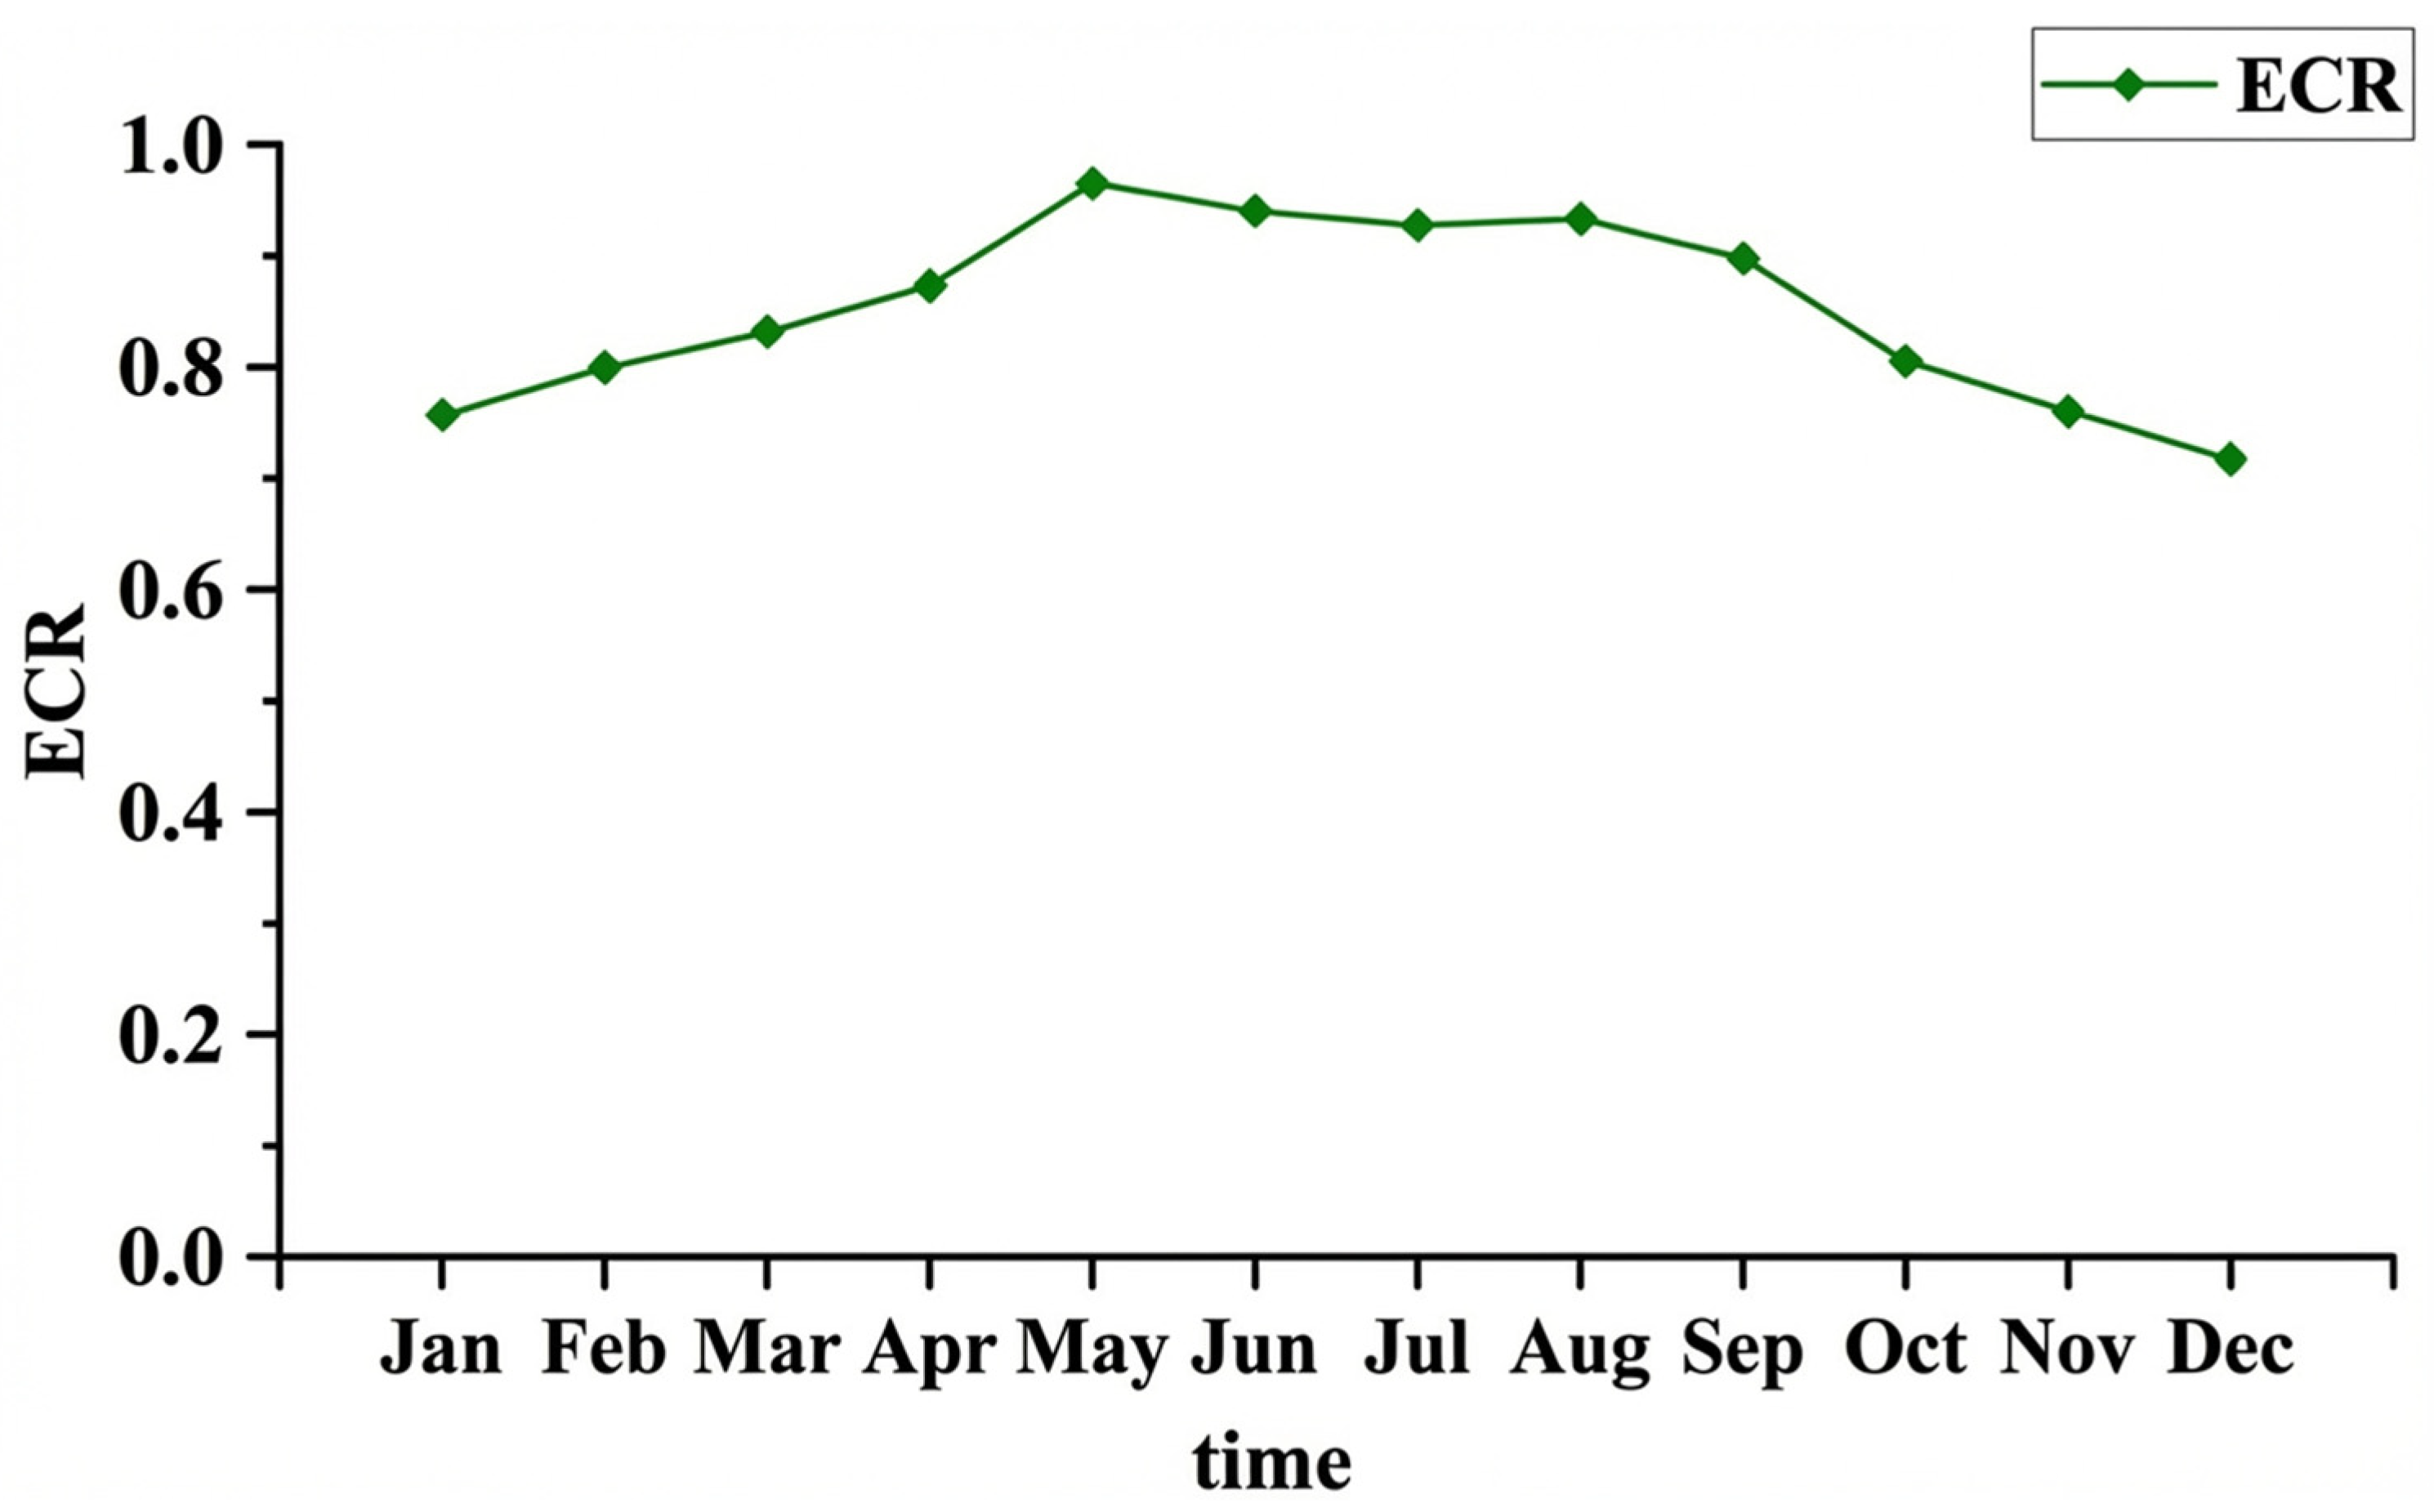
Figure 16 shows the monthly ECR index of the Xi’an reference system throughout one year. Loads are smaller during the transitional seasons and larger in summer/winter. The ECR is higher during the transitional seasons and lower in summer/winter.
PV and AFC satisfy most of the system’s electricity demand, with minimal grid input, keeping the annual ECR above 0.74 consistently. During spring and autumn transitions, Xi’an’s low building load allows combined PV-AFC output to fully cover demand, enabling autonomous operation and peak ECR. In summer and winter, higher cooling/heating loads see AFC compensate for PV shortages, with grid supplementation when both are insufficient.

4.3.2. Environmental Analysis

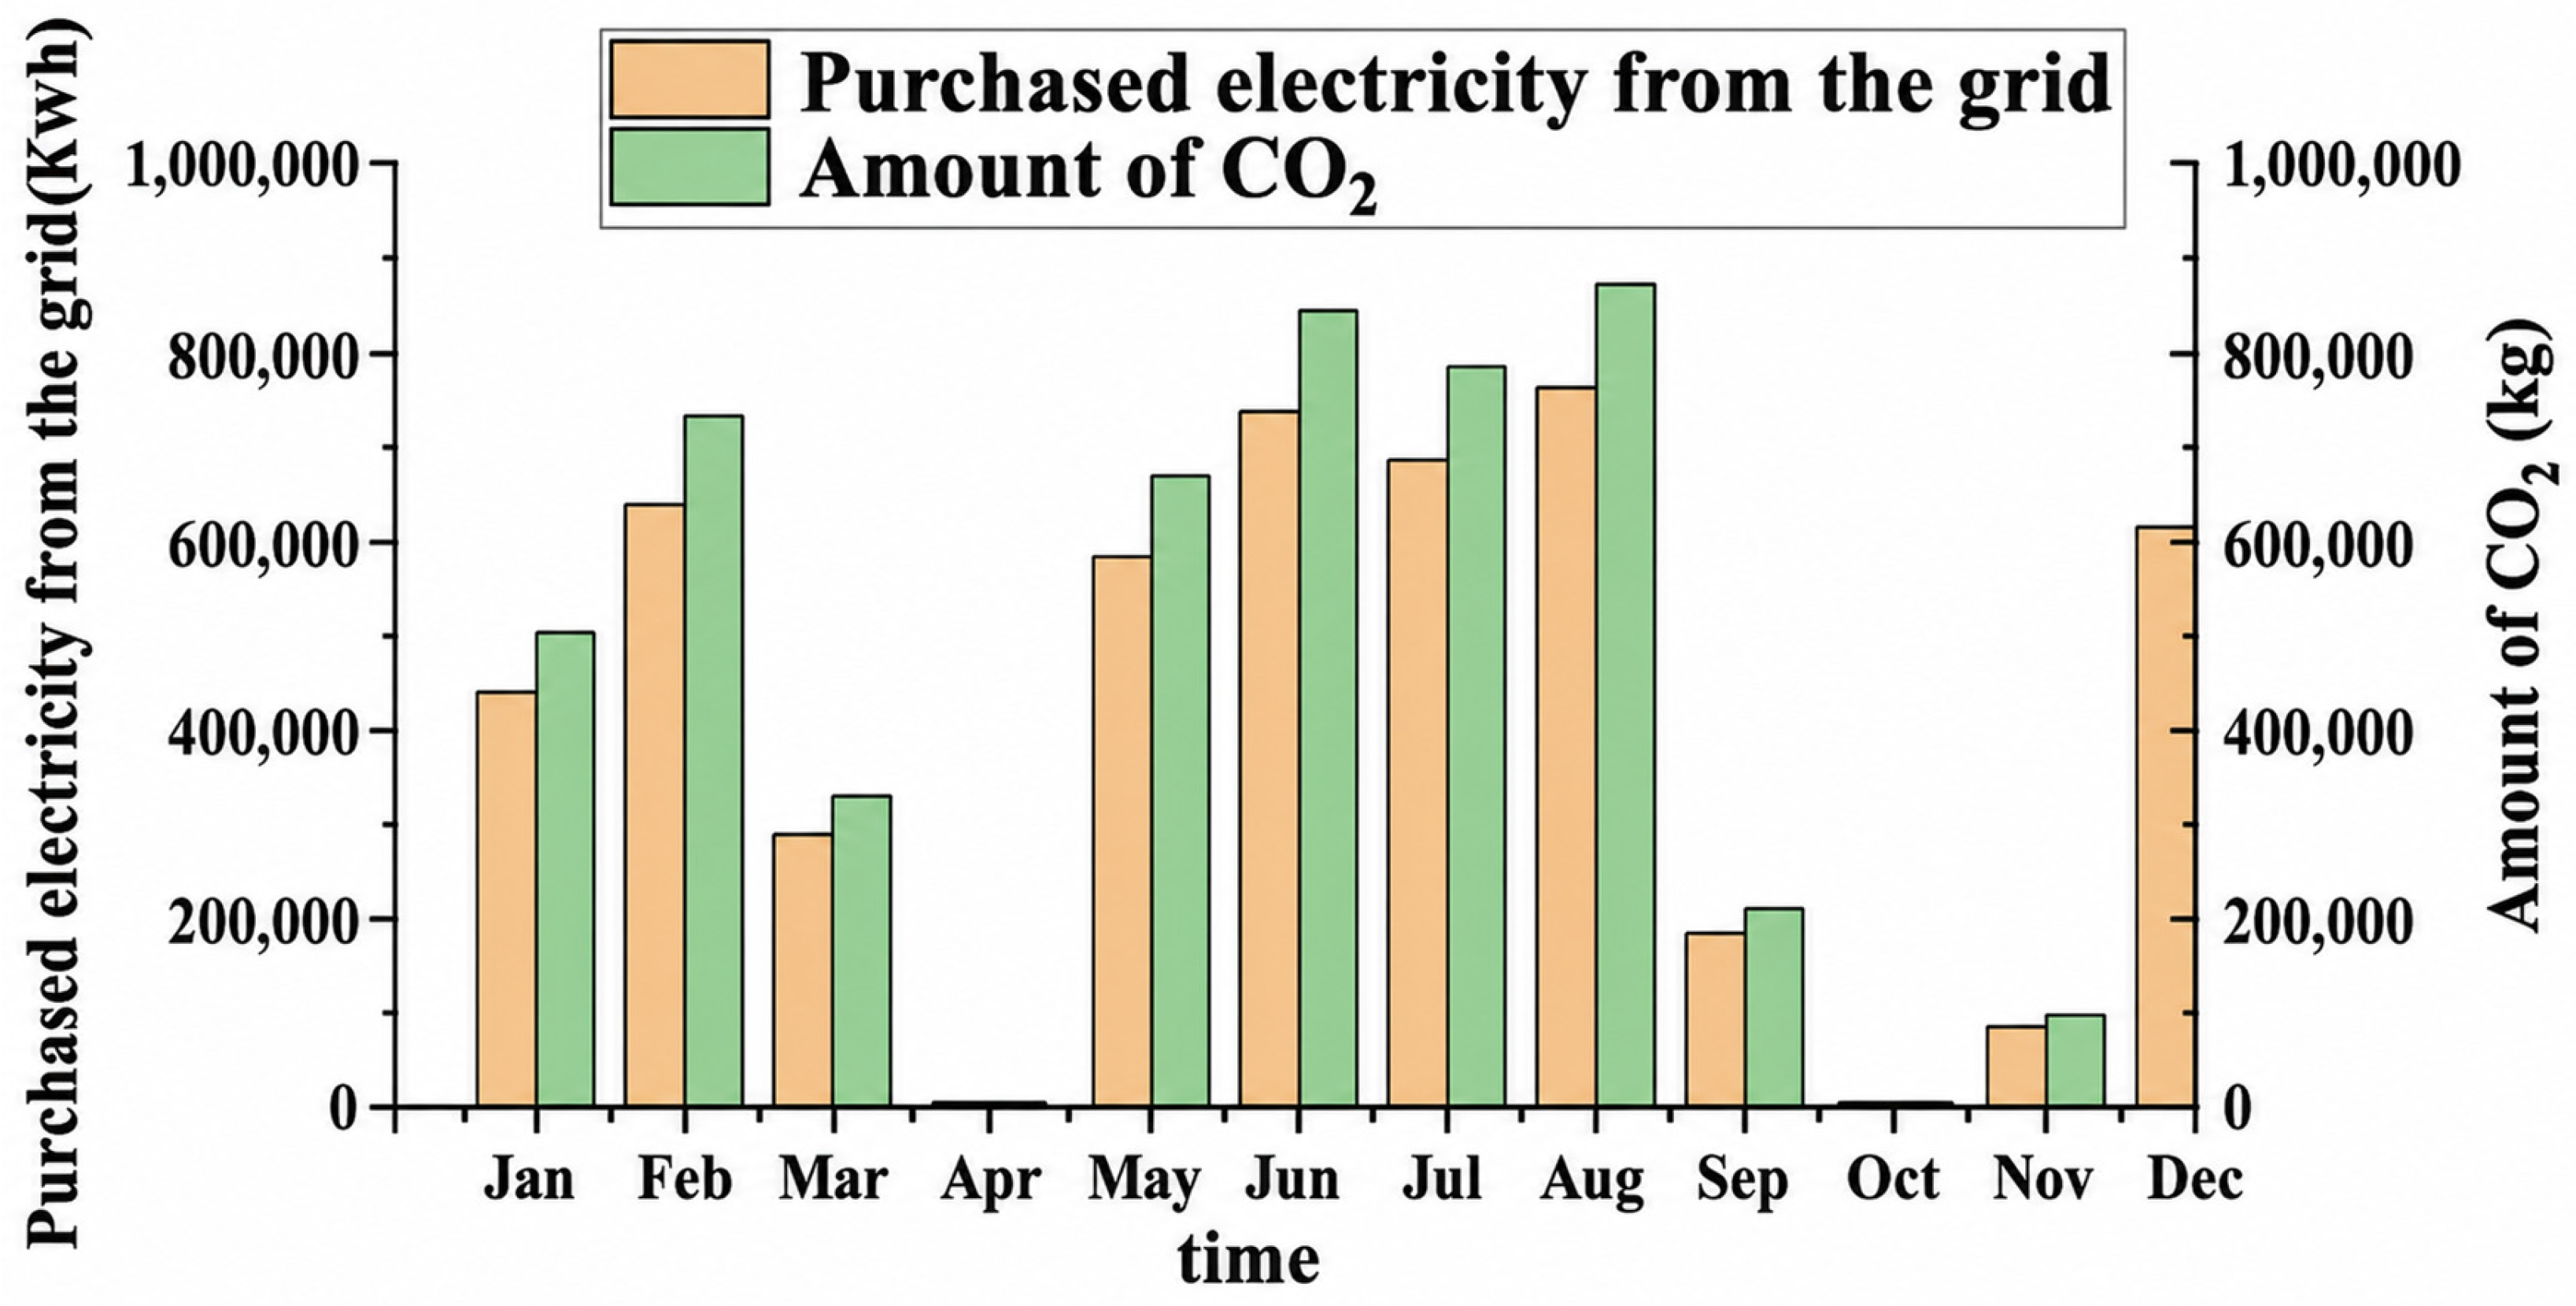
Figure 17 presents the annual CO2 emissions of the Xi’an reference system. As car-bon emissions are directly correlated with electricity usage during operation, this study accounts for carbon emissions in the system’s operational stage.
Xi’an’s monthly carbon emissions show peaks in summer and winter because of higher heating and cooling loads. The system’s PV and AFC generation cannot fully meet demand during these periods, leading to substantial electricity purchases from the grid and increased carbon emissions. In contrast, carbon emissions are lower in spring and autumn, especially reaching almost zero during transitional seasons. At these times, the system’s heating and cooling loads are small, and the energy supplied by PV and AFC meets most of the demand, with minimal grid electricity supplementation; thus, carbon emissions decline gradually.
Annual carbon emissions exhibit seasonal fluctuations. From January to April, rising temperatures reduce heating demand, while improved solar conditions boost PV generation, cutting grid purchases and lowering emissions. During the spring–summer transition, PV fully meets system needs for grid-independent operation and the lowest annual emissions.
April to August brings warmer weather and enhanced solar resources (higher PV output), but surging cooling loads outpace PV and AFC generation, requiring grid supplementation; emissions thus rise to a July peak. August to October sees falling temperatures (lower cooling demand) and reduced external power reliance, driving emissions down; in the autumn transition, sufficient PV enables autonomous operation and another emission low. October to December brings shorter, weaker daylight (plummeting PV output) and soaring heating demand; PV and AFC fail to meet load, prompting heavy grid supplementation, meaning emissions climb to a December peak.

4.3.3. Economic Analysis

Figure 18 shows the annual LCOE and total net present value of the Xi’an simulation system. Since LCOE is somewhat correlated with LLC, the figure indicates that although SES-HES-AFC has higher equipment costs, its operating costs significantly decreased compared to before optimization. Both the net present value and LCOE decreased compared to pre-optimization, with LCOE at 0.0914. This means the optimized system has lower electricity costs and higher overall economic benefits.

5. Conclusions

This study presents and optimizes an innovative solar energy storage and hydrogen energy storage system based on an alkaline fuel cell (SES-HES-AFC), which is capable of efficiently and economically harnessing solar energy, enhancing renewable energy self-sufficiency, and enabling reuse of surplus photovoltaic power. A comprehensive performance evaluation was conducted, comparing the proposed system with a reference system in terms of power coverage and environmental and economic characteristics. Using typical Xi’an climate conditions and a hypothetical two-story building as the research case, the feasibility of the system and optimization model was confirmed, resulting in the following conclusions.
  • Results demonstrated a marked LCC reduction after optimization, especially in operational costs, confirming the system’s strong long-term economic performance. Despite the hydrogen system’s higher initial investment, its low grid electricity demand and energy self-sufficiency yielded the lowest total net present value.
  • Taking Xi’an as a typical climatic case, results showed the system achieved an annual average ECR above 74.2%, with significantly lower carbon emissions than traditional systems and a minimum LCOE of approximately 12.9 USD/MWh.
  • On typical days, winter AFC offset PV deficits and supplied waste heat; summer abundant solar irradiance enabled near-independent PV power supply, with surplus electricity directed to hydrogen storage; and transitional seasons brought strong self-generation capacity and minimal grid dependence.
Despite the progress made in this study on the SES-HES-AFC renewable energy dual storage system with green hydrogen, several limitations and critical challenges still require resolution. The modeling process omitted the impacts of pressure drops in pipes and valves and did not account for thermal losses of the photovoltaic system. The current system model is primarily based on the Xi’an region; thus, the conclusions have geographic limitations.
Future research will broaden the scope to incorporate diverse climate zones, building types, and usage requirements to assess the system’s adaptability across different regions. Although hydrogen storage systems have advantages over long cycles, the equipment investment and operation and maintenance costs remain relatively high. Presently, optimization targets concentrate primarily on life cycle costs. Future efforts should integrate factors such as carbon emission allowances, electricity market volatility, and carbon trading mechanisms to steer system design toward a dual optimal goal of “low carbon and low cost.” Renewable energy dual storage systems with green hydrogen serve as crucial support for building low-carbon buildings and smart energy networks and still hold vast potential for development and optimization in practical applications. With continuous technological advancements and policy support, such systems are expected to play a more critical role in future urban energy systems.

Author Contributions

Conceptualization, N.Z. and C.A.; methodology, N.Z.; validation, N.Z., C.A., T.W., X.J. and S.Z.; formal analysis, N.Z.; investigation, N.Z.; resources, N.Z. and C.A.; data curation, N.Z.; writing—original draft preparation, N.Z.; writing—review and editing, N.Z., C.A., T.W., X.J. and S.Z.; visualization, N.Z.; supervision, C.A. All authors have read and agreed to the published version of the manuscript.

Funding

This research received no external funding.

Data Availability Statement

The original contributions presented in the study are included in the article, further inquiries can be directed to the corresponding author.

Conflicts of Interest

The authors declare no conflicts of interest.

Nomenclature

AcollSolar Collector Area [m2]Greek Symbols
APVPhotovoltaic Generation Area [m2]ηhEfficiency of Electric Boiler (EB)
VtankRated Capacity of Heat Storage TankηcChiller Efficiency (EC)
EhRated Capacity of Electric Boiler [kW]αhThermal Loss of the Heating Line
EcRated Capacity of Electric Chiller [kW]αcRefrigeration Loss of the Cooling Line
CiInitial Investment Cost [USD]Abbreviations
CeElectricity Cost per [USD/kWh]PVPhotovoltaic
CMCOperation and Maintenance Expense [USD]AFCAlkaline Fuel Cell
EgridTotal Annual Electricity Purchased from the Grid [kWh]LCCLifecycle Cost
MCO2Total Mass of CO2 [kg]LCOELevelized Cost of Energy
VCO2Volume of CO2 [m3]ECRElectricity Coverage Rate
ρCO2Density of CO2 [kg/m3]BESSBattery Energy Storage Systems
WloadBuilding’s Load [kWh]HESHydrogen Energy Storage
iAnnual Bank Loan Interest RateSFCSolar Flat Collectors
ieAnnual Electricity Price Growth RateHCTHeat Storage Tank
mDesigned Operational PeriodEBElectric Boiler
fmFixed Ratio between Maintenance and Initial CostECElectric Chiller
qheatingMaximum Hourly Thermal LoadDHWDomestic Hot Water
qcoolingMaximum Hourly Cooling LoadSTCSolar Thermal Collector
QSCHeat Output of Solar CollectorCCHPCombined Cooling, Heating and Power
QAFCHeat Generated by AFCNPVNet Present Value
QDHWHeat for Domestic Hot WaterCOPCoefficient of Performance
QHCTHeat Stored in HCT

References

  1. Wang, Z.; Hou, G.; Taherian, H.; Song, Y. Numerical investigation of innovative photovoltaic–thermal (PVT) collector designs for electrical and thermal enhancement. Energies 2024, 17, 2429. [Google Scholar] [CrossRef]
  2. Qi, S.; Cheng, S.; Tan, X.; Feng, S.; Zhou, Q. Predicting China’s carbon price based on a multi-scale integrated model. Appl. Energy 2022, 324, 119784. [Google Scholar] [CrossRef]
  3. Malaviya, P.; Sarvaiya, V.; Shah, A.; Thakkar, D.; Shah, M. A comprehensive review on space solar power satellite: An idiosyncratic approach. Environ. Sci. Pollut. Res. 2022, 29, 42476–42492. [Google Scholar] [CrossRef] [PubMed]
  4. Huang, J.; Fan, J.; Furbo, S. Feasibility study on solar district heating in China. Renew. Sustain. Energy Rev. 2019, 108, 53–64. [Google Scholar] [CrossRef]
  5. Chen, Y.; Quan, M.; Wang, D.; Du, H.; Hu, L.; Zhao, Y.; Guo, M.; Liu, Y. Optimization and comparison of multiple solar energy systems for public sanitation service buildings in Tibet. Energy Convers. Manag. 2022, 267, 115847. [Google Scholar] [CrossRef]
  6. ur Rehman, H.; Hirvonen, J.; Kosonen, R.; Sirén, K. Computational comparison of a novel decentralized photovoltaic district heating system against three optimized solar district systems. Energy Convers. Manag. 2019, 191, 39–54. [Google Scholar] [CrossRef]
  7. Rahman, S.; Saha, S.; Islam, S.N.; Arif, M.T.; Mosadeghy, M.; Haque, M.E.; Oo, A.M. Analysis of power grid voltage stability with high penetration of solar PV systems. IEEE Trans. Ind. Appl. 2021, 57, 2245–2257. [Google Scholar] [CrossRef]
  8. Eltigani, D.; Masri, S. Challenges of integrating renewable energy sources to smart grids: A review. Renew. Sustain. Energy Rev. 2015, 52, 770–780. [Google Scholar] [CrossRef]
  9. Zhou, D.; Chong, Z.; Wang, Q. What is the future policy for photovoltaic power applications in China? Lessons from the past. Resour. Policy 2020, 65, 101575. [Google Scholar] [CrossRef]
  10. Chandel, R.; Chandel, S.S.; Malik, P. Perspective of new distributed grid connected roof top solar photovoltaic power generation policy interventions in India. Energy Policy 2022, 168, 113122. [Google Scholar] [CrossRef]
  11. Pemmada, S.; Patne, N.R.; Manchalwar, A.D.; Panigrahi, R. A novel hybrid algorithm based optimal planning of solar PV and battery energy storage systems. Energy Rep. 2023, 9, 380–387. [Google Scholar] [CrossRef]
  12. Zhang, Z.; Wen, K.; Sun, W. Optimization and sustainability analysis of a hybrid diesel-solar-battery energy storage structure for zero energy buildings at various reliability conditions. Sustain. Energy Technol. Assess. 2023, 55, 102913. [Google Scholar] [CrossRef]
  13. Gul, E.; Baldinelli, G.; Bartocci, P.; Bianchi, F.; Piergiovanni, D.; Cotana, F.; Wang, J. A techno-economic analysis of a solar PV and DC battery storage system for a community energy sharing. Energy 2022, 244, 123191. [Google Scholar] [CrossRef]
  14. Mansir, I.B.; Bani Hani, E.H.; Farouk, N.; AlArjani, A.; Ayed, H.; Nguyen, D.D. Comparative transient simulation of a renewable energy system with hydrogen and battery energy storage for residential applications. Int. J. Hydrogen Energy 2022, 47, 26198–26208. [Google Scholar] [CrossRef]
  15. Welder, L.; Stenzel, P.; Ebersbach, N.; Markewitz, P.; Robinius, M.; Emonts, B.; Stolten, D. Design and evaluation of hydrogen electricity reconversion pathways in national energy systems using spatially and temporally resolved energy system optimization. Int. J. Hydrogen Energy 2019, 44, 9594–9607. [Google Scholar] [CrossRef]
  16. Liu, J.; Cao, S.; Chen, X.; Yang, H.; Peng, J. Energy planning of renewable applications in high-rise residential buildings integrating battery and hydrogen vehicle storage. Appl. Energy 2021, 281, 116038. [Google Scholar] [CrossRef]
  17. Song, Y.; Mu, H.; Li, N.; Shi, X.; Zhao, X.; Chen, C.; Wang, H. Techno-economic analysis of a hybrid energy system for CCHP and hydrogen production based on solar energy. Int. J. Hydrogen Energy 2022, 47, 24533–24547. [Google Scholar] [CrossRef]
  18. Izadi, A.; Shahafve, M.; Ahmadi, P. Neural network genetic algorithm optimization of a transient hybrid renewable energy system with solar/wind and hydrogen storage system for zero energy buildings at various climate conditions. Energy Convers. Manag. 2022, 260, 115593. [Google Scholar] [CrossRef]
  19. Mansir, I.B.; Hani, E.H.B.; Ayed, H.; Diyoke, C. Dynamic simulation of hydrogen-based zero energy buildings with hydrogen energy storage for various climate conditions. Int. J. Hydrogen Energy 2022, 47, 26501–26514. [Google Scholar] [CrossRef]
  20. Babatunde, O.M.; Munda, J.L.; Hamam, Y. Off-grid hybrid photovoltaic–micro wind turbine renewable energy system with hydrogen and battery storage: Effects of sun tracking technologies. Energy Convers. Manag. 2022, 255, 115335. [Google Scholar] [CrossRef]
  21. Okundamiya, M.S. Integration of photovoltaic and hydrogen fuel cell system for sustainable energy harvesting of a university ICT infrastructure with an irregular electric grid. Energy Convers. Manag. 2021, 250, 114928. [Google Scholar] [CrossRef]
  22. Pal, P.; Mukherjee, V. Off-grid solar photovoltaic/hydrogen fuel cell system for renewable energy generation: An investigation based on techno-economic feasibility assessment for the application of end-user load demand in north-east India. Renew. Sustain. Energy Rev. 2021, 149, 111421. [Google Scholar] [CrossRef]
  23. Elkhatib, R.; Kaoutari, T.; Louahlia, H. Green hydrogen energy source for a residential fuel cell micro-combined heat and power. Appl. Therm. Eng. 2024, 248, 123194. [Google Scholar] [CrossRef]
  24. Mahmoudi, S.M.; Maleki, A.; Rezaei Ochbelagh, D. Techno-economic assessment of hydrogen-based energy storage systems in determining the optimal configuration of the nuclear-renewable hybrid energy system. Energy Rep. 2024, 11, 4713–4725. [Google Scholar] [CrossRef]
  25. Li, J.; Wang, H.; Liu, Z.; Zhao, Y. Optimal design and economic assessment of PV–hydrogen–fuel cell hybrid systems for building applications. Int. J. Hydrogen Energy 2022, 47, 24533–24547. [Google Scholar] [CrossRef]
  26. Lajunen, A. Lifecycle costs and charging requirements of electric buses with different charging methods. J. Clean. Prod. 2018, 172, 56–67. [Google Scholar] [CrossRef]
  27. Sarıkoç, S. Lifecycle-Based Environmental Pollution Cost Analyses of a Spark Ignition Engine Fueled with a Methanol-Gasoline Blend. Energy Sources Part A Recovery Util. Environ. Eff. 2021, 43, 3166–3183. [Google Scholar] [CrossRef]
  28. Xu, X.; Chen, Y.; Goude, Y.; Yao, Q. Day-ahead probabilistic forecasting for french half-hourly electricity loads and quantiles for curve-to-curve regression. Appl. Energy 2021, 301, 117465. [Google Scholar] [CrossRef]
  29. Orioli, A.; Di Gangi, A. Five-years-long effects of the italian policies for photovoltaics on the energy demand coverage of grid-connected PV systems installed in urban contexts. Energy 2016, 113, 444–460. [Google Scholar] [CrossRef]
  30. Zuo, Z.; Basem, A.; Hussein, Z.A.; Sharma, K.; Dixit, S.; Alanazi, Y.M.; El-Shafay, A.S. Enhanced near zero-energy building performance through intelligent hydrogen storage management across diverse climates. Energy 2025, 327, 136339. [Google Scholar] [CrossRef]
  31. Wang, L.; Luo, Y.; Wang, L.; Yang, G. Dynamic performance analysis and climate zone-based design of a seasonal solar thermochemical energy storage and heating system in China. Energy Convers. Manag. 2025, 331, 119688. [Google Scholar] [CrossRef]
  32. Lu, T.; Lü, X.; Välisuo, P.; Zhang, Q.; Clements-Croome, D. Innovative approaches for deep decarbonization of data centers and building space heating networks: Modeling and comparison of novel waste heat recovery systems for liquid cooling systems. Appl. Energy 2024, 357, 122473. [Google Scholar] [CrossRef]
  33. Altun, A.F.; Kilic, M. Design and performance evaluation based on economics and environmental impact of a PV-wind-diesel and battery standalone power system for various climates in Turkey. Renew. Energy 2020, 157, 424–443. [Google Scholar] [CrossRef]
  34. Geng, C.; Zhang, T.; Sun, W. Hybrid solar, wind, and geothermal power generation combined with energy storage for sustainable energy management in remote buildings. J. Energy Storage 2025, 123, 116655. [Google Scholar] [CrossRef]
  35. Wei, W.; Yue, H.; Huang, J.; Zhang, H.; Liu, H.; Chen, H.; Cheng, C. Performance analysis and optimization of photovoltaic thermal coupled ground source heat pump system. Energy 2025, 319, 134955. [Google Scholar] [CrossRef]
  36. Zhang, L.; Feng, G.; Bi, Y.; Huang, K.; Chang, S.; Li, A.; Li, H. Design and optimization of cooling-heating-electricity integrated storage systems in cold regions. J. Energy Storage 2025, 109, 115131. [Google Scholar] [CrossRef]
  37. Wu, Q.; Luo, H.; Cao, S. Net-zero energy synergies of utilising electric shuttle buses to remotely share energy between zero-energy commercial and transportation buildings. Appl. Energy 2025, 383, 125399. [Google Scholar] [CrossRef]
  38. Zeng, R.; Ni, Z.; Tang, X.; Zhang, X.; Li, H.; Zhang, G. Optimization of PVT-AFC-CCHP system configuration under multi-climate zones. Int. J. Hydrogen Energy 2025, 102, 1210–1230. [Google Scholar] [CrossRef]
  39. Hamdi, M.; Alimi, S.E. Performance analysis of a photovoltaic-driven hydrogen electrolyzer system for sustainable ammonia production: Seasonal and regional assessment. Energy Convers. Manag. 2025, 326, 119538. [Google Scholar] [CrossRef]
Figure 1. Xi’an monthly radiation levels.
Energies 19 03165 g001
Figure 2. Xi’an monthly seasonal temperature differences.
Energies 19 03165 g002
Figure 3. Architectural model and thermal zoning of the case study building.
Energies 19 03165 g003
Figure 4. Building heating and cooling load.
Energies 19 03165 g004
Figure 5. A schematic of the TRNSYS-based model of the SES-HES-AFC system.
Energies 19 03165 g005
Figure 6. Control logic.
Energies 19 03165 g006
Figure 7. (a) Optimized cost chart and (b) cost chart before optimization.
Energies 19 03165 g007
Figure 8. System performance for (a) PV power generation, (b) Wele power generation, and (c) power grid electricity purchase volume.
Energies 19 03165 g008
Figure 9. System performance for (a) AFC power generation and (b) hydrogen storage tank gas content.
Energies 19 03165 g009
Figure 10. Proportion of system energy.
Energies 19 03165 g010
Figure 11. Comparison of power consumption for heating and cooling systems.
Energies 19 03165 g011
Figure 12. (a) Heat proportion of each system component, (b) proportion of thermal energy consumption, and (c) proportion of system heat generation sources.
Energies 19 03165 g012
Figure 13. The hourly operational analysis of the system on (a) a typical electric energy in winter and (b) the typical daily heat energy in winter in Xi’an.
Energies 19 03165 g013
Figure 14. The hourly operation of the system on (a) a typical summer day and (b) the typical daily solar energy in summer in Xi’an.
Energies 19 03165 g014
Figure 15. Typical daily: (a) electricity energy in the transitional season; (b) solar energy in the transitional season.
Energies 19 03165 g015
Figure 16. Monthly ECR of the system.
Energies 19 03165 g016
Figure 17. Monthly carbon dioxide emissions.
Energies 19 03165 g017
Figure 18. Optimized system LCOE cost chart.
Energies 19 03165 g018
Table 1. Case study: building information.
Case Study: Building Information
AreaNumber of layers: 2
Total Region: 5
Area of each floor: 200 m2
Total area: 400 m2
Internal gainPeople, computers, lights, TVs, refrigerators
HAVC setpointHeating: 23 °C
Cooling: 23 °C
Permeability0.6 ACH
Table 2. Comparison of the AFC in this study with the experimental data from Ref. [23].
VariableThis StudyLiteratureUnitRelative Error (%)
The number of series-connected AFC modules per stack1616
The number of parallel-connected AFC modules per stack11
The heat generated by the AFC stack87758700W0.86
The electric power output by the AFC stack67746700W1.10
Table 3. The specific composition and control strategies of different subsystems.
SubsystemComponentControl Strategy
PV Photovoltaic SubsystemPV: type94a; Polycrystalline silicon waferThe operation schedule of photovoltaic power generation is determined by the solar irradiance per hour.
STC SubsystemSolar collector: type1, Flat plate collector;
Hot water tank: type158;
Temperature difference controller: type2b
The operation scheme of the collector water pump is determined by the outlet temperature of the collector and the heat storage tank through the temperature difference controller.
Heating SubsystemElectric boiler: type 138;
Pump: type 114, Single speed.
The schedule for starting the electric boiler and heating water pump is determined by the hourly heating load and the load side outlet temperature of the heating water tank ((1) whether the hourly heating load is greater than 0 and (2) whether the load-side outlet temperature of the heating water tank is lower than 50 °C).
Cooling SubsystemWater chiller: type 655, COP: 5.5.The schedule for the chiller unit and chilled water pump operation is determined by the hourly cooling load.
HES and AFC subsystemsElectrolytic cell controller: type100a
Power regulation: type 175;
Electrolytic cell: type 160;
Compressor: type 167;
Hydrogen storage tank; type 164;
Fuel cell; type 173.
The opening schedule of HES is determined by the excess power of PV. The opening schedule of AFC is determined by the difference between the power driving the heating/cooling subsystem and the power provided by PV; if the difference exceeds 1.5 kW, AFC will be activated.
Table 4. Decision variables in the recommendation system.
SystemVariables
SES-HES-AFCAcoll, APV, Vtank, Eh, Ec
Table 5. Economic parameters and cost assumptions of system components.
EquipmentPriceUnitService Life
Photovoltaic panel98.35USD/m215 years
Solar panel heat collector70.25USD/m215 years
Hot water tank84.30USD/m215 years
Electric boiler28.10USD/kW15 years
Chilled water unit136.28USD/kW15 years
Electrolytic cell1100USD/kW15 years
compressor15000USD15 years
Hydrogen storage tank2100USD15 years
Electricity0.11USD/kWh
i3.85%
ie1.85%
Table 6. Optimized variable.
VariableTitle 1
APV200 m2
Acoll50 m2
Vtank12 m3
Eh15 kW
Ec10 kW
Disclaimer/Publisher’s Note: The statements, opinions and data contained in all publications are solely those of the individual author(s) and contributor(s) and not of MDPI and/or the editor(s). MDPI and/or the editor(s) disclaim responsibility for any injury to people or property resulting from any ideas, methods, instructions or products referred to in the content.