


Abstract
Unbalanced input voltage can significantly affect the electrical behavior of transformer rectifier units (TRUs), especially when a diode open-circuit (OC) fault breaks the original diode conduction symmetry. However, the effect of unbalanced input voltage on the diode OC fault has not been sufficiently clarified from the perspective of a conduction mechanism. This paper analyzes the effect of unbalanced input voltage on diode OC faults in TRUs by establishing a conduction-oriented mechanism. Unbalanced input voltage is divided into two forms, namely, unequal magnitude and phase-shift deviation. The effects on diode conduction boundaries, conduction angles, and conduction intervals are first derived theoretically. Then, using a 12-pulse TRU with and OC faults as representative cases, current and voltage responses are investigated in both time and frequency domains. The experimental results show that the two forms change diode conduction intervals in different ways. In particular, an unequal magnitude changes the relative driving voltage dominance near the conduction boundaries, resulting in the stretching or compression of diode conduction intervals; phase-shift deviation shifts the angular positions of the driving voltages and modifies the commutation timing. Two forms further aggravate waveform asymmetry and enhance low-order and non-characteristic harmonics under diode OC fault conditions. This effect analysis provides a more comprehensive basis for understanding diode OC fault responses in 12-pulse TRUs and supports the development of more robust diode OC fault diagnosis methods under non-ideal input voltage conditions.
1. Introduction
With the rapid development of electric propulsion, reliable power conversion has become increasingly important for electrical systems [1]. Transformer rectifier units (TRUs) remain one of the most representative and indispensable ac/dc conversion interfaces in safety-critical electrical systems due to their simple structure, high power density, and high reliability. In these applications, such as railways [2], shipboard [3], high voltage dc transmission [4], and aircraft [5,6], a TRU is required not only to provide stable dc output but also to maintain acceptable input current quality under demanding operating conditions [7]. Once a fault occurs, the operation can be distorted, resulting in input current harmonic deterioration and abnormal output voltage fluctuation. These effects may reduce output power in mild cases and threaten system safety and reliability in severe cases [8,9]. Therefore, fault behavior of TRUs and its influence on electrical responses deserve careful investigation.
Among various fault modes, a diode open-circuit (OC) fault in rectifier bridges is one of the most common and practically significant faults [10]. Unlike a short-circuit fault, which often triggers protective actions rapidly, a diode OC fault usually does not cause a catastrophic failure immediately. It interrupts the normal current conduction path, reconstructs the conduction sequence, and redistributes the conduction intervals of remaining diodes. As a result, the fault induces waveform distortion and harmonic redistribution on both the ac and dc sides. These responses are not only directly related to converter performance degradation but also provide important observable signatures for fault detection and health monitoring. Consequently, diode OC fault analysis is of considerable importance for both the reliability enhancement and fault diagnosis of TRUs.
In recent years, the fault analysis of a diode OC in TRUs has been conducted mainly as part of fault detection and diagnosis. Researchers have extensively analyzed current and voltage signals after a diode becomes open-circuited and obtained fault signatures through time- and frequency-domain analyses [11,12,13]. Current response-related features in the time domain include root mean square (RMS) [6], peak value [13] and waveform distortion. Frequency-domain current features, including harmonic amplitude variation and their corresponding ratios [14,15,16], the emergence of specific harmonic components [16], and the total harmonic distortion [16,17], have been analyzed. Rectified voltage can also effectively reflect the occurrence of diode OC faults. Typical features include the average value [6,13,18] and local distortion [17,19,20,21], as well as harmonic variations. These studies provide important technical support for detecting and diagnosing diode OC faults. Nevertheless, most of the available research is diagnostic-oriented, and fault analysis is usually introduced to explain specific diagnostic features, rather than to provide a unified mechanism-oriented analysis for the fault behavior.
Moreover, from a comprehensive analysis perspective, most existing studies on OC faults implicitly assume balanced input voltage; the effect of unbalanced input voltage on the diode OC fault has not been sufficiently revealed. However, in practical TRUs, unbalanced input voltage occurs due to unbalanced line impedance, poor connections, inconsistent transformer winding parameters, external disturbances in the power supply system [22,23,24] and other non-ideal conditions [25]. Such an imbalance destroys the symmetry of three-phase input voltages. When a diode OC fault occurs, unbalanced input voltage further affects fault responses. The underlying reason is that the diode conduction process is not completely fixed by topology alone. Conduction boundaries and conduction angles are also determined by the instantaneous relationship between the rectifier-side driving voltage and dc-side conduction requirement [26,27]. The effect degrades the dc output voltage quality of the TRU, injects undesirable harmonics into the upstream power supply system, and increases the electrical and thermal stresses imposed on the power devices. Without timely detection and protection, such adverse effects evolve into more severe failures and eventually cause damage to the TRU and the associated upstream and downstream equipment. Therefore, from the perspectives of fault severity and analysis completeness, it is very necessary to analyze the diode OC fault response under unbalanced input voltage.
This paper develops a conduction mechanism-oriented analysis for diode OC faults in TRUs under unbalanced input voltage. Unbalanced input voltage is categorized into two forms, namely, unequal magnitude and phase-shift deviation. Starting from the conduction boundaries and conduction angles, this paper analyzes how these two forms affect the conduction process and then explains how the resulting boundary migration and conduction interval redistribution act on current and voltage responses, which reshape the time-domain waveforms and frequency-domain harmonics under diode OC faults. The main contributions are summarized as follows:
- A conduction mechanism-oriented analysis was carried out to describe how unbalanced input voltage affects the diode conduction process under an OC fault in TRUs.
- The effects of unequal magnitude and phase-shift deviation on conduction boundary migration, conduction angle variation, waveform distortion, and harmonic distribution were clarified in a differentiated manner.
- The effects of unbalanced input voltage on current and rectified voltage responses under diode OC faults were analyzed in both the time and frequency domains, and the corresponding findings are further validated by the experiment.
The remainder of this paper is organized as follows. Section 2 presents the conduction boundary and conduction angle equations to reveal the mechanism by which unequal magnitude and phase-shift deviation affect the diode conduction process. Section 3 investigates the effect of unbalanced input voltage on the current response of a 12-pulse TRU under diode OC faults. Section 4 analyzes the effect of unbalanced input voltage on the rectified voltage response of a 12-pulse TRU under diode OC faults. Section 5 provides the experimental validation and discussion. Finally, Section 6 concludes this paper.
2. Mechanism of Conduction Boundaries and Conduction Angles Under Unbalanced Input Voltage
The conduction boundary and conduction angle equations are introduced in this section to reveal how unbalanced input voltage changes the conduction process. The essential reason is that unbalanced input voltage perturbs the diode conduction condition by modifying the instantaneous relationship between the rectifier-side driving voltage and the equivalent dc-side conduction threshold, thereby causing boundary migration and conduction angle variation. For analytical tractability, two assumptions are adopted. First, the forward voltage drop of each diode is treated as a constant and is denoted by . Second, the phase-shifting transformer is assumed to operate in the linear magnetic region. These assumptions allow the focus to remain on the conduction process changes induced by unbalanced input voltage, without introducing complications from nonlinear magnetic effects or device-level voltage drop variations.
2.1. Conduction Angle and Boundary Equation
In a TRU, a diode conducts when its instantaneous rectifier-side driving voltage exceeds the dc-side conduction threshold. For a given diode , i is the diode number; the conduction condition can be expressed as
where is the rectifier-side driving voltage, is the dc-side voltage including ripple, and is the commutation voltage associated with leakage inductance and current transfer. The right side of Equation (1) is collectively written as an equivalent dc-side conduction threshold, , such that the conduction condition is reformulated as
Accordingly, the conduction boundary equation of is defined by
Let and denote the turn-on and turn-off boundary angles of , respectively. The conduction angle is defined as
Equations (1)–(4) indicate that both the conduction boundary and the conduction angle are not fixed. They are determined by the instantaneous relationship between the rectifier-side driving voltage and the dc-side equivalent conduction threshold. Once either side of this relationship changes, the conduction boundary shifts accordingly, which, in turn, changes the conduction angle and redistributes the conduction intervals. When becomes open-circuited, its original conduction condition is no longer satisfied, and the corresponding diode conduction interval disappears, . Meanwhile, the remaining diodes reestablish their own conduction boundaries and conduction angles under the updated relationship between and .
2.2. Effect of General Disturbances on Conduction Boundaries and Conduction Angles
To provide a unified description of the effect of unbalanced input voltage on the conduction process under diode OC faults, let p denote a general parameter related to unbalanced input voltage. This parameter influences not only the rectifier-side driving voltage but also the dc-side equivalent conduction threshold through the rectification process. Accordingly, the conduction boundary equation of can be generalized as
For a around the balanced operating point, a first-order Taylor expansion can be used to qualitatively explain how the unbalanced input voltage shifts the conduction boundary. This is because the first-order term reflects the dominant trend of boundary migration, whereas the higher-order terms mainly affect the magnitude of the boundary shift under relatively large voltage unbalance. Therefore, Equation (5) can be expanded as
from which the corresponding conduction boundary shift is expressed as
Equation (7) shows that the effect of unbalanced input voltage is first manifested as a shift in the conduction boundary. Here, reflects the local sensitivity of the conduction condition to the electrical angle near the conduction boundary, whereas characterizes the strength with which the parameter p changes the boundary condition. Physically, when the conduction boundary equation slowly varies with respect to the angle, a given p produces a relatively large angular shift. When p strongly modifies the relative relationship between the driving voltage and the threshold, the resulting boundary migration becomes more significant.
The conduction angle is jointly determined by the turn-on and turn-off boundaries, and its variation can be written as
Equation (8) indicates that the parameter p changes the conduction angle through the combined migration of the turn-on boundaries and turn-off boundaries . Therefore, once the mechanism of a given parameter p related to unbalanced input voltage on the boundary equation is clarified, the conduction angle variation and the conduction interval redistribution can be inferred directly. It should be noted that the above derivation is based on a local first-order perturbation, which is sufficient to reveal the mechanism by which unbalanced input voltage alters the conduction boundary and conduction angle. This is because it is intended to describe the migration trend and sensitivity of the conduction boundary near the balanced operating point, rather than to provide a global closed-form solution for conduction intervals under arbitrarily large disturbances.
2.3. Effect of Unbalanced Input Voltage on Conduction Boundaries and Conduction Angles
Unequal magnitude and phase-shift deviation are treated as two independent parameters p. For diode , let the balanced rectifier-side driving voltage be characterized by amplitude and initial phase angle . Then under unequal magnitude, the rectifier-side driving voltage can be written as
whereas phase-shift deviation refers to the deviation of the initial phase angle from that under the balanced condition. Therefore, under phase-shift deviation , the rectifier-side driving voltage of can be written as
Substituting (9) and (10) into the conduction boundary Equation (5), and performing a first-order Taylor expansion at the balanced conduction boundary, the boundary shift caused by unequal magnitude can be expressed as
The boundary shift caused by phase-shift deviation can be expressed as
where denotes the balanced conduction boundary angle. Equations (11) and (12) reveal that the two forms of unbalanced input voltage affect the conduction process in different physical ways. Unequal magnitude changes the amplitude relationship between the rectifier-side driving voltage and the dc-side equivalent conduction threshold. In other words, it changes the relative voltage dominance near the conduction boundary, thereby causing the turn-on or turn-off instant to advance or delay. By contrast, phase-shift deviation changes the angular position of the rectifier-side driving voltage. Its primary effect is therefore to perturb the timing of the competition among rectifier-side driving voltages, which, in turn, shifts the conduction boundary and modifies the commutation sequence. Although these two forms act differently, they share a common consequence, that is, both of them produce conduction boundary migration, which further leads to conduction angle variation and conduction interval reconstruction.
Based on the operating principle of the TRU, any change in conduction intervals will generally be reflected in the time-domain waveforms of the winding currents and rectified voltage. In the frequency domain, these waveform variations further appear as changes in harmonic amplitude and spectrum distribution. The effect mechanism based on the conduction boundary and conduction angle established in this section provides the theoretical foundation for the rectifier-side current responses analysis in Section 3 and the rectified voltage responses analysis in Section 4.
3. Rectifier-Side Current Response Analysis Under Unbalanced Input Voltage
This section first introduces the general operation process of a 12-pulse TRU to clarify electrical signal transfer relationships, since 12-pulse TRUs are a widely used multi-pulse TRU topology and can clearly reflect the basic configuration of TRUs as well as the functional relationships among their internal parts. Then, with balanced input voltage taken as the reference case, the current waveforms and harmonic distributions under a single diode OC fault are analyzed. Furthermore, the effects of unequal magnitude and phase-shift deviation are examined separately. In this way, the distinct roles of unequal magnitude and phase-shift deviation in the current response can be more clearly identified.
3.1. Operation Analysis of 12-Pulse TRU
A typical 12-pulse TRU is shown in Figure 1, where a phase-shifting transformer is employed to adjust the magnitude and phase of the three-phase input voltage. Figure 2 shows the phasor diagram of the phase-shifting transformer. The phase voltages of secondary winding with star-connection are in phase with the primary winding phase voltages, whereas the phase voltages of secondary winding with delta-connection lag the primary winding phase voltages by . Therefore, the two sets of secondary windings provide phase-shifted voltages with an equal angular displacement of to rectifier bridges I and II. Each rectifier bridge consists of six diodes.
Figure 1.
The 12-pulse TRU topology.
Figure 2.
Phasor diagram of the phase-shifting transformer.
Assuming that the three-phase input voltages, which also serve as primary phase voltages of the phase-shifting transformer, are given by
where , and are the root mean square (RMS) of the three-phase input voltage, is the angular frequency. The jth () secondary phase voltages can be expressed as
where indicates the secondary winding with star-connection, and indicates the secondary winding with delta-connection. is the turns ratio between the primary winding and the jth secondary winding. Neglecting phase-shift transformer leakage inductance and the diode forward voltage drop, each rectifier bridge rectifies its secondary voltages into a six-pulse pulsating dc voltage. Rectified voltages can be written as
where , , and are the diode switching functions associated with secondary phase voltages , , and . They describe the conduction states of the corresponding diode pairs. Accordingly,
Next, rectified voltage is connected in series to form the total dc-side voltage for supplying the load, which can be expressed as
Furthermore, according to Kirchhoff’s current law and the ampere-turn balance principle, assuming the load current is constant and denoted as , the secondary currents of the phase-shifting transformer can be expressed as
According to the transformer current-transfer relationship, the primary currents are synthesized from two sets of secondary currents. They can be further derived as
where , , and are the corrected secondary winding currents determined by the winding configuration of the phase-shifting transformer. Equations (16), (18) and (19) show that each set of secondary currents is determined by diode conduction in the corresponding rectifier bridge. Primary current is determined by the superposition of secondary current contributions. Once the conduction boundary and conduction angle of any diode change, the diode switching function changes accordingly, resulting in primary and secondary currents being altered immediately.
3.2. Current Response Analysis Under Balanced Condition
Before analyzing the effect of unbalanced input voltage, it is first necessary to clarify the current response of a 12-pulse TRU under a diode OC fault with balanced input voltage, which serves as the baseline for subsequent comparisons because it isolates current redistribution caused solely by the diode OC fault. In this section, an OC fault of diode , as shown in Figure 1, is selected as a representative case for two reasons. First, although all diodes in a 12-pulse TRU may become open-circuited, a single diode OC fault is the most common in practice. Second, this section aims to analyze how unbalanced input voltage affects the current response under a diode OC fault, and, therefore, it is unnecessary to enumerate all possible OC fault cases.
Under balanced input voltages, when is open-circuited, the conduction condition of each diode is determined by Equations (1)–(3), and current waveforms of both primary and secondary winding are shown in Figure 3. In the middle subfigure of Figure 3, the positive-axis secondary current in the interval disappears. The missing current is then redistributed to the other upper diodes in the same bridge, and , which distort secondary current and over the affected interval. The distorted secondary currents , and give rise to an obvious asymmetry. In contrast, secondary currents , , and still follow their conduction sequence, as shown in the right subfigure of Figure 3. According to Equation (19), a OC fault further affects primary currents , , and in the interval , as shown in the left subfigure, where k is the turns ratio of primary windings and the first secondary windings. The segmented expression of primary currents in the affected interval is as follows:
Figure 3.
Windings’ current distribution under balanced input voltage when there is a OC fault.
Equation (20) and Figure 3 show that the positive-axis amplitude of is reduced from to compared to the healthy case (indicated by the dotted line), while the reduction in amplitude is redistributed to and in different intervals. In particular, the positive-axis amplitude of increases in the interval , whereas that of increases in . This means that the diode OC fault produces a current redistribution process in which the missing current of the faulty phase is transferred to the other phases.
The spectra of primary and secondary currents in Figure 3 are plotted in Figure 4a–c to provide a frequency-domain interpretation of the current redistribution caused by a OC fault under balanced input voltage. In Figure 4a, the total harmonic distortions (THDs) of primary currents , , and are 25.70%, 23.11%, and 22.84%, respectively. It can be seen that the spectrum of primary currents is no longer dominated by () harmonics. Instead, the dc component and low-order harmonics become dominant. More specifically, the spectrum of contains almost all harmonic orders except , whereas the spectra of and contain almost all harmonic orders except .
Figure 4.
Spectrum of the (a) primary currents , , and , (b) secondary currents , , and and (c) secondary currents , , and under balanced input voltage when there is a OC fault.
In addition, those non-characteristic harmonic amplitudes of are generally larger than those of and , which is consistent with the fact that the faulty diode belonging to the branch of rectifier bridge I affects the synthesis of primary current a. As the harmonic order increases, the harmonic amplitudes of all primary currents gradually decrease, and the difference between the harmonic amplitudes of and those of and decreases. The spectra of secondary currents , , and in Figure 4b exhibit more severe distortion than those of primary currents, indicating that the fault effect is strongest in the rectifier bridge where the faulty diode is physically located. In particular, the THDs of , and are 66.68%, 45.99% and 45.79%, respectively. From the spectrum distribution, it is clear that the dc component and low-order harmonics dominate in , and , rather than the () harmonics. The spectrum of contains almost all harmonic orders except , whereas the spectra of and contain almost all harmonic orders except . Another remarkable feature is that the amplitudes of specific even harmonics in are approximately twice those in and , although the harmonic amplitudes of all currents decrease gradually with increasing harmonic order. By contrast, the spectrum of secondary currents , , and shown in Figure 4c preserves () harmonics. The THDs of , , and are 29.49%, 29.60%, and 29.71%, respectively, which are significantly lower than those of secondary currents , , and . This indicates that rectifier bridge II is not completely unaffected by a OC fault, though its conduction sequence remains much closer to the healthy six-pulse rectifier bridge.
The above analysis verifies that changes in diode conduction angles and conduction intervals directly affect the secondary currents and are then transferred to primary currents through a phase-shift transformer, which can provide an explanation chain, namely, diode conduction boundary/angle variation → diode conduction redistribution → secondary current distortion → primary current distortion → harmonic redistribution.
3.3. Current Response Analysis Under Unequal Magnitude
When unequal magnitude is introduced, the current response is no longer determined only by a diode OC fault but also by the unequal magnitude dominance among the three-phase input voltages. Figure 5 shows that unequal magnitude reshapes the faulted current waveform caused by shifting diode conduction boundaries. Compared to Figure 3, the turn-on conduction boundary of secondary current is postponed from to , while the turn-off boundary is advanced from to . The conduction angle of diode decreases, while the conduction angles and of diodes and increase. A similar boundary migration can also be observed in secondary currents , and , where the balanced conduction boundaries at , , , and advance or delay by in a complementary manner. The conduction angles of diodes and decrease, and those of diodes and decrease, whereas those of diodes and increase.
Figure 5.
Windings’ current distribution under unequal magnitude when there is a OC fault.
This indicates that although rectifier bridge II is not directly faulted, its diode conduction angle is still perturbed by the effect of unequal magnitude. These variations are consistent with the analysis in Section 2; unequal magnitude causes the conduction boundaries to advance or delay and further leads to the increase or decrease in the corresponding conduction angles. These variations then propagate to the primary currents. As shown in Figure 5 compared with the balanced (dotted line), the local interval of primary currents , and narrows. This indicates that unequal magnitude amplifies diode OC fault behavior, intensifies the harmonic distortion of primary current and disrupts the inter-phase harmonic balance. In other words, unequal magnitude affects the current response by stretching or compressing the local intervals, aggravating current waveform asymmetry.
The effect of unequal magnitude on the current response is also clearly reflected in the frequency domain. Current spectra under unequal magnitude are shown in Figure 6a–c. Compared to Figure 4, the THDs of primary currents , and increase to 33.89%, 27.31% and 27.38%, respectively.
Figure 6.
Spectrum of the (a) primary currents , , and , (b) secondary currents , , and and (c) secondary currents , , and under unequal magnitude when there is a OC fault.
This indicates that unequal magnitude further aggravates the primary current distortion caused by a OC fault. In particular, the THD increase in is the most significant, showing that the current in the phase where the faulty diode is located is the most sensitive to unequal magnitude. Moreover, the dc component and low-order harmonics become even more pronounced, () harmonics of the three-phase currents are no longer equal, harmonics are introduced, and the difference in () harmonics among with and is enlarged.
The spectrum of secondary currents , and is shown in Figure 6b. The THDs of , and are 87.58%, 42.55%, and 42.80%, respectively. Compared to the balanced condition, the THD of increases further, and those of and decrease slightly. The secondary currents connected to the bridge where the faulty diode is located still exhibit the most severe distortion, and their spectra remain dominated by the dc component and low-order harmonics. A noteworthy feature is that harmonics become significantly enhanced, while the amplitudes of harmonics are no longer equal among the three-phase currents. This indicates that unequal magnitude breaks the inter-phase symmetry that exists under balanced conditions. By contrast, the THD of the secondary currents in , and in Figure 6c becomes 34.65%, 29.04% and 35.04%, respectively. Compared with Figure 4c, the distortion of and increases significantly. In addition, harmonics become noticeably weakened, while the participation of odd harmonics becomes more obvious, especially the third and fifth harmonics. In particular, the harmonics are especially prominent in and . This indicates that the healthy bridge is still substantially affected by unequal magnitude through the disturbed overall rectification process and the coupling introduced by the dc-side current path. In other words, unequal magnitude is able to propagate the fault-related spectrum disturbance from the faulty bridge to the healthy bridge and thereby reduce the harmonic symmetry.
Combining the above results it can be concluded that unequal magnitude affects the current response through conduction boundary migration and conduction angle redistribution. In the time domain, by changing the relative voltage dominance near the balanced commutation boundaries, unequal magnitude stretches some conduction intervals and compresses others, thereby altering the local interval widths and waveform symmetry. In the frequency domain, this process manifests itself as an enhancement of low-order harmonics, a growth of phase harmonic asymmetry. Therefore, the effect of unequal magnitude on the current response is not merely an aggravation of distortion, but rather a systematic redistribution of the harmonic distribution through the perturbation of the diode conduction process.
3.4. Current Response Analysis Under Phase-Shift Deviation
When phase-shift deviation is introduced, the current response of a OC fault is modified. As shown in Figure 7, compared to the balanced condition, the most prominent change is that current intervals shift to the left along the angular axis. This is because the initial phase angle of input voltage in Equation (13) is shifted to the left under phase-shift deviation, which changes the timing of voltage competition among three phases and therefore modifies diode conduction boundaries. The turn-on and turn-off conduction boundaries of shift leftward simultaneously, while the conduction angle remains unchanged. The turn-on conduction boundary of is shifted to the left by at , while that of is shifted to the left by at . As a result, the conduction angles and of diodes and decrease. This means that, under phase-shift deviation, the current redistribution caused by a OC fault is not as stretched or compressed under unequal magnitude but is shifted in angle in the same direction. The conduction boundaries of , and are shifted to different degrees, especially a significant shift at and . This confirms the analysis of Section 2 that phase-shift deviation affects the current response through conduction boundary migration. The above boundary migration is then transmitted to primary currents. Current intervals of , and shift leftward along the angular axis in different degrees, aggravating waveform asymmetry. Therefore, phase-shift deviation reshapes the current response by shifting current intervals in the same direction but to different degrees, thereby aggravating current waveform asymmetry.
Figure 7.
Windings’ current distribution under phase-shift deviation when there is a OC fault.
Figure 8a–c show current spectra under phase-shift deviation. The THDs of the primary currents , and are 28.18%, 20.88%, and 28.60%, respectively. Relative to the balanced THDs of 25.70%, 23.11%, and 22.84%, it can be seen that the distortions of and increase, whereas that of decreases slightly. Their spectra are still dominated by the dc component and low-order harmonics with weakened inter-phase symmetry. In particular, harmonics appear in , while harmonics become visible in and . In addition, the harmonics are no longer equal among the three phases. Another notable feature is that high-order 35th and 37th harmonics under balanced conditions shift toward 31st and 33rd. This indicates that phase-shift deviation does not affect all three-phase primary currents uniformly. Instead, it redistributes the harmonics among phases. The spectra of secondary currents , , and are shown in Figure 8b. The THDs are 66.57%, 42.61%, and 51.51%, respectively. Compared to the balanced condition, the THDs of and decrease slightly, whereas that of increases significantly. The spectra remain dominated by the dc component and low-order harmonics. does not contain harmonics, while harmonics become visible in and . Moreover, the approximate twofold relationship between the even-order harmonic amplitudes of and those of and , which was observed under the balanced condition, is no longer preserved. This result reflects that phase-shift deviation alters not only the magnitude of certain harmonics but also the inter-phase harmonic proportionality. As shown in Figure 8c, the THDs of , and are 27.32%, 28.97%, and 37.66%, respectively. Compared with the balanced condition, the asymmetry among the three phases increases noticeably. In addition, odd-order harmonics become more evident in all currents, but the inter-phase harmonics differ significantly. The 3rd and 5th components of are much more pronounced. The 9th, 15th, 23rd, and 29th harmonics of and are clearly higher than those of . These observations indicate that phase-shift deviation affects the healthy rectifier bridge through an enhancement of three-phase amplitude asymmetry.
Figure 8.
Spectrum of the (a) primary currents , , and , (b) secondary currents , , and and (c) secondary currents , , and under phase-shift deviation when there is a OC fault.
Therefore, the waveform and spectrum results indicate that the effect of phase-shift deviation is manifested in the time domain as an angular shift in current intervals. In the frequency domain, this effect does not lead to a uniform increase or decrease in harmonic amplitudes. Instead, it appears as a harmonics redistribution, together with a further weakening of inter-phase harmonic symmetry. Compared to those under unequal magnitude, unequal magnitude changes the current response by stretching or compressing the redistributed conduction intervals, whereas phase-shift deviation modifies the current response by shifting the angular positions of the redistributed conduction intervals. This time-domain difference is precisely the continuation of the two physical mechanisms established in Section 2. Nevertheless, judging from the frequency domain, both forms lead to harmonic redistribution and aggravate inter-phase asymmetry.
4. Rectified Voltage Response Analysis Under Unbalanced Input Voltage
Rectified voltage response analysis is conducted from the dc-side of the TRU, which can more intuitively describe the effect of unbalanced input voltage on TRU output quality. This section investigates rectified voltage response from both time and frequency domains under unequal magnitude and phase-shift deviation. The balanced condition is taken as the reference to provide a baseline against which the additional effects introduced by unequal magnitude and phase-shift deviation can be evaluated.
4.1. Voltage Response Analysis Under Balanced Condition
Under balanced conditions, rectified voltage response is determined solely by the diode OC fault itself. When diode is open-circuited, the pulsating dc voltage generated by rectifier bridge I no longer preserves the six-pulse waveform observed under healthy conditions in Figure 9a, but instead exhibits an evident local depression within the interval , as shown in Figure 10a. The output voltage of rectifier bridge II largely retains its original six-pulse pattern. According to Equation (17), the total output voltage is the series combination of and ; its waveform maintains a clear local notch and increased ripple in the interval of . This result indicates that the diode OC fault is already sufficient to destroy the ideal voltage pulse of the 12-pulse TRU and introduce observable voltage distortion.
Figure 9.
(a) Voltages , , and (b) their normalized spectrum of low-order harmonics relative to dc component under balanced input voltage when healthy.
Figure 10.
(a) Voltages , , and (b) their normalized spectrum of low-order harmonics relative to dc component under balanced input voltage when there is a OC fault.
To further quantify this effect in the frequency domain, the spectra of harmonics normalized to the dc component are shown in Figure 10b. The dc components of , and are 25.766 V, 11.532 V, and 14.233 V, respectively. Compared with the healthy condition in Figure 9b, where dc components are 29.029 V, 14.514 V, and 14.514 V, dc components of and decrease significantly, whereas that of remains almost unchanged. This comparison indicates that the reduction in total output voltage originates from the reduction in caused by the OC fault. Meanwhile, low-order harmonics of become more pronounced, and the harmonic distribution of is still dominated by the 6th harmonic. For the total output voltage , low-order harmonics are only partially eliminated because of the series superposition of the two rectifier bridges and the effect of the phase-shifting transformer.
4.2. Voltage Response Analysis Under Unequal Magnitude
Figure 11a shows the rectified voltage waveform under unequal magnitude. Compared with the balanced condition, evident low-frequency oscillations appear in , and , and the amplitudes of twelve pulses are no longer equal without phase displacement. This indicates that unequal magnitude not only changes local intervals associated with a OC fault but also reshapes the contribution of each pulse over the entire rectification cycle. Figure 11b shows that, under unequal magnitude, dc components of , and are 26.498 V, 12.042 V, and 14.456 V, respectively, increasing by 2.8%, 4.4% and 1.6%. This indicates that the rectified voltage of a bridge containing a faulty diode is more sensitive to unequal magnitudes. In addition, even-order harmonics, especially the second harmonic, are enhanced in , , and . This suggests that unequal magnitude affects not only a faulty rectifier bridge but also a healthy rectifier bridge. Compared with the balanced condition, unequal magnitude causes rectified voltage to exhibit obvious low-frequency oscillations. Although dc components of , and increase slightly, the most remarkable spectral effect is the emergence and enhancement of even-order harmonics, especially the second harmonic. This result confirms that the essential effect of unequal magnitude on the rectified voltage response lies in its disruption of amplitude symmetry, which not only aggravates the distortion of the fault-related rectified voltage but also extends the distortion to the rectified voltage of the healthy rectifier bridge.
Figure 11.
(a) Voltages , , and (b) their normalized spectrum of low-order harmonics relative to dc component under unequal magnitude when there is a OC fault.
4.3. Voltage Response Analysis Under Phase-Shift Deviation
The rectified voltage under phase-shift deviation also exhibits evident low-frequency oscillations in , and , as shown in Figure 12a. However, the oscillation details are different from those under unequal magnitude. Under phase-shift deviation, the angular displacement occurs in addition to the unequal amplitudes of the twelve pulses. As shown in Figure 12b, dc components of , and under phase-shift deviation are 26.290 V, 11.777 V, and 14.513 V, respectively. Compared with the balanced condition, the dc components of the three rectified voltages all increase by approximately 2%. This indicates that phase-shift deviation has a relatively uniform effect on the total output voltage and the two bridge output voltages. From the frequency-domain perspective, even-order harmonics appear in , which is similar to that under unequal magnitude. However, the ratio of the second harmonic to the fundamental is different from that under unequal magnitudes. Under unequal magnitude, this ratio is greater than 1, whereas under phase-shift deviation, it is less than 1. Overall, phase-shift deviation introduces low-frequency oscillations, slightly and uniformly increases dc components of , , and , and produces additional even-order harmonics. More importantly, the ratio of the second harmonic to the fundamental is clearly different from that under unequal magnitude, which provides a useful basis for distinguishing these two forms of unbalanced input voltage in the rectified voltage spectrum.
Figure 12.
(a) Voltages , , and (b) their normalized spectrum of low-order harmonics relative to dc component under phase-shift deviation when there is a OC fault.
5. Experimental Validation and Discussion
To verify the effectiveness and correctness of the theoretical analysis presented in Section 2, Section 3 and Section 4, a 12-pulse TRU experimental platform was established, as shown in Figure 13. Figure 1 was used as the circuit schematic and wiring diagram of the experimental platform. A phase-shifting transformer was employed to provide both step-down conversion and galvanic isolation. Its primary and secondary windings adopt a Yy0d11 configuration. The turns numbers of primary winding, star-connected secondary winding, and delta-connected secondary winding are 78, 5 and 8, respectively. The rectifier bridges were constructed using MBR40200PT diode modules manufactured by ASEMI (Asemi Technology Co., Ltd., Shenzhen, China). The dc-side filter capacitor bank consists of three 220 F capacitors connected in parallel. To suppress dc-side inrush current, a 0.1 mH inductor is connected in series at the rectifier output. The main system parameters are summarized in Table 1, where 1.4 is treated as a purely resistive load.
Figure 13.
Experimental of the 12-pulse TRU.
Table 1.
System parameters of experimental 12-pulse TRU.
In the experiments, unbalanced input voltages were generated by a programmable three-phase ac power source, so that the voltage amplitude and phase angle of each phase could be independently adjusted. To realize unequal magnitude and phase-shift deviation, the detailed experimental settings and measured signals are listed in Table 2. Under the balanced condition, , , , healthy, the OC fault, and the OC fault were tested, respectively. Under unequal magnitude, , , , and and OC faults were tested, respectively. Under phase-shift deviation, , , , and and OC faults were also tested, respectively. For all conditions, the measured signals include primary currents , , and , secondary currents , , , , , and , rectifier voltages and , and the total dc output voltage . In addition, signal acquisition was accomplished by a sampling circuit with a sampling frequency of 20 kHz. To reduce the influence of measurement uncertainty, the steady-state waveforms are repeatedly collected under the same conditions and then averaged. In this way, the distinct effects of unequal magnitude and phase-shift deviation on the diode open-circuit fault behavior of the 12-pulse TRU can be experimentally examined.
Table 2.
Experimental settings and measured signals under different conditions.
5.1. Verification of Diode OC Fault
To verify current and voltage responses under healthy conditions, the OC fault condition and OC fault, as shown in Figure 1, are first analyzed under balanced input voltage. Figure 14 presents the experimental current results under healthy, OC fault and OC fault conditions. As shown in Figure 14a, under healthy conditions, primary currents , , and remain symmetrical, with equal amplitudes and regular phase displacement. Secondary currents , , and and , , and , shown in Figure 14b,c, exhibit expected segmented conduction. After becomes open-circuited, as shown in Figure 14d–f, obvious local distortion appears in primary currents , , and , the positive-axis amplitude of decreases, and the conduction intervals are no longer symmetrical. Secondary currents , , and exhibit significant distortion. In particular, the conduction interval related to in disappears and is compensated by and . Secondary currents , , and remain close to those of a six-pulse rectifier bridge, although they are still affected by a OC fault. Similarly, after becomes open-circuited, as shown in Figure 14g–i, primary currents , , and also exhibit obvious local distortion, the positive-axis amplitude of decreases, and the conduction intervals become asymmetrical. Secondary currents , , and remain close to those of a six-pulse rectifier bridge. In contrast, secondary currents , , and exhibit significant distortion. Specifically, the conduction interval related to in disappears and is compensated by and . These results indicate that a diode OC fault causes current distortion, and secondary currents connected to the rectifier bridge containing the faulty diode exhibit the most pronounced distortion. The healthy rectifier bridge still maintains its current waveform, with only slight amplitude fluctuations.
Figure 14.
Experimental waveforms of (a) primary currents , , and under healthy conditions, (b) secondary currents , , and under healthy conditions, (c) secondary currents , , and under healthy conditions, (d) primary currents , , and under a OC fault, (e) secondary currents , , and under a OC fault, (f) secondary currents , , and under a OC fault, (g) primary currents , , and under a OC fault, (h) secondary currents , , and under a OC fault, and (i) secondary currents , , and under a OC fault.
The frequency-domain results under and OC faults are shown in Figure 15. Higher-order harmonics are not displayed because the non-ideal characteristics of the devices, together with the dc-side filter, suppress the higher-order harmonic components to below approximately 0.5%. As can be seen from Figure 15a, under a OC fault, the THDs of primary currents , and are 23.99%, 16.77%, and 15.36%, respectively, which show an uneven distribution among the three phases, while the a phase exhibits the most severe distortion. In addition, although the harmonics are still retained, they are no longer the dominant spectral components. Instead, the dc component and low-order harmonics become dominant after a diode OC fault. As shown in Figure 15b, the THDs of , and reach 60.73%, 34.36%, and 35.91%, respectively, with being the largest. The relative amplitudes of harmonics do not change drastically, but they are no longer the main components in the spectrum. Similar to primary currents, the newly generated dc component and low-order harmonics replace them as dominant harmonics. Secondary currents , and in Figure 15c have THDs of 23.70%, 23.31%, and 24.98%, respectively, which are closer to those under healthy conditions. Their spectra still maintain strong harmonics. However, the dc components and low-order harmonics inevitably appear. Current frequency-domain results under a OC fault are shown in Figure 15d–f. The THDs of primary currents , , and are 18.81%, 19.99%, and 13.73%, respectively, indicating evident distortion, among which exhibits the most severe distortion. Dc components and low-order harmonics are introduced into , , and . For secondary currents, contrary to a OC fault, the THDs of , , and are 24.76%, 23.47%, and 23.32%, respectively, and their spectra contain only a small dc component and low-order harmonics. By contrast, the THDs of , , and reach 57.56%, 32.86%, and 34.39%, respectively, with being the largest. The dominant role of the harmonics is replaced by the dc component and low-order harmonics.
Figure 15.
Spectrum of the experimental current waveforms: (a) primary currents , , and under a OC fault; (b) secondary currents , , and under a OC fault; (c) secondary currents , , and under a OC fault; (d) primary currents , , and under a OC fault; (e) secondary currents , , and under a OC fault; and (f) secondary currents , , and under a OC fault.
In addition, experimental current results and theoretical results were compared. Current waveforms in Figure 14b,d,f show good consistency with the theoretical currents in Figure 3. The main differences are that experimental waveforms contain smoother commutation edges, amplitude fluctuations and small oscillations. The key fault-induced features, including the disappearance of the faulty diode conduction interval and the distortion of primary currents and secondary currents connected to the bridge containing the faulty diode, are consistent between the theoretical analysis and experimental results. The experimental current spectra in Figure 15a–c are also shown to be basically consistent with the theoretical current spectra in Figure 4. The differences are that the theoretical exceptions of and harmonics no longer strictly hold, harmonics of the three-phase primary currents are no longer equal, and the same phenomenon is also observed for the harmonics of the three-phase secondary currents. These differences arise from the effects of phase-shifting transformer leakage inductance, diode voltage drops, winding resistance, and other non-ideal factors in the practical 12-pulse TRU.
Overall, the effect of a diode OC fault on the current response can be summarized as follows. First, a diode OC fault causes conduction interval disappearance corresponding to a faulty diode, and this is compensated by the conduction of diodes in other phases with the same polarity bridge arm of the same rectifier bridge. Second, the diode OC fault causes the most severe distortion in secondary currents connected to the rectifier bridge containing the faulty diode, while the healthy rectifier bridge is also affected to some extent. The superposition of these distortions in primary currents leads to an amplitude decrease in the current associated with the faulty diode, while the other primary currents exhibit distortion for compensation. Third, in the frequency domain, a diode OC fault weakens harmonic features and introduces dominant dc components and low-order harmonics. Moreover, harmonic amplitudes decrease with increasing harmonic order. In addition, certain harmonic amplitudes differ among three-phase currents, which is the combined result of the diode OC fault and the incomplete symmetry of system parameters.
The experimental results of rectified voltages under healthy, OC fault and OC fault conditions are shown in Figure 16. Under healthy conditions, Figure 16a shows that remains around 28 V with 12 pulses, and are both around 14 V, and each exhibits a six-pulse waveform with interleaved phases. It indicates that the two rectifier bridges contribute almost equally to the output. These waveforms reflect the normal pulse–superposition relationship of a healthy 12-pulse TRU. After becomes open-circuited, as shown in Figure 16b, exhibits an obvious local voltage notch, and largely preserves its original six-pulse waveform. Since is the series combination of and , the healthy rectifier bridge provides partial compensation, but the total output voltage still shows a clear local notch together with an observable reduction in its average value. Similarly, after is open-circuited, rectified voltages show similar changes. The position of the local voltage notch corresponds to the position of the faulty diode, which is determined by the alternating output of two rectifier bridges in the 12-pulse TRU.
Figure 16.
Experimental waveforms of (a) voltages , , and under healthy conditions, (b) voltages , , and under a OC fault, and (c) rectified voltages , , and under a OC fault.
Table 3 shows the dc components and the first 15 harmonics of , and under healthy conditions, a OC fault and a OC fault. When is open-circuited, dc components of , and under a OC fault are 25.594 V, 11.437 V and 14.166 V, respectively. Compared with those under healthy conditions, namely, 28.17 V, 14.092 V, 14.087 V, decreases by 9.1%, and decreases by 18.8%, while remains almost unchanged. In the frequency domain, low-order harmonics of and increase sharply after a OC fault. For example, the fundamental and second harmonic of increase to 4.795 V and 3.793 V, respectively, and those of increase to 4.944 V and 3.878 V, respectively. The low-order harmonics of increase only slightly, whereas they are almost negligible under healthy conditions. When becomes open-circuited, dc components of , , and are 25.588 V, 14.168 V, and 11.422 V, respectively. Compared with healthy conditions, decreases by 9.2%, and decreases by 18.9%, whereas remains almost unchanged. In the frequency domain, low-order harmonics of and increase sharply. The fundamental and second harmonics of increase to 4.668 V and 3.393 V, respectively, and those of increase to 4.79 V and 3.506 V, respectively, while low-order harmonics of increase only slightly. These results indicate that the diode OC fault destroys original pulses and introduces low-order distortion into the voltage. In addition, the 6th harmonic is worthy of particular attention. The 6th harmonic of increases from 0.006 V under healthy conditions to 0.174 V under a OC fault and 0.173 V under a OC fault. The 6th harmonic of decreases from 1.35 V to 1.146 V and 1.281 V, respectively, while that of decreases from 1.339 V to 1.146 V and 1.111 V, respectively. Similar variations can also be observed in the 12th harmonic. These results show that a diode OC fault weakens the original characteristic harmonics of rectified voltages and increases the non-characteristic harmonics, especially low-order harmonics.
Table 3.
The dc component and first 15 harmonics of the experimental voltage waveforms under healthy, OC fault and OC fault conditions.
Compared with the theoretical analysis in Section 4.1, the experimental results in Figure 16a agree well with the theoretical results in Figure 9a, and the experimental results in Figure 16b also agree well with the theoretical results in Figure 10a. Under healthy conditions, two rectifier bridges generate six-pulse voltages with a phase difference of , and the total output voltage forms a 12-pulse dc waveform. After a diode OC fault occurs, the local notch of the total output voltage is mainly caused by the rectifier voltage of the bridge containing the faulty diode. Specifically, when is open-circuited, the local notch of is caused by , whereas when is open-circuited, the local notch of is caused by . In addition, compared with the theoretical dc components of , , and under healthy conditions and a OC fault, shown in Figure 9b and Figure 10b, the experimental dc components are slightly lower. These differences are caused by practical circuit losses. Furthermore, experimental results in the frequency domain under a OC fault are consistent with the theoretical analysis, although there are numerical differences, which are normal deviations between the simulation and experiment results. Specifically, the original characteristic harmonics are weakened, and low-order harmonics are introduced, with the rectified voltage related to a faulty diode being more pronounced.
5.2. Verification of Effect of Unbalanced Input Voltage
5.2.1. Verification of Effect of Unbalanced Input Voltage on Current Response
Figure 17 presents the experimental currents under unequal magnitude and phase-shift deviation when is open-circuited, where the solid lines represent the results under an unbalanced input voltage, and the dashed lines represent those under a balanced input voltage. Experimental currents under unequal magnitudes are shown in Figure 17a,c,e. According to the theoretical analysis in Section 2, unequal magnitudes of input voltages directly change the voltage dominance at conduction boundaries, causing distortion in both primary and secondary currents. Specifically, the amplitudes of all three-phase currents decrease to different extents, among which the reduction in the positive-axis amplitude of phase c is the most obvious, while the reduction in the negative-axis amplitude of phase a is the most significant. In addition, within the interval where amplitude decreases, becomes locally narrower, accompanied by partial compensation from the adjacent currents and . Similar changes can also be observed in secondary currents , , and and , , and . Experimental currents under phase-shift deviation are shown in Figure 17b,d,f. The distorted currents caused by a OC fault shift along the time axis, which confirms the analysis in Section 2 that phase-shift deviation moves the angular positions of driving voltages and modifies the commutation instants, causing phase shifts of different extents.
Figure 17.
OC fault experimental waveforms of (a) primary currents , , and under the unequal magnitude condition, (b) primary currents , , and under the phase-shift deviation condition, (c) secondary currents , , and under the unequal magnitude condition, (d) secondary currents , , and under the phase-shift deviation condition, (e) secondary currents , , and under the unequal magnitude condition, and (f) secondary currents , , and under the phase-shift deviation condition.
The effects of two forms of unbalanced input voltage on the current response under a OC fault are further analyzed in the frequency domain, as shown in Table 4 and Figure 18. Under unequal magnitude, the THDs of , , and increase to 27.02%, 18.16%, and 17.09%, respectively. This indicates that unequal magnitude aggravates the distortion of primary currents, especially in phase a, which is the phase with the reduced input voltage magnitude. The THD of increases to 70.06%, whereas the THDs of and decrease to 31.61% and 34.16%, respectively. Compared with the balanced scenario, these changes correspond to approximately +15.4%, −8.0%, and −4.9%, respectively. The THDs of and increase to 26.54% and 26.77%, respectively, while the THD of decreases to 20.79%. These results indicate that unequal magnitude intensifies the inter-phase imbalance of three-phase currents and confirm the high sensitivity of the bridge containing the faulty diode to unequal magnitude. Under phase-shift deviation, the THD of increases from 23.99% under the balanced condition to 25.98%, whereas the THDs of and remain almost unchanged from 16.77% and 15.36%, respectively. The THD of slightly increases from 60.73% to 61.68%, the THD of decreases from 34.36% to 31.32%, and the THD of increases significantly from 35.91% to 42.25%. The THDs of , , and change from 23.70%, 23.31%, and 24.98% to 19.76%, 23.05%, and 33.36%, respectively, indicating that phase-shift deviation aggravates the imbalance among three-phase currents.
Table 4.
The THDs of primary and secondary currents when there is a OC fault.
Figure 18.
Current spectrum of OC fault experimental waveforms under different conditions: (a) primary currents , , and under unequal magnitude; (b) primary currents , , and under phase-shift deviation; (c) secondary currents , , and under unequal magnitude; (d) secondary currents , , and under phase-shift deviation; (e) secondary currents , , and under unequal magnitude; and (f) secondary currents , , and under phase-shift deviation.
The detailed current spectral distributions under two forms of unbalanced input voltage are further analyzed. Current spectra under unequal magnitude are shown in Figure 18a,c,e. In Figure 18a, the spectra of , , and are still dominated by the dc components and low-order harmonics, although the dc components decrease. The inter-phase differences in specific low-order harmonics become more pronounced. For example, 2nd, 5th, 9th, and 11th harmonics of are much larger than those of and . In addition, 2nd, 3rd, 5th, 6th, 8th, 9th, 11th, and 12th harmonics of increase significantly. Among them, harmonics deserve particular attention because they are weak under balanced conditions. As shown in Figure 18c, the spectra of , , and are also dominated by the dc components and low-order harmonics. The dc components decrease, while the inter-phase differences in specific low-order harmonics become more evident. In addition, harmonics of are significantly enhanced. As shown in Figure 18e, the main spectra of , , and are harmonics, but these harmonics are accompanied by aggravated inter-phase imbalance and significant increases in 3rd, 9th, and 15th harmonics. These results indicate that unequal magnitude does not change the dominance of dc components and low-order harmonics caused by a diode OC fault, but it aggravates the inter-phase imbalance of all three-phase currents and significantly increases harmonics. Current spectra under phase-shift deviation are shown in Figure 18b,d,f. As shown in Figure 18b, the spectra of , , and are dominated by the dc components and low-order harmonics, showing an aggravated inter-phase imbalance and a significant increase in harmonics of three-phase currents. Similar variations can also be observed in , , and and , , and , as shown in Figure 18d,f.
The above experimental results agree well with the theoretical analysis in Section 3.3 and Section 3.4, from which the following conclusions can be drawn. First, both unequal magnitude and phase-shift deviation affect secondary currents, both connected to the rectifier bridge containing the faulty diode and those connected to the healthy rectifier bridge, and two effects are superimposed and reflected in primary currents. Second, in the time domain, unequal magnitude causes decreases in the amplitudes of both primary and secondary currents, and the current associated with the phase of unequal magnitude exhibits local narrowing. Under phase-shift deviation, primary and secondary currents mainly exhibit waveform shifts. These phenomena are determined by their effect mechanisms. Third, from the frequency domain, two forms of unbalanced input voltage aggravate the inter-phase imbalance of three-phase currents and significantly increase harmonics. Moreover, the current distortion associated with the rectifier bridge containing the faulty diode is the most sensitive to two forms of unbalanced input voltage.
To verify whether the position of the faulty diode changes the effect of unbalanced input voltage on the current response, Figure 19 presents the experimental currents under unequal magnitude and phase-shift deviation when is open-circuited. Compared with Figure 17 for a OC fault, the detailed waveform of the experimental currents is different; however, the effects of unequal magnitude and phase-shift deviation on the current response remain consistent, indicating that these effects are not the result of a specific condition but are generally present in the 12-pulse TRU. Table 5 and Figure 20 present the frequency-domain results. Under unequal magnitude, the THDs of and increase to 24.45% and 15.56%, respectively, whereas the THD of decreases to 18.36%. The THD of increases to 30.73%, while the THDs of and decrease to 20.60% and 21.57%, respectively. The THDs of and increase to 62.63% and 36.96%, respectively, whereas the THD of decreases to 29.67%. Under phase-shift deviation, the THDs of and increase to 21.47% and 15.80%, respectively, while the THD of decreases to 18.36%. The THD of remains almost unchanged, the THD of decreases to 20.88%, and the THD of increases to 30.28%. The THD of decreases to 50.25%, whereas the THDs of and increase to 33.16% and 41.15%, respectively. These results indicate that, under a OC fault, unequal magnitude and phase-shift deviation aggravate the imbalance among three-phase currents. Figure 20a,c,e and Figure 20b,d,f show the current spectra under unequal magnitude and phase-shift deviation, respectively. Compared with Figure 15d–f under balanced conditions, the spectra exhibit aggravated inter-phase imbalance of three-phase currents and a significant increase in harmonics. In summary, these results further verify that the effects of two forms of unbalanced input voltage on the current response are generally present in the 12-pulse TRU. Moreover, the current with the most severe distortion corresponds to the position of the faulty diode. Specifically, under a OC fault, the most significant effect of the two forms of unbalanced input voltage appears in secondary currents connected to rectifier bridge I, whereas under a OC fault, the most significant effect appears in secondary currents connected to rectifier bridge II.
Figure 19.
OC fault experimental results of (a) primary currents , , and under unequal magnitude, (b) primary currents , , and under phase-shift deviation, (c) secondary currents , , and under unequal magnitude, (d) secondary currents , , and under phase-shift deviation, (e) secondary currents , , and under unequal magnitude, and (f) secondary currents , , and under phase-shift deviation.
Table 5.
The THDs of primary and secondary currents when there is a OC fault.
Figure 20.
Current spectrum of OC fault experimental waveforms under different conditions: (a) primary currents , , and under unequal magnitude; (b) primary currents , , and under phase-shift deviation; (c) secondary currents , , and under unequal magnitude; (d) secondary currents , , and under phase-shift deviation; (e) secondary currents , , and under unequal magnitude; and (f) secondary currents , , and under phase-shift deviation.
5.2.2. Verification of Effect of Unbalanced Input Voltage on Voltage Vesponse
Figure 21 shows experimental rectified voltages under unequal magnitude and phase-shift deviation when and are open-circuited separately. Compared with the balanced condition in Figure 16, two forms of unbalanced input voltage modify the rectified voltage response, but their effect mechanisms and voltage response are different. When is open-circuited, as shown in Figure 21a, under unequal magnitude, and exhibit a local notch caused by a OC fault, while low-frequency oscillations become more pronounced. Obvious low-frequency oscillations also appear in , indicating that unequal magnitude aggravates the rectified voltage distortion of both the rectifier bridge containing the faulty diode and the healthy rectifier bridge. Under phase-shift deviation, as shown in Figure 21b, , , and also exhibit local notch and low-frequency oscillations. Compared with unequal magnitude, the voltage decrease is smaller. When is open-circuited, the waveform distortions under two forms of unbalanced input voltage are similar, except that the positions of the local notches are different, which is caused by the alternating conduction of diodes in the two rectifier bridges.
Figure 21.
Experimental waveforms of (a) rectified voltages , , and under unequal magnitude when there is a OC fault. (b) Rectified voltages , , and under phase-shift deviation when there is a OC fault. (c) Rectified voltages , , and under unequal magnitude when there is a OC fault. (d) Rectified voltages , , and under phase-shift deviation when there is a OC fault.
Table 6 and Table 7 present frequency-domain results of the rectified voltages under unequal magnitude and phase-shift deviation when and are open-circuited, respectively. As shown in Table 6, when is open-circuited, the dc components of , , and under unequal magnitude are 22.995 V, 10.670 V, and 12.334 V, respectively. Compared with 25.594 V, 11.437 V, and 14.166 V under the balanced condition in Table 3, they decrease by approximately 10.2%, 6.7%, and 12.9%, respectively. This indicates that unequal magnitude reduces all three voltages. In the frequency domain, unequal magnitude shifts the harmonic distribution toward low-order components, especially enhancing the 2nd and 4th even-order harmonics. The second harmonic of increases from 3.793 V under the balanced condition to 6.533 V, and the fourth harmonic increases from 0.916 V to 1.209 V, increasing by approximately 72.2% and 32%, respectively. The second harmonic of increases from 3.878 V to 4.732 V. The second harmonic of increases significantly from 0.232 V to 1.823 V, and the fourth harmonic of increases from 0.134 V to 0.602 V. Therefore, the main spectral effect of unequal magnitude is the enhancement of low-order even harmonics. Under phase-shift deviation, the dc components of , , and are 25.109 V, 11.272 V, and 13.846 V, respectively, decreasing by approximately 1.9%, 1.4%, and 2.3%. The second harmonic of reaches 6.845 V, increasing by 80.5%. The second and fourth harmonics of reach 4.455 V and 1.164 V, respectively, increasing by 14.9% and 28.8%. The second and fourth harmonics of reach 3.049 V and 0.563 V, respectively. This indicates that phase-shift deviation also shifts the harmonic distribution toward low-order components, especially increasing the 2nd and 4th harmonics. In addition, the effects of unequal magnitude and phase-shift deviation on the voltage response are more prominently reflected in low-order even harmonics, increasing the rectified voltage from the healthy bridge.
Table 6.
The dc component and first 15 harmonics of the experimental voltage waveforms under unequal magnitude and phase-shift deviation when there is a OC fault.
Table 7.
The dc component and first 15 harmonics of the experimental voltage waveforms under unequal magnitude and phase-shift deviation when there is a OC fault.
When is open-circuited, the effects of unequal magnitude and phase-shift deviation on the voltage response are basically consistent with those observed under a OC fault. As shown in Table 7, under unequal magnitude, the dc components of , , and are 22.766 V, 12.511 V, and 10.258 V, respectively. Compared with 25.588 V, 14.168 V, and 11.422 V under the balanced condition in Table 3, they decrease by approximately 11%, 11.7%, and 10.2%, respectively. This indicates that unequal magnitude reduces all three voltage components. In addition, unequal magnitude shifts the harmonic distribution toward low-order components, especially enhancing the 2nd and 4th even-order harmonics. The second harmonic of increases from 3.393 V under the balanced condition to 5.253 V, increasing by approximately 54.8%. The second harmonic of increases from 0.268 V to 1.788 V, and the fourth harmonic increases from 0.151 V to 0.299 V. The second harmonic of increases significantly from 3.506 V to 3.823 V. Under phase-shift deviation, the dc components of , , and are 24.184 V, 13.835 V, and 10.351 V, respectively, decreasing by approximately 5.5%, 2.4%, and 9.4%. In the frequency domain, the second harmonic of reaches 6.845 V, corresponding to an increase of 80.5%. The second and fourth harmonics of reach 4.455 V and 1.164 V, respectively, corresponding to increases of 14.9% and 28.8%. The second and fourth harmonics of reach 3.049 V and 0.563 V, respectively. This indicates that phase-shift deviation shifts the harmonic distribution toward low-order components, especially increasing the 2nd and 4th harmonics. These results are consistent with the effects of two forms of unbalanced input voltage on the voltage response under a OC fault.
In summary, although unequal magnitude and phase-shift deviation affect the rectified voltage response through different physical routes, their differences in the time-domain waveforms are mainly reflected in the different positions of the local depressions, which are related to the alternating conduction of the diodes in the two rectifier bridges. In the frequency domain, the effects of the two forms of unbalanced input voltage are consistent. Specifically, both unequal magnitude and phase-shift deviation reduce all voltage components and enhance low-order even harmonics, with the most significant increase in even-order harmonics appearing in the healthy rectifier bridge. These experimental results confirm the theoretical analysis in Section 4.
6. Conclusions
This paper investigated the effect of unbalanced input voltage on current and voltage responses under diode OC faults in 12-pulse TRUs. A conduction-oriented effect mechanism was established to reveal how unequal magnitude and phase-shift deviation modify diode conduction boundaries, conduction angles, and, consequently, current and voltage responses. The results are generalized from three aspects. First, for the effect mechanism, unequal magnitude changes the relative voltage dominance near the conduction boundaries, resulting in the stretching or compression of conduction intervals. Phase-shift deviation changes the angular positions of the driving voltages and modifies the commutation timing. Second, in the time domain, unequal magnitude aggravates the non-uniform distortion of currents and voltages, leading to an amplitude decrease and phase shift in the current and local voltage notch. Phase-shift deviation causes shifts in the local voltage notch position and current intervals. Third, in the frequency domain, both unequal magnitude and phase-shift deviation aggravate the harmonics asymmetry of three-phase currents, especially the increase in 3n harmonics. For voltage response, they reduce the dc components of voltages and shift harmonics toward lower-order, especially enhancing 2nd and 4th harmonics. In addition, these quantitative feature changes are more obvious in faulty diode position-related currents and voltages. It should be noted that the conclusions are applicable to 12-pulse TRUs with similar structures and provide a valuable reference for more complex multi-pulse TRUs. Finally, future work will focus on diode OC fault detection and protection under unbalanced input voltage. On the one hand, based on the current and voltage responses revealed in this study, fault feature extraction and identification methods will be investigated. On the other hand, diode OC fault protection strategies considering the effect of unbalanced input voltage will be further explored to improve the reliability and safety of TRUs under complex power supply fields.
Author Contributions
Conceptualization, T.W.; methodology, T.W. and F.D.; validation, T.W. and F.D.; formal analysis, T.W.; investigation, T.W.; resources, X.Z. and W.L.; data curation, T.W.; writing—original draft preparation, T.W.; writing—review and editing, T.W. and F.D.; visualization, T.W.; supervision, X.Z. and W.L.; project administration, X.Z.; funding acquisition, F.D. and X.Z. All authors have read and agreed to the published version of the manuscript.
Funding
This research was funded in part by the Fundamental Research Funds for the Central Universities under Grant D5000250171.
Data Availability Statement
All data generated or analyzed during this study are included in this published article.
Conflicts of Interest
The authors declare no conflicts of interest.
References
- Deng, F.; Li, X.; Qi, Y.; Yao, W.; Lei, T.; Li, W.; Zhang, X. Decentralized Power Allocation Strategy for Fuel Cell/Battery/Ultracapacitor Hybrid Power Systems in Electric Propulsion Aircraft. IEEE Trans. Ind. Electron. 2026. Early Access. [Google Scholar] [CrossRef] [Scilit]
- An, B.; Li, Y.; Xiao, H.; Xie, B.; Wang, P.; Wang, M.; Luo, L. Magnetic-integrated multipulse rectifier transformer with a tight impedance equalizing strategy for power quality improvement of DC traction power supply system. IEEE Trans. Ind. Electron. 2019, 67, 6270–6279. [Google Scholar] [CrossRef] [Scilit]
- An, B.; Li, Y.; Xie, B.; Xiao, H.; Zuo, W.; Luo, L.; Cao, Y. A new DC multipulse integrated shipboard power supply system and performance analysis referring to transformer noninteger turns ratio deviation. IEEE Trans. Power Electron. 2020, 36, 353–363. [Google Scholar] [CrossRef] [Scilit]
- Mon-Nzongo, D.L.; Ipoum-Ngome, P.G.; Jin, T.; Song-Manguelle, J. An improved topology for multipulse AC/DC converters within HVDC and VFD systems: Operation in degraded modes. IEEE Trans. Ind. Electron. 2017, 65, 3646–3656. [Google Scholar] [CrossRef] [Scilit]
- Wang, S.; Ruan, X.; He, Y. Unified small-signal impedance modeling and analysis of multi-pulse rectifier units for more electric aircraft. IEEE Trans. Power Electron. 2024, 39, 8610–8621. [Google Scholar]
- Xiang, Y.; Liu, F.; Li, Z. Fault diagnosis for transformer rectifier unit on more-electric aircraft. In Proceedings of the 2022 IEEE 5th International Electrical and Energy Conference (CIEEC); IEEE: Piscataway, NJ, USA, 2022; pp. 4039–4044. [Google Scholar]
- Du, Q.; Gao, L.; Li, Q.; Liu, W.; Yin, X.; Meng, F. Harmonic Reduction Methods at DC Link of Series-Connected Multi-Pulse Rectifiers: A Review. IEEE Trans. Power Electron. 2022, 37, 3143–3160. [Google Scholar]
- Deng, F.; Yao, Z.; Li, X.; Yao, W.; Lei, T.; Li, W.; Zhang, X. Efficiency-Enhanced Distributed Aggregated Power Management for Multistack Fuel Cell Hybrid Propulsion Systems in Electric Aircraft. IEEE Trans. Aerosp. Electron. Syst. 2025, 61, 15381–15394. [Google Scholar] [CrossRef] [Scilit]
- Deng, F.; Li, X.; Yao, W.; Lei, T.; Li, W.; Zhang, X. Distributed Power Management Strategy for Multistack Fuel Cell Systems in Electric Propulsion Aircraft with Efficiency Reinforcement. IEEE Trans. Aerosp. Electron. Syst. 2025, 61, 5659–5668. [Google Scholar]
- Iannuzzo, F.; Abbate, C.; Busatto, G. Instabilities in Silicon Power Devices: A Review of Failure Mechanisms in Modern Power Devices. IEEE Ind. Electron. Mag. 2014, 8, 28–39. [Google Scholar] [CrossRef] [Scilit]
- Li, W.; Liu, W.; Wu, W.; Zhang, X.; Gao, Z.; Wu, X. Fault diagnosis of star-connected auto-transformer based 24-pulse rectifier. Measurement 2016, 91, 360–370. [Google Scholar]
- Du, Q.; Fang, Z.; Gao, L.; Li, Q.; Li, F.; Meng, F. Open-Phase Fault Research on the Parallel-Connected 40-Pulse Rectifier with Multioutput Auto-Connected Phase-Shifting Transformer. IEEE J. Emerg. Sel. Top. Power Electron. 2023, 11, 4108–4118. [Google Scholar]
- Lin, Y.; Ge, H.; Chen, S.; Pecht, M. Two-level fault diagnosis RBF networks for auto-transformer rectifier units using multi-source features. J. Power Electron. 2020, 20, 754–763. [Google Scholar]
- Lee, J.U.; Baek, S.W.; Cho, K.Y.; Kim, H.W. Fault detection of three phase diode rectifier based on harmonic ratio of DC-link voltage ripples. In Proceedings of the 2017 IEEE 12th International Conference on Power Electronics and Drive Systems (PEDS); IEEE: Piscataway, NJ, USA, 2017; pp. 386–391. [Google Scholar]
- Pang, J.; Liu, W.; Wei, Z.; Sun, C.; Jiao, N.; Han, X. Online diode fault detection in rotating rectifier of the brushless synchronous starter generator. IEEE Trans. Ind. Inform. 2020, 16, 6943–6951. [Google Scholar] [CrossRef] [Scilit]
- Yang, C.; Zhang, F.; Cheng, L.; Zhang, Z. Open-circuit fault research on asymmetric delta-polygon 18-pulse autotransformer rectifier unit for more electric aircraft. IEEE Trans. Power Electron. 2022, 37, 14615–14630. [Google Scholar]
- Du, Q.; Gao, L.; Liu, W.; Yin, X.; Meng, F. Diode open-circuit fault research on the parallel-connected 24-pulse rectifier with DC-side passive harmonic reduction circuit. IEEE Trans. Power Electron. 2021, 37, 485–497. [Google Scholar]
- Zhang, L.; Xiang, Y.; Li, Z.; Li, W. Diode health assessment of aviation transformer rectifier unit based on Mahalanobis distance. In Proceedings of the CSAA/IET International Conference on Aircraft Utility Systems (AUS 2022), Nanchang, China, 17–20 August 2022; pp. 71–75. [Google Scholar]
- Nejad, A.Z.; Dastfan, A. Signal-based fault diagnosis in Q-pulse diode rectifier with fast and accurate detection of faulty switch. Measurement 2023, 207, 112331. [Google Scholar]
- Yang, C.; Zhang, F.; Cheng, L.; Zhang, Z. A general diode open-circuit fault diagnosis method for autotransformer rectifier unit considering grid voltage disturbance. IEEE J. Emerg. Sel. Top. Power Electron. 2022, 11, 2214–2226. [Google Scholar] [CrossRef] [Scilit]
- Chen, S.; Ge, H.; Li, H.; Sun, Y.; Qian, X. Hierarchical deep convolution neural networks based on transfer learning for transformer rectifier unit fault diagnosis. Measurement 2021, 167, 108257. [Google Scholar] [CrossRef] [Scilit]
- Fang, Z.J.; Cai, T.; Duan, S.X.; Chen, C.; Ren, C.D. Performance analysis and capacitor design of three-phase uncontrolled rectifier in slightly unbalanced grid. IET Power Electron. 2015, 8, 1429–1439. [Google Scholar]
- Deriszadeh, A.; Karabasoglu, O.; Ćalasan, M.P.; Mehdipour, F. A dynamic functional model of diode bridge rectifier for unbalanced input voltage conditions. IET Power Electron. 2021, 14, 584–589. [Google Scholar] [CrossRef] [Scilit]
- Yazdavar, A.H.; Azzouz, M.A.; El-Saadany, E.F. Harmonic Analysis of Three-Phase Diode Bridge Rectifiers Under Unbalanced and Distorted Supply. IEEE Trans. Power Deliv. 2020, 35, 904–918. [Google Scholar]
- Mayordomo, J.G.; Beites, L.F.; Yang, X.; Xu, W. A Detailed Procedure for Harmonic Analysis of Three-Phase Diode Rectifiers Under Discontinuous Conduction Mode and Nonideal Conditions. IEEE Trans. Power Deliv. 2018, 33, 741–751. [Google Scholar]
- Xie, X.; Zhang, J.; Sun, Y.; Fan, J. A measurement-based dynamic harmonic model for single-phase diode bridge rectifier-type devices. IEEE Trans. Instrum. Meas. 2024, 73, 1–13. [Google Scholar]
- Wu, Y.; Kong, Y.; Bai, Y.; Gu, C.; Zhang, G. Diode Open-Circuit Fault Detection for Rotating Rectifiers of Brushless Exciters. IEEE Trans. Energy Convers. 2026. Early Access. [Google Scholar] [CrossRef] [Scilit]
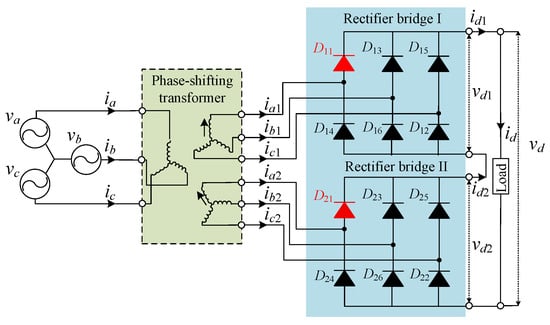
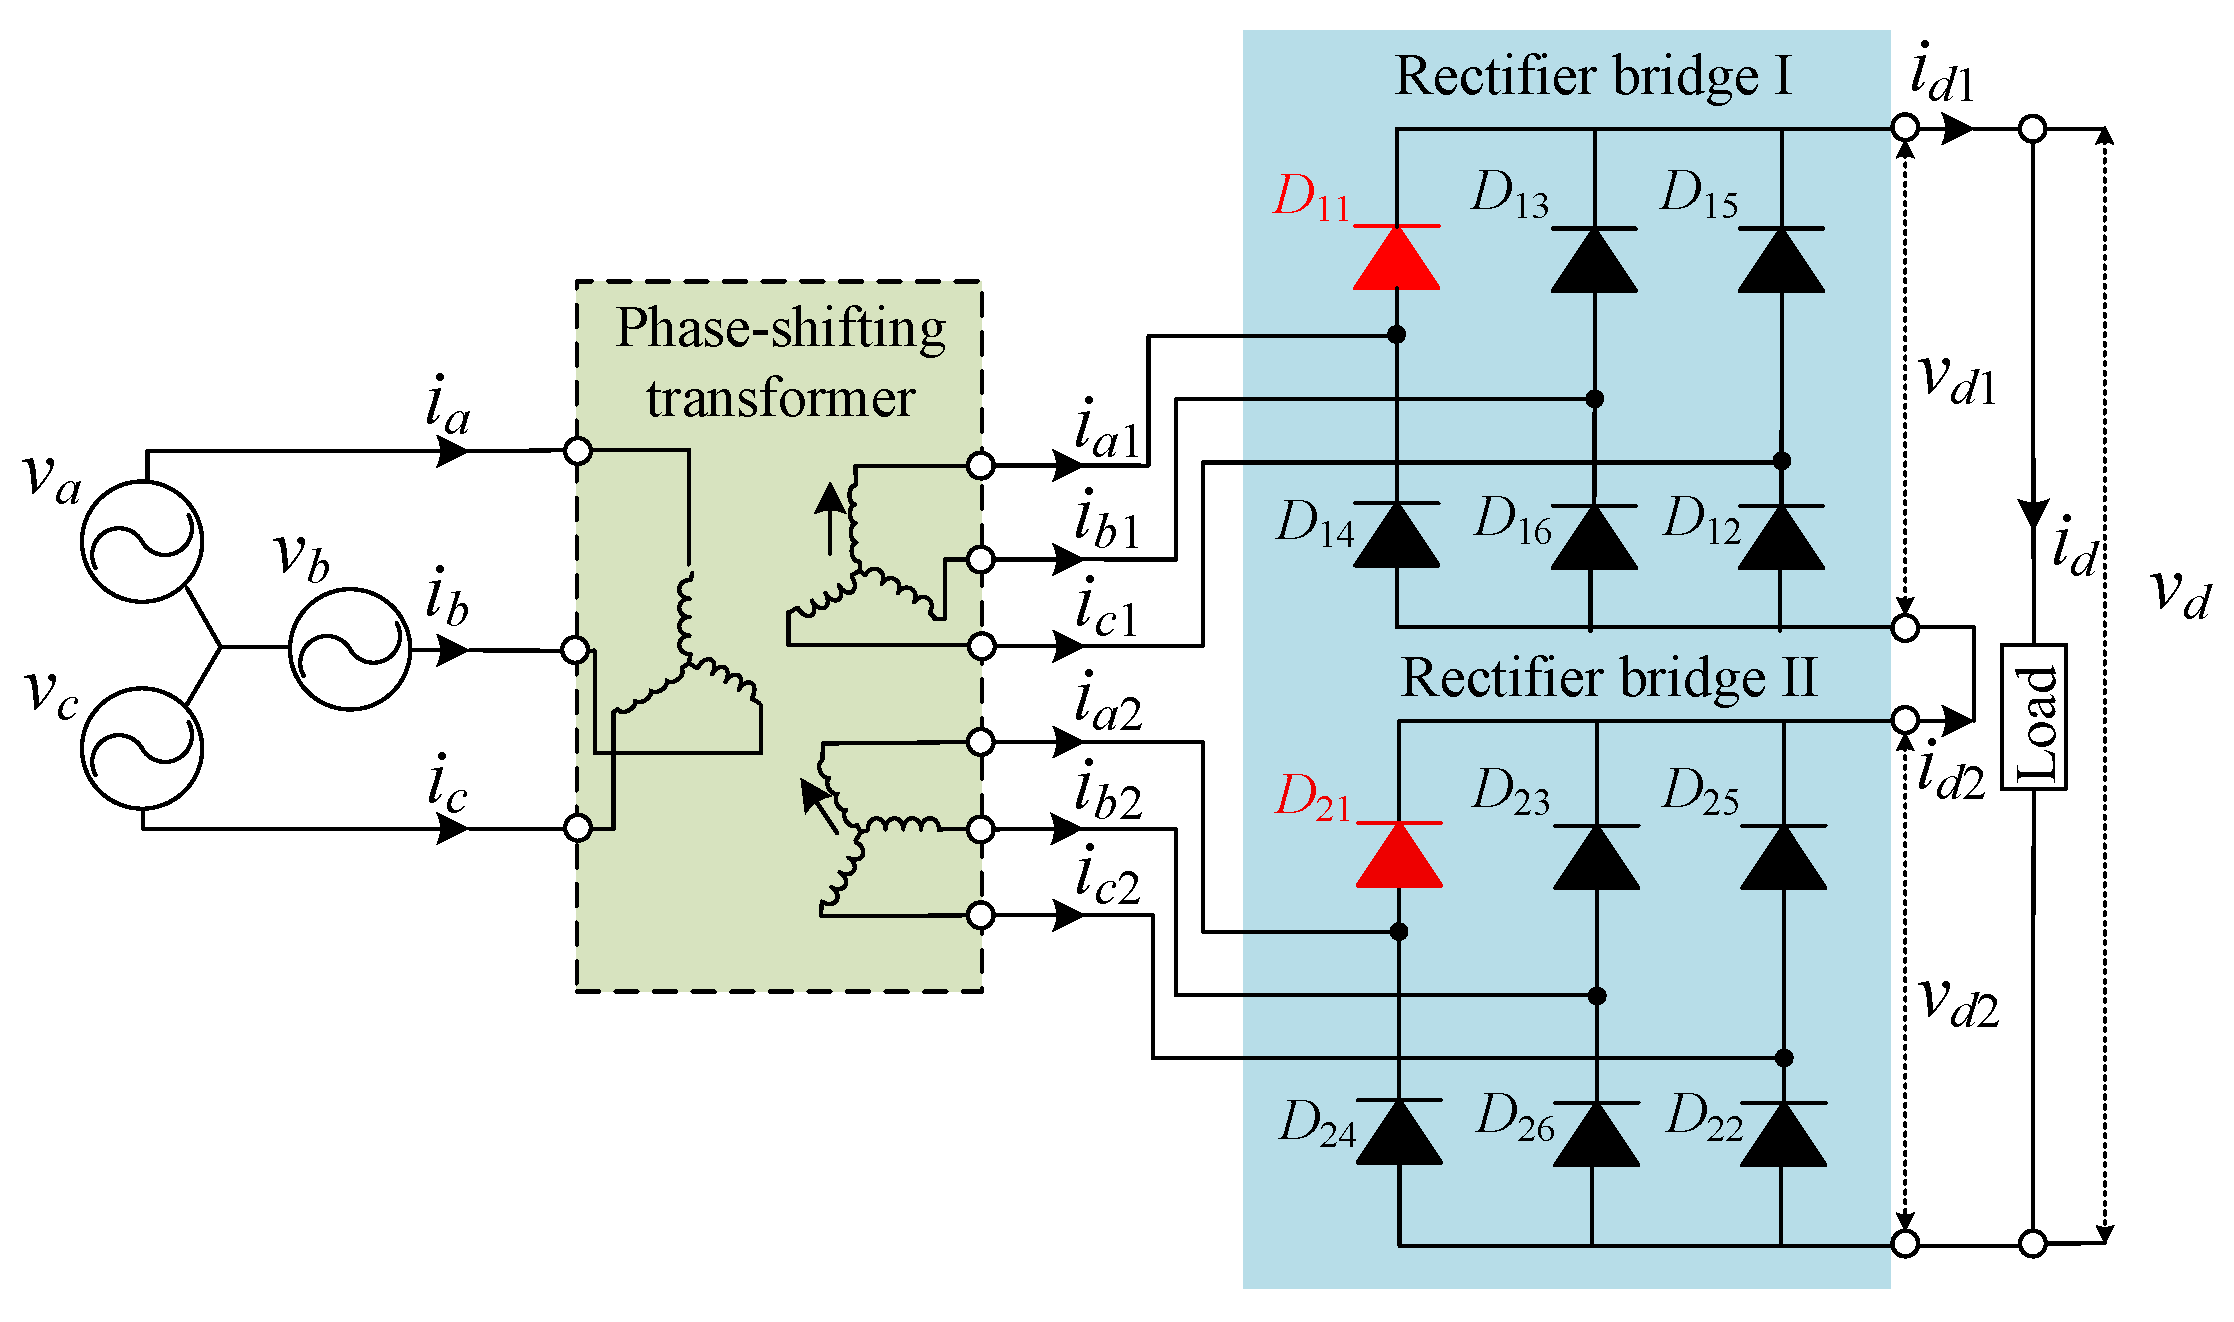
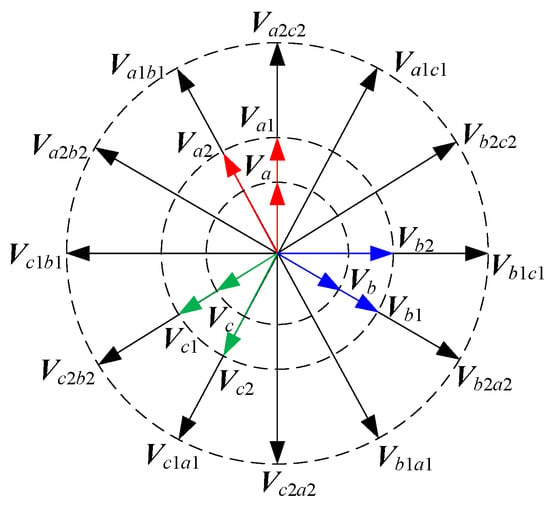
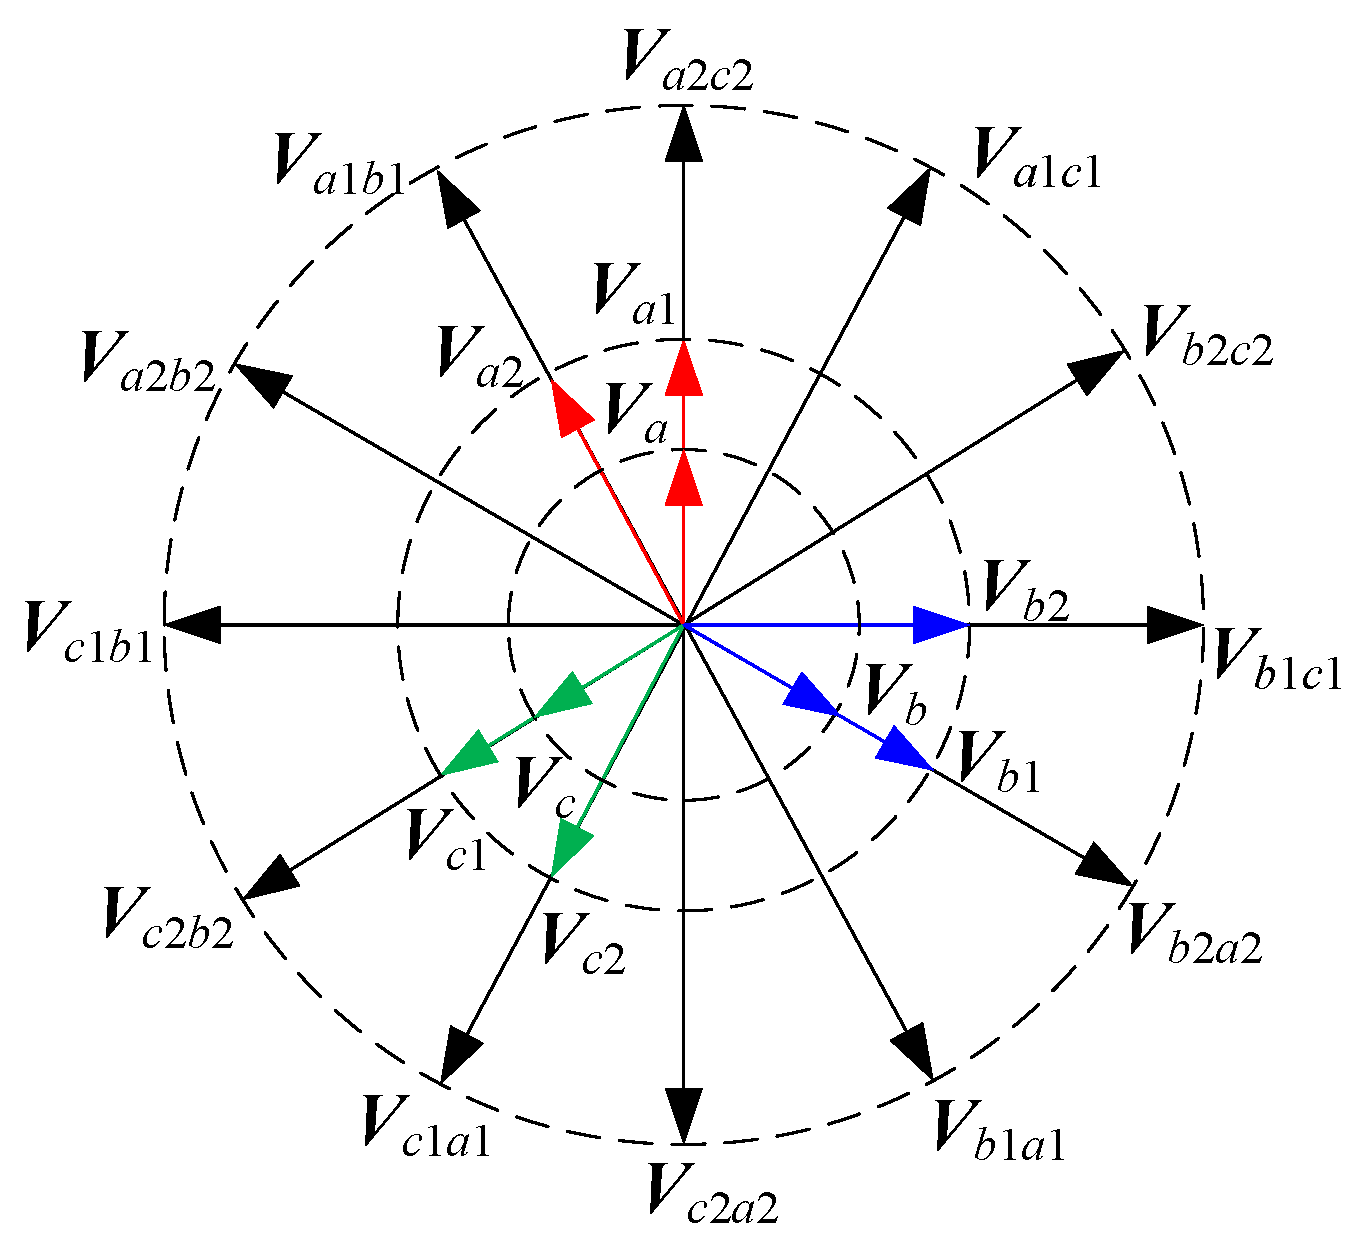
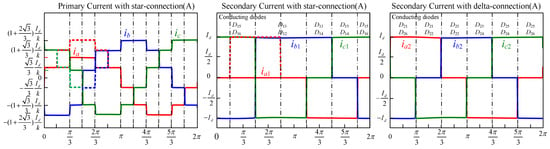
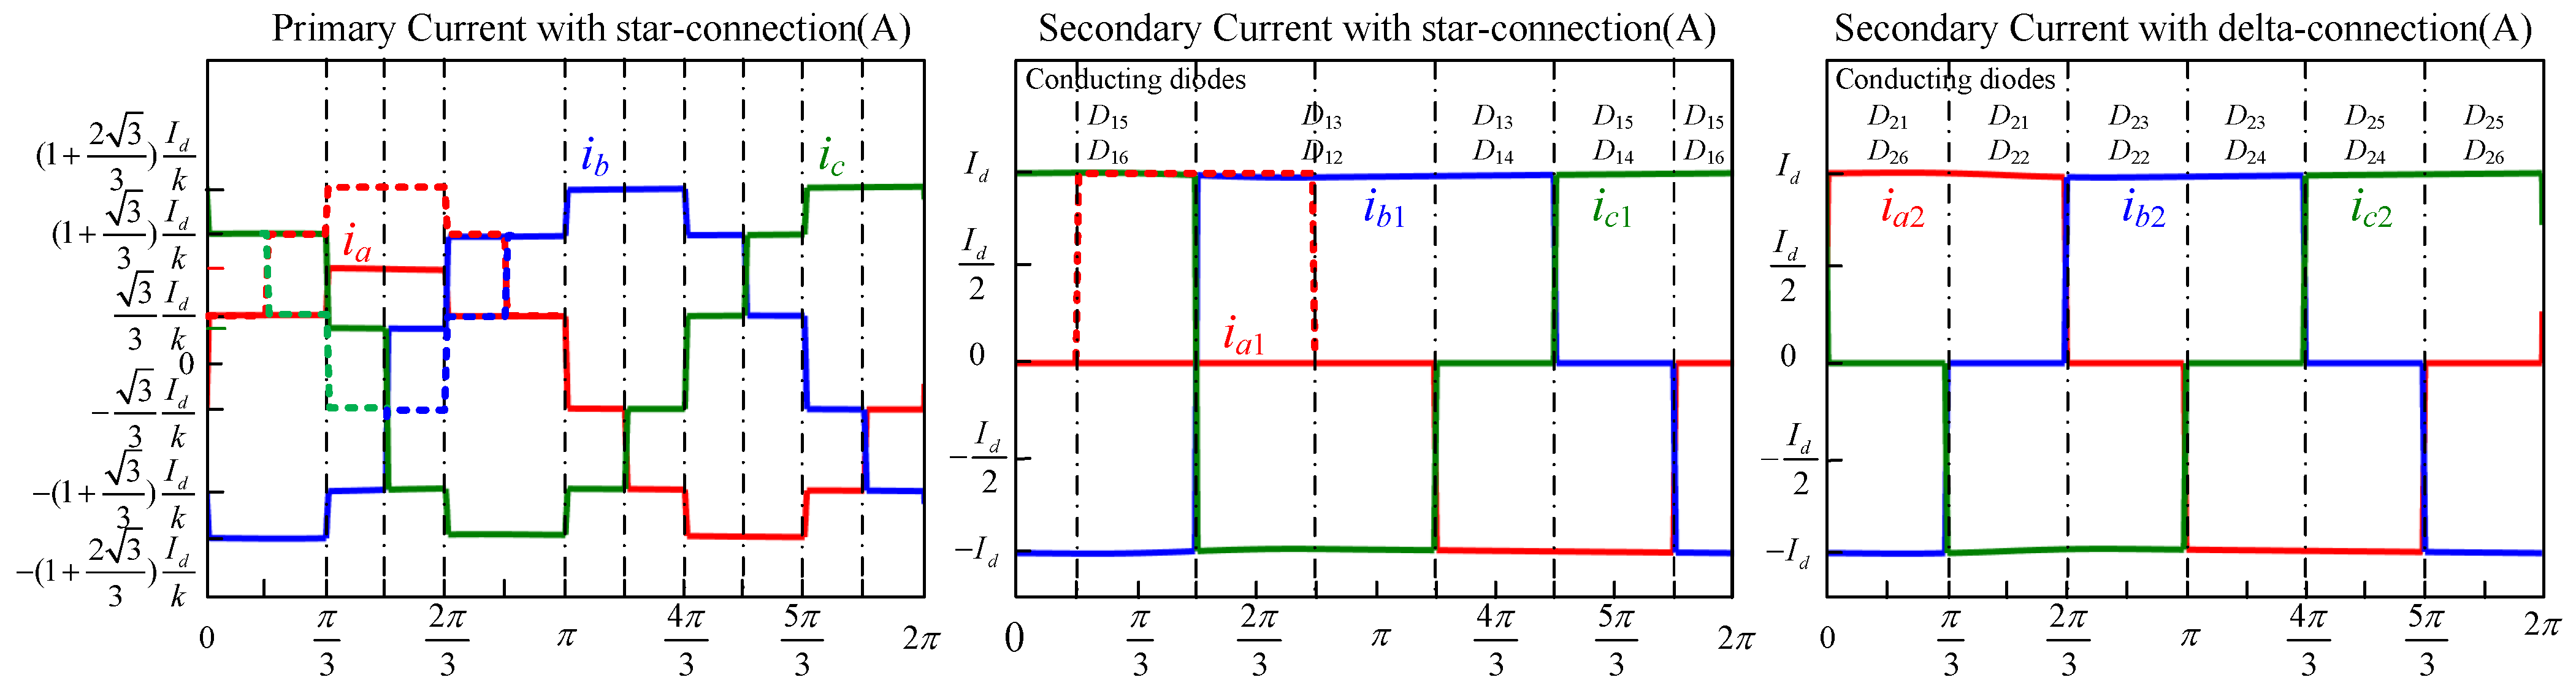
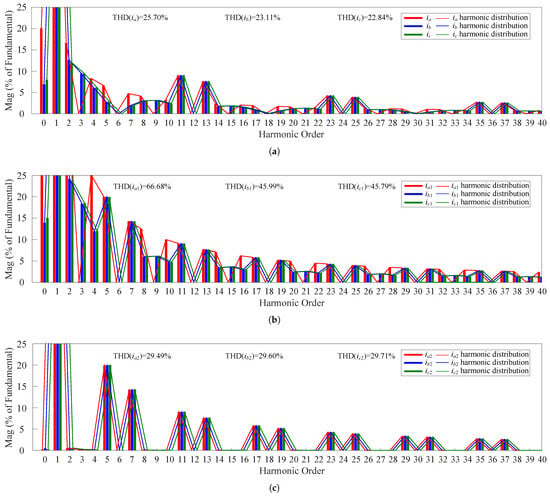
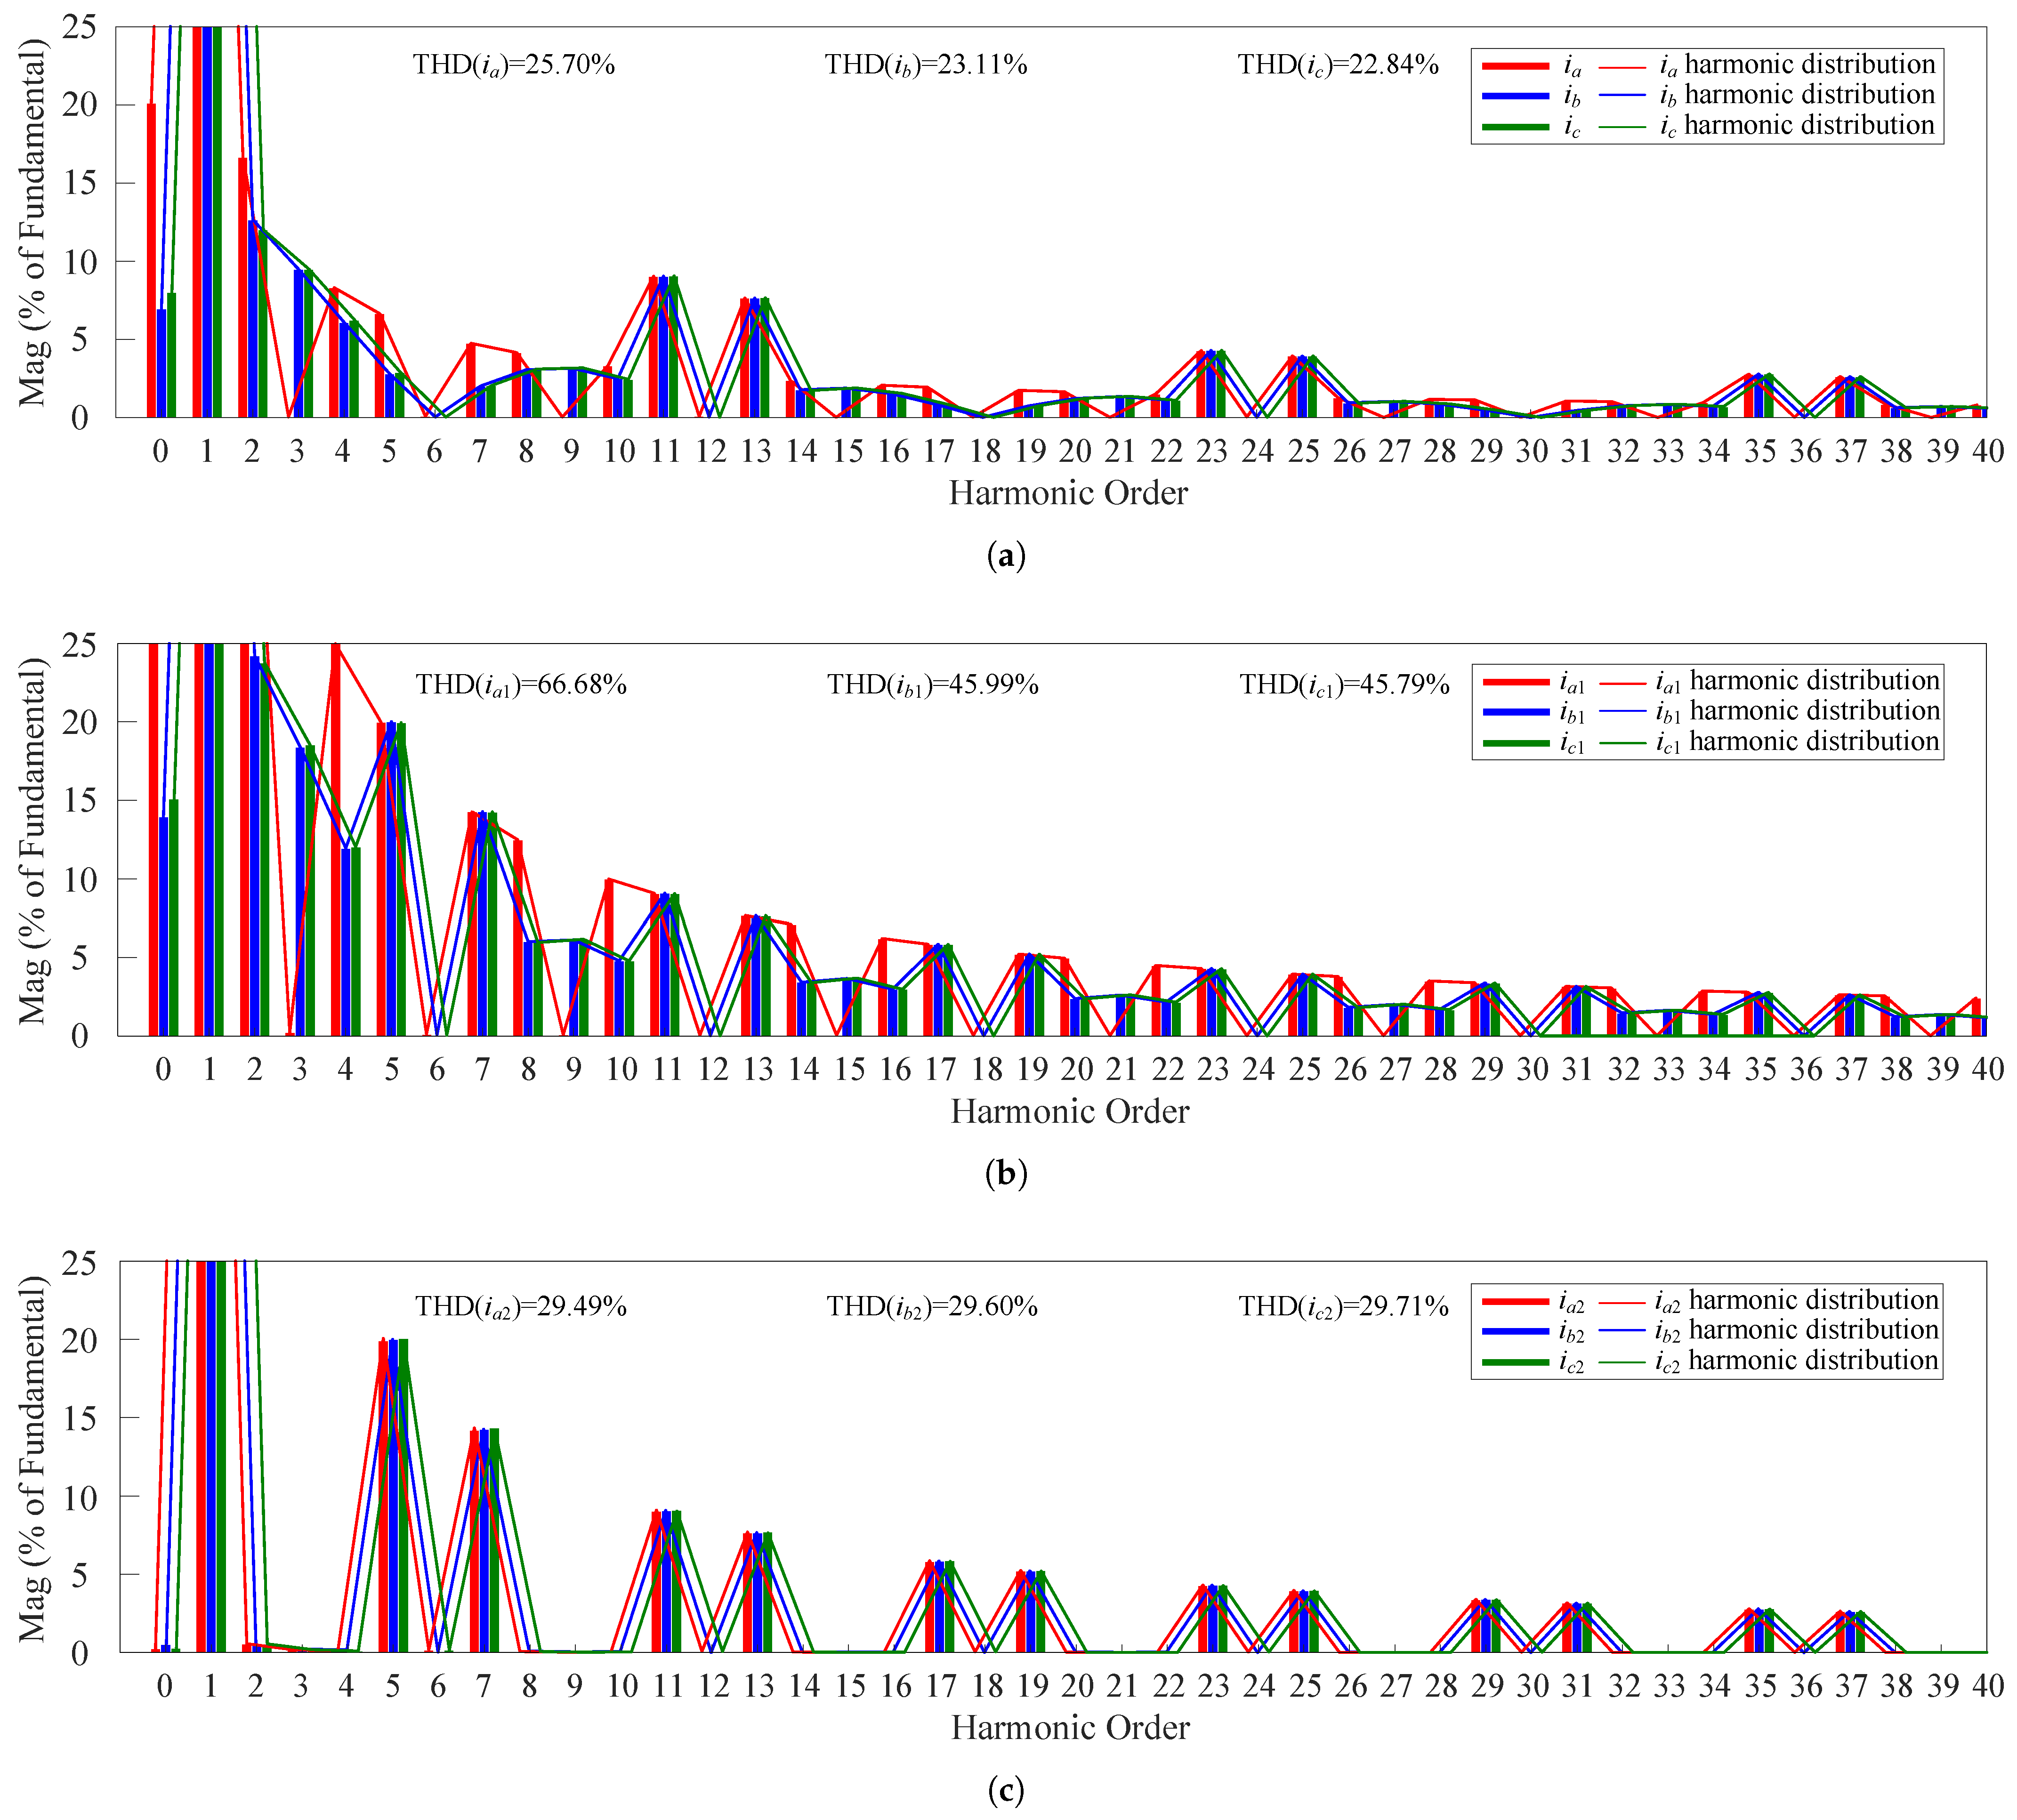
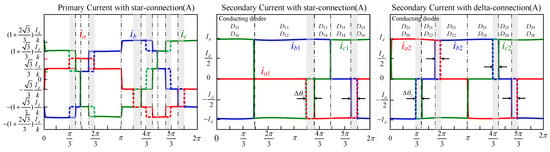
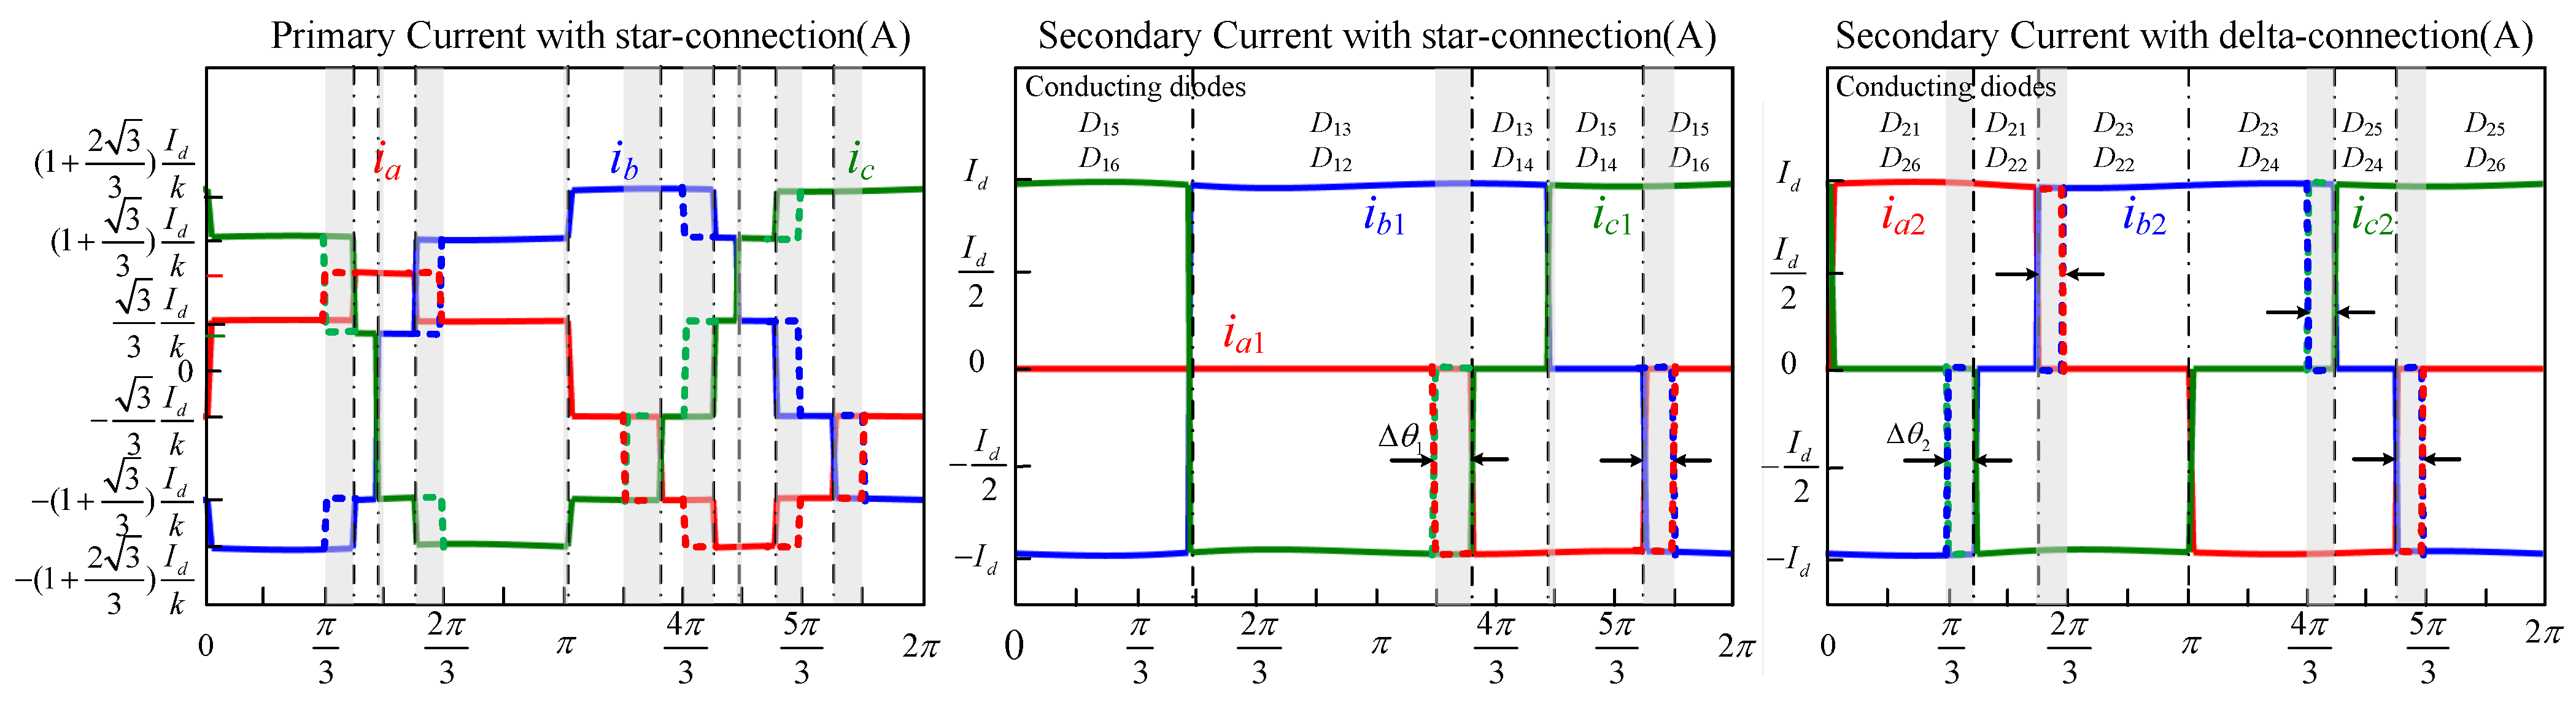
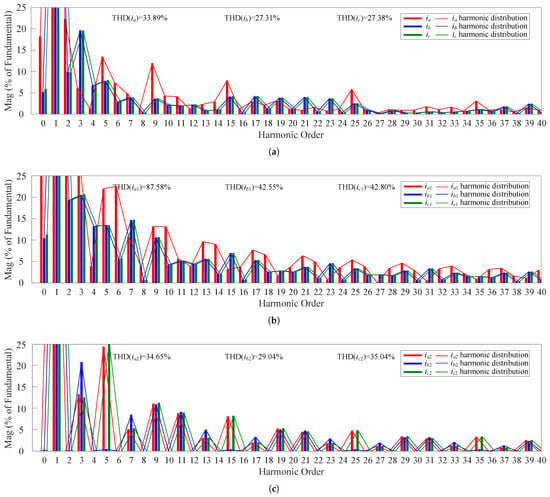
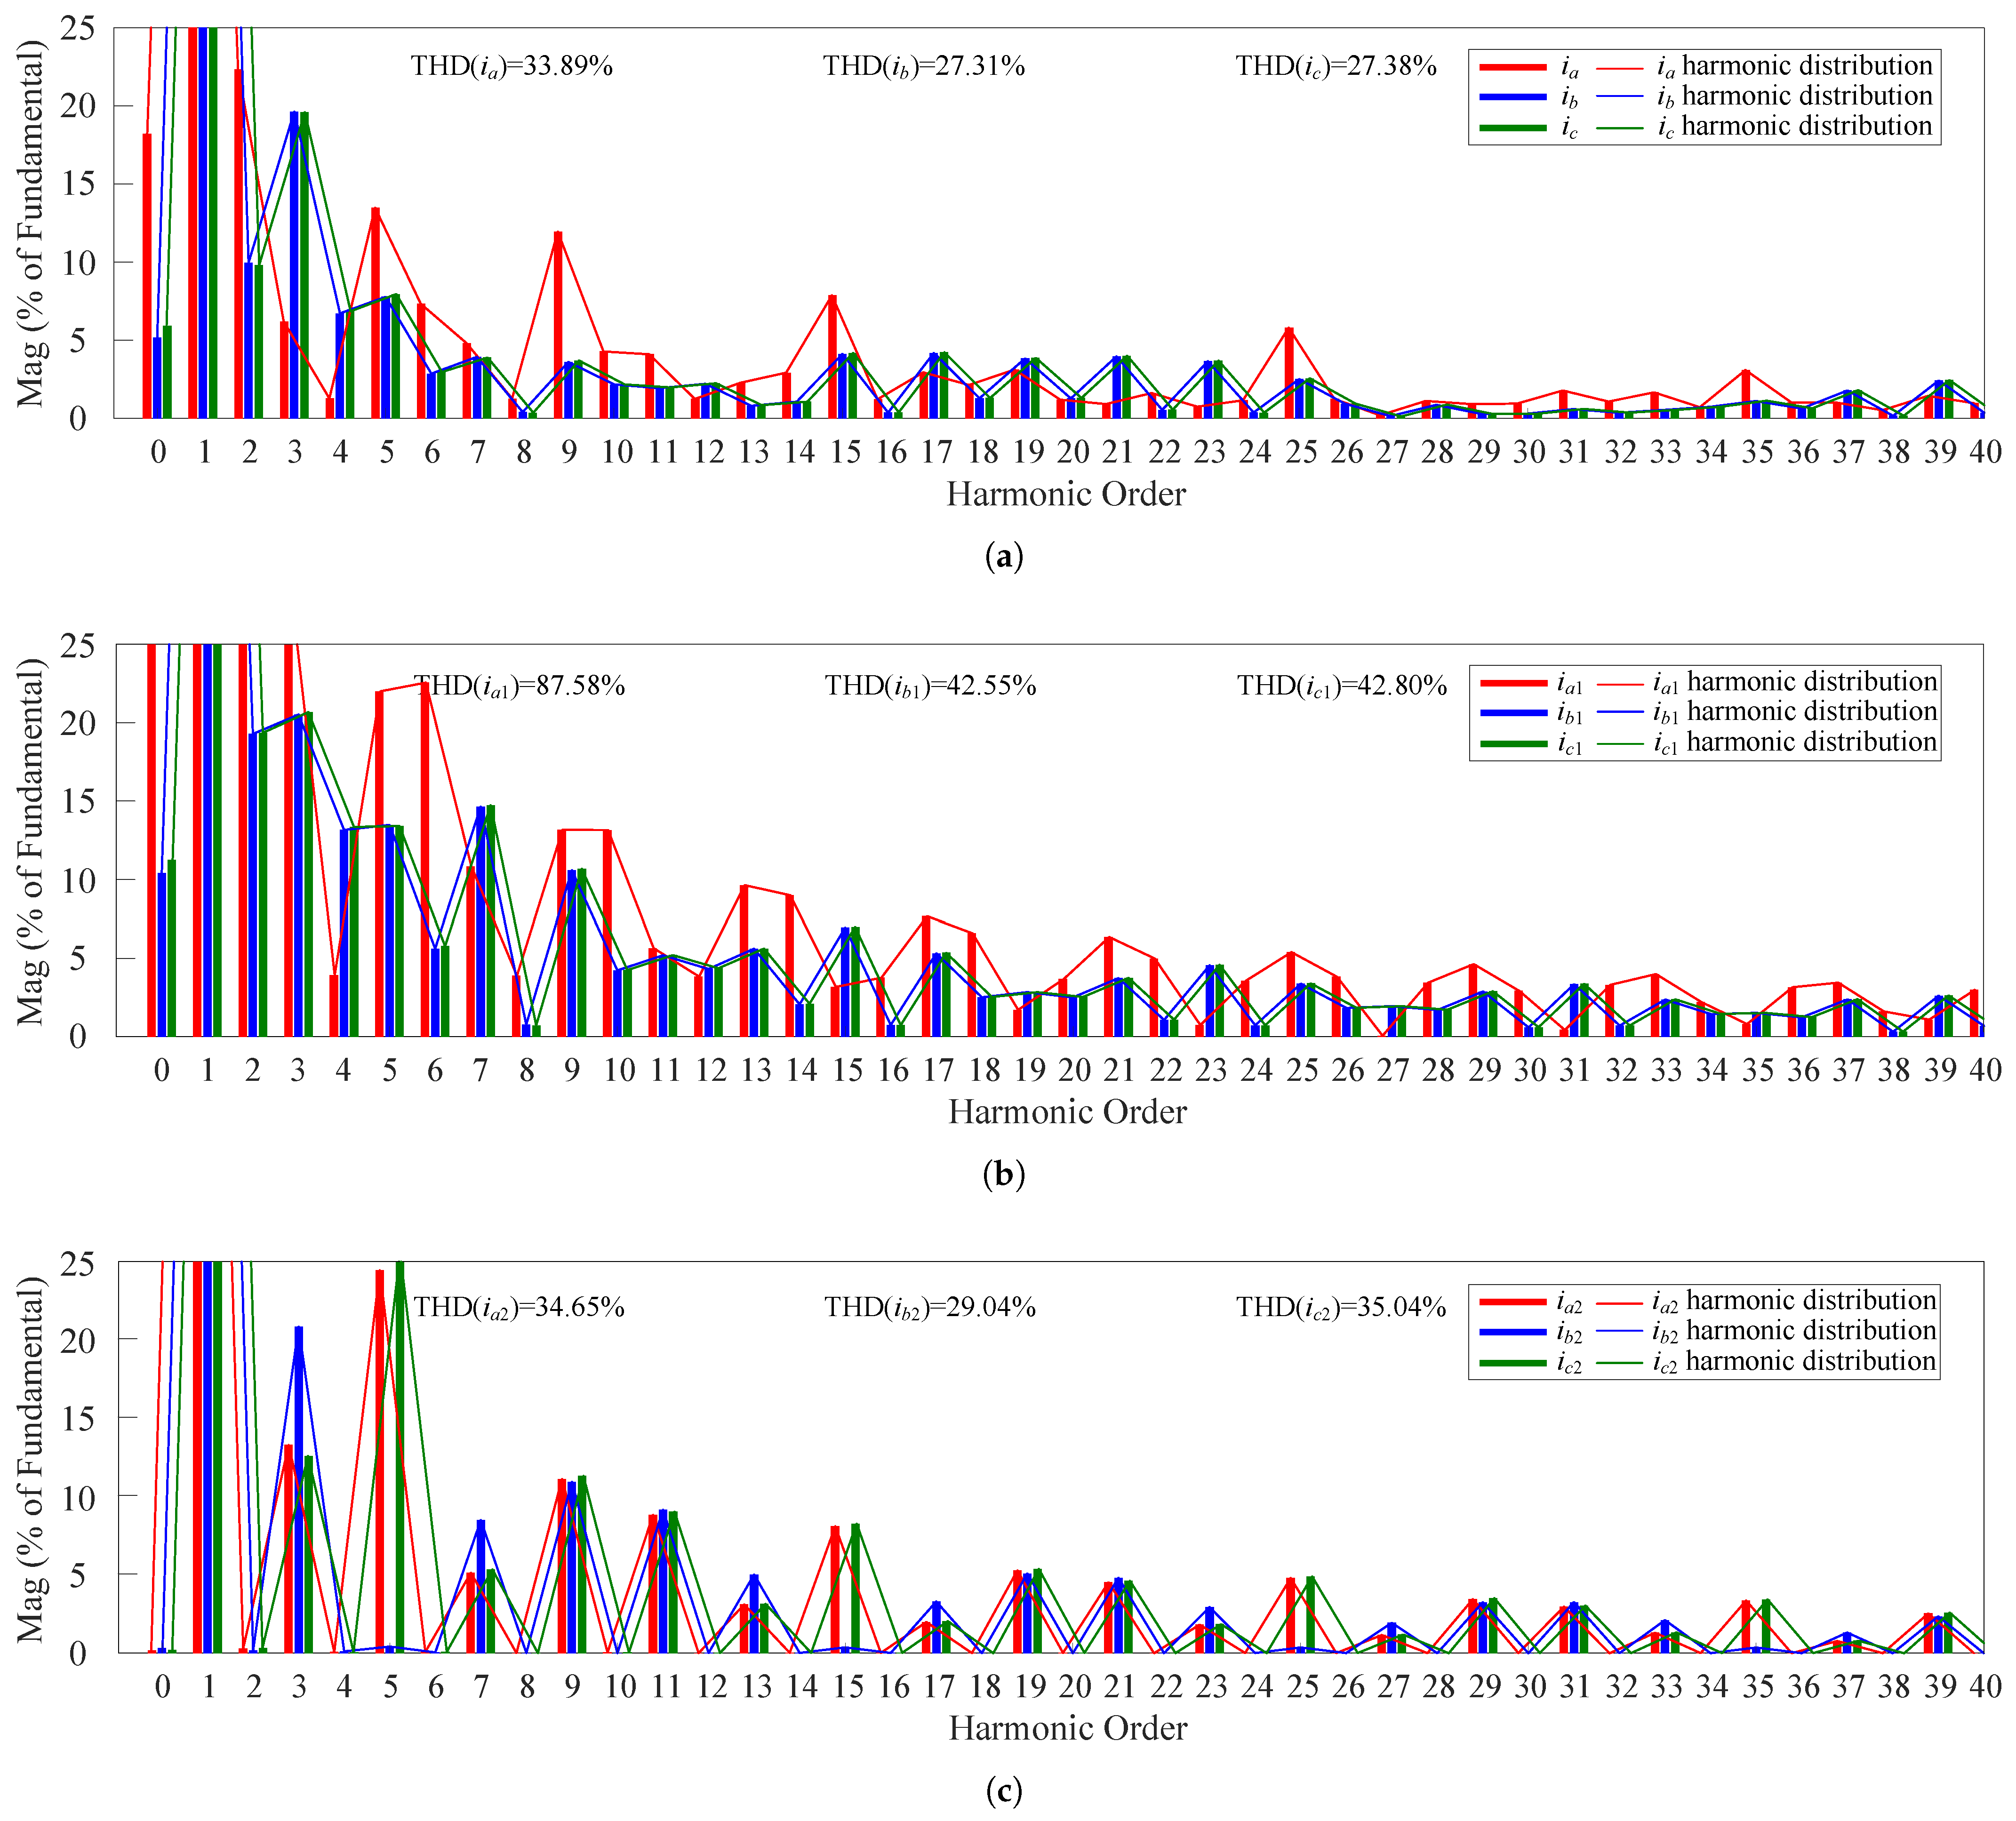
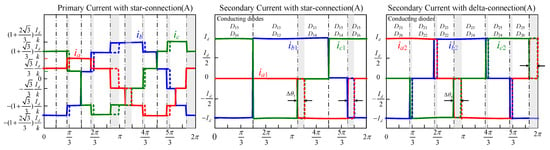
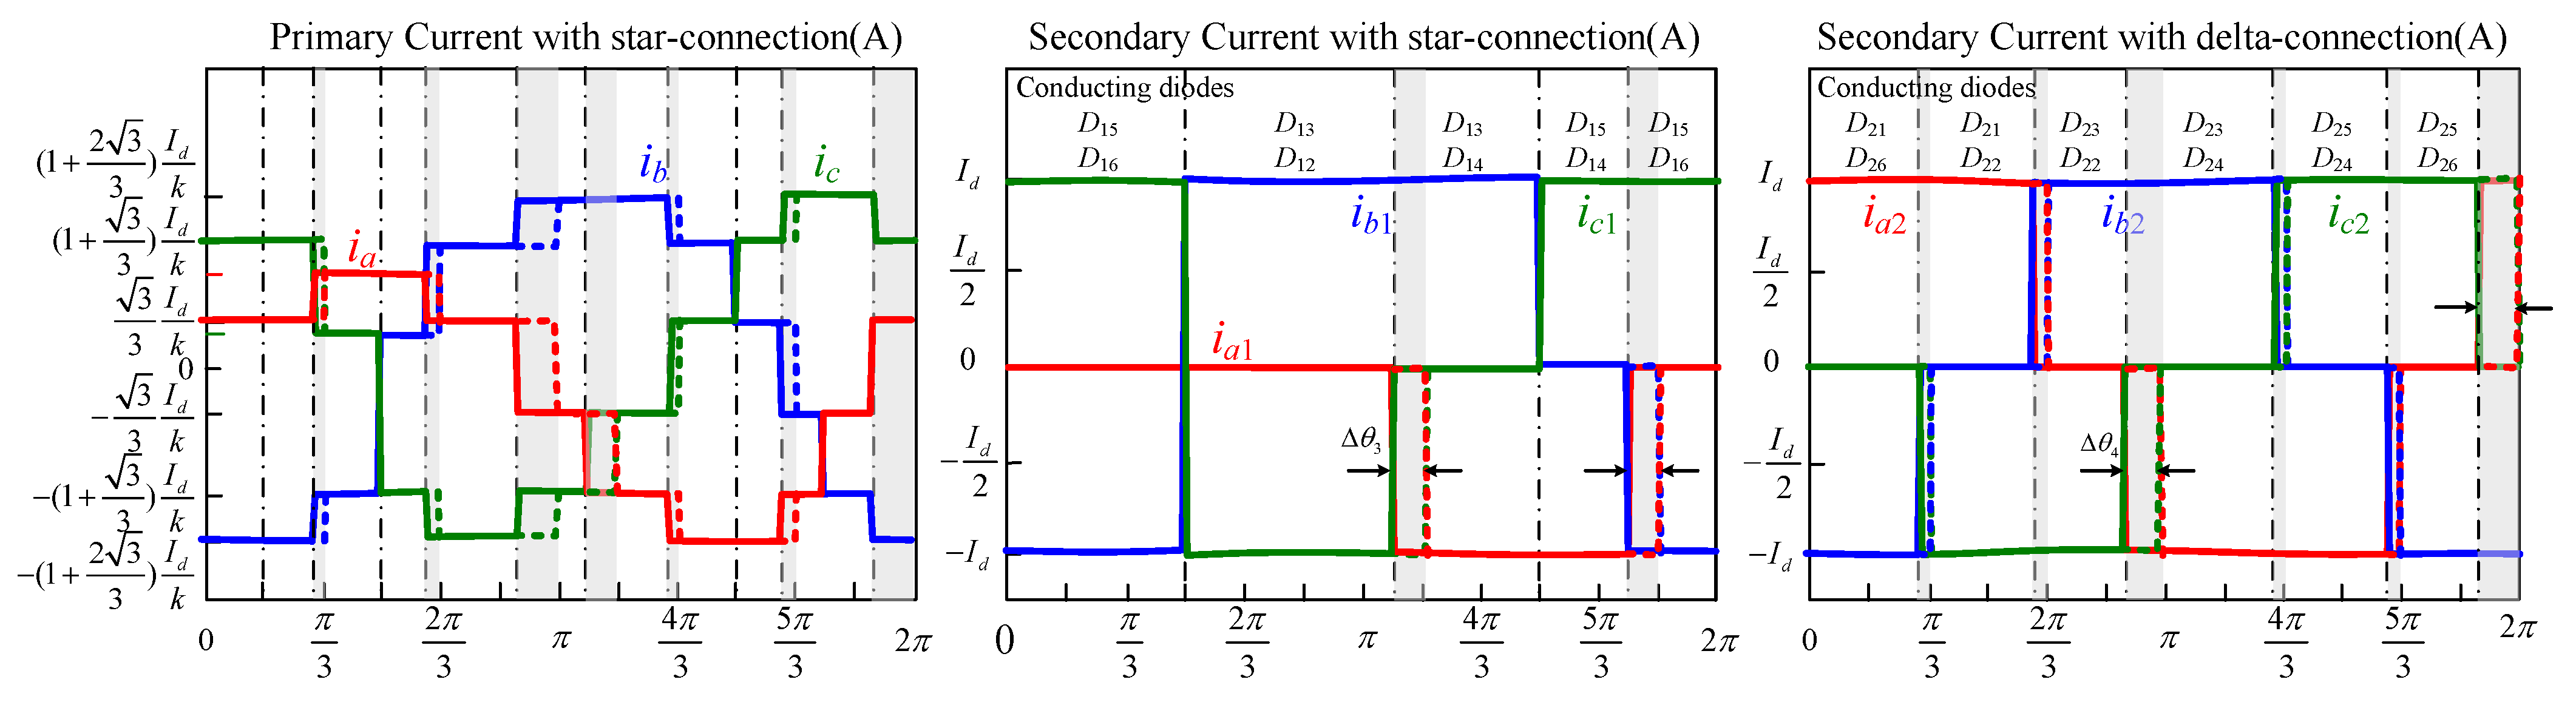
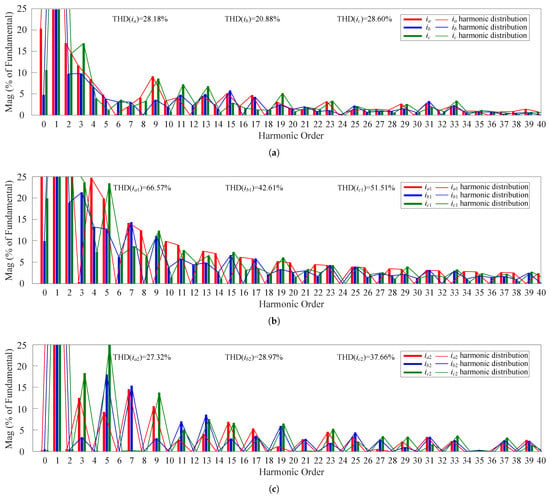
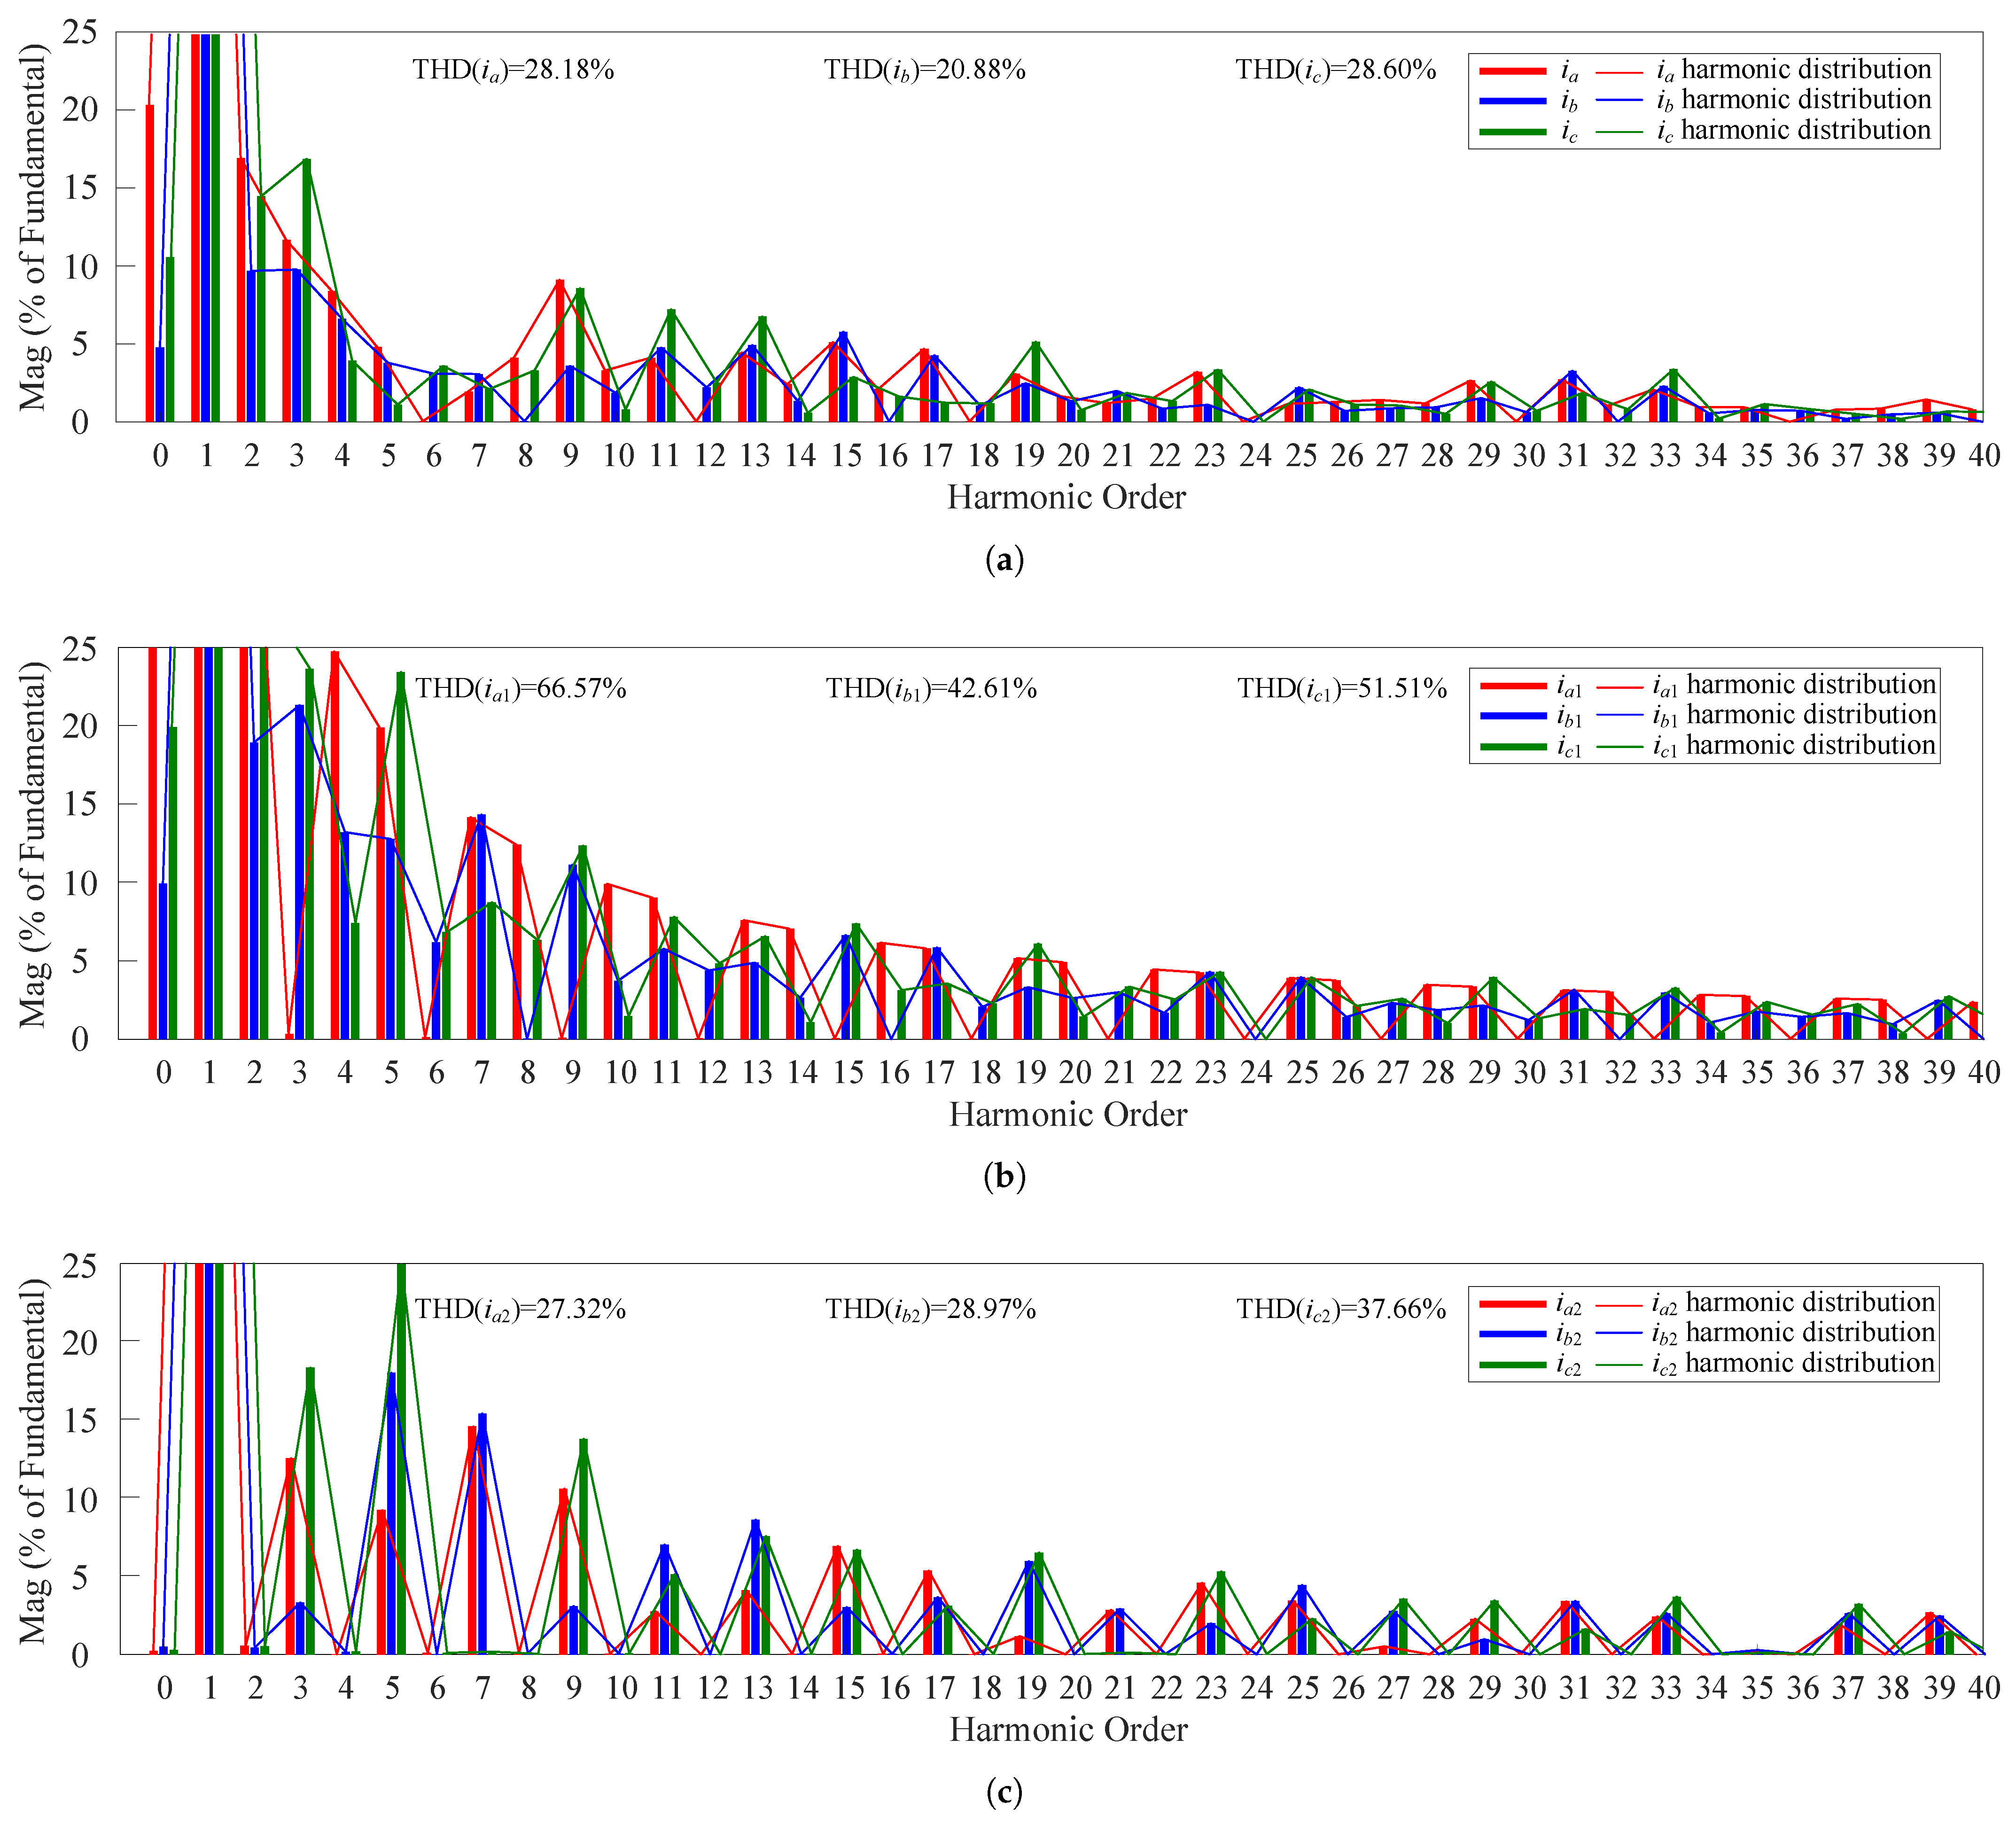
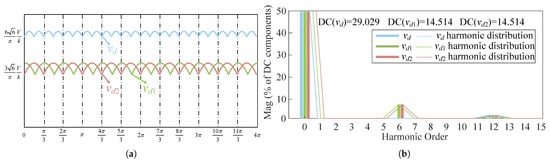
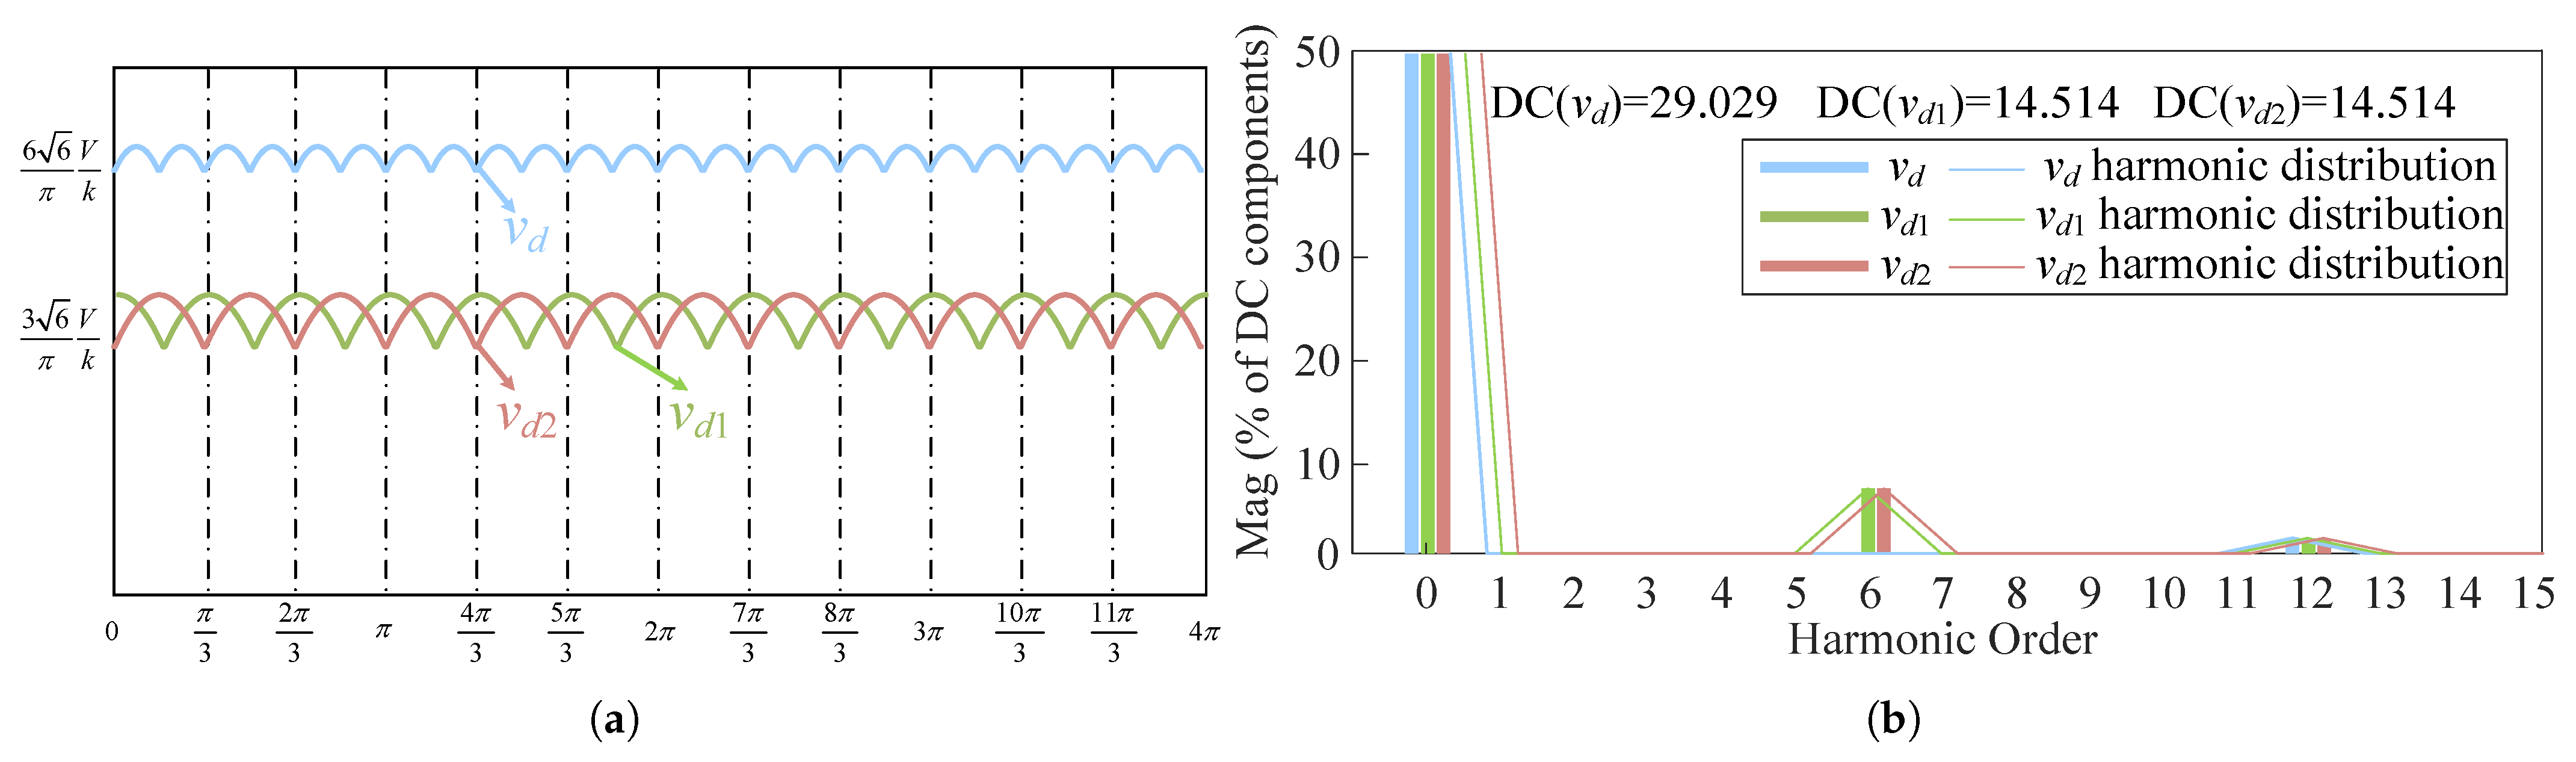
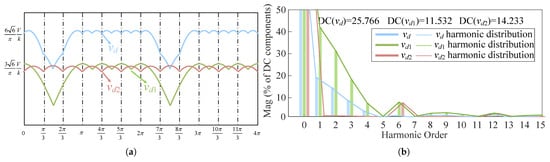
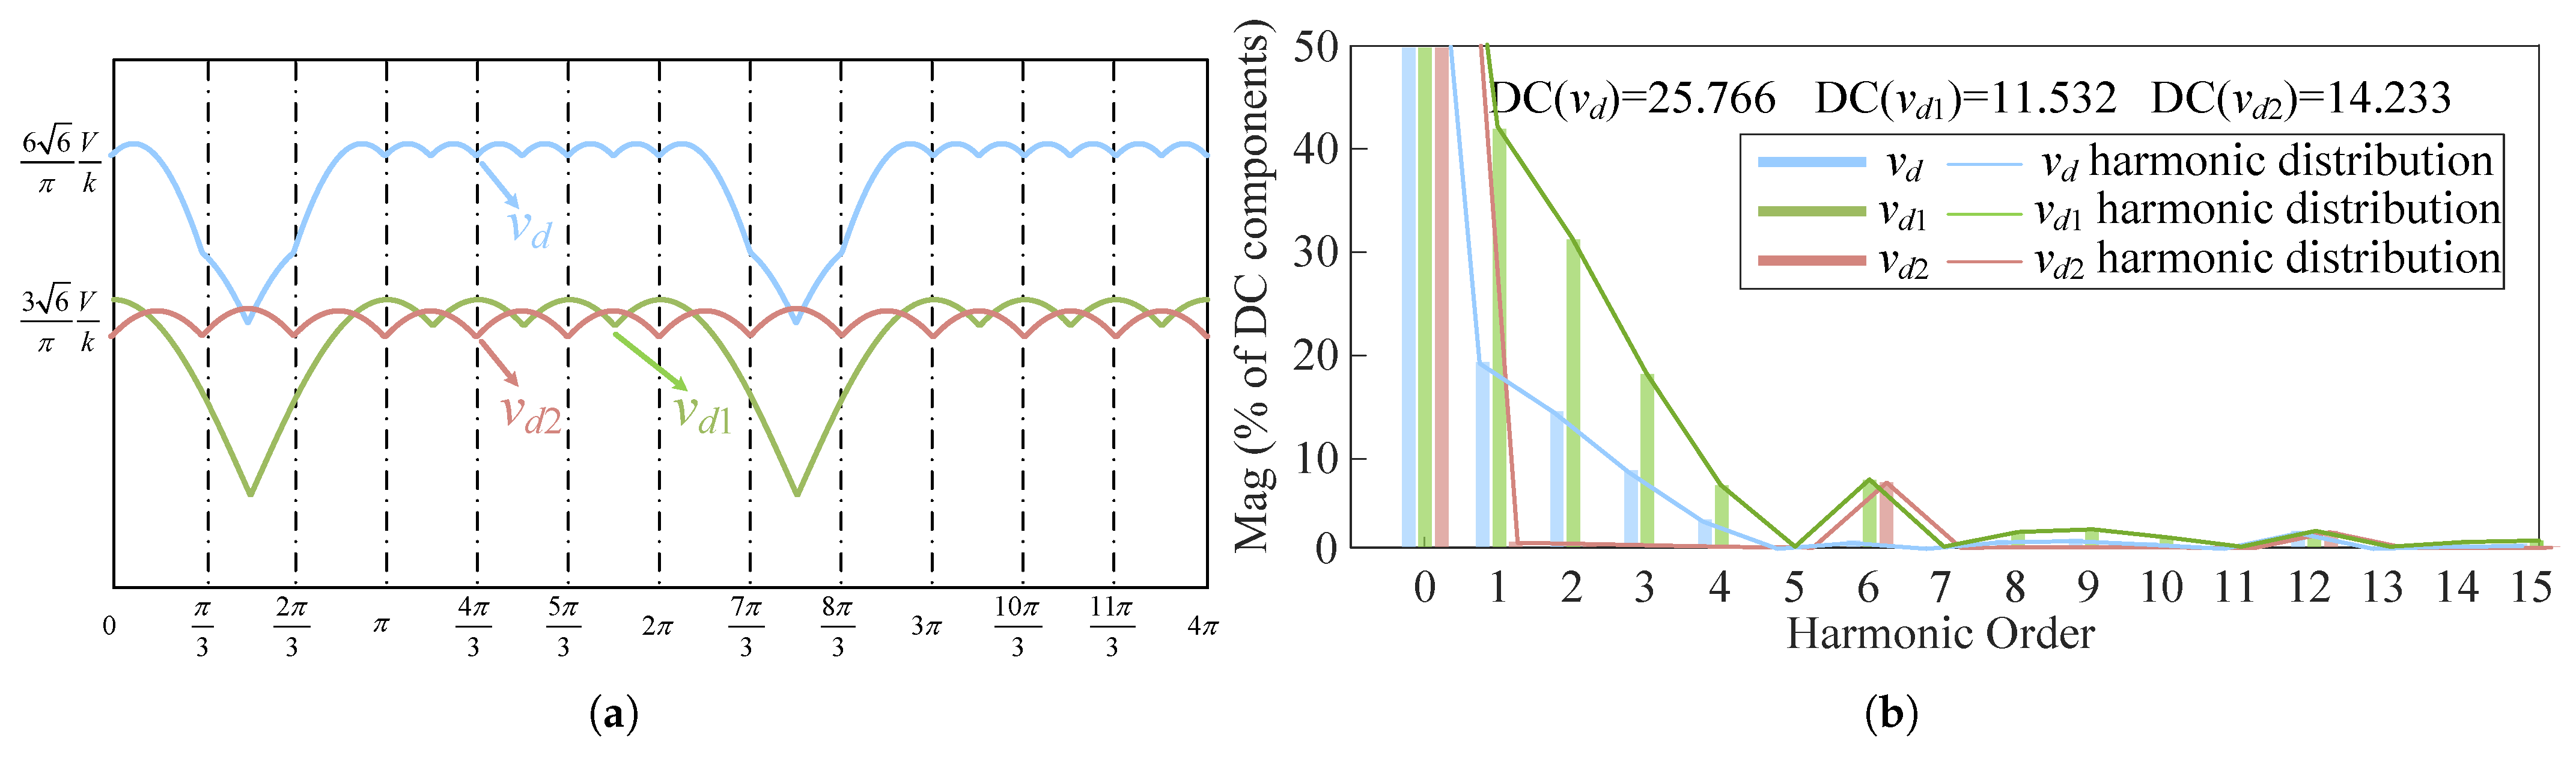
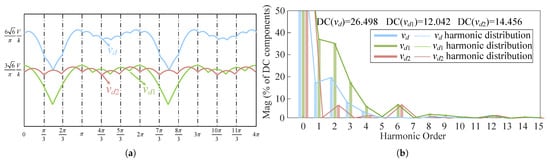
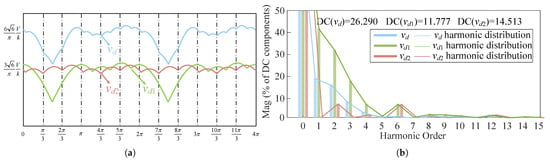
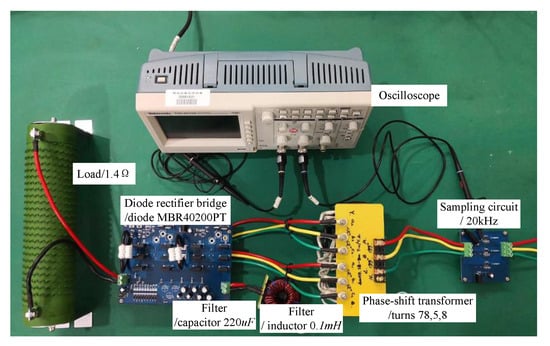
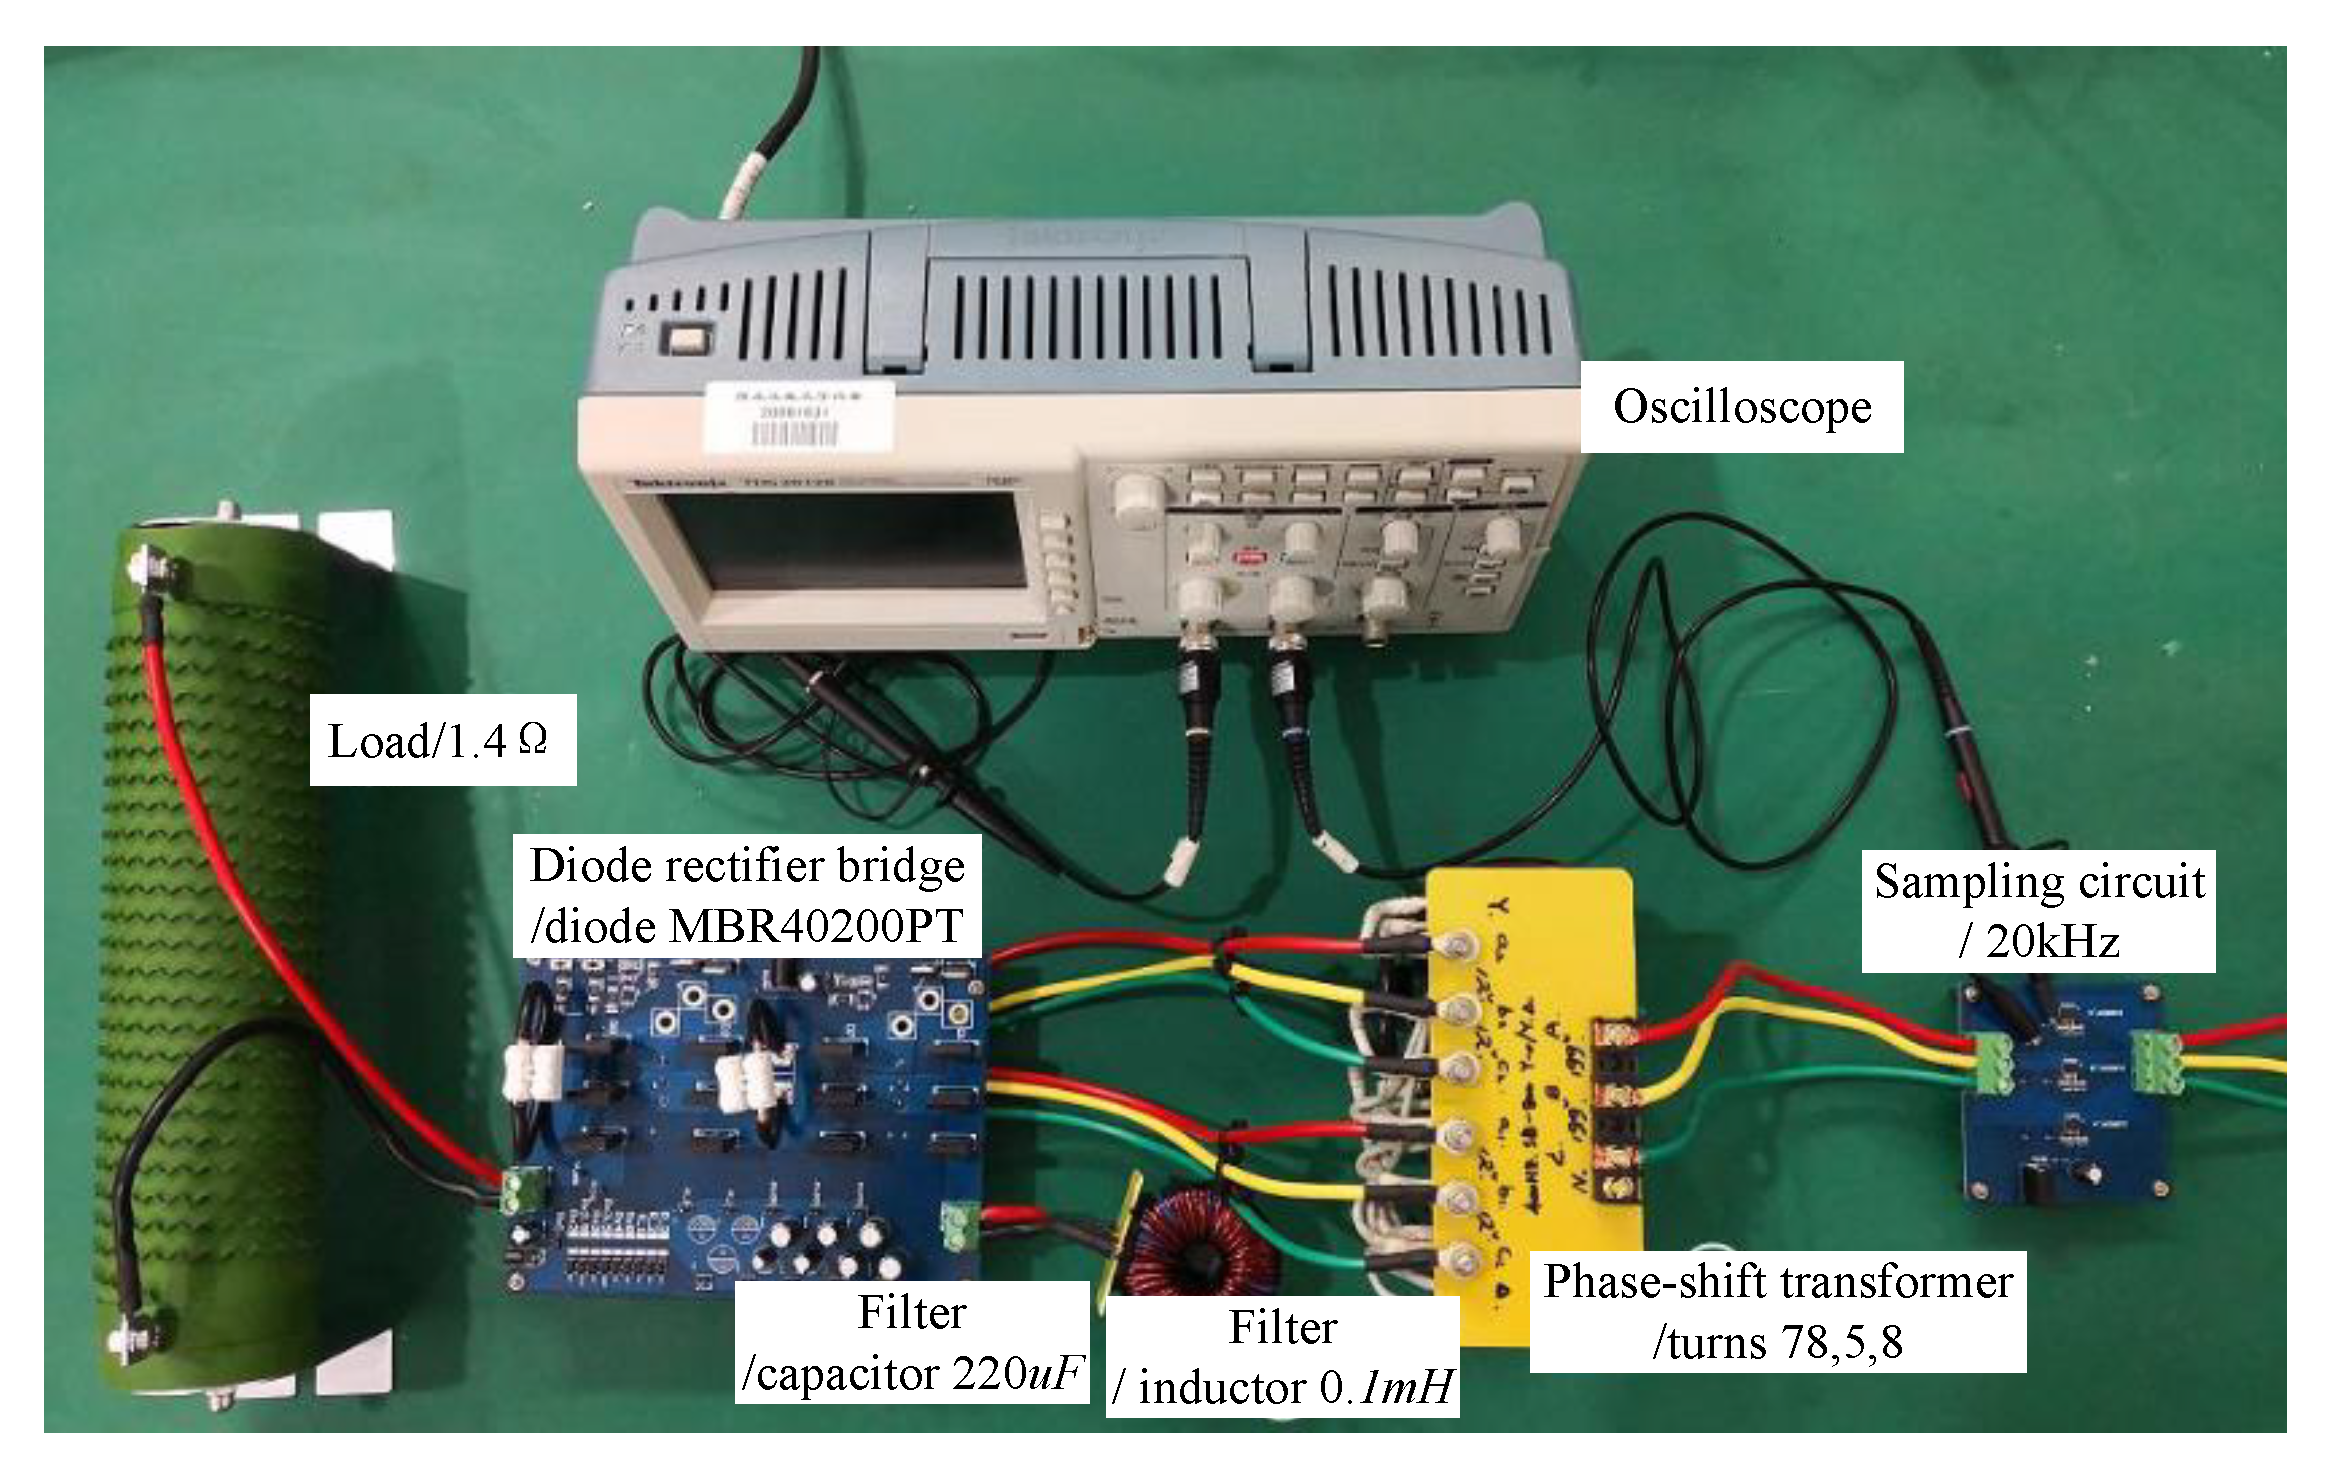
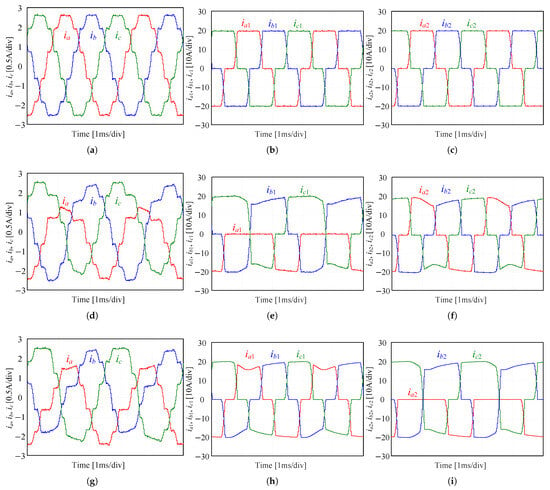
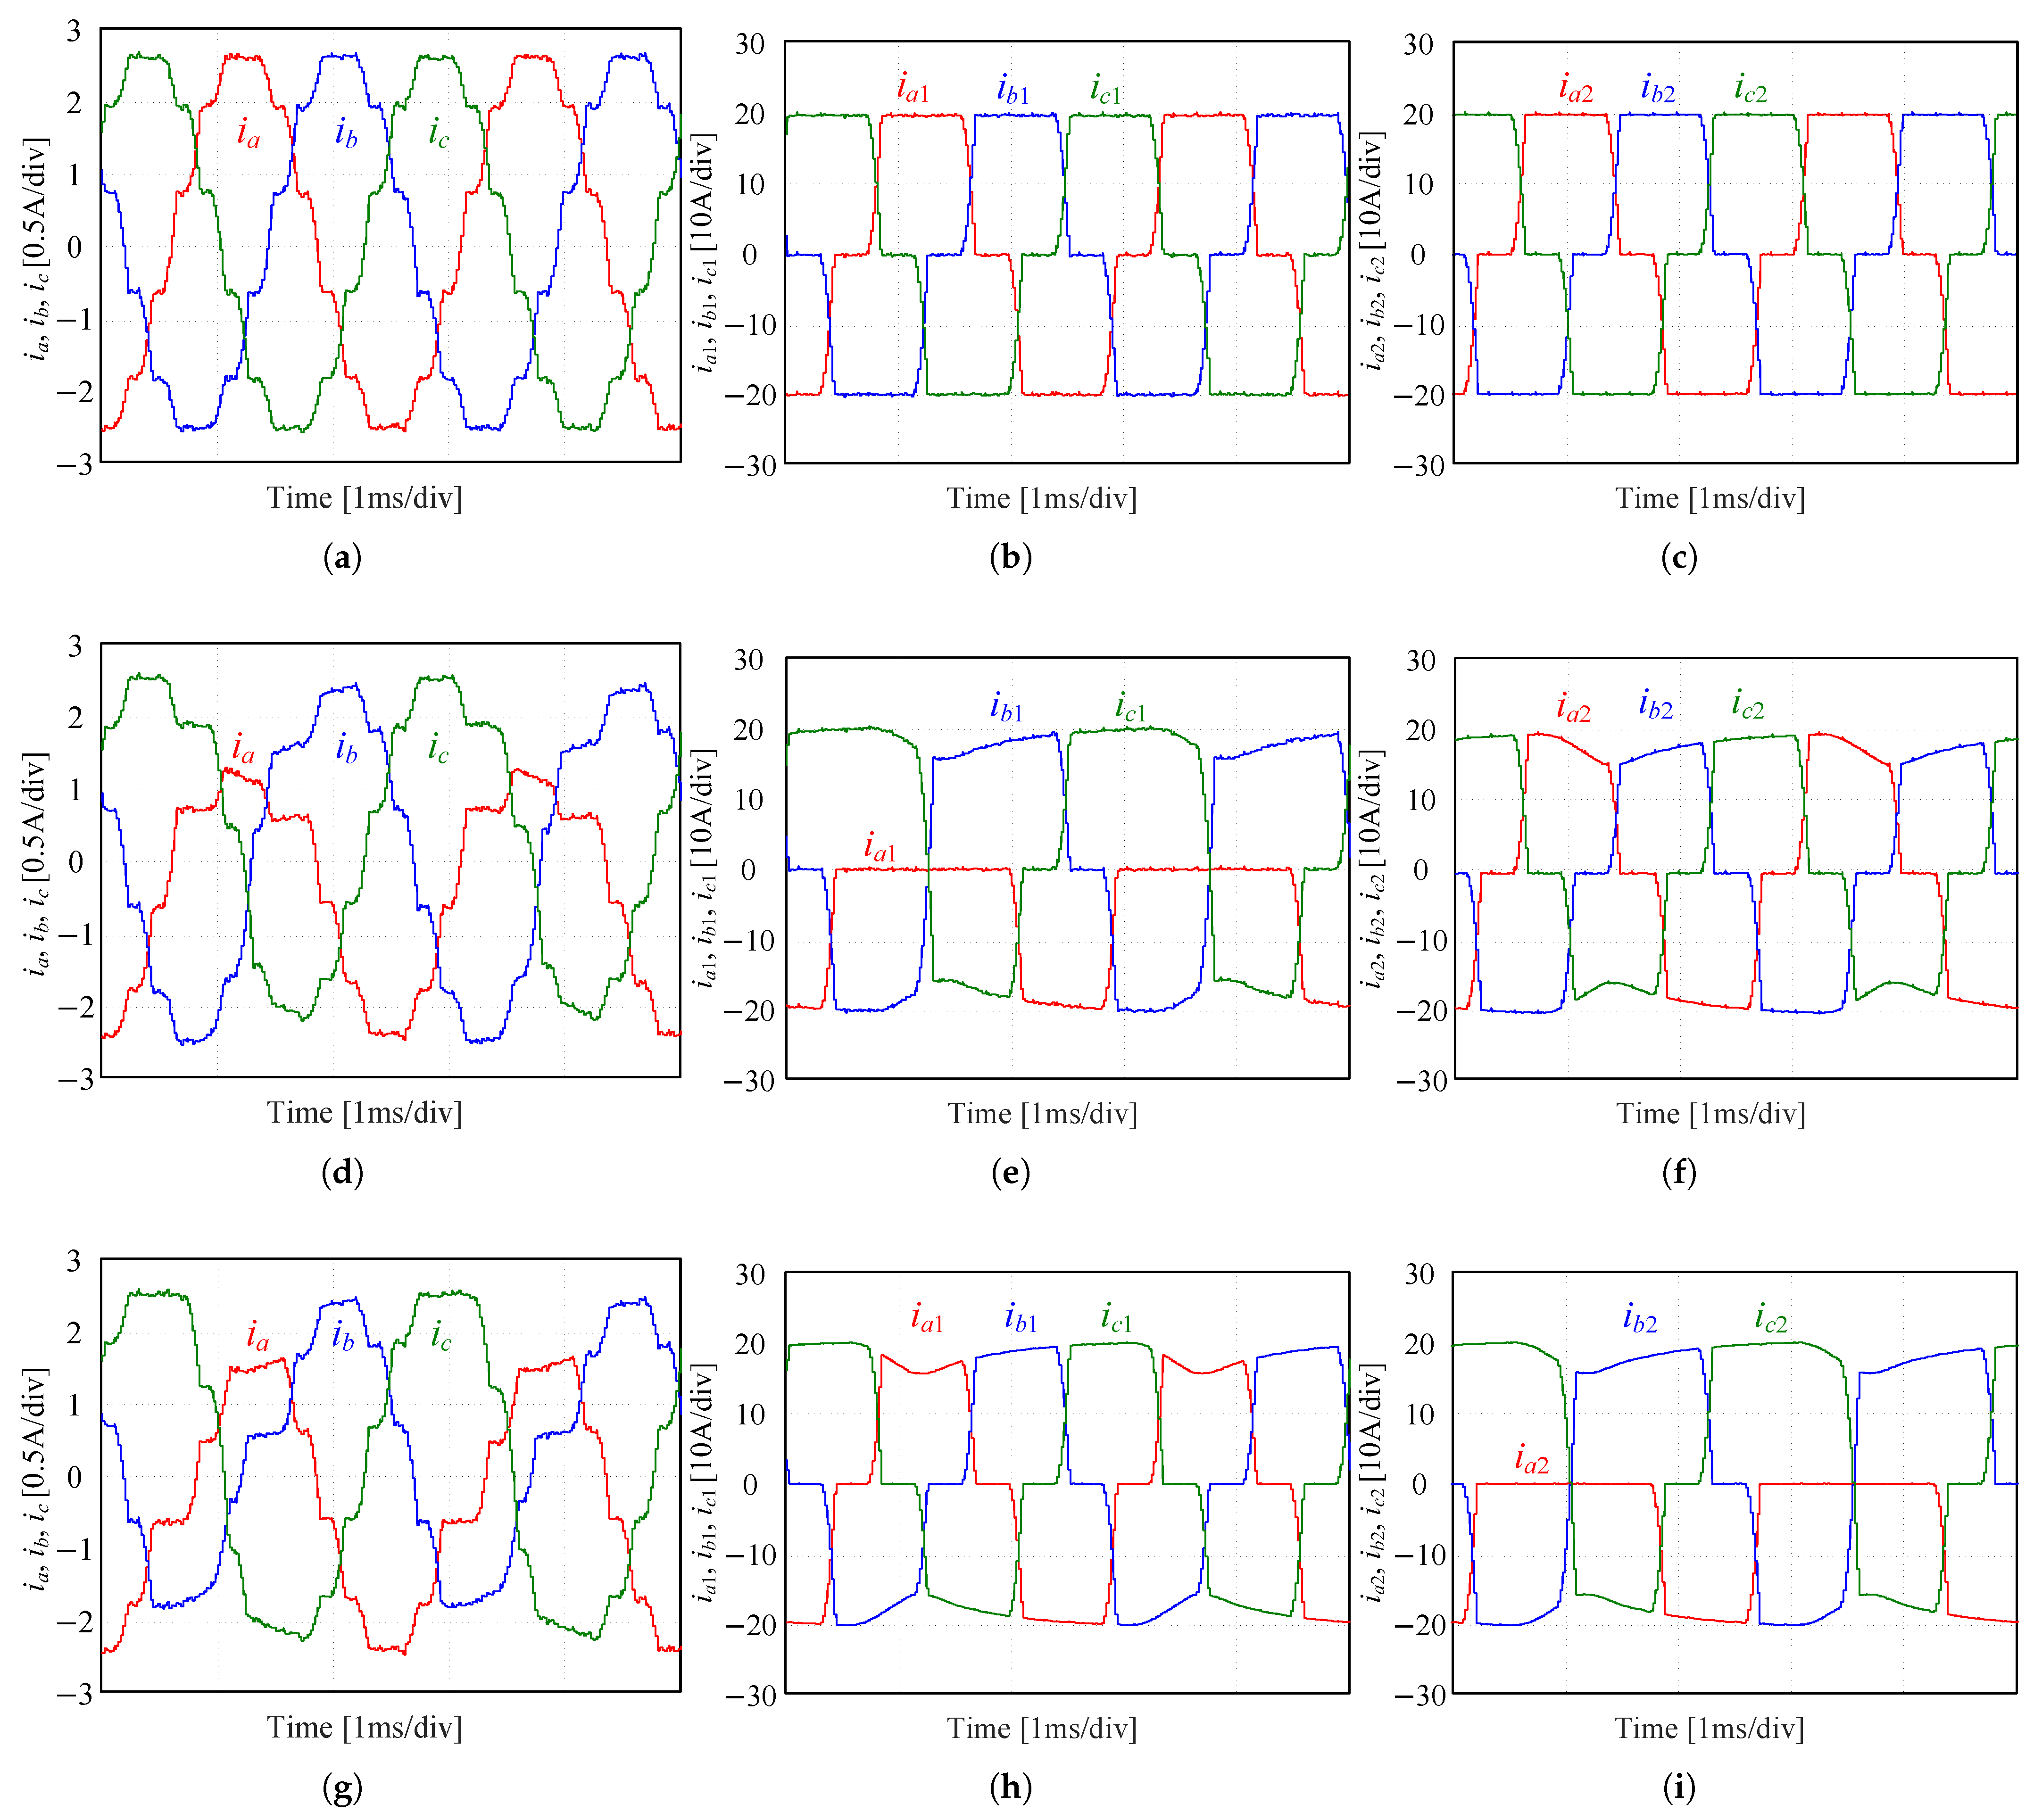
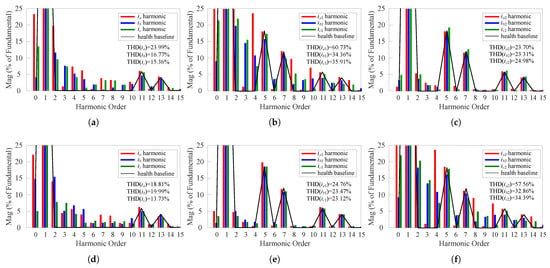
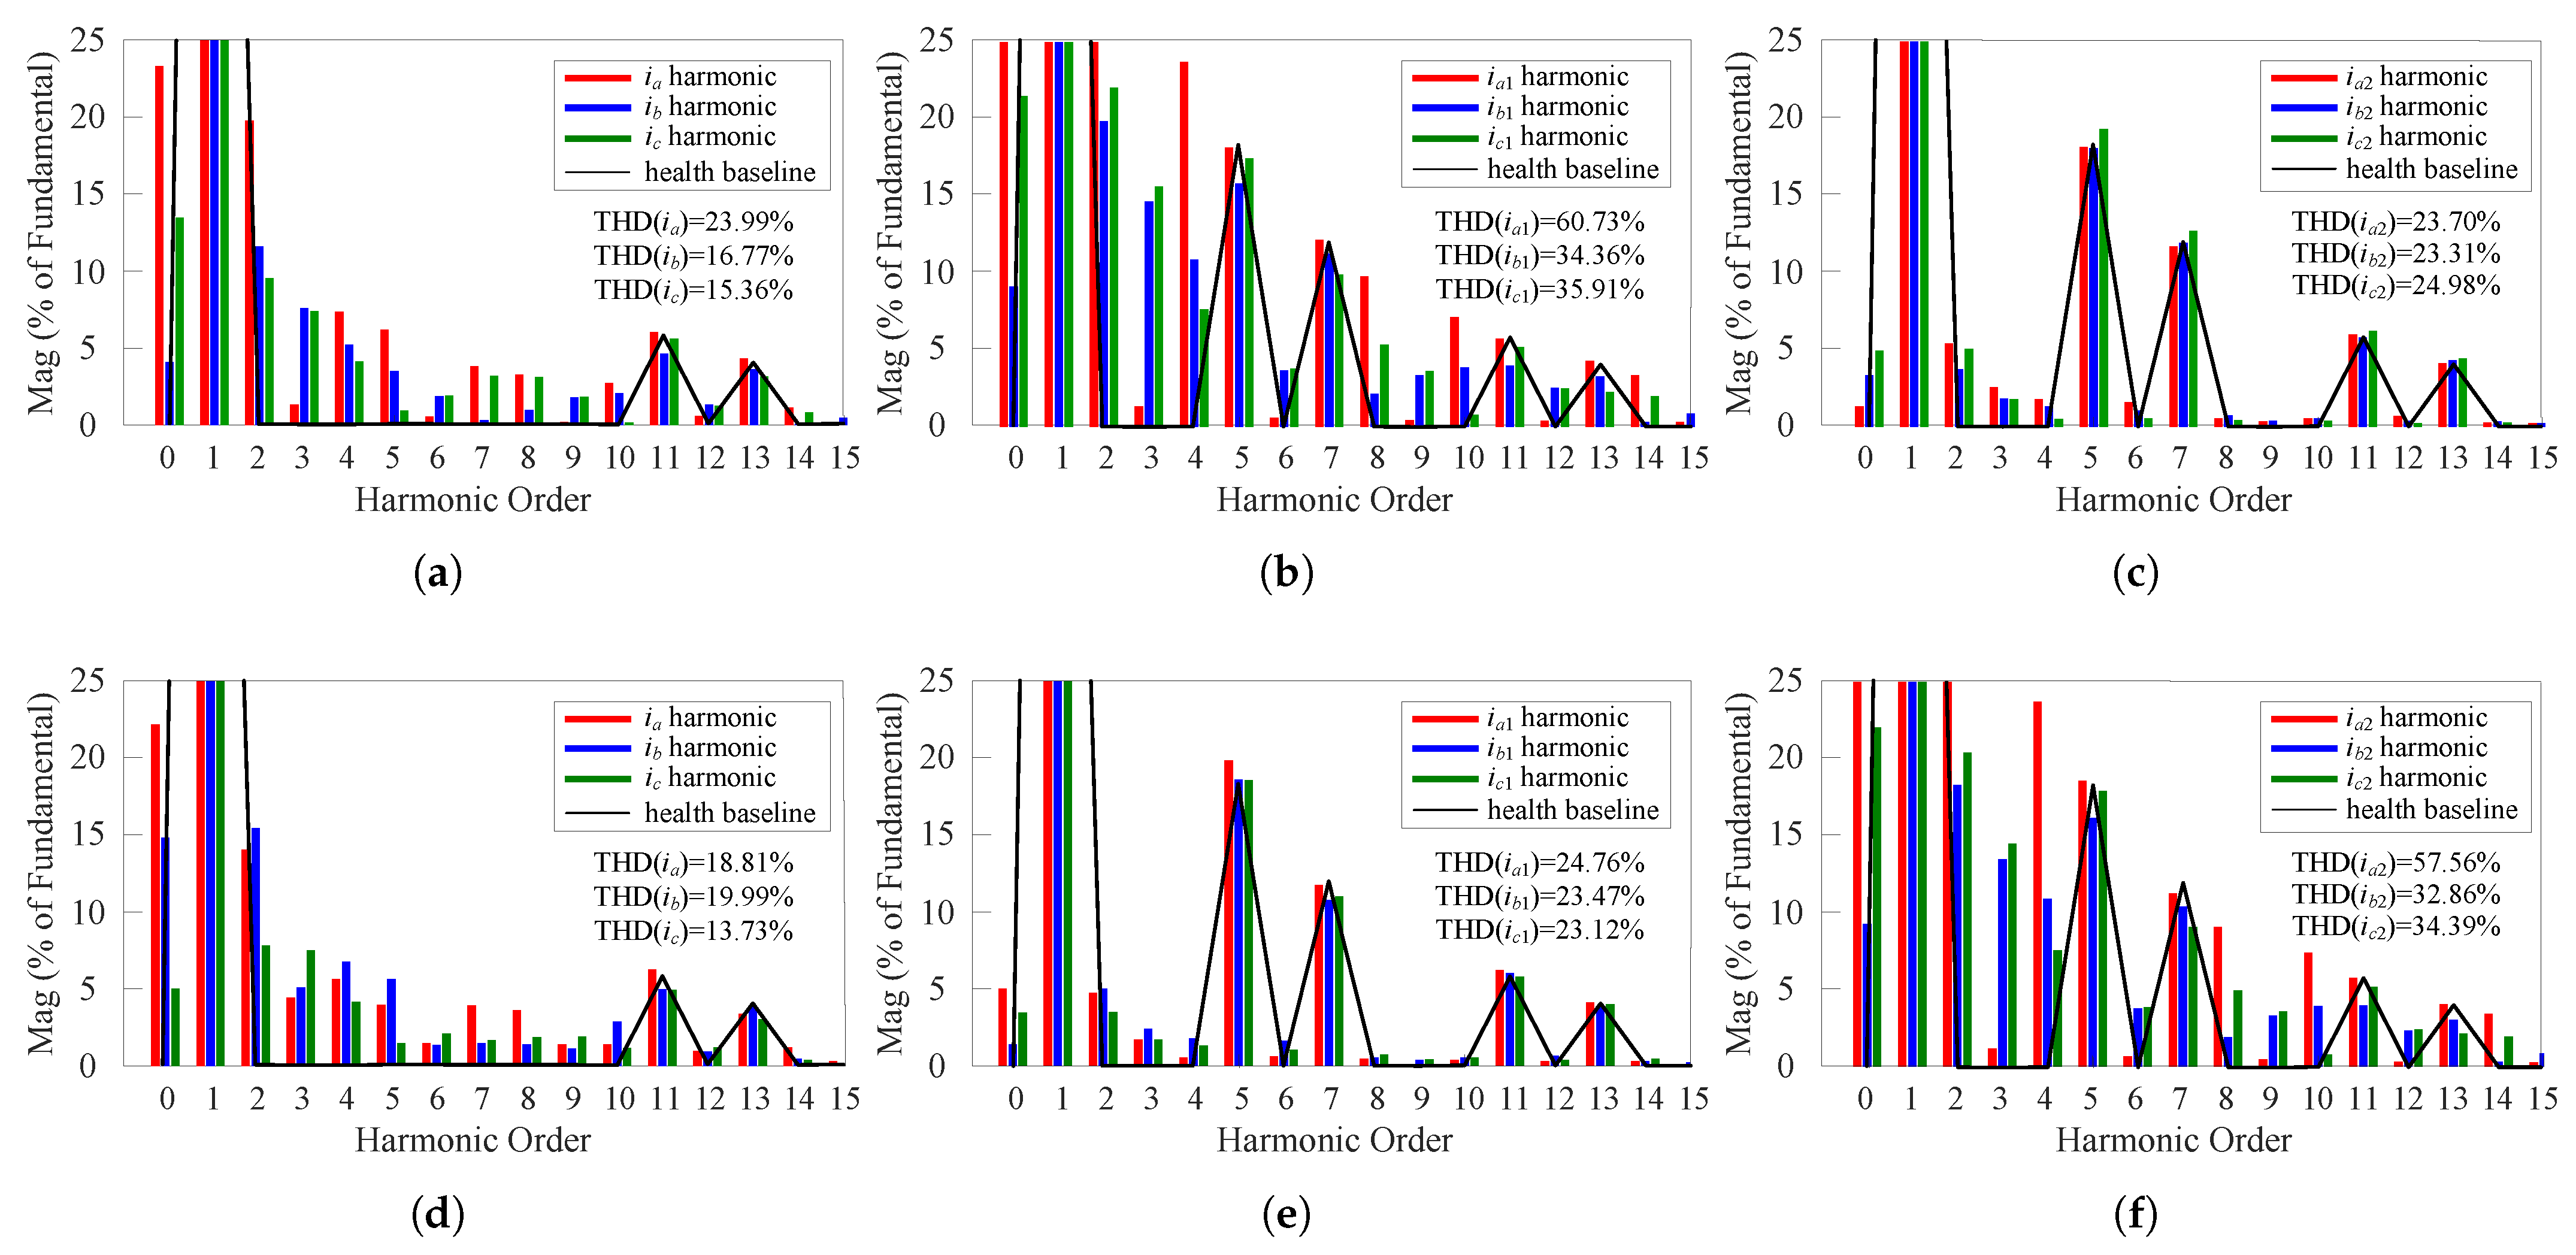
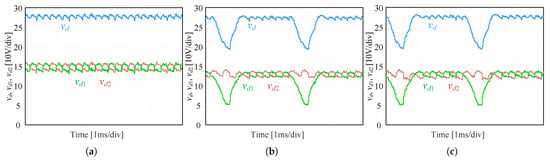
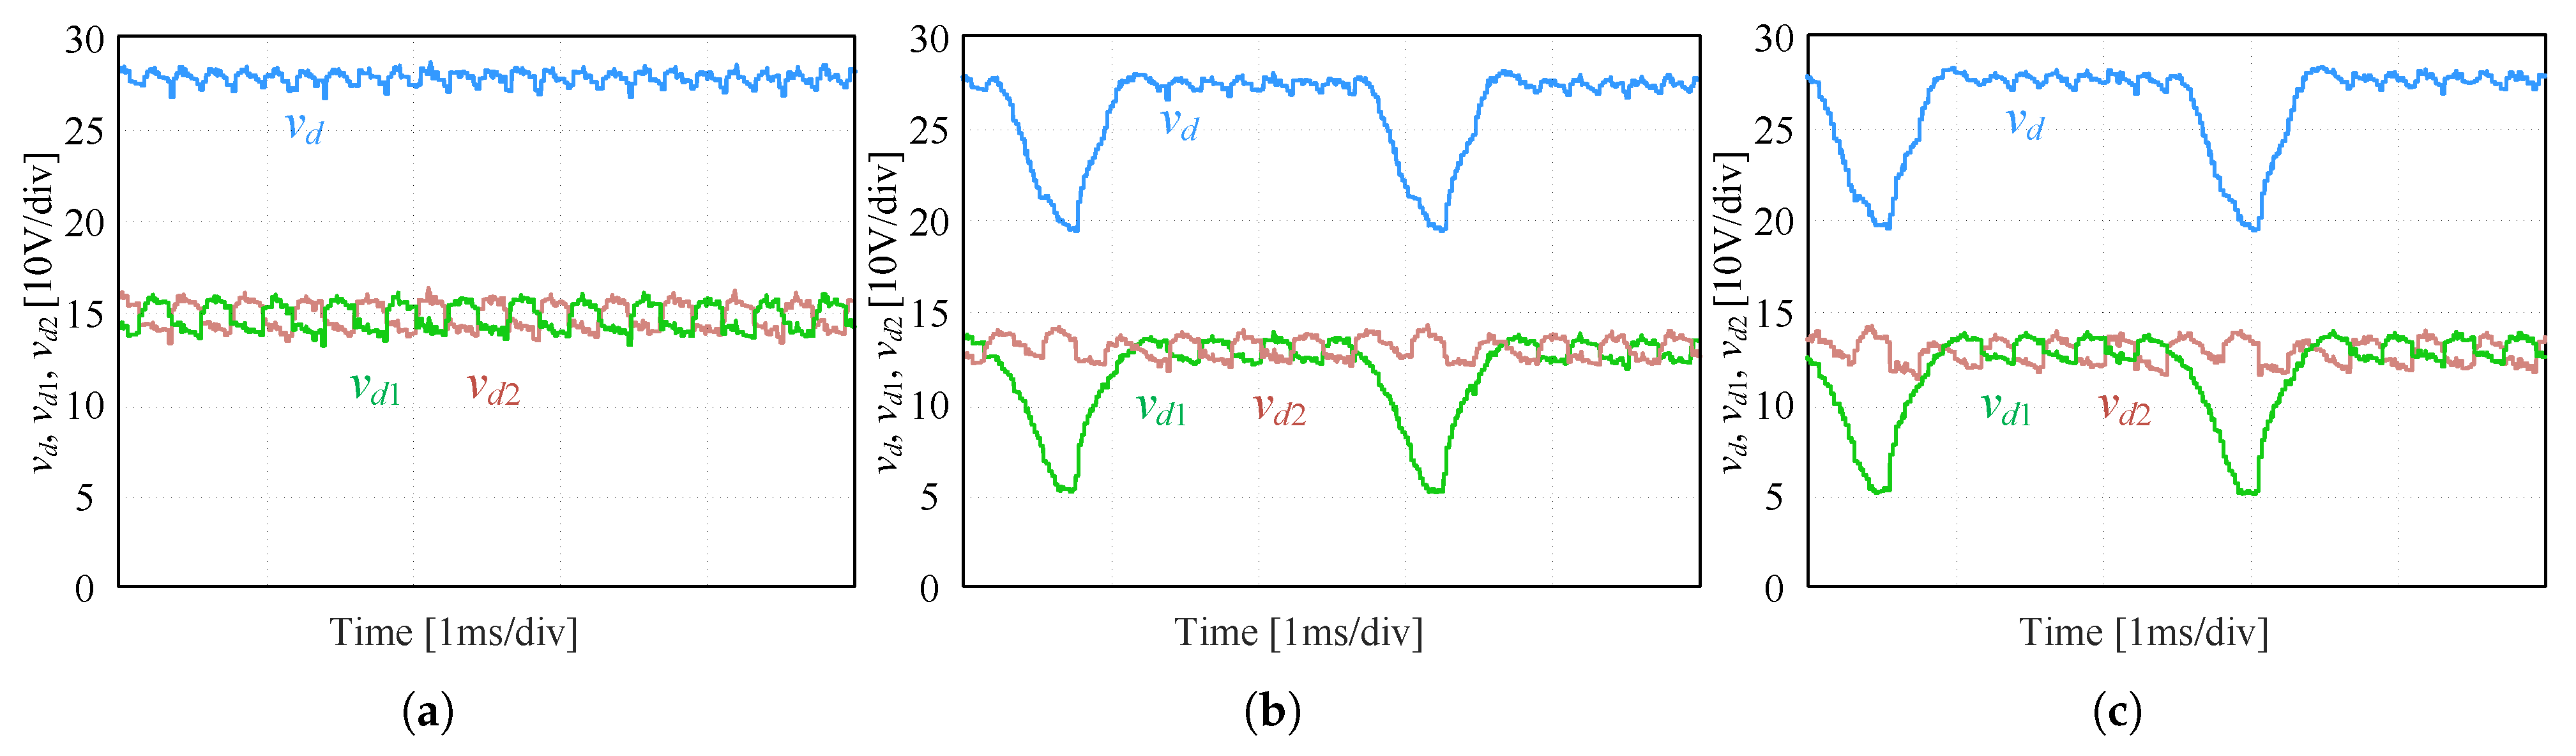
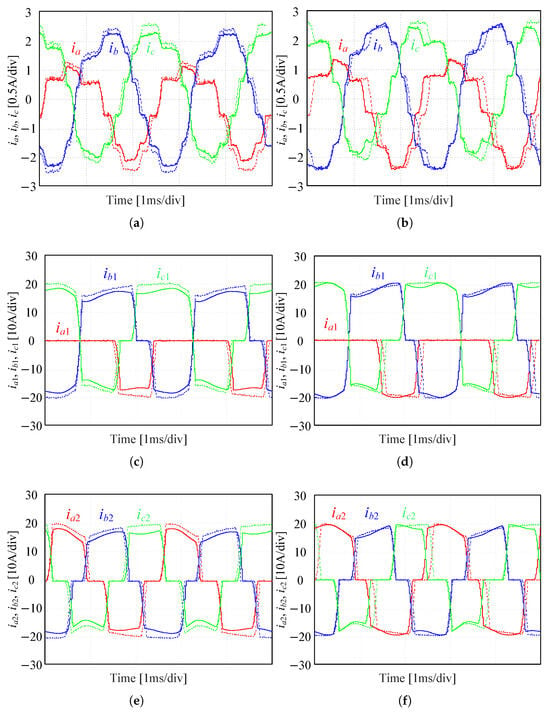
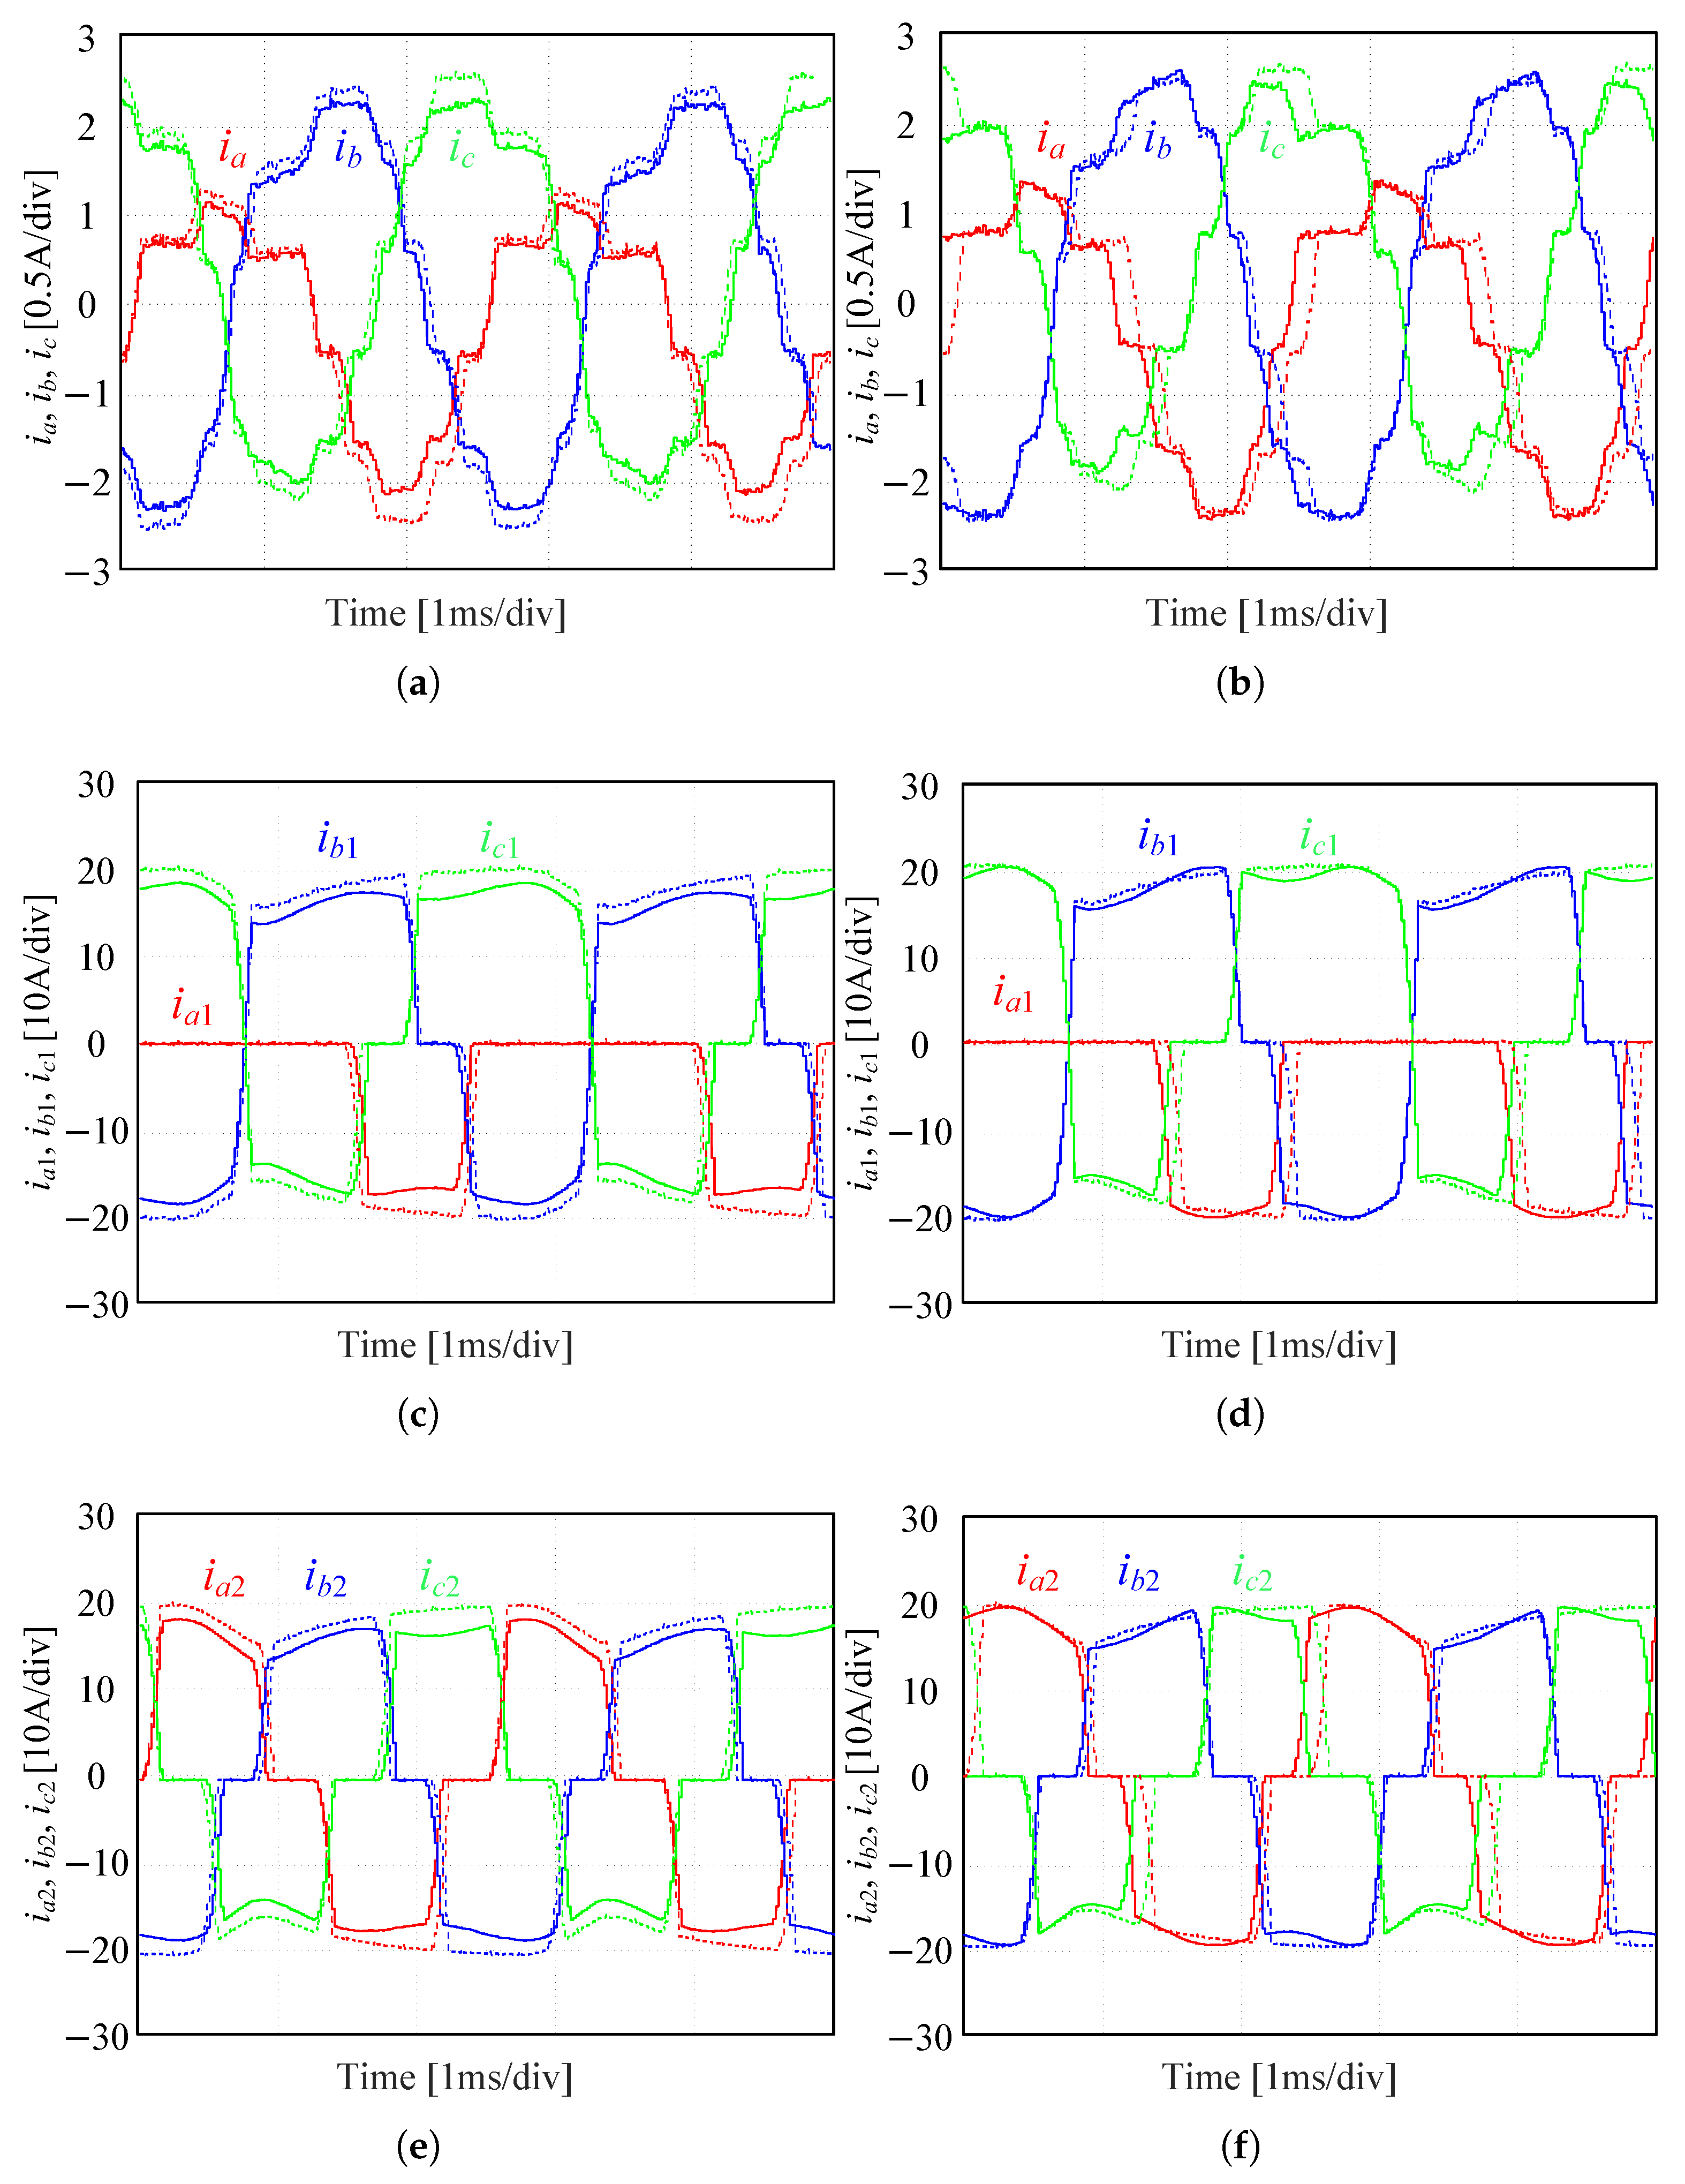
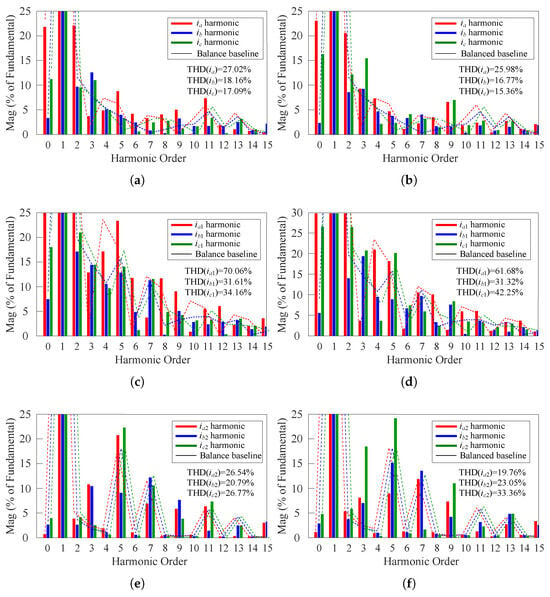
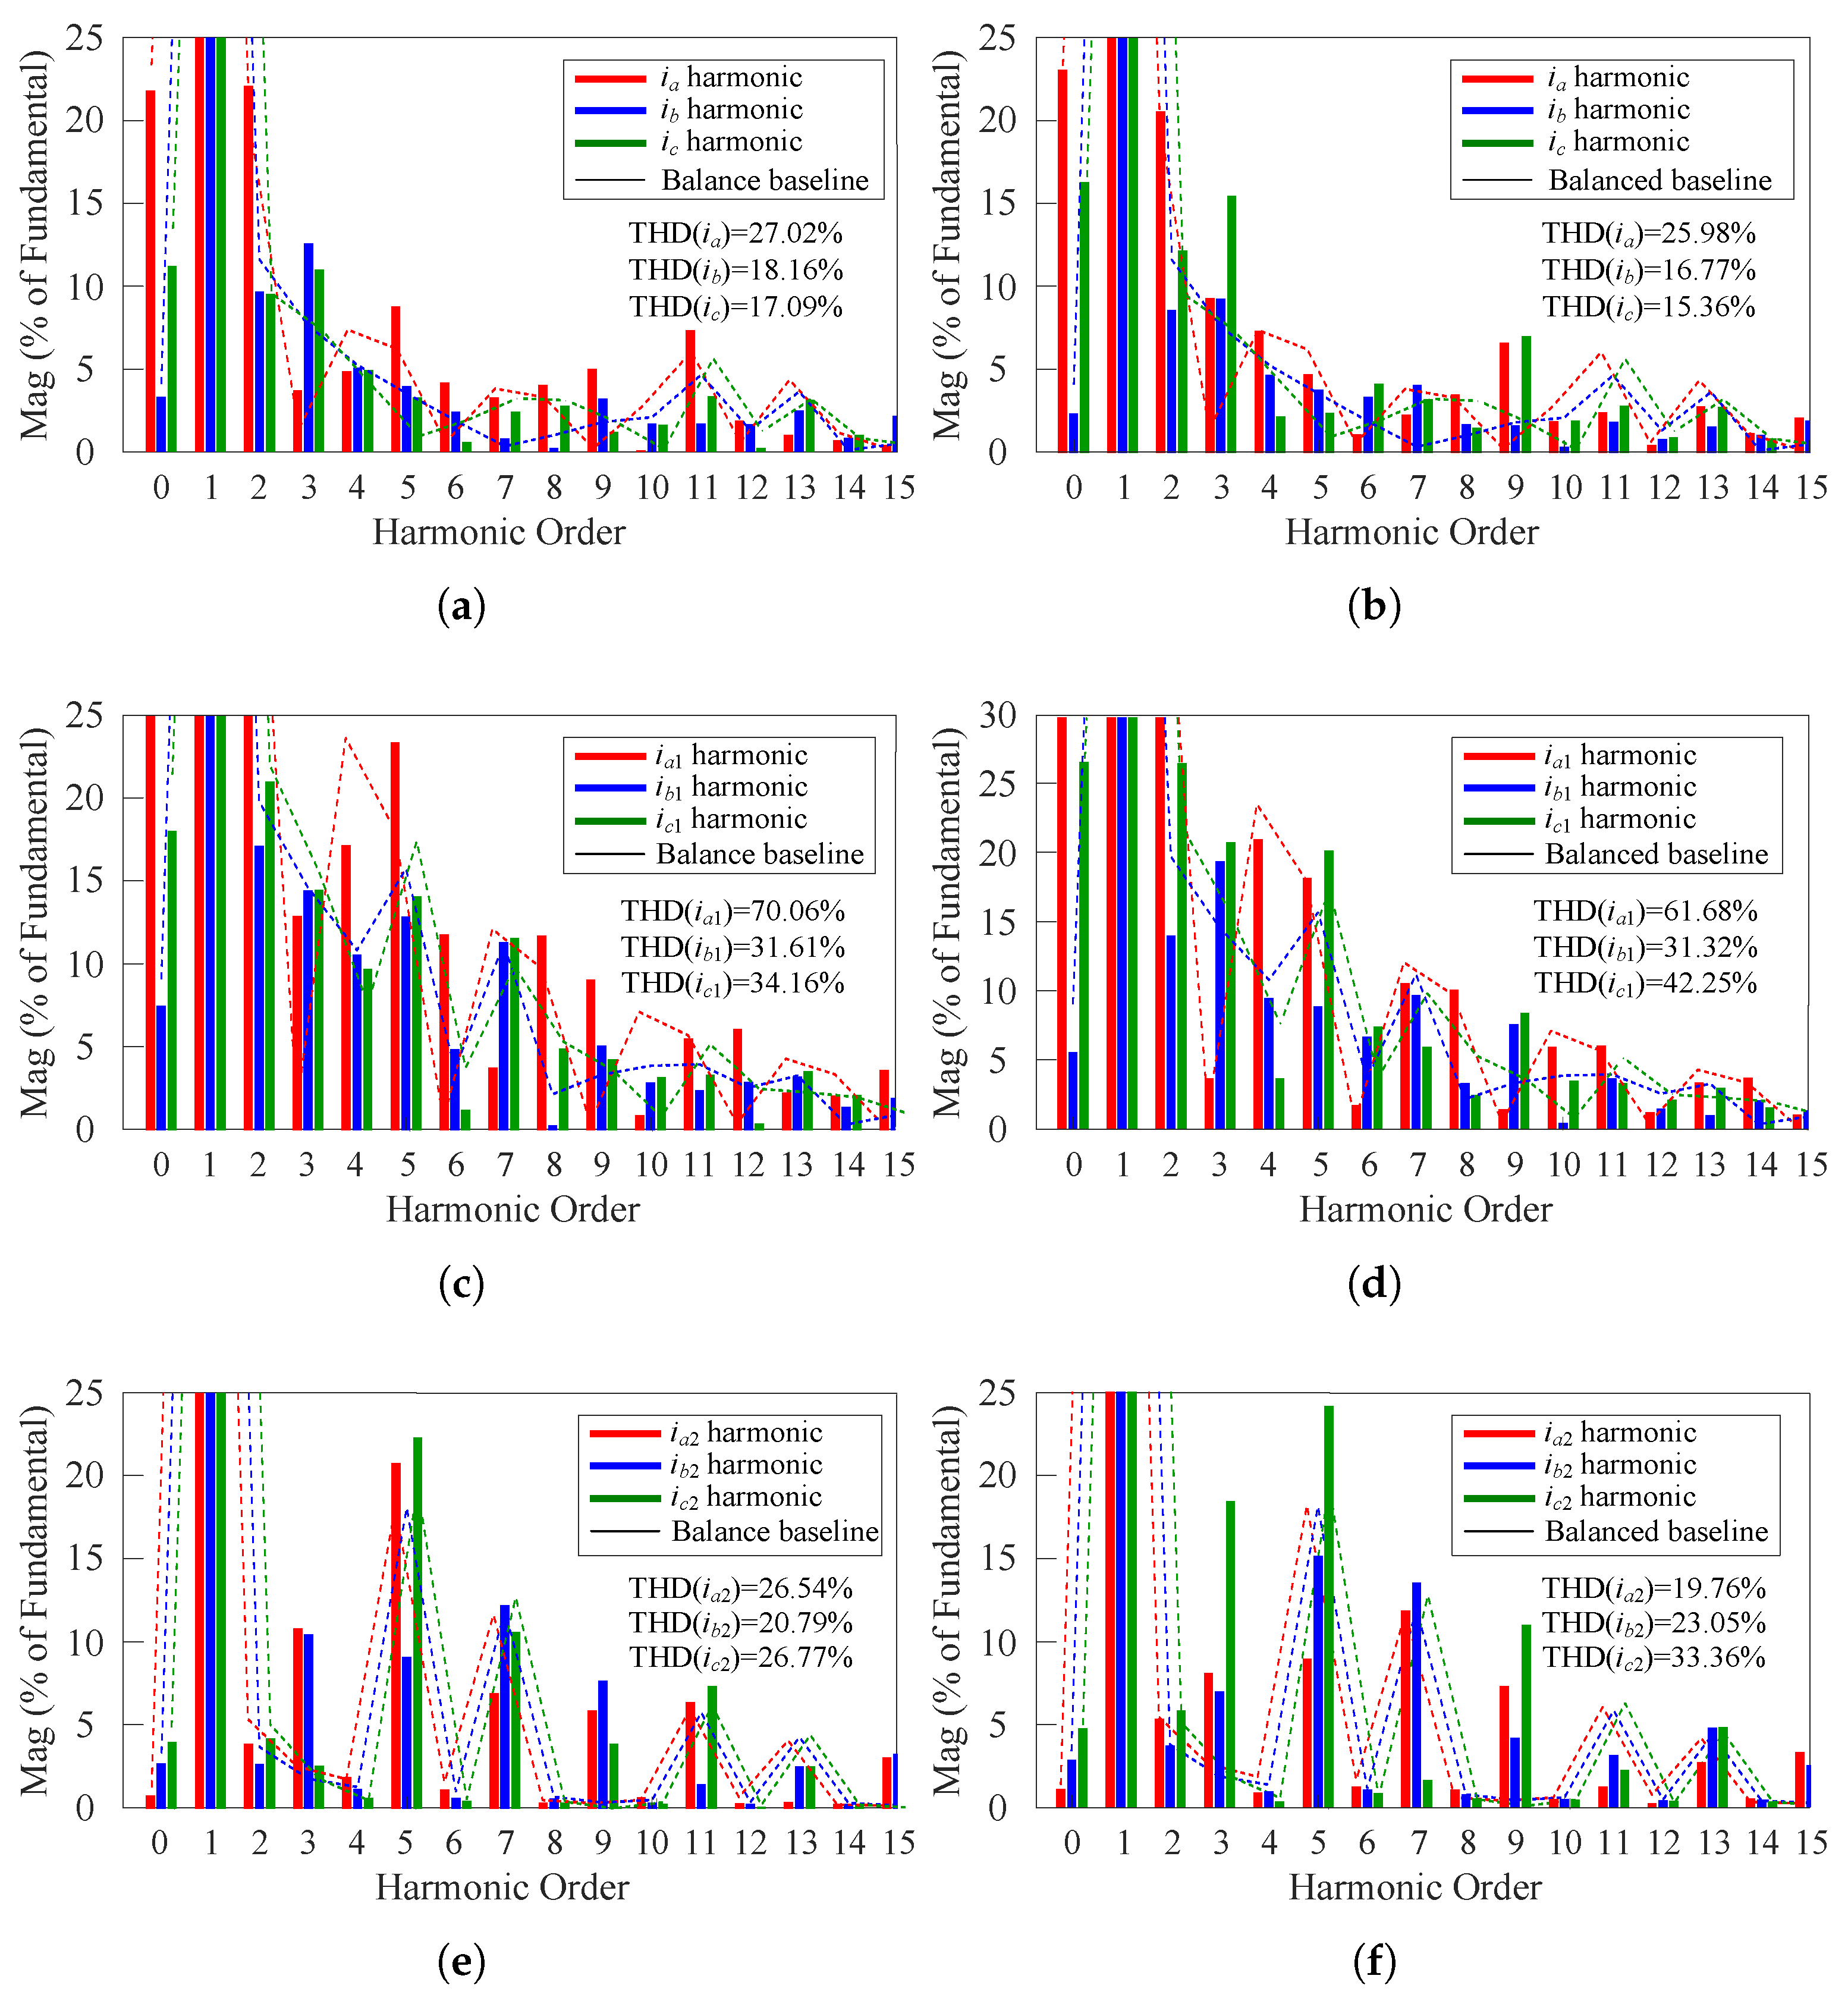
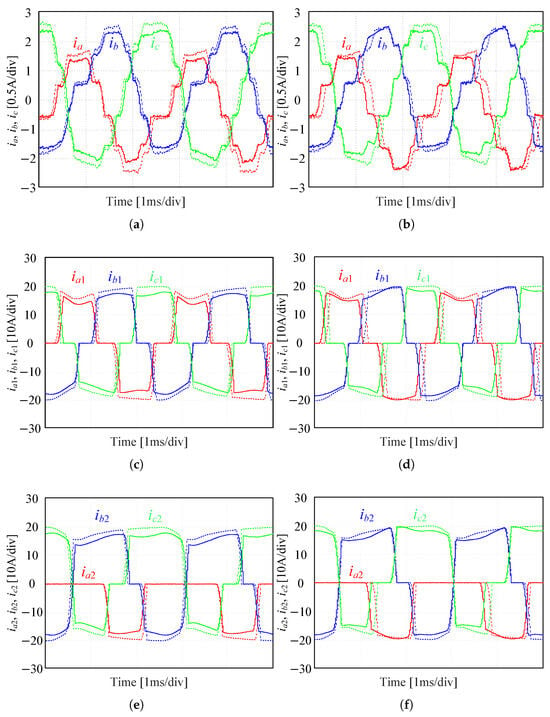
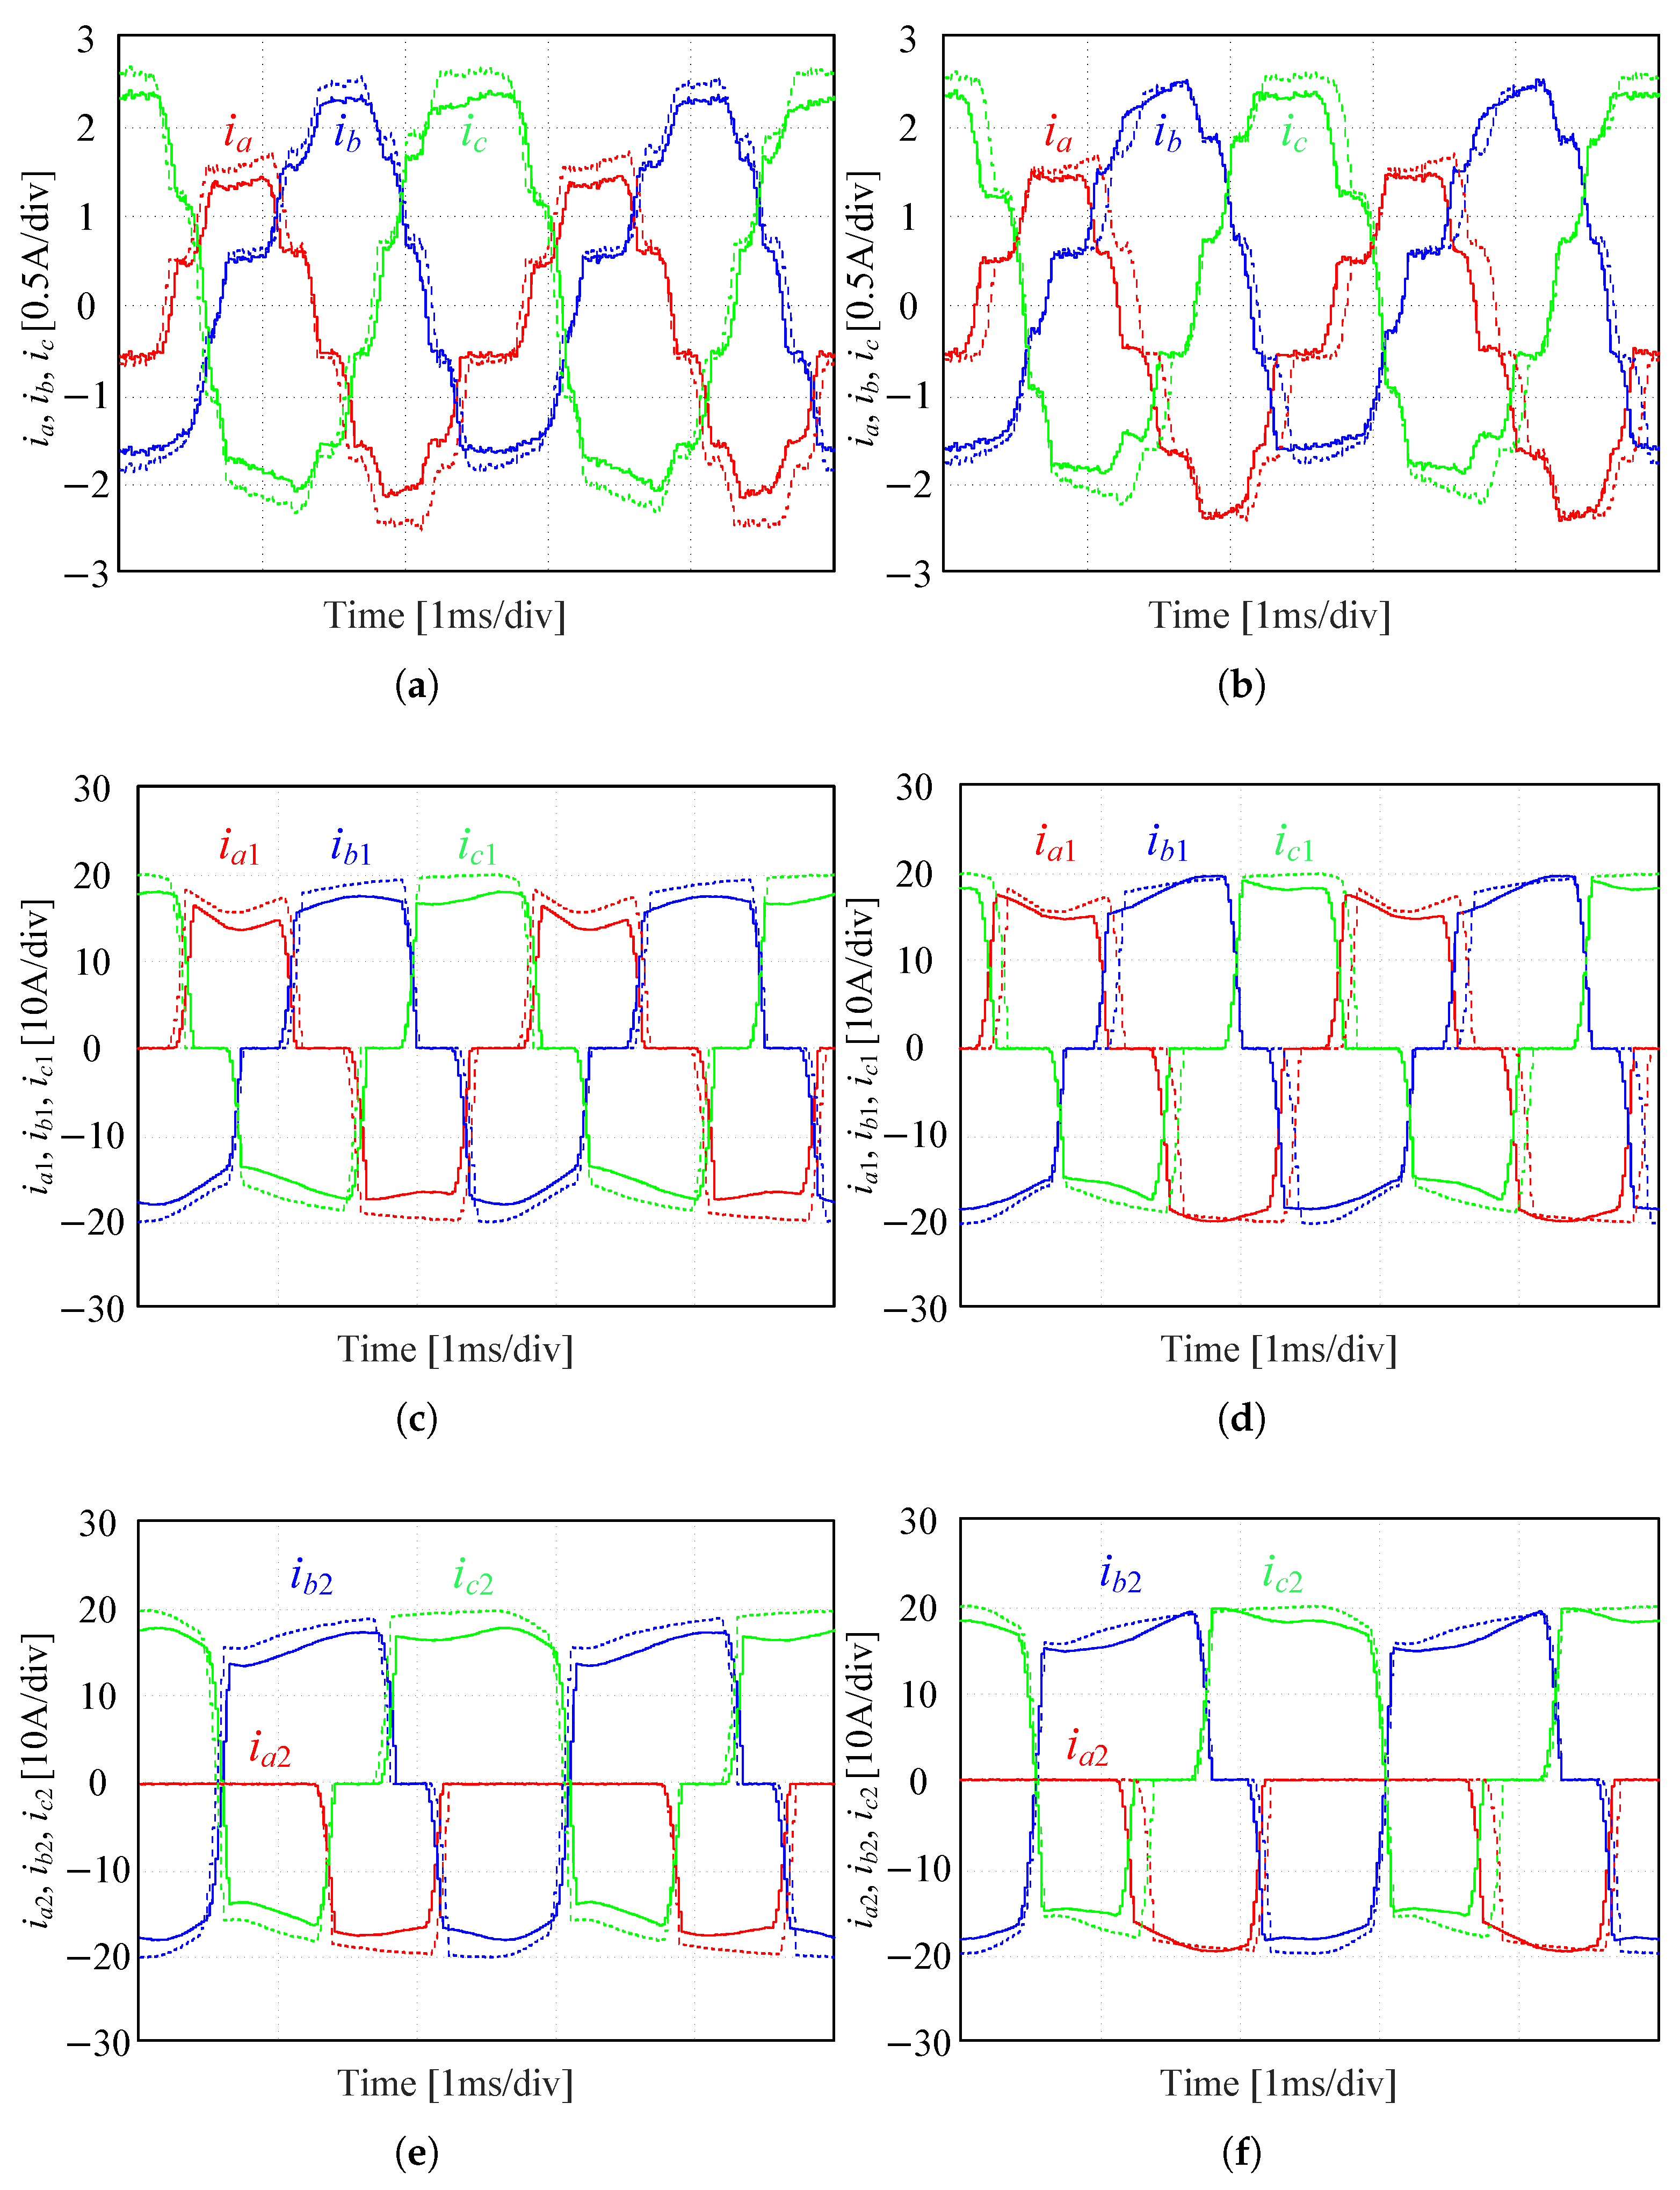
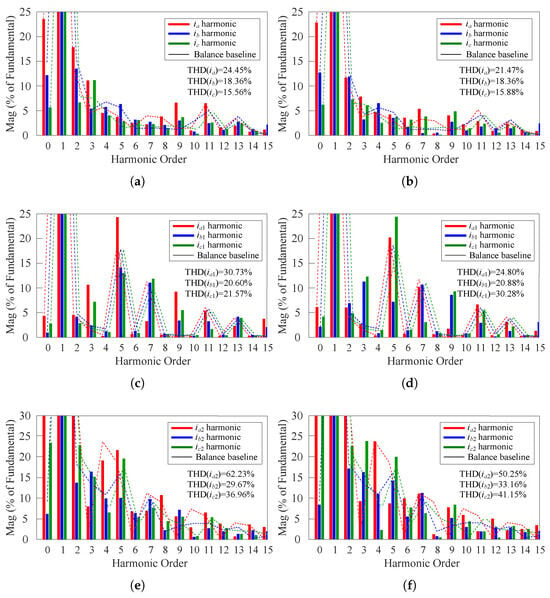
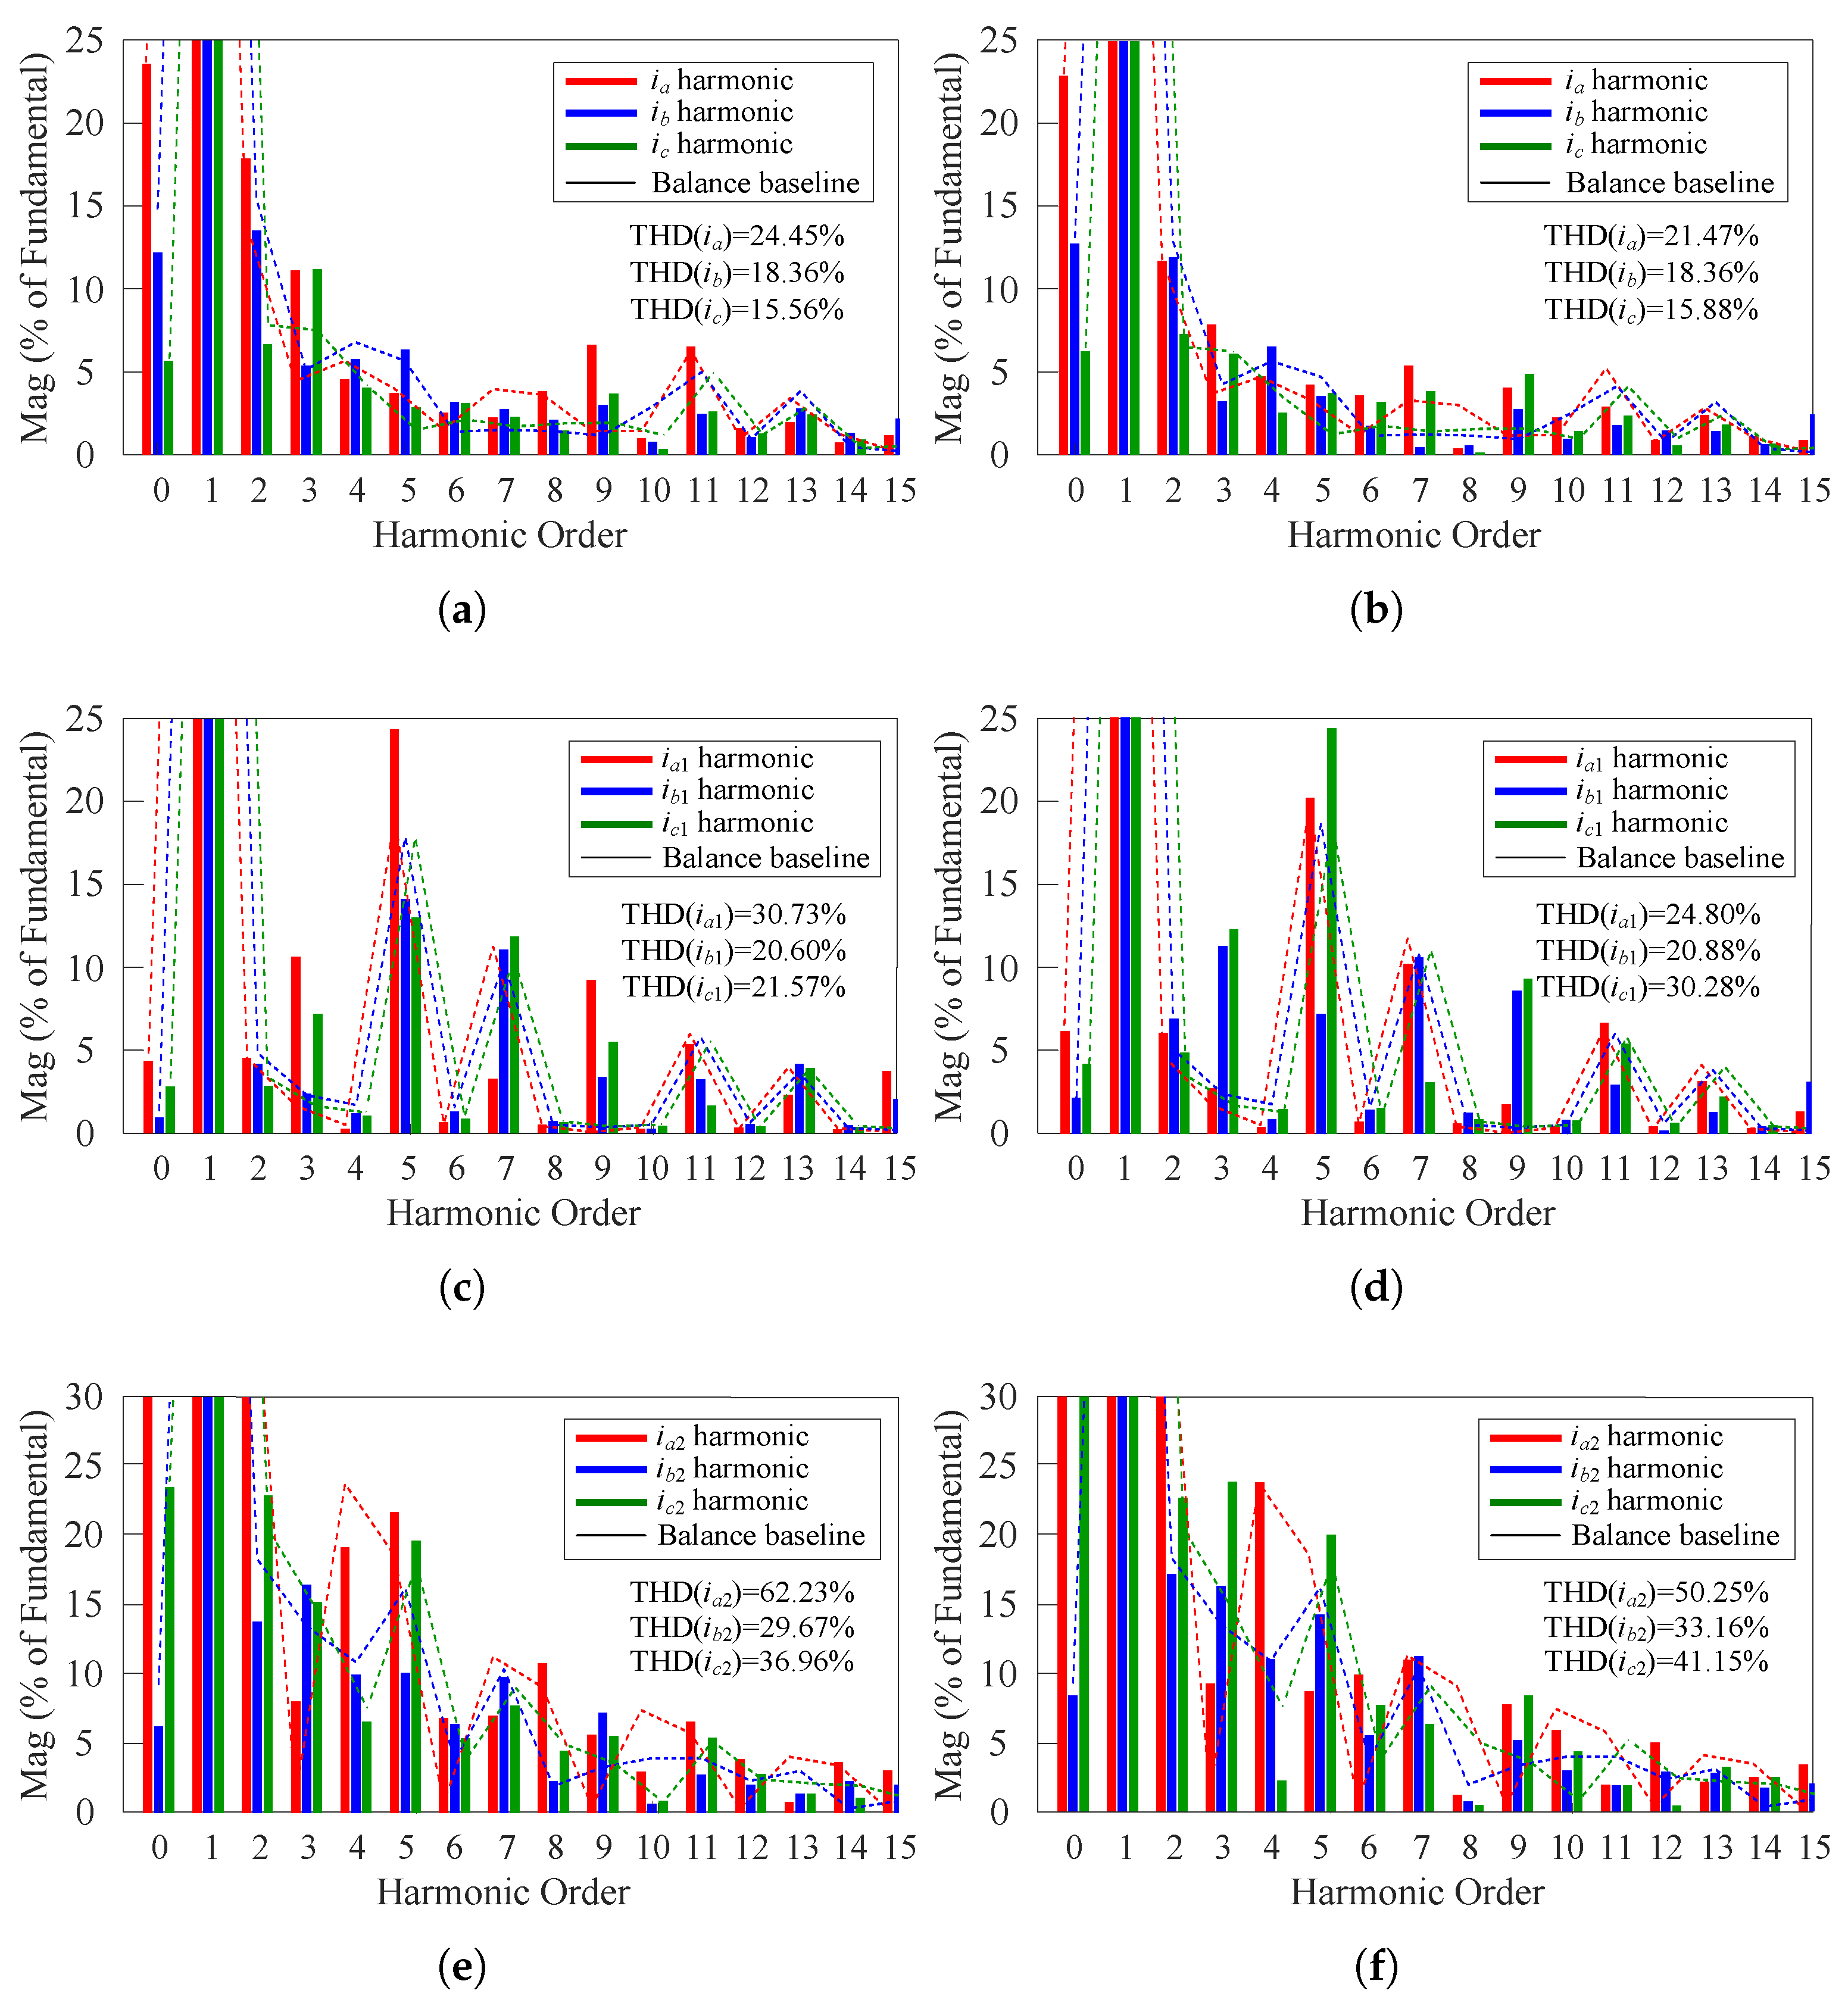
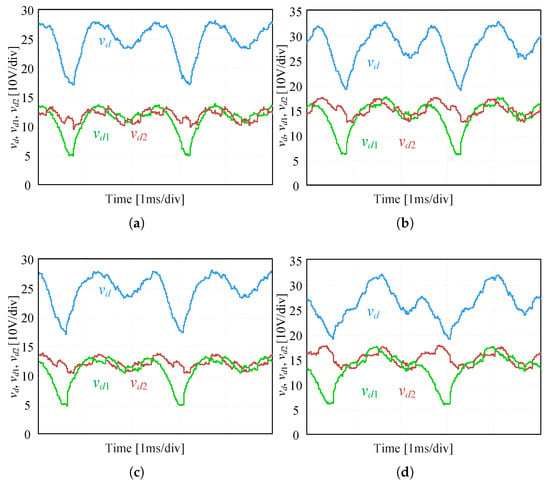
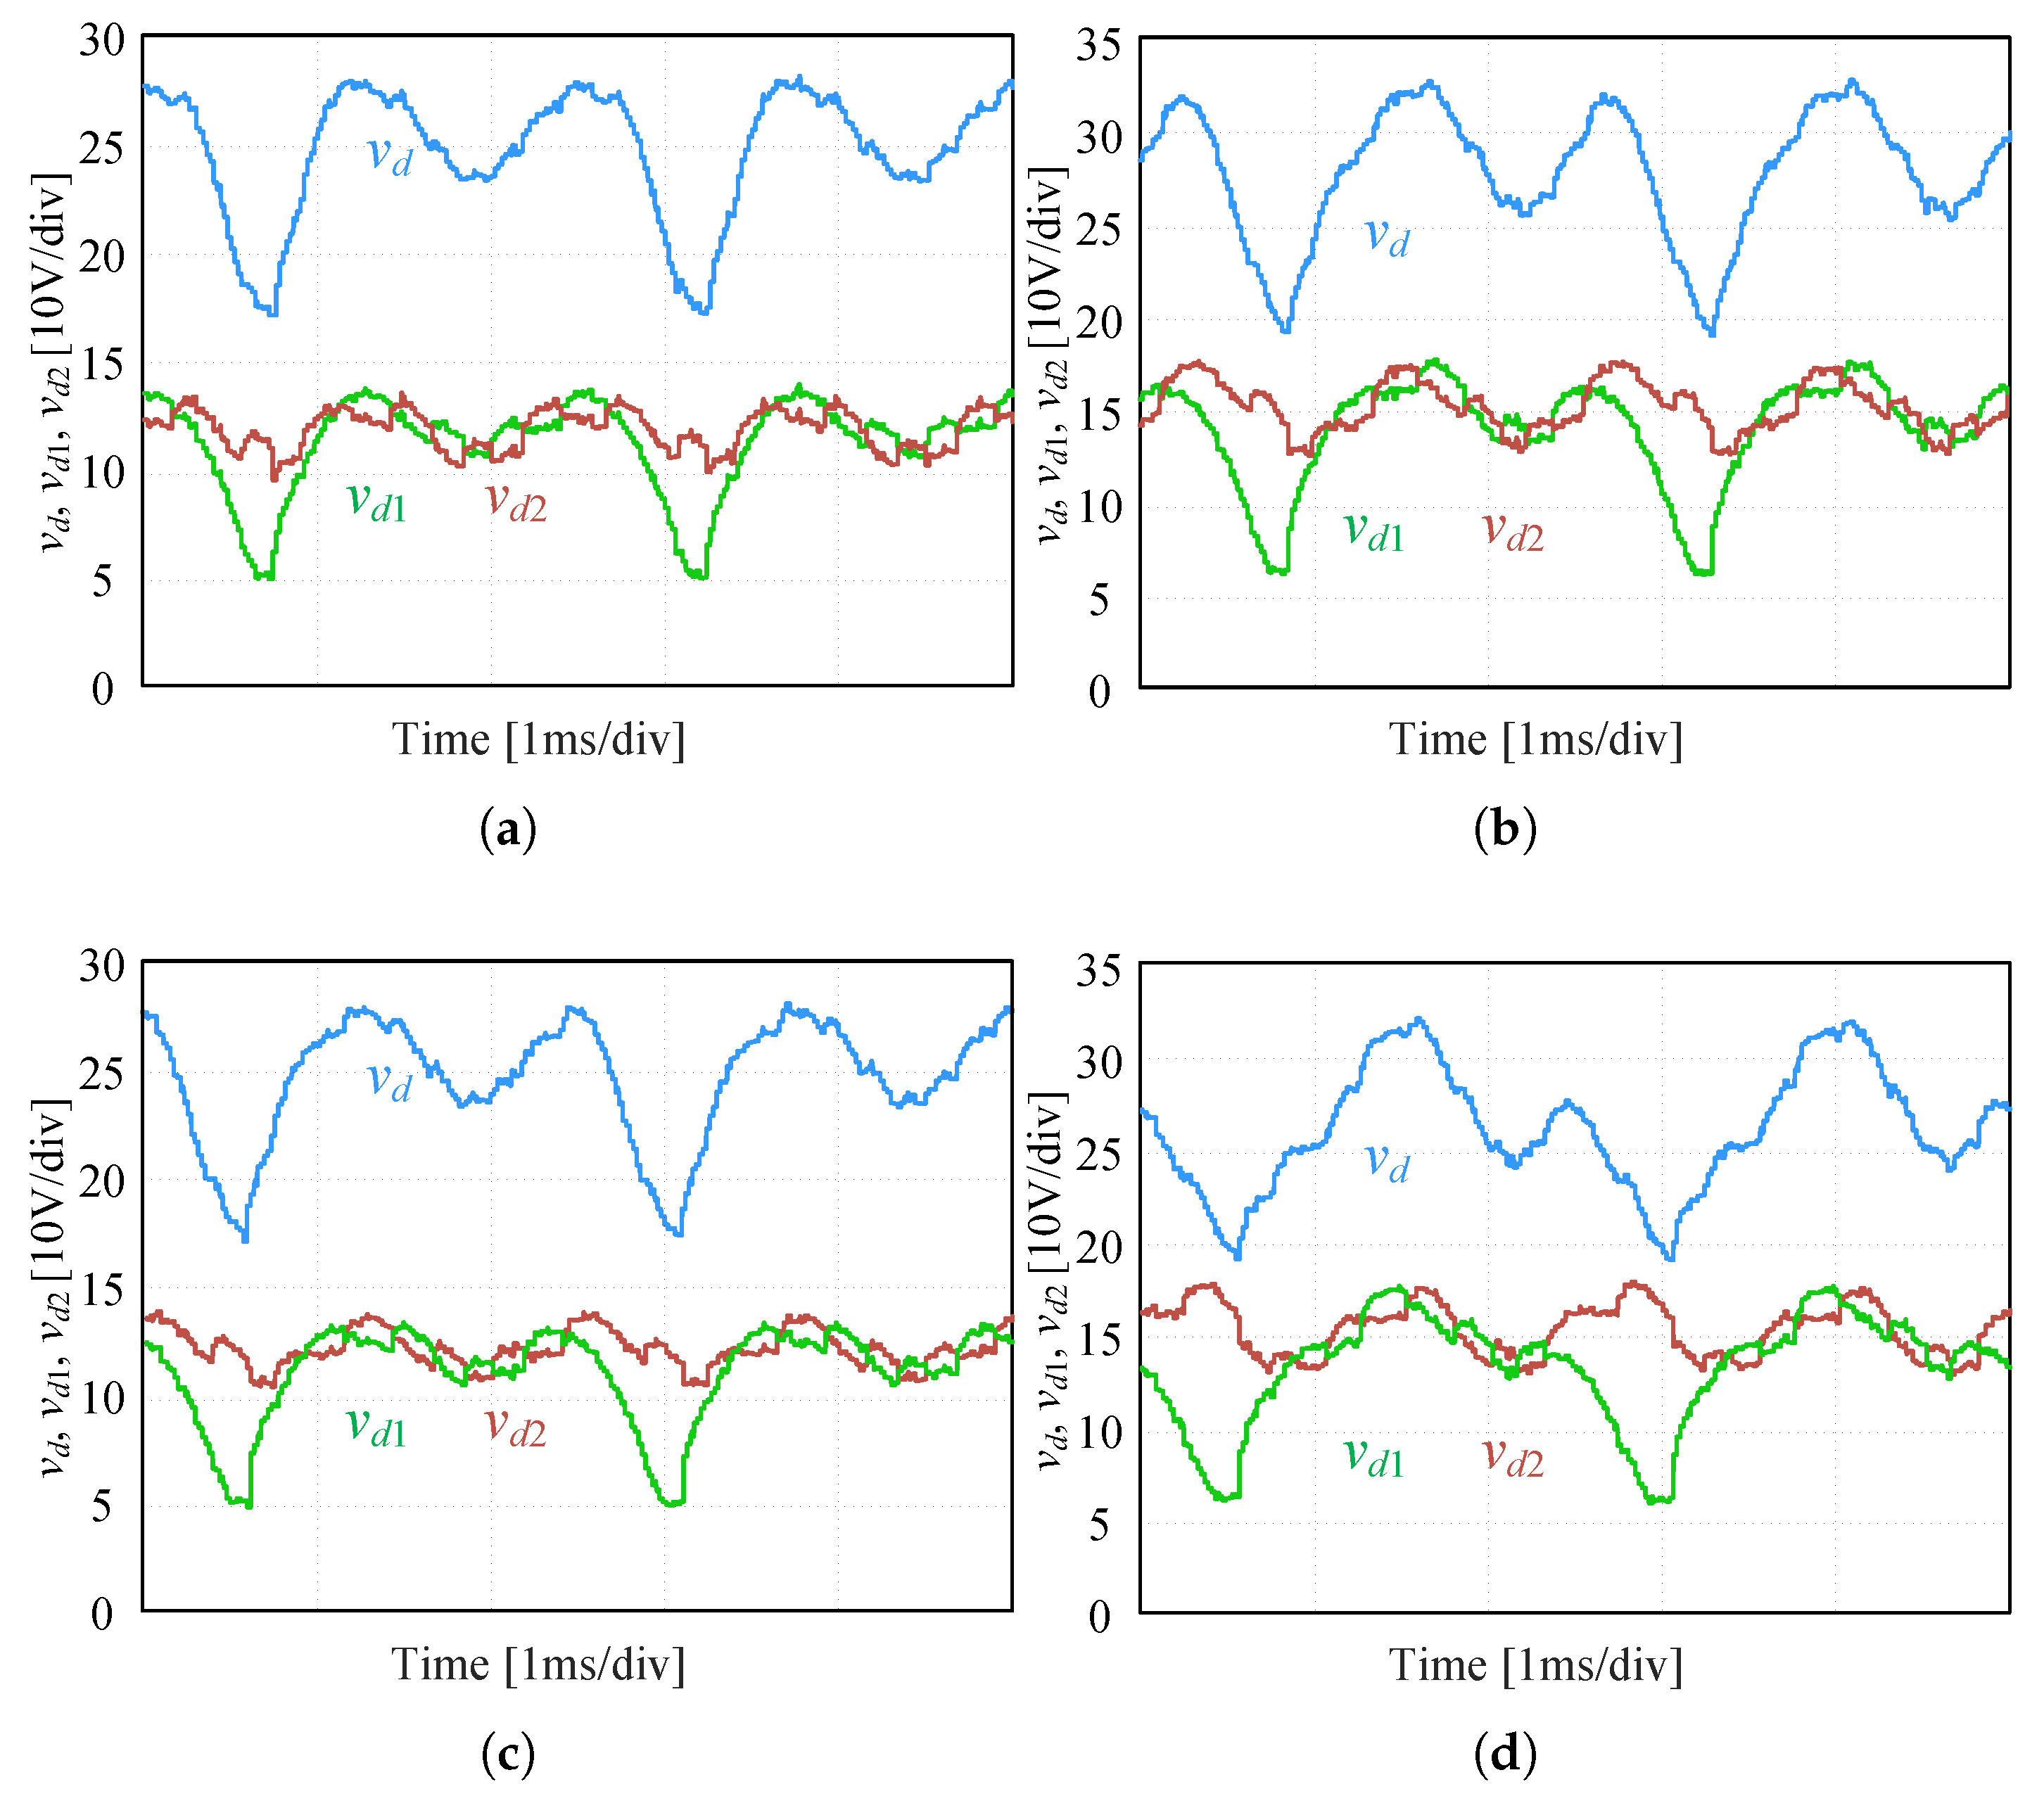

Disclaimer/Publisher’s Note: The statements, opinions and data contained in all publications are solely those of the individual author(s) and contributor(s) and not of MDPI and/or the editor(s). MDPI and/or the editor(s) disclaim responsibility for any injury to people or property resulting from any ideas, methods, instructions or products referred to in the content. |
© 2026 by the authors. Licensee MDPI, Basel, Switzerland. This article is an open access article distributed under the terms and conditions of the Creative Commons Attribution (CC BY) license.