


Abstract
Efficient heat extraction from fractured geothermal reservoirs is strongly controlled by fracture network heterogeneity, well-layout design, and injection operations. In this study, a two-dimensional discrete fracture network (DFN) model incorporating thermo-hydraulic processes was established to investigate the effects of well layout and injection rate on the long-term heat extraction performance in fractured geothermal reservoirs. Two well-layout orientations, specifically 45°/135° and 0°/90°, were designed according to their geometric relationship with the dominant fracture orientations. For each orientation, four well configurations were considered, including one-injection–one-production, one-injection–two-production, one-injection–three-production, and one-injection–four-production schemes. Three injection rates of 1.0, 1.5, and 2.0 kg/s were then assigned to each well layout, resulting in 24 simulation cases. The spatiotemporal evolution of the temperature field, average outlet temperature, total production mass flow rate, and heat-output power were systematically analyzed. The results show that injected cold water preferentially migrates along connected fractures, and that cooling-front propagation is jointly controlled by fracture connectivity, well spacing, and injection–production alignment. When the well alignment is consistent with the dominant fracture orientation, nearly direct preferential flow channels are more likely to form, leading to a faster outlet-temperature decline and a higher thermal-breakthrough risk. Multi-production-well layouts can activate more fracture pathways and improve the total production mass flow rate, but their enhancement effect is limited by competitive flow diversion and local fracture connectivity. Increasing the injection rate enhances early-stage heat-output power but shortens fluid residence time and accelerates thermal breakthrough, thereby reducing long-term thermal stability. Overall, the 0°/90° multi-production-well layouts exhibit better long-term heat-output performance, while a lower injection rate is more favorable for maintaining a stable outlet temperature and heat-output power. These findings provide useful guidance for well-pattern optimization and injection-scheme selection in fractured geothermal reservoirs.
1. Introduction
Geothermal energy is widely regarded as a stable, low-carbon and clean energy source with considerable potential for long-term heat supply, power generation, and regional energy systems [1,2]. Compared with intermittent energy sources such as solar and wind energy, geothermal energy is less affected by diurnal and seasonal fluctuations and can provide a relatively continuous and stable energy output, making it an important component of future clean energy systems [3,4]. Recent advances in geothermal energy exploitation, enhanced geothermal systems (EGSs), and deep fractured geothermal reservoirs have further highlighted the importance of efficient subsurface heat recovery and long-term thermal management [5]. In particular, hot dry rock systems and deep fractured geothermal reservoirs have attracted increasing attention in recent years because of their large heat-storage capacity, broad spatial distribution, and high development potential [6]. However, efficient heat extraction from fractured geothermal reservoirs remains challenging, as fluid migration and heat extraction are jointly controlled by fracture network heterogeneity, injection–production conditions, and thermo-hydro-mechanical coupling processes [7,8].
In fractured geothermal reservoirs, fractures usually provide the dominant pathways for fluid migration, whereas the rock matrix mainly acts as a heat-storage and heat-supply medium [9]. During long-term injection–production circulation, the low-temperature injected fluid preferentially flows through highly permeable fracture networks and exchanges heat with the surrounding hot rock mass [10,11]. As the cooling process continues, the reservoir temperature field evolves continuously, and thermal contraction of the rock mass may further change fracture apertures, permeability, and flow-path distribution [12,13]. Therefore, heat extraction from fractured geothermal reservoirs is not a single seepage or heat-transfer process, but a complex process involving the coupled evolution of the seepage field, temperature field, and stress field [14]. Establishing a thermo-hydro-mechanical coupled model is thus essential for revealing the dynamic relationships among fracture flow, reservoir cooling, stress redistribution, and fracture-conductivity evolution.
Well layout is one of the key engineering factors affecting the heat extraction performance of fractured geothermal systems [15]. The relative positions of injection and production wells determine the main flow direction, the effective thermal sweep region, and the possibility of an early thermal breakthrough [16]. When the injection–production alignment is consistent with the dominant fracture orientation, the injected fluid is more likely to rapidly migrate along highly connected fractures and form preferential flow channels. This may result in a high early-stage flow rate, but it may also lead to insufficient heat exchange and a rapid decline in the production-well outlet temperature [17]. In contrast, when the well layout promotes more dispersed flow paths, the cooling front propagates more slowly and the thermal sweep region becomes more uniform, which is beneficial for delaying thermal breakthrough and improving long-term heat extraction stability [18,19]. In addition, multi-production-well layouts can enhance the utilization of fracture networks and enlarge the flow-affected region, but they may also introduce competitive flow among production wells, resulting in more complex temperature-field and flow-field responses [20].
The injection rate is another important factor affecting the heat extraction performance [21]. A higher injection rate can enhance early-stage fluid circulation and increase the heat-output power of the system over a short period [22]. However, excessive injection shortens the residence time of the working fluid in the reservoir and accelerates the migration of the cooling front, thereby inducing premature thermal breakthrough [23]. Conversely, a lower injection rate may reduce the early-stage heat extraction capacity, but it is more favorable for maintaining a higher production-well outlet temperature and long-term thermal stability [24]. Therefore, the influence of the injection rate should not be discussed as an independent operational parameter, but should be considered together with the well-layout orientation and fracture network structure.
Previous studies have investigated heat extraction from fractured geothermal reservoirs from several perspectives, including fracture network characterization, thermo-hydro-mechanical coupling simulation, well-layout optimization, and operational-parameter regulation [25,26,27]. In terms of fractured reservoir modeling, discrete fracture network models have been widely used to characterize the effects of fracture geometry, connectivity, and preferential flow channels on geothermal exploitation [17]. Related studies have shown that fracture density, fracture length, fracture orientation, fracture aperture, and fracture connectivity can significantly change fluid migration pathways in the reservoir, thereby affecting the cooling-front propagation, thermal-breakthrough time, and the thermal sweep region [24,28]. Compared with equivalent porous-media models, discrete fracture network models can more directly represent fracture-dominated flow and local preferential-channel effects, and have therefore been widely applied in simulations of fractured hot dry rock reservoirs and enhanced geothermal systems.
Regarding multiphysics coupling, thermo-hydro-mechanical numerical simulation has become an important approach for studying the long-term response of geothermal reservoirs [29]. After the low-temperature fluid is injected into the reservoir, the decrease in reservoir temperature can induce thermal contraction and stress redistribution in the rock mass, which may further change fracture apertures, permeability, and flow pathways [30]. Meanwhile, variations in pore pressure can also alter the effective stress acting on fracture surfaces, thereby affecting fracture conductivity [31]. Therefore, the heat extraction process in geothermal reservoirs is not simply a heat-transfer or seepage problem, but the result of interactions among fluid migration, heat exchange, and rock deformation. Existing studies based on THM-coupled models have revealed the effects of injection temperature, reservoir permeability, fracture aperture, and the stress state on heat extraction performance, providing an important basis for understanding thermal breakthrough, permeability evolution, and reservoir stability during geothermal exploitation [23,27,32].
In terms of engineering operational parameters, well layout and injection rate are generally regarded as the key controllable factors influencing geothermal system performance [23]. The distance and relative position between injection and production wells can change the dominant flow direction, thereby affecting the effective heat-exchange area and the thermal-breakthrough risk [19,33]. When the injection–production alignment is consistent with the dominant fracture orientation, the fluid is more likely to form rapid flow channels along highly connected fractures [34]. Although this is beneficial for increasing the early-stage flow rate, it may also result in insufficient heat exchange and a rapid decline in the outlet temperature. Multi-production-well layouts can enlarge the production-affected region and improve the utilization of fracture networks, but they may also cause competitive flow among production wells, resulting in more complex local flow distribution and temperature-field responses [35,36]. In addition, a higher injection rate can usually improve the early-stage circulation intensity and instantaneous heat-output power, but it shortens the residence time of the fluid in the reservoir and accelerates cooling-front propagation, thereby inducing premature thermal breakthrough. In contrast, a lower injection rate is more favorable for maintaining the long-term outlet temperature and heat-output stability.
Although previous studies have provided important insights into heat extraction from fractured geothermal reservoirs, several issues remain insufficiently clarified. First, many studies have examined only a single well pattern or a limited number of injection–production configurations, and systematic comparisons among different well layouts under the same fracture network condition remain limited. Because fracture networks are stochastic and heterogeneous, using different fracture network realizations for different well schemes makes it difficult to distinguish the influence of the well layout from that of fracture network variability. Second, the geometric matching relationship between the well-layout orientation and the dominant fracture orientation has not been sufficiently quantified under a unified DFN framework. Third, the combined influence of the production-well number and the injection rate on flow-path organization, outlet-temperature decline, mass flow response, and long-term heat-output performance remains unclear. Therefore, a unified DFN-based thermo-hydraulic comparison is needed to clarify how the well layout and the injection rate jointly regulate the long-term heat extraction performance of fractured geothermal reservoirs.
In addition, the influence of multi-production-well layouts on flow-path organization and heat extraction response remains unclear. Increasing the number of production wells does not necessarily lead to a linear improvement in the heat extraction performance, because competitive flow among multiple wells may occur. This process may enlarge the thermal sweep region, but it may also alter local preferential channels and the thermal-breakthrough process. The injection rate and the well layout are also often discussed separately, although they jointly control the fluid residence time, the pressure gradient, the cooling-front migration rate, and the heat-output evolution. A systematic analysis of the coupled effects of the well layout and the injection rate under a unified fracture network, a unified thermo-hydraulic DFN model, and unified evaluation indicators is still lacking.
Based on these considerations, this study establishes a two-dimensional DFN-based thermo-hydraulic model to investigate the coupled effects of the well-layout orientation, the production-well number, and the injection rate on heat extraction performance of fractured geothermal reservoirs. Under the same reservoir geometry and fracture network condition, two well-layout orientations, specifically 45°/135° and 0°/90°, are designed, and four well configurations are considered for each orientation, including one-injection–one-production, one-injection–two-production, one-injection–three-production, and one-injection–four-production schemes. Three injection rates of 1.0, 1.5, and 2.0 kg/s are then assigned to each well layout, resulting in 24 simulation cases. The spatiotemporal evolution of the temperature field, outlet-temperature response, total production mass flow rate, and heat-output power are analyzed to clarify how well layout and injection rate jointly regulate cooling-front propagation, thermal-breakthrough behavior, fluid circulation capacity, and long-term heat-output performance.
2. Thermo-Hydro-Mechanical Coupled Model and Validation
2.1. Model Assumptions
To reasonably describe the thermo-hydro-mechanical (THM) coupling processes in the rock matrix and the fracture system during geothermal exploitation, while improving the numerical efficiency and convergence stability, it is necessary to simplify the complex reservoir geometry and nonlinear processes. By neglecting secondary factors that have limited influence on the macroscopic heat extraction response, parameter uncertainty can be reduced and numerical reproducibility can be improved. On the premise that the dominant physical responses are effectively captured, the following assumptions are adopted in this study:
- (1)
- The geothermal reservoir is simplified as a two-dimensional porous medium composed of a rock matrix and discrete fractures. Because the permeability of the rock matrix is much lower than that of the fractures, the rock matrix is treated as an isotropic porous medium with constant permeability. Its mechanical deformation is assumed to be linearly elastic and to follow the generalized Hooke’s law.
- (2)
- The working fluid in the reservoir is considered as a saturated single-phase fluid, and its flow behavior follows Darcy’s law. The high-pressure environment in deep geothermal reservoirs suppresses phase transitions; therefore, the working fluid remains in the liquid phase throughout the simulation.
- (3)
- Local thermal equilibrium is assumed between the rock matrix and the fluid, meaning that the solid and fluid phases have the same temperature at any given spatial location and time. Heat transfer mainly comprises heat conduction in the rock mass and advective heat transport by the fluid, while thermal radiation and thermal dispersion are neglected.
- (4)
- The fracture aperture is controlled by changes in the effective stress. Fracture permeability varies with fracture aperture and follows the cubic law. The coupling among rock deformation, pore-pressure variation, and temperature change is described through poroelastic and thermoelastic effects.
2.2. Governing Equations
2.2.1. Fluid Flow in Porous Media
Fluid flow in saturated porous media can be described by combining the mass conservation equation with Darcy’s law. The mass balance equation for single-phase fluid flow in the rock matrix is expressed as:
where ρf is the fluid density, kg/m3; Ss is the specific storage coefficient, 1/Pa; p is the pore pressure, Pa; u is the Darcy velocity, m/s; and Qm is the mass source/sink term, kg/(m3·s). The Darcy velocity is given by:
where κ is the reservoir permeability, m2; and μ is the dynamic viscosity of the fluid, Pa·s. For the discrete fracture network, the mass conservation equation for fracture flow is modified based on the matrix flow equation. The governing equation for fluid flow in fractures is written as:
where df is the fracture aperture, m; Sf is the fracture storage coefficient, 1/Pa; and uf is the fluid velocity in the fracture, m/s. The fluid velocity in the fracture also satisfies Darcy’s law:
where κf is the fracture permeability, m2. The relationship between the fracture permeability and the fracture aperture follows the cubic law:
This relationship indicates that even a small variation in the fracture aperture may cause a significant change in the fracture permeability. Therefore, fracture aperture evolution is a key factor controlling the flow capacity of fractured geothermal reservoirs.
2.2.2. Heat Transfer in Porous Media
Heat transfer in porous media can be described by the energy conservation equation and Fourier’s law. In this study, local thermal equilibrium between the rock matrix and the working fluid is assumed; that is, the rock matrix and the fluid have the same temperature at any given location and time. The energy conservation equation in the matrix domain is expressed as:
where (ρCp) is the equivalent volumetric heat capacity, J/(m3·K); T is the temperature, K; CP,f is the specific heat capacity of the fluid, J/(kg·K); q is the Fourier heat flux, W/m2; and Q is the energy source/sink term, W/m3. The equivalent volumetric heat capacity and heat flux are given by:
where ε is the porosity; ρs is the density of the rock matrix, kg/m3; Cp,s is the specific heat capacity of the rock matrix, J/(kg·K); and λs and λf are the thermal conductivities of the rock matrix and the fluid, respectively, W/(m·K).
Similarly, the heat-transfer equation in discrete fractures can be written as:
where n is the normal direction of the boundary; qf is the heat flux in the fracture, W/m2; and Qf is the energy source/sink term in the fracture, W/m3. The equivalent volumetric heat capacity (ρCP)f and heat flux qf in the fracture are expressed as:
where θ is the volume-fraction parameter in the fracture element.
In addition, the fluid density, dynamic viscosity, and thermal conductivity are important thermophysical parameters controlling the coupling strength between the flow field and the temperature field. Considering the large temperature variation during geothermal exploitation, temperature-dependent polynomial fitting relationships are used to describe the thermophysical properties of the fluid [27]:
where T0 = 273.15 K.
2.2.3. Mechanical Deformation of Porous Media
The deformation of the rock matrix in a geothermal reservoir is jointly controlled by in situ stress, pore pressure, and thermal stress. Under the assumptions of small deformation and linear elasticity, the constitutive relationship of the rock mass can be described by the generalized Hooke’s law:
where G and K are the shear modulus and the bulk modulus of the rock, respectively; σij is the stress tensor; σkk is the first invariant of the stress tensor; αb is the Biot coefficient, αb = 1 − K/Ks; αT is the thermal expansion coefficient of the rock, 1/K; Tref is the reference temperature, K; and δij is the Kronecker delta, where δij = 1 if i = j, and δij = 0 if i ≠ j.
The deformation of the rock mass should also satisfy the mechanical equilibrium equation and the strain–displacement relationship:
where Fi is the body force term, N/m3. By combining the constitutive relationship, equilibrium equation, and strain–displacement relationship, the thermoporoelastic deformation equation controlled by pore pressure and temperature variation can be obtained as:
where u is the displacement component and ν is Poisson’s ratio. This equation represents the combined influence of pore-pressure variation and temperature change on the stress–deformation response of the rock mass.
2.2.4. Fracture Aperture Deformation
During geothermal exploitation, cold-water injection and production alter the pore-pressure and temperature distributions in the reservoir, thereby changing the effective normal stress acting on fracture surfaces. The variation in the effective stress further causes normal deformation and aperture evolution in the fractures, which can be expressed as:
where σn is the normal stress acting on the fracture surface, Pa; σn′ is the effective normal stress on the fracture surface, Pa; un is the normal displacement of the fracture, m; d0 is the initial fracture aperture, m; and kn is the normal stiffness of the fracture, Pa/m. Changes in the fracture aperture may affect the fracture permeability and fluid-flow behavior. In the present study, this formulation is introduced to provide a more realistic representation of fracture hydraulic properties rather than to investigate the mechanical response itself.
It should be noted that the mechanical component in this study is mainly introduced to account for stress-dependent fracture aperture deformation and its influence on the fracture permeability. The focus of the subsequent performance analysis is placed on the thermo-hydraulic responses of the fractured geothermal reservoir, including temperature-field evolution, outlet temperature, production mass flow rate, and heat-output power. Therefore, stress redistribution and fracture deformation are not discussed as independent result indicators, but are incorporated through the stress-dependent permeability formulation.
2.3. Validation of the Coupled Model
To ensure the accuracy of the complex discrete crack network model to be developed subsequently, this paper first reconstructs the two-dimensional single-fracture model shown in Figure 1, and then compares the temperature evolution obtained from numerical simulations with the corresponding analytical solutions.
Figure 1.
Schematic diagram of a two-dimensional single-crack seepage-heat transfer validation model.
The rock mass has a length of L = 100 m and a width of D = 100 m, with an initial temperature of T0 = 80 °C. A single fracture with a constant width of df = 0.1 mm runs through the center of the rock mass. Due to the small width of the fracture, only temperature changes along the fracture are considered, and the vertical temperature gradient is neglected. Fluid is injected from the left end of the fracture at a constant velocity uin = 0.01 m/s, with a temperature of Tin = 20 °C and flows along the fracture toward the right boundary. The main physical parameters used in the model are shown in Table 1.
Table 1.
Parameters used for numerical model validation.
The analytical solution for the time evolution of fluid temperature along the fracture is given by Equation:
Figure 2 shows a comparison of the numerical and analytical solutions over a 200-day simulation period. Specifically, Figure 2a displays the temperature distribution along the fracture at different time points, while Figure 2b presents the time-dependent temperature curves at selected locations within the fracture (x = 25 m, 50 m, and 75 m). Overall, the numerical and analytical solutions show a high degree of agreement, indicating that the established numerical model can reliably reproduce the temperature evolution within the fracture. This provides a solid foundation for subsequent numerical simulations of the thermal compensation process in the host rock of the geothermal reservoirs.
Figure 2.
Validation of the developed numerical model through comparison with the analytical solution for the single-fracture heat-transfer problem: (a) Temperature distributions along the fracture at different times; (b) Temperature evolution with time at selected fracture locations (x = 25 m, 50 m, and 75 m).
To verify the accuracy of the THM-coupled model established in this study, the thermoelastic consolidation problem of the soil column is selected as a benchmark case for the numerical simulation. This problem involves mechanical deformation, heat transfer, and pore-pressure dissipation in a saturated porous medium, and thus provides a suitable basis for evaluating the capability of the model to describe the THM coupling processes. Bai derived the analytical solution of this thermoelastic consolidation problem using the finite Fourier transform and the inverse Fourier transform [37]. In this study, the proposed THM-coupled model is used to obtain the numerical solution, which is then compared with the analytical solution.
As shown in Figure 3, the soil-column model has a height of 4 m and a width of 1 m. The initial temperature is 10 °C, and the initial pore pressure is 10 kPa. A uniform load of 10 kPa is applied to the top surface, where a zero-pressure boundary and a constant-temperature boundary of 60 °C are also imposed. The remaining boundaries are set as no-flow and thermally insulated boundaries, with the normal displacement constrained. The main physical parameters used in the model are summarized in Table 2.
Figure 3.
Thermoelastic consolidation model of the soil column.
Table 2.
Physical parameters used for THM model validation [25].
The THM coupling results of the numerical soil-column model are shown in Figure 4. The evolution of displacement, temperature, and pore pressure at three vertical positions, specifically z = 0.5, 1 and 3 m along x = 0.5 m are presented and compared with the analytical solutions. The numerical results agree well with the analytical solutions, indicating that the proposed THM-coupled model can effectively capture the dynamic evolution of displacement, temperature, and pore pressure during thermoelastic consolidation. This confirms the reliability of the model for simulating THM coupling processes during geothermal exploitation.
Figure 4.
Comparison between numerical and analytical solutions of the thermoelastic consolidation model: (a) displacement evolution at different heights; (b) temperature evolution at different heights; (c) pore-pressure evolution at different heights.
3. Numerical Model Construction and Simulation Scheme
3.1. DFN Modeling of Fractured Geothermal Reservoirs
To ensure the reproducibility of the DFN model, the fracture network generation parameters were further specified in this study. The fractures were stochastically generated using the Monte Carlo method, and the fracture density was characterized by (P21). In this study, the fracture density was set to (0.15 m−1). The generated fracture network was required to satisfy a minimum connectivity criterion, specifically that at least one continuous dominant flow pathway must be established between the injection well and the production well. Fracture networks that failed to meet this connectivity requirement were discarded and regenerated:
The spatial locations of the fracture center points were randomly generated using a Poisson process, and the coordinates of the fracture midpoints within the fracture-generation domain were determined using a recursive random algorithm. The corresponding random sequence and fracture midpoint coordinates can be expressed as follows:
where Ri denotes a uniformly distributed random number within the interval [0, 1], int(x) represents the integer part of x, and R0 is the initial random seed generated using the multiplicative congruential method. For the fracture-generation domain bounded by xg1 < xg2 and yg1 < yg2, the coordinates of fracture midpoints can be determined according to Equation (25).
3.2. Fractured Geothermal Reservoir Model and Well-Layout Design
This study mainly investigates the effects of well-layout schemes and injection rates on the heat extraction performance of fractured geothermal reservoirs. To ensure the comparability of different cases, all simulations are conducted under the same reservoir size, fracture network structure, and boundary conditions, with only the spatial arrangement of the injection–production wells and the injection rate being varied. The two-dimensional DFN model, which has been widely used to study fluid flow and heat transfer in fractured reservoirs, can effectively capture key processes such as preferential flow-path development, thermal-breakthrough evolution, and the geometric interaction between the well layouts and the fracture networks. Therefore, the adopted modeling approach is particularly suitable for identifying the relative effects of well-layout orientation, production-well number, and injection rate on heat extraction performance while minimizing the interference of complex three-dimensional structural heterogeneity.
According to the relative geometric relationship between the injection–production alignment and the dominant fracture orientation, two representative well-layout orientations were designed. It should be clarified that the 45°/135° and 0°/90° directions refer to the well-layout orientations rather than to different fracture network realizations. The same DFN realization is used for all simulation cases. The fracture network contains two dominant fracture sets with orientations of 45° and 135°. Therefore, the 45°/135° well layouts represent cases in which the injection–production alignment is approximately consistent with the dominant fracture orientations, whereas the 0°/90° well layouts represent cases in which the injection–production alignment is non-parallel to the dominant fracture orientations.
This design is a parametric well-layout study rather than a site-specific simulation calibrated against a particular geothermal field. The purpose of selecting these two orientations is to construct two geometrically contrasting well-layout patterns and to examine how the matching relationship between the well alignment and the dominant fracture orientation affects preferential flow channel development, cooling-front propagation, and long-term heat extraction performance. Although intermediate orientations, such as 30° or 60°, were not systematically simulated in this study, their effects are expected to represent a transition between the two end-member layout types considered here. As the injection–production alignment gradually deviates from the dominant fracture orientation, the direct preferential channel effect is expected to weaken, leading to more dispersed flow paths and delayed thermal breakthrough. A systematic sensitivity analysis of intermediate well-layout angles will be conducted in future work.
The numerical model adopts a dual-medium description consisting of a rock matrix and a discrete fracture network. To reduce the influence of boundary effects on fluid migration and temperature-field evolution, a discrete fracture network is first generated in a 500 m × 500 m domain, and then the central 400 m × 400 m region is extracted as the computational domain of the geothermal reservoir. This treatment ensures good spatial continuity of fractures within the computational domain and reduces the interference caused by incomplete fractures near the model boundaries. The fracture network consists of two dominant fracture sets with orientations of 45° and 135°. The fracture length follows a normal distribution, with a mean value of 100 m and a standard deviation of 30 m.
The fracture network and the well-layout schemes are described in a combined textual–graphical manner to maintain figure clarity. The generated DFN contains dense fracture traces, and overlaying all fracture traces with the eight well-layout schemes in Figure 5 would make the subplots visually crowded and reduce the readability of well positions and spacing. Therefore, the geometric relationship between the well alignment and the dominant fracture orientations is clarified in the text and the figure caption. Specifically, the 45°/135° well-layout schemes represent cases in which the injection–production alignment is approximately parallel to the dominant fracture orientations, whereas the 0°/90° well-layout schemes represent cases in which the well alignment is non-parallel to the dominant fracture orientations.
Figure 5.
Schematic diagram of fractured geothermal reservoir models under different well-layout schemes. The generated DFN contains two dominant fracture orientations of 45° and 135°. The 45°/135° well-layout schemes are approximately parallel to the dominant fracture orientations, whereas the 0°/90° well-layout schemes are non-parallel to them. Blue circles represent injection wells, and red circles represent production wells.
The numerical models of different well-layout schemes are shown in Figure 5. The blue circles represent injection wells, while the red circles represent production wells. The labeled distances in the figure indicate the well spacing. All injection and production wells are located within the central 200 m × 200 m region of the reservoir to minimize the influence of external boundaries on inter-well flow and thermal breakthrough. Cases 1 and 2 correspond to one-injection–one-production layouts; Cases 3 and 4 correspond to one-injection–two-production layouts; Cases 5 and 6 correspond to one-injection–three-production layouts; and Cases 7 and 8 correspond to one-injection–four-production layouts. This well-layout design enables a systematic comparison of the effects of production-well number, well spacing, injection–production alignment, and injection rate on flow-path organization, cooling-front migration, and long-term heat extraction performance in fractured geothermal reservoirs.
3.3. Model Parameters, Boundary Conditions, and Simulation Settings
The same initial conditions, boundary conditions, and material parameters are applied to all well-layout schemes to ensure comparability among different simulation cases. As shown in Figure 6, the initial pore pressure and temperature of the geothermal reservoir are set to 20 MPa and 473.15 K, respectively. The injection well is assigned a constant mass flow boundary, with the injected fluid temperature set to 293.15 K. Three injection rates are considered: 1.0, 1.5, and 2.0 kg/s. The selected injection rates were chosen to ensure numerical stability and manageable computational cost while allowing clear observation of the relative effects of the well-layout schemes and the injection rates on the heat extraction performance. Although these values are lower than typical field-scale geothermal operations, the results remain applicable in revealing the key mechanisms controlling fluid flow, cooling-front propagation, and the heat-output response in fracture-controlled reservoirs. The production well is assigned a constant-pressure boundary of 0 MPa, which serves as a reference (gauge) pressure to establish the injection–production pressure difference and drive fluid circulation through the fracture network. The same production-well pressure is applied for all simulation cases to maintain consistent hydraulic conditions and enable direct comparison of the heat extraction performance across different well-layout schemes. The radius of all injection and production wells is set to 0.1 m.
Figure 6.
Schematic diagram of boundary conditions for the numerical model.
The total simulation period was set to 15 years. This period was selected to capture the main stages of the thermal response under different well-layout schemes, rather than to predict the complete thermal lifetime or the final thermal depletion of a specific geothermal reservoir. Within this time window, the outlet-temperature response can generally reflect the early temperature-stable stage, the intermediate rapid-decline stage, and the late slow-decline stage under the same DFN realization and boundary conditions. It should be noted that the system is not assumed to reach a strictly steady thermal state within 15 years. Because cold-water injection and reservoir cooling continue throughout the operation period, the heat extraction process remains transient. In some cases, the outlet temperature shows a reduced decline rate and approaches a quasi-stable output stage, whereas in other cases, especially those with lower injection rates or more tortuous flow paths, complete thermal breakthrough may require a longer simulation period. Therefore, the 15-year operation period is used as a consistent basis for comparing the relative effects of well-layout orientation, production-well number, and injection rate. Longer-term simulations will be considered in future work to evaluate the full thermal lifetime and the ultimate heat-recovery behavior of fractured geothermal reservoirs.
The external boundaries of the reservoir are set as no-flow and thermally insulated boundaries to avoid the influence of external fluid recharge and heat exchange on the internal heat extraction process. In terms of mechanical boundary conditions, normal displacement constraints are applied to the surrounding boundaries of the model to eliminate rigid-body motion and improve the numerical stability. This boundary setting ensures stable numerical convergence while representing the basic mechanical constraint exerted by the surrounding rock mass in deep geothermal reservoirs.
The total production period is set to 15 years, with a time step of 5 days. A sensitivity analysis was conducted on the time step, and it was found that further reducing the time step had a negligible effect on the changes in the key thermal response metrics, indicating that the selected time step ensures the reliability of the simulation results. The main physical parameters of the rock matrix, fractures, and working fluid are listed in Table 3. Parameters such as matrix permeability, porosity, elastic modulus, Poisson’s ratio, and thermal expansion coefficient are used to describe the seepage, heat-transfer, and mechanical responses of the reservoir. The fracture storage coefficient and the volume fraction are used to characterize the fluid storage and transport capacity of the discrete fracture network. The fluid density, dynamic viscosity, and thermal conductivity vary with the temperature and are determined using the temperature-dependent polynomial relationships described above.
Table 3.
Physical parameters used in the geothermal reservoir numerical model [25].
3.4. A Mesh-Independence Study
Mesh-independence verification was performed for Case 1 under an injection rate of 1 kg/s to evaluate the sensitivity of the numerical results to the mesh resolution. Simulations were conducted with different mesh sizes (21,598, 43,269, 67,519, 89,567, 112,156, and 135,841 elements) over a 15-year operation period, and the outlet temperatures were recorded along with their relative errors. Figure 7 indicates that the outlet temperature gradually converges with mesh refinement, and when the mesh reaches 112,156 and 135,841 elements, the relative error is only 0.29%. This demonstrates that the selected mesh (135,841 elements) provides sufficient accuracy for the numerical simulations while maintaining computational efficiency. The chosen mesh can effectively capture the characteristics of fracture-controlled fluid flow and heat transfer, providing a reliable numerical basis for subsequent comparisons of different operational conditions and well-layout schemes.
Figure 7.
Verification of mesh-independence.
4. Heat Extraction Responses and Controlling Mechanisms Under Different Well Layouts and Injection Rates
Because the main objective of this study is to evaluate the effects of well layout and injection rate on heat extraction performance, the results are mainly discussed in terms of thermo-hydraulic performance indicators, including temperature-field evolution, outlet temperature, production mass flow rate, and heat-output power. The mechanical component is incorporated only to update the fracture hydraulic properties during the simulation. The primary objective of this study is to evaluate thermo-hydraulic responses under different well layouts and injection rates.
To quantitatively evaluate the heat extraction performance of fractured geothermal reservoirs under different well layouts and injection rates, three indicators are selected in this study: outlet temperature of production wells, total production mass flow rate, and heat-output power. The outlet temperature reflects the degree of heat exchange between the working fluid and the hot rock mass. The total production mass flow rate characterizes the fluid circulation capacity of the injection–production system. The heat-output power represents the instantaneous heat extraction capacity jointly controlled by flow rate and the temperature difference. These indicators provide a comprehensive evaluation of the geothermal system in terms of heat exchange efficiency, fluid transport capacity, and energy output.
For systems with multiple production wells, the outlet flow rate and the outlet temperature may vary among different production wells. Therefore, a mass flow-weighted average method is adopted to calculate the average outlet temperature of the system [20]:
where t is the production time, s; Tf(t) denotes the fluid temperature at time t, with the unit of K; T(t) is the outlet temperature of the i-th production well at time t, K; r is the well radius, and L is the production-well length, which is taken as 1 m in the two-dimensional model.
The total production mass flow rate, qout, is defined as the total mass flow reaching the wellbore through both the fractures and the rock matrix [20]:
The heat-output power is jointly determined by the system mass flow rate, the fluid specific heat capacity, and the temperature difference ΔT between the injection and production wells, and is calculated as follows:
where Cf is the specific heat capacity of the fluid, with the unit of J/(kg·K), and Tin is the injection temperature, with the unit of K.
4.1. Spatiotemporal Evolution of Temperature Field and Cooling-Front Propagation
Figure 8, Figure 9 and Figure 10 show the temperature-field distributions of the geothermal reservoir under different well-layout schemes after 5, 10, and 15 years of production, respectively, with the injection rate fixed at 2.0 kg/s. Overall, the low-temperature cooling region mainly expands along the discrete fracture network, indicating that fractures serve as the dominant pathways controlling fluid migration and cooling-front propagation. Owing to the strong heterogeneity of the fracture network, the diffusion range, propagation direction, and cooling intensity of the injected cold water differ significantly among the well-layout schemes.
Figure 8.
Temperature-field distribution under different well-layout schemes after 5 years of production.
Figure 9.
Temperature-field distribution under different well-layout schemes after 10 years of production.
Figure 10.
Temperature-field distribution under different well-layout schemes after 15 years of production.
After 5 years of production, distinct differences in the temperature field can already be observed among the well layouts (Figure 8). For the one-injection–one-production schemes, Cases 1 and 2 exhibit markedly different cooling patterns. In Case 2, the low-temperature region is much larger than that in Case 1, and the cooling front rapidly propagates toward the production well along connected fractures. This indicates that a shorter well spacing and stronger fracture connectivity can significantly accelerate early-stage cooling-front migration. In contrast, the injection–production spacing in Case 1 is relatively large, resulting in a more limited cooling region that is mainly concentrated near the injection well and along locally connected fractures. For the one-injection–multiple-production schemes in Cases 3–8, the increase in the production-well number changes the flow pattern from a single injection–production pathway to multiple competing flow paths toward different production wells. Therefore, although some production wells are closer to the injection well, the competitive flow among multiple production wells weakens the preferential propagation effect along a single direction, leading to relatively similar temperature-field patterns among the multi-production-well schemes.
After 10 years of production, the low-temperature region further expands, and the cooling front continuously migrates into the reservoir along the dominant fracture network (Figure 9). Compared with the 5-year results, a larger portion of the rock matrix participates in heat exchange, and the temperature gradients within the reservoir become more pronounced. In regions with dense and well-connected fractures, cold water diffusion is faster, leading to a more significant decrease in the matrix temperature. Case 1 still exhibits a relatively limited cooling range, suggesting that the longer well spacing restricts the effective hydraulic connection and thermal sweep between the injection and production wells. In contrast, Case 2 develops a much larger low-temperature region at the intermediate production stage, indicating that preferential fracture channels under short-well-spacing conditions can enhance fluid circulation and cooling-front propagation. For the multi-production-well schemes, although the number and positions of the production wells differ, the injected cold water is initially controlled by the fracture connectivity around the injection well. Consequently, the overall temperature-field patterns of Cases 3–8 are relatively similar.
After 15 years of production, the overall cooling degree of the reservoir further increases, and the low-temperature region covers most of the computational domain in several cases (Figure 10). At this stage, the injected cold water not only migrates rapidly along highly permeable fractures but also gradually affects the surrounding rock matrix through fracture–matrix heat exchange. Compared with the early stage, during which the cooling is mainly controlled by preferential fracture channels, the late-stage temperature-field evolution is jointly governed by fracture flow and matrix heat exchange. Case 2 shows the largest cooling range, suggesting that this layout has shorter and better-connected flow paths and can produce a more extensive thermal sweep. However, this also implies a higher risk of early thermal breakthrough. In Cases 3–8, the multi-production-well arrangement promotes fluid migration in multiple directions, which helps weaken the concentrated cooling caused by a single preferential channel. Nevertheless, the competitive flow among the different production wells also makes the cooling pattern more complex.
Overall, Figure 8, Figure 9 and Figure 10 indicate that cold-water diffusion in fractured geothermal reservoirs is jointly controlled by injection-well location, production-well number, well spacing, and fracture network connectivity. When a short and well-connected fracture pathway exists between injection and production wells, the cooling front propagates faster and the thermal sweep region becomes larger, but the production wells may experience an earlier temperature decline. In contrast, multi-production-well layouts can distribute flow paths and weaken the dominance of a single preferential channel, resulting in a more uniform temperature-field evolution. These results demonstrate that well layout significantly affects the cooling range, thermal-breakthrough process, and long-term heat extraction response by altering the organization of flow paths within the fracture network.
4.2. Outlet-Temperature Decline and Thermal-Breakthrough Response of Production Wells
The production period was divided into three stages according to the first derivative of the outlet-temperature curve, (dT/dt). Stage I corresponds to the temperature-stable stage, during which the absolute temperature-decline rate (|dT/dt|) remains relatively small. Stage II begins when (|dT/dt|) increases markedly, indicating that the cooling front has reached the production wells and thermal breakthrough becomes significant. Stage III begins after the maximum decline period, when (|dT/dt|) decreases again and the outlet-temperature curve gradually approaches a relatively stable trend. The stage boundaries were identified based on the inflection points and slope variations in the outlet-temperature curves and were applied consistently to all simulation cases. Figure 11 shows the variation in the average outlet temperature of production wells with time under different well-layout schemes. Overall, the outlet temperature in each case exhibits a clear stage-dependent evolution, which can be divided into a temperature-stable stage, a rapid-decline stage, and a slow-decline stage.
Figure 11.
Variation in average outlet temperature of production wells with time under different well-layout schemes and injection rates: (a) Case 1; (b) Case 2; (c) Case 3; (d) Case 4; (e) Case 5; (f) Case 6; (g) Case 7; (h) Case 8.
In the early production stage (Stage I), the outlet temperature remains at a relatively high level under different injection rates. During this stage, the injected cold water has not yet reached the production wells on a large scale. The working fluid has a relatively sufficient residence time within the fracture network and can fully exchange heat with the hot rock mass. Therefore, the outlet temperature shows only a slight decrease.
In the intermediate production stage (Stage II), the outlet temperature decreases rapidly in all well-layout schemes, indicating that the cooling front gradually migrates toward the production wells along preferential fracture channels and induces thermal breakthrough. During this stage, the continuous cooling of the surrounding rock mass causes thermal contraction and stress redistribution, which further affects fracture aperture and permeability. As a result, the conductivity of the preferential fracture channels may be enhanced, accelerating the migration of cold water toward the production wells. This process leads to a pronounced decline in the outlet temperature and represents the main stage of performance degradation in the geothermal system.
In the late production stage (Stage III), the decreasing rate of the outlet temperature gradually slows down and tends to stabilize. At this stage, most of the high-temperature region in the reservoir has been cooled, and the temperature difference between the injected fluid and the surrounding rock mass is reduced. Consequently, the effective heat-exchange capacity decreases. Although fluid circulation continues, the additional decrease in outlet temperature becomes relatively limited, and the system gradually enters a low-temperature stable-output stage.
Regarding the influence of the well layout, the outlet temperature in the one-injection–one-production schemes (Cases 1 and 2) decreases relatively slowly, suggesting that the heat-exchange process is more concentrated along a single injection–production pathway and that the propagation range of the cooling front is relatively limited. In contrast, the outlet temperature decreases more rapidly in the one-injection–two-production schemes (Cases 3 and 4), indicating that the injected fluid is more easily attracted by multiple production wells and forms stronger flow pathways, thereby accelerating thermal breakthrough. As the number of production wells further increases, the decline rate of the outlet temperature is reduced to some extent. This suggests that although multiple production wells enlarge the flow-affected region, they also promote fluid migration in multiple directions and weaken the concentrated cooling effect of a single preferential channel.
Distinct differences can also be observed between the two types of well-layout orientations. When the injection–production alignment is approximately consistent with the dominant fracture orientations, specifically the 45°/135° layout, the outlet temperature generally decreases more significantly. This is because the dominant fracture orientations in the reservoir are also 45° and 135°. When the well alignment matches the dominant fracture orientations, the injected fluid can more easily form nearly direct preferential flow channels along highly connected fractures. This shortens the fluid residence time, reduces the heat-exchange duration, and causes an earlier temperature decline at the production wells. By comparison, in the 0°/90° layout, the injection–production alignment is not fully consistent with the dominant fracture orientations. The flow paths are more tortuous and the heat-exchange region is more dispersed, which helps delay the decline in the outlet temperature.
The injection rate also has a significant influence on the outlet temperature. Under the same well-layout scheme, the outlet temperature decreases markedly with an increasing injection rate. A higher injection rate increases the flow velocity of the injected cold water, shortens its residence time in the reservoir, and reduces the time available for heat exchange with the hot rock mass, thereby promoting earlier thermal breakthrough. In addition, a higher injection rate increases the pressure gradient near the injection well, causing the fluid to preferentially migrate along fractures with higher permeability. This further strengthens the preferential-channel effect and reduces the effective heat-exchange area. Therefore, a high injection rate can enhance the early-stage fluid circulation but accelerates the outlet-temperature decline, whereas a low injection rate is more favorable for maintaining the long-term outlet-temperature stability, although its early heat-output capacity is relatively limited.
In summary, the differences in the outlet temperature among the well-layout schemes are jointly controlled by injection–production alignment, production-well number, and injection rate. When the well alignment matches the dominant fracture orientation, rapid preferential flow channels are more likely to form, resulting in earlier thermal breakthrough. Multi-production-well layouts can alter the organization of flow paths and promote more dispersed cooling-front propagation. The injection rate controls fluid residence time and pressure gradient, thereby affecting heat-exchange efficiency. These results demonstrate that well layout and injection rate have significant effects on the long-term outlet-temperature stability of fractured geothermal reservoirs.
4.3. Evolution of Total Production Mass Flow Rate and Flow-Path Control Effect
Figure 12 shows the variation in the total production mass flow rate with time under different well-layout schemes and injection rates. Overall, the production mass flow rate gradually increases with production time in all cases, but the growth rate, peak value, and late-stage trend differ significantly among different injection rates and well layouts. This indicates that the total production mass flow rate is controlled not only by the injection rate, but also by fracture network connectivity, well spacing, production-well number, and the temperature-dependent variation in fluid viscosity.
Figure 12.
Variation in total production mass flow rate with time under different well-layout schemes and injection rates: (a) Case 1; (b) Case 2; (c) Case 3; (d) Case 4; (e) Case 5; (f) Case 6; (g) Case 7; (h) Case 8.
At the early production stage, the outlet mass flow rate remains relatively low in all cases, with only slight variations. This is because the injected cold water has not yet fully connected the main fracture pathways, and the flow paths within the reservoir are still being gradually established. With the continuous action of the injection–production pressure difference, the fluid progressively migrates toward the production wells along connected fractures, leading to a rapid increase in the total production mass flow rate. For cases with higher injection rates, the hydraulic driving force is stronger and the flow paths are established more rapidly. Therefore, the production mass flow rate increases more significantly during the early and intermediate stages and reaches its peak earlier.
Regarding the influence of the well layout, the total production mass flow rate in the 0°/90° well-layout schemes is generally higher than that in the 45°/135° schemes. This is mainly related to well spacing and flow-path organization. In the 0°/90° layouts, relatively shorter hydraulic connection paths exist between some injection and production wells, which shortens the time required for the fluid to reach the production wells and results in a higher outlet mass flow rate under the same injection rate. In contrast, although the 45°/135° layouts are more consistent with the dominant fracture orientations, the fluid tends to migrate along local preferential channels, which may restrict the overall flow-affected region and lead to a relatively lower total production mass flow rate.
The number of production wells also has a significant effect on the system flow rate. As the number of production wells increases, the total production mass flow rate increases markedly. The outlet mass flow rate in the one-injection–four-production schemes is much higher than that in the one-injection–one-production schemes, indicating that multiple production wells can more effectively activate the fracture network, enlarge the production-affected region, and enhance the overall circulation capacity of the system. However, competitive flow may occur among different production wells, resulting in uneven flow distribution along different production directions. Therefore, while multi-production-well layouts increase the total system flow rate, they also change the organization of flow paths within the reservoir.
The injection rate has a strong stage-dependent influence on the production mass flow rate. During the early and intermediate production stages, a higher injection rate generally corresponds to a higher outlet mass flow rate. This is because a larger injection rate increases the pressure gradient near the injection well and strengthens the driving force for fluid migration through the fracture network. However, as production continues, the outlet mass flow rate in some high-injection-rate cases begins to decrease after reaching its peak and may be exceeded by that in lower-injection-rate cases during the late stage. This phenomenon is closely related to the temperature-field evolution. A high injection rate accelerates the propagation of the cooling front and causes earlier thermal breakthrough.
As the reservoir temperature decreases, the dynamic viscosity of the fluid increases, and the flow resistance within the fractures becomes larger, leading to a decline in the late-stage production mass flow rate. In contrast, under a low injection rate, the cooling front propagates more slowly, the reservoir temperature declines more gradually, and the increase in the fluid viscosity is less pronounced, allowing the flow capacity to remain more stable during the late production stage.
This trend varies among different well-layout schemes. For example, in Case 2, the outlet mass flow rate increases with injection rate throughout the 15-year production period, indicating that the relatively short injection–production pathway in this layout can continuously maintain strong flow capacity. In contrast, in the one-injection–two-production schemes such as Cases 3 and 4, a high injection rate enhances the system flow in the early stage, but its late-stage outlet mass flow rate is slightly exceeded by that under lower injection rates due to thermal breakthrough and the associated increase in the fluid viscosity. This suggests that the positive effect of a high injection rate on flow enhancement is stage-dependent and does not necessarily imply better long-term flow performance.
In summary, the total production mass flow rate is jointly controlled by well layout, production-well number, and injection rate. Reducing well spacing and increasing the number of production wells can improve the overall system flow rate. Increasing the injection rate can enhance early-stage fluid circulation, but it may also accelerate reservoir cooling and thermal breakthrough, thereby reducing late-stage flow capacity. Therefore, in fractured geothermal reservoir development, the trade-off between early flow enhancement and long-term flow stability should be carefully considered.
4.4. Heat-Output Power Evolution and Long-Term Heat Extraction Performance
Figure 13 shows the variation in heat-output power with time under different well-layout schemes and injection rates. Because the heat-output power is jointly determined by the total production mass flow rate and the temperature difference between injection and production wells, its evolution is controlled by both the fluid circulation capacity and the decline in outlet temperature. Overall, the heat-output power in all cases exhibits a characteristic trend of increasing first and then decreasing.
Figure 13.
Variation in heat-output power with time under different well-layout schemes and injection rates: (a) Case 1; (b) Case 2; (c) Case 3; (d) Case 4; (e) Case 5; (f) Case 6; (g) Case 7; (h) Case 8.
At the early production stage, the reservoir temperature remains high and the outlet temperature of the production wells has not yet decreased significantly. Meanwhile, the injection–production pressure difference gradually promotes the establishment of flow pathways, leading to an increase in the total production mass flow rate. As a result, the heat-output power gradually increases with time. During the intermediate production stage, the heat-output power reaches a peak as the production mass flow rate continues to increase or remains at a relatively high level. Subsequently, the cooling front migrates toward the production wells, and the thermal breakthrough becomes more pronounced. The outlet temperature decreases rapidly, causing a significant reduction in the temperature difference between injection and production. Although the mass flow rate remains relatively high in some cases, the decrease in the temperature difference becomes the dominant factor limiting the heat output, resulting in a rapid decline in heat-output power after the peak. At the late production stage, the reservoir becomes increasingly cooled, and the heat-output power gradually decreases, indicating a clear degradation of the effective heat extraction capacity of the geothermal system.
Regarding the influence of the well layout, increasing the number of production wells generally improves the heat-output power of the system. For the 45°/135° well-layout orientation, the heat-output power increases markedly with the number of production wells, and the one-injection–four-production scheme exhibits much higher heat-output power than the one-injection–one-production scheme. This indicates that multiple production wells can enlarge the production-affected region, enhance the utilization of the fracture network, and improve the overall fluid circulation capacity and the heat extraction intensity. For the 0°/90° well-layout orientation, the one-injection–four-production scheme shows the highest heat-output power, whereas the one-injection–two-production scheme exhibits relatively low heat-output power. This suggests that increasing the number of production wells does not necessarily lead to a linear improvement in heat extraction performance, because the effect is also controlled by well spacing, fracture connectivity, and flow-path distribution.
A comparison between the two well-layout orientations shows that, for the one-injection–one-production schemes, Cases 1 and 2 display similar heat-output power trends, although Case 2 has slightly higher heat-output power due to its shorter flow path and a higher production mass flow rate. For the one-injection–two-production schemes, the heat-output power of Case 4 is significantly lower than that of Case 3, indicating that local inter-well connectivity and competitive flow among the production wells can influence the heat extraction efficiency. For the one-injection–three-production and one-injection–four-production schemes, the 0°/90° layouts generally exhibit higher heat-output power, suggesting that this layout orientation can provide more effective fluid circulation and a more stable heat extraction process under multi-production-well conditions.
The injection rate also strongly affects the heat-output power. A higher injection rate can rapidly increase the heat-output power during the early production stage and cause the peak heat-output power to occur earlier. This is because a higher injection rate enhances fluid circulation and allows the system to reach a larger production mass flow rate within a shorter time. However, a high injection rate also shortens the residence time of the fluid in the reservoir and accelerates the migration of the cooling front, leading to an earlier decline in the outlet temperature. Therefore, in some cases, although an injection rate of 2.0 kg/s results in an earlier increase in heat-output power, the subsequent decline after the peak is also more rapid, and the late-stage heat-output power may even become lower than that under lower injection rates. This phenomenon is particularly evident in Cases 3 and 5, indicating that rapid thermal breakthrough induced by a high injection rate can weaken the long-term heat extraction capacity of the system.
In contrast, a lower injection rate leads to a slower increase in early-stage heat-output power, but it also slows the propagation of the cooling front and reduces the rate of outlet-temperature decline. As a result, the system can maintain a larger injection–production temperature difference for a longer period. Therefore, a low injection rate is more favorable for maintaining the long-term heat-output power, especially for geothermal systems designed for stable long-term production. For the 0°/90° multi-production-well schemes, such as Cases 4, 6, and 8, the difference in the peak heat-output power among different injection rates is relatively small, but the high-injection-rate cases reach the peak earlier and decline more rapidly in the later stage. This further indicates that the injection rate mainly affects the peak time and long-term decline rate of the heat-output power.
In summary, the heat-output power is jointly controlled by the outlet mass flow rate and the outlet temperature. Increasing the number of production wells can increase the total production flow rate and thereby enhance the heat-output power. However, if the fluid rapidly breaks through along preferential channels, the outlet temperature declines quickly and the heat-output power decreases significantly. A higher injection rate is beneficial for improving the early-stage heat extraction capacity, but it accelerates the thermal breakthrough and weakens the long-term output. In contrast, a lower injection rate helps delay temperature decline and maintain long-term heat-output stability. Overall, the 0°/90° multi-production-well layout shows better long-term heat-output performance, while a lower injection rate is more favorable for the stable long-term operation of the geothermal system.
4.5. Coupled Mechanisms by Which Well Layout and Injection Rate Control Heat Extraction Performance
Based on the results shown in Figure 8, Figure 9, Figure 10, Figure 11, Figure 12 and Figure 13, the heat extraction performance of a fractured geothermal reservoir is not controlled by a single factor, but by the combined effects of well-layout orientation, production-well number, well spacing, fracture network connectivity, and injection rate. The temperature-field evolution indicates that the injected cold water mainly migrates along the discrete fracture network, demonstrating that fracture structure is the dominant factor controlling cooling-front propagation. The outlet temperature reflects the thermal-breakthrough process, the total production mass flow rate characterizes the fluid circulation capacity, and the heat-output power is jointly determined by the mass flow rate and the temperature difference between injection and production wells. Therefore, the effects of well layout and injection rate on heat extraction performance can be summarized as the preferential fracture-channel effect, the competitive flow-diversion effect among multiple production wells, and the residence-time–thermal-breakthrough trade-off controlled by the injection rate. The related mechanisms are summarized in Table 4.
Table 4.
Main mechanisms by which well layout and injection rate control heat extraction performance.
From the perspective of the well-layout orientation, the matching relationship between the injection–production alignment and the dominant fracture orientation determines the main migration pathway of the injected cold water. When the injection–production alignment is approximately consistent with the dominant fracture orientation, the cold water is more likely to form nearly direct flow channels along highly connected fractures. This flow pattern can enhance the local fluid circulation during the early production stage, but it also shortens the residence time of the working fluid in the hot rock mass. As a result, the cooling front rapidly migrates toward the production well, leading to an earlier decline in the outlet temperature. In contrast, when the injection–production alignment is not fully consistent with the dominant fracture orientation, the fluid must pass through more tortuous fracture pathways before reaching the production well. The cold-water diffusion becomes more dispersed, which is beneficial for enlarging the effective heat-exchange region and delaying the thermal breakthrough. Therefore, the 45°/135° well layout is more likely to be controlled by preferential fracture channels, whereas the 0°/90° well layout is more favorable for maintaining long-term heat-output stability under multi-production-well conditions. The results suggest that multi-production-well layouts arranged in orthogonal or complementary directions relative to the dominant fracture orientation may be beneficial for improving geothermal heat extraction. Such configurations can promote a more uniform distribution of flow paths within the fracture network, enlarge the thermal sweep region, and delay the thermal breakthrough, thereby contributing to more sustainable long-term heat production. Therefore, the geometric relationship between well layouts and dominant fracture orientations should be considered during the design of the injection–production systems. Combined with site-specific fracture characteristics and engineering constraints, the proposed layout strategy may provide a useful reference for preliminary well-placement design in fractured geothermal reservoirs.
The production-well number further modifies the organization of flow paths within the reservoir. In the one-injection–one-production layout, the fluid mainly migrates along a single injection–production pathway, resulting in a relatively concentrated cooling-front propagation direction and a limited thermal sweep region. As the number of production wells increases, the injected fluid is attracted by multiple production wells, and the flow pattern changes from a single pathway to multi-directional dispersed flow. This process can activate more fracture channels, increase the total production mass flow rate, and enlarge the flow-affected region. However, competitive flow diversion also occurs among the multiple production wells, leading to differences in the flow distribution and the cooling intensity along different directions. Therefore, although multi-production-well layouts can improve the total system flow rate and heat-output power, their enhancement effect does not increase linearly with the number of production wells, but is jointly controlled by well spacing, fracture connectivity, and flow-path distribution.
In addition to the well layout, the injection rate exerts a clear stage-dependent influence on the heat extraction performance. A higher injection rate increases the pressure gradient near the injection well and enhances the fluid circulation, enabling the system to achieve a higher production mass flow rate and the heat-output power more rapidly during the early production stage. However, a high injection rate also shortens the residence time of the fluid in the reservoir and accelerates the migration of the cooling front along preferential fracture channels, causing the outlet temperature of the production wells to decline earlier. After the thermal breakthrough occurs, the temperature difference between the injection and the production wells decreases rapidly. Even if the system maintains a relatively high mass flow rate, the heat-output power will still decline significantly. In contrast, although a lower injection rate results in a slower increase in the early-stage flow rate and the heat-output power, it can delay the reservoir cooling and the temperature decline, allowing the system to maintain a larger injection–production temperature difference over a longer period. Therefore, a lower injection rate is more favorable for stable long-term heat extraction.
These results indicate that there is a clear trade-off between the early-stage high production and the long-term stability in fractured geothermal reservoir development. A high injection rate and short well spacing are beneficial for improving the early-stage fluid circulation and the heat-output power, but they may also induce rapid thermal breakthrough. Multi-production-well layouts can enlarge the flow-affected region and increase the total system flow rate, but their effectiveness depends on the matching relationship between the well pattern and the fracture network. For long-term geothermal exploitation, it is necessary to avoid forming a single direct flow channel completely aligned with the dominant fracture orientation and to reasonably control the injection rate, so as to achieve a balance between the fluid circulation intensity and a sufficient heat exchange. These findings can provide useful guidance for the well-layout design and the injection-scheme selection in fractured geothermal reservoirs.
Nevertheless, some limitations of the present study should be noted. Although the same DFN realization was used for all simulation cases to ensure direct comparability among different well-layout and injection-rate schemes, this treatment inevitably limits the statistical representativeness of the results. Because fracture networks are stochastic and heterogeneous, the absolute values of thermal-breakthrough time, outlet temperature, production mass flow rate, and heat-output power may vary under different DFN realizations. Therefore, the conclusions of this study should be interpreted as relative trends under a fixed fracture network condition rather than as statistical predictions for all fractured geothermal reservoirs. Future work will include multiple DFN realizations to quantify the uncertainty caused by fracture network randomness and to further evaluate the robustness of the proposed well-layout optimization strategy.
Another limitation of the present study is that the mechanical response is incorporated through the stress-dependent fracture aperture and permeability evolution, but detailed mechanical field results, such as stress redistribution, displacement fields, and spatial fracture aperture evolution, are not separately presented. Therefore, the present study should be regarded as a thermo-hydraulic performance analysis in which the stress-dependent permeability is treated as a supporting model feature rather than a primary research objective. Future work will further quantify the mechanical contribution by analyzing fracture aperture evolution, permeability redistribution, and stress-field changes during long-term geothermal exploitation.
5. Conclusions
In this study, a two-dimensional DFN-based thermo-hydraulic model was established to investigate the effects of the well layout and the injection rate on the heat extraction performance of fractured geothermal reservoirs. Four well configurations were considered, including one-injection–one-production, one-injection–two-production, one-injection–three-production, and one-injection–four-production schemes. For each configuration, two well-layout orientations, specifically 0°/90° and 45°/135°, were designed. Three injection rates of 1.0, 1.5, and 2.0 kg/s were assigned to each well-layout scheme, resulting in 24 simulation cases. The spatiotemporal evolution of the temperature field, average outlet temperature, total production mass flow rate, and heat-output power were systematically analyzed. The main conclusions are as follows.
- (1)
- The well layout significantly affects the spatiotemporal evolution of the reservoir temperature field. The injected cold water mainly migrates along the discrete fracture network, and the propagation of the cooling front is jointly controlled by the fracture connectivity and the relative positions of the injection and the production wells. Under the same injection rate, the one-injection–one-production layout with relatively short well spacing and injection–production alignment approximately parallel to the dominant fracture orientation produces the largest cooling region, with most of the reservoir occupied by low-temperature fluid at the late production stage. This indicates that short and well-connected flow paths aligned with the dominant fractures can enlarge the thermal sweep region and intensify the reservoir cooling. However, it also implies a higher risk of rapid thermal breakthrough. In the one-injection–multiple-production schemes, competitive flow diversion among the multiple production wells weakens the rapid unidirectional propagation of the cold water, resulting in a more dispersed temperature-field distribution.
- (2)
- The outlet temperature of the production wells shows a clear stage-dependent decline. During the early production stage, the outlet temperature remains at a relatively high level. In the intermediate stage, the cooling front migrates toward the production wells along preferential fracture channels, leading to a rapid decrease in the outlet temperature. In the late stage, the reservoir temperature gradually approaches the injection temperature, and the decline rate of the outlet temperature becomes slower. The outlet temperature decreases relatively slowly in the one-injection–one-production schemes, whereas it declines more rapidly in the one-injection–two-production schemes. As the number of production wells further increases, the flow paths become more dispersed, and the decline rate of the outlet temperature is reduced to some extent. When the injection–production alignment is consistent with the dominant fracture orientation, specifically in the 45°/135° layout, nearly direct preferential flow channels are more likely to form, resulting in a larger decrease in the outlet temperature.
- (3)
- The total production mass flow rate is jointly controlled by well spacing, production-well number, and injection rate. In general, the outlet mass flow rate in the 0°/90° layouts is higher than that in the 45°/135° layouts, indicating that shorter effective flow paths and more favorable inter-well connectivity can enhance fluid circulation. Increasing the number of production wells can activate more fracture channels and improve the total production mass flow rate. The mass flow rate in the one-injection–four-production schemes is much higher than that in the one-injection–one-production schemes. A higher injection rate can increase the production mass flow rate during the early and intermediate production stages, but it also accelerates the thermal breakthrough and the reservoir cooling. As a result, the fluid viscosity increases and flow resistance becomes larger in the late stage, causing the outlet mass flow rate in some high-injection-rate cases to be exceeded by that under lower injection rates.
- (4)
- The heat-output power is jointly determined by the total production mass flow rate and the temperature difference between the injection and the production wells, and generally exhibits an increase followed by a decline. The 0°/90° multi-production-well layouts show better long-term heat-output performance, suggesting that these layouts can improve system flow rate while maintaining a relatively stable temperature difference. In the 45°/135° layouts, the heat-output power increases with the number of production wells, but the overall long-term performance is lower than that of the 0°/90° multi-production-well layouts. Increasing the injection rate enhances the early-stage heat-output power, but it shortens the fluid residence time and induces earlier thermal breakthrough. A lower injection rate results in a weaker early-stage heat extraction capacity, but it is more favorable for maintaining long-term outlet temperature and the heat-output stability. Therefore, a trade-off between the early-stage high production and the long-term stability should be considered in the development of fractured geothermal reservoirs.
It should be noted that the above conclusions were obtained using a two-dimensional DFN-based thermo-hydraulic model. Because the fracture connectivity, the cooling-front geometry, and fracture–matrix heat exchange may differ between two-dimensional and three-dimensional reservoirs, the quantitative results reported in this study may change under three-dimensional conditions. Therefore, future work will extend the present framework to three-dimensional fractured geothermal reservoir models and field-scale validation.
Author Contributions
Conceptualization, Y.Z. and C.L.; methodology, Y.Z., H.Y. and C.L.; software, Y.Z.; validation, Y.Z., H.Y., X.Q. and C.L.; formal analysis, Y.Z. and H.Y.; investigation, Y.Z. and H.Y.; resources, X.Q. and C.L.; data curation, Y.Z. and H.Y.; writing—original draft preparation, Y.Z.; writing—review and editing, H.Y., X.Q. and C.L.; visualization, Y.Z.; supervision, X.Q. and C.L.; project administration, X.Q. and C.L.; funding acquisition, X.Q. and C.L. All authors have read and agreed to the published version of the manuscript.
Funding
This study has been financially supported by National Natural Science Foundation of Henan (252300420279), Support of Top-talent Scientific and Technological Talents of Guizhou Educational Commission [2024]348], High-level Innovative Talents in Guizhou Province ([2025]202306), Foundation Research Project of Kaili University (YTH-TD20253I and YTH-PT20240), Kaili University 2024 First-Class Course, “Engineering Ethics” (JK202417) and Guizhou Province 2024 First-Class Course, “Engineering Ethics” (2024JKHH0188), Anyang Institute of Technology University-level Scientific Research Innovation Team (CXTD202202).
Data Availability Statement
The original contributions presented in this study are included in the article. Further inquiries can be directed to the corresponding authors.
Conflicts of Interest
The authors declare no conflicts of interest.
References
- Long, T.; Xie, Z.; Huang, Z.; Li, G.; Song, X.; Wu, X.; Li, J.; Yang, R.; Zou, W.; Sun, Z. Hydraulic Fracturing of Naturally Fractured Hot Dry Rock Based on a Coupled Thermo-Hydro-Mechanical Model. Geoenergy Sci. Eng. 2026, 257, 214163. [Google Scholar] [CrossRef] [Scilit]
- Tian, L.; Su, Y.; Huang, H. Numerical Evaluation of the Heat Extraction Performance of Single-Well Enhanced Geothermal System with Rough Fractures. Int. J. Heat Mass Transf. 2026, 256, 127980. [Google Scholar] [CrossRef] [Scilit]
- Zu, W.; Wen, Z.; Tao, J.; Jiang, Z.; Zuo, Y.; Peng, F. Heat Extraction Performance in Enhanced Geothermal Systems: Effects of Heterogeneous Fracture Distribution and Hydraulic Properties. Appl. Therm. Eng. 2025, 281, 128674. [Google Scholar] [CrossRef] [Scilit]
- Zhang, H.; Li, Y.; Ding, T.; Shao, S.; Feng, Y. Cascade and Effective Utilization of Medium and Deep Geothermal Energy: A Comprehensive Review and Application Prospects. Energy 2025, 326, 136219. [Google Scholar] [CrossRef] [Scilit]
- Nath, F.; Mahmood, M.N.; Ofosu, E.; Khanal, A. Enhanced Geothermal Systems: A Critical Review of Recent Advancements and Future Potential for Clean Energy Production. Geoenergy Sci. Eng. 2024, 243, 213370. [Google Scholar] [CrossRef] [Scilit]
- Cai, X.; Deng, Q.; Xu, K.; Zhong, X.; Yang, M. Impact of Dual-Fracture Location on Heat Extraction from Enhanced Geothermal System in Low-Permeability Reservoirs. Appl. Therm. Eng. 2025, 259, 124754. [Google Scholar] [CrossRef] [Scilit]
- Mahmoodpour, S.; Singh, M.; Bär, K.; Sass, I. Thermo-Hydro-Mechanical Modeling of an Enhanced Geothermal System in a Fractured Reservoir Using Carbon Dioxide as Heat Transmission Fluid—A Sensitivity Investigation. Energy 2022, 254, 124266. [Google Scholar] [CrossRef] [Scilit]
- Zhou, D.; Tatomir, A.; Liu, Q.; Li, K.; Gao, H.; Sauter, M. Effects of Thermoelasticity Induced Aperture Variation on Performances of Enhanced Geothermal System. Appl. Therm. Eng. 2024, 248, 123308. [Google Scholar] [CrossRef] [Scilit]
- Zhou, D.; Tatomir, A.; Niemi, A.; Tsang, C.-F.; Sauter, M. Study on the Influence of Randomly Distributed Fracture Aperture in a Fracture Network on Heat Production from an Enhanced Geothermal System (EGS). Energy 2022, 250, 123781. [Google Scholar] [CrossRef] [Scilit]
- Li, X.; Li, C.; Gong, W.; Zhang, Y.; Wang, J. Probabilistic Analysis of Heat Extraction Performance in Enhanced Geothermal System Based on a DFN-Based Modeling Scheme. Energy 2023, 263, 125674. [Google Scholar] [CrossRef] [Scilit]
- Han, C.; Chen, S.; Wang, F.; Li, W.; Yin, D.; Zhang, J.; Zhang, W.; Bai, Y. Data-Driven Hydraulic Property Analysis and Prediction of Two-Dimensional Random Fracture Networks. Comput. Geotech. 2024, 171, 106353. [Google Scholar] [CrossRef] [Scilit]
- Zeng, F.; Wu, H.; Zhang, K.; Liu, Y. Fracture Aperture Evolution in Subsurface Fractured Reservoirs: Insights from Thermo-Hydro-Mechanical Simulations and Implications for Field-Scale Applications. Int. J. Rock Mech. Min. Sci. 2025, 195, 106254. [Google Scholar] [CrossRef] [Scilit]
- Ma, Y.; Li, Y.; Gan, Q. Permeability Evolution and Heat Transfer in Hot Sedimentary Aquifers and Enhanced Geothermal Systems: Insights from Coupled DFN-THM Modeling. Geoenergy Sci. Eng. 2026, 260, 214387. [Google Scholar] [CrossRef] [Scilit]
- Ji, J.; Song, X.; Song, G.; Xu, F.; Shi, Y.; Lv, Z.; Li, S.; Yi, J. Study on Fracture Evolution Model of the Enhanced Geothermal System under Thermal-Hydraulic-Chemical-Deformation Coupling. Energy 2023, 269, 126604. [Google Scholar] [CrossRef] [Scilit]
- Ma, Y.; Li, S.; Zhang, L.; Liu, S.; Wang, M. Heat Extraction Performance Evaluation of U-Shaped Well Geothermal Production System under Different Well-Layout Parameters and Engineering Schemes. Renew. Energy 2023, 203, 473–484. [Google Scholar] [CrossRef] [Scilit]
- Yan, Y.; Yang, S.; Han, L.; Suo, Y. The Influence of Well Configurations on Geothermal Energy Extraction Efficiency. Therm. Sci. Eng. Prog. 2025, 65, 103898. [Google Scholar] [CrossRef] [Scilit]
- Alamooti, M.; Namie, S. Rock Physics and Fracture Characterization of the Deadwood Formation, Williston Basin: Insights into Geothermal Resource Development. Geomech. Energy Environ. 2025, 44, 100737. [Google Scholar] [CrossRef] [Scilit]
- Ma, Y.; Li, S.; Zhang, L.; Liu, S.; Liu, Z.; Li, H.; Shi, E. Study on the Effect of Well Layout Schemes and Fracture Parameters on the Heat Extraction Performance of Enhanced Geothermal System in Fractured Reservoir. Energy 2020, 202, 117811. [Google Scholar] [CrossRef] [Scilit]
- Lu, X.; Tong, X.; Du, X.; Xiao, Y.; Deng, J. Effect of Wellbore Layout and Varying Flow Rate on Fluid Flow and Heat Transfer of Deep Geothermal Mining System. Therm. Sci. Eng. Prog. 2023, 42, 101870. [Google Scholar] [CrossRef] [Scilit]
- Zheng, J.; Li, P.; Dou, B.; Fan, T.; Tian, H.; Lai, X. Impact Research of Well Layout Schemes and Fracture Parameters on Heat Production Performance of Enhanced Geothermal System Considering Water Cooling Effect. Energy 2022, 255, 124496. [Google Scholar] [CrossRef] [Scilit]
- Zhu, C.-Y.; Huang, D.; Lei, W.-X.; He, Z.-Y.; Duan, X.-Y.; Gong, L. Prediction of Output Temperature and Fracture Permeability of EGS with Dynamic Injection Rate Based on Deep Learning Method. Renew. Energy 2025, 239, 122102. [Google Scholar] [CrossRef] [Scilit]
- Fu, X.; Ma, Y.; Li, S.; Zhang, L.; Liu, S.; Wang, T. Sensitivity Analysis of Mechanical Field Parameters in Fractured HDR Reservoir Based on THM Coupling. Energy 2025, 320, 135360. [Google Scholar] [CrossRef] [Scilit]
- Magaji, A.; Dou, B.; Ileye, Y.; Dhawood, R.; Ibrahim, A.-W.; Tao, W.; Al-khulaidi, G. Geothermal Energy Harvesting from Abandoned Wells: A Numerical Simulation of Multi Well Closed Loop Systems. Appl. Therm. Eng. 2025, 278, 127063. [Google Scholar] [CrossRef] [Scilit]
- Han, B.; Wang, S.; Zhang, Z.; Wang, Y. Numerical Simulation of Geothermal Reservoir Thermal Recovery of Heterogeneous Discrete Fracture Network-Rock Matrix System. Energy 2024, 305, 132306. [Google Scholar] [CrossRef] [Scilit]
- Sun, Z.; Zhang, X.; Xu, Y.; Yao, J.; Wang, H.; Lv, S.; Sun, Z.; Huang, Y.; Cai, M.; Huang, X. Numerical Simulation of the Heat Extraction in EGS with Thermal-Hydraulic-Mechanical Coupling Method Based on Discrete Fractures Model. Energy 2017, 120, 20–33. [Google Scholar] [CrossRef] [Scilit]
- Wang, L.; Li, H.; Gong, Y.; Bu, X. Numerical Simulation of Single-Well Enhanced Geothermal Power Generation System Based on Discrete Fracture Model. Geothermics 2024, 120, 103001. [Google Scholar] [CrossRef] [Scilit]
- Aliyu, M.D.; Finkbeiner, T.; Chen, H.-P.; Archer, R.A. A Three-Dimensional Investigation of the Thermoelastic Effect in an Enhanced Geothermal System Reservoir. Energy 2023, 262, 125466. [Google Scholar] [CrossRef] [Scilit]
- Gudala, M.; Yan, B. Graph Neural Network for Multi-Physics Geothermal Simulation with Discrete Fracture Network. Adv. Water Resour. 2025, 205, 105062. [Google Scholar] [CrossRef] [Scilit]
- Zhao, Y.; Feng, Z.; Feng, Z.; Yang, D.; Liang, W. THM (Thermo-Hydro-Mechanical) Coupled Mathematical Model of Fractured Media and Numerical Simulation of a 3D Enhanced Geothermal System at 573 K and Buried Depth 6000–7000 M. Energy 2015, 82, 193–205. [Google Scholar] [CrossRef] [Scilit]
- Song, G.; Song, X.; Xu, F.; Li, G.; Wang, G.; Ji, J.; Shi, Y. Numerical Parametric Investigation of Thermal Extraction from the Enhanced Geothermal System Based on the Thermal-Hydraulic-Chemical Coupling Model. J. Clean. Prod. 2022, 352, 131609. [Google Scholar] [CrossRef] [Scilit]
- Shi, Y.; Zhang, Y.; Wang, G.; Zhang, X.; Song, X.; Cui, Q.; Wang, G. Heat Extraction Mechanism in Hot Dry Rock Based on Horizontal Wells with Multi-Stage Fracturing. Energy 2026, 347, 140217. [Google Scholar] [CrossRef] [Scilit]
- Hong, P.; Zhao, F.; Dai, C.; Lei, H. Implicit Lattice Boltzmann Flux Solver: A Novel Mesoscopic Numerical Algorithm for Geothermal Reservoir Simulation. Int. J. Therm. Sci. 2024, 201, 109023. [Google Scholar] [CrossRef] [Scilit]
- Wang, G.; Song, X.; Yu, C.; Shi, Y.; Song, G.; Xu, F.; Ji, J.; Song, Z. Heat Extraction Study of a Novel Hydrothermal Open-Loop Geothermal System in a Multi-Lateral Horizontal Well. Energy 2022, 242, 122527. [Google Scholar] [CrossRef] [Scilit]
- Cai, X.; Liu, Z.; Xu, K.; Li, B.; Yang, M. Numerical Simulation on Converting Abandoned Wells into Double-Well Open-Loop Geothermal System. Appl. Therm. Eng. 2024, 248, 123324. [Google Scholar] [CrossRef] [Scilit]
- Cai, X.; Ren, X.; Zhong, X.; Deng, Q.; Yang, M.; Zhu, Z. Design and Numerical Simulation Study of Open-Loop Geothermal Systems with Different Well Networks. Appl. Therm. Eng. 2025, 272, 126426. [Google Scholar] [CrossRef] [Scilit]
- Cai, X.; Liu, Z.; Xu, K.; Li, B.; Zhong, X.; Yang, M. Numerical Simulation Study of an Enhanced Geothermal System with a Five-Spot Pattern Horizontal Well Based on Thermal-Fluid-Solid Coupling. Appl. Therm. Eng. 2025, 258, 124649. [Google Scholar] [CrossRef] [Scilit]
- Bai, B. One-dimensional thermal consolidation characteristics of geotechnical media under non-isothermal condition. Eng. Mech. 2005, 22, 186–191. (In Chinese) [Google Scholar]
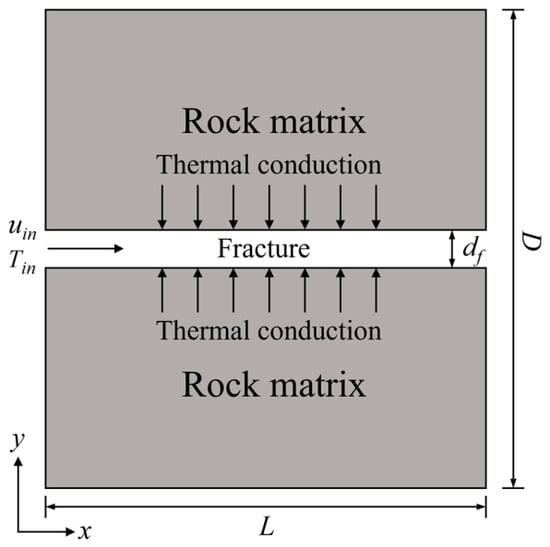
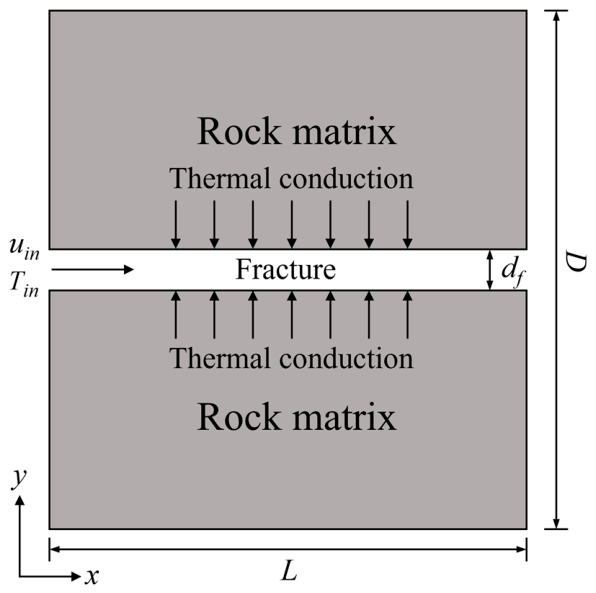
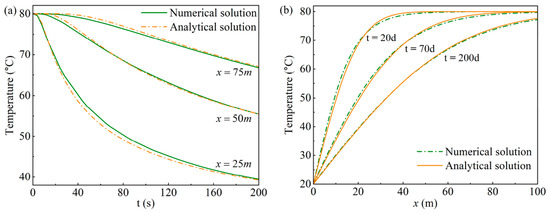
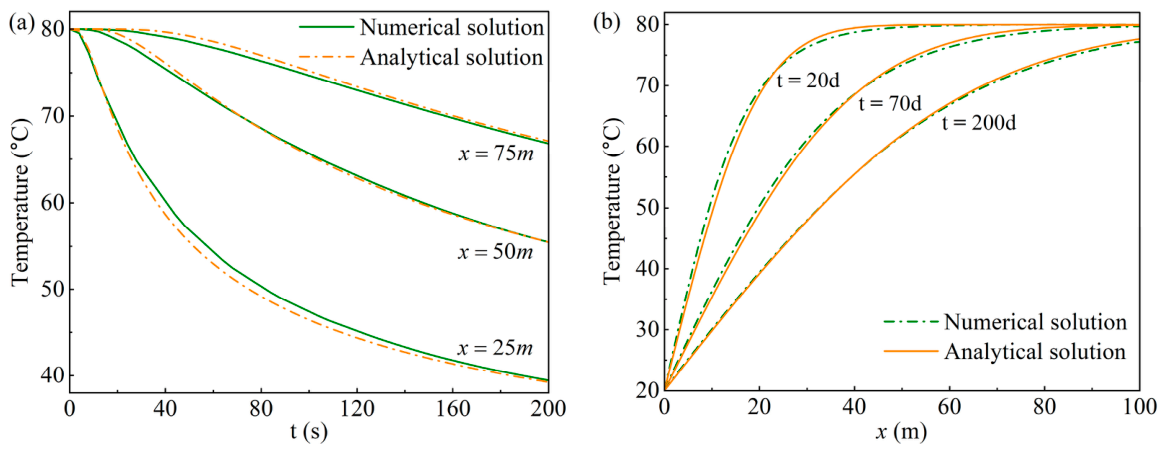
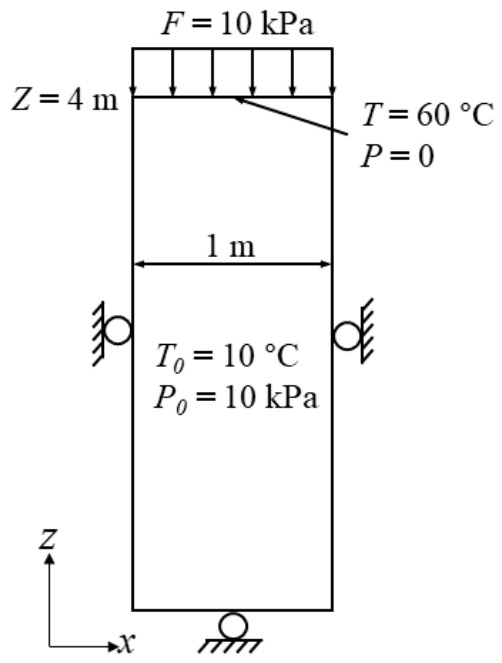
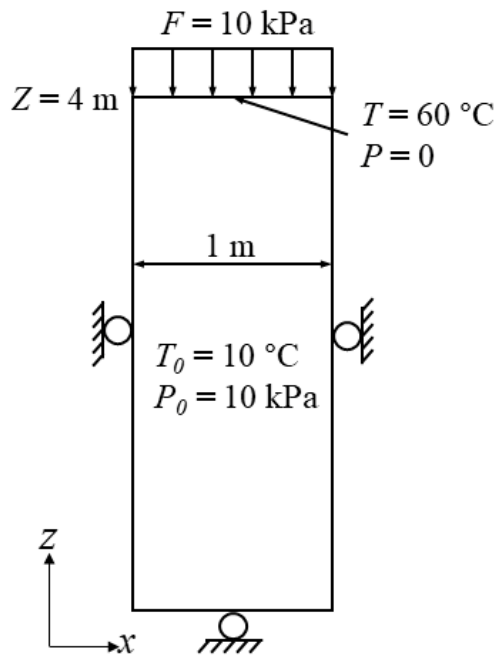
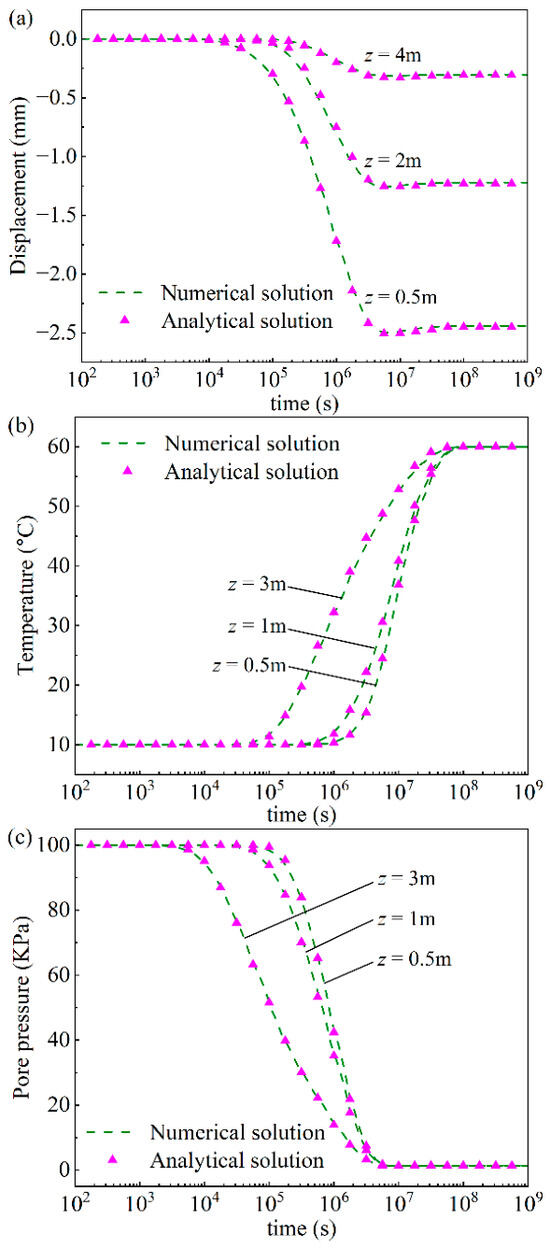
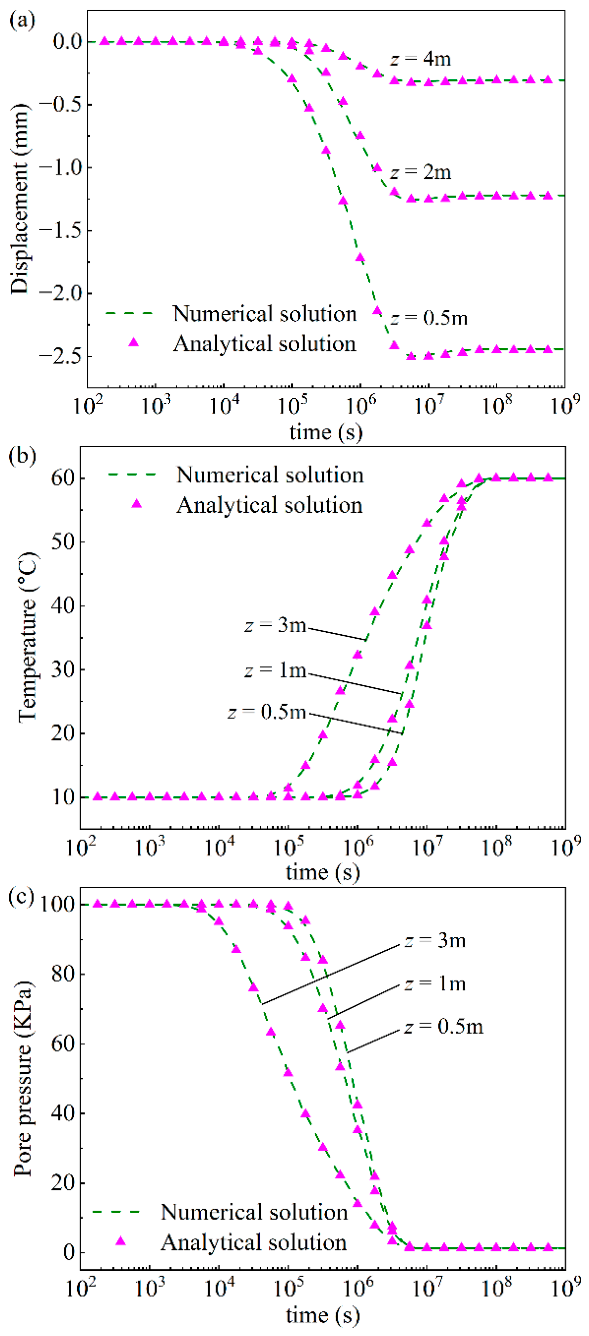
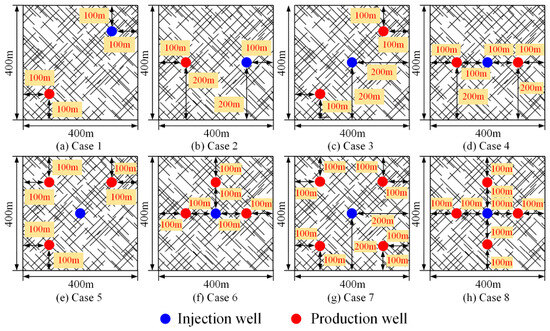
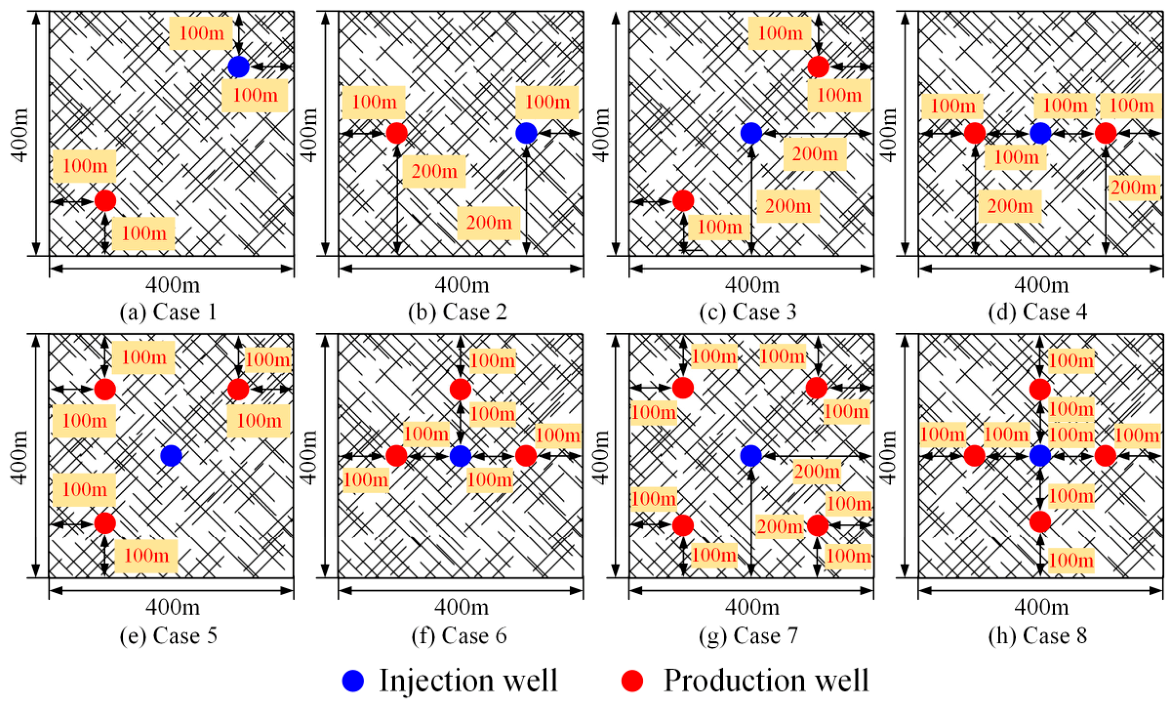
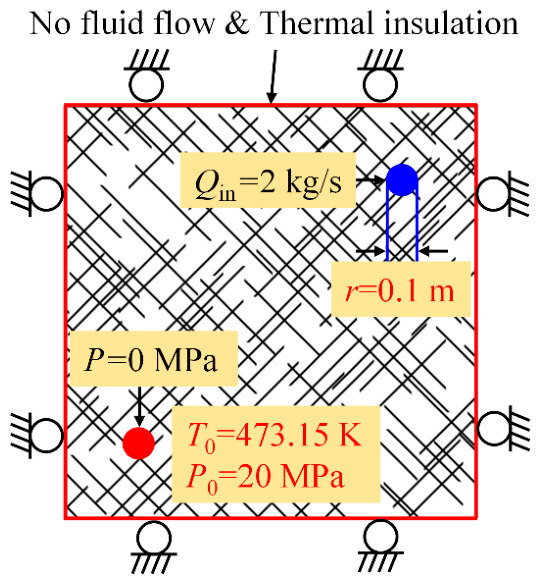
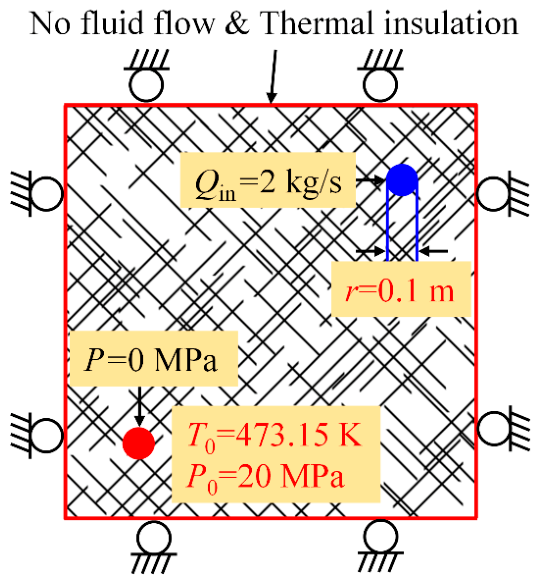
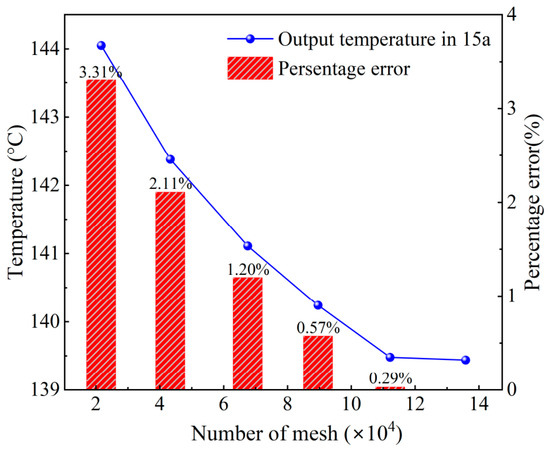
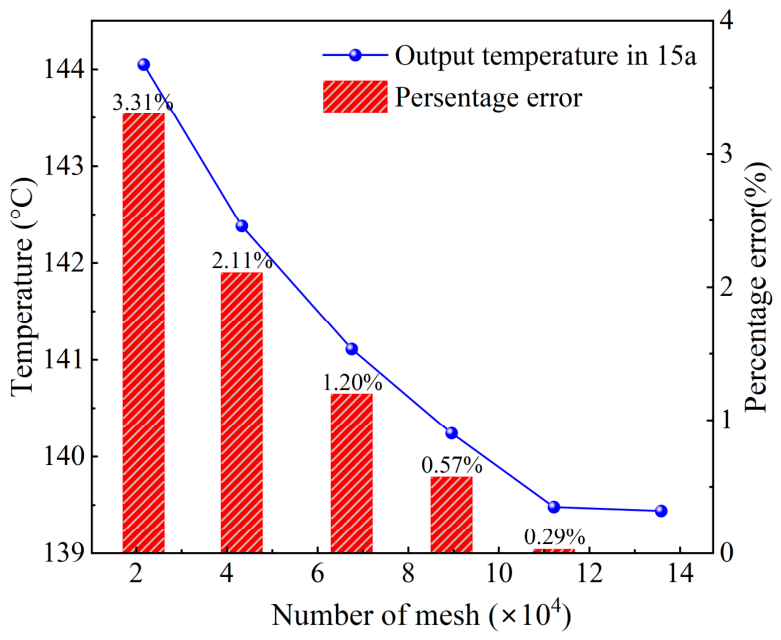
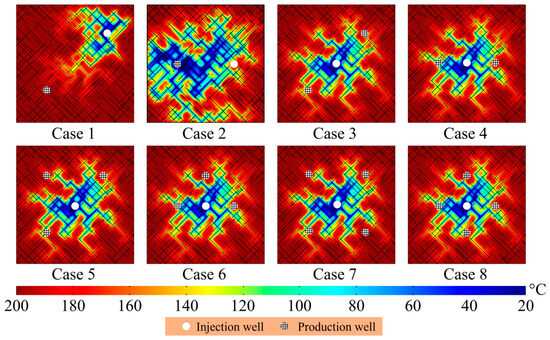
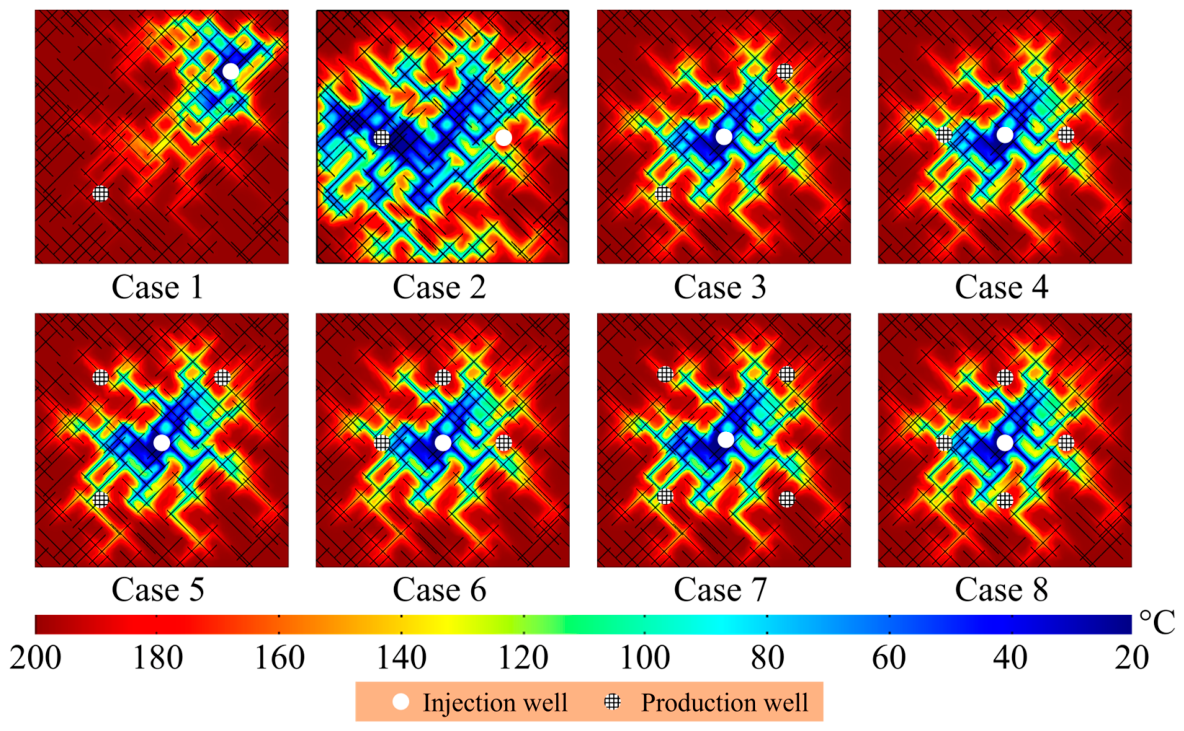
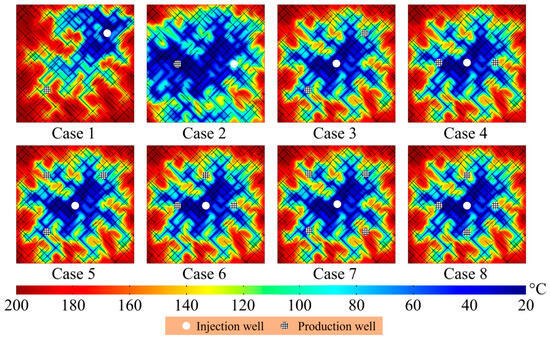
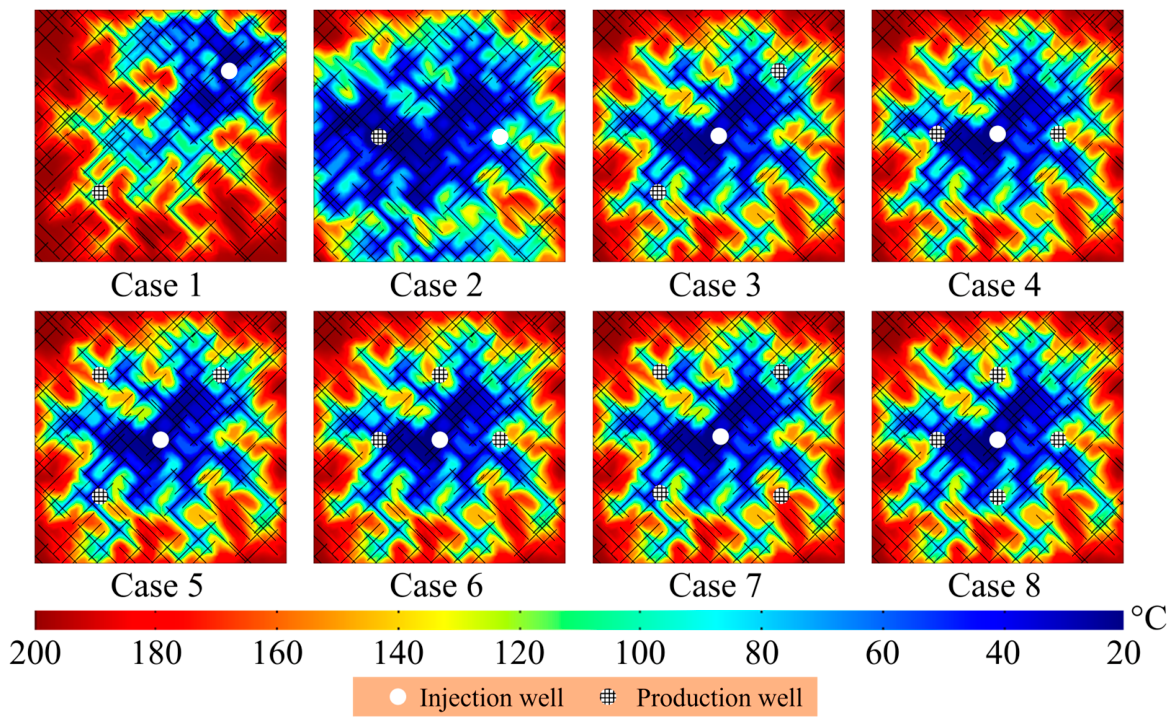
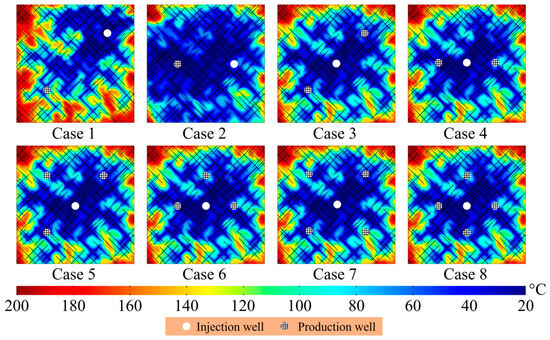
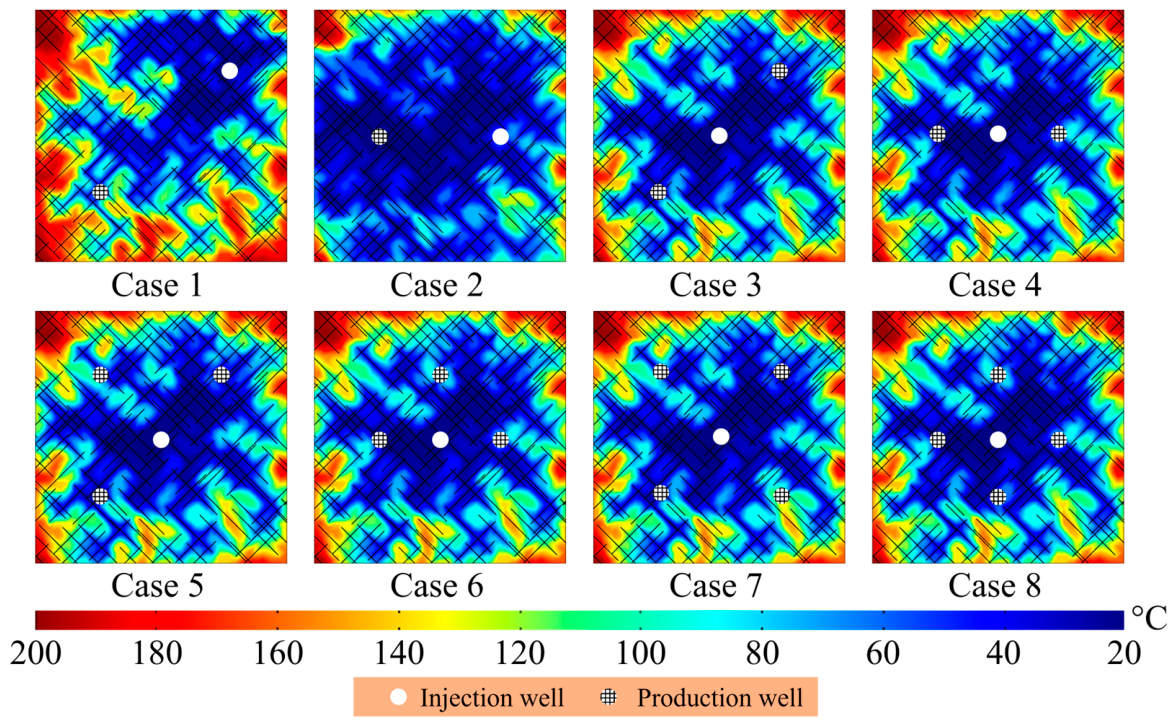
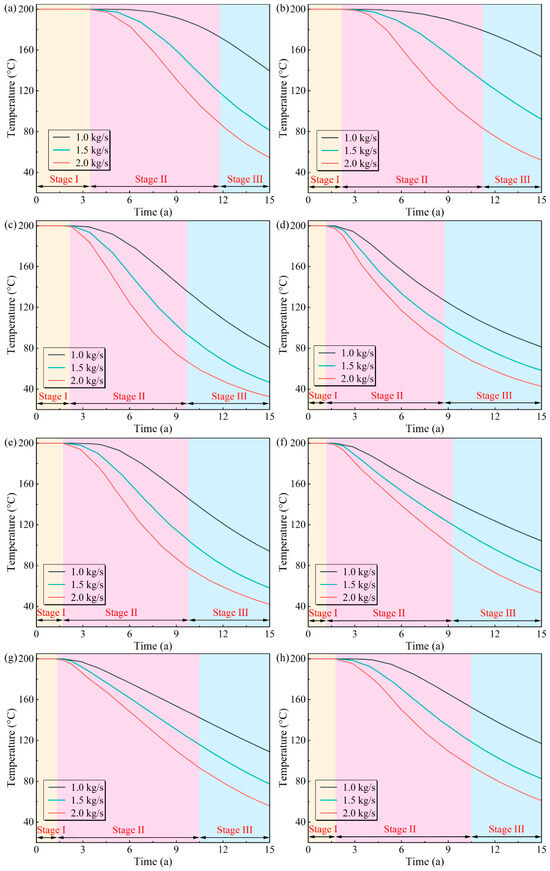
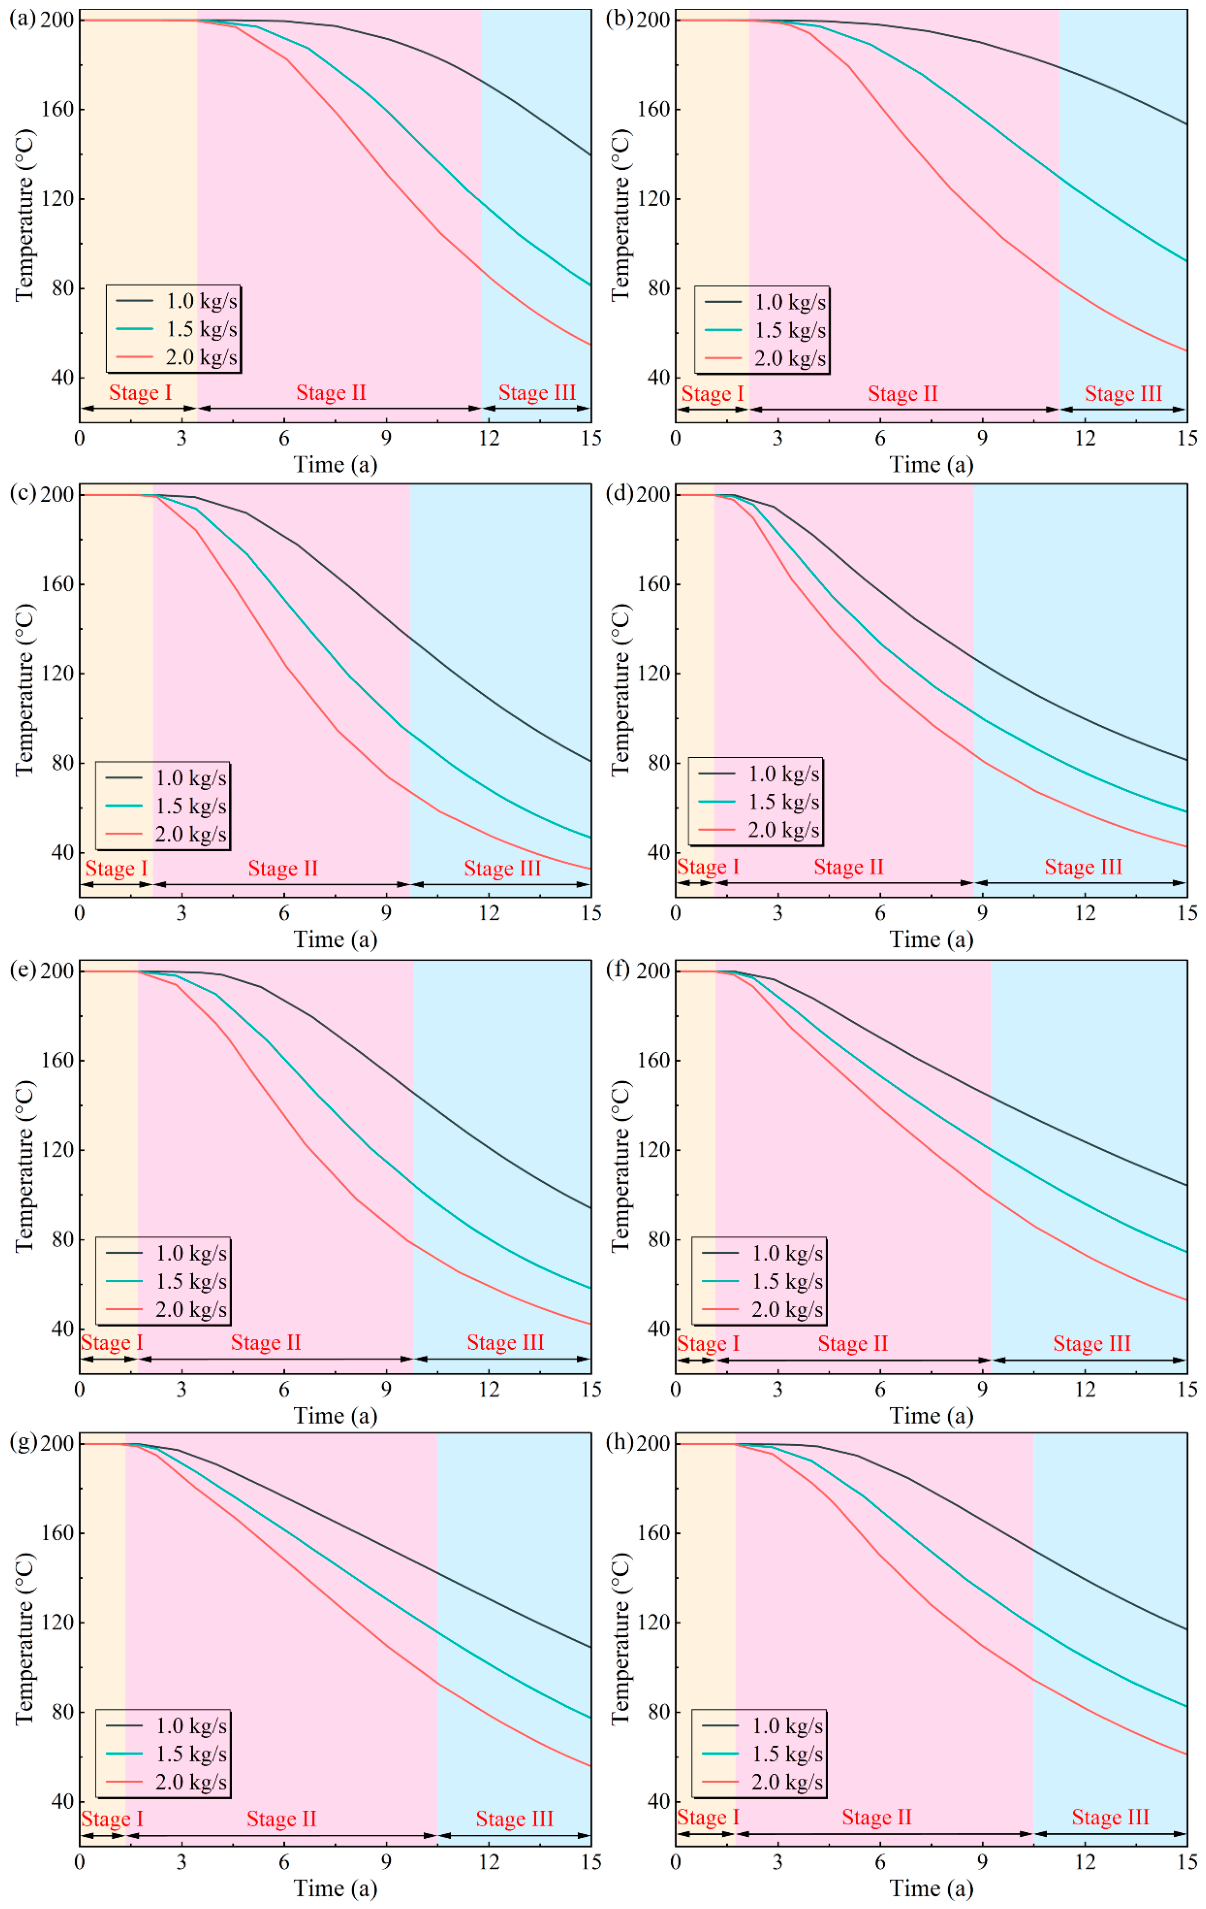
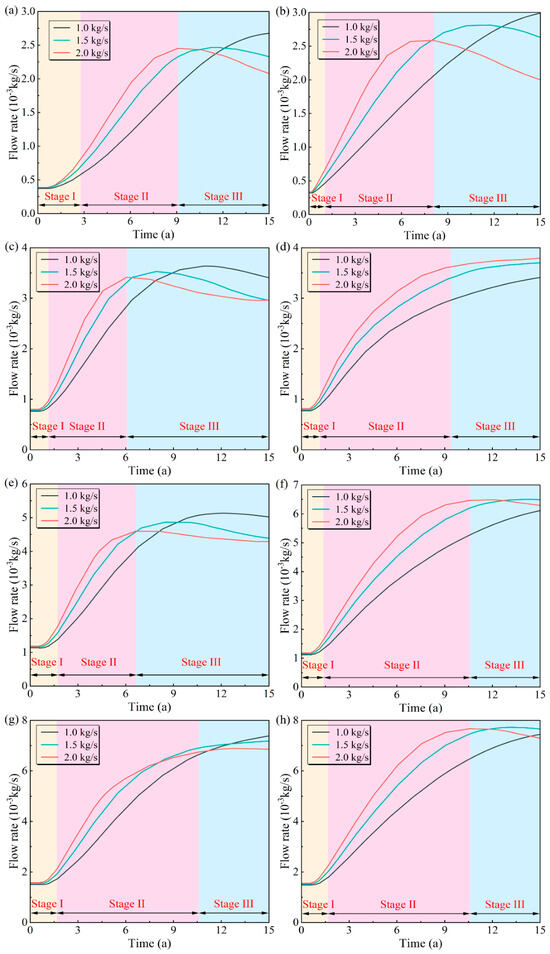
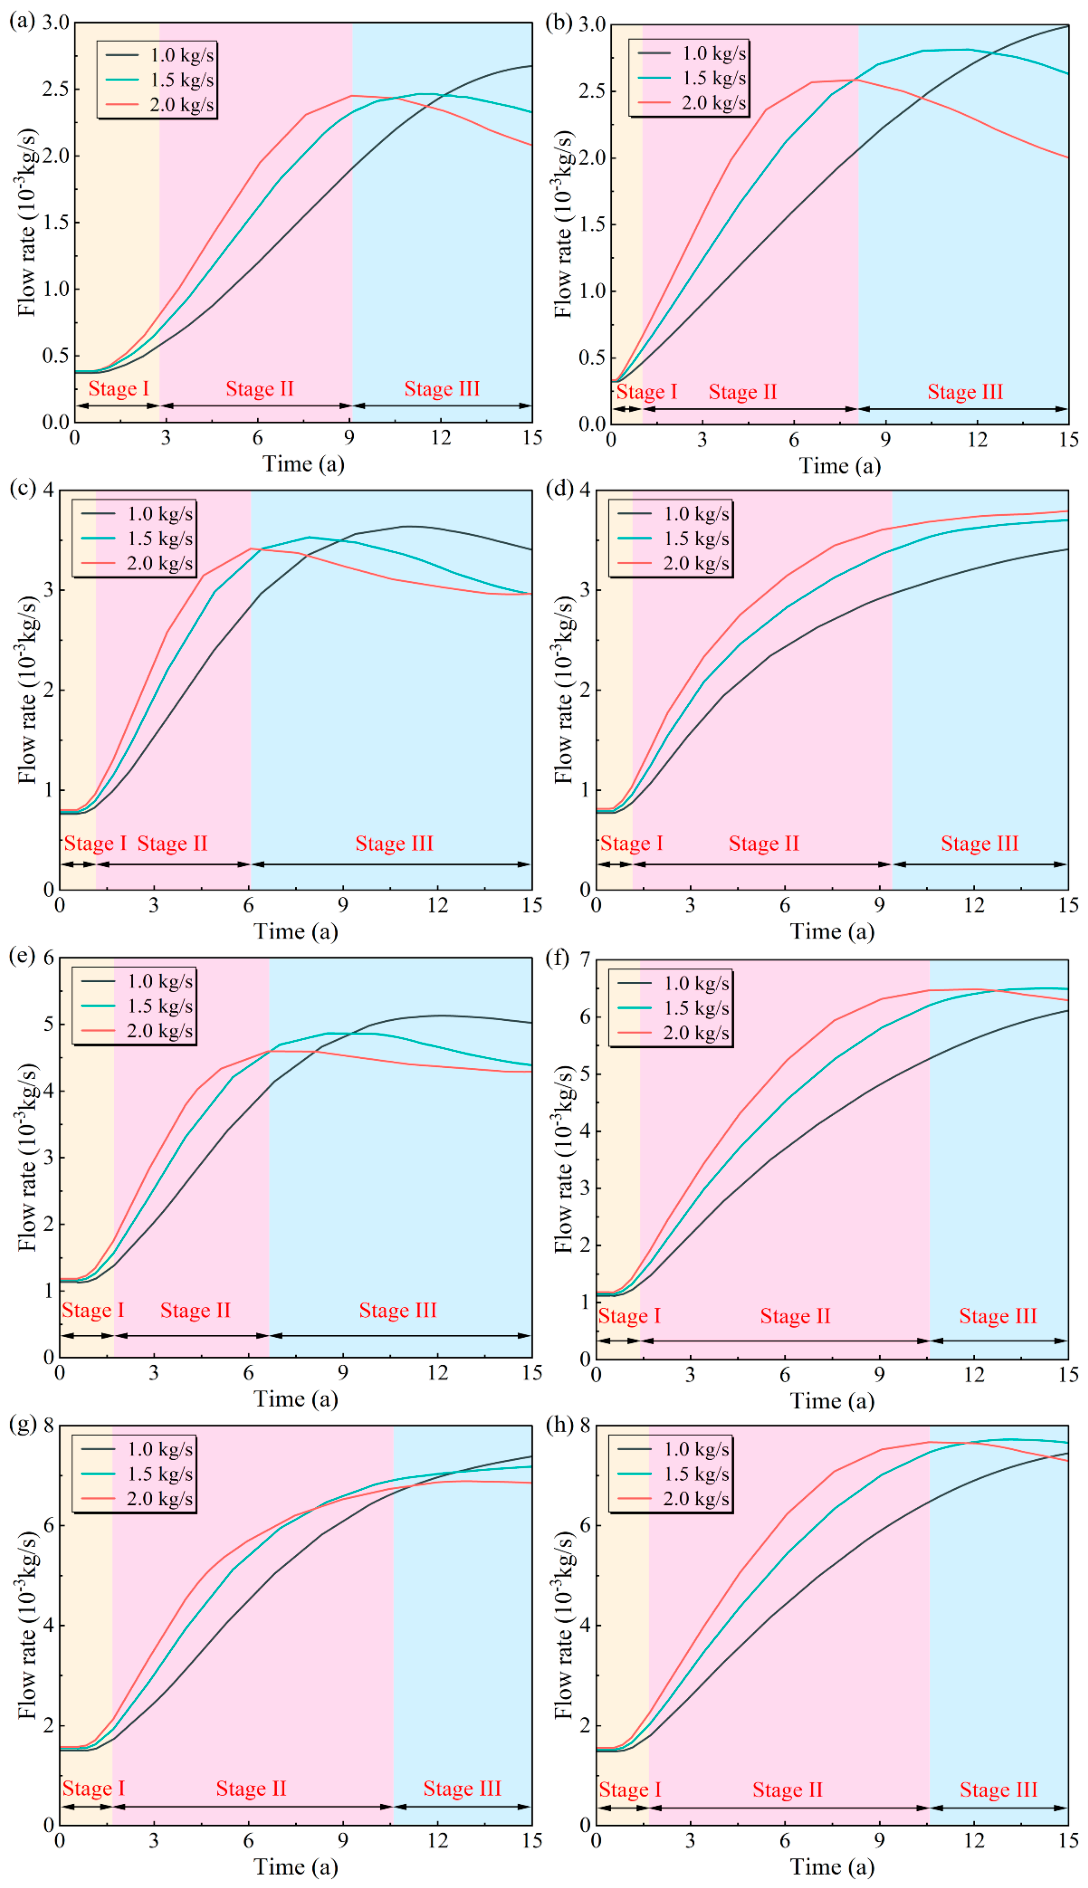
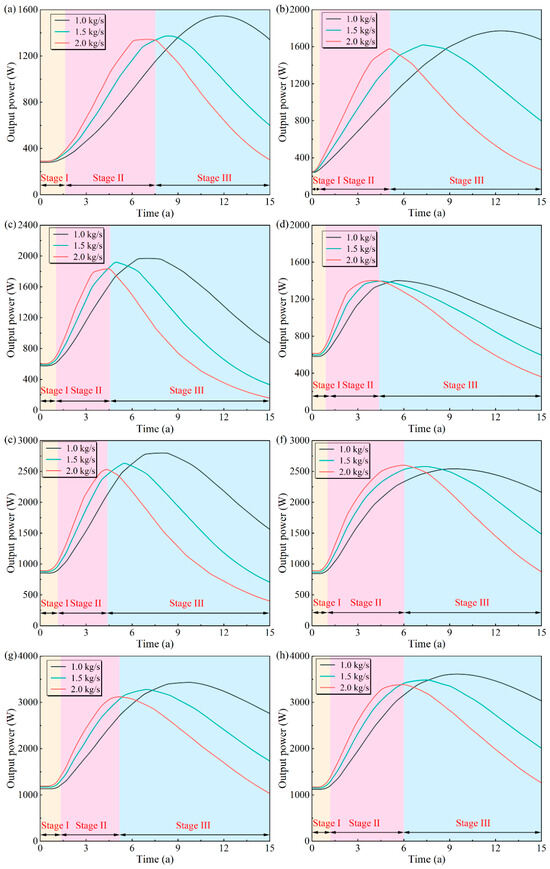
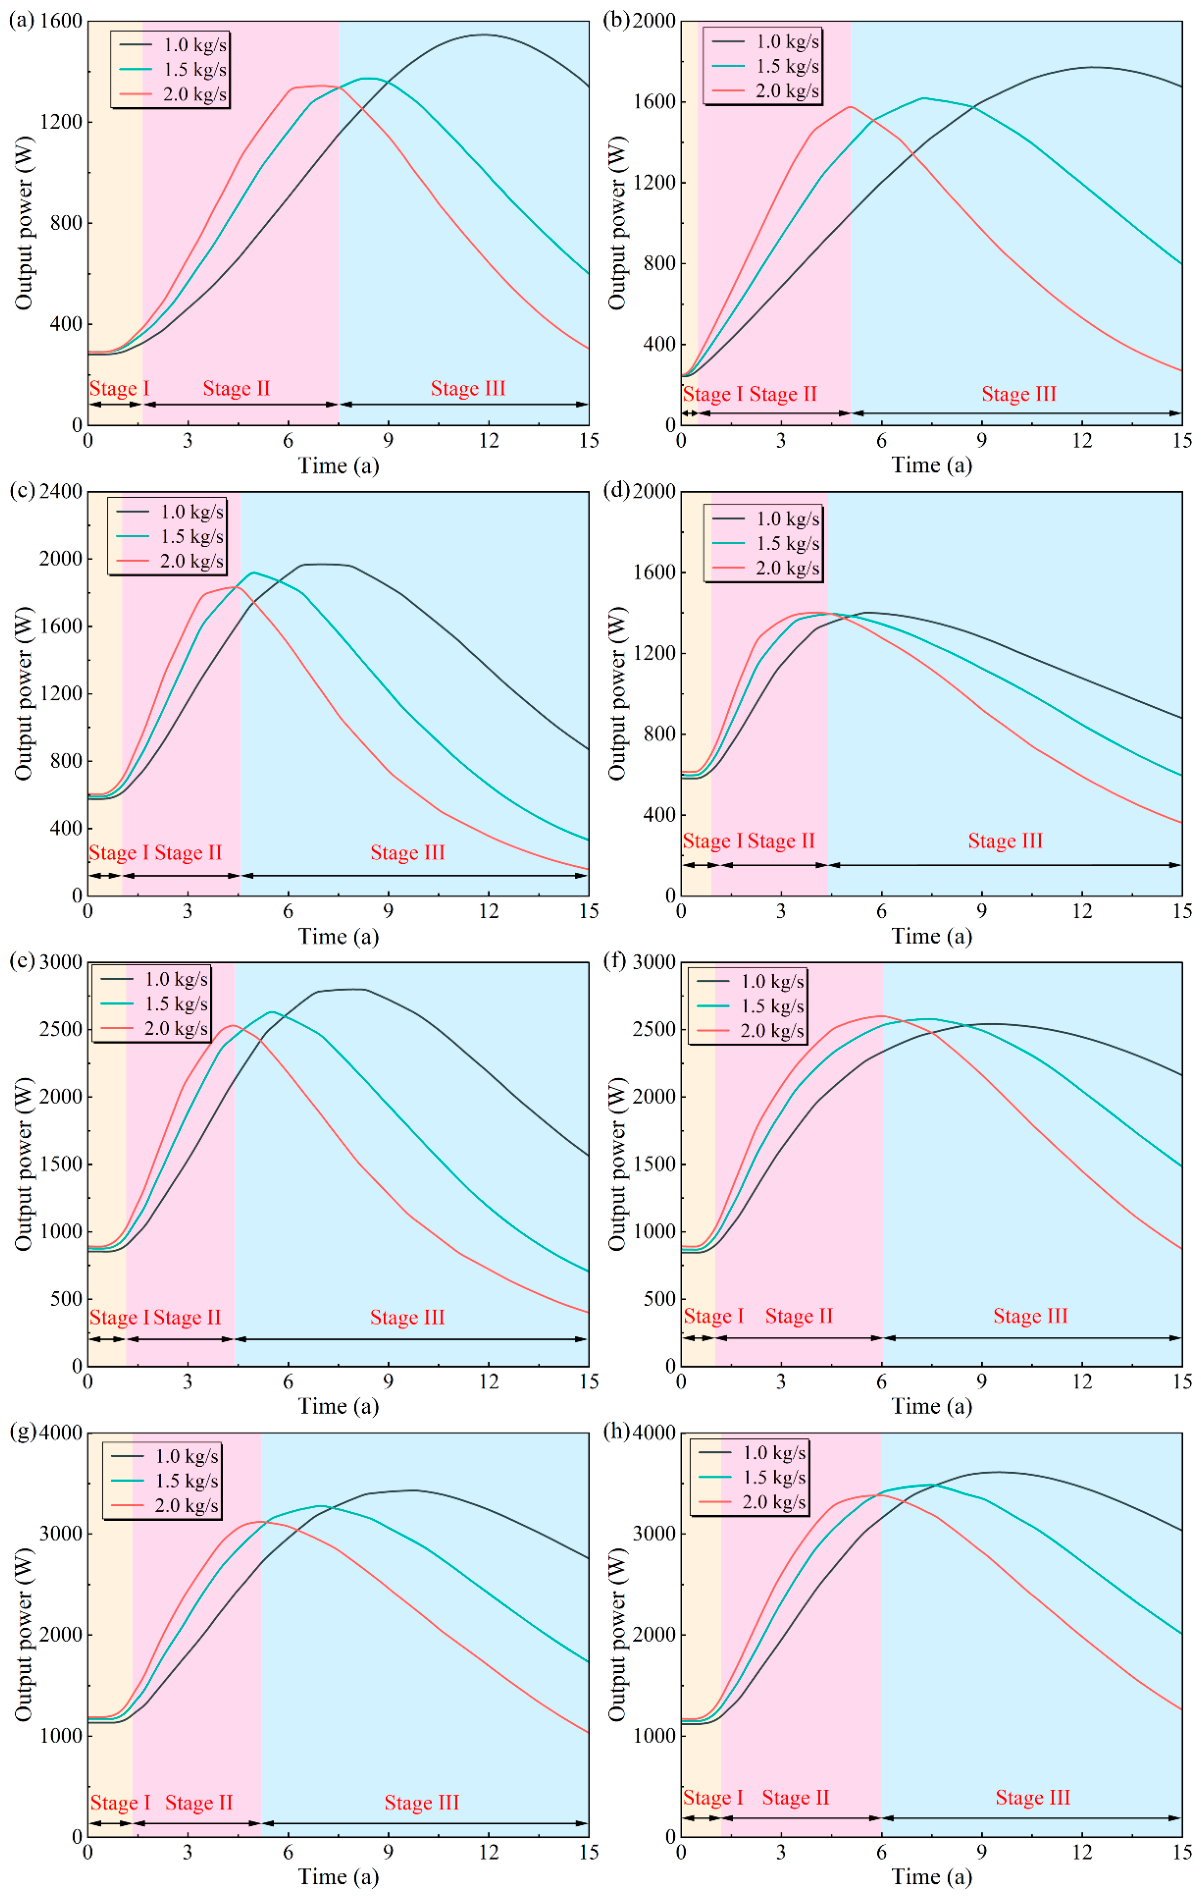

Disclaimer/Publisher’s Note: The statements, opinions and data contained in all publications are solely those of the individual author(s) and contributor(s) and not of MDPI and/or the editor(s). MDPI and/or the editor(s) disclaim responsibility for any injury to people or property resulting from any ideas, methods, instructions or products referred to in the content. |
© 2026 by the authors. Licensee MDPI, Basel, Switzerland. This article is an open access article distributed under the terms and conditions of the Creative Commons Attribution (CC BY) license.