


Abstract
Namibia’s rural communities continue to experience limited and unreliable electricity access despite the potential of the country’s exceptional solar, wind, and biomass renewable energy resources. Conventional grid extension remains financially and technically impractical for dispersed off-grid settlements, underscoring the need for cost-effective, renewable-based alternatives. This paper presents a resource-driven design and multi-objective optimization framework for Hybrid Renewable Energy Systems (HRESs) tailored to Namibia’s off-grid communities. The proposed model integrates solar PV, wind turbines, biomass generators, and hydrogen-based fuel cells with a hybridized energy storage consisting of batteries, supercapacitors, and hydrogen tanks. Using the Non-dominated sorting Genetic Algorithm-II (NSGA-II), the system simultaneously minimizes Total Life Cycle Cost (TLCC), Levelized Cost of Electricity (LCOE), Loss of Power Supply Probability (LPSP), carbon dioxide (CO2) emissions, and Wasted Renewable Energy (WRE). The framework is applied to three rural villages, Oluundje, Ombudiya, and Onguati, using high-resolution, site-specific renewable resource datasets and community-level load forecasts. The results demonstrate that resource-aligned configurations substantially improve system reliability (up to 99.28%), reduce LCOE (0.0023–0.0811 USD/kWh), and optimize dispatch behaviour across seasonal variations. Storage hybridization further enhances stability by balancing transient and long-duration deficits. Compared to existing diesel mini-grids, the optimized HRESs achieve markedly superior techno-economic and environmental performance. The proposed framework offers a scalable, adaptable, and policy-ready tool for accelerating sustainable rural electrification in Namibia.
1. Introduction
1.1. Background and Context
Access to reliable and affordable electricity remains one of the most pressing development challenges across the African continent. Despite significant progress in recent years, the continent’s average electrification rate stands at approximately 38% [1]. This energy gap constrains socio-economic development, limits industrial productivity, and undermines efforts toward poverty alleviation and social inclusion. Rural electrification is a critical development priority, particularly in Sub-Saharan Africa, where dispersed settlements, low population densities, and vast geographic distances make grid extension both technically challenging and economically prohibitive [2].
Namibia faces similar electrification challenges. Despite being richly endowed with Renewable Energy Resources (RERs), particularly solar, wind, and biomass, national electricity access stood at only 56.3% in 2020, with rural access substantially lower at 36.3% [3]. Compounding this challenge is the country’s dependence on electricity imports, primarily coal-based power from neighbouring countries, which historically accounted for 45.8% of the total supply [4]. This dependency not only exposes the country to external supply risks but also contradicts national and global commitments to Sustainable Development Goal (SDG) 7 (Climate Action).
For remote and sparsely populated settlements, off-grid electrification using locally available Renewable Energy Sources (RESs) presents a viable, cost-effective, and environmentally sustainable alternative to traditional grid extension [2]. However, the intermittency of dominant RESs, particularly solar and wind, poses significant operational challenges. Without appropriate Energy Storage Systems (ESSs), RES-based systems cannot reliably meet fluctuating load demands. Hybrid Renewable Energy Systems (HRESs), which strategically combine complementary RESs with short- and long-term storage technologies, have therefore emerged as the most effective solution for improving power quality, enhancing reliability, and ensuring continuous supply in off-grid environments [5]. Short-term ESSs enhance dynamic response and regulate voltage and frequency fluctuations, while long-term ESSs address extended deficits in RESs’ production [6,7]. As noted by Alzahrani et al. [8], the integration of ESSs with RESs represents one of the most effective approaches for sustainable rural electrification; however, ESS technologies also introduce challenges related to cost, control complexity, operational safety, lifecycle degradation, and mobility constraints [9]. Therefore, ESS selection must account for operational characteristics, response time, economic feasibility, and serviceability requirements [8]. Considering these factors, and based on a comparative analysis of storage technologies, supercapacitors, batteries, and hydrogen storage emerged as the most suitable technologies for hybridization in off-grid Namibian communities.
The optimal sizing and configuration of HRES components are essential to achieve cost-effective designs tailored to local resource availability and community energy needs [10]. Electrification planning is inherently multi-objective, often requiring the simultaneous evaluation of economic performance, technical reliability, and environmental sustainability [11,12]. However, many existing design tools prioritize cost minimization, neglecting equally important considerations, such as reliability and environmental factors, as well as their trade-offs, which are especially critical in rural contexts. To address this gap, this study adopts a resource-driven design framework, emphasizing the alignment of HRES configurations with locally available RERs and community-specific demand profiles. The model supports Namibia’s pursuit of SDG 7 (Affordable and Clean Energy) and 13 (Climate Action) to facilitate long-term socio-economic development in rural communities.
1.2. Academic Perspective and Need for Research
While PV–battery configurations are technically feasible, they often require very large Battery Energy Storage System (BESS) capacities to reach 100% renewable penetration, making them prohibitively expensive [13]. The addition of complementary resources such as wind can reduce battery cycling and lower the LCOE, yet batteries alone remain constrained by limited cycle life and high replacement costs [14,15]. Consequently, studies exploring multi-storage combinations such as PV/BESS/supercapacitors (SCs) [16] and PV/fuel-cell (FC)/SC systems [17] consistently demonstrate that supercapacitors are effective for smoothing high-frequency fluctuations, while fuel cells provide long-duration support during extended low-generation periods. These findings collectively confirm that no single storage technology can meet the dynamic and multi-timescale requirements of high-RES microgrids; rather, an optimal blend of short-term and long-term storage is essential for cost-effective and reliable operation.
A review of previous case studies reveals wide variation in load demand assessment methodologies. Some studies adopt holistic or simulated load profiles that reflect weekday–weekend differences and seasonal variations such as summer and winter peaks [18,19]. More sophisticated models incorporate socio-economic and behavioural uncertainty using stochastic techniques, including Markov Chain Processes [20] and bottom-up RAMP-based modelling [21]. Empirical studies targeting institutions (e.g., schools, clinics) capture seasonal variability by load type [22], whereas community-level surveys such as those conducted in Oluundje, Namibia [23], provide realistic data but often ignore inter-seasonal variations. Conversely, there are simplified forecasting models that assume constant daily loads across seasons, as in Amarika, Namibia [24].
Given the complexity of accurately modelling both supply and demand, optimal HRES sizing requires tools and techniques that can evaluate multiple conflicting objectives simultaneously. Typical objectives span economic (e.g., LCOE), technical (e.g., reliability), environmental (e.g., emissions), and social considerations such as affordability and local resource utilization [25].
Despite their widespread use, existing software tools for HRES planning present notable limitations. HOMER, the most-used platform for sizing and economic evaluation, supports simulation and sensitivity analysis but lacks capabilities for true multi-objective optimization and cannot model critical factors such as battery depth of discharge or environmental indicators [26,27]. Other tools, such as HYBRID2, HYBRIDS, TRNSYS, RETScreen, and PVsyst, offer specialized features but suffer from some constraints. HYBRID2 requires extensive datasets and lacks flexibility, TRNSYS and HYBRIDS simulate transient behaviour but cannot determine optimal sizing, RETScreen supports financial and emissions analysis but does not model temperature effects on PVs, and PVsyst excels in PV modelling but lacks hybrid system optimization capabilities [28]. These limitations collectively indicate that generic tools are insufficient for designing systems for rural Namibian communities that align with SDGs 7 and 13.
As a result, the literature increasingly favours advanced optimization methods, particularly heuristic and metaheuristic algorithms that can efficiently explore non-linear, multi-dimensional search spaces. Dad and Saleem [29] identified a wide range of techniques used in HRES optimization, from analytical and iterative methods to probabilistic, graphical, and Artificial Intelligence (AI)-based approaches. Analytical methods benefit from simplicity but struggle with non-linear formulations [30], while iterative methods are intuitive yet often slow to converge [31]. Graphical techniques are easy to interpret but limited to two variables [32]. Consequently, Genetic Algorithms (GA), Particle Swarm Optimization (PSO), Simulated Annealing (SA), and Artificial Neural Networks (ANN) have become the preferred choice for addressing the inherent non-linearity and uncertainty of HRES design.
Maheri [33] asserts that the three dominant uncertainties, renewable resource variability, parameter uncertainty in cost and power models, and unpredictable human behaviour, necessitate the use of algorithms capable of global search and robust handling of stochastic inputs. For single-objective problems, algorithms such as PSO, GA, SA, Ant Colony Optimization, Harmony Search, and Bee Swarm Optimization have been applied. For multi-objective optimization, NSGA-II, NSGA-III, and Multi-Objective PSO (MOPSO) are the most widely adopted.
Comparative studies show distinct strengths. MOPSO generally offers faster convergence and better uncertainty handling, while NSGA-II produces more accurate and diverse Pareto fronts. Husain et al. [34] found that MOPSO yields lower Loss of Power Supply Probability (LPSP), whereas NSGA-II results in lower LCOE. Similarly, for solar–wind–battery systems, MOPSO converges faster, but NSGA-II provides superior Pareto diversity [35]. In systems incorporating hydrogen technologies, both NSGA-II and MOPSO perform comparably in achieving high Primary Energy-Saving Ratios (PESR) [36].
1.3. Gap in the Research and Novelty of the Presented Work
Although various tools and models have been applied to HRES design, most existing approaches still fall short of capturing the full multi-dimensional nature of rural electrification planning. They rarely integrate cost, reliability, environmental impact, and multi-storage dynamic within a unified optimization framework.
These limitations underscore the need for more comprehensive methods capable of jointly exploring the trade-offs among economic, technical, and environmental objectives under varying rural resource and demand conditions. To address this gap, the present study develops a multi-objective optimization model based on the weighted NSGA-II algorithm to simultaneously minimize TLCC, LCOE, LPSP, WRE and CO2 emissions. The proposed framework integrates multi RESs (SPV, wind, biomass, and fuel cells) together with complementary storage technologies including batteries, supercapacitors, and hydrogen storage, enabling robust performance across both transient and steady-state operating conditions.
The novelty of this work lies in the development of a customized adaptive NSGA-II approach combined with a weighted Pareto-based mechanism, allowing for a systematic evaluation of trades-offs across the five objectives. The model is applied to three rural Namibian communities (Oluundje, Ombudiya, and Onguati), with differing resource availability and load characteristics, demonstrating its scalability, adaptability, and suitability for real-world electrification planning.
2. Renewable Energy Resources Analysis
2.1. Wind Speed Analysis
Using the seasonal histograms given in Figure 1, with a wind speed distribution of 0.5 m/s wind bins for the three rural areas, it is confirmed that winter is the most favourable season, with the lowest null wind (<2.5 m/s) percentages, and summer is typically the least favourable (highest null wind), as is further summarized in Table 1. The wind resource data (wind speed) were obtained from the Global Wind Atlas and NASA Prediction of Worldwide Energy Resources (POWER) database for 2023 at hourly resolution, and extrapolated to the required hub height for analysis. These seasonal patterns underscore the need for hybridization and storage to manage intra-day and seasonal supply variations.
Figure 1.
Seasonal wind speed distribution frequency for (a) Oluundje, (b) Ombudiya and (c) Onguati villages.
Table 1.
Average Percentage of Wind Speed (<2.5 m/s) in Each Village for Every Season.
2.2. Solar Irradiance Analysis
Solar PV (SPV) converts irradiance to electricity and is strongly influenced by Global Horizontal Irradiance (GHI) and cell temperature. A minimum solar insolation needed to generate electricity is 100–200 W/m2 [36]. The solar resource assessment for the three rural areas was based on re-analysis data obtained from the NASA POWER database, accessed via the NASA POWER Data Access Viewer. The GHI and temperature parameters were extracted for the geographical coordinates of each site, for 2023, at hourly resolution, as presented in Figure 2.
Figure 2.
Winter, Summer, Autumn and Spring Solar Irradiance for (a) Ombudiya, (b) Oluundje and (c) Onguati.
The solar irradiance assessment for the three villages, Ombudiya, Oluundje, and Onguati, reveals strong and consistent solar energy potential throughout the year, as illustrated in Figure 2a, Figure 2b and Figure 2c, respectively. Specifically, summer exhibits the highest irradiance levels, with peak GHI values exceeding 1076.35 W/m2 in Ombudiya, 1093.7 W/m2 in Oluundje, and 1104.53 W/m2 in Onguati. Spring also demonstrates strong irradiance, averaging between 980 W/m2 and 1000 W/m2, followed by autumn, which presents slightly lower peaks (around 820–950 W/m2). Observably, winter exhibits the lowest solar intensity, with irradiance values of approximately 780–790 W/m2, though still well above the minimum PV-operational threshold of 200 W/m2.
The annual and seasonal GHI profiles indicate high solar stability with minor seasonal variations, affirming the feasibility of year-round photovoltaic generation. However, the absence of irradiance during the morning and night time highlight the necessity of energy storage systems or hybrid operation (e.g., with wind or biomass) to maintain supply continuity during non-solar irradiance hours.
2.3. Biomass Resources
Table 2 illustrates the biomass power generation potential of the three sites. The biomass resource estimates were derived from national and literature-based datasets on biomass distribution in Namibia, including bush encroachment and agricultural residue assessments, combined with assumptions regarding sustainable feedstock availability and energy conversion. In this study, only 30% of the total theoretical biomass resource is considered available for energy generation, to account for competing uses (e.g., domestic consumption and agriculture), environmental sustainability constraints, and practical limitations in biomass collection and processing [37].
Table 2.
Biomass resources of the three rural areas.
It can be observed that the Oluundje and Ombudiya villages have higher biomass resources compared to Onguati village. This variation plays a significant role in determining the optimal hybrid system configuration, as will be illustrated in the subsequent sections.
This section provides an overview of the available RERs, highlighting their availability and variability for rural electrification in Namibia. The discussion emphasizes the variability and complementarity of solar, wind, and biomass resources. All datasets were selected to ensure reliability, consistency, and suitability for long-term techno-economic analysis.
3. Modelling of Hybrid Renewable Energy System
3.1. System Overview
Mathematical formulations and simulation procedures for solar PV, wind turbines, and biomass gasifiers are presented, along with the corresponding energy storage systems (battery, supercapacitor, and fuel cell). The models incorporate key environmental, operational, and design parameters to ensure realistic performance evaluation. Furthermore, this subsection outlines the methodology used to estimate and forecast energy demand for rural communities.
3.2. Solar Power Model
SPV output power is determined using Equation (1) [38]:
where ηpv is the photoelectric efficiency in (%), Apv is the area of the PV array in (m2), GT (W/m2) is the incident solar radiation and Tc (°C) is the cell operation temperature [39]. The GHI is used for SPV GT. Using GHI and ambient temperature, module temperature is as given in Equation (2) [39,40]:
where and denote cell temperature and ambient temperature respectively, and is nominal operating cell temperature [39]. The value is in the range of 45 ± 3 °C, based on the climate condition of the state [40].
3.3. Wind Power Model
Wind output power is determined using Equation (3) [41]:
where is the rated power, and , , , and are the actual, cut-in, cut-out and rated wind speeds (m/s), respectively. The rated power is defined as a function of the area swept by the wind turbine blades (), air density () (1.225 kg/m3), power coefficient (), wind turbine generator efficiency () and the rated velocity (), as indicated in Equation (4) [41]:
The theoretical maximum value of the power coefficient is 0.593, also known as the Betz’s coefficient [42]. However, practical wind turbines operate at lower power coefficients due to aerodynamic losses. In this study, a value of is adopted to represent realistic turbine performance under typical operating conditions.
3.4. Biomass Power Modelling
Biomass gasification generator power is determined using Equation (5) [43,44].
where is the efficiency of the biomass generator.
3.5. Battery Storage System Model
The equations used for the mathematical modelling of the battery outlined in [45] is as given in Equation (6), illustrating the Battery State of Charge (SOC).
where represents the SOC at time t, expressed in seconds, represents the initial SOC value, represents the battery capacity, and is the current through the battery expressed in (A). is positive for the discharging cycle and negative for the charging cycle, as illustrated in Equations (7) and (8).
Discharging equation (
Charging equation (
where is the battery voltage in volts, is the battery current in amperes, is the time in seconds, is the constant battery voltage in volts, is the maximum battery capacity in ampere-hour, is the exponential voltage in volts, is the exponential zone time constant inverse (Ah)−1, is actual battery capacity (Ah), is low-frequency current dynamics and is the polarization constant in (Ah)−1.
3.6. Capacitance Model
The capacitance of the supercapacitor is determined using Equation (9) [46]:
where is the Capacitance, is the discharge energy between start and end voltages and is the rated voltage of the supercapacitor.
3.7. Fuel Cell Model
Fuel cells operate on the opposite principle of water electrolysis. The cells work on the premise of recovering the combustion energy of hydrogen and converting it into electrical energy at each electrode through Equations (10) and (11) (chemical reactions) [47].
Anode reaction:
Cathode reaction:
The total voltage produced by the fuel cell (FC) is determined using Equation (12) [48]:
For cells connected in series and forming a stack, the voltage is determined by Equation (13):
where is the thermodynamic potential of each unit cell and represents its reversible voltage, is the voltage drop associated with the activation of the anode and of the cathode, is ohmic voltage drop associated with the conduction of protons and electrons, is voltage drop resulting from the decrease in the concentration of oxygen and hydrogen.
3.8. Hydrogen Storage Tank Model
According to the gas-state equation, internal pressure of a hydrogen tank is determined using Equations (14)–(16):
where is the tank pressure; is the amount of hydrogen in the tank; is the volume of tank; is the molar gas constant; is the gas temperature; () is the initial value of the substance inside the gas tank at time ; is the net hydrogen feed flow rate; and is the hydrogen flow rate at a gas tank outlet.
3.9. Load Model
The mathematical models adapted in this study to forecast the aggregated load demand are provided in Equations (17) and (18).
where is the hour of the day [h = 0, 1, 2, 3, … 23], refers to the type of electrical appliances and refers to the type of consumer, is the number of users and is the type of appliance of each consumer class (TVs, lights, phones, etc.), represents the nominal power of the different types of appliances of each consumer, is the total daily load demand of the entire system, is the hourly load demand of the entire system.
4. Proposed Energy Management Strategy
HRESs consisting of multiple energy sources are increasingly investigated to provide a reliable and uninterrupted power supply in remote or islanded microgrids. However, to ensure the efficient and safe operation of such systems, a robust Energy Management Strategy (EMS) is essential. The EMS governs the coordination of energy sources, controls power generation and distribution, and regulates the charging and discharging behaviour of ESSs, ensuring system reliability and performance under varying operational conditions. As emphasized in [49,50], the development of an EMS must consider load behaviour, the nature of energy sources, and their availability to ensure technical feasibility, economic efficiency, and long-term system reliability. Additionally, EMSs play a critical role in maintaining power balance under fluctuating generation conditions, particularly in isolated microgrids [51].
While numerous studies have focused on the techno-economic sizing of HRES components, many neglect operational dispatch strategies [50]. However, subtle adjustments to control logic can substantially improve system dynamics. According to Sanaa et al. [51], the careful alignment of energy production, consumption, and storage methodology enhances system responsiveness, stability, and efficiency, especially during transience or periods of resource unavailability.
Given the centralized configuration of the proposed system and the goal of integrating sizing and dispatch control within a unified framework, this study adopts a deterministic rule-based EMS guided by a Multi-Objective Optimization approach (NSGA-II). This hybrid strategy enables optimal component sizing while ensuring real-time operational flexibility, energy balancing, and the protection of critical components [50].
4.1. Objectives of the Proposed Energy Management Strategy
Taking into consideration the intermittency of the RERs and the unpredictable load variations, the proposed EMS aims to achieve the following:
- (i)
- Ensure a reliable and continuous supply of power to the loads depending on power availability.
- (ii)
- Ensure efficient operation of the different RESs and HESS.
- (iii)
- Reduce hybrid system operational cost.
- (iv)
- Avoid overcharging and over-discharging of the battery and ultracapacitors.
Factors Taken Into Consideration for the Proposed EMS
The effectiveness of the proposed EMS is evaluated in terms of the reduction in LPSP, and reductions in operation cost, ESSs and greenhouse gas emissions by systems; therefore, the following factors are taken into consideration:
- Wind and Solar: Since the prediction of the power output from these RESs is challenging and cannot be dispatched at will, it is recommended for utilization when available or stored for later use.
- Load-Following Strategies: Fuel cell energy production and biomass energy production.
- The model combines real-time PV and wind power information, considers the limitation of the SOC of the HESS, adjusts the charge or discharge power of ESSs in real time, and optimises the working state of different energy storage components.
4.2. Modes of Operation of the Hybrid Energy Sources System
Mode 1: Wind and solar energy are produced to maximum capacity as per their availability:
- (a)
- The batteries and supercapacitors are charged during this mode with relation to the RESs generation and load demand provided that SOC ≤ SOCmax.
- (b)
- The dump load is activated during this mode if SOC = SOCmax for both the batteries and supercapacitors, and there is still excess energy in the network.
Mode 2: Supercapacitors have high power densities and tolerate a large number of rapid charge–discharge cycles as compared to batteries [52]. Therefore, in this study, the supercapacitor is available for transient responses to absolve or provide peak currents, and it is used to respond to rapid load and RESs generation variations when the generated power by the RESs is lower or higher than the load demand.
Mode 3: A battery bank is used to supply long term power and cater for low-frequency loads and RESs variations, and for transient responses.
Mode 4: The fuel cell is used to supply long-term power when the batteries are discharged beyond or equivalent to SOCmin or when the batteries cannot fully supply the load.
- (a)
- The batteries and supercapacitors are not charged during this mode.
- (b)
- The dump load is not activated during this mode.
Mode 5: Biomass generator is used to supply long-term power when the batteries and fuel cell resources are deployed beyond their minimum thresholds, or when these resources cannot fully supply the entire load.
- (a)
- The batteries and supercapacitors are not charged during this mode.
- (b)
- The dump load is not activated during this mode.
Mode 6: When the total generation from all the RESs and ESSs cannot fully supply the load, and the power is sufficient to supply the critical load, then only the critical load will be supplied; otherwise, the power from wind and solar will be used to charge the battery and supercapacitor and no load will be supplied during that period.
- (a)
- Proposed Energy Management Flow Chart
To further demonstrate the energy flow management of the microgrid, the proposed energy management flowchart is provided in Figure 3.
Figure 3.
The proposed energy management flow chart.
5. Proposed Optimization Algorithm
The NSGA-II algorithm, introduced by Deb et al. in 2002, overcomes the limitations of the original NSGA by introducing elitism, fast non-dominated sorting, and crowding distance comparison [34,53]. NSGA-II is widely recognized for its computational efficiency and is extensively used as a benchmark for evaluating new optimization methods. Unlike other algorithms, such as MOPSO, NSGA-II handles complex multi-dimensional problems with higher stability but may require more time to converge.
Given the limitations of existing tools and the need for high-accuracy, customized optimization for rural electrification in Namibia, this study proposes the development of a multi-objective, NSGA-II-based optimization model. The model is tailored to local energy resource data, socio-economic characteristics, and policy frameworks. Its goal is to ensure reliable, cost-effective, and environmentally sustainable electrification aligned with national development goals and SDGs 7 and 13. The adapted NSGA-II algorithm is presented in Algorithm 1:
| Algorithm 1: The Proposed NSGA-II for HRES |
| Inputs: 1: N = 10 (population size). 2: G = 10 (number of generations). 3: Decision vector X = [PPV, PWind, PBio, EBat, ESC, PFC, H2max, Invsize, …] The decision vector X represents the set of design variables optimized in the model where PPV (kW) is the installed solar PV capacity, PWind (kW) is the wind turbine capacity, PBio (kW) is the biomass generator capacity, EBat (kWh) is the battery energy capacity, ESC (kWh) is the supercapacitor capacity, PFC (kW) is the fuel cell power rating, H2max (kg or kWh equivalent) is the hydrogen storage capacity, and Invsize (kW) is the inverter capacity. 4: System parameters: efficiencies (ηPV, ηWind, ηBio, ηFC); SOC limits (SOCSCmin = 0.2, SOCSCmax = 0.9; SOCBatmin = 0.2, SOCBatmax = 0.8); Hydrogen bounds [H2min, H2max]; yearly biomass cap. 5: Termination: stop after G generations. 6: Random seed fixed; log best LCOE every 5 generations. |
| Objectives (all minimized): 7: f1 = LCOE(X) 8: f2 = TLCC(X) 9: f3 = 1 − Reliability(X): Reliability inverted so that minimization favors higher reliability 10: f4 = CO2 Emissions(X) 11: f5 = −Wasted Power(X): Wasted renewable energy inverted so that minimization favors lower curtailment |
| 12: Initialization Phase 13: Generate N feasible solutions P = {X1, …, XN} Using generate_random_solution(). 14: Apply repair_individual() (round PBio to 100 kW, PFC to 6 kW, enforce bounds). |
| 15: Fitness Evaluate 16: For each Xi ∈ P: 17: Run hourly EMS dispatch simulation. 18: Compute F (Xi) = [f1, f2, f3, f4, f5] |
| 19: Non-Dominated Ranking 20: Apply fast non-dominated sorting → fronts F1, F2, … 21: Compute crowding distance in each front. |
| 22: Main Evolutionary Loop 23: For generation g = 1 to G do 24: Selection and Reproduction 25: Initialize Q = ∅. 26: While ∣Q∣ < N do 27: Select parents via tournament (size = 3). 28: Uniform crossover with pc = 0.9 else clone. 29: Mutation per gene with rate 0.80: → X′ = X × (0.4 + 0.7·rand). 30: Repair offspring; add to Q. 31: End while 32: Environmental Selection 33: Combine R = P ∪ Q. 34: Non-dominated sort R → F1, F2, …. 35: Fill Pnext with successive fronts until ∣Pnext∣ = N. 36: If last front overfills: select by highest crowding distance. 37: Progress Logging 38: If g mod 5 = 0, record min (f1) in Pnext. 39: Set P ← Pnext. 40: End for |
| 41: Termination 42: Return final Pareto set F1 from generation G. |
| 43: Weighted Decision-Making 44: Normalize objective values for all Xi ∈ F1. 45: Assign weighting factors reflecting rural-electrification priorities: LCOE = 0.35; Reliability (LPSP) = 0.35; Emissions = 0.10; Wasted Power = 0.20 46: Compute weighted score: Score(Xi) = 0.35 + 0.35 + 0.10 + 0.20 The weighting factors were selected to reflect the practical priorities of rural electrification systems, where affordability and reliability are the primary design drivers. Accordingly, higher weights were assigned to LCOE and LPSP, while lower weights were assigned to environmental impact and excess energy objectives. These selections are based on engineering judgment and are supported by the existing literature, which emphasizes cost and reliability as the dominant criteria in off-grid system design. It is acknowledged that the final optimal solution is sensitive to the choice of weighting factors; however, the selected values provide a balanced trade-off between competing objectives within the scope of this study. 47: Select final preferred configuration X* = arg Score(Xi) |
5.1. Problem Formulation
Objective functions are crucial components in the optimization of HRESs, as they guide the search for optimal solutions by quantifying system performance. According to Sharma and Kumar [54], objective functions are computable mathematical expressions that evaluate the quality of candidate solutions based on decision variables. In this study objective function are derived using Equations (19) and (20):
where k is the number of objective functions, and each function represents a specific performance criterion. In addition, the different objective functions for this study are divided into financial, technical and environmental functions and are described for modelling as follows:
Financial objectives:
Technical objectives:
Environmental objectives:
where , , , and represent the electrical energy generated (kWh) at time by the solar PV, wind, biomass, and fuel cell systems, respectively; , , , and are the corresponding emission factors (kgCO2/kWh). In this study, emission factors are: kgCO2/kWh; kgCO2/kWh; kgCO2/kWh; kgCO2/kWh.
The overall objective function is further modelled as follows:
Objective function: Min (, , ).
where is the time in years, is the initial investment capital, is the operational cost with respect to time , is the maintenance cost with respect to time , is the fuel cost with respect to time , is energy sources, is the discount rate, is the annual growth rate of expenditure, is the electricity generated in year , is WRE in year , and is the total power of the system.
The economic parameters used in the TLCC and LCOE calculations, including capital costs, operation and maintenance (O&M) costs, and component lifetimes, are summarized in Table 3. The selected values are based on literature-reported data and reflect realistic techno-economic conditions for hybrid renewable energy systems in rural electrification contexts. These parameters are consistently applied across all system components in the optimization model.
Table 3.
Economic Parameters Used in TLCC and LCOE Calculations.
Equations (21)–(35) define the operational and design constraints necessary for optimizing the HRES. Optimization ensures minimized LPSP, reduces energy waste, and maintains the state of charge of storage systems (battery and supercapacitor) within safe bounds. The constraints also regulate the sizing of system components, enforce realistic limits on the use of renewable resources, and guarantee the presence of essential system elements like fuel cells and hydrogen storage. Finally, the reliability constraint (shown in Equation (35)) ensures that the system achieves power supply with an LPSP above the minimum thresholds, thereby prioritizing reliability in rural electrification scenarios.
5.2. Equalities Constraints
- (a)
- Power Balance Equality Constraints
The power balance equality is determined by Equation (21).
where and represent the load, SPV, wind generator, biomass generator, battery, supercapacitor and fuel cell power at time t, respectively, with respect to the optimized capacities, and
- (b)
- Wasted Power Equality Constraints
The total wasted renewable energy is determined by Equations (22) and (23).
where is the wasted power at time t and is the total wasted power.
5.3. Inequalities Constraint
- (a)
- Storage System Operational Inequality Constraints
Equations (24)–(27) are used to provide the operating limits of the battery, supercapacitor, hydrogen storage tank and biomass storage, respectively.
where and represent the state of charge of the battery and supercapacitor, respectively. Whereas and represent the hydrogen and biomass storage capacities, respectively.
- (b)
- Renewable Energy Sizing Inequalities Constraint
Equations (28)–(30) present the sizing constraints of the solar, wind turbine and biomass generators, respectively.
where , , and are the capacity for SPV, wind and biomass generation.
- (c)
- Storage Sizing Inequalities Constraint
Equations (31)–(34) present the sizing constraints of the battery, supercapacitor, hydrogen fuel cell and hydrogen storage tank, respectively.
where , , , and represent the capacities of the battery, supercapacitor, fuel cell and hydrogen storage tanks, respectively.
- (d)
- Reliability Inequality Constraint
Equation (35) presents the LPSP operating constraint
The constraint equations in Equations (21)–(35) ensure that the optimized system operates within physically feasible and practical limits. The power balance constraint guarantees that generation meets demand at all times, while the wasted energy constraint accounts for excess renewable energy that cannot be utilized. Storage constraints maintain the SOC of batteries and supercapacitors within safe operating limits to prevent degradation. Resource and sizing constraints restrict component capacities based on realistic design and availability considerations, while hydrogen and biomass constraints regulate fuel usage. Finally, the reliability constraint ensures that the system maintains an acceptable level of supply security. Together, these constraints guide the optimization toward technically viable and sustainable solutions.
6. Simulation Environment
The modelling and optimization framework was implemented in MATLAB R2024b (MathWorks Inc., Natick, MA, USA), using custom-developed scripts. The NSGA-II algorithm was employed for multi-objective optimization, while system performance was evaluated through the hourly simulation of generation, storage, and load interactions. The MATLAB environment was used for data processing, visualization, and performance analysis to ensure the reproducibility and consistency of the results.
7. Simulation Results
This section presents and analyzes the results obtained from the optimization of hybrid renewable energy systems for the selected rural communities: Oluundje, Ombudiya, and Onguati. The results are discussed in terms of system performance, seasonal power variations, and the behaviour of storage components. It also evaluates the Pareto-optimal solutions, comparing the trade-offs among technical and economic objectives. The analysis further explores energy compositions, capacity factors, and dispatch characteristics under different operating scenarios. This comprehensive assessment provides valuable insights into the viability of renewable-based microgrids in Namibia.
7.1. Optimal Solution
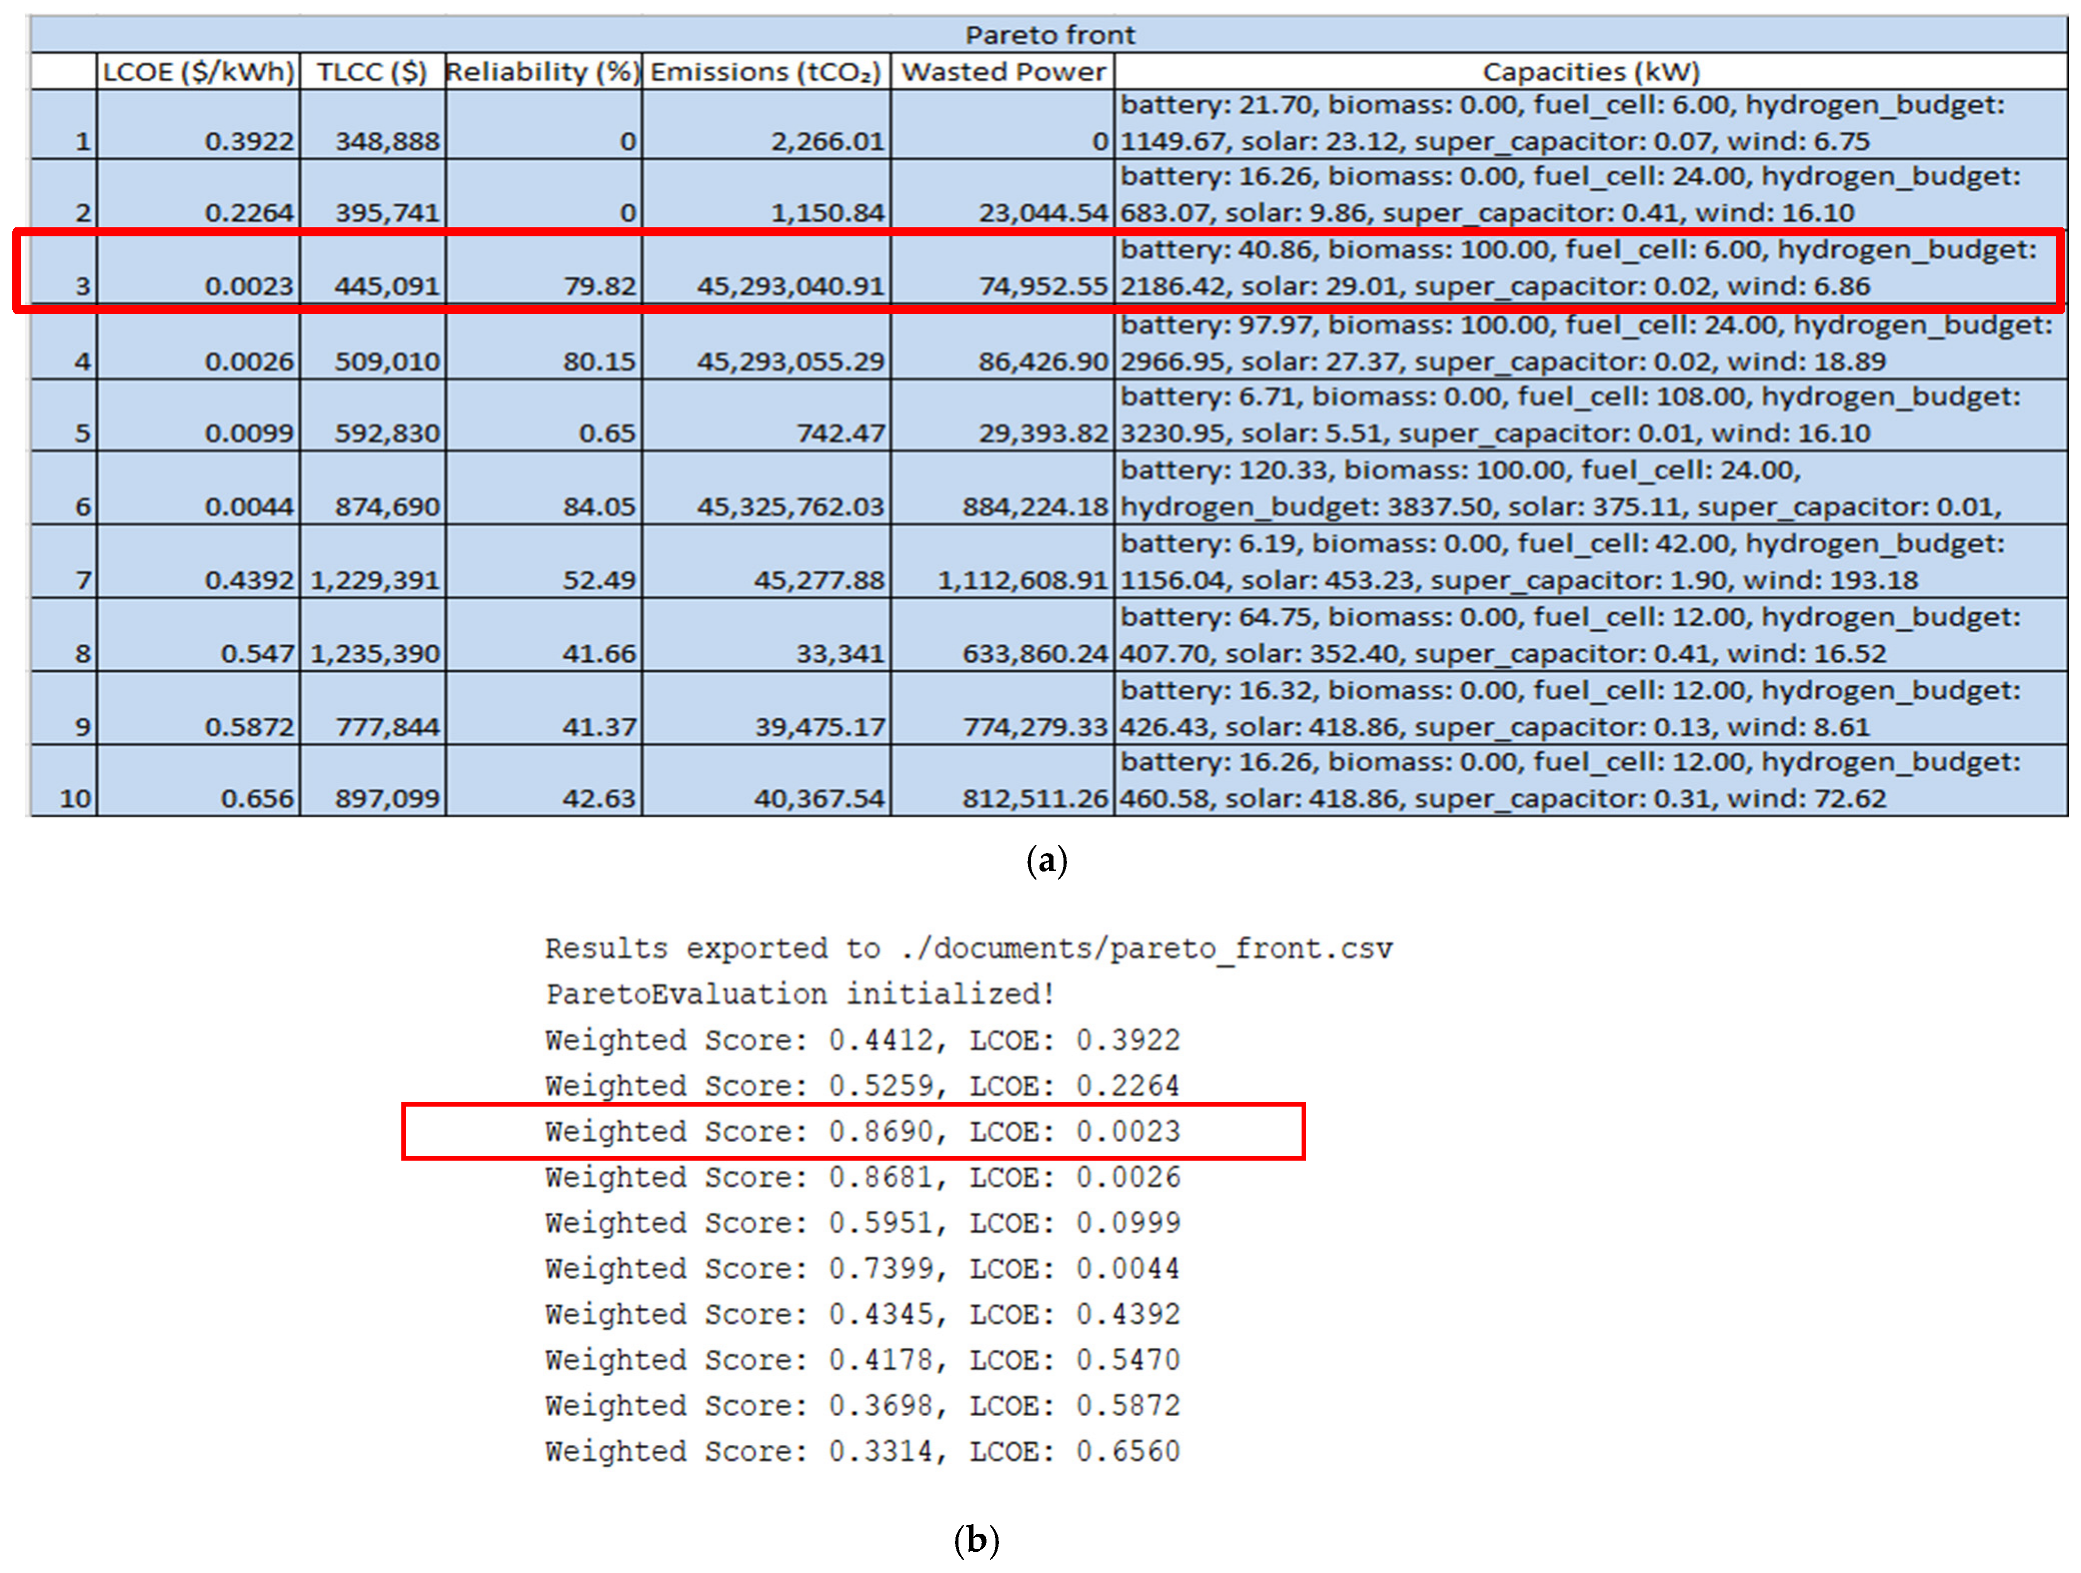
This section presents the optimal sizing configurations of the HRESs for the three selected villages, Oluundje, Ombudiya, and Onguati, obtained using the NSGA-II multi-objective optimization framework. To improve the visualization of the optimization results, selected graphical representations were introduced based on the existing dataset. These plots illustrate the variation in key performance metrics such as LCOE and LPSP across the obtained solutions, providing clear insight into system behaviour and trade-offs. Detailed numerical results are retained in Appendix A. The Pareto-optimal solutions for each area are provided in the subsequent subsections, which are further weighted, and the Pareto solution with the highest score is chosen as the best solution. The best solution is indicated with a yellow star in the graph showing the optimal output of reliability vs. LCOE vs. wasted power, based on weighted Pareto (Figure 4, Figure 5 and Figure 6), and with a red rectangle in the Pareto-optimal solution tables (Appendix A Figure A1a, Figure A2a and Figure A3a) as well as in the weighted Pareto-optimal solutions tables (Appendix A Figure A1b, Figure A2b and Figure A3b).
Figure 4.
Oluundje village’s optimal output: reliability vs. LCOE vs. wasted power based on weighted Pareto.
Figure 5.
Onguati village’s optimal output: reliability vs. LCOE vs. wasted power based on weighted Pareto.
Figure 6.
Ombudiya village’s optimal output: reliability vs. LCOE vs. wasted power based on weighted Pareto.
Figure A1 illustrates the Pareto-optimal solutions for Oluundje village, showcasing multiple trade-offs for the solutions between cost, emissions, reliability, and wasted energy. In Figure A1, the best solution, highlighted with a red rectangle, achieves the highest weighted score of 0.9100, combining 99.28% reliability, TLCC of 849,173.00 USD, and a low LCOE of 0.0042 USD/kWh. This optimal configuration includes significant contributions from solar (26.10 kW) and wind (177.09 kW). Notably, the biomass allocation is substantial (100.00 kW), confirming its dominance in this village’s generation mix, and this is in agreement with the findings of [53] that biomass is one of the lowest-cost energy sources for mini-grids, especially in villages with more than 200 households and electricity demands exceeding three hours per day. The fuel cell (60.00 kW) serves a complementary role, with battery and supercapacitor capacities of 180.93 kWh and 2.56 kWh, respectively, indicating the need for both long-term and fast-response storage.
In Figure A2, the best Pareto-optimal solution for Onguati village reveals a markedly different optimal mix due to its higher wind potential as compared to other renewable energy sources in conjunction with areas of low load demand, with a reliability of 94.20%, LCOE of 0.0811 USD/kWh, TLCC of 784,142.00 USD, and a weighted score of 0.9148. Wind power is the dominant source of power, at 149.68 kW, followed by solar at 8.68 kW, as a secondary contributor. Fuel cells (192.00 kW) are used sparingly as backup. Notably, the batteries, with a capacity of 154.21 kWh and supercapacitor at 3.10 kWh, are relatively smaller compared to those of Oluundje village; this is attributed to consistent wind availability reducing the dependence on energy storage. This confirms that the proposed algorithm is superior in ensuring the adaptability of the HRES to local resource profiles.
Figure A3 displays the Pareto front and selected solution for Ombudiya village. It is observed from Figure A3 that the best optimal result achieves 79.82% reliability, an LCOE of 0.0023 USD/kWh, and a TLCC of 445091.00 USD, earning the highest weighted score of 0.8690. The configuration again places heavy reliance on biomass (100.00 kW), with moderate contributions from solar (29.01 kW) and low wind penetration (6.86 kW). A fuel cell (10.00 kW) supplements the system during rare shortfalls. Notably, the battery (40.86 kWh) and supercapacitor (0.02 kWh) capacities are adjusted to align with moderate renewable resource variability, emphasizing a balance between cost and dispatchability.
7.2. Seasonal Power Variations
Figure 7 illustrates the yearly variation in power and load demand on an hourly basis, while Figure 8, Figure 9 and Figure 10 shows seasonal variations in power and load demand for the three villages.
Figure 7.
Hourly power profiles for (a) Oluundje, (b) Ombudiya, and (c) Onguati.
Figure 8.
Oluundje seasonal power profiles for (a) summer, (b) autumn, (c) winter, and (d) spring.
Figure 9.
Ombudiya seasonal power profiles for (a) summer, (b) autumn, (c) winter, and (d) spring.
Figure 10.
Onguati seasonal power profiles for (a) summer, (b) autumn, (c) winter, and (d) spring.
Across all villages, solar energy emerges as the dominant source, aligning with Namibia’s high solar irradiance levels. In Oluundje and Ombudiya villages, solar resources contribute significantly during the day, between 06H00 and 18H00, but show variability across seasons and within days, requiring support from other energy sources to maintain the supply–demand balance. In Onguati village, solar energy remains significant, but it is frequently outpaced by wind energy due to the favourable wind conditions in the location (up to 20 m/s in winter). In addition, as wind resources are available throughout the day, the reliance on energy storage systems is reduced.
It is illustrated in Figure 7a–c that wind energy exhibits significant variation across the studied villages. Wind power is minimal in Oluundje and Ombudiya villages due to the prioritization of biomass resources, achieving a low LCOE and LPSP. This is primarily because biomass in these areas is locally abundant, stable, and dispatchable, thereby reducing reliance on oversized energy storage systems and minimizing unmet load conditions, which in turn lowers the LPSP. Given the high biomass availability and relatively high load demand in these villages [55], wind energy contributes the least to the overall hybrid power supply. By contrast, Onguati demonstrates substantial wind power activity, especially during transitional seasons, indicating high reliance on wind due to low load demand, and thus biomass is less cost-effective. The dashed blue lines in Onguati village’s plots, as illustrated in Figure 10, show sharp wind generation spikes, reducing the dependence on other generation sources during those periods.
Fuel cells play a pivotal role in hybrid operation, particularly in supplementing energy during shortfalls. They act as the first dispatchable backup once renewable sources (solar and wind), batteries, and supercapacitors are depleted. Their operation is prominent in all three villages, although their activity is more frequent in Oluundje and Ombudiya due to the low renewable energy surplus. Importantly, their contribution precedes biomass utilization to ensure quick-start and low-volume balancing support.
Biomass is primarily used after the fuel cell resource becomes exhausted or insufficient, serving as a long-term and reliable backup power source. In Oluundje and Ombudiya villages, biomass usage is dominant during the peak evening hours and early morning hours, when solar is unavailable and the battery’s SOC is insufficient. This highlights biomass’s role as a firm and dispatchable generation asset in larger communities with high energy demand.
In this scenario, supercapacitors and batteries are utilized for short-term fluctuations and smoothing, responding to high-frequency imbalances. The plots show fast charge–discharge cycles, especially in Oluundje and Ombudiya villages, where these storage systems provide transient response support. Their contribution is minimal in terms of total energy, but essential for system stability and voltage regulation.
The load demand profile is attributed to the Diurnal load shape where, for residential households, peak demand is in the evening when people are home, and the lighting and heating cycles, cooking cycles and economic and activity cycles such as school hours, market days, and work patterns shift daily.
In summary, the analysis confirms a strategic dispatch hierarchy where renewable energy (solar and wind) is used first, followed by batteries and supercapacitors for stabilization. When deficits arise, fuel cells are engaged as the first backup due to their fast-response capability, followed by biomass generators for sustained power delivery. This staged dispatch strategy optimizes both cost and reliability, aligning with the overarching system design objectives for sustainable rural electrification in Namibia.
7.3. Energy Storage Flowcharts
Figure 11, Figure 12 and Figure 13 present the annual behaviour of dispatchable resource capacities and energy storage in the optimized hybrid energy systems for Oluundje, Ombudiya, and Onguati villages. This includes the remaining fuel budgets (in kWh) for fuel cells and biomass generators, as well as the State of Charge (SOC) trends for batteries and supercapacitors throughout the year.
Figure 11.
Oluundje village’s (a) available dispatchable capacity and (b) battery and supercapacitor SOC (%).
Figure 12.
Ombudiya village’s (a) available dispatchable capacity, (b) battery and supercapacitor SOC (%).
Figure 13.
Onguati village’s (a) available dispatchable capacity and (b) battery and supercapacitor SOC (%).
As shown in Figure 11 and Figure 12, there is a steady depletion of the available hydrogen storage allocated to the fuel cell before biomass activation in Oluundje and Ombudiya villages, respectively, consistent with the dispatch strategy, where fuel cells act as the primary dispatchable source when RESs are insufficient. Biomass is engaged after the energy in fuel cells is depleted to supply the remaining unmet load. This layered approach reflects both economic and operational priorities, prioritizing hydrogen utilization before biomass due to emissions and operational cost considerations. The SOC levels of the battery and supercapacitors in these villages remain relatively stable, generally above 20% and below 80% and 90% for the battery and supercapacitor, respectively, and there is minimal usage. These SOC limits are selected to prevent deep discharge and overcharging, which are known to accelerate degradation and reduce the operational lifespan of storage systems, and are widely adopted in energy storage modelling practices. These storage devices are mainly used for short-term balancing and transient support rather than continuous cycling. By prioritizing dispatchable generation (fuel cell and biomass) over prolonged storage discharge, the algorithm mitigates excessive cycling stress, reduces degradation rates, and extends storage lifespan. Consequently, storage devices function mainly as dynamic stabilizers for power smoothing and rapid response support, rather than as continuous energy sources.
In Onguati village, biomass resource remains virtually untapped throughout the year, as evidenced by the flat energy budget curve in Figure 13a. This occurs because wind power, which serves as the village’s primary energy source, is sufficient to meet most of the load demand, while the fuel cell provides reliable backup during renewable shortfalls. Given the relatively low load demand and substantial wind availability, the optimization algorithm identifies biomass generation as uneconomical, since activating it would increase operational costs and emissions without significantly improving reliability. These results confirm that wind power can meet most of the load when supplemented by the fuel cell, battery, and supercapacitors. However, the repeated SOC cycling observed in Onguati village’s storage systems (battery and supercapacitor) highlights their critical role in mitigating wind intermittency and managing short-term power fluctuations.
The variation in storage usage patterns across villages underscores the importance of site-specific hybrid energy system planning. While Oluundje and Ombudiya villages significantly depend on dispatchable resources to meet the load, Onguati village’s system capitalizes on wind abundance, relying more on the battery and supercapacitor and fuel cell than on biomass-based generation.
7.4. Capacity Factors of Energy Sources
Figure 14 illustrates the annual capacity factors (CF) of solar, wind, biomass, and fuel cell systems for the three villages. The results indicate that solar PV consistently exhibits the highest CF across all three locations, ranging from approximately 23% to 27%. This reflects not only the abundant solar resource potential in Namibia’s semi-arid climate but also the low seasonal variability, high solar irradiance levels, and favourable temperature conditions that enhance PV conversion efficiency. In addition, the optimization algorithm prioritizes solar generation due to its zero-fuel cost, low operational expenditure, and high reliability, leading to consistently high utilization throughout the year and showing this to be a cornerstone of HRESs.
Figure 14.
Capacity factors for the different energy sources for the three villages.
In contrast, wind energy displays relatively lower CF values, typically below 14%, suggesting limited or inconsistent wind availability in the regions studied. This positions wind as a supplementary energy source, particularly useful for covering night-time or seasonal gaps in solar power generation.
Biomass-based systems achieve a notably high CF in Oluundje and Ombudiya villages, ranging from 25% to 30%, signifying effective utilization of available feedstock and the efficient integration of biomass generation into the dispatch strategy. Conversely, Onguati village exhibits zero CF for biomass systems. This is attributed to lower demand levels, and resource constraints, considering that the village’s configuration is optimized around wind energy.
The fuel cell CF remains the lowest across all villages, ranging between 3% and 6%. This is due to minimal periods of concurrent renewable energy shortfalls where fuel cells were to be used as a back-up source of power, as well as the fuel limitations. The observed differences in CF values across different technologies and locations underscore the necessity for site-specific resource assessment and hybrid system optimization to ensure both technical reliability and economic feasibility.
7.5. Composition of the Energy Sources
Figure 15 illustrates the optimal combination of the energy mix for the three villages under consideration. It is shown that wind energy is the dominant source in Onguati village, driven by a favourable and consistently available wind resource (up to 20 Fm/s m/s in winter). By contrast, biomass accounts for the majority of the energy supply in Ombudiya and Oluundje villages, reflecting the availability of a sustainable biomass feedstock and the higher energy demand in these two villages, which have larger communities.
Figure 15.
Energy sources compositions for (a) Oluundje, (b) Ombudiya, and (c) Onguati.
The prominence of biomass in Ombudiya and Oluundje villages aligns with the findings in [55]. It is observed from Figure 15 that solar PV contributes a comparatively equal amount of power in all three villages, but its share remains moderate due to its intermittency, limited generation during nighttime, and optimized sizing constraints aimed at minimizing costs. Fuel cells, powered by stored hydrogen, contribute the least in all cases and are only dispatched under circumstances when renewable generation sources are insufficient.
These findings emphasize the importance of a site-specific system configuration that accounts for local renewable resource availability, population-based demand patterns, and cost-effectiveness in resource utilization. Tailoring the HRES design in this manner enhances system reliability, ensures cost-efficiency, and promotes sustainable rural electrification. The results from the optimization further confirm that the multi-objective NSGA-II is effective in designing HRESs for enhanced rural electrification. Each village’s most optimal solution varied depending on their load profiles and resource availability. Key takeaways include the importance of dispatchable sources like biomass and fuel cells for reliability, the role of supercapacitors in transient stability, and the use of hydrogen storage for long-duration support. The framework developed here can be scaled and adapted for other rural locations in Namibia and beyond.
Furthermore, the graphical and analytical results obtained for three villages collectively illustrate the development of an adaptable hybrid renewable energy framework capable of replication across diverse rural contexts in Namibia. The resource assessment graphs (Figure 1 and Figure 2) and Table 2 revealed significant spatial and temporal variations in wind speed, solar irradiance across the three sites, and biomass availability, forming the foundation for location-specific parameterization within the model.
The optimization results, including the Pareto fronts and reliability–LCOE–wasted power trade-off plots (Figure 4, Figure 5 and Figure 6), demonstrated that the model dynamically adjusted the optimal configuration of solar PV, wind turbines, biomass generators, and hydrogen-based fuel cell systems according to each village’s resource potential and demand profile. For instance, the Pareto front for Onguati village favoured a solar–wind–fuel cell hybrid system due to the high solar insolation and wind resources and moderate biomass potential and low load demand. Conversely, Oluundje and Ombudiya villages’ optimal solution incorporated a larger biomass capacity owing to their increased biomass resources, and an increased load demand due to the larger community size, making the solution more cost-effective. The available dispatch capacity and state-of-charge (SOC) plots (Figure 11, Figure 12 and Figure 13) validated the control strategy’s effectiveness in maintaining system stability and ensuring a balanced power-sharing among the battery, supercapacitor, and hydrogen storage subsystems, as well as biomass resources’ availability.
Furthermore, the reliability and sensitivity analyses confirmed that the framework consistently achieved a system reliability above 75% while maintaining competitive LCOE values between $0.0023 and $0.0811/kWh, outperforming existing diesel mini-grids such as those in the Tsumkwe and Gam locations. These results collectively verify that the framework can automatically adapt to varying technical, economic, and resource constraints. By updating the input datasets, such as local renewable resource profiles, and load patterns, the same optimization simulation framework can be applied to any other rural area in Namibia to design a site-specific, reliable, and economically viable hybrid energy system, thus promoting replicable, scalable and sustainable rural electrification.
The findings in this section demonstrate that integrating multiple renewable sources with appropriate storage systems can effectively enhance the reliability and affordability of rural electrification. Seasonal analyses confirmed that hybrid configurations outperform single-resource systems in terms of stability and energy availability. The Pareto-optimal results underscore the balance between cost and reliability, supporting sustainable energy planning decisions. These results validate the robustness of the proposed optimization framework. The concluding section summarizes the research contributions and provides recommendations for future work.
8. Conclusions
The study developed and validated an NSGA-II multi-objective optimization model for Hybrid Renewable Energy Systems (HRESs) tailored to rural electrification in Namibia. The key innovative outcomes and contributions are summarized as follows:
- A novel integrated HRES framework combining solar PV, wind, biomass, batteries, supercapacitors, and hydrogen-based fuel cells was successfully formulated and optimized for rural applications.
- The NSGA-II-based multi-objective optimization approach effectively minimized TLCC, LCOE, and WRE while maximizing reliability and renewable energy utilization under real-world conditions, including available renewable energy resources and forecasted load demand.
- The model demonstrated strong techno-economic and operational performance, while providing a flexible multi-objective optimization framework capable of capturing trade-offs between cost, reliability, emissions, and energy utilization.
- Hybrid energy storage integration (battery–supercapacitor–hydrogen) significantly enhanced system flexibility, reduced component stress, and improved long-term operational stability.
- Supercapacitors enabled high-frequency load balancing, while batteries and hydrogen storage provided long-duration energy autonomy, addressing renewable intermittency more effectively than single-storage systems.
- Solar PV was identified as the primary energy contributor, due to the high availability of solar resources and their low operation and maintenance costs, with wind and biomass acting as complementary sources to improve system reliability and dispatchability.
- The best optimal HRES configurations achieved high system reliability (>75%) while maintaining highly competitive LCOE values between $0.0023 and $0.0811/kWh, significantly outperforming both existing diesel mini-grids, such as Tsumkwe (≈$0.55/kWh) and Gam (≈$0.91/kWh) [56], and Namibia’s average grid electricity cost of approximately $0.134/kWh [57]. This demonstrates the superior techno-economic viability of renewable-based hybrid systems for rural electrification. Such cost advantages, coupled with improved reliability and environmental sustainability, position HRES as a long-term substitute for fossil-fuel-based and grid-dependent systems, requiring only minimal institutional support to accelerate large-scale deployment across off-grid regions.
- Optimal sizing and intelligent dispatch strategies minimized excess energy and ensured efficient utilization of available renewable resources.
- A clear cost–reliability trade-off was established, where higher reliability required increased storage capacity, particularly for hydrogen-based systems.
- The model was validated across three different rural sites, demonstrating its scalability, adaptability, and suitability for broader national electrification planning.
- The framework also incorporated Namibia-specific socio-economic conditions, such as affordability thresholds (electricity cost ≤ 5% of household income), ensuring cost-effective energy supply through the minimization of LCOE, which serves as a proxy for affordability in low-income rural contexts, where energy demand is strongly constrained by household income levels.
Author Contributions
Conceptualization, N.V.N. and T.W.; methodology, N.V.N. and E.H.; software, N.V.N. and M.M.K.; validation, T.W. and E.H.; formal analysis, M.M.K.; investigation, N.V.N.; resources, M.M.K.; data curation, T.W. and E.H.; writing—original draft preparation, N.V.N.; writing—review and editing, N.V.N. and M.M.K.; visualization, and E.H.; supervision, T.W.; project administration, T.W.; funding acquisition, T.W. and M.M.K. All authors have read and agreed to the published version of the manuscript.
Funding
This research received no external funding.
Data Availability Statement
The data presented in this study are available from the corresponding author upon reasonable request. The study used MATLAB-generated simulation and optimization data based on input parameters described within the article.
Conflicts of Interest
The authors declare no conflict of interest.
Nomenclature
| Symbol | Description | Unit |
| Power | kW | |
| Solar PV power output | kW | |
| Wind turbine power output | kW | |
| Biomass generator power output | kW | |
| Fuel cell power output | kW | |
| Load demand | kW | |
| Wasted renewable power | kW | |
| Energy | kWh | |
| Energy generated by source | kWh | |
| Energy from PV at time | kWh | |
| Energy from wind at time | kWh | |
| Energy from biomass at time | kWh | |
| Energy from fuel cell at time | kWh | |
| State of charge (%) | – | |
| Battery state of charge (%) | – | |
| Supercapacitor state of charge (%) | – | |
| Initial investment cost | USD | |
| Operational cost at time | USD | |
| Maintenance cost at time | USD | |
| Fuel cost at time | USD | |
| Decommissioning cost | USD | |
| Discount rate | – | |
| Annual cost escalation rate | – | |
| Project lifetime | years | |
| Time index | hour/year | |
| Number of energy sources | – | |
| Loss of power supply probability | – | |
| Wasted renewable energy | kWh | |
| Total carbon dioxide emissions | kg | |
| Emission factor of source | kgCO2/kWh | |
| PV emission factor | kgCO2/kWh | |
| Wind emission factor | kgCO2/kWh | |
| Biomass emission factor | kgCO2/kWh | |
| Fuel cell emission factor | kgCO2/kWh | |
| Decision vector | – | |
| Installed PV capacity | kW | |
| Installed wind capacity | kW | |
| Installed biomass capacity | kW | |
| Fuel cell capacity | kW | |
| Battery energy capacity | kWh | |
| Supercapacitor energy capacity | kWh | |
| Maximum hydrogen storage | kg or kWh | |
| Inverter capacity | kW | |
| Wind turbine power coefficient | – | |
| PV conversion efficiency | – | |
| Biomass conversion efficiency | – | |
| Fuel cell efficiency | – |
Appendix A
Figure A1.
Oluundje village’s (a) Pareto-optimal solutions, where the red box indicates the selected optimal solution, and (b) optimal solutions based on weighted Pareto.
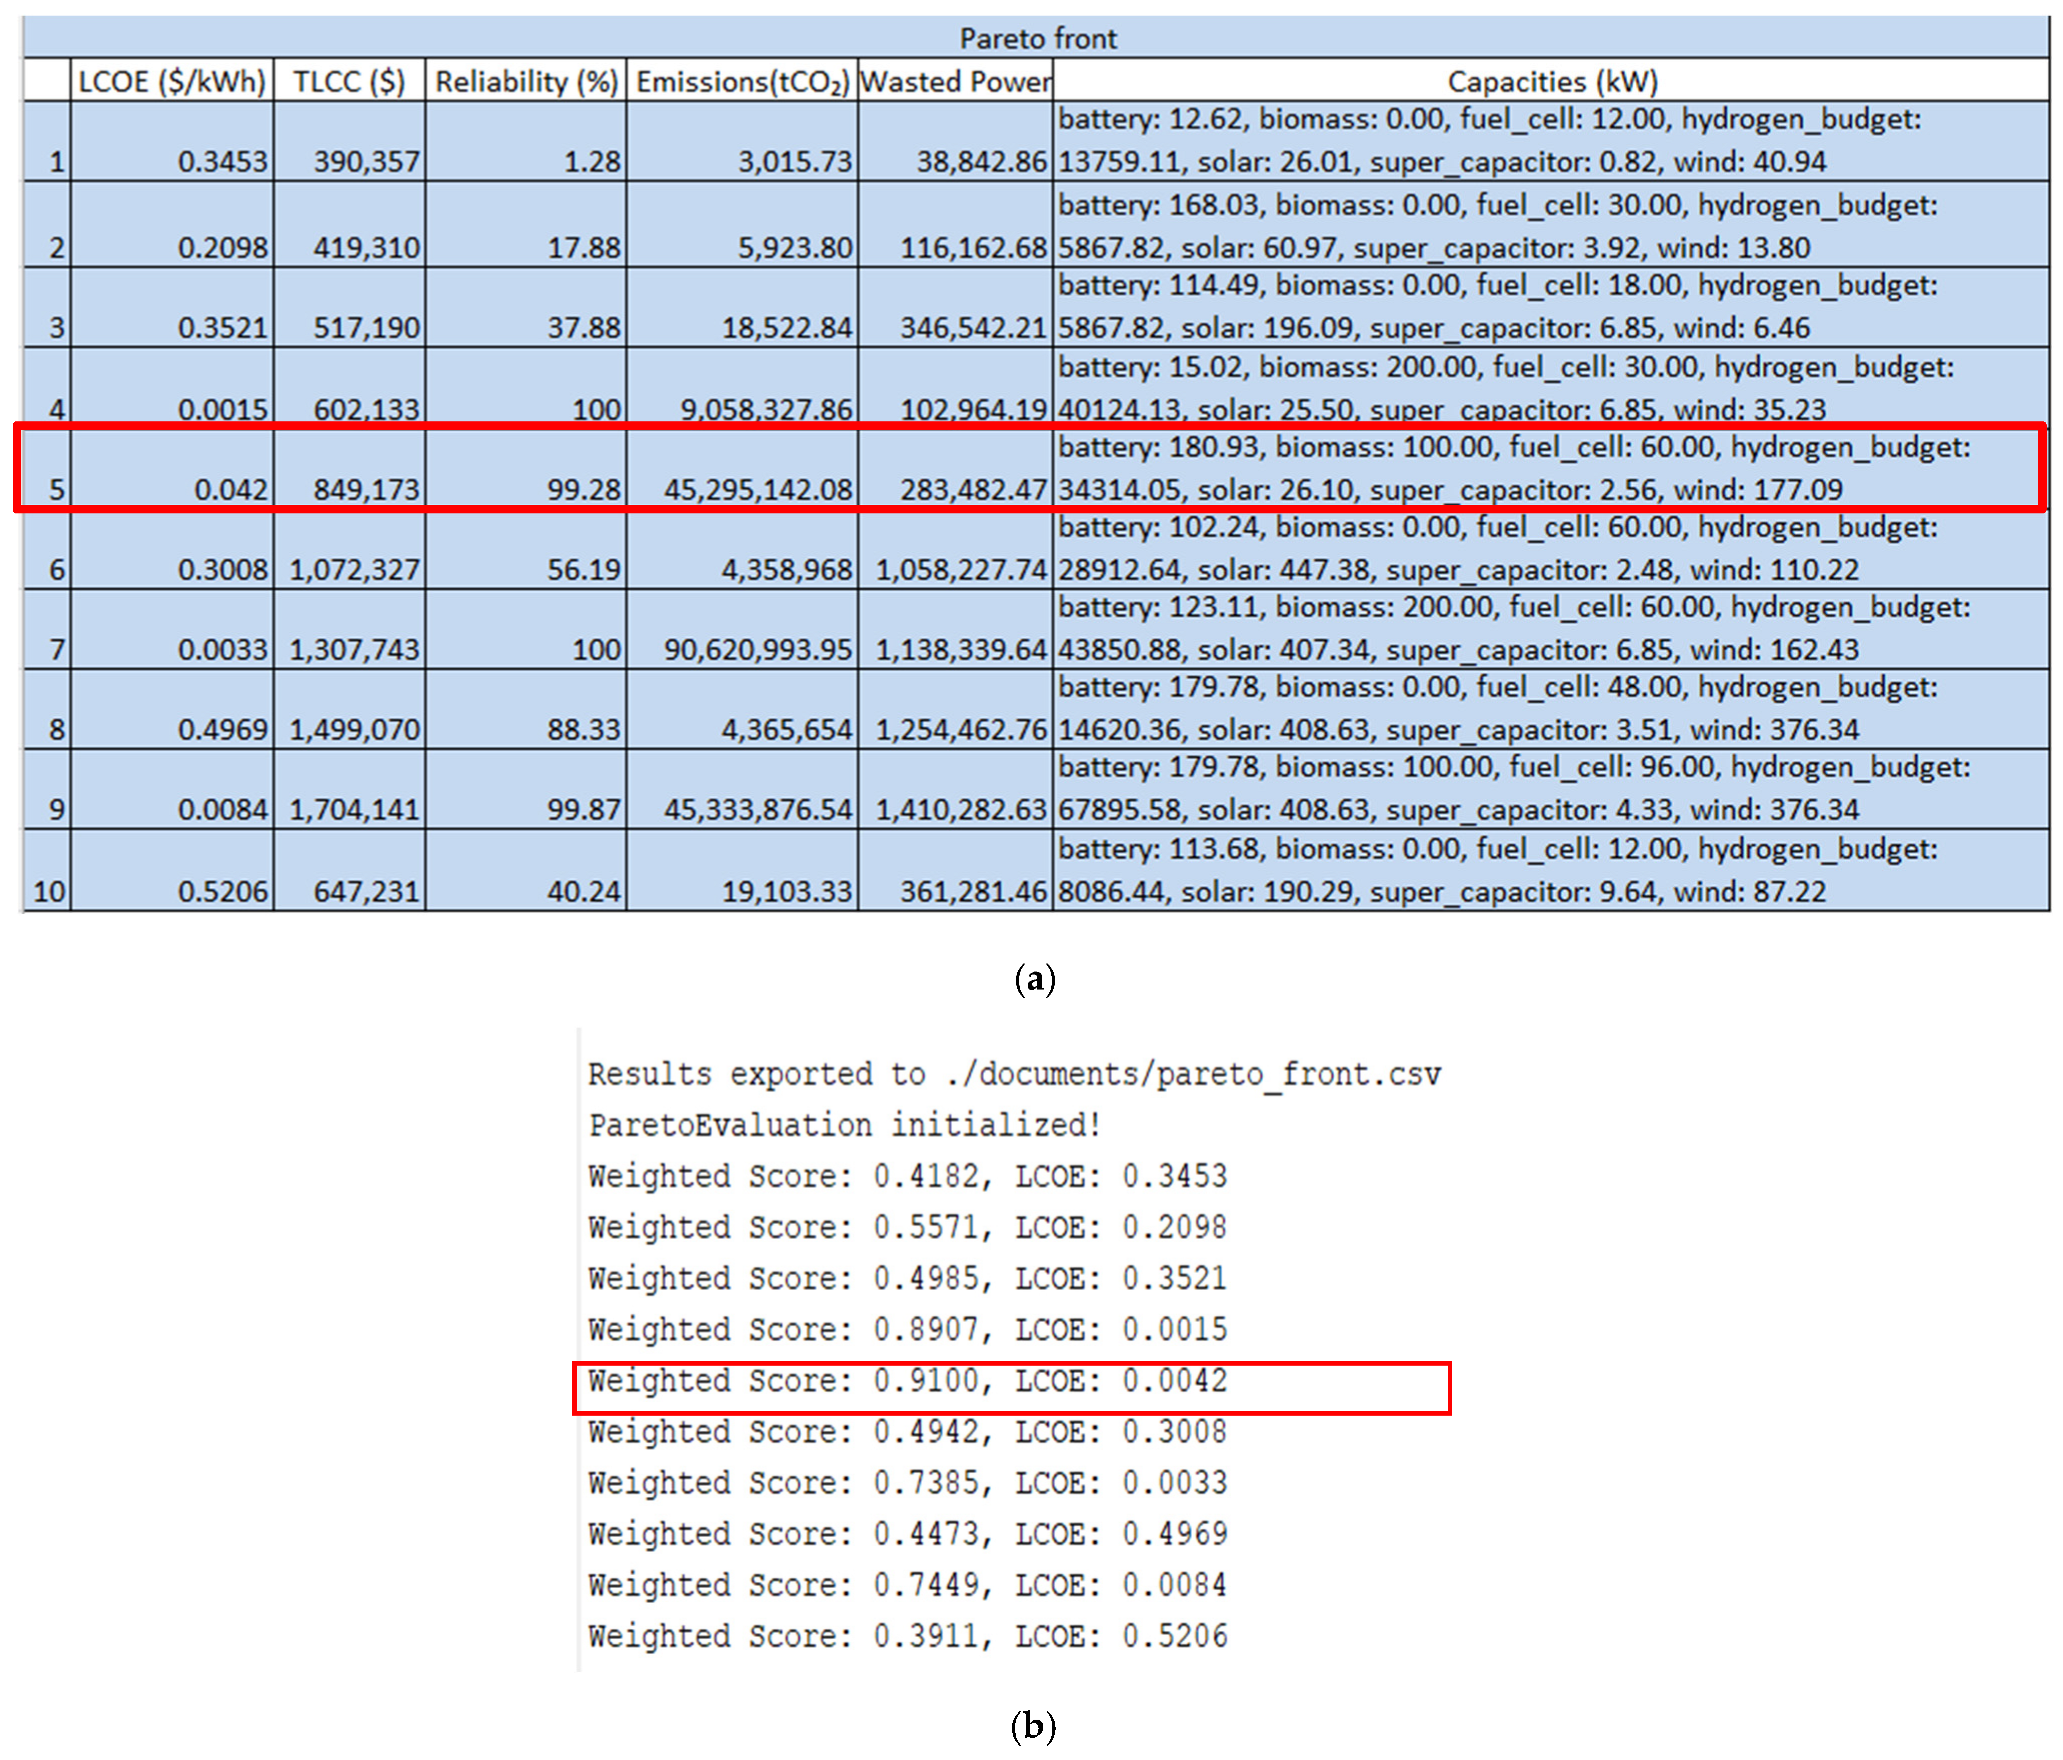
Figure A2.
Onguati village’s (a) Pareto-optimal solutions, where the red box indicates the selected optimal solution, and (b) optimal solutions based on weighted Pareto.
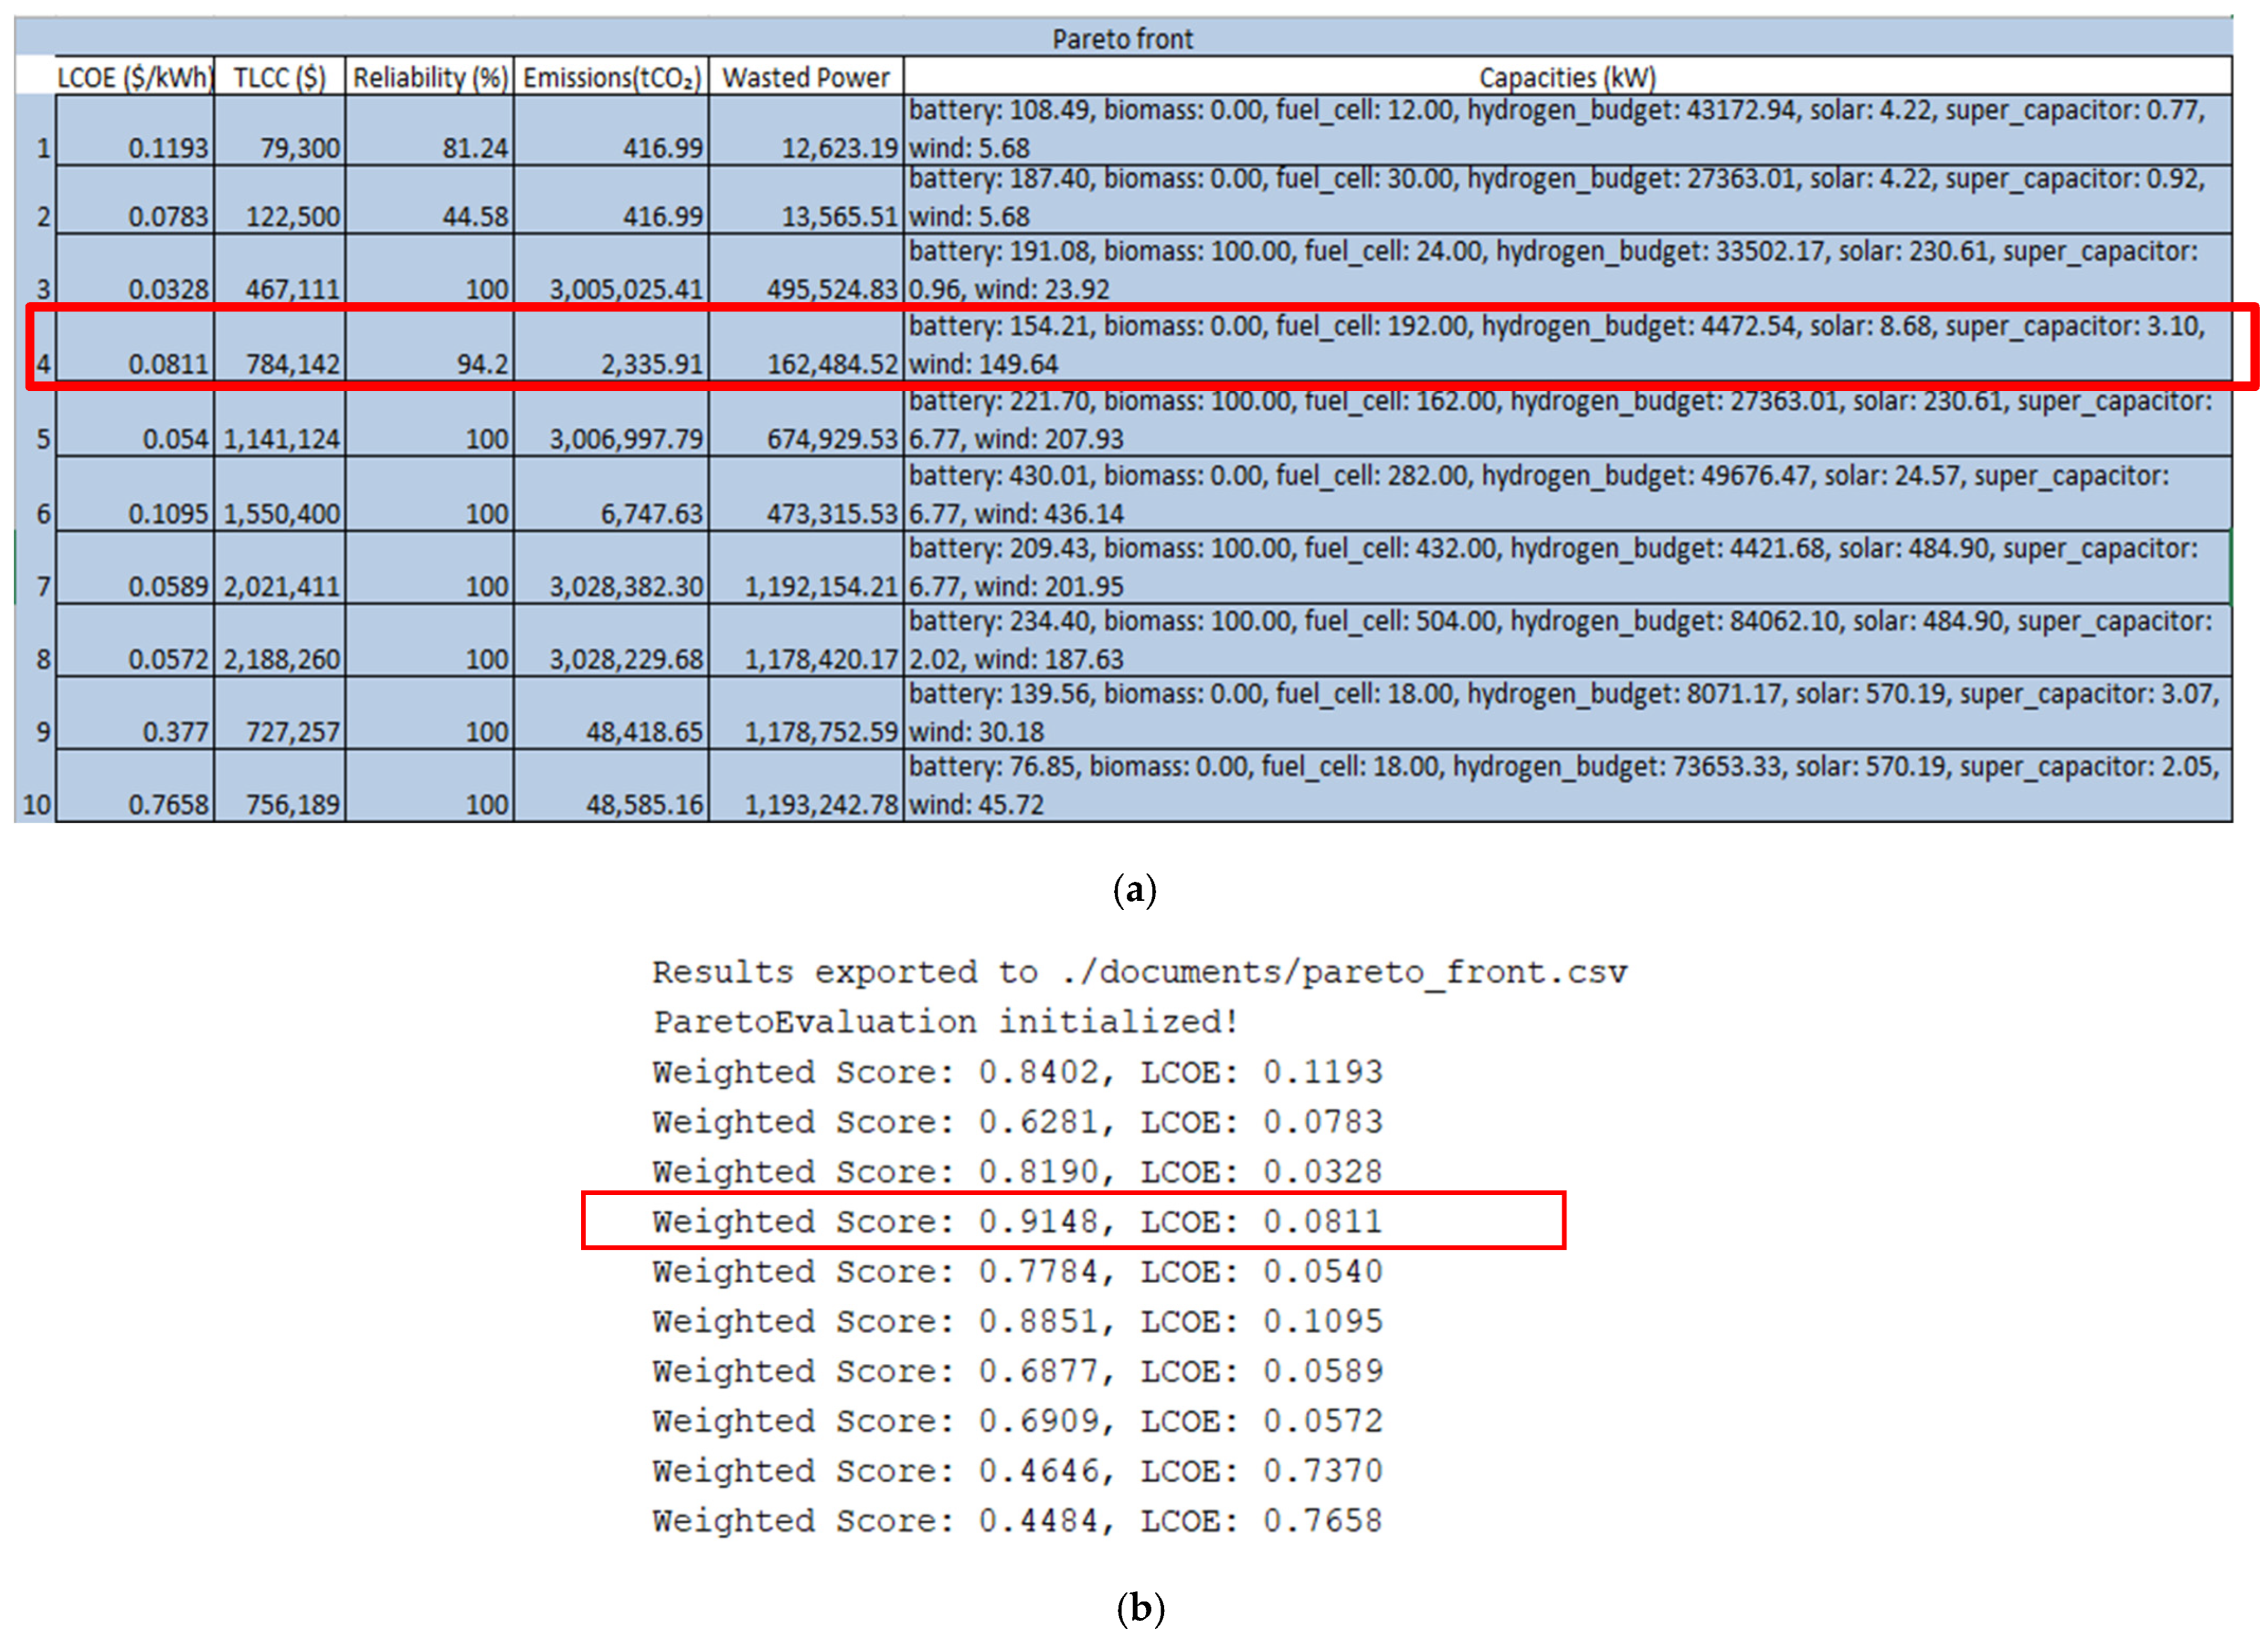
Figure A3.
Ombudiya village’s (a) Pareto-optimal solutions, where the red box indicates the selected optimal solution and (b) optimal solutions based on weighted Pareto.
References
- Hachim, B.; Dahlioui, D.; Barhdadi, A. Electrification of rural and arid areas by solar energy applications case study: Boumhaout village in south of Morocco. In Proceedings of the 2018 6th International Renewable and Sustainable Energy Conference (IRSEC); IEEE: New York, NY, USA, 2018. [Google Scholar] [CrossRef] [Scilit]
- Saini, V.; Singal, S.K.; Saini, R.P. Renewable energy-based system for electrification of remote villages. In Proceedings of the 2022 International Conference on Green Energy, Computing and Sustainable Technology (GECOST); IEEE: New York, NY, USA, 2022; pp. 6–10. [Google Scholar] [CrossRef] [Scilit]
- Access to Electricity (% of Population)|Data. Available online: https://data.worldbank.org/indicator/eg.elc.accs.zs (accessed on 14 August 2025).
- NamPower (Pty) Ltd. NamPower Integrated Annual Report 2024; NamPower (Pty) Ltd.: Windhoek, Namibia, 2024; Available online: https://www.nampower.com.na/Media/Document/559400c8-51a9-427d-8cbc-62021aac8d82.pdf (accessed on 25 April 2025).
- Patel, A.M.; Singal, S.K. Implementation Methodology of Integrated Renewable Energy System Modeling for Off-grid Rural Electrification: A review. In Proceedings of the Conference on Industrial and Commercial Use of Energy (ICUE); IEEE: New York, NY, USA, 2018. [Google Scholar] [CrossRef] [Scilit]
- Zahraoui, Y.; Alhamrouni, I.; Mekhilef, S.; Khan, M.R.B.; Seyedmahmoudian, M.; Stojcevski, A.; Horan, B. Energy Management System in Microgrids: A Comprehensive Review. Sustainability 2021, 13, 10492. [Google Scholar] [CrossRef] [Scilit]
- AL Shaqsi, A.Z.; Sopian, K.; Al-Hinai, A. Review of energy storage services, applications, limitations, and benefits. Energy Rep. 2020, 6, 288–306. [Google Scholar] [CrossRef] [Scilit]
- Alzahrani, A.; Ramu, S.K.; Devarajan, G.; Vairavasundaram, I.; Vairavasundaram, S. A Review on Hydrogen-Based Hybrid Microgrid System: Topologies for Hydrogen Energy Storage, Integration, and Energy Management with Solar and Wind Energy. Energies 2022, 15, 7979. [Google Scholar] [CrossRef] [Scilit]
- Liu, X.; Zhao, T.; Deng, H.; Wang, P.; Liu, J.; Blaabjerg, F. Microgrid Energy Management with Energy Storage Systems: A Review. CSEE J. Power Energy Syst. 2023, 9, 483–504. [Google Scholar] [CrossRef] [Scilit]
- Keller, S.; Naciri, S.; Nejmi, A.; Dos Ghali, J. Simulation-based decision support tool for electrification of isolated areas using a network with multiple renewable sources. In Proceedings of the 2007 International Conference on Clean Electrical Power (ICCEP); IEEE: New York, NY, USA, 2007; pp. 1–8. [Google Scholar] [CrossRef] [Scilit]
- Gusain, C.; Mohan Tripathi, M.; Nangia, U. Study of Meta-heuristic Optimization Methodologies for Design of Hybrid Renewable Energy Systems. Therm. Sci. Eng. Prog. 2023, 39, 101711. [Google Scholar] [CrossRef] [Scilit]
- Akbas, B.; Kocaman, A.S.; Nock, D.; Trotter, P.A. Rural electrification: An overview of optimization methods. Renew. Sustain. Energy Rev. 2022, 156, 111935. [Google Scholar] [CrossRef] [Scilit]
- Bastos, A.F.; Trevizan, R.D. Feasibility of 100% Renewable-Energy-Powered Microgrids Serving Remote Communities. In Proceedings of the 2023 IEEE Power & Energy Society Innovative Smart Grid Technologies Conference (ISGT); IEEE: New York, NY, USA, 2023. [Google Scholar] [CrossRef] [Scilit]
- Javed, M.S.; Song, A.; Ma, T. Techno-economic assessment of a stand-alone hybrid solar-wind-battery system for a remote island using genetic algorithm. Energy 2019, 176, 704–717. [Google Scholar] [CrossRef] [Scilit]
- Canziani, F.; Vargas, R.; Gastelo-Roque, J.A. Hybrid Photovoltaic-Wind Microgrid With Battery Storage for Rural Electrification: A Case Study in Perú. Front. Energy Res. 2021, 8, 528571. [Google Scholar] [CrossRef] [Scilit]
- Melkia, C.; Ghoudlburk, S.; Soufi, Y.; Maamri, M.; Bayoud, M. Battery-Supercapacitor Hybrid Energy Storage Systems for Stand-Alone Photovoltaic. Eur. J. Electr. Eng. 2022, 24, 265–271. [Google Scholar] [CrossRef] [Scilit]
- Ferahtia, S.; Djerioui, A.; Zeghlache, S.; Houari, A. A hybrid power system based on fuel cell, photovoltaic source and supercapacitor. SN Appl. Sci. 2020, 2, 940. [Google Scholar] [CrossRef] [Scilit]
- Prinsloo, G.; Dobson, R.; Mammoli, A. Smart Village Load Planning Simulations in Support of Digital Energy Management for Off-grid Rural Community Microgrids. Curr. Altern. Energy 2017, 2, 2–18. [Google Scholar] [CrossRef] [Scilit]
- Kühnel, S.; Ahmed, T.; Mehta, K.; Ehrenwirth, M.; Besner, R.; Knepper, K.; Ileka, H.; Trinkl, C.; Zörner, W. Holistic approach to develop electricity load profiles for rural off-grid communities in sub-Saharan Africa. In Proceedings of the ISES Solar World Congress 2021; International Solar Energy Society: Freiburg, Germany, 2021; pp. 348–361. [Google Scholar] [CrossRef] [Scilit]
- Namaganda-Kiyimba, J.; Mutale, J.; Azzopardi, B. Improving the Load Estimation Process in the Design of Rural Electrification Systems. Energies 2021, 14, 5505. [Google Scholar] [CrossRef] [Scilit]
- Takalani, R.; Bekker, B. Load and load growth models for rural microgrids, and how to future-proof designs. In Proceedings of the 2020 International SAUPEC/RobMech/PRASA Conference; IEEE: New York, NY, USA, 2020. [Google Scholar] [CrossRef] [Scilit]
- Patel, A.M.; Singal, S.K. Renewable Energy Source based Hybrid Power Generation Scheme for Off-grid Rural Electrification. In Proceedings of the 2017 14th IEEE India Council International Conference (INDICON); IEEE: New York, NY, USA, 2018. [Google Scholar] [CrossRef] [Scilit]
- Hamatwi, E.; Nyirenda, C.; Davidson, I. Optimisation of a Hybrid PV-Diesel System for Rural Application: The Case of Oluundje Village, Namibia. J. Energy Res. 2017, 9, 9–25. [Google Scholar]
- Wanjekeche, T.; Ananias, T. Optimal and Economic Evaluation of a Stand-alone Microgrid for Electricity and Water Supply for Namibia’s Rural Village. Am. J. Energy Eng. 2019, 7, 64–73. [Google Scholar] [CrossRef] [Scilit]
- Mohammad-Alikhani, A.; Mahmoudi, A.; Kahourzade, S. Multi-objective optimization of system configuration and component capacity in AC mini-grid hybrid power system. In Proceedings of the 9th IEEE International Conference on Power Electronics, Drives and Energy Systems (PEDES); IEEE: New York, NY, USA, 2020. [Google Scholar] [CrossRef] [Scilit]
- Come Zebra, E.I.; van der Windt, H.J.; Nhumaio, G.; Faaij, A.P.C. A review of hybrid renewable energy systems in mini-grids for off-grid electrification in developing countries. Renew. Sustain. Energy Rev. 2021, 144, 111036. [Google Scholar] [CrossRef] [Scilit]
- Amir, N.; Purnamasari, D.N.; Mufarroha, F.A. Application of Renewable Energy Sources for Rural Electrification at a Remote Outer Island. In Proceedings of the 2021 IEEE 7th Information Technology International Seminar (ITIS); IEEE: New York, NY, USA, 2021. [Google Scholar] [CrossRef] [Scilit]
- Dad, R.F.; Saleem, S. A Comparative Study of Various Optimization Techniques to Size a Hybrid Renewable Energy System. In Proceedings of the 2022 24th International Multitopic Conference (INMIC); IEEE: New York, NY, USA, 2022. [Google Scholar] [CrossRef] [Scilit]
- Song, K.; Wang, X.; Li, F.; Sorrentino, M.; Zheng, B. Pontryagin’s minimum principle-based real-time energy management strategy for fuel cell hybrid electric vehicle considering both fuel economy and power source durability. Energy 2020, 205, 118064. [Google Scholar] [CrossRef] [Scilit]
- Slama, A.H.; Saidi, M.; Saidi, L. Optimal Sizing for Renewable Hybrid Energy Systems: A Review With Some Applications. In Proceedings of the 2022 IEEE International Conference on Electrical Sciences and Technologies in Maghreb (CISTEM); IEEE: New York, NY, USA, 2022. [Google Scholar] [CrossRef] [Scilit]
- Nabipour-Afrouzi, H.; Wen Yii, S.H.; Ahmad, J.; Tabassum, M. Comprehensive review on appropriate sizing and optimization technique of hybrid PV-wind system. In Proceedings of the Asia-Pacific Power and Energy Engineering Conference (APPEEC); IEEE: New York, NY, USA, 2018; pp. 364–369. [Google Scholar] [CrossRef] [Scilit]
- Thirunavukkarasu, M.; Sawle, Y.; Lala, H. A comprehensive review on optimization of hybrid renewable energy systems using various optimization techniques. Renew. Sustain. Energy Rev. 2023, 176, 113192. [Google Scholar] [CrossRef] [Scilit]
- Maheri, A. MOHRES, a Software Tool for Analysis and Multiobjective Optimisation of Hybrid Renewable Energy Systems-An Overview of Capabilities. In Proceedings of the 2021 6th International Symposium on Environment, Energies and Applications (EFEA); IEEE: New York, NY, USA, 2021. [Google Scholar] [CrossRef] [Scilit]
- Husain, S.; Shrivastava, N.A. A Comparative Analysis of Multi-objective Optimization Algorithms for Stand-Alone Hybrid Renewable Energy System. In Proceedings of the 2nd International Conference on Innovative Mechanisms for Industry Applications (ICIMIA); IEEE: New York, NY, USA, 2020; pp. 255–260. [Google Scholar] [CrossRef] [Scilit]
- Hlal, M.I.; Ramachandaramurthya, V.K.; Padmanaban, S.; Kaboli, H.R.; Pouryekta, A.; Abdullah, T.A.R.b.T. NSGA-II and MOPSO based optimization for sizing of hybrid PV/wind/battery energy storage system. Int. J. Power Electron. Drive Syst. 2019, 10, 463–478. [Google Scholar] [CrossRef] [Scilit]
- Zhu, X.; Gui, P.; Zhang, X.; Han, Z.; Li, Y. Multi-objective optimization of a hybrid energy system integrated with solar-wind-PEMFC and energy storage. J. Energy Storage 2023, 72, 108562. [Google Scholar] [CrossRef] [Scilit]
- Economic and Social Justice Trust. Utilisation of Bush Biomass: What Are the Best Options for Namibia? Background Paper; Economic and Social Justice Trust: Windhoek, Namibia, 2020. [Google Scholar]
- Feleke, S.; Anteneh, D.; Pydi, B.; Satish, R.; El-Shahat, A.; Abdelaziz, A.Y. Feasibility and Potential Assessment of Solar Resources: A Case Study in North Shewa Zone, Amhara, Ethiopia. Energies 2023, 16, 2681. [Google Scholar] [CrossRef] [Scilit]
- Rateele, T.N.; Thamae, L.Z. An optimization approach for the economic dispatch incorporating renewable energy resources into Lesotho power sources portfolio. Heliyon 2023, 9, e14748. [Google Scholar] [CrossRef] [Scilit] [PubMed]
- Jain, A.; Das, P.; Yamujala, S.; Bhakar, R.; Mathur, J. Resource potential and variability assessment of solar and wind energy in India. Energy 2020, 211, 118993. [Google Scholar] [CrossRef] [Scilit]
- Askarzadeh, A.; dos Santos Coelho, L. A novel framework for optimization of a grid independent hybrid renewable energy system: A case study of Iran. Sol. Energy 2015, 112, 383–396. [Google Scholar] [CrossRef] [Scilit]
- Gebrehiwot, K.; Mondal, M.A.H.; Ringler, C.; Gebremeskel, A.G. Optimization and cost-benefit assessment of hybrid power systems for off-grid rural electrification in Ethiopia. Energy 2019, 177, 234–246. [Google Scholar] [CrossRef] [Scilit]
- Rajanna, S.; Saini, R.P. Optimal modeling of an integrated renewable energy system with battery storage for off grid electrification of remote rural area. In Proceedings of the 1st IEEE International Conference on Power Electronics, Intelligent Control and Energy Systems (ICPEICES); IEEE: New York, NY, USA, 2017. [Google Scholar] [CrossRef] [Scilit]
- Akinte, O.O.; Plangklang, B.; Prasartkaew, B.; Aina, T.S. Energy Storage Management of a Solar Photovoltaic–Biomass Hybrid Power System. Energies 2023, 16, 5122. [Google Scholar] [CrossRef] [Scilit]
- Thakkar, R.R. Electrical Equivalent Circuit Models of Lithium-ion Battery. In Management and Applications of Energy Storage Devices; IntechOpen: London, UK, 2021. [Google Scholar] [CrossRef] [Scilit]
- Naseri, F.; Karimi, S.; Farjah, E.; Schaltz, E. Supercapacitor management system: A comprehensive review of modeling, estimation, balancing, and protection techniques. Renew. Sustain. Energy Rev. 2022, 155, 111913. [Google Scholar] [CrossRef] [Scilit]
- Hamlat, A.; Sekour, M.; Mankour, M.; Yahiaoui, M.; Khalfaoui, M.; Brahmi, B. Advanced Power Management and Control Using Fuzzy Backstepping Super-Twisting Controls Designed for Fuel Cell Supercapacitors Hybrid Power Systems for Traction Applications. J. Control Autom. Electr. Syst. 2023, 34, 996–1012. [Google Scholar] [CrossRef] [Scilit]
- Corrêa, J.M.; Farret, F.A.; Popov, V.A.; Simões, M.G. Sensitivity analysis of the modeling parameters used in simulation of proton exchange membrane fuel cells. IEEE Trans. Energy Convers. 2005, 20, 211–218. [Google Scholar] [CrossRef]
- El Zerk, A.; Ouassaid, M.; Zidani, Y. Energy management based fuzzy logic control of hybrid system wind/photovoltaic with batteries. In Proceedings of the 3rd Renewable Energies, Power Systems & Green Inclusive Economy (REPS-GIE); IEEE: New York, NY, USA, 2018. [Google Scholar] [CrossRef] [Scilit]
- Adetoro, S.A.; Olatomiwa, L.; Tsado, J.; Dauda, S.M. An Overview of Configurations and Dispatch Strategies in Hybrid Energy Systems. In Proceedings of the 2022 IEEE Nigeria 4th International Conference on Disruptive Technologies for Sustainable Development (NIGERCON); IEEE: New York, NY, USA, 2022. [Google Scholar] [CrossRef] [Scilit]
- Faquir, S.; Yahyaouy, A.; Tairi, H.; Sabor, J. Energy Management in an Electrical Hybrid System Using a Fuzzy Inference Control System. In Proceedings of the 2013 International Conference on Industrial Engineering and Systems Management (IESM); IEEE: New York, NY, USA, 2013; Available online: https://ieeexplore.ieee.org/document/6761389 (accessed on 10 September 2025).
- El-Fawair, A.B.; Al-Aubidy, K.M.; Al-Khawaldeh, M.A. Energy Management in Microgrids with Renewable Energy Sources and Energy Storage System. In Proceedings of the 2023 20th International Multi-Conference on Systems, Signals & Devices (SSD); IEEE: New York, NY, USA, 2023; pp. 801–806. [Google Scholar] [CrossRef] [Scilit]
- Jain, A.; Lalwani, S.; Lalwani, M. A Comparative Analysis of MOPSO, NSGA-II, SPEA2 and PESA2 for Multi-Objective Optimal Power Flow. In Proceedings of the 2nd International Conference on Energy, Power and Environment: Towards Smart Technology (ICEPE); IEEE: New York, NY, USA, 2018. [Google Scholar] [CrossRef] [Scilit]
- Sharma, S.; Kumar, V. A Comprehensive Review on Multi-objective Optimization Techniques: Past, Present and Future. Arch. Comput. Methods Eng. 2022, 29, 5605–5633. [Google Scholar] [CrossRef] [Scilit]
- Pode, R.; Diouf, B.; Pode, G. Sustainable rural electrification using rice husk biomass energy: A case study of Cambodia. Renew. Sustain. Energy Rev. 2015, 44, 530–542. [Google Scholar] [CrossRef] [Scilit]
- Lwakatare, B.; Vyavahare, P.; Mehta, K.; Zörner, W. Electrification Planning for Off-Grid Communities in Sub-Saharan Africa: Advancing Energy Access. Energies 2024, 17, 5994. [Google Scholar] [CrossRef] [Scilit]
- NamPower. Schedule of the Approved Electricity Tariffs for the Financial Year 2025/2026. Available online: https://www.nampower.com.na/Media/Document/8634c34e-0f29-4bfe-b95d-962af3eb8400.pdf (accessed on 31 October 2025).
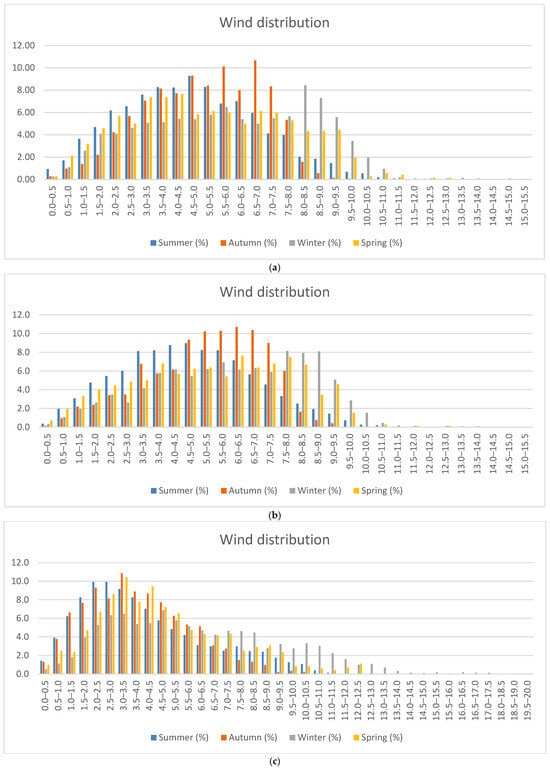
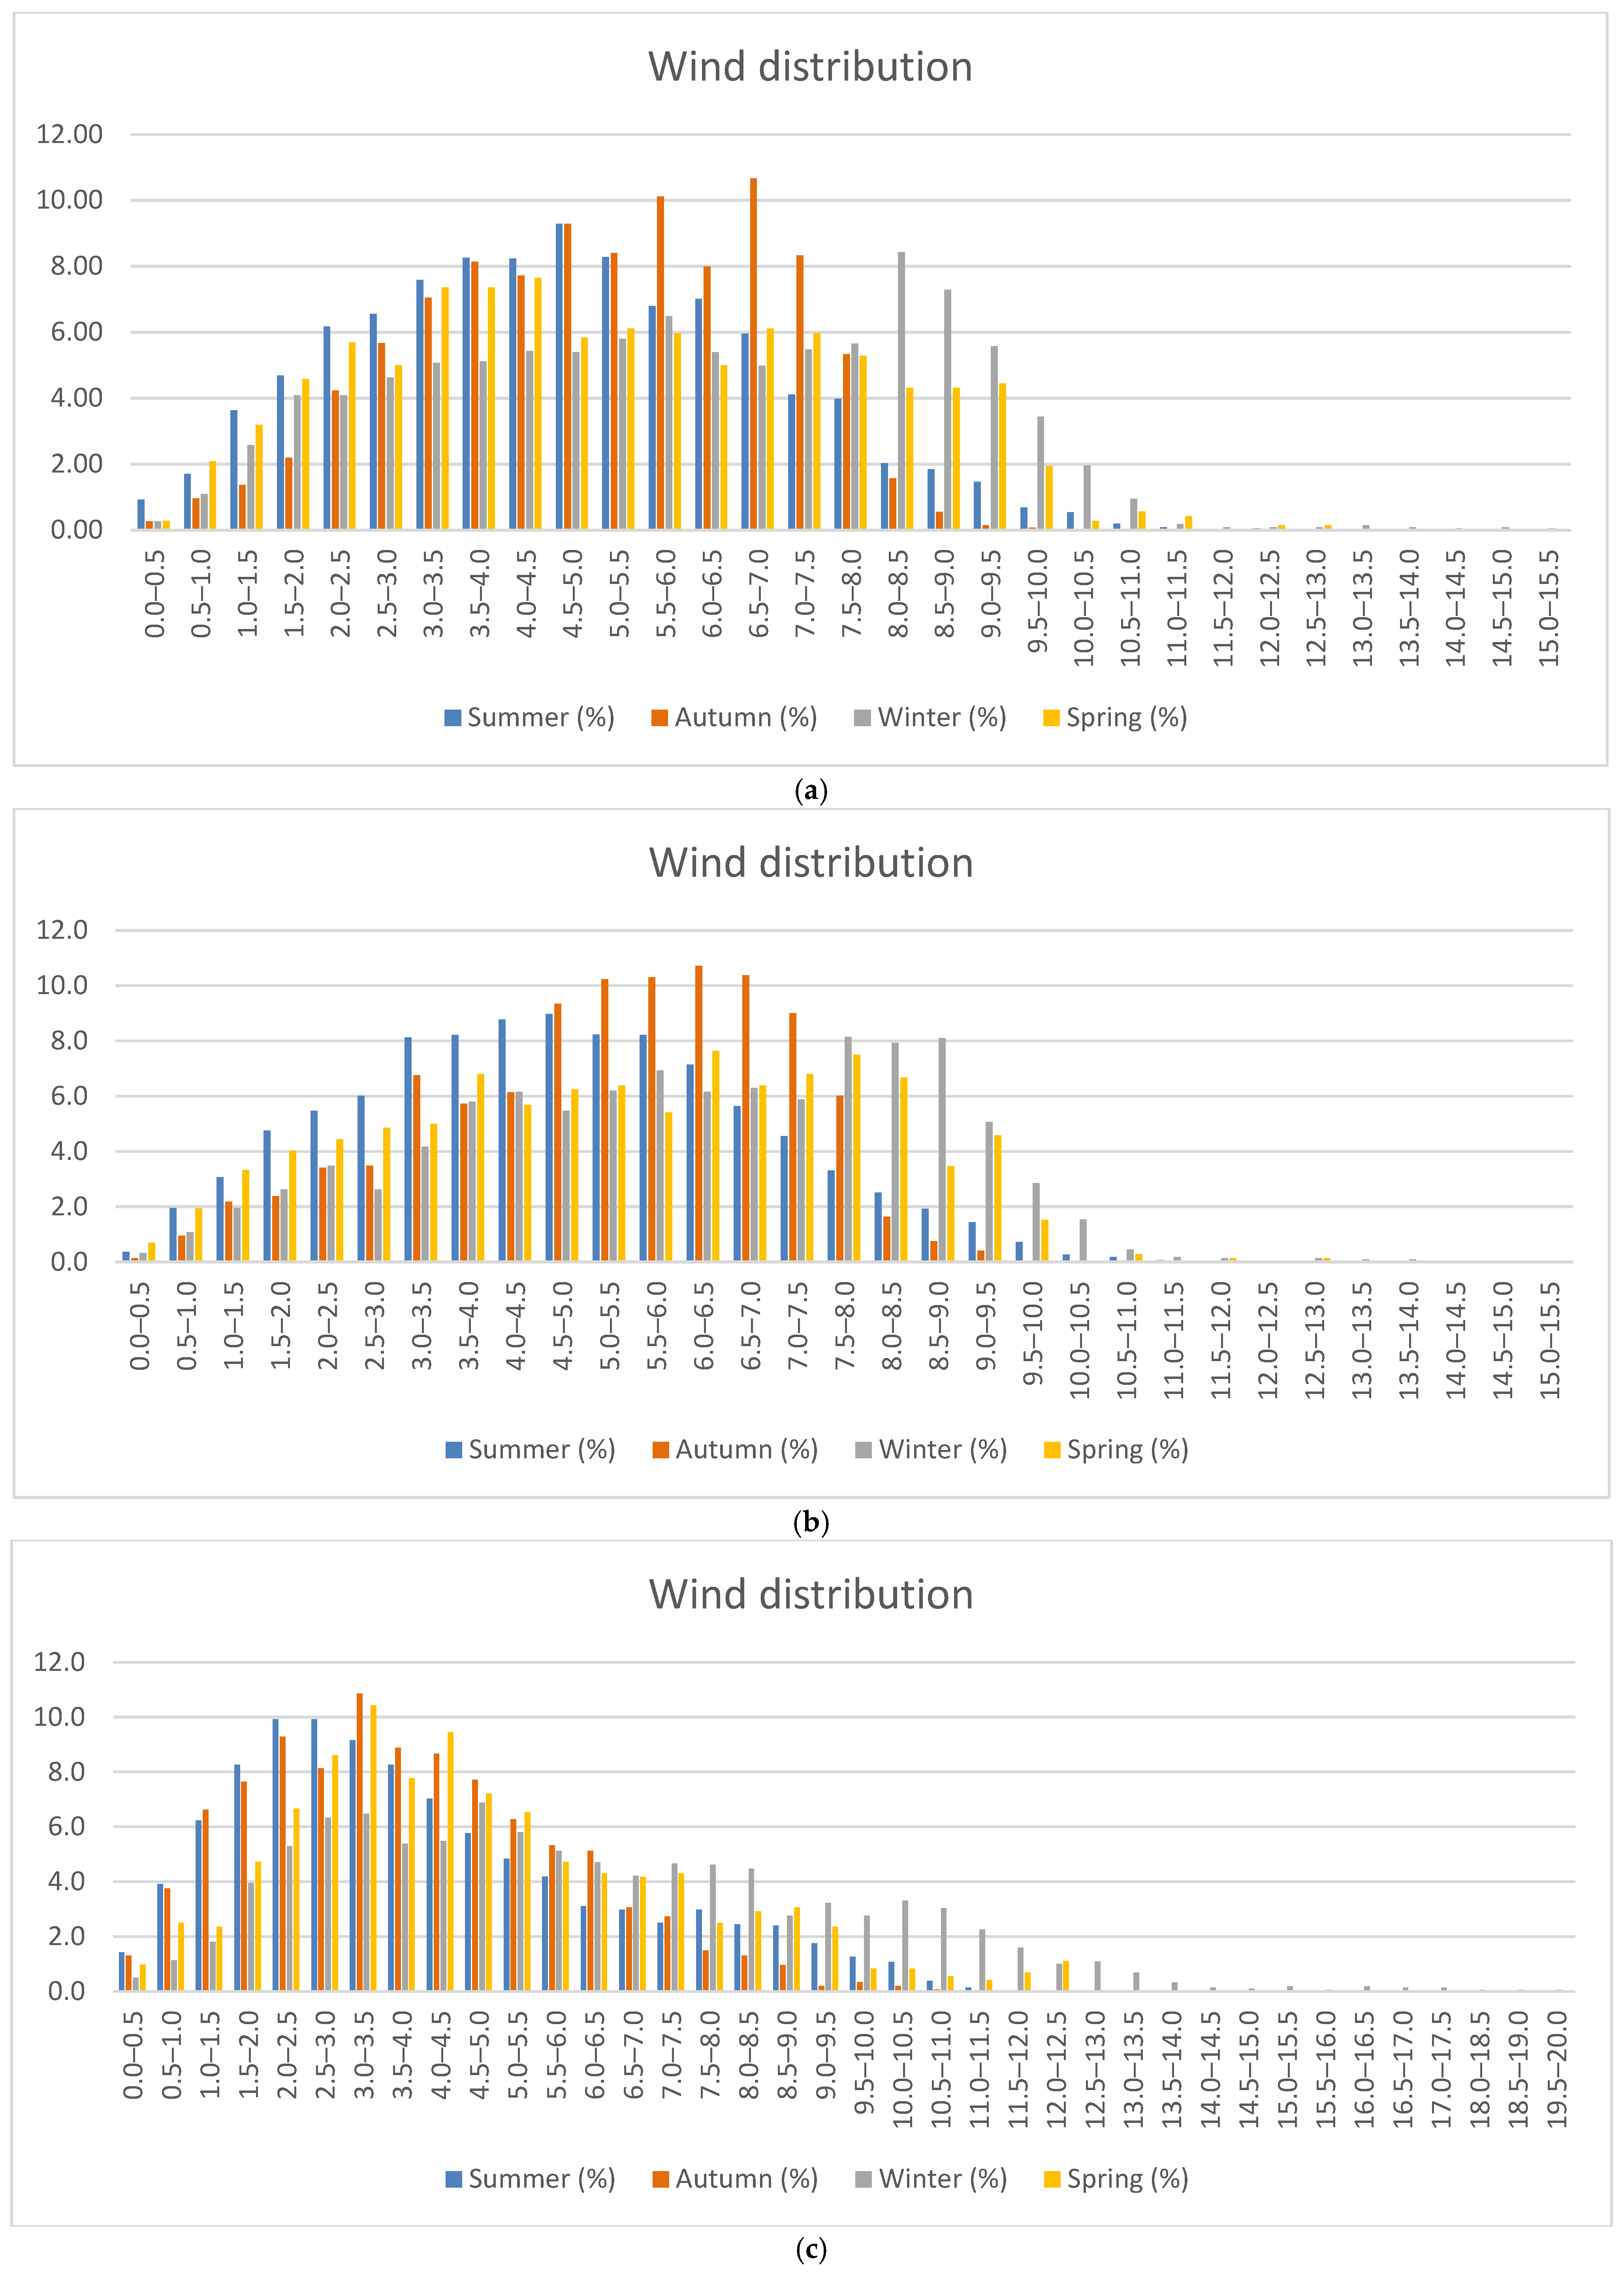
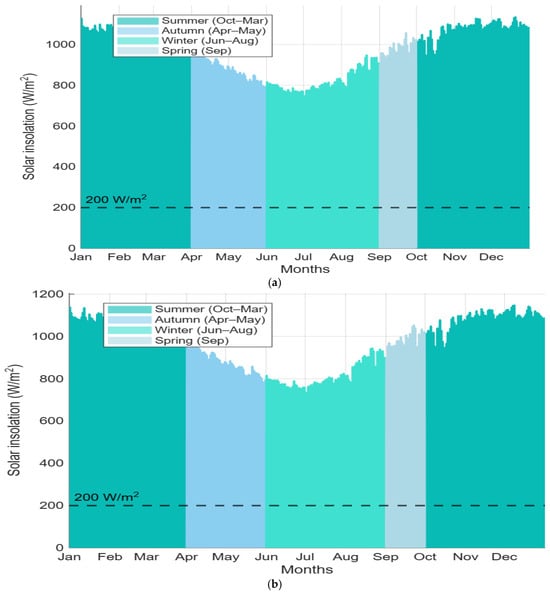
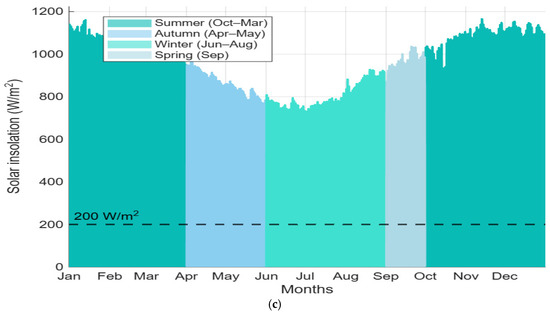
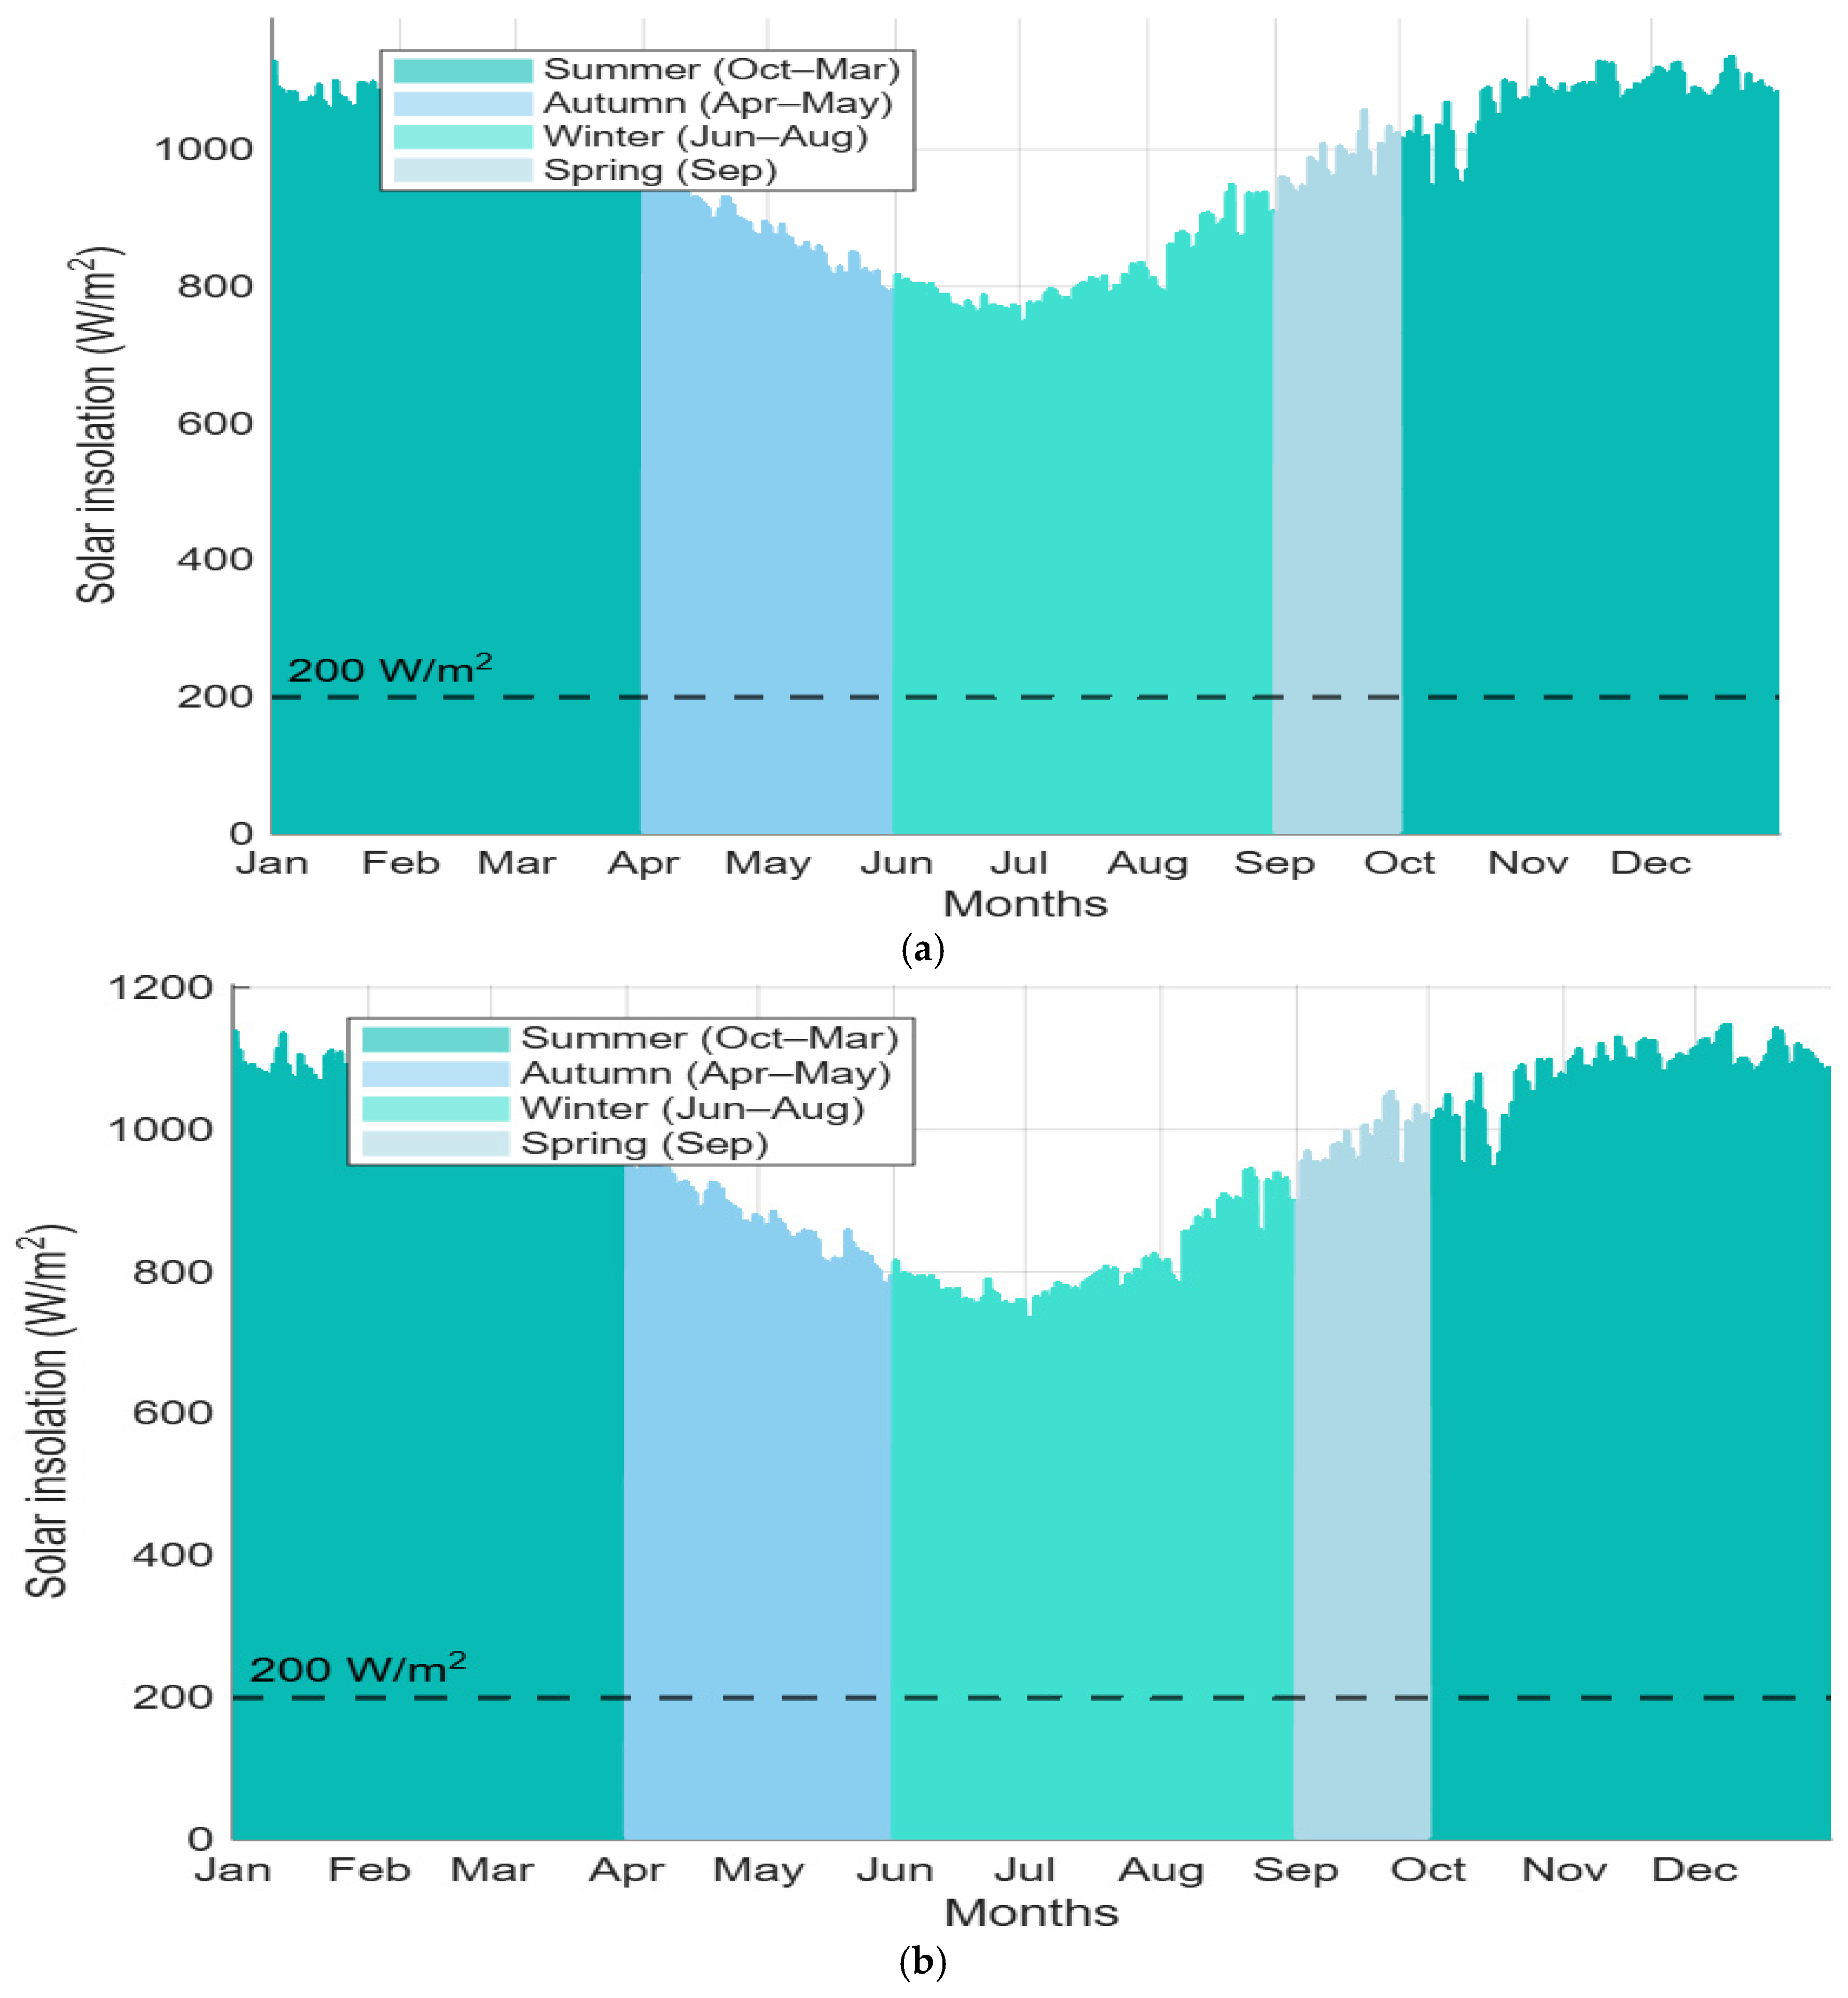
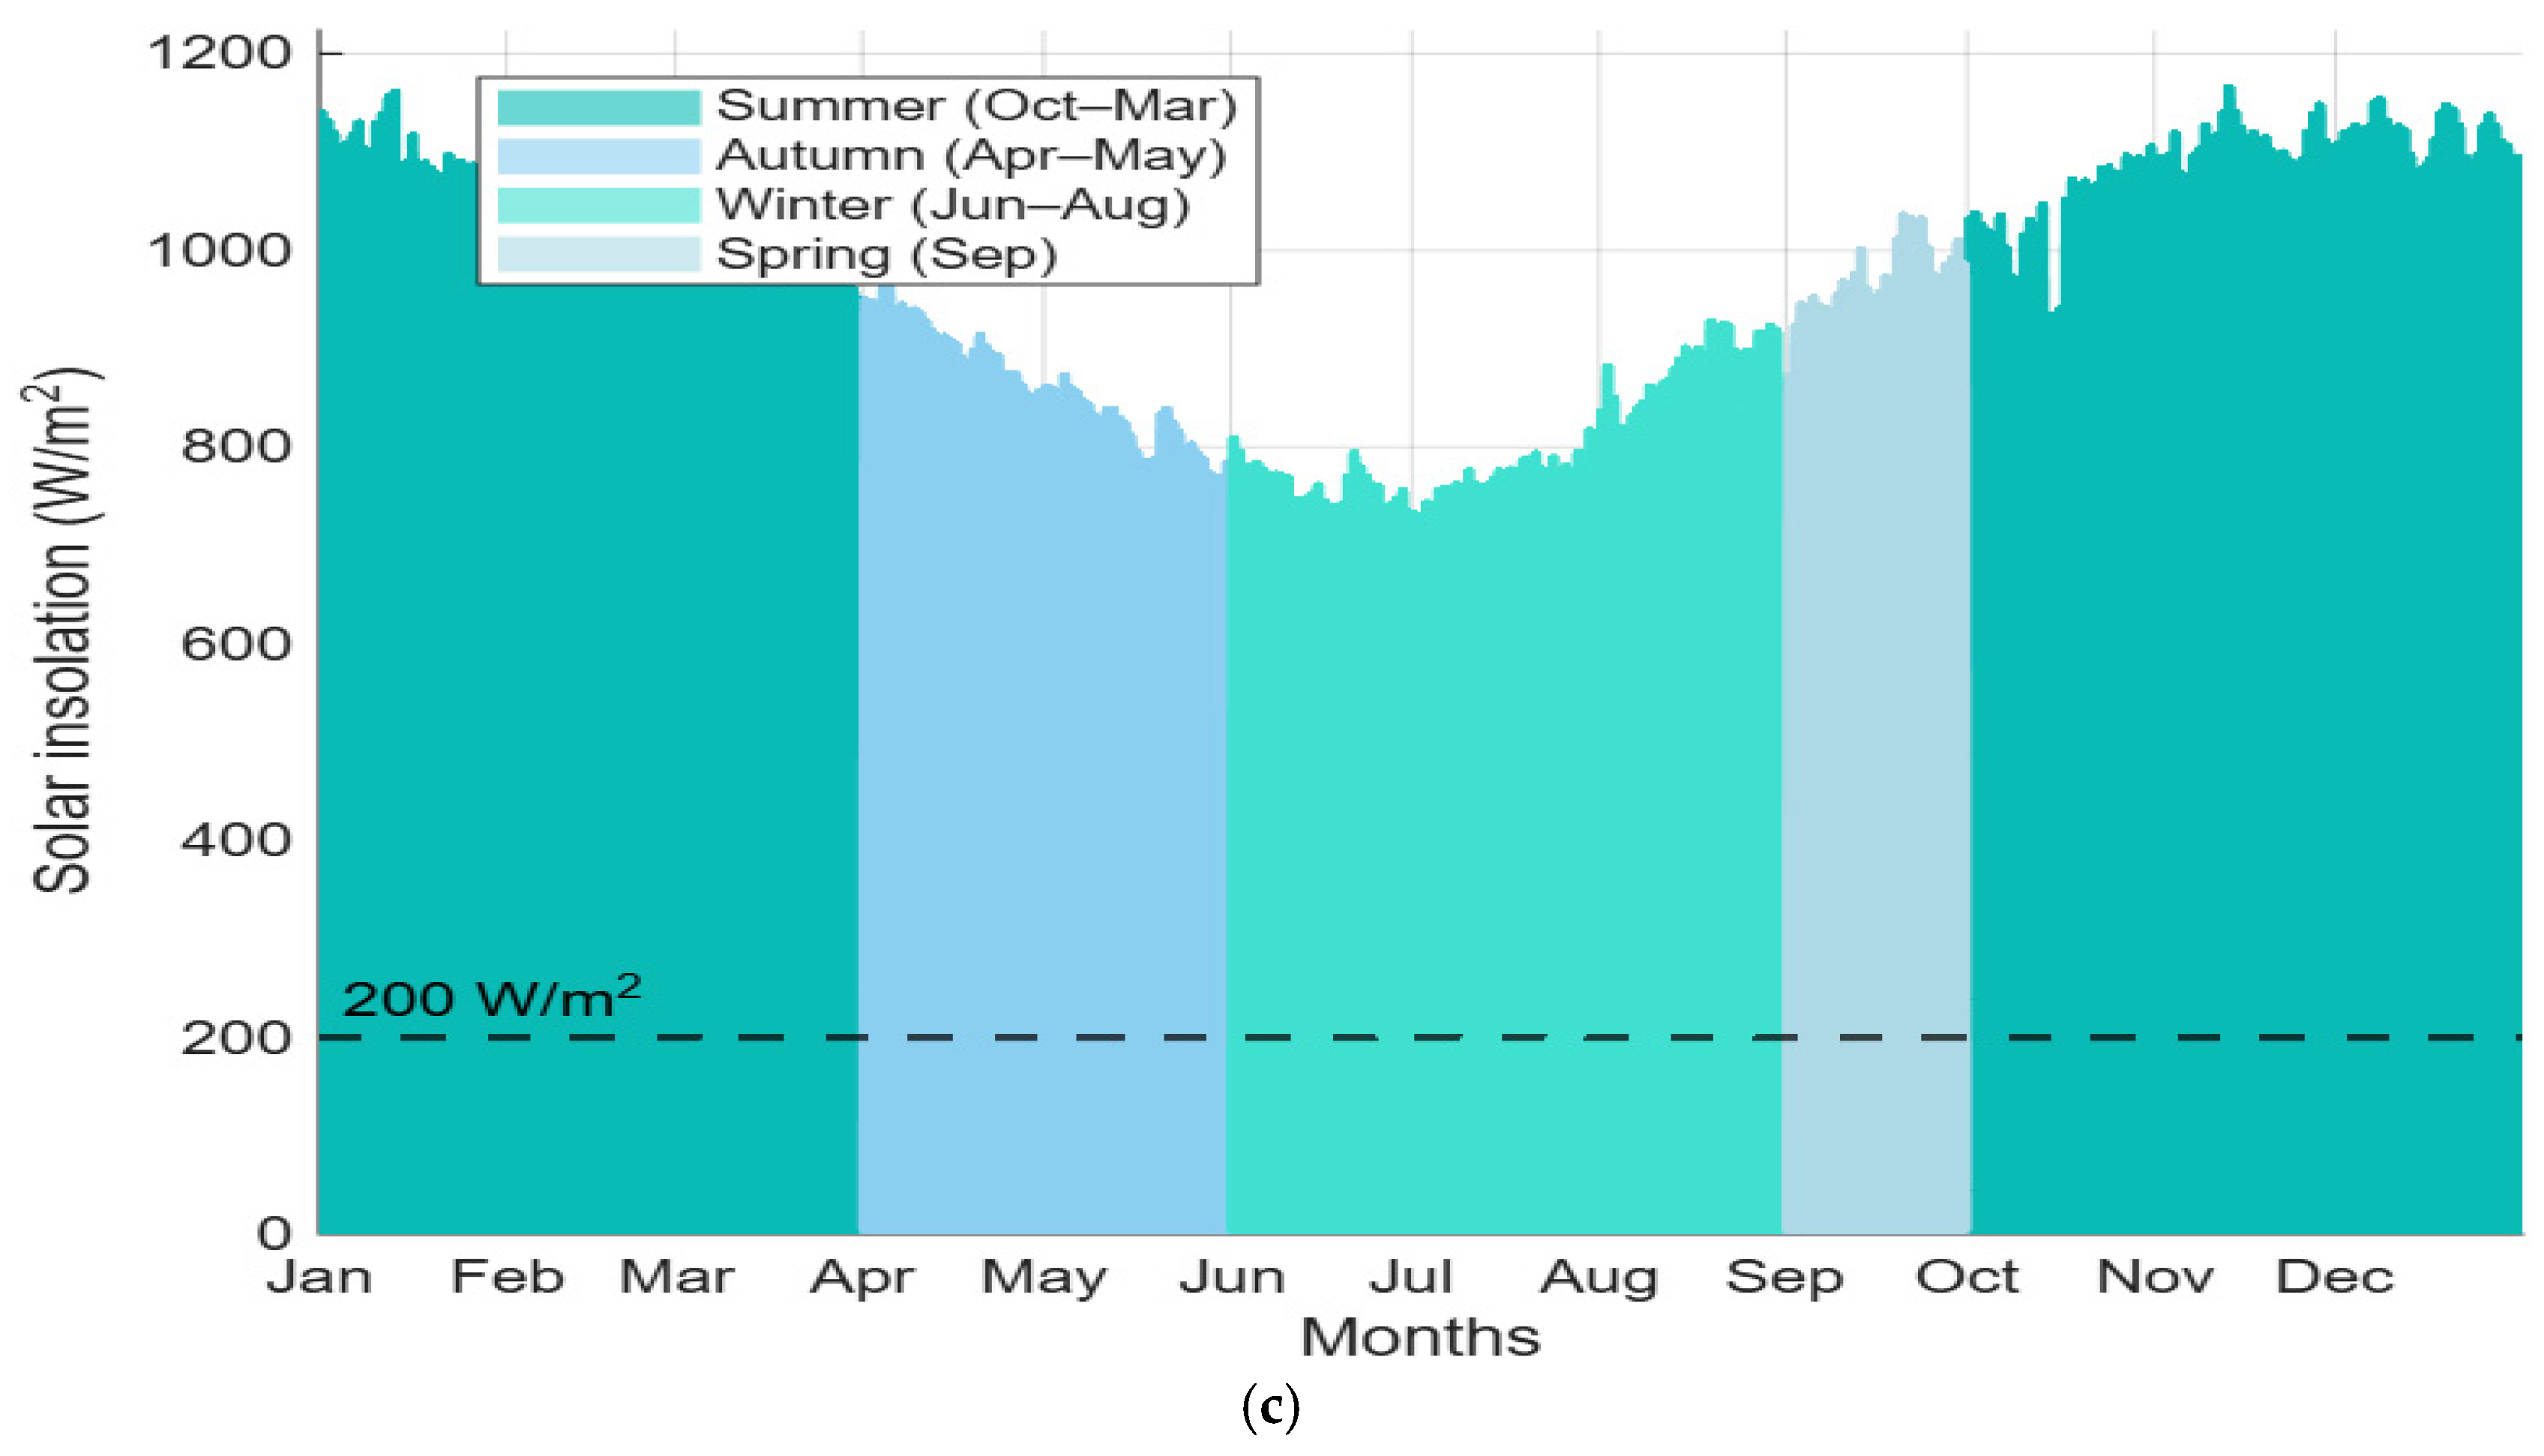
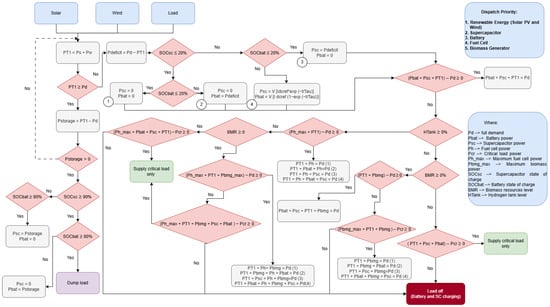
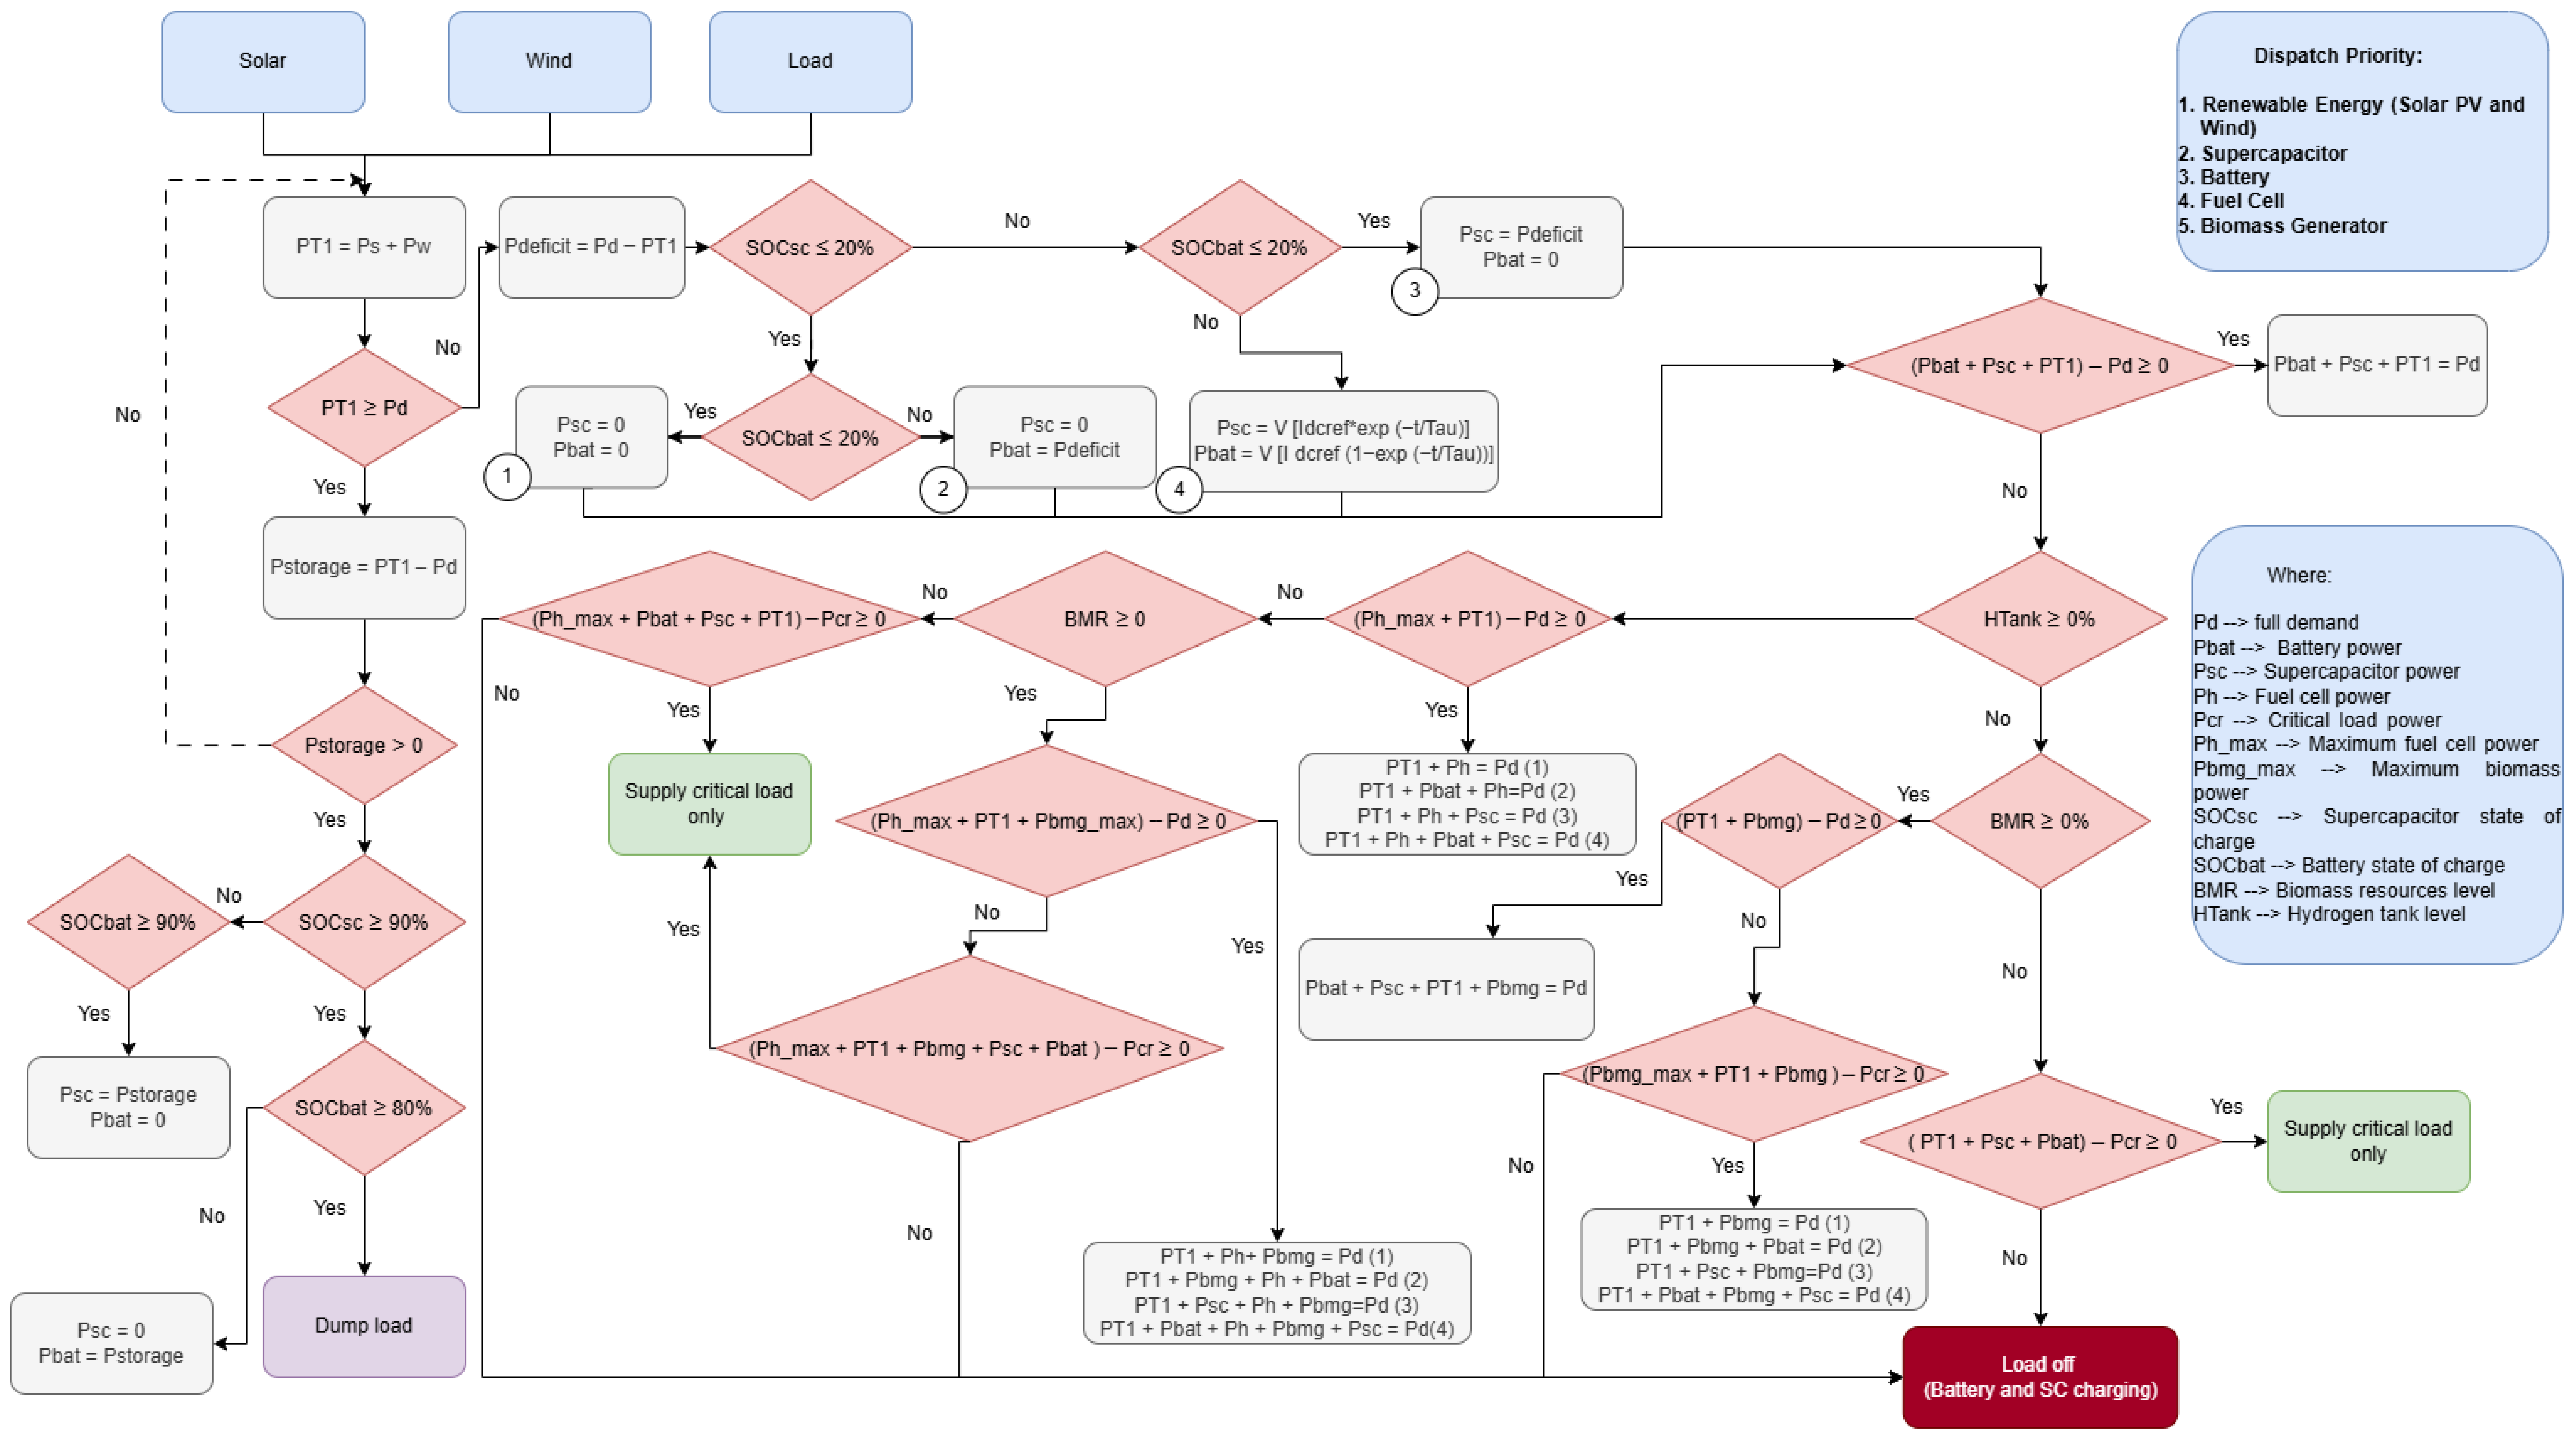
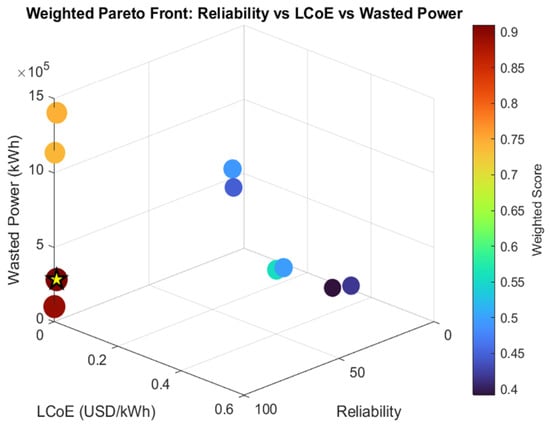
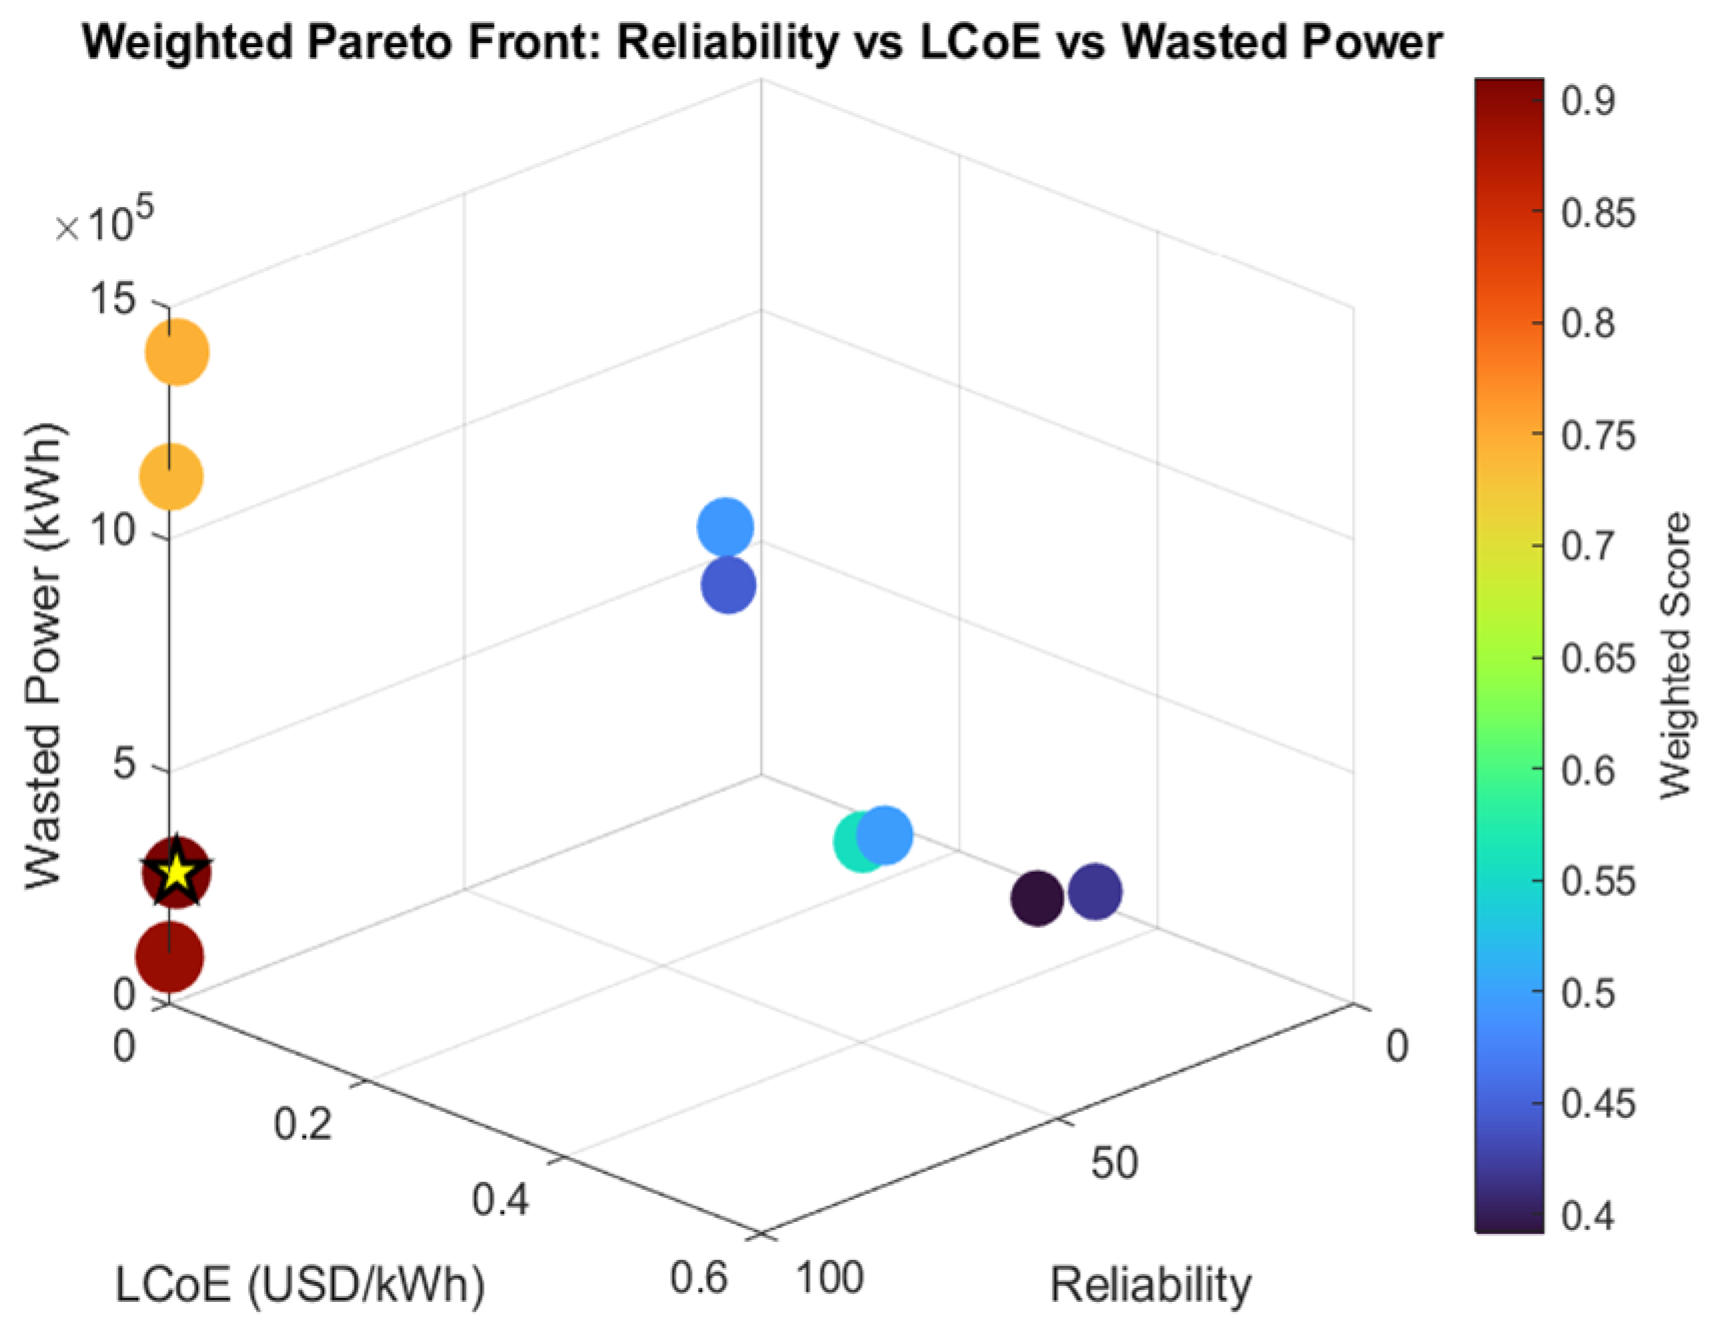
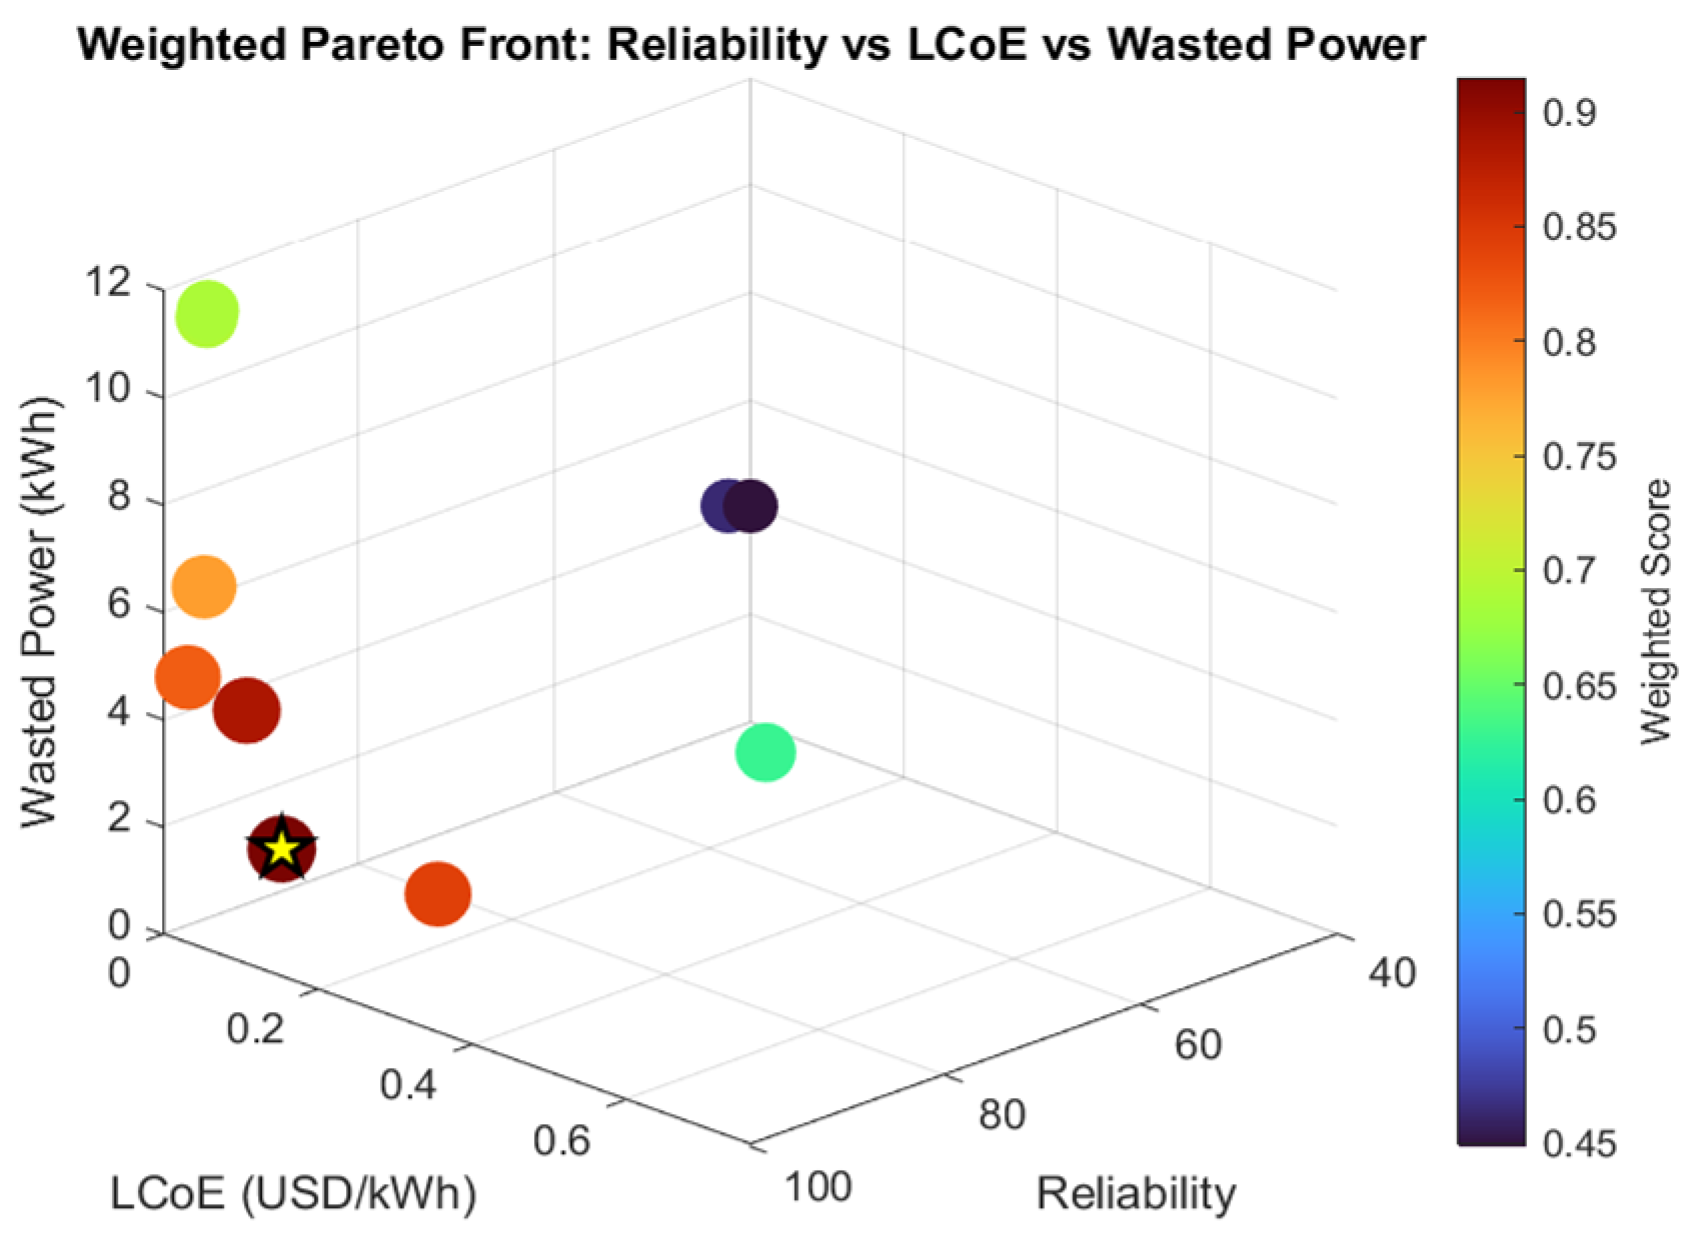
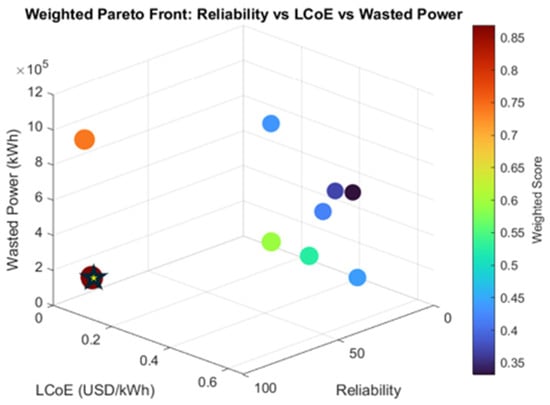
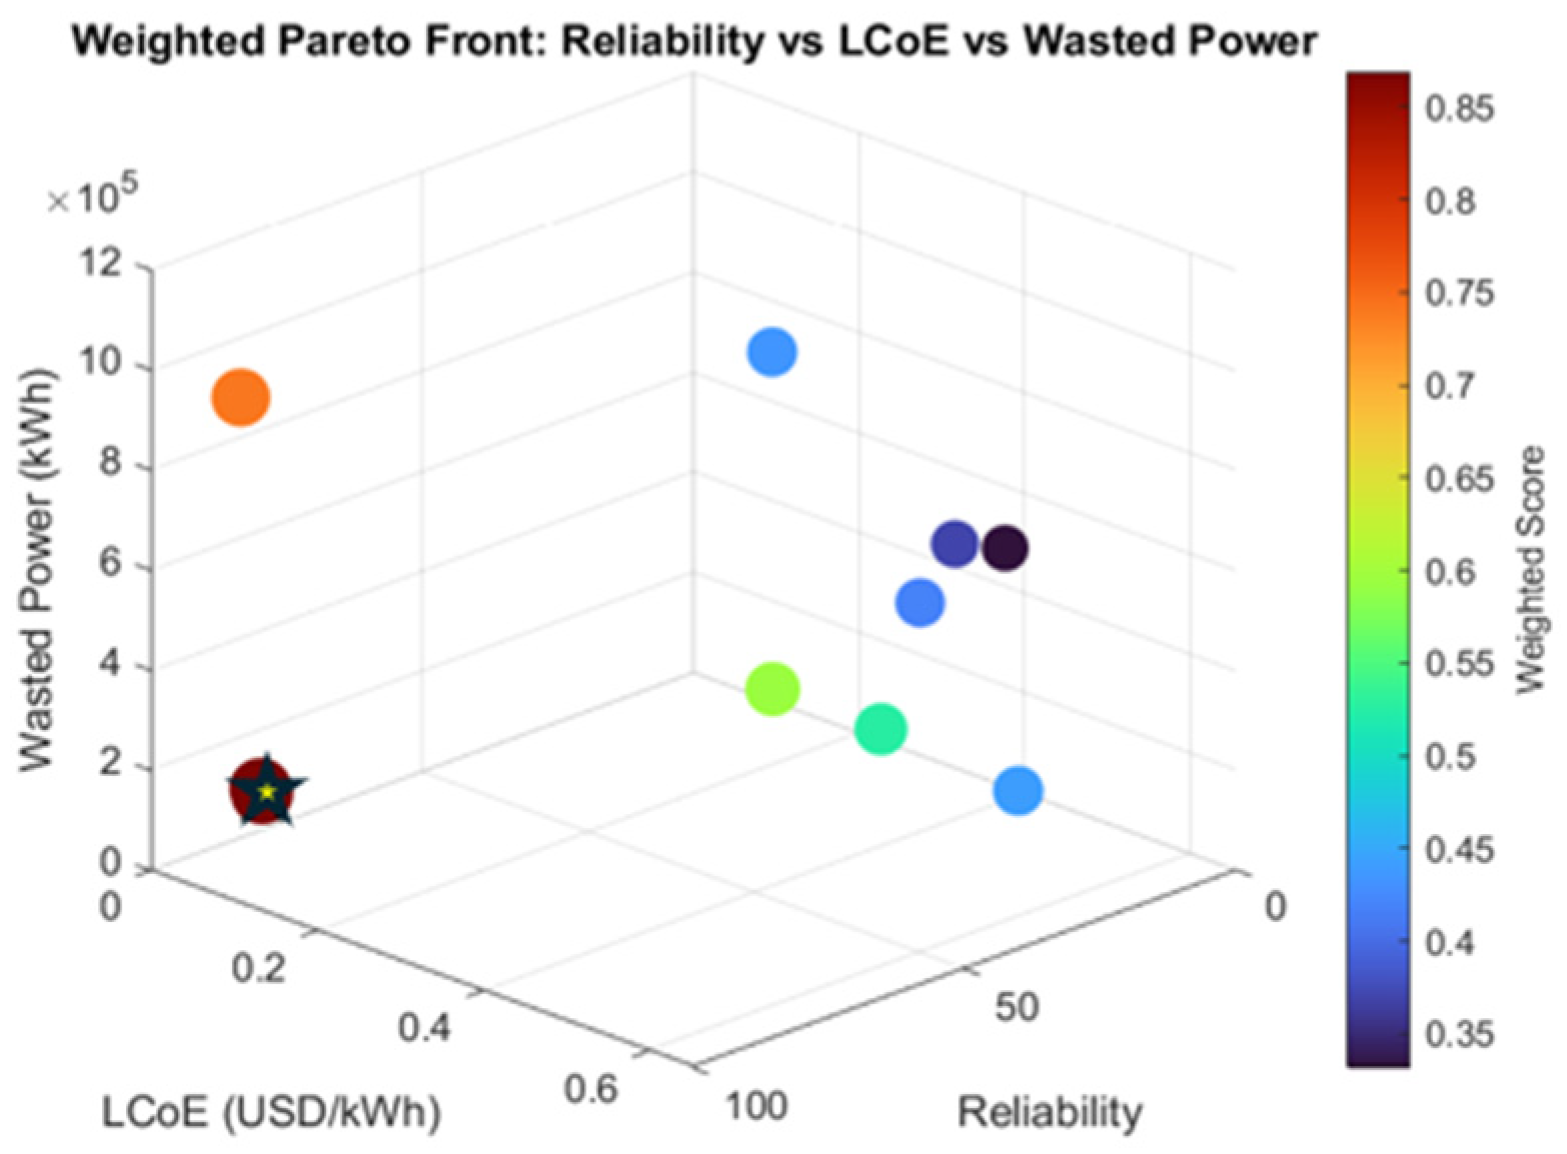
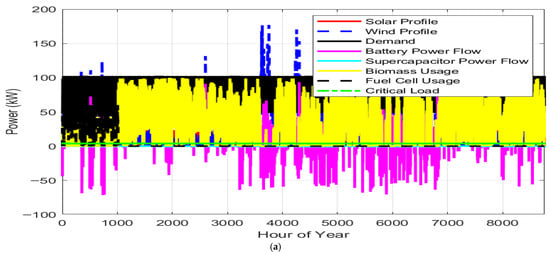
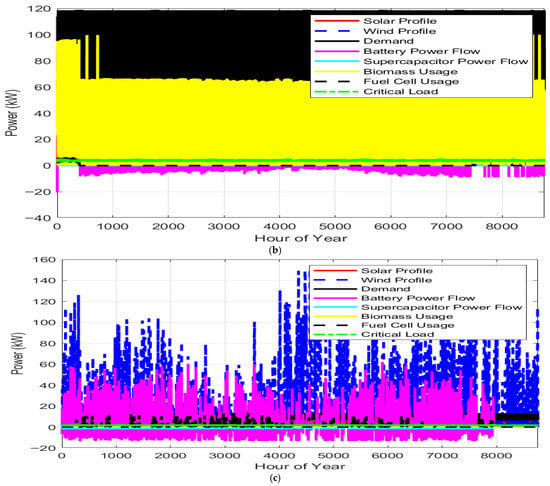
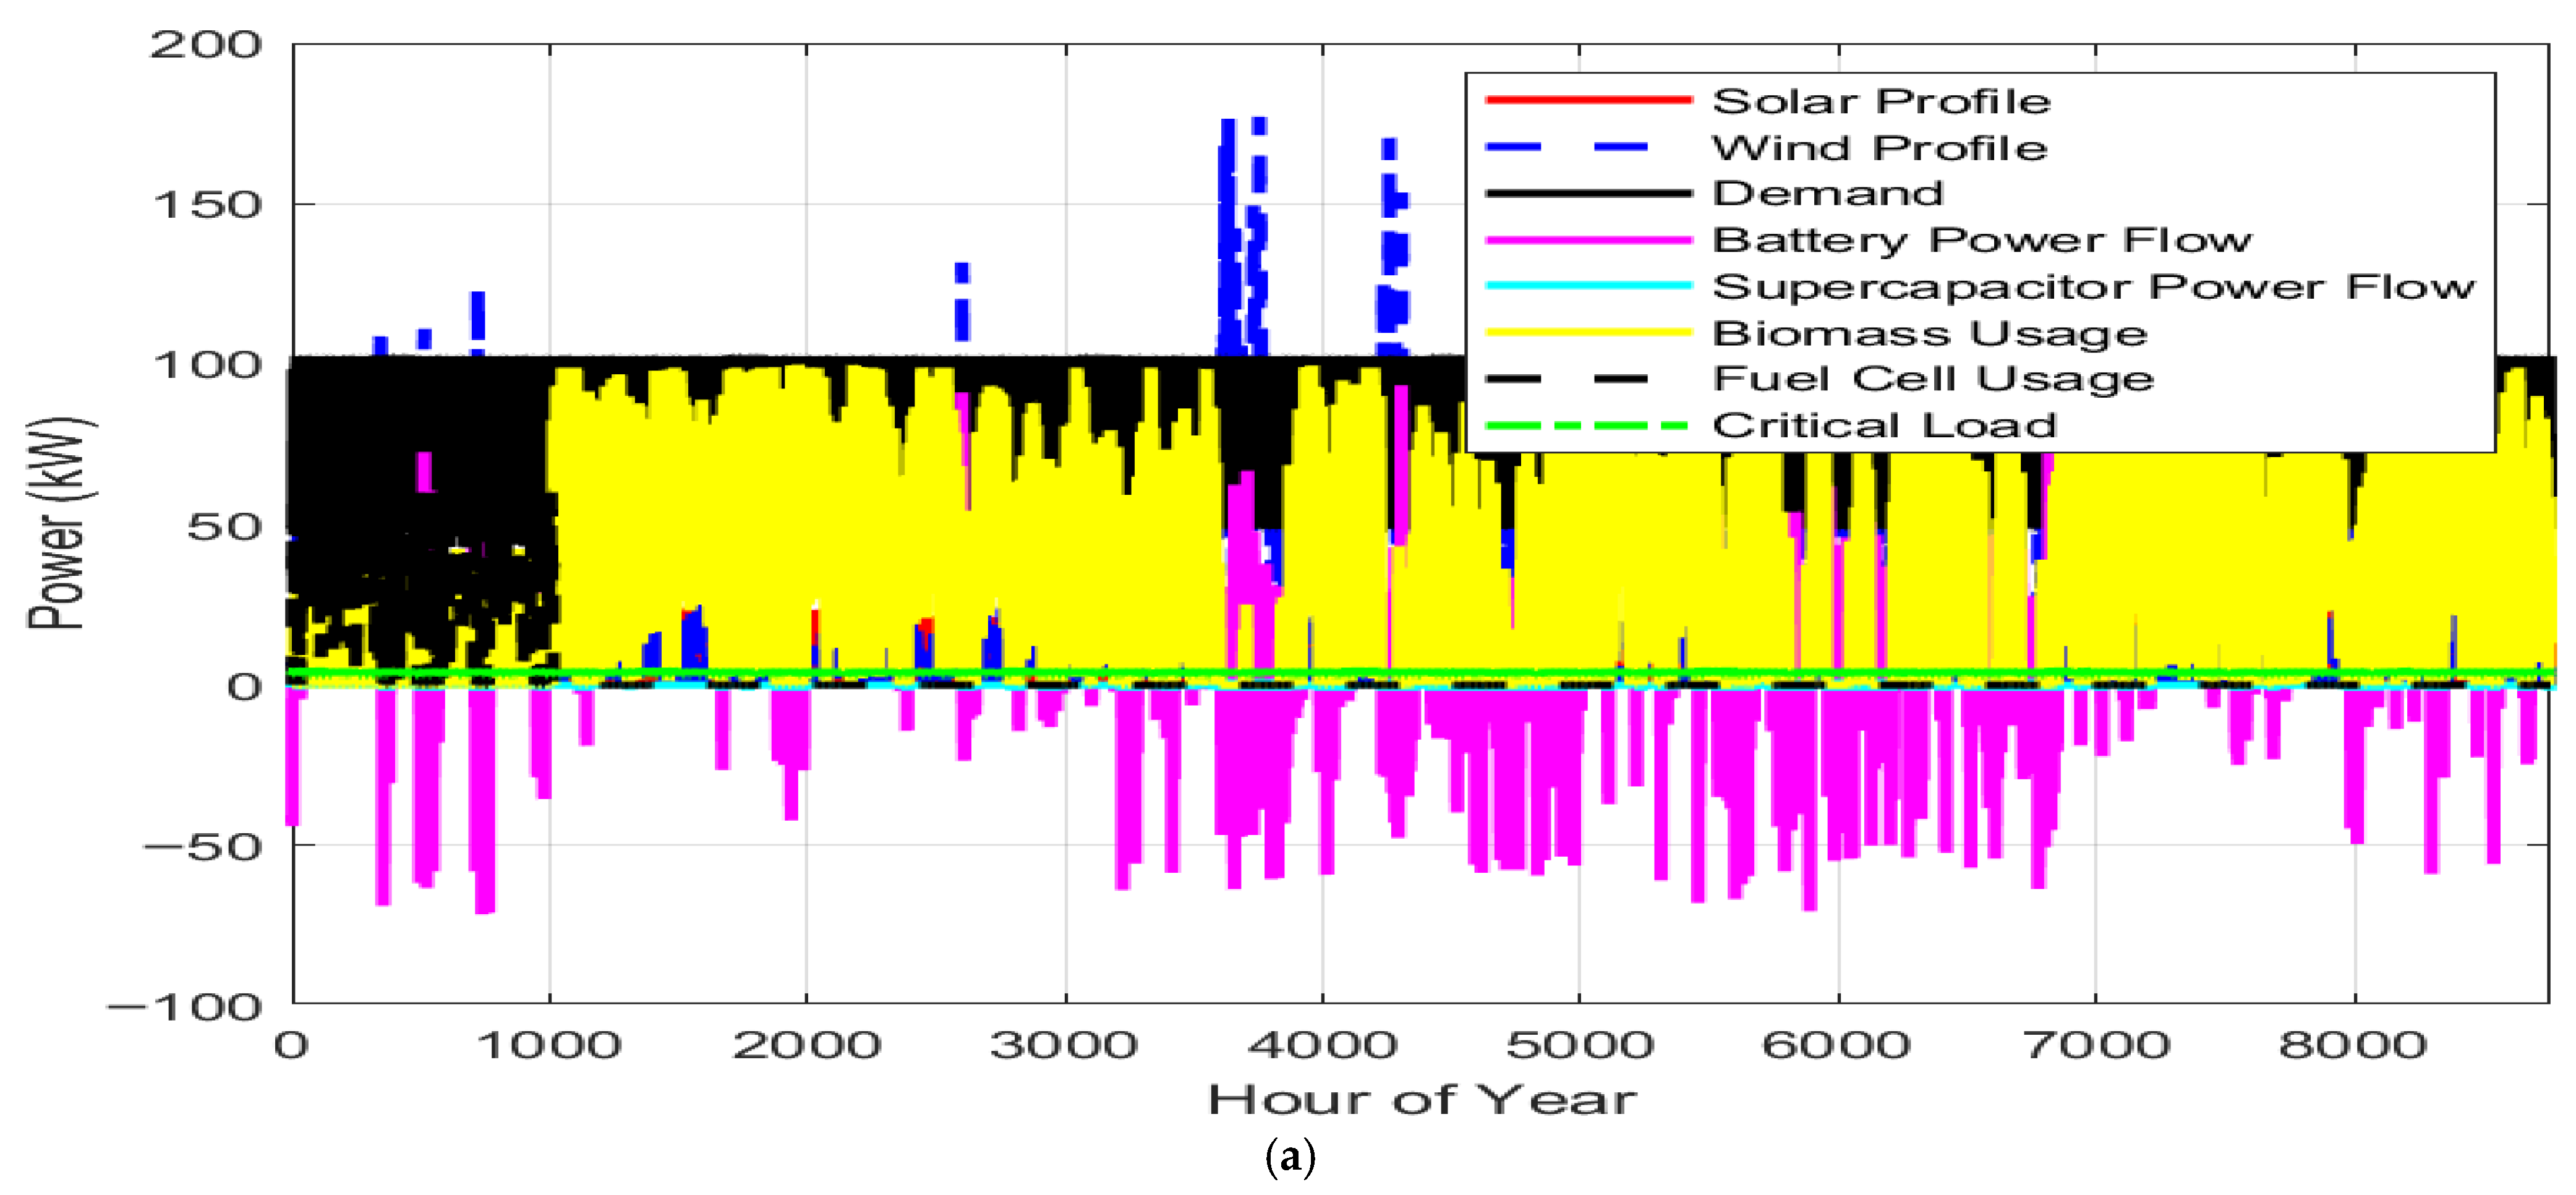
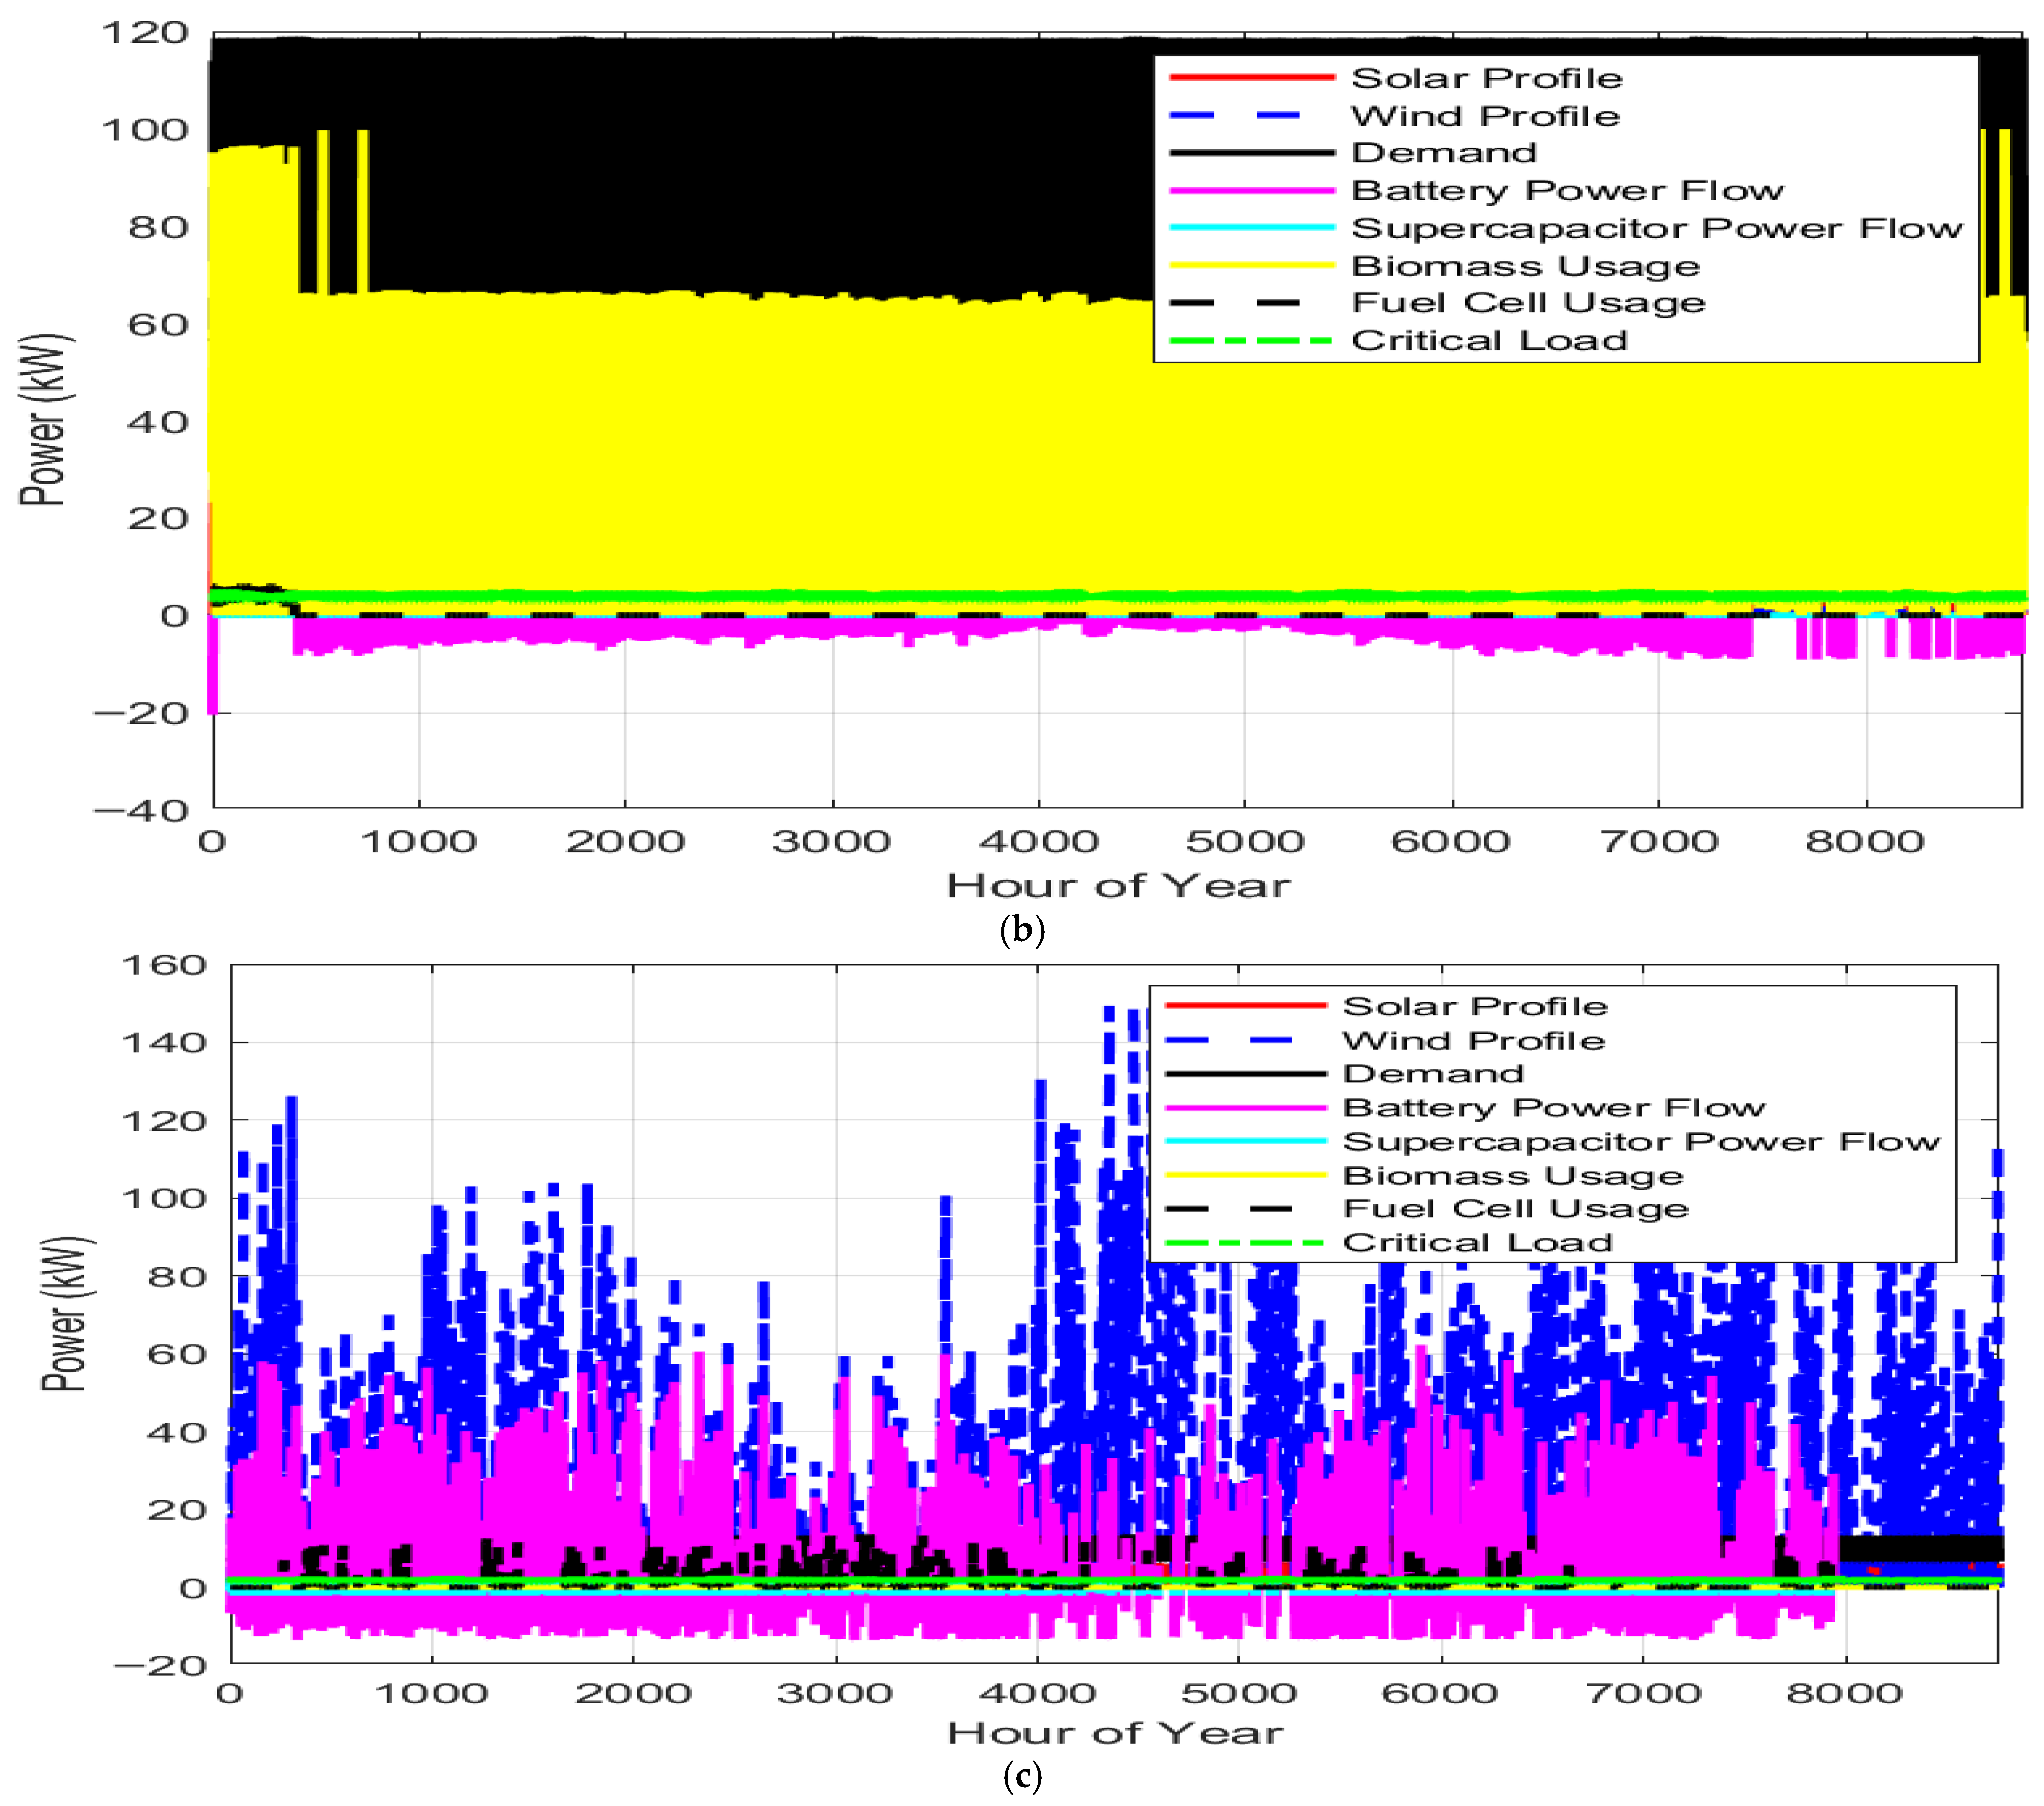
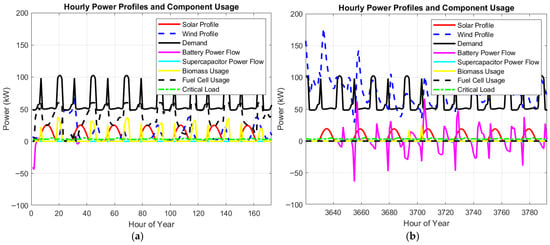
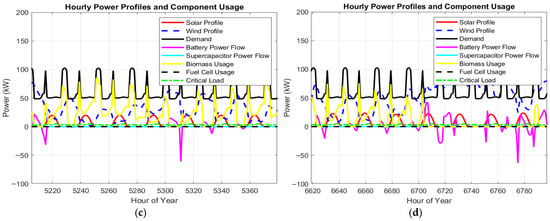
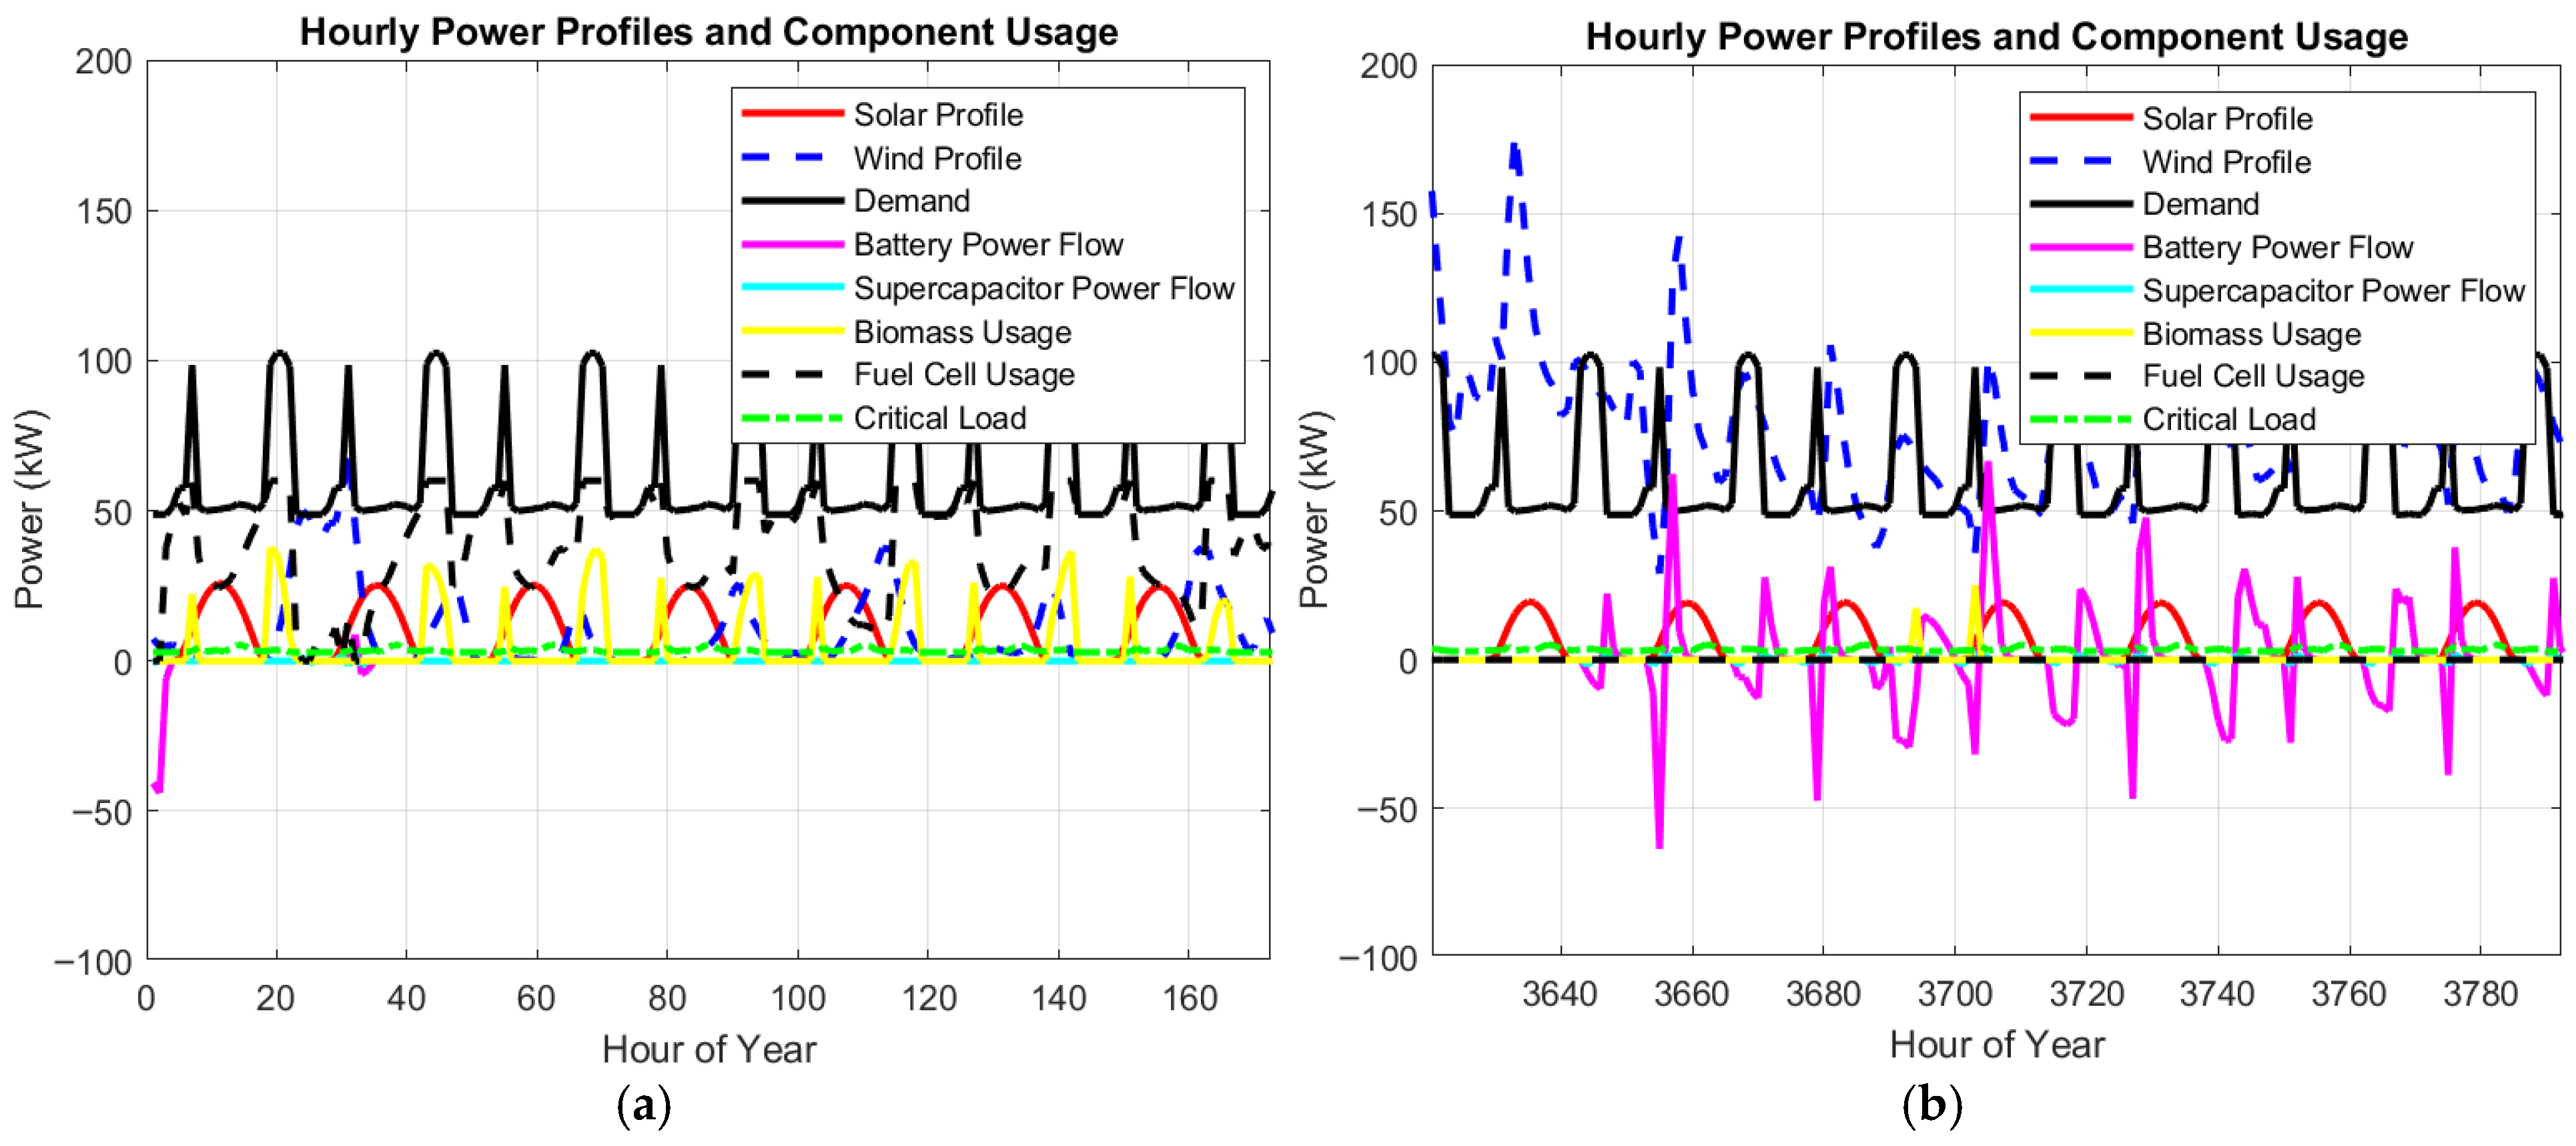
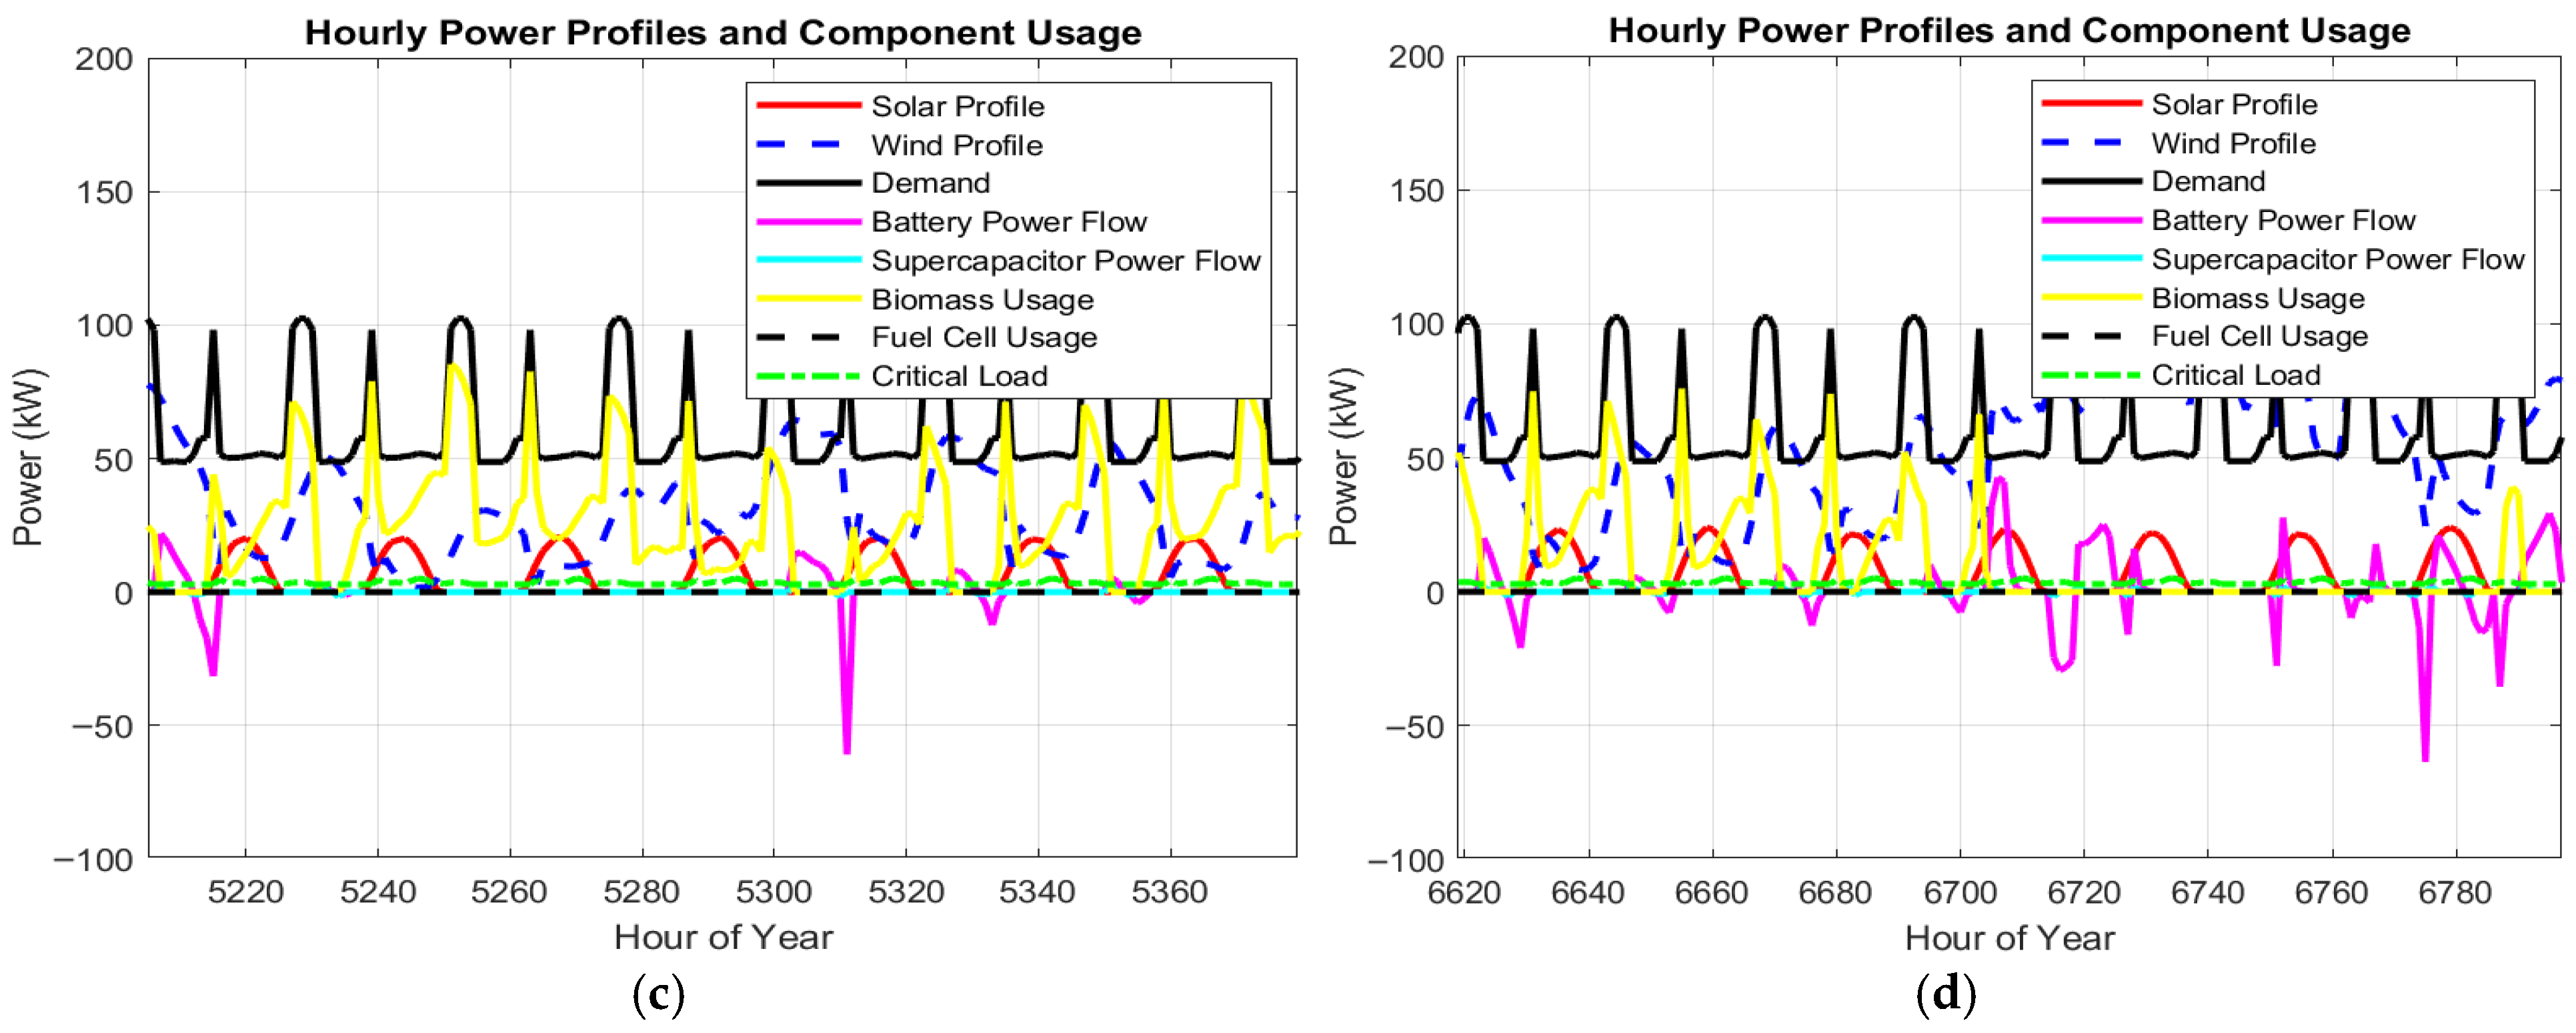
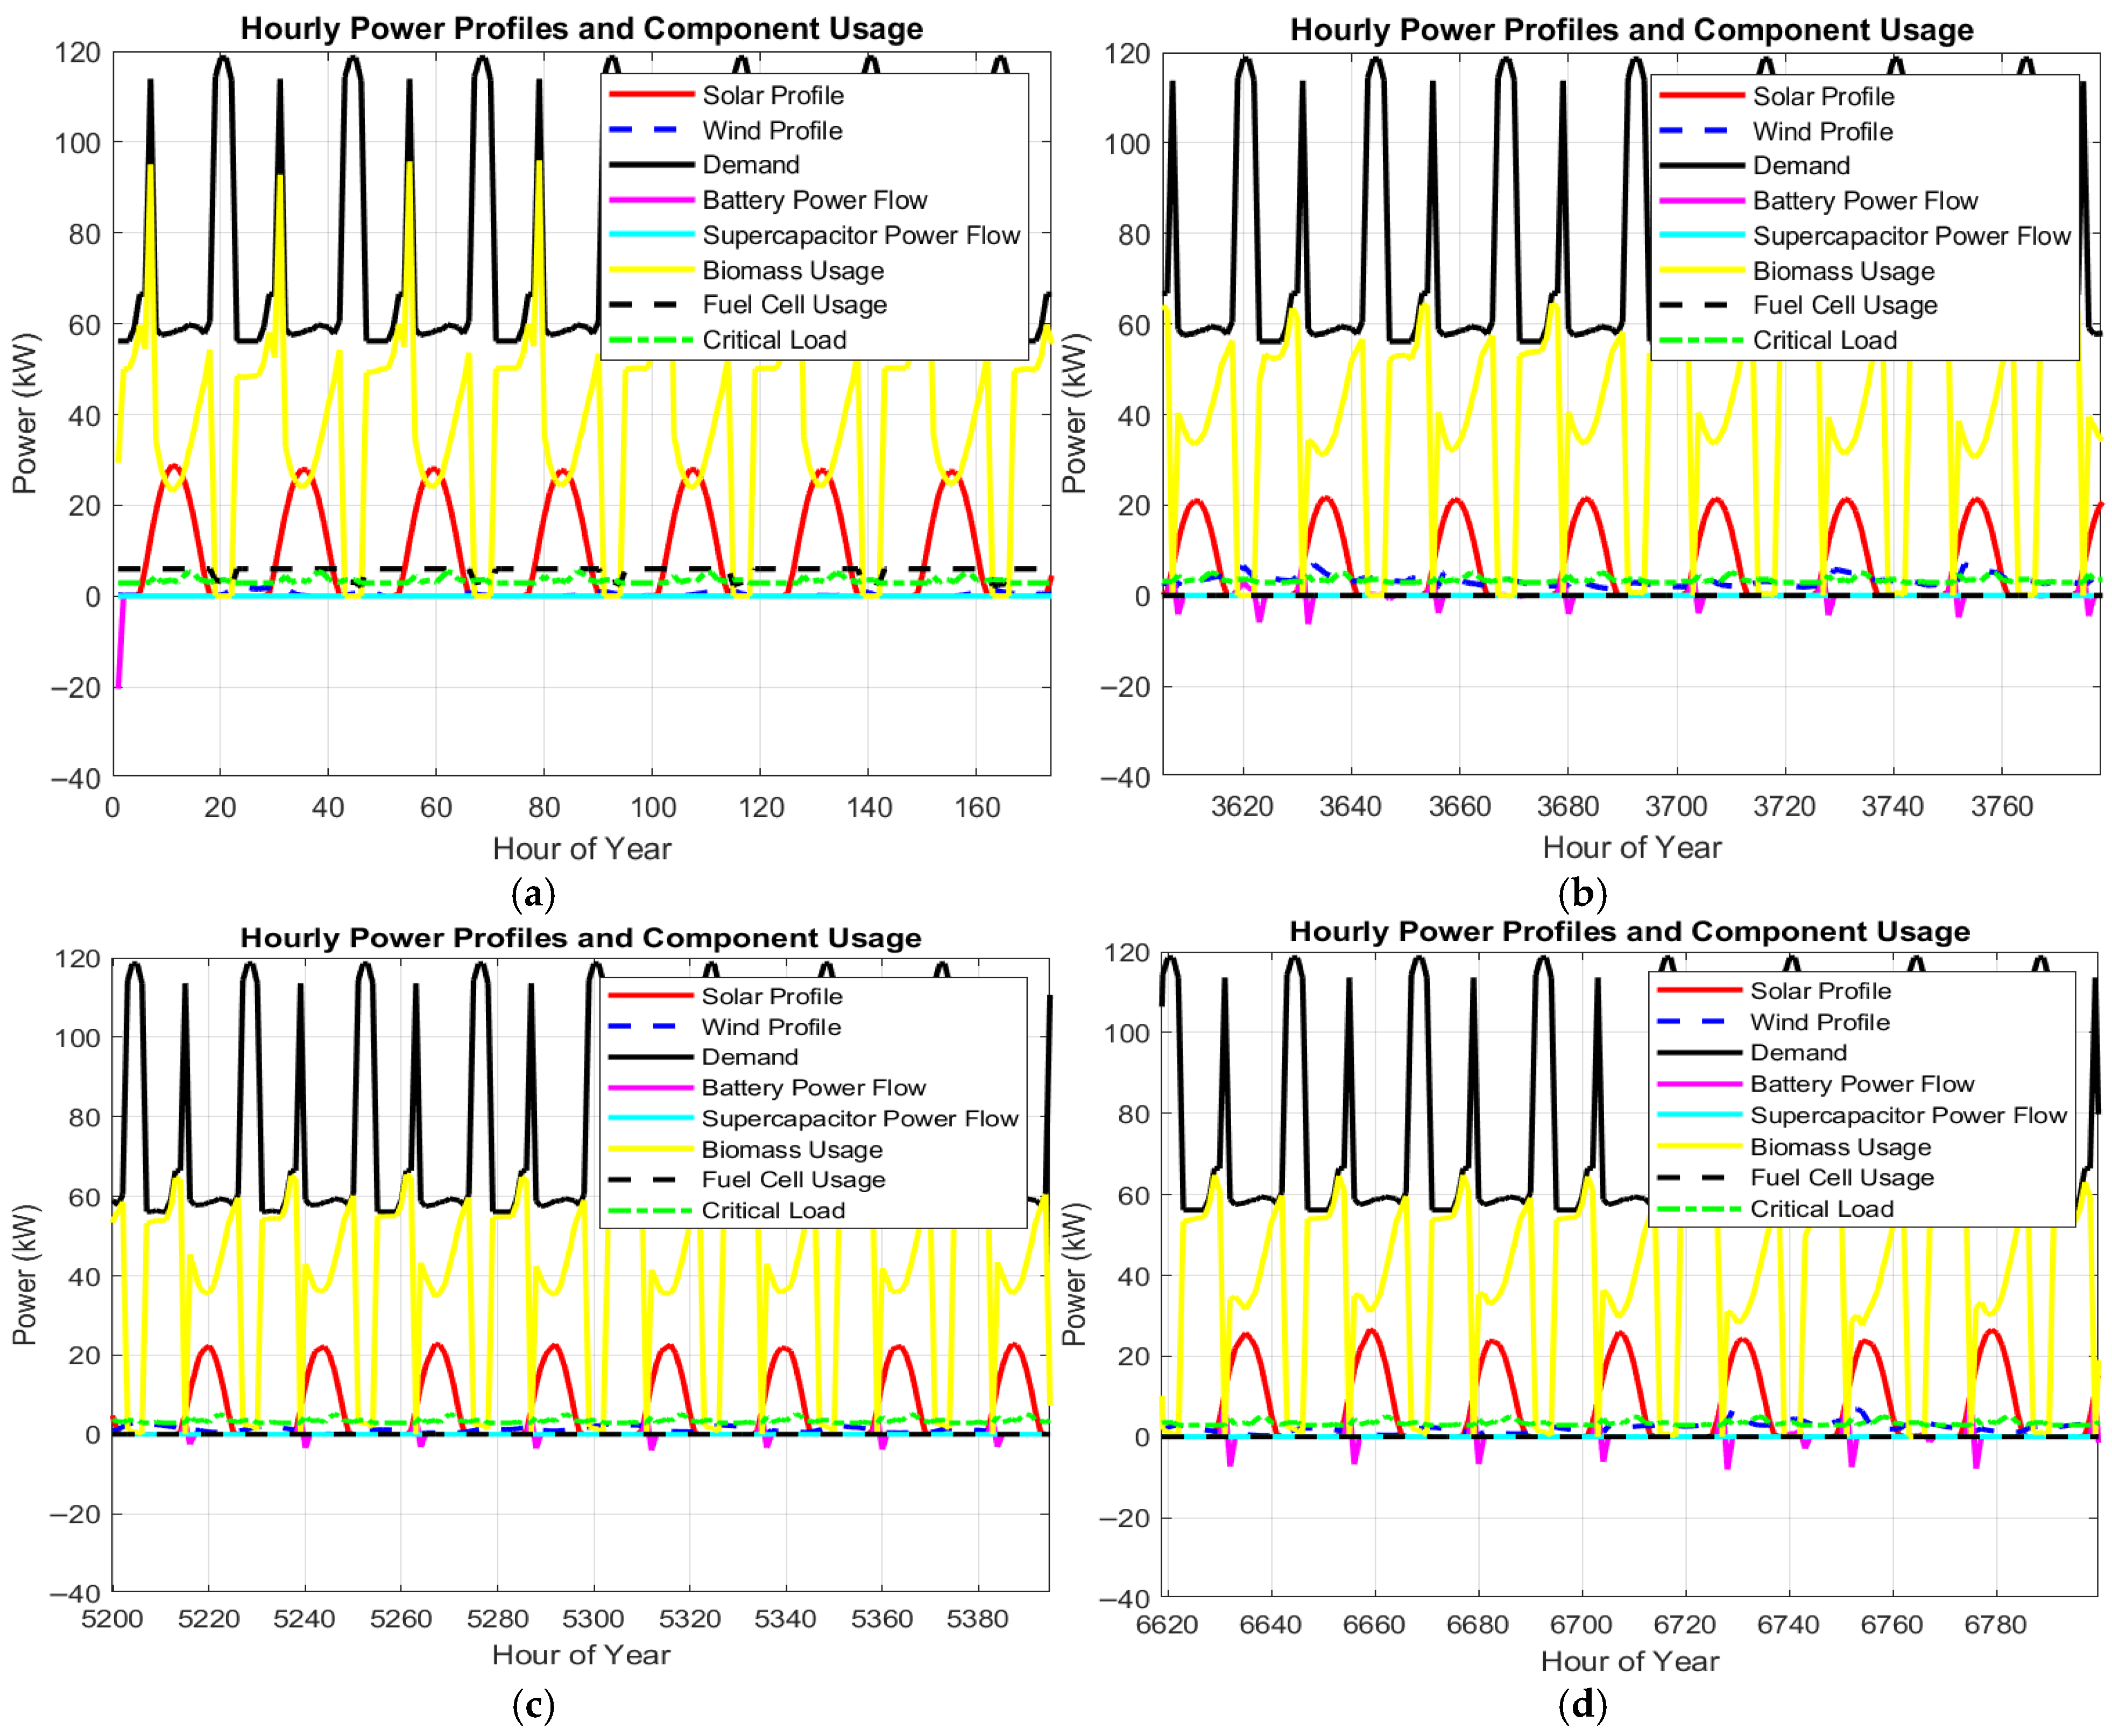
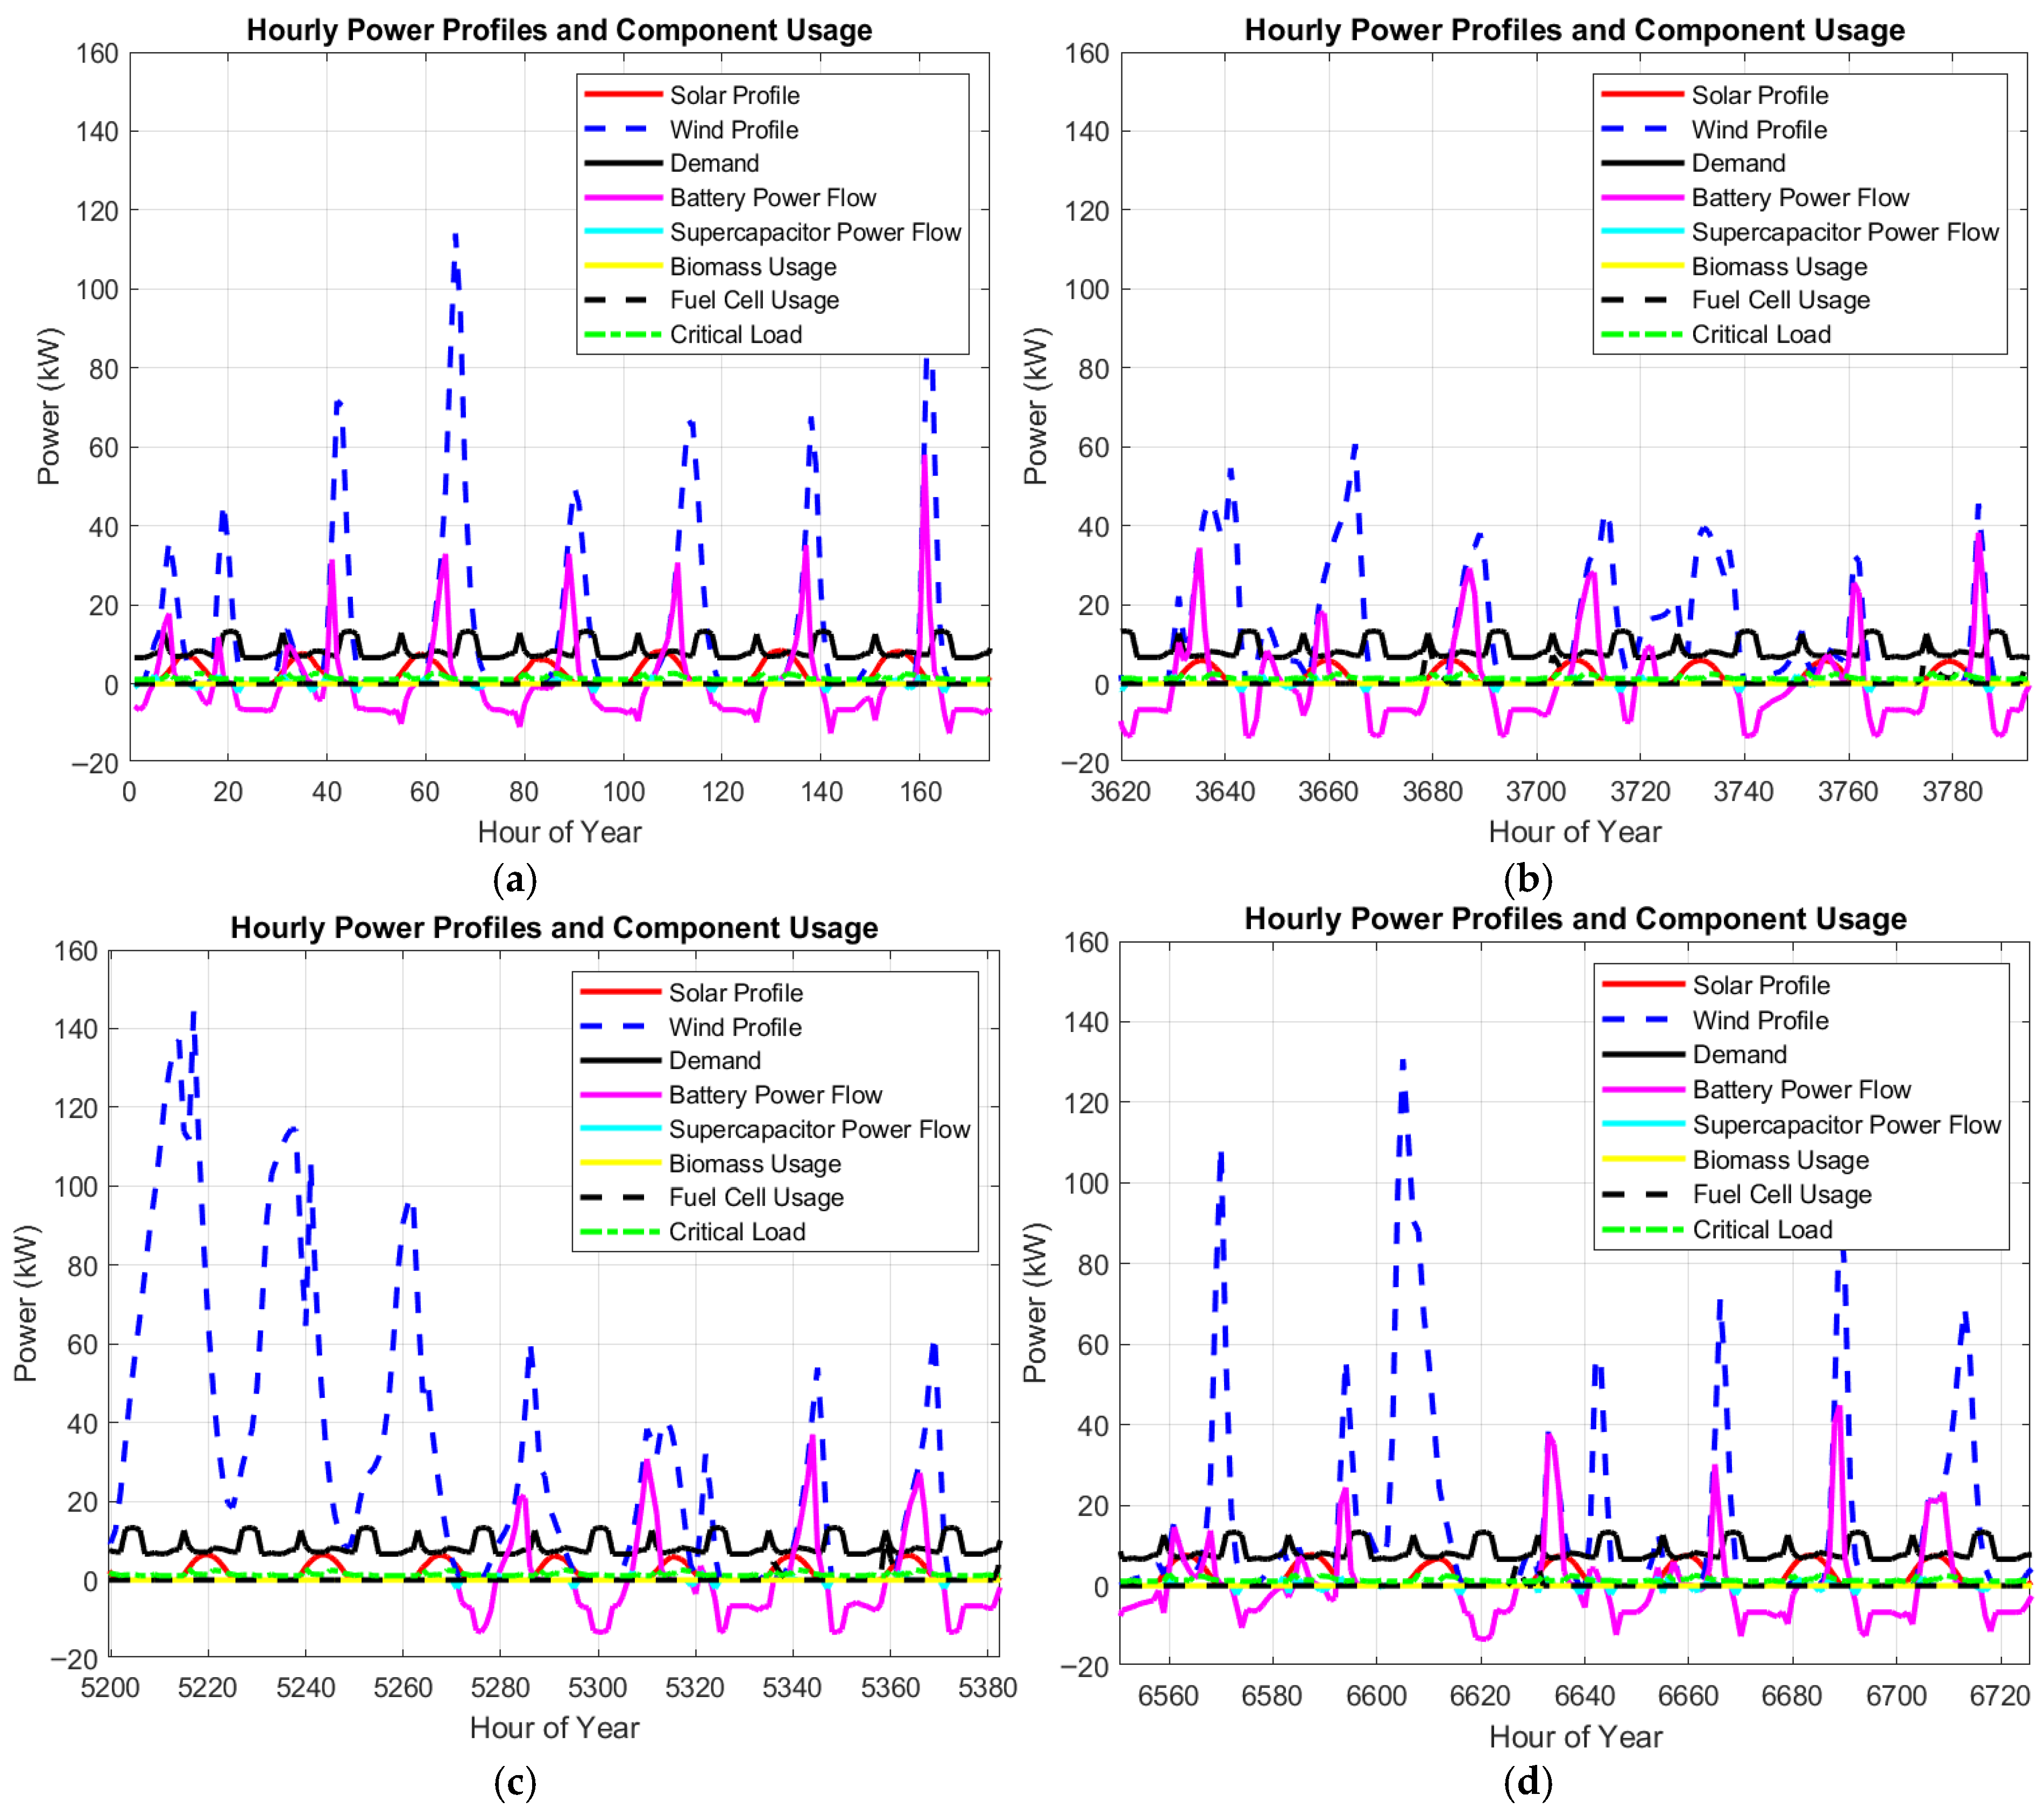
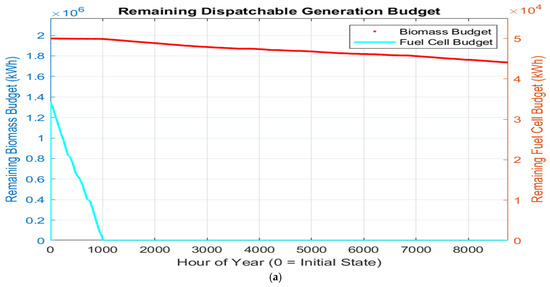
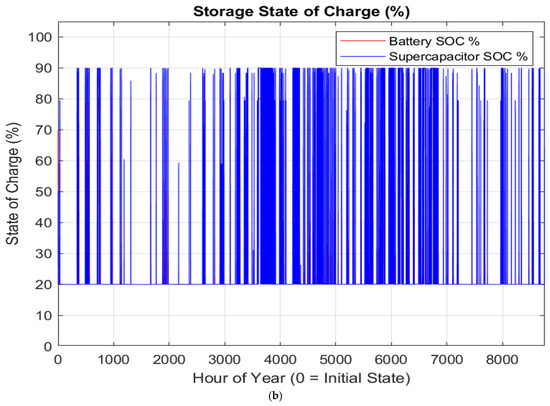
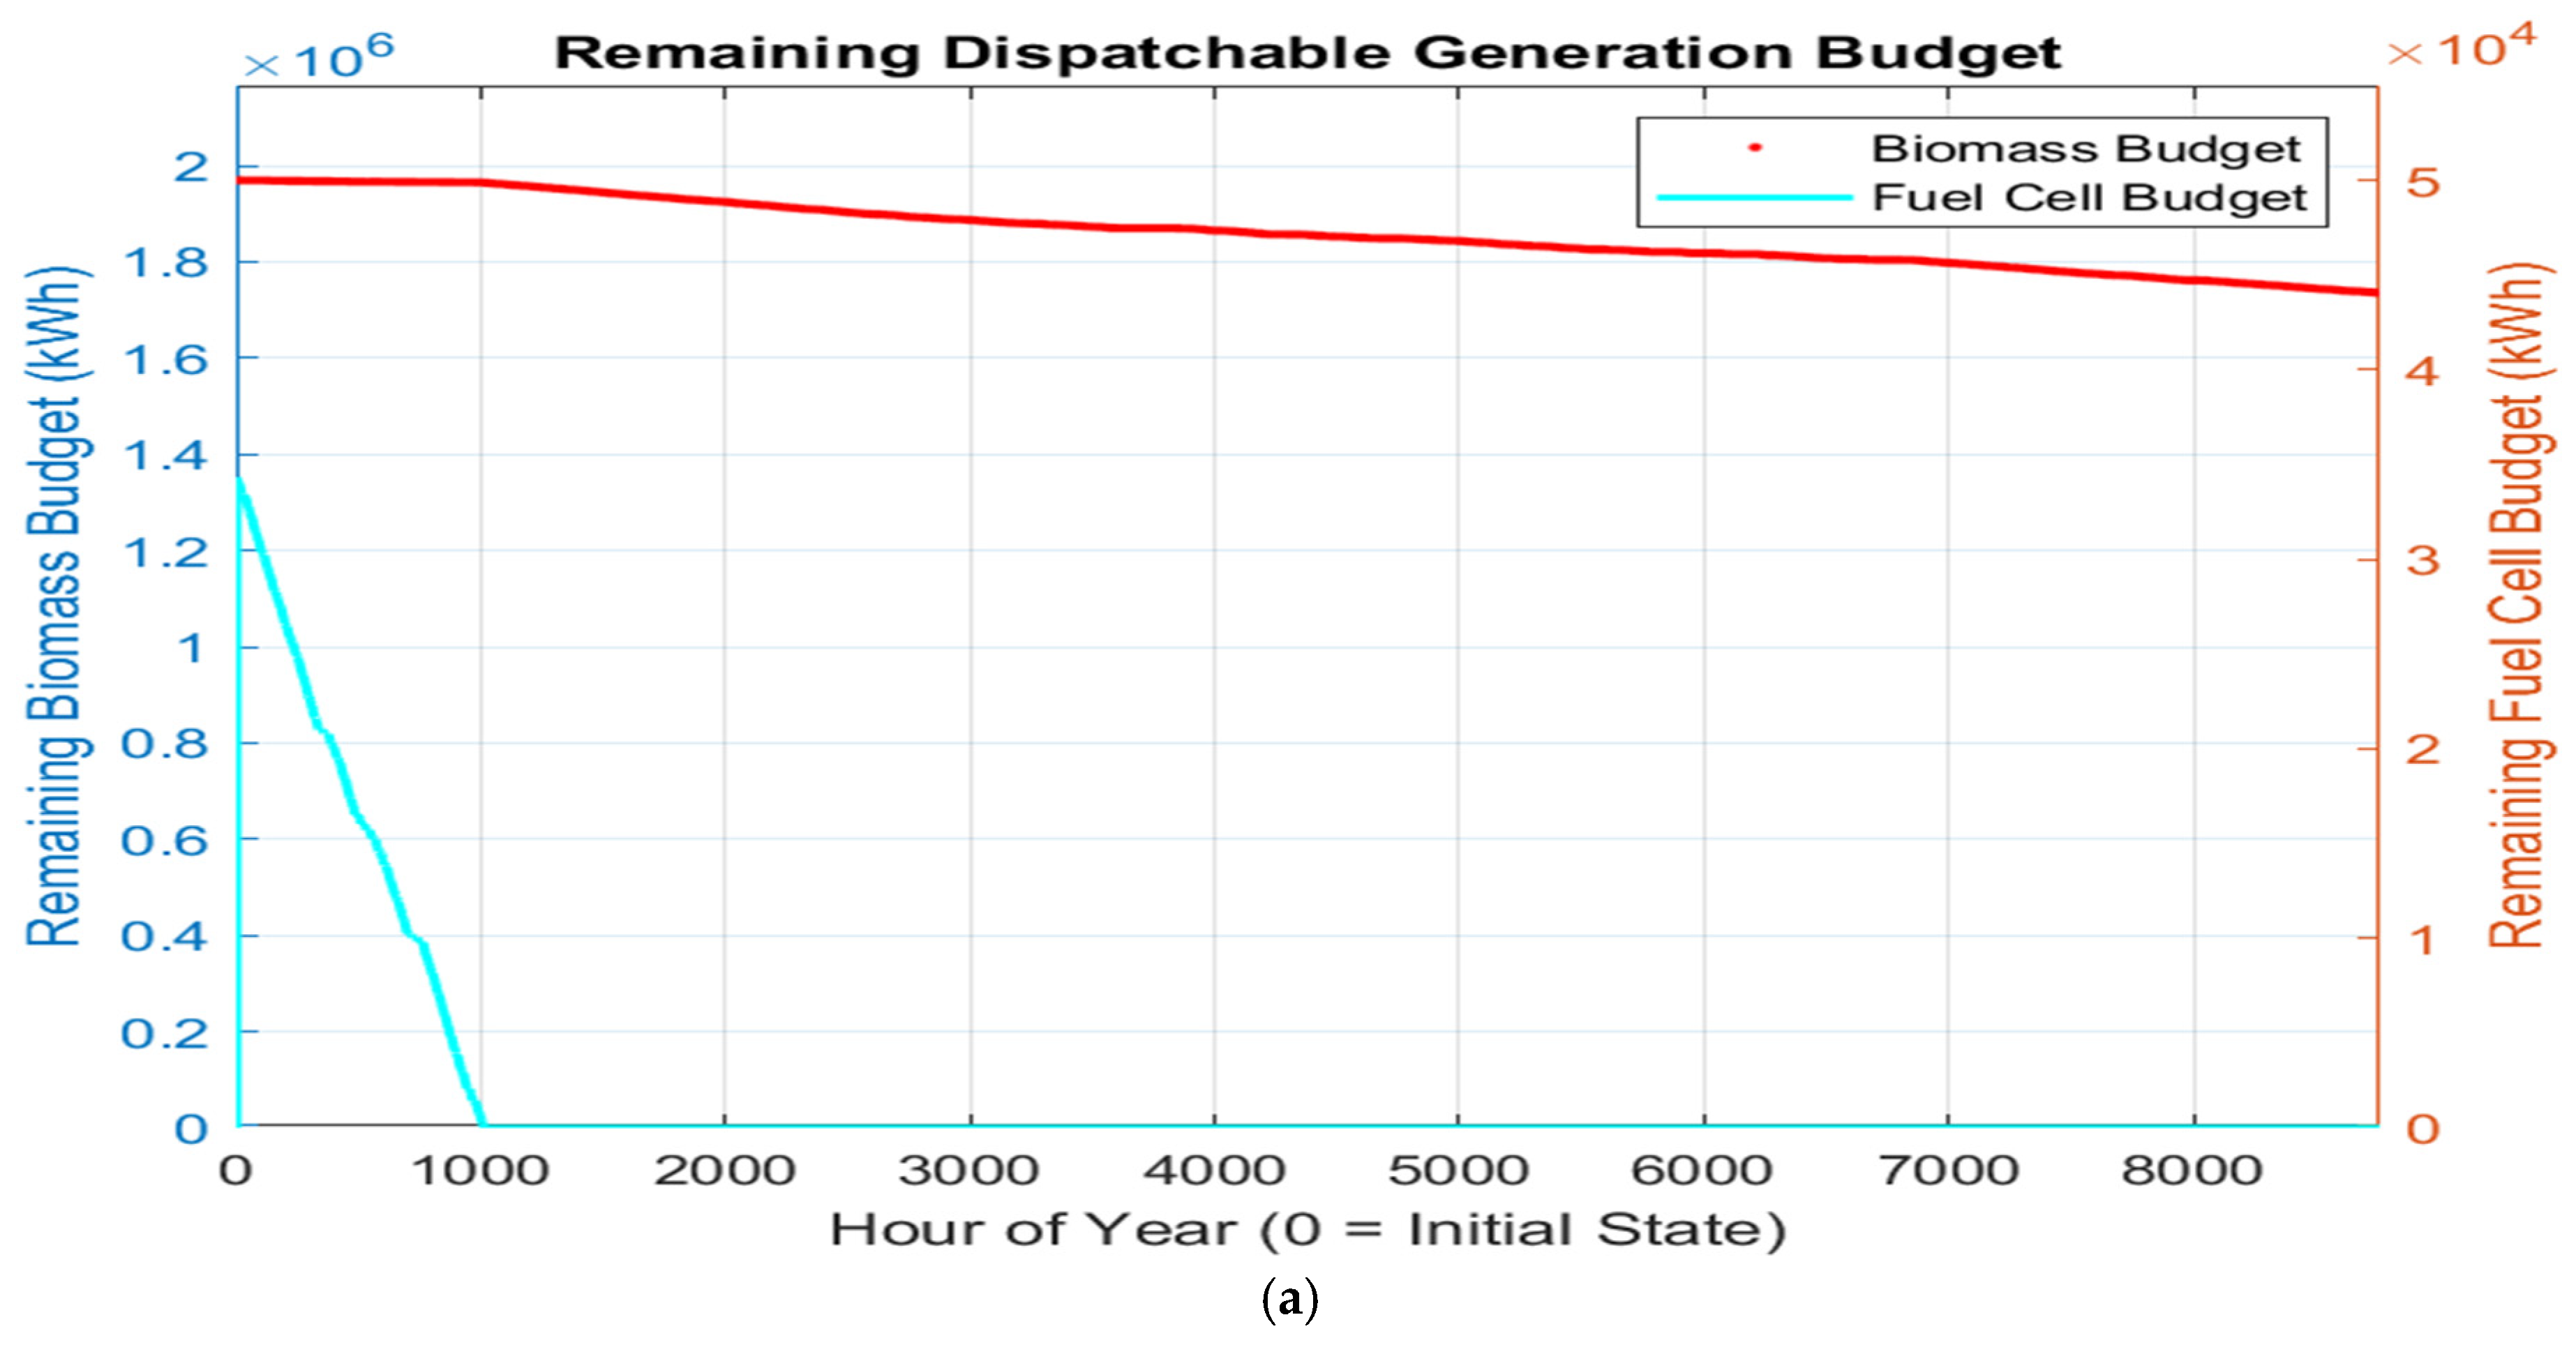
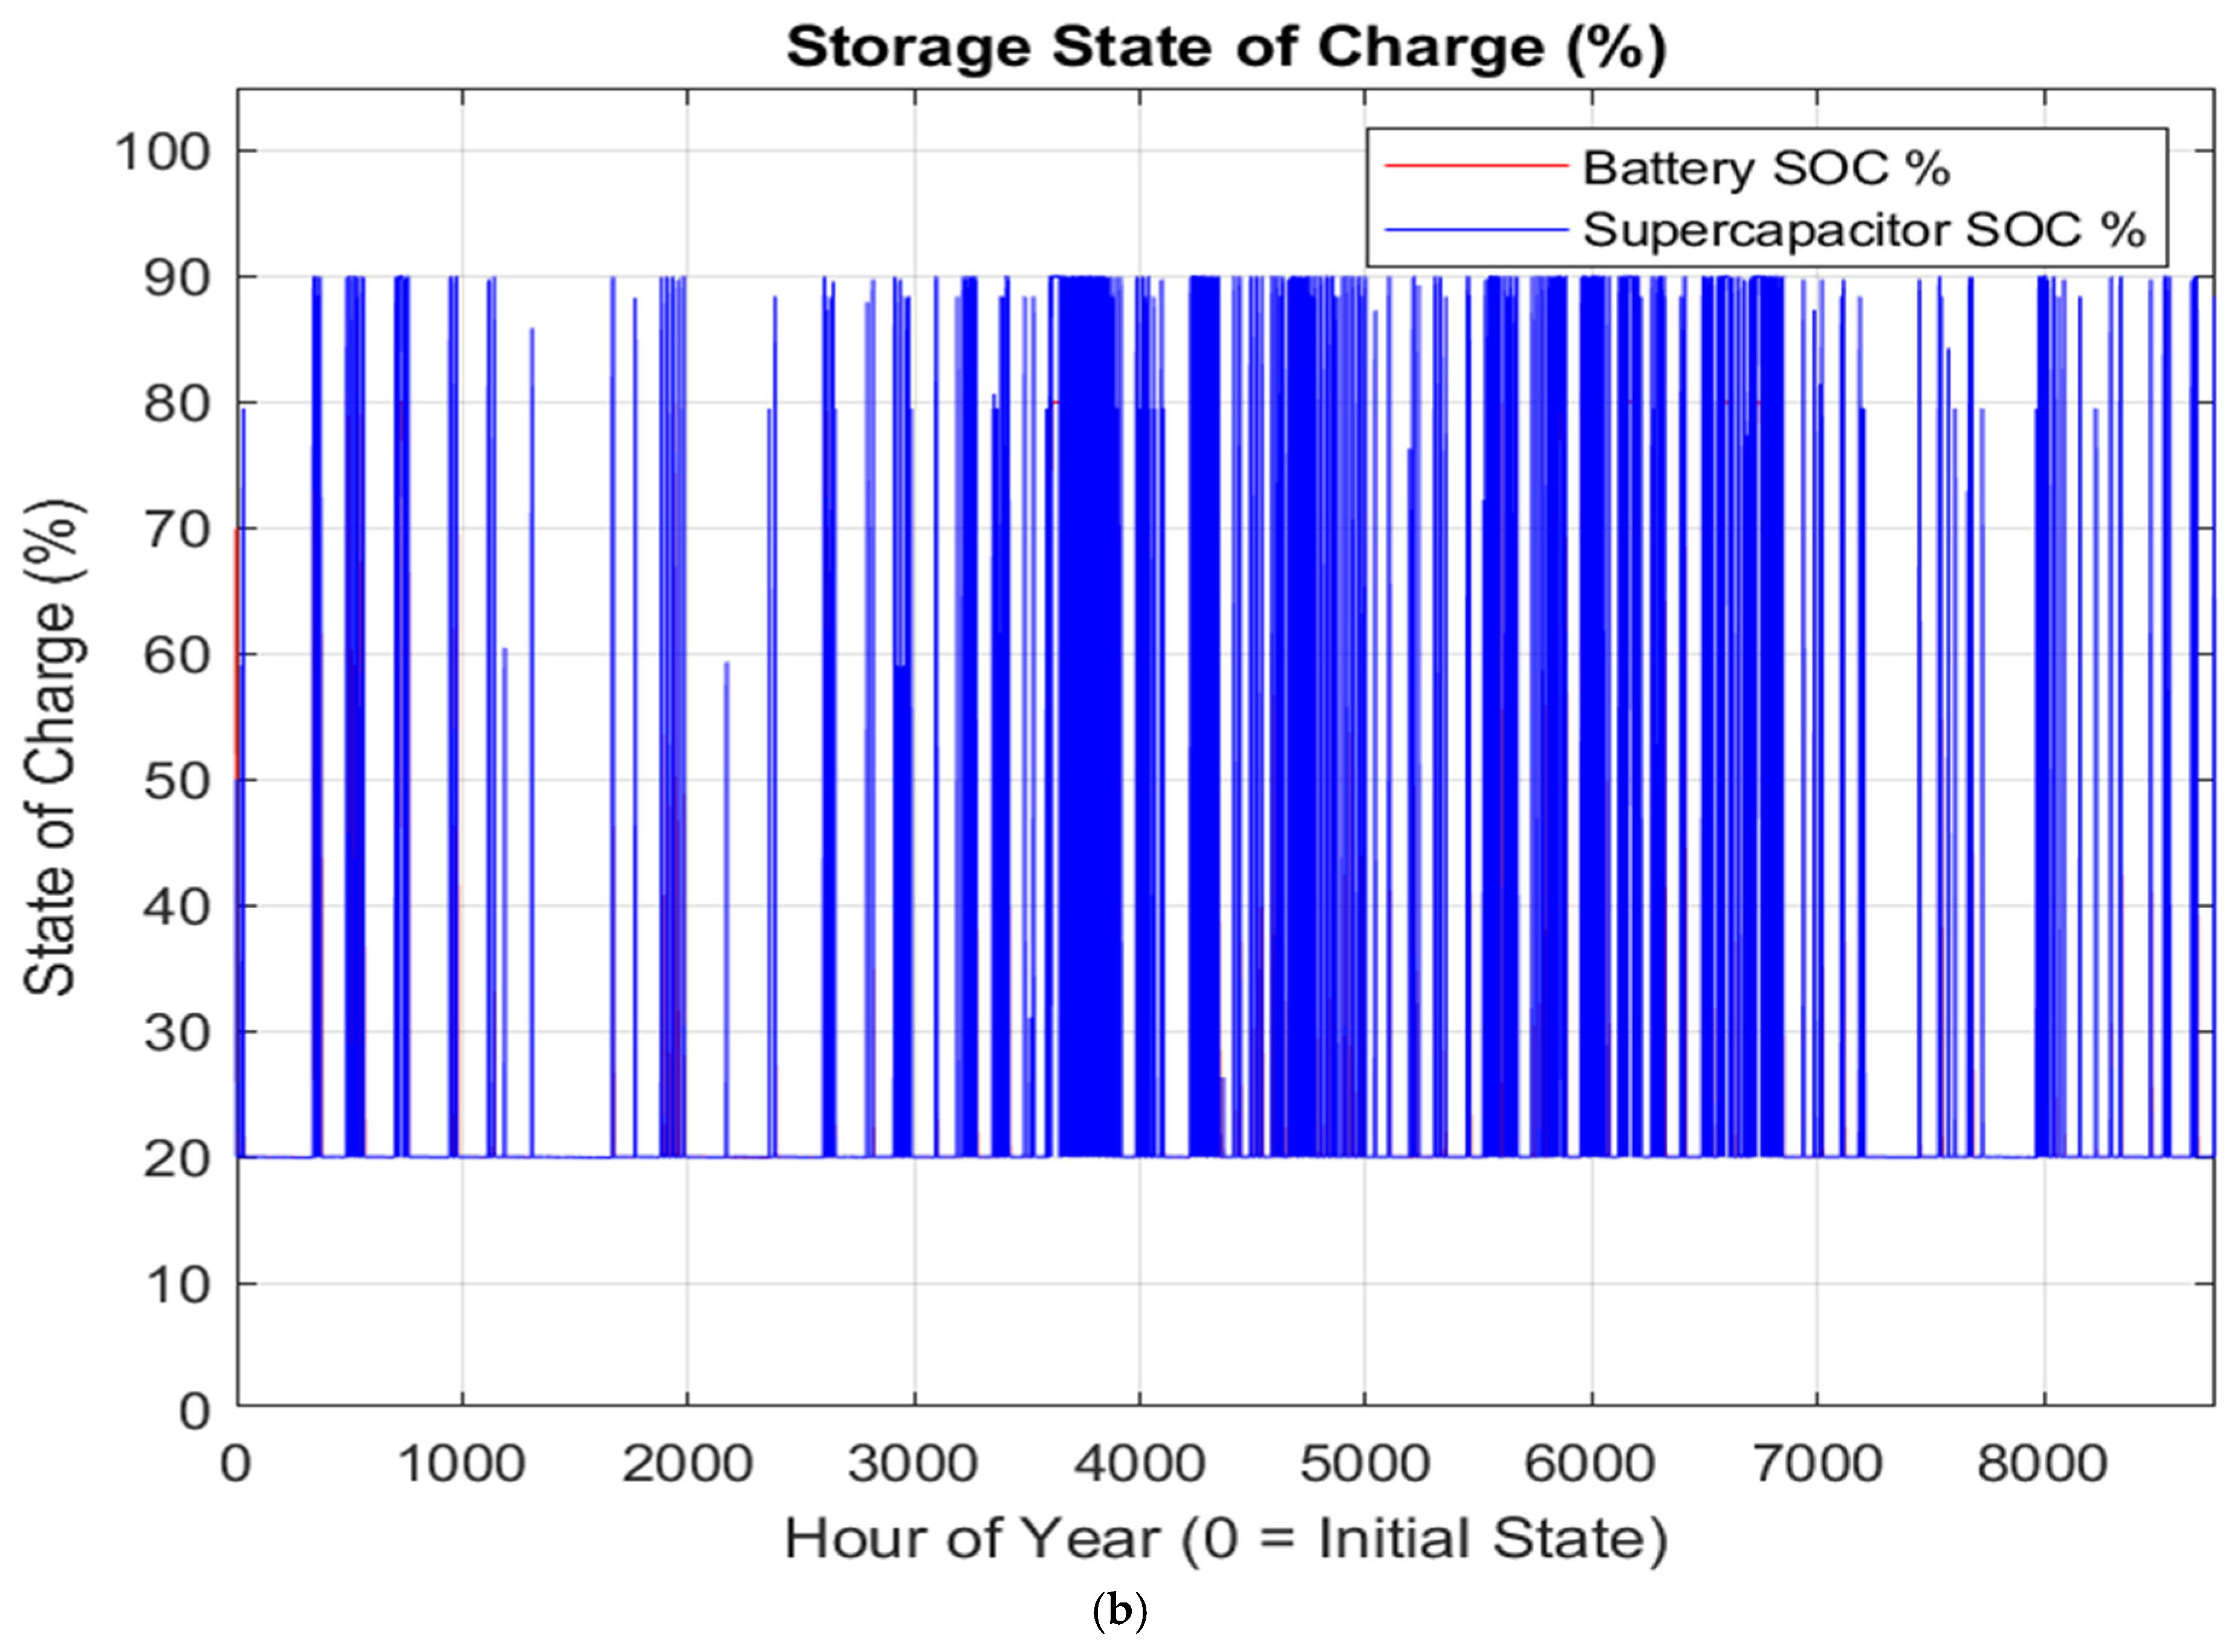
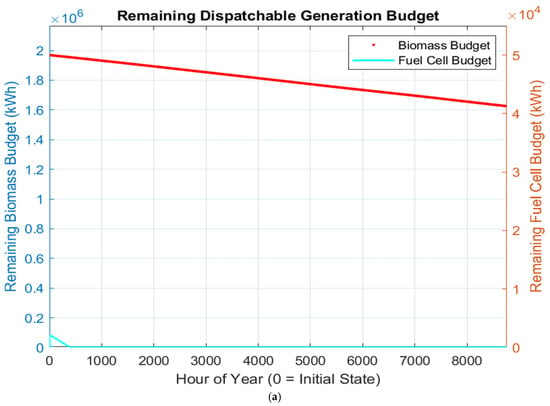
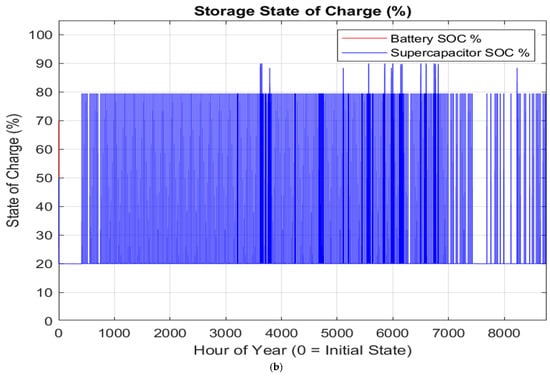
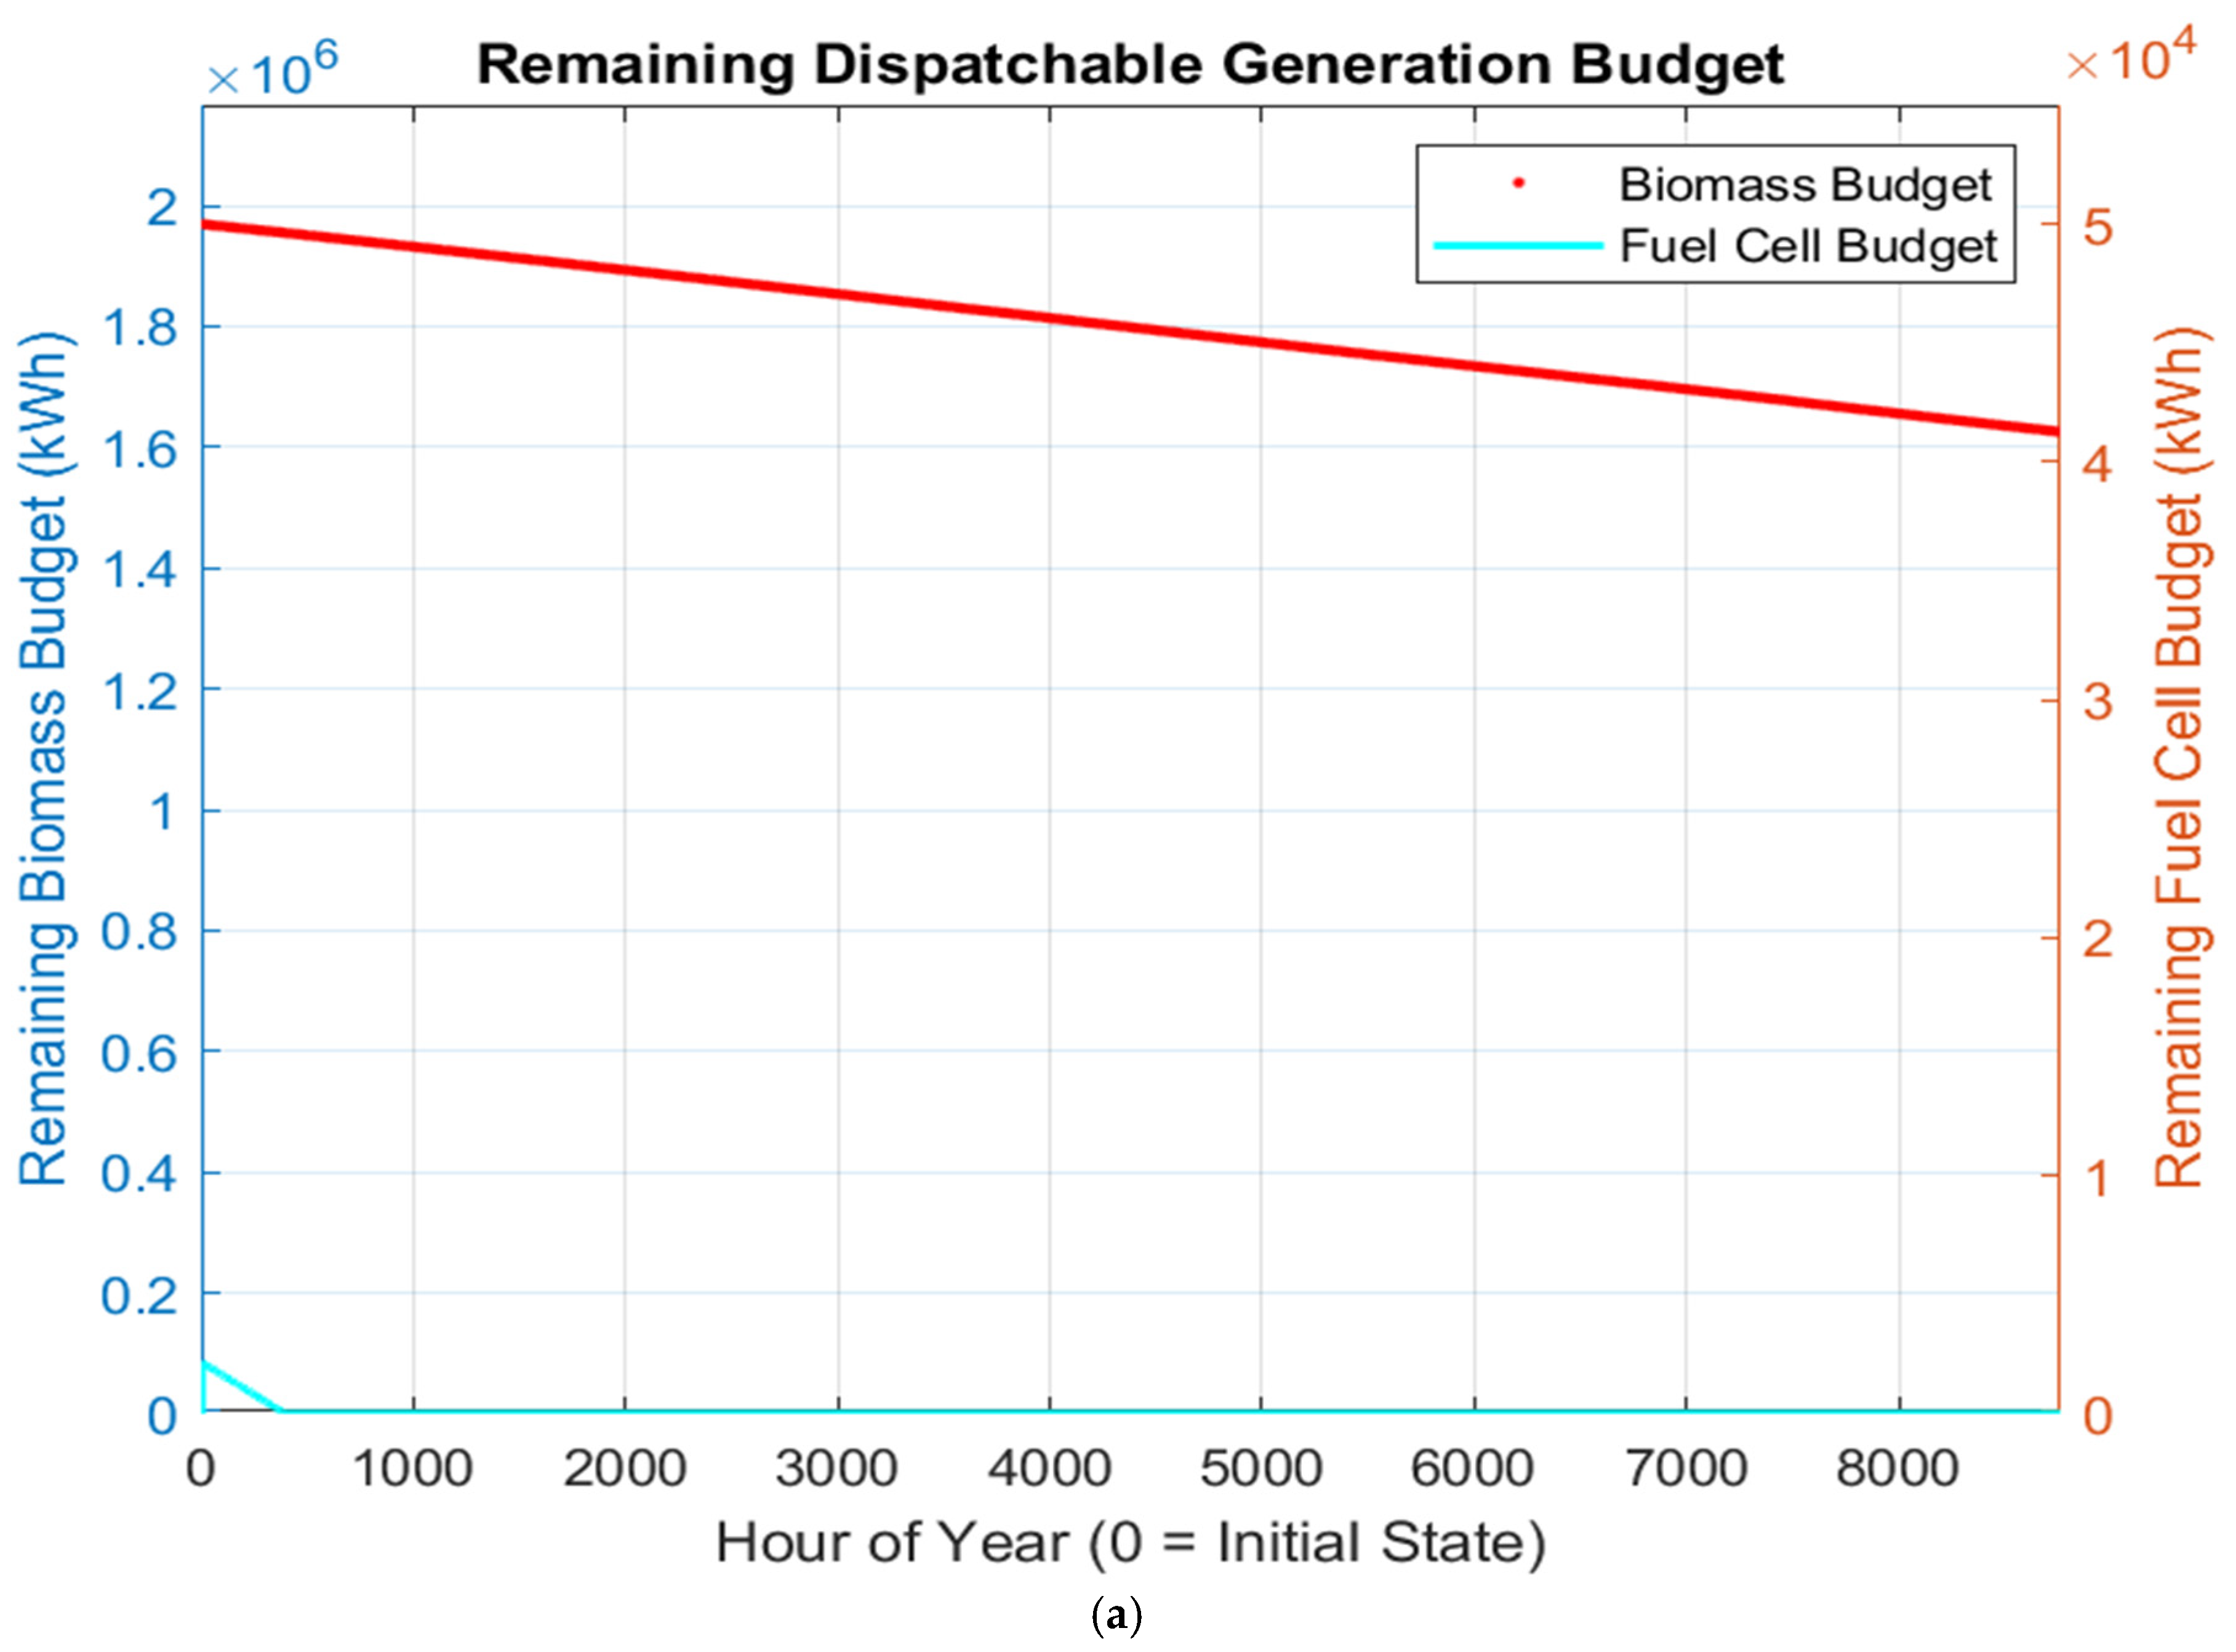
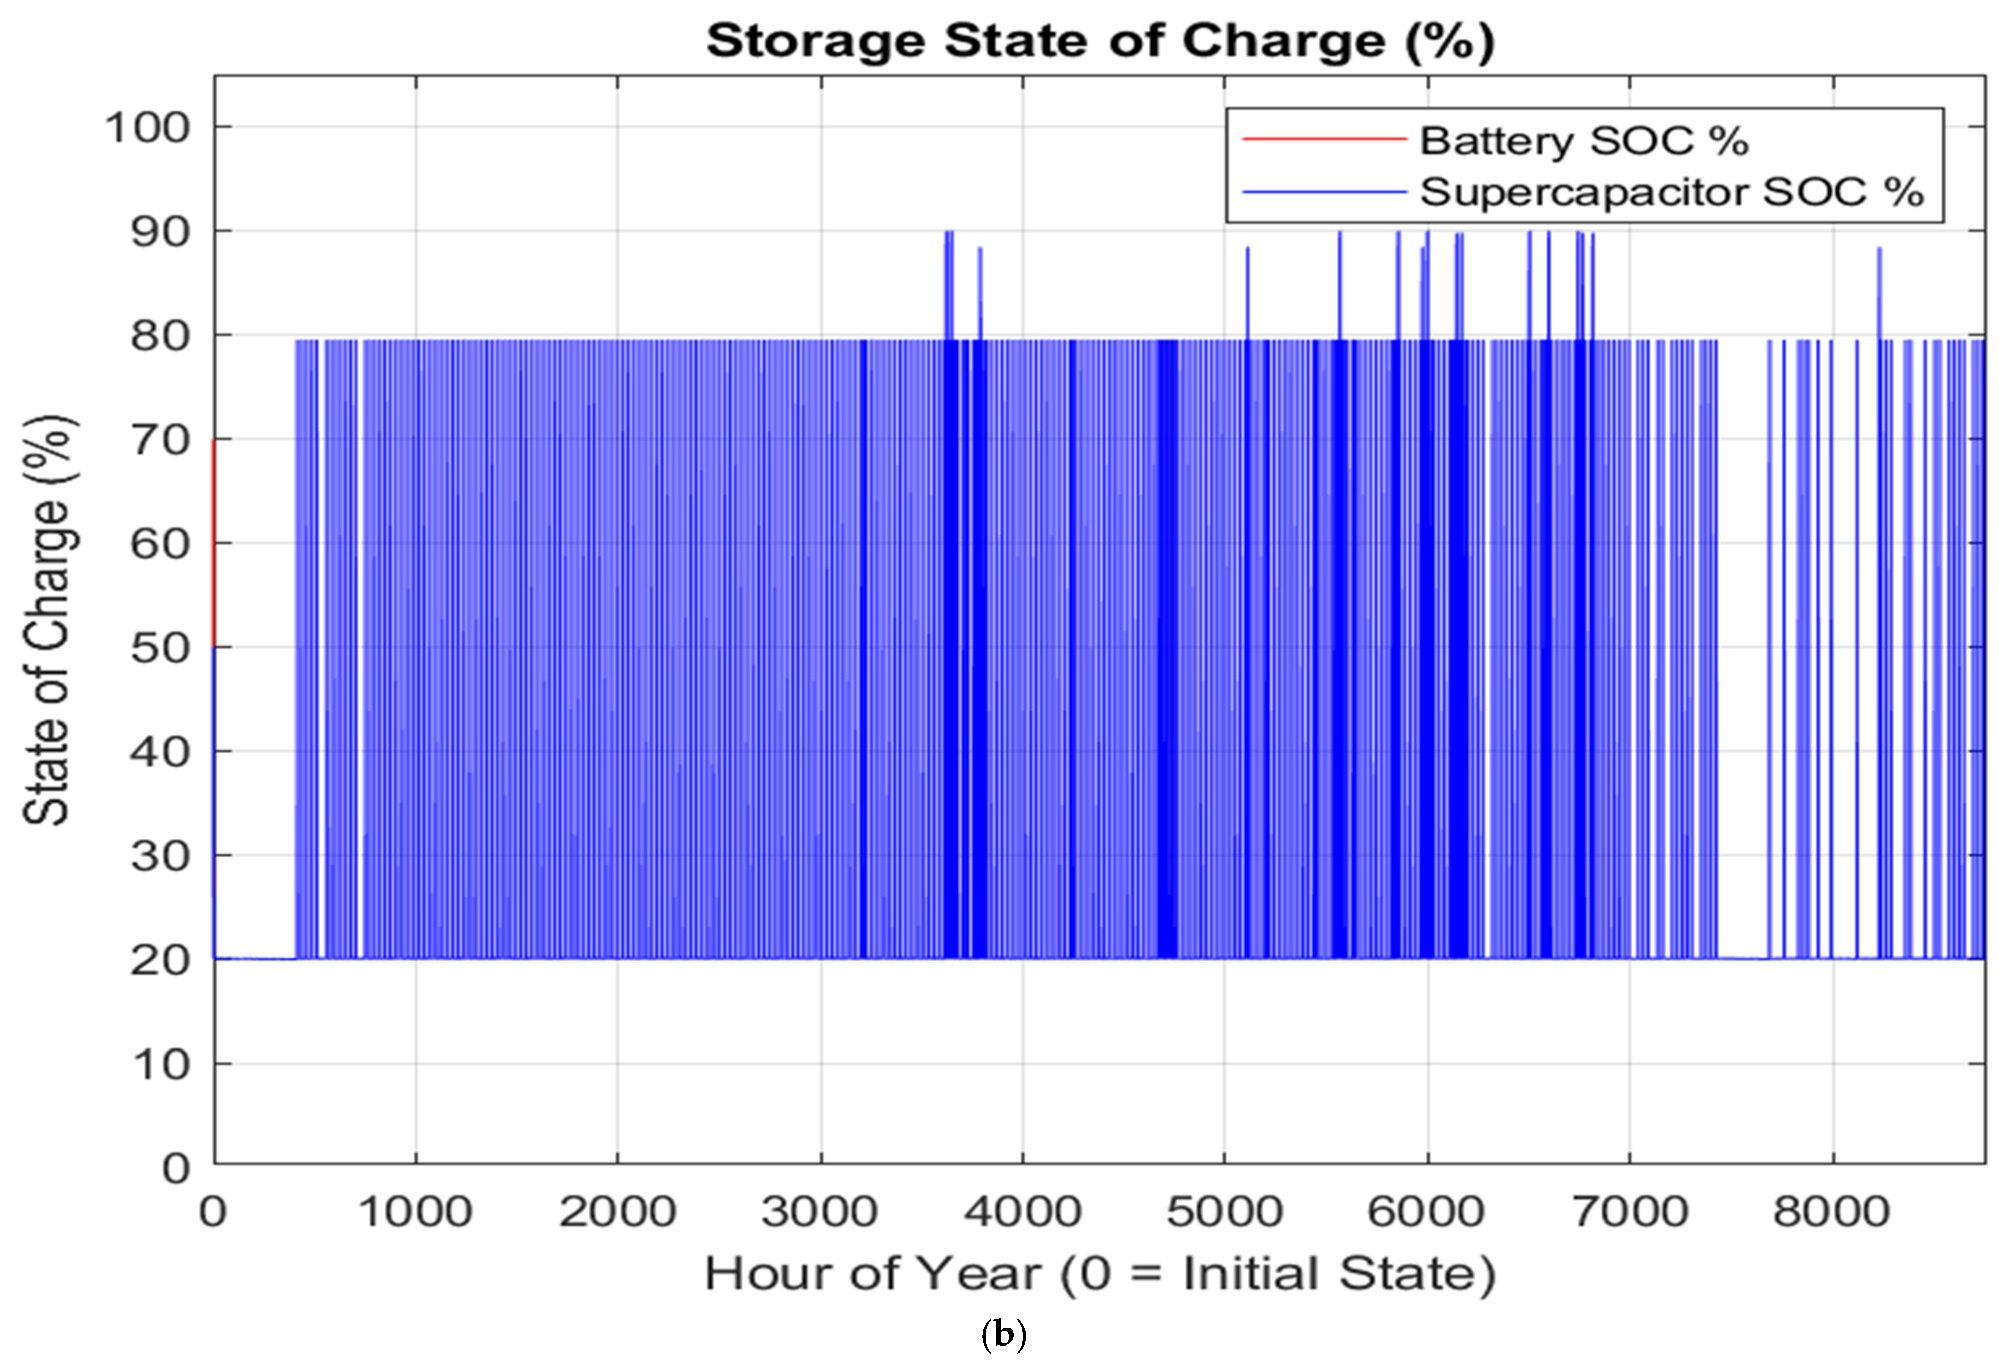
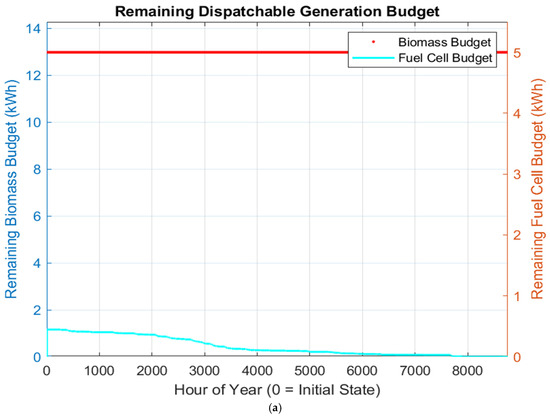
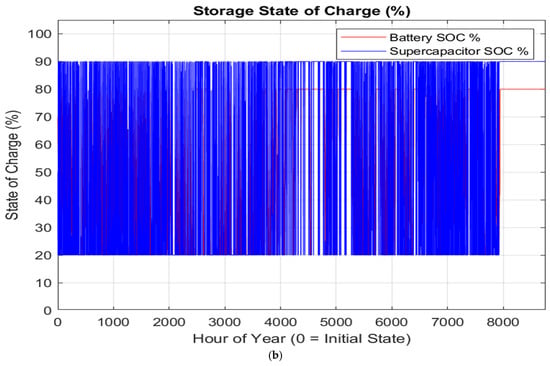
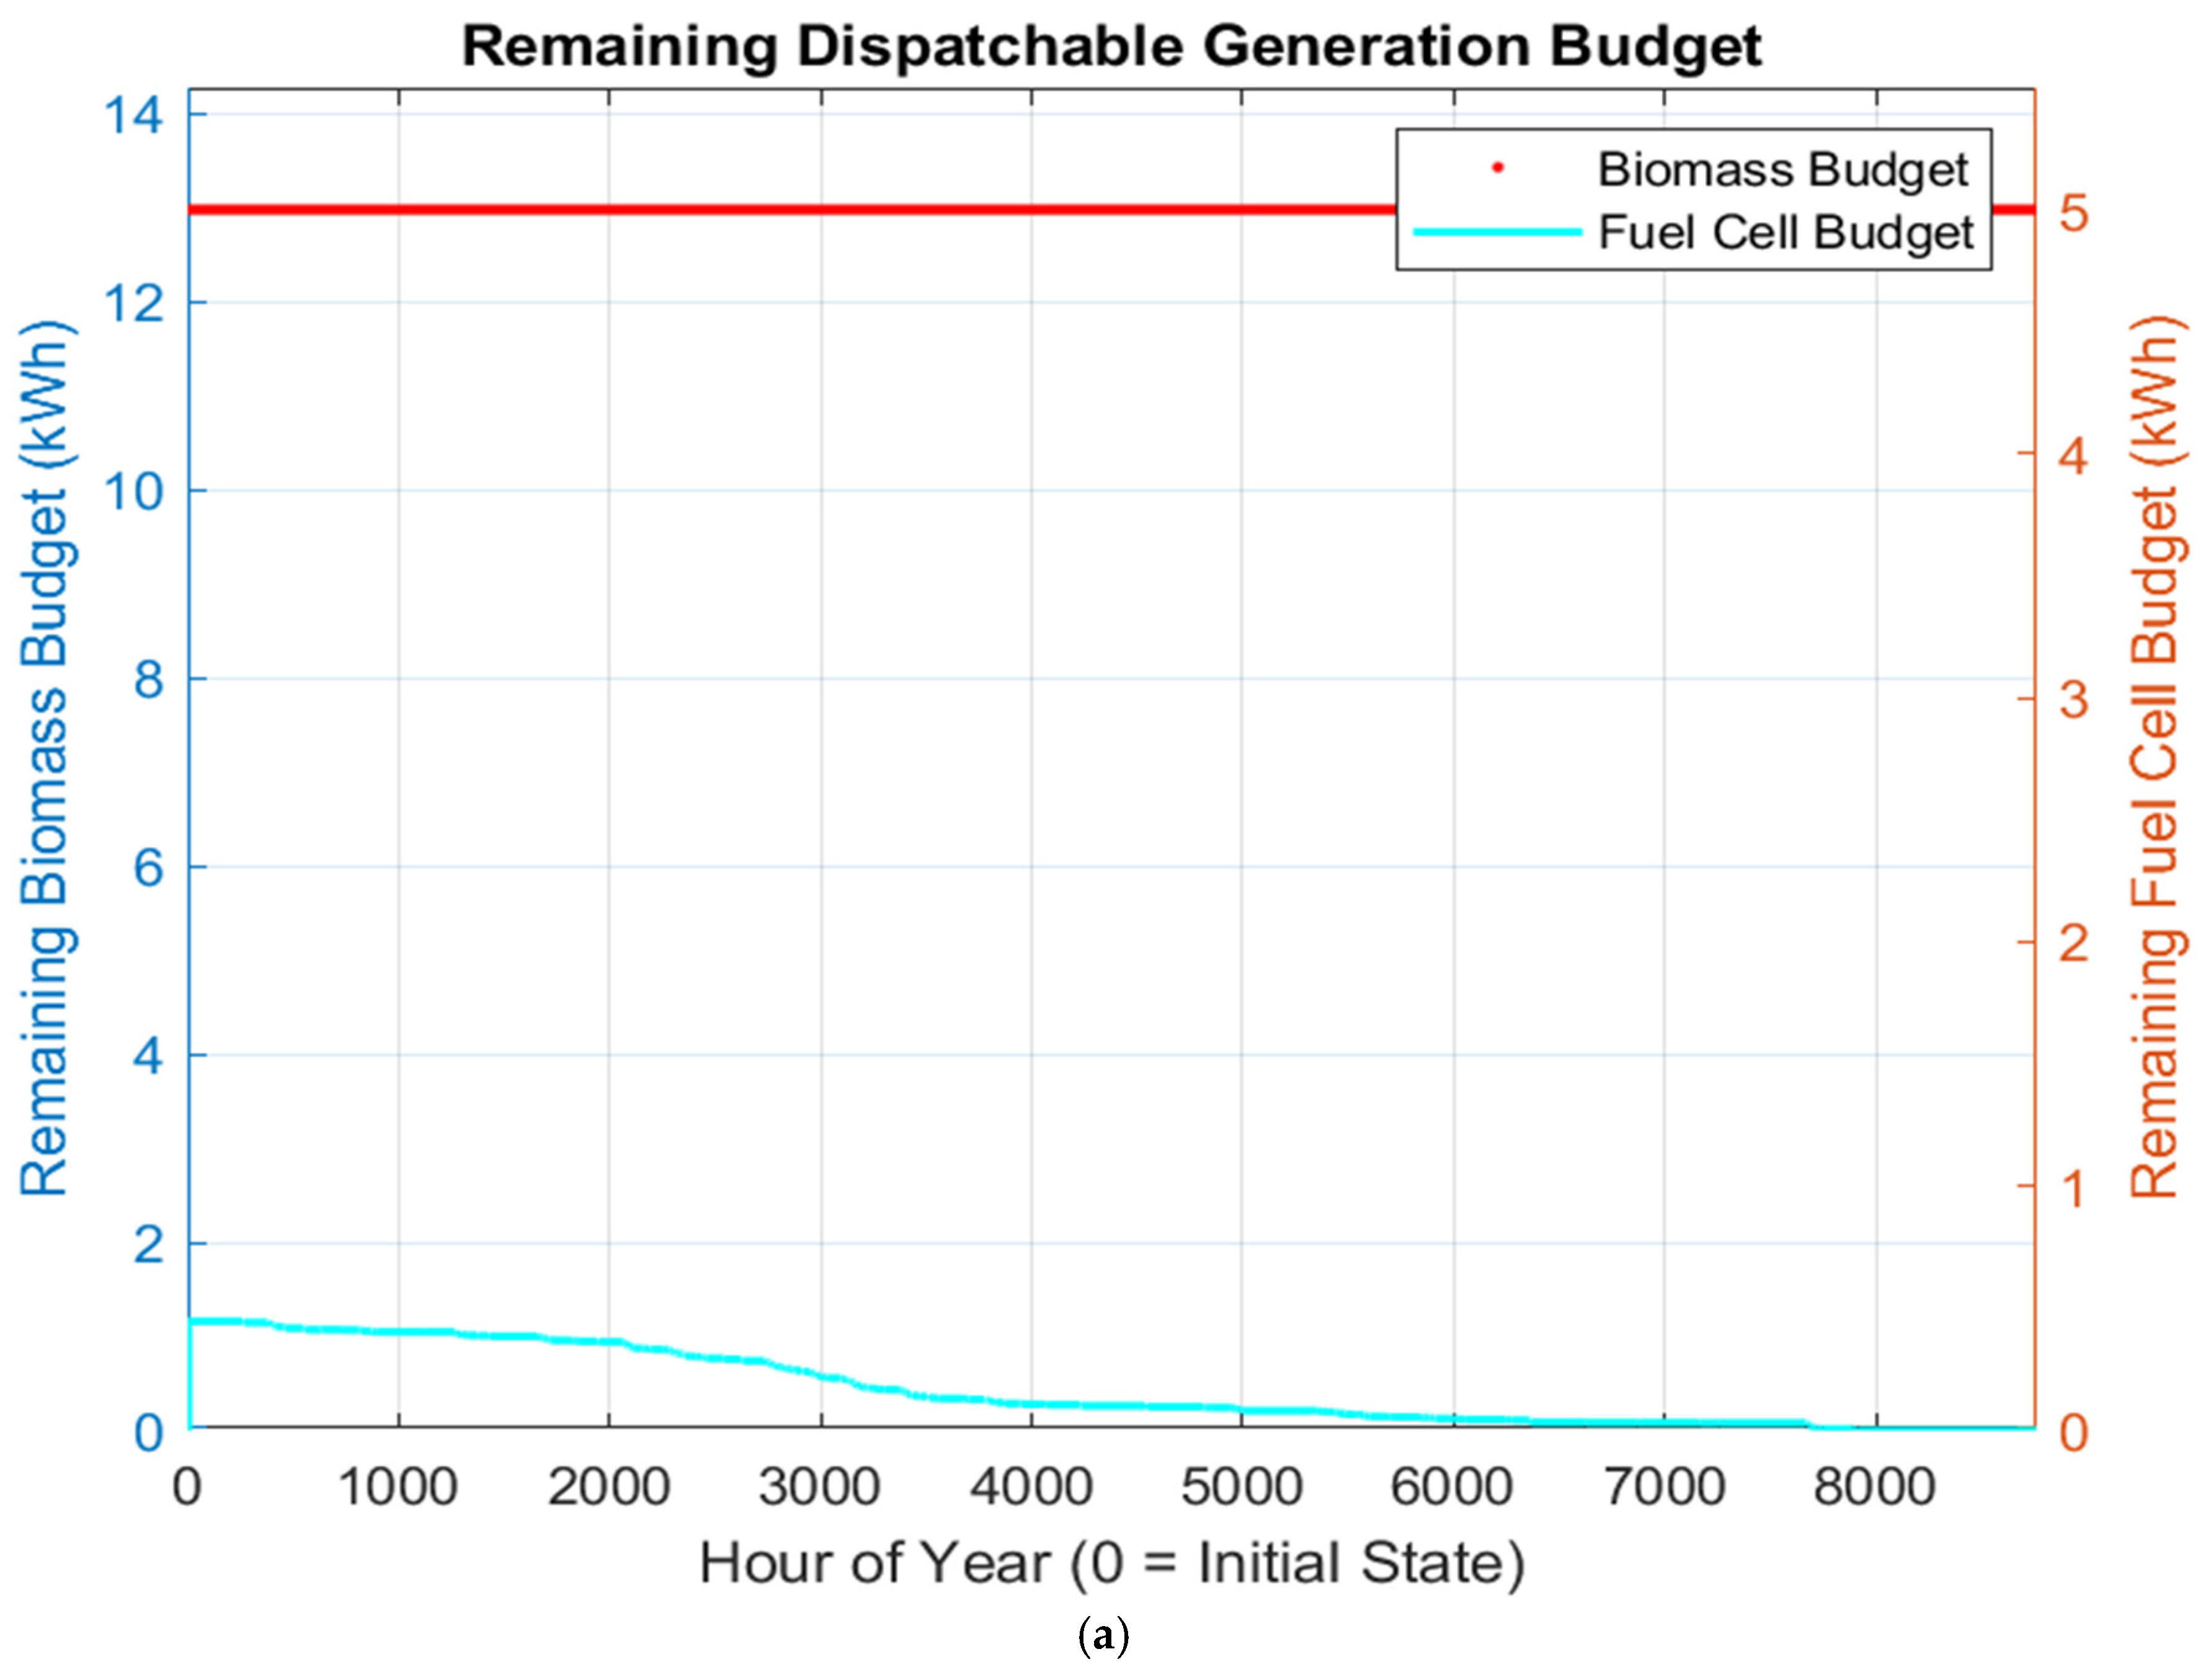
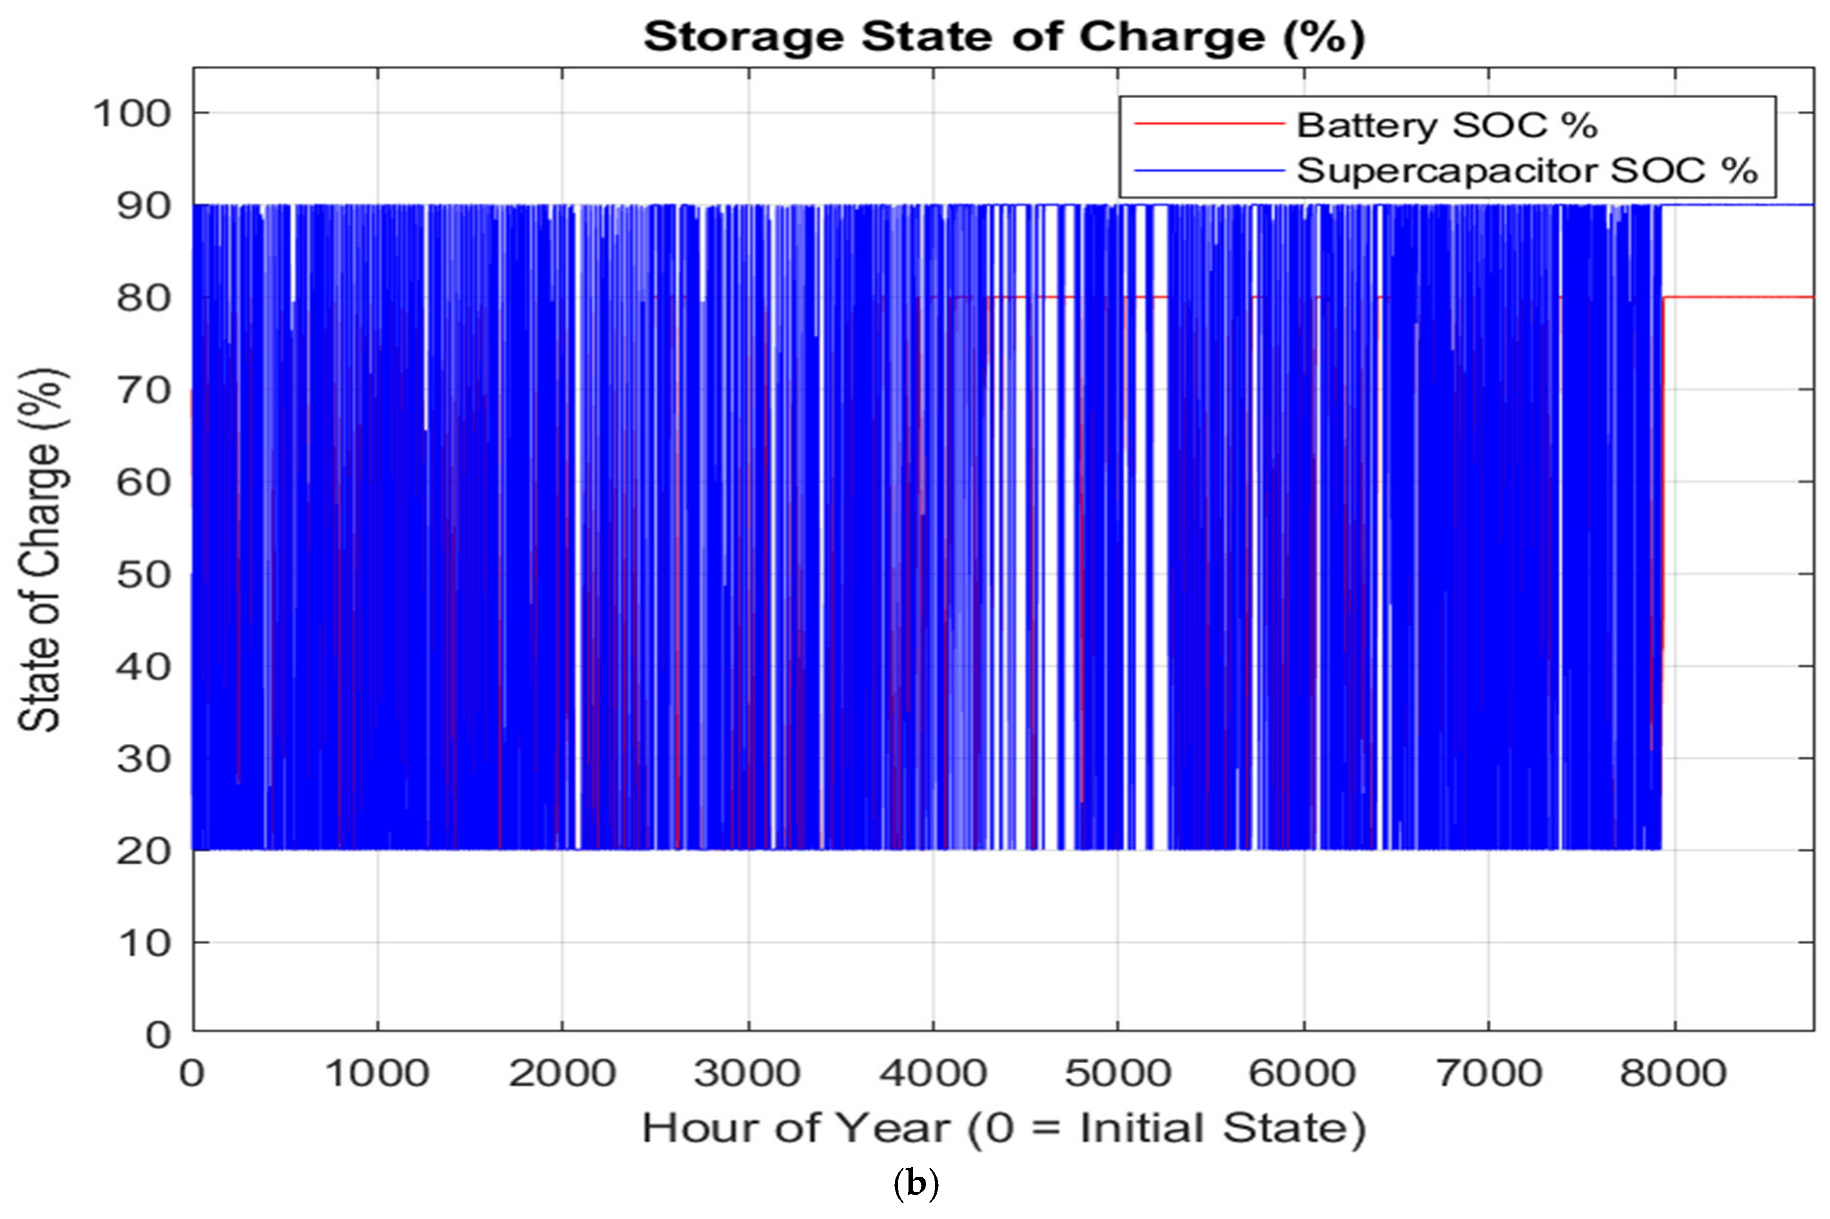
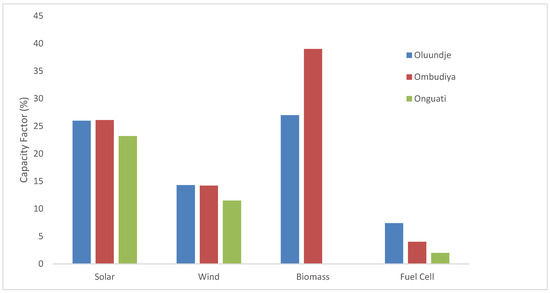
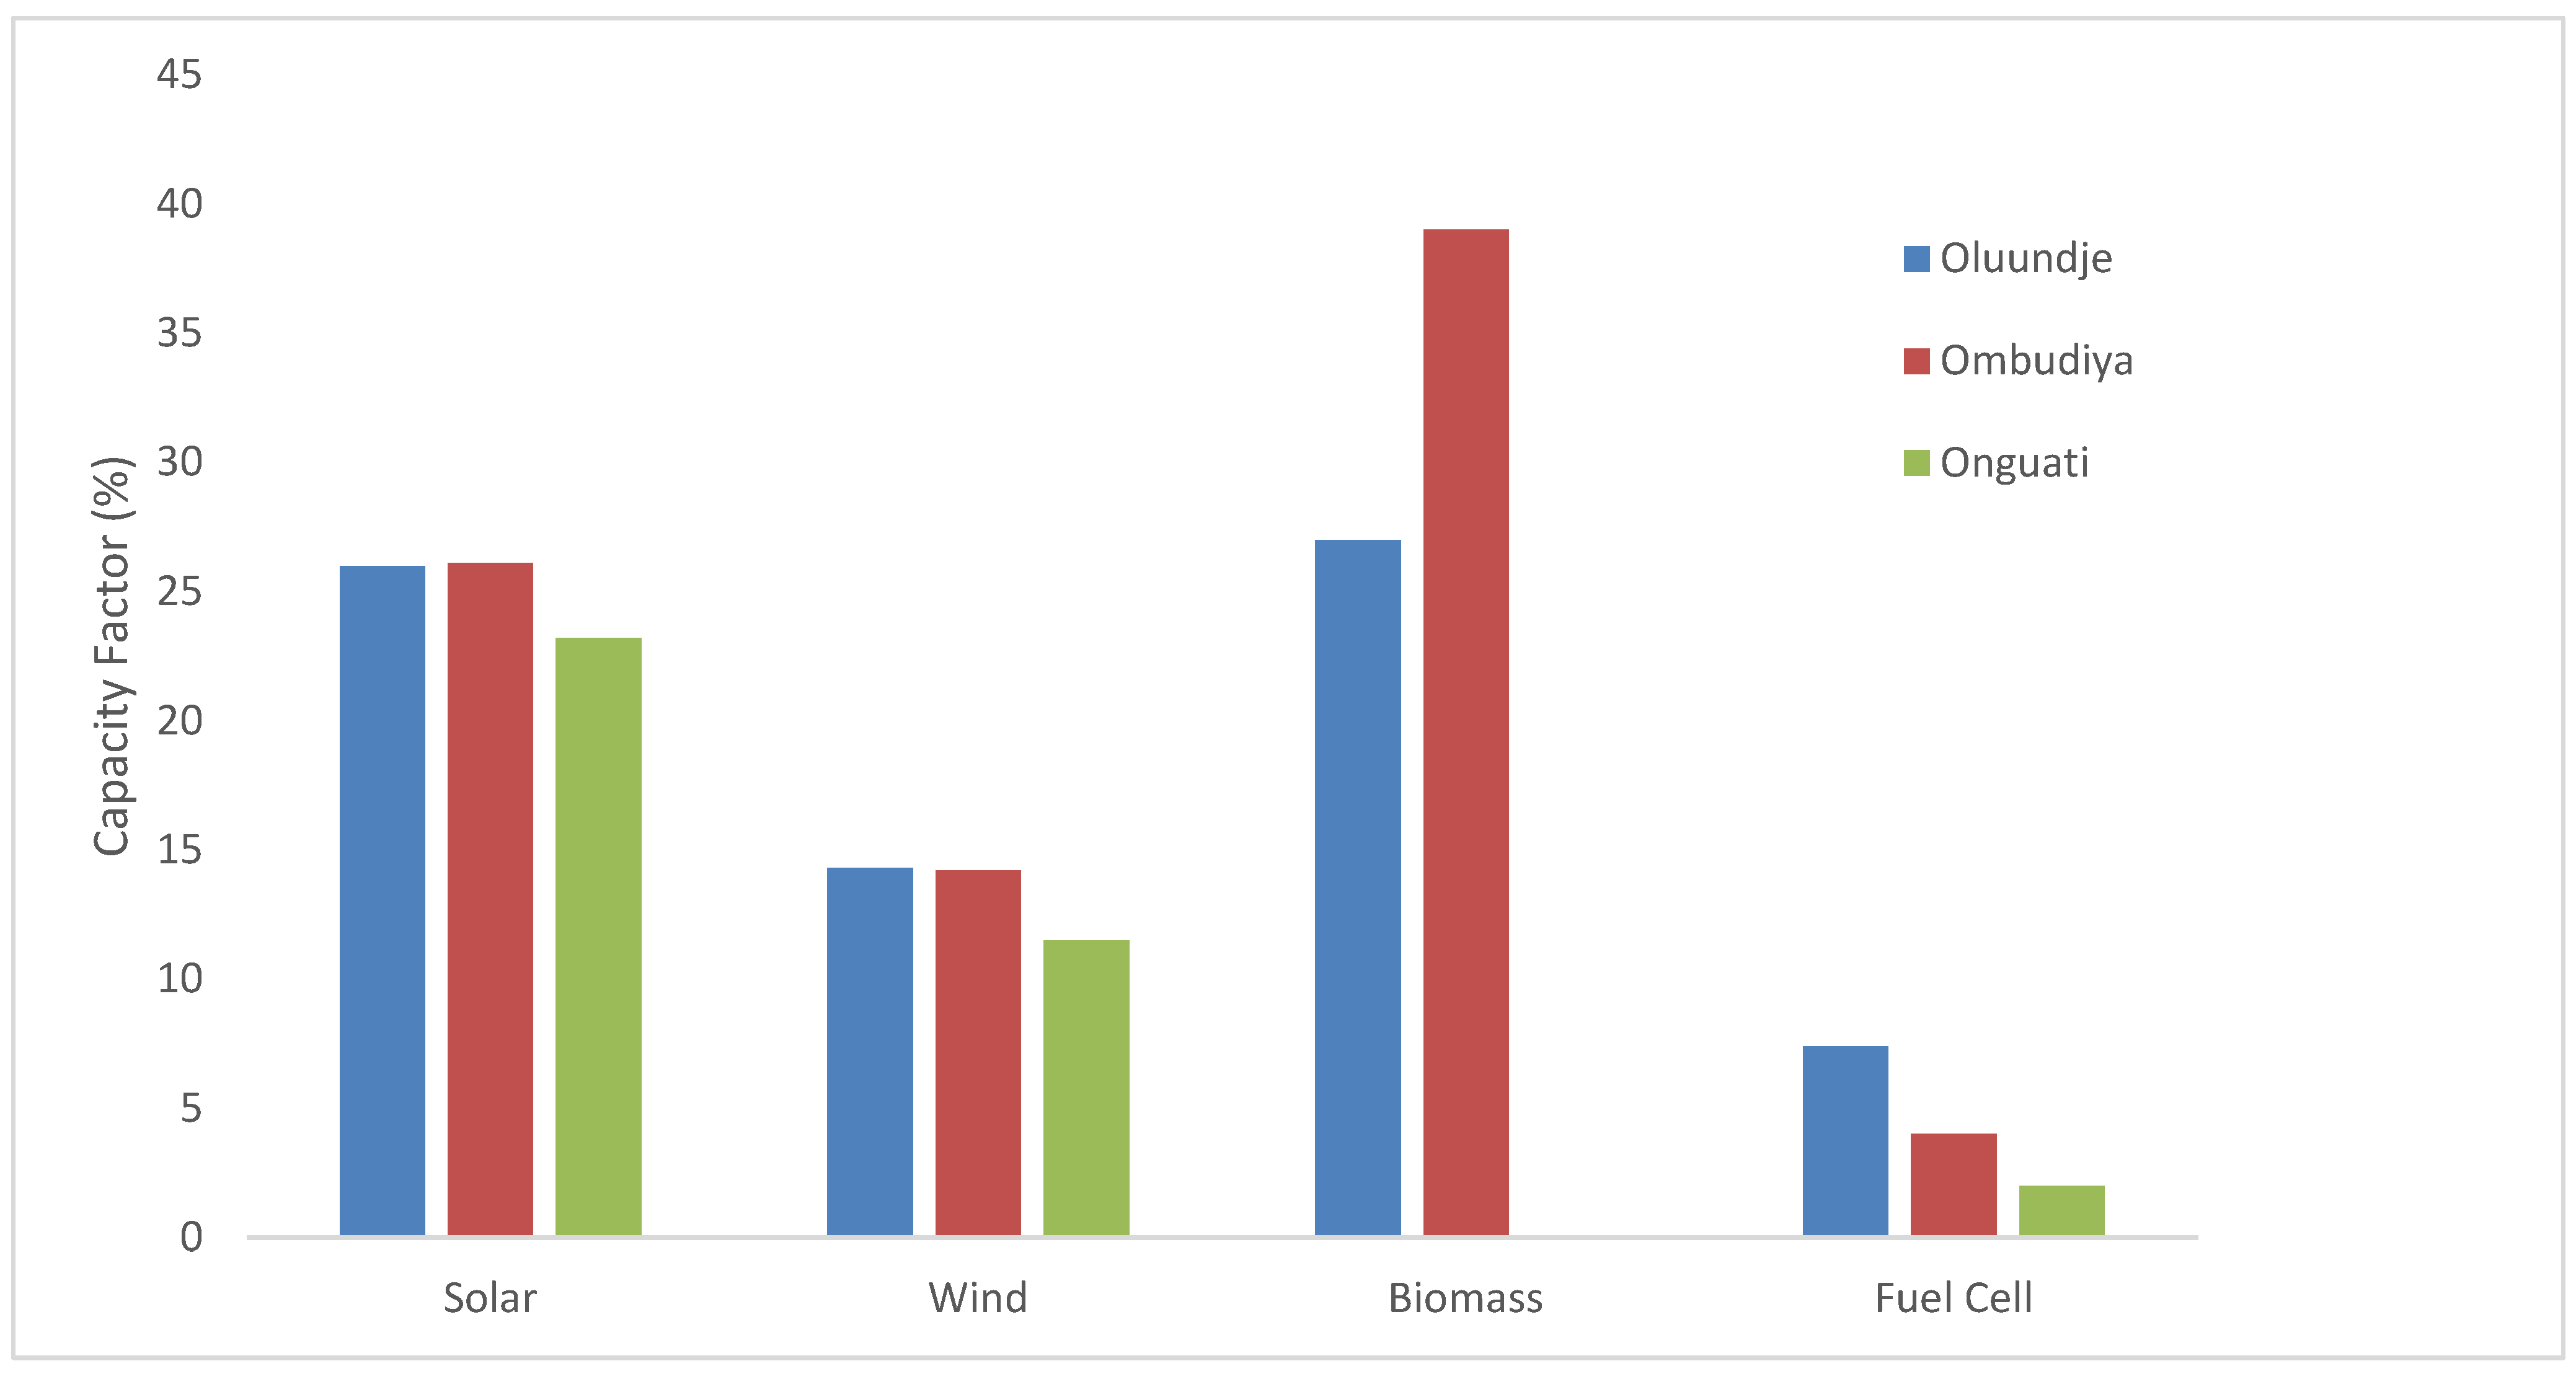
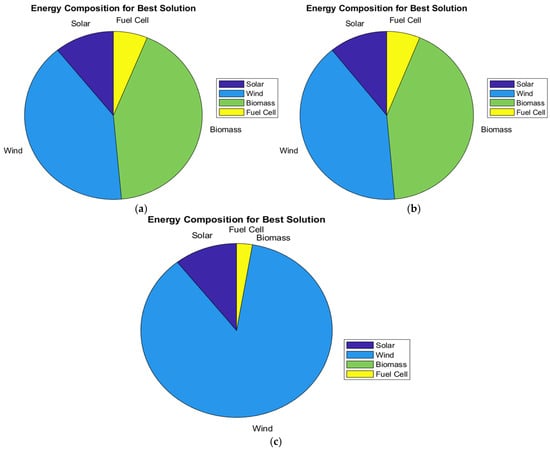
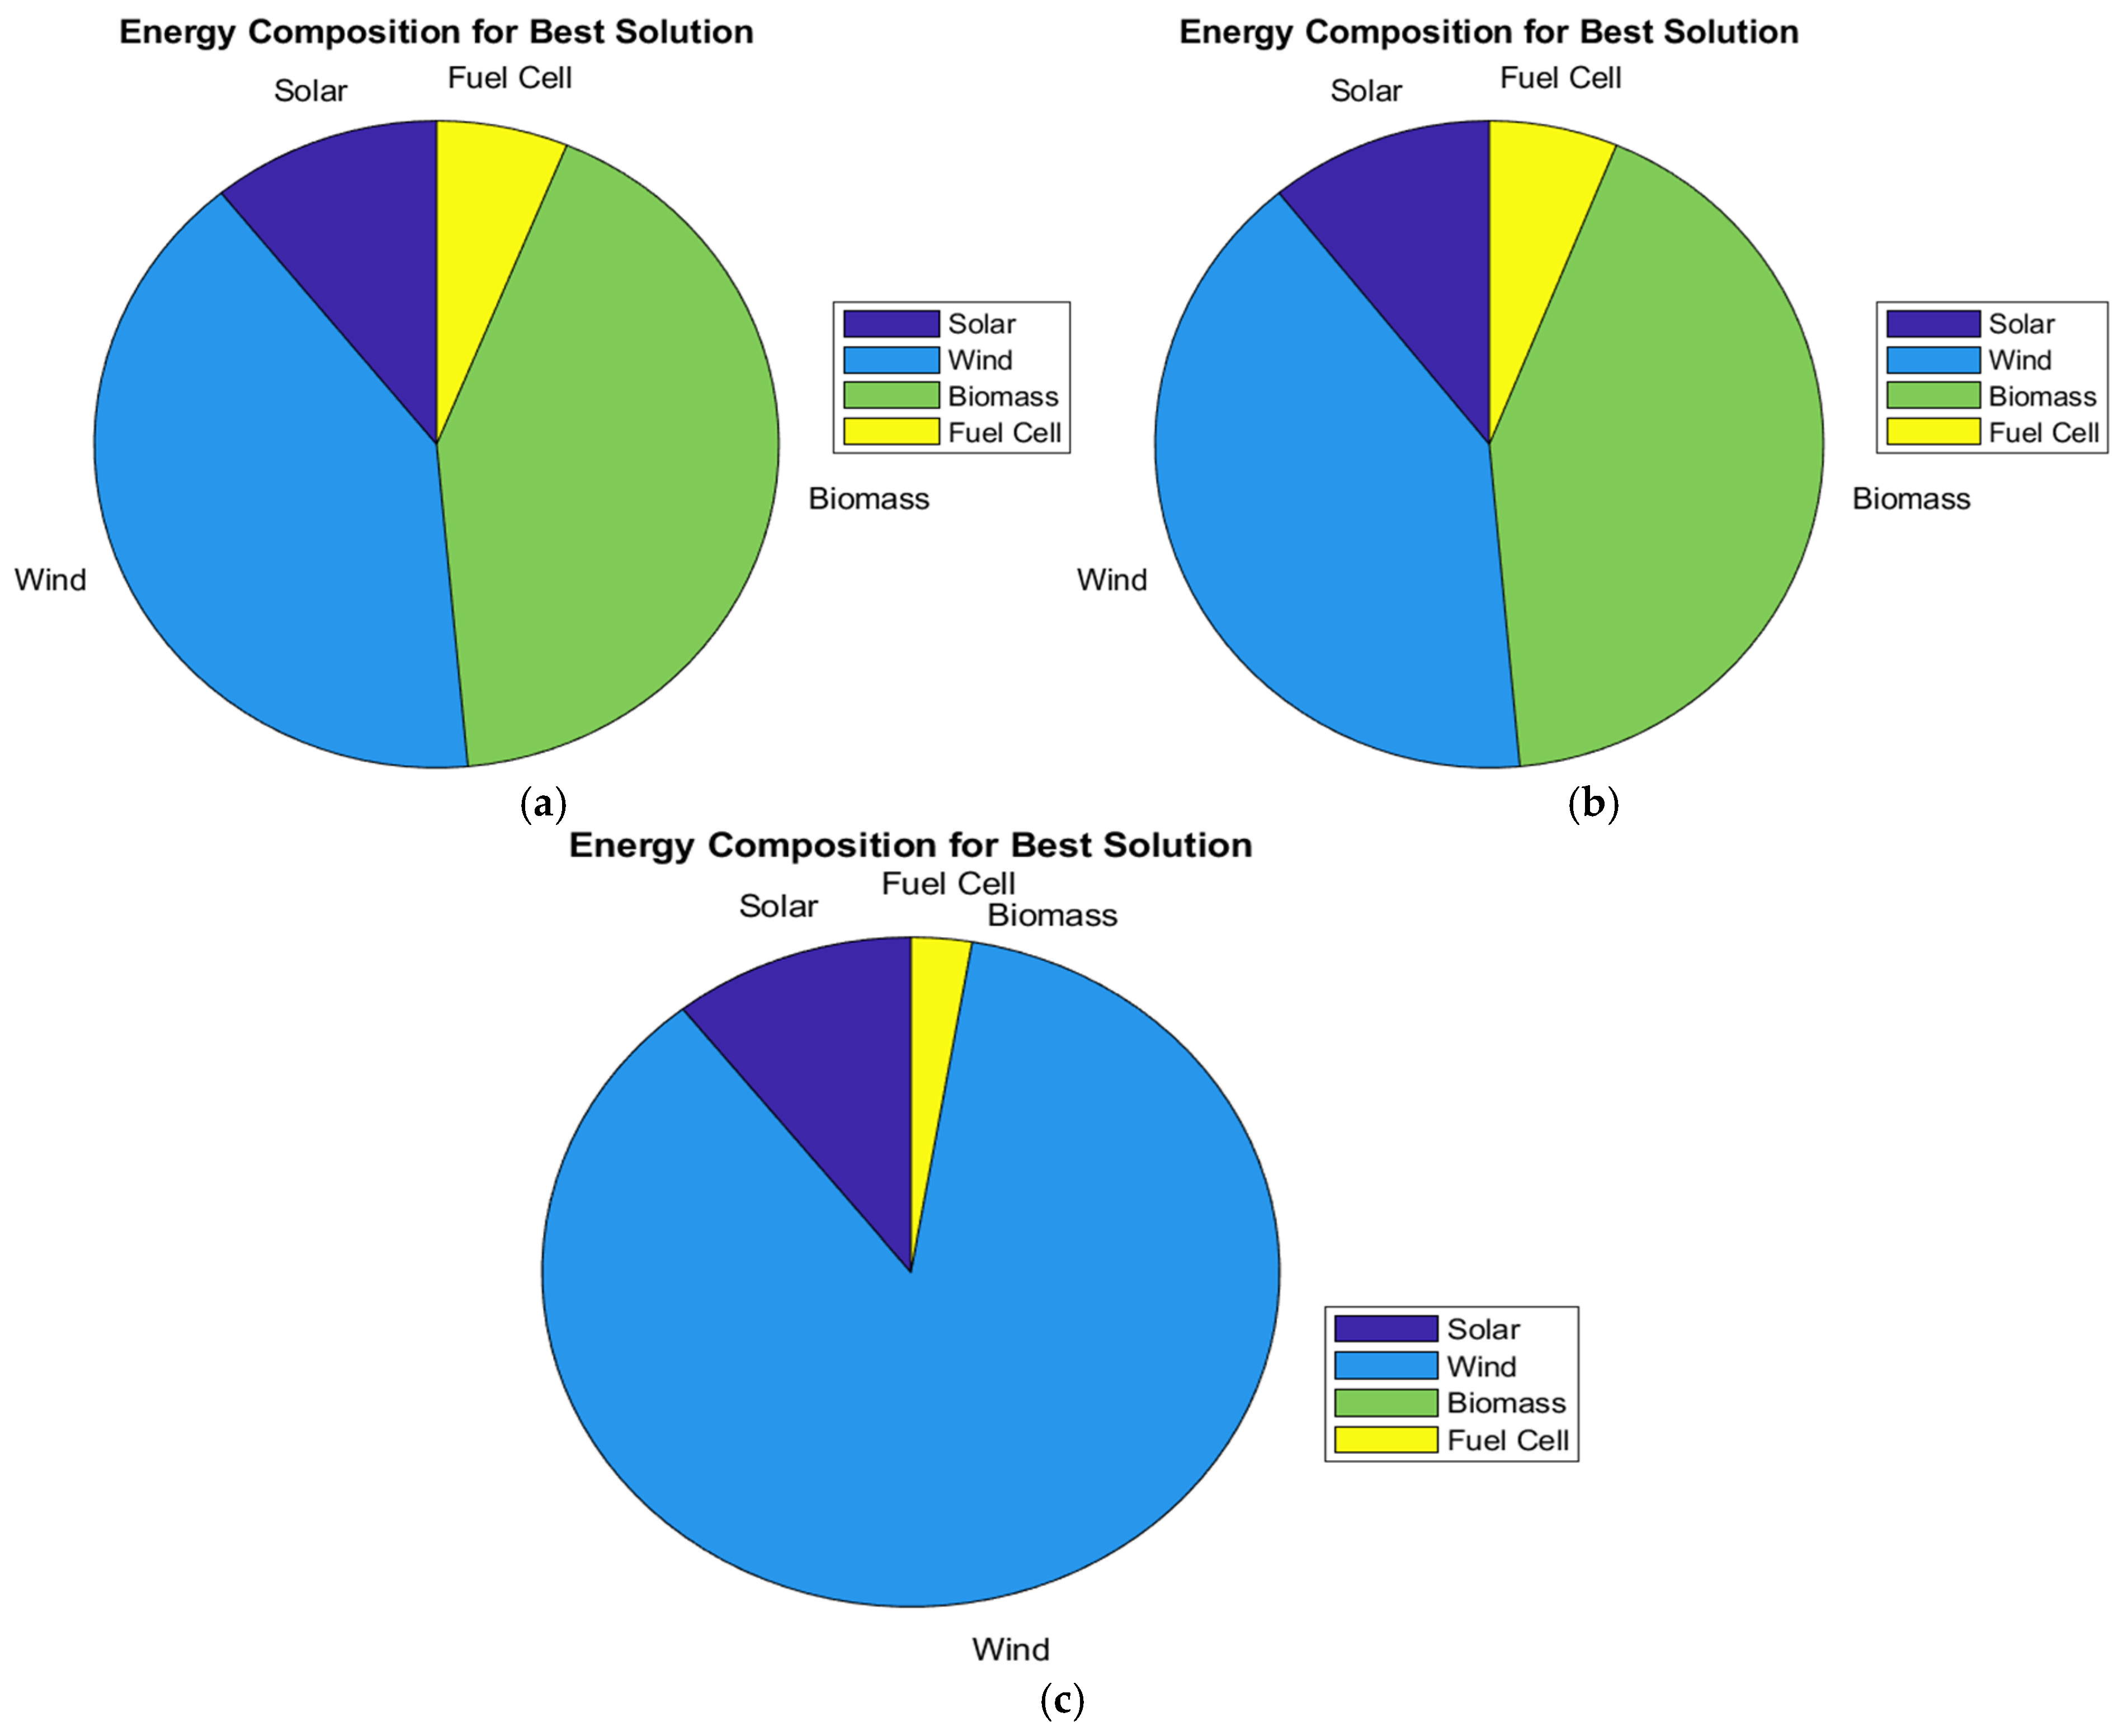

Disclaimer/Publisher’s Note: The statements, opinions and data contained in all publications are solely those of the individual author(s) and contributor(s) and not of MDPI and/or the editor(s). MDPI and/or the editor(s) disclaim responsibility for any injury to people or property resulting from any ideas, methods, instructions or products referred to in the content. |
© 2026 by the authors. Licensee MDPI, Basel, Switzerland. This article is an open access article distributed under the terms and conditions of the Creative Commons Attribution (CC BY) license.