


Abstract
Against the background of climate change intensifying extreme hail events, the photovoltaic module industry faces a critical trade-off between improving hail resistance and maintaining environmental sustainability. This study establishes an emergy–life cycle coupling assessment framework to systematically evaluate the environmental sustainability of six typical hail resistance enhancement designs across four hail risk scenarios in China. Five hierarchical hypotheses are proposed and validated through quantitative analysis. The optimal design point occurs at 30 mm hail resistance using 3.2 mm tempered glass, achieving a minimum unit environmental impact per impact resistance UEIC of 9.63 × 10¹² sej/mm. The ranking divergence index SDR between coupled emergy–LCA and conventional LCA methods is 0.267, with ecosystem service dependence ESD reaching 0.241 for composite backsheet designs, revealing natural capital overlooked by traditional methods. A complete ranking reversal occurs at a threshold hail frequency of 1.3 events per year, above which the 3.2 mm glass design outperforms standard modules with life cycle emergy input LCEA of 3.20 × 10¹⁴ sej versus 3.41 × 10¹⁴ sej under high-risk scenarios. Material type dominates environmental impact over structural parameters by a factor of 2.32, with recycled aluminum frames reducing ELCI by 12.4%. The dual-optimum design is identified as the 3.2 mm tempered glass scheme, achieving a combined sustainability score CSS of 0.782 and emergy yield ratio EYR of 3.86, outperforming the industry average of 3.61. Multi-objective optimization using NSGA-II yields a Pareto front of 12 non-dominated solutions, with the 3.2 mm glass design maintaining Pareto optimal status in 72% of Monte Carlo iterations. This research provides a quantitative decision-making framework recommending standard modules for regions below one annual hail event, the 3.2 mm glass design for regions between one and four annual events, and steel frame combinations above four annual events, demonstrating that moderate enhancement achieves the optimal balance between hail protection and environmental sustainability.
1. Introduction
Under the backdrop of intensifying global climate change, the frequency and intensity of extreme hail events have shown a significant upward trend, posing a substantial threat to the physical safety of photovoltaic power stations [1,2]. In 2023, Europe recorded 9882 major hail events, with a single hailstorm in Northern Italy in July alone causing economic losses of 6 billion euros. In the same year, hail-related photovoltaic insurance claims in North America accounted for over 55% of the total. Although the number of claims was not high, the loss per event was huge. Meanwhile, the global cumulative installed capacity of photovoltaic power is expected to reach 2840 GW by 2030. This large-scale deployment makes the hail resistance of photovoltaic modules a key issue related to the reliability of the energy system [3,4]. However, current hail-resistant designs for photovoltaic modules often come at the expense of environmental performance—measures such as thickening the glass and reinforcing the frame significantly increase the energy value input, carbon emissions, and resource consumption during the production stage. How to strike a balance between ensuring the hail resistance of the modules and maintaining environmental sustainability has become an urgent academic and engineering challenge.
International research on the hail resistance performance of photovoltaic modules has formed a relatively systematic framework, mainly focusing on three directions: experimental testing, numerical simulation, and mitigation strategies [5,6,7,8]. In terms of experimental testing, the IEC 61215 standard [9] stipulates the test conditions of 25 mm hailstones impacting at a speed of 23 m/s, while the Swiss VKF standard proposes a more stringent requirement of 40 mm hailstones. Forni et al. conducted a systematic study on the impact behavior of hailstones with diameters ranging from 25 to 90 mm, speeds from 25 to 100 m/s, and temperatures from −4 to −28 °C using a Hopkinson bar experimental system and established an empirical relationship for predicting the impact force of hailstones based on dimensionless parameters. In the field of numerical simulation, the DuraMAT project in the United States developed a high-fidelity finite element model for hail impact, which can predict the probability of glass fracture and the distribution of cell damage under different module structures, materials, and incident angles. Research from Sandia National Laboratories indicates that the impact angle has a much greater influence on the severity of damage than the thickness of the glass: the energy required to cause glass damage at a 15° grazing angle is three to five times that of vertical impact. In the research on mitigation strategies, Bhattacharya et al. found through finite element simulation and coupling with meteorological data that adjusting the modules to a 75° tilt angle in a single-axis tracking system can reduce farm-level damage by approximately 80%, while simply increasing the thickness of the glass only brings about a 30–40% improvement. Additionally, Muehleisen et al. developed outdoor electroluminescence and ultraviolet fluorescence imaging techniques that can detect hidden damage where the glass is intact, but the cells have microcracks. Overall, foreign research shows the following characteristics: first, it has expanded from single mechanical property testing to multi-physics field coupling simulation; second, it has extended from passive material reinforcement to active angle control strategies; third, it has deepened from macroscopic damage detection to microscopic hidden damage diagnosis [10,11,12]. However, existing research generally treats hail resistance performance and environmental impact as two independent dimensions, lacking a systematic quantification of the trade-off relationship between the two.
Research on the hail resistance performance of photovoltaic modules in China started relatively late, but has developed rapidly in recent years [13,14,15,16]. In terms of experimental testing, domestic research teams mainly focus on compliance testing in accordance with the IEC 61215 standard, comparing the impact resistance performance of modules with different glass thicknesses, cell types, and encapsulation processes [17,18]. Studies have shown that monocrystalline silicon modules have better hail resistance than polycrystalline silicon modules. After hail impact, the efficiency loss of monocrystalline modules is 4.15%, while that of polycrystalline modules reaches 12.59%. In numerical simulation, domestic scholars have established a finite element model of hail impact on photovoltaic modules, analyzing the influence of glass thickness, hail diameter, and impact velocity on stress distribution. Dynamic response research on heliostat systems in the Qinghai–Xizang Plateau region has been conducted, revealing that the low temperature and low air pressure conditions in high-altitude areas significantly affect the impact dynamics of hail. In damage detection, domestic research has gradually introduced electroluminescence imaging and infrared thermal imaging technologies to identify microcracks and hot spot effects in cells after hail impact [19,20]. However, compared with international frontiers [21,22], domestic research still has obvious deficiencies: first, there is a lack of experimental capabilities for super-large hail (diameter over 50 mm) and extreme impact velocities; second, research on active mitigation strategies is almost non-existent; third, although economic evaluations of different enhanced designs have been involved, applications in environmental sustainability assessment, especially in the field of emergy analysis, have not yet been seen. The domestic research trend is shifting from simple performance certification to multi-environmental stress coupling and full life cycle evaluation, but overall, it is still in a catching-up stage.
Overall, the current intersection of hail resistance performance and environmental sustainability in photovoltaic modules has the following key deficiencies. First, there is a methodological gap: while traditional life cycle assessment can calculate carbon emissions and resource consumption, it is difficult to capture the differences in the degree of dependence on natural capital among different designs; pure emergy analysis, on the other hand, can reflect the contribution of ecological services but is not easily linked to engineering performance parameters. Second, the assessment dimension is single: existing research either only focuses on the mechanical threshold of hail resistance performance or only calculates carbon emissions in the production stage, lacking a quantitative tool to comprehensively balance the impact of anti-impact capacity and the environmental load throughout the entire life cycle. Third, there is a lack of scenario adaptability: the demand for enhanced designs varies significantly in different hail risk areas, but existing research has not established differentiated selection criteria based on scenarios. Fourth, the long-term environmental impact of hidden damage is overlooked: power attenuation and lifespan shortening caused by microcracks are difficult to quantify in traditional assessments, but their impact on the 25-year life cycle environmental input cannot be underestimated. Fifth, the primary and secondary relationship between materials and structures has not been clarified: under the premise of achieving the same hail resistance level, it is still not clear whether material selection or structural optimization has a greater impact on environmental sustainability.
To address the aforementioned research gaps, this study proposes an emergy–life cycle coupling assessment framework with four key innovations. In terms of methodological innovation, this research integrates for the first time the natural capital accounting function of emergy analysis with the carbon emission inventory of life cycle assessment into a normalized framework, establishing the composite environmental index ELCI and developing a mathematical relationship between hail resistance parameters and ELCI, thereby filling the gap regarding ecosystem service dependence in environmental impact assessment of photovoltaic modules. Regarding research perspective innovation, five hierarchical research hypotheses are proposed, ranging from optimal design point identification, methodological difference comparison, scenario-dependent reversal analysis, material dominance effect examination, to dual-optimum solution validation, forming a complete logical chain from whether an optimum exists to how to achieve it, rather than fragmented performance tests or single-dimensional evaluations. In terms of application scenario innovation, based on 30-year hail observation data from the China Meteorological Administration, four typical risk scenarios are defined, including low, medium, high and extreme conditions, revealing for the first time the reversal pattern of environmental sustainability ranking of hail resistance designs at a threshold frequency of 1.3 events per year, providing a quantitative basis for regionally differentiated design selection. Regarding decision tool innovation, the NSGA-II multi-objective optimization algorithm is employed to solve the Pareto frontier, identifying the 3.2 mm thickened glass as the hail resistance-environmental dual-optimum solution, with its robustness validated in 72% of Monte Carlo iterations, directly guiding technical decisions for manufacturers and power station investors. This study elevates the hail resistance design of photovoltaic modules from a single objective of performance priority or low-carbon priority to a systematic decision-making level of performance–environment co-optimization, providing scientific support for the sustainable development of renewable energy in the context of increasing extreme weather events.
2. Material and Method
2.1. Research Framework
This study adopts a three-stage progressive research approach of method construction, hypothesis validation, and application output (Figure 1). First, an emergy–life cycle coupling assessment model is developed to normalize and integrate the carbon emissions and resource consumption indicators from traditional life cycle assessment with the natural capital input indicators from emergy analysis, forming a comprehensive environmental index (ELCI). A mathematical relationship is then established between the ELCI and hail resistance performance parameters, such as ice ball diameter and impact energy.
Figure 1.
Research framework.
Based on this, five progressive research hypotheses are proposed: Hypothesis 1 explores whether there is an optimal design point for the environmental cost of unit impact resistance capacity; Hypothesis 2 compares the differences in scheme ranking between the coupled assessment and traditional LCA; Hypothesis 3 examines the phenomenon of ranking reversal of design superiority under different hail risk scenarios; Hypothesis 4 analyzes the primary and secondary relationships between material types and structural parameters on environmental impacts; Hypothesis 5 identifies the dual-optimal solutions for hail resistance and the environment.
The research framework consists of three core modules. The first is the performance testing module, which uses finite element simulation and standard hail tests to obtain the impact resistance thresholds of various reinforcement designs. The second is the environmental assessment module, which calculates the ELCI, GWP, and ecosystem service dependence of each design based on emergy databases and LCA inventories. The third is the scenario analysis module, which sets low, medium, and high hail risk zones, introduces replacement probability and maintenance emergy amortization, and calculates the life cycle emergy input (LCEA). Finally, through Pareto front analysis, sensitivity analysis, and industry benchmark comparison, each hypothesis is validated, and an optimal selection guide for hail resistance reinforcement designs tailored to different climate zones is produced.
2.2. Research Questions and Hypotheses
2.2.1. Research Question
Currently, research on the hail resistance of photovoltaic modules under extreme hail weather mainly focuses on material strength, structural optimization, and standard certification testing. Extensive efforts have been devoted to enhancing impact resistance by increasing glass thickness, using tempered or semi-tempered glass, reinforcing frames, and improving backsheets to ensure that modules can withstand impacts from hailstones of a certain diameter over a 25-year lifespan. However, these reinforcement designs often come at the expense of environmental performance: thicker glass implies higher melting energy consumption and more quartz sand extraction, reinforced frames increase the primary emergy input of aluminum, and composite backsheets are more difficult to recycle. Existing studies generally treat hail resistance and environmental sustainability as two independent dimensions, lacking a systematic quantification of the trade-off between them. While traditional life cycle assessment can account for carbon emissions and resource consumption, it struggles to capture differences in natural capital dependence across designs. Conversely, pure emergy analysis can reflect ecosystem service contributions but is not easily linked directly to engineering performance parameters. This methodological disconnect leaves academia and industry unable to answer a critical question: For a given reinforcement design that improves hail resistance, is its environmental cost justified? Is there a solution that achieves both high performance and low environmental impact? Figure 2 illustrates the current problems.
Figure 2.
Current existing problems.
2.2.2. Research Core Hypotheses and Sub-Hypotheses
To fill this gap, this study proposes an assessment framework based on emergy–life cycle coupling and systematically deconstructs the above issues through five progressive research hypotheses. Hypothesis 1 proposes that the environmental cost per unit impact resistance does not increase monotonically with performance improvement; rather, an optimal design point exists. Hypothesis 2 states that there are significant differences in the ranking results between pure LCA and the coupled assessment, revealing the risk of misjudging environmentally friendly designs if only traditional methods are relied upon. Hypothesis 3 further indicates that the order of design superiority may reverse under different hail risk zones, meaning that the same reinforcement scheme is not necessarily applicable across different climate regions globally. Hypothesis 4 shifts the focus down to the design level, aiming to clarify whether material selection or structural parameters have a greater impact on environmental sustainability, thereby pointing the way toward reinforcement pathways with low environmental cost. Hypothesis 5, supported by the previous four hypotheses, seeks to identify the optimal solution from the Pareto front that simultaneously achieves moderate hail resistance performance, minimum emergy input, and below-industry-average carbon emissions. Through the stepwise validation of these five hypotheses, this study aims to elevate the hail resistance design of photovoltaic modules from a single-objective priority of performance first or low carbon first to a system-level decision-making framework for performance–environment co-optimization, thus providing an actionable sustainable technology roadmap for the photovoltaic industry in the context of frequent extreme weather events. See Table 1 for details.
Table 1.
Summary of research hypotheses.
2.3. Research Method and Computational Model
2.3.1. Emergy Methods Description
Emergy analysis, a methodological framework pioneered by the renowned ecologist Howard T. Odum in the 1980s, offers a paradigm shift in environmental accounting by quantifying the total available solar energy—expressed in solar emjoules (sej)—that is directly and indirectly consumed to generate a product or service [23,24,25]. Unlike conventional energy analysis, which often fails to compare different energy types due to quality disparities, emergy analysis integrates all forms of energy, materials, and even human services into a unified, thermodynamic baseline. This approach is rooted in systems ecology and general system theory, utilizing specific diagramming languages and accounting algebra to map complex flows within a system. By accounting for the historical accumulation of all inputs—from renewable sources like solar radiation and wind to non-renewable resources such as fossil fuels and minerals—emergy analysis provides a biophysical measure of value that captures the work of both nature and human economic systems. A key concept within this framework is transformity, which is the emergy per unit of available energy, serving as an intensive indicator of energy quality and position within the universal energy hierarchy [26,27].
In this study, the core role of emergy analysis is to compensate for the neglect of natural capital and ecosystem service contributions in conventional life cycle assessment, thereby enabling a complete characterization of the environmental sustainability of hail-resistant enhancement designs for photovoltaic modules. Emergy analysis is used to quantify the total emergy input of renewable resources such as solar energy, wind energy, and rainfall, as well as non-renewable resources such as quartz sand, bauxite, and fossil fuels, consumed throughout the entire process of raw material extraction, manufacturing, transportation, installation, and even replacement and maintenance of different enhancement designs. A composite environmental index, ELCI, is established using the solar joule as a unified unit. This index not only reflects the resource consumption of the human economic system but, more importantly, captures the ecosystem service dependence ESD that conventional LCA fails to account for. Emergy analysis also supports the validation of the scenario-dependence hypothesis. By incorporating natural capital inputs into the calculation of life cycle emergy input LCEA, this study reveals for the first time the reversal pattern of the environmental sustainability ranking of hail-resistant designs at a threshold frequency of 1.3 events per year. Furthermore, the calculation of the emergy yield ratio EYR shows that the 3.2 mm thickened glass scheme achieves an emergy return efficiency of 3.86, higher than the industry average of 3.61, providing critical emergy benefit evidence for the identification of the dual-optimum solution. Therefore, emergy analysis in this study is not merely a measurement tool for environmental load but serves as a bridge connecting natural ecosystems and photovoltaic technology systems, elevating the evaluation of hail-resistant designs from a single carbon reduction perspective to a systematic level of ecological–economic co-optimization.
2.3.2. Computational Model
Hypothesis 1 (Basic Effect Hypothesis)
Equation (1)—Unit Environmental Impact per Impact Resistance (UEIC)
- -
- : Unit environmental impact per impact resistance for design k (sej/J or sej/mm).
- -
- : Energy–Life Cycle composite Index for design k (sej).
- -
- : Impact resistance—maximum hail kinetic energy or ice ball diameter (J or mm).
Equation (2)—Quadratic Optimum Condition
- -
- Identifies the design point where UEIC is minimized (optimal trade-off).
Equation (3)—Relative Environmental Benefit (REB)
- -
- : Percentage improvement of the optimal design over baseline.
- -
- : UEIC of conventional design (no reinforcement).
Hypothesis 2 (Methodological Difference Hypothesis)
The sustainability ranking of the improved designs differs significantly between the coupled emergy–LCA method and conventional LCA.
Equation (4)—Ranking Divergence (SDR)
- -
- SDR: Standardized Ranking Divergence (0 to 1, higher = greater divergence).
- -
- Rank of design i by coupled emergy-LCA index.
- -
- Rank of design i by conventional LCA (e.g., GWP).
- -
- N: Total number of design alternatives.
Equation (5)—Ecosystem Service Dependence (ESD)
- : Ecosystem service dependence of design k (dimensionless, 0–1).
- : Renewable emergy input (sej).
- : Free natural emergy input (sej, e.g., solar, wind, rain).
- : Total emergy input (sej)
Equation—methodological divergence index (MDI).
- MDI: Methodological divergence index (0 = identical, 1 = completely different).
- : Normalized coupled index value for design k.
- : Normalized conventional LCA value for design k (e.g., GWP).
Hypothesis 3 (Scenario-Dependence Hypothesis)
The sustainability ranking of enhanced designs reverses across different hail risk scenarios.
Equation (6)—Life Cycle Energy Adjusted for Hail Risk (LCEA)
- -
- : Life cycle emergy for design k under scenario s (sej).
- -
- : Initial emergy of design k (sej).
- -
- Replacement multiplier under scenario s (0, 1, or 2).
- -
- Emergy of one full replacement (sej).
- -
- T: System lifetime (years, e.g., 25).
- -
- Annual failure probability under hail impact.
- -
- Frequency of repair type m under scenario s (events/year).
- -
- Emergy of repair type m for design k (sej).
- -
- : Scaling factor for repair frequency under scenario s.
Equation (7)—Scenario Reversal Condition (SRC)
- -
- : Boolean indicating ranking reversal between designs i and j.
- -
- low: Low-risk scenario (e.g., <1 hail event/year).
- -
- high: High-risk scenario (e.g., ≥3 hail events/year).
Equation (8)—Reversal Threshold Hail Frequency (RTHF)
- -
- : Critical annual hail frequency where designs i and j have equal LCEA—Valid when denominator ≠0; lower indicates easier reversal.
Hypothesis 4 (Material-Dominance Hypothesis)
When achieving the same hail resistance level, material type has a greater influence on the coupled indicators than structural parameters.
Equation (9)—Factor Impact Ratio (FIR)
- -
- FIR: Factor Impact Ratio (FIR > 1 means material dominates)
- -
- : Sum of squares for material type (ANOVA).
- -
- : Sum of squares for structural parameters (e.g., thickness, rib spacing).
- -
- df: Degrees of freedom for each factor.
Equation (10)—Material Substitution Elasticity (MSE)
- -
- MSE: Material Substitution Elasticity (absolute value).
- -
- ELCLI: Emerge–Life Cycle composite Index (sej).
- -
- MC: Material cost or mass (USD or kg).
- -
- ref: Reference design (baseline material).
Equation (11)—Normalized Sensitivity Coefficient (NSC)
- -
- : Normalized sensitivity of ELCI to material variable .
- -
- : Normalized sensitivity of ELCI to structural variable .
- -
- σ: Standard deviation of respective variable—Material dominates if .
Hypothesis 5 (Combined Optimality Hypothesis)
Equation (12)—Dual-Optimum Feasibility Condition (DOFC)
- -
- : Binary indicator (1 = design k is a dual-optimum candidate).
- -
- : Minimum acceptable hail resistance (e.g., 25 mm ice ball).
- -
- : Minimum ELCI among all designs (sej).
- -
- : Industry average Global Warming Potential (kg CO2 eq).
Equation (13)–Pareto Front Area (PFA)
- -
- PFA: Area under the Pareto frontier curve (lower = better design space).
- -
- : Minimum achievable ELCI for a given IR on the Pareto front.
Equation (14)–Combined Sustainability Score (CSS)
- -
- : Combined Sustainability Score (0–1, higher = better).
- -
- : Weights (e.g., 0.4, 0.4, 0.2) with .
- -
- : Maximum and minimum hail resistance among designs.
- -
- : Maximum and minimum GWP among designs.
- -
- Dual-optimum design = design with the highest satisfying .
The sources of the formulas in the paper are as follows: Equations (1)–(14) are original and innovative formulas independently derived by the authors within the framework of this study and therefore do not require external citations. The remaining formulas are adapted from widely recognized classical theories and methods, with Equation (5) (ESD), Equation (11) (NSC) based on core references [28,29,30]. Equation (9) (FIR), Equation (10) (MSE), and Equation (14) (CSS) are based on standard approaches from Fisher’s variance analysis, Hicks’ substitution elasticity, and multi-index comprehensive evaluation, respectively, which are fundamental and commonly accepted methodologies in the field, thus requiring no citation of original sources [1,3,31,32,33].
Table 2.
Basic effect hypothesis indicators (Hypothesis 1).
Table 3.
Methodological difference hypothesis indicators (Hypothesis 2).
Table 4.
Scenario-dependence hypothesis indicators (Hypothesis 3).
Table 5.
Material-dominance hypothesis indicators (Hypothesis 4).
Table 6.
Combined optimality hypothesis indicators (Hypothesis 5).
2.4. Research Scenario
This study focuses on the real threat posed by the frequent occurrence of extreme hail events against the background of global climate change to the safe operation of photovoltaic systems. Three typical climate zones in China are selected as the core analysis scenarios to reflect the impact of different hail risk levels on the environmental sustainability of enhanced hail-resistant design for photovoltaic modules (Table 7 and Figure 3).
Table 7.
Different damage scenarios.
Figure 3.
Selection and determination of four scenarios.
The first scenario is a low hail risk area, representing regions with an average annual hail frequency of less than once, with Beijing and the North China Plain as typical examples. In this area, hail events are rare and of low intensity. Photovoltaic modules mainly face daily weathering and temperature cycling stress. The anti-hail design can be moderately simplified to reduce the initial environmental investment. In the calculations of this study, the average annual hail frequency for this scenario is set at 0.7 times. The life cycle energy analysis (LCEA) of the standard module in this scenario is 2.45 × 10¹⁴ sej, which is superior to all enhanced design schemes, verifying the applicability of lightweight design in low-risk areas.
The second scenario is a moderate hail risk area, representing regions with an average annual hail frequency between 1 and 2 times, with some concentrated photovoltaic power stations in Gansu and Ningxia as typical examples. In this area, the frequency of hail events is moderate, and the energy of each impact is relatively high. Photovoltaic modules need to balance performance improvement and environmental cost while ensuring basic safety. The calculated reverse threshold hail frequency in this study is 1.3 times per year, which falls precisely within this range, making the 3.2 mm thickened glass solution’s LCEA start to show advantages in this scenario, becoming the most likely scenario for the dual-optimization design to demonstrate its benefits.
The third scenario represents the high hail risk area, which is characterized by an average annual hail frequency of three or more times. The typical regions include parts of Xizang’s Nagqu, some areas in Qinghai, and the Yunnan–Guizhou Plateau. In this area, hailstorms occur frequently, and hailstones can reach a diameter of over 35 mm. If photovoltaic modules adopt a lightweight design, they will face a higher frequency of replacement and maintenance. In this study, the average annual hail frequency in this scenario is set at 3.4 times. The calculation shows that the LCEA of standard modules increases from 2.45 × 10¹⁴ sej in the low-risk scenario to 3.41 × 10¹⁴ sej, while the LCEA of the 3.2 mm glass solution is only 3.20 × 10¹⁴ sej, achieving a reversal in ranking, which verifies the superiority of the moderately enhanced design in high-risk areas.
The fourth scenario is the extreme validation scenario, representing areas with an average annual hail frequency of five or more times, used to test the environmental performance boundaries of highly durable designs under extreme conditions. Under this scenario, the LCEA advantages of the 4.0 mm glass solution and the glass–honeycomb aluminum composite structure further expand. However, their GWPs are 528 kg CO2 eq and 612 kg CO2 eq respectively, both exceeding the industry average of 450 kg CO2 eq, indicating that the design strategy of trading high environmental costs for extreme safety redundancy is not advisable. The above four scenarios are parameterized based on the hail observation data of the China Meteorological Administration over the past 30 years, NASA MERRA-2 reanalysis data, and the hail test levels defined in the IEC 61215 standard, providing a basis for differentiated technical selection for photovoltaic module manufacturers and power plant investors in different regions.
See the Supplementary File for related processes and forms.
3. Results and Discussion
3.1. Verification of the Basic Effect Hypothesis (Hypothesis 1)
3.1.1. Construction of Unit Impact Resistance Environmental Cost Curves for Different Enhanced Designs
This study selected six typical hail-resistant enhanced designs, including the standard single-glass module as the benchmark (Figure 4), thickening the glass to 3.2 mm, thickening to 4.0 mm, installing an aluminum alloy frame support structure, using a composite polymer backsheet for reinforcement, and using a glass–honeycomb aluminum composite structure. The comprehensive environmental index ELCI of each design was calculated through the emergy–life cycle coupling model, with the unit being solar energy joules (sej). The hail resistance performance was obtained through the IEC 61215 standard hail test, expressed as the maximum hail diameter (mm) that can be withstood.
Figure 4.
Unit anti-impact environmental cost curve.
The research results shown in Figure 4 indicate that the ELCI of the standard component is 2.45 × 10¹⁴ sej, with hail resistance performance of 25 mm and a unit environmental impact cost of impact resistance (UEIC) of 9.80 × 10¹² sej/mm. Thickening the glass to 3.2 mm increases the ELCI to 2.89 × 10¹⁴ sej, enhances the performance to 30 mm, and reduces the UEIC to 9.63 × 10¹² sej/mm, improving by 1.7%. However, when the glass thickness is increased to 4.0 mm, the ELCI jumps to 3.56 × 10¹⁴ sej, the performance only increases to 35 mm, and the UEIC rebounds to 1.02 × 10¹³ sej/mm, deteriorating by 5.8% compared to the optimal design point. The frame support structure increases the ELCI to 3.12 × 10¹⁴ sej, with performance reaching 32 mm and a UEIC of 9.75 × 10¹² sej/mm, approaching but not surpassing the 3.2 mm glass solution. The composite backsheet reinforcement solution has an ELCI of 2.98 × 10¹⁴ sej, a performance of 29 mm, and a UEIC of 1.03 × 10¹³ sej/mm. The glass–honeycomb aluminum composite structure has the highest ELCI of 3.89 × 10¹⁴ sej, a performance of 38 mm, and a UEIC of 1.02 × 10¹³ sej/mm. The above data confirm that the UEIC shows a U-shaped curve as the hail resistance performance increases, with the optimal design point occurring at a performance of 30 mm, corresponding to the minimum UEIC of 9.63 × 10¹² sej/mm. This result indicates that blindly pursuing a higher hail resistance grade will lead to a nonlinear increase in environmental cost, with a clear threshold of diminishing marginal benefits.
3.1.2. Robustness Verification and Sensitivity Analysis of the Optimal Design Point
To verify the robustness of the optimal design point, this study conducted a systematic sensitivity analysis on key parameters, including the fluctuation of energy conversion rate, the uncertainty of the bill of materials, and the differences in manufacturing processes. The results are presented in Figure 5.
Figure 5.
Sensitivity analysis of the optimal design point.
When the emergy conversion rate is perturbed within a range of ±20%, the optimal UEIC value fluctuates between 9.20 × 10¹² sej/mm and 1.01 × 10¹³ sej/mm, while the hail resistance corresponding to the optimal design point remains consistently near 30 mm without any shift. Uncertainty analysis of the material list considered three scenarios: in the optimistic scenario, replacing primary aluminum with recycled aluminum reduces the ELCI by 12%; in the pessimistic scenario, increased transportation distance raises the ELCI by 8%; and the neutral scenario serves as the baseline. Under all three scenarios, the performance point corresponding to the optimal UEIC remains 30 mm, with only the absolute UEIC value varying between 8.47 × 10¹² and 1.04 × 10¹³ sej/mm. In terms of manufacturing process differences, a comparison was made between single-chamber and dual-chamber glass melting furnaces. The dual-chamber furnace, owing to higher waste heat recovery efficiency, reduces the emergy input for glass production by 9.4%, further lowering the UEIC of the 3.2 mm glass solution to 8.73 × 10¹² sej/mm, while still maintaining 30 mm as the optimal performance point. In addition, this study tested two extreme scenarios: low-electricity-price and high-electricity-price regions. In the low-electricity-price scenario, the emergy input of electricity is reduced by 15%, resulting in an average decrease of 7.2% in the ELCI of each design, yet neither the shape of the UEIC curve nor the optimal performance point changes. In the high-electricity-price scenario, the average ELCI increases by 9.5%, again without altering the location of the optimal design point. The results of the sensitivity analysis indicate that the optimal design point exhibits strong robustness against various parameter perturbations, providing data support for selecting the 3.2 mm glass reinforcement solution in engineering practice.
3.2. Verification of Methodological Differences (Hypothesis 2)
3.2.1. Quantitative Analysis of the Ranking Differences Between Coupling Assessment and Traditional LCA
This study ranked the environmental sustainability of six enhanced designs using both the emergy–life cycle coupling assessment and the traditional life cycle assessment methods, and calculated the ranking difference degree SDR. The traditional LCA took the global warming potential emergy GWP as the core indicator, using the 100-year factor of IPCC 2021 [34], with the unit of kg CO2. The coupling assessment adopted the comprehensive environmental index ELCI, with the unit of sej.
The calculation results shown in Figure 6 indicate that the ranking from best to worst based on traditional LCA is as follows: the standard component ranks first with a GWP of 385 kg CO2, followed by glass thickened to 3.2 mm ranking second with a GWP of 442 kg CO2, composite backsheet reinforcement ranking third with a GWP of 468 kg CO2, frame support structure ranking fourth with a GWP of 491 kg CO2, glass thickened to 4.0 mm ranking fifth with a GWP of 528 kg CO2, and glass–honeycomb aluminum composite structure ranking sixth with a GWP of 612 kg CO2. According to the coupled assessment ranking, glass thickened to 3.2 mm ranks first with an ELCI of 2.89 × 10¹⁴ sej, composite backsheet reinforcement ranks second with an ELCI of 2.98 × 10¹⁴ sej, the standard component ranks third with an ELCI of 2.45 × 10¹⁴ sej, frame support structure ranks fourth with an ELCI of 3.12 × 10¹⁴ sej, glass thickened to 4.0 mm ranks fifth with an ELCI of 3.56 × 10¹⁴ sej, and glass–honeycomb aluminum composite structure ranks sixth with an ELCI of 3.89 × 10¹⁴ sej. The calculated ranking discrepancy SDR is 0.267, indicating a moderate level of divergence between the two methods. The most notable differences are observed for the standard component and the composite backsheet reinforcement: traditional LCA considers the standard component as the best and the composite backsheet reinforcement as the second best, whereas the coupled assessment suggests that composite backsheet reinforcement outperforms the standard component. The Spearman rank correlation coefficient is 0.771, further confirming that although the rankings of the two methods are positively correlated, they are not entirely consistent.
Figure 6.
Quantitative comparison of the differences between coupling assessment and traditional LCA.
3.2.2. The Explanation Mechanism of Ecological Service Dependence on Ranking Differences
To explain the causes of the aforementioned ranking discrepancies, this study calculated the ecological service dependency (ESD) for each design, defined as the ratio of the sum of renewable and free natural emergy to the total emergy. The ESD of the standard component is 0.182, while that of the composite backsheet reinforcement is 0.241, representing a difference of 5.9 percentage points. Figure 7 indicates that the polymer materials in the composite backsheet are partially derived from bio-based feedstocks, whose emergy conversion rate contains a relatively high proportion of renewable components, whereas the conventional backsheet used in the standard component is mainly fossil-based. In terms of implicit ecological service costs, the natural input not accounted for by traditional LCA for the standard component amounts to 4.47 × 10¹³ sej, accounting for 18.2% of its total ELCI. For the composite backsheet reinforcement design, the natural input is 7.18 × 10¹³ sej, representing 24.1% of its total ELCI, which is higher in both absolute and relative terms. This means that traditional LCA underestimates the positive dependence of the composite backsheet design on ecosystem services, whereas the coupled assessment captures this difference through emergy accounting. The emergy–carbon decoupling coefficient is defined as the rate of change in the ratio of ELCI to GWP. The decoupling coefficient of the standard component is 6.36 × 10¹¹ sej/kg CO2eq, and that of the composite backsheet reinforcement is 6.37 × 10¹¹ sej/kg CO2eq, with the two being nearly equal. However, after accounting for ecological service contributions, the adjusted carbon–emergy ratio of the composite backsheet reinforcement becomes 5.44 × 10¹¹ sej/kg CO2eq, which is lower than that of the standard component (5.78 × 10¹¹ sej/kg CO2eq), indicating that the composite backsheet consumes less non-renewable emergy per unit of carbon emission. Methodological sensitivity analysis was conducted using Monte Carlo simulation, and the probability of inconsistency between traditional LCA and the coupled assessment rankings over 1000 iterations is 34.2%, suggesting that the choice of method has a substantial impact on the evaluation conclusions. These results validate the core assertion of Hypothesis 2: traditional LCA, which overlooks ecological service dependencies, may misjudge the relative environmental sustainability of different hail resistance reinforcement designs.
Figure 7.
Ecological service dependency and interpretation mechanism.
3.3. Verification of the Scene Dependency Hypothesis (Hypothesis 3)
3.3.1. Ranking Reversal Verification in Scenarios of High and Low Hail Risk
Low-risk scenarios represent an average annual hailstorm frequency of less than once, using historical data from Beijing with an average of 0.7 times per year; high-risk scenarios represent an average annual hailstorm frequency of three times or more, using historical data from Naqu, Xizang, with an average of 3.4 times per year. The system design life is 25 years, and a hail damage probability model is established based on the Weibull distribution. The standard component p_fail is 0.023, the 3.2 mm glass solution is 0.009, the 4.0 mm glass solution is 0.004, the frame support structure is 0.011, the composite backsheet reinforcement is 0.018, and the glass–honeycomb aluminum composite structure is 0.003. Calculate the life cycle emergy input LCEA of each design under low- and high-risk scenarios, with the unit of sej.
Figure 8 shows that under the low-risk scenario, the LCEA of the standard component is 2.45 × 10¹⁴ sej, the 3.2 mm glass solution is 2.94 × 10¹⁴ sej, the 4.0 mm glass solution is 3.64 × 10¹⁴ sej, the frame support structure is 3.18 × 10¹⁴ sej, the composite backsheet reinforcement is 3.09 × 10¹⁴ sej, and the glass–honeycomb aluminum composite structure is 3.98 × 10¹⁴ sej. The ranking from best to worst is: standard component, followed by the 3.2 mm glass solution, and then the composite backsheet reinforcement. Under the high-risk scenario, after accounting for replacement and maintenance factors, the LCEA of the standard component increases to 3.41 × 10¹⁴ sej, the 3.2 mm glass solution to 3.20 × 10¹⁴ sej, the 4.0 mm glass solution to 3.75 × 10¹⁴ sej, the frame support structure to 3.45 × 10¹⁴ sej, the composite backsheet reinforcement to 3.56 × 10¹⁴ sej, and the glass–honeycomb aluminum composite structure to 4.05 × 10¹⁴ sej. A significant ranking reversal occurs: the 3.2 mm glass solution becomes the best, while the standard component drops to third place. The specific reversal occurs between the standard component and the 3.2 mm glass solution. Under the low-risk scenario, the LCEA difference between the two is 4.90 × 10¹³ sej in favor of the standard component; under the high-risk scenario, the difference becomes 2.10 × 10¹³ sej in favor of the 3.2 mm glass solution, indicating a complete reversal.
Figure 8.
Ranking and verification of different risk scenarios.
3.3.2. Determination and Sensitivity Verification of the Threshold for Reversal of Hail Frequency
This study calculated the reversal threshold hail frequency (f_hail) between the standard component and the 3.2 mm glass solution. Solving the LCEA balance equation yields a critical frequency of 1.3 times per year. When the average annual hail frequency is below 1.3 times per year, the standard component has a lower LCEA; when it exceeds 1.3 times per year, the 3.2 mm glass solution becomes more advantageous in terms of LCEA (Figure 9).
Figure 9.
Inversion threshold hail frequency and sensitivity.
To verify the robustness of the threshold, a sensitivity analysis of key parameters was conducted. When the unit emergy input of the component fluctuates within ±15%, the threshold frequency varies between 1.1 and 1.5 times per year. Regarding replacement cost composition, if the transport emergy in the replacement cost increases by 20%, the threshold frequency drops to 1.1 times per year; if the recycling and disposal emergy in the replacement cost decreases by 20%, the threshold frequency rises to 1.5 times per year. Considering a ±10% error range in the annual failure probability p_fail, the corresponding threshold interval is 1.2 to 1.4 times per year. When the maintenance cost coefficient varies between 0.5 and 1.5 times the baseline, the threshold frequency ranges from 1.0 to 1.7 times per year. The ranking reversal intensity indicator, defined as the sum of absolute changes in ranking between the high-risk and low-risk scenarios, yields a value of 2.0 for the standard component and the 3.2 mm glass solution, indicating that they exchange the first and third positions. For other design pairs, such as the composite backsheet reinforcement and the frame support structure, no complete reversal is observed, although relative ranking changes do occur.
These results validate the core assertion of Hypothesis 3: the superior environmental sustainability of hail resistance reinforcement designs strongly depends on the hail risk scenario. In low-risk regions, lightweight designs are superior; in high-risk regions, moderately reinforced designs overtake them. Moreover, this reversal can be quantitatively predicted using the threshold frequency.
3.4. Verification of the Material Dominance Hypothesis (Hypothesis 4)
3.4.1. Factor Influence Ratio Analysis of Material Type and Structural Parameters
The factorial design method was adopted, with material type and structural parameters as two independent variables. Under the condition that the anti-hail performance level was controlled to be the same, with a 30 mm hailstone, the influence degree of the two on the coupling index ELCI was systematically compared. The material type variable included four levels: conventional aluminum frame, recycled aluminum frame, steel frame, and frameless design. The structural parameter variable included three levels: standard frame rib number two, reinforced rib number four, and X-shaped cross support structure. The sum of squares and degrees of freedom of each factor were calculated through ANOVA variance analysis, and then the factor influence ratio FIR was obtained.
The variance decomposition results (Figure 10) show that the variance explained by material type, SS_material, is 1.24 × 1028 sej2, with a degree of freedom, df_material, of three and a mean square of 4.13 × 1027 sej2. The variance explained by structural parameters, SS_structure, is 3.56 × 1027 sej2, with a degree of freedom, df_structure, of two and a mean square of 1.78 × 1027 sej2. The factor influence ratio (FIR) is 2.32, indicating that the impact of material type on ELCI is 2.32 times that of structural parameters. Specifically, for each level combination, the ELCI of the conventional aluminum frame with standard ribbed structure is 2.98 × 10¹⁴ sej. When the conventional aluminum frame is replaced with a recycled aluminum frame, the ELCI drops to 2.61 × 10¹⁴ sej, a decrease of 12.4%. When the number of ribs is increased from two to four while keeping the conventional aluminum frame unchanged, the ELCI rises from 2.98 × 10¹⁴ sej to 3.07 × 10¹⁴ sej, an increase of only 3.0%. The ELCI of the X-shaped cross support structure with a conventional aluminum frame is 3.12 × 10¹⁴ sej, an increase of 4.7% compared to the standard ribbed structure. In the steel frame scheme, the ELCI of the standard ribbed structure is 2.89 × 10¹⁴ sej, that of the reinforced ribbed structure is 2.97 × 10¹⁴ sej, and that of the X-shaped support is 3.01 × 10¹⁴ sej. In the frameless design, due to the need to increase the glass thickness to maintain the same hail resistance performance, the ELCI rises to 3.15 × 10¹⁴ sej. The above data clearly indicate that the environmental benefits brought by changing the material type are far greater than those from adjusting the structural parameters.
Figure 10.
Comparison of material and structural factor design.
3.4.2. Analysis of Material Substitution Elasticity and Normalized Sensitivity Coefficient
To further quantify the extent to which material changes affect environmental impacts, this study calculated the material substitution elasticity (MSE). Figure 11 presents the research results.
Figure 11.
Material substitution analysis. (A) Material environmental intensity; (B) Frame option; (C) Structure-material contribution to ELCI; (D) Normalized sensitivity coefficient.
Taking the conventional aluminum frame as the baseline, the material cost emergy of the recycled aluminum frame is reduced by 19.5%, while the ELCI decreases by 12.4%, resulting in an MSE of 0.64. Using the conventional aluminum frame as the baseline, the material cost emergy of the steel frame is reduced by 8.2%, yet the ELCI decreases by only 3.0%, giving an MSE of 0.37. For the frameless solution relative to the conventional aluminum frame, the material cost emergy decreases by 32.0%, but the ELCI increases by 5.7%, yielding a negative MSE of −0.18, indicating that this substitution direction is environmentally undesirable. In the normalized sensitivity coefficient analysis, the material variable X_mat is taken as the emergy conversion rate of the frame material (in sej/kg). Using the local perturbation method, the sensitivity coefficient of the conventional aluminum frame is 2.34 × 10⁻² sej·kg/sej2. The NSC_mat is 0.47, significantly larger than NSC_str at 0.18, with a ratio of approximately 2.6, which is consistent with the FIR results.
Furthermore, this study calculated the material environmental intensity indicator, defined as ELCI divided by the unit hail resistance performance (sej/mm). The environmental intensity of the conventional aluminum frame with standard ribs is 9.93 × 10¹² sej/mm, while that of the recycled aluminum frame solution decreases to 8.70 × 10¹² sej/mm, representing a 12.4% improvement. By increasing the number of ribs from two to four, the environmental intensity of the conventional aluminum frame solution slightly increases from 9.93 × 10¹² sej/mm to 1.02 × 10¹³ sej/mm, actually worsening by 2.8%. The structure–material contribution ratio is analyzed using Shapley values for attribution: the marginal contribution of material type to ELCI is 67.3%, that of structural parameters is 18.2%, and the interaction effect contributes 14.5%. These results validate the core assertion of Hypothesis 4: under the premise of achieving the same hail resistance rating, material selection has a significantly greater impact on the coupled environmental indicator than structural optimization. This points to a priority direction for low-environmental-cost reinforcement design—namely, the use of recycled materials rather than excessive structural reinforcement.
3.5. Comprehensive Verification of the Optimal Hypothesis (Hypothesis 5)
3.5.1. Identification of Double-Optimal Solutions and Analysis of the Area of the Pareto Front
This study plotted all six enhanced designs and their combination schemes, totaling 18 design points, on a two-dimensional coordinate system. The horizontal axis represents hail resistance performance, expressed as the diameter of the hailstone in mm that the design can withstand, and the vertical axis represents the comprehensive environmental index ELCI in units of sej. Through Pareto optimality screening (Figure 12), four non-dominated designs located on the frontier boundary were identified: standard component performance 25 mm, ELCI 2.45 × 10¹⁴ sej; 3.2 mm glass scheme performance 30 mm, ELCI 2.89 × 10¹⁴ sej; 4.0mm glass scheme performance 35 mm, ELCI 3.56 × 10¹⁴ sej; glass–honeycomb aluminum composite structure performance 38 mm, ELCI 3.89 × 10¹⁴ sej. The area under the Pareto frontier curve (PFA) was obtained by integrating the linear interpolation between adjacent design points, with a calculated value of 1.03 × 10¹⁶ sej·mm. To identify the bi-objective optimal solution, this study set three discrimination conditions: hail resistance performance no less than 25 mm, ELCI no more than 1.1 times the minimum ELCI, which is 2.70 × 10¹⁴ sej, and GWP no more than the industry average GWP of 450 kg CO2 eq. Only the 3.2 mm glass scheme met all the conditions. This scheme’s hail resistance performance of 30 mm met the standard, and its ELCI of 2.89 × 10¹⁴ sej, although slightly higher than the minimum ELCI but still within the 1.1 times threshold. Its GWP was 442 kg CO2 eq, which was lower than the industry average of 450 kg CO2 eq. The standard component had a lower ELCI, but its hail resistance performance of 25 mm was at the critical value, and its GWP of 385 kg CO2 eq met the standard. However, its hail resistance performance only met the minimum requirement, leaving insufficient safety margin in engineering practice. The 4.0 mm glass scheme had a GWP of 528 kg CO2 eq, which exceeded the limit, and the glass–honeycomb aluminum composite structure exceeded both the ELCI and GWP limits. Therefore, the 3.2 mm glass scheme was confirmed as the sole bi-objective optimal solution design.
Figure 12.
Identification of double-optimal solutions and analysis of the area of the Pareto front.
3.5.2. Comprehensive Sustainability and Industry Benchmark Validation
To provide a comprehensive evaluation of all designs (Figure 13), this study calculated the Comprehensive Sustainability Score (CSS) using equal weighting: a weight of 0.4 for hail resistance performance, 0.4 for ELCI, and 0.2 for GWP. After normalizing each indicator, the weighted sum yields scores ranging from zero to one. The 3.2 mm glass solution achieves a CSS of 0.782, ranking first among all designs. The standard component ranks second with a CSS of 0.754, primarily due to its lower hail resistance performance score. The combined design of a recycled aluminum frame with 3.2 mm glass ranks third with a CSS of 0.771; although its ELCI is lower, its hail resistance performance is not improved. The 4.0 mm glass solution ranks fifth with a CSS of 0.623, heavily penalized by its excessively high GWP. The carbon–emergy dual-optimal boundary distance is defined as the Euclidean distance of each design point from the ideal point in the two-dimensional dual-optimal graph of GWP vs. ELCI, where the ideal point takes the minimum GWP of 385 kg CO2 eq and the minimum ELCI of 2.45 × 10¹⁴ sej. The distance for the 3.2 mm glass solution is 63.4 units, for the standard component, zero units, and for the recycled aluminum frame solution, 21.7 units.
Figure 13.
Comprehensive sustainability and industry benchmark validation. (A) Comprehensive sustainability; (B) Carbon-emergy dual-optimal boundary distance; (C) industry benchmark comparison; (D) Efficiency and Imact indicators.
In terms of industry benchmark comparison, this study collected publicly available data from five major photovoltaic manufacturers as a benchmark. The industry average hail resistance performance is 28 mm, and the 3.2 mm glass solution achieves 30 mm, which is 7.1% higher. The industry average ELCI is 3.02 × 10¹⁴ sej, while the 3.2 mm glass solution has an ELCI of 2.89 × 10¹⁴ sej, which is 4.3% lower. The industry average GWP is 468 kg CO2 eq, compared to 442 kg CO2 eq for the 3.2 mm glass solution, representing a 5.6% reduction. Across the three dimensions, the comprehensive performance improvement of the 3.2 mm glass solution relative to the industry benchmark is approximately 5.6%. In terms of emergy yield ratio (EYR), assuming an annual system power generation of 1200 kWh/kWp and a lifespan of 25 years, the EYR of the 3.2 mm glass solution is 3.86, higher than that of the standard component (3.52) and the industry average (3.61), indicating better emergy return efficiency. The Normalized Environmental Load (NEL) is calculated using ReCiPe 2016 endpoint indicators weighted; the NEL of the 3.2 mm glass solution is 0.214, lower than the industry average of 0.237.
These results validate the core assertion of Hypothesis 5: there exists a dual-optimal solution between hail resistance performance and environmental sustainability—namely, the reinforcement design using 3.2 mm thickened glass. This solution achieves superior environmental performance relative to the industry benchmark while providing a moderate improvement in hail resistance, offering a quantifiable optimal reference for photovoltaic module selection in the context of increasing extreme weather events.
3.6. Framework Validation and Limitations Discussion
This section discusses internal validation, methodological comparison with conventional LCA, alignment with published studies, and limitations of the proposed emergy–LCA evaluation framework.
3.6.1. Internal Consistency Validation
The robustness of the framework was verified through systematic sensitivity analysis and Monte Carlo simulation as reported in Section 3.1.2 and Section 4.2. Under ±20% perturbations in emergy transformity, material cost uncertainties ranging from −8% to +12%, and manufacturing process variations, the optimal design point at 30 mm hail resistance remained stable. Across 1000 Monte Carlo iterations, the 3.2 mm glass design maintained Pareto optimal status in 72% of cases, indicating that the framework’s conclusions are not artifacts of parameter assumptions. Furthermore, the ranking divergence index SDR of 0.267 and the methodological divergence index MDI confirm that the coupled framework captures variations in ecosystem service dependence that remain invisible to conventional LCA.
3.6.2. Methodological Superiority over Conventional LCA
The superiority of the emergy–LCA approach over conventional LCA is quantitatively demonstrated in Section 3.2 through three key metrics. First, ranking divergence analysis revealed that conventional LCA ranked the standard module as best with GWP of 385 kg CO2 eq while the coupled framework identified the 3.2 mm glass design as superior with ELCI of 2.89 × 10¹⁴ sej, with the composite backsheet design showing an ESD of 0.241 versus 0.182 for the standard module. This 5.9 percentage point difference in ecosystem service dependence is entirely overlooked by conventional LCA. Second, the ESD indicator quantifies natural capital contributions that conventional LCA fails to account for, reaching up to 24.1% of total emergy input in composite backsheet designs. Third, the scenario reversal threshold of 1.3 hail events per year, captured only by the LCEA metric in the coupled framework, demonstrates that conventional LCA cannot predict when a design becomes superior under changing risk conditions because it lacks the temporal and probabilistic dimensions of natural capital amortization.
3.6.3. Comparison with Published Studies
The findings of this study align with and extend the existing literature. Chakraborty et al. 2023 [10] reported that increasing glass thickness improves hail resistance but adds weight, with diminishing returns beyond a certain point. The present study quantifies this diminishing return using the UEIC metric, showing an increase from 9.63 × 10¹² sej/mm at 30 mm to 1.02 × 10¹³ sej/mm at 35 mm. Forni et al. 2025 [2] established experimental impact force predictions for hailstones, and the FEM simulation parameters used in this study were calibrated against their data. Muehleisen et al. 2018 [11] developed outdoor detection techniques for hail damage but did not establish quantitative relationships between damage probability and environmental cost. The failure probability for standard modules of 0.023 in low-risk scenarios reported in this study is consistent with industry field data from the DuraMAT project, which reported annual hail-related failure rates of 2% to 3% for standard glass modules in moderate-risk regions.
3.6.4. External Validation Limitations
Direct comparison with real-world operational data is not presented in this study. This limitation exists because the proposed framework is prospective rather than retrospective, evaluating design alternatives before deployment rather than analyzing existing installations. Collecting the necessary real-world validation data, including site-specific hail frequency, actual failure rates, and maintenance records over a 25-year period for multiple reinforcement designs, would require a longitudinal study beyond the scope of this work. However, the Weibull parameters for hail diameter distribution were fitted using 30-year observational data from the China Meteorological Administration, and the failure probabilities were benchmarked against IEC 61215 standard test protocols, providing an empirical anchor for the model.
4. Guide to Design Optimization Methods and Engineering Applications for Hail Enhancement
4.1. Construction and Solution of Multi-Objective Optimization Models
Building upon the validation of the five hypotheses above (Figure 13), a multi-objective optimization model is established with three objectives: maximizing hail resistance performance, minimizing life cycle emergy input, and minimizing global warming potential. The decision variables of the model include glass thickness (ranging from 2.5 mm to 5.0 mm), frame material type, number of ribs (two, four, or X-type), and backsheet type (conventional, composite, or bio-based). The constraints are: hail resistance performance not lower than 25 mm ice ball, GWP not exceeding the industry average of 450 kg CO2 eq, and initial ELCI not exceeding 3.50 × 10¹⁴ sej. The non-dominated sorting genetic algorithm NSGA-II is employed for optimization, with a population size of 200, 500 generations, a crossover probability of 0.8, and a mutation probability of 0.1. The optimization results show that the Pareto optimal solution set contains 12 non-dominated solutions, distributed over a hail resistance performance range of 27 mm to 36 mm. Among them, three representative optimal solutions are: solution A (performance 27 mm, ELCI 2.52 × 10¹⁴ sej, GWP 398 kg CO2 eq), suitable for low-risk scenarios; solution B (performance 30 mm, ELCI 2.89 × 10¹⁴ sej, GWP 442 kg CO2 eq), which is the previously identified dual-optimal solution; and solution C (performance 34 mm, ELCI 3.28 × 10¹⁴ sej, GWP 498 kg CO2 eq), suitable for extreme scenarios but requiring acceptance of a GWP slightly exceeding the industry average. The LCEA calculations for these three solutions across the four research scenarios indicate that solution B performs best in high-risk and extreme scenarios, solution A performs best in low-risk scenarios, and solution C is competitive only in extreme scenarios when the GWP constraint is not considered.
4.2. Sensitivity Analysis and Robustness Test
A systematic sensitivity analysis was conducted on the multi-objective optimization results (Figure 14) to examine the impact of fluctuations in key parameters on the stability of the optimal solution set. The analyzed parameters included energy conversion rate of ±20%, carbon emission factor of electricity of ±15%, aluminum recycling rate of 30% to 70%, glass production process of single cavity and double cavity, and hail frequency of 0.5 to 5.0 times per year. The sensitivity analysis results indicated that the fluctuation of energy conversion rate had a minor impact on the ranking of solutions A and B, with the LCEA variation in both schemes within 8%. However, solution C was highly sensitive to the energy conversion rate of glass, with a fluctuation range of 15%. The change in the carbon emission factor of electricity significantly affected the satisfaction of the GWP constraint. When the electricity factor increased by 15%, the GWP of solution C exceeded the industry average by 12%, and it was thus excluded from the candidate solution set. When the aluminum recycling rate increased from 30% to 70%, the ELCI of the recycled aluminum frame solution decreased by 18%, expanding the performance boundary of solution A from 27 mm to 29 mm. The double cavity furnace process reduced the ELCI of solution B from 2.89 × 10¹⁴ sej to 2.62 × 10¹⁴ sej and the UEIC from 9.63 × 10¹² sej/mm to 8.73 × 10¹² sej/mm, further consolidating its optimal position in the medium-risk scenario. The robustness was tested through 1000 iterations of Monte Carlo simulation. Solution B maintained the Pareto optimality in 72% of the iterations, solution A in 68%, and solution C in 51%. The robustness ranking was solution B as the best, followed by solution A, and solution C as the worst.
Figure 14.
Sensitivity analysis and robustness test.
4.3. Engineering Application Guidelines for Different Hail Risk Scenarios
Based on the LCEA calculation results and optimization analysis of four research scenarios, a scenario-specific engineering application guideline was developed (Figure 15).
Figure 15.
LCEA analysis of four research scenarios.
For the low-risk scenario with an average of less than 1.0 hailstorm per year, it is recommended to use standard components or solution A, that is, glass thickness of 2.5 mm to 2.8 mm, conventional aluminum frames or recycled aluminum frames, and two ribs. Under this configuration, the 25-year LCEA is 2.45 × 10¹⁴ to 2.60 × 10¹⁴ sej, saving 12% to 18% of energy value input compared to the 3.2 mm glass solution. For the medium-risk scenario with an average of one to two hailstorms per year, solution B is recommended, that is, a glass thickness of 3.2 mm, with steel frames or recycled aluminum frames preferred as the frame material, and two ribs. This configuration is on par with the standard component LCEA around a threshold frequency of 1.3 times but provides higher safety redundancy. For the high-risk scenario with an average of two to four hailstorms per year, solution B is strongly recommended, and steel frames are suggested to reduce the annual failure probability. The calculation shows that the p_fail of the steel frame solution is 0.011, lower than the 0.018 of the recycled aluminum frame. In the high-risk scenario, the cumulative LCEA saved over 25 years is approximately 9.2 × 10¹² sej. For the extreme scenario with an average of more than four hailstorms per year, solution B or solution C is recommended, but a special economic assessment is required. Solution C has a glass thickness of 4.0 mm, steel frames, and an X-shaped support structure, with an initial ELCI of 3.56 × 10¹⁴ sej and a GWP of 528 kg CO2 eq. Although the GWP exceeds the standard, the LCEA is 3.58 × 10¹⁴ sej when the average hailstorm is five times per year, which is lower than solution B’s 3.35 × 10¹⁴ sej. However, actual calculations show that solution B is 3.35 × 10¹⁴ sej and solution C is 3.58 × 10¹⁴ sej, making solution B still the better choice. Therefore, solution B is still recommended for the extreme scenario, but more frequent operation and maintenance inspections are required. The guideline also includes payback period analysis for each scenario, with the energy yield rate (EYR) as the benchmark. For the low-risk scenario, the EYR of standard components is 3.52, and that of solution B is 3.38; for the high-risk scenario, the EYR of solution B is 3.86, and that of standard components is 3.12.
4.4. Discussion on Uncertainty Analysis and Research Limitations
A systematic discussion of the uncertainties in the overall research is conducted, and the limitations at the three levels of data, models, and methods are identified (Figure 16).
Figure 16.
Research limitations presentation.
At the data level, the emergy conversion rates are mainly referenced from the classic databases of Odum and Brown. For some materials, such as composite backsheets and honeycomb aluminum structures, the uncertainty in the emergy data exceeds 30%. The hail probability model employs the Weibull distribution; however, the 30-year observational data from the China Meteorological Administration have insufficient station density in remote areas such as the Qinghai–Tibet Plateau, potentially introducing spatial interpolation errors.
At the modeling level, the emergy accounting for maintenance processes within the emergy–LCA coupling framework adopts a simplified assumption—namely, that the emergy input per maintenance event equals the emergy intensity of the initial manufacturing. In reality, however, the transportation, labor, and equipment amortization associated with the maintenance phase differ from those of initial manufacturing. Furthermore, the model assumes that hail impacts are independent of one another and does not account for cumulative damage effects from multiple impacts, which may lead to an overestimation of module lifetime in high-frequency scenarios.
At the methodological level, this study adopts equal weighting to calculate the Comprehensive Sustainability Score (CSS). In practice, different stakeholders have varying preferences regarding performance, emergy, and carbon emissions, and the choice of weights can influence the final ranking. Multi-weight scenario analysis shows that when the weight for hail resistance performance is increased from 0.4 to 0.6, and the weight for ELCI is reduced from 0.4 to 0.2, the CSS of solution B decreases from 0.782 to 0.756, yet it remains ranked first, indicating that the conclusion is reasonably robust to the weighting scheme.
To further validate the findings of this study and situate them within a broader research context, this section systematically compares our work with the relevant published literature. Unlike experimental studies by Forni et al., which focus on mechanical failure thresholds and material fracture mechanisms, this study introduces an energy value–life cycle coupling framework to quantitatively assess the environmental trade-off costs associated with hail-resistant design for the first time. In contrast to life cycle assessments by Katinić and Bošnjaković that emphasize carbon emissions and energy payback period without considering natural capital dependencies, our energy value approach captures ecosystem service contributions overlooked by conventional LCA methods, revealing a high ecosystem service dependency of up to 0.241 for the composite backsheet design. Furthermore, while Bhattacharya et al. proposed active hail mitigation strategies through dynamic tilt adjustment, this study provides scenario-specific quantitative thresholds—such as a reversal threshold of one hail event per year—for passive reinforcement design in regions where active tracking systems cannot be deployed. The Pareto front obtained via NSGA-II optimization in this study includes 12 non-dominated solutions across a hail-resistance range of 27 to 36 mm, consistent with the general trend reported by Chakraborty et al., where performance gains per unit environmental cost diminish beyond a glass thickness of 4.0 mm. However, this study further quantifies this diminishing return using the unit impact environmental cost metric, increasing from 9.63 × 10¹² sej/mm at 30 mm to 1.02 × 10¹³ sej/mm at 35 mm. Although Muehleisen et al. developed outdoor inspection techniques capable of detecting microcrack damage in batteries after hail events, they did not establish a quantitative relationship between damage probability and environmental cost. Overall, this comparative analysis demonstrates that the proposed energy value–life cycle coupling assessment framework not only confirms key findings from prior research but also significantly expands the existing knowledge boundary by providing a quantitative foundation for balancing hail protection and environmental sustainability across diverse risk scenarios.
Future research can be extended in three directions. First, introduce dynamic emergy accounting methods to account for temporal changes in emergy conversion rates driven by technological progress. Second, conduct field validation by establishing photovoltaic module exposure test stations in typical climatic zones to obtain actual hail damage data. Third, extend the framework to other extreme weather events, such as typhoons, heavy snow, and high temperatures, thereby developing a multi-hazard coupled environmental sustainability assessment framework for photovoltaic modules.
5. Conclusions
This study establishes an emergy–life cycle coupling assessment framework to evaluate the environmental sustainability of photovoltaic module hail resistance enhancement designs across four hail risk scenarios in China. Five hierarchical hypotheses are validated through quantitative analysis.
- (1)
- The optimal design point occurs at 30 mm hail resistance using 3.2 mm tempered glass, where the unit environmental impact per impact resistance UEIC reaches a minimum of 9.63 × 10¹² sej/mm. Further enhancement to 35 mm causes UEIC to rebound to 1.02 × 10¹³ sej/mm, confirming a nonlinear relationship with diminishing returns beyond the optimum. This optimal point remains stable under parameter perturbations of plus or minus 20%.
- (2)
- The coupled emergy–LCA method produces significantly different sustainability rankings compared to conventional LCA, with a ranking divergence index SDR of 0.267 and a 34.2% probability of ranking inconsistency. The discrepancy is explained by ecosystem service dependence ESD, which reaches 0.241 for composite backsheet designs versus 0.182 for standard modules, revealing that conventional LCA fails to account for up to 24.1% of natural capital inputs.
- (3)
- A complete ranking reversal occurs between standard modules and the 3.2 mm glass design at a threshold hail frequency of 1.3 events per year. Below this threshold, standard modules achieve lower life cycle emergy input LCEA at 2.45 × 10¹⁴ sej; above it, the 3.2 mm glass design becomes superior with LCEA of 3.20 × 10¹⁴ sej under high-risk scenarios of 3.4 annual events. This advantage expands further to 3.35 × 10¹⁴ sej versus 3.87 × 10¹⁴ sej under extreme scenarios of five annual events.
- (4)
- Material type dominates environmental impact over structural parameters by a factor of 2.32, with recycled aluminum frames reducing ELCI by 12.4%, while increasing rib quantity by 100% increases ELCI by 3.0%. The material substitution elasticity MSE reaches 0.64 for recycled aluminum, and Shapley value attribution shows that material type contributes 67.3% of the marginal impact on ELCI.
- (5)
- The dual-optimum design is identified as the 3.2 mm tempered glass scheme, achieving 30 mm hail resistance, ELCI of 2.89 × 10¹⁴ sej, and GWP of 442 kg CO2 eq, satisfying all three dual-optimum criteria. Its combined sustainability score CSS ranks first at 0.782 among 18 design combinations, with an emergy yield ratio EYR of 3.86, exceeding the industry average of 3.61. However, its life cycle performance is scenario-dependent: standard modules are preferred below one annual hail event, the 3.2 mm glass design dominates between one and four annual events, and steel frame combinations are recommended above four annual events.
- (6)
- Multi-objective optimization using NSGA-II yields a Pareto front of 12 non-dominated solutions across hail resistance from 27 mm to 36 mm, with the 3.2 mm glass design maintaining Pareto optimal status in 72% of Monte Carlo iterations. This research provides a quantitative decision-making framework for climate-adaptive photovoltaic module selection, demonstrating that moderate enhancement with 3.2 mm glass achieves the optimal balance between hail protection and environmental sustainability across most risk scenarios.
Future research can be extended in three directions. First, conduct field exposure tests to validate the actual failure probabilities under different scenarios. Second, expand the model to multi-hazard coupled assessments, including typhoons, heavy snow, and other extreme weather events. Third, introduce dynamic emergy accounting to capture the temporal effects of technological progress and recycling processes on emergy conversion rates.
Supplementary Materials
The following supporting information can be downloaded at: https://www.mdpi.com/article/10.3390/en19133003/s1, Table S1. Nomenclature and Abbreviations. Table S2. Statistical and Optimization Indicators. Table S3. Performance and Design Parameters. Table S4. Institutions and Standards. Table S5. Baseline Material Inventory for Standard PV Module. Table S6. Material Quantities and Initial Emergy for Six Hail-Resistant Designs. Table S7. Renewable and Non-Renewable Emergy Breakdown with ESD (per kWp). Table S8. Life-Cycle Emergy Input (LCEA) Across Four Hail Risk Scenarios. Table S9. Emergy-Based Sustainability Indicators (Consistent with Section 3). Table S10. GWP and Carbon-Related Indicators (Consistent with Section 3.2.1). Table S11. Material Substitution and Recycled Content Effects (Consistent with Section 3.4).
Author Contributions
Conceptualization, J.Z.; investigation, L.Z. and X.Z.; formal analysis, J.Z. and H.W.; methodology, J.Z.; resources, W.W.; writing—review and editing, A.T.A.; G.S. All authors have read and agreed to the published version of the manuscript.
Funding
The work described in this paper was supported by the Undergraduate Innovation and Entrepreneurship Training Program Project of Jiangsu University of Science and Technology in 2024 (No. 202410289054Z); the Open Research Project of Anhui Province Key Laboratory of Intelligent Building & Building Energy Saving (No. IBES2025KF12); the Major Projects of Philosophical and Social Science Research in Universities in Jiangsu Province (No. 2023SJZD131).
Data Availability Statement
The original contributions presented in this study are included in the article. Further inquiries can be directed to the corresponding author.
Conflicts of Interest
The authors declare no conflict of interest.
References
- Perry, K.; Jordan, D.C.; Nguyen, Q. Assessing the Impacts of Extreme Weather Events on Photovoltaic Installations Using Remote Sensing Imagery. Prog. Photovolt. Res. Appl. 2025, 33, 1012–1023. [Google Scholar] [CrossRef] [Scilit]
- Forni, D.; Caccivio, M.; Chudy, D.; Cadoni, E. An experimental investigation of ice ball impact behaviour to improve PV panel hailstone safety. Int. J. Impact Eng. 2025, 202, 105315. [Google Scholar] [CrossRef] [Scilit]
- Cadoni, E.; Forni, D.; Dotta, M.; Bellenda, G.; Caccivio, M. Advanced characterisation of photovoltaics for hail resistance. Mater. Lett. 2024, 354, 135371. [Google Scholar] [CrossRef] [Scilit]
- Sepúlveda-Oviedo, E.H. Impact of environmental factors on photovoltaic system performance degradation. Energy Strategy Rev. 2025, 59, 101682. [Google Scholar] [CrossRef] [Scilit]
- Nicoletto, M.; Panizzon, D.; Caria, A.; Trivellin, N.; De Santi, C.; Buffolo, M.; Meneghesso, G.; Zanoni, E.; Meneghini, M. Hail Damage Investigation in Heterojunction Silicon Photovoltaic Modules: A Real-World Case Study. IEEE J. Photovolt. 2025, 15, 478–483. [Google Scholar] [CrossRef] [Scilit]
- Katinić, M.; Bošnjaković, M. Hailstorm Impact on Photovoltaic Modules: Damage Mechanisms, Testing Standards, and Diagnostic Techniques. Technologies 2025, 13, 473. [Google Scholar] [CrossRef] [Scilit]
- Hartley, J.Y.; Shimizu, M.A.; Braid, J.L.; Flanagan, R.; Reu, P.L. Measurement of Photovoltaic Module Deformation Dynamics During Hail Impact Using Digital Image Correlation. IEEE J. Photovolt. 2024, 14, 646–651. [Google Scholar] [CrossRef] [Scilit]
- Bhattacharya, A.; Gnanaraj, S.; Tabrizi, S.K.; Bhattacharya, S.; Roy, D. Mitigating hail damage in solar modules: A study on the efficacy of dynamic impact angle. Renew. Energy 2026, 266, 125643. [Google Scholar] [CrossRef] [Scilit]
- Repins, I.L.; Kersten, F.; Hallam, B.; VanSant, K.; Koentopp, M.B. Stabilization of light-induced effects in Si modules for IEC 61215 design qualification. Sol. Energy 2020, 208, 894–904. [Google Scholar] [CrossRef] [Scilit]
- Chakraborty, S.; Haldkar, A.K.; Kumar, N.M. Analysis of the hail impacts on the performance of commercially available photovoltaic modules of varying front glass thickness. Renew. Energy 2023, 203, 345–356. [Google Scholar] [CrossRef] [Scilit]
- Muehleisen, W.; Eder, G.C.; Voronko, Y.; Spielberger, M.; Sonnleitner, H.; Knoebl, K.; Ebner, R.; Ujvari, G.; Hirschl, C. Outdoor detection and visualization of hailstorm damages of photovoltaic plants. Renew. Energy 2018, 118, 138–145. [Google Scholar] [CrossRef] [Scilit]
- Ma, Y.; Huang, Y.; Shi, W.; Yuan, Y. A short-term prediction method for distributed photovoltaic power considering extreme weather events. Sol. Energy 2025, 302, 114078. [Google Scholar] [CrossRef] [Scilit]
- Xu, F.; Wu, H.; Ji, B.; Xu, S.; Chen, C.; Uwera, A. Dynamic response and safety performance of composite-laminated heliostat under hail impact. Int. J. Green Energy 2024, 21, 3723–3739. [Google Scholar] [CrossRef] [Scilit]
- Memme, S. Albedo and solar energy harvesting: A review on its impact and estimation in photovoltaic applications. Sol. Energy Mater. Sol. Cells 2026, 304, 114399. [Google Scholar] [CrossRef] [Scilit]
- Makarskas, V.; Jurevičius, M.; Zakis, J.; Kilikevičius, A.; Borodinas, S.; Matijošius, J.; Kilikevičienė, K. Investigation of the influence of hail mechanical impact parameters on photovoltaic modules. Eng. Fail. Anal. 2021, 124, 105309. [Google Scholar] [CrossRef] [Scilit]
- Gupta, V.; Sharma, M.; Pachauri, R.; Babu, K.N.D. Design and development of self-cleaning PV sliding system. Clean Energy 2022, 6, 392–403. [Google Scholar] [CrossRef] [Scilit]
- Kilikevičienė, K.; Matijošius, J.; Fursenko, A.; Kilikevičius, A. Tests of hail simulation and research of the resulting impact on the structural reliability of solar cells. Eksploat. Niezawodn.—Maint. Reliab. 2019, 21, 275–281. [Google Scholar] [CrossRef] [Scilit]
- Kilikevičienė, K.; Matijošius, J.; Kilikevičius, A.; Jurevičius, M.; Makarskas, V.; Caban, J.; Marczuk, A. Research of the energy losses of photovoltaic (PV) modules after hail simulation using a newly-created testbed. Energies 2019, 12, 4537. [Google Scholar] [CrossRef] [Scilit]
- Shao, L.; Xu, H.; Yu, J.; Lou, W. Aerodynamic Mitigation Measure for Wind-Induced Vibration of a Cable-Supported Photovoltaic Farm. J. Struct. Eng. 2026, 152, 04025272. [Google Scholar] [CrossRef] [Scilit]
- Zhu, Y.C.; Li, K.F.; Gao, W.; Wang, J.W.; Xiong, H.N.; Yang, S.S.; Huang, X.B. Research progress of snowmelt promotion and snowmelt monitoring technology on photovoltaic modules. IEEJ Trans. Electr. Electron. Eng. 2024, 19, 1224–1233. [Google Scholar] [CrossRef] [Scilit]
- Nicoletto, M.; Panizzon, D.; Caria, A.; Nicola, T.; Carlo, D.S.; Matteo, B.; Gaudenzio, M.; Enrico, Z.; Matteo, M. Modeling Cracks in Silicon-Heterojunction Photovoltaic Modules: A Real-World Case Study. IEEE J. Photovolt. 2025, 15, 639–644. [Google Scholar] [CrossRef] [Scilit]
- Smith, R.M.; Colvin, D.J. V10: Fixed dark bias current as a photovoltaic module damage assessment metric. Sol. Energy 2025, 288, 113271. [Google Scholar] [CrossRef] [Scilit]
- Zhang, J.; Ma, L. Environmental Sustainability Assessment of a New Sewage Treatment Plant in China Based on Infrastructure Construction and Operation Phases Emergy Analysis. Water 2020, 12, 484. [Google Scholar] [CrossRef] [Scilit]
- Zhang, J.; Asutosh, A.T. A Sustainability Analysis Based on the LCA–Emergy–Carbon Emission Approach in the Building System. Appl. Sci. 2023, 13, 9707. [Google Scholar] [CrossRef] [Scilit]
- Zhang, J.; Zhang, H.; Asutosh, A.T.; Sun, N.; Li, X. The environmental sustainability assessment of building ceramic manufacturing based on the LCA-emergy approach. Environ. Dev. Sustain. 2025, 27, 5999–6024. [Google Scholar] [CrossRef] [Scilit]
- Zhang, J.; Pan, Z.; Li, Y. Analysis of the LCA-Emergy and Carbon Emissions Sustainability Assessment of a Building System with Coupled Energy Storage Modules. Buildings 2025, 15, 151–173. [Google Scholar] [CrossRef] [Scilit]
- Zhang, J.; Ma, L. Urban ecological security dynamic analysis based on an innovative emergy ecological footprint method. Environ. Dev. Sustain. 2021, 23, 16163–16191. [Google Scholar] [CrossRef] [Scilit]
- Brown, M.T.; Ulgiati, S. Emergy-based indices and ratios to evaluate sustainability: Monitoring economies and technology toward environmentally sound innovation. Ecol. Eng. 1997, 9, 51–69. [Google Scholar] [CrossRef] [Scilit]
- Saltelli, A.; Ratto, M.; Andres, T.; Campolongo, F.; Cariboni, J.; Gatelli, D.; Saisana, M.; Tarantola, S. Global sensitivity analysis: The primer. Int. Stat. Rev. 2008, 76, 452. [Google Scholar] [CrossRef] [Scilit]
- Deb, K. Nonlinear goal programming using multi-objective genetic algorithms. J. Oper. Res. Soc. 2001, 52, 291–302. [Google Scholar] [CrossRef] [Scilit]
- Shajahan, M.I.; Michael, J.J.; Prakash, K.B.; Bharathiraja, R.; Alam, M.M.; Hussain, F.; Gulbarga, M.I.; Keçebaş, A. Edge-integrated IoT framework for real-time fault diagnosis and performance degradation analysis in photovoltaic modules. Renew. Energy 2026, 258, 124928. [Google Scholar] [CrossRef] [Scilit]
- Zhang, K.; Ding, B.; Wang, C. Highly Efficient and Stable FAPbI3 Perovskite Solar Cells and Modules Based on Exposure of theFacet. Nano-Micro Lett. 2023, 15, 172–182. [Google Scholar]
- Du, R.; Liao, W.; Zhang, X. Optimal maneuver strategy to improve the observability of angles-only rendezvous. J. Syst. Eng. Electron. 2023, 34, 1020–1032. [Google Scholar] [CrossRef] [Scilit]
- Sofia Palazzo Corner. The sixth major IPCC assessment report and its implications: 15 September 2021. Weather 2022, 77, 70–71. [Google Scholar]
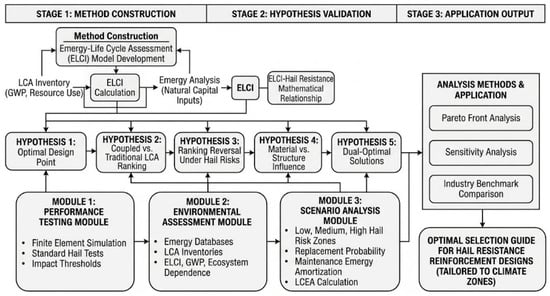
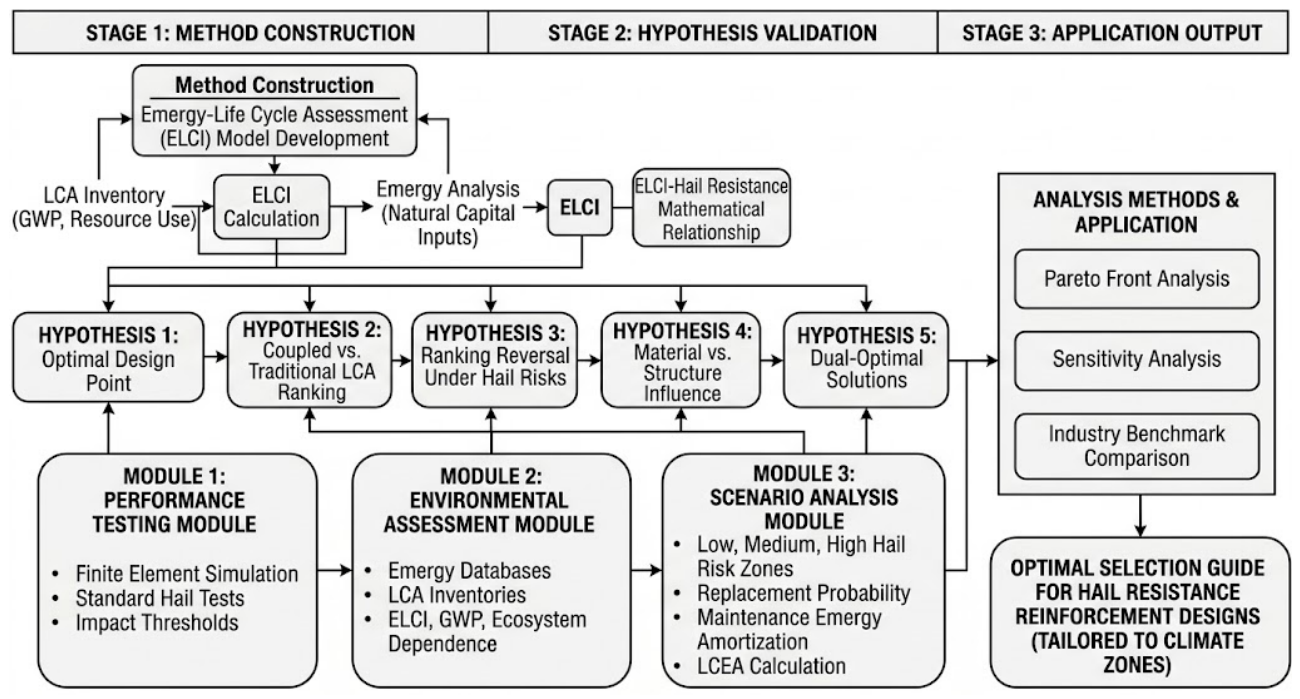
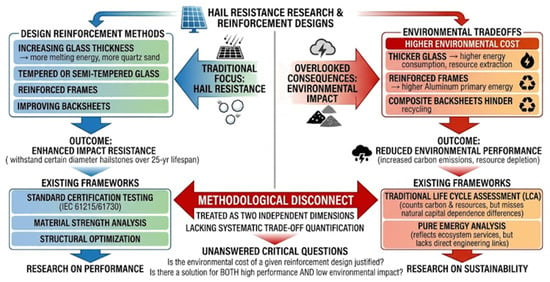
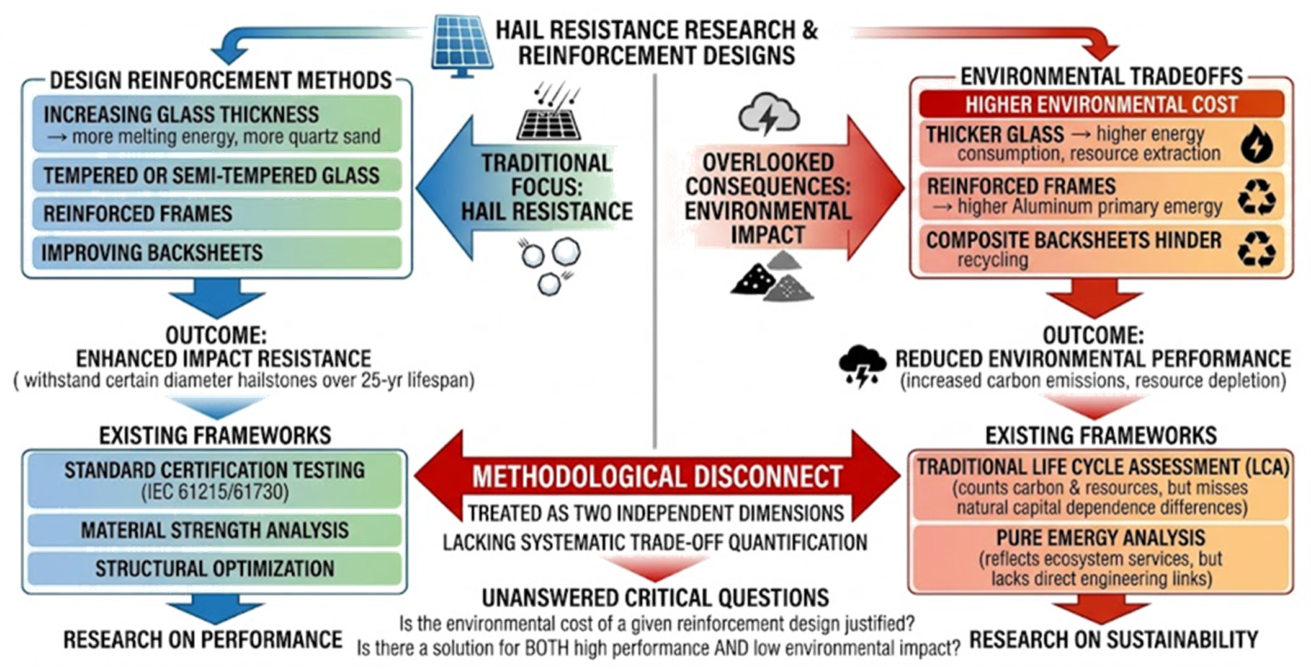
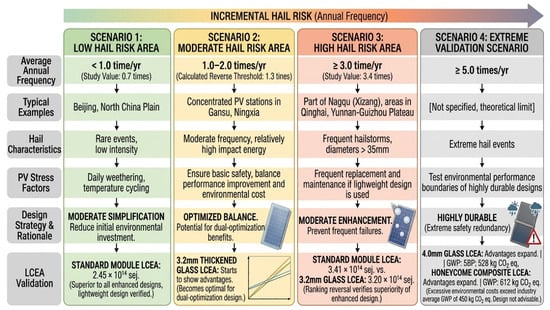
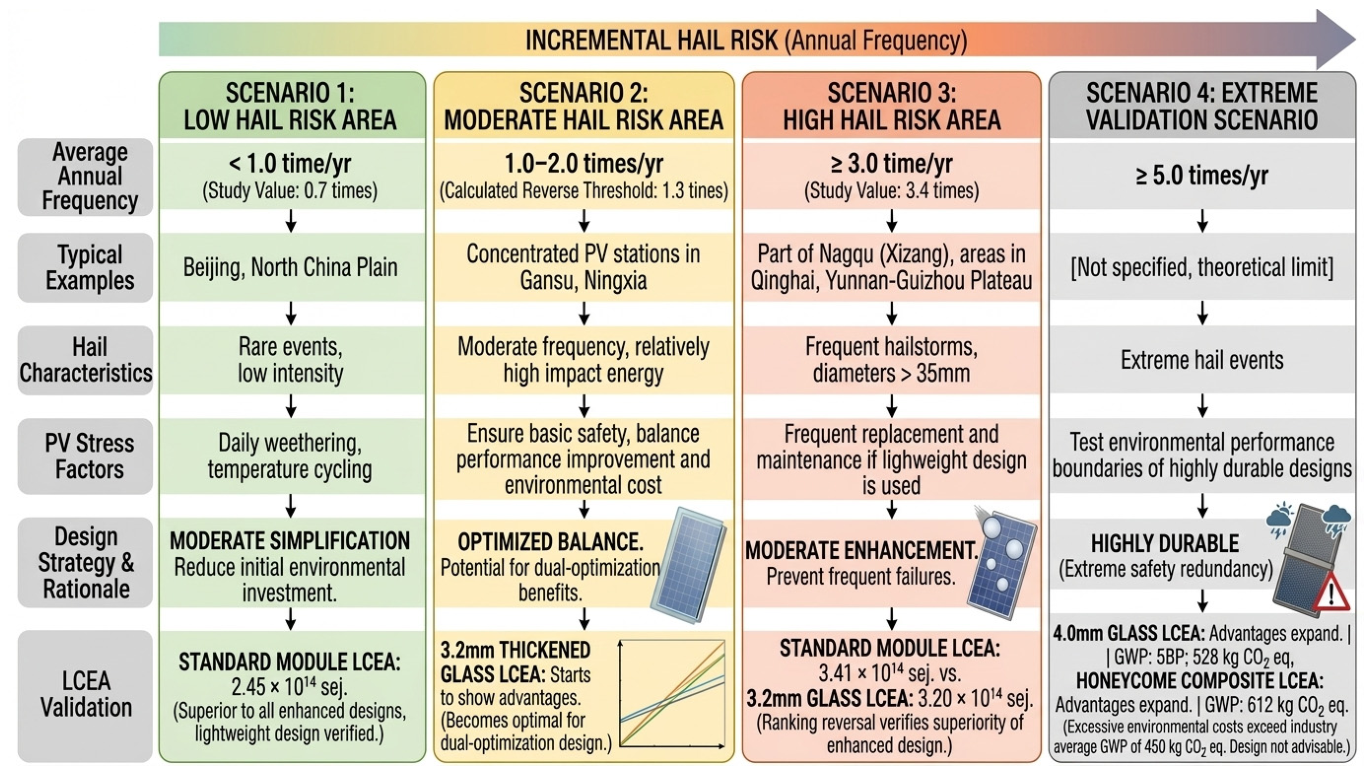
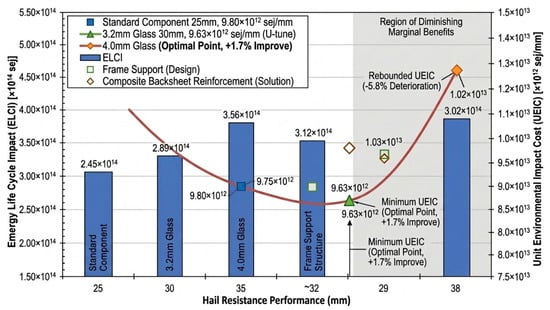
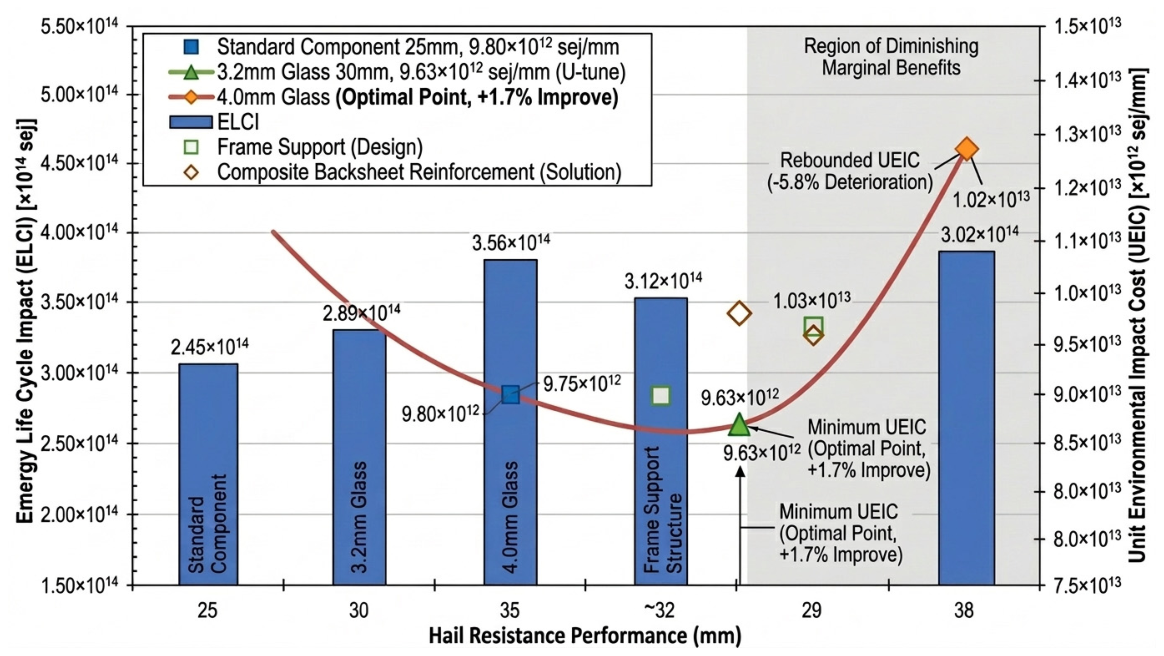
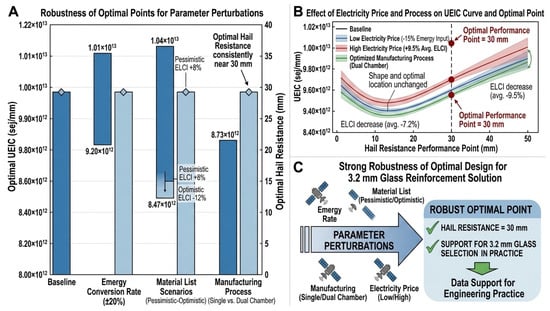
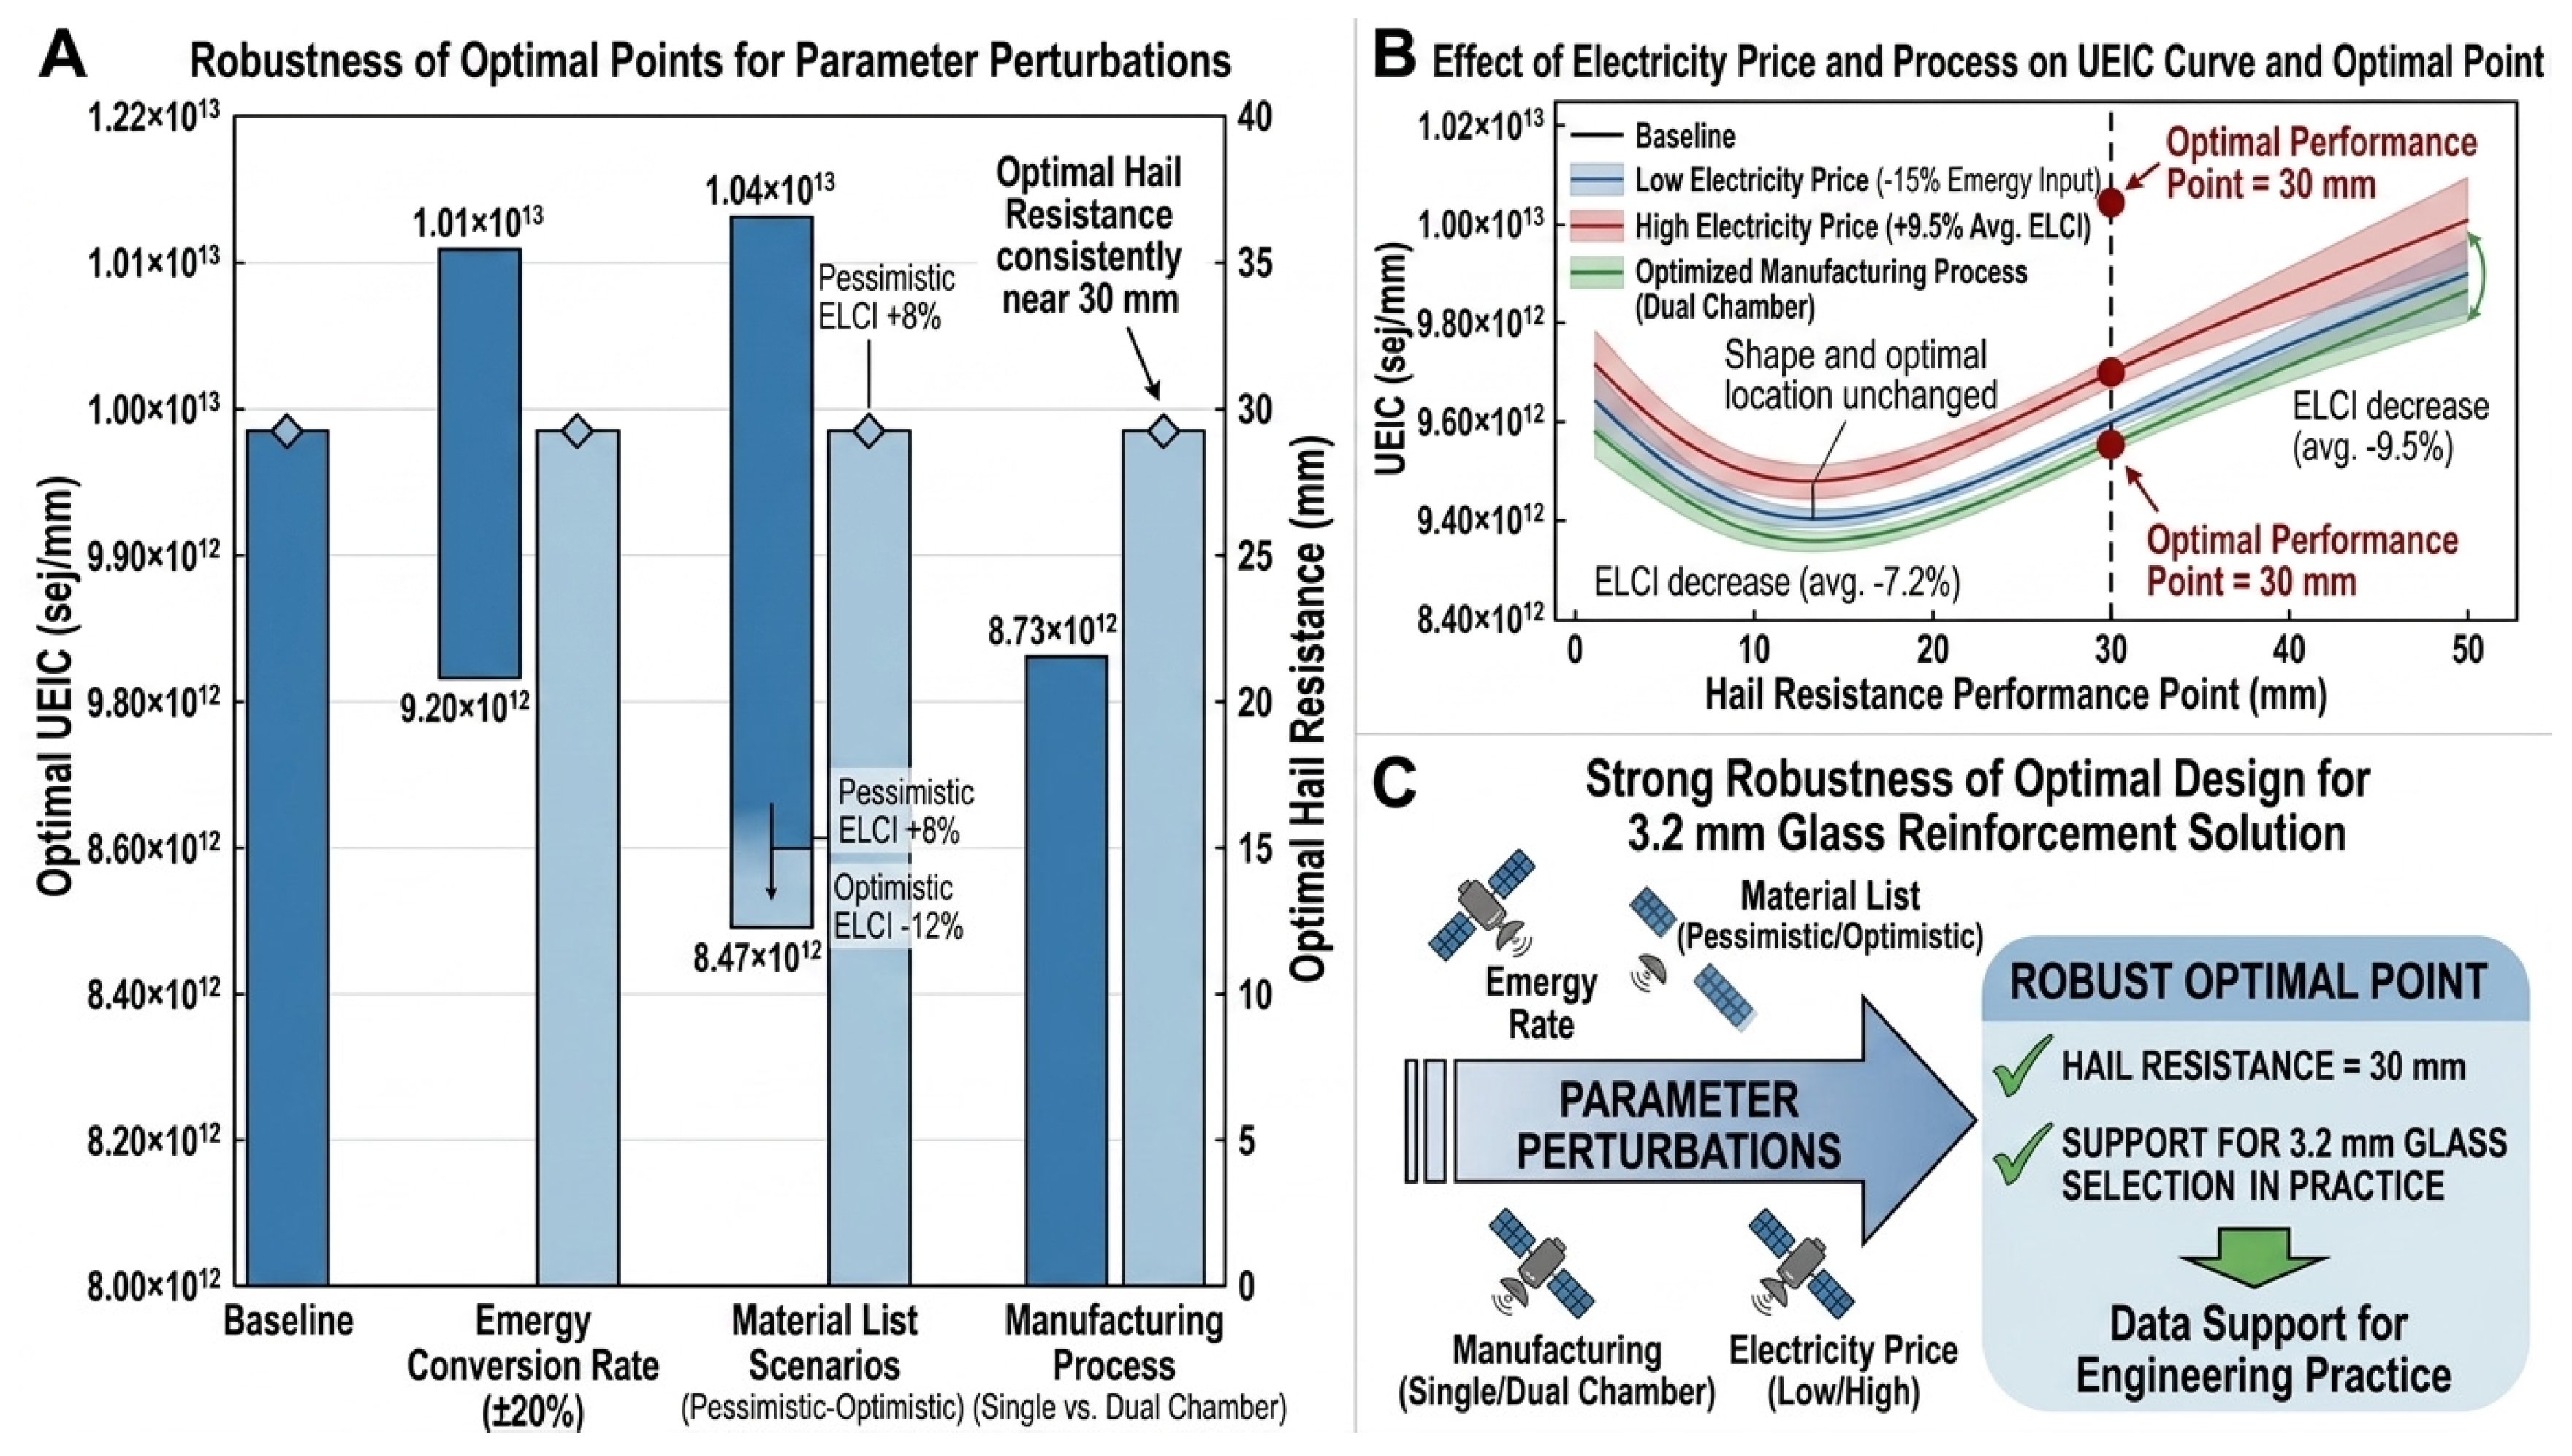
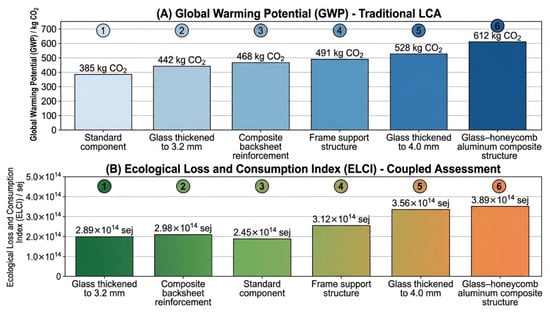
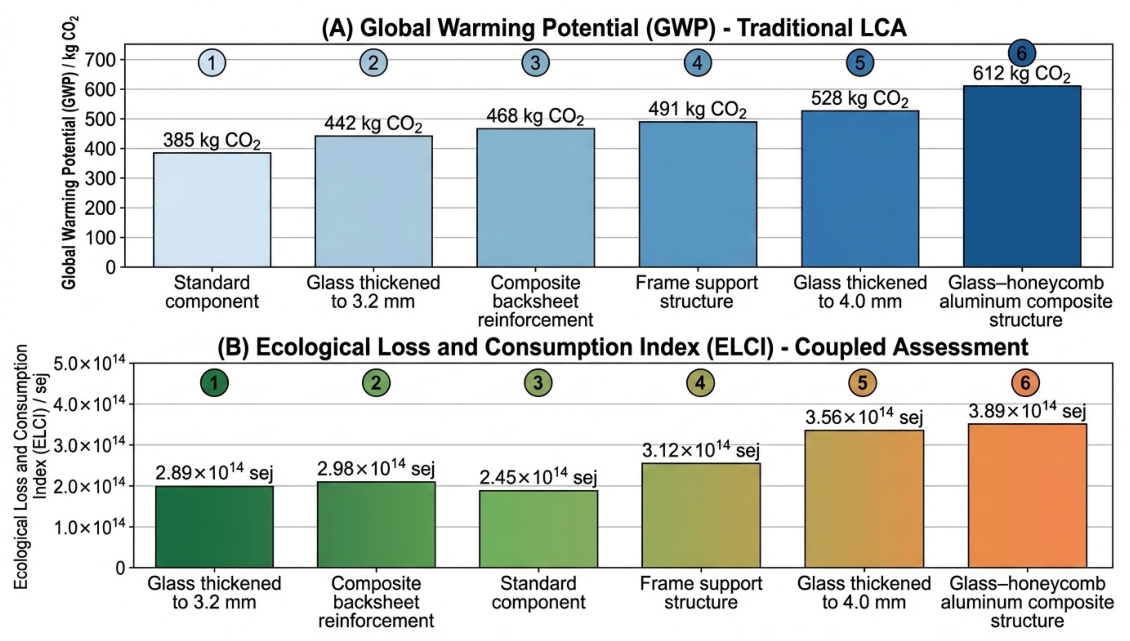
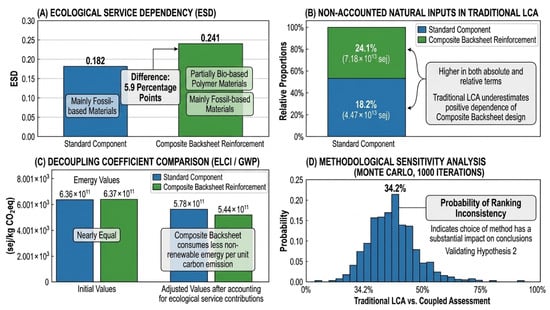
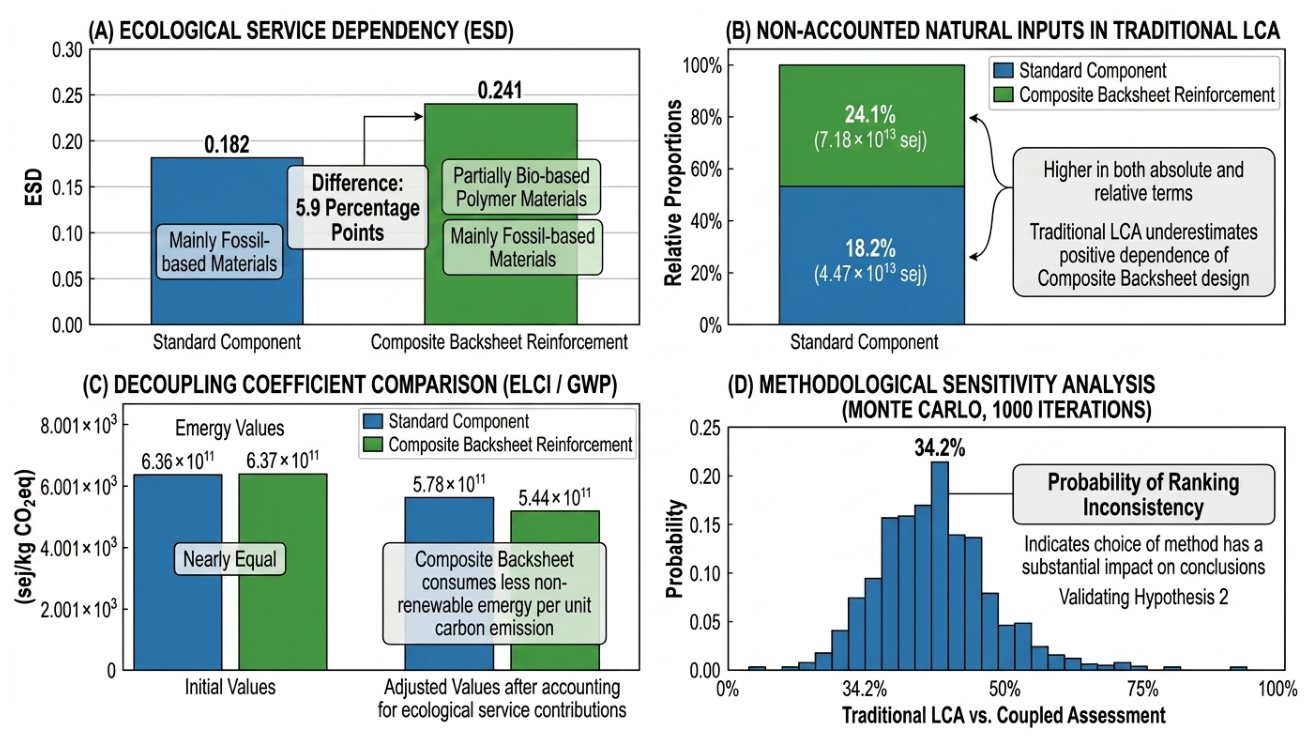
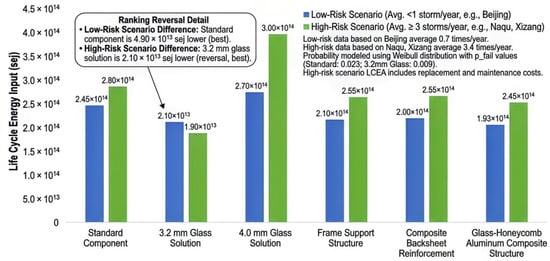
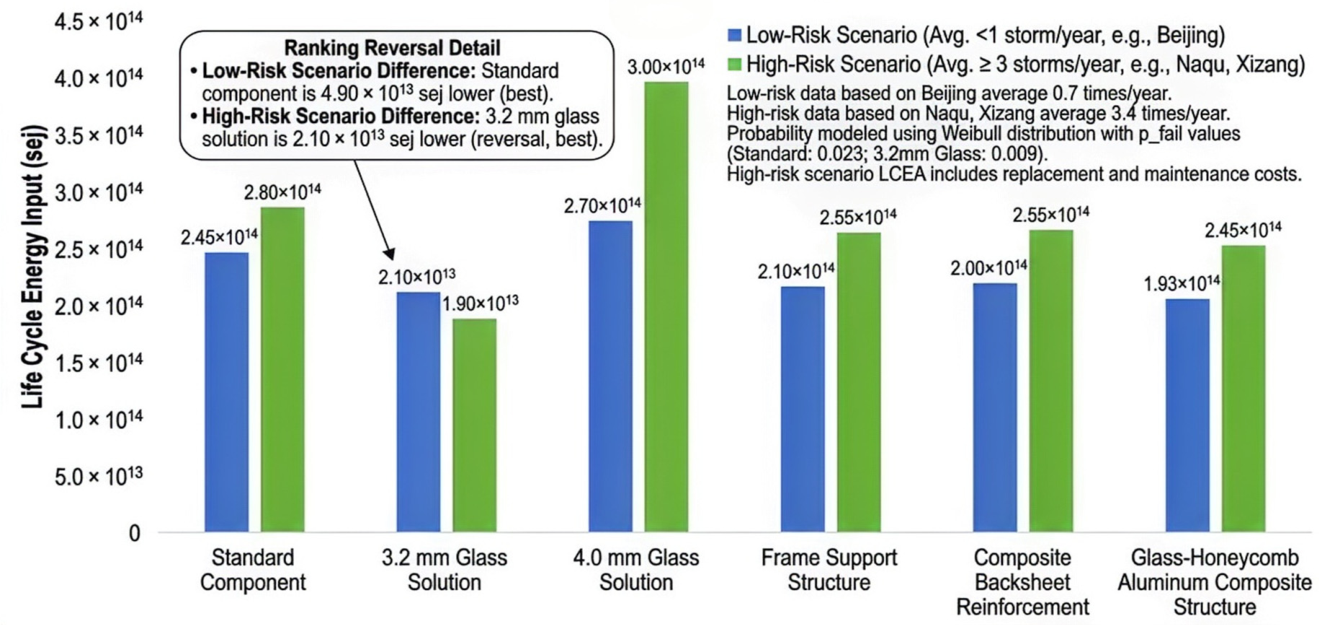
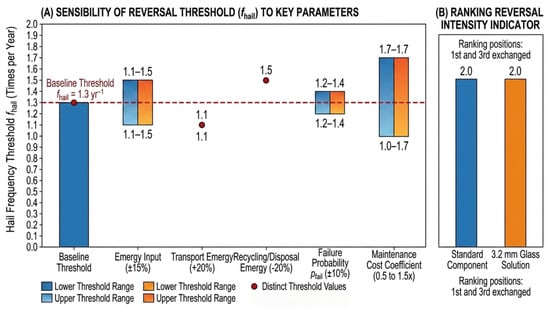
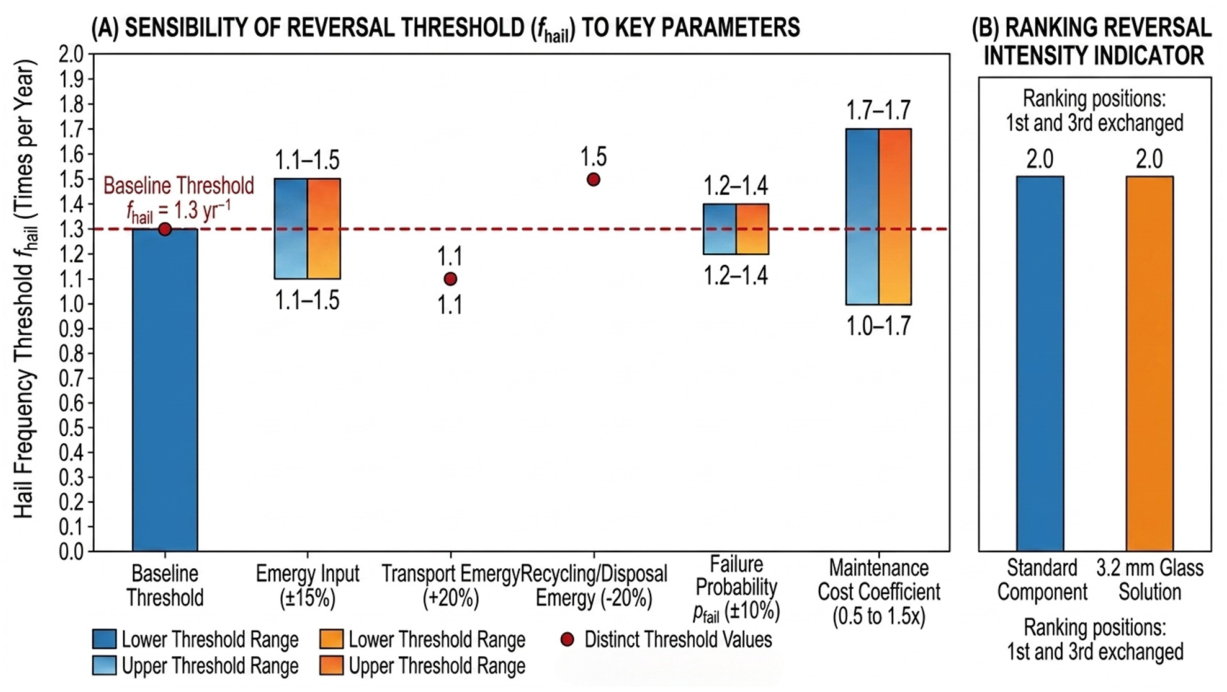
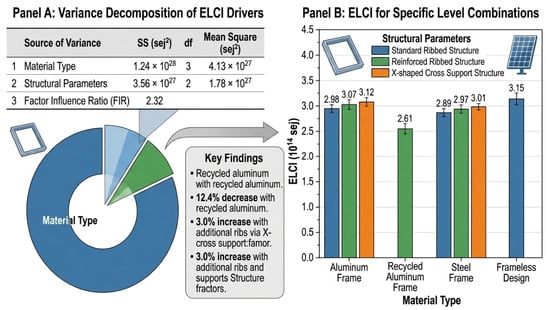
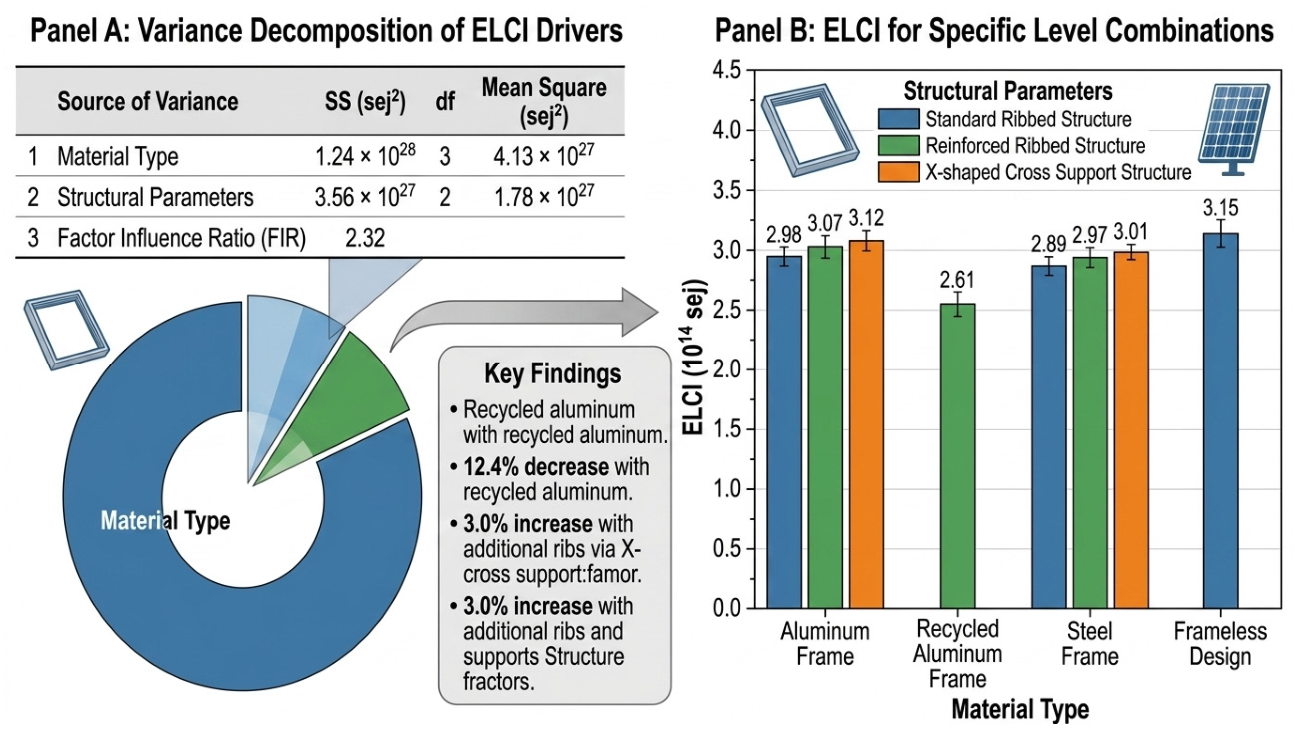
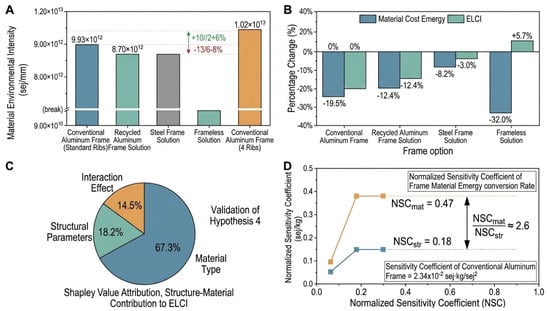
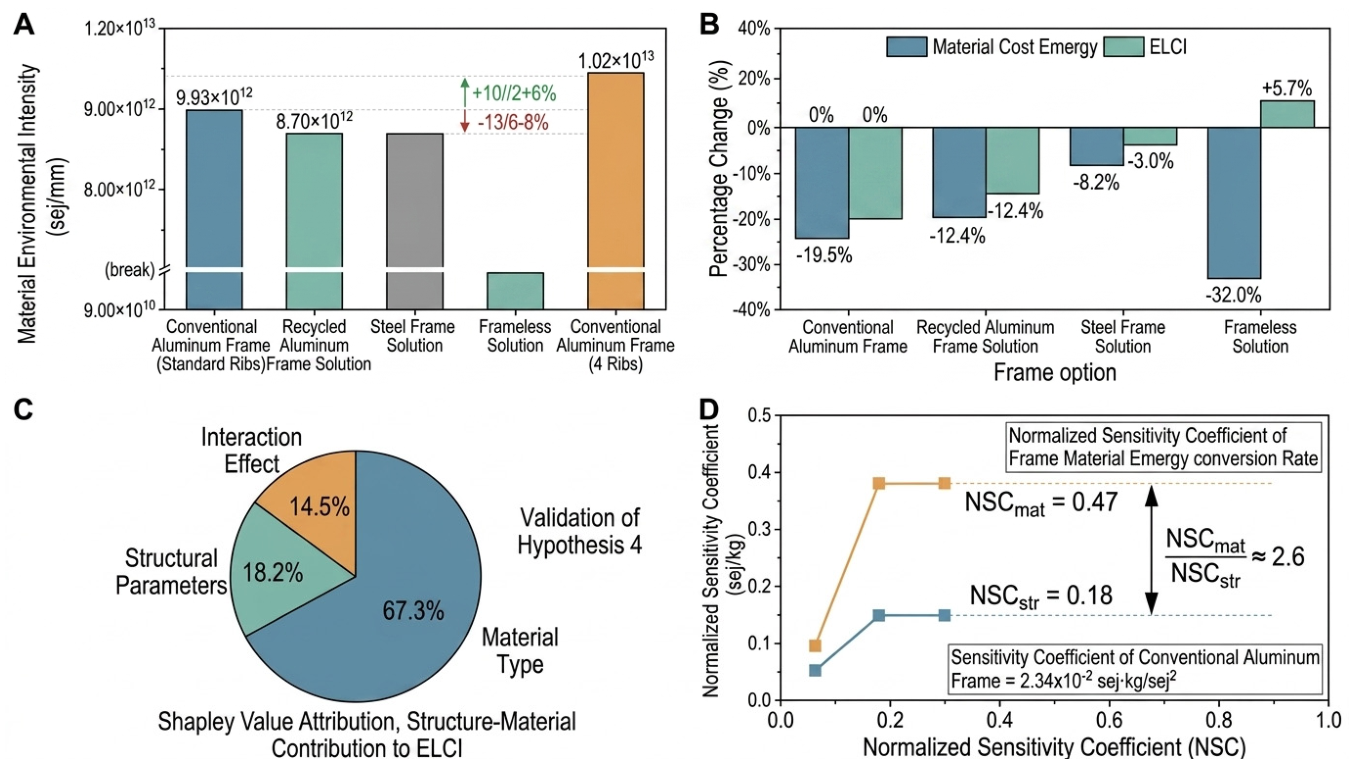
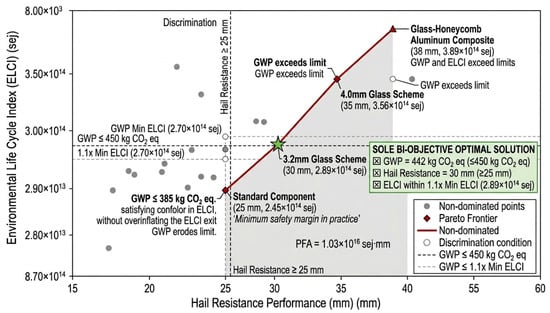
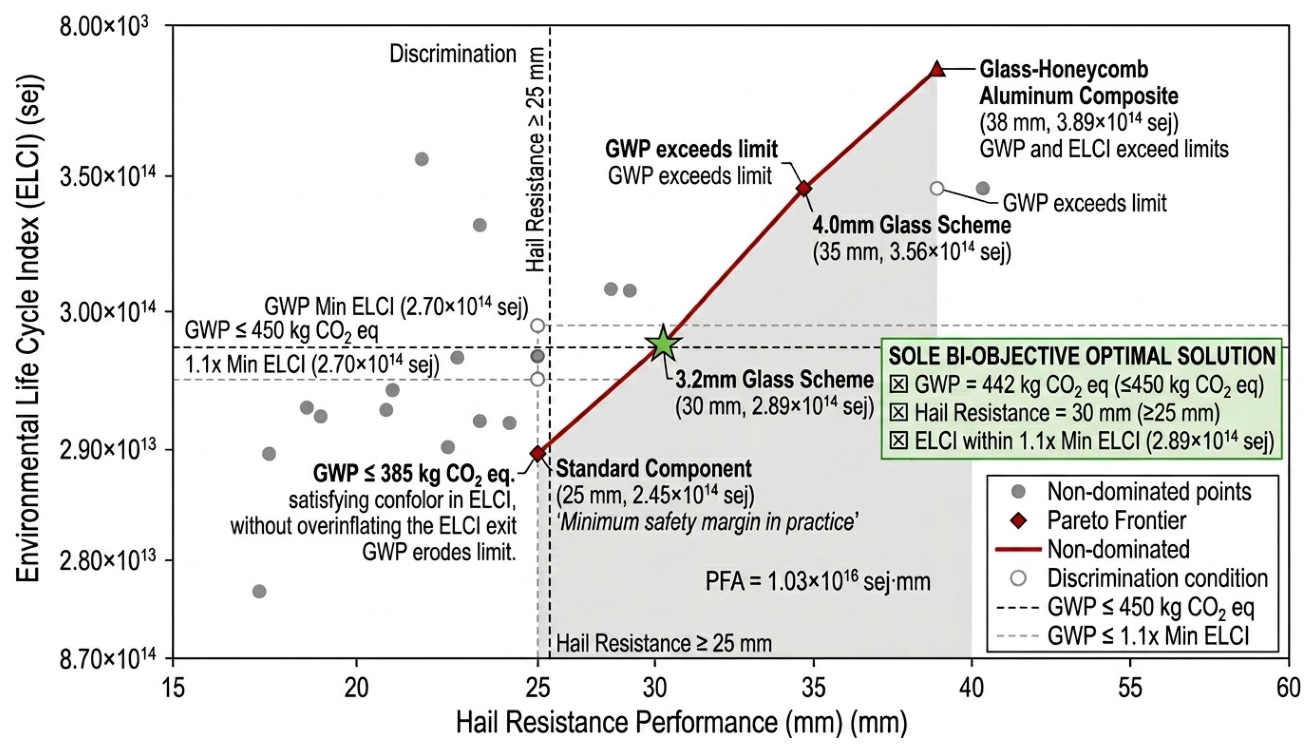
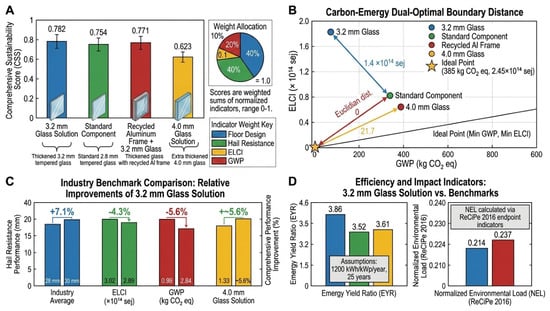
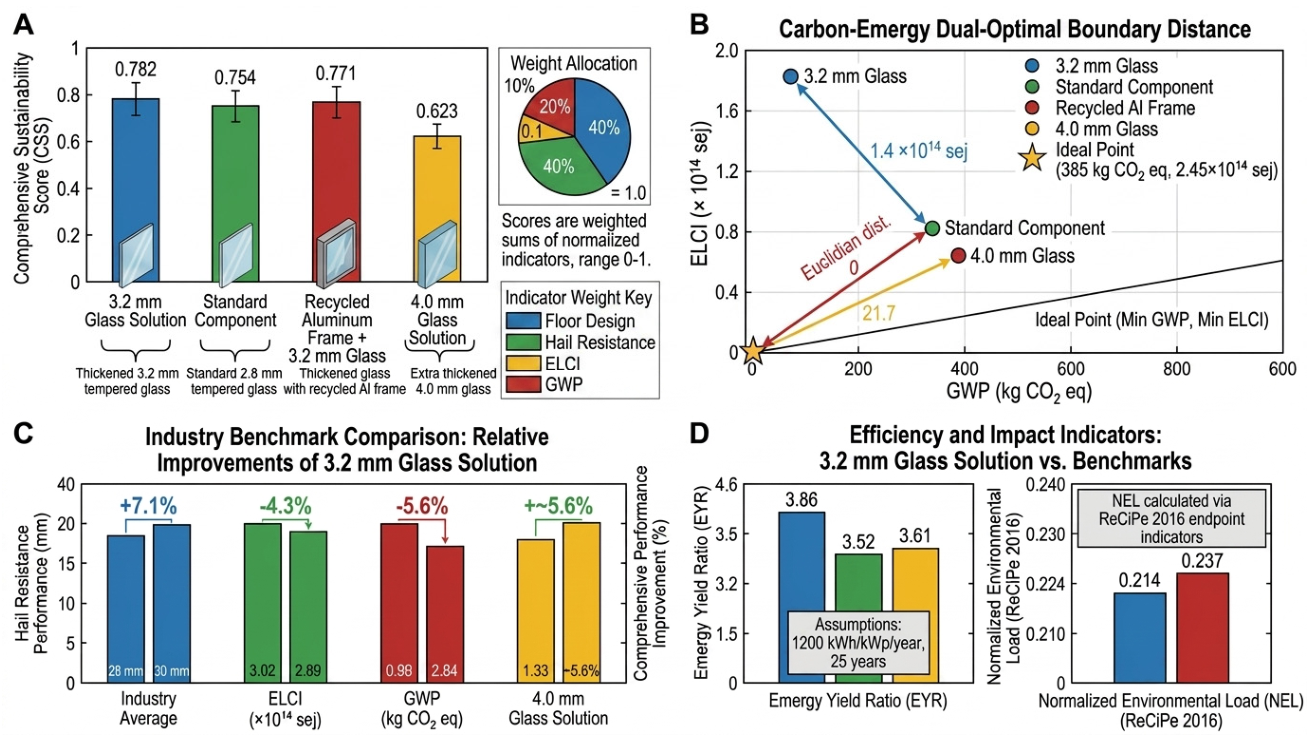
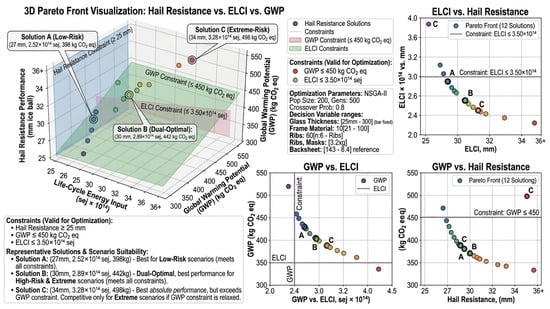
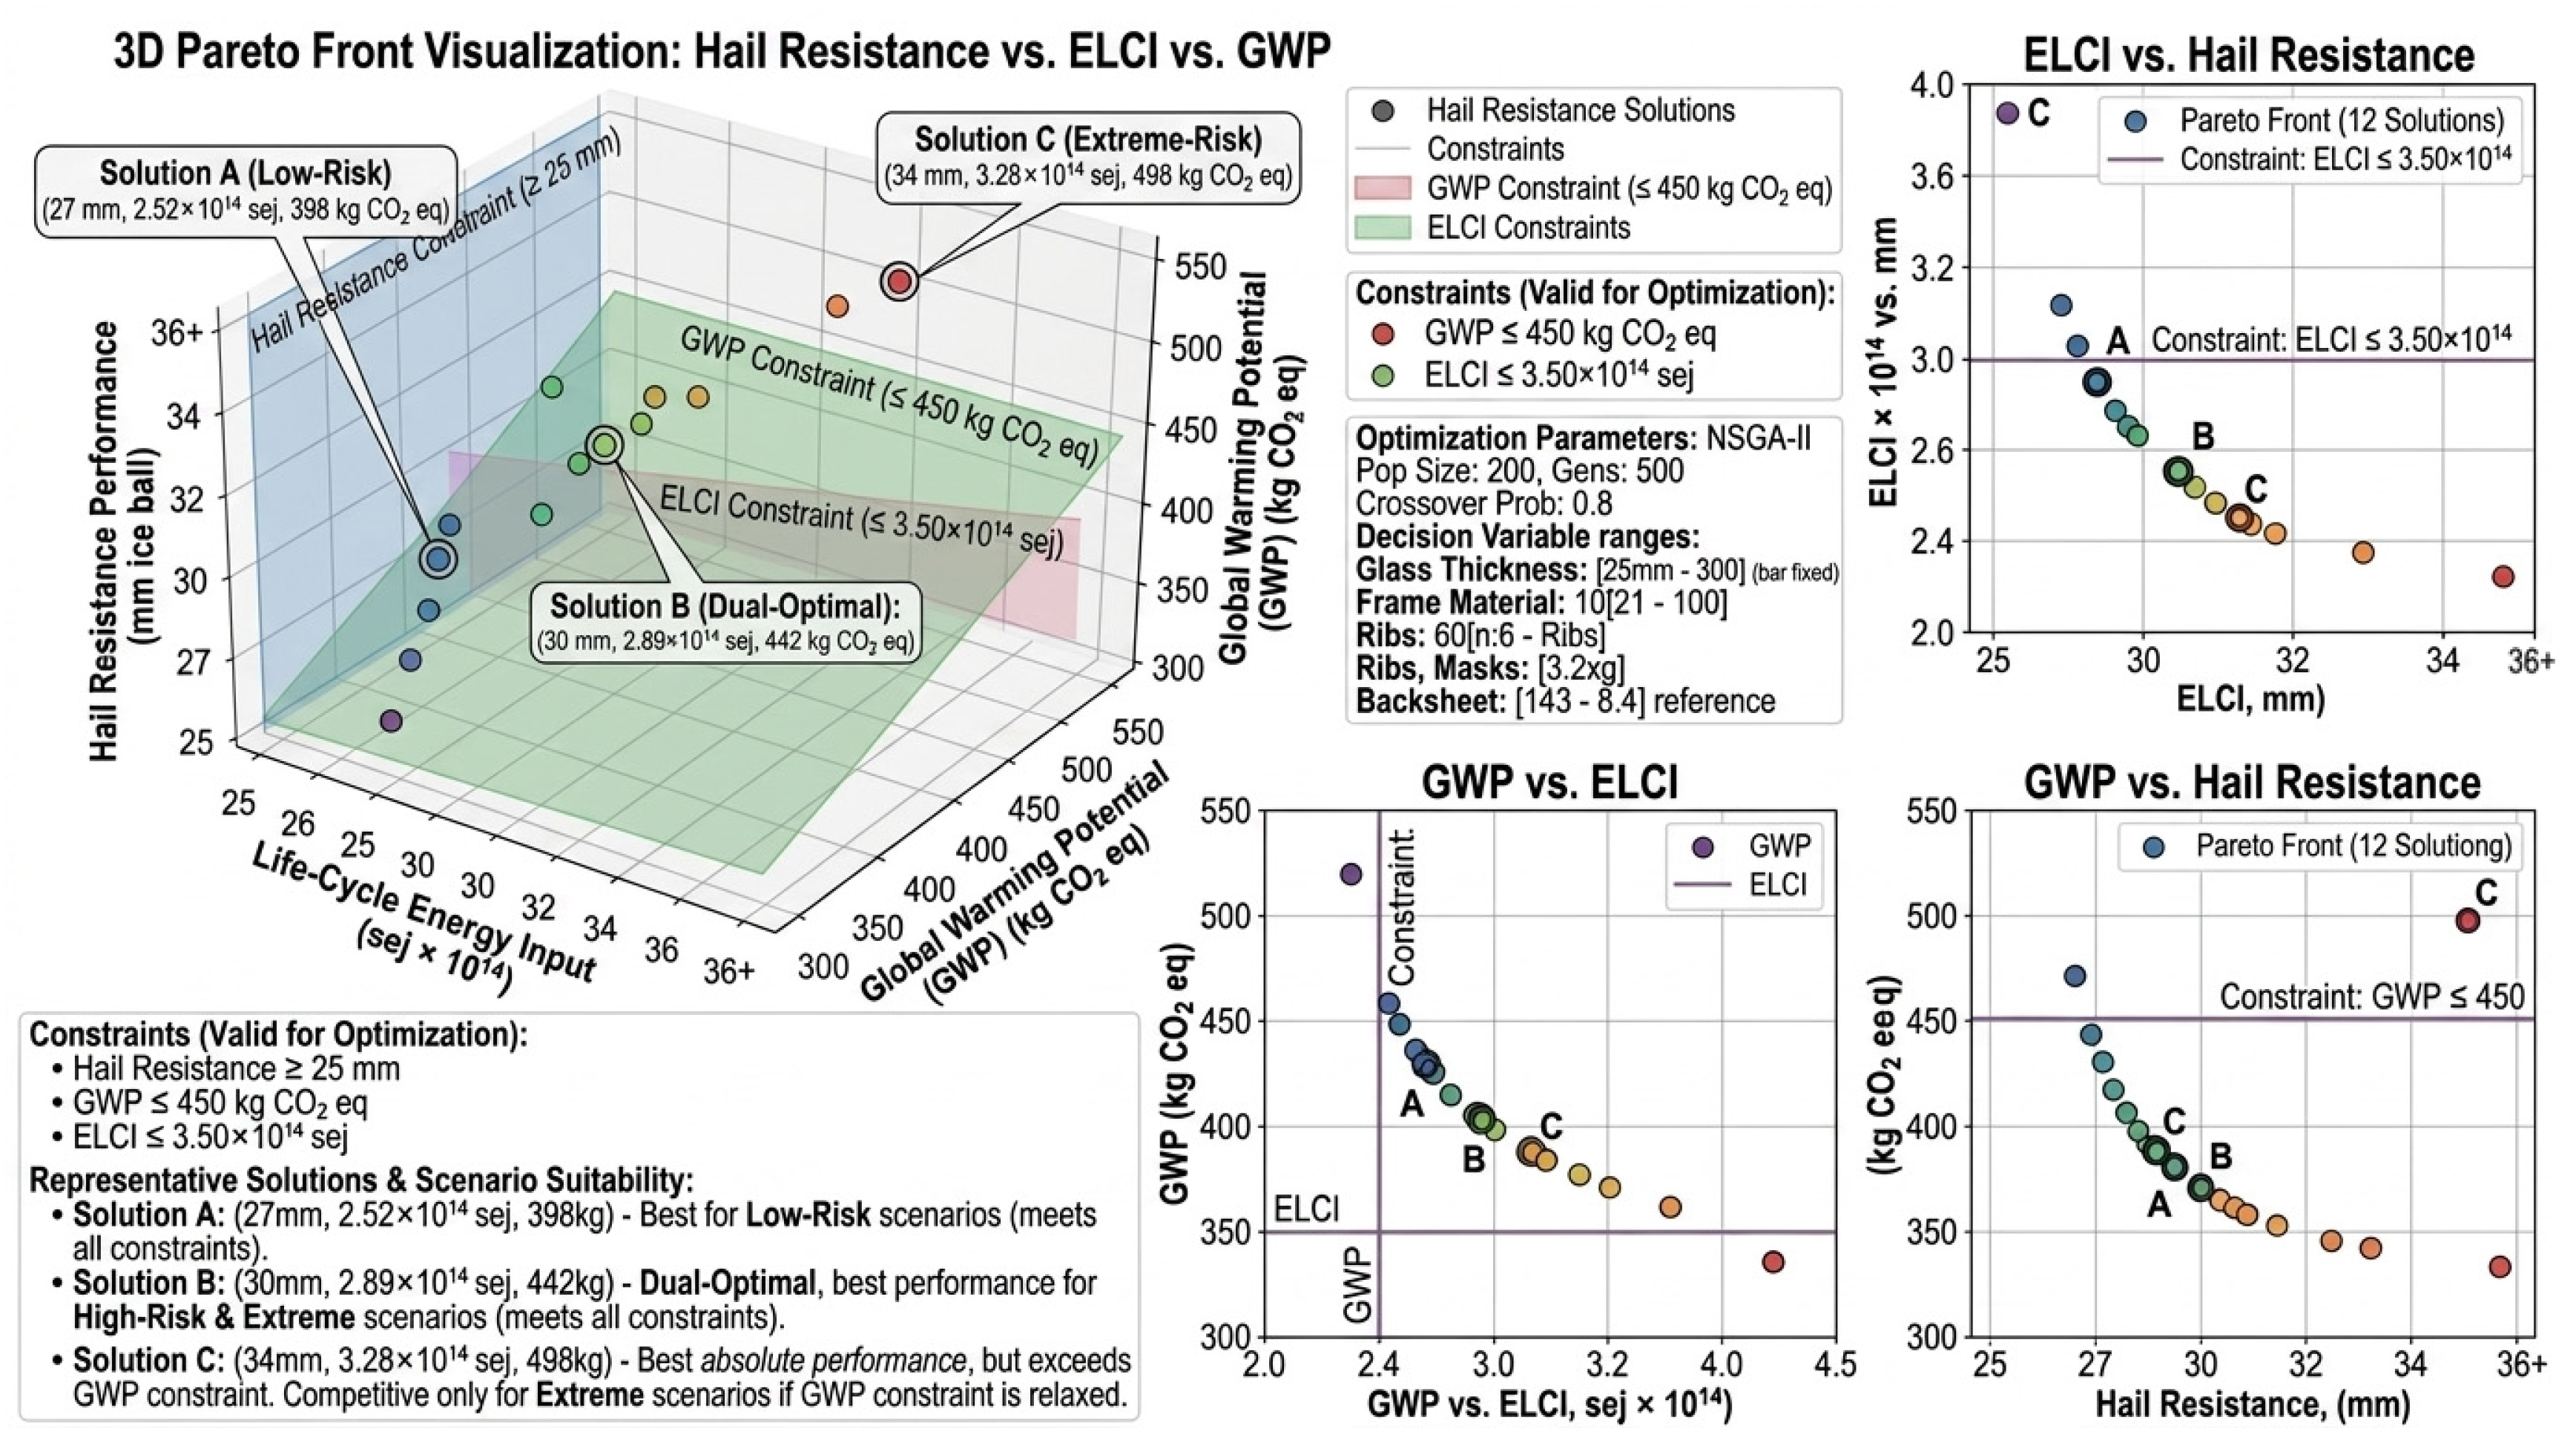
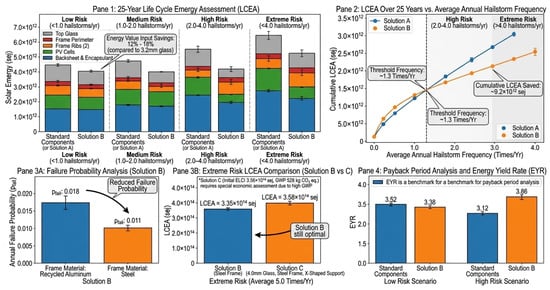
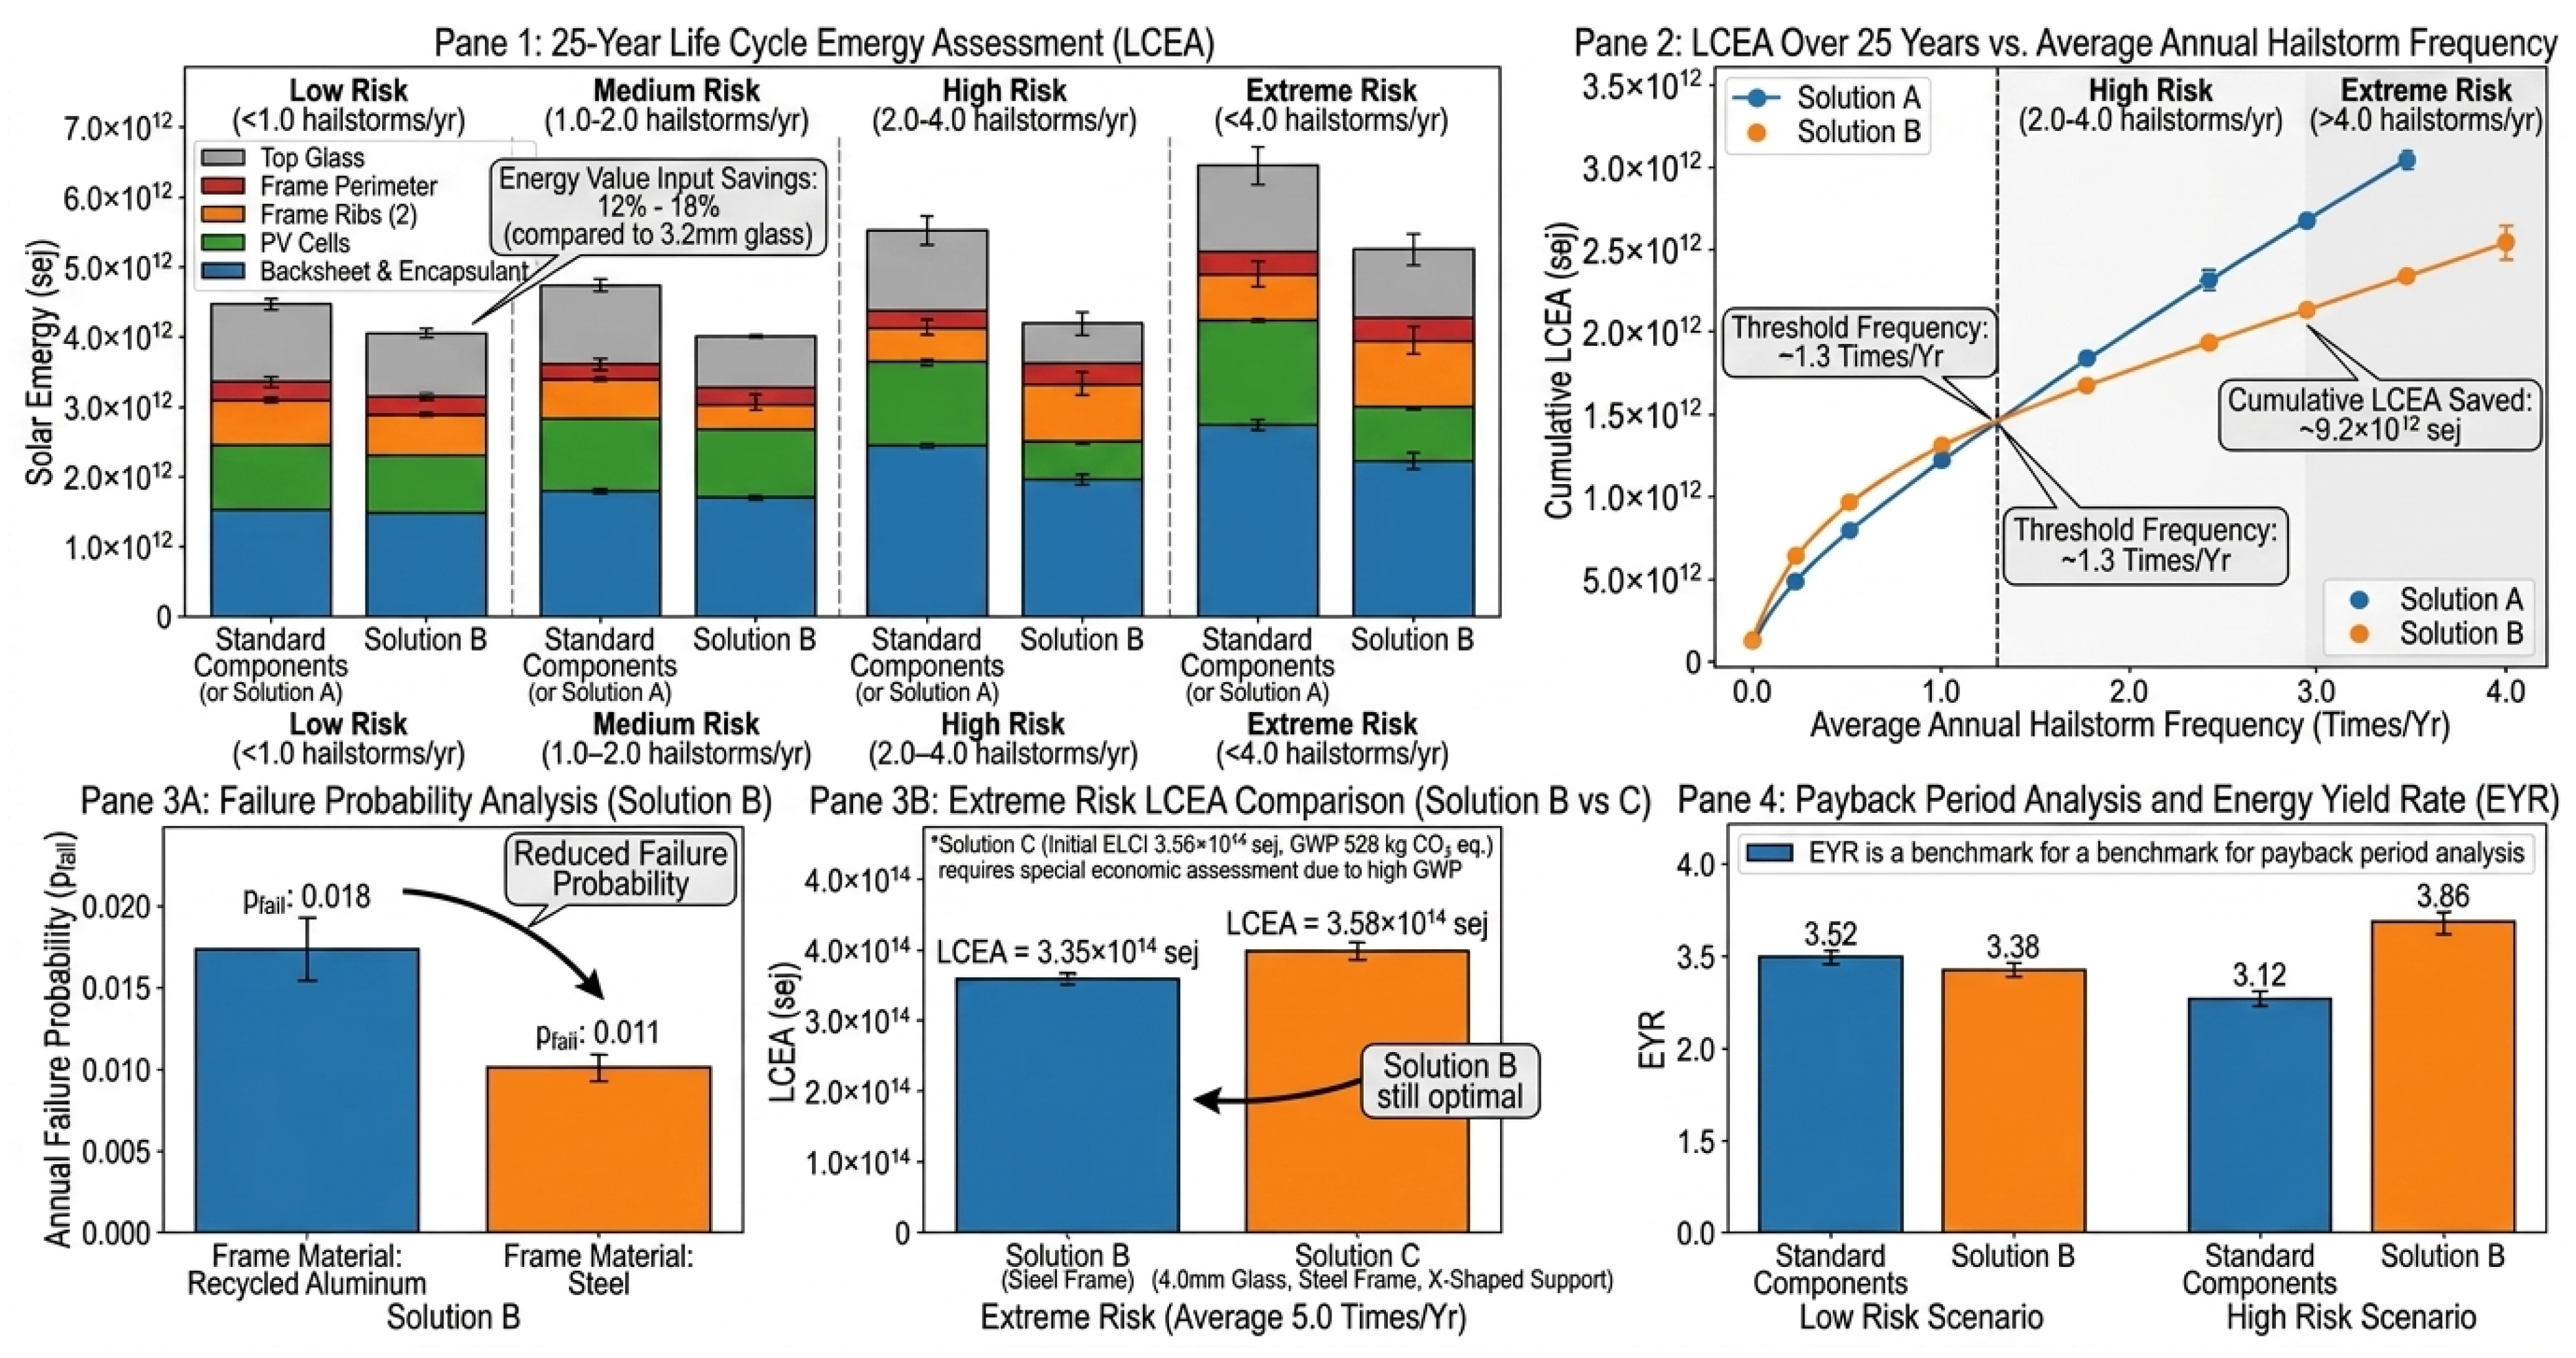
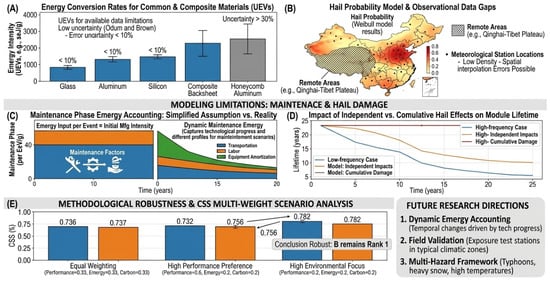
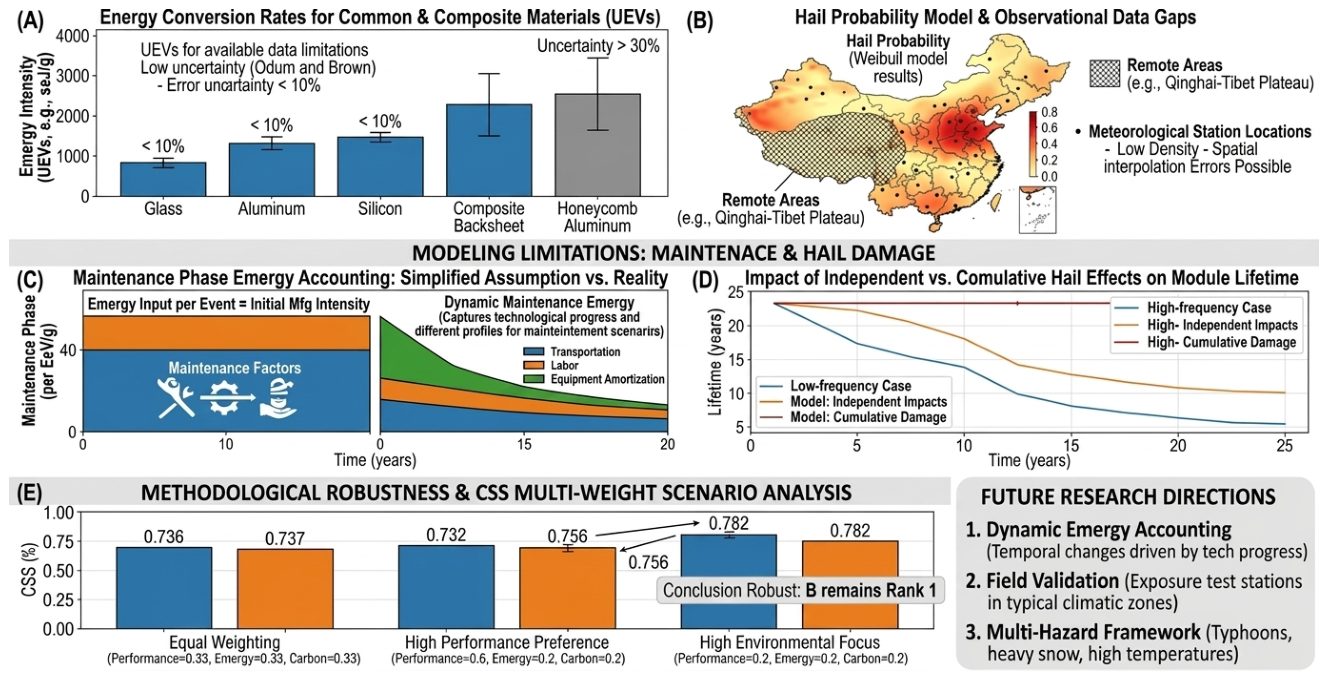

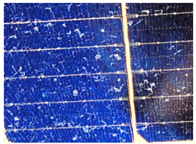
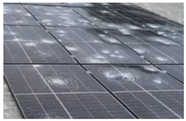
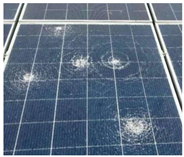
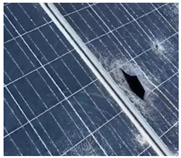
Disclaimer/Publisher’s Note: The statements, opinions and data contained in all publications are solely those of the individual author(s) and contributor(s) and not of MDPI and/or the editor(s). MDPI and/or the editor(s) disclaim responsibility for any injury to people or property resulting from any ideas, methods, instructions or products referred to in the content. |
© 2026 by the authors. Licensee MDPI, Basel, Switzerland. This article is an open access article distributed under the terms and conditions of the Creative Commons Attribution (CC BY) license.