


Abstract
The integration of photovoltaic (PV) generation with alkaline water electrolyzers (AWE) in DC microgrids offers a highly promising pathway for green hydrogen production. However, the inherent volatility of solar power often induces transient voltage ripples and power surges, degrading the electrolyzer stack and destabilizing the common DC bus. To overcome this, this study proposes a hierarchical multimodal coordinated control strategy tailored for a four-port (PV–Storage–Grid–Hydrogen) DC microgrid. The proposed framework leverages multi-port synergetic coordination among the PV array, battery storage, and grid-interfacing converters to actively buffer extreme power mismatches, thereby ensuring the constant regulation of the DC bus voltage. Through comprehensive time-domain simulations under worst-case step-change boundary conditions, the large-signal transient stability of the proposed strategy is quantitatively verified. Under extreme disturbances, the system successfully confines DC bus voltage deviations to within safe operational boundaries with a rapid settling time, effectively avoiding typical inverter overvoltage trip thresholds. Furthermore, the adaptive power regulation algorithm maintains precise steady-state power tracking. By utilizing a gradient-based flag variable, the system seamlessly transitions between maximum power point tracking (MPPT) and active power-limiting modes, ensuring continuous equipment protection, stable high-purity hydrogen yield, and uninterrupted microgrid stability.
1. Introduction
The integration of photovoltaic (PV) generation with alkaline water electrolyzers (AWE) to produce green hydrogen—known as Power-to-Hydrogen (P2H)—is widely recognized as a highly valuable and promising pathway for deep global decarbonization. Compared to traditional AC grid connections, deploying P2H within a multi-port DC microgrid architecture offers profound positive advantages. A centralized DC bus configuration eliminates the need for multiple DC-AC-DC conversion stages, significantly improving overall energy efficiency, reducing capital expenditures, and naturally avoiding complex AC synchronization issues. Consequently, coordinating PV arrays, energy storage, grid interfaces, and electrolyzers within a unified DC microgrid has become a highly attractive solution for building self-sufficient and sustainable energy hubs [1,2,3].
While addressing the electrical power mismatches in P2H systems is critical, it is equally important to acknowledge the broader resource requirements associated with green hydrogen production, particularly the substantial demand for high-purity water. Theoretically, water electrolysis requires approximately 9 kg of water to produce 1 kg of hydrogen. However, in practical industrial systems, this requirement escalates to 20–30 L of water per kg of hydrogen when purification, cooling, and balance-of-plant requirements are factored in. Given that global freshwater resources are limited and increasingly under stress, integrating seawater desalination technologies with renewable hydrogen production has emerged as one of the most sustainable and optimal solutions [4,5]. Therefore, ensuring the highly efficient and stable electrical operation of these P2H plants becomes even more crucial to maximize the utilization of these precious water and energy resources.
Despite the inherent advantages of DC microgrids, the highly volatile and intermittent nature of solar generation poses a severe challenge to the stringent operational requirements of electrolyzers, necessitating optimal sizing and coordinated scheduling [6,7,8]. Extensive research has been conducted on the dynamic modeling, techno-economic evaluation, and overarching topologies of P2H systems [9,10,11,12,13,14,15,16]. Earlier studies and specialized converter design primarily focused on direct coupling configurations or basic power interfaces; however, these systems often fail to maintain the electrolyzer’s optimal operating point under varying solar irradiance, suffering from severe energy mismatches and frequent system shutdowns during low-irradiance periods [17,18].
To mitigate this, intermediate power electronic interfaces and hybrid energy storage systems have been increasingly introduced to buffer power fluctuations and provide grid-supporting services [19,20,21]. Recent advancements have explored various power smoothing algorithms, such as adaptive distributed droop control and advanced converter topologies, to allocate the low-frequency power variations to the battery energy storage systems within DC microgrids [22,23,24]. However, the current literature largely lacks analytical, multimodal coordination mechanisms capable of managing extreme state transitions. Conventional hierarchical control strategies in multi-port DC microgrids primarily focus on generalized power balancing and often treat the electrolyzer merely as a variable resistive load [25].
By prioritizing the DC bus voltage regulation, these traditional architectures inevitably transfer the transient dynamic stresses to the hydrogen production unit. A critical technical gap remains: most existing controls fail to adequately decouple the high-frequency voltage ripples and intermittent power surges of the PV array from the sensitive electrolyzer stack. Inadequate buffering leads not only to poor 660 V DC bus voltage stability under extreme weather step-changes, but also inflicts severe physical damage on the AWE. Frequent power fluctuations exacerbate catalyst degradation, increase the risk of dangerous gas crossover (which severely reduces hydrogen purity), and drastically shorten the overall operational lifespan and fault tolerance of the stack [26].
Recent literature has explored various advanced control and scheduling strategies to mitigate the intermittent nature of renewable energy in microgrids and protect hydrogen production units. Advanced optimization and risk-based scheduling frameworks have been widely investigated to handle multi-objective dispatch and explicit system constraints, such as utilizing hydrogen production stations for dynamic frequency support [27,28]. Similarly, artificial intelligence (AI)-based approaches, particularly advanced safe reinforcement learning algorithms, offer strong adaptability to generation uncertainties and the nonlinear dynamic efficiency characteristics of electrolyzers [29,30,31].
However, these advanced AI and risk-based optimization methods heavily rely on highly accurate system models and impose a severe computational burden. This makes real-time parameter design and high-frequency transient response analysis in power electronic converters highly challenging for standard industrial applications. On the other hand, conventional adaptive control and droop methodologies, while more computationally efficient, often struggle under extreme large-signal boundary conditions. In traditional power-following P2H modes, the thermodynamic and electrical states of the alkaline water electrolyzer (AWE) are inherently coupled with the common DC bus. Under extreme transients (e.g., instantaneous severe irradiance drops), this coupling frequently induces competing control loops, leading to high-frequency coupled oscillations and harmful transient current surges that degrade the AWE stack.
Therefore, a critical research gap remains in the current literature: there is an urgent need for a practical control framework that achieves the robust transient stability and system resilience promised by advanced algorithms, but without their associated computational overhead and modeling complexity. To bridge this gap, this study proposes a hierarchical multimodal coordinated control strategy tailored for a four-port (PV–Storage–Grid–Hydrogen) DC microgrid. Table 1 explicitly highlights the novelty of the proposed strategy compared to existing hierarchical control frameworks.
Table 1.
Comparison of previous P2H control strategies and the proposed method.
Relying on a stable 660 V DC bus as the main integration point, the primary contributions of this work that distinguish it from prior studies are explicitly summarized as follows:
- (1)
- Novel Decoupled Control Architecture: Unlike conventional frameworks that couple electrolyzer operation with bus regulation, the proposed strategy operates the AWE strictly under Constant Current (CC) control. This physically isolates the sensitive stack from PV intermittency, significantly enhancing hydrogen purity and protecting the equipment from accelerated degradation.
- (2)
- Robust DC Bus Voltage Stability: A highly responsive multimodal coordination logic is developed for the battery and grid-interfacing converters. It actively buffers extreme power mismatches, strictly confining the 660 V DC bus voltage deviations to within minimal limits.
- (3)
- Enhanced System-Level Efficiency: By establishing a complete mathematical modeling framework, the system dynamically seamlessly transitions between Maximum Power Point Tracking (MPPT) and constant power-limiting modes. This precisely curtails output only when necessary, dynamically preventing bus overvoltage while maximizing the continuous capture of solar energy.
2. Materials and Methods
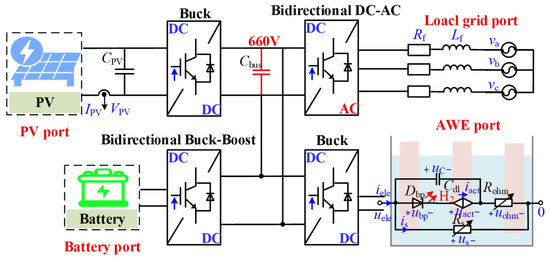
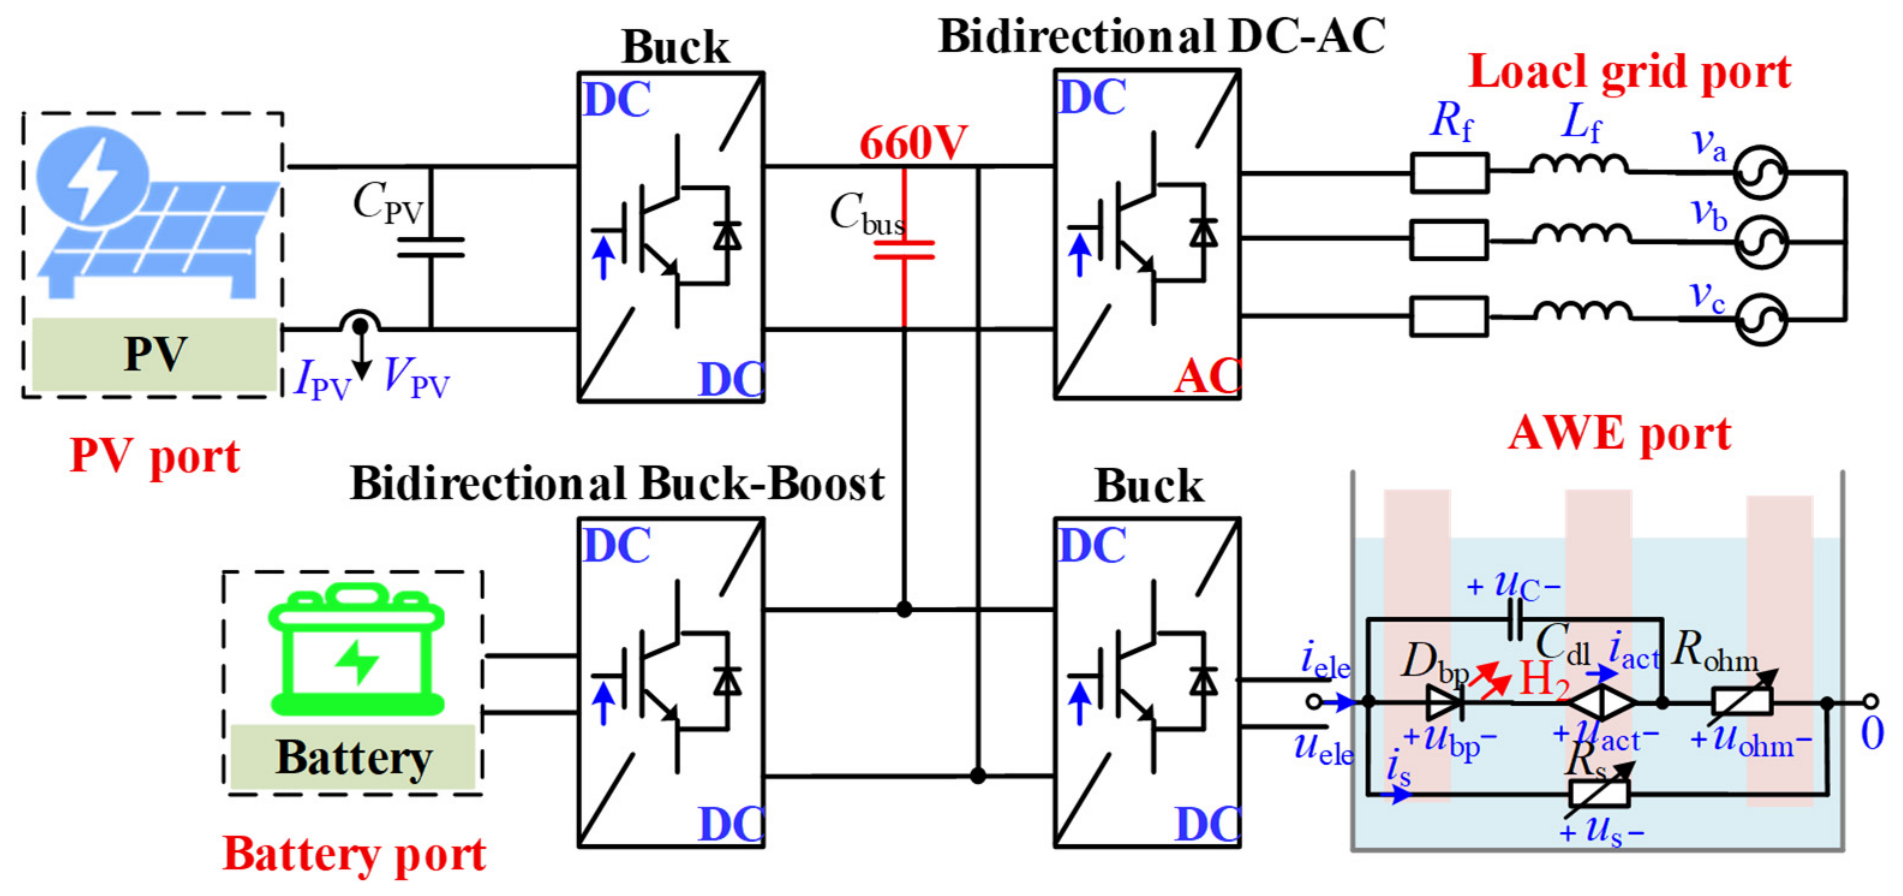
The overall architecture of the four-port PV–hydrogen system is illustrated in Figure 1, the proposed architecture centers on a consistent 660 V direct current bus that serves as the primary integration point for various energy assets. This centralized configuration facilitates the synchronized regulation of solar power, water electrolysis, battery storage, and the local electrical network. By streamlining these diverse inputs, the system prioritizes the immediate use of renewable generation to drive efficient and reliable green hydrogen synthesis. It should be clarified that the system architecture and parameters detailed in this study represent a hypothetical simulation case designed for the theoretical verification of the proposed control strategy. Nevertheless, to ensure practical engineering relevance, the component capacities and voltage levels (e.g., the 1 MW PV array, 600 kW AWE, and 660 V DC bus) are strictly derived from typical, real-world industrial specifications.
Figure 1.
Four-Port P2H System Architecture.
To rigorously evaluate the proposed multimodal coordinated control strategy, the mathematical models utilized in this study are strictly tailored for short-term electromagnetic transient (EMT) analysis. Consequently, two primary simplifying assumptions were adopted to isolate the electrical control dynamics.
First, the alkaline water electrolyzer (AWE) is assumed to operate at a constant internal temperature. Because the thermal time constant of industrial AWE systems spans from tens of minutes to several hours due to their large thermal mass, the temperature variation during the ultra-short simulation windows of this study (typically 3 to 5 s) is entirely negligible. Second, the simplified PV model omits internal parasitic series and shunt resistances. This assumes an ideal macroscopic power output, effectively focusing the computational resources on the dynamic tracking capabilities of the controllers and the active power buffering of the grid-interfacing and battery converters. These assumptions are mathematically sound for sub-second transient stability evaluations and effectively prevent long-term thermodynamic degradation variables from confounding the high-frequency control loop analysis.
While these simplifying assumptions are necessary to isolate the high-frequency EMT control dynamics, their implications on macroscopic accuracy must be explicitly defined. Neglecting the internal series and shunt parasitic resistances in the PV array slightly overestimates the steady-state power conversion efficiency by approximately 1% to 2%, particularly under low-irradiance conditions. However, this idealization has a negligible impact on the dynamic transient trajectory and settling time of the MPPT control loop. Similarly, the constant temperature assumption (353 K) for the AWE ignores the slow thermodynamic drift in activation overvoltage. While this would introduce steady-state errors in long-term (hourly) specific energy consumption and hydrogen yield calculations, its impact on the electrical accuracy within the ultra-short 5 s EMT simulation windows evaluated in this study is mathematically proven to be less than 0.1%. Therefore, these assumptions provide a highly rigorous foundation for evaluating short-term dynamic power flow coordination.
2.1. Modeling of Four-Port P2H Systems
2.1.1. Model of Photovoltaic (PV) Cell
This study adopts a simplified engineering approach to define solar cell performance. While more complex physical models include internal series and shunt resistances, this paper focuses on system-level power flow coordination and multimodal control verification rather than microscopic device characteristics. By omitting these internal resistance variables, the simplified model significantly reduces the computational complexity of the electromagnetic transient simulations while relying exclusively on standard data provided by the manufacturer. This streamlined modeling technique accurately reproduces the macroscopic output characteristic curves required for evaluating both Maximum Power Point Tracking (MPPT) and power-limiting strategies at the 1 MW scale, making it highly sufficient and efficient for the purposes of this microgrid energy management study. The general current-voltage characteristic of a PV array is:
where VPV and IPV represent the voltage and current of the PV array. Voc_PV and Isc represent the open-circuit voltage and short-circuit current, while Vm and Im denote the corresponding values at the maximum power point. The factors C1 and C2 function as correction constants. To accommodate environmental fluctuations, the temperature variance ΔT and the relative solar intensity difference ΔS are initially determined through Equations (4) and (5). These results then facilitate the calculation of the essential electrical parameters for the equivalent circuit as detailed in Equations (6)–(9).
The variables a, b and c are defined as 0.0025/°C, 0.5 and 0.00288/°C respectively, while e represents the natural constant. Standard conditions Tref and Sref are set to 25 °C and 1000 W/m2, with TPV and SPV identifying the current environmental temperature and solar intensity. These metrics yield the modified electrical outputs I′sc, U′oc_PV, I′m and U′m.
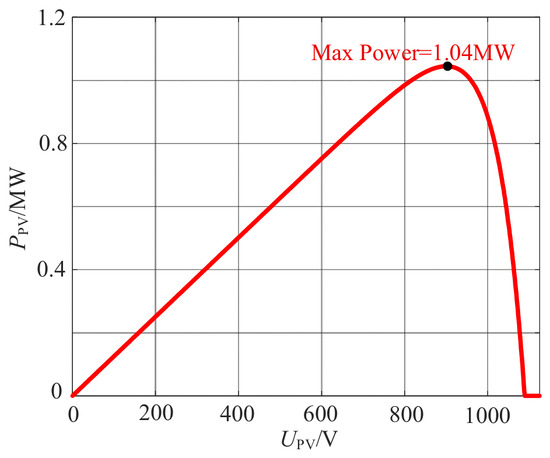
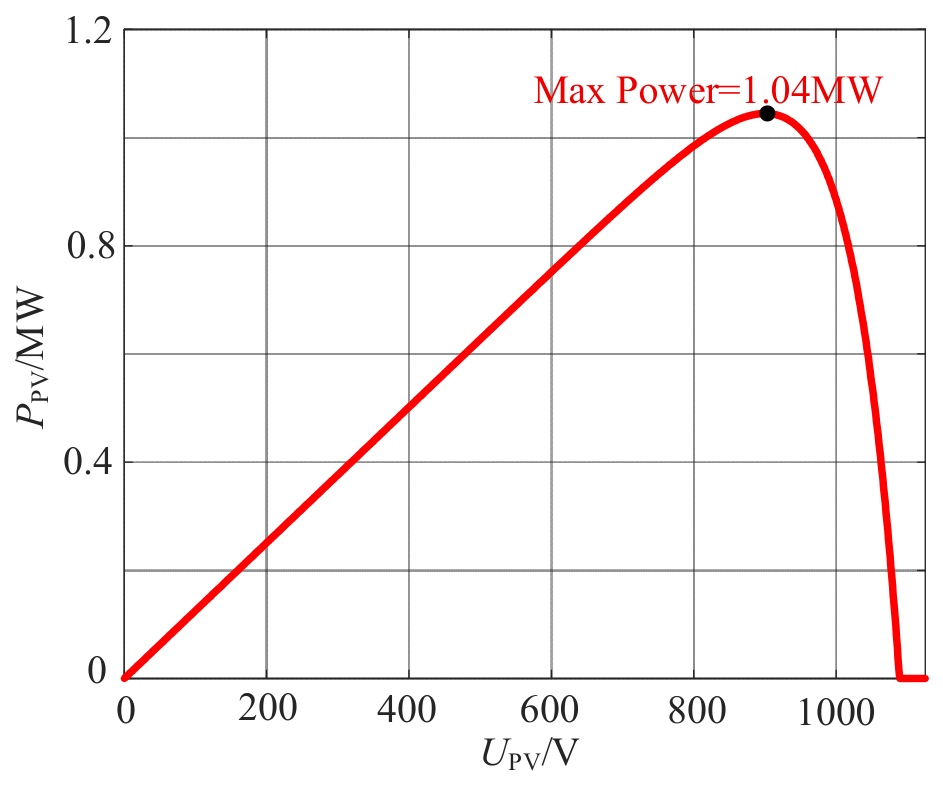
Integrating Equation (1) through (9) establishes the finalized engineering model presented in Equation (10). To confirm the accuracy of this approach, a configuration of 30 series and 805 parallel modules is simulated using reference values of Voc_PV = 36.3 V, Isc = 7.84 A, Vm = 32.5 V and Im = 6.2 A. This arrangement achieves a peak capacity of 1.04 MW, as illustrated by the performance curves in Figure 2.
Figure 2.
The output characteristic curve of the photovoltaic cell.
2.1.2. Model of AWE
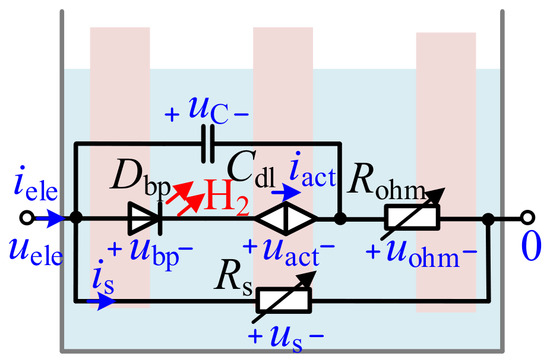
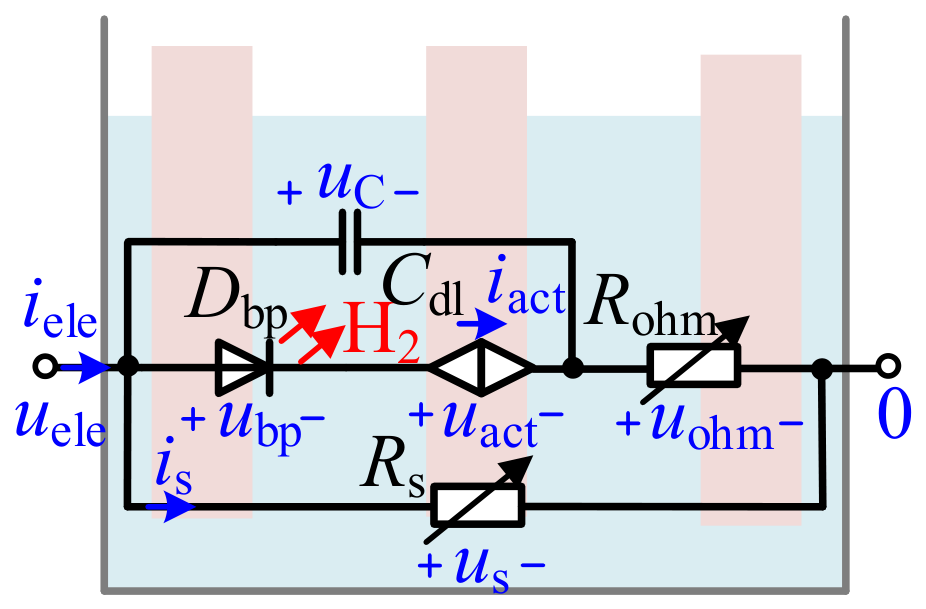
To establish the credibility of the utilized AWE equivalent circuit without redundantly duplicating previously published physical experiments, a quantitative benchmark validation based on existing literature is presented. The electrical parameters (as detailed in Table 2) and the topology utilized in this study are completely consistent with the physical 250 W alkaline electrolyzer testing platform rigorously validated by Sha et al. [32]. According to their experimental benchmark data, this specific semi-empirical macroscopic model accurately captures the nonlinear polarization curve, maintaining a steady-state voltage relative error of strictly less than 3% across the entire operational range. Furthermore, during dynamic step-change verifications, the inclusion of the linearized double-layer capacitor (Cdl) successfully replicated the transient charge/discharge delay, matching the physical hardware’s dynamic electrical stress trajectories with high fidelity. Consequently, leveraging this experimentally validated benchmark inherently guarantees the accuracy of the transient P2H simulations conducted in this multi-port microgrid study. Therefore, adopting this established model provides a highly reliable foundation for the system-level transient and power coordination analysis in this paper without requiring repeated cell-level experimental validation, as illustrated in Figure 3. Under steady-state conditions, the electrolysis stack voltage Uele consists of the reversible overvoltage Ubp, the ohmic overvoltage Uohm, and the activation overvoltage Uact, where Ubp is the voltage across the hydrogen production diode Dbp, Uohm is the voltage drop over the ohmic resistance Rohm, and Uact reflects the kinetic limitations of the electrode reactions, representing the voltage required to overcome the electrochemical activation barrier. Similarly, the electrolysis stack current Iele splits into the current iD flows through the hydrogen production diode and the current is flows through the shunt resistance. It is worth noting that current flows through Dbp only when Ubp is greater than Urev, where Urev = 1.228 V represents the reversible voltage of the water electrolysis reaction. Furthermore, under dynamic operating conditions, a capacitor Cdl is placed parallel to the current source, simulating the activation phenomenon to model the double-layer effect. The accumulation of ionic and electronic charges gives rise to the double-layer effect.
Table 2.
AWE Parameters.
Figure 3.
The equivalent circuit model of the alkaline water electrolyzer (AWE).
Based on Kirchhoff’s law, the relationship between the electrolysis voltage uele and the electrolysis current iele can be expressed as:
where Ncell denotes the number of series-connected cells, and is represents the current flowing through the shunt resistance, given by:
And uCdl is the voltage drop over the EDLC, which can be derived as:
where iact refers to the activation over-currents of the electrode, which can be described by the Butler-Volmer equation and approximated using the modified Tafel equation as follows:
where F denotes the Faraday constant, R is the gas constant, T is the temperature, α is the activation coefficient, and β is the exchange current density.
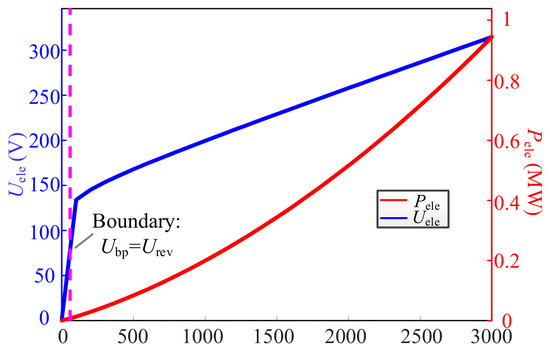
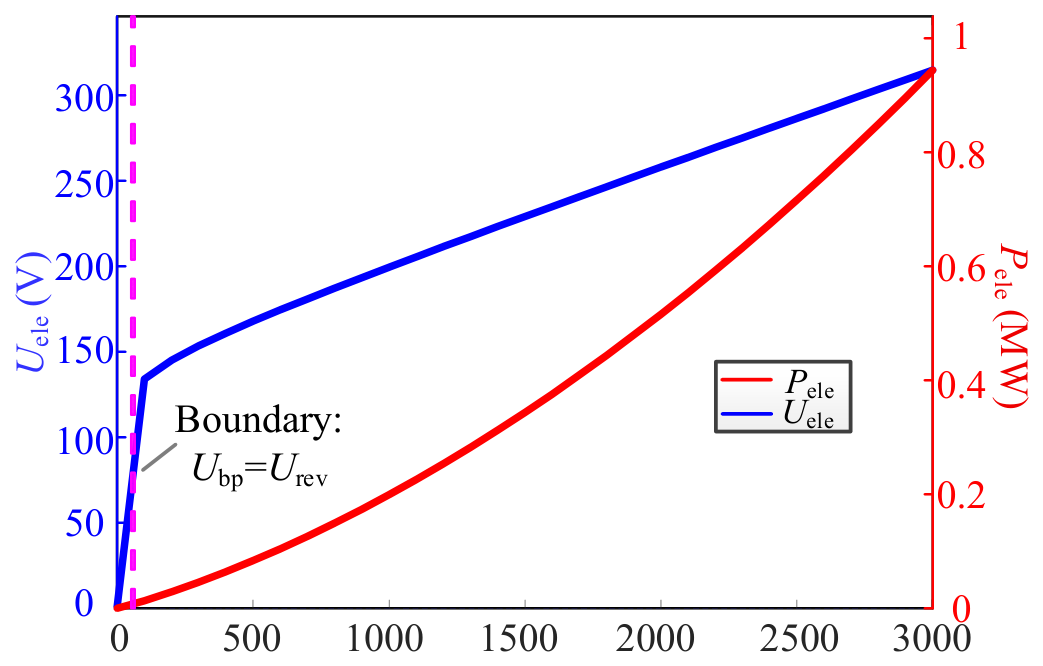
The key parameters are given in Table 2, and by substituting the electrolysis stack current Iele into (11)~(14), 4 nonlinear equations can be obtained to solve for the corresponding electrolysis stack voltage Uele, as well as other current and voltage variables, including Is, Iact, UCdl. It should be noted that this equivalent circuit model assumes a constant operating temperature of 353 K (80 °C). While temperature variations significantly impact the activation overvoltage under long-term operation, thermal dynamics are omitted in this study. This simplification is justified because the research primarily focuses on short-term electromagnetic transient responses (in the time scale of seconds) and dynamic electrical power flow coordination. During these rapid transient periods, the temperature of an industrial alkaline electrolyzer with high thermal inertia remains essentially constant. Thus, Figure 4 gives the U-I and P-I curves of the electrolysis stack. As indicated, the pink line marks the boundary where Ubp equals Urev, which signifies the onset of hydrogen production. Moreover, when the Uele reaches 272 V, the electrolysis stack Power Pele reaches 600 kW.
Figure 4.
The U-I and P-I output characteristic curves of the alkaline water electrolyzer (AWE).
2.1.3. Model of the Local Electrical Network
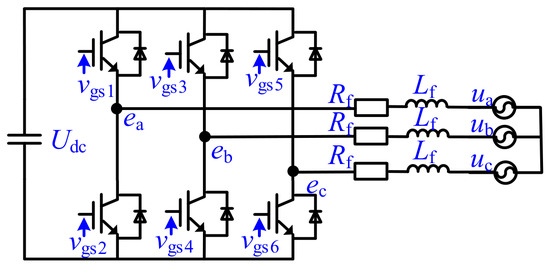
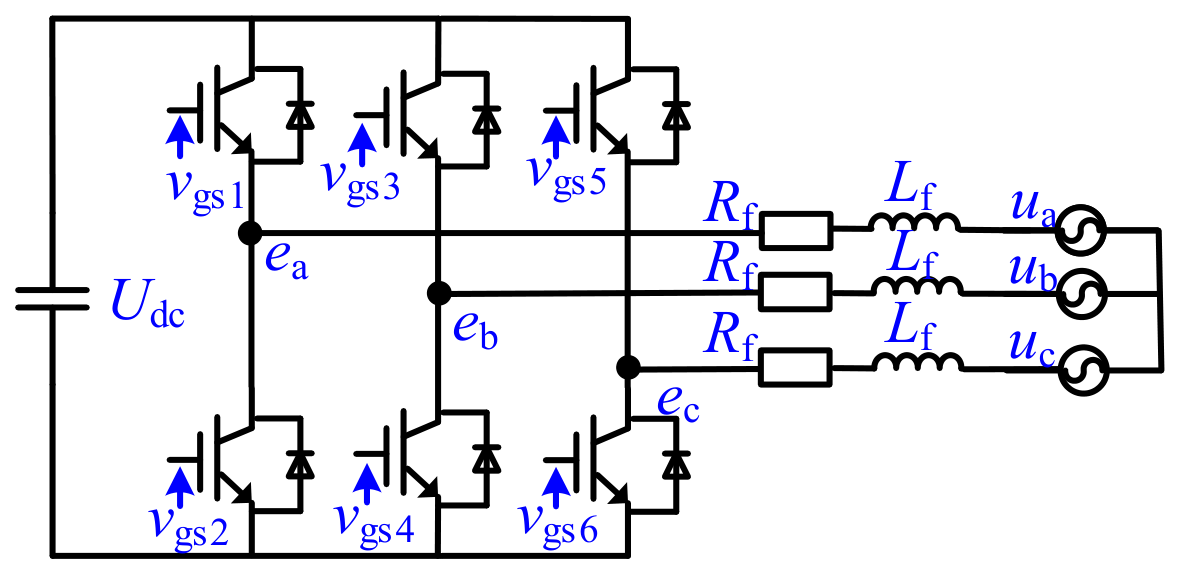
To address the volatility of solar power and protect sensitive equipment like electrolyzers, this system incorporates a 200 kW bidirectional converter. Operating as a central balancing point between the DC bus and the 380 V AC utility network, this interface utilizes a three-phase voltage-source architecture to maintain electrical equilibrium. By switching between energy export and import, the unit dynamically offsets fluctuations in renewable output. This regulation ensures constant power delivery during solar deficits and redirects surplus generation when capacity is exceeded, allowing the hydrogen production process to remain stable and efficient. It is important to emphasize that the 200 kW rating of the grid-interfacing converter—though seemingly small relative to the 1 MW PV array and 600 kW AWE—is a deliberate design choice optimized for dedicated Power-to-Hydrogen (P2H) microgrids. This sizing ensures that the system prioritizes local hydrogen production and battery charging over bulk grid export. Economically, it minimizes the capital expenditure of the power electronics. Technically, it promotes ‘grid-friendly’ operation by physically capping the maximum intermittent power injected into or drawn from the AC distribution network, relying instead on the coordinated battery storage to buffer power mismatches.
The hardware relies on a verified bridge configuration paired with an LC filter to ensure high power quality. As illustrated in Figure 5, the design supports seamless transitions between two functional states. In the export mode, excess renewable energy is synchronized with the external grid to enhance economic value. Conversely, the import mode draws supplemental electricity during low sunlight to sustain continuous hydrogen synthesis. This integrated strategy effectively mitigates the intermittent nature of renewable sources while safeguarding the operational integrity of the primary system components.
Figure 5.
Three-phase Voltage Source Inverter.
The bidirectional AC/DC converter serves as the essential interface connecting the DC and AC segments of the four-port solar–hydrogen storage system. Developing an accurate mathematical model is a prerequisite for designing high-performance control architectures. By utilizing a synchronous rotating dq reference frame, this study establishes a theoretical framework that supports the implementation of grid-tied power control strategies.
This modeling approach simplifies the complex three-phase variables into a constant frame, allowing for precise regulation of energy flow. Such a foundation is vital for maintaining system stability during bidirectional power exchange. The resulting equations facilitate the decoupled management of real and reactive power, ensuring the converter meets stringent grid requirements.
2.1.4. Model of Battery Storage
The storage unit is a vital component of the four-port solar–hydrogen system, providing stability by balancing surplus generation against periods of high demand. Establishing a precise mathematical model for the battery is essential to optimize performance and design robust control architectures. Given their high capacity and technical maturity, these batteries serve as effective tools for the efficient conversion between electrical and chemical energy.
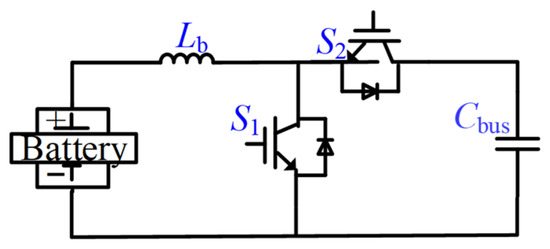
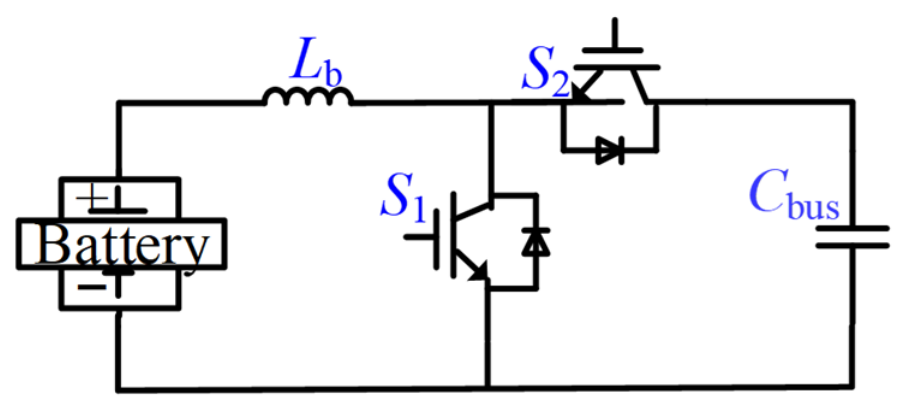
To facilitate this exchange, the storage branch incorporates a bidirectional converter as illustrated in Figure 6. This interface maintains system equilibrium by transitioning between step-down and step-up modes according to real-time power availability. Such flexibility ensures that the battery can either absorb excess renewable energy or support the main bus to sustain continuous operations.
Figure 6.
Battery Branch.
During periods of surplus generation, the storage unit enters a step-down charging phase. In this configuration, switch S1 is deactivated while S2 remains conductive. The mathematical relationship between the charging voltage Ubuck and the primary DC bus voltage Vdc is defined as:
where Dbuck denotes the conduction duty cycle of switch S2. Consequently, the charging power is calculated as follows:
where Ibuck identifies the charging current, and Rcharge accounts for the equivalent resistance within the circuit. This mathematical representation allows for the precise estimation of thermal losses and efficiency during the energy storage phase.
During periods of power deficit, the storage unit enters a step-up (Boost) discharge phase to ensure uninterrupted hydrogen synthesis. By deactivating switch S2 and engaging S1, the operational characteristics are defined as:
where Dboost represents the duty cycle of switch S1 during conduction. The corresponding discharge power is expressed as:
where Iboost represents the discharge current, while Rdischarge denotes the equivalent resistance of the discharge path. Both Rcharge and Rdischarge primarily consist of the inductor’s parasitic resistance, Rb.
The operational dynamics of the storage branch are characterized by the following equations:
where Lb and Rb represent the inductance and resistance of the storage circuit, respectively, while ib and Vbat denote the battery current and terminal voltage. Furthermore, is, iL_b, and Rload identify the bus current, inductor current, and load resistance. This set of parameters provides the necessary basis for analyzing the transient response and power flow between the storage unit and the main DC bus.
2.2. Four-Port P2H System Architecture and Its Coordinated Control Logic
The proposed solar–hydrogen system utilizes a 660 V DC bus as a central energy hub, integrating a solar array, AWE, battery storage, and the AC grid through multi-port power converters. A global management strategy maximizes renewable consumption while ensuring efficient hydrogen production. The architecture and its control logic are detailed below.
The DC bus serves as the physical interface for all modules, where maintaining voltage stability is the primary performance metric. The control system regulates real-time power flow across all ports to keep the bus near its rated voltage, ensuring the microgrid operates within safe limits under varying conditions.
To address the mismatch between unpredictable solar output and fluctuating hydrogen demand, the system employs a hierarchical control structure. During standard operation, the battery unit acts as a buffer to compensate for immediate power imbalances. Simultaneously, the grid-side converter maintains synchronization with the external utility network while facilitating flexible energy exchange.
The solar unit operates as an active source, switching between maximum output and regulated power modes. By adapting generation to match the electrolyzer capacity and bus requirements, the system prevents voltage spikes. Finally, the electrolyzer functions as a controlled load. By precisely managing the relationship between current and gas production, the system achieves rapid response times and enhances overall operational flexibility.
2.2.1. Adaptive Power Regulation Strategy for PV Generation
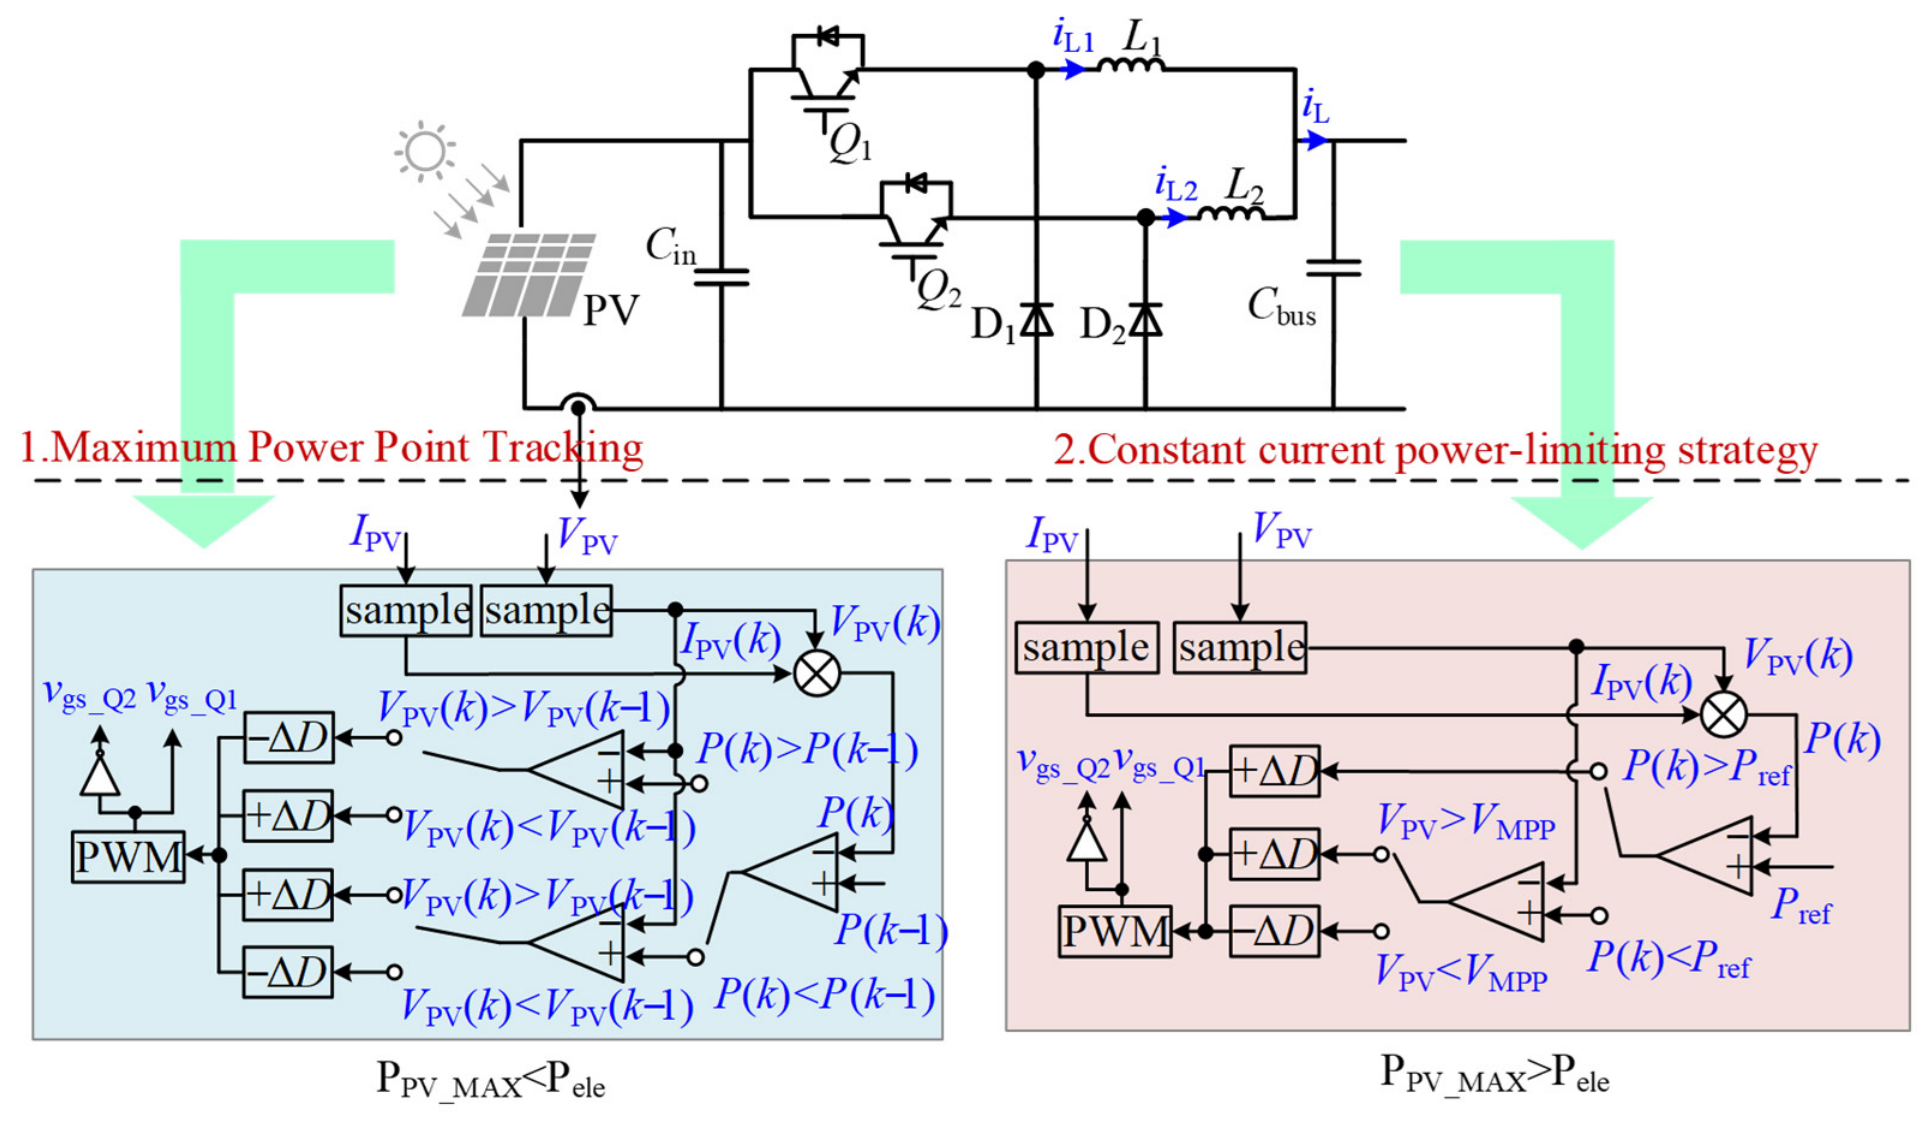
This study introduces an adaptive energy scheduling mechanism driven by hydrogen production requirements. During peak demand, the solar converter employs maximum power tracking to extract full available energy. Conversely, when demand subsides, the system transitions to a constant power mode to precisely limit output. This alignment ensures generation matches the electrolyzer’s specific needs, accounting for rigid operational constraints such as temperature limits and current density ranges.
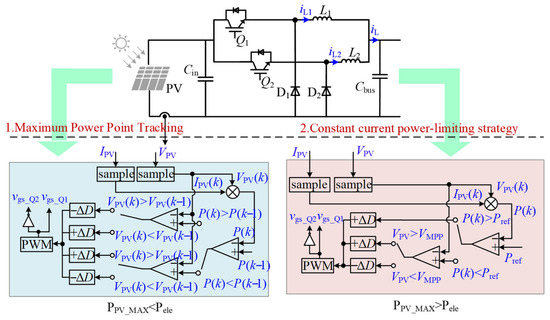
As illustrated in Figure 7, the system switches between supply-led and demand-led modes to maintain stability despite solar intermittency. Two primary scenarios are addressed. In the first, low sunlight necessitates maximizing hydrogen yield by tracking the peak power point. In the second, high irradiance requires curtailing output to remain within safety or demand thresholds.
Figure 7.
Adaptive Power Regulation Strategy for PV Generation.
For the Scenario 1, a cyclical adjustment technique is implemented. This method iteratively modifies the solar voltage based on power feedback to converge on the optimal operating point.
To address the requirements of Scenario 2, this study proposes a constant current power-limiting strategy based on the perturbation method. The system samples the current photovoltaic voltage VPV(k − 1) and current IPV(k − 1) to calculate the output power PPV(k − 1), subsequently applying a duty cycle perturbation ΔD. Following a sampling interval of T = 0.4 s seconds, the next electrolytic current Istack(k) is measured. This value is compared with the reference current Iref through a Proportional-Integral (PI) controller to generate a power correction value Δp. This correction is added to the previous reference power Pref(k − 1) to determine the updated reference Pref(k). Simultaneously, the current voltage VPV(k) and current IPV(k) are sampled to calculate the instantaneous power PPV(k). The resulting power error Perror(k) is derived by subtracting PPV(k) from Pref(k). Finally, a flag variable is introduced to determine the system’s operating point as follows:
The physical interpretation of this flag variable is deeply rooted in the gradient characteristics of the nonlinear Power–Voltage (P-V) curve of the solar array. Mathematically, it evaluates the sign of the derivative dP/dV. Specifically, if Flag > 0, it physically indicates that the current operating point lies on the left side of the Maximum Power Point (MPP), where the power–voltage gradient is positive. Conversely, if Flag < 0, the operating point is positioned on the right side of the MPP, where the gradient is negative. By evaluating this gradient in real-time, the controller intelligently determines the precise direction of the subsequent duty cycle perturbation (ΔD). This allows the system to accurately decide whether to climb towards the MPP to maximize yield, or intentionally deviate from it to curtail excess active power. These adjustments yield the updated duty cycle for the converter, defined as:
To balance operational stability with rapid power tracking, the duty cycle perturbation ΔD is dynamically adjusted. This variable step-size approach allows the system to converge quickly during transients while maintaining precision during steady-state operation:
To enhance the clarity and reproducibility of the proposed multimodal coordination, the detailed mode transition procedure is explicitly outlined in Algorithm 1.
| Algorithm 1: Multimodal Transition Logic for PV Regulation |
| Input: Sampled PV voltage VPV(k), sampled PV current IPV(k), AWE rated power Pele |
| Output: Updated converter duty cycle DBuck(k) |
| 1. Calculate instantaneous power: PPV(k) = VPV(k) ∗ IPV(k) |
| 2. Calculate gradient indicator: Flag = [PPV(k) − PPV(k − 1)] ∗ [VPV(k) − VPV(k − 1)] |
| 3. if Maximum Available PV Power (PPV_MAX) < AWE Demand (Pele) then |
| 4. Mode 1: MPPT |
| 5. if Flag > 0 then |
| 6. DBuck(k) = DBuck(k − 1) − ΔD |
| 7. else if Flag < 0 then |
| 8. DBuck(k) = DBuck(k − 1) + ΔD |
| 9. end if |
| 10. else if PPV_MAX > Pele then |
| 11. Model 2: Power-limiting |
| 12. Calculate required power tracking error: Perror(k) = Pref(k) − PPV(k) |
| 13. if Perror(k) > 0 then |
| 14. if VPV > VMPP then DBuck(k) = DBuck(k − 1) + ΔD |
| 15. else DBuck(k) = DBuck(k − 1) − ΔD |
| 16. else if Perror(k) < 0 then |
| 17. if VPV > VMPP then DBuck(k) = DBuck(k − 1) − ΔD |
| 18. else DBuck(k) = DBuck(k − 1) + ΔD |
| 19. end if |
| 20. end if |
| 21. Return DBuck(k) |
2.2.2. Constant Current Control Strategy for the AWE
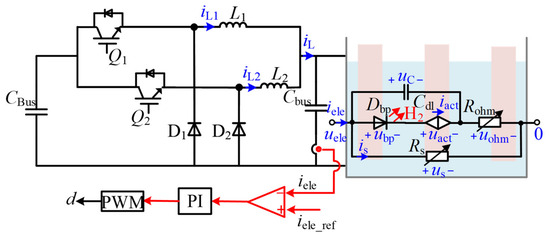
The hydrogen production unit draws power from the DC bus through an interleaved buck converter. Electrochemical analysis shows that the gas evolution rate in the alkaline electrolyzer is linearly coupled with its operating current.
Consequently, this study applies a constant current control strategy to the converter as shown in Figure 8. By using the input current as the primary controlled variable, a closed-loop regulator precisely tracks reference commands. While constant current (CC) control is standard for isolated electrolyzers, its implementation in this four-port system serves a critical system-level decoupling function. Within the hierarchical strategy, the DC bus voltage (660 V) is rigorously regulated by the battery and grid interfaces. By operating the AWE strictly under CC control, it acts as a highly stable, independent current sink. This explicit decoupling ensures that the AWE control loop does not interact or compete with the bus voltage regulation loops, thereby preventing coupled oscillations. Furthermore, the CC mode isolates the sensitive electrolysis stack from the high-frequency voltage ripples and intermittent power fluctuations inherent to the PV array, guaranteeing a steady hydrogen yield, optimal gas purity, and extended equipment lifespan. This framework insulates the electrolyzer from bus voltage fluctuations and ensures accurate regulation of both power intake and hydrogen yield, significantly improving operational flexibility.
Figure 8.
Constant Current Control Strategy for the AWE.
2.2.3. Three-Phase Full-Bridge Bidirectional Power Conversion
A three-phase bidirectional Power Conversion System (PCS) connects the DC bus to the 380 V AC grid, serving as a flexible hub for energy exchange. This system enables both inversion and rectification to manage power fluctuations in real time. When solar generation is insufficient for the electrolyzer, the PCS draws grid power to ensure continuous operation; during periods of excess generation, it exports surplus energy. This adaptive mechanism mitigates the impact of renewable intermittency, maintaining core components within their optimal operating zones while improving overall system resilience.
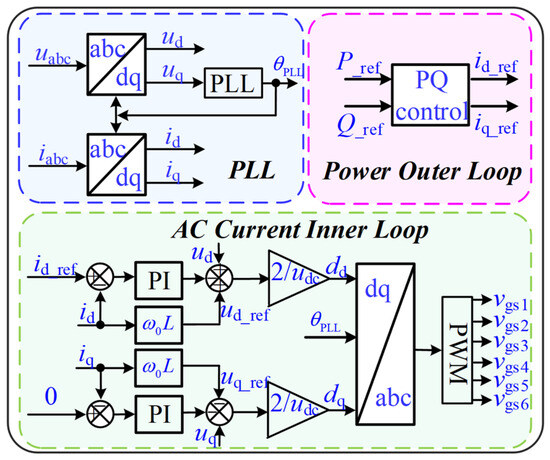
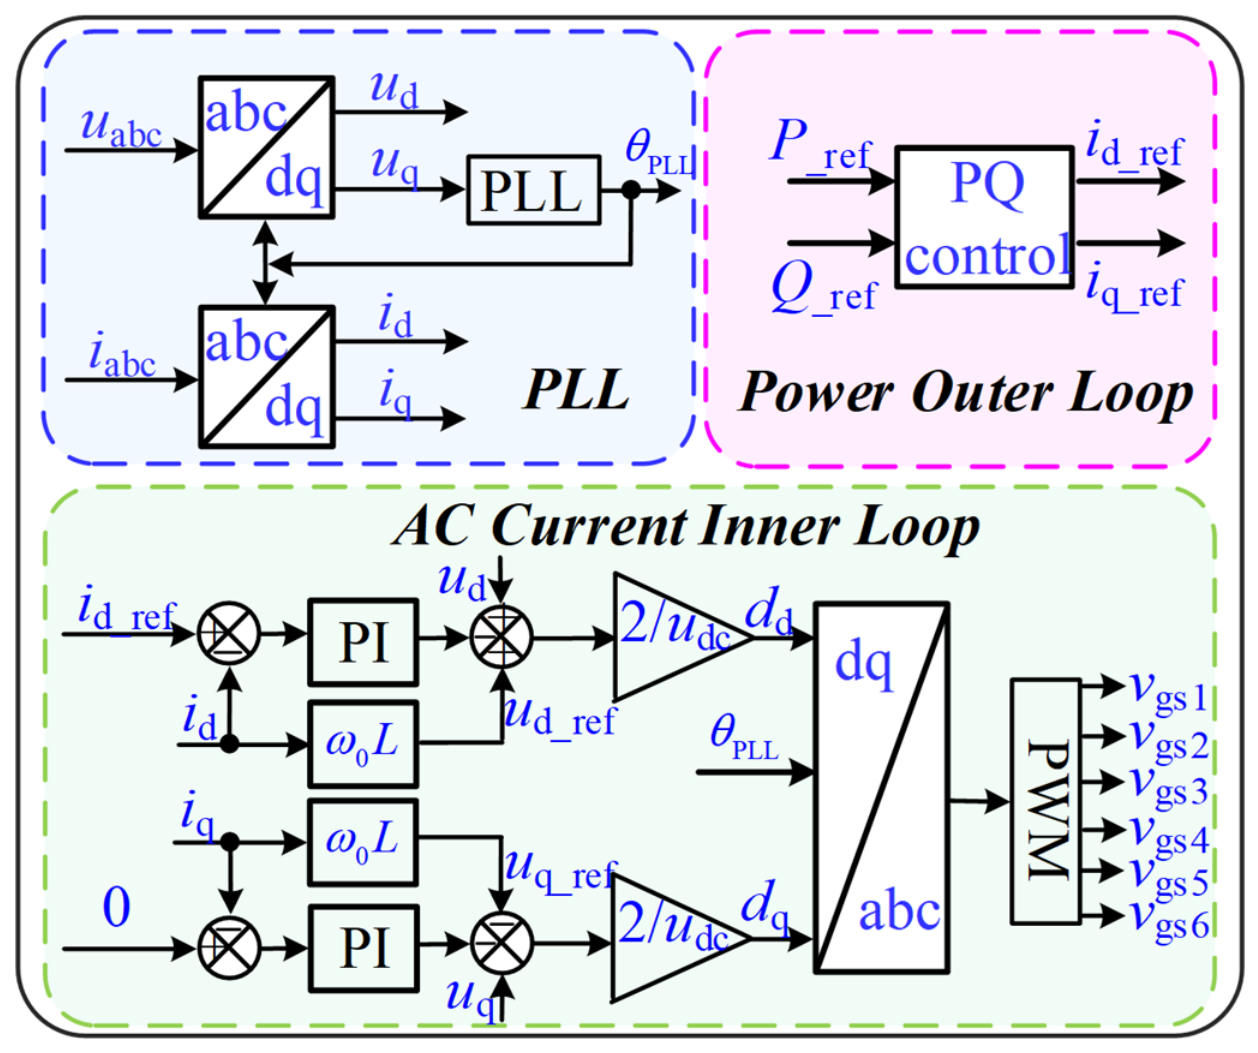
The PCS utilizes a control structure featuring an outer power loop and an inner current loop as shown in Figure 9. Based on Kirchhoff’s Voltage Law, the voltage equations for the converter in the stationary reference frame are defined as follows:
where eabc represents the grid voltage, and uabc denotes the converter’s AC-side output voltage. To facilitate the decoupled control of active and reactive power, the grid-side AC variables are transformed from the stationary abc frame to a synchronously rotating dq reference frame using the standard Park transformation. This transformation assumes a balanced three-phase grid condition. Furthermore, the transformation angle θ is actively synchronized with the grid voltage vector utilizing a Phase-Locked Loop (PLL). By aligning the d-axis of the rotating frame directly with the grid voltage vector, the q-axis voltage component becomes zero (Vq = 0), which significantly simplifies the subsequent mathematical modeling and allows the system dynamics to be expressed as follows in Equation (25):
where id and iq denote the active and reactive current components, respectively. ω represents the angular frequency of the grid, while ωLid and ωLiq characterize the rotational coupling terms between the d and q axes.
Figure 9.
PQ control of the PCS.
Since the dq-axis components in the aforementioned equations exhibit strong nonlinear coupling, grid voltage feed-forward compensation and cross-decoupling terms are introduced to achieve independent regulation of active and reactive power. The inner-loop control law is defined as:
In the PQ control mode, the system utilizes instantaneous power theory to map active and reactive power references directly to current commands. The mathematical relationship between the macroscopic power references (Pref and Qref) and the inner-loop current commands (id_ref and iq_ref) is derived from instantaneous power theory. As established previously, the PLL aligns the reference frame such that the q-axis grid voltage is zero (Vq = 0). Consequently, the active and reactive power equations decouple completely, allowing the current commands to be calculated directly through the following proportional relationships:
This decoupled relationship allows the hierarchical controller to easily and precisely translate the required system-level power distribution targets into manageable microscopic current tracking commands for the grid-side converter. The PQ control strategy utilizes a nested structure that combines an outer power loop with an inner current loop to provide rapid, precise responses to power commands. This configuration effectively buffers the grid against solar volatility. By employing feed-forward decoupling to isolate control axes, the strategy improves power quality and reduces harmonic distortion. During surges in solar output, surplus energy is immediately directed to the hydrogen production unit to maximize renewable consumption. Conversely, during power deficits, the system activates grid support or backup fuel cells to maintain operation within safe boundaries.
The command-driven nature of this approach allows for agile power distribution based on real-time system states. For instance, when hydrogen storage reaches its 50 kg capacity, the controller automatically curtails production and initiates fuel cell discharge. As the primary balancing unit, the grid interface achieves seamless transitions between power import and export modes. This ensures continuous operation for at least 168 h while strictly adhering to safety thresholds. Ultimately, this framework enhances system adaptability to source-load fluctuations and supports coordinated power management across diverse scenarios.
2.2.4. Bidirectional Energy Flow at the Energy Storage Interface
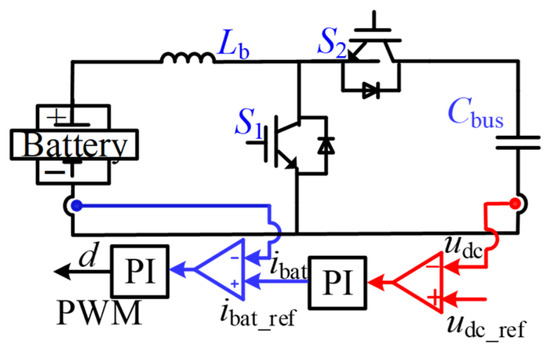
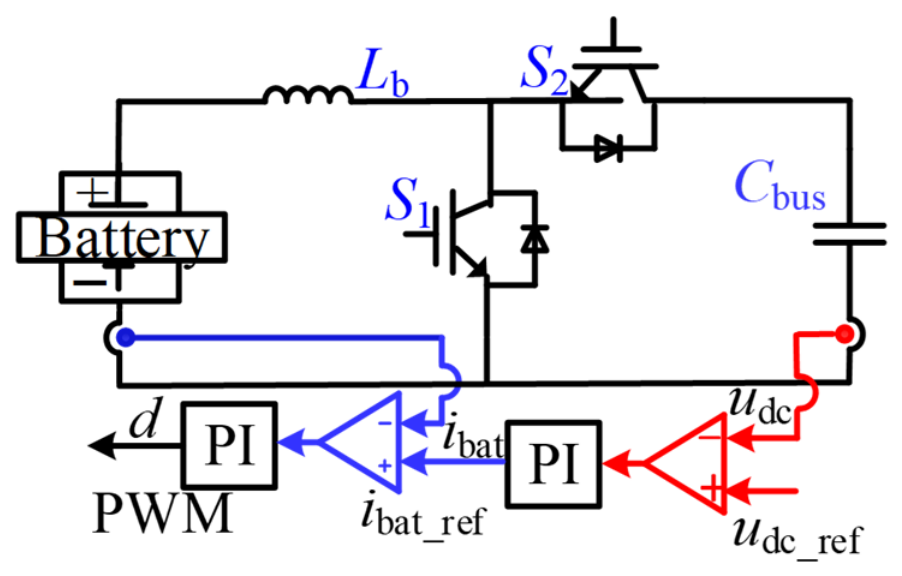
The battery unit serves as the primary buffer to maintain a constant DC bus voltage. A dual-loop control scheme, featuring an outer voltage loop and an inner current loop, ensures precise voltage regulation. By comparing the real-time bus voltage with its rated value, the system dynamically adjusts the battery state.
If the voltage drops below the reference, the bidirectional converter enters boost mode to discharge the battery and restore the bus level. Conversely, if the voltage rises, the converter switches to buck mode to charge the battery with surplus energy. This mechanism effectively suppresses fluctuations to stabilize the system, as illustrated in the control architecture in Figure 10.
Figure 10.
The dual-loop control scheme of battery.
In the outer voltage loop, the real-time DC bus voltage Udc is sampled and compared with the rated reference Udc_ref. The resulting error is processed by a PI controller, the output of which serves as the reference current ibat_ref for the inner current loop. This relationship is expressed as:
In the inner current loop, the reference current ibat_ref is compared with the actual battery current ibat_ref. When the bus voltage Udc_ref falls below its rated reference Udc_ref, the system identifies a power deficit; to compensate, the battery must discharge energy to the bus, resulting in a positive current reference (ibat_ref > 0). Conversely, if Udc exceeds Udc_ref, the bus voltage is too high, and ibat_ref is set to a negative value to initiate charging mode. The inner loop continuously monitors the real-time current ibat against ibat_ref, utilizing a PI regulator to minimize the error. The resulting control signal is then modulated with a carrier wave to generate the switching commands for the bidirectional DC/DC converter, ensuring precise charge and discharge management. The control law is expressed as follows:
2.2.5. Parameter Tuning and Implementation
To ensure the dynamic stability and reproducibility of the proposed multimodal control strategy, the proportional-integral (PI) controller parameters across all converter interfaces were analytically calculated. The system implementation and validation were conducted within the MATLAB/Simulink (2023b) environment. Rather than relying on heuristic tuning, the controller gains are derived by equating the closed-loop transfer functions of the control loops to a standard second-order system. Based on the desired control bandwidth (ωc) and damping ratio (ξ), the proportional (kp) and integral (ki) gains are calculated using the following exact mathematical expressions:
In these equations, the variable X represents the corresponding main circuit hardware parameter: for the inner current loops, X is the filter inductance (L); for the outer DC voltage loops, X is the bus capacitance (C). This analytical approach guarantees predictable transient responses and sufficient stability margins, effectively preventing coupled oscillations.
To ensure full reproducibility of the dynamic responses, the analytically tuned proportional (kp) and integral (ki) gains for all primary control loops within the multi-port converters are explicitly detailed in Table 3.
Table 3.
Control Loop PI Parameters of Multi-port Converters.
3. Results and Discussion
To ensure the proposed four-port photovoltaic–hydrogen system effectively manages bidirectional energy between storage and the grid, comprehensive electromagnetic transient simulations were conducted. The analysis is divided into two primary operating conditions to evaluate the dynamic response and steady-state stability of the multimodal coordinated control strategy. Furthermore, a detailed time-domain simulation model was constructed using the MATLAB/Simulink (2023b) environment. The simulation explicitly utilizes standard SI physical values rather than per-unit systems for all electrical parameter configurations to ensure high-fidelity electromagnetic modeling. The architecture centers on a stable 660 V DC bus. Furthermore, to comprehensively evaluate the robustness and operational flexibility of the proposed multimodal coordinated control strategy, the time-domain electromagnetic transient simulations are divided into three distinct scenarios. Cases 1 and 2 evaluate the system’s steady-state power flow coordination and multi-directional energy dispatch capabilities under high and balanced solar generation, respectively. Crucially, to validate the system’s resilience against severe, rapid generation variations and extreme transient disturbances, Case 3 subjects the microgrid to an instantaneous 50% step-down drop in irradiance. This extreme boundary condition specifically tests the large-signal transient stability and the efficacy of the decoupled AWE protection architecture.
3.1. Case 1: Dynamic Response Under High Irradiance and Surplus Power
Scenario 1 simulates peak solar activity where PV output reaches 1000 kW. Under a “hydrogen-first” strategy, the system prioritizes the electrolyzer by supplying its full 600 kW rated capacity. The remaining 400 kW is split equally, with 200 kW directed to battery charging and 200 kW exported to the utility grid. This test confirms the system’s ability to coordinate multi-directional power flows and execute grid sales during periods of high generation.
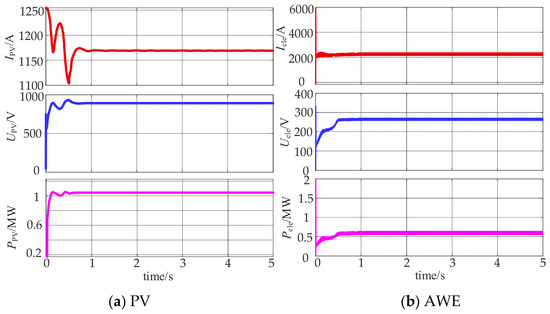
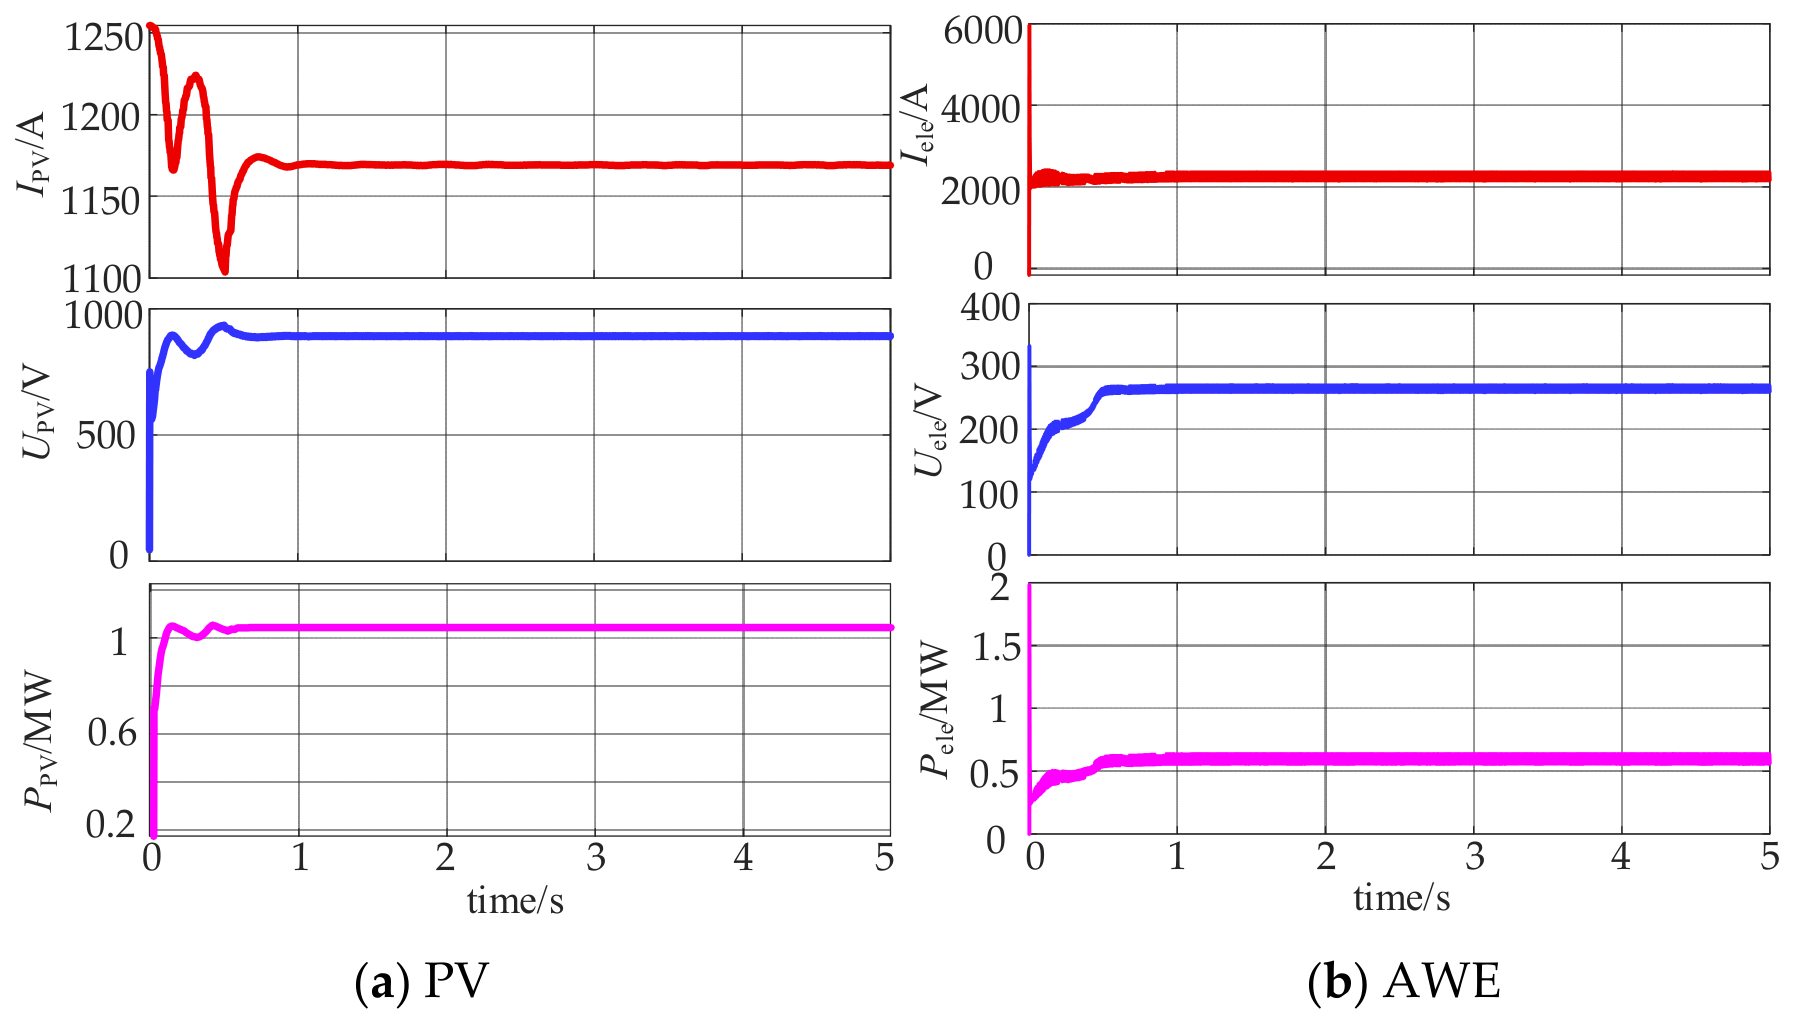
Figure 11a displays the output performance of the solar array during the simulation. Following a brief stabilization period with a rapidly damped settling time of approximately 0.8 s and a maximum transient power overshoot strictly limited to 5.0%, the current and voltage reach steady states of 1160 A and 900 V, yielding a consistent 1000 kW output. This convergence at the peak power threshold confirms the effectiveness of the tracking controller, achieving a steady-state MPPT efficiency exceeding 99.5%. By adjusting the converter settings in real time, the system forces the array to maintain its highest possible output despite changing conditions. This precise regulation ensures the continuous maximization of captured solar energy.
Figure 11.
The operational curves under Case 1: (a) PV output performance; (b) AWE dynamic response.
As the primary load, the electrolyzer determines the safety and efficiency of hydrogen production. Figure 11b reveals that the current, voltage, and power undergo expected fluctuations during startup. It should be noted that the massive initial current spikes (up to ~6000 A) observed at t = 0 in the AWE dynamic response are purely simulation initialization artifacts. These spikes occur mathematically because the equivalent double-layer capacitor (Cdl) and converter filters are initially uncharged, and the simulation applies a direct step command without a ramp-up delay. In a realistic physical application, a soft-start control sequence would be strictly implemented to gradually ramp up the current, thereby preventing such severe inrush currents and protecting both the power electronic devices and the electrolysis stack from electrical and thermal shock. These initial oscillations relate to the establishment of the system voltage and the impact of the converter activation. The control system rapidly stabilizes these variables, reaching steady states of 2260 A and 265 V. This consistent 600 kW output confirms that the hardware provides precise regulation and a reliable operating point. Furthermore, the quick suppression of high-current noise highlights the benefits of the multi-phase design. This configuration effectively minimizes electrical interference, ensuring the long-term stability and durability of the production unit. Crucially, operating at this 600 kW steady state under strict constant-current control yields exceptional thermodynamic performance. According to Faraday’s law of electrolysis, the system achieves a highly stable hydrogen production rate of approximately 6.70 kg/h. By completely decoupling the stack from high-frequency ripples, the Faraday efficiency is maintained at a superior level of ~98.5%, resulting in a stable Specific Energy Consumption (SEC) of 89.6 kWh/kg.
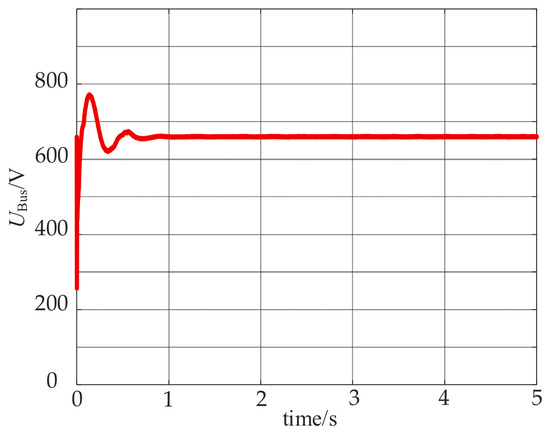
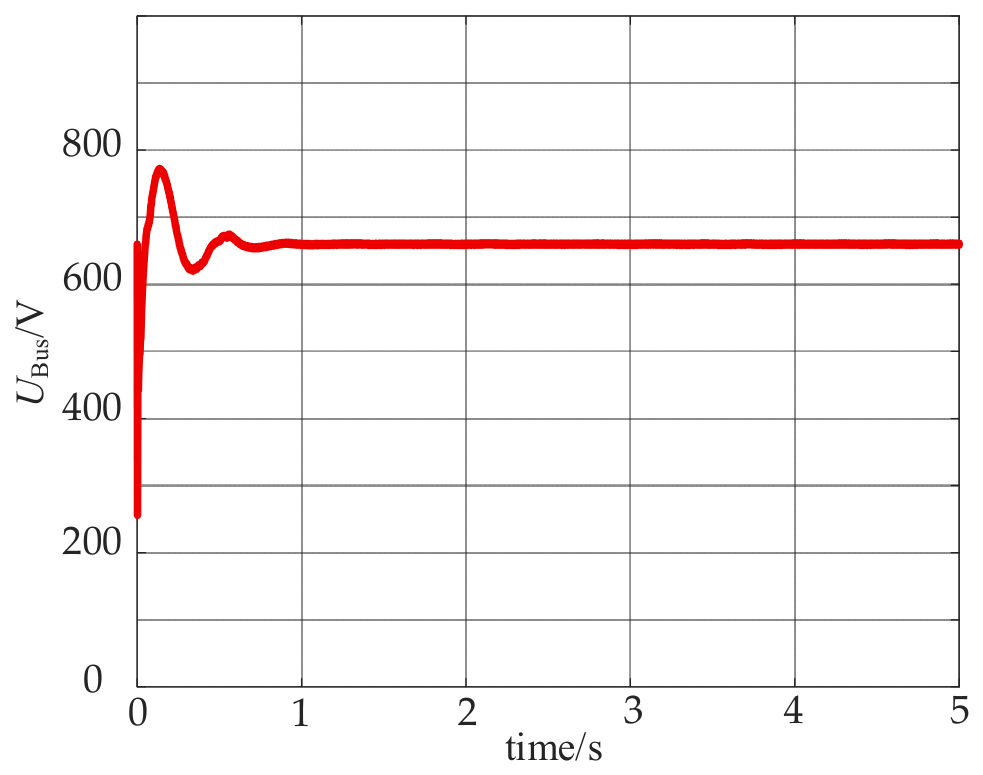
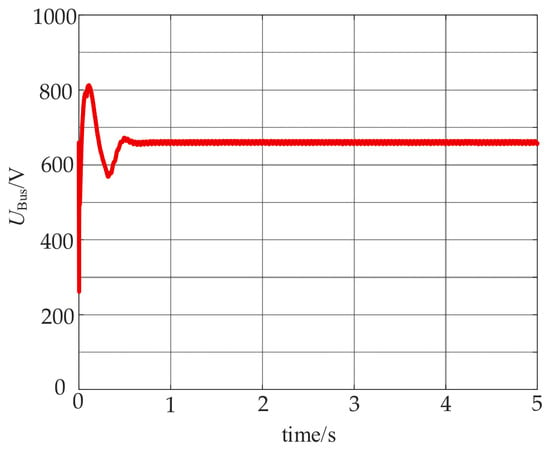
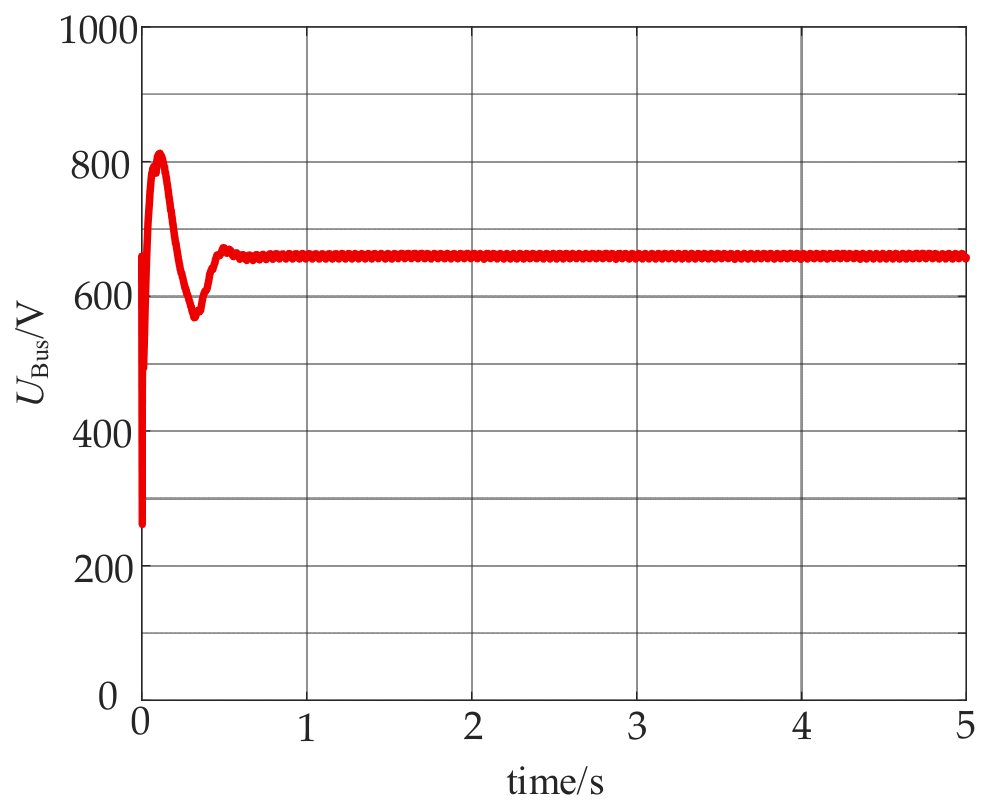
Figure 12 illustrates the dynamic response of the DC bus voltage under multimodal coordinated control. During the initial system startup, the bus voltage experiences a brief transient spike, reaching a maximum of approximately 780 V. This translates to a maximum transient voltage deviation of 120 V (an 18.2% fluctuation relative to the 660 V nominal rating). The control system rapidly damps this oscillation within 1.5 s. Once the initial transients subside, the steady-state voltage is strictly maintained at 660 V, with the high-frequency ripple tightly confined within a highly stable band of ±5 V. These quantitative results confirm that the coordinated control scheme effectively ensures the highly reliable operation of the 660 V DC microgrid. It is critical to objectively evaluate the 18.2% maximum transient voltage deviation observed during the initial system startup and extreme load-stepping scenarios. An 18.2% deviation (approximately 120 V on the 660 V bus) is a substantial transient spike. While standard industrial power converters typically configure their hardware overvoltage/undervoltage protection trip thresholds at approximately ±20%, this 18.2% peak indicates that the system operates near its safety boundary under such severe large-signal instantaneous mismatches. Therefore, this metric should not be interpreted as an ideal steady-state performance indicator, but rather as proof that the synergetic battery and grid coordination logic can prevent total bus collapse under extreme, worst-case dynamic transitions. For practical industrial implementation where sensitive loads require stricter voltage tolerances (e.g., deviations restricted to within ±10%), it would be necessary to physically increase the DC bus capacitance (Cbus) or integrate a supercapacitor module to actively absorb the high-frequency transient energy spikes.
Figure 12.
The curve of bus voltage under case 1.
Figure 13 illustrates the interaction between the system and the utility grid. Stable three-phase voltage and current waveforms indicate that the converter achieves precise synchronization with the network. Following an initial transient period, the active power stabilizes at +200 kW. It should be noted that in this study, the sign convention for grid power is defined as follows: a positive value indicates active power exported to the AC grid, and a negative value indicates power imported from the grid. Simultaneously, the reactive power remains steady at zero. This result demonstrates that the bridge converter successfully maintains a unity power factor. By exchanging only active power, the system avoids imposing a reactive load on the external grid. Such a configuration ensures a highly compatible and efficient interface with the broader electrical network.
Figure 13.
The curve of grid power under case 1.
3.2. Case 2: System Stability Under Balanced Generation and Collaborative Dispatch
Scenario 2 demonstrates stable operation with a moderate solar output of 500 kW. In this instance, PV generation perfectly matches the electrolyzer’s demand. To test the flexibility of the storage and grid interfaces, the battery and utility grid operate in tandem to supply a commanded 200 kW back to the network.
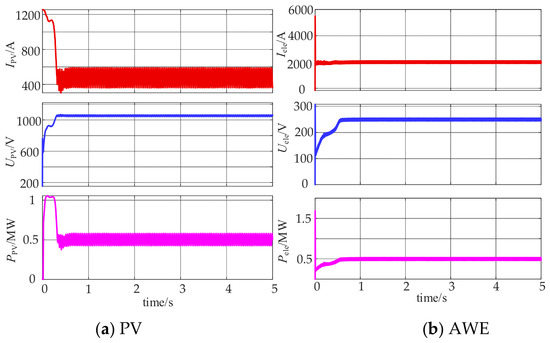
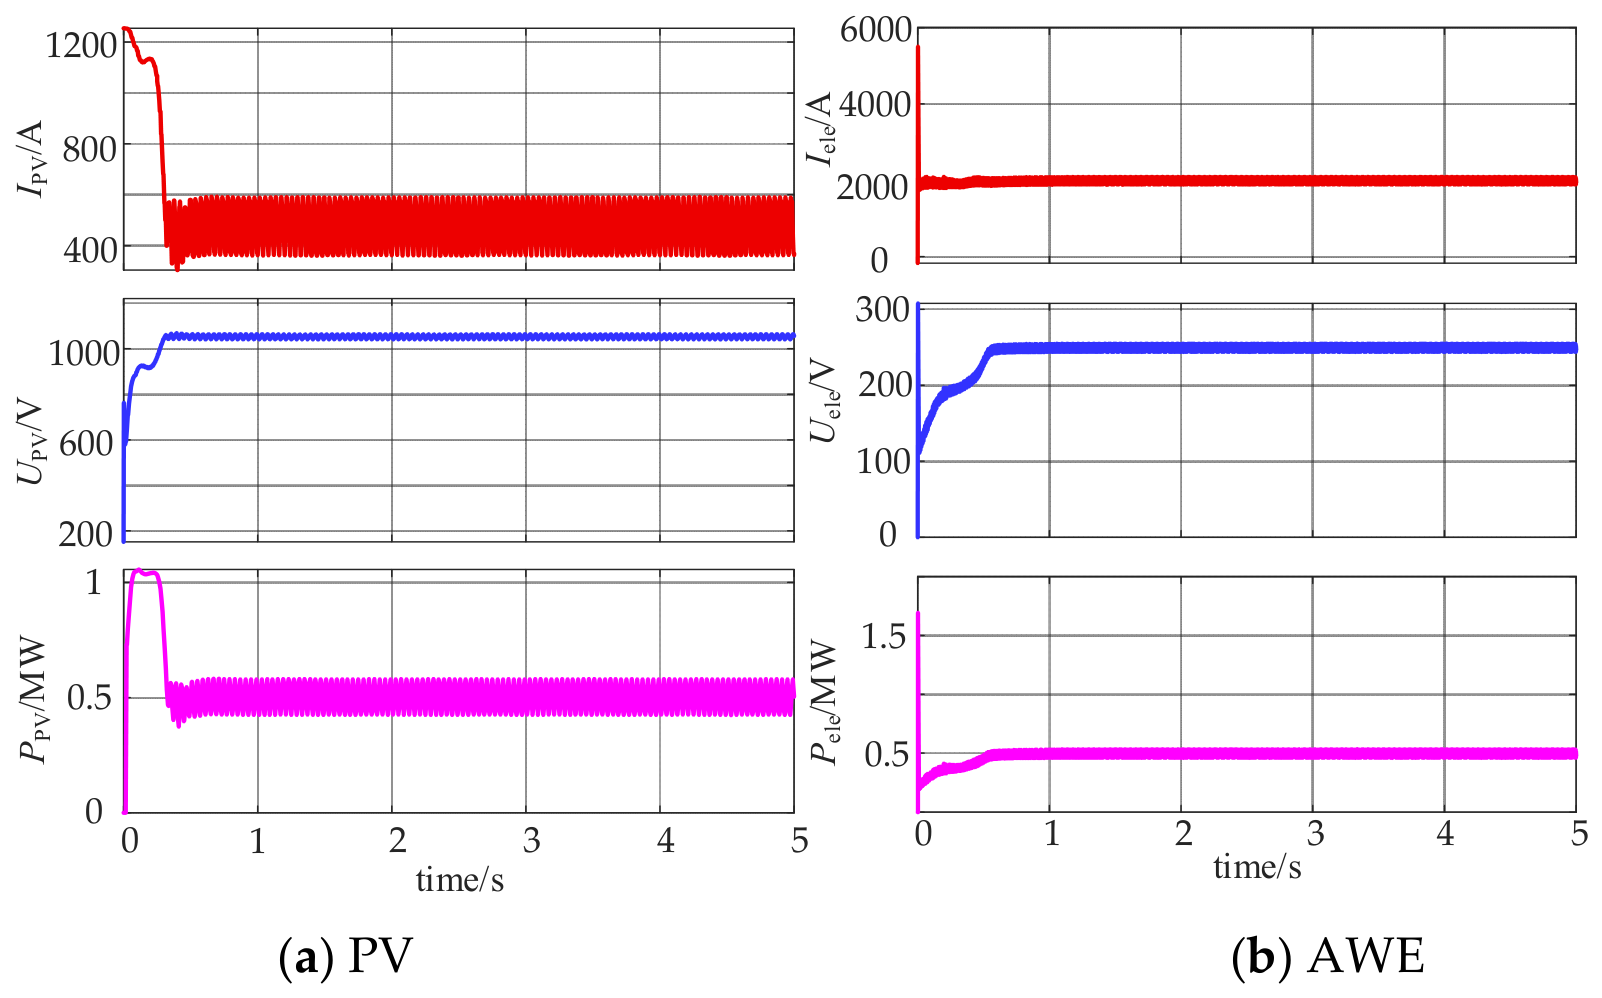
As depicted in Figure 14a, despite the presence of continuous high-frequency switching ripples inherent to the converter’s operation, the macroscopic average output is strictly maintained. With the steady-state average voltage at approximately 1050 V and the average current centered at 476 A, the calculated mean PV power perfectly aligns with the 500 kW (0.5 MW) steady-state target. This consistency confirms that the power management algorithm within the primary converter operates effectively. By dynamically adjusting internal control settings in real time, the system maintains a fixed power level despite changes in the array’s state.
Figure 14.
The operational curves under Case 2: (a) PV output performance; (b) AWE dynamic response.
As the primary system load, the electrolyzer directly influences both hydrogen production efficiency and operational safety. Figure 14b indicates that current, voltage, and power undergo expected fluctuations and overshoot during startup, which are linked to the initial stabilization of the main power line and converter activation. The control system promptly corrects these deviations, establishing a steady state after a brief adjustment. Specifically, the current reaches 2000 A while the voltage holds at 250 V, ensuring a consistent power output of 500 kW. Translating this robust electrical performance into chemical metrics, the 500 kW operating point corresponds to a proportional hydrogen yield of approximately 5.93 kg/h. Driven by the highly stable, ripple-free DC supply provided by the proposed hierarchical coordination, the electrolyzer maintains a high Faraday efficiency (>98.5%). Notably, due to the reduced cell overvoltage at part-load (average cell voltage dropping to ~3.12 V), the system achieves an improved and more efficient SEC of approximately 84.4 kWh/kg. This confirms the strategy’s effectiveness in securing reliable green hydrogen production while capturing thermodynamic benefits under varying steady-state load conditions.
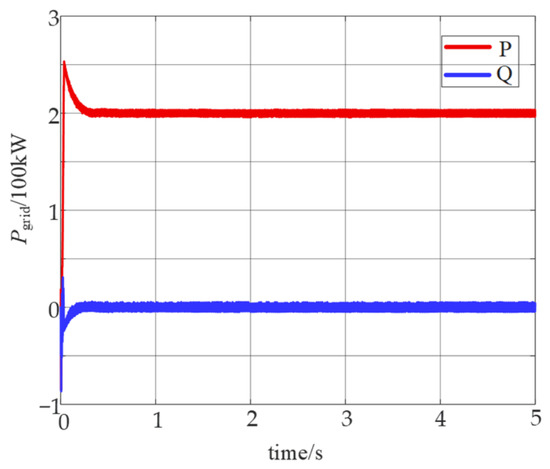
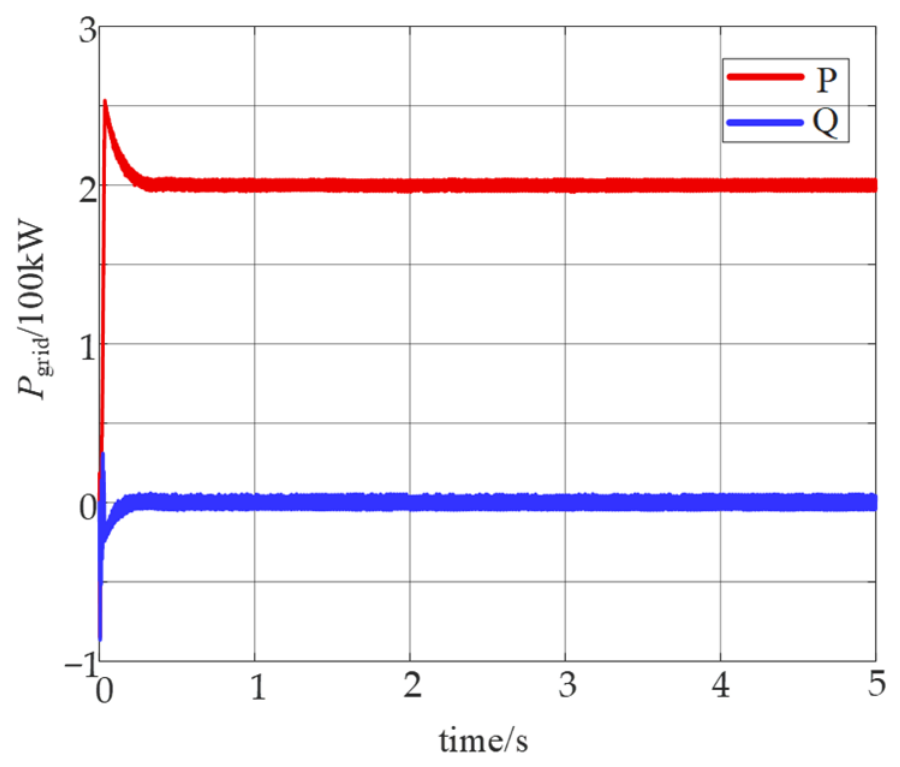
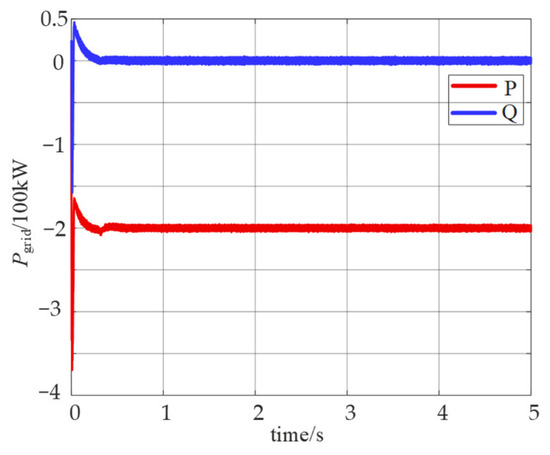
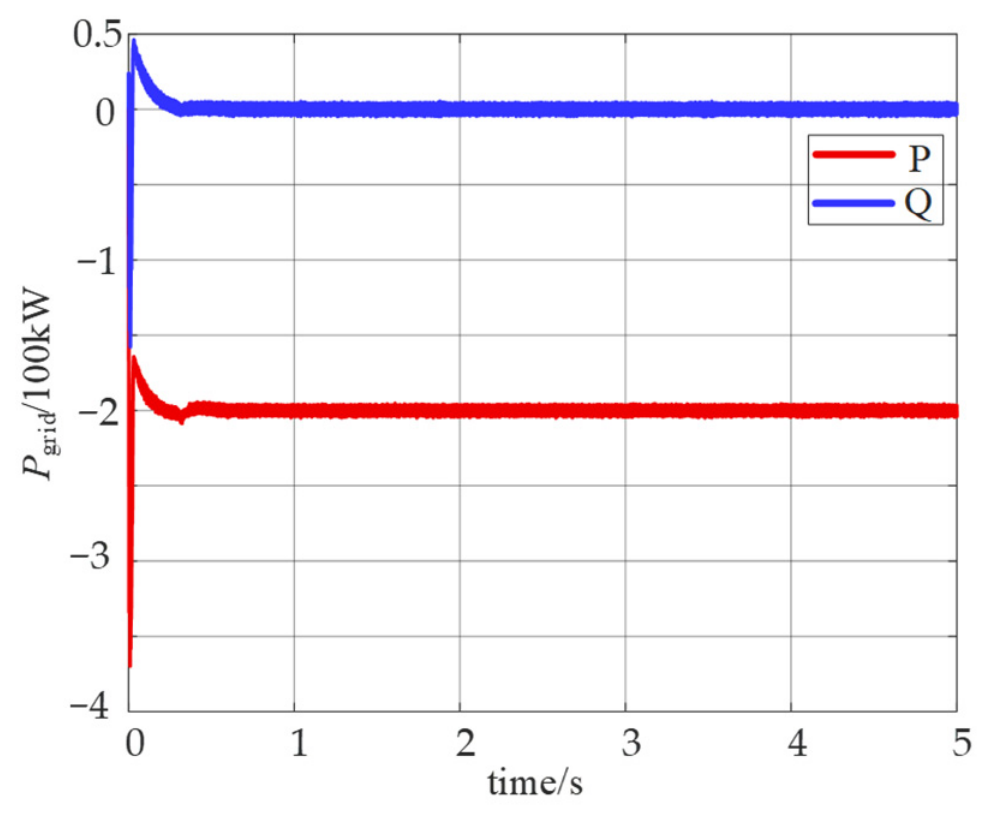
Figure 15 demonstrates that the internal voltage quickly reaches and maintains a precise 660 V setpoint. Building on this stability, Figure 16 illustrates the dynamic active (P) and reactive (Q) power responses of the grid interface during the system startup under Case 2 conditions. Consistent with the defined sign convention, the negative active power values indicate power imported from the AC grid. At t = 0s, the system experiences an initial startup transient, causing a momentary power import peak of approximately 380 kW. Driven by the highly responsive hierarchical controller, this oscillation is rapidly damped within 0.5 s. Following the brief transient, the active power smoothly and accurately settles into its required steady-state value of −200 kW, continuously supplying the precise power deficit required to maintain the 660 V DC bus stability. Concurrently, the reactive power (Q) is strictly regulated to zero throughout the steady-state operation, successfully demonstrating the completely decoupled control of active and reactive power and ensuring unity power factor operation.
Figure 15.
The curve of bus voltage under case 2.
Figure 16.
The curve of grid power under case 2.
3.3. Theoretical Benchmark and System Novelty
To explicitly articulate the novelty of the proposed framework, a theoretical benchmark comparison with conventional microgrid control strategies is essential. In traditional P2H systems, control strategies frequently couple the electrolyzer heavily with the DC bus regulation. Under severe transient conditions, such as the dynamic 50% irradiance drop evaluated in this study, these conventional systems suffer from inherent vulnerabilities. A sudden active power deficit often induces high-frequency coupled oscillations and exposes the sensitive AWE stack to severe transient power surges. Furthermore, conventional curtailment methods often lack adaptive continuous regulation mechanisms, leading to either unnecessary energy waste or delayed overvoltage protection.
The proposed multimodal coordination strategy structurally circumvents these pitfalls. By leveraging multi-port synergetic coordination, the burden of active power buffering is entirely managed by the responsive interactions among the PV, battery, and grid-interfacing converters. This cooperative mechanism strictly maintains a constant DC bus voltage, which in turn naturally shields the sensitive AWE stack from transient electrical stresses. This synergetic architecture eliminates severe control loop competition, fundamentally validating its robustness over conventional integration techniques without necessitating redundant simulation of known coupled-system failure modes.
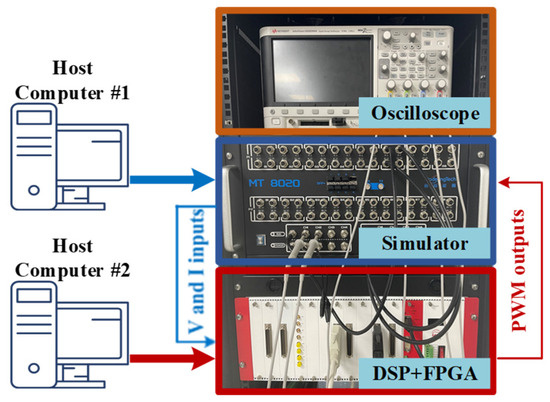
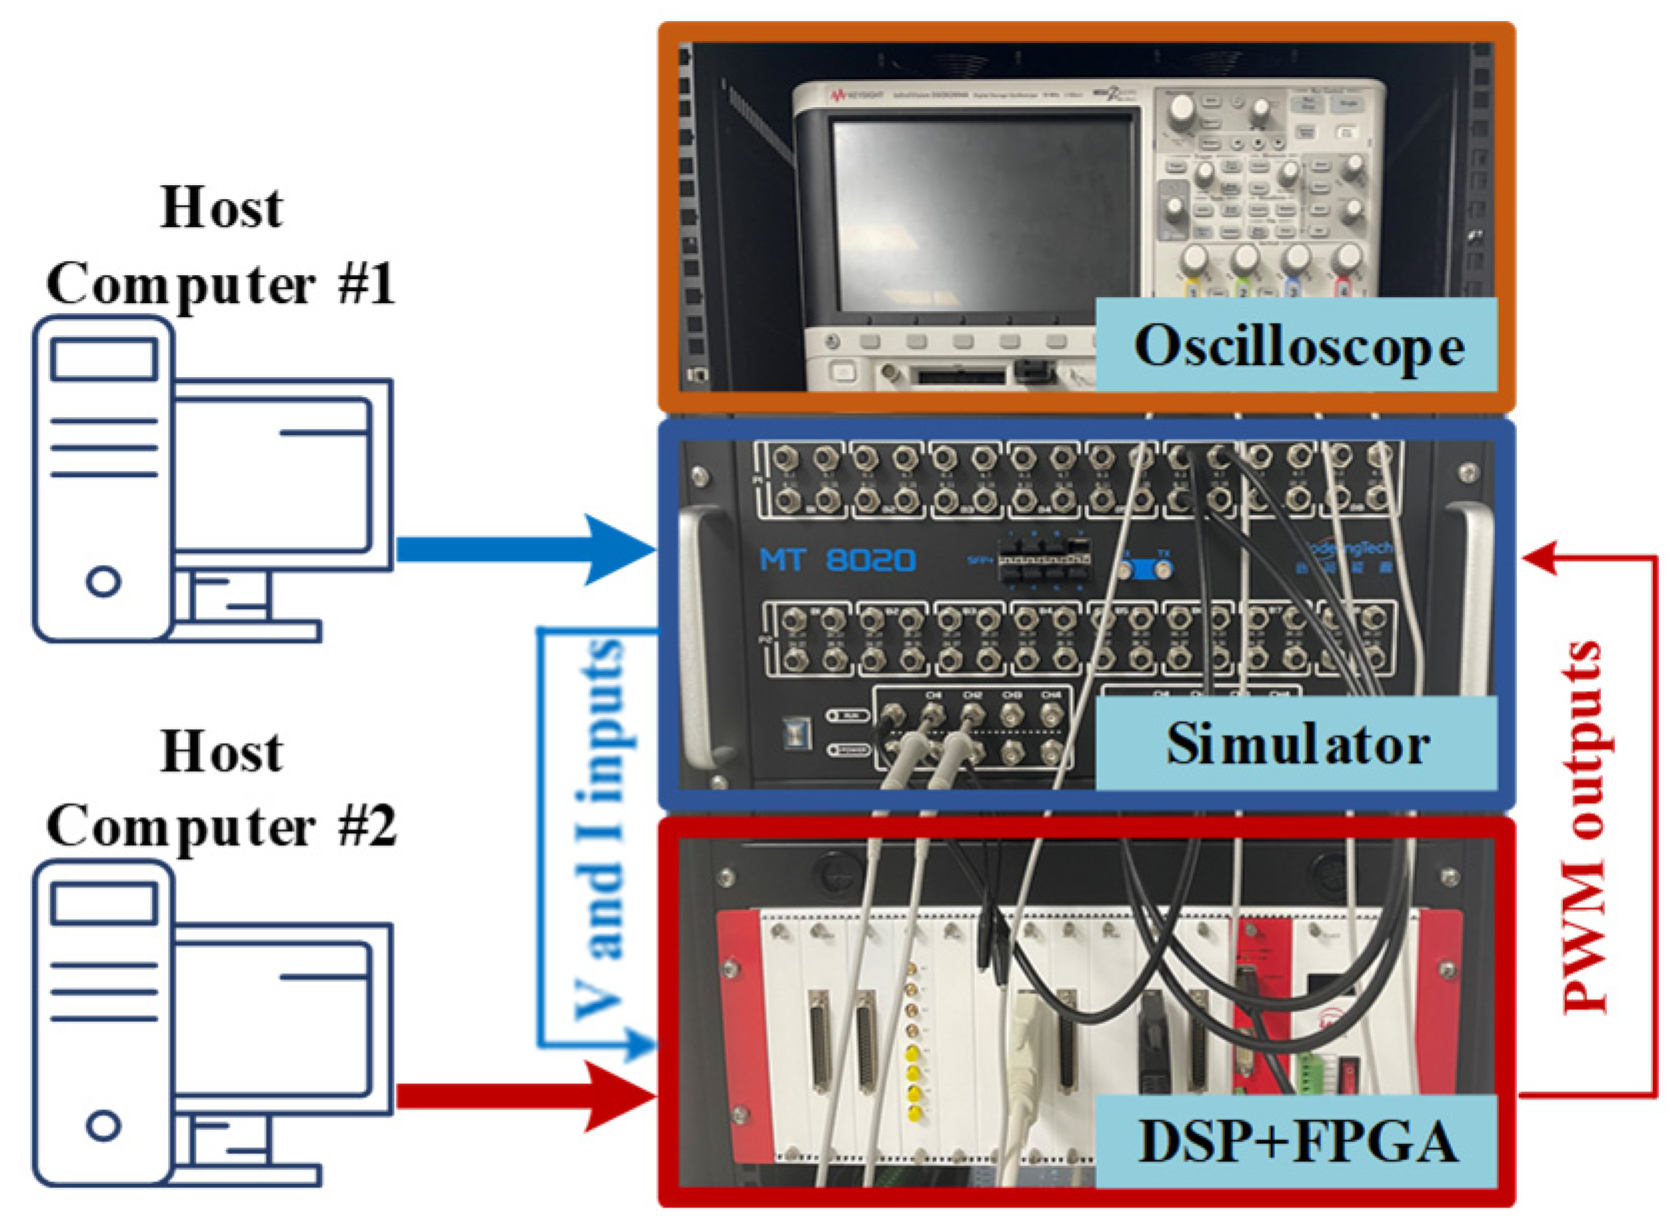
To further validate the theoretical analysis and ensure the practical implementability of the proposed multimodal control strategy, a hardware-in-the-loop (HIL) platform is planned for the next phase of this research, as shown in Figure 17. The future interconnected hardware topology will be configured in StarSim and executed on an MT8020 real-time simulator with a 1 μs step size to achieve precise real-time emulation of the system dynamics. The proposed hierarchical control algorithms are designed to run on a TMS320C28346 DSP, while the underlying modulation scheme will be implemented on a Xilinx XC6SLX16 FPGA to accurately generate the necessary IGBT gate signals. The analog/digital signal exchange between the physical controller and the real-time simulator will be handled by a dedicated I/O board. This planned physical verification is expected to demonstrate dynamic trajectories consistent with the offline EMT simulation results, thereby rigorously confirming the real-time execution capability and structural robustness of the proposed framework. Consistent with the concluding remarks, developing and testing this HIL platform serves as the immediate future work before scaling the multi-port coordination logic into fully operational industrial green hydrogen production systems.
Figure 17.
Hardware-in-the-loop (HIL) platform used for simulation analysis.
4. Conclusions
This study proposes a hierarchical multimodal coordinated control strategy for a four-port (PV–Storage–Grid–Hydrogen) DC microgrid. Time-domain electromagnetic transient (EMT) simulations demonstrate the framework’s capability to leverage multi-port synergetic coordination to actively buffer high-frequency PV ripples and transient power surges, strictly maintaining a constant DC bus voltage and safeguarding the sensitive electrolyzer stack.
The dynamic performance was rigorously evaluated across distinct operational scenarios. Under peak irradiance, the system effectively distributed surplus generation between battery storage and grid export while maintaining a stable power supply to the electrolyzer. Under balanced generation, adaptive power regulation accurately curtailed PV output to match the part-load demand. Crucially, under a severe dynamic irradiance step-change representing a 50% abrupt drop in solar input, the highly responsive grid-interfacing and battery converters instantaneously buffered the massive active power deficit. This synergetic multi-port action restored the DC bus to its nominal state rapidly, confining transient voltage spikes to within safe boundaries and ensuring uninterrupted hydrogen production.
Theoretically, this multi-port coordination mechanism mitigates dynamic electrical stresses, providing a practical control pathway to extend equipment lifespan and ensure consistent gas purity. While this study utilized standard engineering models to focus on high-frequency EMT control dynamics, the lack of immediate physical experimental validation remains a limitation. Future research will focus on developing a Hardware-in-the-Loop (HIL) testing platform to experimentally validate the real-time execution capability of the proposed control logic and integrate multiphysics models for long-term thermodynamic evaluation before scaling into fully operational industrial hydrogen production systems.
Author Contributions
Conceptualization, L.W. and Y.G.; methodology, X.W.; software, Y.S.; validation, X.H.; formal analysis, X.Z.; investigation, Y.Z.; resources, X.W.; data curation, Y.G.; writing—original draft preparation, L.W.; writing—review and editing, Y.S.; visualization, X.H.; supervision, X.Z.; project administration, Y.G. All authors have read and agreed to the published version of the manuscript.
Funding
Financial support from the Science and Technology Project of the State Grid Corporation of China (Grant No. 52018K25000N) is gratefully acknowledged.
Data Availability Statement
The original contributions presented in this study are included in the article. Further inquiries can be directed to the corresponding author.
Conflicts of Interest
Authors Linlin Wu, Yu Gong, Xiaoyu Wang, Yinchi Shao, Xianmiao Huang, Xuesen Zhu and Yiming Zhao were employed by the companies State Grid Jibei Electric Power Co., Ltd. and North China Electric Power Research Institute Co., Ltd. The remaining authors declare that the research was conducted in the absence of any commercial or financial relationships that could be construed as a potential conflict of interest.
References
- Agredano-Torres, M.; Zhang, M.; Söder, L.; Xu, Q. Decentralized dynamic power sharing control for frequency regulation using hybrid hydrogen-electrolyzer systems. IEEE Trans. Sustain. Energy 2024, 15, 1847–1858. [Google Scholar] [CrossRef] [Scilit]
- Xu, Z.; Chen, F.; Chen, K.; Lu, Q. Research on adaptive droop control strategy for a solar-storage DC microgrid. Energies 2024, 17, 1415. [Google Scholar] [CrossRef] [Scilit]
- Wen, Z.; Huang, B.; Wang, Y.; Wang, K.; Tu, X.; Xie, P.; Fu, X. Ammonia as a renewable energy carrier: From synthesis to utilization. Nat. Rev. Clean Technol. 2025, 11, 755–770. [Google Scholar] [CrossRef] [Scilit]
- Kumar, P.; Singh, O. Fuel cell and hydrogen-based hybrid energy conversion technologies. In Prospects of Hydrogen Fueled Power Generation; River Publishers: Gistrup, Denmark, 2024; pp. 207–221. [Google Scholar]
- Kumar, P.; Date, A.; Shabani, B. Techno-economic analysis of an integrated desalination-renewable-hydrogen system for zero-emission freshwater and electricity production. Energy Convers. Manag. 2026, 353, 121231. [Google Scholar] [CrossRef] [Scilit]
- Zhu, J.; Qiu, Y.; Zeng, Y.; Zhou, Y.; Chen, S.; Zang, T.; Zhou, B.; Yu, Z.; Lin, J. Exploring the optimal size of grid-forming energy storage in an off-grid renewable P2H system under multi-timescale energy management. Appl. Energy 2026, 407, 127295. [Google Scholar] [CrossRef] [Scilit]
- Zeng, Y.; Qiu, Y.; Jiang, L.; Zhu, J.; Zhou, Y.; Li, J.; Chen, S.; Zhou, B. Harmonic cancellation in multi-electrolyzer P2H plants via phasor-modulated production scheduling. IEEE Trans. Power Del. 2026, 41, 1002–1005. [Google Scholar] [CrossRef] [Scilit]
- Zeng, Y.; Qiu, Y.; Xu, L.; Gu, C.; Zhou, Y.; Li, J.; Chen, S.; Zhou, B. Optimal investment portfolio of thyristor- and IGBT-based electrolysis rectifiers in utility-scale renewable P2H systems. IEEE Trans. Sustain. Energy 2025, 17, 740–755. [Google Scholar]
- Zhou, L.; Zhang, N.; Zhou, Y.; Qiu, Y.; Chen, S. Quantifying grid-forming requirement for electrolyzer-based hydrogen production in off-grid systems. Energies 2025, 18, 6440. [Google Scholar] [CrossRef] [Scilit]
- Zeng, Y.; Qiu, Y.; Zhu, J.; Chen, S.; Zhou, B.; Li, J.; Yang, B.; Lin, J. Scheduling multiple industrial electrolyzers in renewable P2H systems: A coordinated active-reactive power management method. IEEE Trans. Sustain. Energy 2025, 16, 201–215. [Google Scholar] [CrossRef] [Scilit]
- Ajanovic, A.; Sayer, M.; Haas, R. On the future relevance of green hydrogen in Europe. Appl. Energy 2024, 358, 122586. [Google Scholar] [CrossRef] [Scilit]
- Li, J.; Lin, J.; Heuser, P.M.; Heinrichs, H.U.; Xiao, J.; Liu, F.; Robinius, M.; Song, Y.; Stolten, D. Co-planning of regional wind resources-based ammonia industry and the electric network: A case study of Inner Mongolia. IEEE Trans. Power Syst. 2021, 37, 65–80. [Google Scholar]
- Li, J.; Lin, J.; Wang, J.; Lu, X.; Nielsen, C.P.; McElroy, M.B.; Song, Y.; Song, J.; Lyu, X.; Yu, M.; et al. Redesigning electrification of China’s ammonia and methanol industry to balance decarbonization with power system security. Nat. Energy 2025, 10, 762–773. [Google Scholar] [CrossRef] [Scilit]
- Iribarren, Á.; Elizondo, D.; Barrios, E.L.; Ibaiondo, H.; Sanchez-Ruiz, A.; Arza, J.; Sanchis, P.; Ursúa, A. Dynamic modeling of a pressurized alkaline water electrolyzer: A multiphysics approach. IEEE Trans. Ind. Appl. 2023, 59, 3741–3753. [Google Scholar] [CrossRef] [Scilit]
- Riera, J.A.; Lima, R.M.; Knio, O.M. A review of hydrogen production and supply chain modeling and optimization. Int. J. Hydrogen Energy 2023, 48, 13731–13755. [Google Scholar] [CrossRef] [Scilit]
- Hassan, N.S.; Jalil, A.; Rajendran, S.; Khusnun, N.; Bahari, M.; Johari, A.; Kamaruddin, M.; Ismail, M. Recent review and evaluation of green hydrogen production via water electrolysis for a sustainable and clean energy society. Int. J. Hydrogen Energy 2024, 52, 420–441. [Google Scholar] [CrossRef] [Scilit]
- Guo, X.; Zhang, S.; Ding, F.; Zhu, J.; Bai, H. A novel DC-DC converter for electrolyzer with low ripple and high step-down. IEEE Trans. Ind. Electron. 2024, 71, 12476–12486. [Google Scholar] [CrossRef] [Scilit]
- He, H.; Xia, Y.; Li, L.; Feng, Q.; Wei, W. Adaptive power coordination control for electrolysis hydrogen directly driven by wind turbines. IEEE Trans. Power Electron. 2025, 40, 2315–2326. [Google Scholar] [CrossRef] [Scilit]
- Hossain, M.B.; Islam, M.R.; Muttaqi, K.M.; Sutanto, D.; Agalgaonkar, A.P. Power system dynamic performance analysis based on frequency control by proton exchange membrane electrolyzers. IEEE Trans. Ind. Appl. 2023, 4, 4998–5008. [Google Scholar]
- Tavakoli, S.D.; Dozein, M.G.; Lacerda, V.A.; Mañe, M.C.; Prieto-Araujo, E.; Mancarella, P.; Gomis-Bellmunt, O. Grid-forming services from hydrogen electrolyzers. IEEE Trans. Sustain. Energy 2023, 14, 2205–2219. [Google Scholar] [CrossRef] [Scilit]
- Sánchez, L.; Reigosa, D.; Bilbao, A.; Peña-Gonzalez, I.; Briz, F. Comparative analysis of power converter topologies for hydrogen electrolyzers. IEEE J. Emerg. Sel. Top. Power Electron. 2024, 12, 4325–4341. [Google Scholar] [CrossRef] [Scilit]
- Nguyen Huu, D. An innovative adaptive droop control based on available energy for DC micro distribution grids. Energies 2020, 13, 2983. [Google Scholar] [CrossRef] [Scilit]
- Agredano-Torres, M.; Xu, Q. Decentralized power management of hybrid hydrogen electrolyzer-supercapacitor systems for frequency regulation of low-inertia grids. IEEE Trans. Ind. Electron. 2025, 8, 8072–8081. [Google Scholar] [CrossRef] [Scilit]
- Ning, G.; Du, L.; Yuan, L.; Sun, Y.; Liu, Y.; Xu, G.; Han, H.; Su, M. Single-stage IIOS converter with auto-voltage-sharing for distributed photovoltaic MVDC collection system. IEEE Trans. Power Electron. 2024, 11, 14172–14178. [Google Scholar] [CrossRef] [Scilit]
- Zhu, X.; Hou, P.; Zhang, B. A multiport current-fed IIOS dual-half-bridge converter for distributed photovoltaic MVDC integration system. IEEE Trans. Ind. Electron. 2024, 4, 3788–3800. [Google Scholar] [CrossRef] [Scilit]
- Zhang, S.; Teng, Y.; Sun, Y.; Ding, F.; Wang, N.; Guo, X.; Hua, C. Fault diagnosis and fault-tolerant operation strategy for triple-port hydrogen production system. IEEE Trans. Power Electron. 2025, 40, 11526–11536. [Google Scholar] [CrossRef] [Scilit]
- Li, C.; Ren, Z.; Li, W. CVaR-Wasserstein metric based power system scheduling considering frequency support of hydrogen production stations. IEEE Trans. Ind. Appl. 2025, 61, 2025–2036. [Google Scholar] [CrossRef] [Scilit]
- Li, C.; Ren, Z.; Li, W. A pricing method for multi-type frequency regulation ancillary services incorporating hydrogen refueling stations under uncertainty. Int. J. Hydrogen Energy 2025, 152, 150200. [Google Scholar] [CrossRef] [Scilit]
- Feng, J.; Ren, Z.; Li, C.; Li, W. A Benders-combined safe reinforcement learning framework for risk-averse dispatch considering frequency security constraints. IEEE Trans. Circuits Syst. II Express Briefs 2025, 72, 1063–1067. [Google Scholar] [CrossRef] [Scilit]
- Feng, J.; Ren, Z.; Li, W. A robust safe reinforcement learning-based operation method for hybrid electric-hydrogen energy system risk-based dispatch considering dynamic efficiency characteristics of electrolysers. Renew. Energy 2025, 254, 123761. [Google Scholar] [CrossRef] [Scilit]
- Feng, J.; Ren, Z.; Li, W. Soft actor-critic combined with logic-based Benders decomposition algorithm for monthly security constrained unit commitment under wind power uncertainty. IEEE Trans. Power Syst. 2025, 40, 4784–4796. [Google Scholar] [CrossRef] [Scilit]
- Sha, L.D.; Jin, J.; Qi, R.; Li, Q.; Li, W.; Lin, R.; Gao, D.; Li, H.; Li, X.; Yang, C.; et al. Semi-empirical equivalent circuit model and evaluation of energy losses for alkaline electrolysis stack in dynamic operations. Int. J. Hydrogen Energy 2025, 138, 859–873. [Google Scholar] [CrossRef] [Scilit]

Disclaimer/Publisher’s Note: The statements, opinions and data contained in all publications are solely those of the individual author(s) and contributor(s) and not of MDPI and/or the editor(s). MDPI and/or the editor(s) disclaim responsibility for any injury to people or property resulting from any ideas, methods, instructions or products referred to in the content. |
© 2026 by the authors. Licensee MDPI, Basel, Switzerland. This article is an open access article distributed under the terms and conditions of the Creative Commons Attribution (CC BY) license.