


Abstract
Improving energy efficiency and reducing carbon emissions have become critical challenges in urea production, motivating increased interest in recovering mechanical energy within the process. This study develops a superstructure-based work exchange network with direct work exchangers to analyze mechanical energy recovery in urea synthesis. The work integration (WI) method is evaluated for single-, double-, and triple-stage configurations across different production capacities and compared with a conventional HPRT-based system. Results show that WI consistently outperforms HPRT in both energy recovery and CO2 reduction. The single-stage configuration achieves the highest energy recovery, reaching 8448 MWh/year at 3710.83 t/day, an 18.8% improvement over HPRT. Wind power has the lowest carbon intensity, and emission reduction increases with production capacity. The largest absolute CO2 reduction occurs in the single-stage case, while the greatest relative improvement (up to 41.1%) is observed in the three-stage configuration. Overall, WI significantly enhances energy efficiency and environmental performance in urea production.
1. Introduction
Urea ((NH2)2CO) is one of the most widely produced organic chemicals worldwide. In 2025, the global urea market was valued at approximately USD 79.73 billion and is projected to reach USD 104.88 billion by 2034, with a compound annual growth rate of 3.90% [1]. Beyond its dominant role in agriculture, urea is widely used in various industrial applications due to its favorable properties, including high water solubility, low toxicity, low volatility, and high hydrogen content [2]. These characteristics facilitate its storage and transportation and make it a promising candidate as a hydrogen carrier and a potential fuel for fuel cell systems [3]. In addition, urea is utilized in diesel engine emission control [4], plastics manufacturing [5], and fungicide production [6]. Despite the continuous growth in demand, industrial urea production still relies primarily on the conventional synthesis route, in which ammonia (NH3) reacts with carbon dioxide (CO2) at temperatures of 170–220 °C and pressures of 125–250 bar [2]. This process is carbon-intensive: producing one ton of urea requires approximately 0.73 tons of CO2 and is associated with around 1.5 tons of CO2 emissions [7]. Consequently, the traditional production pathway still faces sustainability challenges due to its heavy reliance on fossil resources and high levels of CO2 emissions [8].
Integrating and intensifying process operations in urea synthesis offers an effective way to reduce energy consumption and lower overall carbon emissions [9]. One example is the ultra-low energy (ULE) retrofit, which improves steam system design and process configuration to enhance heat recovery while overcoming limitations related to temperature differences and corrosion. For instance, the introduction of a dual-tube bundle reactor—where the inner bundle generates low-pressure steam and the outer bundle promotes carbamate decomposition at medium pressure—enables more efficient, staged use of energy [10]. As a result, ULE systems can significantly reduce steam and cooling water demand, and have already been implemented at an industrial scale in China [11]. In addition, integrated production schemes further improve resource efficiency. In urea–methylamine co-production, unreacted NH3 is redirected to a methylation unit for methylamine synthesis, enabling process integration within a single system [12]. Similarly, urea–melamine integration recovers NH3- and CO2-rich off-gases from melamine production and recycles them into the urea synthesis loop, forming a closed-cycle system. Since urea is a key feedstock for melamine, this approach also enables flexible production adjustments in response to market demand [13].
Work integration (WI) is a form of process integration that enables the recovery and reuse of mechanical energy by transferring pressure energy from high-pressure streams to low-pressure streams. Such energy transfer can reduce external compression or pumping requirements and thereby improve the overall energy efficiency of industrial processes. From a methodological perspective, work exchange network (WEN) synthesis has often been formulated as a mathematical optimization problem. To improve model tractability, many studies [14,15,16] adopt simplifying assumptions, such as ideal gas behavior, reversible or isothermal compression/expansion, and single-phase process streams. These assumptions are useful for conceptual network design, but they may limit the accuracy of performance evaluation when the method is applied to real industrial systems involving non-ideal thermodynamics, multiphase behavior, and complex operating constraints.
Work exchange can be realized through direct or indirect devices. Direct work exchange devices (DWEDs) transfer mechanical energy between high- and low-pressure streams through two parallel displacement chambers, enabling pressure exchange without intermediate conversion to shaft work or electricity [17]. In 1996, Huang and Fan [18] introduced the concept of WEN and proposed criteria for matching process streams, providing an early foundation for systematic WI. Zhou et al. [14] applied pinch analysis to WENs based on direct work exchangers and used a problem table approach to estimate minimum work requirements. Their results, however, relied on the simplifying assumption that the source pressure is always higher than the sink pressure, providing only approximate values and omitting detailed network design and stream matching. Zhuang et al. [19] further advanced the methodology by introducing an improved graphical approach using pressure index–work (μ–W) diagrams. By constructing modified composite curves for source and sink streams, this method allows the analysis of WEN under isothermal, isentropic, and variable process conditions. Amini-Rankouhi and Huang [16] proposed a thermodynamic approach to maximize recoverable mechanical energy, developing a pressure interval matrix to evaluate system potential. However, this method does not optimize the WEN structure. In parallel, indirect work exchange devices have also been investigated. In such devices, pressure energy from a high-pressure stream is first converted into shaft work or electricity through a turbine and then used to drive a compressor or pump for pressurizing a low-pressure stream [20]. Typical examples include single-shaft turbine–compressor (SSTC) and hydraulic power recovery turbine (HPRT). Razib et al. [21] developed a multi-stage superstructure model for matching high- and low-pressure streams in SSTC-based networks, with the objective of minimizing total annualized cost. However, the use of linear cost functions limits the accuracy of economic evaluation. Du et al. [22] proposed a method based on a transshipment model for synthesizing indirect WEN, which benefits from the computational efficiency of linear programming. Nevertheless, its reliance on assumptions such as ideal gas behavior and isothermal reversible compression restricts its practical applicability. Feng and Chen [23] introduced matching rules for pressurized and depressurized streams based on both energy and economic considerations, but the heuristic nature of the method limits its applicability to large-scale and complex systems.
Application of WENs in real industrial processes remains limited. Deng et al. [24] developed a pinch-based WEN and compared direct and indirect work exchange schemes in a Rectisol process, showing clear energy-saving potential, although phase change behavior was neglected. Rossi et al. [25] investigated the application of HPRTs in an Italian refinery for H2S removal and reported an annual energy recovery of approximately 2966 MWh. The authors further explored the potential of this HPRT technology in urea synthesis, considering energy recovery efficiency, environmental benefits, and economic feasibility [26]. More recently, Lan et al. [27] developed a superstructure-based WEN using DWEDs and applied it to cryogenic distillation for CO2 capture, demonstrating its effectiveness in reducing energy consumption and carbon emissions. Nevertheless, the systematic design of a superstructure-based direct WEN for mechanical energy recovery in urea synthesis processes has not yet been fully explored, particularly under realistic operating conditions derived from process simulation. This gap motivates the present study.
This study focuses on mechanical energy recovery in urea synthesis processes. The remainder of the paper is organized as follows. Section 2 describes the configuration of the urea synthesis process. Section 3 introduces the work recovery methods. Section 4 presents the application of work recovery techniques to the process, along with results and discussion. Finally, Section 5 provides the conclusions.
2. Urea Synthesis Process
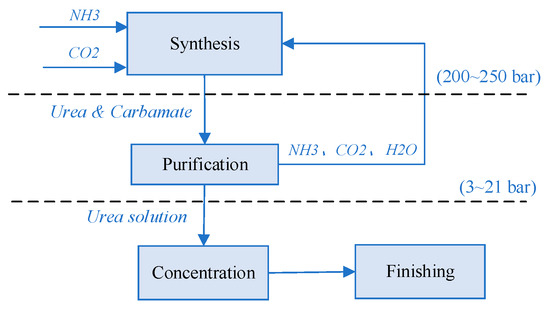
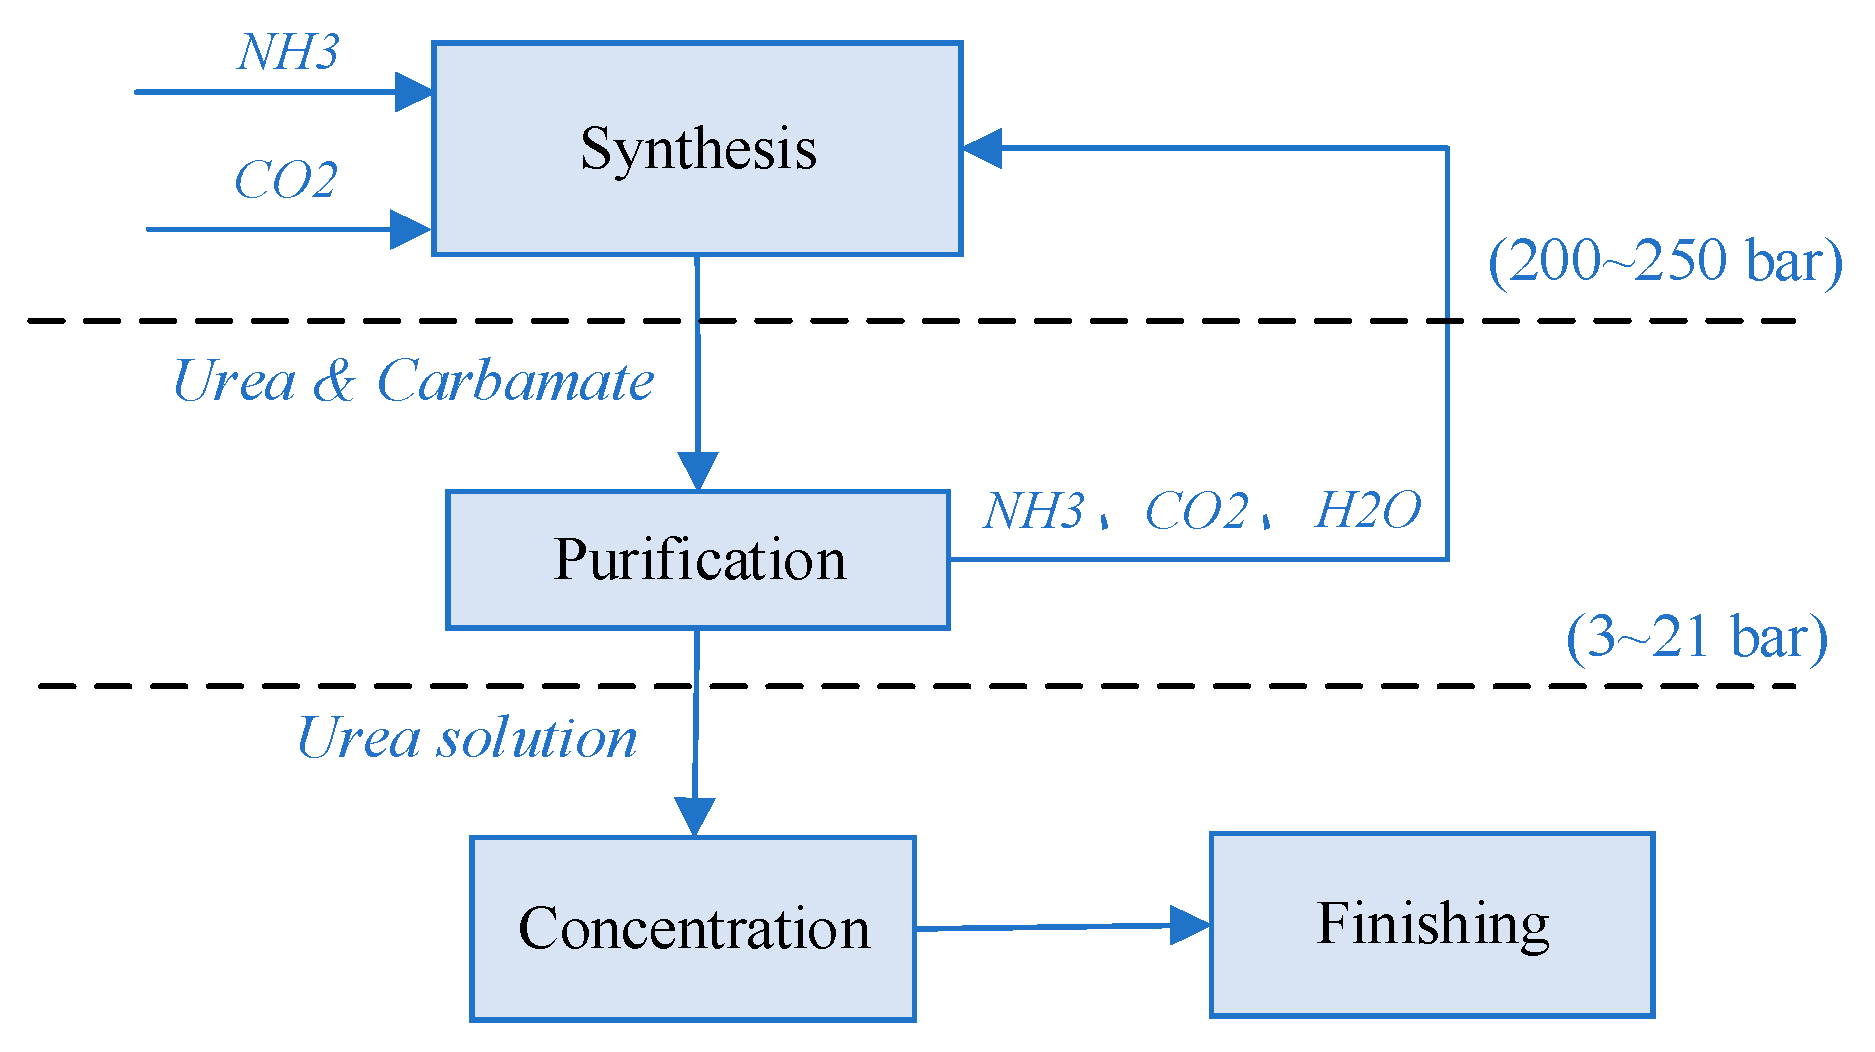
The industrial urea production process can be divided into three main stages: (i) the synthesis section, where NH3 and CO2 react under high-pressure conditions (200–250 bar) to produce urea, while unreacted NH3 and CO2 are simultaneously recovered and recycled; (ii) the purification section, which operates at medium and low pressures (3–21 bar) to separate and recover excess NH3, CO2, water, and ammonium carbamate, thereby increasing the urea concentration; and (iii) the concentration and finishing section, where the urea solution is further concentrated to high purity and converted into solid products for storage and commercial use [28].
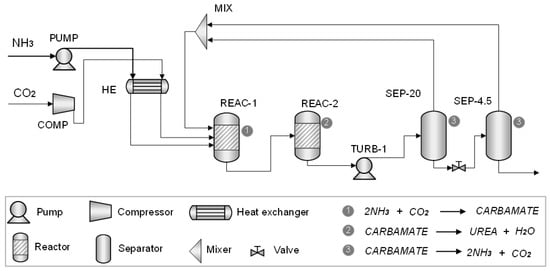
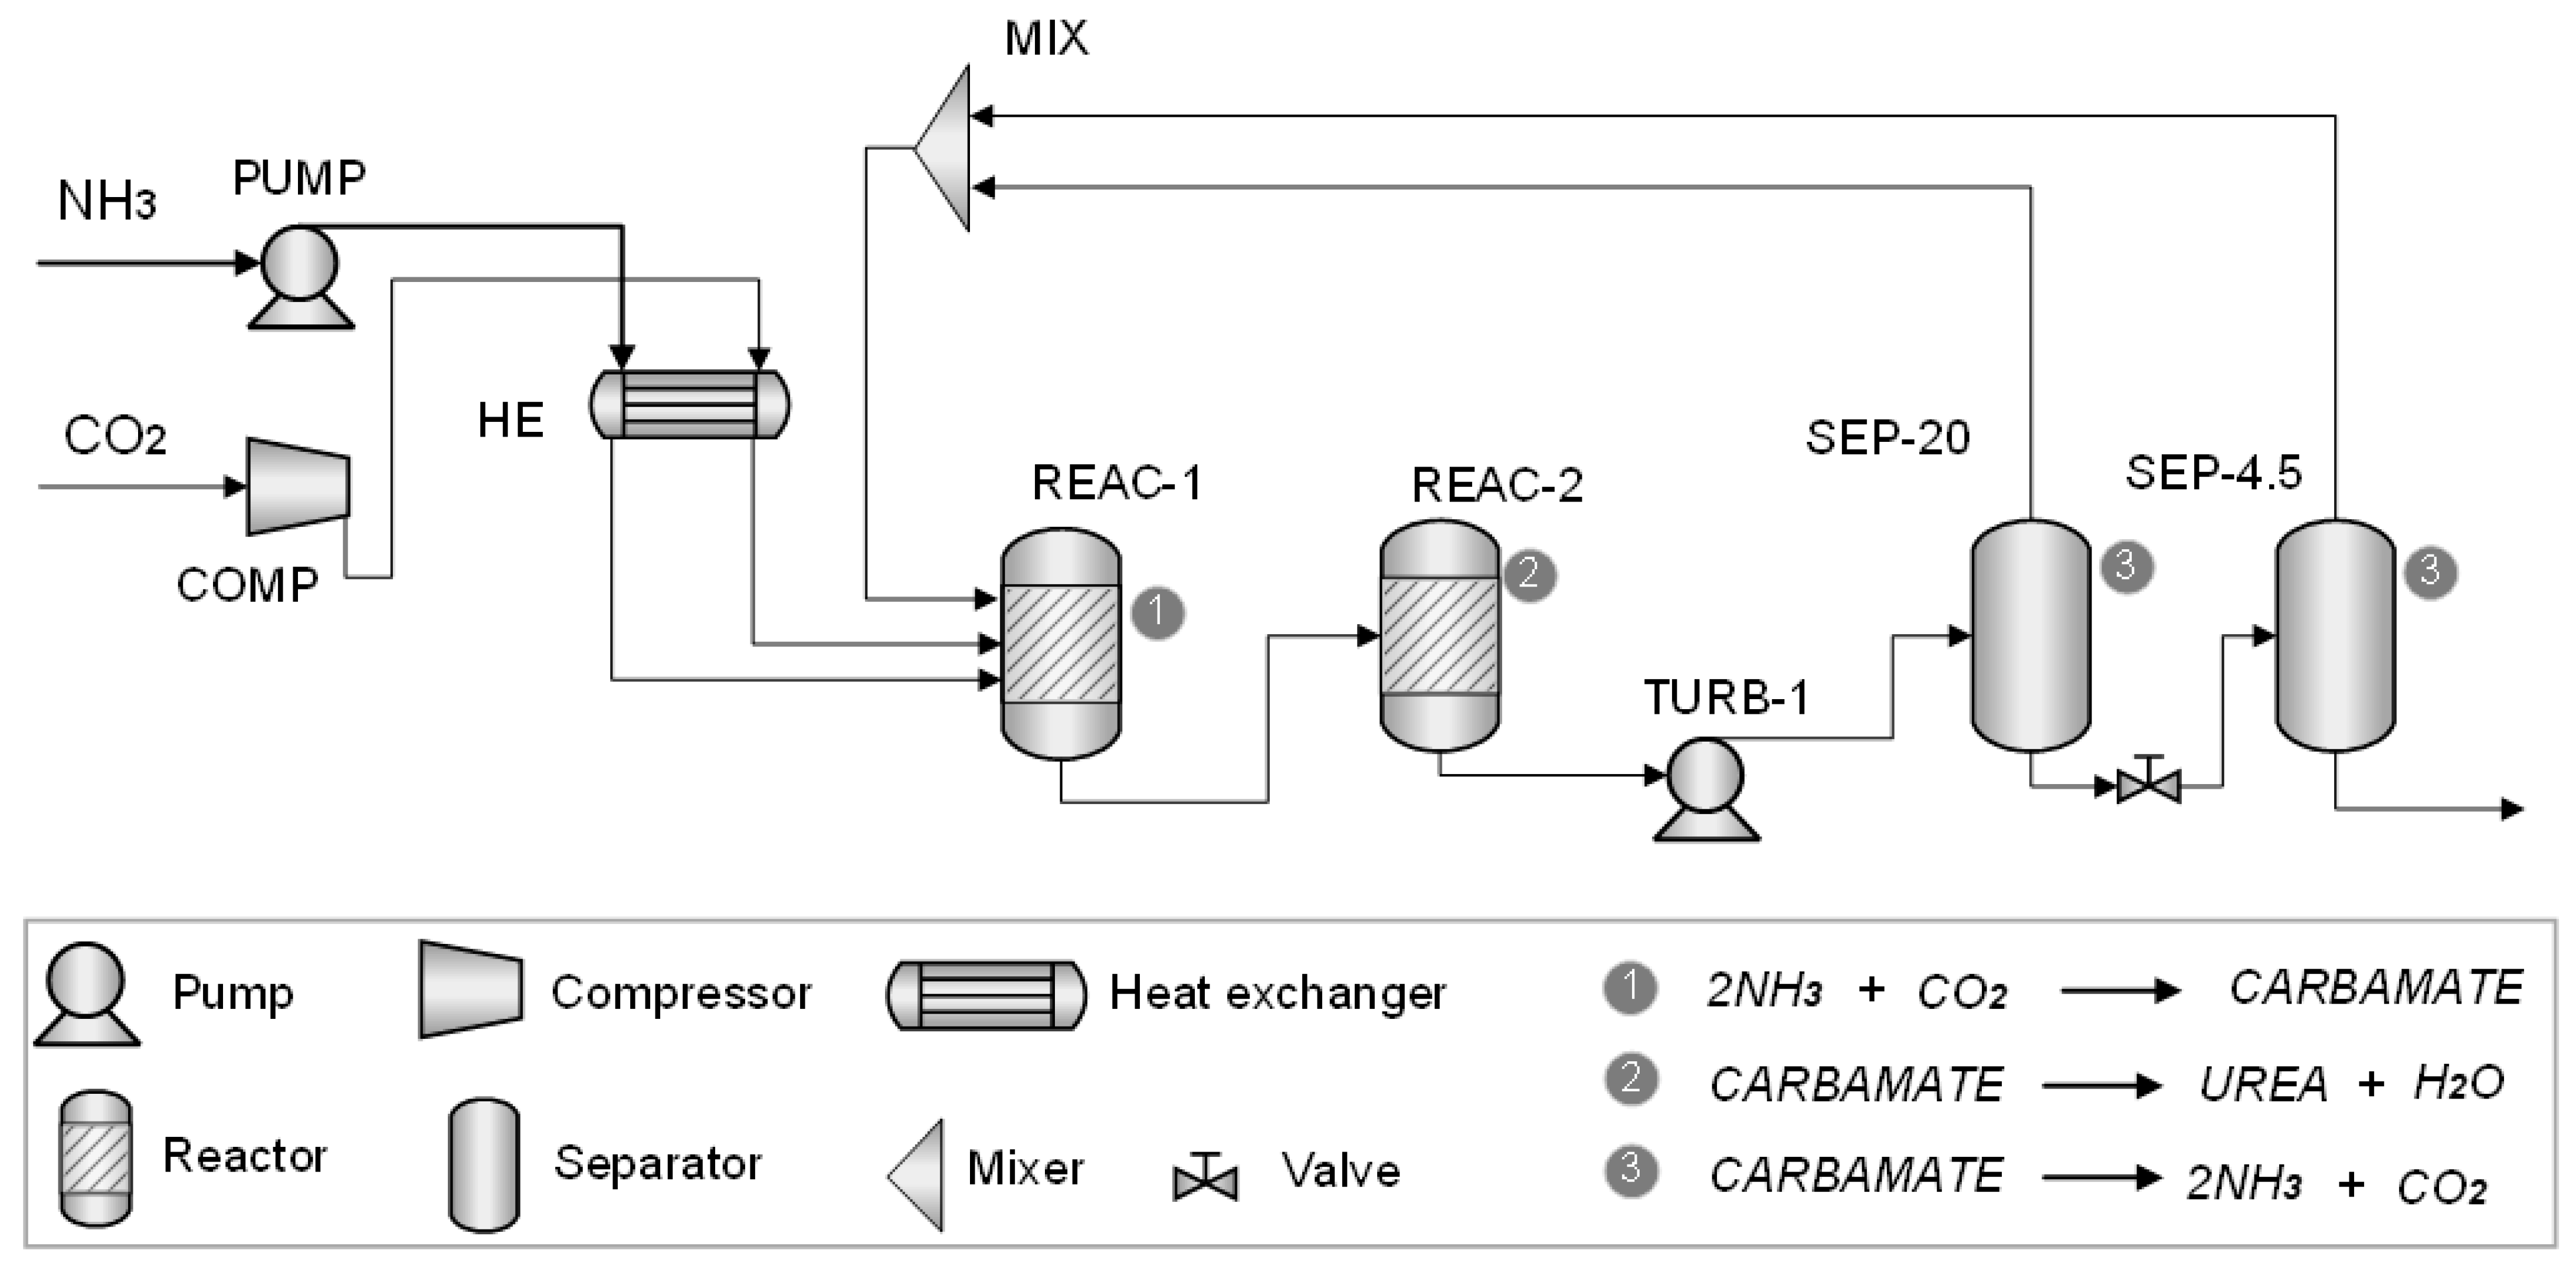
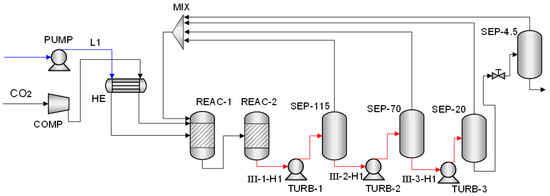
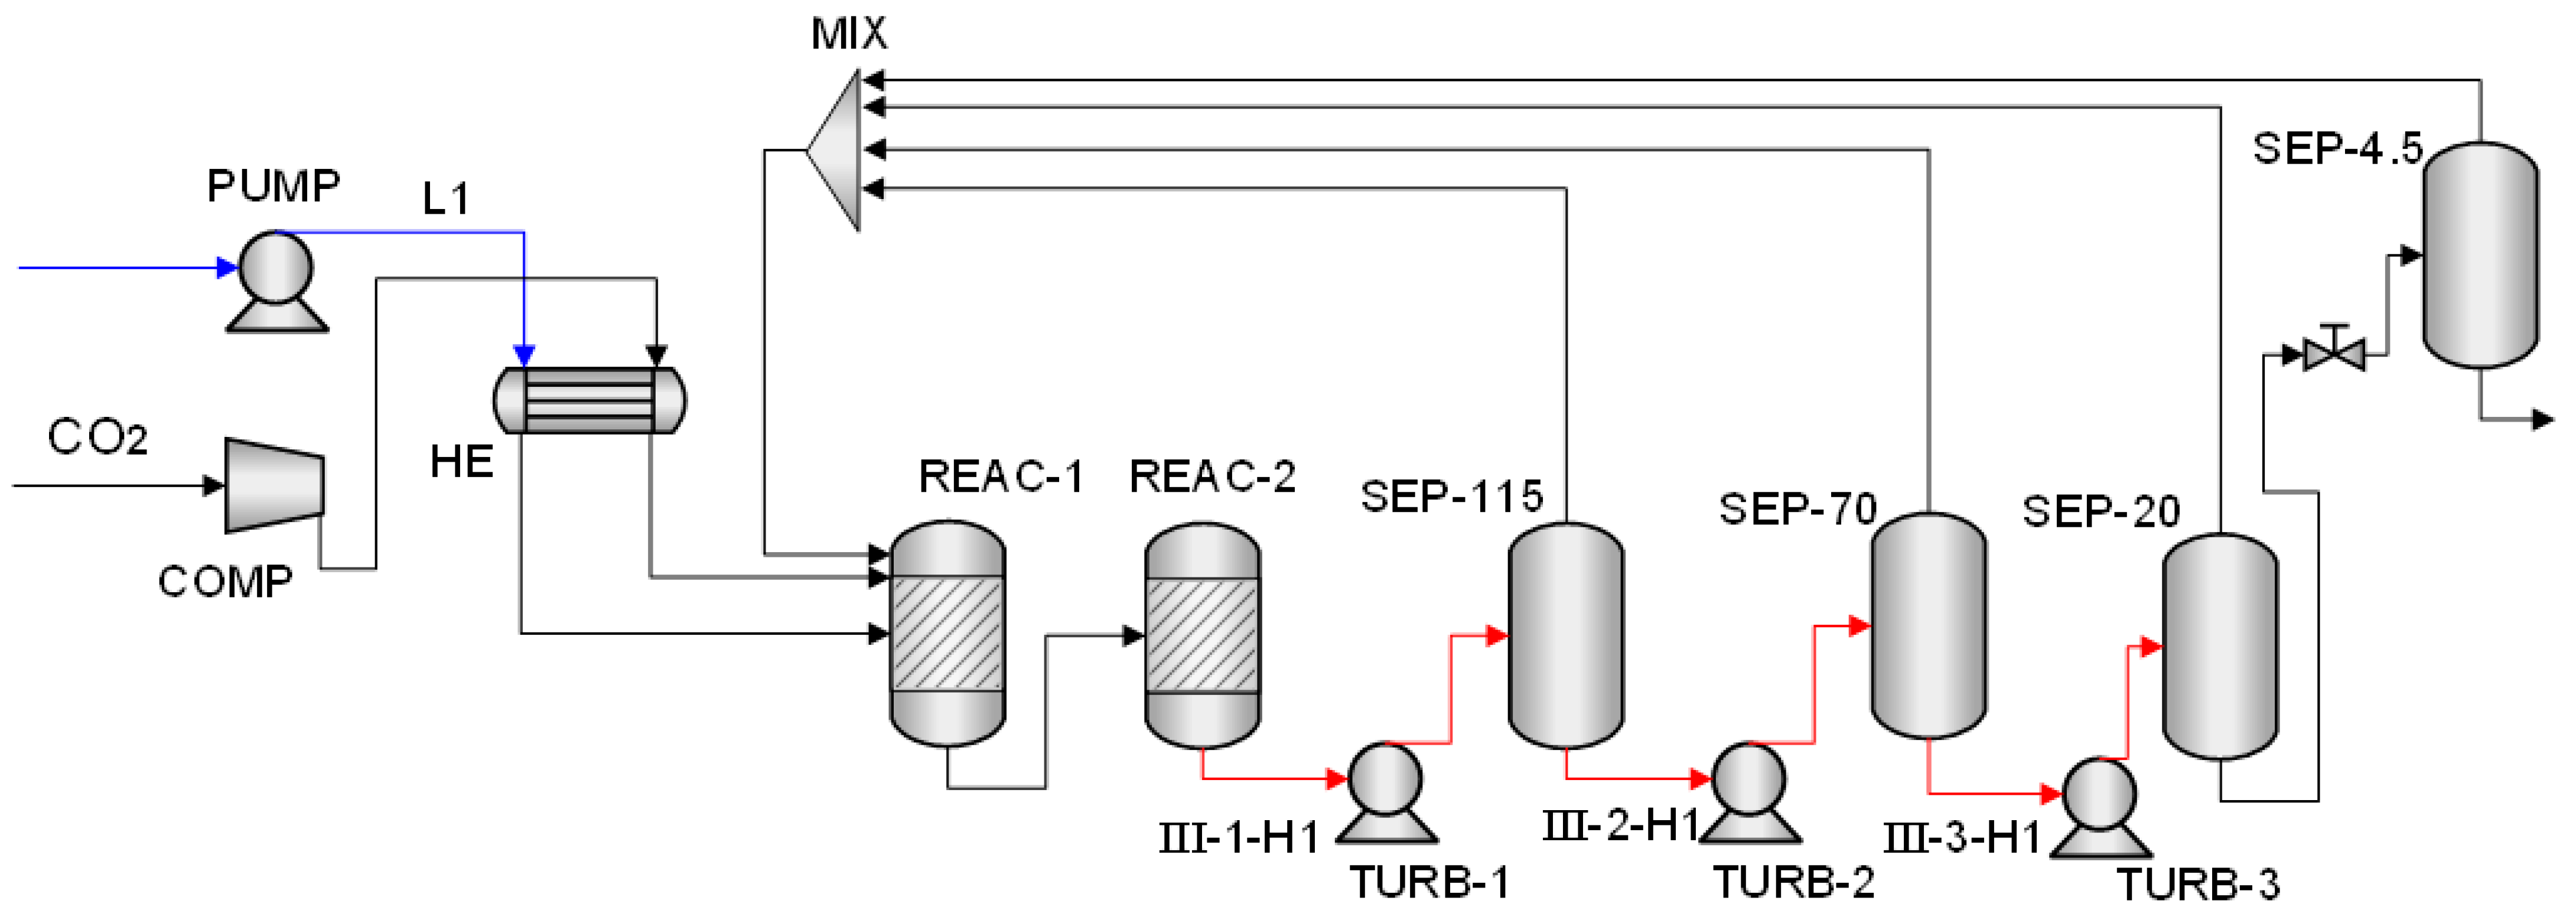
Figure 1 provides a simplified schematic of the industrial urea production process, with this study focusing primarily on the first two stages. The flow diagram of the urea synthesis and purification sections is shown in Figure 2. The high flow rates of NH3 and CO2, combined with the elevated pressures in these sections, present significant potential for mechanical energy recovery within the process.
Figure 1.
Urea synthesis process block diagram.
Figure 2.
Urea synthesis and purification section flow diagram.
Urea synthesis proceeds through two consecutive reactions. In the first step (Equation (1)), NH3 reacts with CO2 in reactor REAC-1 to form ammonium carbamate in the liquid phase. In the second step (Equation (2)), ammonium carbamate is dehydrated in reactor REAC-2 through an endothermic equilibrium reaction to produce urea.
2NH3 + CO2 ↔ NH4COONH2
NH4COONH2 ↔ NH2CONH2 + H2O
In the purification stage, the main objective is to recover unreacted components and improve product quality under medium- and low-pressure conditions. The urea solution leaving the synthesis section is first depressurized through turbine TURB-1, reducing its pressure from high synthesis conditions to the lower levels required for purification. This pressure reduction promotes the separation of NH3, CO2, water, and ammonium carbamate. During this step, the released NH3 and CO2 are separated from the liquid in a phase separator (SEP-20) and recycled back to the synthesis section. Meanwhile, ammonium carbamate is further decomposed in a subsequent stripping unit (SEP-4.5). The resulting streams can then be directed either to the urea concentration unit or to the final product processing section.
3. Methodology
3.1. Principles of DWED and HPRT
An HPRT is primarily used for liquid transport while enabling energy recovery within the process. In addition to its functional flexibility, the HPRT is relatively easy to install and requires low maintenance, making it a practical and cost-effective option for industrial applications.
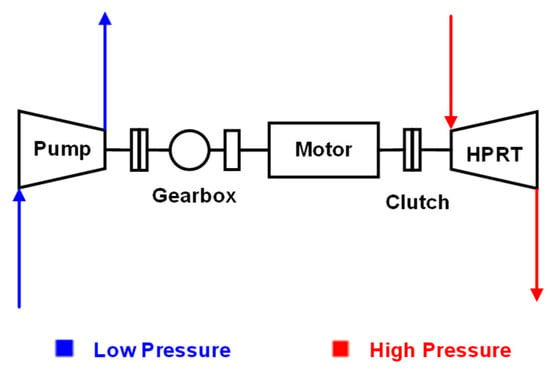
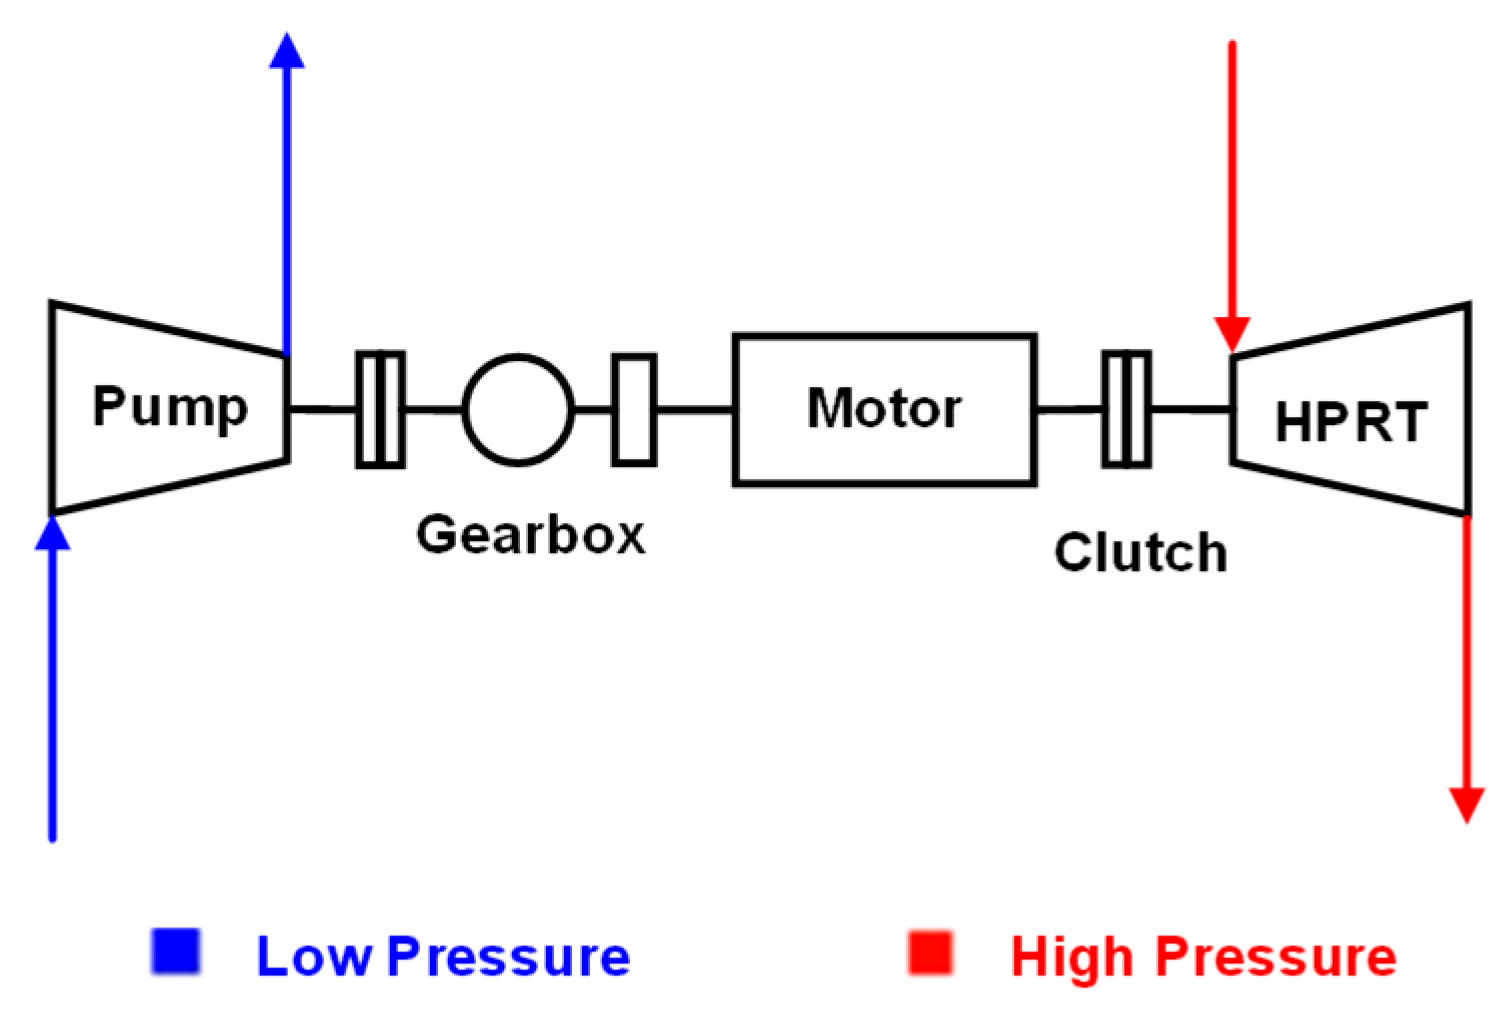
A typical HPRT system consists of a pump, a gearbox, a motor, a clutch, and the HPRT unit. In this configuration, high-pressure streams pass through the HPRT, where mechanical energy is recovered and transferred to assist the pump in compressing low-pressure streams. Through this process, energy recovery is achieved. As illustrated in Figure 3 [26], the HPRT is commonly coupled with the feed pump within the same process and arranged on a shared shaft to reduce the pump’s power demand. The pump increases the pressure of the process fluid. A gearbox is installed between the motor and the pump to regulate the torque and rotational speed delivered by the motor according to plant operating requirements, ensuring stable and flexible operation. In addition, it enables quick disconnection during maintenance or in the event of failure.
Figure 3.
Layout of an HPRT system [26].
The clutch controls the engagement of the HPRT, enabling it to be disconnected when necessary or to operate as a backup pump in emergency situations. Within the HPRT, the turbine converts the pressure energy of the fluid into mechanical energy.
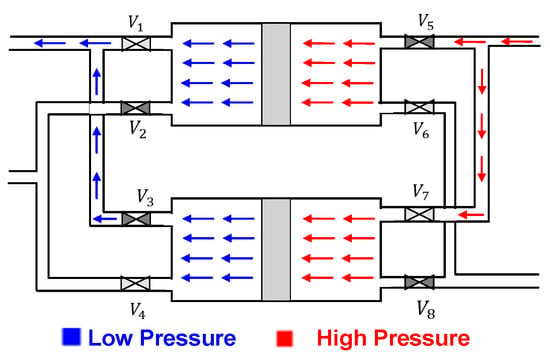
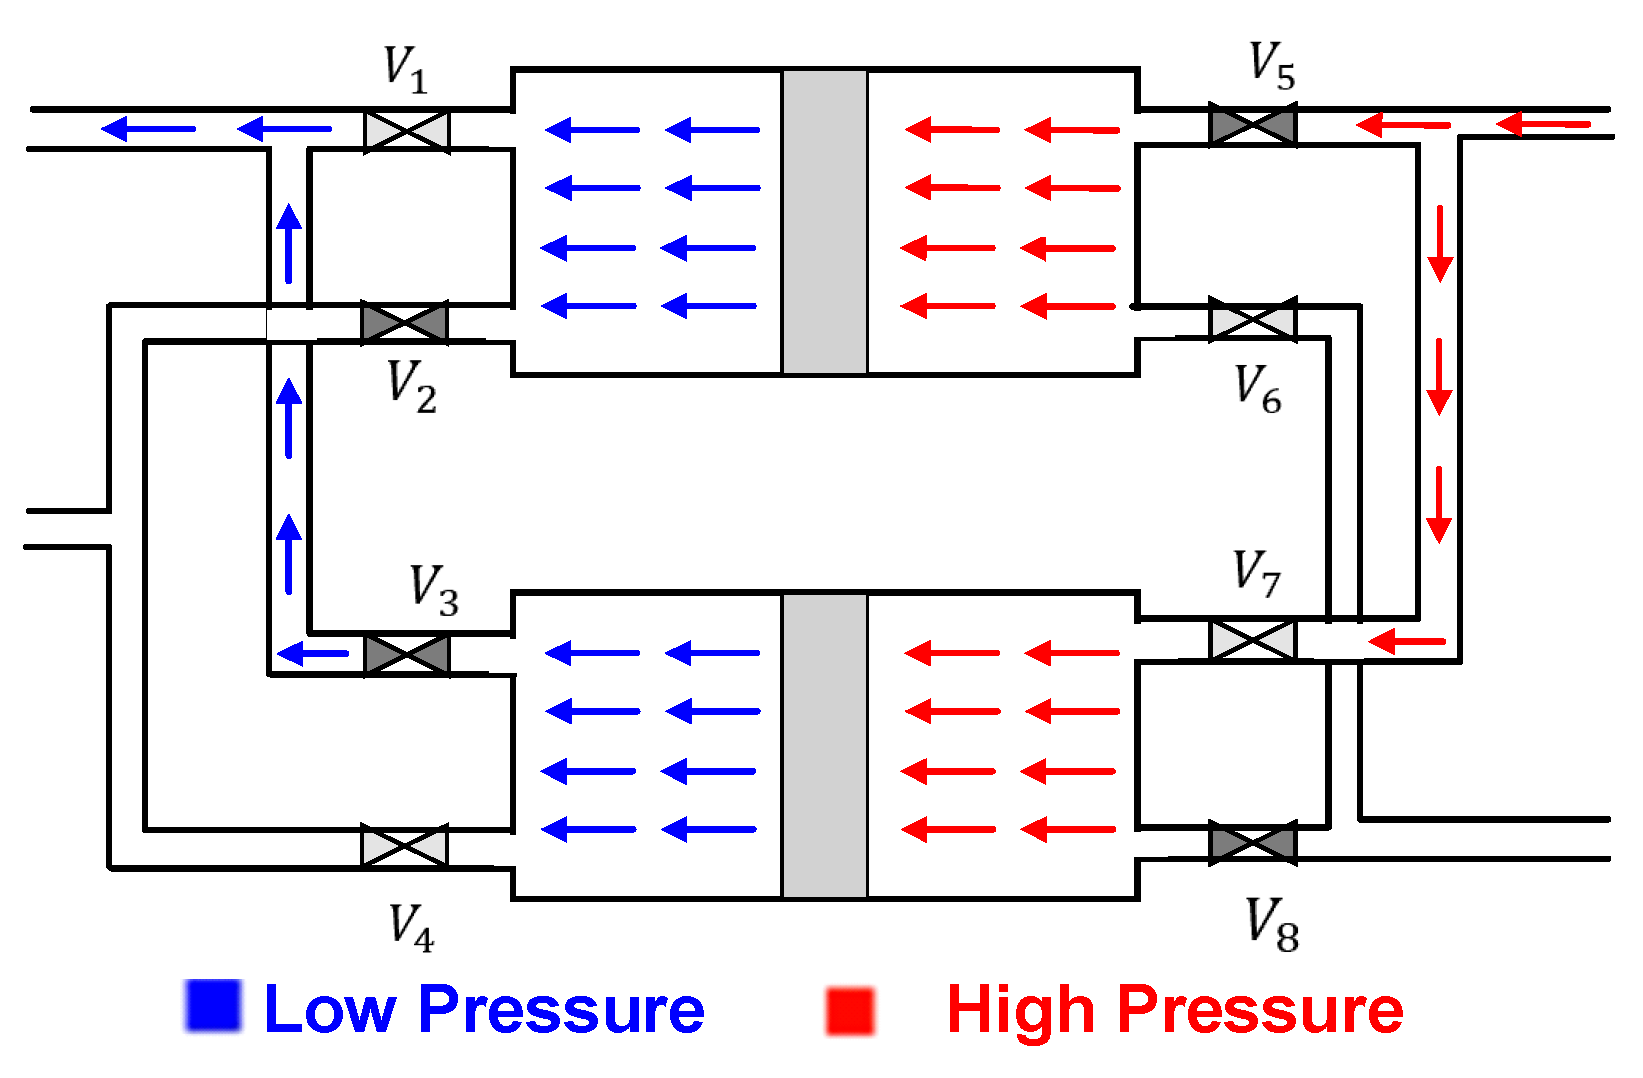
The DWED (Figure 4) was designed by Cheng et al. [17], typically consists of two identical displacement cylinders, each equipped with a piston and four control valves. The piston divides each cylinder into two compartments, allowing high- and low-pressure streams to flow alternately on either side. By periodically opening and closing the valves, the system switches between pressurization and depressurization. This enables the expansion of the high-pressure stream and the compression of the low-pressure stream, ensuring continuous and stable operation. The main operating cycle is described as follows:
Figure 4.
Layout of a DWED.
The operating cycle consists of four main steps.
- (1)
- Depressurization: In the upper cylinder, once the right compartment is filled with a high-pressure stream, valves V1 and V2 remain closed. Valve V5 is closed, and V6 is opened, allowing the stream to discharge and the pressure to decrease gradually.
- (2)
- Low-pressure displacement: As the pressure in the right compartment drops to a certain level, valve V2 opens. Low-pressure stream enters the left compartment, pushing the piston to the right until the compartment is fully filled. Meanwhile, the remaining high-pressure stream continues to exit through valve V6.
- (3)
- Pressurization: In the lower cylinder, valves V3 and V4 are closed. Valve V8 is closed, and V7 is opened, allowing a high-pressure stream to enter the right compartment. This drives the piston to the left, compressing the low-pressure stream in the opposite compartment.
- (4)
- High-pressure displacement: When the low-pressure stream reaches the target pressure, valve V3 opens, allowing the pressurized stream to discharge. At the same time, a high-pressure stream continues to enter through valve V7, completing the cycle and preparing the system for the next iteration.
These four steps define the operation of a two-cylinder engine. By alternating between two cylinders, the system achieves continuous energy exchange. The displacement steps typically dominate the cycle time, while the pressurization and depressurization steps are relatively short, ensuring stable and efficient operation.
3.2. WI Method
Given their higher energy transfer efficiency [24], DWEDs are selected as the key components of the WEN in this study. The proposed WEN consists of DWEDs, pressure-changing units (e.g., pumps, compressors, and turbines), and process streams at different pressure levels, with a device efficiency of 95% [24] assumed throughout. The system includes both high- and low-pressure streams, characterized by their supply and target pressures, flow rates, and a minimum pressure difference (ΔPmin), set to 70 kPa in this work. The mechanical energy released from high-pressure stream expansion and the energy required for low-pressure stream compression are determined through process simulation.
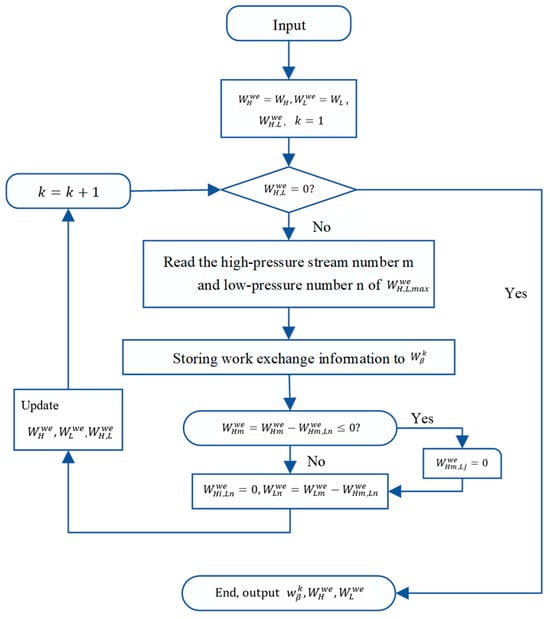
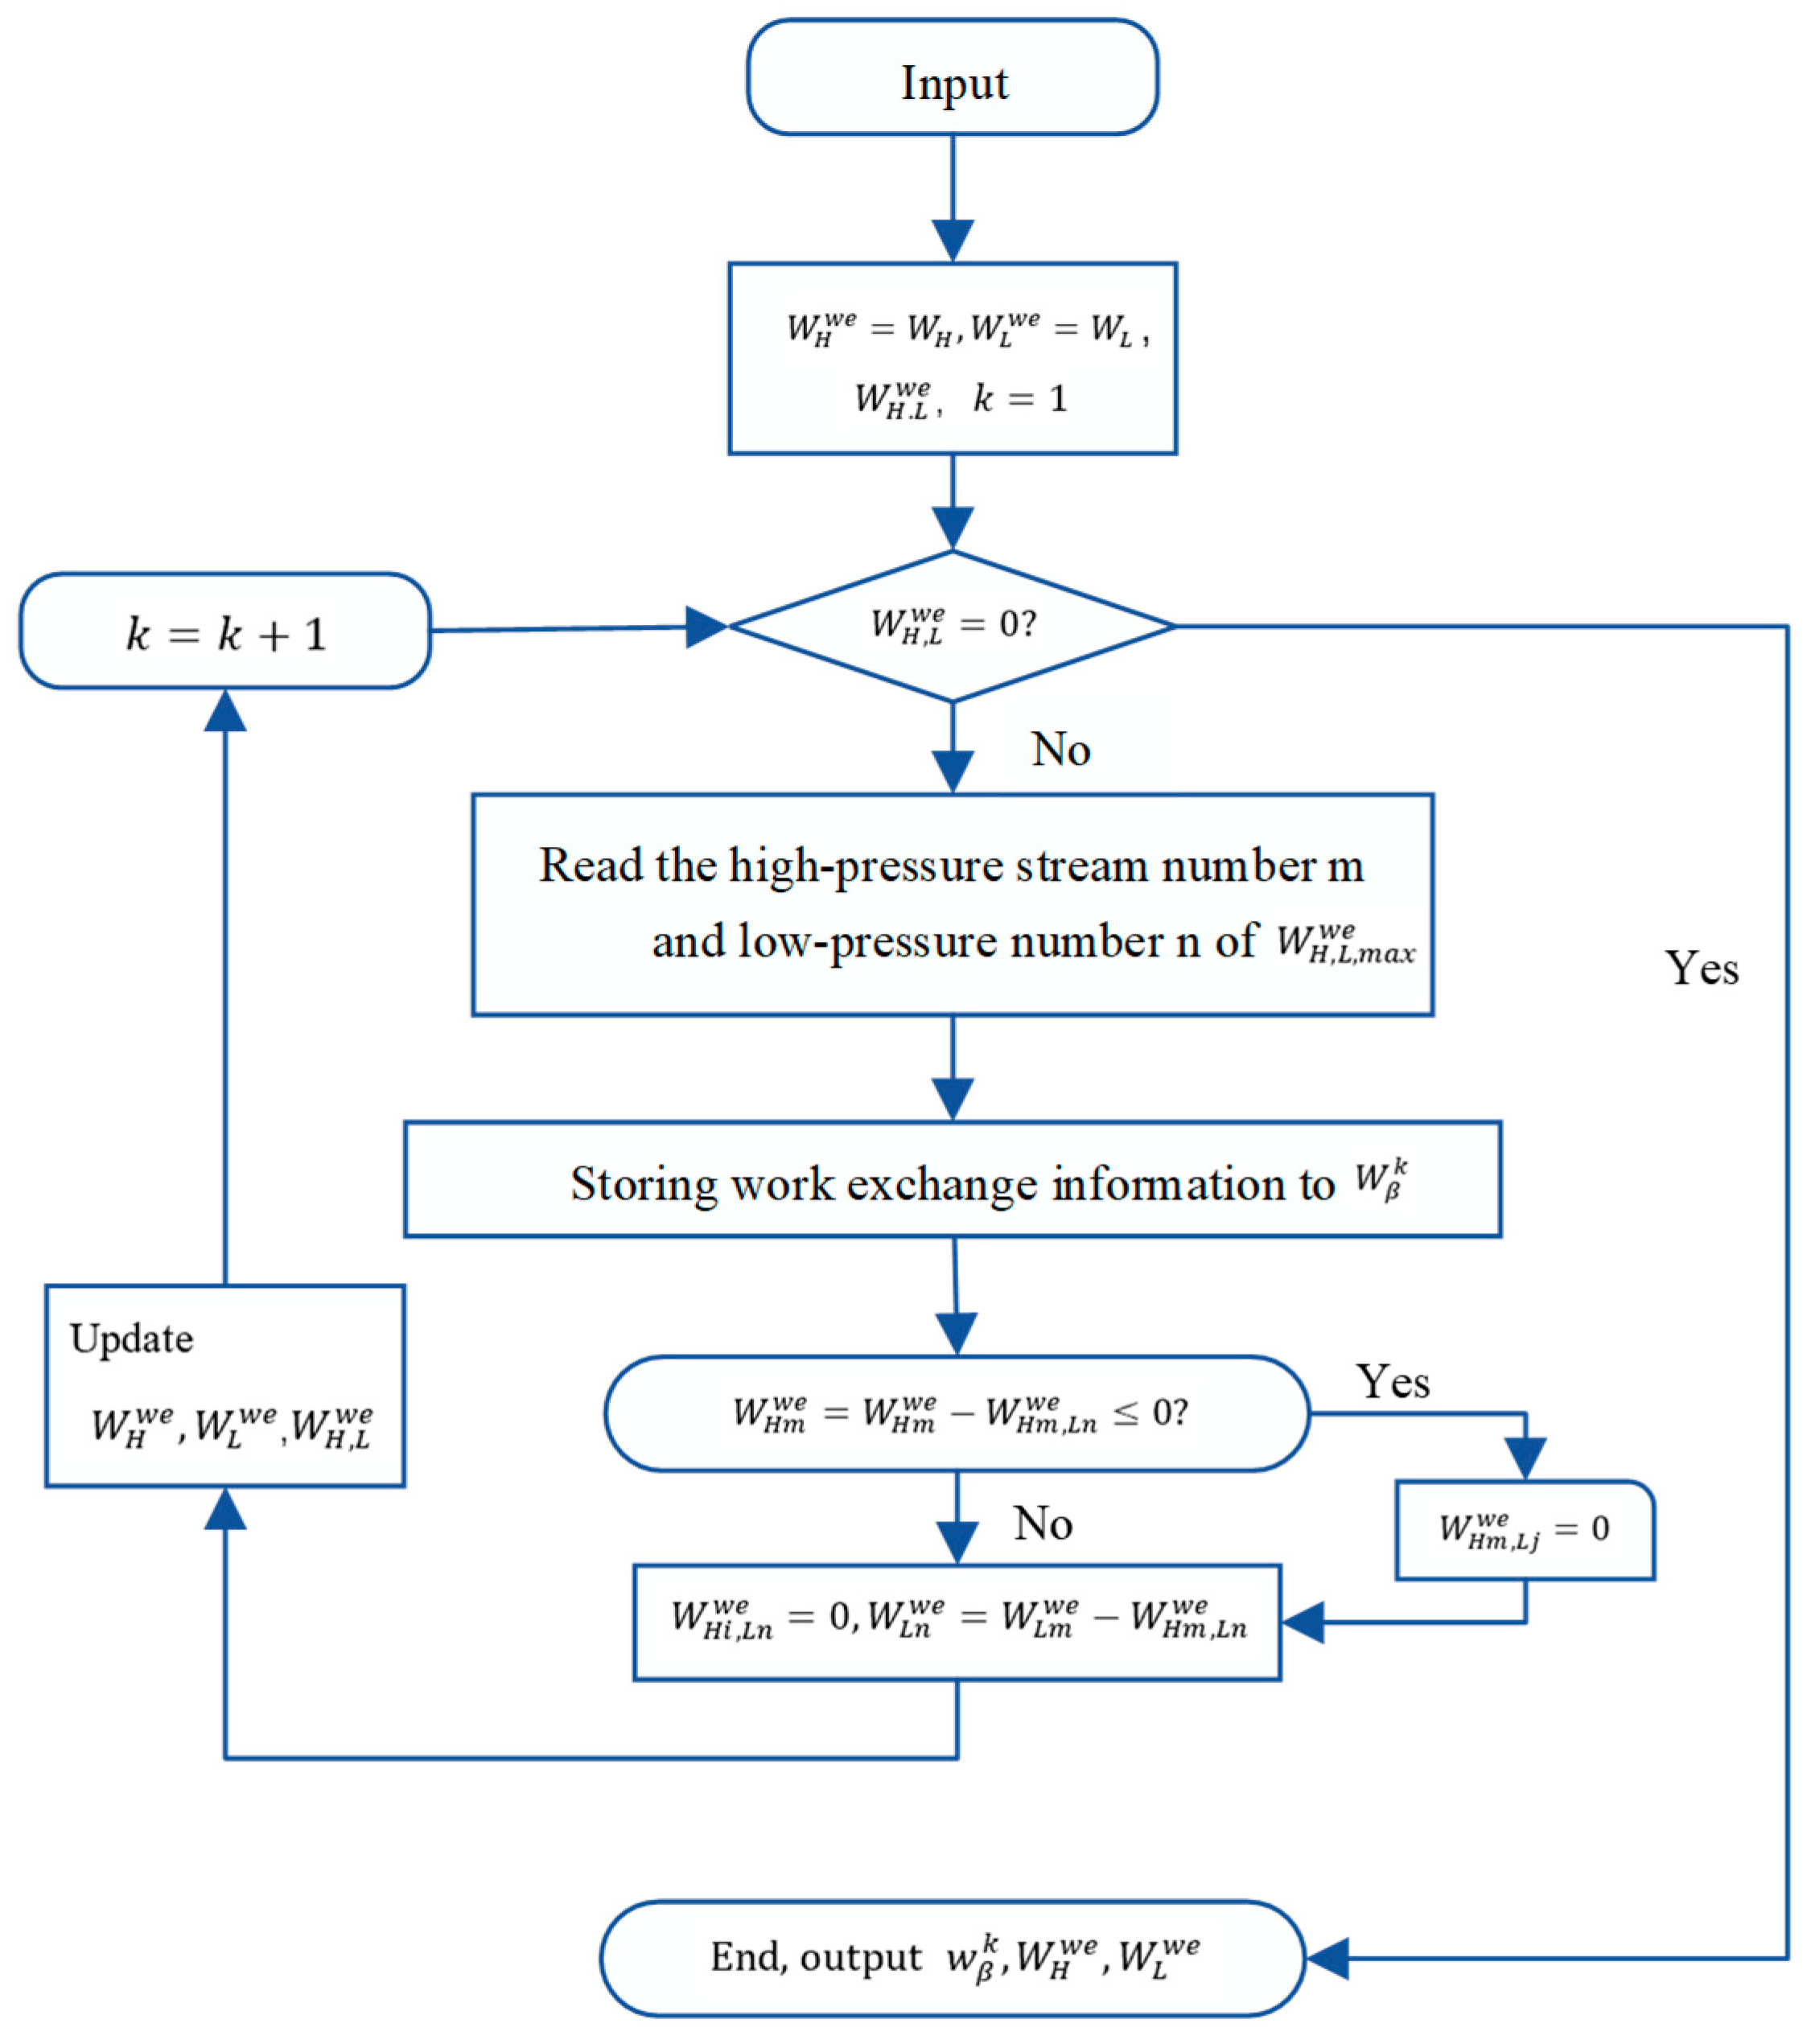
Before performing work exchange, the pressures of all streams are adjusted to satisfy the matching conditions of the network. Specifically, the pressure difference between the supply pressure of low-pressure streams and the target pressure of high-pressure streams, as well as that between the supply pressure of high-pressure streams and the target pressure of low-pressure streams, must both be no less than ΔPmin. Figure 5 illustrates the optimization workflow of the WEN based on DWEDs.
Figure 5.
The optimization workflow of the work exchange network.
The main steps are as follows:
First, read the basic information for the high- and low-pressure streams, and define the high-pressure streams Hi, i = 1, 2, … NH, and low-pressure streams Lj, j = 1, 2, … NL, respectively. Input their supply pressures and and , target pressures and , flow rates VHi and VLj, and minimum pressure difference ΔPmin. Based on this, the work sources WH and work sinks WL for each stream are calculated. Under the constraints of ΔPmin, compute the mechanical energy exchanged between all possible matching pairs to obtain the work matrix .
Second, high-pressure streams (Hi) from the work sources are sequentially matched with low-pressure streams (Lj) from the work sinks for mechanical energy exchange. To simplify the network structure, only one feasible match is allowed between each source–sink pair. Consequently, each low-pressure stream can receive mechanical energy from only one high-pressure stream. Prioritize matching source–sink pairs that correspond to the maximum exchangeable mechanical energy () between the high-pressure stream (m) and the low-pressure stream (n), and store the relevant energy exchange information in a database ().
After each work exchange match, the actual exchanged work is subtracted from the remaining work of the corresponding streams ( and ). The low-pressure stream (n) no longer participates in work exchange with other high-pressure streams; then, . If the work exchanged by the high-pressure stream (m) satisfies , the stream no longer exchanges work with other low-pressure streams, and thus . The updated residual work of the high-pressure stream is then used to determine the values of relevant parameters, such as and .
The work exchange matching table is then updated accordingly. This procedure is repeated until all streams reach the termination criteria, i.e., no further feasible work exchange is possible or all matching requirements have been satisfied. The complete configuration of the WEN is then obtained. A more comprehensive description of the optimization methodology is available in previous work [27].
4. Analyzed Case Studies
4.1. Description of the Urea Synthesis Process
The case study is based on the work of Rossi et al. [26]. It focuses on the downstream decomposition section of the synthesis loop and evaluates how three process configurations and four production levels (1613.41, 2319.48, 2985.62, and 3710.83 t/day) affect overall system performance.
Specifically, three configurations are considered: single-stage, two-stage, and three-stage decomposition. In each case, staged flash separation is used to recover unreacted components and increase urea concentration. The vapor streams generated in different sections are combined and recycled back to the first reactor.
For the single-stage configuration, the purification section includes one turbine (TURB-1), one separator (SPE-20), and one stripper (SPE-4.5). The two-stage configuration adds an additional turbine (TURB-2) and separator (SPE-70). In the three-stage configuration, a third turbine (TURB-3) and an additional separator (SPE-115) are introduced, further enhancing recovery and separation performance.
The urea synthesis process uses two feed streams: NH3 and CO2. The NH3 feed enters at 8 °C and is pressurized to 240 bar using a pump, while the CO2 feed, initially at 40 °C, is compressed to 160 bar. Due to compression, both streams experience temperature increases, with NH3 rising to about 14 °C and CO2 reaching approximately 192 °C.
To ensure suitable conditions for the synthesis reaction, a heat exchanger is used to adjust the temperatures of both streams. The NH3 stream is heated, while the CO2 stream is cooled, bringing their temperatures to 132 °C and 130 °C, respectively. This temperature alignment ensures consistent conditions before entering the reactor.
The mixed streams then enter the first reactor, operating at 180 °C and 160 bar, where the initial reaction takes place (Equation (1)). The resulting ammonium carbamate solution flows to a second reactor under the same conditions, where it is further converted into urea (Equation (2)).
Literature results [26] show that, when both reactors operate at a conversion of 60%, moving from a single-stage to a two-stage configuration raises the urea mass fraction by about 0.9%, while adding a three-stage yields only a further 0.06% increase. This indicates that additional stages provide minimal improvement in urea concentration. The study also evaluates work recovery across different layouts, with the aim of identifying the configuration that maximizes energy recovery and uses it to drive the NH3 feed pump.
Building on these assumptions, this study introduces a work integration strategy into the urea synthesis process. The results are then compared with a conventional HPRT-based approach reported in the literature to evaluate the overall performance of the different technical options. The urea synthesis process was simulated using Aspen Plus V11 software, with thermodynamic properties calculated by the Peng–Robinson equation of state. The WEN superstructure was developed and solved in MATLAB R2021b.
4.2. Operating Parameters
Table 1 summarizes the operating conditions of the separation units for the three process configurations, including temperature and pressure. It should be noted that all values are based on industrial data reported in the literature [29].
Table 1.
The operating parameters of each separation unit under the three process configurations.
Table 2 presents the results from the reference case [26], including the power requirements of the NH3 feed pump and CO2 feed compressor under different decomposition configurations and urea production rates, as well as the corresponding energy consumption when HPRTs are applied. The simulation results of this study are consistent with those reported in [26].
Table 2.
Electric energy consumption under different decomposition sections and different urea product.
4.3. Application of the WI Method
Reference [26] systematically evaluated work recovery from different purification section configurations in the urea process. In that study, the fractional conversion of CO2 in both the first and second reactors was fixed at 60%. The mechanical efficiencies of the pump and the HPRTs were each assumed to be 80%, while the conversion of expansion work to electricity was considered ideal (100%), with the HPRT supplying power to the pump.
Building on these assumptions, this study further considers a 95% [24] energy transfer efficiency for DWEDs and assumes an annual operating time of 8000 h. By introducing a WI strategy and comparing it with the conventional HPRT-based approach, a systematic analysis of mechanical energy recovery in the urea synthesis process is conducted, enabling a comprehensive evaluation of the energy-saving and emission reduction performance of different technical pathways.
4.3.1. Energy Efficiency
The recovered work streams considered in this study are labeled as shown in Table 3. To clearly distinguish operating conditions and stream characteristics, a consistent naming convention is adopted for all potential work exchange streams. For example, L1 denotes a low-pressure stream at a production rate of 1613.41 t/d that passes through the NH3 feed pump and is available for work exchange, while L2 represents the corresponding low-pressure stream at 2319.48 t/d.
Table 3.
Name the work recovery stream.
For high-pressure streams, a structured labeling format is used. Taking “I-T1-H2” as an example, the Roman numerals indicates the first-stage decomposition configuration, the T1 refers to the turbine unit (TURB-1) through which the stream passes, and “H2” identifies it as a high-pressure stream under the 2319.48 t/d condition. Similarly, “III-T3-H2” denotes a high-pressure stream in the third-stage configuration, flowing through TURB-3, under the same production rate.
This study evaluates the work recovery performance of the urea production process under configurations with one, two, and three decomposition stages.
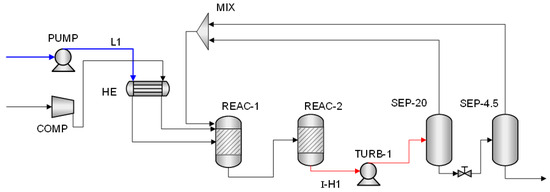
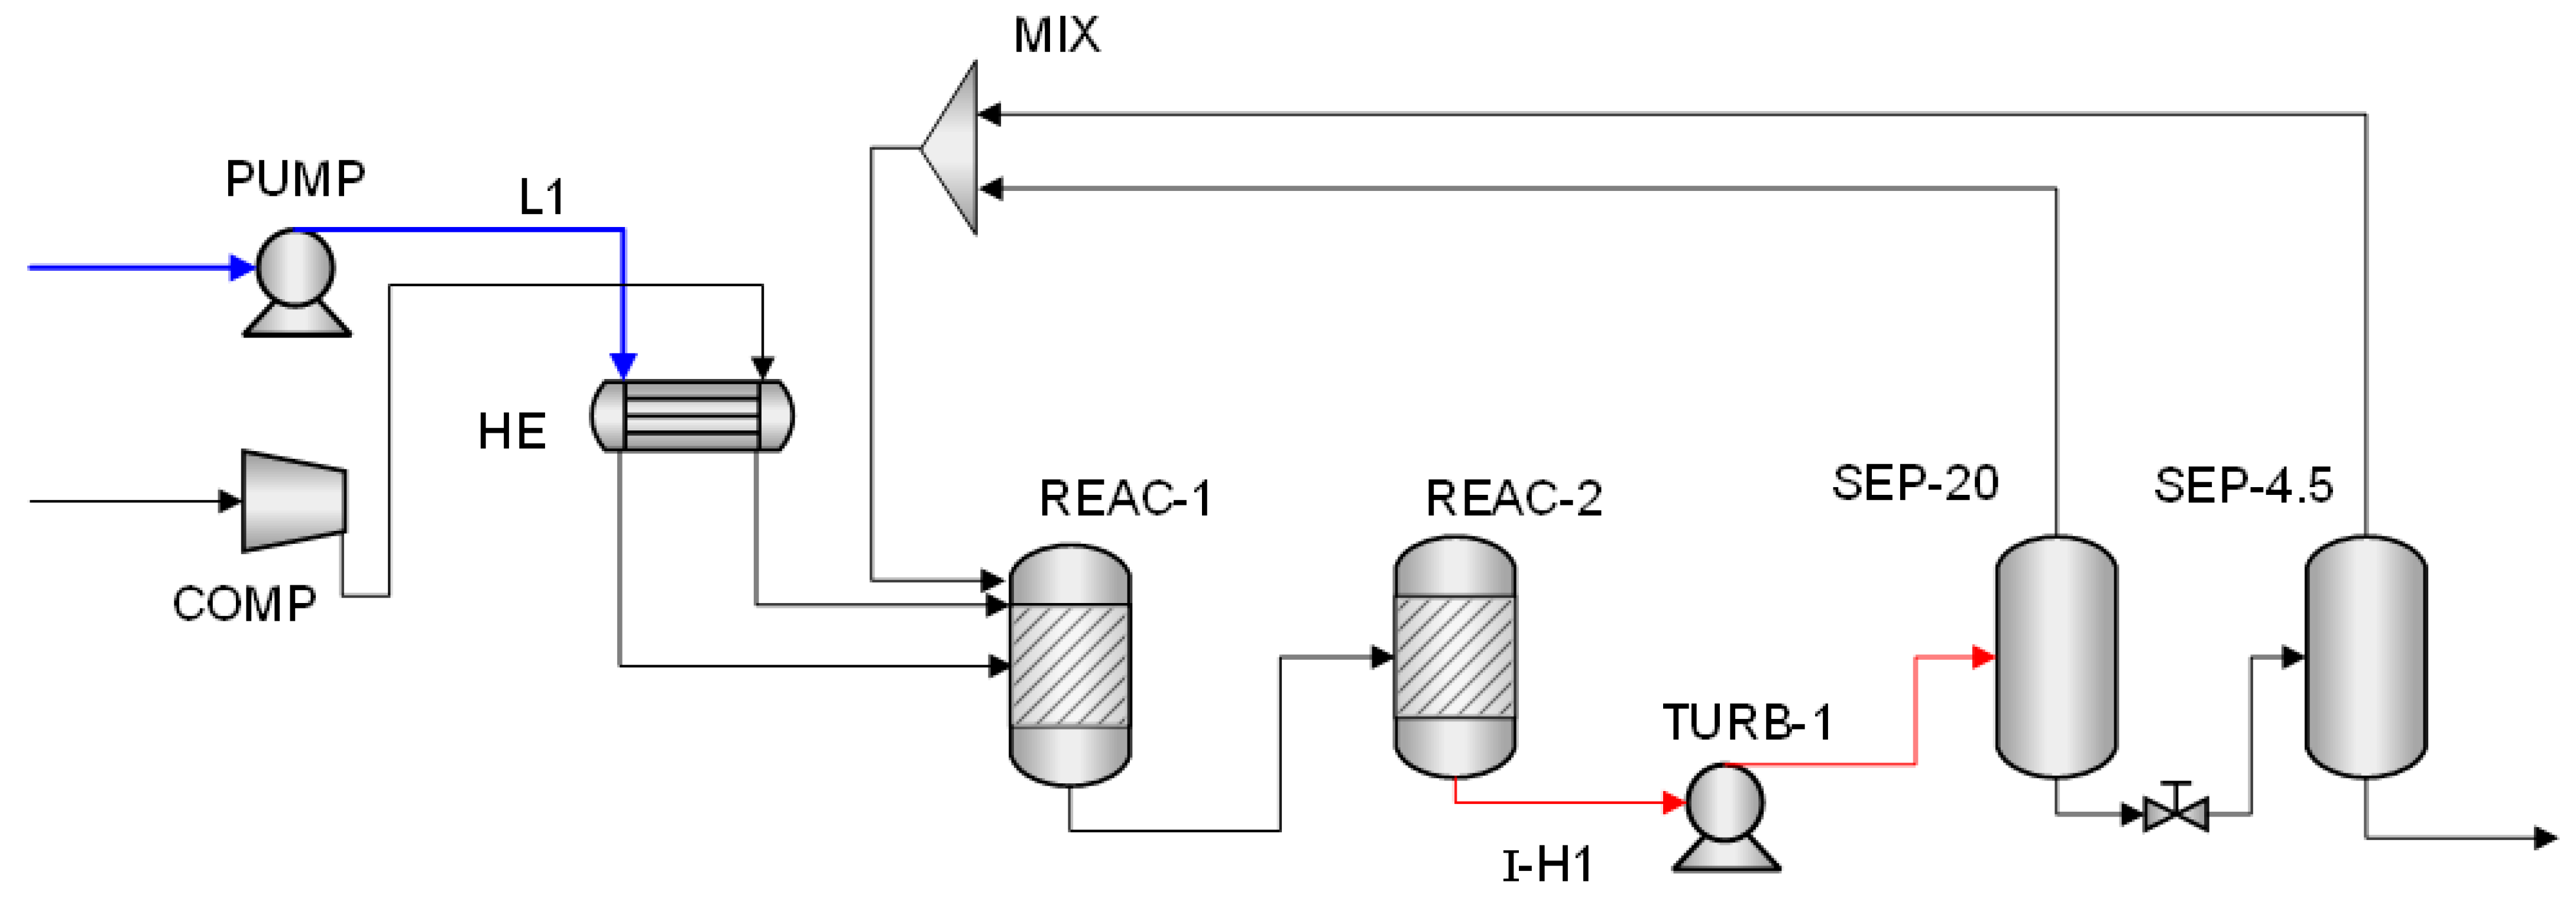
For the single-stage configuration, the initial stream data used for work exchange at different production rates are presented in Table 4. Figure 6 illustrates the process layout at a urea production rate of 1613.41 t/day, where red lines denote high-pressure stream and blue lines indicate low-pressure stream.
Table 4.
The initial flow information of the work exchange in single-stage decomposition.
Figure 6.
At a urea production rate of 1613.41 t/day, the synthesis and purification process operates in a single-stage decomposition configuration.
Under the proposed WI strategy, work exchange is carried out between different stream pairs depending on the production. At a production of 1613.41 t/day, the stream pair L1 and I-T1-H1 is used. For 2319.48 t/day, L2 and I-T1-H2 are matched; for 2985.62 t/day, L3 and I-T1-H3 are used; and for 3710.83 t/day, L4 and I-T1-H4 are paired.
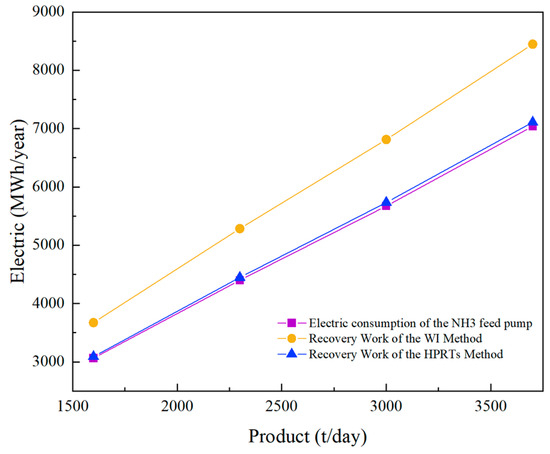
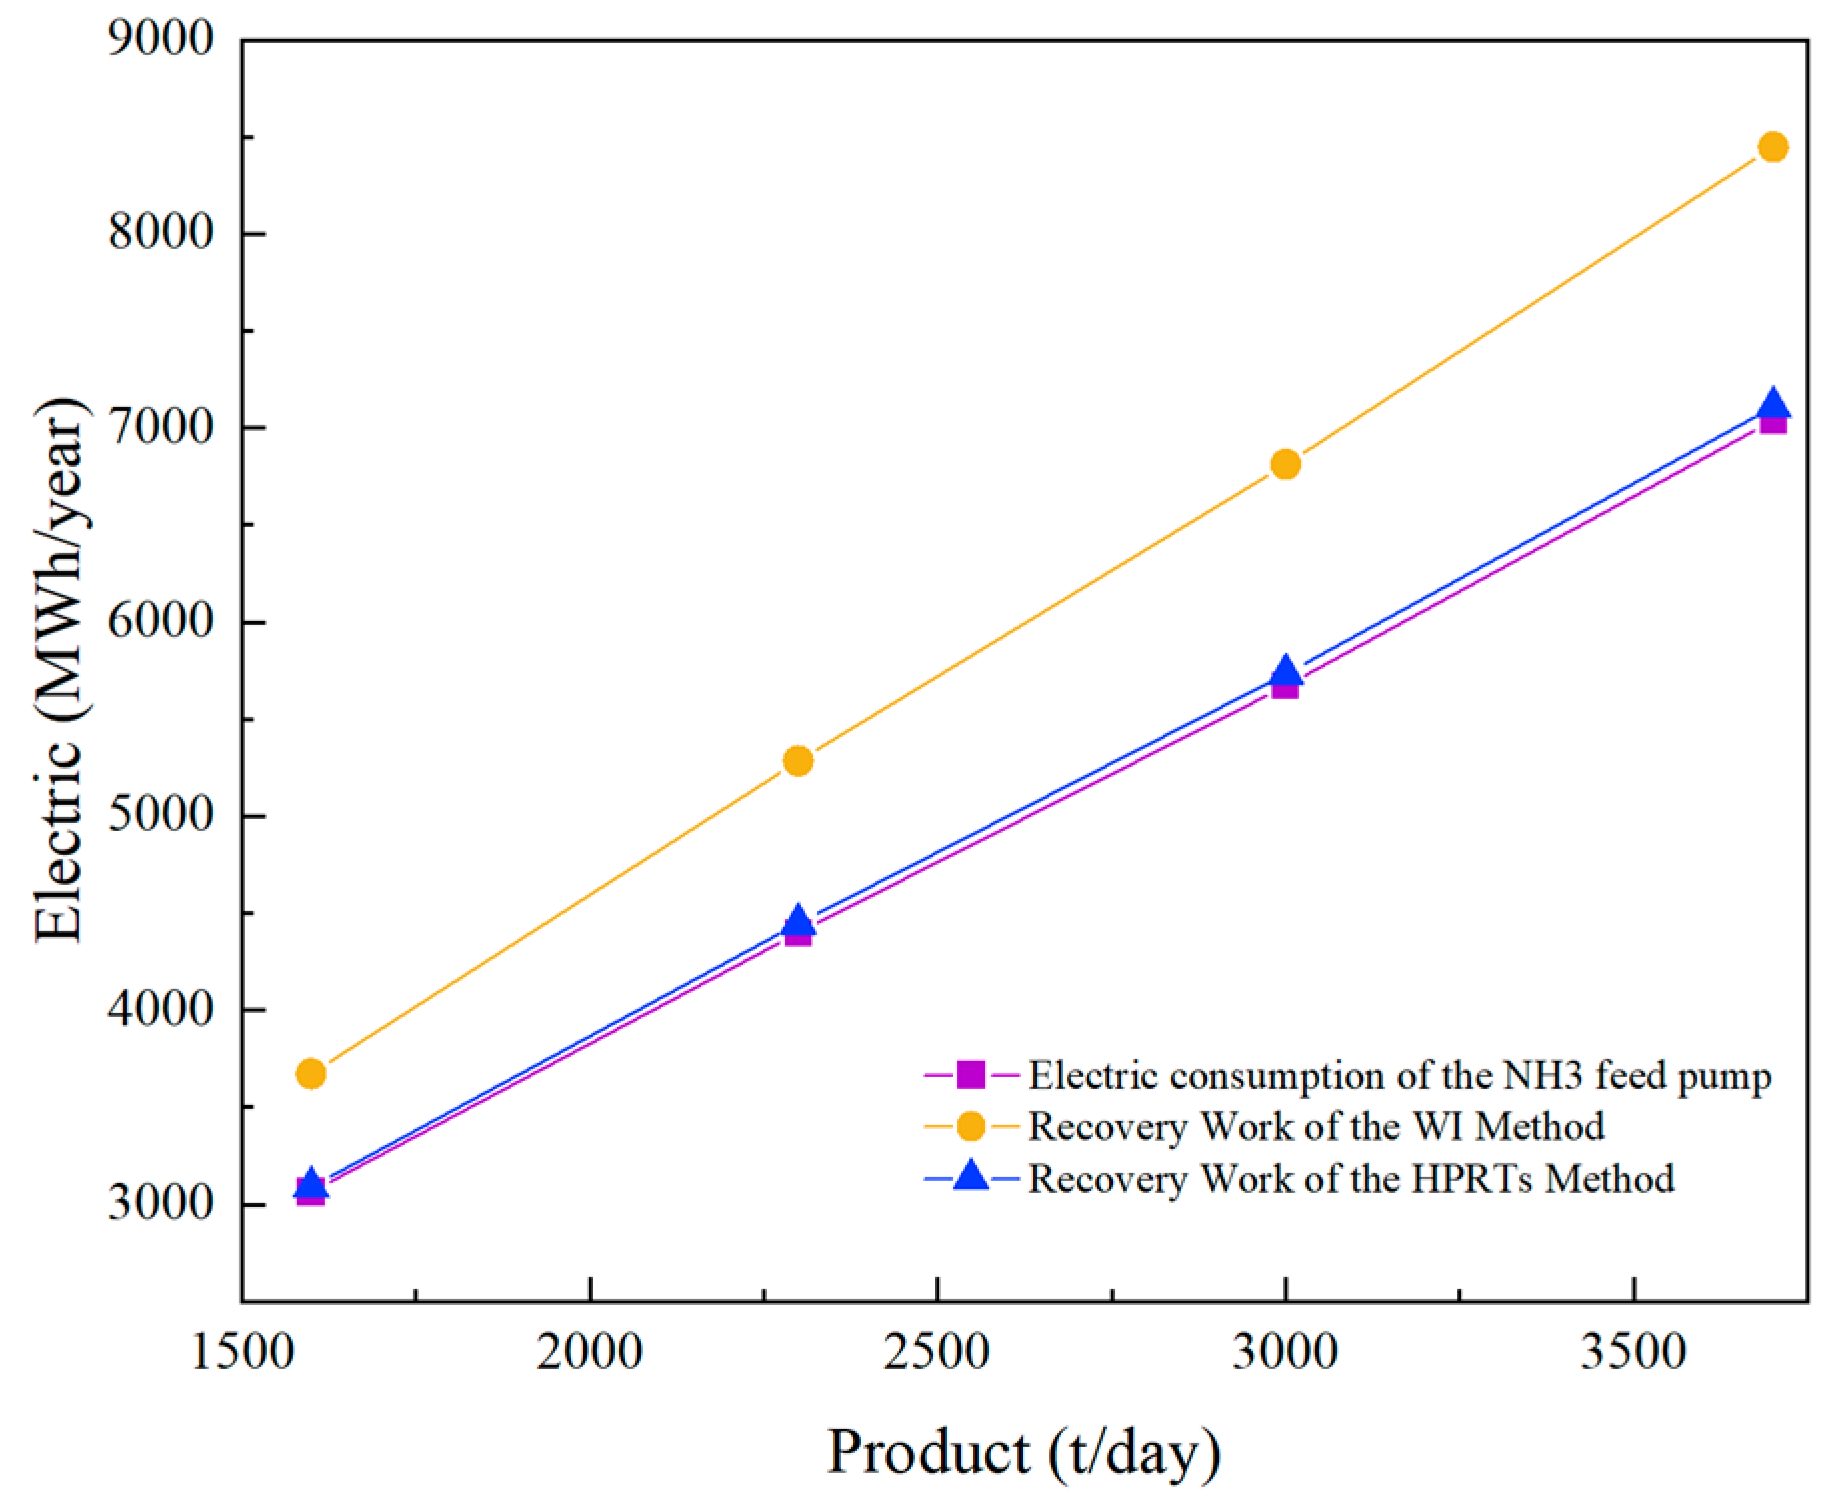
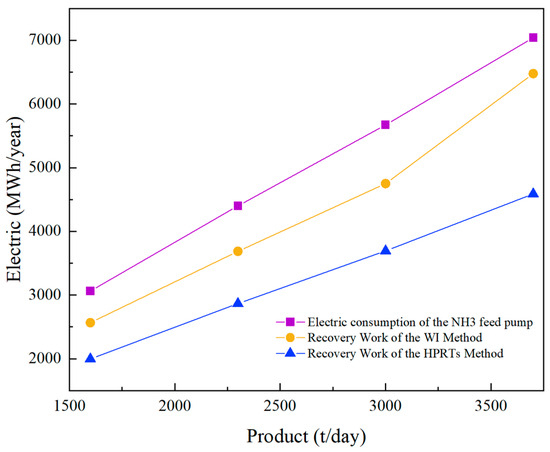
Figure 7 presents a comparison between the proposed WI method and the HPRT-based approach reported in the reference case. The comparison focuses on the annual energy recovery achieved in a single decomposition stage under different production. The figure also includes the energy demand of the NH3 feed pump. This allows a direct assessment of whether the recovered energy can fully meet the pump’s requirements and, in some cases, supply additional energy.
Figure 7.
Energy consumption comparison of different work recovery methods in 1-stage decomposition process.
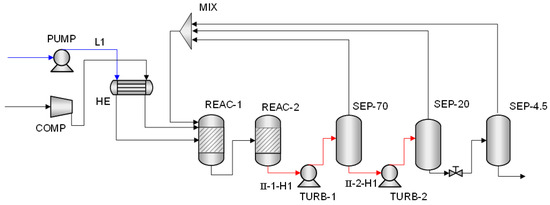
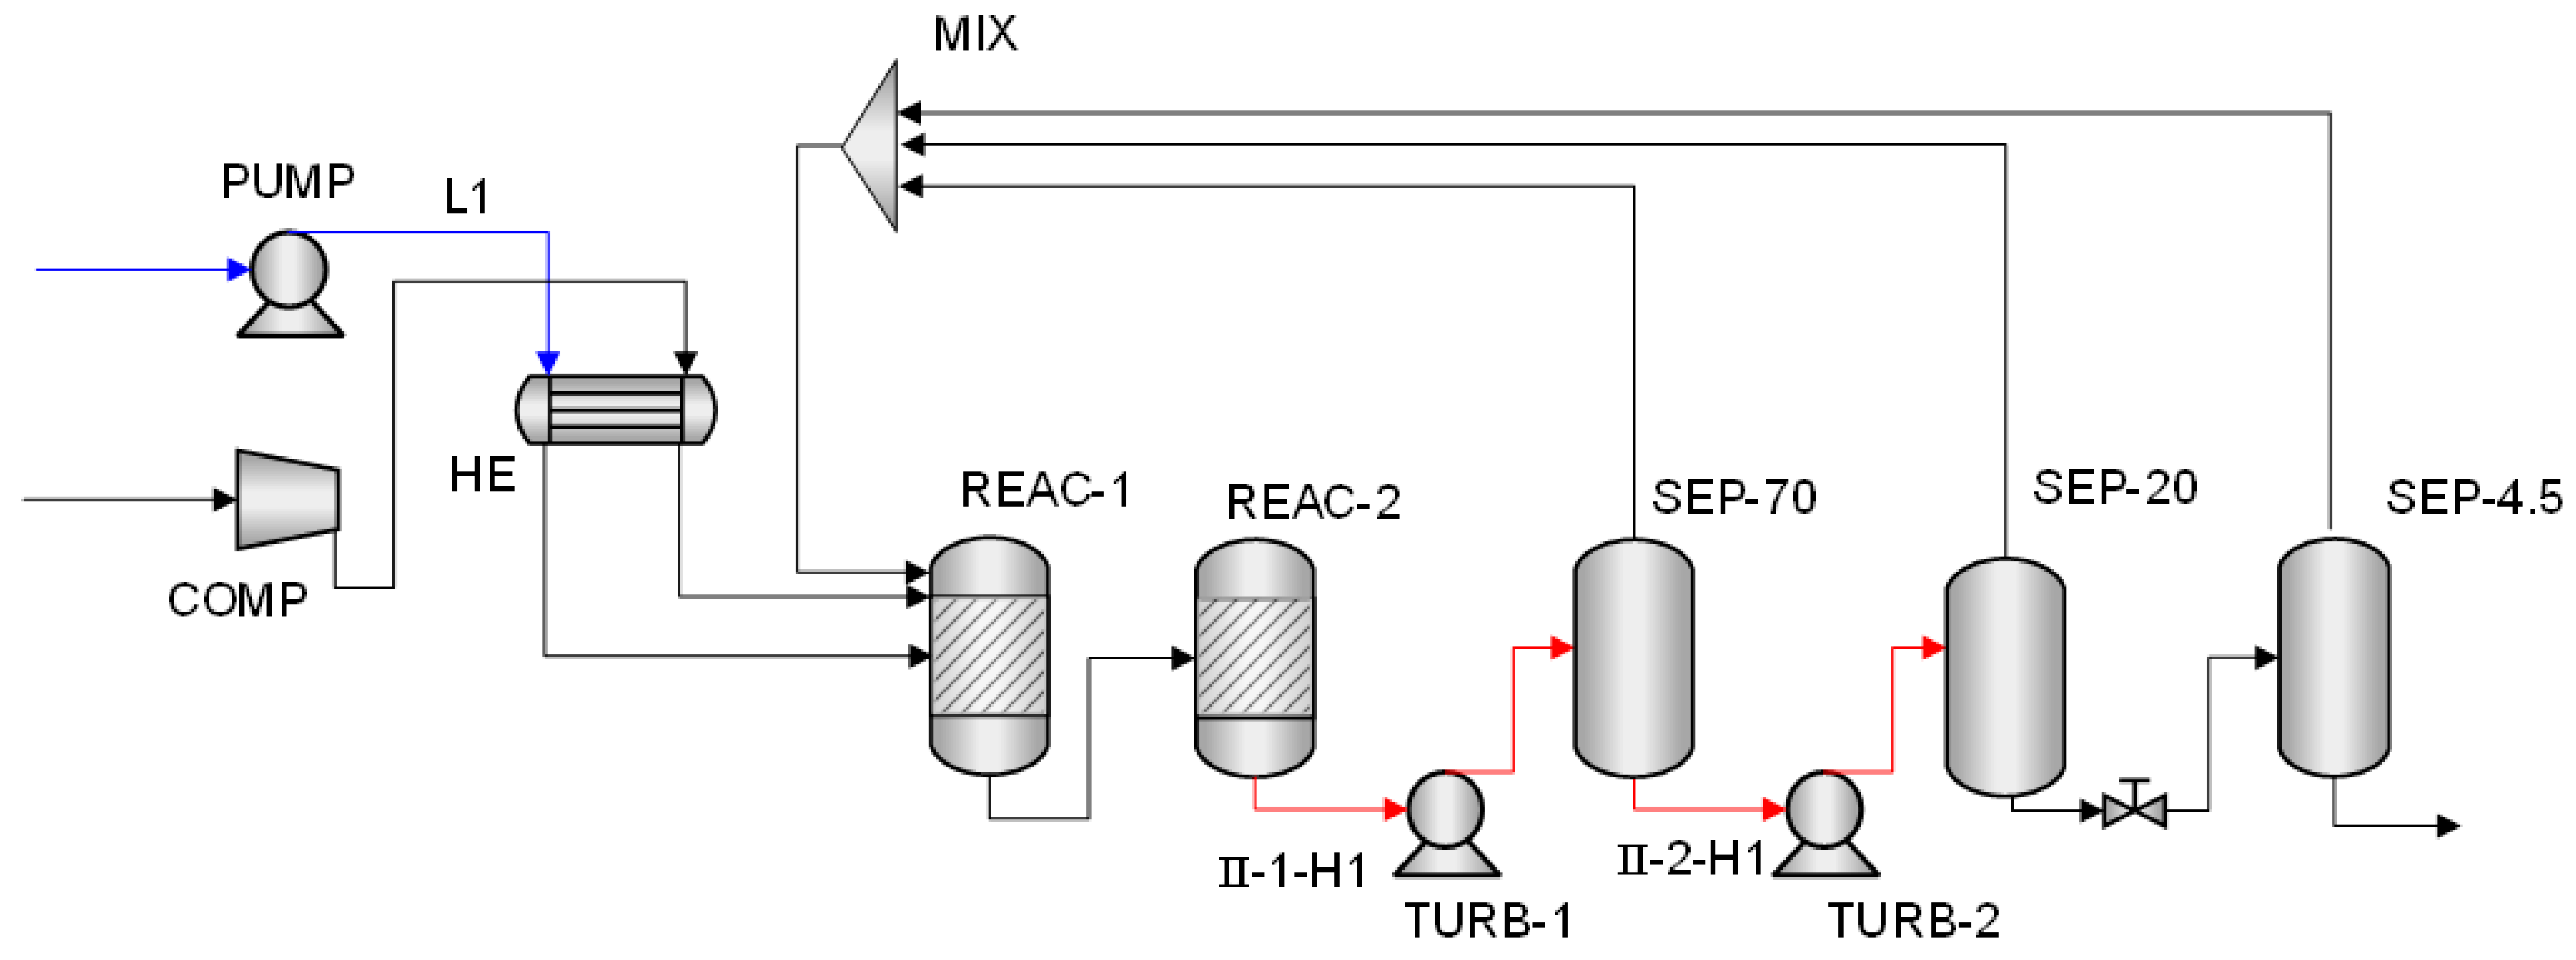
For the two-stage configuration, the initial stream data used for work exchange at different production rates are presented in Table 5. Figure 8 illustrates the process layout at a urea production rate of 1613.41 t/day, where red lines denote high-pressure streams and blue lines indicate low-pressure streams.
Table 5.
The initial flow information of the work exchange in two-stage decomposition.
Figure 8.
At a urea production rate of 1613.41 t/day, the synthesis and purification process operates in a two-stage decomposition configuration.
Under the proposed WI strategy, work exchange is carried out sequentially between the low-pressure and high-pressure streams at different production. At 1613.41 t/day, stream L1 is matched with II-T1-H1 and II-T2-H1. At 2319.48 t/day, L2 exchanges work with II-T1-H2 and II-T2-H2. Similarly, for 2985.62 t/day and 3710.83 t/day, L3 and L4 are paired with the corresponding high-pressure streams (II-T1-H3, II-T2-H3 and II-T1-H4, II-T2-H4), respectively. Figure 9 compares the performance of the proposed WI method with the HPRT-based approach from the reference case.
Figure 9.
Energy consumption comparison of different work recovery methods in two-stage decomposition process.
For the three-stage configuration, the initial stream data used for work exchange at different production rates are presented in Table 6. Figure 10 illustrates the process layout at a urea production rate of 1613.41 t/day, where red lines denote high-pressure streams and blue lines indicate low-pressure streams.
Table 6.
The initial flow information of the work exchange in three-stage decomposition.
Figure 10.
At a urea production rate of 1613.41 t/day, the synthesis and purification process operates in a three-stage decomposition configuration.
Under the proposed WI strategy, each low-pressure stream is sequentially matched with three high-pressure streams according to production. At 1613.41 t/day, L1 exchanges work with III-T3-H1, III-T1-H1, and III-T2-H1. At 2319.48 t/day, L2 is paired with III-T3-H2, III-T1-H2, and III-T2-H2. Likewise, for 2985.62 t/day and 3710.83 t/day, L3 and L4 are matched with the corresponding high-pressure streams (III-T3-H3, III-T1-H3, III-T2-H3 and III-T3-H4, III-T1-H4, III-T2-H4), respectively. Figure 11 presents a comparison between the proposed WI method and the HPRT-based approach from the reference case.
Figure 11.
Energy consumption comparison of different work recovery methods in three-stage decomposition process.
This study evaluates the effect of multi-stage decomposition and work recovery across different sections of the urea process, with the aim of reducing overall power consumption.
As shown in Table 4, Table 5 and Table 6, the volume flow rates of the streams involved in work exchange vary with the number of decomposition stages in the process configuration. The introduction of TURB-2 reduces the throughput of TURB-1, while adding TURB-3 increases the load on TURB-2 and further decreases that of TURB-1. However, increasing the number of separation stages has only a limited impact on improving urea product purity.
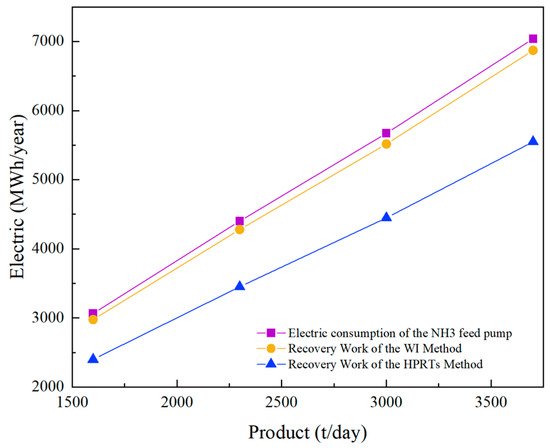
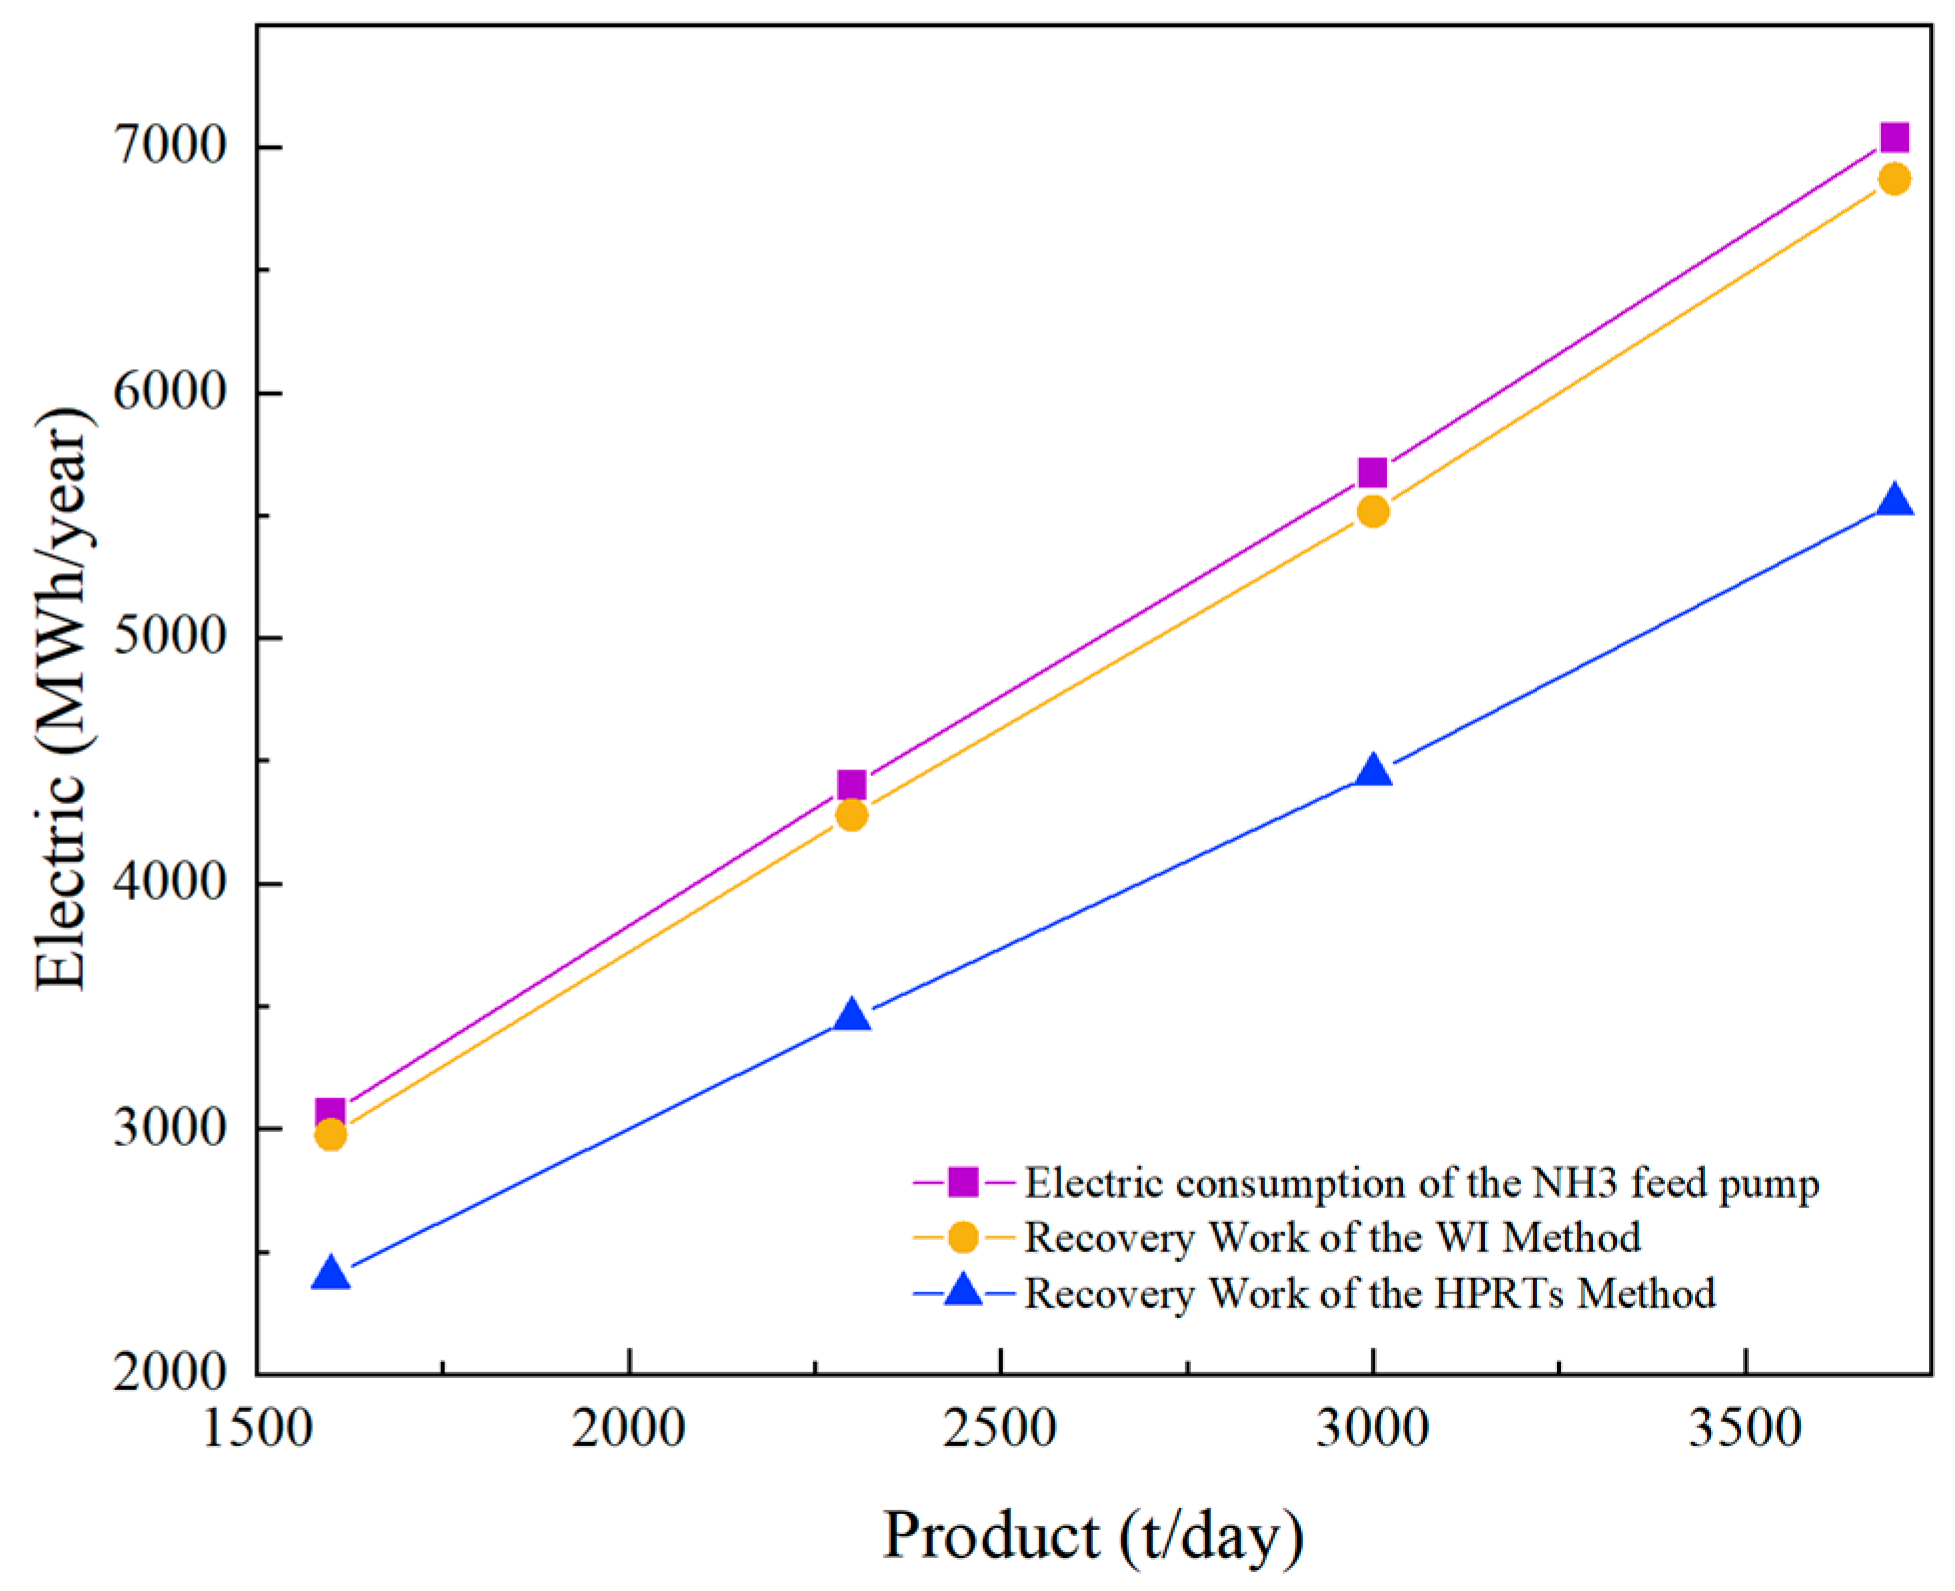
Figure 7, Figure 9 and Figure 11 show that a single-stage decomposition configuration is sufficient to achieve the highest level of mechanical energy recovery among the cases studied. The maximum recovered energy obtained using both methods, together with the largest improvement achieved by the WI strategy relative to the HPRT-based approach, is summarized in Table 7.
Table 7.
The WI and HPRT-based methods achieve maximum mechanical energy recovery, and the corresponding maximum improvement in energy recovery is obtained by the WI method relative to the HPRT approach.
At a urea production rate of 3710.83 t/day under the single-stage decomposition configuration, the HPRT-based approach recovers approximately 7110 MWh/year of mechanical energy, whereas the proposed WI method increases the recovered energy to about 8448 MWh/year under the same operating conditions. This corresponds to an improvement of approximately 18.8% compared with the reference case [26].
The greatest enhancement achieved by the WI method is observed at a production rate of 3710.83 t/day under the three-stage decomposition configuration, where the recovered mechanical energy is improved by approximately 41.1% relative to the HPRT-based system [26].
A one-at-a-time sensitivity analysis was performed for the base case (3710.83 t/day, single-stage decomposition configuration) by varying DWED efficiency, HPRT efficiency, and annual operating time by ±5% while keeping all other parameters constant. The results show that recovered work is most sensitive to DWED efficiency. According to the following equation:
is the baseline value; and represent the results obtained when the parameter is increased and decreased by 5%, respectively; is the sensitivity coefficient.
A ±5% change in DWED efficiency alters the recovered energy from 8025.6 to 8870.4 MWh/year, corresponding to a sensitivity coefficient of 1.0, indicating a direct proportional relationship between DWED efficiency and energy recovery. In contrast, HPRT efficiency has a negligible effect on the WI system. Annual operating time does not affect instantaneous power recovery but directly impacts annual recovered energy.
Overall, the configuration with a single work recovery unit delivers the best performance. This is because it can fully meet the power demand of the NH3 feed pump while also generating additional usable energy.
4.3.2. Environmental Analysis
In urea synthesis, CO2 emissions serve as a key indicator for evaluating both energy efficiency and environmental performance. To assess the environmental impact of the process, this study quantifies total CO2 emissions by distinguishing between direct and indirect contributions. Following ref. [30], direct emissions are determined from material balances, while indirect emissions are estimated based on process energy consumption. As different work recovery strategies are applied to reduce energy use, the corresponding CO2 mitigation is calculated from the associated energy savings.
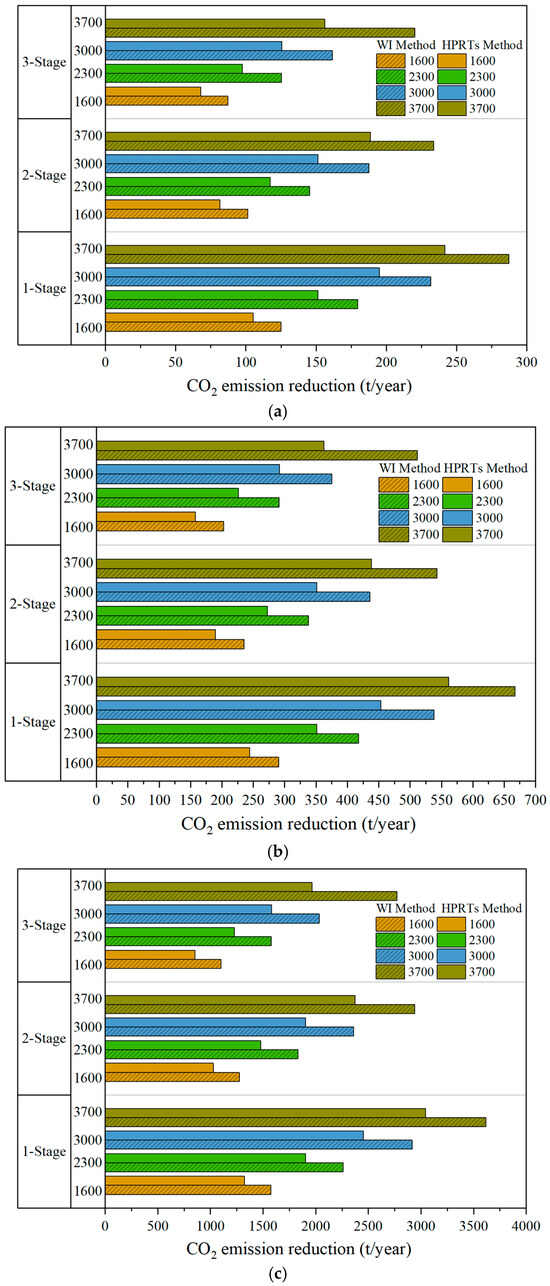
Since electricity represents the primary energy input in the proposed process, three representative power sources are considered for comparison: wind power (0.034 t CO2/MWh), solar power (0.079 t CO2/MWh), and grid electricity (0.428 t CO2/MWh) [31]. The CO2 emission reduction results for all cases are presented in Figure 12.
Figure 12.
The reduction in CO2 emissions from power sources such as wind (a), solar (b), and grid (c) in urea synthesis process.
Under wind power supply conditions (Figure 12a), the HPRT method shows an increasing reduction trend with rising urea production from 1600 to 3700 t/d. For the single-stage decomposition system, CO2 reduction increases from 105.094 to 241.740 t/year; for the two-stage system, from 81.600 to 188.666 t/year; and for the three-stage system, from 67.898 to 156.062 t/year. In comparison, the WI method consistently achieves higher reduction levels across all operating conditions, reaching 124.916–287.232 t/year, 101.184–233.648 t/year, and 87.278–220.218 t/year for the three configurations, respectively. Overall, the WI strategy improves CO2 reduction performance by approximately 18.8% under wind power supply.
Under solar power conditions (Figure 12b), both methods exhibit a similar upward trend with increasing production. Using the HPRT approach, CO2 reduction rises from 244.189 to 561.690 t/year for the single-stage system, from 189.600 to 438.371 t/year for the two-stage system, and from 157.763 to 362.531 t/year for the three-stage system. After applying the WI method, further improvements are observed, with values of 290.246–667.392 t/year, 235.104–542.888 t/year, and 202.793–511.683 t/year, respectively. Overall, WI leads to an approximate 24% increase in CO2 reduction under solar power supply.
Under grid electricity conditions (Figure 12c), both methods achieve the highest CO2 reduction levels, but the differences become more pronounced. With HPRTs, reductions increase from 1322.948 to 3043.080 t/year (single-stage), 1027.200 to 2374.972 t/year (two-stage), and 854.716 to 1964.092 t/year (three-stage). In contrast, the WI method further enhances performance, reaching 1572.472–3615.744 t/year, 1273.728–2941.216 t/year, and 1098.676–2772.156 t/year, respectively. Overall, WI achieves an improvement of about 28.5% in CO2 reduction under grid electricity conditions.
A comparative analysis of Figure 12a–c is summarized in Table 8, which presents the maximum CO2 emission reductions achieved by the WI and HPRT-based methods, together with the largest improvement obtained by the WI strategy relative to the HPRT approach.
Table 8.
Maximum CO2 emission reductions achieved by the WI and HPRT-based methods, and the corresponding maximum improvement in CO2 emission reduction obtained by comparing the two methods.
The results indicate that the highest CO2 reduction is achieved under the single-stage decomposition configuration at a urea production rate of 3710.83 t/day with grid electricity as the power source. Under these conditions, the WI method achieves a CO2 reduction of 3615.744 t/year, compared with 3043.08 t/year for the HPRT-based system. Overall, the WI approach improves CO2 reduction performance by 18.8% relative to the HPRT method. The greatest relative improvement of the WI strategy is observed under the three-stage decomposition configuration at a production rate of 3710.83 t/day using wind, solar, or grid electricity. In this case, the WI approach improves CO2 reduction performance by approximately 41.1% compared with the HPRT method.
Through the above analysis, energy sources differ markedly in their carbon intensity. Wind power shows the lowest carbon footprint (0.034 t CO2/MWh), indicating the strongest potential for emission reduction, while photovoltaic power, although slightly higher, still maintains a relatively low level (0.079 t CO2/MWh). In contrast, grid electricity is significantly more carbon-intensive, reaching 0.428 t CO2/MWh. However, both wind and solar energy are inherently intermittent due to seasonal and geographic variability, suggesting that combining multiple energy sources can help achieve more stable operation and further reduce overall emissions.
Within urea production, the potential for emission reduction increases with production capacity, with the first-stage decomposition section contributing the most significant CO2 reduction. A comparison of different technical routes shows that the WI approach consistently outperforms the HPRTs across single-, double-, and triple-stage configurations, with the greatest improvement observed in the three-stage process. Overall, WI demonstrates strong potential to enhance energy efficiency while reducing carbon emissions in urea production systems.
5. Conclusions
This study investigates work recovery in the urea synthesis process by developing a superstructure-based WEN using DWEDs. Mechanical energy recovery is evaluated for single-, two-, and three-stage configurations under different production capacities. The proposed WI approach is further compared with a conventional HPRT-based method reported in the literature.
The results indicate that the WI method consistently outperforms the HPRT-based approach in both mechanical energy recovery and CO2 emission reduction across all operating conditions. For energy recovery, the single-stage decomposition configuration provides the best performance, where at 3710.83 t/day the recovered energy increases from 7110 to 8448 MWh/year, corresponding to an 18.8% improvement; the largest relative gain (41.1%) is observed under the three-stage configuration at the same production rate. For CO2 emissions, the highest absolute reduction also occurs in the single-stage configuration at 3710.83 t/day with grid electricity, where WI achieves 3615.744 t/year compared with 3043.08 t/year for HPRT. Wind power shows the lowest carbon intensity, followed by solar energy, while grid electricity is the most carbon-intensive, although renewable sources are constrained by intermittency, suggesting potential benefits from hybrid supply systems. Overall, higher production capacity enhances both energy recovery and emission reduction potential, and the WI strategy demonstrates robust advantages over HPRT, with strong promise for improving energy efficiency and reducing carbon emissions in urea production.
Building on the WI framework developed in this study, future research will focus on incorporating heat integration to achieve simultaneous work–heat integration and further improve overall process energy efficiency. Additional efforts are also required to optimize the design of direct work exchange devices, integrate advanced control systems, and determine appropriate equipment sizing to enhance energy recovery performance and operational reliability. Furthermore, the work exchange network methodology has considerable potential for broader application in energy-intensive industries, such as petroleum refining, petrochemical production, and air separation processes.
Author Contributions
Conceptualization, Y.L.; methodology, Y.L.; software, Y.L. and M.R.; validation, Y.L., C.C. and M.F.; formal analysis, Y.L.; data curation, Y.L.; writing—original draft preparation, Y.L.; writing—review and editing, Y.L., J.S., C.C. and M.F.; supervision, J.S., C.C. and M.F. All authors have read and agreed to the published version of the manuscript.
Funding
This work was supported by the European Union HORIZON-MSCA-2024-PF-01 (No. 101211557). Yang Lan thanks the China Scholarship Council (CSC) and the University of Twente for support.
Data Availability Statement
The original contributions presented in this study are included in the article.
Conflicts of Interest
The authors declare no conflicts of interest.
Nomenclature
| Notation | |
| DWEDs | Direct work exchange devices |
| HPRTs | Hydraulic power recovery turbines |
| SSTC | Single-shaft turbine–compressor |
| ULE | Ultra-low energy |
| WEN | Work exchange network |
| WI | Work integration |
| The work required for compressing the low-pressure streams | |
| Matrix of mechanical energy that can be transferred from high-pressure streams to low-pressure streams | |
| The maximum mechanical energy that can be transferred from individual high-pressure stream to low-pressure streams | |
| Vector of mechanical energy that can be transferred from individual high-pressure stream to low-pressure streams | |
| The work produced by expanding the high-pressure streams | |
| WEN | Work exchange network |
| Subscripts/superscripts | |
| H | High-pressure stream |
| i | Index for high-pressure stream |
| j | Index for low-pressure stream |
| k | The sequence of work exchanges in vector |
| L | Low-pressure stream |
| m | The high-pressure stream serial number in vector |
| n | The low-pressure stream serial number in vector |
| The number of high-pressure streams | |
| The number of low-pressure streams | |
| s | Supply for pressure |
| t | Target for pressure |
References
- Urea Market Size, Share Industry & Analysis, by Grade (Fertilizer Grade, Feed Grade, and Technical Grade), by Application (Agriculture, Animal Feed, Chemical Synthesis, and Others), and Regional Forecast, 2026–2034. Available online: https://www.fortunebusinessinsights.com/urea-market-106850 (accessed on 10 May 2026).
- Meessen, J. Urea synthesis. Chem. Ing. Tech. 2014, 86, 2180–2189. [Google Scholar] [CrossRef] [Scilit]
- Zhu, X.; Zhou, X.; Jing, Y.; Li, Y. Electrochemical synthesis of urea on MBenes. Nat. Commun. 2021, 12, 4080. [Google Scholar] [CrossRef] [Scilit] [PubMed]
- An, H.; Yang, W.M.; Li, J.; Zhou, D.Z. Modeling analysis of urea direct injection on the NOx emission reduction of biodiesel fueled diesel engines. Energy Convers. Manag. 2015, 101, 442–449. [Google Scholar] [CrossRef] [Scilit]
- Krupa, I.; Nógellová, Z.; Špitalský, Z.; Janigová, I.; Boh, B.; Sumiga, B.; Kleinová, A.; Karkri, M.; AlMaadeed, M.A. Phase change materials based on high-density polyethylene filled with microencapsulated paraffin wax. Energy Convers. Manag. 2014, 87, 400–409. [Google Scholar] [CrossRef] [Scilit]
- Wang, H.; Zhai, Z.-W.; Shi, Y.-X.; Tan, C.-X.; Weng, J.-Q.; Han, L.; Li, B.-J.; Liu, X.-H. Novel trifluoromethylpyrazole acyl urea derivatives: Synthesis, crystal structure, fungicidal activity and docking study. J. Mol. Struct. 2018, 1171, 631–638. [Google Scholar] [CrossRef] [Scilit]
- Meng, W.; Wang, D.; Zhou, H.; Yang, Y.; Li, H.; Liao, Z.; Yang, S.; Hong, X.; Li, G. Carbon dioxide from oxy-fuel coal-fired power plant integrated green ammonia for urea synthesis: Process modeling, system analysis, and techno-economic evaluation. Energy 2023, 278, 127537. [Google Scholar] [CrossRef] [Scilit]
- Devkota, S.; Karmacharya, P.; Maharjan, S.; Khatiwada, D.; Uprety, B. Decarbonizing urea: Techno-economic and environmental analysis of a model hydroelectricity and carbon capture based green urea production. Appl. Energy 2024, 372, 123789. Available online: https://www.sciencedirect.com/science/article/pii/S0306261924011723 (accessed on 28 June 2024). [CrossRef] [Scilit]
- Santos Mesquita, I.; Albuquerque Melo, P.; Resende Secchi, A. Novel pathways for urea synthesis decarbonization: An analytical review from Bosch–Meiser to electroreduction processes. Appl. Energy 2025, 400, 126527. [Google Scholar] [CrossRef] [Scilit]
- Gao, C. Experiences with ultra low Energy plant operation. In Proceedings of the International Fertiliser Society; The International Fertiliser Society: Chester, UK, 2023; p. 887. Available online: https://fertiliser-society.org/store/experiences-with-ultra-low-energy-plant-operation/ (accessed on 10 May 2026).
- Stamicarbon. Ultra Low Energy Design. 2023. Available online: https://www.stamicarbon.com/launch-melt-ultra-low-energy-design (accessed on 10 May 2026).
- Ding, Z.H.; Liang, W. Horizontal Methylamine Condenser and Urea Synthesis Highpressure Ring Equipment and Process. 2024. Available online: https://patents.google.com/patent/CN118391932A/en (accessed on 26 July 2024).
- Patil, R.; Mennen, J.H.; Gevers, L.W. Coupled Urea Melamine Production with HP CO2 Stripping. 2024. Available online: https://patents.google.com/patent/US12134590B2/en (accessed on 15 August 2024).
- Zhou, H.; Liu, G.; Feng, X. Problem table method for work exchange network with efficiency considered. J. Chem. Ind. Eng. 2011, 62, 1600−1605. Available online: https://www.tib.eu/de/suchen/id/BLSE:RN296305283/Problem-table-method-for-work-exchange-network (accessed on 10 May 2026).
- Onishi, V.C.; Quirante, N.; Ravagnani, M.A.S.S.; Caballero, J.A. Optimal synthesis of work and heat exchangers networks considering unclassified process streams at sub and above-ambient conditions. Appl. Energy 2018, 224, 567–581. [Google Scholar] [CrossRef] [Scilit]
- Amini-Rankouhi, A.; Huang, Y. Prediction of maximum recoverable mechanical energy via work integration: A thermodynamic modeling and analysis approach. AIChE J. 2017, 63, 4814–4826. [Google Scholar] [CrossRef] [Scilit]
- Cheng, C.Y.; Cheng, S.W.; Fan, L.T. Flow work exchanger. AIChE J. 1967, 13, 438–442. [Google Scholar] [CrossRef] [Scilit]
- Huang, Y.L.; Fan, L.T. Analysis of a Work Exchanger Network. Ind. Eng. Chem. Res. 1996, 35, 3528–3538. [Google Scholar] [CrossRef] [Scilit]
- Zhuang, Y.; Liu, L.; Zhang, L.; Du, J. Upgraded Graphical Method for the Synthesis of Direct Work Exchanger Networks. Ind. Eng. Chem. Res. 2017, 56, 14304–14315. [Google Scholar] [CrossRef] [Scilit]
- Chen, Z.; Wang, J. Heat, mass, and work exchange networks. Front. Chem. Sci. Eng. 2012, 6, 484–502. [Google Scholar] [CrossRef] [Scilit]
- Shamsuzzaman Razib, M.D.; Faruque Hasan, M.M.; Karimi, I.A. Optimal synthesis of compressor network. In Proceeding of the 7th International Conference on the Foundations of Computer-Aided Process Design (FOCAPD 2009), Design for Energy and Environment; CRC Press: Boca Raton, FL, USA, 2009; pp. 263–271. Available online: https://www.taylorfrancis.com/chapters/edit/10.1201/9781439809136-23/optimal-synthesis-compressor-networks-md-shamsuzzaman-razib-faruque-hasan-karimi (accessed on 10 May 2026).
- Du, J.; Zhuang, Y.; Liu, L.; Li, J.; Fan, J.; Meng, Q. Synthesis of indirect work exchanger network based on transshipment model. Comput.-Aided Chem. Eng. 2015, 37, 1139–1144. [Google Scholar] [CrossRef] [Scilit]
- Feng, X.; Chen, H. Optimized work exchange networks with economic consideration. Qinghua Daxue Xuebao/J. Tsinghua Univ. 2012, 52, 298–302. Available online: https://www.researchgate.net/publication/288107249_Optimized_work_exchange_networks_with_economic_consideration (accessed on 10 May 2026).
- Deng, J.; Cao, Z.; Zhang, D.; Feng, X. Integration of energy recovery network including recycling residual pressure energy with pinch technology. Chin. J. Chem. Eng. 2017, 25, 453–462. [Google Scholar] [CrossRef] [Scilit]
- Rossi, M.; Comodi, G.; Piacente, N.; Renzi, M. Energy recovery in oil refineries by means of a Hydraulic Power Recovery Turbine (HPRT) handling viscous liquids. Appl. Energy 2020, 270, 115097. [Google Scholar] [CrossRef] [Scilit]
- Rossi, M.; Fanti, O.; Pacca, S.A.; Comodi, G. Energy efficiency intervention in urea processes by recovering the excess pressure through hydraulic power recovery Turbines (HPRTs). Sustain. Energy Technol. Assess. 2022, 52, 102263. [Google Scholar] [CrossRef] [Scilit]
- Lan, Y.; Tian, C.; Lyu, H.; Sun, J. Integration of work exchange network within distillation process optimization. Sep. Purif. Technol. 2025, 362, 131552. [Google Scholar] [CrossRef] [Scilit]
- Meessen, J.H. Urea; John Wiley Sons Ltd.: Hoboken, NJ, USA, 2000. [Google Scholar] [CrossRef] [Scilit]
- Rumman Ali, M.; Anantharaman, A.P. Process Simulation of High Pressure Urea Production from Carbon Dioxide and Ammonia. Int. Res. J. Eng. Technol. 2019, 6, 381–386. Available online: https://www.irjet.net/archives/V6/i4/IRJET-V6I484.pdf (accessed on 10 May 2026).
- Adnan, M.A.; Kibria, M.G. Comparative techno-economic and life-cycle assessment of power-to-methanol synthesis pathways. Appl. Energy 2020, 278, 115614. Available online: https://www.sciencedirect.com/science/article/pii/S0306261920311211 (accessed on 7 September 2020). [CrossRef] [Scilit]
- Cameli, F.; Delikonstantis, E.; Kourou, A.; Rosa, V.; Van Geem, K.M.; Stefanidis, G.D. Conceptual Process Design and Technoeconomic Analysis of an e-Methanol Plant with Direct Air-Captured CO2 and Electrolytic H2. Energy Fuels 2024, 38, 3251–3261. [Google Scholar] [CrossRef] [Scilit]

Disclaimer/Publisher’s Note: The statements, opinions and data contained in all publications are solely those of the individual author(s) and contributor(s) and not of MDPI and/or the editor(s). MDPI and/or the editor(s) disclaim responsibility for any injury to people or property resulting from any ideas, methods, instructions or products referred to in the content. |
© 2026 by the authors. Licensee MDPI, Basel, Switzerland. This article is an open access article distributed under the terms and conditions of the Creative Commons Attribution (CC BY) license.