


Abstract
With the high penetration of distributed photovoltaic and storage systems, active distribution grids are prone to experiencing “active power surplus and reactive power shortage” during the evening peak, leading to voltage sags at the network end. Although electric vehicle (EV) grid-connected inverters possess four-quadrant reactive power regulation capabilities without causing the additional chemical cyclic aging of the battery cells, existing dispatch systems often treat them as unconditional response resources, overlooking users’ actual willingness to cede control and the associated strategic interactions. To address this, this paper proposes a “grid-load” coordinated reactive power optimization strategy that accounts for EV users’ willingness to respond: a Logit model incorporating price incentives, initial energy consumption, and parking duration is constructed based on discrete choice theory. By combining a truncated normal distribution with the Monte Carlo method to eliminate micro-sampling errors, a model of the expected reactive power capacity of charging stations under dynamic incentives is established; considering the physical constraints of SVCs and EVs, a scalarized single-objective optimization model is constructed with grid loss-equivalent costs, ancillary service costs, and voltage deviation as objectives, and solved using an improved particle swarm optimization algorithm with linearly decreasing weights. Simulations on a modified 33-node IEEE system incorporating storage indicate that this strategy can assign optimal compensation prices to each node based on the spatial value of reactive power. Compared to traditional single-voltage regulation and fixed subsidies, it not only stabilizes the grid-wide voltage within a safe range but also avoids overcompensation, achieving global optimization of both power quality and economic efficiency.
1. Introduction
With the large-scale integration of renewable energy sources, such as distributed photovoltaics, as well as electric vehicles, the operational characteristics of traditional distribution grids are undergoing profound changes. On the one hand, the output of renewable energy sources is highly intermittent and random, which can easily lead to node voltage fluctuations and out-of-limit issues [1]; on the other hand, the temporal and spatial concentration of electric vehicle charging loads is continuously increasing, further exacerbating voltage sags and reactive power regulation pressures in distribution grids during peak load periods. How to fully tap the reactive power regulation potential of new flexible resources while ensuring the safe and stable operation of distribution grids has become a critical issue that urgently needs to be addressed in the field of distribution grid operation and control [2].
Reactive power optimization and voltage control in traditional distribution grids primarily rely on centralized regulation methods such as capacitor banks, on-load tap-changing transformers, and static var compensators (SVCs) [3]. While these devices can improve voltage levels to some extent, their fixed installation locations and limited flexibility pose challenges. Furthermore, under conditions of the high penetration of distributed generation, they can easily lead to the long-distance transmission of reactive power within the distribution network, resulting in increased line currents and higher active power losses [4]. Therefore, relying solely on centralized reactive power compensation devices is no longer sufficient to meet the future demand for flexible and efficient reactive power regulation in distribution networks.
Electric vehicle (EV) charging stations typically connect to the distribution grid via power electronic converters, providing the technical capability for rapid and continuous reactive power regulation. Without altering active charging behavior, they can serve as potential distributed reactive power resources for voltage regulation [5]. While the integration of electric vehicles into distribution-level flexibility markets [6] has garnered significant attention, it is crucial to explicitly distinguish between traditional vehicle-to-grid active-power participation and reactive-power support through charger inverter capacity [7]. Most existing user-centric demand response and uncertainty-aware EV aggregation models focus on shifting active power load or utilizing battery discharge [8]. This active-power participation inherently accelerates battery degradation and frequently encounters strong psychological resistance from users. Conversely, while reactive power regulation may introduce minor inverter thermal stress and ohmic losses, it does not involve the active-power cycling that leads to primary battery chemical degradation. By utilizing the remaining apparent capacity of four-quadrant inverters within their operational limits, this approach provides continuous voltage control for active distribution networks while preserving the core electrochemical life of the EV batteries. Furthermore, to mobilize these distributed flexible resources, Distribution Locational Marginal Pricing (DLMP) has been widely proposed in the recent literature to reflect the spatial value of reactive power and guide active distribution network voltage control [9]. However, these existing DLMP-driven pricing models and V2G frameworks often treat charging stations as deterministic, fully controllable resources, insufficiently addressing the highly stochastic nature of micro-level user behaviors driven by range anxiety and parking durations [10].
Although the use of electric vehicle inverters to provide reactive power support holds theoretical promise, a critical research gap remains unaddressed: the significant mismatch between macro-grid dispatch assumptions and micro-level stochastic user behavior. Most existing studies adopt a strictly physical or control-center perspective, implicitly assuming that charging stations are fully compliant and fully dispatchable resources once instructed. Furthermore, while traditional demand response models can effectively achieve active power transfer in the time domain, they largely fail to exploit the four-quadrant reactive power capabilities of electric vehicles in the spatial domain, where battery losses are negligible.
To incentivize user participation, recent studies have introduced Distribution Locational Marginal Pricing (DLMP) for active/reactive power coordination. However, existing DLMP-driven models are fundamentally insufficient because they operate under the assumption of “perfectly rational economic agents,” presuming an ideal linear correlation between the compensation price and the EV response capacity. In reality, users exhibit bounded rationality characterized by complex, nonlinear willingness boundaries driven by range anxiety and parking duration. This idealized linear assumption in conventional DLMP inherently leads to either severe under-compensation (failing to activate sufficient reactive power at critical nodes) or massive over-compensation (causing spatial misallocation of dispatch funds).
To explicitly address the aforementioned limitations in the existing literature, this paper bridges the macro-micro divide through a comprehensive data-driven pricing framework. Unlike existing studies that treat charging stations as unconditional resources, we formulate a price-driven EV reactive-power response model utilizing a multi-dimensional Logit approach to quantitatively capture the bounded rationality of users regarding economic incentives, initial state of charge, and remaining parking duration. To overcome the deterministic assumptions prevalent in traditional capacity evaluations, this micro-willingness is integrated into a macro-capacity estimation via a Truncated Normal Monte Carlo sampling method, establishing a dynamic aggregation model for station-level expected reactive-power ceilings. Furthermore, addressing the spatial fund misallocation inherent in existing DLMP-based pricing models that assume perfectly rational economic agents, our work proposes a coordinated SVC-EV multi-source spatial optimization framework. This strategy embeds the nonlinear expected capacity into an Improved Particle Swarm Optimization algorithm to dynamically determine optimal spatial compensation prices, effectively preventing under-compensation at critical nodes and redundant over-compensation. The proposed framework is comprehensively validated on a modified IEEE 33-node system, demonstrating through comparative analysis with traditional single-device regulation, generic Time-of-Use pricing, and standard DLMP that our methodology successfully stabilizes system-wide voltage while economically minimizing active power losses and ancillary service costs under heavy-load conditions.
To clearly illustrate the overall physical and logical boundaries of the strategy proposed in this paper, Figure 1 presents the general architecture of the distributed power system’s reactive power coordination optimization, which takes into account EV users’ willingness to respond. In practical implementation, the reliable execution of such a spatially distributed architecture inherently relies on resilient digital state synchronization and networked communication between the distribution-system operator and the distributed charging stations. Recent advances in grid state synchronization and resilient coordination [11] provide a solid technical foundation for the real-time operation of our proposed model.
Figure 1.
Overall architecture for reactive power co-optimization.
2. Multi-Source Physical Constraints and Operational Modeling in Active Distribution Networks
To achieve global coordinated optimization of active distribution grids incorporating a high proportion of electric vehicles and distributed renewable energy sources, the primary task is to accurately characterize the physical operating boundaries of each core flexibility resource within the system. This paper constructs a multi-source coordinated physical framework encompassing the “generation side, grid side, and consumer side”. Within this framework, the distribution of power flows in the distribution grid is driven not only by base load but is also constrained by strict physical equations and inequalities governing each distributed controllable device.
2.1. Static Var Compensator (SVC) Model
In steady-state power flow analysis and reactive power optimization scheduling for distribution networks, Static Var Compensators (SVCs) are typically modeled as continuously adjustable reactive power sources connected to specific nodes [12]. Unlike traditional mechanical capacitor banks (CBs), which can only perform discrete step-by-step regulation, SVCs are capable of outputting any desired reactive power value within their physical capacity limits.
Assuming an SVC device is connected at distribution network node i, its reactive power output model and operational physical boundary constraints for time step t can be expressed by the following equation:
where is the actual reactive power (Mvar) injected into or absorbed from the grid by the SVC during time interval t; is the maximum physical capacity limit (Mvar) for capacitive compensation of the SVC unit; is the maximum physical capacity limit for inductive compensation of the SVC unit (Mvar), typically taken as a negative value.
The SVC’s operating mode switches dynamically based on real-time voltage conditions in the distribution network and requirements for optimizing line losses:
- (1)
- Capacitive operating state ( > 0): The SVC injects capacitive reactive power into the distribution network. During evening peak load periods (such as at 7:00 p.m.) or when reactive power deficits cause significant voltage sags at nodes, the SVC primarily operates in this state to effectively raise the overall voltage level of the feeder.
- (2)
- Reactive operating state ( < 0): The SVC absorbs reactive power from the distribution network. During daytime periods of light load when distributed photovoltaic (PV) systems are operating at high output (e.g., around 12:00), which creates a risk of overvoltage at local nodes, the SVC can operate in this state to suppress voltage spikes.
In the multi-source collaborative optimization framework developed in this paper, the SVC serves as a centralized reactive power regulation resource on the “grid side,” deployed at key nodes along the system’s main transmission lines to provide fundamental global reactive power support for the entire grid. During the optimization phase, will serve as a one-dimensional continuous control variable in the Particle Swarm Optimization (PSO) algorithm, undergoing joint optimization with the distributed dynamic reactive power capacity of EV charging stations on the “customer side”. This ultimately achieves complementary utilization of reactive power resources on both the “grid” and “load” sides, as well as the optimization of global operational metrics for the distribution network.
2.2. Base Load and Reactive Power Physical Limit for Electric Vehicle Charging Stations
With the rapid increase in the number of electric vehicles (EVs), the connection of charging stations to the power grid has placed significant active power load pressure on the grid. However, since modern EV charging stations typically feature voltage-source inverters (VSI) capable of four-quadrant operation, the remaining apparent power capacity of the inverter can be fully utilized to provide continuous reactive power (Q) support to the grid, provided that the vehicle’s own active charging demand is met (i.e., P is not reduced).
2.2.1. Active Load Characteristics of EV Charging Stations
In steady-state power flow analysis of distribution networks, EV charging stations are treated as active loads connected to a specific node i. Due to the clustered nature of residential travel patterns and differences in travel scenarios, this load exhibits significant peak-to-off-peak variations over time, and the required load also varies across different geographic locations. Assuming represents the total active charging load of charging station i during time interval t, this paper classifies charging stations into three distinct zones (residential, office, and transportation hubs). Considering the load characteristics of EVs in different zones, the load profiles for the typical grid-connected time intervals identified in this study are set as shown in Table 1.
Table 1.
Load profiles for the typical grid-connected time intervals.
2.2.2. Four-Quadrant Operation Model and Reactive Power Physical Boundaries for Charging Station Inverters
To ensure that the system has sufficient reactive power regulation margin under overload or fault conditions, chargers in modern charging stations are typically over-sized by a certain percentage during the planning and design phase. Assuming that the capacity configuration factor of the inverter is λ, the maximum aggregate apparent power of all chargers in charging station i can be expressed as:
where is the maximum apparent power capacity of charging station i (MVA); is the highest active load of that charging station over the course of a day (MW); λ is the inverter capacity margin factor. For legacy charging facilities without such hardware margins ( ≈ 1), the proposed coordination framework remains applicable by utilizing active power derating to release reactive power capacity, which ensures the backward compatibility of the method.
Modern charging station inverters typically feature four-quadrant operation capabilities under all operating conditions, enabling them to flexibly provide capacitive or inductive reactive power support while simultaneously absorbing or delivering active power [13]. The circuit diagram is shown in Figure 2.
Figure 2.
Electric Vehicle Charger Four-Quadrant Inverter Circuit Diagram.
To visually demonstrate the reactive power regulation limits of the inverter under different active load levels, this paper constructs a physically coupled model of the charging station inverter’s four-quadrant operation.
As shown in the Figure 3, the actual operating point of the inverter is strictly confined within the circular boundary defined by the rated apparent power . At any given operating time t, based on the geometric coupling relationship of the power triangle shown in the figure, the maximum unidirectional physical reactive power output that the charging station can provide is directly limited by its real-time active power demand , which is calculated as follows:
Figure 3.
Physically coupled model of the charging station inverter’s four-quadrant operation.
Since the charging station inverter described in this paper supports four-quadrant continuous regulation, the physically feasible range of reactive power that Charging Station i can provide in response to grid dispatch during time slot t (i.e., the vertical axis regulation range shown in the figure) is:
where represents the actual reactive power (Mvar) injected into or absorbed from the grid by charging station i during time slot t; represents the real-time active power demand (MW) during time slot t.
Although the provision of reactive power support by electric vehicles via inverters does not directly cause chemical cycling degradation of the battery (i.e., it does not alter the state of charge, SOC), it still has some indirect effects in actual engineering operations. First, an increase in reactive current leads to higher ohmic losses in the charging station’s inverter and cables, generating additional thermal stress. Second, when the inverter’s apparent power reaches its limit, reactive power regulation may force a derating of active charging power. However, compared to the electrode material stress and chemical degradation caused by V2G active power discharge, these thermal stresses and equipment losses have a negligible impact on the lifespan of the vehicle’s core battery assets. Within the research framework of this paper, we focus primarily on avoiding costly battery chemical lifespan degradation and assume that inverter heat can be controlled within safe operating limits.
As can be seen from the geometric models and formulas described above, EVs possess significant potential for reactive power dispatch during actual charging. Therefore, by formulating a reasonable EV charging strategy, EVs can be integrated into the reactive power optimization process of the distribution grid without affecting their charging.
In this simulation model, the calculated from the equations represents only the charging station’s maximum reactive power output capacity at the physical hardware level. In actual coordinated dispatch of distribution grids, whether this reactive power capacity can be fully utilized is strictly constrained by the individual participation willingness of micro-level EV users at the station (driven by factors such as subsidy incentives, battery state of charge, and remaining parking time). Therefore, building upon this model, this paper further integrates a micro-psychological model to assess response willingness and uses this willingness to calculate the final expected reactive power.
3. A Model for Evaluating Expected Reactive Power Capacity of Charging Stations Based on User Preferences
Building upon the established physical boundaries between the grid side and the consumer side, this chapter further narrows the focus to the micro-level EV user group. In practical applications of EV participation in distribution grid reactive power optimization services, the maximum reactive power capacity available at the physical level of a charging station essentially depends on whether the vast number of dispersed users within the station are willing to relinquish control of their chargers’ inverters. Since providing reactive power support does not involve active charging or discharging of the battery and thus does not cause additional wear and tear on the battery’s cycle life, the primary barrier to user participation stems from concerns about interference with charging schedules. To address this, this chapter constructs a Logit participation probability model incorporating multidimensional drivers based on discrete choice theory in microeconomics [14], and combines it with the Truncated Normal Monte Carlo Sampling method [15] to achieve a rigorous mathematical derivation from “micro-level individual vehicle participation probability” to “macro-level station-wide expected reactive power ceiling”.
3.1. Quantifying EV User Participation Probability Using a Logit Model
3.1.1. Binary Logit Model
EV users exhibit typical characteristics of bounded rationality when deciding whether to authorize their inverters to participate in grid reactive power optimization dispatch.
Their decision-making process is driven not only by economic incentives for reactive power compensation issued by the grid dispatch center but is also strongly constrained by the vehicle’s battery state (range anxiety) and parking duration (time anxiety). This paper employs a binary Logit model to quantitatively model this discrete choice behavior [16].
Let denote the comprehensive utility function for the j-th EV user participating in the distribution grid’s reactive power dispatch. This utility function is a linear combination of three core independent variables: economic incentives, state of charge (SOC), and remaining charging time:
In the equation: represents the total utility of the j-th EV user in choosing to participate in reactive power regulation; represents the economic incentive level for reactive power compensation issued by the power grid (yuan/kvar·h); represents the initial state of charge (SOC) of the j-th EV when it connects to the charging station (%); is the remaining parking time (h) until the j-th EV is expected to leave the charging station; β1, β2, and β3 are the preference sensitivity coefficients for the corresponding explanatory variables (all positive), reflecting the marginal contribution of each factor to user utility; α is the Alternative Specific Constant (ASC), representing the inherent baseline utility of the behavior of “ceding inverter control” for EV users, distinct from explicit explanatory variables such as economic incentives, electricity consumption, and parking time. Since relinquishing control is typically accompanied by implicit privacy concerns and psychological resistance, this constant term is usually negative. As the fixed intercept of the utility function, it reflects the psychological response threshold commonly observed across the population.
Based on stochastic utility theory, assuming that the random error term of the utility function follows a Gumbel distribution, the probability that the j-th EV user ultimately agrees to participate in reactive power support follows a logistic distribution:
As can be seen from this nonlinear mapping relationship, as subsidies for reactive power compensation increase, battery capacity becomes more abundant, and parking duration lengthens, the probability of user participation will rise along an S-shaped curve and eventually reach a state of saturation.
This function indicates that the probability of user participation exhibits a nonlinear growth trend as economic incentives increase, and is modulated by battery state and parking duration. It should be noted that the focus of the model in this paper is to characterize the functional relationship between “price signals and user response probability” for subsequent reactive power capacity aggregation modeling, rather than to make precise predictions of specific individual behaviors.
As regional EV reactive power markets are still in their nascent stages, comprehensive large-scale empirical datasets regarding user behavioral responses remain scarce. Consequently, the proposed Logit structure functions as a forward-looking exploratory behavioral layer designed to capture the nonlinear dynamics of user decision-making under future market mechanisms. To ensure the robustness of the overarching dispatch framework against this current empirical scarcity, this study conducts an extensive sensitivity analysis covering a diverse range of parameter combinations, rather than relying on a single deterministic set.
To analyze the impact of different user characteristics on response behavior, this paper selects multiple representative parameter combinations within a reasonable range and conducts a comparative analysis of trends in user participation probability. It should be emphasized that these parameter combinations do not correspond to specific real-world user categories, but are used to characterize differences in response behavior under different preference profiles.
To rigorously fulfill the requirement of an extensive sensitivity analysis for this hypothetical behavioral layer, Figure 4 and Figure 5 illustrate the response boundaries across a broad spectrum of parameter variations. Figure 4 demonstrates the sensitivity of the inherent preference constant α, revealing that even if the baseline psychological resistance shifts drastically, the S-shaped response probability strictly maintains its nonlinear mapping characteristics. More importantly, Figure 5 explores the multi-dimensional β parameter combinations by defining extreme hypothetical user profiles, such as the “highly sensitive profit-driven type” and the “mileage protection type”. The extensive analysis of these curves proves that although the specific trajectory of user response varies, the dynamic elasticity between compensation price and reactive power capacity persists. This guarantees that the subsequent “grid-load” coordinated optimization framework is fundamentally robust and mathematically solvable, entirely independent of any single, deterministic set of empirical parameters.
Figure 4.
Sensitivity analysis of the inherent preference constant a to the reactive power response willingness of EV.
Figure 5.
The influence of multi-dimensional B parameter combinations.
The analysis results indicate that the user participation probability curves exhibit significant differences in slope and initial position under different parameter combinations: when users are more sensitive to economic incentives, their participation probability shows a steeper growth trend as the price increases; when users are more sensitive to battery state of charge, their willingness to participate may still be suppressed even at higher compensation levels; and when users have ample parking time, they may exhibit a certain degree of spontaneous participation even at low incentive levels. These results indirectly reflect the heterogeneous nature of user behavior and demonstrate that a single, fixed compensation strategy is unlikely to fully tap into the potential of flexible resources on the user side.
3.1.2. Parameter Expectation Calibration Method Based on Monte Carlo Multi-Scenario Sampling
To ensure the validity of the Logit model in real-world power distribution network reactive power simulations and to avoid subjective parameter biases (single-point bias) resulting from a single hypothetical scenario, this paper proposes a parameter expectation calibration method based on Monte Carlo multi-scenario sampling.
Set the system to operate under a conservative baseline scenario with no external economic incentives ( = 0). Given that EV users generally have a very low willingness to relinquish control without compensation, this study establishes a hypothetical baseline participation rate of 5–15%. While this assumption draws upon general innovation diffusion theory and preliminary statistical observations from existing vehicle-grid interaction pilot projects [17], it is employed here primarily as a mathematical boundary condition to initialize the Monte Carlo sampling process for the intrinsic preference constant, rather than a definitive empirical measurement.
To map macro-level expected probabilities to the micro-level intrinsic preference constant α, this paper uses the Monte Carlo method to generate a set of M representative initial state scenarios .
For any kth scenario in the set, the required local intrinsic constant , derived in order to satisfy the macro-level base probability , is:
Finally, by calculating the mathematical expectation of the local across all scenarios, we obtain the global intrinsic preference constant , which eliminates the randomness bias in individual states:
Through the closed-loop calibration process described above, the constructed Logit model is able to smoothly and robustly reflect the actual evolution of EV users’ willingness to respond to reactive power demands—from a state of no incentives to one of high incentives—within the specific context of this power distribution network, as shown in Figure 6.
Figure 6.
The real Logit model.
3.2. Random Sampling of EV States and Scene Generation Based on the Truncated Normal Distribution
In the actual operation of distribution networks, the EVs entering charging stations exhibit a high degree of randomness in terms of their initial state of charge (SOC) and estimated remaining parking time (). To accurately assess the expected reactive power capacity at the charging station cluster level, it is necessary to develop appropriate statistical models and generate scenarios based on the micro-level states of the large number of EVs within the station.
3.2.1. Mathematical Model of the Truncated Normal Distribution
To strictly ensure that the generated random variables comply with objective physical boundaries, this paper introduces a truncated normal distribution model [18]. Assuming that the random variable x (representing SOC or ) follows a normal distribution with mean μ and standard deviation σ, and is constrained by strict physical upper and lower limits [a, b], its truncated probability density function (PDF) f(x) can be expressed as:
In the formula: x is the state variable to be sampled from the EV; μ and σ are the mean and standard deviation of the original, uncut normal distribution, respectively; a and b are the lower and upper bounds of the variable’s physically feasible range, respectively; ϕ(·) is the probability density function of the standard normal distribution; Φ(·) is the cumulative distribution function (CDF) of the standard normal distribution; the denominator term serves to renormalize the truncated probability density, ensuring that the sum of the probability integrals over the interval [a, b] equals 1.
3.2.2. Monte Carlo Multi-Scenario Generation Process
To eliminate random errors caused by single-sample observations, this paper employs the Monte Carlo Simulation (MCS) method to generate a large-scale set of random scenarios [19]. Suppose that at time t, there are electric vehicles connected to the grid at charging station i. The Monte Carlo scenario generation process is as follows:
- (1)
- Set the total number of simulation scenarios, M.
- (2)
- In the mth scenario (m ∈ {1, 2, …, M}), based on the truncated normal distribution model described above, generate independent sets of microstate parameter matrices :
In the equation: and represent, respectively, the initial state of charge and the remaining parking time of the jth EV at charging station i in the mth scenario.
- (3)
- By iterating through all M scenarios, we construct a complete set of states Ω = {, , …, } that encompasses a vast range of random possibilities, thereby laying the data foundation for subsequent aggregation calculations to determine the expected upper limit of reactive power capacity for the entire charging station.
3.3. A Macro-Level Aggregation Model for Expected Reactive Power Capacity at Charging Stations Based on Price Incentives
In the actual operation of distribution grids, the remaining capacity of inverters at the physical level represents only the absolute upper limit of reactive power regulation, while the reliable reactive power capacity that the dispatch center can actually call upon depends heavily on the reactive power compensation price issued. In this section, based on a Monte Carlo multi-scenario micro-state matrix, we construct a price-signal-driven macro-level expected reactive power capacity aggregation model [20,21] to achieve a cross-domain mapping from “economic incentives” to “physical capacity”.
3.3.1. Calculation of Individual EV Expected Reactive Power Capacity
For the jth electric vehicle at the charging station, in the mth Monte Carlo simulation scenario, its initial state of charge is , and its remaining parking time is .
When the distribution network dispatch center broadcasts the uniform reactive power compensation price , the response probability that the user agrees to relinquish control of the inverter, based on the Logit response willingness model, is:
Combining the real-time physical reactive power limit for a single EV derived in Section 2.2 the upper bound of the statistically expected reactive power capacity that this vehicle can provide to the power grid can be expressed as the product of the physical capacity and the willingness probability:
When the physical capacity is objectively constrained by the vehicle’s active charging, the dispatch center can only effectively tap into the vehicle’s reactive power potential by increasing the response probability through higher economic incentives .
3.3.2. Aggregation of Station-Level Macro-Level Expected Reactive Power Capacity
Within the same scheduling period t, for the mth random scenario, the station-level reactive power capacity —aggregated from all grid-connected EVs at charging station i—is the linear sum of the expected capacities of each individual vehicle:
To eliminate random fluctuations in micro-level states within individual scenarios and ensure the robustness of steady-state dispatch in power distribution networks, this paper calculates the global mathematical expectation of the aggregated capacity across M Monte Carlo scenarios. Ultimately, the macro-level expected reactive power capacity physical limit that charging station i can provide in response to dispatch during time slot t is defined as:
3.3.3. Price-Capacity Response Function and Scheduling Constraints
From the above derivation, it can be seen that, for a given operating section of the distribution network (i.e., assuming that and the active charging demands of each vehicle are fixed), the adjustable reactive power limit of the charging station is no longer a static constant, but rather a dynamic nonlinear function of the compensation price .
In the subsequent multi-source coordinated optimization process for the distribution grid, the actual reactive power injected into the grid by charging station i must be strictly constrained by this dynamic desired boundary:
In this study, the compensation price essentially serves as a dynamic retail-side incentive embedded within the local flexibility market at the distribution level. At the operational level, the Distribution System Operator (DSO) acts as a central coordinator, using optimization algorithms to calculate these optimal spatial prices, which serve as internal dispatch signals. Rather than requiring individual users to participate directly in complex wholesale ancillary service markets, the DSO distributes these price signals to decentralized charging station operators (aggregators), who then pass the incentives on to individual electric vehicle users via mobile charging apps in the form of real-time ancillary service payments or direct discounts on current charging bills. This tiered mechanism effectively translates the physical demands of the macro-grid into microeconomic retail-side incentives, thereby bridging the regulatory gap between grid dispatch and user participation.
It should be noted that the aggregation models derived from Equations (13) and (14) essentially provide a statistical expectation assessment of a charging station’s reactive power potential. At the micro level, the response behavior of individual users follows a Bernoulli distribution with probability ; at the macro level, the total capacity of the station is represented as a weighted combination of random variables. This paper draws on the Law of Large Numbers to argue that when the sample size of electric vehicles within a charging station is sufficiently large, the statistical expectation of the group can serve as a stable proxy signal for scheduling. Although in practical engineering scenarios, psychological correlations among different users may arise due to extreme weather or grid emergencies, and there is a risk of random fluctuations between actual response levels and expected values, this paper aims to establish a “price-willingness-capacity” mapping mechanism. In subsequent research, confidence intervals can be introduced to further transform the “expected capacity” into “reliable dispatch capacity” to address the uncertainty of micro-responses.
4. A Model and Solution for “Grid-Load” Coordinated Reactive Power Optimization in Active Distribution Networks
Based on the multi-source physical constraint and micro-level EV user preference evaluation model developed in the previous section, this chapter will formally establish a comprehensive mathematical model for reactive power optimization in active distribution grids. During typical grid-intensive periods such as evening peak loads, the distribution grid dispatch center faces a fundamental economic and physical trade-off: on the one hand, it must strive to raise terminal node voltages and reduce active power losses across the entire grid; on the other hand, mobilizing the reactive power capacity of EV charging stations requires paying users corresponding economic compensation . Therefore, this chapter adopts a heuristic algorithm to solve for the optimal reactive power pricing and dispatch strategy, with the objective of minimizing the total system operating cost, subject to strict power flow equations and equipment capacity constraints.
4.1. Integrated Optimization Objective Function
To achieve the overall optimization of both the physical operational indicators of the distribution network and the economic costs of ancillary services, this paper constructs a joint objective function Ftotal that includes the “equivalent cost of line losses” and the “cost of reactive power compensation”. For a specific scheduling period t, the objective function is defined as follows:
In the equation: represents the equivalent cost of active power line losses, as shown in Equation (17); represents the procurement cost of reactive power services from EV, as shown in Equation (18); represents the penalty function for node voltage deviation, as shown in Equation (19).
In the equation: is the unit price (yuan/kWh) at which the distribution network purchases electricity from the higher-level main grid; is the total number of branches in the distribution network; is the equivalent resistance of the lth branch; and are the active and reactive powers flowing through branch l at time t, respectively; is the voltage amplitude at the starting node of the branch; ∆t is the dispatch time interval.
where denotes the set of EV charging station nodes connected to the distribution grid; denotes the unit reactive power compensation price (yuan/kvar·h) assigned to node i; denotes the expected reactive power that the charging station actually responds to.
where is the total number of nodes in the distribution network; is the actual voltage normalization value at node i; is the reference voltage value at node i; is the penalty weight factor for voltage deviation, which maps the dimensionless voltage deviation normalization value to an economic penalty value of the same order of magnitude as line losses. A larger indicates that the dispatch strategy places greater emphasis on power quality.
To verify the validity of the parameter settings for the objective function described above, this paper conducts a sensitivity analysis on the key parameters.
First, the sensitivity of the penalty factor : Experiments show that when is small, the algorithm tolerates minor voltage violations at the end nodes of the distribution network in pursuit of maximum economic efficiency (reducing EV compensation costs); whereas when ≥ 105, the penalty mechanism forms an effective absolute barrier, ensuring that all isolated operation solutions satisfy the voltage safety constraints 100% of the time. This demonstrates the necessity and effectiveness of selecting = 106 as the hard constraint alternative in this paper.
Next is the sensitivity of the line loss price conversion factor cgrid: since economic terms are unified under the “yuan” dimension, system behavior is highly sensitive to the grid’s base electricity price. Tests indicate that if the distribution network is in an off-peak pricing period (where cgrid is low), the proportion of line loss costs in the total objective decreases, and the algorithm tends to reduce the purchase of EV compensation, allowing line losses to rise moderately; Conversely, during peak-rate periods, the algorithm further increases the EV compensation price to secure more on-site reactive power support, thereby reducing grid losses. This adaptive trade-off perfectly aligns with the logic of electricity economics, further validating the rationality of this normalized objective function.
4.2. Physical Boundaries of System Operation and Multi-Source Collaborative Constraints
To ensure the absolute safety and technical feasibility at the physical level of the “grid-load” coordinated reactive power optimization scheme for distribution networks, all control variables and state variables in the proposed dispatch strategy must strictly satisfy the following set of equations and inequalities, which encompass power flow, equipment, and economic considerations.
Constraints on the Safe Operation of Distribution Networks
During any scheduling period t, the active and reactive power injections at each node i in the system must satisfy Kirchhoff’s laws in real time (in polar form based on AC power flow). Additionally, to ensure power quality for end users and equipment insulation safety, the voltage at each node must be maintained within a specified range of nominal values. Furthermore, the response capability of multi-source reactive power devices is constrained by their hardware specifications and the economic willingness of users [22]:
In the equation: and represent the active and reactive power outputs of conventional distributed generation sources at node i; and represent the base active and reactive load demands at node i (including the active charging load of EVs); is the total reactive power compensation provided at node i (i.e., the sum of and ); and are the voltage magnitudes at nodes i and j, respectively; and are the real part (conductance) and imaginary part (admittance) of the node admittance matrix elements, respectively; is the voltage phase angle difference between nodes i and j; is the set of adjacent nodes directly connected to node i; is the maximum unit price allowed under local ancillary service market rules or dispatch center budget constraints, and represent the active and reactive power flowing from node I to its adjacent node j, respectively; is the thermal stability apparent power limit of the physical power distribution line connecting nodes i and j.
4.3. Solution Process for Collaborative Optimization Based on the Improved Particle Swarm Optimization (IPSO) Algorithm
The “grid-load” coordinated reactive power optimization model for active distribution networks developed in this paper is a typical nonlinear, non-convex mixed-integer programming problem involving complex coupling constraints. In particular, the Logit probability mapping relationship between the expected reactive power capacity boundary of EVs and the compensation price makes it difficult to solve conventional mathematical analytical methods (such as the interior-point method) directly, or causes them to easily become stuck in local optima. Therefore, this paper employs an Improved Particle Swarm Optimization (IPSO) algorithm incorporating a linearly decreasing inertia weight strategy to achieve efficient global optimization, and combines it with the MATPOWER power flow calculation kernel for state verification.
4.3.1. Mapping Particle Codes to Control Variables
In the IPSO algorithm, each particle represents a set of global control strategies issued by the distribution network dispatch center during this time period. Assuming that the distribution network is equipped with static var compensators and connected to EV charging stations with reactive power regulation capabilities, the position vector of the kth particle in the population is encoded as a mixed-dimensional vector comprising direct physical control variables (SVC output) and economic control variables (compensation price):
The algorithm does not directly generate the reactive power output of the EV; instead, it assigns values to the dimension in the position vector. The aggregation model then maps this to the actual available reactive power capacity of that charging station, which is subsequently used as the reactive power injection at the PQ node in the power flow calculation.
4.3.2. Fitness Evaluation Mechanism Based on a Penalty Function
To address the stringent system state inequality constraints encountered during the operation of distribution networks, this paper introduces an external dynamic penalty function into the fitness evaluation process.
For any scheduling plan generated by particle k, its composite fitness function is defined as the sum of the basic objective function and the penalty term:
where represents the total operating cost; represents the voltage deviation threshold for node i; and represents the maximum penalty coefficient. This mechanism ensures that any infeasible solution causing a node voltage to exceed the threshold is assigned a very high objective cost, thereby being rapidly eliminated during the evolutionary process.
4.3.3. Steps for Executing the IPSO Algorithm
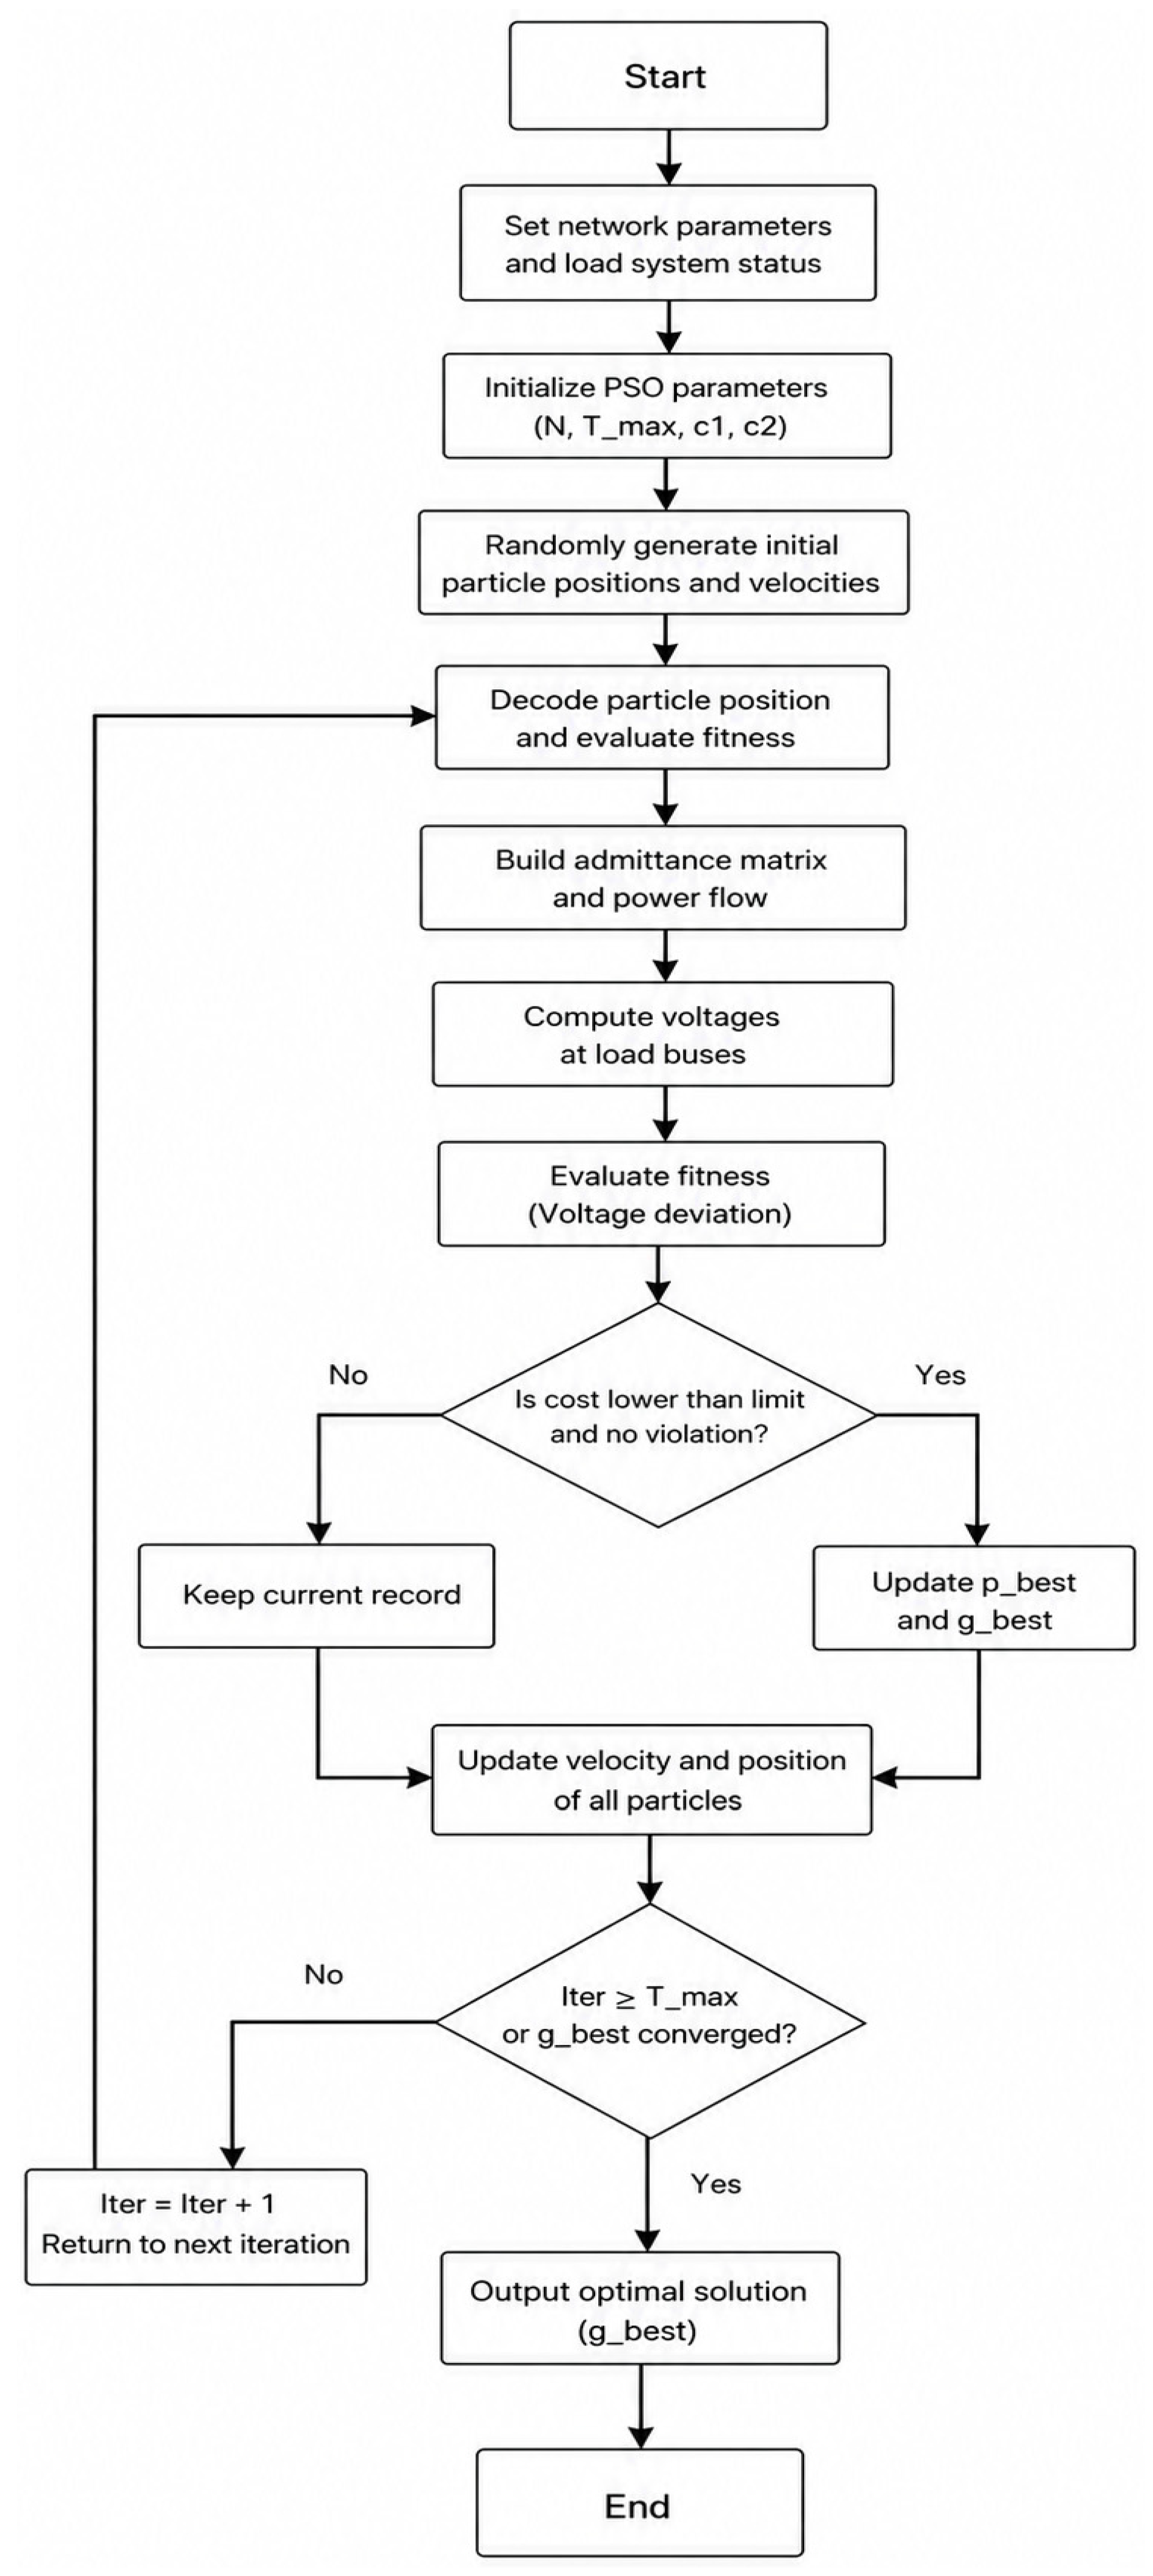
The complete flowchart of the optimization strategy described in this paper is shown in Figure 7. The complete execution process is as follows:
- (1)
- Set the base load parameters for the distribution network and the EV Monte Carlo sampling state matrix. Initialize the IPSO algorithm parameters: set the population size to 40, the maximum number of iterations to 60, and the learning factors c1 and c2 to 2.0. Generate the initial positions X and velocities V of the population randomly within the physically and economically feasible boundaries of the control variables.
- (2)
- Decode the position vectors of each particle and use the Logit capacity function to calculate the reactive power injection at each charging station. Input the reactive power compensation matrices for the grid-wide SVCs and EVs into the MATPOWER kernel to solve the power flow problem using the Newton-Raphson method, thereby obtaining the voltage distribution at all grid nodes.
- (3)
- Based on the results of the simulation and the fitness function Fit(k) with a penalty term constructed in Step 2, calculate the fitness values (i.e., the total cost) for all particles in the current population.
- (4)
- Compare the fitness of the current particle with the historical individual best () and global best (). If the current solution has a lower cost and has not triggered the voltage-out-of-bounds penalty, update the record of the best values.
- (5)
- The inertial weight ω is dynamically updated using the following formula to balance global exploration in the early stages of the algorithm with local convergence in the later stages:
Then update the velocity and position of all particles and perform strict boundary clipping to prevent them from going out of bounds.
- (6)
- Check whether the maximum number of iterations has been reached or whether the global optimal solution has remained unchanged for several consecutive generations. If the termination condition is met, output the global optimal scheduling plan and its corresponding minimum total system cost; otherwise, set the iteration count to t = t + 1 and return to step 2 to continue the optimization process.
Figure 7.
The complete execution process.
5. Case Study Analysis
5.1. Case Setup and Basic Data
The case study is based on a modified IEEE 33-node distribution network. The system’s reference voltage is 12.66 kV, with a total rated active load of 3.715 MW and a reactive load of 2.300 Mvar. It includes a photovoltaic-battery energy storage (PV-BESS) system, reactive power compensators (SVCs), and EV bidirectional reactive power charging stations. The IEEE 33-node network topology is shown in Figure 8. The distributed PV-BESS systems are connected at the end zones of the system’s two main branches (Nodes 18 and 33) to improve the active power flow distribution across the entire grid; The static var compensator (SVC), serving as the core equipment for centralized voltage regulation on the grid side, is connected to the central hub in the middle section of the distribution network (Node 14). Its reactive power regulation capacity is continuously adjustable within the range of [−1.0, 1.0] Mvar; EV charging stations are distributed across Nodes 7, 24, and Node 31. As the key user-side flexible reactive power resources explored in this paper, their aggregated reactive power capacity is constrained by the micro-state sampling of EVs connected to the station and the reactive power compensation price C_inc issued by the distribution grid. Optimization scheduling is performed for the typical time slot of 19:00, and simulation analysis is conducted in the MATLAB environment. Power flow calculations are based on the MATPOWER kernel, and the optimization solution employs the improved particle swarm optimization algorithm developed in Section 4.3 of this paper. Regarding the operating parameters of the Monte Carlo scenario sampling process, a robust rejection sampling method is employed, utilizing a truncated normal distribution to accurately model the random variables of the electric vehicle fleet. Each distributed charging station is configured with a total capacity of 50 vehicles. For these arriving vehicles, the initial state of charge is mathematically sampled with a mean of 50% and a standard deviation of 15%, strictly constrained within the physical range of 20% to 100%. Concurrently, the random remaining parking duration is sampled with a mean of 4.0 h and a standard deviation of 1.5 h, strictly limited to a range of 0.5 to 12.0 h.
Figure 8.
IEEE33 topology diagram.
To verify the feasibility and effectiveness of the collaborative optimization strategy described in this paper, the following test cases—labeled S1 through S4—were established based on the specified parameter settings, with S1 serving as the baseline case:
S1: The system is in a natural overload state. The PV-BESS hybrid systems at nodes 18 and 33 are only performing conventional active power discharge (PV output is zero, BESS is discharging); the grid-side SVC is offline; EVs are only performing unidirectional active power charging and are not participating in reactive power compensation interactions. There are no active reactive power or voltage control measures in place across the entire grid.
S2: Voltage regulation relies solely on traditional grid-side equipment. The SVC at Node 14 is activated to optimize reactive power output; however, no compensation incentive mechanism is implemented. Due to users’ inherent reluctance to relinquish control over their batteries, the expected reactive power response capacity at the charging stations at Nodes 7, 24, and 31 is extremely low, and they contribute almost nothing to grid-wide coordination.
S3: This scenario employs the typical Time-of-Use (TOU) pricing mechanism widely used in electricity markets [23]. During the 19:00 evening peak load period, the distribution grid dispatch center issues uniform peak-load high-price reactive power compensation instructions to EV charging stations at all nodes across the grid. This strategy focuses on guiding flexible loads to participate in regulation through price signals in the temporal dimension, while implementing undifferentiated uniform pricing in the spatial dimension.
S4: This scenario introduces the Distribution Locational Marginal Pricing (DLMP) framework. This strategy precisely extracts the reactive power-voltage (Q-V) sensitivity of each node by taking the derivative of the distribution network power flow equations, and uses this as the physical basis for calculating spatially differentiated compensation prices for each node. During settlement, it adheres to the theoretical paradigm of the “perfectly rational economic agent” found in traditional flexibility markets, implicitly assuming that micro-level willingness exhibits “constant price elasticity” in response to external economic incentives. This implies that the potential utilization of reactive power resources will expand without behavioral decision-making constraints as compensation prices rise. This scenario aims to quantitatively examine the overcompensation bias resulting from traditional DLMP methods that ignore bounded rationality and the saturation characteristics of micro-level response willingness.
S5: Fully implement the comprehensive optimization model developed in this paper. Enable SVC voltage regulation, and the dispatch center will no longer rely on manually set fixed empirical prices. Instead, using the IPSO algorithm, it will aim to minimize the total system operating cost (line loss cost + reactive power procurement cost + voltage penalty) and issue dynamically optimized reactive power compensation prices C_inc to each charging station. Through a precise interplay of price and capacity, this approach will elicit the most appropriate share of reactive power from EVs.
In the practical implementation of the algorithm, the selection of key parameters is crucial for computational efficiency and global optimization performance. Through multiple preliminary experiments, this paper proposes the following optimized parameter settings for the IPSO algorithm: for the multi-dimensional control variables of the IEEE 33-node distribution network, the population size is set to N = 40 and the maximum number of iterations to Tmax = 60. Preliminary tests indicate that this scale ensures the population maintains sufficient diversity in the non-convex solution space while effectively controlling the computational overhead of power flow calculations per iteration. Furthermore, the algorithm typically converges within 30–40 generations, with the 60-generation upper limit providing ample margin. In this study, the upper bound = 0.9 and lower bound = 0.4 are selected for the adaptive weight. This is the optimally proven range in classical particle swarm algorithm theory, which perfectly aligns with the original intent of the linear decay strategy in this paper—emphasizing global exploration to escape local optima at 0.9, and ensuring fine convergence near extrema at 0.4. Regarding learning factors, both the individual learning factor and the social learning factor are set to c1 = c2 = 2.0. This symmetric configuration aims to assign equal weight to the “self-experience” and “group experience” of particles, thereby preventing the algorithm from deviating from the search direction under the complex constraints of the Logit preference boundary during the early stages.
5.2. Comparison of Comprehensive Optimization Results Under Different Scheduling Strategies
5.2.1. Analysis of Total Operating Costs and Economic Benefits
Table 2 presents the key economic indicators and power quality assessment results for the five scenarios. The actual total expenditure for the distribution network includes only the cost of electricity equivalent to line losses () and the cost of reactive power purchased for EV users ().
Table 2.
Economic and operational cost comparison under different cases.
Table 3 provides a detailed overview of the various technical metrics across the five scenarios.
Table 3.
Technical performance indicators and node interactive pricing for five scenarios.
It can be seen that under natural operating conditions (S1) and when relying solely on grid-side reactive power regulation (S2), the system experiences severe under-voltage limit violations (voltage sags). This indicates that under high-load conditions, relying solely on centralized reactive power equipment is insufficient to meet the voltage support requirements of remote nodes. After incorporating electric vehicles into the dispatch process (S3–S5), the system voltage returns to within safe limits, demonstrating that distributed reactive power resources on the consumer side can effectively mitigate under-voltage issues and elevate the end-node voltages. From an economic perspective, different pricing strategies have a significant impact on the system’s total cost. In the S3 scenario, which employs a Time-of-Use (TOU) pricing mechanism, while it effectively incentivizes charging stations to provide sufficient reactive power support, the failure to account for variations in reactive power demand across nodes leads to overcompensation at some nodes, resulting in higher compensation costs. In contrast, the S4 scenario, by introducing DLMP, reduces redundant compensation to some extent. However, because it assumes an ideal linear positive correlation between default reactive power response and compensation price—failing to account for the nonlinear characteristics inherent in real-world user behavior—it still results in mismatches with actual demand. The S5 strategy proposed in this paper uses an optimization model to adaptively generate compensation prices, achieving a precise match with the reactive power demands of different nodes. While ensuring voltage stability, it effectively reduces unnecessary compensation expenditures.
Further analysis reveals that the significant reduction in total cost achieved by the S5 strategy proposed in this paper is not the result of a reduction in a single dimension, but rather the combined effect of three factors: optimized space allocation, lower reactive power demand, and more precise node pricing. On the one hand, S5 avoids the misallocation of spatial resources caused by the uniform high price of S3; by substantially reducing compensation prices at non-critical nodes, it safely reduces unnecessary reactive power demand at those locations. On the other hand, S5 overcomes the flaw of the S4 strategy—which is based on linear assumptions—that leads to blind premium pricing at extreme nodes. Since micro-users’ willingness to respond follows the non-linear Logit saturation characteristic, S5 accurately identifies the optimal location at end node 31, which is severely short of reactive power, successfully avoiding the marginal premium trap in S4 and significantly reducing single-point expenditure while maintaining the same level of reactive power support.
Figure 9 visually illustrates the effectiveness of five different dispatch strategies in reducing active power losses across the entire distribution network under heavy-load conditions during the evening rush hour.
Figure 9.
Network loss comparison chart.
As shown in Figure 9, in Scenarios 1 and 2, due to the lack of distributed reactive power support in the system, the surge in load at each node resulted in a large amount of reactive power needing to be transmitted over long-distance lines from the upstream main grid, generating significant reactive currents. This caused active power losses across the entire grid to reach as high as 0.1985 MW and 0.1717 MW, respectively. Upon introducing EVs to participate in “grid-load” coordinated voltage regulation (Scenarios 3, 4, and 5), line losses experienced a precipitous decline. This provides strong physical evidence of the immense engineering value of distributed reactive power resources’ “local balancing” characteristics in suppressing line heating and enhancing grid operational efficiency.
Scenario 3 employs a high-price incentive strategy based on time-of-use pricing. Although this significantly mobilized reactive power, it failed to achieve physical optimality. The root cause lies in the fact that a fixed, uniform tariff structure masks the spatial heterogeneity of reactive power demand. Consequently, nodes located near substations—which originally had no reactive power deficit—excessively injected redundant reactive power () driven by high electricity prices. As recent studies on active distribution grids have emphasized [24,25], uncoordinated local reactive power injection—particularly in grids supported by existing distributed active power sources (such as the PV-storage systems at nodes 18 and 33)—inevitably leads to severe reactive power reverse flow (RRPF). When locally injected reactive power exceeds node demand, the excess reactive current is forced to flow back upstream into the main grid. This reverse reactive power flow unnecessarily occupies the limited thermal capacity of distribution lines and increases the total branch current magnitude (|I|), thereby triggering a secondary surge in active power losses (Ploss = |I|2 R). The dynamic spatial pricing strategy proposed in this paper (Scenario 5) fundamentally suppresses this reverse reactive power flow. By imposing low-price instructions on head nodes with reactive power surpluses, the strategy strictly prevents overcompensation and successfully avoids the I2R heating penalty associated with reverse reactive currents.
The dynamic pricing strategy for Scenario 5 described in this paper further reduces active power losses to the lowest level across the entire system. By applying high-price incentives to end nodes with reactive power shortages and issuing low-price instructions to head nodes with reactive power surpluses, it reduces financial expenditures on EV compensation and achieves local reactive power balancing in the physical space.
5.2.2. Analysis of the Effect of Improved Node Voltage Distribution
Figure 10 illustrates the voltage distribution at distribution network nodes under different control strategies. Without any control measures (S1), the system voltage exhibits a clear downward trend along the feeder, with the voltage at the end nodes falling below the safety threshold, reflecting typical voltage sags under heavy load conditions. When only grid-side SVC devices are activated (S2), the voltage level on the main feeder is somewhat improved, but the effect on remote nodes is limited. This is primarily due to the long transmission distances for reactive power in a radial distribution network structure, making it difficult for centralized compensation to effectively cover the entire network. After introducing electric vehicles to participate in collaborative voltage regulation (S3–S5), the voltage distribution improved overall, with all nodes maintained within permissible limits. In the S3 scenario, due to relatively sufficient compensation, the voltage increase was more pronounced; however, the voltage at some nodes approached the upper limit, indicating a certain degree of overcompensation. In Scenarios S4 and S5, differentiated pricing strategies aligned reactive power support more closely with actual demand, resulting in a smoother voltage distribution. Compared to Scenario S4, where the default reactive power response and compensation price exhibited an ideal linear positive correlation—failing to account for the nonlinear characteristics inherent in real-world consumer behavior—Scenario S5 achieved a more balanced overall voltage distribution while ensuring safety constraints. This demonstrates that the proposed method offers certain advantages in regulating the spatial distribution of reactive power.
Figure 10.
Node voltage comparison chart.
5.2.3. Analysis of Algorithm Convergence and Execution Efficiency
When addressing the “grid-load” coordinated multidimensional nonlinear game model developed in this paper, the objective function not only incorporates complex AC power flow constraints in the distribution network but also deeply couples the nonlinear response boundaries of users based on the Logit model with stringent node voltage violation penalties. This results in a highly non-convex solution space, placing extremely high demands on the optimization solver’s search depth.
Figure 11 illustrates the global convergence trajectories and average error distributions of the IPSO algorithm adopted in this paper across 50 independent runs under the late-peak heavy-load section (Scenario 5). From the perspective of evolutionary dynamics, it is clearly observed that the convergence process of the IPSO algorithm exhibits an elegant exponential smooth decay characteristic, perfectly aligning with the theoretical design intent of “linearly decreasing inertial weights”. In terms of execution efficiency, leveraging the MATLAB (v2024) kernel, the average optimization time per scheduling run is kept within 35 s, meeting the real-time engineering requirements for the current 15 min online rolling scheduling of active distribution grids.
Figure 11.
IPSO: Results from a total of 50 runs.
5.3. Robustness and Adaptability Analysis
To comprehensively validate the robustness and generalizability of the “grid-load” coordinated reactive power optimization strategy proposed in this paper under varying operating conditions, this section goes beyond the limitations of a single heavily loaded section during the evening peak. It conducts in-depth stress tests across three dimensions: spatiotemporal load shifts in the temporal dimension, sensitivity to electric vehicle penetration rates in the spatial dimension, and fluctuations in consumer micro-behavioral preferences. The section also discusses the engineering feasibility of the algorithm for large-scale power grids.
5.3.1. Spatio-Temporal Adaptive Control Under Multi-Period Operating Conditions
Throughout the day, the center of reactive power demand shifts dynamically in response to changes in the spatial distribution of the load. In this section, we selected two typical operating conditions—the midday peak (12:00) and the early morning off-peak (03:00)—for testing. The simulation results are shown in Figure 12 and Figure 13. During the midday period, the base load across the entire grid remains at a medium-to-high level. The simulation results indicate that the optimization strategy proposed in this paper can accurately capture voltage differences and reactive power demand between nodes. As shown in the dynamic pricing results in the figure, the compensation prices assigned to Node 7, Node 24, and the distribution network end point (Node 31) at this time are 0.64, 0.15, and 1.39 RMB/kvar, respectively. The algorithm continues to precisely assign the highest premium to the terminal node with the greatest risk of voltage sags, successfully guiding grid-connected vehicles to release inverter capacity and smoothly maintaining the lowest node voltage across the entire grid at this time slot at a high safety level of approximately 0.998 p.u. During the early morning off-peak time slot (03:00), the grid’s base load drops to its lowest point of the day, and the distribution network’s own reactive power resources are abundant. At this time, the optimization algorithm automatically issued an extremely low reactive power compensation price of exactly 0 to all charging stations, effectively curbing the problem of a large number of grid-connected vehicles blindly injecting reactive power, which could have been triggered by a fixed, high subsidy.
Figure 12.
Voltage profiles of the active distribution network across different typical time slots.
Figure 13.
Spatial adaptation of optimal reactive power compensation prices under various operating conditions.
5.3.2. Spatial Adaptability Under Different Electric Vehicle Penetration Rates
To verify the strategy’s adaptability to varying levels of reactive power resources, this section compares the dispatch performance under a 20% and 50% EV penetration rate during the 19:00 evening peak load section. As shown in Table 4, when the penetration rate increases from 20% to 50%, the total system operating cost rises from 717.9 yuan to 1295.5 yuan. Specifically, the equivalent active power transmission loss cost decreased from 82.95 to 77.23, demonstrating that large-scale local reactive power balancing effectively curbed energy losses from long-distance transmission. However, in pursuit of optimal global voltage quality, the algorithm proactively procured ample reactive power support from a larger base of users, resulting in a significant increase in overall reactive power compensation expenditures.
Table 4.
Comparison of economic efficiency under different EV penetration levels.
5.3.3. Robustness Testing for Different User Behavior Parameters
To verify the strategy’s resilience against the psychological preferences of unknown users, this section introduces a group of conservative “range-conscious” users who are insensitive to economic incentives and place extreme importance on remaining battery range. In this stress test scenario, most vehicle owners exhibit strong psychological resistance due to range anxiety and are unwilling to relinquish control of their inverters. Simulation comparisons (see Figure 14) show that relying solely on traditional grid-side static reactive power compensators (S2), without on-site support from distributed resources, leads to severe voltage sags caused by long-distance reactive power transmission. The voltage at terminal node 33 drops to approximately 0.943 p.u., severely breaching safety limits. However, after introducing the dynamic pricing strategy (S5) proposed in this paper, the algorithm is able to keenly detect the contraction of macro-response capacity and, through adaptive iteration, decisively raise the compensation pricing at each node. This strong price signal successfully overcomes the high psychological resistance threshold of conservative participants, ultimately forcing the grid’s minimum voltage to rise and remain within the safe range of approximately 0.959 p.u. This robustly demonstrates that the collaborative framework possesses an extremely wide adaptation range for uncertainties in micro-level behavioral parameters and a strong physical safety net capability.
Figure 14.
Comparison of voltage profiles under the extreme conservative EV user behavior scenario.
Furthermore, the reliability of the proposed framework’s scheduling does not depend solely on the absolute accuracy of the probabilistic Logit boundary. Its reliability is ensured through a dual safeguard mechanism. First, at the algorithmic level, the IPSO solver operates as a closed-loop adaptive controller; if the actual reference demand in a specific region deviates significantly downward (e.g., due to extreme psychological resistance), the algorithm automatically detects the capacity gap during the iteration process and decisively raises the compensation price to exceed the behavioral threshold, as confirmed by the aforementioned stress tests. Second, at the physical level, this coordination framework essentially retains grid-side centralized SVC as a deterministic safety net. Even in extreme scenarios where the probabilistic response of electric vehicles completely fails, the algorithm will automatically maximize SVC output to resolutely prevent systemic voltage collapse, ensuring that physical grid safety is never compromised by micro-level uncertainties.
5.3.4. Algorithm Robustness and Performance Comparison
To further demonstrate the necessity and irreplaceability of introducing the IPSO algorithm within the physics-economics synergy framework discussed in this paper, this section conducts a large-scale comparative test of the IPSO algorithm against the standard real-number-encoded genetic algorithm (GA) and the standard particle swarm optimization algorithm (Standard PSO, using a fixed inertia weight) under the most challenging Scenario 5. All three algorithms were uniformly set with a population size of 40 and a maximum number of iterations of 60, and each was run independently 50 times to eliminate the randomness inherent in heuristic search. The comprehensive statistical metrics of the tests are shown in Table 5, and the complete convergence trajectories of GA and PSO over 50 runs are illustrated in Figure 15a,b.
Table 5.
Comparison of the Results of Three Algorithms.
Figure 15.
Results from a total of 50 runs of GA and PSO.
Faced with the complex solution space in this study—which is non-convex and involves a high-penalty function—the GA exhibited severe premature convergence, with highly dispersed trajectories after 50 runs, rendering it completely incapable of handling such strongly constrained scheduling tasks. The standard PSO algorithm lost population diversity too early in the initial iterations and had a roughly 2% probability of becoming completely trapped in a local optimum. In actual power grid operations, such low-probability scheduling errors would directly lead to node voltage exceeding limits, posing unacceptable safety risks. Thanks to its linearly decreasing inertial weight mechanism, the IPSO algorithm developed in this paper achieved 100% global optimal solution convergence in 50 high-intensity tests, with a standard deviation of only 0.0003.
In summary, the IPSO algorithm demonstrates exceptional solution stability.
5.3.5. A Discussion on Computational Complexity and Engineering Feasibility
The “Monte Carlo + IPSO” nonlinear power flow solution framework proposed in this paper requires minimal time per optimization run on a 33-node system, which is sufficient to meet the current 15 min online rolling dispatch requirements of distribution grids. However, if directly applied to real-world large power grids comprising thousands of nodes, centralized iterative optimization would face the curse of dimensionality and communication delays. To achieve the engineering implementation of this theoretical model in industrial-scale power grids, two technical approaches can be pursued in the future: First, adopting an “offline training + online surrogate model” approach, which uses historical multi-section optimization data to train deep neural networks to replace complex online power flow iterations, thereby enabling the direct output of optimal pricing instructions within milliseconds; Second, introducing network decoupling and distributed parallel computing to partition large-scale distribution grids into several weakly coupled microgrid zones for independent parallel solving, thereby reducing computational complexity from exponential to linear levels and comprehensively ensuring the computational feasibility of real-time dispatch for ultra-large-scale distribution grids.
6. Conclusions
This paper addresses the issues of limited voltage regulation capacity in single-side equipment and severe voltage sags at the network end in distribution grids under heavy-load conditions during the evening rush hour. It proposes a reactive power coordination and dynamic pricing strategy that takes into account the response willingness of electric vehicle users. Research indicates that by introducing a Logit response willingness model to accurately characterize user behavior and constructing a “grid-load” coordinated optimization framework, it is possible to effectively identify and mobilize flexible resources on the user side, thereby ensuring system voltage safety constraints under extreme conditions at the physical level.
Regarding pricing games and resource allocation in multi-source coordination, this paper reveals the decisive influence of spatial heterogeneity in reactive power sensitivity on dispatch decisions. Traditional undifferentiated fixed-subsidy strategies tend to overlook the spatial topological characteristics of the power grid, leading to redundant responses from low-sensitivity head-end nodes. In contrast, the scalarized single-objective coordination strategy proposed in this paper can adaptively generate spatially differentiated price signals that match the Q-V sensitivity of nodes. By suppressing the minimum price at head-end nodes and incentivizing high prices at end-nodes, this mechanism effectively eliminates ineffective compensation and achieves a significant improvement in the utilization efficiency of dispatch funds.
In terms of physical operational performance, this study further elucidates the underlying mechanisms by which spatially differentiated pricing suppresses reactive current loops in distribution grids and reduces active power losses. Simulation results confirm that blind, excessive compensation not only leads to economic redundancy but also causes excessive reactive power injection at the source end, resulting in reverse power flows and cross-node reactive power transmission within the distribution grid, thereby increasing additional active power losses in the system. The strategy proposed in this paper uses price mechanisms to precisely guide the optimal local balancing of reactive power resources, effectively avoiding long-distance ineffective reactive power flows. This optimization mechanism significantly reduces economic expenditures while further lowering active power losses across the entire grid, achieving synergistic optimization of the system’s financial efficiency and physical operational efficiency.
Finally, it must be acknowledged that this study inherently possesses certain limitations that outline the trajectory for future work. Foremost, in the absence of real-world user-response data, the behavioral Logit model remains fundamentally exploratory, necessitating future empirical calibration via large-scale vehicle–grid interaction pilot projects to transition from a theoretical framework to a predictive tool. Furthermore, the current validation is strictly confined to the modified IEEE 33-node benchmark system, warranting broader testing across large-scale, asymmetric, and topologically complex real-world distribution feeders. The framework also relies on simplified abstractions of EV charging behaviors and implicitly assumes idealized, zero-latency digital communication networks between the distribution-system operator and distributed charging stations. Subsequent research endeavors will directly address these boundaries by integrating uncertainty-aware real-time validation techniques, incorporating complex real-world communication constraints, and evaluating the multi-source collaborative strategy under highly stochastic grid environments.
Author Contributions
Conceptualization, X.Z. and S.H.; methodology, S.H.; software, X.Z.; validation, S.H. and X.Z.; formal analysis, S.H.; investigation, X.Z.; resources, S.H. and X.Z.; data curation, X.Z.; writing—original draft preparation, S.H. and X.Z.; writing—review and editing, X.Z. and Y.S.; visualization, X.Z. and Y.S.; supervision, S.H.; project administration, S.H.; funding acquisition, S.H. All authors have read and agreed to the published version of the manuscript.
Funding
This research received no external funding.
Data Availability Statement
The data and MATLAB/MATPOWER source codes supporting the findings of this study are publicly available for research reproducibility.
Conflicts of Interest
The authors declare no conflict of interest.
References
- Rao, Z.; Li, R.; Zhou, S.; He, W.; Yuan, X.; Li, J. Dynamic reactive power optimization method for active distribution network with new energy and electric vehicle charging stations connected to the grid. In Proceedings of the 2024 IEEE 2nd International Conference on Power Science and Technology (ICPST), Dali, China, 9–11 May 2024; pp. 1979–1988. [Google Scholar]
- Wang, Z.; Hou, S. Optimal Scheduling for Hybrid Battery Swapping System of Electric Vehicles. Processes 2023, 11, 1604. [Google Scholar] [CrossRef] [Scilit]
- Yang, X.; Wei, B. Reactive power and voltage optimization method for distribution network with distributed generation. Electr. Age 2025, 7, 74–77. (In Chinese) [Google Scholar]
- Li, Y.; Hu, X. Multi-objective reactive power optimization of distribution network based on distributed power supply in large-scale parallel network. Autom. Instrum. 2025, 40, 6–12. (In Chinese) [Google Scholar] [CrossRef]
- Srijeeth, J.; Thiagarajan, V.C.; Mohanrajan, S.R. Z-source dual active bridge bidirectional AC–DC converter for electric vehicle applications. In Proceedings of the 2018 IEEE International Conference on Power Electronics, Drives and Energy Systems (PEDES), Chennai, India, 18–21 December 2018; pp. 1–4. [Google Scholar] [CrossRef] [Scilit]
- Wang, X.; Wang, Z.; Li, Q. Distribution-level Flexibility Market for Congestion Management of Distribution Networks Considering Responsiveness Uncertainties of Electrical Vehicles. In Proceedings of the 2024 IEEE PES 16th Asia-Pacific Power and Energy Engineering Conference (APPEEC), Nanjing, China, 25–27 October 2024; pp. 1–5. [Google Scholar] [CrossRef] [Scilit]
- Suri, V.; Nagpal, N.; Siano, P.; Sharma, R.; Agarwal, S.; Pak, W. EVA-centric QUBO optimization for active and reactive power coordination in DLMP-driven distribution systems. Sci. Rep. 2026, 16, 12513. [Google Scholar] [CrossRef] [Scilit] [PubMed]
- Veiga, C.; Soares, J.; Ramos, C.; Corchado, J.; Mello, R.; Fernandes, R.; Dorneles, C. A Review of Support Tools for User-Centric Electric Vehicle Charging Management Based on Artificial Intelligence and Multi-Agent System Approaches. Energies 2025, 18, 6189. [Google Scholar] [CrossRef] [Scilit]
- Jangid, B.; Mathuria, P.; Gupta, V. Reactive DLMP for Hierarchical Energy Management and Optimal Reactive Power Response from EVs. In Proceedings of the 2022 22nd National Power Systems Conference (NPSC), New Delhi, India, 17–19 December 2022; pp. 278–283. [Google Scholar] [CrossRef] [Scilit]
- Xu, Y.; Han, J.; Yin, Z.; Liu, Q.; Dai, C.; Ji, Z. Voltage and reactive power-optimization model for active distribution networks based on second-order cone algorithm. Computers 2024, 13, 95. [Google Scholar] [CrossRef] [Scilit]
- Prymushko, A.; Puchko, I.; Yaroshynskyi, M.; Sinko, D.; Kravtsov, H.; Artemchuk, V. Efficient State Synchronization in Distributed Electrical Grid Systems Using Conflict-Free Replicated Data Types. IoT 2025, 6, 6. [Google Scholar] [CrossRef] [Scilit]
- Li, Z.; Xiong, J. Reactive power optimization in distribution networks of new power systems based on multi-objective particle swarm optimization. Energies 2024, 17, 2316. [Google Scholar] [CrossRef] [Scilit]
- Kesler, M.; Kisacikoglu, M.C.; Tolbert, L.M. Vehicle-to-grid reactive power operation using plug-in electric vehicle bidirectional offboard charger. IEEE Trans. Ind. Electron. 2014, 61, 6778–6784. [Google Scholar] [CrossRef] [Scilit]
- Parsons, G.R.; Hidrue, M.K.; Kempton, W.; Gardner, M.P. Willingness to pay for vehicle-to-grid (V2G) electric vehicles and their contract terms. Energy Econ. 2014, 42, 313–324. [Google Scholar] [CrossRef] [Scilit]
- Zheng, J.; Cui, J.; Zhao, Z. Multi-objective optimization scheduling for electric vehicle charging and discharging: Peak-load shifting strategy based on Monte Carlo sampling. Designs 2025, 9, 51. [Google Scholar] [CrossRef] [Scilit]
- Luo, C.; Huang, Y.-F.; Gupta, V. Placement of EV charging stations—Balancing benefits among multiple entities. IEEE Trans. Smart Grid 2017, 8, 759–768. [Google Scholar] [CrossRef] [Scilit]
- Pi, Y.; Zhang, M.; Cai, Z. Vehicle-to-grid (V2G) discharge pricing strategies and consumer participation: Price–demand and representative scenarios analyses. In Proceedings of the International Conference on Electrical Engineering and Intelligent Systems (IC2EIS 2025), Zhengzhou, China, 14–16 March 2025; p. 136962E. [Google Scholar] [CrossRef] [Scilit]
- Lee, J.-S.; Yang, M.C.K. Threshold selection using estimates from truncated normal distribution. IEEE Trans. Syst. Man Cybern. 1989, 19, 422–429. [Google Scholar] [CrossRef] [Scilit]
- Bian, H.; Tang, X.; Ji, K.; Zhang, Y.; Xie, Y. Prediction of electric vehicle charging load considering user travel characteristics and charging behavior. World Electr. Veh. J. 2025, 16, 502. [Google Scholar] [CrossRef] [Scilit]
- Wang, L.; Chen, L.; Xu, X.; Wang, C. Coordinated Dispatch and Control of Active-Reactive Power for Distribution Network Considering Aggregation of Electric Vehicle Clusters. Autom. Electr. Power Syst. 2026, 1–16. (In Chinese) [Google Scholar]
- Huang, L.; Li, H.; Lai, C.S.; Zobaa, A.F.; Zhong, B.; Zhao, Z.; Lai, L.L. Electric vehicle cluster scheduling model for distribution systems considering reactive-power compensation of charging piles. Energies 2024, 17, 2541. [Google Scholar] [CrossRef] [Scilit]
- Chen, J. Research on Optimal Scheduling of Electric Vehicles for Secure Operation of Distribution Network. Master’s Thesis, North China Electric Power University, Beijing, China, 2025. (In Chinese) [Google Scholar] [CrossRef]
- Wu, Y.; Duan, S.; Yang, L. Optimization of active distribution network for electric vehicle charging–swapping–storage integrated station considering time-of-use pricing. IEEE Trans. Transp. Electrif. 2026, 12, 3267–3279. [Google Scholar] [CrossRef] [Scilit]
- Trinh, P.-H.; Chung, I.-Y. Integrated Active and Reactive Power Control Methods for Distributed Energy Resources in Distribution Systems for Enhancing Hosting Capacity. Energies 2024, 17, 1642. [Google Scholar] [CrossRef] [Scilit]
- Ma, Z.; Li, Z.; Sun, C.; Zhu, C.; Gu, B.; Zhang, X. Decoupled Partitioning of Active and Reactive Power for Voltage Control in Distribution System Based on Generalized Distance. In Proceedings of the 2024 IEEE 7th Student Conference on Electric Machines and Systems (SCEMS), Macao, China, 6–8 November 2024; pp. 1–6. [Google Scholar] [CrossRef] [Scilit]
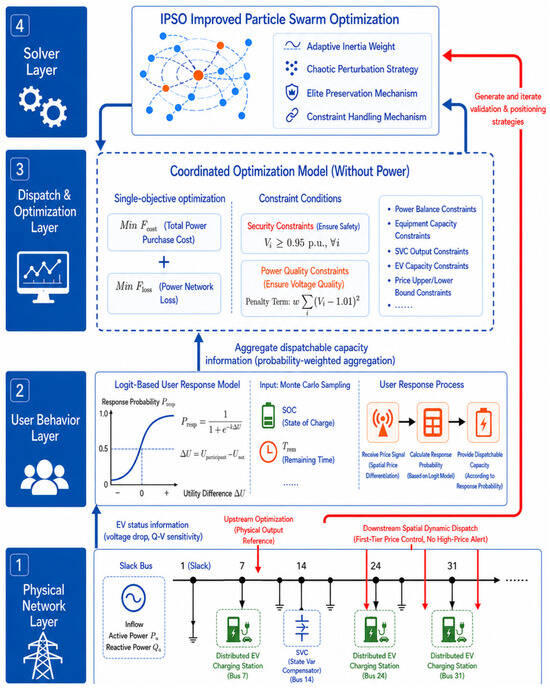
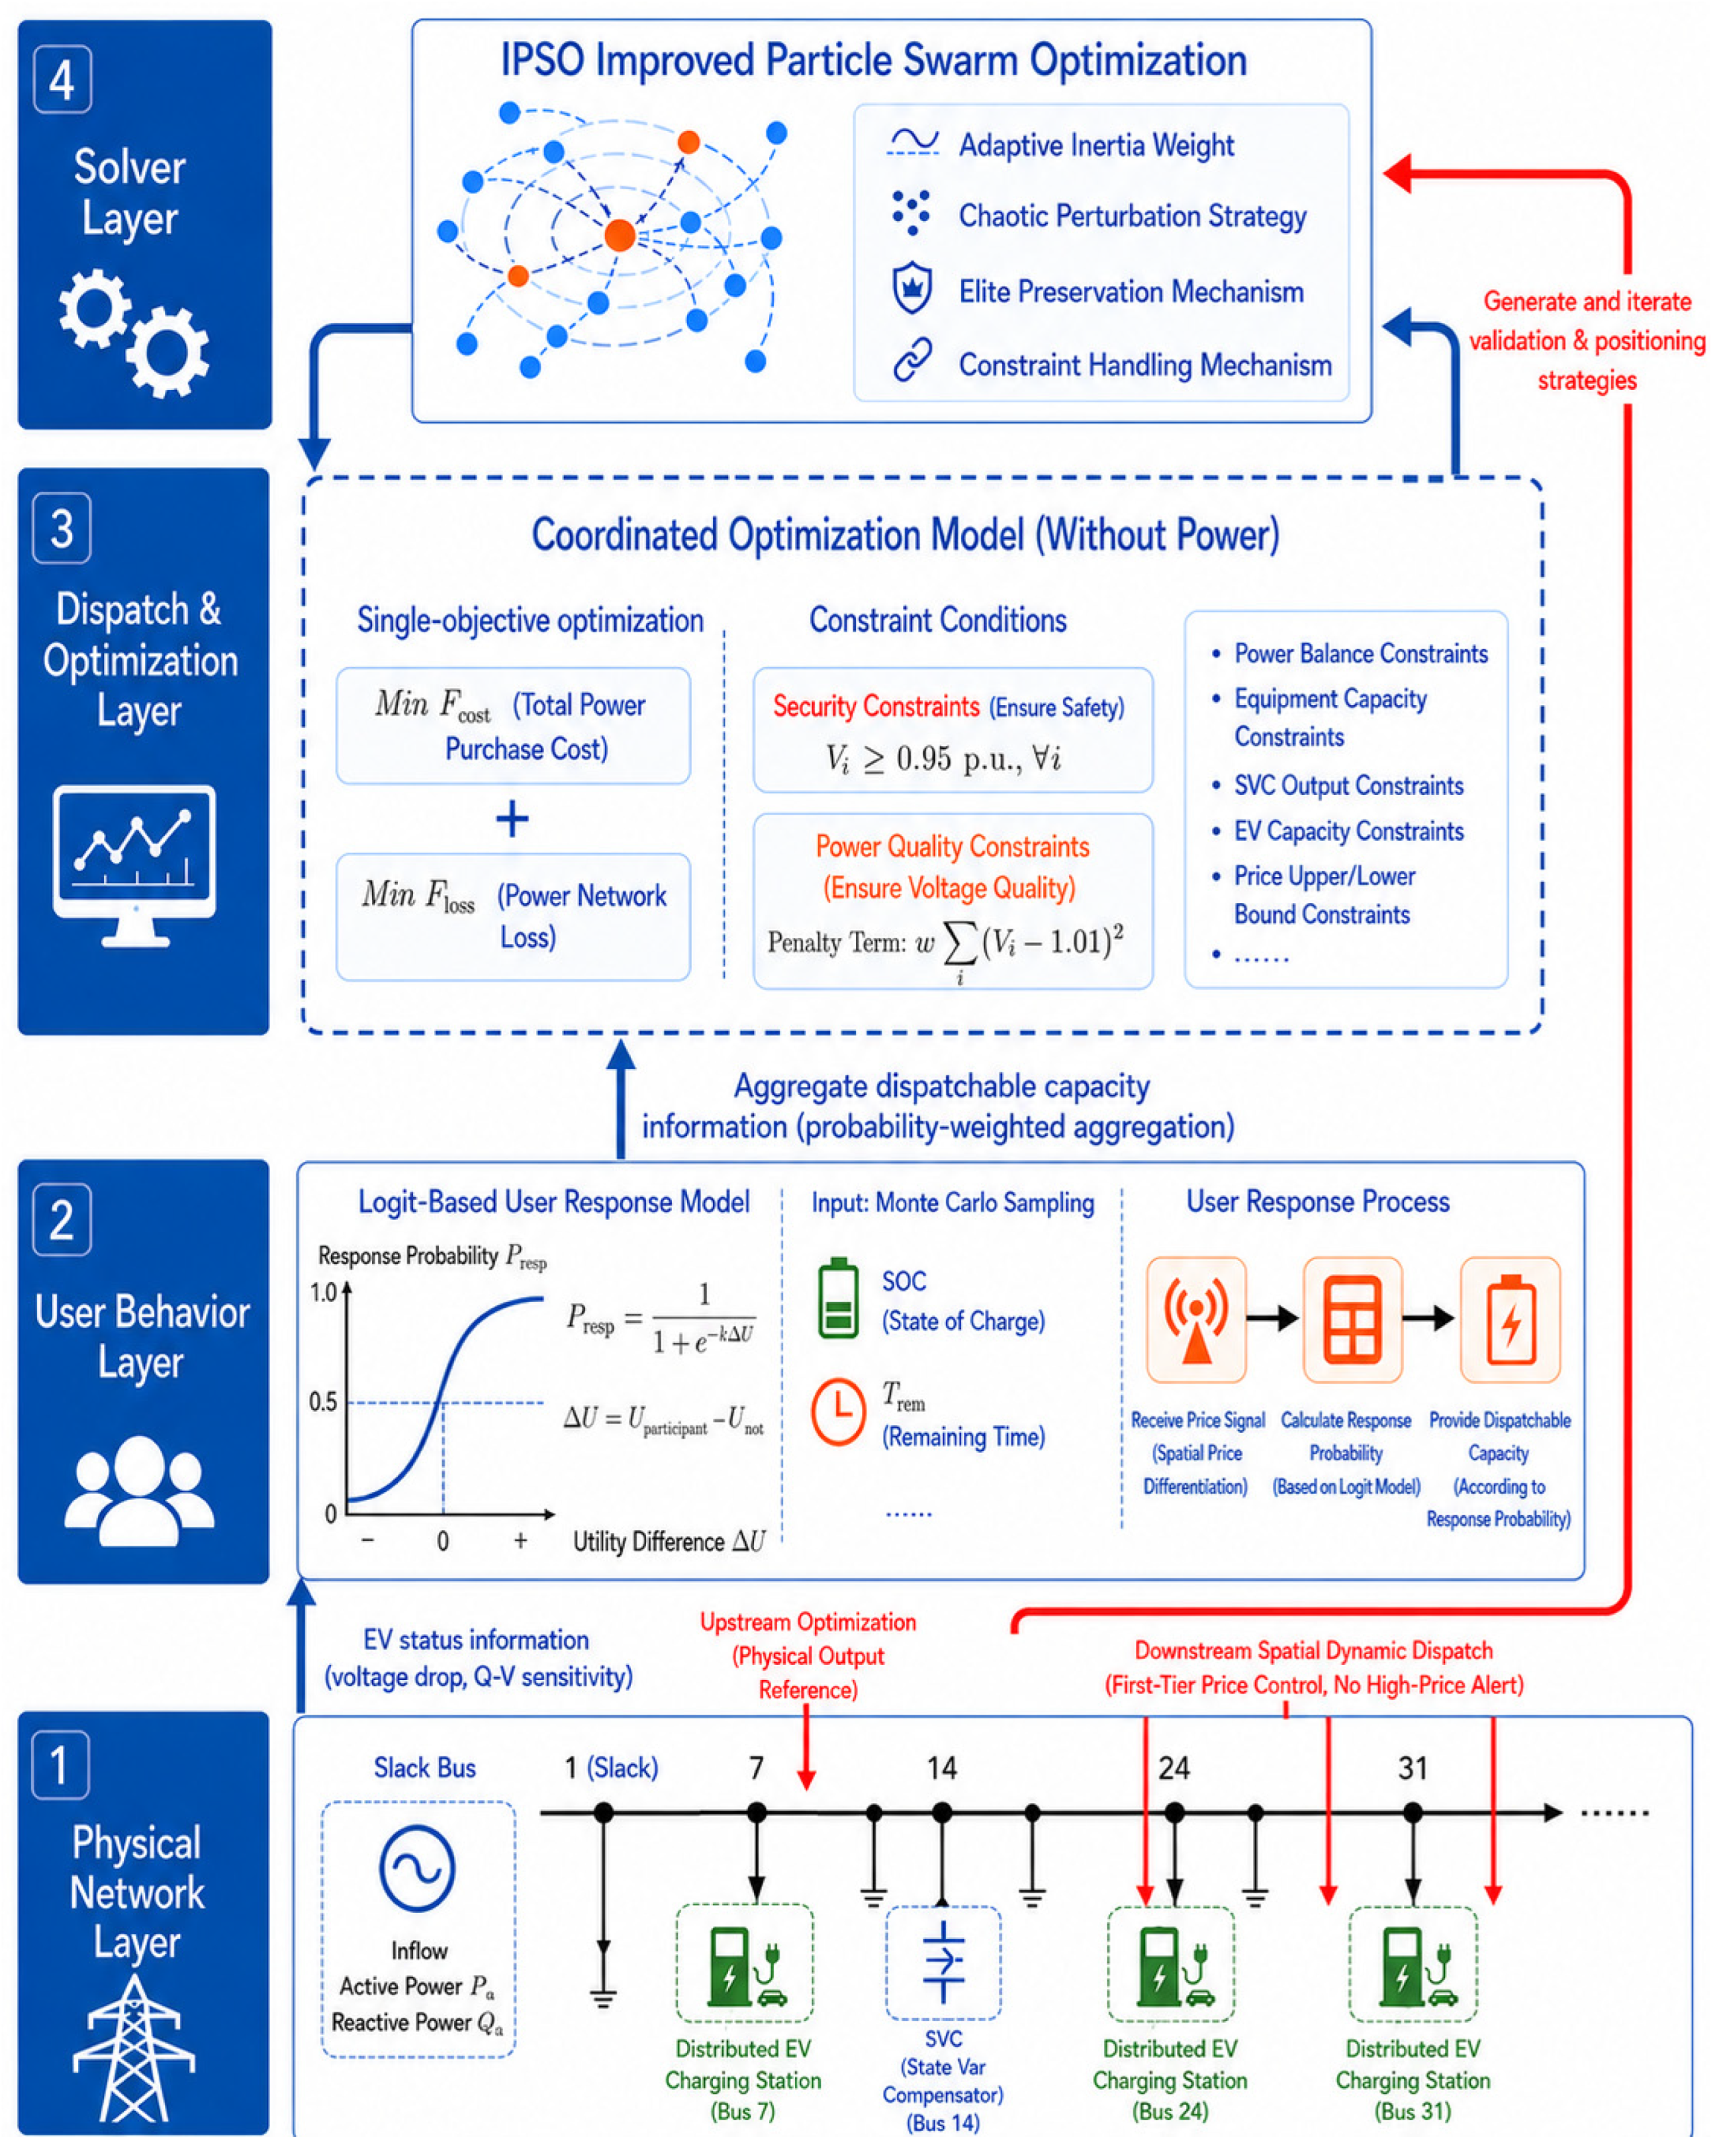
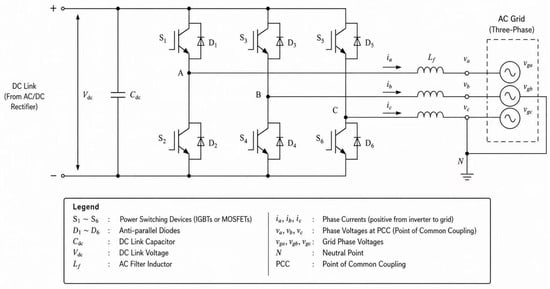
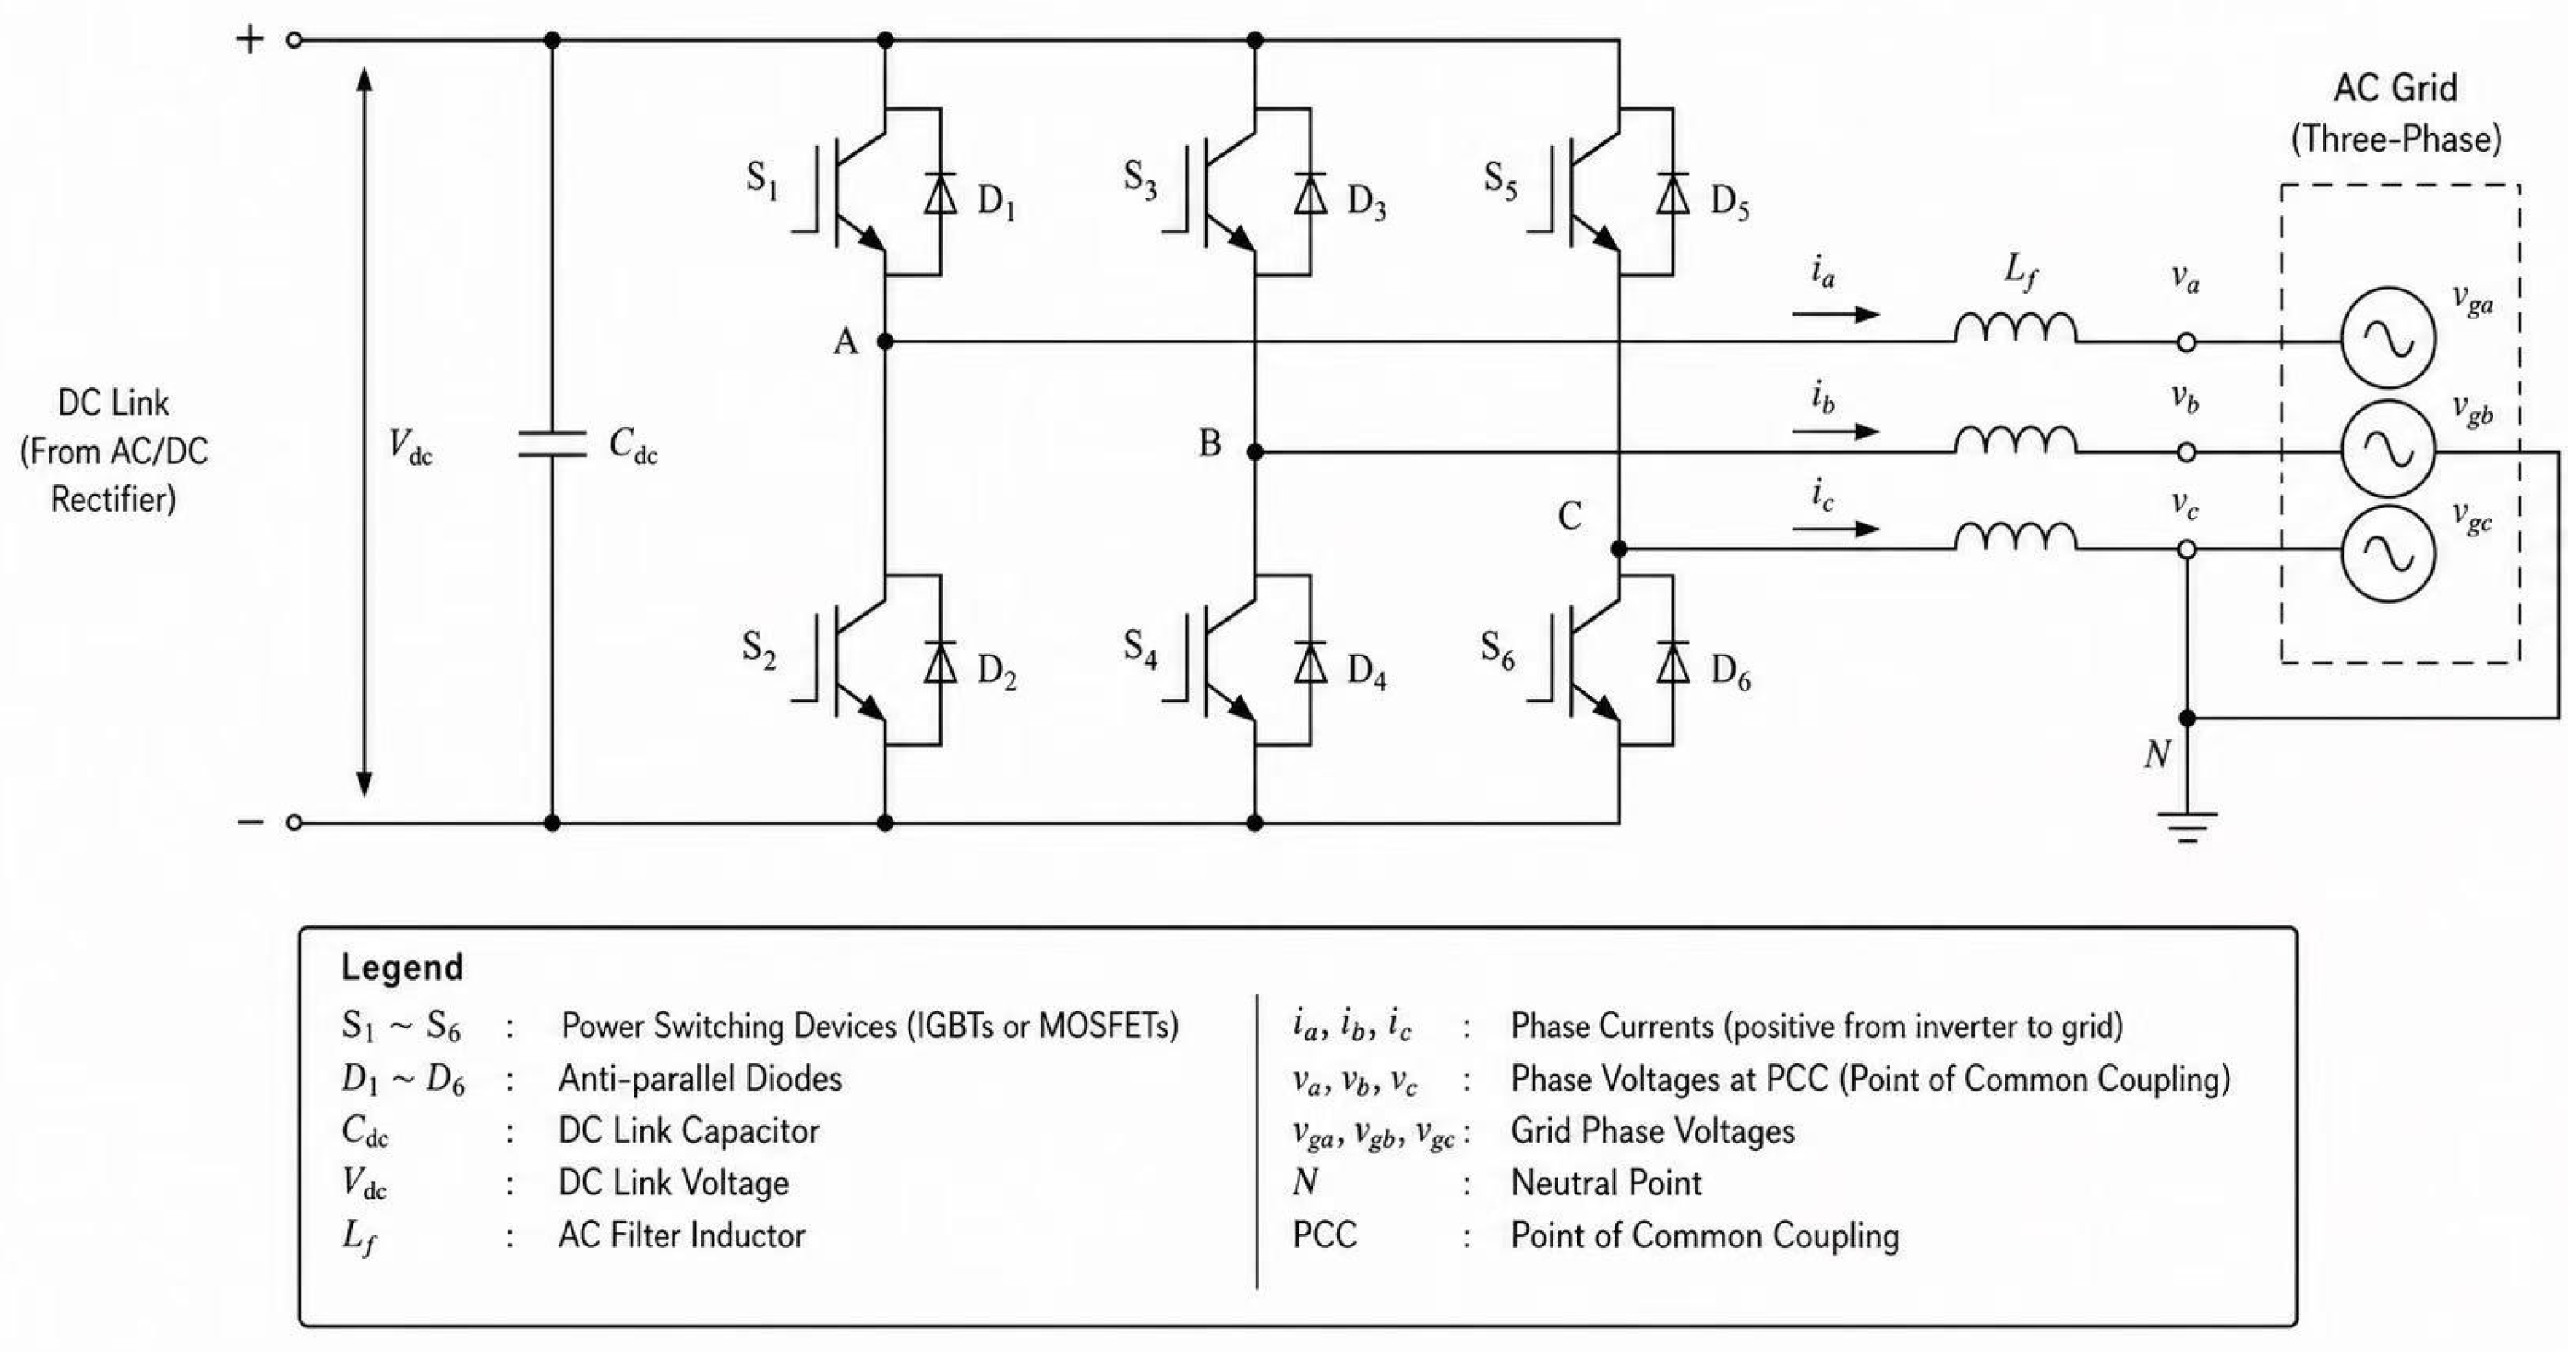
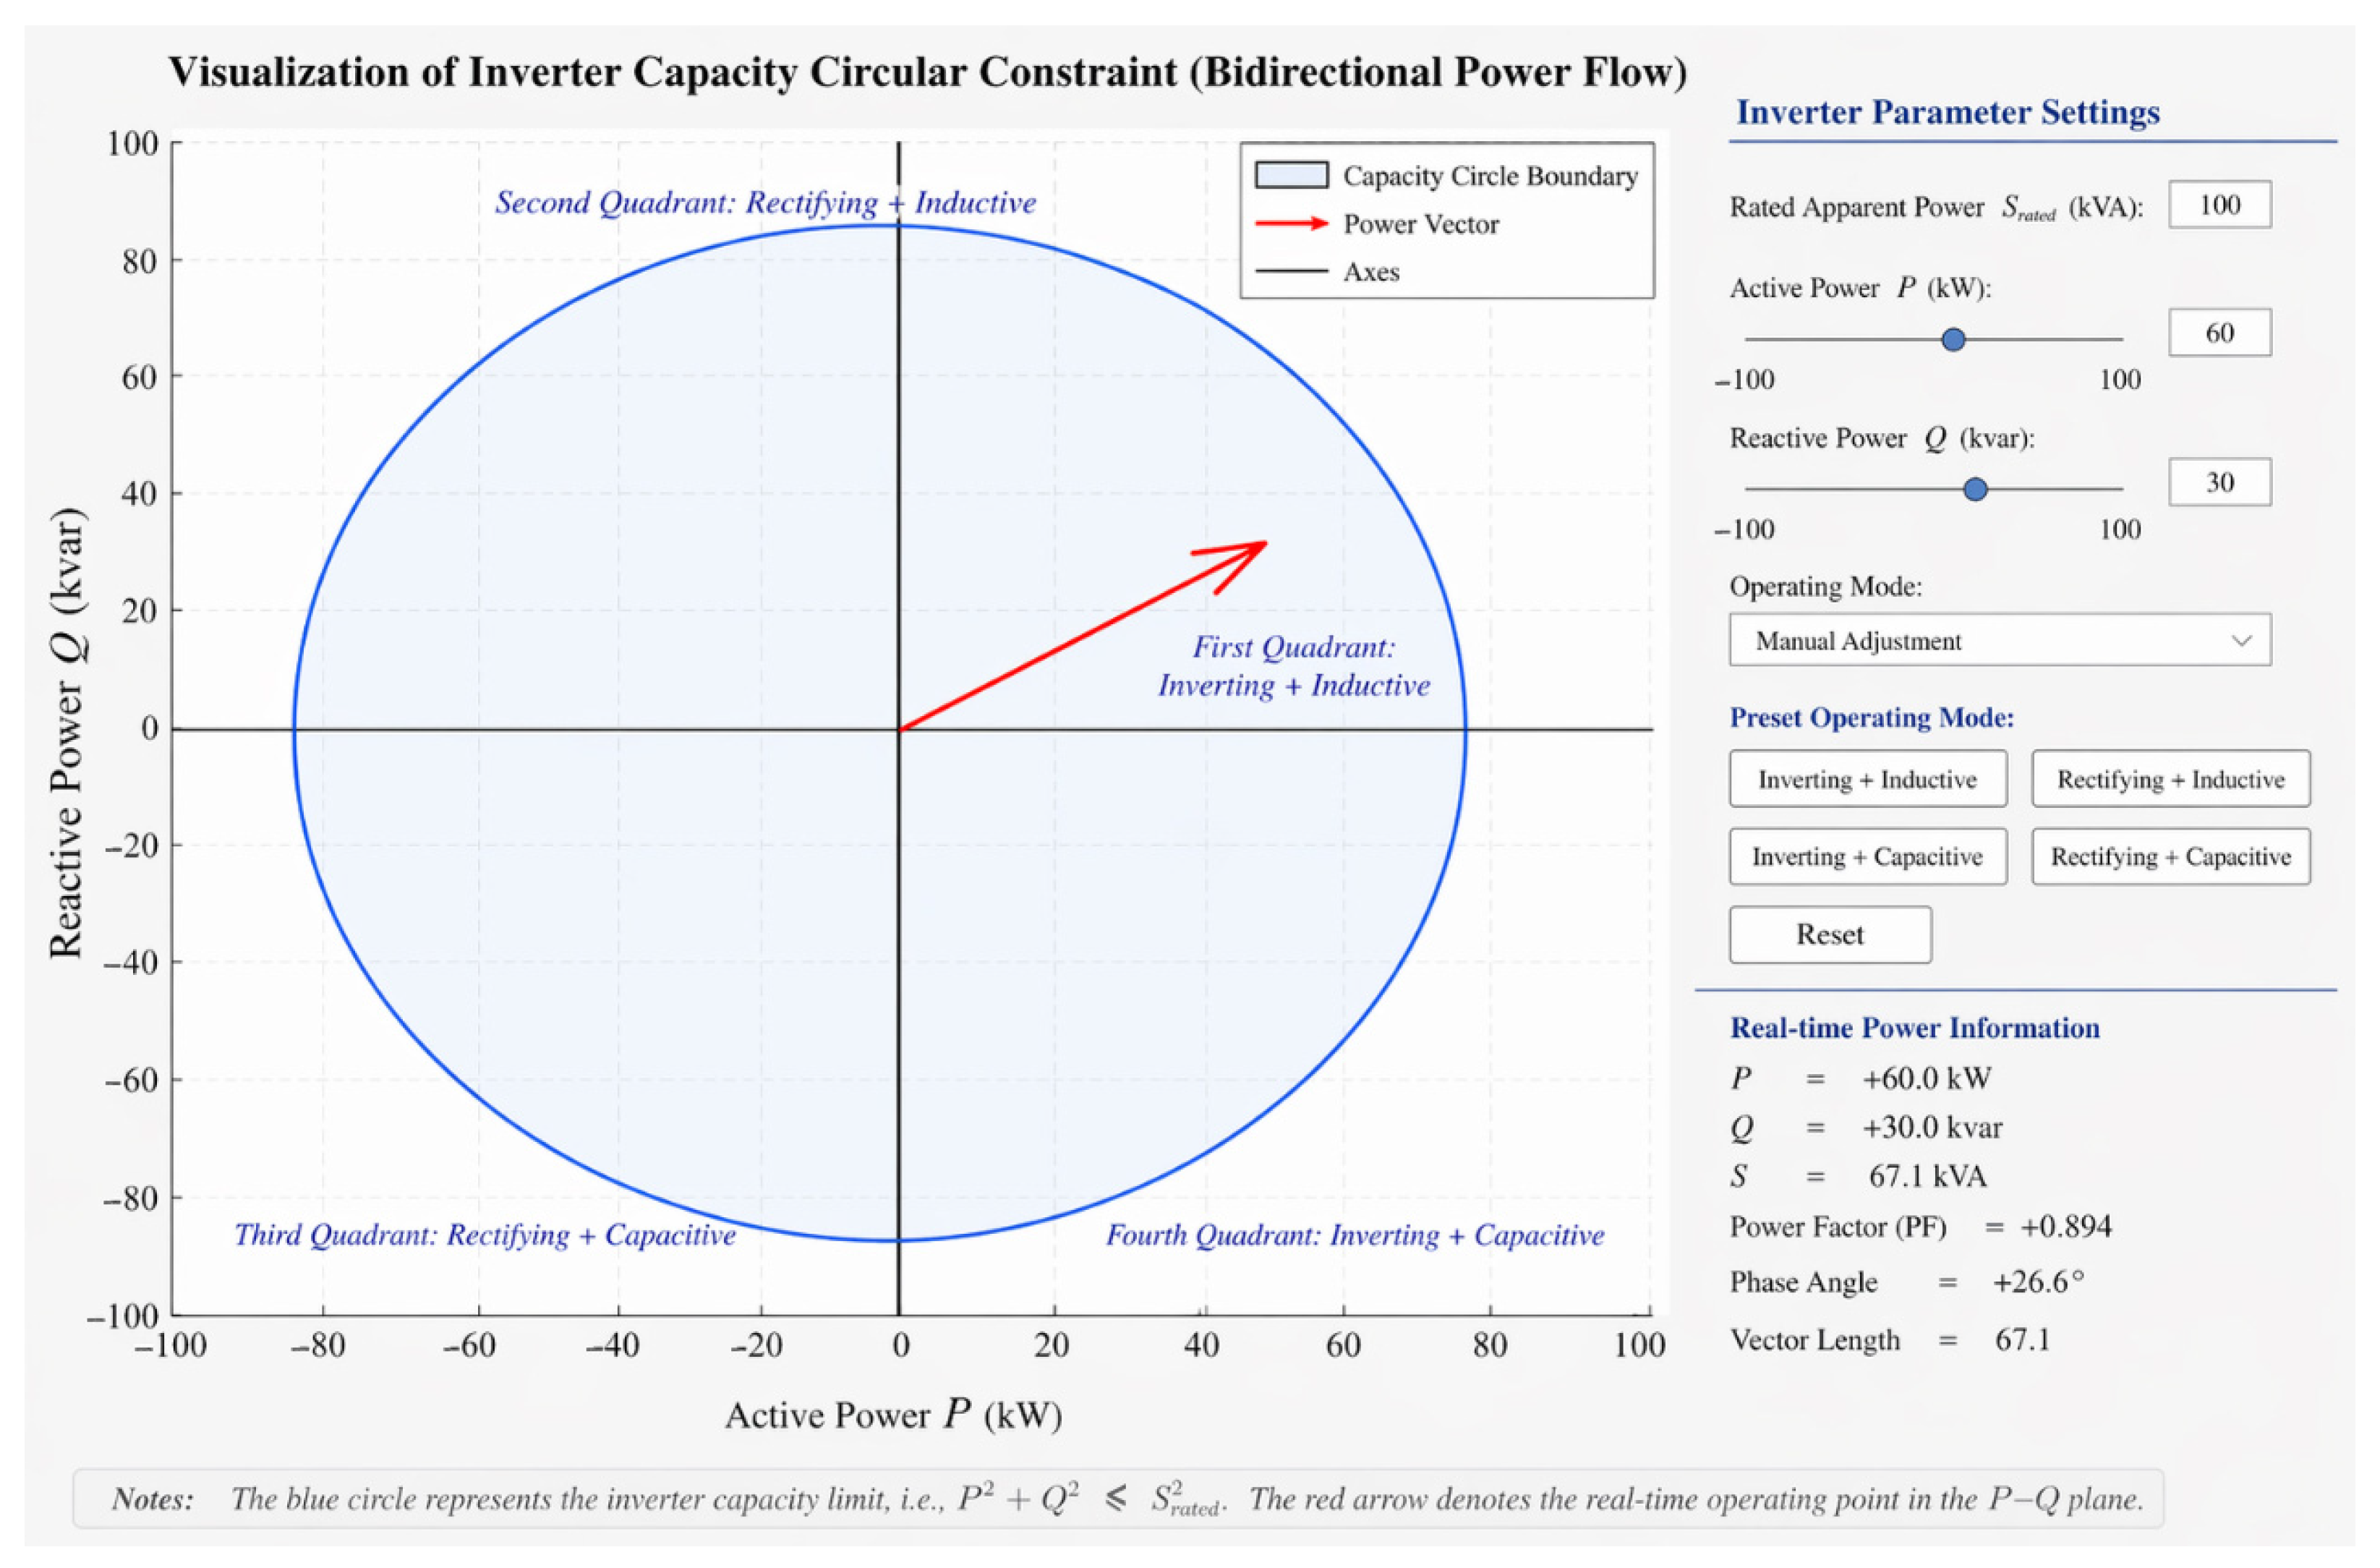
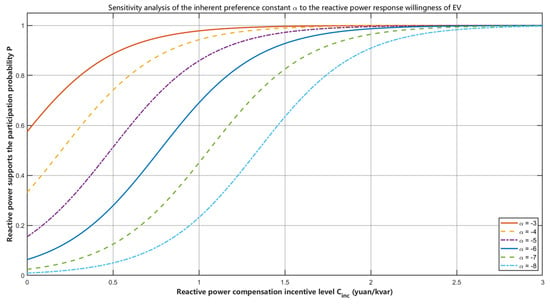
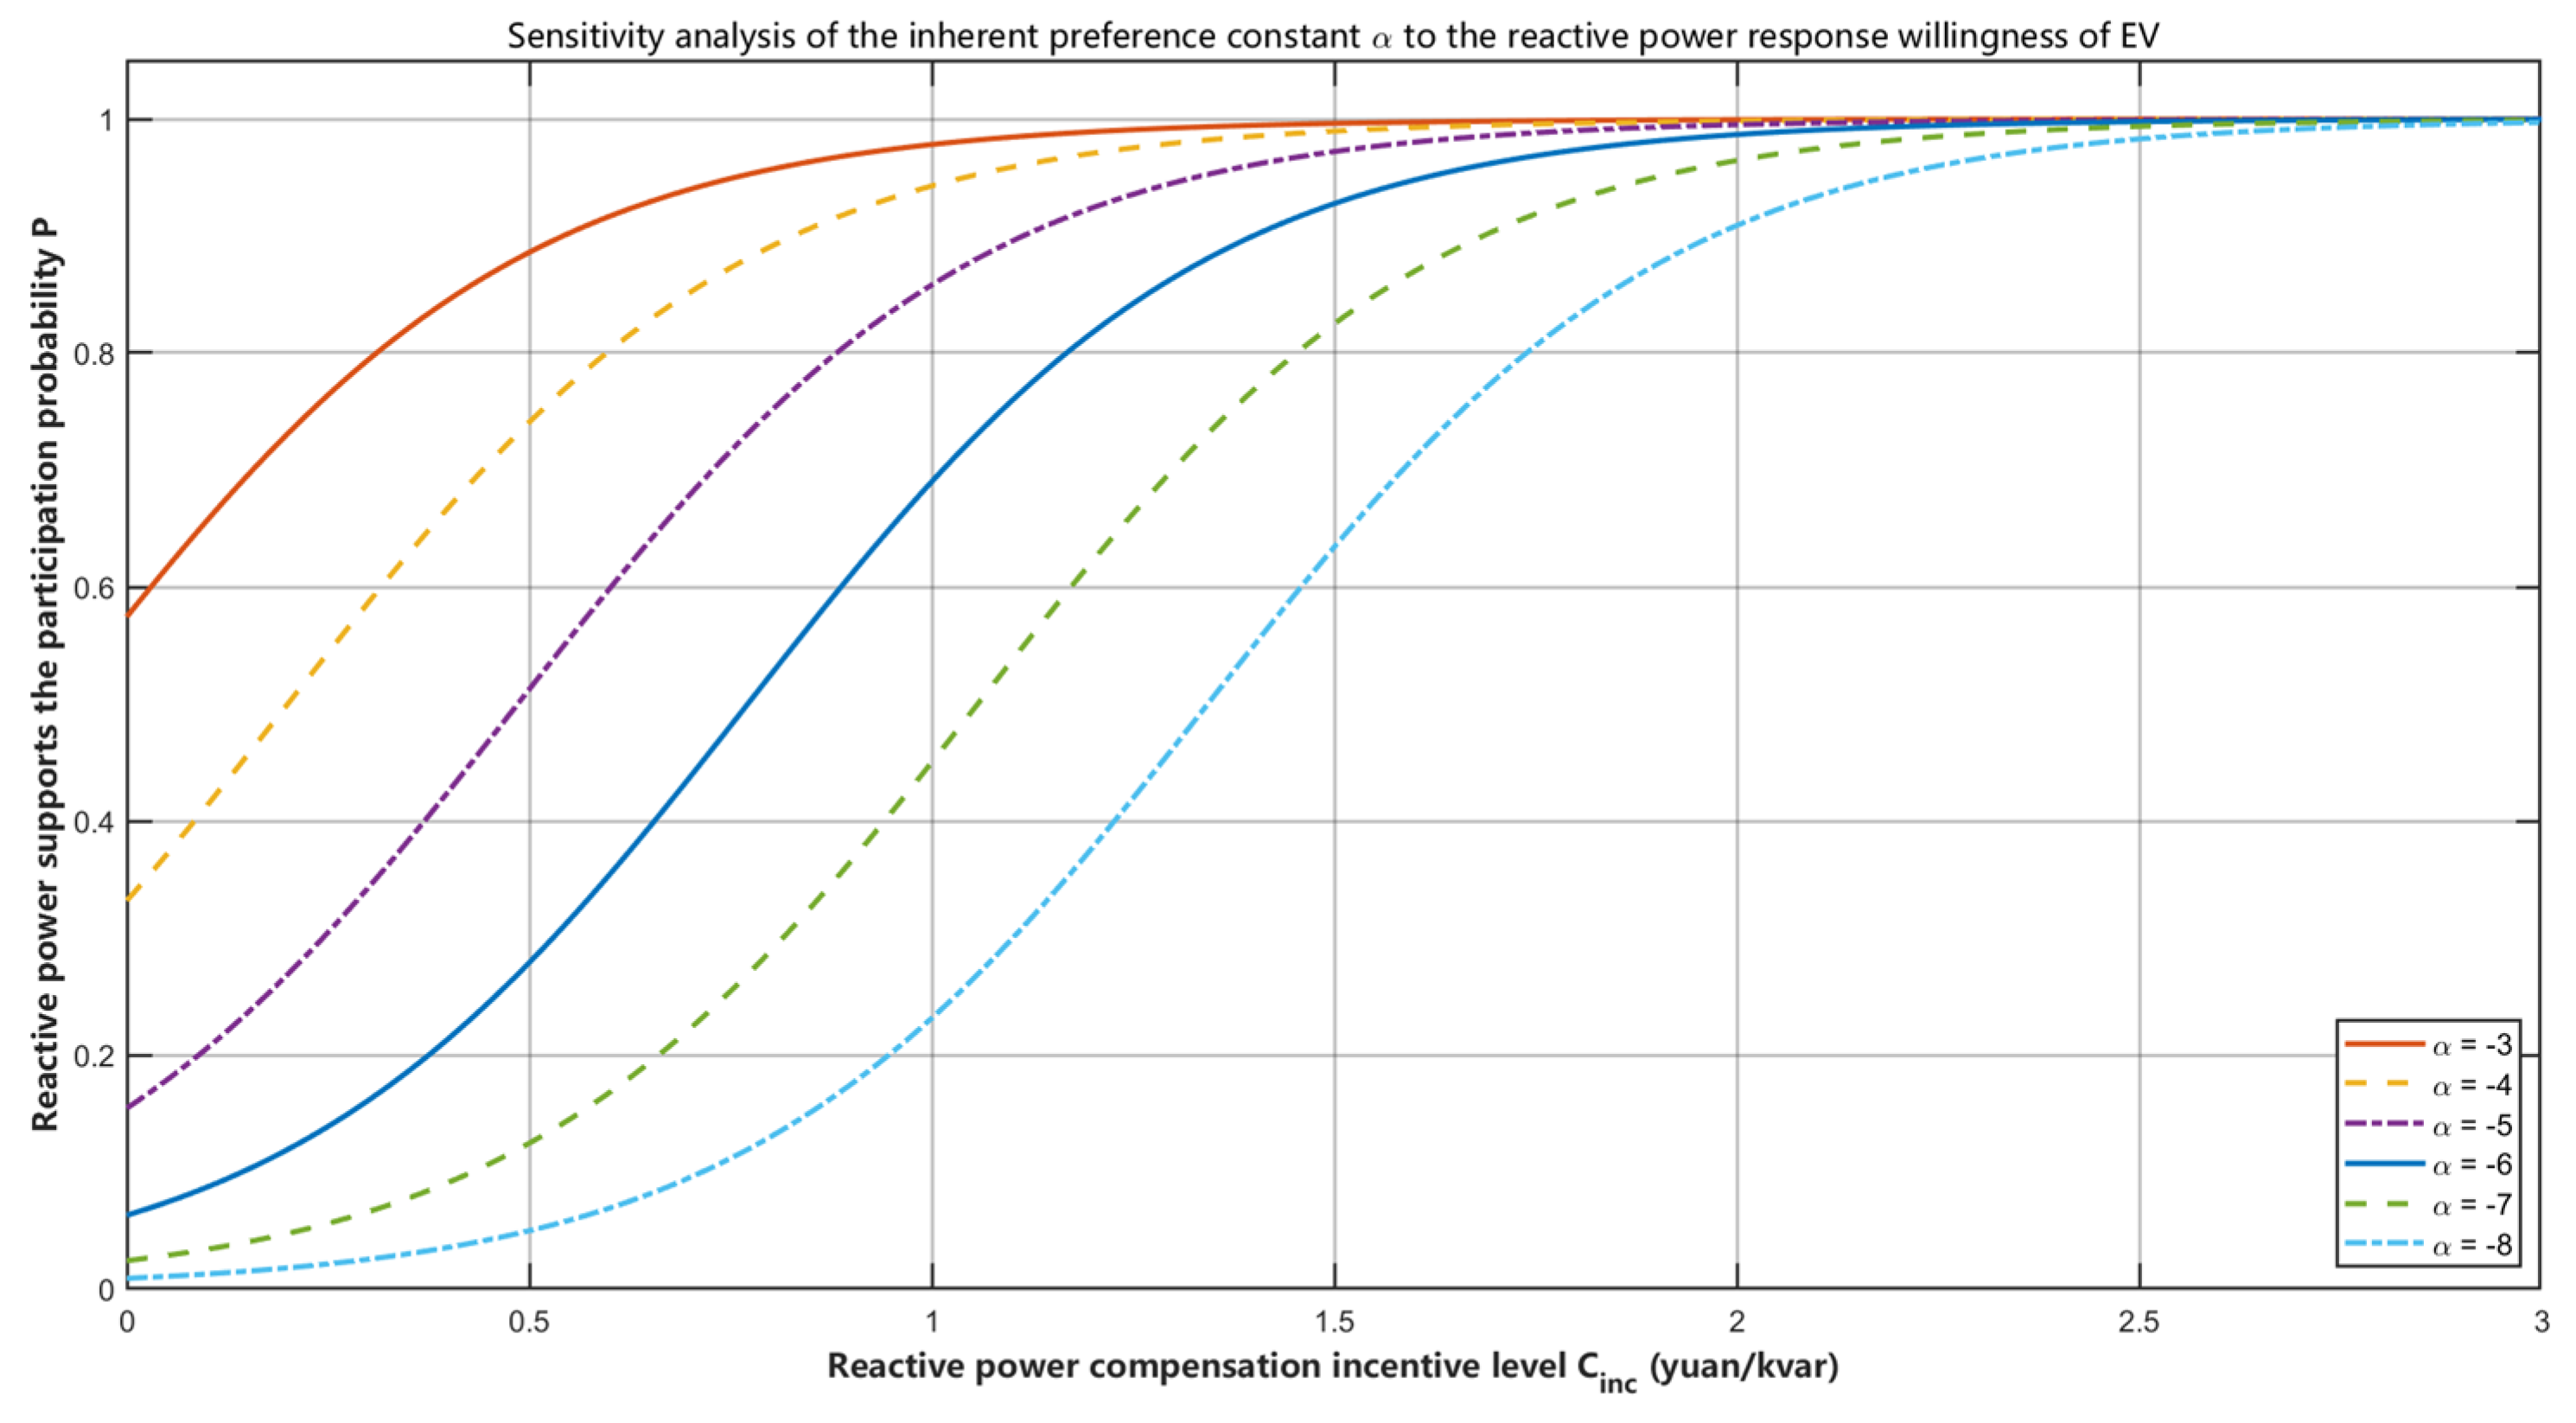
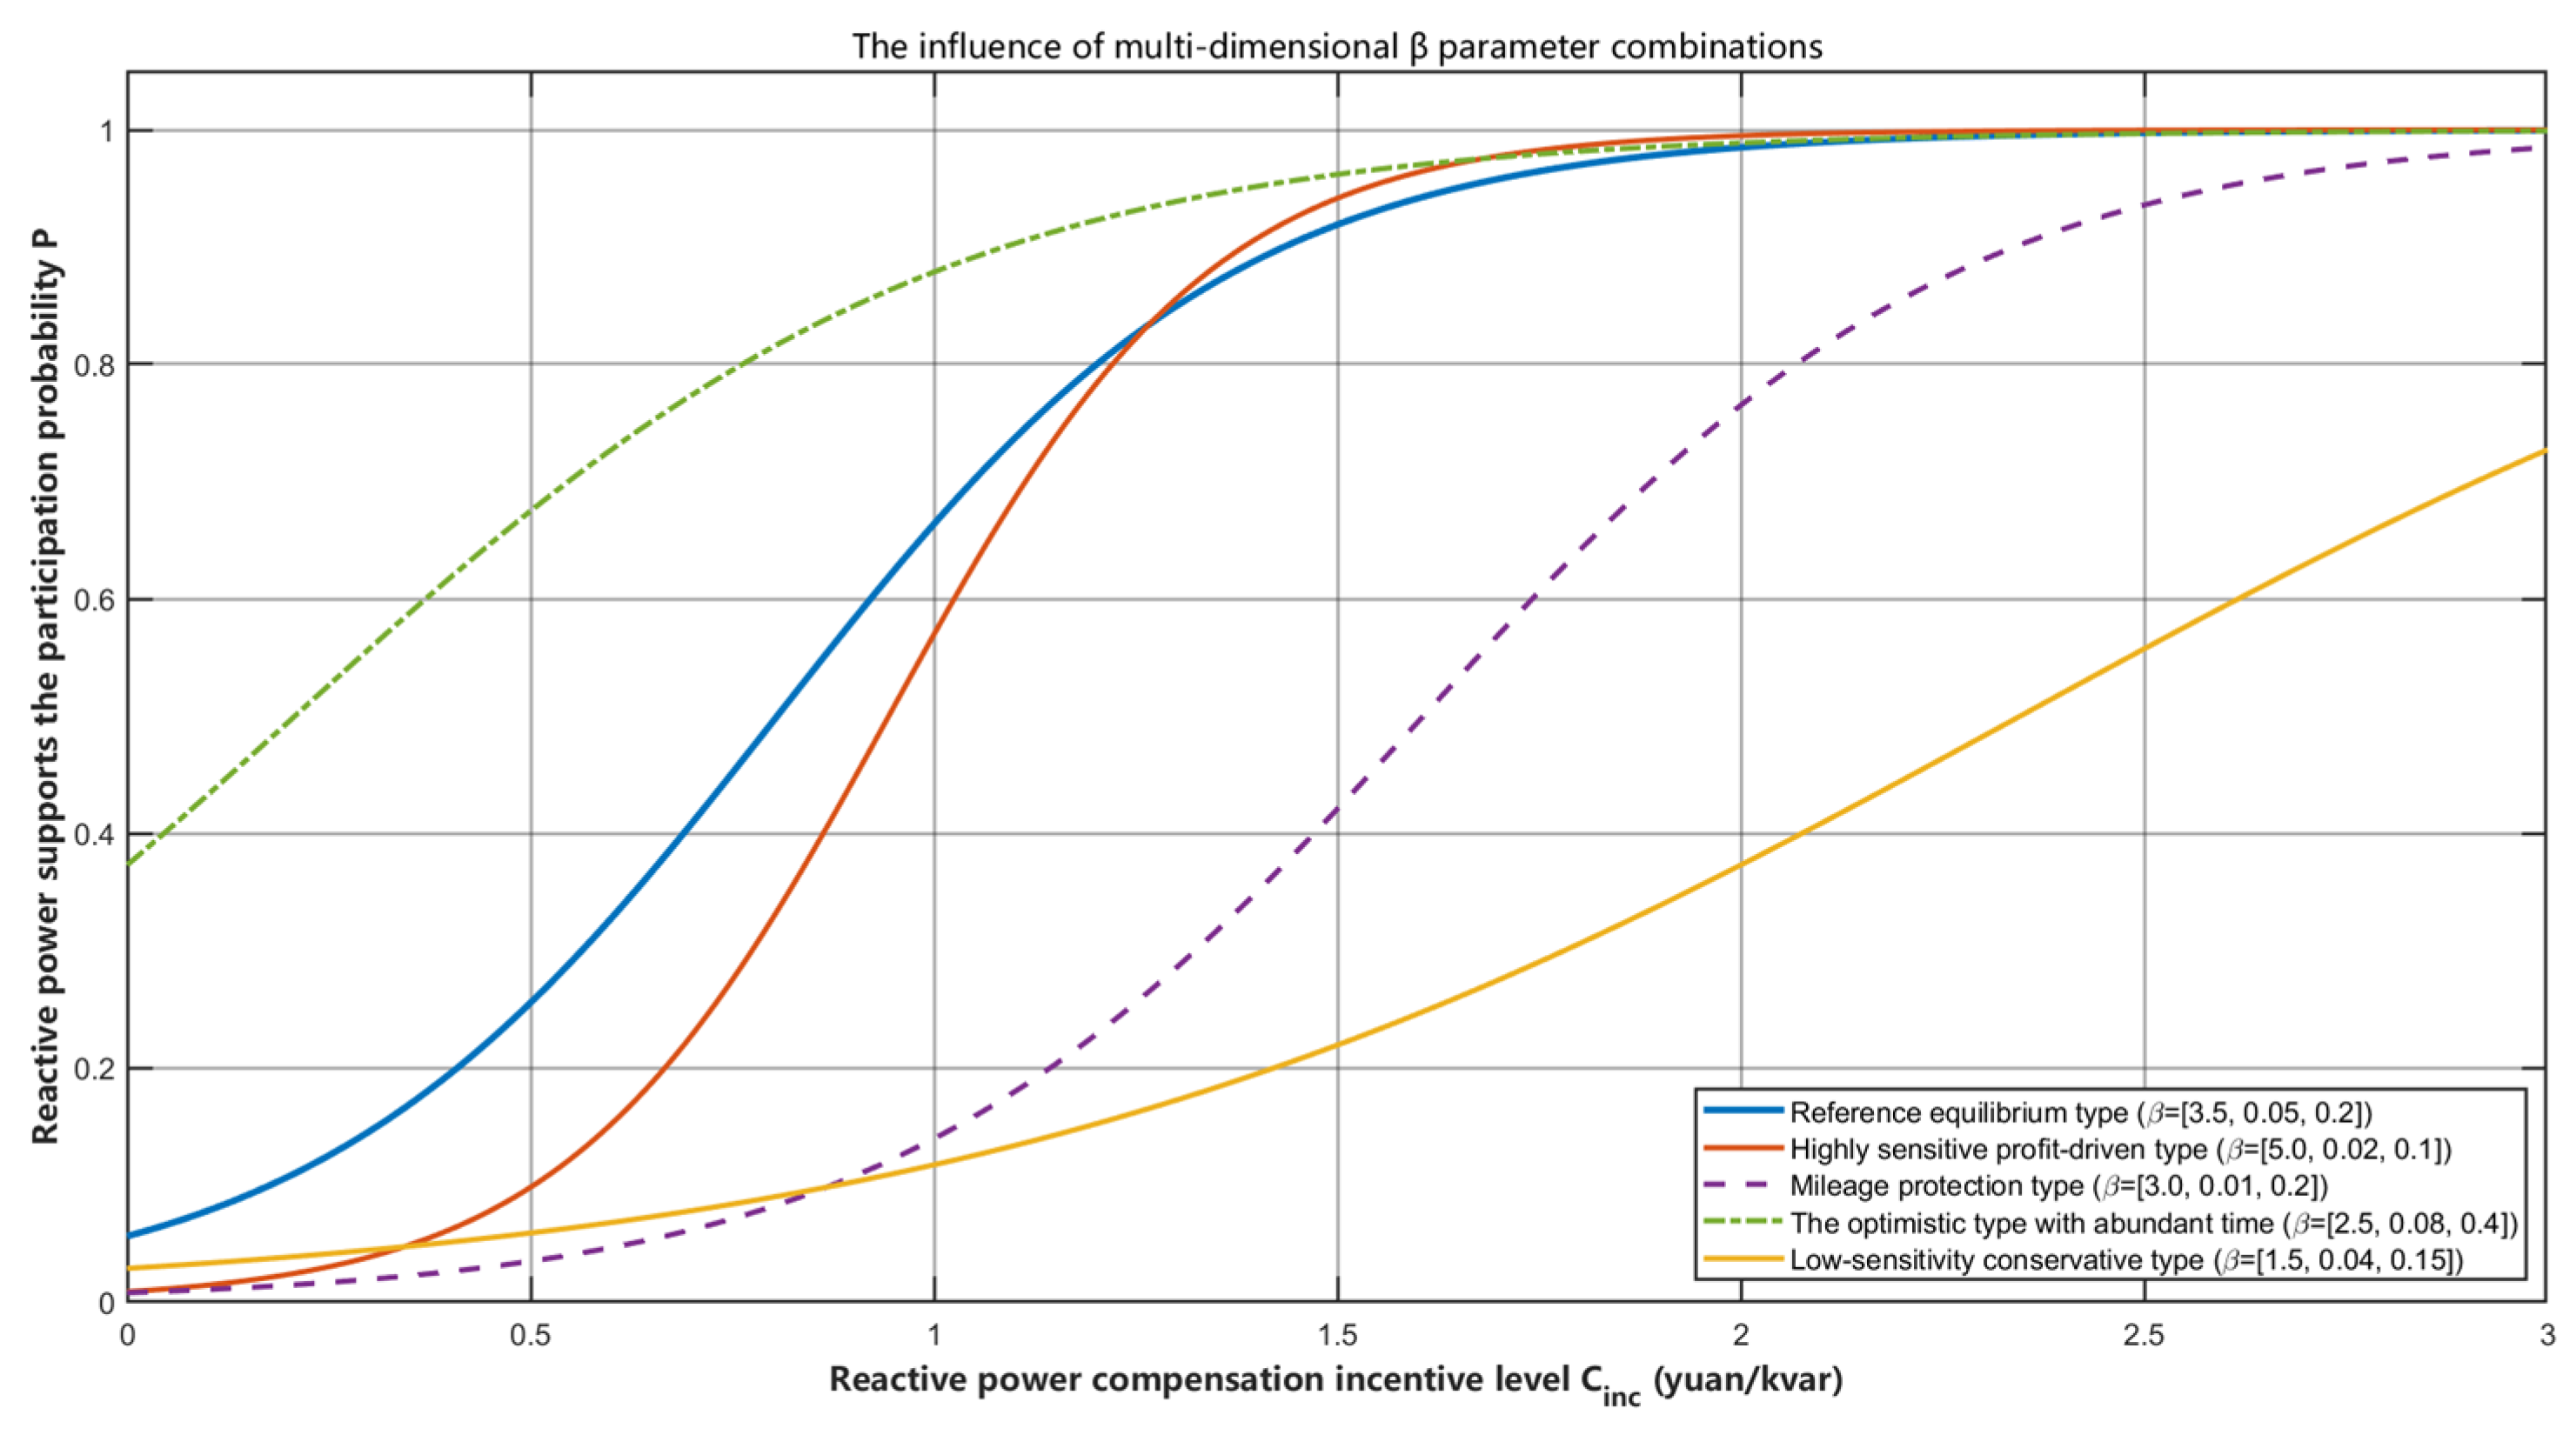
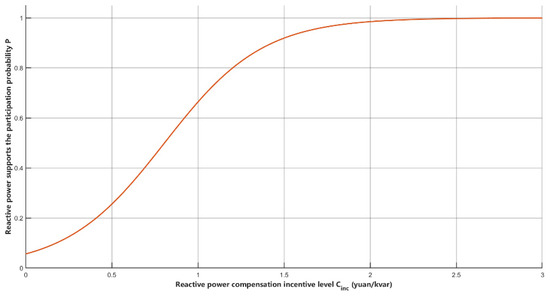
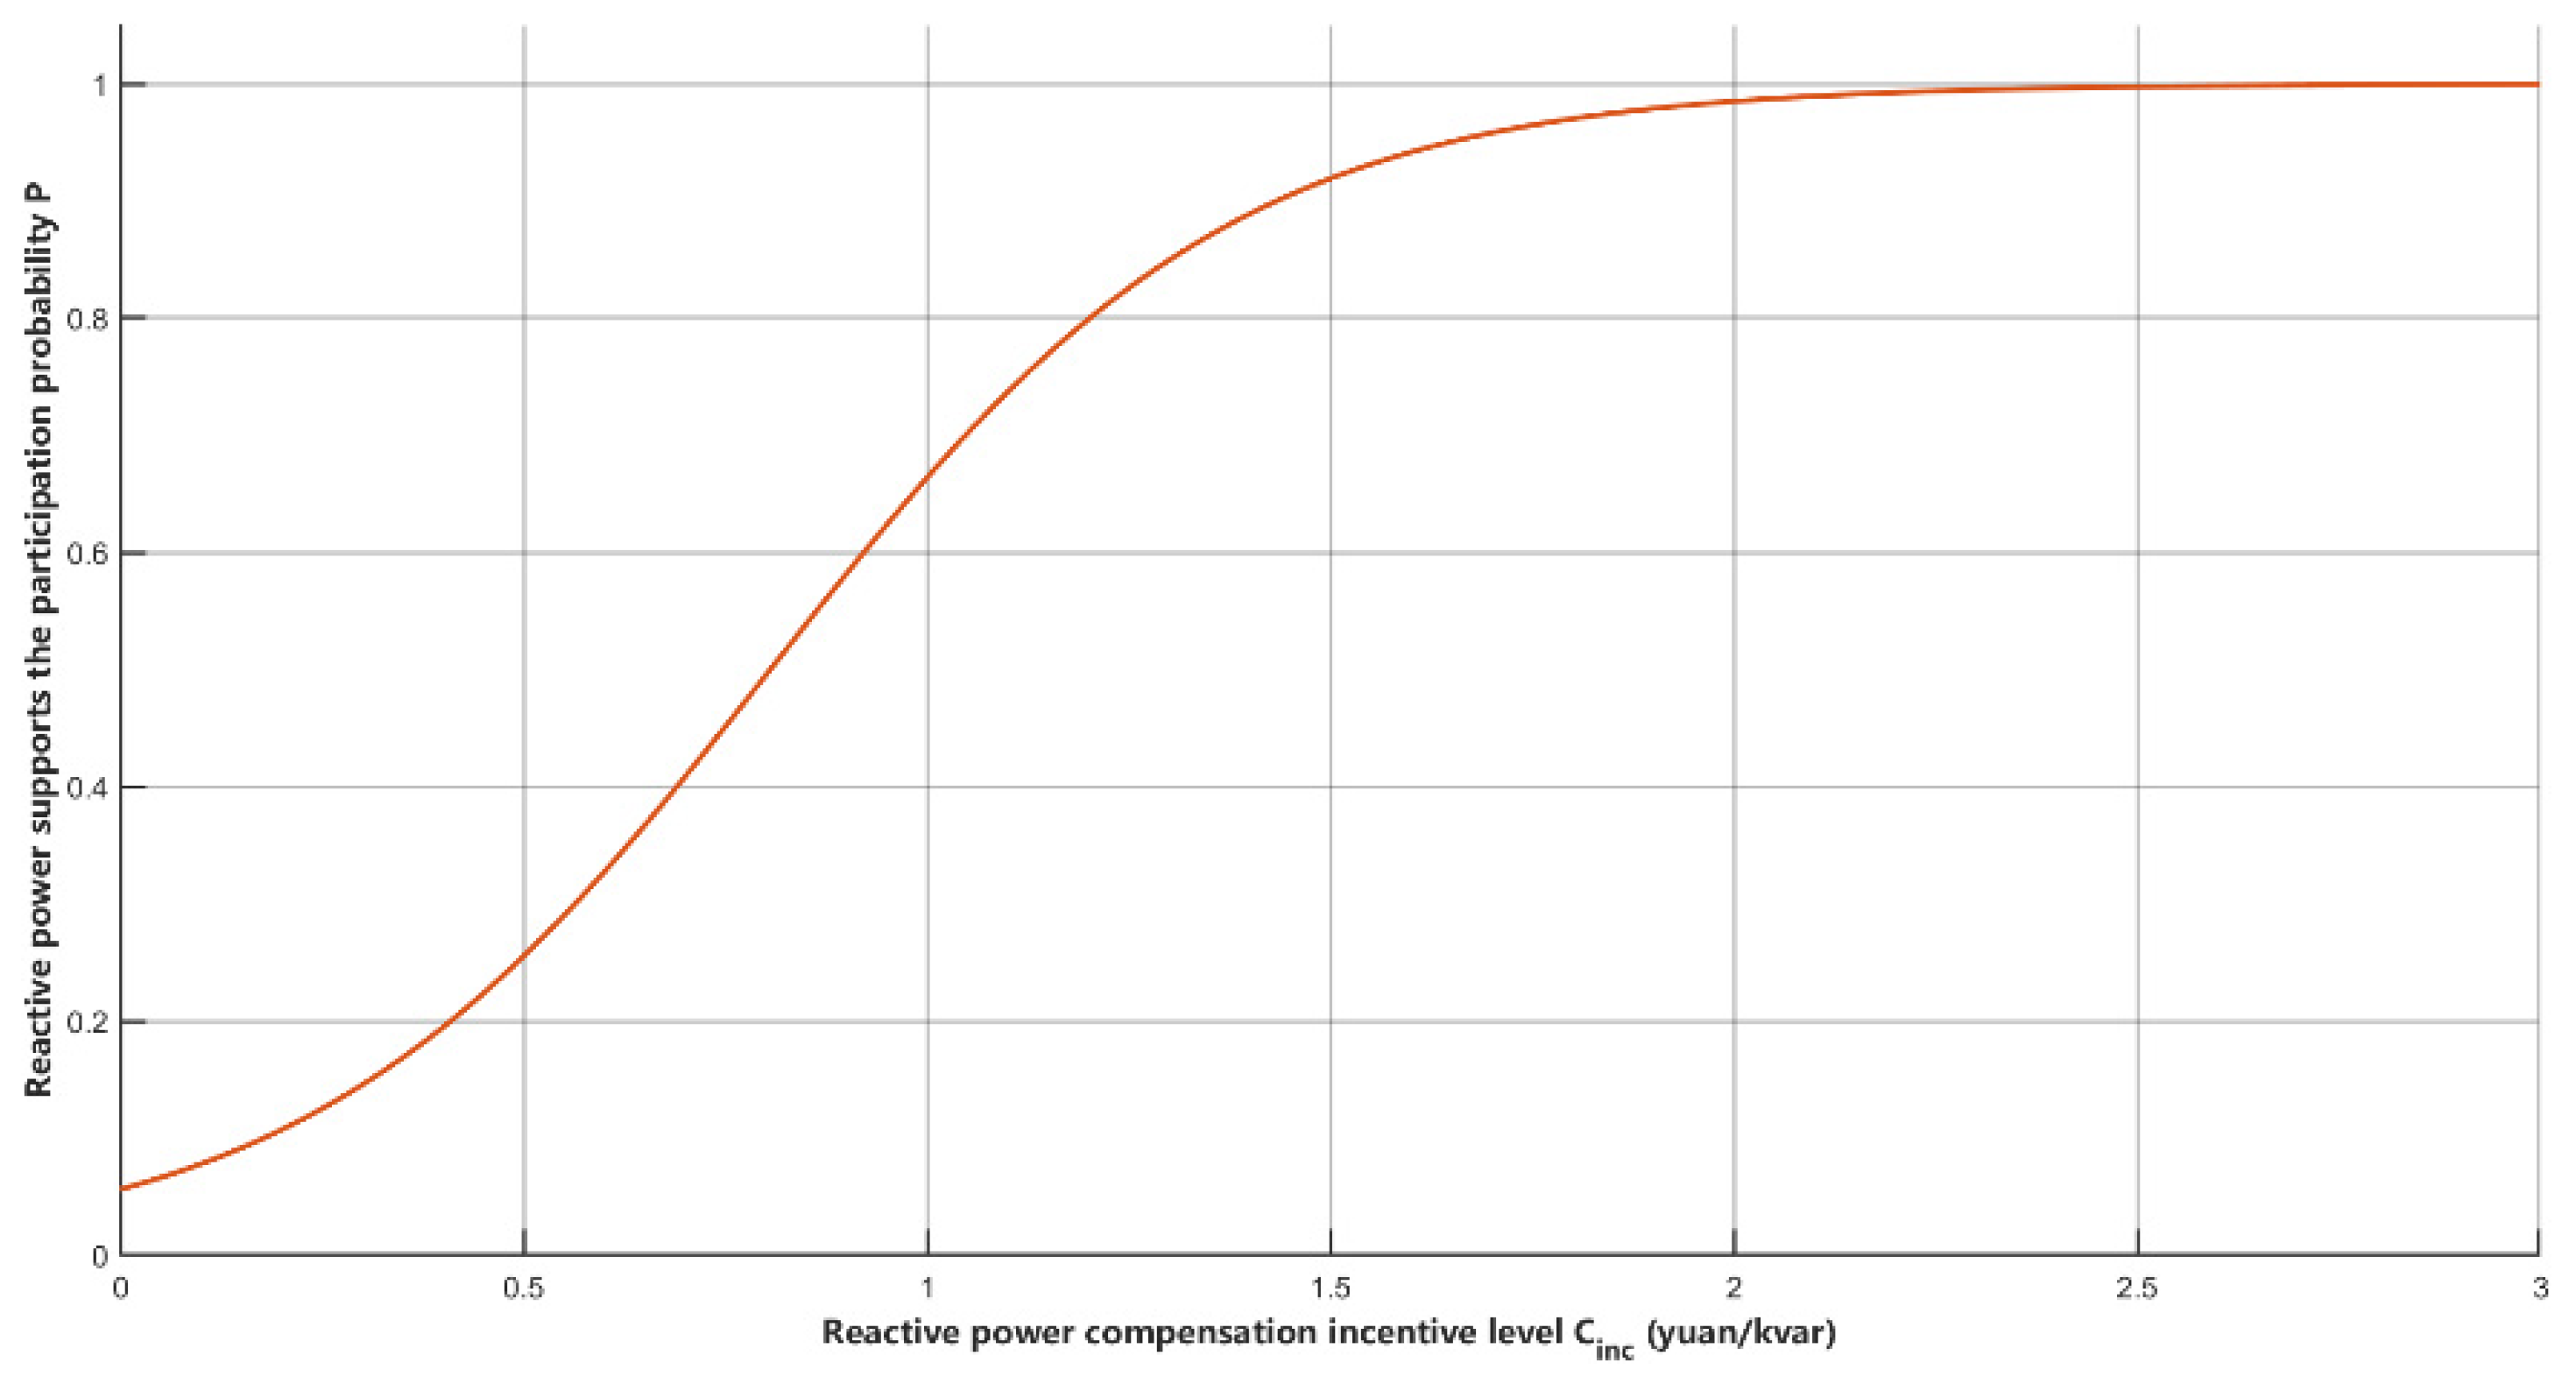
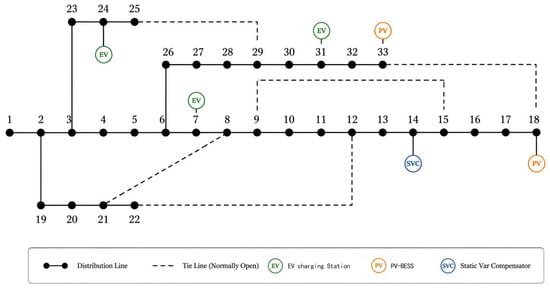
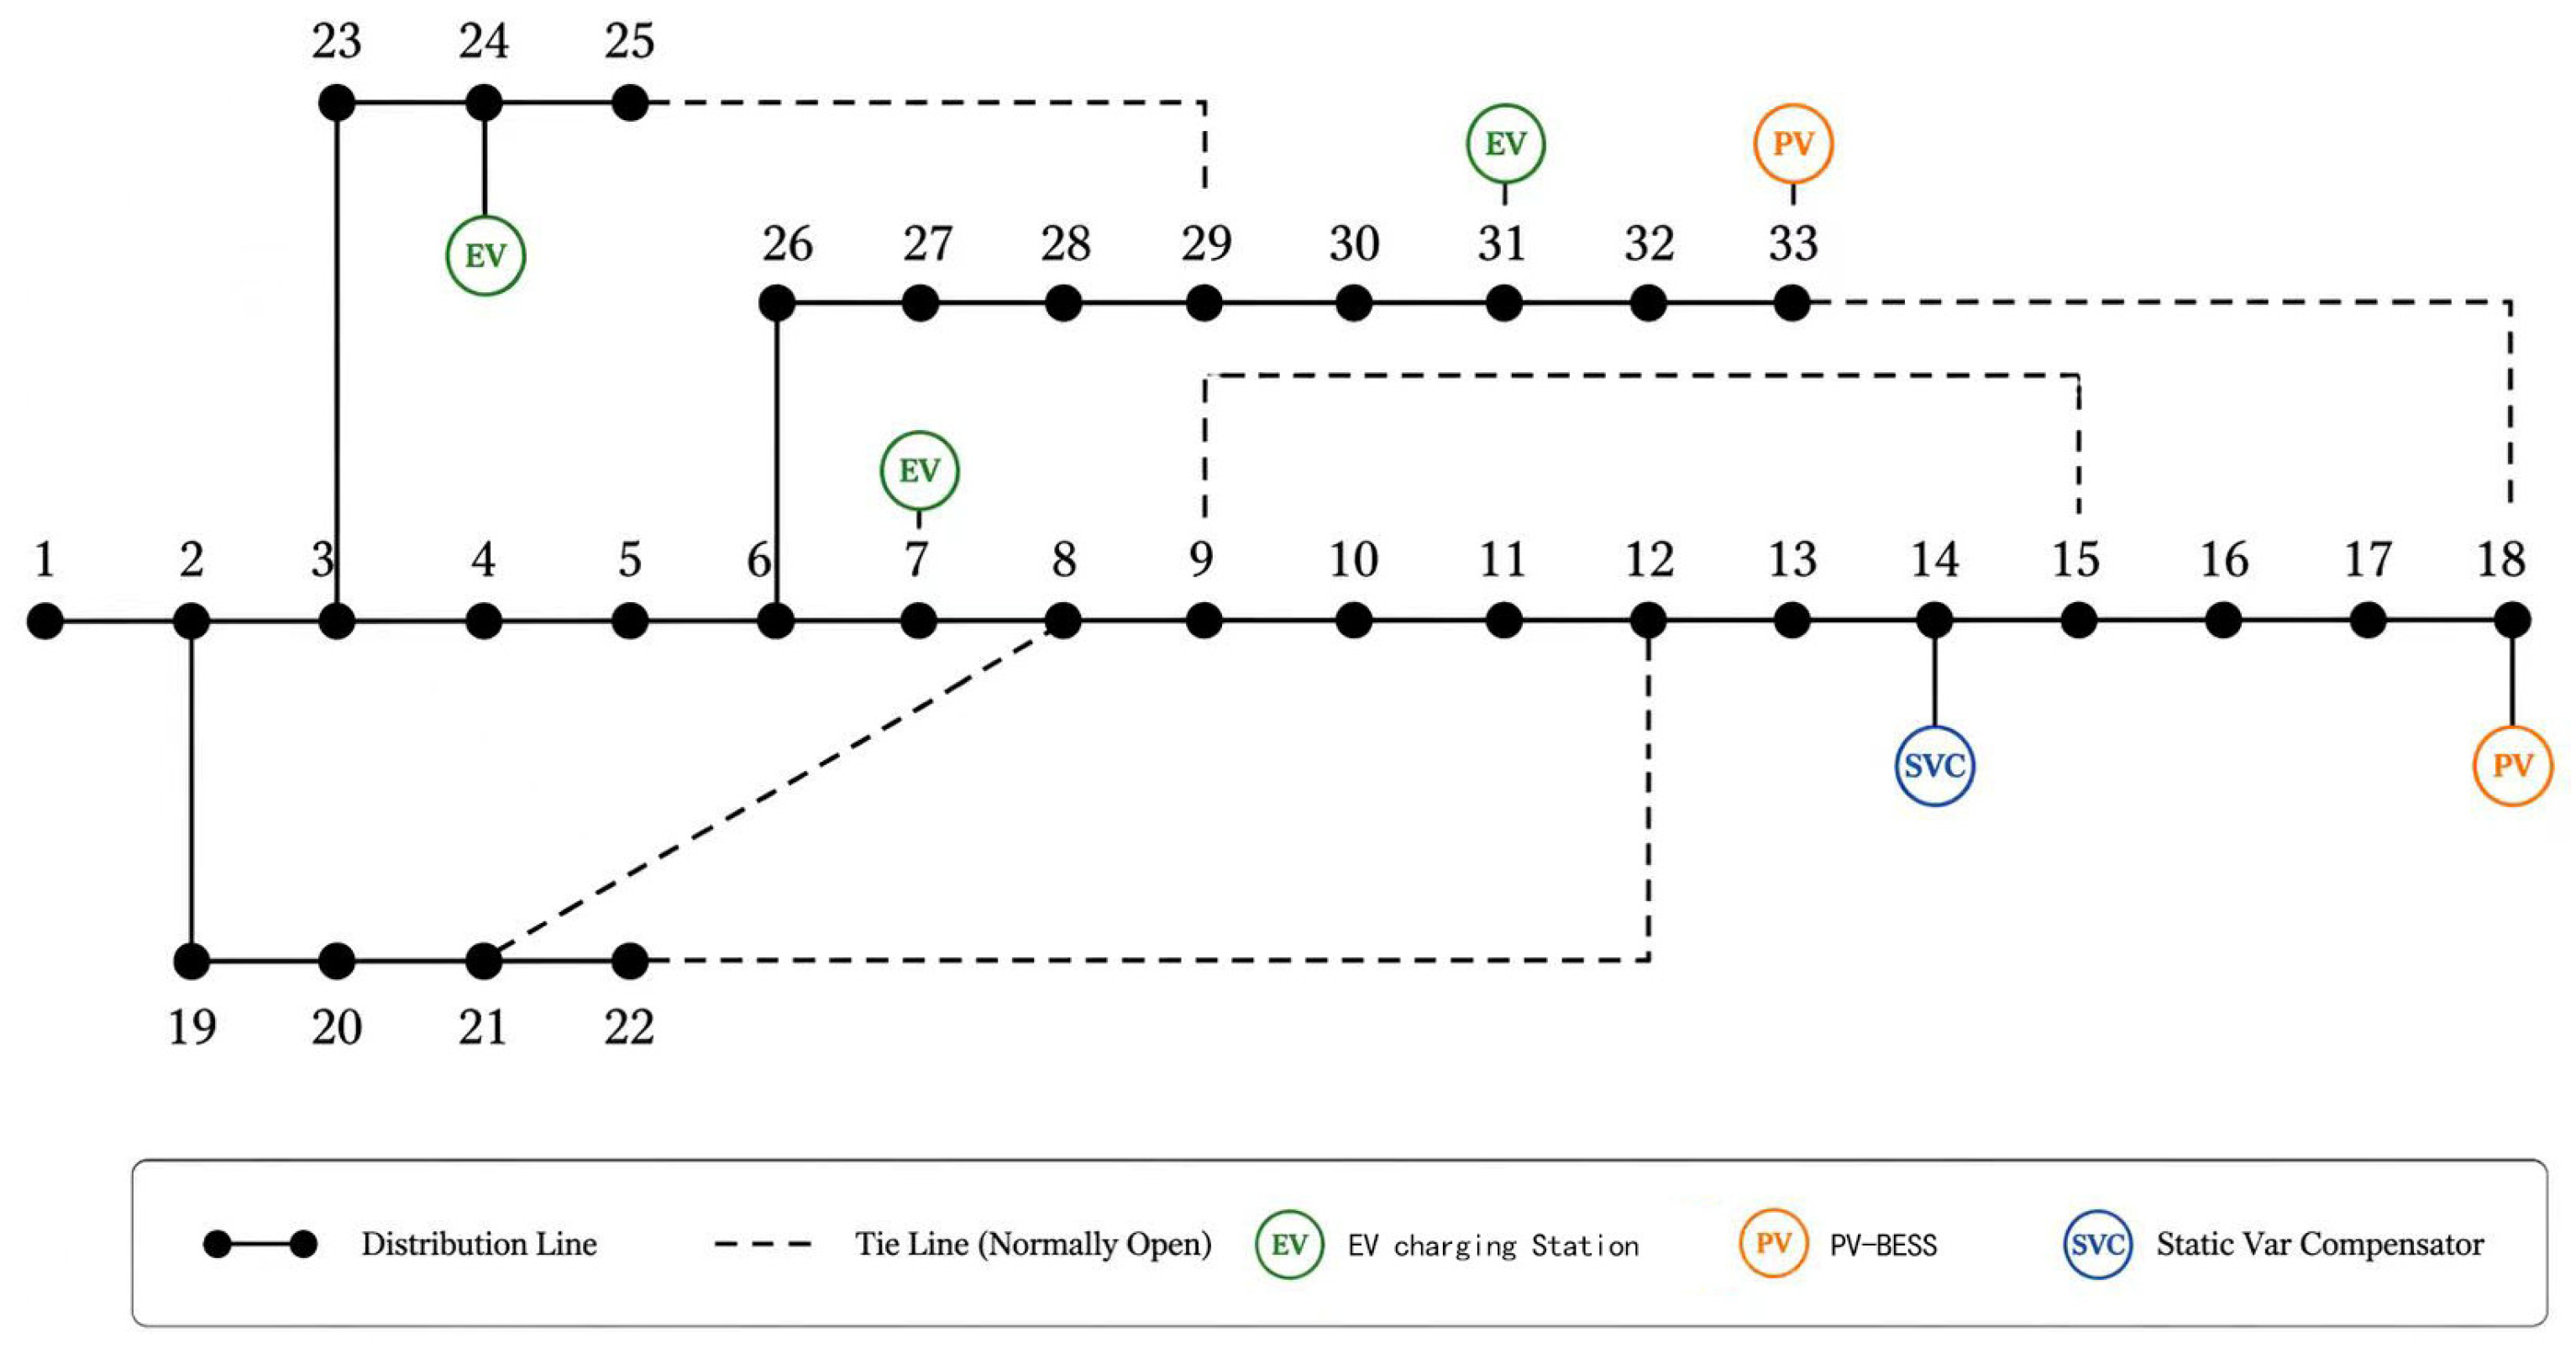
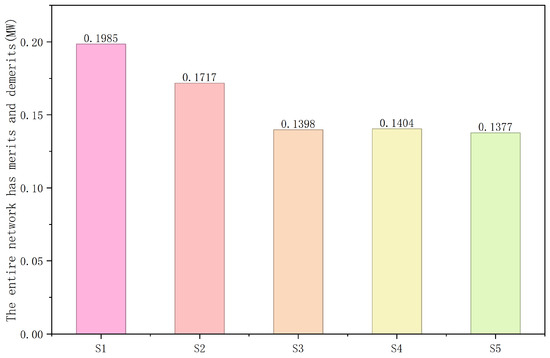
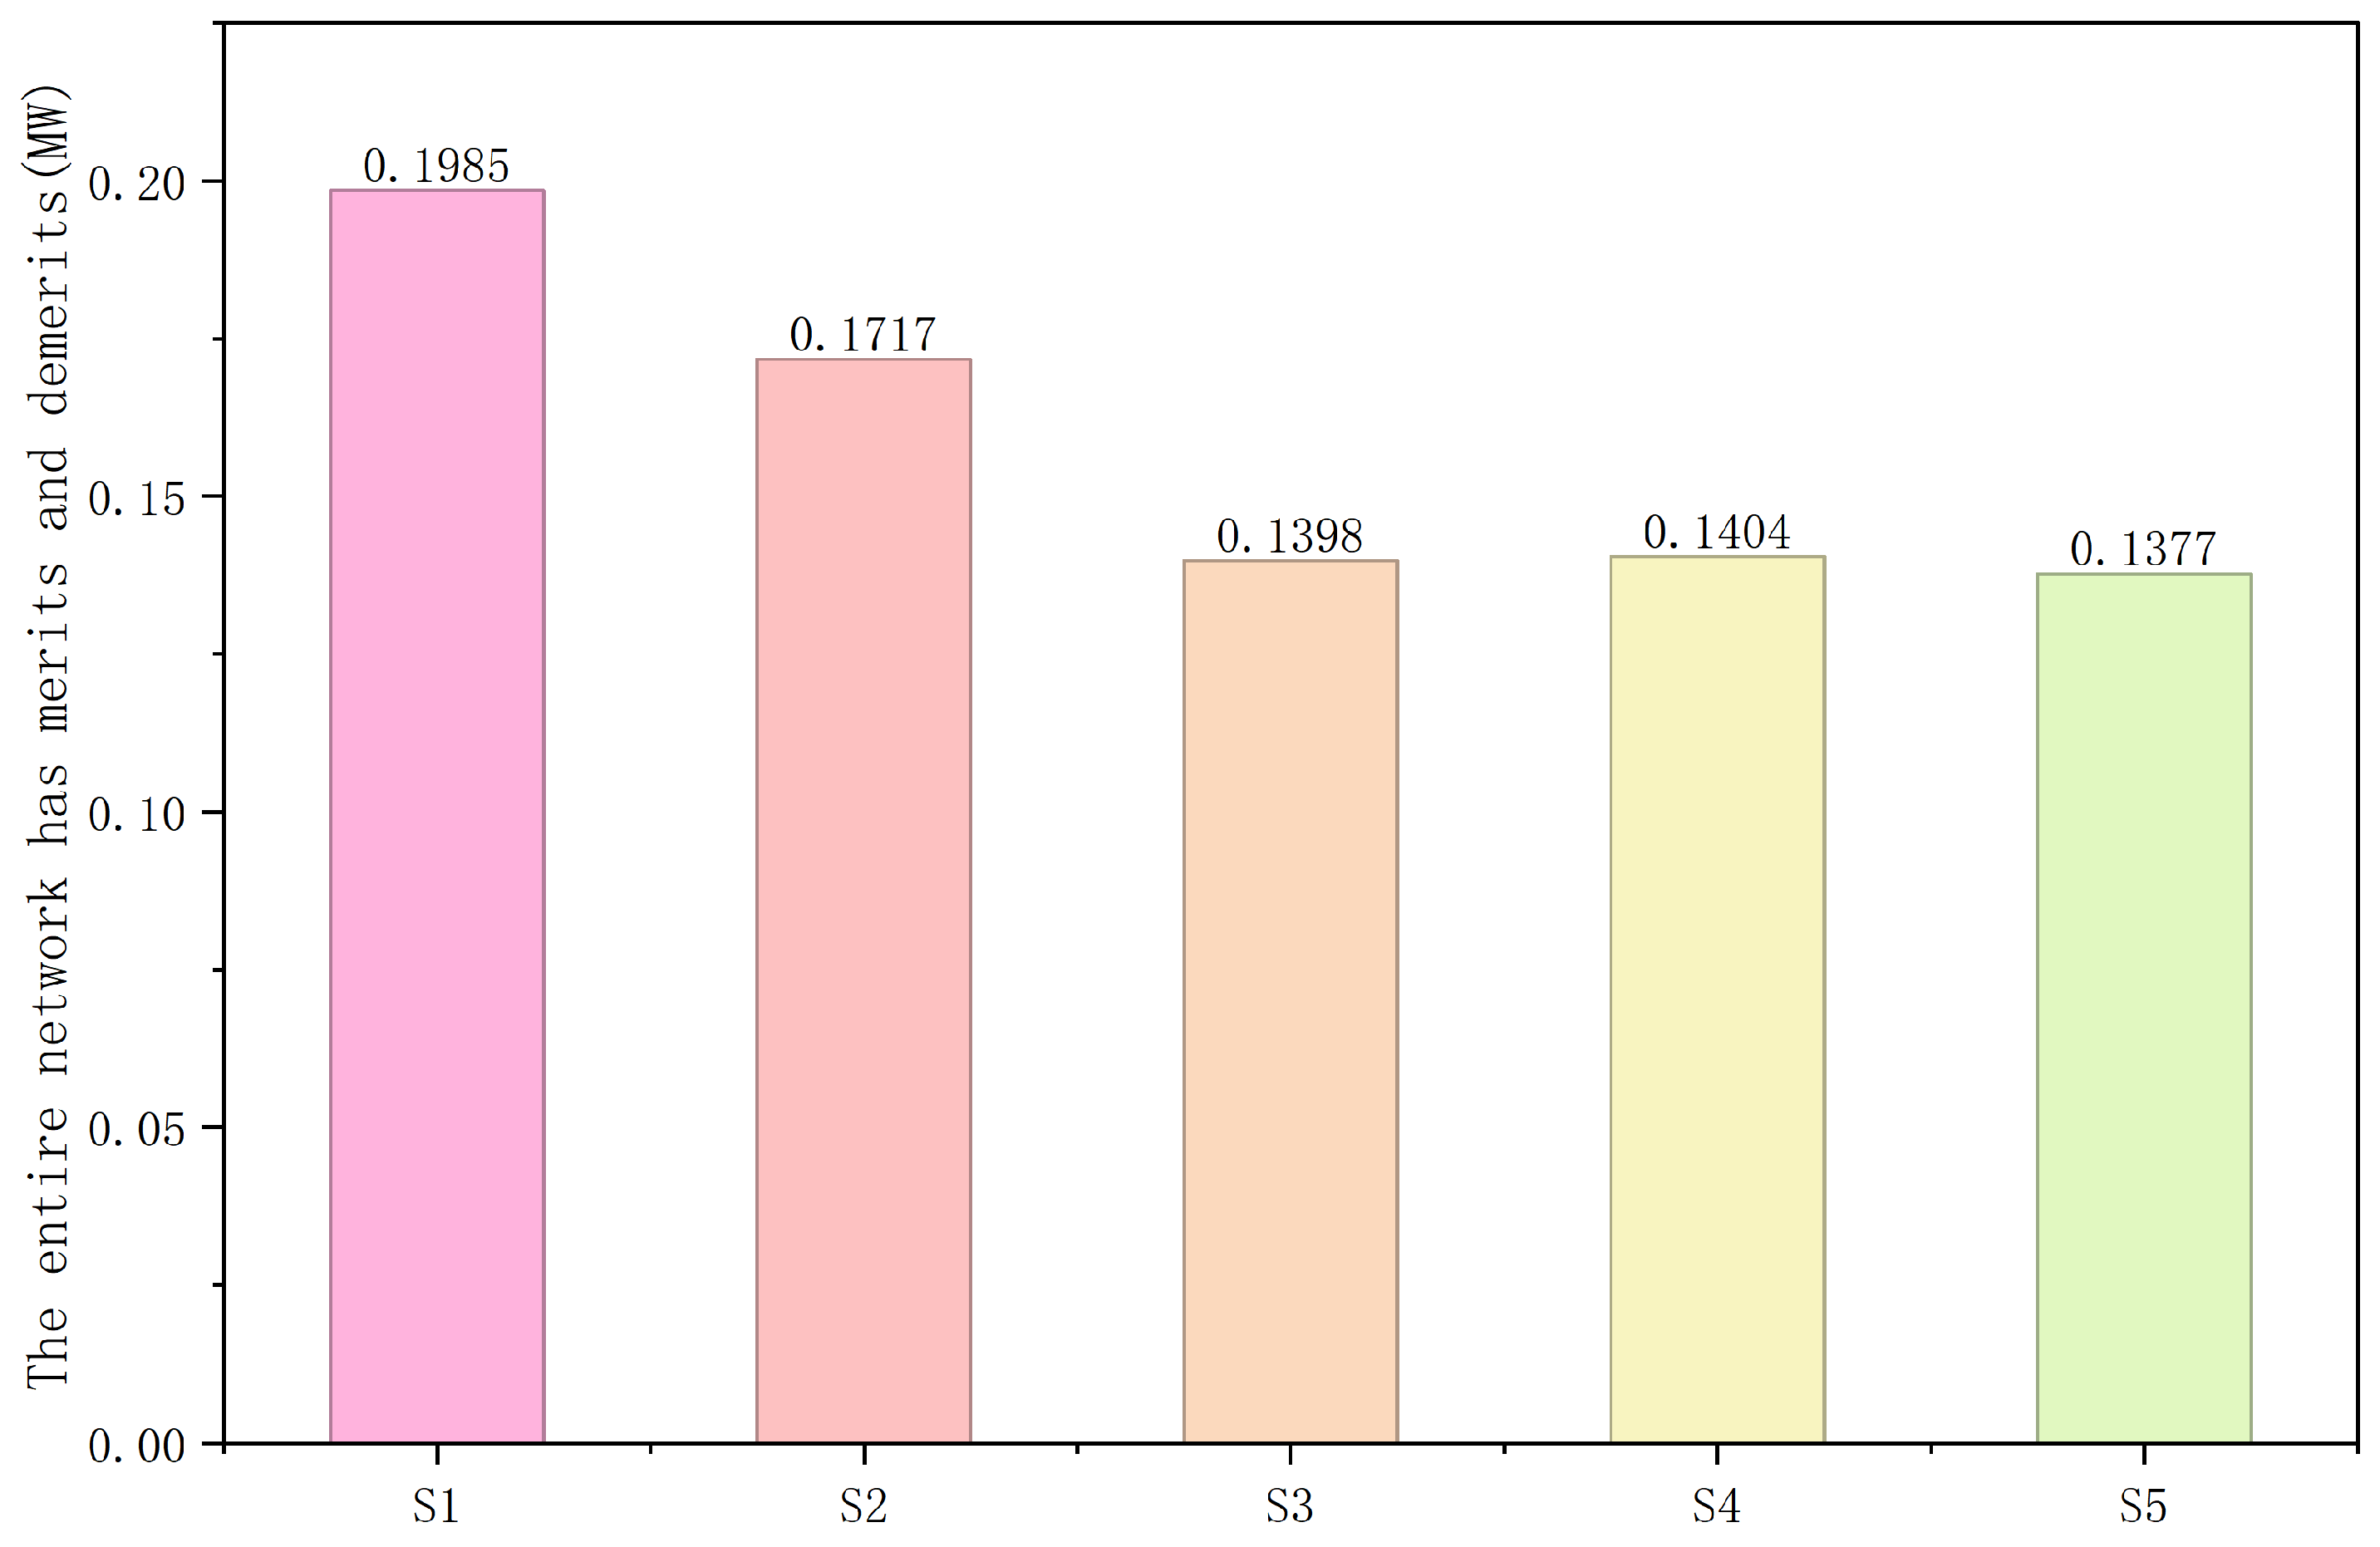
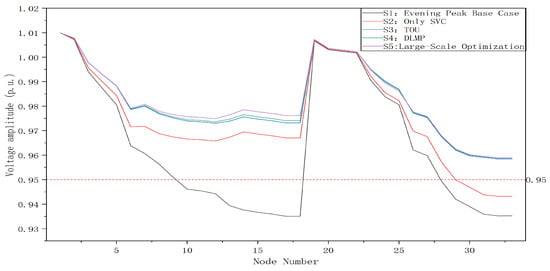
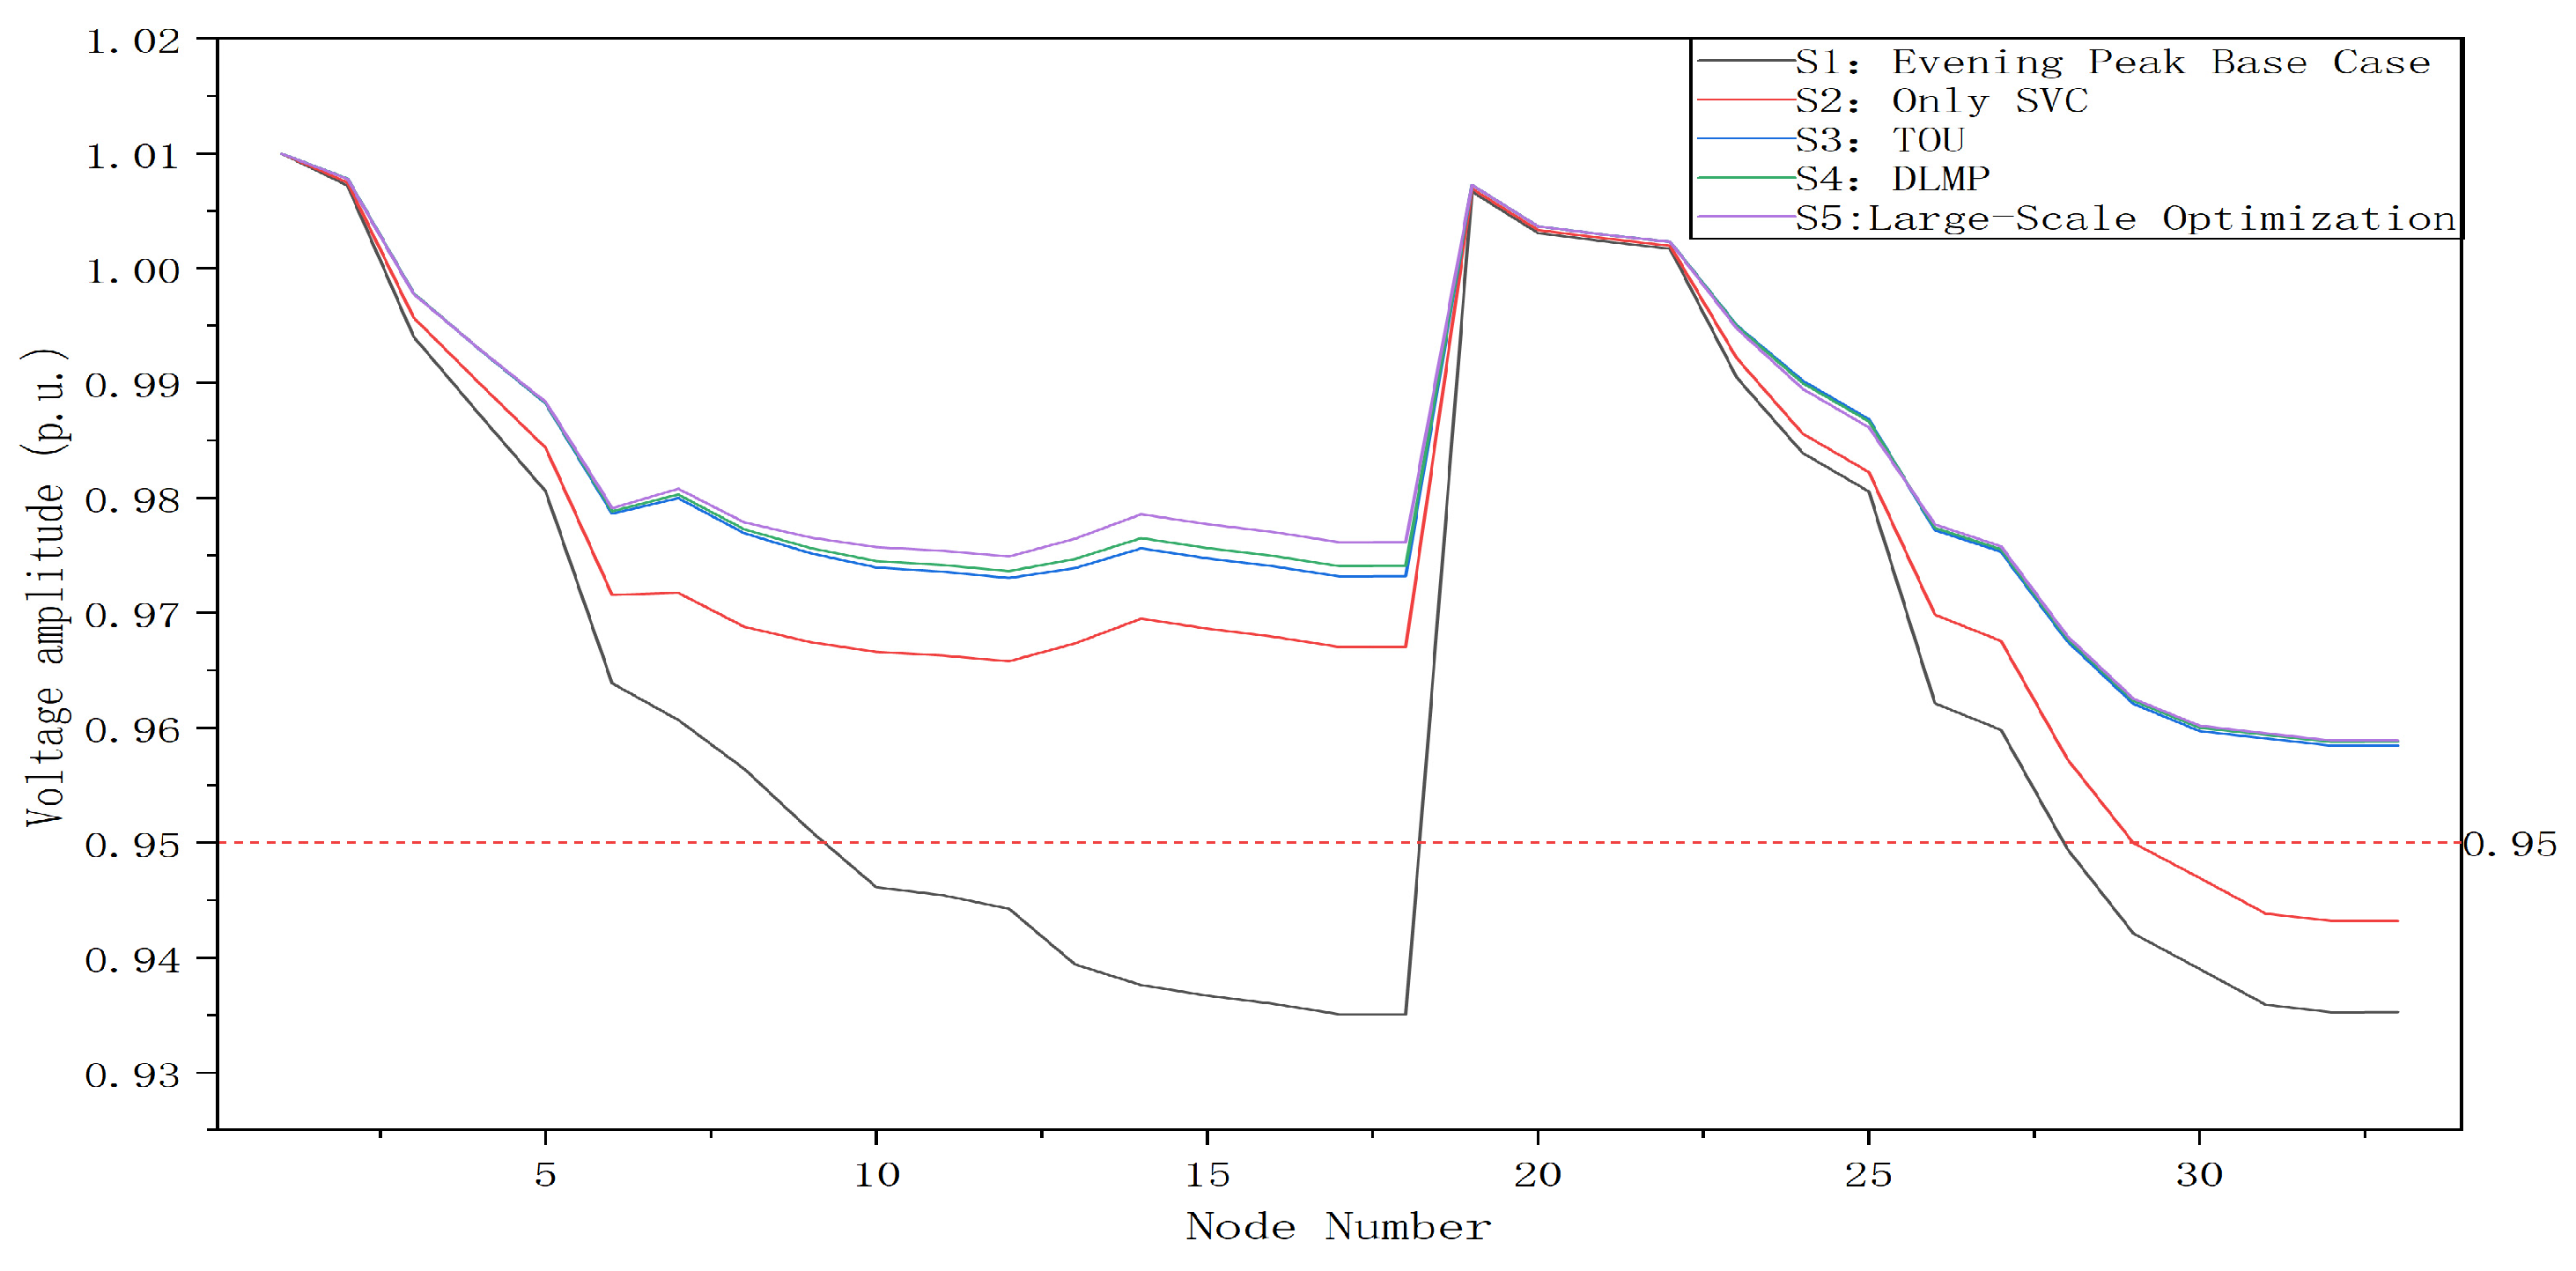
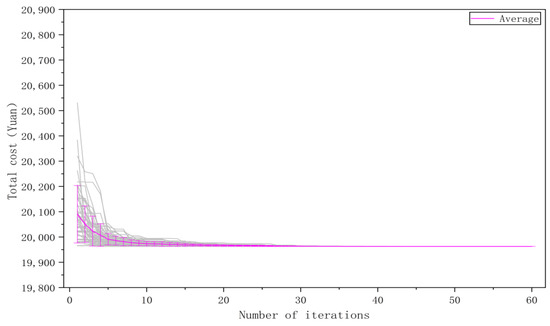
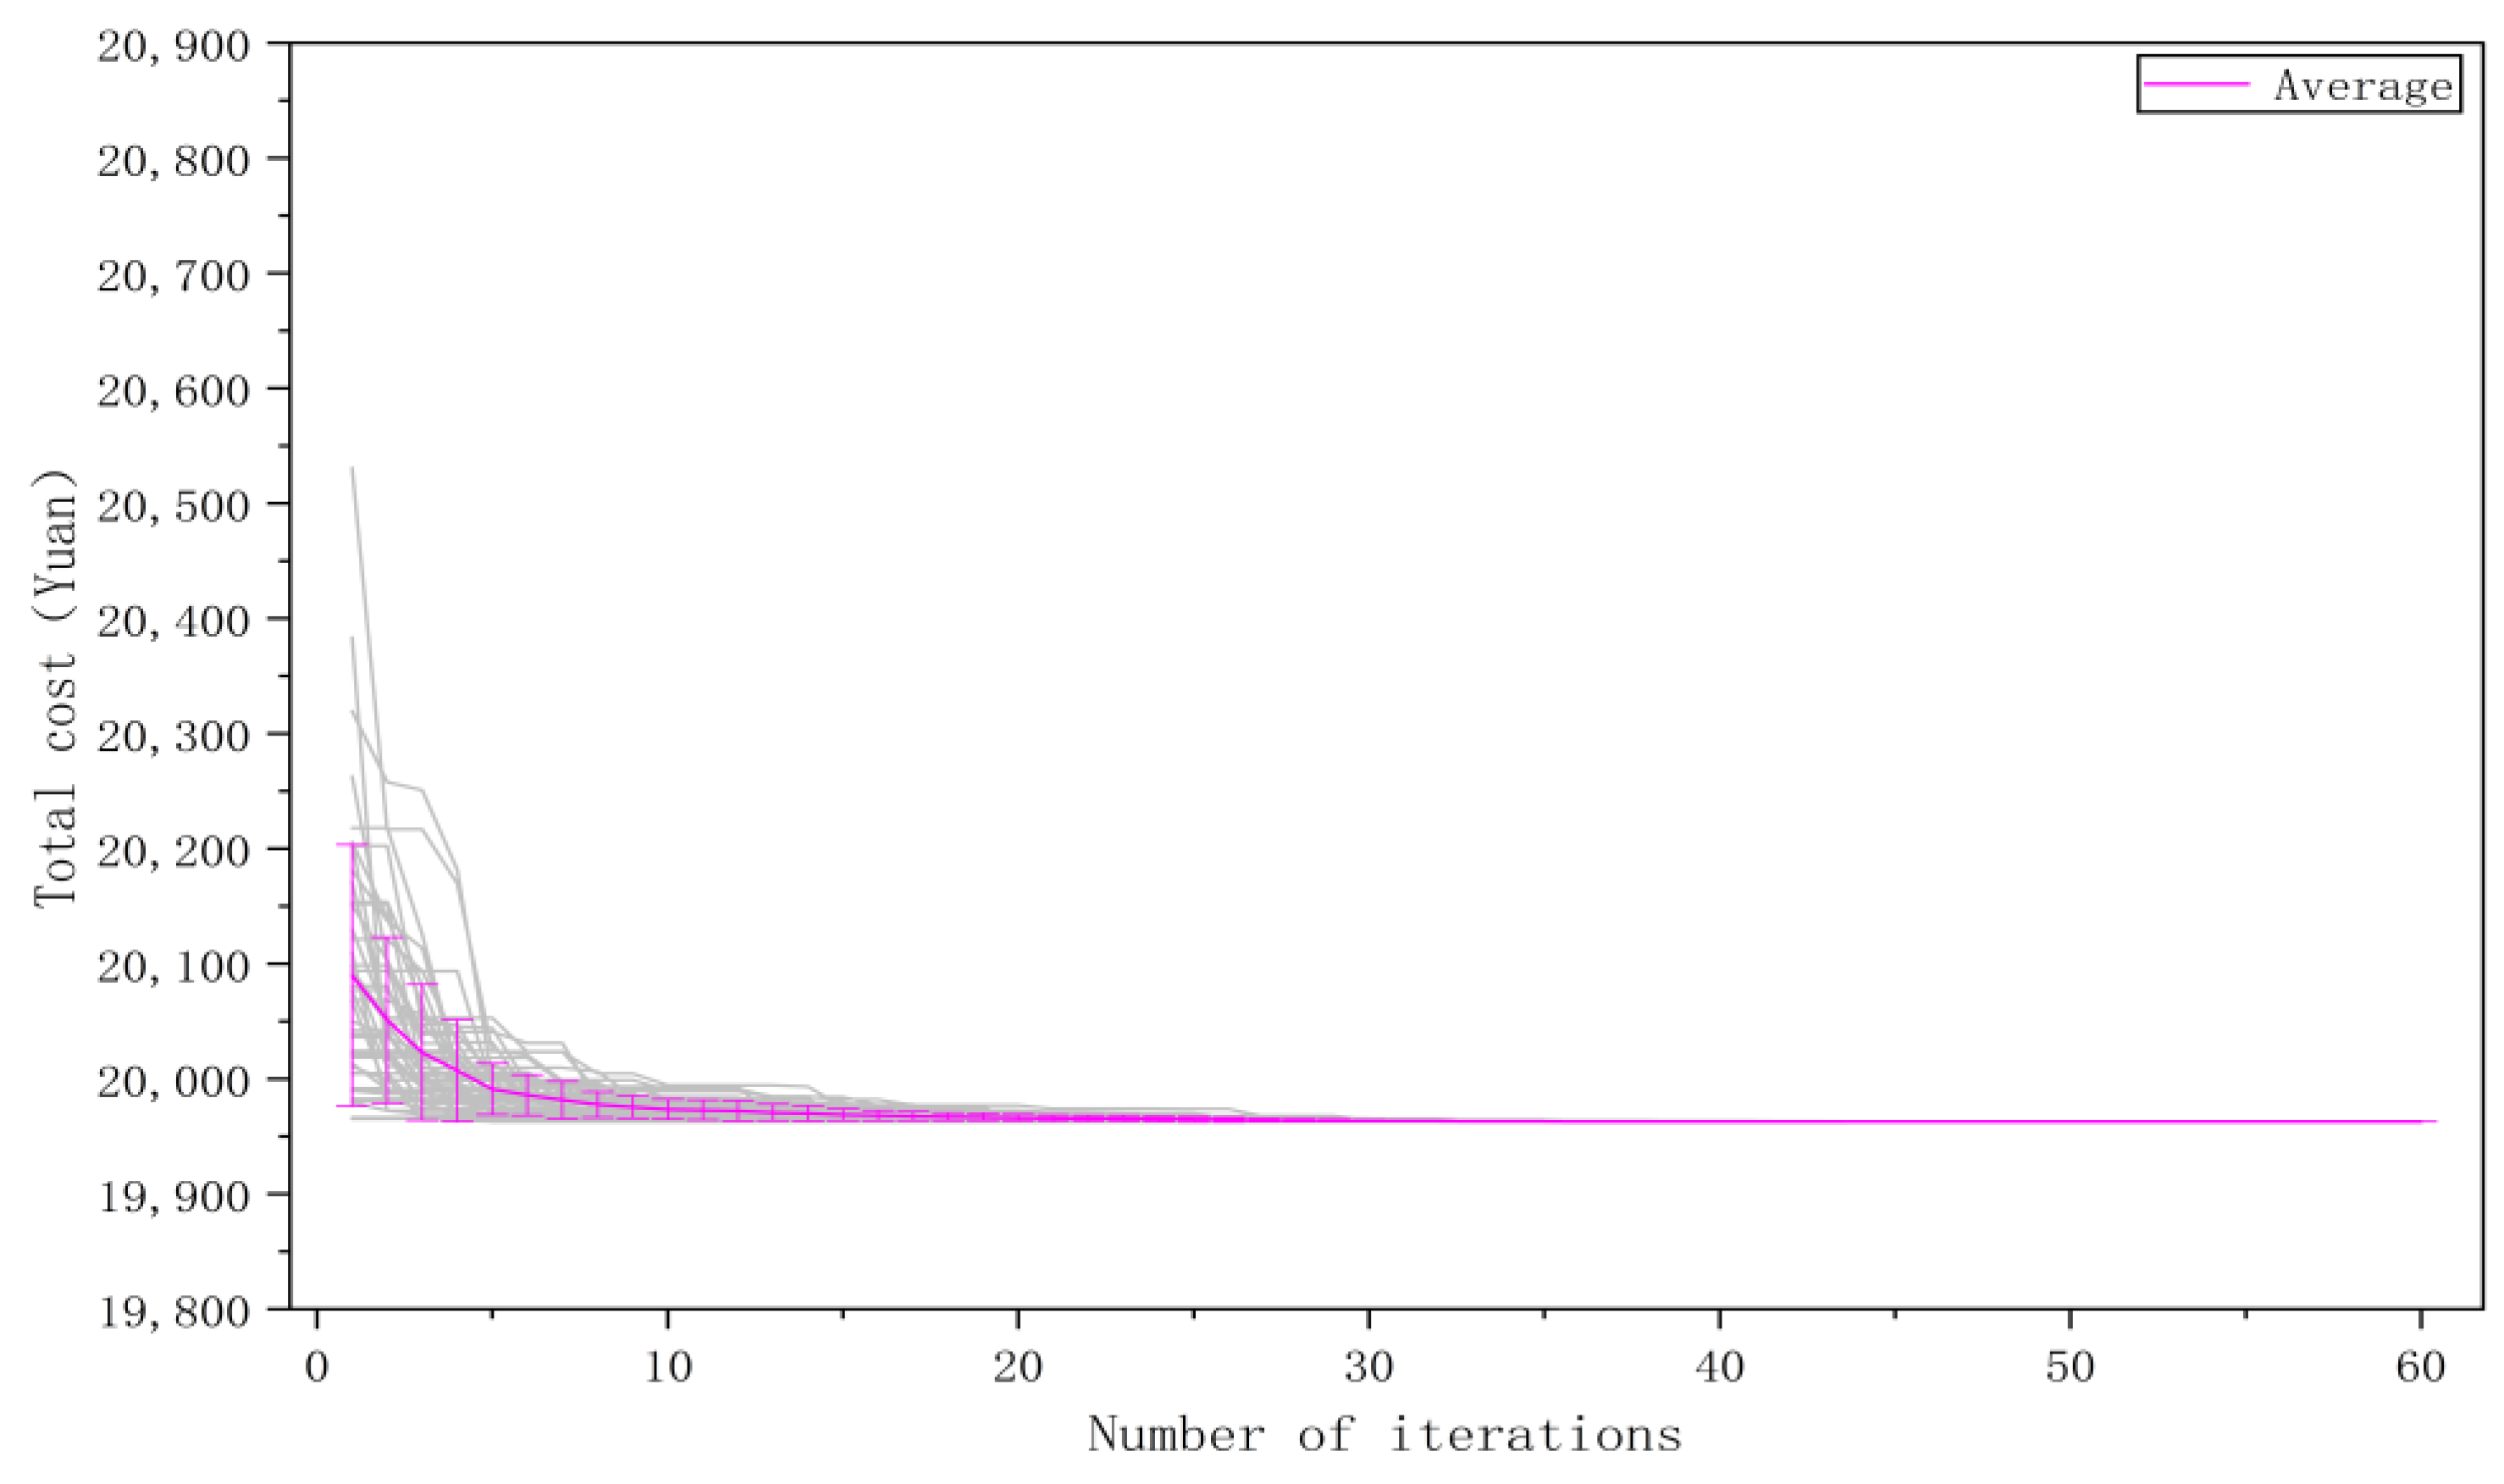
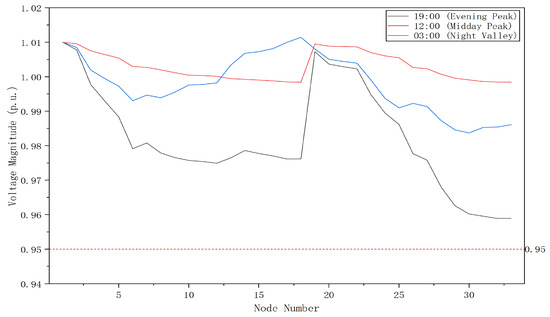
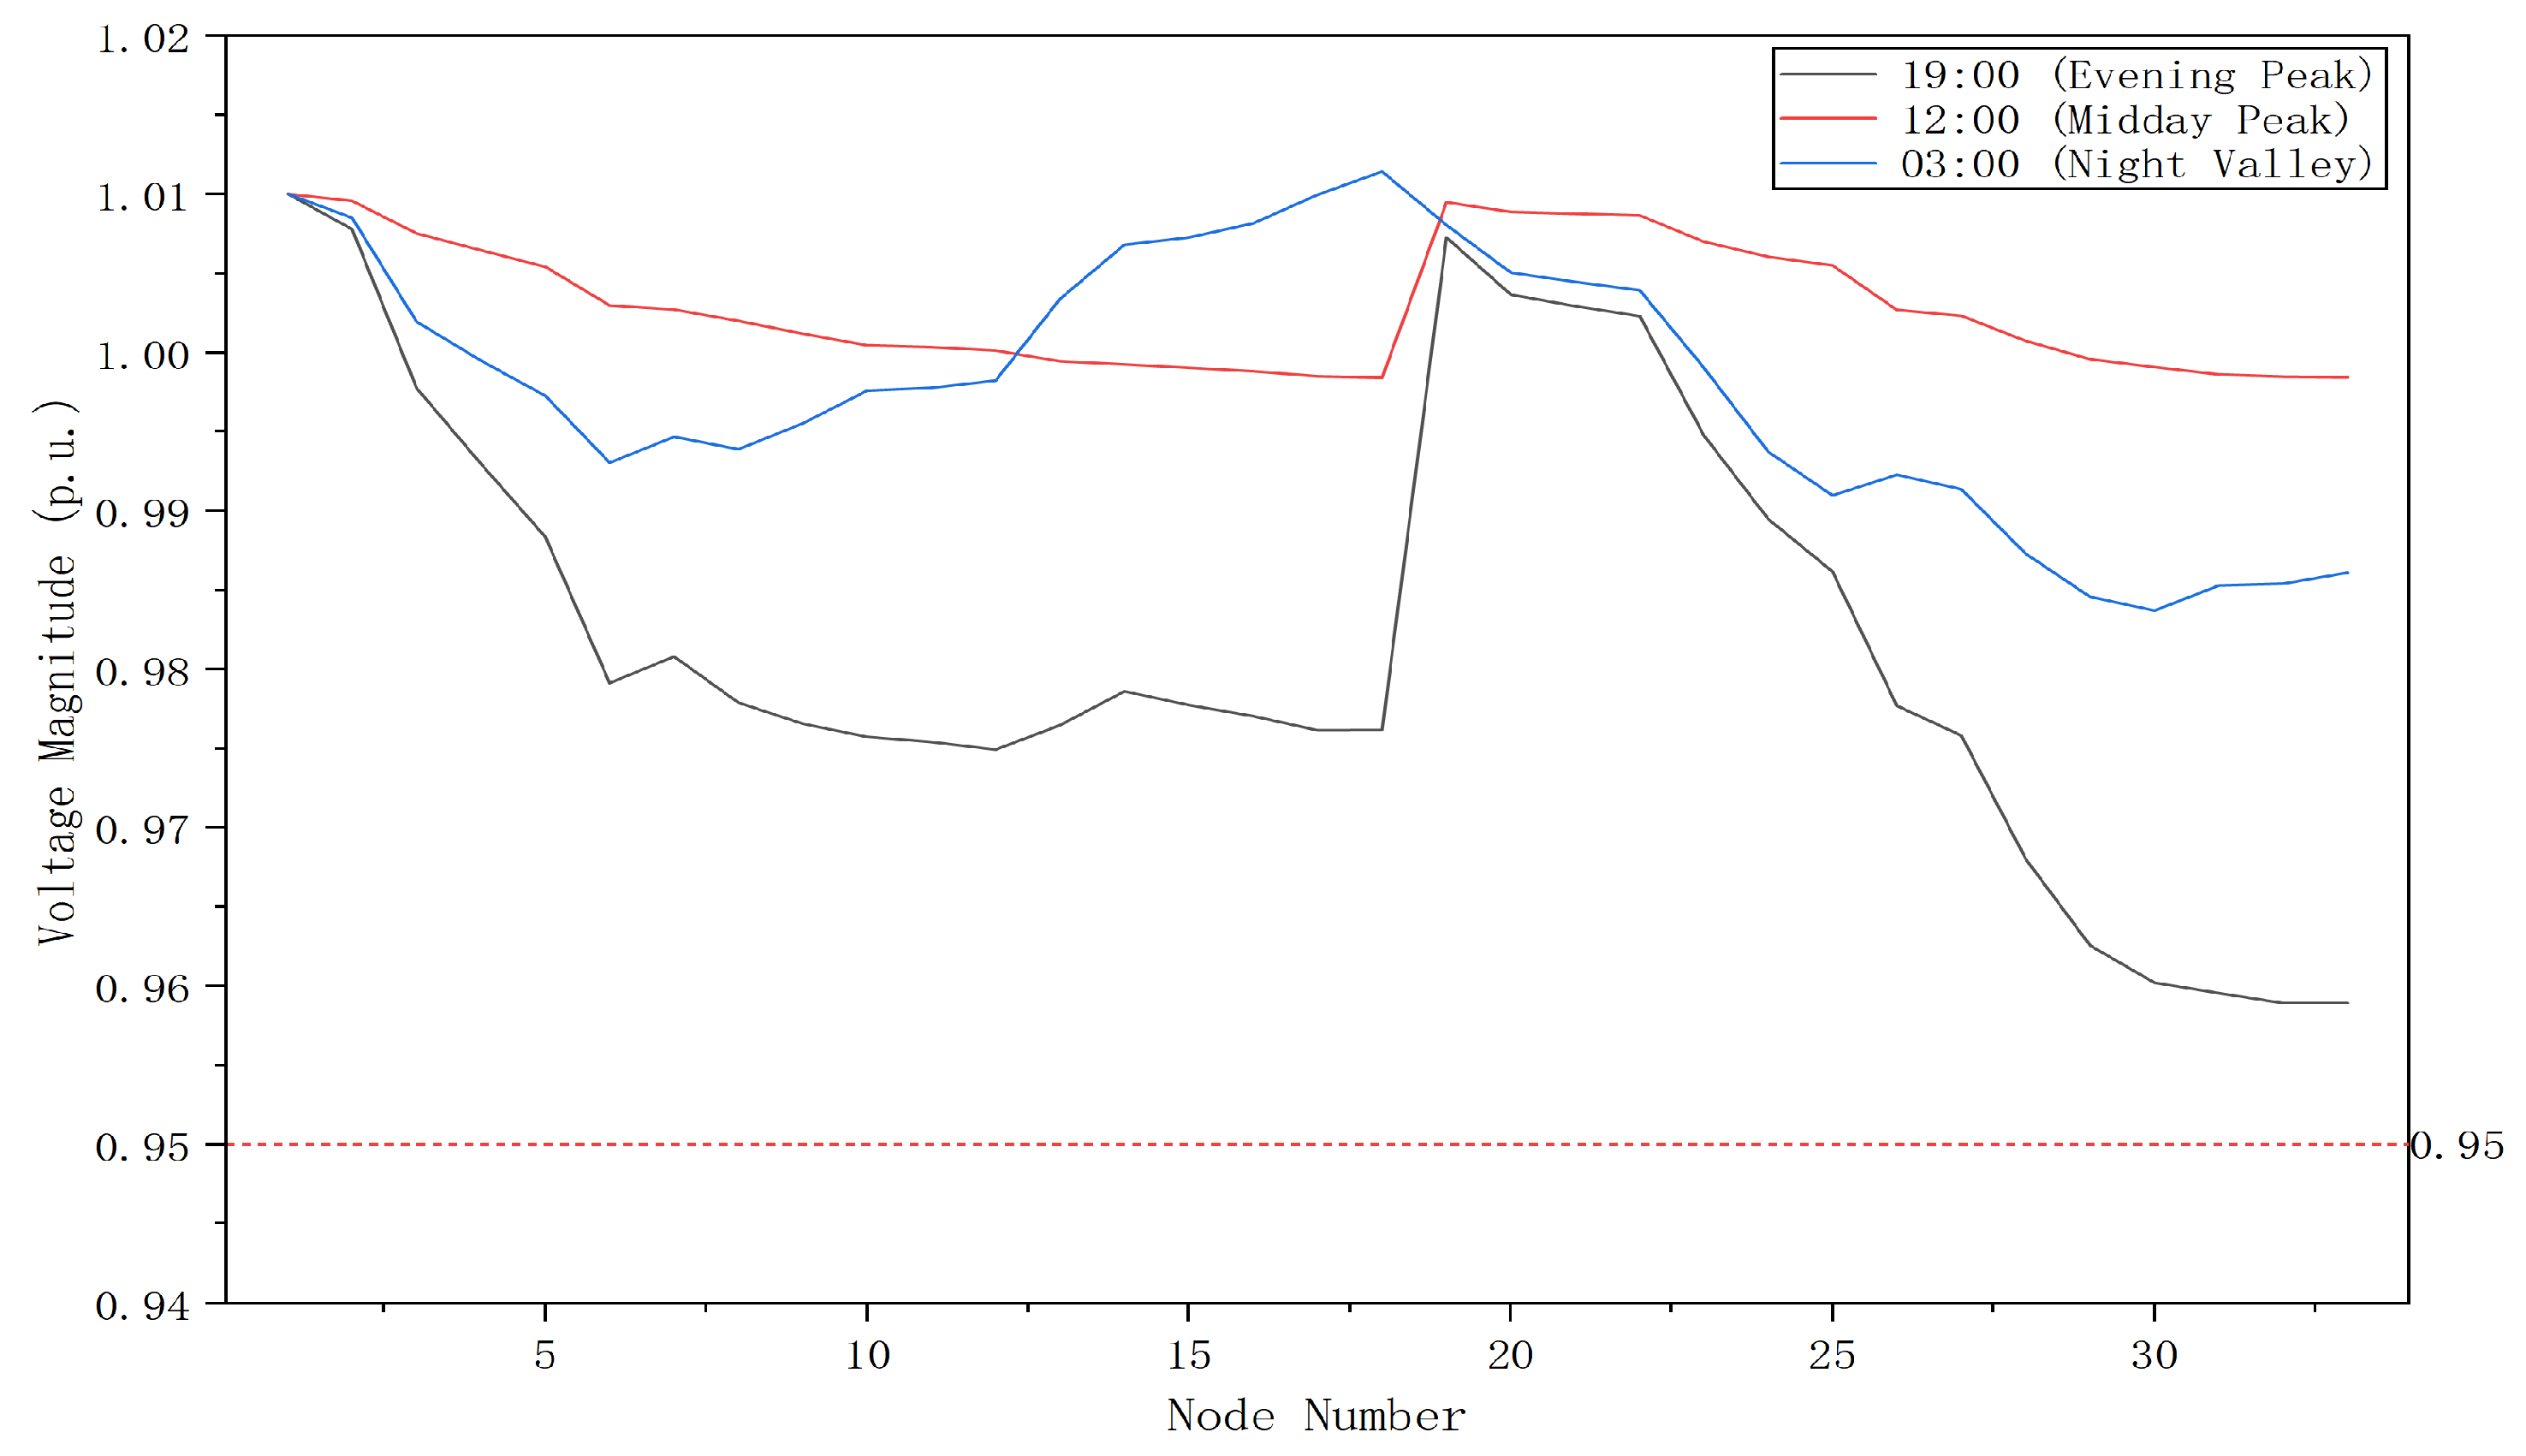
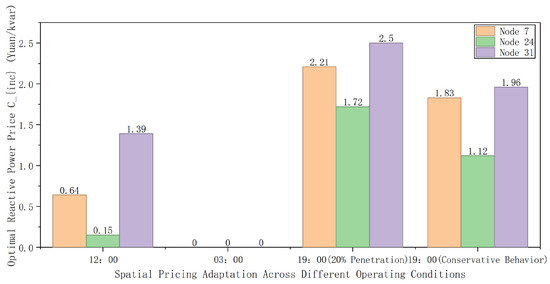
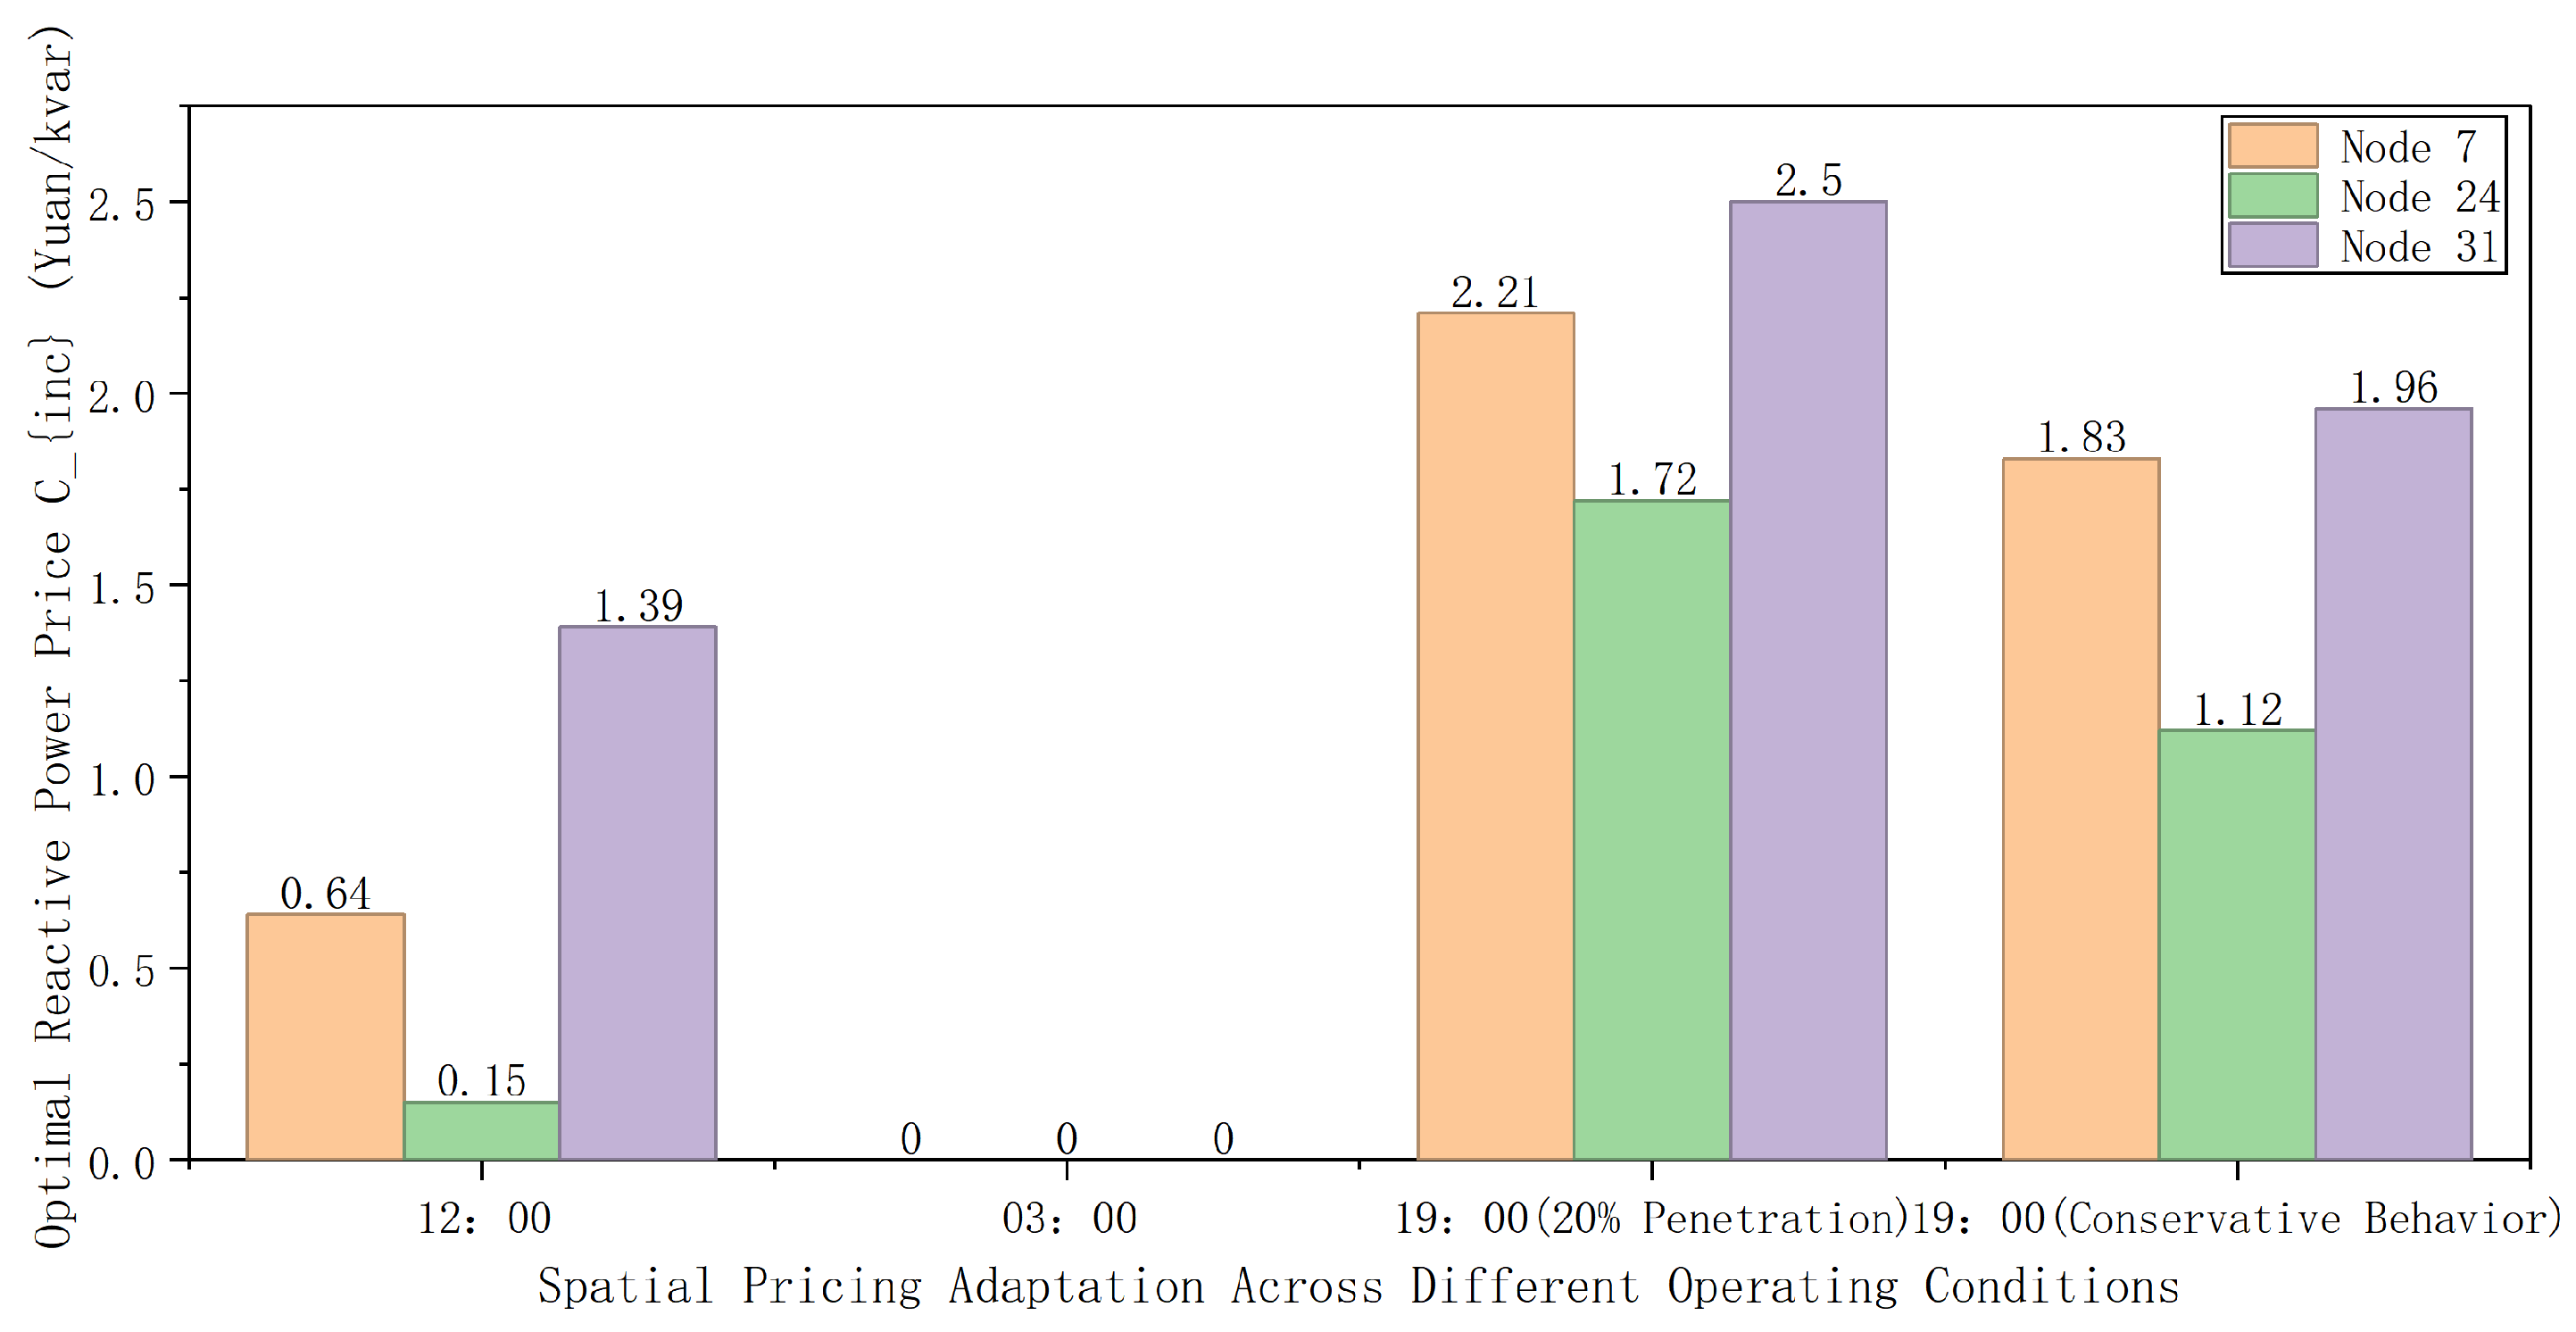
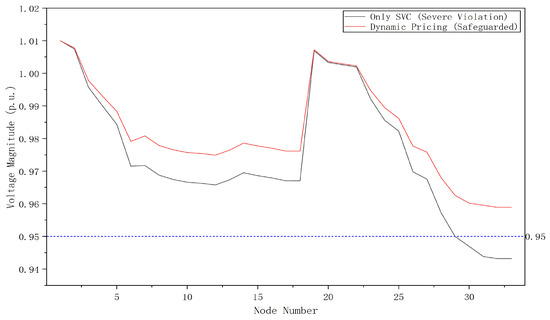
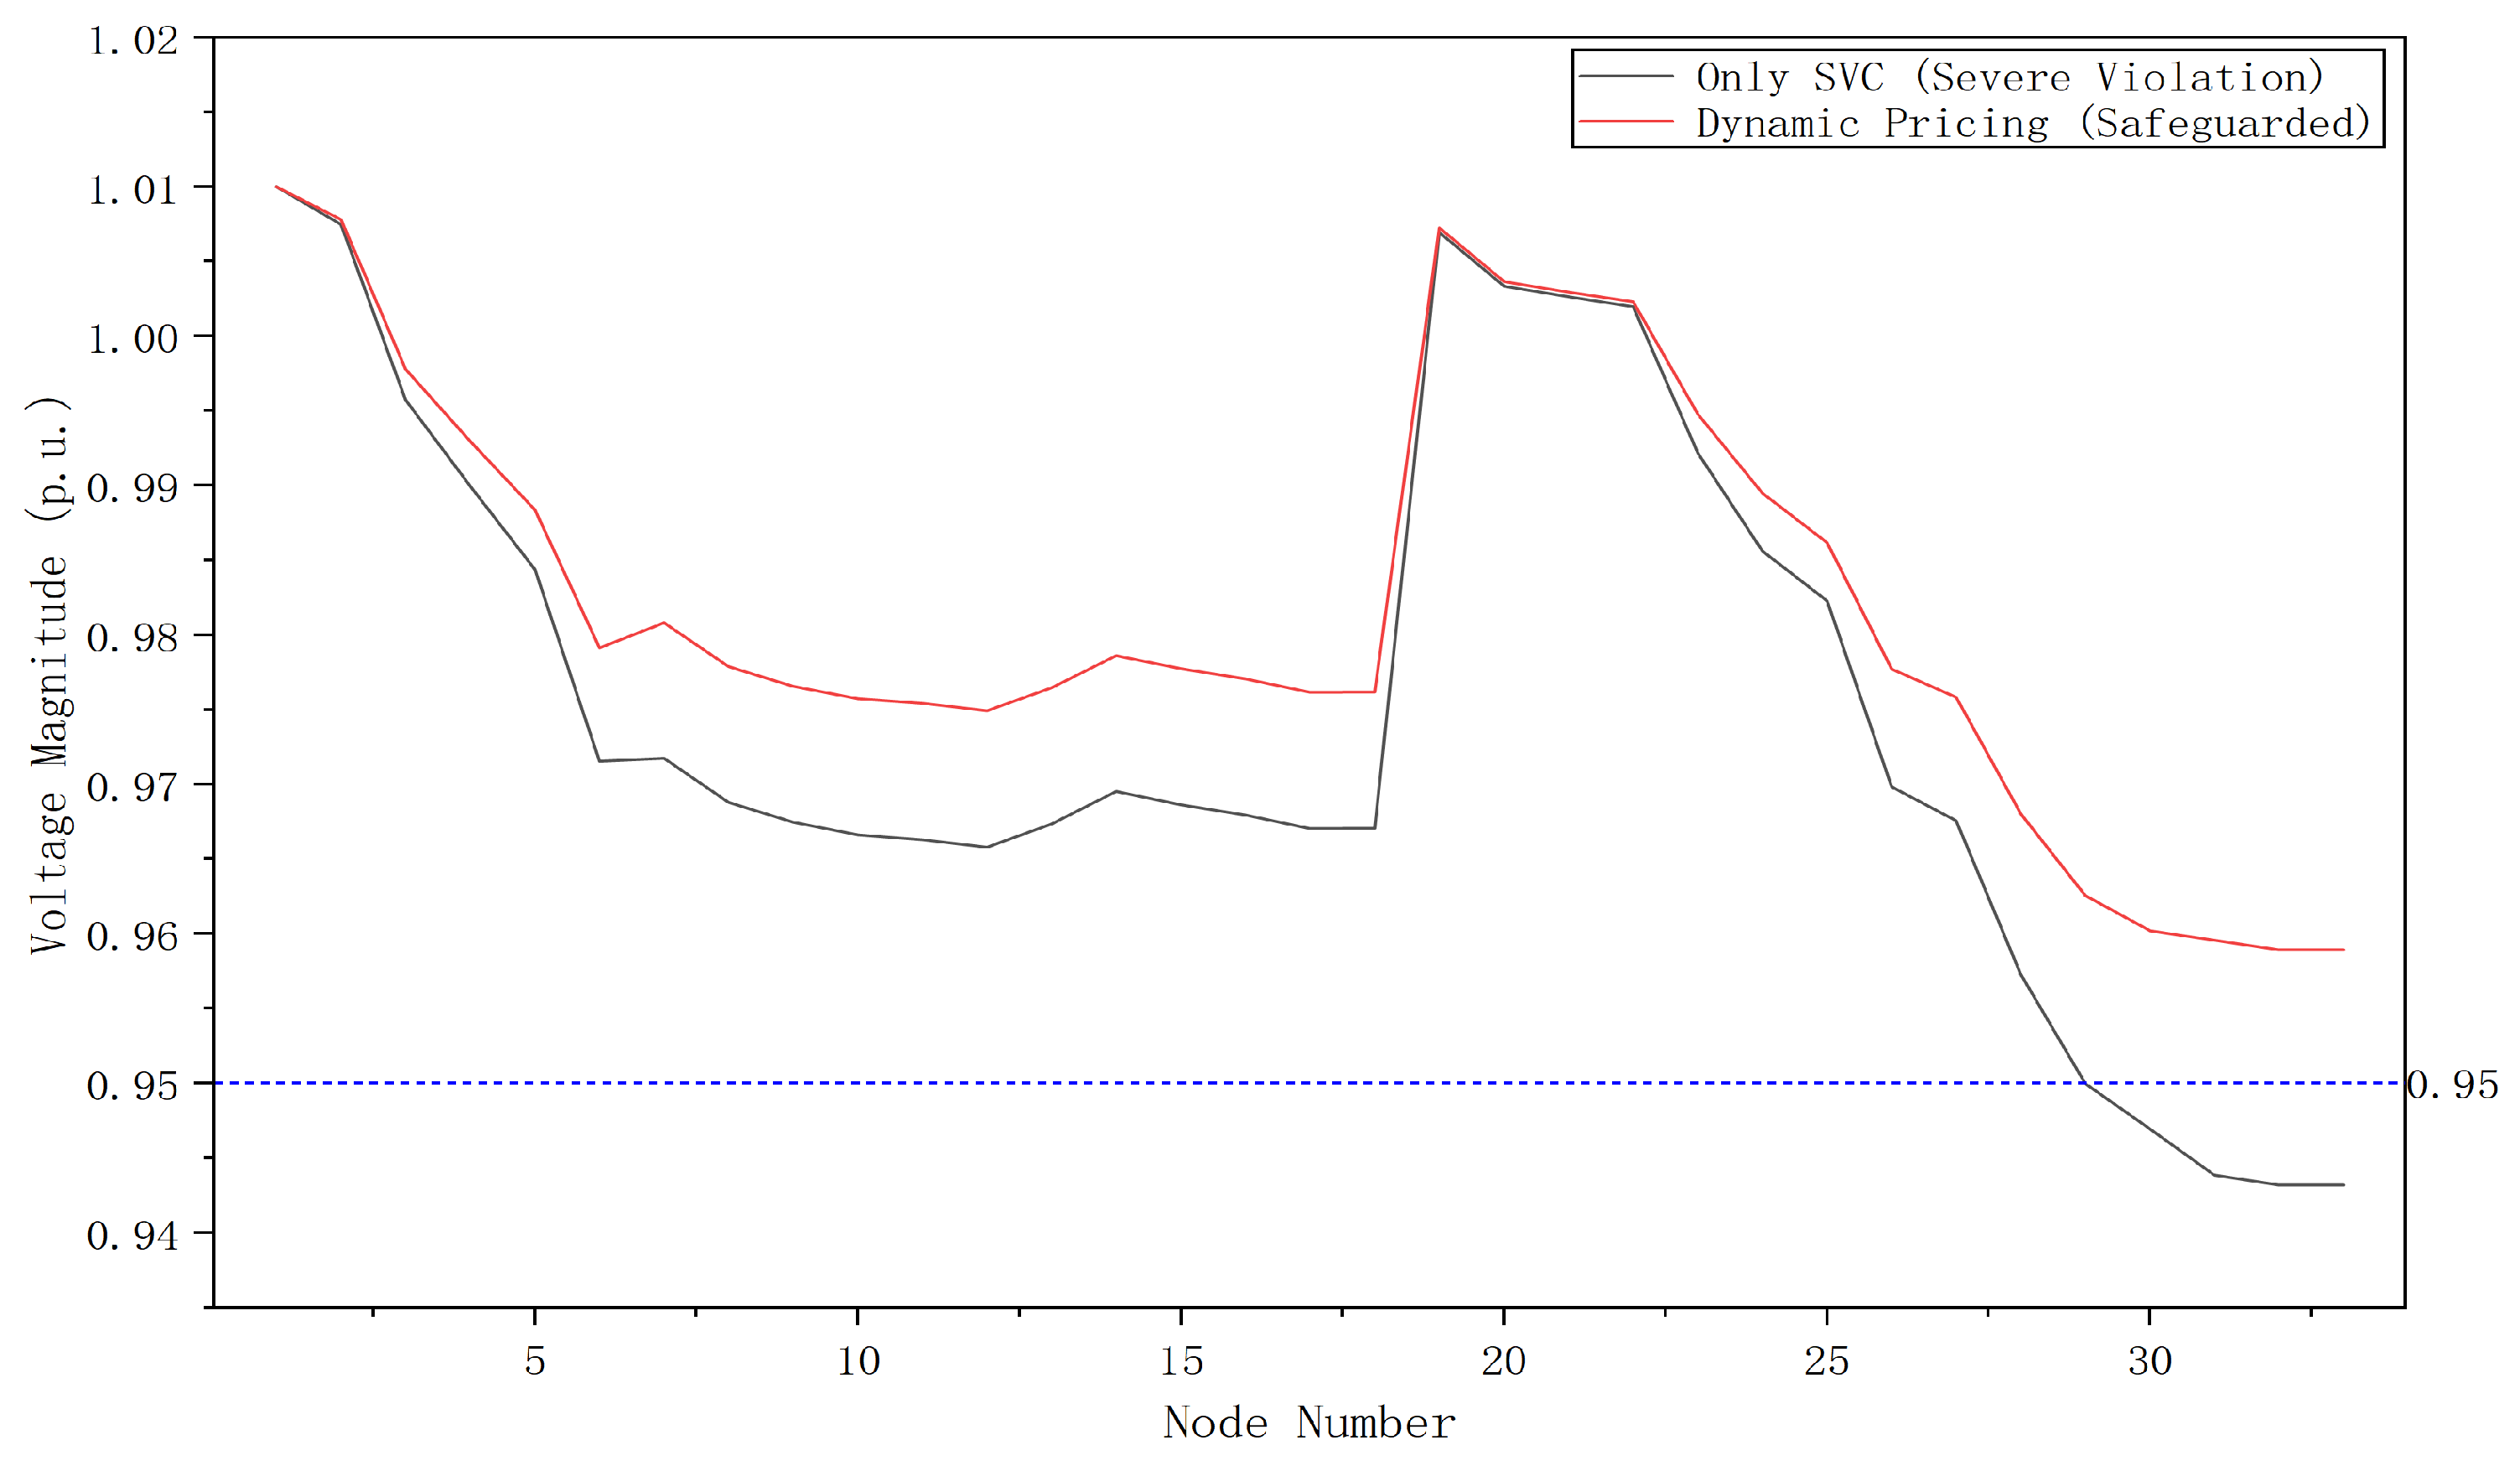
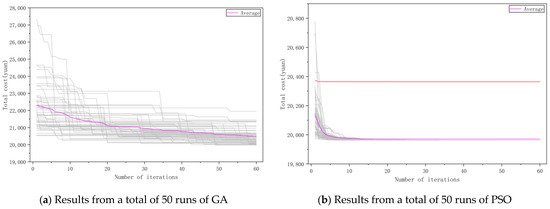
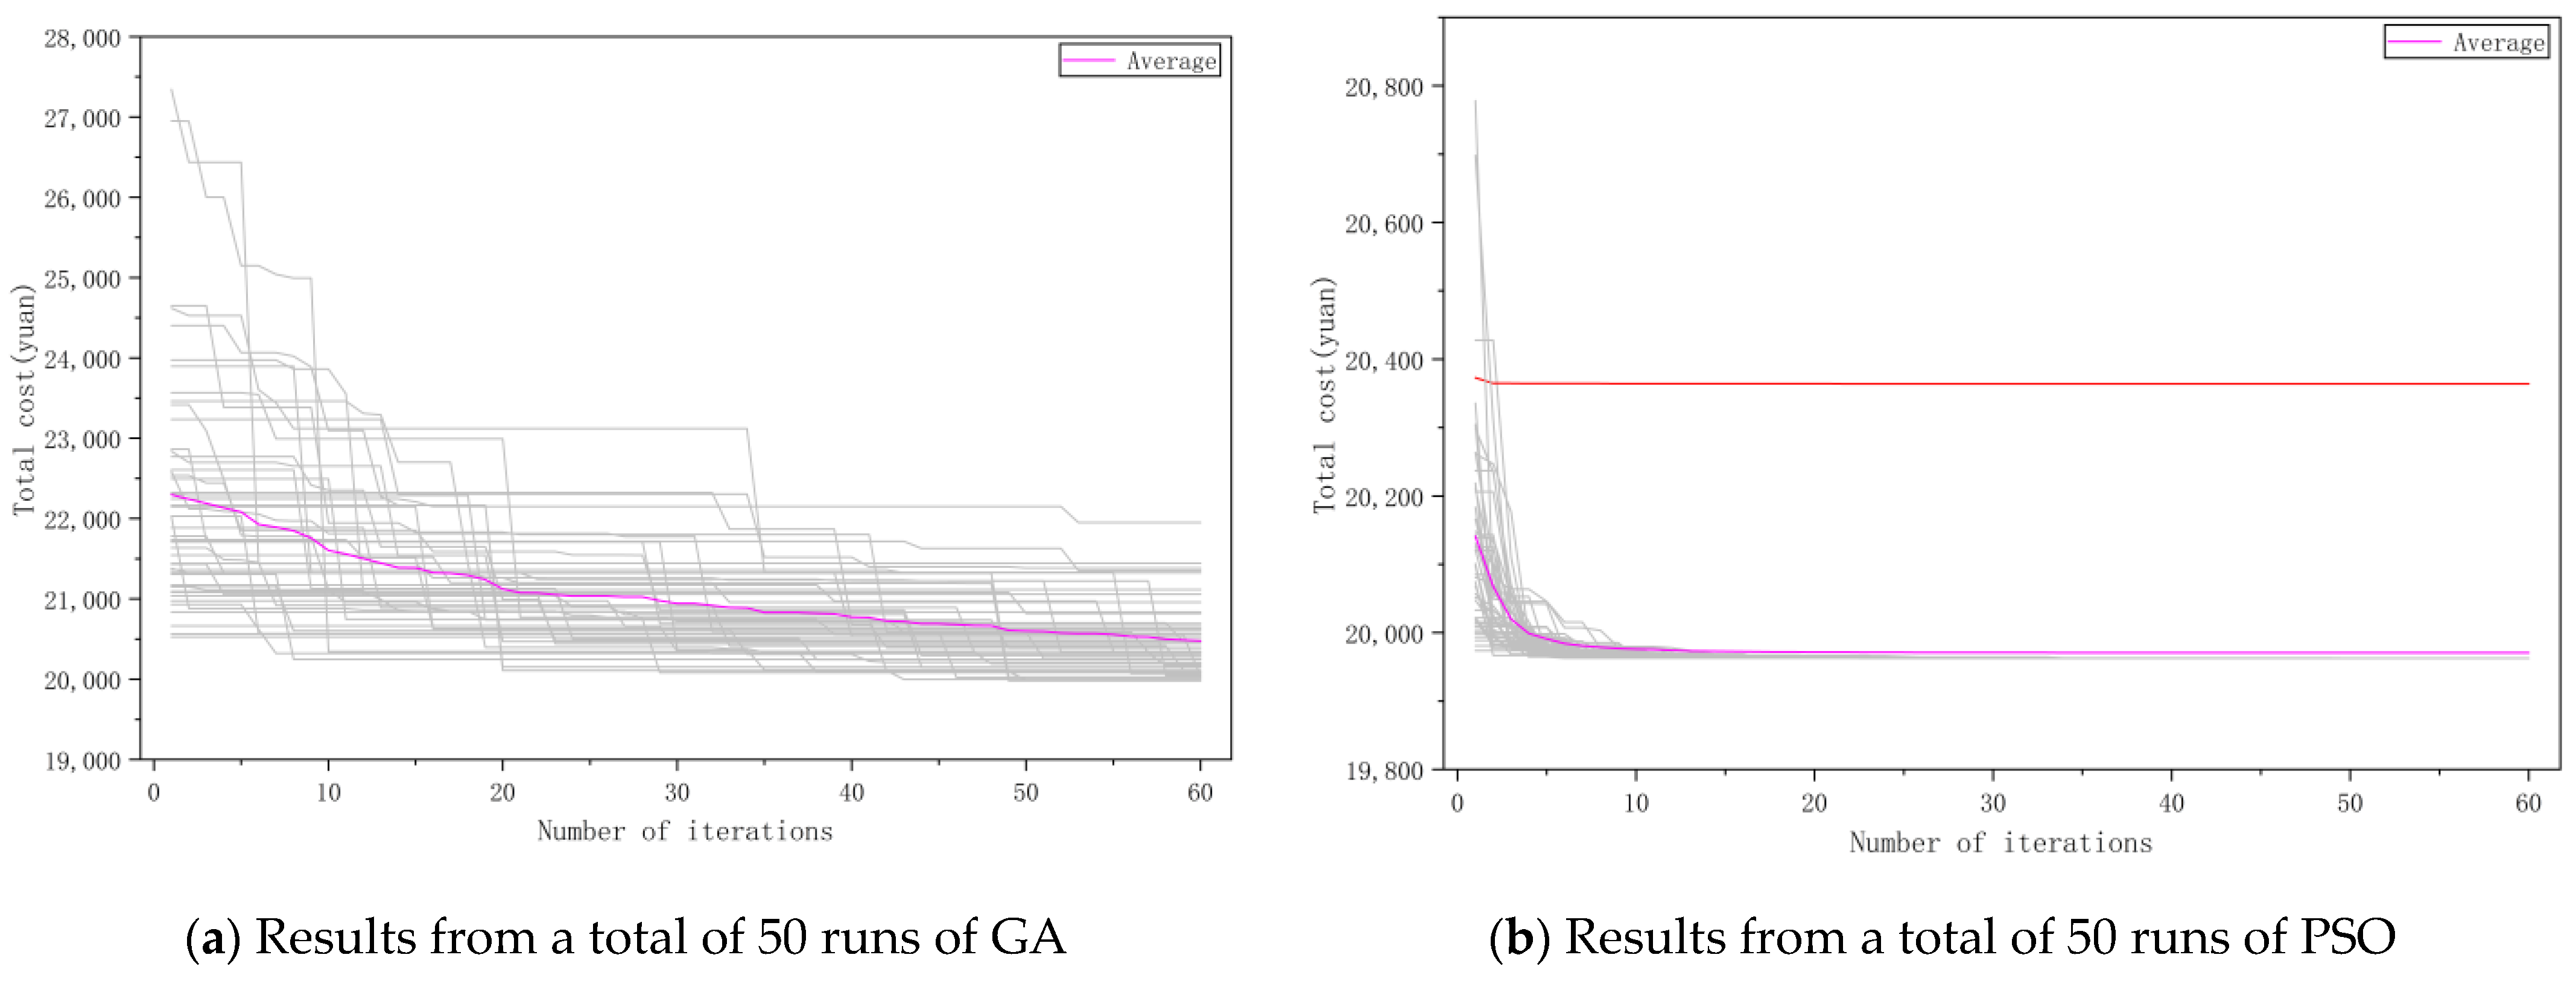

Disclaimer/Publisher’s Note: The statements, opinions and data contained in all publications are solely those of the individual author(s) and contributor(s) and not of MDPI and/or the editor(s). MDPI and/or the editor(s) disclaim responsibility for any injury to people or property resulting from any ideas, methods, instructions or products referred to in the content. |
© 2026 by the authors. Licensee MDPI, Basel, Switzerland. This article is an open access article distributed under the terms and conditions of the Creative Commons Attribution (CC BY) license.