


Abstract
Against the backdrop of China’s transition from the eradication of absolute poverty toward the pursuit of common prosperity, equitable access to energy has become an increasingly important policy concern. This study develops a multidimensional framework to assess energy poverty from three interrelated dimensions: energy use level, energy structure, and energy capability. Using panel data for 30 provincial-level regions from 2005 to 2020, a provincial energy poverty index (EPI) is constructed based on the entropy-weighting approach. The spatial and temporal dynamics of energy poverty are examined using Moran’s I, the Dagum Gini decomposition, kernel density estimation, and spatial Markov chain analysis. The results reveal several key patterns. (1) Although energy poverty has declined nationwide, it remains pronounced in parts of western, central, and northeastern China. (2) Energy poverty exhibits significant spatial clustering, with high-poverty clusters concentrated in resource-dependent regions such as Shanxi and Inner Mongolia, while low-poverty clusters are mainly located along the eastern coast. (3) Regional disparities follow an inverted U-shaped trajectory over time, with east–west differences constituting the primary source of overall inequality. (4) Moreover, the evolution of energy poverty displays strong path dependence and club convergence. These findings highlight the need to strengthen dynamic monitoring and governance mechanisms, promote region-specific clean energy development, and enhance cross-regional coordination to support energy security and green transformation under China’s “dual-carbon” objectives.
1. Introduction
Energy is a fundamental material foundation for economic and social development, closely associated with social, economic, political, and cultural activities, thereby forming a complex network of societal relationships. The inability of energy supply to meet developmental demands has become a key manifestation of current energy poverty [1]. Unlike absolute poverty, energy poverty lacks a unified measurement standard. It arises alongside contemporary energy demands, grounded in both domestic energy reserves and the global energy landscape, and continuously evolves with socio-economic development as a dynamic and relative form of deprivation [2]. By late 2023, China’s population had risen to over 1.4 billion. Such a demographic scale has generated tremendous energy demand, positioning China as one of the world’s largest energy consumers. However, this high level of energy demand and dependence has made it increasingly difficult to ensure national energy security [3]. On one hand, although China is among the leading global energy producers with abundant reserves, the vast population and uneven economic development have resulted in significant regional disparities in energy infrastructure. Consequently, some areas still face challenges regarding equitable access to and effective use of energy resources. On the other hand, China’s substantial dependence on imported energy makes its supply vulnerable to disruptions caused by global political and economic instability, thereby intensifying the country’s energy security risks [4]. To address both energy and environmental crises, China must advance an energy transition from traditional high-carbon and high-pollution sources toward low-carbon, clean, and sustainable energy systems. Achieving this transition, however, first requires resolving the problem of energy poverty [5].
Energy poverty describes a relative condition where the available energy is insufficient to satisfy people’s living and production requirements. It embodies a dynamic and evolving relationship between energy supply and demand that changes alongside socioeconomic development. In essence, energy poverty arises when the available energy supply cannot satisfy the requirements of a given stage of development [6]. Energy poverty is increasingly understood not merely as a shortage of energy supply, but as a multidimensional form of deprivation [7]. It manifests when households or communities lack adequate access to modern energy services, face affordability constraints, or are forced to rely on low-quality or unclean energy sources, which in turn undermines health, well-being, and development opportunities. To systematically assess China’s energy poverty, this study adopts the multidimensional energy poverty concept as the core theoretical framework. This framework posits that energy poverty is not a single-dimensional deprivation, but rather a condition in which multiple energy-related dimensions are simultaneously or alternately constrained [7,8]. Drawing on China’s national context, data availability, and existing studies [9,10], we operationalize this multidimensional concept into three interrelated yet distinct dimensions: energy use level, energy structure, and energy capacity. Energy use level measures the quantity of energy that is actually accessible and consumed, reflecting the basic availability of energy services. Energy structure captures the cleanliness, low-carbon characteristics, and modernization of the energy used, reflecting the quality of energy services and their externalities for health and the environment. Energy capacity measures residents’ economic capability and social support for obtaining and consuming energy, reflecting the affordability and sustainability of access to energy services. Together, these three dimensions constitute the multidimensional energy poverty index (EPI) employed in this study.
Existing research on energy poverty primarily concentrates on several aspects. First, a substantial body of work describes the current state of energy poverty across different countries and regions. For example, Kökény et al. [11] investigated the determinants of energy poverty, focusing on whether households in the European Union can maintain adequate heating and avoid falling behind on utility payments. Second, Karmaker et al. [12] developed a new multidimensional index of women’s empowerment and examined how varying levels of empowerment relate to multidimensional energy poverty in five South Asian countries. In addition, Maier and Dreoni [13] used two subjective indicators and two expenditure-based indicators derived from statistically matching the Household Budget Survey (HBS) and the Survey on Income and Living Conditions (SILC) household survey data to conduct a systematic analysis of the distribution and characteristics of energy-poor populations within the EU. Liu et al. [14] utilized a multidimensional EPI to evaluate energy deprivation among nomadic herders, assessing both the effectiveness and shortcomings of solar home systems (SHSs) widely adopted in nomadic settings to satisfy everyday energy requirements. In addition, studies such as Ghosh [15] on BRICS countries and Heller et al. [16] on Europe and the United States have further enriched this research area. Second, the influencing factors of energy poverty are complex. Existing studies mainly analyze this issue from the perspectives of climate and environmental risks, socio-household characteristics, digital technology, and institutional and cultural factors. Climate- and temperature-related shocks affect the energy demand side, supply side, and affordability simultaneously. Representative studies include research on climate risks [17] and temperature shocks [18]. Socio-household factors influence energy poverty primarily through income capacity, decision-making power, energy preferences, and information access. Relevant studies have been conducted on gender differences [19], social capital [20], and clan culture [21]. Within the energy system, digital technologies can improve the balance between supply and demand through smart metering, remote monitoring, and demand-side response, thereby reducing power outages and voltage fluctuations and mitigating energy poverty. Researchers have examined these relationships from various perspectives, such as the digital economy [22], digital technology [23], digital inclusive finance [24], green finance [25], and internet accessibility [26]. Institutional and policy factors influence the availability, affordability, and quality of energy services primarily through public provision and incentive mechanisms. Representative studies include government expenditure [27], health shocks [28], energy assistance programs [29], fiscal decentralization [30], clan culture [20], and regional intergenerational mobility [31]. From the above literature, it can be observed that many scholars have examined the influencing factors and current conditions of energy poverty. However, relatively few studies have explored its evolutionary patterns, regional disparities, and methods for measuring dynamic spatial distribution.
Based on the above, this paper adopts an integrated methodological framework combining Moran’s I index, the Dagum Gini coefficient, kernel density estimation (KDE), and spatial Markov chain modeling to systematically investigate the spatial distribution, regional inequalities, and dynamic evolution patterns of energy poverty. The principal contributions of this study are manifested in the following dimensions. First, it enhances the energy poverty evaluation framework by constructing a multidimensional model comprising three core indicators—energy utilization level, energy composition, and energy capacity—along with six supplementary metrics such as household energy consumption and supply capability. Second, it delivers an extensive analysis of the structural attributes of energy poverty from the perspectives of distributional dynamics, regional inequality, structural variation, and convergence, thereby deepening the understanding of its spatial-temporal evolution.
2. Research Design
2.1. Conceptual Framework
To construct a rigorous theoretical analytical framework, this study draws on and integrates the “energy deprivation” model proposed by Bouzarovski and Tirado Herrero [8] together with the mainstream theories of multidimensional energy poverty. This model argues that energy deprivation is not a single issue of energy availability, but rather a complex outcome arising from the interaction among household or community characteristics, broader socioeconomic structures, and region-specific infrastructures and governance systems. These factors jointly shape the availability, affordability, and quality or utility of energy services, ultimately determining the degree and form of energy deprivation.
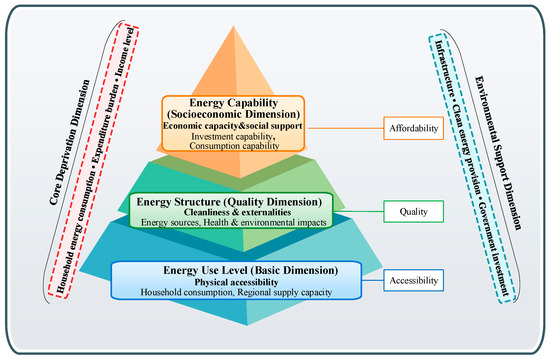
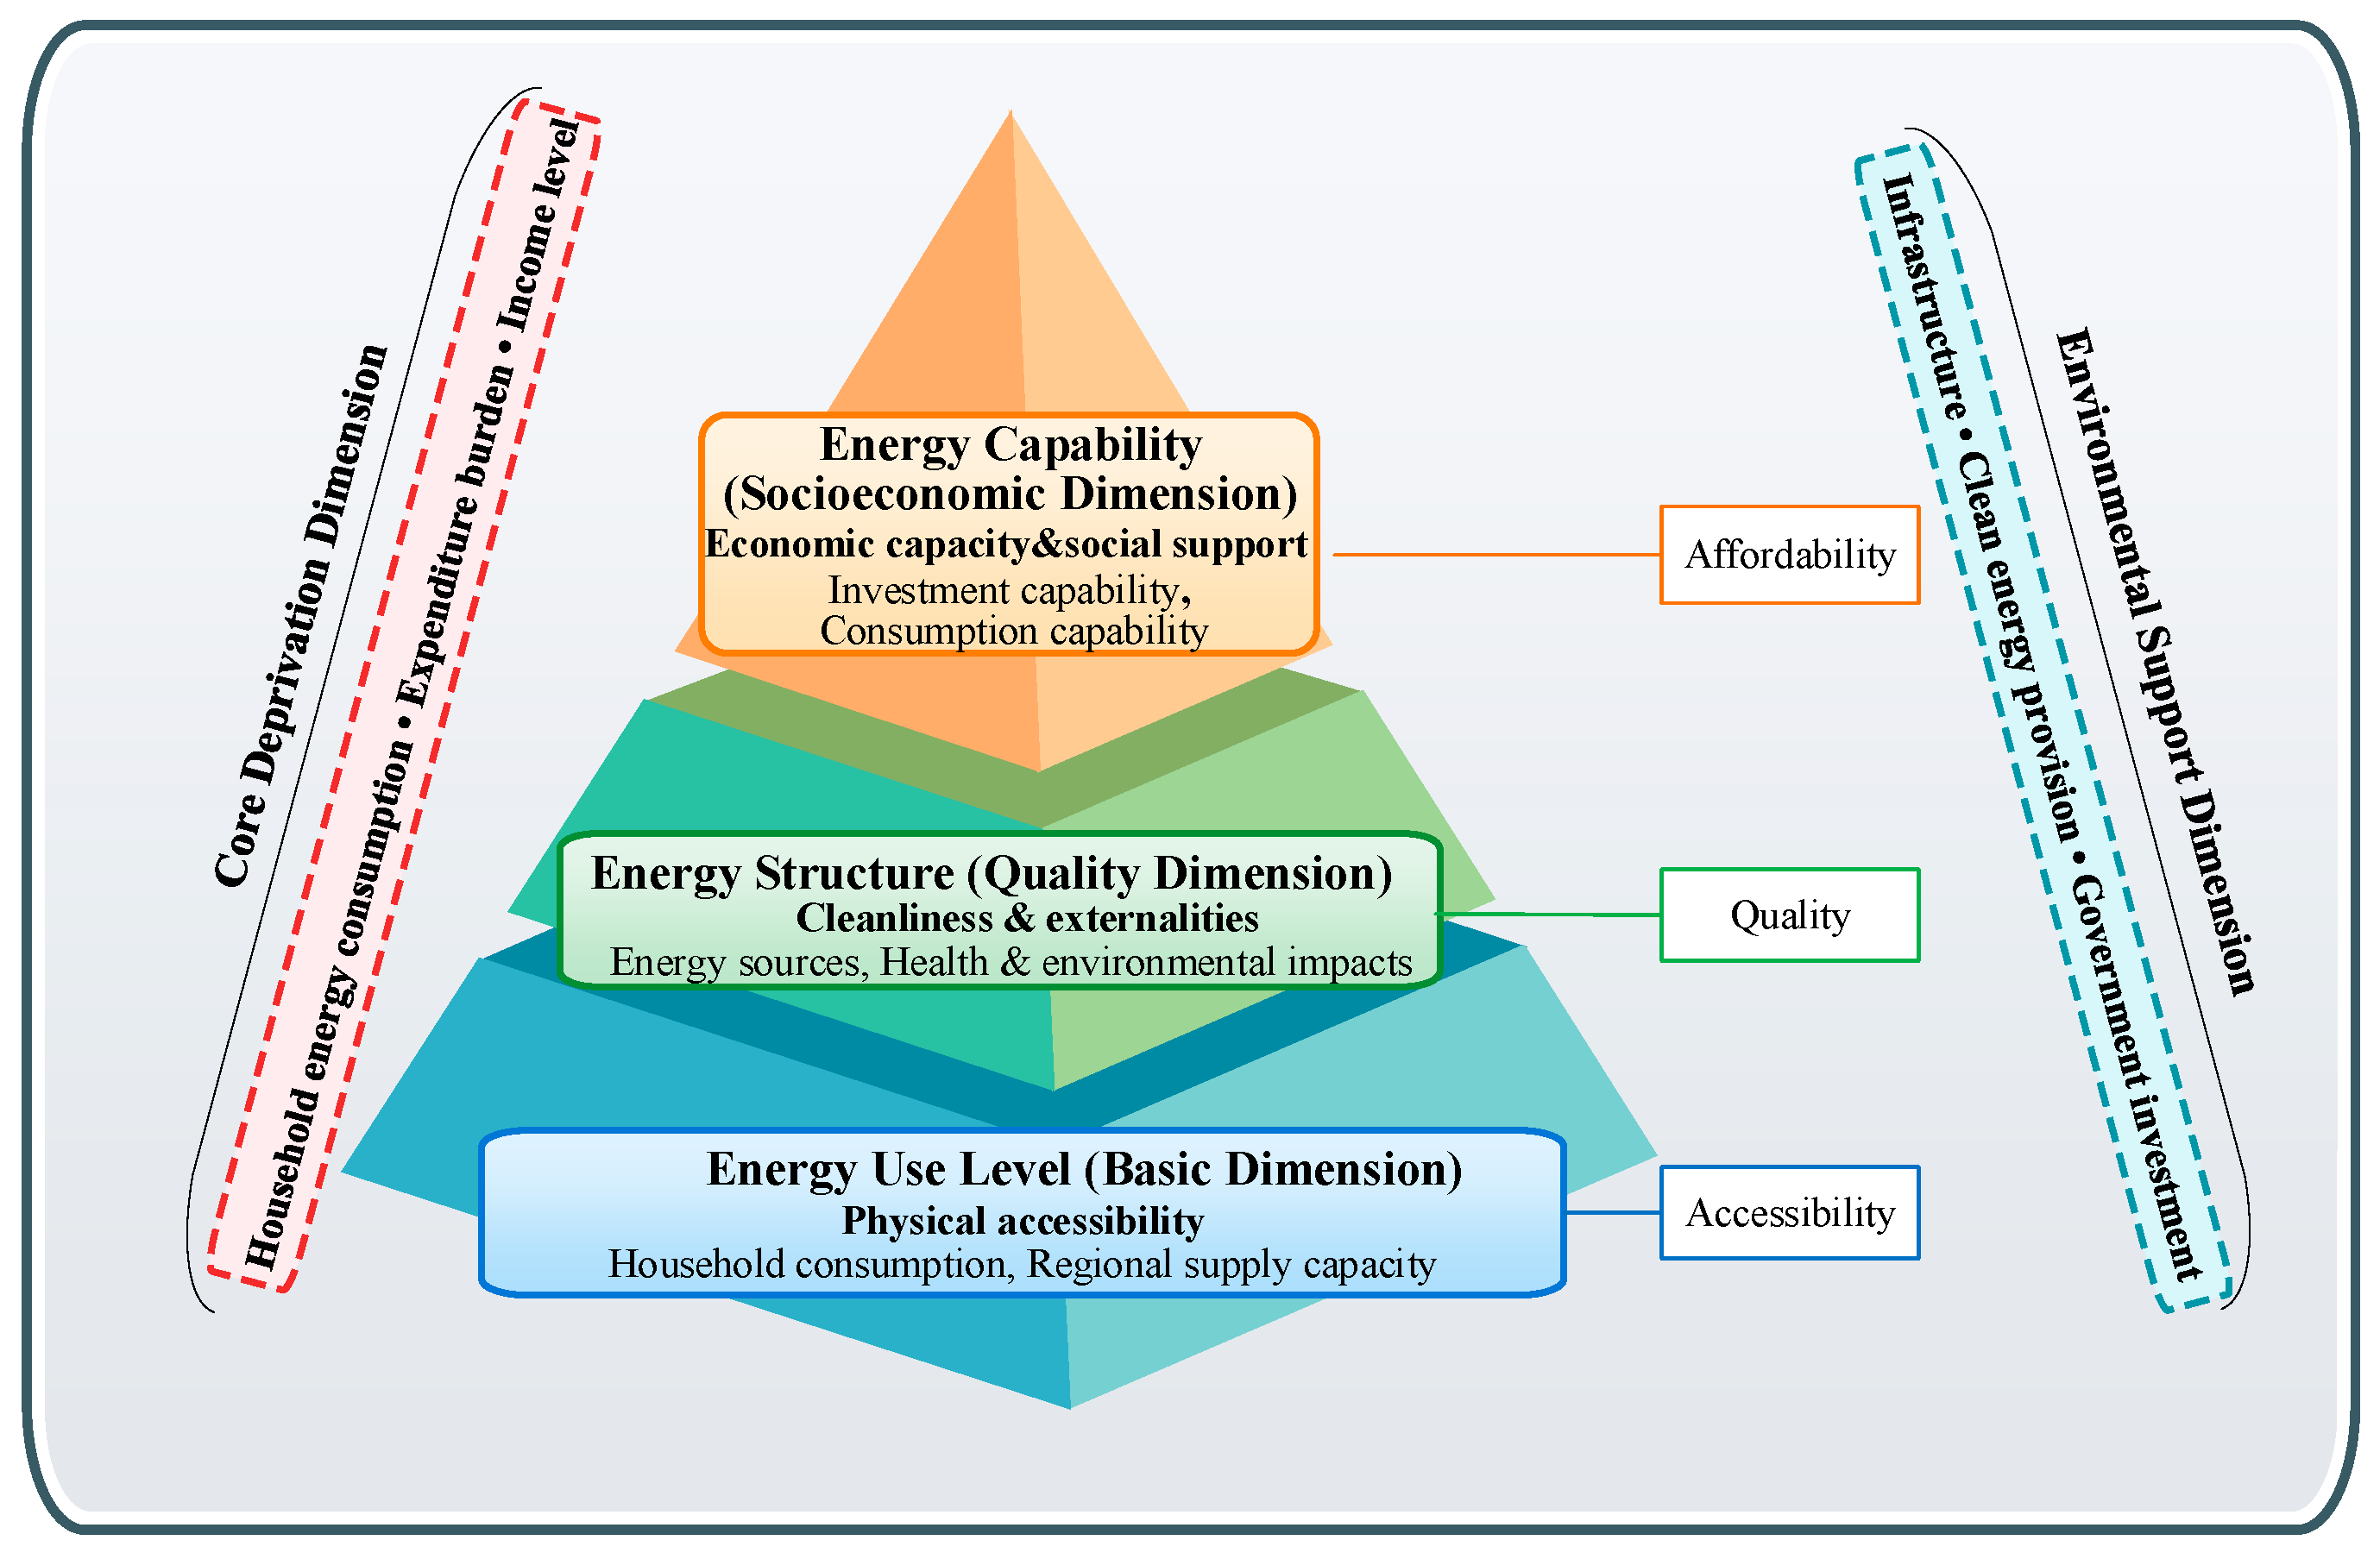
Building on this foundation, and considering the availability of provincial-level macro data in China, this study constructs a multidimensional analytical framework tailored to the Chinese context (as shown in Figure 1). This framework contains three core dimensions that are interrelated and sequentially reinforcing, together capturing the multifaceted nature of energy poverty:
Figure 1.
A Multidimensional Analytical Framework for Energy Poverty.
Energy use level. This constitutes the foundational dimension of energy deprivation, as it directly reflects the physical accessibility of energy services. It is shaped by both household energy use patterns and regional energy provisioning capacity, thereby addressing the fundamental question of “whether energy services are available in practice.” Energy structure. This dimension reflects the quality of energy services, including their cleanliness, degree of modernization, and associated externalities. It focuses on the composition of energy sources and their implications for health and the environment, essentially addressing “what is the quality of the energy used?” Even when supply is sufficient, a highly polluting and carbon-intensive energy structure may exacerbate substantive deprivation by harming health and environmental conditions. Energy capacity. This is the socioeconomic layer of energy poverty, reflecting residents’ economic ability and social support to access and continuously use energy. It is shaped by both regional energy investment capacity and households’ affordability of energy consumption, addressing “whether households can afford and sustainably use energy services.”
The provincial multidimensional EPI constructed in this study is an integrative indicator that combines direct household-level deprivation with regional supporting conditions. It consists of two logical layers. The first is the core deprivation layer, which includes factors such as household energy consumption, energy expenditure burden, and income level. The second is the environmental support layer, which incorporates energy infrastructure, clean energy supply, government investment, and environmental externalities. Together, these two layers jointly determine the energy poverty outcomes that households ultimately experience.
Building on multidimensional energy poverty theory and a spatial analytical perspective, the analysis proceeds with the following testable hypotheses:
H1.
China’s energy poverty exhibits significant spatial positive correlation and spatial clustering.
H2.
Inter-regional disparities constitute the primary source of overall energy poverty inequality.
H3.
The evolution of energy poverty displays path dependence and club convergence characteristics.
2.2. Indicators and Data Sources
Given that energy poverty in China is primarily manifested in three dimensions: energy utilization level, energy composition, and energy capacity [10,32,33], this study develops the EPI by constructing an evaluation index system based on these dimensions. Due to limitations in statistical reporting, some indicators such as urban natural gas consumption are available only for urban areas. To partially capture rural energy accessibility within the indicator framework, the analysis incorporates measures including rural power generation capacity and the coverage of rural solar water heaters. During data compilation, several indicators contain missing values for specific provinces or years, primarily in earlier periods or in remote regions where statistical information is incomplete. To ensure temporal continuity and comparability across provinces, missing values in time series are filled using linear interpolation when the gaps occur within the interior of the series. When the gaps appear at the beginning or the end of the series, nearest-neighbor interpolation or moving-average methods are applied. For isolated missing observations in cross-sectional data, for example, when a province lacks data in a particular year, imputation relies on observations from adjacent years for the same province or the average values of comparable provinces. The detailed indicator framework for the EPI is presented in Table 1.
Table 1.
EPI Indicator System.
- (1)
- Energy use level. This dimension captures household energy utilization by focusing on both actual consumption and supply-related capacity. Specifically, household energy use is measured using per capita residential electricity consumption and per capita residential natural gas consumption [34,35]. Energy supply capacity is proxied by a set of infrastructure-related indicators, including the urban gas penetration rate, rural power generation equipment capacity, and centralized heating supply per million urban residents [9,36]. Together, these measures reflect residents’ overall accessibility to energy.
- (2)
- Energy structure. This dimension reflects the level of low-carbon [10,37], serving as a key component in assessing energy poverty. For the low-carbon dimension, the selected indicators include the share of non-thermal power in total electricity generation, the proportion of natural gas in overall energy consumption, the per capita availability of solar water heaters in rural areas, and the number of public transport vehicles per capita in urban regions, reflecting the utilization of clean energy and public transport.
- (3)
- Energy capability. This dimension captures residents’ economic ability to obtain and consume energy, encompassing both energy investment capacity [33] and energy consumption capacity [38]. Energy investment capacity is measured by the level of government support for the energy sector, using per capita urban investment in gas production and supply, and per capita fixed asset investment in state-owned electricity and heat production and supply industries. Energy consumption capacity reflects residents’ affordability for energy use, measured by the share of household energy spending relative to total consumption, the average disposable income available to individuals in urban areas and that of residents in rural regions.
Energy poverty is not confined to rural areas but is also prevalent in urban settings. Accordingly, the indicator system is designed to capture both urban–rural heterogeneity in energy access and use. However, owing to data constraints in certain rural regions, several indicators were appropriately adjusted or omitted to ensure data consistency and comparability. Taking into account China’s distinctive patterns of energy distribution and utilization, this study focuses on 30 provincial-level administrative units, excluding Hong Kong, Macao, Taiwan, and Tibet. These provinces are classified into four broad geographic regions—eastern, central, western, and northeastern China—to facilitate a structured analysis of regional disparities. Based on this regional framework, panel data spanning the period from 2005 to 2020 are employed to investigate the spatial distribution and evolution of energy poverty across China. The empirical analysis is mainly based on official statistical publications, including the China Energy Statistical Yearbook, the China Statistical Yearbook, the China Environmental Statistical Yearbook, and the China Rural Statistical Yearbook. In addition, data are collected from statistical yearbooks published by individual provinces and municipalities to enhance data coverage and reliability.
2.3. Research Methods
2.3.1. Entropy Weight Method
As a widely used objective weighting approach, the entropy weight method determines indicator weights based on information entropy, which helps reduce subjective bias and enhances the reliability of composite index construction. Before weighting, all indicators are standardized according to their positive or negative orientations to remove scale effects arising from heterogeneous measurement units. Subsequently, the entropy measure of each indicator is computed to quantify its information contribution, which serves as the basis for deriving the corresponding weights. Specifically, positive indicators (marked “+”) are normalized as follows:
While negative indicators (marked “−”) are first inverted and then normalized as:
Here is the raw value of indicator for province , while and represent the corresponding extreme values across the full sample of provinces. Following normalization, all indicators are rescaled to the interval [0, 1], where lower values consistently reflect superior performance, corresponding to lower levels of energy poverty.
Finally, a weighted summation of all indicators is performed to obtain the annual EPI for each region. The core computational steps are as follows:
Equation (3) is used to calculate information entropy, where denotes the proportion of the evaluation object under the indicator , and is a constant. This equation is employed to measure the degree of information dispersion of each indicator among different evaluation objects. The larger the value of , the smaller the information difference of the indicator, and consequently, the less information it provides.
Equation (4) is applied to calculate the weight assigned to each indicator, where denotes the corresponding weight of indicator , reflecting its relative contribution to the overall evaluation results. By adjusting the variability of entropy values for each indicator, the relative importance of different indicators can be objectively determined.
2.3.2. Moran’s Index
The Global Spatial Autocorrelation approach is utilized to quantify the overall spatial aggregation features of provincial energy poverty levels, and its formula is presented below:
In Equation (5), refers to Global Moran’s I, representing the overall degree of spatial autocorrelation; refers to the number of provincial administrative units; is the mean value of energy poverty levels across provinces; and represent energy poverty levels in provinces and , respectively; and represents the spatial weight matrix between provinces.
The Local Spatial Autocorrelation further reveals the spatial heterogeneity and clustering characteristics of energy poverty across provinces, and its formula is expressed as follows:
In Equation (6), denotes the local Moran’s I of province ; and refer to the standardized energy poverty indices of provinces and , respectively. Based on the Local Moran’s I results, provinces can be classified into clustering categories including high–high (HH), low–low (LL), high–low (HL), and low–high (LH), which provides insights into the spatial dependence and regional heterogeneity of energy poverty in China.
2.3.3. Gini Coefficient
To systematically examine regional disparities in energy poverty, this study applies the Dagum decomposition of the Gini coefficient. Overall inequality is decomposed into within-group, between-group, and transvariation components, allowing for a detailed assessment of the spatial sources of inequality.
In Formula (7), represent the energy poverty levels of any province within regions , respectively; refers to the total number of provincial units; indicates the national average level of energy poverty; and correspond to the number of provinces contained within regions . The contribution rate is expressed as , corresponding to the effects of within-region disparities, between-region disparities, and transvariation intensity.
2.3.4. KDE
As a non-parametric statistical method, KDE can be used to analyze spatial non-equilibrium conditions. Suppose denote the probability density function of a random variable . Equation (6) then defines the estimated density at location . Here, denotes the observed value, indicates the sample size, is the bandwidth parameter, and denotes a kernel function that satisfies standard regularity assumptions. The specific computational formulation is presented as follows:
The bandwidth is selected using Silverman’s rule of thumb [39]:
Here, denotes the standard deviation, and represents the interquartile range.
The kernel function is specified as a Gaussian kernel [40], defined as:
Under these specifications, KDE can capture the distributional dynamics and evolutionary features of energy poverty across regions.
2.3.5. Markov Chain
The Markov chain is applied to study the stochastic transition laws of economic phenomena under conditions free from external interference. The specific formula is as follows:
In Formula (8), represents the number of energy-poverty spatial units that belong to type at time and transition to type at time ; denotes the total number of spatial units of type at time during the study period; and indicates the probability of spatial units transitioning from type to type at time . The energy poverty status is categorized according to the comprehensive EPI or its quantile classification into four levels: Class I—low energy poverty, Class II—moderate-low energy poverty, Class III—moderate-high energy poverty, and Class IV—high energy poverty. The spatial Markov chain incorporates spatial effects into the traditional Markov model by constructing a spatial conditional transition probability matrix. This approach links spatial neighborhood relationships with the temporal series of provincial energy poverty levels. The overall transition matrix is further divided into a conditional matrix, enabling the analysis of how surrounding regional energy poverty levels influence the spatial-temporal evolution of local energy poverty.
3. Empirical Analysis
3.1. Evaluation and Analysis of China’s EPI
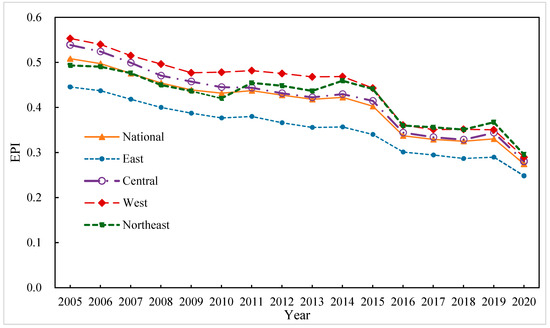
This research utilizes the entropy weighting approach to evaluate the EPI across 30 Chinese provinces from 2005 to 2020, where a higher index indicates a deeper degree of energy poverty and greater difficulty in accessing clean and modern energy. The national and regional trends of China’s EPI are shown in Figure 2. Overall, China’s EPI generally exhibits a declining trend. Rapid economic growth, which has boosted household disposable income and enhanced energy infrastructure, has significantly mitigated the challenges of energy access confronting Chinese households. The extent of energy poverty shows a negative correlation with the degree of economic development. As shown in Figure 2, the western, central, and northeastern regions demonstrate significantly higher levels of energy poverty than the national average, consistent with prior research findings [41,42]. Beyond economic factors, topography and geographic environment also play critical roles. Due to geographical and terrain constraints, developing energy resources in China’s western and northeastern regions proves more challenging and expensive, which leads to lower local energy accessibility. Moreover, as key national energy bases, the western and northeastern regions play a critical role in maintaining the country’s overall supply–demand balance. This functional positioning implies that, while these regions supply energy to other parts of the country, they may themselves face challenges such as insufficient local conversion and utilization of energy resources and relatively lagging infrastructure development. These constraints can indirectly affect households’ energy accessibility and affordability. Naturally, the emergence of energy poverty reflects the combined influence of multiple factors, including economic development, geographic conditions, and industrial structures. Compared with energy reserves, the level of economic development serves as a stronger determinant of regional energy poverty and sustainable development capacity. Rapid economic growth can largely offset resource deficits. For late-developing regions, leveraging resource endowments can enhance competitiveness and stimulate economic growth. However, it is essential to maintain a balance between energy exploitation and ecological protection.
Figure 2.
National and Regional Trends of China’s EPI.
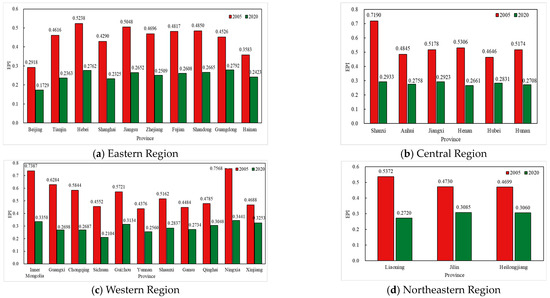
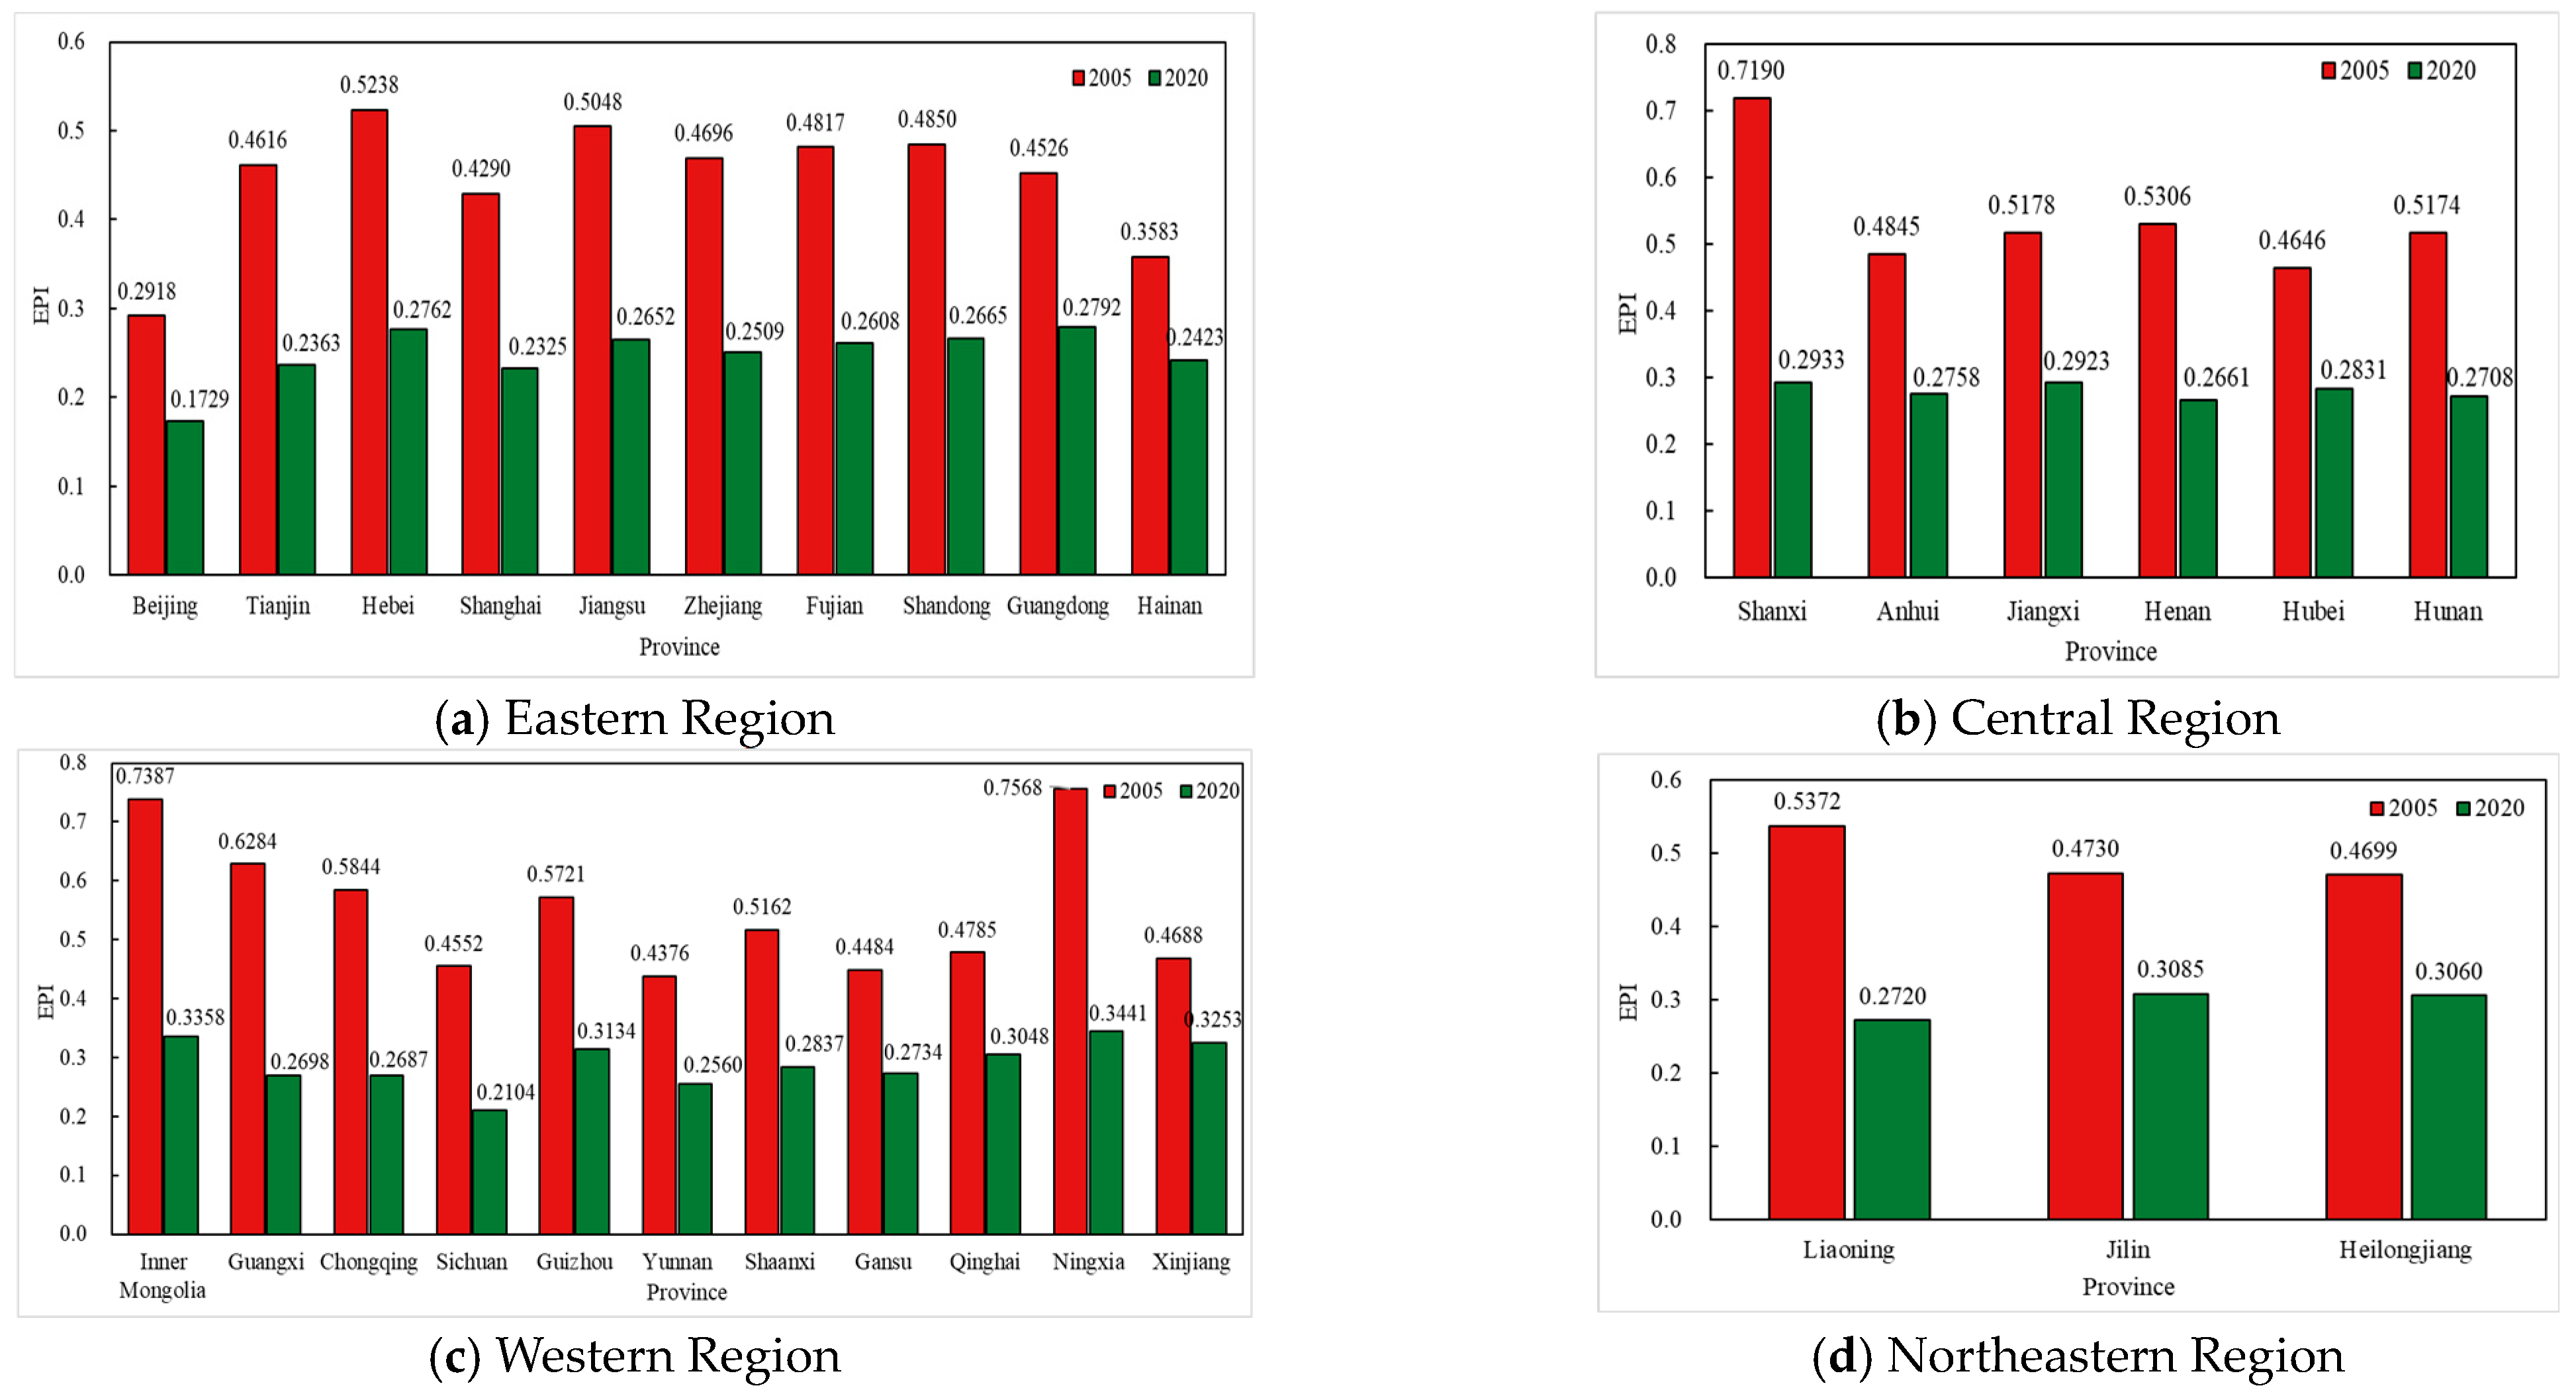
China’s overall energy poverty has declined, but it remains to some extent and exhibits notable regional disparities. To further uncover these variations, Figure 3 illustrates the regional analysis results of energy poverty conditions across different areas of the country.
Figure 3.
Regional Comparison of China’s EPI.
Eastern Region: Comparing the data from 2005 and 2020, in the early period, the EPI of all provinces in the eastern region, except Beijing, was above 0.3. Hebei, Jiangsu, Shandong, and Fujian showed the most severe energy poverty. By 2020, the energy poverty indices of all provinces had fallen below 0.3. In terms of the change trend, Tianjin, Hebei, Jiangsu, and Zhejiang achieved the most significant improvement, while Guangdong and Hainan showed the weakest progress. Because Beijing’s level of energy poverty was already low, its improvement was relatively modest.
Central Region: In the central region, Shanxi experienced the most serious energy poverty, while the other five provinces recorded indices of about 0.5 in 2005, which declined to around 0.3 by 2020. Among these provinces, Shanxi showed the greatest improvement, followed by Henan and Hunan, whereas Hubei exhibited the smallest reduction in energy poverty. Driven by the transformation of the energy structure, Shanxi achieved significant progress in the promotion of clean energy. Henan and Hunan, as provinces with large populations, initially suffered from insufficient energy access and lower income levels. Owing to the combined effects of targeted poverty alleviation, power grid upgrading, and the promotion of clean energy, the accessibility of modern energy services in both provinces has improved markedly, resulting in a clear downward trend in the EPI. In contrast, Hubei still shows considerable internal disparities, and some areas continue to have weak energy infrastructure, leading to slower progress. As a typical resource-based province, Shanxi has a high dependence on coal and still faces the risk of energy poverty during its energy transition. Through optimizing the energy structure, promoting green and low-carbon development, and improving safeguard mechanisms, Shanxi’s experience provides important lessons for other energy-oriented provinces seeking sustainable transformation.
Western Region: The overall level of energy poverty in the western region remains relatively high, reflecting persistent inadequacies in energy accessibility and utilization conditions. Nevertheless, the improvement trend is evident. Ningxia, Inner Mongolia, and Guangxi have achieved the most substantial progress in reducing energy poverty, primarily due to the sustained advancement of new energy development, rural power grid upgrading, and energy poverty alleviation initiatives. As a national comprehensive energy demonstration zone, Ningxia has rapidly increased the share of clean energy. Inner Mongolia has made remarkable progress in optimizing its energy structure through the large-scale construction of wind and photovoltaic power bases. Guangxi has benefited from the “West-to-East Power Transmission” program and rural energy projects, resulting in a significant enhancement of energy availability. In contrast, regions such as Xinjiang, Gansu, and Qinghai in northwestern China have experienced smaller improvements. Due to complex geographical conditions, weak infrastructure, and limited capacity for clean energy transmission, economic development remains constrained, and the adjustment of the energy structure is relatively difficult. Consequently, the improvement of energy services in rural and remote areas has been comparatively slow.
Northeastern Region: The three northeastern provinces show relatively small differences in their energy poverty indices, yet their overall improvement is less pronounced than that of the central and western regions. Three main factors account for this outcome. First, the transition of regional energy structures has proceeded slowly, as fossil fuels and traditional biomass continue to dominate the energy mix while the replacement by clean energy remains limited. Second, the region has not fully leveraged the favorable policies for revitalizing Northeast China, resulting in sluggish economic growth and incomplete infrastructure development. Third, the serious outflow of population, insufficient innovation capacity, and low efficiency in energy development and utilization have hindered the full realization of technological progress as a driving force for regional energy transformation.
3.2. Regional Disparities and Sources of Energy Poverty Levels
3.2.1. Spatial Autocorrelation Analysis
To further investigate the regional disparities and spatial distribution patterns of energy poverty, this study draws on previous studies [43,44], employs a spatial contiguity weight matrix, and applies the Global Moran’s I to assess the spatial autocorrelation and clustering characteristics of energy poverty. The contiguity-based spatial weight matrix serves as the benchmark specification, while the robustness analysis examines whether adopting an economic distance matrix alters the estimated spatial effects. The results are reported in Table 2.
Table 2.
Global Moran’s I.
As reported in Table 2, the overall Moran’s I values for energy poverty in China remain significantly positive throughout the period 2005–2020, indicating the presence of spatial dependence. Provinces with comparable levels of energy poverty tend to be geographically clustered. The persistence of positive Moran’s I values over time points to a stable pattern of spatial clustering at the provincial level.
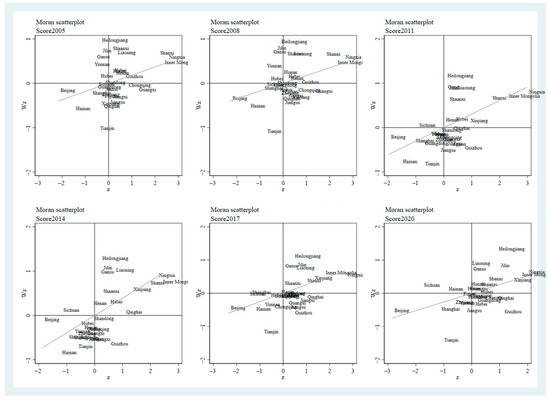
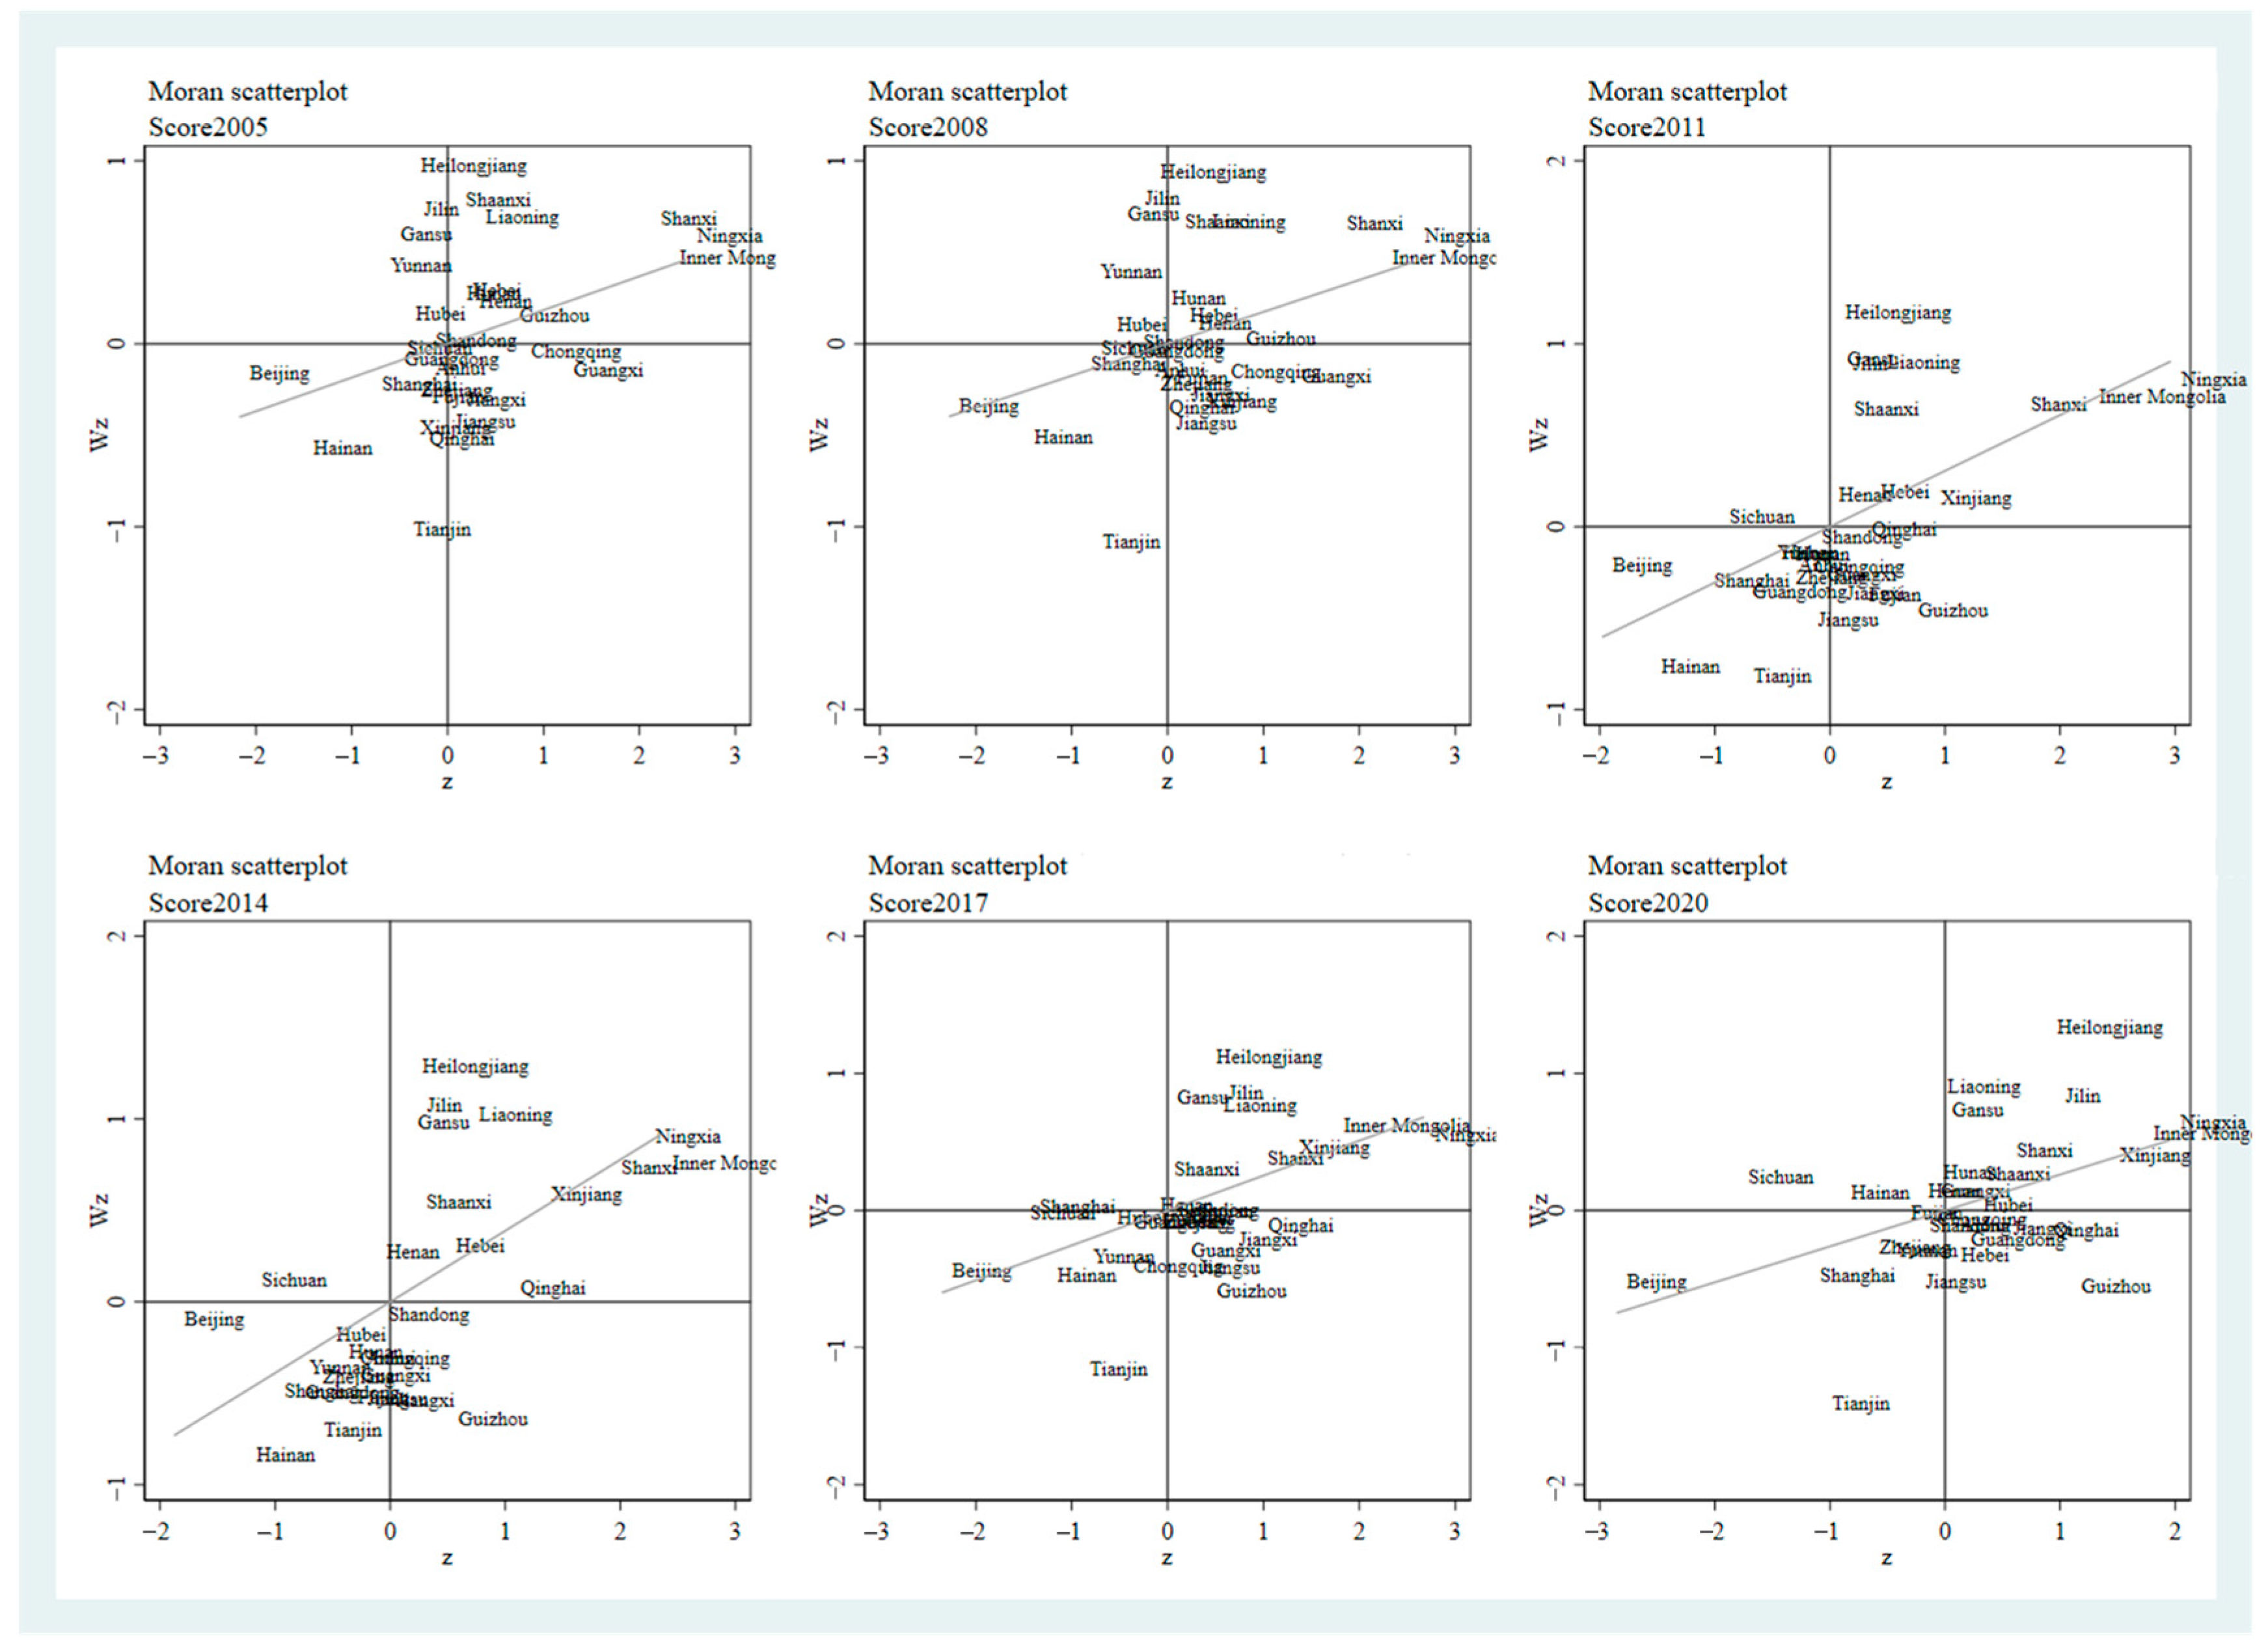
To further examine the internal spatial structure of energy poverty, local Moran’s I statistics were applied. In this framework, HH denotes provinces with high energy poverty surrounded by similarly high-poverty neighbors, whereas LL characterizes clusters of uniformly low energy poverty. HL refers to high-poverty provinces adjacent to low-poverty areas, and LH represents the opposite configuration. As illustrated in Figure 4, northwestern provinces—including Shanxi, Inner Mongolia, Ningxia, and Xinjiang—together with Heilongjiang in the northeast, predominantly fall within the first quadrant, forming persistent HH clusters over most years. These regions are largely resource-dependent and dominated by energy-intensive heavy industries. Despite abundant energy endowments, long-standing national energy supply obligations, coupled with relatively undiversified industrial structures and underdeveloped infrastructure, have reinforced the spatial concentration of energy poverty. By contrast, economically advanced coastal provinces such as Beijing, Tianjin, Shanghai, Hainan, and Guangdong are mainly located in the third quadrant, exhibiting clear LL characteristics. This pattern reflects relatively low levels of energy poverty and strong positive spillovers from neighboring regions, supported by solid economic foundations, advanced energy infrastructure, and more effective energy governance. Meanwhile, several provinces in central and southwestern China—most notably Guizhou, Guangxi, and Yunnan—intermittently appear in the HL or LH categories, indicating spatial mismatches and transitional dynamics in regional energy poverty. Overall, the spatial clustering of energy poverty in China displays pronounced regional heterogeneity, with a clear contrast between resource-dependent provinces in the northwest and north and economically developed coastal regions in the east. Accordingly, policies aimed at alleviating energy poverty should adopt a differentiated regional approach within a unified national framework. Resource-based provinces should prioritize strengthening local energy utilization and infrastructure development; eastern developed regions can play a supportive role by providing technological and financial assistance; and central and western regions should enhance interregional energy connectivity and expand access to clean energy. These coordinated efforts are essential to promote more equitable access to energy services and advance the goal of common prosperity.
Figure 4.
Local Moran’s I Map.
3.2.2. Overall Disparities and Regional Decomposition
After establishing that energy poverty exhibits notable spatial dependence within China, this study further measures and decomposes regional disparities and their sources by employing the Gini coefficient, drawing on the analytical frameworks proposed by Bu et al. [45] and Xue et al. [46]. Based on this analysis, the analysis investigates how regional variation in China’s energy poverty has developed and what factors account for these patterns. A summary of the computations is provided in Table 3.
Table 3.
Gini Decomposition.
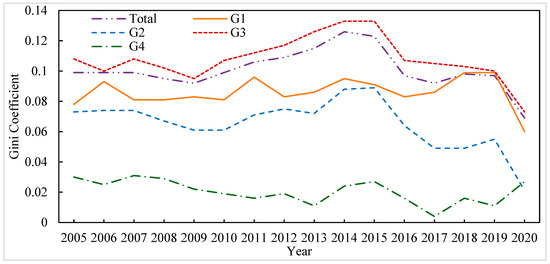
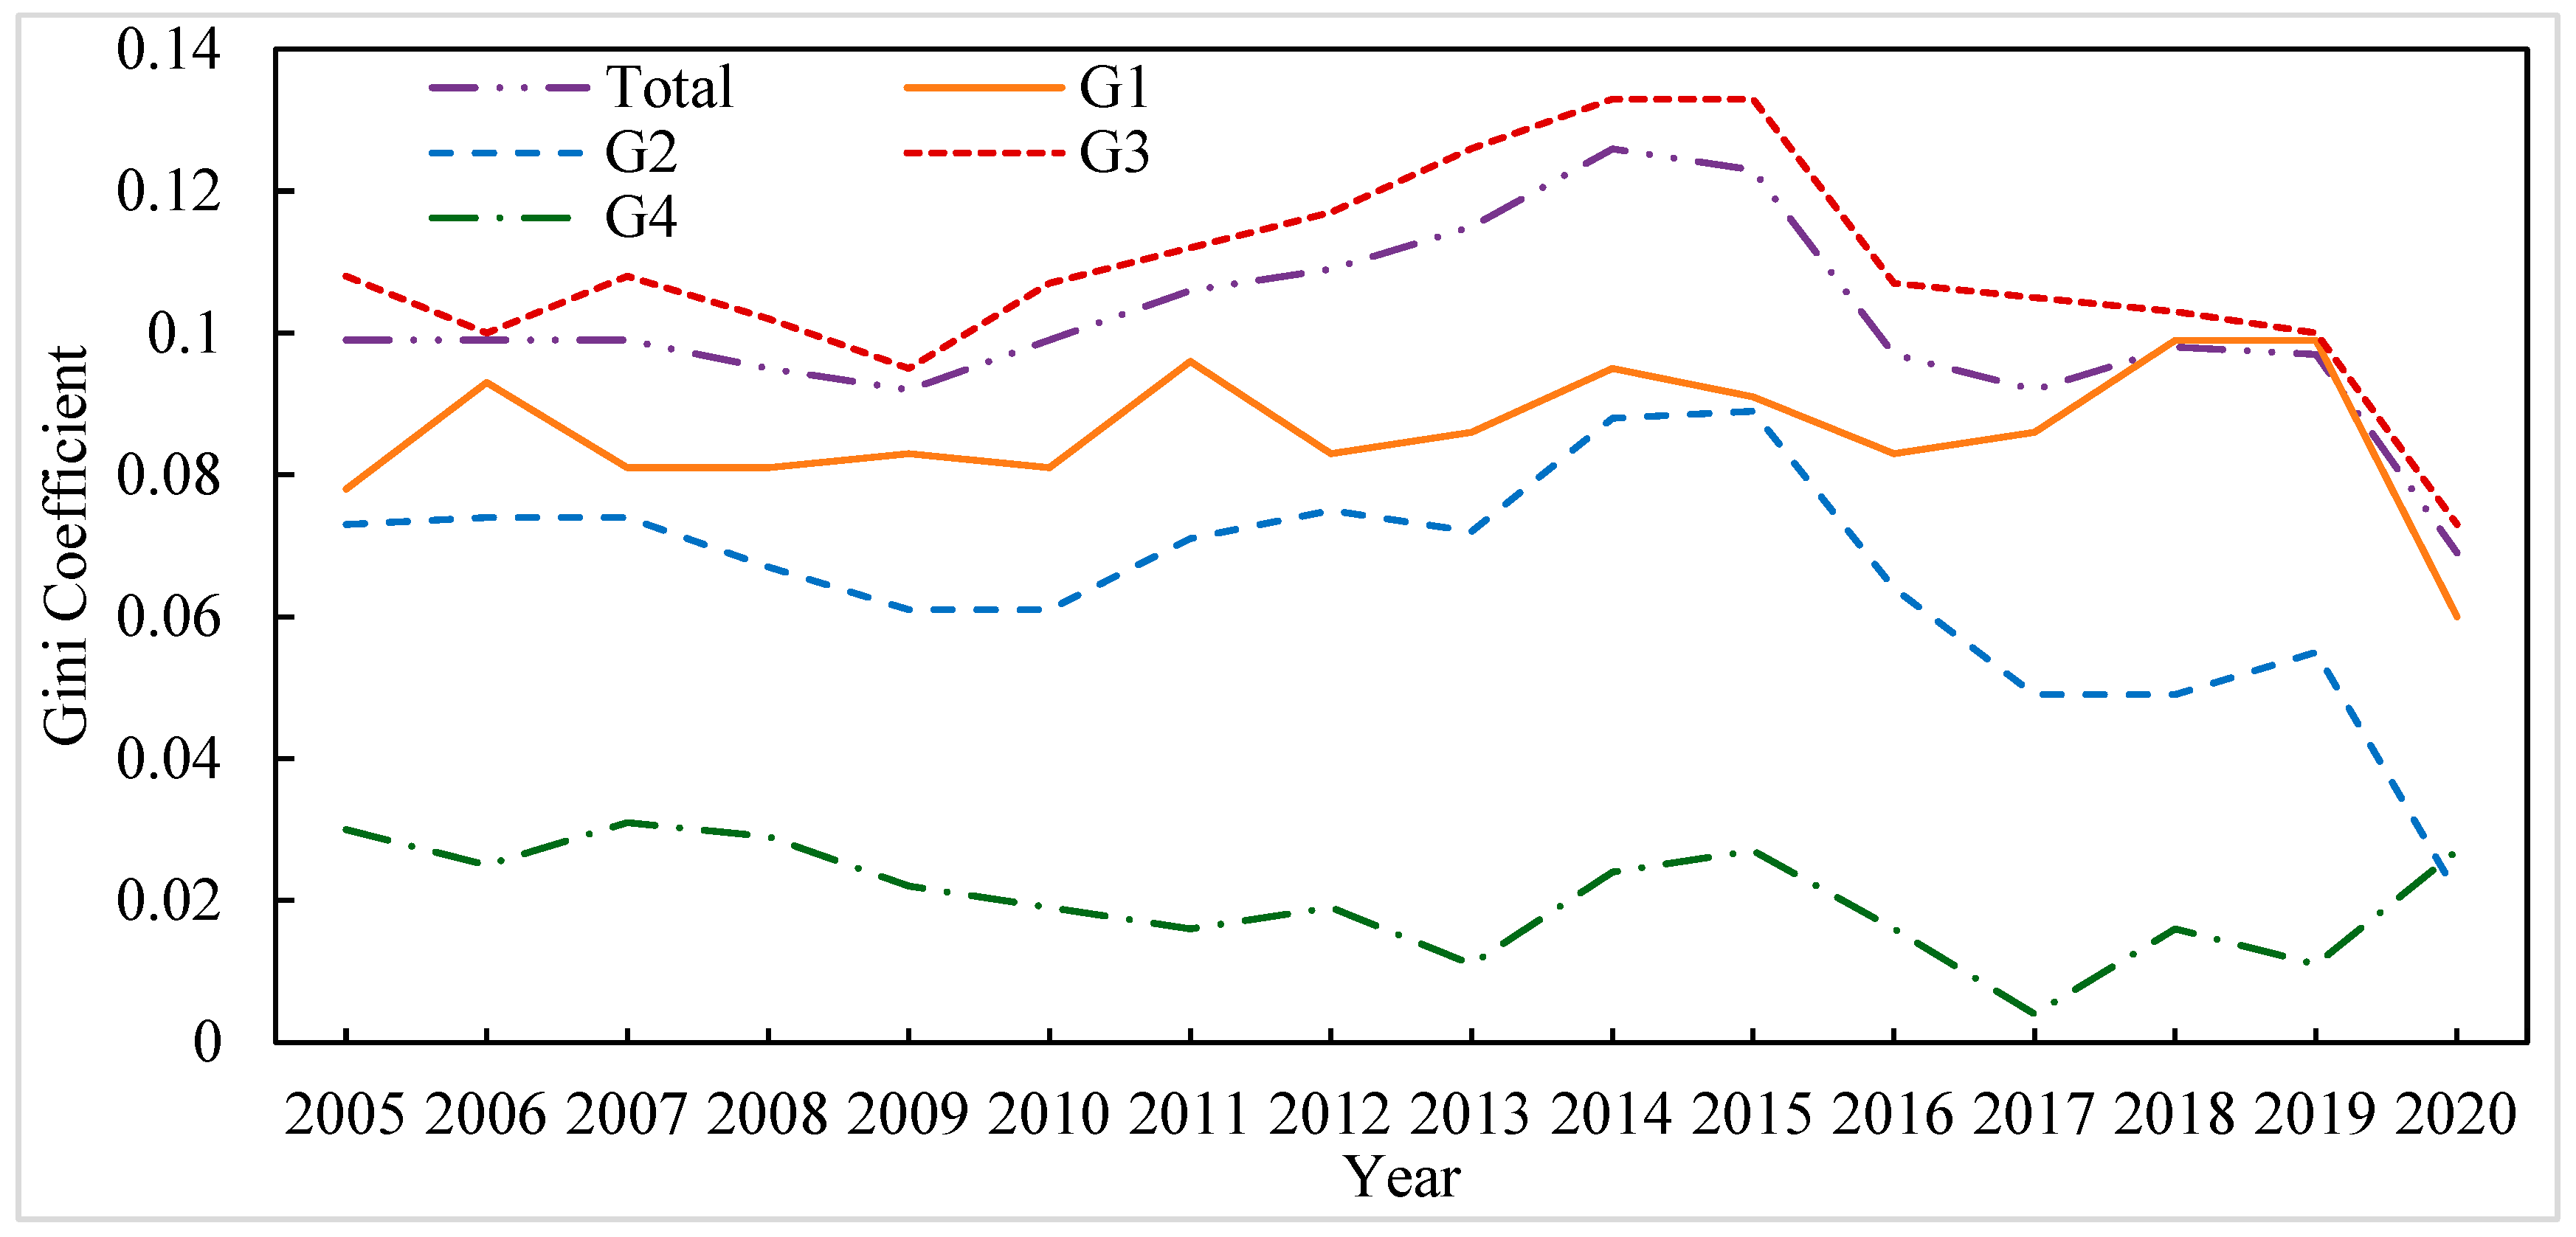
As shown in Figure 5, the overall and intra-regional disparities in China’s EPI from 2005 to 2020 exhibit a pattern of initial expansion followed by convergence. The national Gini coefficient increased from 0.092 in 2009 to a peak of 0.126 in 2014 and then gradually declined to 0.069 in 2020, indicating a general narrowing of regional disparities in energy poverty across the country. At the regional scale, the eastern and western regions exhibit noticeable fluctuations, with disparities widening before 2014–2015 and converging thereafter. In contrast, the central and northeastern regions show relatively low levels of internal disparity throughout the period. The central region experienced a cyclical “decline–increase–decline” trend, while the northeastern region exhibited a slow but steady decrease followed by a mild rebound in the later years. Overall, these results suggest that regional disparities in China’s energy poverty have continued to narrow, and the trend toward coordinated improvement across regions has become increasingly evident.
Figure 5.
Intra-regional Differences.
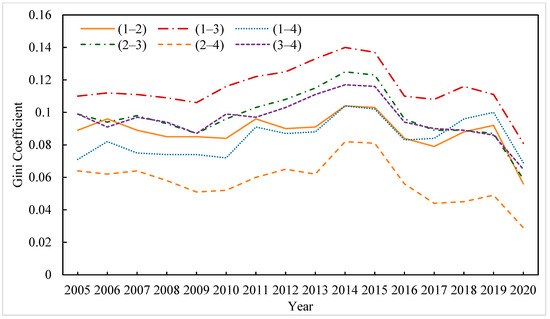
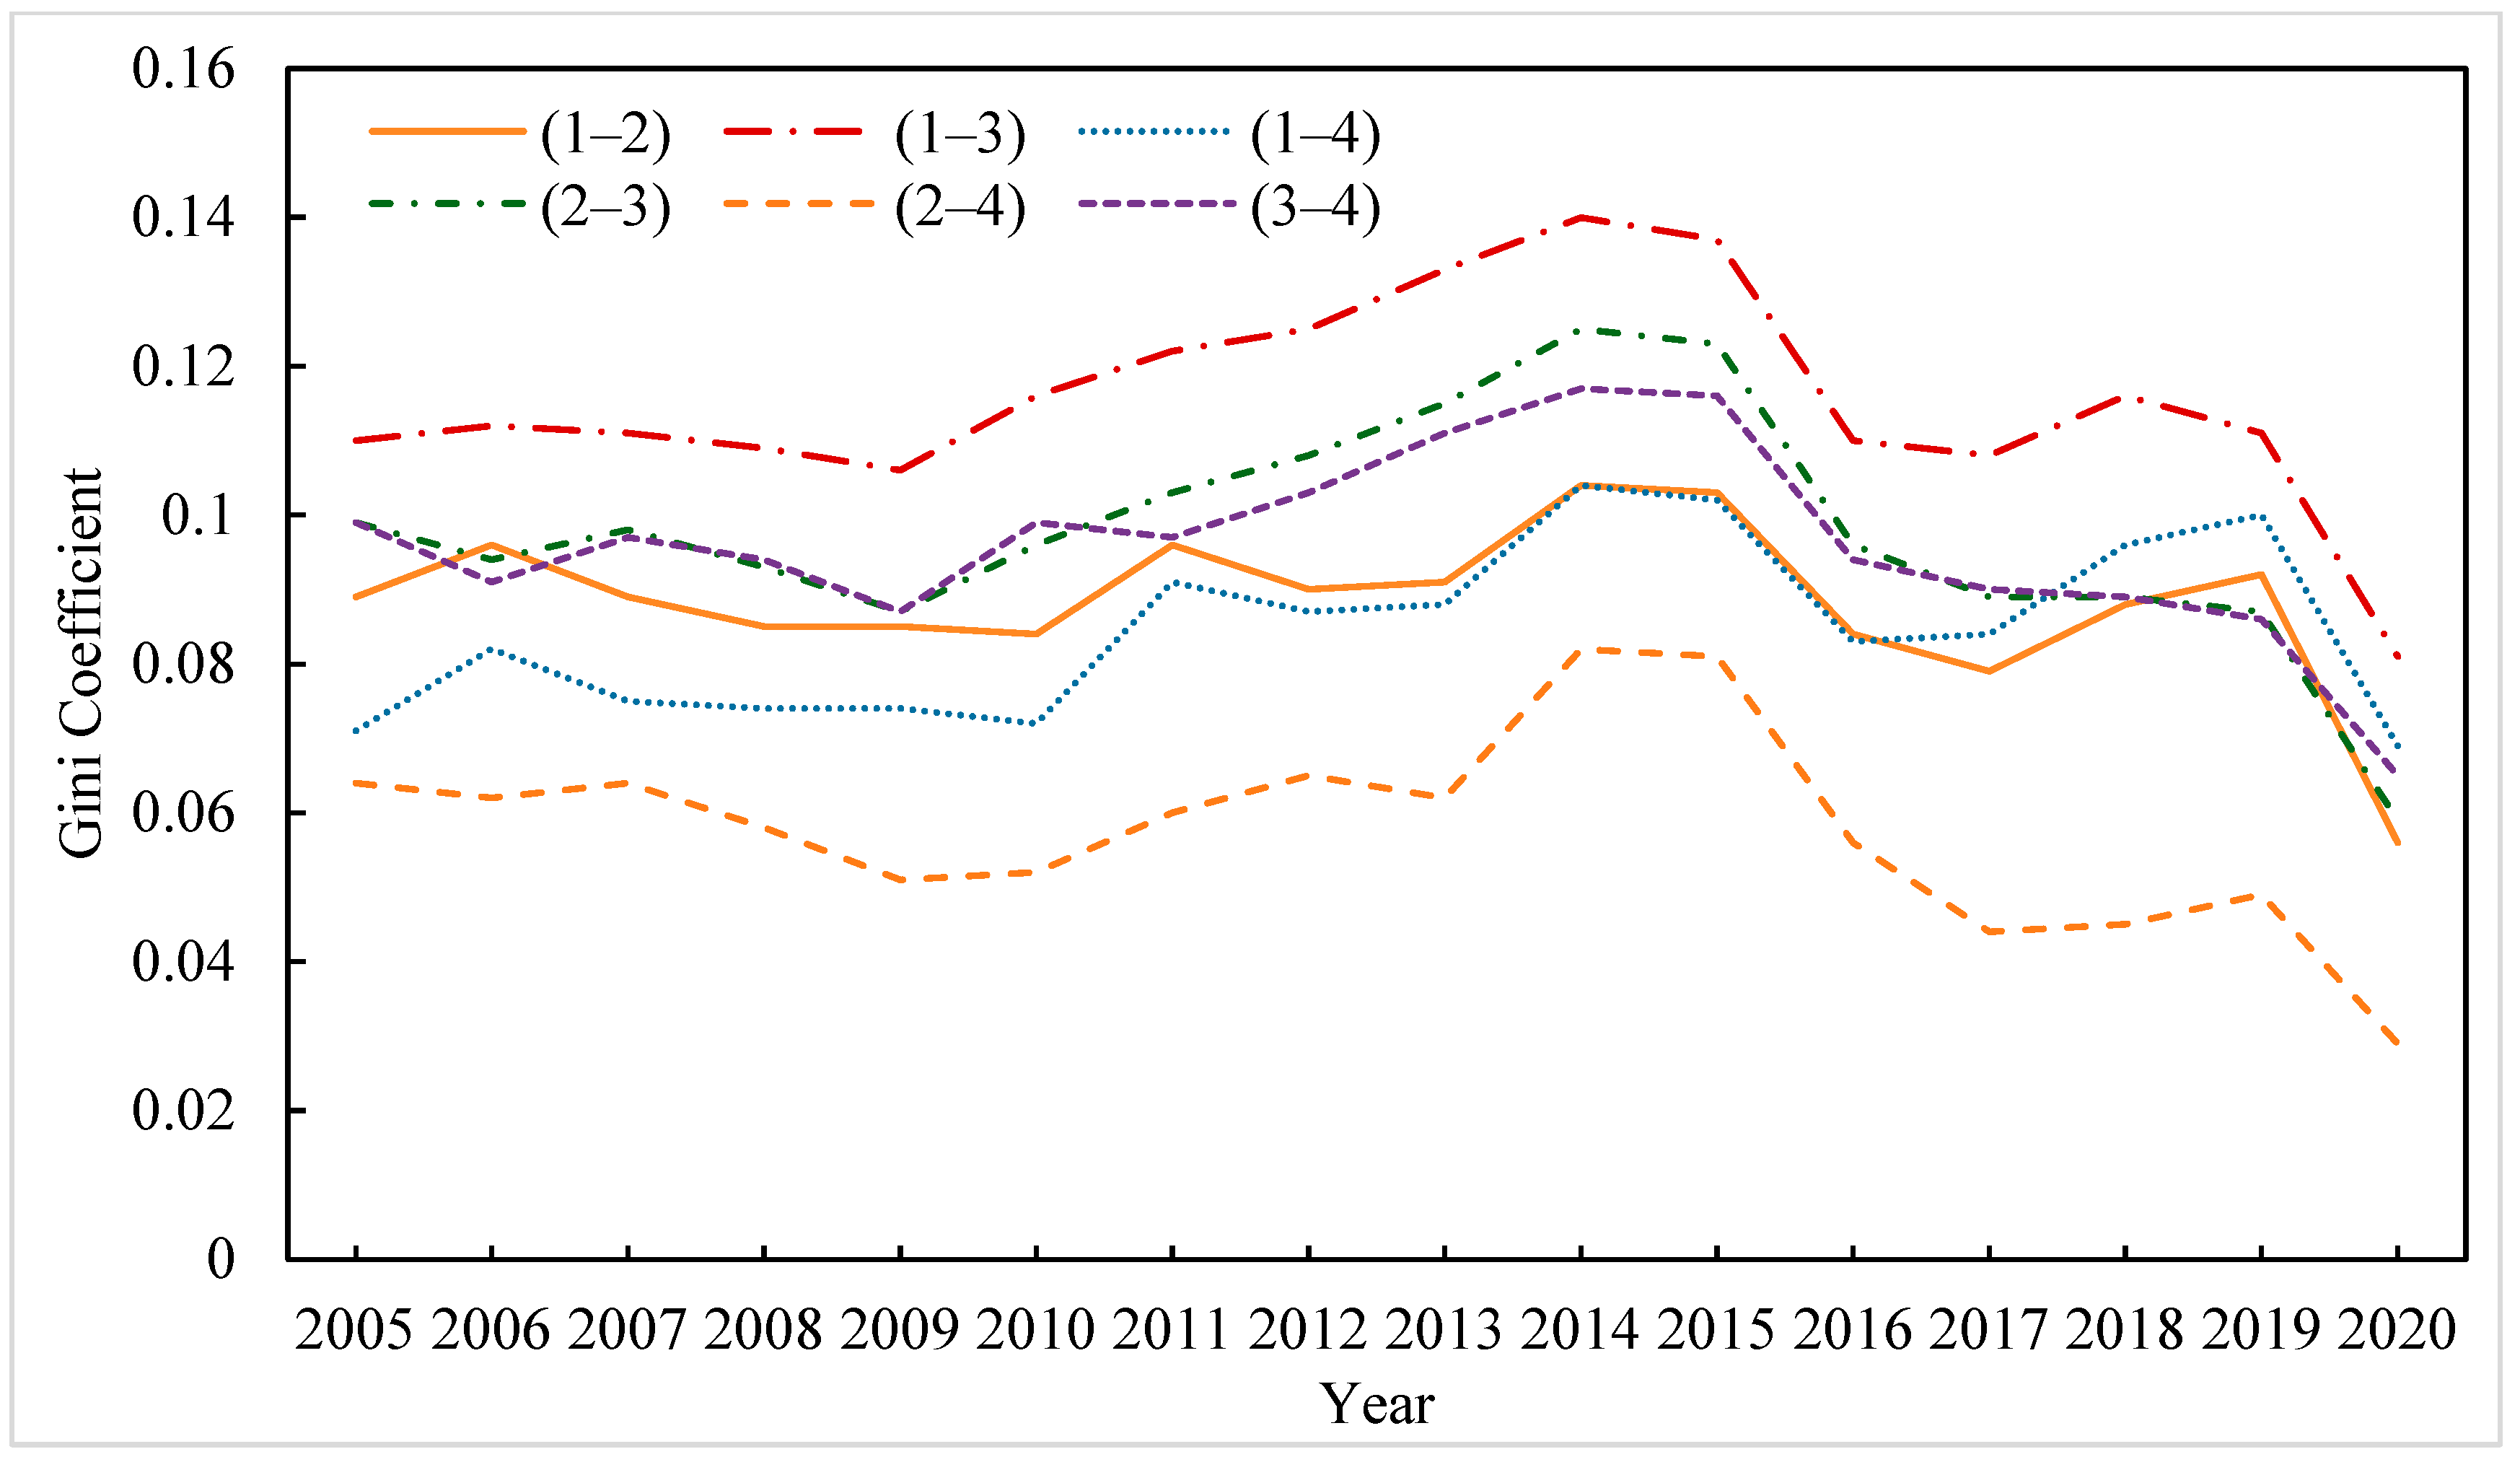
Figure 6 illustrates temporal changes in regional energy poverty disparities across China’s eastern (1), central (2), western (3), and northeastern (4) regions from 2005 to 2020. At the regional-pair level, the disparity between the eastern and western regions (1–3) is the most pronounced. Its Gini coefficient increased from 0.110 in 2005 to a peak of 0.140 in 2014, which was the highest among all pairs, before declining to 0.081 in 2020. The central–western (2–3) and western–northeastern (3–4) disparities rank next, with their coefficients increasing to 0.125 and 0.117 in 2014, respectively, before declining to 0.059 and 0.065 by 2020. This indicates a notable narrowing of energy poverty gaps between the western region and the central and northeastern regions after a period of elevated disparity. The eastern–central (1–2) and eastern–northeastern (1–4) gaps are comparatively smaller, peaking at 0.104 in 2014 and decreasing to 0.056 and 0.069 in 2020. The central–northeastern (2–4) pair shows the smallest disparity throughout the period, with the Gini coefficient rising from 0.064 in 2005 to 0.082 in 2014 and falling sharply to 0.029 in 2020. In summary, regional disparities in energy poverty expanded from 2005 to 2014 but exhibited a clear convergence trend after 2014, driven by policies promoting coordinated regional development and energy poverty alleviation.
Figure 6.
Inter-regional Differences.
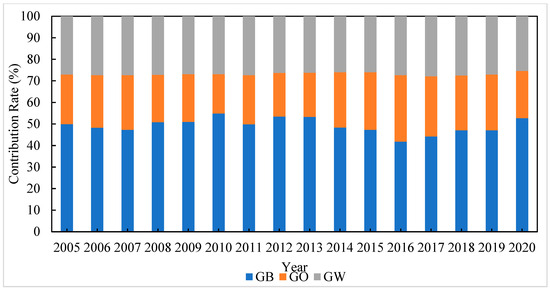
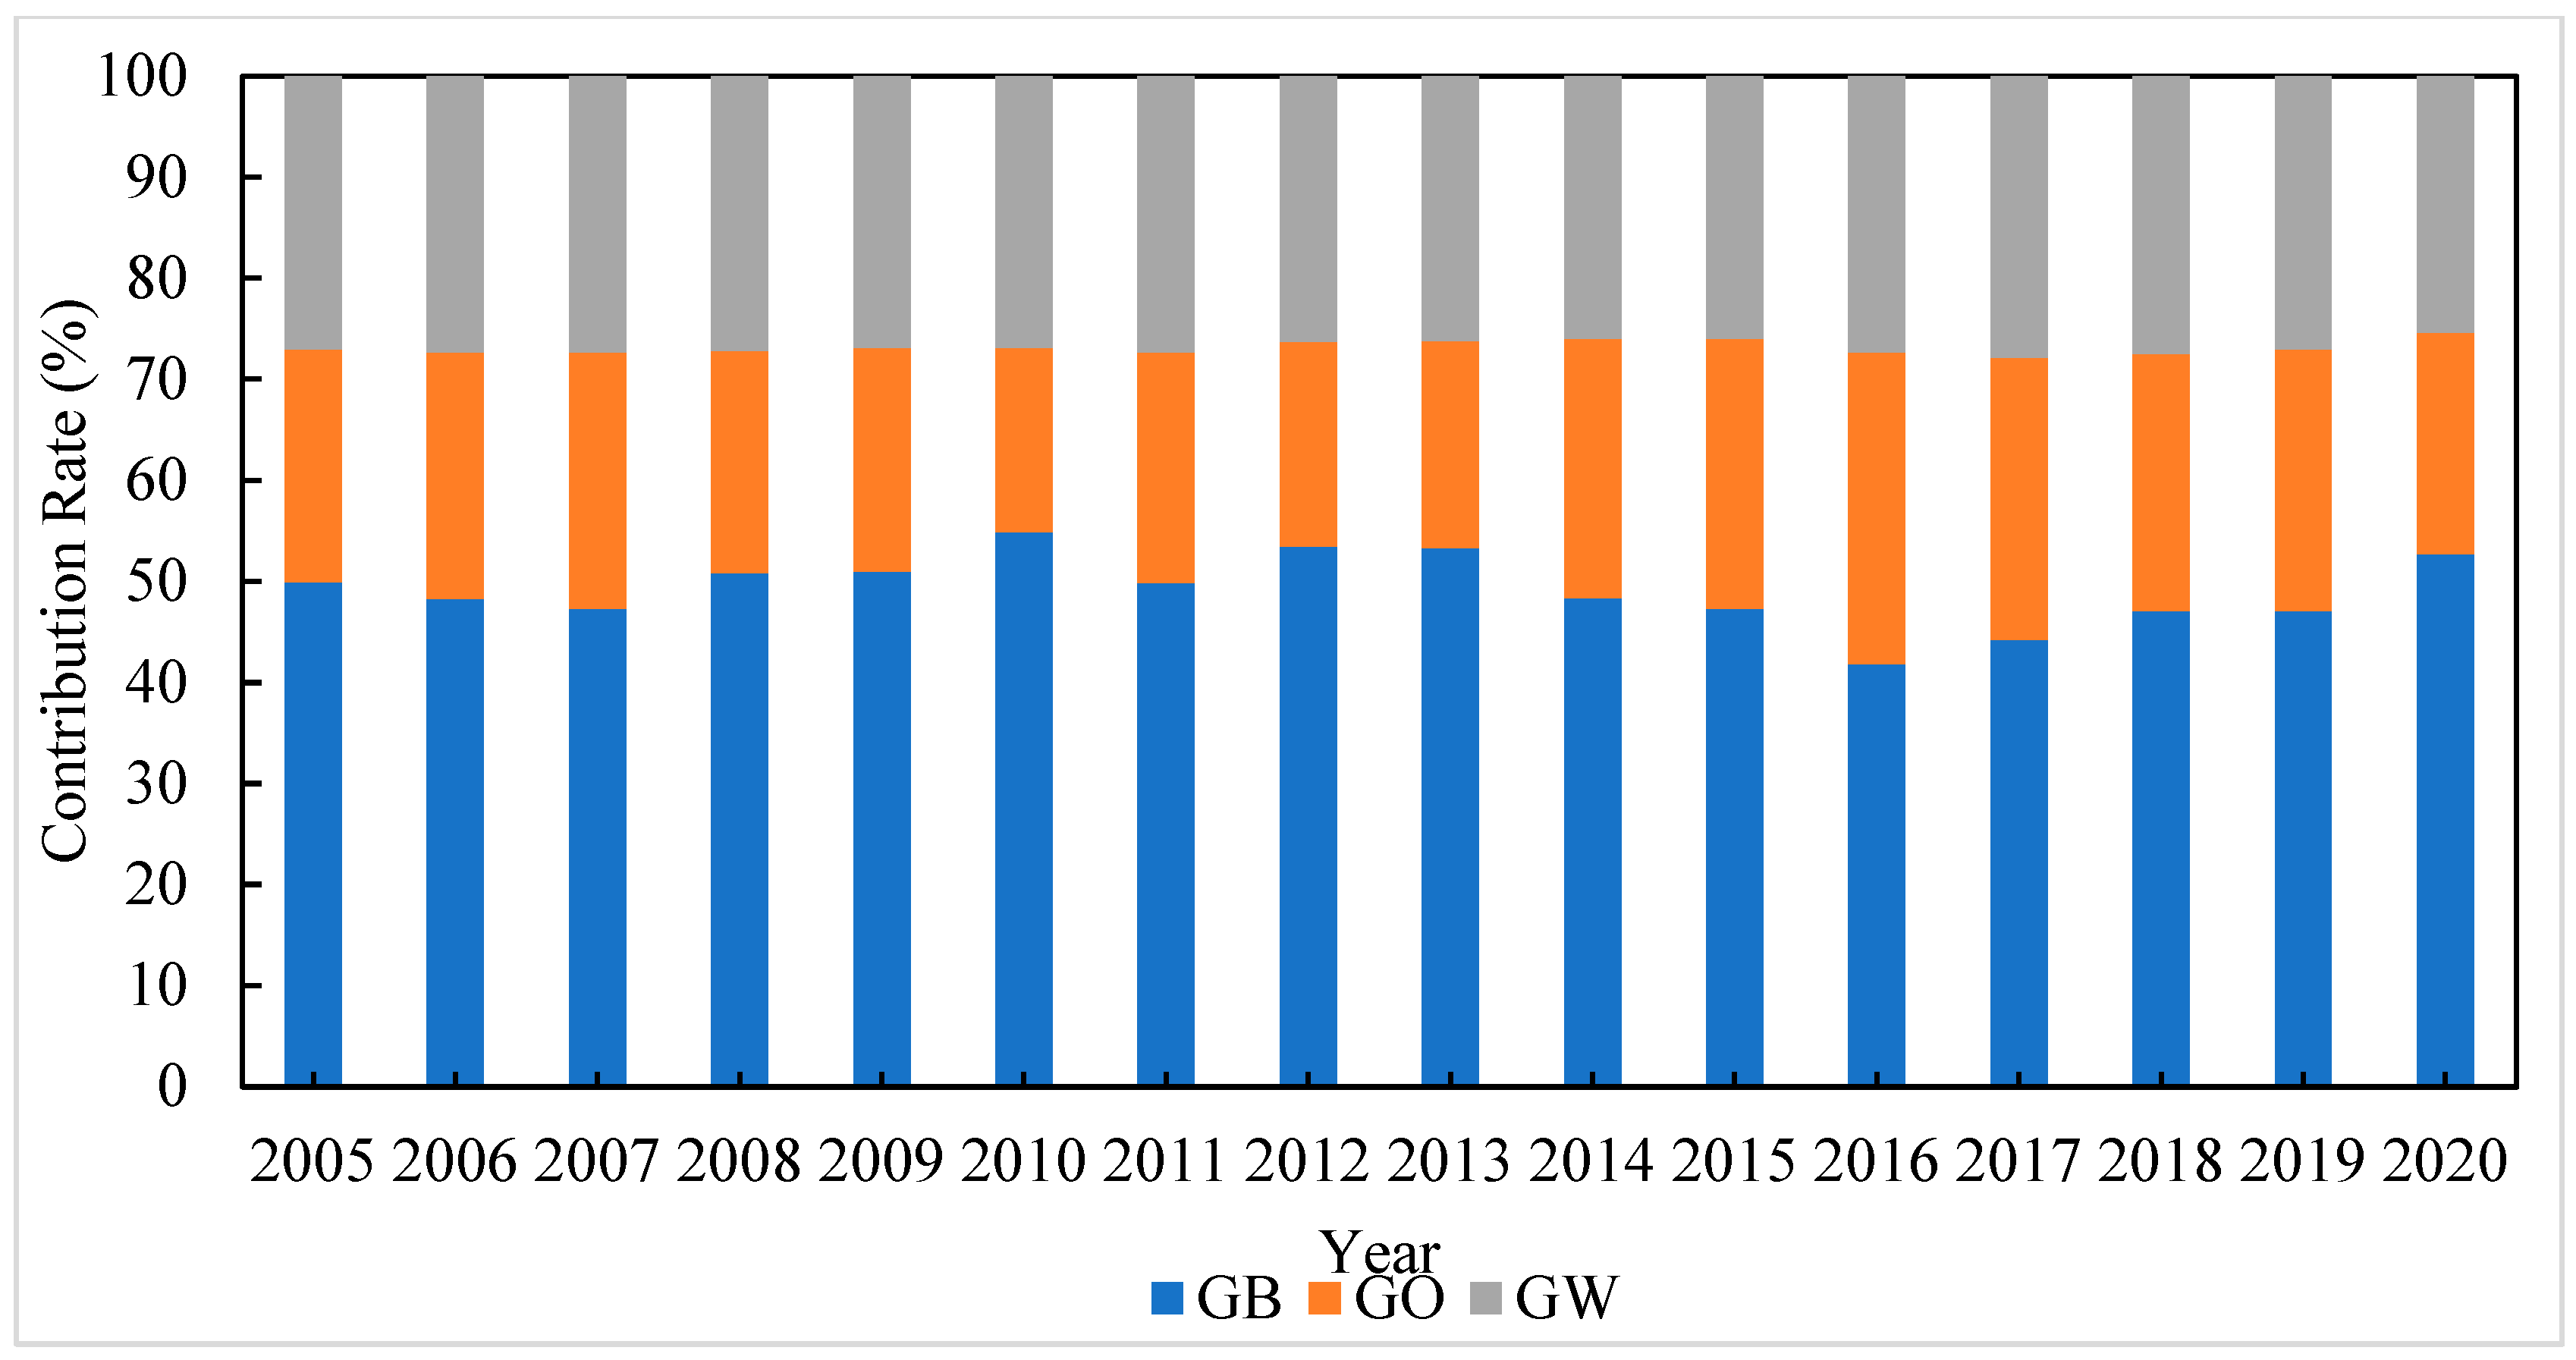
Figure 7 illustrates the sources of disparities in China’s EPI from 2005 to 2020. Overall, interregional differences consistently accounted for the largest share, generally ranging between 45% and 55%. Specifically, the contribution rate increased slightly from 49.93% in 2005 to 54.83% in 2010, declined to a low of 41.77% in 2016, and then rose again to 52.68% in 2020. This pattern indicates that regional disparities have remained the dominant source of variation in China’s energy poverty levels. The contribution of transvariation intensity fluctuated mainly between 20% and 30%, showing a pattern of gradual increase followed by decline. It rose from 23.00% in 2005 to 30.88% in 2016, and then steadily decreased to 21.90% in 2020. This suggests that disparities arising from interregional overlaps and “outlier” provinces have weakened over time, resulting in a clearer spatial gradient across regions. The contribution of intraregional differences remained relatively stable, hovering around 25–28%, which implies that disparities among provinces within the same region exerted a comparatively consistent influence on the overall variation in energy poverty. In summary, during 2005–2020, the average contribution rates of interregional differences, transvariation intensity, and intraregional differences were 49.19%, 23.95%, and 26.86%, respectively. The markedly higher interregional contribution confirms that disparities between regions are the primary source of China’s overall energy poverty inequality.
Figure 7.
Contribution to Overall Disparity.
3.3. Distributional Dynamics and Evolution of Energy Poverty
3.3.1. Distributional Dynamics
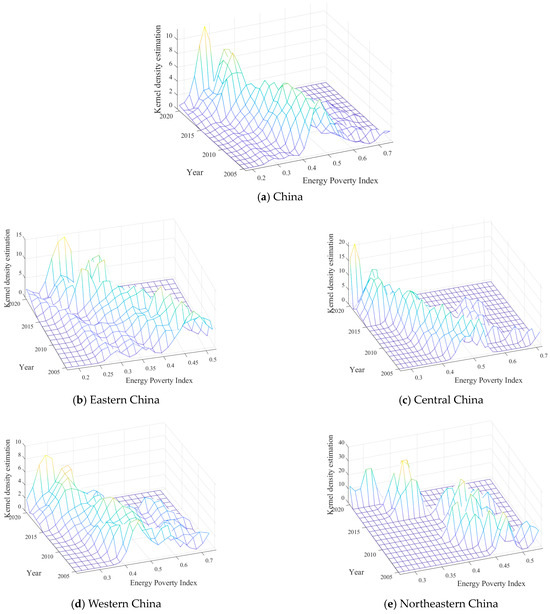
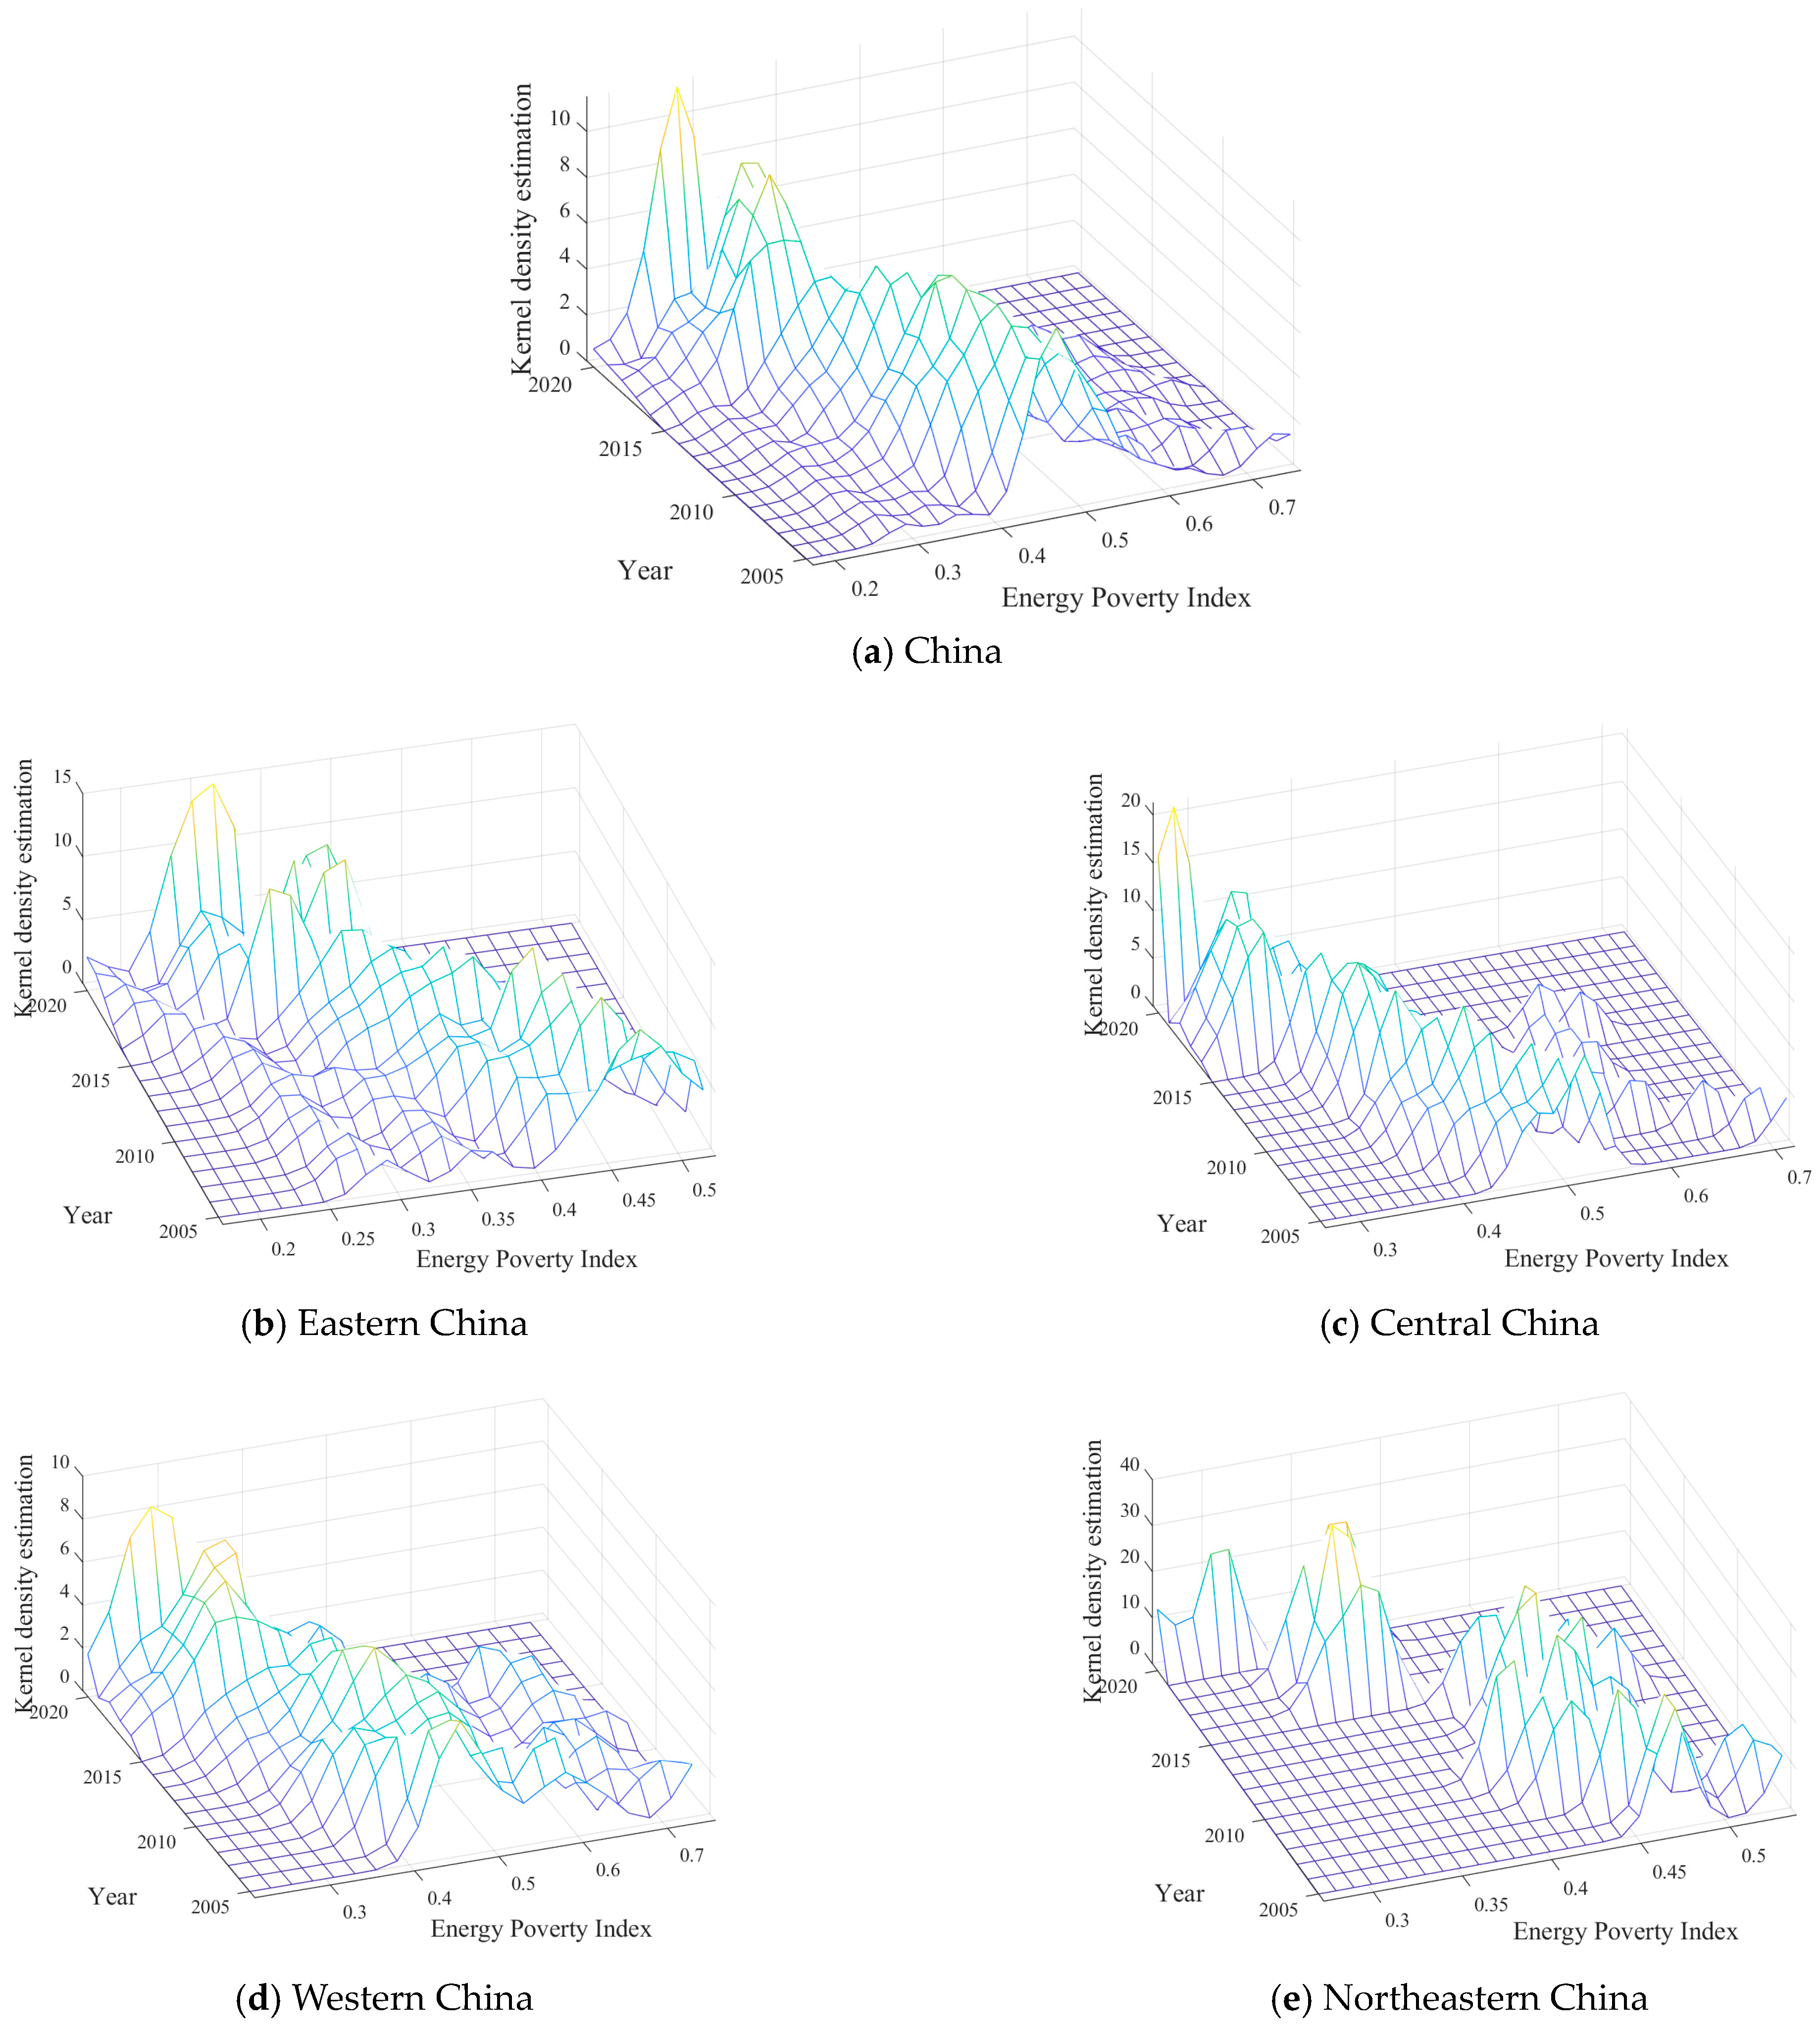
Following the approaches of S. Wang et al. [40] and Gao et al. [47], this study applies the KDE method to analyze the distributional dynamics and evolutionary characteristics of energy poverty levels in China from 2005 to 2020. Figure 8a illustrates the three-dimensional kernel density distribution of the national EPI. Overall, the peak of the distribution shifts noticeably leftward during the study period, indicating a continuous decline in national energy poverty and a gradual improvement in residents’ access to energy. Regarding the shape of the peak, the distribution curve evolves through a “sharp–flat–sharp” pattern, reflecting a stage-wise process in which overall disparities in energy poverty first expanded and then converged. In terms of distributional spread, the curve shows a slight right-tail extension in the later years, suggesting that although overall energy poverty has decreased, a few provinces remain in relatively high poverty, implying some delay in regional improvement. As for the number of peaks, the distribution remains dominated by a single main peak throughout the period, with no evident multimodality, indicating that polarization in national energy poverty is not significant and that interprovincial disparities are generally converging. In summary, from 2005 to 2020, China’s energy poverty level has shown a continuous improvement, though the magnitude of change varies across stages, demonstrating the gradual and phased nature of energy poverty alleviation.
Figure 8.
Kernel Density Distributions of Energy Poverty in China and Its Four Major Regions, 2005–2020.
Figure 8b–e depict the distributional dynamics and evolutionary trends of the EPI in the eastern, central, western, and northeastern regions, respectively. In terms of position, the eastern region is concentrated in the low-poverty range, the central and western regions cluster in the higher range, while the northeastern region lies in between but slightly above the national average. Over time, the kernel density curves for the eastern, central, and western regions generally move leftward, indicating sustained reductions in energy poverty and improvements in energy accessibility. In contrast, the northeastern region exhibits relatively slow changes, with occasional reversals in some years, reflecting a lagging improvement process. Regarding peak shape, the main peaks in the eastern and central regions become narrower and sharper, indicating convergence in interprovincial disparities. The western region’s peak remains relatively broad but also shifts leftward, showing a significant decline in poverty levels. The northeastern region exhibits a high and narrow peak, suggesting smaller internal disparities but greater year-to-year fluctuations. As for distributional spread, the eastern region shows the shortest right tail, indicating balanced improvement; the central region’s right tail contracts considerably; and the western region still shows a mild right-tail extension, suggesting that some provinces have advanced at a slower pace. Regarding polarization, the eastern, central, and northeastern regions of China are dominated by a single peak, indicating convergence rather than polarization. The western region is primarily unimodal as well, although minor local fluctuations suggest that a few areas still lag in improvement.
3.3.2. Evolutionary Trends
Building on the methods of previous studies [48,49], this study employs the Markov transition probability matrix to further analyze the dynamic evolutionary characteristics of China’s energy poverty across different development levels. Since the sample size for some transition paths is relatively small, this study focuses on transition probabilities with at least five observations to ensure the robustness of the conclusions. The dominance of the diagonal elements is partly driven by the classification scheme, but it still indicates persistence in energy poverty status over time. Combined with the transition patterns under spatial lag conditions, we consider this to reflect, to some extent, the path-dependent nature of regional energy poverty. Table 4 indicates a pronounced “diagonal dominance” in the traditional Markov transitions, suggesting that provincial energy poverty statuses are generally stable, with limited cross-level transitions primarily occurring between adjacent categories. Specifically, the self-retention probabilities for categories I–IV are 0.9239, 0.6949, 0.7000, and 0.7500, respectively, implying strong temporal persistence in China’s energy poverty. Moreover, the transition probabilities in the lower-triangular section of the matrix exceed those in the upper-triangular section, indicating that improvement-type transitions outweigh deterioration-type transitions—reflecting a gradual overall alleviation of energy poverty.
Table 4.
Markov Transition Probability Matrices for Energy Poverty in China.
When spatial neighborhood effects are taken into account, the spatial Markov chain analysis further reveals pronounced spatial correlation and regional dependence in China’s energy poverty. First, there is clear spatial synchrony between provincial energy poverty statuses and those of their neighboring regions. When neighboring areas fall into category I, the proportion of provinces also in category I is significantly higher than in other types, with a self-retention probability of 0.9138, reflecting an evident spatial clustering of low-poverty regions. Conversely, when neighboring areas fall into category IV, provinces in category IV have a high persistence probability of 0.7805, highlighting strong spatial dependence. This demonstrates a “like-tends-to-like” pattern in China’s spatial energy poverty distribution, wherein low-poverty regions mutually reinforce improvement while high-poverty regions remain mutually locked. Second, the overall transition trends exhibit a pronounced spatial path-dependence. The middle-level provinces (categories II and III) have self-retention probabilities of 0.6441 and 0.7000, respectively, with limited cross-level transitions, suggesting that both the improvement and deterioration of energy poverty occur gradually and are highly stable. At the same time, the direction of transitions varies under different neighborhood conditions: when neighboring regions are relatively better-off (categories I or II), provinces in category III are more likely to move toward lower energy-poverty levels; whereas when neighboring regions are poorer (categories III or IV), provinces in categories II or III are more likely to shift toward higher poverty levels. For instance, under a category IV neighborhood, the probability of a category III province transitioning to category IV reaches 0.2073, indicating a significant spatial spillover effect—that is, “wealthy neighbors bring wealth, while poor neighbors spread poverty.” Third, the spatial Markov results reveal an evident “club convergence” phenomenon in China’s energy poverty. Provinces in low-poverty categories I and II within low-poverty neighborhoods have high stability probabilities of 0.9138 and 0.6441, respectively, reflecting a form of “benign lock-in.” Likewise, high-poverty provinces (category IV) surrounded by high-poverty neighbors display strong persistence (0.7805), illustrating a pattern of “poverty agglomeration.” These findings indicate that the spatial evolution of China’s energy poverty exhibits strong dependence and regional clustering: while low-poverty regions show coordinated improvement through mutual reinforcement, high-poverty regions are more likely to be constrained by structural conditions, falling into a “poverty trap.”
The spatial differentiation and evolution of energy poverty are not only shaped by energy availability, cleanliness, and economic capacity, but are also deeply constrained by regional industrial structure, resource endowments, institutional capacity, and energy governance arrangements. Resource-dependent regions that have long relied on energy-intensive, high-emission industries are prone to a “resource curse” effect. This slows the transition of the energy structure, weakens the capacity for clean energy substitution, and locks these regions into a trajectory of high emissions, low efficiency, and persistent poverty. In western China, abundant wind and solar resources coexist with weak infrastructure and limited transmission capacity, creating a situation in which resources are rich but difficult to utilize locally and leading to a spatial concentration of energy-poor areas. By contrast, eastern coastal regions, supported by stronger fiscal capacity, more effective policy implementation, and more market-oriented mechanisms, can upgrade energy infrastructure and promote clean energy more rapidly. Central, western, and northeastern regions lag behind in terms of energy governance systems and cross-regional coordination mechanisms, which slows progress in alleviating energy poverty. Moreover, neighboring provinces are closely interconnected through industrial structures, policy pilots, and the spatial layout of energy projects. These linkages generate HH and LL spatial clusters and further reinforce a club convergence pattern in regional energy poverty.
3.3.3. Robustness Checks
- (1)
- Alternative weighting method
This robustness test replaces the entropy-weighting approach with principal component analysis to recalculate energy poverty levels. The resulting index is highly correlated with the entropy-based EPI, with a correlation coefficient of 0.91, and the spatial distribution pattern remains largely unchanged.
- (2)
- Alternative spatial weight matrix
The analysis re-estimates Moran’s I using an economic distance matrix. The results indicate no meaningful deviations from the benchmark, and the global Moran’s I remains significantly positive.
- (3)
- Adjusted sample coverage
The analysis is further refined by removing centrally administered municipalities (Beijing, Shanghai, Tianjin, and Chongqing) as well as key energy-producing provinces, including Shanxi and Inner Mongolia, after which the regional decomposition and KDE are re-estimated. The results show that interregional disparities still represent the dominant source of overall variation, contributing more than 45%, while the core findings remain robust.
- (4)
- Alternative time segmentation
The study divides the sample period into two sub-phases (2005–2012 and 2013–2020) and conducts Markov transition analysis separately. The transition matrices consistently display diagonal dominance and patterns of club convergence.
- (5)
- Adjusted indicator system
To assess the robustness of the indicator framework, one representative variable is removed from each dimension: per capita industrial SO2 emissions from the energy structure dimension and rural per capita disposable income from the energy capability dimension. The EPI is recalculated and compared with the benchmark results. The estimates show that, even after excluding these indicators, the spatiotemporal evolution of energy poverty closely mirrors the baseline pattern. This consistency suggests that the principal findings are not driven by the inclusion of specific indicators and that the core dimensions are conceptually and empirically stable.
- (6)
- Robustness checks for the Markov chain
Energy poverty categories are redefined using absolute thresholds (low: EPI < 0.2; lower-middle: 0.2 ≤ EPI < 0.4; upper-middle: 0.4 ≤ EPI < 0.6; high: EPI ≥ 0.6), followed by re-estimation of the transition matrices. The results continue to show significant spatial dependence and club convergence. Separate estimations of the transition matrices for 2005–2012 and 2013–2020 yield consistent results, supporting the stationarity assumption. Re-estimating the spatial Markov chain using an economic distance matrix produces results that closely align with the benchmark.
- (7)
- Kernel density robustness checks
To assess the sensitivity of the KDE results to bandwidth selection and kernel specification, several robustness tests are conducted. Estimates obtained using bandwidths of 0.5 h, h, and 1.5 h exhibit highly consistent distributional shapes and temporal dynamics. Re-estimation with the Epanechnikov kernel yields results that are likewise comparable to those based on the Gaussian kernel. These sensitivity analyses indicate that the kernel density estimates are robust, and the study’s conclusions are not materially influenced by the choice of bandwidth or kernel function.
- (8)
- Missing-data robustness checks
Finally, the impact of missing-value treatment is assessed. Provinces with an interpolation share above 10% (such as Tibet and Qinghai) are removed from the sample, and energy poverty and spatial statistics are recalculated. The rankings of provincial energy poverty, the significance of Moran’s I, and the pattern of regional disparities are all highly consistent with the full-sample results, suggesting that the data processing strategy adopted in this study is reasonably robust.
3.4. Discussion: Comparative Analysis and Contributions
In addition, we compare China’s energy poverty patterns with those observed in other countries. To contextualize the national decline in energy poverty, the analysis juxtaposes China’s trajectory with that of the European Union and other economies, highlighting the distinctive alleviation pathway shaped by rapid economic growth and strong policy intervention. Regarding spatial clustering and the “resource curse,” we draw on international discussions of resource-dependent regional development [8,42] and introduce the concept of “export-oriented energy poverty,” which emerges under China’s interregional energy dispatching framework. The inverted-U trajectory of regional disparities is linked to relevant theories in development economics [7,41], and the post-2013 suite of regional coordination policies is identified as a likely driver of the observed turning point, providing evidence of policy effectiveness. Finally, the analysis situates the findings on path dependence and club convergence within the broader literature on spatial poverty traps [44,48], emphasizing that the spatial Markov chain approach employed in this study quantitatively uncovers the mechanisms through which neighborhood effects shape the dynamic evolution of energy poverty, thereby advancing methodological and empirical understanding in this field.
4. Conclusions and Recommendations
Building on the evaluation framework developed in this study, we analyze the spatial configuration, regional inequality, and temporal evolution of energy poverty in China. The main conclusions are summarized below.
- (1)
- The overall level of energy poverty in China has improved markedly, although it has not yet been fully eradicated. Estimates based on the entropy weight method indicate that the national and regional energy poverty indices exhibited a sustained downward trend from 2005 to 2020, reflecting steady progress in the accessibility of clean and modern energy. Energy poverty has generally eased across the eastern, central, western, and northeastern regions; however, the degree of improvement varies across provinces. Some areas with relatively strong resource endowments but weak infrastructure remain at comparatively high levels of energy poverty.
- (2)
- Energy poverty demonstrates pronounced regional disparities and spatial clustering, forming a basic pattern of “low in the east, moderate in the west, and high in the northeast.” Results of Moran’s I reveal significant and persistent positive spatial autocorrelation throughout the study period, with the highest level of spatial agglomeration occurring in 2015. High-poverty provinces—typically resource-dependent regions—and low-poverty provinces in the developed eastern coastal areas formed relatively stable high-value and low-value clusters, respectively. Several provinces in the central and western regions exhibit transitional or divergent characteristics.
- (3)
- The overall disparity in national energy poverty follows an evolutionary trajectory of “initial divergence followed by convergence,” with interregional differences constituting the main source of the overall gap. The Dagum Gini coefficient indicates that energy-poverty disparities widened gradually in the early stage and peaked in 2014, after which they declined, forming a typical inverted-U pattern. Among these disparities, gaps between the eastern and western regions, as well as between the western region and other regions, are most pronounced, implying that the West will continue to be the focal and challenging area for energy-poverty alleviation.
- (4)
- Energy poverty exhibits significant spatial path dependence and “club convergence,” with high-poverty areas facing the risk of being locked into persistent deprivation. KDE shows that the overall national distribution shifted toward a lower-poverty range while maintaining a unimodal pattern; however, a right-tail drag persists, indicating that a few provinces remain trapped in relatively high-poverty conditions. Regionally, the eastern peak continues to converge toward low-poverty levels; the west has improved overall but still retains a high-poverty tail; the central and northeastern regions remain at moderately high levels, with the northeast exhibiting a relatively slower convergence pace. Markov transition results further show high state-retention probabilities and limited cross-state mobility, indicating strong path dependence; nevertheless, upward transitions outnumber downward transitions, suggesting an overall positive trend. Considering spatial neighborhood effects, low-poverty provinces tend to remain stable within advantageous environments, whereas high-poverty provinces are reinforced within disadvantaged environments, leading to the coexistence of “club convergence” and “poverty clustering” and posing a potential risk of long-term lock-in for high-poverty regions.
Based on the above conclusions, alleviating and ultimately eliminating energy poverty, while promoting energy equity and common prosperity, requires a nationally coordinated and regionally balanced framework that integrates differentiated and localized policy combinations. This study puts forward three key policy suggestions.
First, strengthen foundational governance by establishing a multidimensional, dynamic monitoring and institutionalized management system. Building on the existing framework of “energy consumption level, energy structure, and energy capability,” additional dimensions such as housing conditions, accessibility of digital energy services, and energy security under extreme climatic conditions should be incorporated to improve multilevel monitoring indicators at the provincial and county levels. Supported by big data, smart meters, and the energy Internet of Things, a regularly published energy poverty monitoring report should be developed to dynamically identify and precisely locate key regions and vulnerable populations, providing real-time references for policy adjustment. Meanwhile, residents’ energy expenditure burdens should be included in the income distribution and social assistance systems, and policies such as targeted energy subsidies, tiered pricing incentives, and special assistance for low-income households should be improved to prevent new forms of energy poverty triggered by energy price increases or structural reforms. By enhancing policy coordination among departments of energy, finance, ecology, environment, and rural revitalization, the governance model should shift from project-based and temporary measures toward institutionalized and regularized governance, preventing intergenerational transmission and long-term entrenchment of energy poverty.
Second, promote targeted interventions and implement regionally differentiated strategies to upgrade infrastructure and enhance clean energy supply. For the western, central, and northeastern regions with higher levels of energy poverty, efforts should focus on strengthening and modernizing basic energy infrastructure, including rural grid renovation, intelligent distribution network upgrades, and clean heating projects. In provinces such as those in Northwest China, where geographic conditions are complex, infrastructure is weak, and energy development costs are high, central fiscal transfers should be increased to establish a comprehensive support mechanism centered on infrastructure guarantees, clean energy prioritization, and targeted price subsidies. This would ensure that residents in remote areas have access to stable, safe, and affordable modern energy services. Simultaneously, terminal energy structures should be optimized by accelerating the deployment of renewable energy such as wind, solar, and biomass and enhancing local utilization capacity in the central, western, and northeastern regions, thereby integrating local development with nearby consumption and delivering dual benefits in energy exports and local welfare. Differentiated electricity and gas pricing policies, clean heating subsidies, and the promotion of energy-efficient appliances and high-efficiency boilers should be adopted to lower barriers to clean energy use, restrain traditional high-emission energy consumption, and generate synergistic effects of emission reduction, pollution reduction, and poverty alleviation. Greater efforts should also be devoted to controlling industrial wastewater, sulfur dioxide, and particulate emissions to prevent environmental degradation from deepening the vulnerability of energy-poor regions.
Third, strengthen coordination in benefit distribution and improve mechanisms for interregional cooperation and shared development. Within the framework of large-scale energy transmission projects such as “West-to-East Power Transmission” and “West-to-East Gas Transmission,” mechanisms for price formation, tax sharing, and ecological compensation should be optimized to increase the proportion of resource revenues retained in energy-producing regions. By establishing a benefit-sharing mechanism between energy-supplying and energy-consuming regions, a portion of the revenues from electricity and natural gas transmission, as well as carbon reduction gains, can be reinvested in the supplying areas to improve local access to energy and foster emerging green industries, thereby alleviating structural energy poverty characterized by resource abundance but insufficient energy access for residents. Under the unified national energy market and regional coordination strategy, the eastern developed regions should leverage their technological, institutional, and financial advantages to assist the central, western, and northeastern regions through technology transfer, capital investment, industrial collaboration, and talent exchange, thereby enhancing their capacity for energy governance and green development. Interregional energy cooperation platforms and pilot demonstration zones should be established to jointly explore innovations in smart grids, energy storage, distributed generation, and digital energy management. The integrated diffusion of technology, institutions, and capital will strengthen the endogenous capacity for sustainable development and self-sufficiency in regions at high risk of energy poverty.
Alleviating and eliminating energy poverty is not merely a technical challenge in the energy sector, but a complex systemic endeavor that involves regional coordinated development, ecological civilization building, and the pursuit of common prosperity. In the future, China should strengthen spatial perspectives and regional differentiation awareness within a framework of national coordination, utilizing multidimensional governance tools and multi-actor collaboration to achieve equalized and sustainable energy services. This will provide a solid foundation for advancing Chinese-style modernization through improved energy welfare and equitable access. Although this study constructs a comprehensive provincial-level evaluation system of energy poverty from the three dimensions of energy consumption level, energy structure, and energy capability, and employs the entropy weight method, spatial autocorrelation analysis, Dagum Gini coefficient decomposition, KDE, and Markov chain analysis to systematically portray the spatiotemporal patterns and dynamic evolution of energy poverty in China, several limitations remain. First, due to data availability constraints, the indicator system still relies primarily on macro-level statistical data, which cannot fully capture intra-household energy structures, service quality, and behavioral preferences. Future research should integrate household survey data to conduct multi-scale and multi-agent micro-level identification analyses. Second, the spatial weight matrix in this study is mainly based on geographical adjacency, without incorporating complex relationships such as economic distance, transportation connectivity, and energy transmission networks. Future work could construct a multidimensional spatial weight matrix to more comprehensively capture the multiple spatial effects of energy poverty across geographic, economic, and network dimensions. Third, this paper mainly analyzes the evolution of energy poverty from the perspectives of distributional dynamics and state transitions. Future studies could introduce spatial econometric models and causal identification methods to systematically evaluate the heterogeneous impacts of specific policy instruments—such as energy subsidies, rural grid renovation, and clean heating projects—on energy poverty alleviation across different types of regions. By continuously expanding the theoretical framework, data foundation, and methodological tools, future research can provide stronger empirical support for China’s coordinated advancement of energy security, green transition, and livelihood improvement within the broader process of achieving the “dual carbon” goals and common prosperity.
Moreover, although this study provides an in-depth examination of energy poverty, its spatial complexity merits further investigation. Future research could develop composite spatial weight matrices that integrate multiple dimensions of spatial linkage, such as power grid coupling and transportation networks, to more precisely characterize the spatial evolution of energy poverty. In addition, given data availability constraints, subsequent work should incorporate rural household survey data to more comprehensively capture urban–rural differences in energy poverty. The dataset used in this study also contains some missing observations. Although these are treated through interpolation, they may still introduce measurement error. Future studies could draw on more fine-grained survey data or employ techniques such as multiple imputation to further improve data completeness and accuracy. Finally, this study mainly relies on a first-order Markov chain. Future research may compare first-order and higher-order chains to more rigorously test state dependence in the dynamics of energy poverty.
Author Contributions
Conceptualization, Z.G. and Y.H.; methodology, Z.J. and Y.H.; software, Z.J.; validation, C.Z.; formal analysis, Z.J., S.G. and X.Y.; investigation, Y.H.; data curation, Z.G.; writing—original draft preparation, Z.J., S.G. and X.Y.; writing—review and editing, Z.G., C.Z. and Y.H.; visualization, Z.J. and S.G.; supervision, Z.G., C.Z. and Y.H.; project administration, C.Z.; funding acquisition, Z.G. All authors have read and agreed to the published version of the manuscript.
Funding
This research was funded by the National Social Science Fund of China, grant number 24FJYB049, and by the Graduate Education and Teaching Reform Project of Beijing Institute of Petrochemical Technology, “Construction of an Innovative Talent Training System for Master’s Students in Economics and Management with a ‘Dual Carbon’ Focus”, grant number YJ25-104. The APC was not funded.
Data Availability Statement
The data supporting the findings of this study are available upon reasonable request from the corresponding author, should any relevant researchers require access.
Acknowledgments
The usual disclaimer applies.
Conflicts of Interest
The authors declare no conflict of interest.
References
- Lourenço, M.A.; Henriques, C.O.; Figueira, J.R.; Silva, C.S.; Pereira, M.A. A multi-criteria classification approach for assessing energy poverty in the European Union. Energy Econ. 2025, 146, 108539. [Google Scholar] [CrossRef] [Scilit]
- Jmaii, A. Microeconometric analysis of energy poverty and urban-rural welfare disparities in Tunisia: Implications for sustainable development policy. Energy Policy 2025, 203, 114636. [Google Scholar] [CrossRef] [Scilit]
- Zhu, W.; Shi, C.; Chen, Z.; Zhi, J.; Zhang, C.; Yao, X. Research on the process of energy poverty alleviation in China’s provinces by new energy revolution from the perspective of time and space. Energy 2025, 322, 135635. [Google Scholar] [CrossRef] [Scilit]
- Yang, X.; Yu, S.; Jiang, X.; Cai, Z.; Jiang, P. The Impact of Different Types of Energy Transition Policies in China on Household Energy Poverty and Health Vulnerability. Energies 2025, 18, 1976. [Google Scholar] [CrossRef] [Scilit]
- Shen, B.; Ma, W.; Li, J. Role of gender in determining energy poverty, clean energy access, and energy expenditure: Insights from rural China. Energy Econ. 2025, 144, 108369. [Google Scholar] [CrossRef] [Scilit]
- Wang, Y.; Xu, B. Assessing the effective drivers of energy poverty reduction in China: A spatial perspective. Energy 2025, 320, 135427. [Google Scholar] [CrossRef] [Scilit]
- Nussbaumer, P.; Bazilian, M.; Modi, V. Measuring energy poverty: Focusing on what matters. Renew. Sustain. Energy Rev. 2012, 16, 231–243. [Google Scholar] [CrossRef] [Scilit]
- Bouzarovski, S.; Tirado Herrero, S. The energy divide: Integrating energy transitions, regional inequalities and poverty trends in the European Union. Eur. Urban Reg. Stud. 2017, 24, 69–86. [Google Scholar] [CrossRef] [Scilit]
- Wang, K.; Wang, Y.; Li, K.; Wei, Y. Energy poverty in China: An index based comprehensive evaluation. Renew. Sustain. Energy Rev. 2015, 47, 308–323. [Google Scholar] [CrossRef] [Scilit]
- Dong, B.; Xu, Y. Energy Poverty and Social Welfare: Its Measurement Analysis and Moderating Mechanism Evaluation. Soc. Indic. Res. 2025, 176, 593–627. [Google Scholar] [CrossRef] [Scilit]
- Kökény, L.; Hortay, O.; Pálvölgyi, D.; Kökény, L. Evolving energy poverty in the European Union in multi-crisis years 2022–2024: A large sample analysis. Energy Res. Soc. Sci. 2025, 129, 104374. [Google Scholar] [CrossRef] [Scilit]
- Karmaker, S.C.; Sen, K.K.; Singha, B.; Chapman, A.J.; Bari, W.; Hosan, S.; Saha, B.B. Empowering women to combat energy poverty in South Asia. Energy 2025, 338, 138765. [Google Scholar] [CrossRef] [Scilit]
- Maier, S.; Dreoni, I. Who is “energy poor” in the EU? Energy Policy 2026, 208, 114869. [Google Scholar] [CrossRef] [Scilit]
- Liu, X.; Yu, J.; Dugarjav, B.; Okubo, K.; Bat-Orgil, T.; Wang, S. Actual situation analysis of energy poverty issues among nomadic herders in Mongolia. Energy Sustain. Dev. 2025, 89, 101867. [Google Scholar] [CrossRef] [Scilit]
- Ghosh, A. Decoding energy poverty: Rural-urban disparities and structural barriers in BRICS countries. Front. Environ. Econ. 2025, 4, 1552502. [Google Scholar] [CrossRef] [Scilit]
- Heller, P.; Schittekatte, T.; Barrella, R.; Mastropietro, P.; Batlle, C. European and US approaches to energy poverty: Classifying and evaluating design strategies. Util. Policy 2025, 97, 102059. [Google Scholar] [CrossRef] [Scilit]
- Zhang, L.; Xiang, R.; Liao, B.; Yang, Q. Energy Poverty vs. Climate Risk: Unveiling Threats to Global and Regional Human Development. Energy 2025, 339, 138947. [Google Scholar] [CrossRef] [Scilit]
- Munyanyi, M.E.; Grote, U. Temperature shocks and multidimensional energy poverty: Evidence from Malawi. Energy Econ. 2025, 152, 108994. [Google Scholar] [CrossRef] [Scilit]
- Wang, A.; Zhao, S.; Ma, J. An invisible health killer? The psychological cost of energy poverty from a gendered perspective in China. Energy Res. Soc. Sci. 2025, 129, 104362. [Google Scholar] [CrossRef] [Scilit]
- Li, Z.; Wu, M.; Qin, Y.; Li, T.; Zheng, X. Social capital and rural household energy poverty: Evidence from the China Family Panel Studies. Energy 2025, 335, 138286. [Google Scholar] [CrossRef] [Scilit]
- Li, M.; Li, C.; Li, Q. From tradition to transition: The effect of clan culture on energy poverty. Energy Policy 2025, 206, 114777. [Google Scholar] [CrossRef] [Scilit]
- Yang, Y.; Li, X.; Li, L.; Fang, L.; Chen, Y.; Zama, N.I. Is Digital Development the Answer to Energy Poverty? Evidence from China. Energies 2025, 18, 5330. [Google Scholar] [CrossRef] [Scilit]
- Yue, J.; Chen, S.; Weng, Z. Digital technology alleviates intergenerational energy poverty: Evidence from household analysis. Appl. Energy 2025, 399, 126488. [Google Scholar] [CrossRef] [Scilit]
- Ding, Q.; Rao, Y.; Dai, Y. Can digital financial inclusion alleviate energy poverty? Evidence from China. Energy 2025, 333, 137533. [Google Scholar] [CrossRef] [Scilit]
- Zhong, M.; Zhou, T.; Wu, Q. Comparison between inclusive finance and green finance in alleviating energy poverty and the mediating role of energy structure. Energy Econ. 2025, 147, 108597. [Google Scholar] [CrossRef] [Scilit]
- Wang, W.; Wang, J. Nexus of clean energy internet with energy poverty and health: Evidence from China. J. Environ. Manag. 2025, 385, 125666. [Google Scholar] [CrossRef] [Scilit] [PubMed]
- Xu, B.; Xu, R. How can government expenditure effectively achieve energy poverty reduction? a non-linear perspective. Energy 2025, 335, 137760. [Google Scholar] [CrossRef] [Scilit]
- Fan, W.; Xu, H.; Cheng, S.; Yang, F. How do health shocks affect household energy poverty? Energy Econ. 2025, 150, 108884. [Google Scholar] [CrossRef] [Scilit]
- Xu, X.; Peng, J.; Wang, K.; Zhang, Z. Is energy aid a panacea for energy poverty? Evidence from developing countries. Energy Policy 2025, 206, 114809. [Google Scholar] [CrossRef] [Scilit]
- Doan, N.; Nguyen, C.P.; Su, T.D. Does fiscal decentralization reduce energy poverty? Evidence from Vietnam. Energy Policy 2025, 207, 114845. [Google Scholar] [CrossRef] [Scilit]
- Luo, C.; Dong, Y.; Jin, Z.; Yu, H. Assessing the effect of regional intergenerational mobility on household energy poverty in China. Cities 2025, 164, 106069. [Google Scholar] [CrossRef] [Scilit]
- Zhang, J.; Faraz Raza, S.M.; Huang, Y.; Wang, C. What affect energy poverty in China? A path towards sustainable development. Econ. Res.-Ekon. Istraživanja 2023, 36, 2111316. [Google Scholar] [CrossRef] [Scilit]
- Wei, T.; Pan, H.; Duan, Z.; Xie, P. New energy technology innovation and energy poverty alleviation in China. Renew. Energy 2024, 235, 121348. [Google Scholar] [CrossRef] [Scilit]
- Okushima, S. Measuring energy sufficiency: A state of being neither in energy poverty nor energy extravagance. Appl. Energy 2024, 354, 122161. [Google Scholar] [CrossRef] [Scilit]
- Robinson, C.; Yan, D.; Bouzarovski, S.; Zhang, Y. Energy poverty and thermal comfort in northern urban China: A household-scale typology of infrastructural inequalities. Energy Build. 2018, 177, 363–374. [Google Scholar] [CrossRef] [Scilit]
- Tang, J.; Zhao, P.; Gao, Y. Can smart energy alleviate energy poverty in China?–Empirical evidence using synthetic control methods. J. Clean. Prod. 2024, 449, 141821. [Google Scholar] [CrossRef] [Scilit]
- Tutar, H.; Štreimikienė, D. Assessing the effects of low-carbon transition on energy poverty: Empirical evidence from selected EU member states. Energy Res. Soc. Sci. 2025, 127, 104315. [Google Scholar] [CrossRef] [Scilit]
- Wang, L.; Gu, Y.; Sha, L.; Guo, F. How does Fintech affect green innovation of Chinese heavily polluting enterprises? The mediating role of energy poverty. Environ. Sci. Pollut. Res. Int. 2023, 30, 65041–65058. [Google Scholar] [CrossRef] [Scilit]
- Silverman, B.W. Density Estimation for Statistics and Data Analysis; Routledge: New York, NY, USA, 2018. [Google Scholar]
- Wang, S.; Xu, J.; Cheng, M.; Zhang, W. Measurement and influencing factors of China’s energy transition level from the perspective of the low-carbon and resilience two-dimensional game. Energy 2025, 338, 138789. [Google Scholar] [CrossRef] [Scilit]
- Cheikh, N.B.; Zaied, Y.B.; Nguyen, D.K. Understanding energy poverty drivers in Europe. Energy Policy 2023, 183, 113818. [Google Scholar] [CrossRef] [Scilit]
- Halkos, G.E.; Gkampoura, E. Evaluating the effect of economic crisis on energy poverty in Europe. Renew. Sustain. Energy Rev. 2021, 144, 110981. [Google Scholar] [CrossRef] [Scilit]
- Li, Q.; Yang, L.; Jiang, F.; Liu, Y.; Guo, C.; Han, S. Distribution characteristics, regional differences and spatial convergence of the water-energy-land-food nexus: A case study of China. Land 2022, 11, 1543. [Google Scholar] [CrossRef] [Scilit]
- Husiev, O.; Arrien, O.U.; Enciso-Santocildes, M. Spatial analysis of energy communities and energy vulnerabilities in Spain. Util. Policy 2025, 95, 101954. [Google Scholar] [CrossRef] [Scilit]
- Bu, Z.; Zeng, S.; Zhao, X. Spatial-temporal evolution characteristics and critical factors identification of China’s energy trilemma index. Energy 2025, 333, 137375. [Google Scholar] [CrossRef] [Scilit]
- Xue, H.; Ma, Q.; Ge, X. Spatiotemporal dynamics and driving factors of energy-related carbon emissions in the Yangtze River Delta region based on nighttime light data. Sci. Rep. 2025, 15, 3384. [Google Scholar] [CrossRef] [Scilit]
- Gao, Z.; Jia, Z.; Hao, Y. Regional Disparities, Spatial Effects, and the Dynamic Evolution of Distorted Energy Prices in China. Energies 2025, 18, 3465. [Google Scholar] [CrossRef] [Scilit]
- Karpinska, L.; Śmiech, S. Breaking the cycle of energy poverty. Will Poland make it? Energy Econ. 2021, 94, 105063. [Google Scholar] [CrossRef] [Scilit]
- An, C.; Zhou, P. Energy transition affordability in China: Disparities and determinants. Energy Econ. 2024, 140, 107972. [Google Scholar] [CrossRef] [Scilit]

Disclaimer/Publisher’s Note: The statements, opinions and data contained in all publications are solely those of the individual author(s) and contributor(s) and not of MDPI and/or the editor(s). MDPI and/or the editor(s) disclaim responsibility for any injury to people or property resulting from any ideas, methods, instructions or products referred to in the content. |
© 2025 by the authors. Licensee MDPI, Basel, Switzerland. This article is an open access article distributed under the terms and conditions of the Creative Commons Attribution (CC BY) license.