Abstract
This study examines the impact of chilled water supply parameters on the energy efficiency of an office building’s HVAC system located in a temperate European climate. Two cooling system variants were analyzed: (1) a traditional low-temperature system using fan-coil units and (2) a high-temperature system with chilled beams for sensible cooling. In the latter, moisture removal is performed entirely by the air handling unit, where outdoor air is dehumidified before being supplied to the space. Hourly simulations were carried out for the summer period using typical meteorological year data. Detailed heat gain calculations included transmission, occupancy, equipment, lighting, and solar radiation. Based on the cooling loads, chilled water production and distribution systems were selected, and their electricity consumption was assessed. The total energy use of chillers, ventilation units, circulation pumps, and auxiliary equipment was compared for both systems. The findings highlight the energy-saving potential of high-temperature chilled water systems, especially when integrated with centralized ventilation capable of latent load control. Additionally, results show that increasing the chilled water supply temperature significantly enhances the Energy Efficiency Ratio (EER) of chillers.
1. Introduction
The energy efficiency of HVAC systems in office buildings has become one of the key issues in the context of growing cooling demand and increasingly stringent legal and environmental requirements. Numerous studies and measurements in modern office buildings located in temperate and cold climates indicate a systematic increase in cooling loads, driven by higher internal gains from occupants, IT equipment, and lighting, as well as the growing share of glazed façades and extended operating hours of office spaces [1,2,3,4]. As a consequence, cooling is becoming one of the dominant components of the energy balance of service buildings, including in temperate climates, and HVAC systems must provide the required indoor environmental conditions with the lowest possible final and primary energy consumption [1,2,5,6].
In the design practice of modern office buildings, hydronic room cooling systems are commonly used, in which cooling emission is mainly provided by fan coil units (FCUs) and active chilled beams (ACBs) cooperating with a central mechanical ventilation system [1,2,3,6]. FCU systems typically operate with low-temperature chilled water (approximately 6–8 °C at the supply), which allows simultaneous coverage of sensible loads and part of the latent loads through condensation of water vapor on the coils of the room units. In systems with active chilled beams, elevated chilled water temperatures are used (on the order of 14–18 °C or higher), and the beams are designed as terminals operating solely in sensible cooling mode—condensation on the heat exchanger is not allowed, and the entire moisture load must be handled by the central ventilation system, which dehumidifies outdoor air [1,2,3,7,8,9]. In such hybrid air–water configurations, the overall energy performance depends not only on the selection of terminal units and chilled water temperature but also on the adopted control strategies for airflow, chilled water temperature and humidity, which determine how sensible and latent loads are partitioned between the hydronic and air subsystems [5,8,10,11,12,13].
The increasing deployment of chilled beams in office buildings is reflected in numerous review, experimental and simulation studies. Latif et al. [1] presented a comprehensive review of ACB systems in office buildings, highlighting the potential for reduction in energy use compared with all-air systems (CAV/VAV) and solutions with a large share of energy transport by air. Võsa et al. [7] experimentally compared several types of hydronic cooling emitters in the same office room (chilled ceiling panels, underfloor cooling, fan-assisted radiators and fan coils), simultaneously analyzing thermal comfort parameters and sensible cooling efficiency. Filipsson et al. [14] and Ming et al. [8] studied, respectively, airflow modeling and self-regulation of chilled beams and the impact of beam layout on temperature distribution and ventilation effectiveness, showing that, with proper design and control, ACB systems can provide comfort conditions comparable to traditional mixing systems, while offering a more favorable distribution of energy use [1,8,14].
Comparisons between ACB systems and FCU systems in office buildings are still relatively scarce, but the available results indicate that, with proper sizing and control, both solutions can provide similar indoor environmental conditions, differing mainly in the structure of energy use. Kostyák et al. [6] analyzed an air-conditioning system with an AHU equipped with indirect evaporative cooling and an additional room cooling system, demonstrating that, for comparable indoor conditions, different AHU operating configurations and fluid parameter settings can lead to significantly different specific cooling energy use. Dezfouli et al. [5], in an experimental study of an FCU system in a nearly zero-energy building in a tropical climate, showed that fan coils can provide acceptable indoor conditions, but their energy performance strongly depends on the control strategy and the level of internal gains [5]. Ahmed et al. [2] compared, in a numerical model of a typical office building in Osaka, a VAV+FCU system and an ACB system supplied with non-condensing chilled water. In both variants, the same outdoor air flow rate and similar ranges of air temperature and CO2 concentration in the zone were ensured, while the ACB system showed lower cooling energy consumption and lower fan and pump energy use, resulting in a higher seasonal energy efficiency ratio [2]. These differences were mainly due to different organization of recirculated air flow (lower fraction of recirculated air) and a larger share of the water loop in cooling transport, rather than a reduction in hygienic ventilation [1,2].
A part of the literature is devoted to detailed models of chilled beams and analyses of their operation at the terminal level. Chen et al. [9] proposed indicators describing the performance of an ACB operating in VAV mode and showed that, from an energy efficiency perspective, it is beneficial to limit the primary air flow rate while maximizing the use of the water-side heat exchanger, provided that the latent load is effectively removed by the central AHU [1,3,9]. Latif et al. [1] and Ming et al. [8] emphasized that proper operation of ACB systems requires close coordination of primary air parameters (temperature and humidity) with chilled water parameters in the beam loop, so as to avoid condensation while ensuring sufficient cooling capacity. In parallel, field and simulation studies conducted in office buildings located in temperate and cold climates (e.g., in Estonia, Finland and Sweden) show that high-temperature hydronic cooling systems (e.g., chilled beams or chilled ceilings) integrated with AHUs responsible for dehumidifying outdoor air allow chillers to operate at higher evaporation temperatures and potentially enable a higher share of free cooling, while maintaining acceptable thermal comfort [3,7,10].
Another research direction concerns the optimization of chilled water systems and fluid temperatures on the source side. Deng et al. [15] analyzed a chilled water system in a high-rise office building, showing that increasing the temperature difference in the chilled water loop, reducing hydraulic resistance and appropriately controlling pumps and chillers can reduce the total electricity consumption of the cooling generation and distribution system. Qiu et al. [16] and Zheng et al. [17] demonstrated that the use of advanced model-free or metaheuristic optimization algorithms to control chilled water and cooling water temperatures in building air-conditioning systems can further reduce energy use of the cooling plant. In most of these studies, however, the cooling load is treated in an aggregated way, without explicit separation into sensible and latent components and without analyzing alternative concepts for splitting cooling between the hydronic and air subsystems [15,16,17]. In parallel, a growing body of work investigates advanced control strategies such as neural-network-based predictive control and model predictive control (MPC) for simultaneous temperature and humidity regulation in HVAC systems. Yang et al. [17] and Bahramnia et al. [11] showed that NN-based predictive and MPC controllers can track both air temperature and relative humidity more accurately than conventional PI/PID control in chilled-water and VAV-reheat systems while reducing control-induced oscillations and avoiding unnecessary overcooling and reheating. More recently, Ma et al. [12] quantified how ventilation rate and humidity setpoint scheduling in humid climates strongly affect latent cooling energy and demand-response potential, and Zhao et al. [13] demonstrated in a temperature- and humidity-independent control (THIC) system for an office building that decoupling sensible and latent cooling loops enables targeted efficiency improvements but also shifts part of the energy use to fans and pumps.
Against this background, the literature provides a good description of the local behavior of hydronic terminals (chilled beams, chilled ceilings, fan coils) and the potential for optimizing operating parameters of chilled water systems. However, there is still a lack of comprehensive analyses in which, within a single, consistent office building model, two conceptually different cooling systems are compared: a classical low-temperature FCU system, in which part of the latent load is removed locally via condensation on the coils, and a high-temperature system with chilled beams operating in purely sensible mode, where the entire latent load is handled by a central AHU with outdoor air dehumidification. Previous studies rarely quantify the impact of the assumed partition of sensible and latent loads between the hydronic and air subsystems on the seasonal energy use of chillers, supply fans and circulation pumps in a temperate climate.
The aim of this study is to address this gap by conducting a comparative energy analysis of two chilled water systems applied to the same office building located in a temperate European climate: (1) a low-temperature FCU system supplied with chilled water at approximately 7/12 °C, in which local condensation on the FCU coils provides partial removal of latent loads, and (2) a high-temperature system with chilled beams supplied with elevated water temperature (e.g., 15–17 °C), operating solely in sensible cooling mode, where the entire moisture load is handled by a ventilation unit dehumidifying outdoor air before supplying it to the zones. Using hourly simulations for the summer period of a typical meteorological year (TMY), detailed heat gains were determined, equipment for chilled water generation and distribution was selected, and the electricity use of chillers, AHUs, circulation pumps and auxiliary equipment was calculated for both variants. The analysis makes it possible to quantitatively assess the energy-saving potential of high-temperature chilled water systems under given indoor conditions and to show to what extent an increase in chilled water temperature translates into improved chiller efficiency when the full HVAC system structure and the division of sensible and latent cooling between subsystems are taken into account.
2. Materials and Methods
2.1. Case-Study Building
The comparative analysis concerns one floor of an office building located in Warsaw, Poland. The building has five above-ground storeys in total, and the analyzed floor is located on level +2, with a total floor area of 1124 m2. The floor comprises cellular offices with different numbers of occupants (1-, 2-, 3- and 4-person), open-plan office areas and conference rooms (Figure 1). The storey height is 3.5 m, and the clear height without suspended ceiling is 2.7 m. The façade includes glazing on the north, east, south and west orientations. Office spaces are used from Monday to Friday, from 7:00 to 15:00.
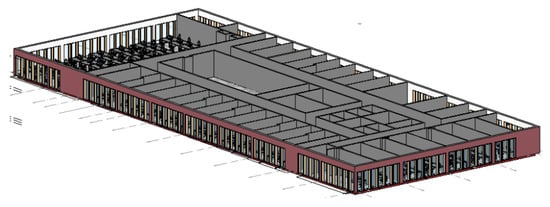
Figure 1.
Schematic floor plan of the analyzed office building storey.
2.2. Outdoor and Indoor Design Parameters
To calculate energy use, appropriate outdoor boundary conditions had to be defined. Data for the typical meteorological year (TMY) for Warsaw were adopted based on official data published on a governmental portal, prepared using climate observations from 1971 to 2000 [18]. The calculations cover the period from 1 June to 30 September (Figure 2).
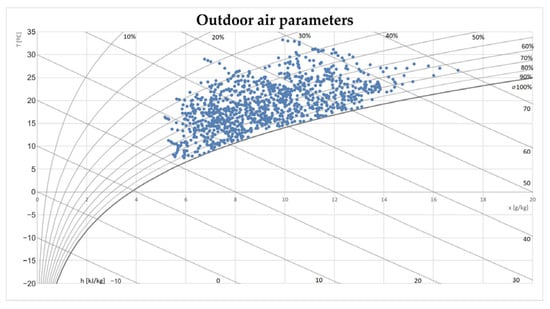
Figure 2.
Distribution of outdoor air parameters on the psychrometric chart.
The following hourly data were used in the analysis:
- dry-bulb temperature (DBT) [°C],
- humidity ratio (HR) [g/kg],
- global solar irradiance on a horizontal surface (ITH) [W/m2],
- direct solar irradiance on a horizontal surface (IDH) [W/m2],
- diffuse solar irradiance on a horizontal surface (ISH) [W/m2],
- total solar irradiance on a vertical surface (tilt 90°) [W/m2].
The indoor air temperature was set to 24 °C and assumed to be constant throughout the analyzed period. The indoor relative humidity was controlled, depending on the outdoor humidity ratio, within the range 50–55%. The supply air temperature was set to 18 °C for the entire analysis period. Supplying air at a temperature lower than the room air temperature ensures removal of part of the sensible heat gains. Envelope properties, including the U-value of exterior walls (U = 0.20 W/(m2·K)) and windows (U = 0.90 W/(m2·K)), were taken in line with current standards.
2.3. Determination of Room Cooling Loads
In the first step of the analysis, sensible and latent heat gains were estimated for each room and for the entire floor. Since the rooms have the same indoor design parameters and similar patterns of use, the calculated and assumed heat gains are identical in both system I and system II. The input data for the calculation of sensible heat gains from occupants and equipment were selected based on widely accepted values reported in the literature, as documented in authoritative HVAC references and textbooks, such as the ASHRAE Fundamentals. For internal gains from occupants, a sensible heat gain of Q_{lj} = 76 W/person was assumed, corresponding to office work at an indoor air temperature of 24 °C. Sensible gains from a desktop computer were taken as Q_{PC} = 110 W, and from a monitor Q_{M} = 50 W. It was assumed that each occupant uses one computer and two monitors. In conference rooms, projectors with a power of Q_{PR} = 300 W may be in operation. The maximum total sensible gains from occupants and equipment amounted to 32.2 kW.
Heat gains from electric lighting were calculated taking into account thermal storage and the dynamic response of the building. The installed lighting power density was assumed as 15 W/m2 of floor area, corresponding to an illuminance of 500 lux. This value reflects the specific use of the spaces and is somewhat higher than typical LED lighting densities of around 5 W/m2. It was further assumed that, during periods of peak solar gains and direct sunlight on the windows, electric lighting would be switched off.
Solar gains were determined using the total solar irradiance incident on vertical surfaces with E, S, W and N orientations and a tilt angle of 90°. Due to the window installation details, the absence of balconies, external sills and other projecting façade elements, and the lack of nearby buildings that could shade the façade, no external self-shading of the windows was assumed. During periods of highest solar gains, internal blinds made of light-colored fabric were assumed to be used. The methodology for calculating solar heat gains was based on the VDI 2078 standard [19].
The calculated maximum sensible heat gain for the analyzed floor was 73.7 kW, occurring on 3 July. When related to the total floor area, this corresponds to 65.6 W/m2. The variation in the total sensible gains over the analysis period is shown in Figure 3.
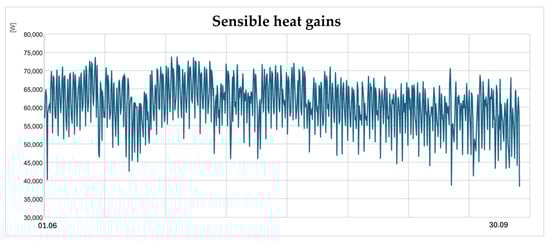
Figure 3.
Variation in total sensible heat gains during the analysis period.
For moisture gains, a specific latent moisture generation rate of 101 g/h per person was assumed, corresponding to light office work at 24 °C. Due to the assumed variability in occupant activity, an average value between low and moderate activity levels was adopted. Taking into account the occupancy schedules of individual rooms and the resulting variation in the number of people, the maximum hourly total moisture gain in the system was 11,767 g/h.
2.4. Air-Conditioning System Concepts
To analyze the influence of chilled water supply parameters on the energy performance of the office building, two alternative air-conditioning system concepts were developed. Their characteristics are summarized below.
System I: a low-temperature cooling system operating with chilled water parameters of 7/12 °C in the room terminal loop, with “wet” operation of the terminals (condensation on the coils). The room terminals are fan coil units. The source of chilled water is a chiller. Outdoor air is supplied by a supply–exhaust AHU, which provides only the minimum ventilation air required due to occupancy. The ventilation air flow rate per person is 30 m3/(h·person), in line with the relevant standard. The cooling coil in the AHU is supplied with chilled water at 7/12 °C from a separate chiller. It was assumed that the chilled water distribution in both systems I and II is insulated such that there are no heat losses in the piping, and the water temperature at the terminal inlets equals the water temperature at the chiller outlet. The AHUs are equipped with a cross-flow heat recovery exchanger, enabling both heat and “coolth” recovery. No latent heat recovery is provided. The sensible heat recovery efficiency was set to 70%. During the cooling season, coolth recovery is enabled when the outdoor air temperature exceeds the exhaust air temperature (tₑ > 24 °C). The air heating coils are supplied by a heat pump. In each system (I and II), two separate chillers were used: one for the AHU coil and one for the room terminals.
System II: a high-temperature cooling system operating with chilled water parameters of 15/20 °C in the room terminal loop, with “dry” operation of the terminals (no condensation). The room cooling terminals remove only the sensible heat gains and do not participate in humidity control. Such terminals may be, for example, active or passive chilled beams, chilled ceilings or vertical and horizontal surface cooling systems. The chilled water source is again a chiller. In this system, the AHU is responsible both for supplying outdoor air and for controlling indoor humidity. The AHU cooling coil is supplied with chilled water at 7/12 °C. Since there are no “wet” terminals in the rooms, control of indoor humidity is provided solely by the AHU. To this end, the supply air leaving the coil is cooled to a constant temperature of 12 °C, after which it is reheated to 18 °C, as in system I. Due to the variable outdoor humidity ratio, system II uses variable air volume (VAV) ventilation to control indoor humidity. In this way, the required indoor humidity range can be maintained, which is a prerequisite for functional equivalence of systems I and II. The total supply air flow rate varied between 9703 m3/h and 3630 m3/h, depending mainly on the instantaneous outdoor humidity ratio (Figure 4). Thus, the airflow variation in system II was between 37.5% and 100%, which is acceptable from the standpoint of proper VAV operation, including the performance of diffusers and other air terminal devices [20].
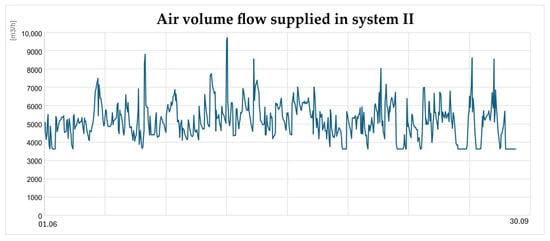
Figure 4.
Variation in total supply air flow rate [m3/h] in system II during the analysis period.
2.5. Calculation Procedure
The energy consumption calculations for the two analyzed air-conditioning systems were performed using a custom spreadsheet with an hourly time step. The analysis covered a single repetitive floor of an office building over the period from June 1 to September 30, during standard office working hours. Climatic data were based on a typical meteorological year for Warsaw, taking into account the variability of outdoor air temperature, humidity content, and solar radiation intensity. For the analysis, a detailed occupancy scenario was defined, including schedules for occupants, the power and operation of office equipment, and lighting. At each time step, sensible and latent heat gains resulting from heat transfer through building envelopes, occupant presence, equipment operation, lighting, and solar gains were calculated. Calculations were conducted under the assumption of maintaining a constant indoor air temperature of 24 °C, which allowed for determining the instantaneous cooling demand. Hourly heat gains were then used to determine the cooling demand of terminal units and air-handling unit chillers, followed by the instantaneous load of the chilled water plants relative to their nominal capacity. The chillers were selected using the manufacturer’s software, and their part-load performance characteristics were taken from datasheets. The relationship between chiller load, electrical power consumption, and EER values was presented in graphical form at Figure 5. Based on these characteristics, the instantaneous electricity consumption of the chillers was determined for each time step. Total electrical energy consumption was obtained by summing the hourly energy demands, enabling a direct comparison of the energy efficiency of both systems.
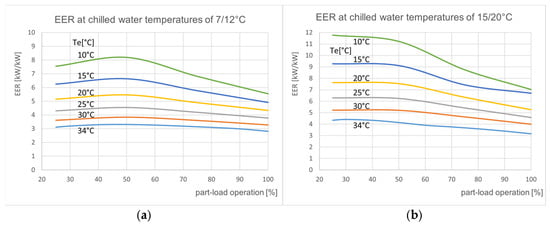
Figure 5.
EER value in part-load operation depending on the outdoor air temperature, Te: (a) chilled water parameters 7/12 °C; (b) chilled water parameters 15/20 °C.
3. Results
The calculations made it possible to compare the energy use of the main components of the air-conditioning systems. The following elements were considered: AHUs (cooling and heating coils), room terminals and chillers.
3.1. Chillers
The chillers used in the systems were selected using the manufacturer’s selection software. As mentioned earlier, in each system separate chillers were installed for the AHU coil and the room terminals. The chillers were selected for an outdoor air temperature of 34 °C. The resulting nominal cooling capacities and conditions are:
- System I, chiller 1—Q_{\max} = 21.2 kW, chilled water 7/12 °C—AHU coil,
- System I, chiller 2—Q_{\max} = 83.7 kW, chilled water 7/12 °C—FCUs,
- System II, chiller 1—Q_{\max} = 80.7 kW, chilled water 7/12 °C—AHU coil,
- System II, chiller 2—Q_{\max} = 66.0 kW, chilled water 15/20 °C—room terminals.
To determine the seasonal electricity use of the chillers, EER (Energy Efficiency Ratio) values at full and part load were taken from the manufacturer’s data. As the data are provided for selected percentage load levels, EER values were approximated for specific outdoor air temperatures. The analysis of EER showed consistently higher EER values for the chiller supplying the room terminals at 15/20 °C in system II compared with the 7/12 °C chiller in system I.
The total cooling energy required in the entire system in system II was 55,065 kWh, i.e., 11% higher than in system I (49,746 kWh) (Figure 6). However, the electricity use of the chiller supplying the AHU cooling coil was much higher in system II: 3100 kWh, compared with 647 kWh in system I (an increase of about 380%). For the chiller supplying the room terminals, the situation is opposite: electricity use in system I was about 37% higher than in system II (Figure 7). Summing the chiller electricity use for each system, the difference between the two variants is small: the total electricity use of the chillers differs by only about 1.2%.
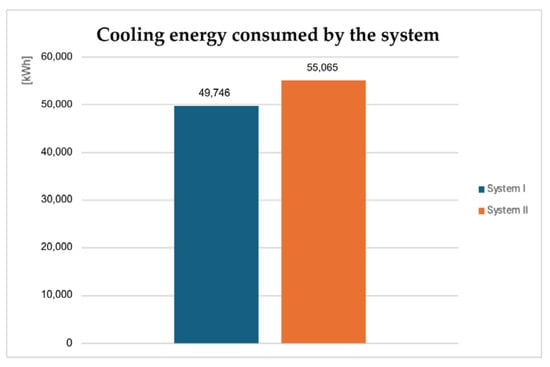
Figure 6.
Total cooling energy delivered by the chillers in systems I and II [kWh].
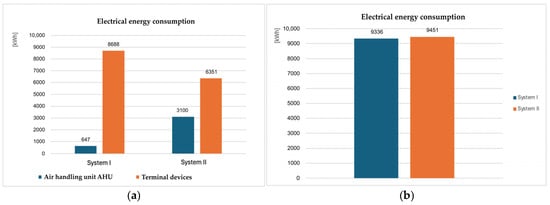
Figure 7.
Electricity use of the chillers: (a) by individual chillers in systems I and II; (b) total chiller electricity use in systems I and II.
3.2. AHU Cooling and Heating Coils
Significant differences occurred between systems I and II in the required capacities of the AHU cooling and heating coils (Figure 8). The maximum capacity of the cooling coil in system II (80.7 kW) was 281% higher than in system I (21.2 kW). This results from the higher maximum air flow rate through the AHU in system II and the lower coil outlet air temperature. Consequently, the cooling energy handled by the AHU cooling coil in system II was 335% higher than in system I. The required heating coil capacity in system II was 19.5 kW, compared with 12.4 kW in system I (an increase of 57%).
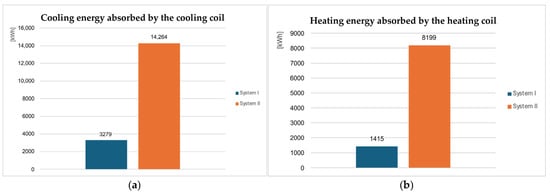
Figure 8.
Energy use of AHU coils over the analysis period: (a) cooling coil; (b) heating coil.
The air heating coils in both systems are supplied by heat pumps. The key parameter for estimating heat pump electricity use is the COP (Coefficient of Performance). In the calculations, the dependence of COP on the temperature of the heat source (outdoor air) was taken into account. The supply temperature of the heating medium to the AHU coils was assumed to be 45 °C in both systems. The outdoor air was selected as the heat source. The variation in COP as a function of outdoor temperature was used to determine the heat pump electricity use over the analysis period.
The resulting electricity use of the heat pump in system I was 323 kWh, while in system II it was 1692 kWh, i.e., about 424% higher.
3.3. Room Terminals
In system I, the capacities of the room terminals were determined based on the sum of sensible heat gains minus the sensible cooling supplied with the ventilation air, plus the additional capacity required to remove the remaining latent gains. Part of the latent load is removed by the ventilation system; however, in system I, the AHU does not actively control room humidity. This function is assigned to the FCUs. At the sizing stage, the FCU cooling capacities were therefore calculated to remove both sensible gains and the excess moisture from indoor air. The manufacturer’s selection software was used for this purpose. The FCU supply air temperature was set to 12 °C in all rooms for simplicity. The relative humidity of air leaving the FCUs lies between 80% and 90%; a value of 85% was used in the calculations, corresponding to a humidity ratio of 7.4 g/kg. This value was also taken as uniform for all rooms. The total installed cooling capacity of room terminals in system I was 83.7 kW, and the cooling energy delivered by the terminals over the analysis period was 46,467 kWh (Figure 9).
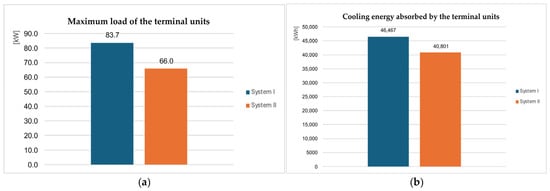
Figure 9.
Comparison of room terminal performance: (a) maximum installed cooling capacity; (b) total cooling energy delivered by room terminals.
In system II, the capacities of the room terminals were also determined based on the sensible heat gains minus the sensible cooling supplied with the ventilation air from the AHU. In this case, however, the terminals do not reduce air humidity. The maximum terminal capacity in system II was 66.0 kW, and the total cooling energy delivered by the terminals during the analysis period was 40,801 kWh. As a result, the cooling energy delivered by the terminals in system II was about 14% lower than in system I.
In addition to cooling capacity, the electricity use of fans in the room terminals is also important. This applies only to system I, as the FCUs include fans, whereas the terminals in system II were assumed to be passive hydronic emitters. The calculated electricity use of the FCU fans in system I was 2192 kWh.
3.4. Pumps and Fans
To compare fan electricity use in the AHUs, fans were selected using the manufacturer’s software. For simplicity, it was assumed that the required static pressure of the fans is the same in both systems. In system I, which operates with a constant air volume, fan power is constant. In system II, the fan power–airflow characteristic was used to determine electricity use as a function of the varying air flow rate. The results show that fan electricity use in system II was 1950 kWh, compared to 1471 kWh in system I, i.e., about 33% higher (Figure 10).
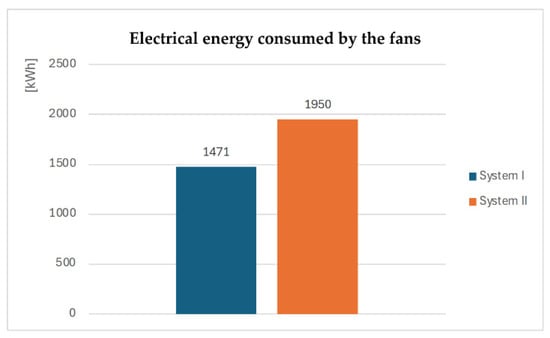
Figure 10.
Electricity use of AHU supply fans in systems I and II.
A similar procedure was applied to the circulation pumps, both those supplying the room terminals and those supplying the AHU coils. Pump selection was carried out using manufacturer data, and the pump power–flow characteristics were used to calculate electricity use. The electricity use of the pumps supplying the room terminals was 142 kWh in system I and 125 kWh in system II (13% lower in system II). For the pumps supplying the AHU cooling coils, electricity use was 66 kWh in system II and 26 kWh in system I (about 154% higher in system II).
3.5. Total Energy Use
Based on the partial results presented above, the total electricity use of both systems can be determined. Two comparisons are shown in Figure 11. The first includes all components except the electricity use of room-terminal fans. The second additionally includes the FCU fan electricity use in system I (Figure 12).
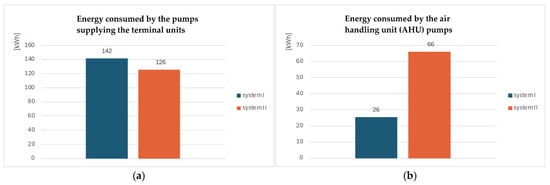
Figure 11.
Electricity use of: (a) pumps in the room terminal circuits; (b) pumps in the AHU cooling coil circuits.
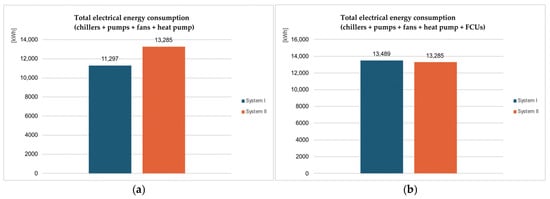
Figure 12.
Total electricity use of the analyzed systems: (a) chillers, pumps and AHU fans (without room-terminal fans); (b) including room-terminal fans (only in system I).
Without including FCU fans, the total electricity use of system II was 13,285 kWh, i.e., 18% higher than in system I (11,297 kWh). The need for fan electricity at room terminals depends on the type of terminal. In the analyzed example, only system I included FCUs with fans. After including the FCU fan electricity use, the total electricity use of system I increased to 13,489 kWh, while system II remained at 13,285 kWh. The overall difference between the two systems was therefore about 1.5%, in favor of the high-temperature system.
To enable the use of the obtained results for estimating cooling capacity and electricity demand, the calculated values of cooling capacity and electricity consumption were converted into indicators normalized per 1 m2 of floor area of the cooled room volume. These indicators, summarized in Table 1, make it possible to approximately estimate the required cooling capacity and seasonal energy use in buildings with a similar function and construction, located in a temperate European climate or in climates with comparable outdoor conditions.

Table 1.
Specific cooling capacity demand and seasonal electricity consumption index.
4. Discussion
The comparative analysis of the two chilled water systems—a low-temperature FCU system and a high-temperature system with chilled beams (operating without condensation)—shows that increasing the chilled water temperature on the terminal side clearly improves chiller efficiency, but this gain is largely offset by higher ventilation and dehumidification energy use in the chilled-beam variant. As a result, the total electricity use of both systems over the summer season differs by only about 1.5%, which means that, from the standpoint of final energy use, the two concepts are practically equivalent.
In the chilled-beam system, the higher chilled water temperature allowed significantly higher chiller EER values than in the 7/12 °C system, which is consistent with the findings of Deng et al. In the chilled-beam system, the higher chilled water temperature allowed significantly higher chiller EER values than in the 7/12 °C system, which is consistent with the findings of Deng et al. [15], who demonstrated improved chiller efficiency with raised evaporation temperature and reduced losses in the chilled water loop. At the same time, in our case the chiller had to cover a larger overall cooling demand, resulting from deeper dehumidification of outdoor air in the AHU. Consequently, the electricity use of the chillers in both variants turned out to be very similar, despite approximately 10% higher cooling load in the chilled-beam system.
The largest differences between the systems occur in the air-side components. In the FCU system, the AHU operates with a constant air flow rate equal to the hygienic minimum, and part of the latent load is removed locally by the FCUs. In the chilled-beam system, the supply air flow rate has to vary—from the same hygienic minimum up to about three times that value during the most humid hours—in order to maintain the required indoor relative humidity. This leads to significantly higher AHU fan electricity use in the chilled-beam variant.
This behavior is consistent with detailed modeling studies of ACB systems. Chen et al. [9] showed that the energy benefits of chilled beams occur mainly when the primary air flow rate is minimized and most of the energy transport is carried by water, with latent loads handled efficiently by the AHU. Ming et al. [8] and Latif et al. [1] highlighted that excessive primary air flow rates and poor coordination between air and water parameters can easily negate the energy advantage of ACBs, even if chilled water temperatures are higher. In the present analysis, the chilled-beam system operated precisely in a regime of elevated air flow rates driven by humidity control, which resulted in higher fan electricity use than in the simpler FCU system with constant minimum ventilation. This indicates that the final balance between the two concepts may depend not only on the chilled-water temperature level, but also on the adopted humidity/ventilation control strategy (e.g., coordinated control of airflow, coil leaving-air temperature and reheat). Predictive controllers explicitly accounting for coupled temperature–humidity dynamics (including MPC- and NN-based approaches) have been shown to improve simultaneous RH/temperature tracking while reducing control effort and energy use, which suggests a clear pathway to reduce the air-side penalty observed in system II (ACB) [10,11].
A particularly interesting comparison can be made with the study by Ahmed et al. [2], where a VAV+FCU system was compared with an ACB system in a model office building in a hot and humid climate. The authors reported lower total energy use and a higher seasonal efficiency factor for the chilled-beam variant, whereas in our conditions the overall energy use of the two systems was almost identical. One reason is that the reference system in [2] included a significant share of recirculated air and additional fan energy use in the FCUs, which magnified the advantage of the system with a higher share of hydronic transport [2,3]. In our model, both variants assumed 100% outdoor air and the same AHU with sensible heat recovery, which reduced the potential energy savings on the air side. Moreover, in our chilled-beam variant the AHU operated with deep dehumidification (cooling to 12 °C at the coil exit and reheating), leading to high peak air flow rates, whereas in [2] somewhat higher indoor relative humidity levels were accepted, reducing dehumidification energy use [2,3].
The results of this study are more consistent with the conclusions of Kostyák et al. The results of this study are more consistent with the conclusions of Kostyák et al. [6] and comparative analyses of ACB and VAV systems such as the work by Yau and Tam [21]. These studies indicate that differences in annual energy use between hydronic–air systems (chilled beams, TABS) and conventional convective systems (VAV, FCU) depend strongly on the chosen design parameters, load profiles and climate, and may range from clear energy savings for ACBs to situations where the net energy benefit is marginal. Our calculations confirm that raising the chilled water temperature does not automatically guarantee energy savings at the level of the entire HVAC system if this is accompanied by intensive dehumidification in the AHU and increased ventilation rates.
The contribution of fan energy and reheat energy after dehumidification is particularly important. In the chilled-beam system, the AHU must cool the air to a low temperature to condense moisture and then reheat it, which increases heat pump compressor electricity use and fan energy for air transport. In the FCU system, this energy use is lower, but part of the latent load is removed locally in the room terminals. After summing the electricity use of the chillers, pumps, AHU fans and FCU fans, the total difference in electricity use between the two systems is only about 1.5%, in favor of the chilled-beam system. This conclusion is aligned with recent latent-load studies showing that, in humid periods, both ventilation rate and humidity setpoint selection can markedly increase latent cooling energy; therefore, strategies that temporarily relax humidity setpoints or reshape ventilation schedules may reduce peak dehumidification and fan energy and could shift the system-level balance in favor of high-temperature concepts [12].
In future studies, it would be advisable to extend the analysis to include other climatic locations, variants with different heat and moisture recovery strategies, and alternative latent-load control concepts that reduce or avoid overcooling-and-reheat (e.g., temperature and humidity independent control frameworks enabling higher coil temperatures for sensible cooling while using dedicated dehumidification). This would allow for a more comprehensive assessment of the potential of high-temperature systems under a broader range of operating conditions.
5. Conclusions
The comparative analysis showed that, under the assumption of identical indoor environmental conditions (room air temperature of 24 °C and maximum relative humidity of 55%), the total electricity use of the two analyzed HVAC systems is very similar. Differences in energy use at the system level (chillers, pumps, AHUs and heat sources for reheating) do not exceed a few percent, and when the electricity use of FCU fans in the low-temperature system is included, the difference is about 1.5% in favor of the high-temperature system.
From a practical design standpoint, this means that the energy-saving potential of high-temperature chilled water systems in office buildings in temperate climates is strongly dependent on the adopted ventilation and dehumidification concept. If the aim is to maximize the benefits of higher chilled water temperatures—increased chiller EER and the possibility of integrating low-temperature renewable or ambient cooling sources—as reported in the literature on ACBs and optimized chilled water systems [1,11], the primary air flow rate should be limited to the hygienic minimum and the dehumidification process should be controlled to minimize the need for reheating the air after the cooling coil. Otherwise, as the present results demonstrate, energy savings on the chiller side may be compensated by higher auxiliary energy use, and the advantage of high-temperature systems over conventional FCU systems may be modest.
It should also be emphasized that the model used in this study has limitations. The analysis was carried out for a single office building, a single temperate climate and strictly defined operational assumptions. Variants in which the chilled-beam system is combined with free cooling or ground-coupled cold sources, or with advanced algorithms for chilled water temperature optimization, as discussed in [15,16,17], were not considered, nor were scenarios allowing a wider variation in indoor relative humidity. These aspects should be addressed in future work.
Author Contributions
Conceptualization, S.S. and M.C.; Methodology, S.S. and M.C.; Software, S.S.; Formal analysis, M.C.; Investigation, S.S.; Data curation, J.H.; Writing—original draft, M.C. and J.H.; Writing—review & editing, M.C. and J.H.; Supervision, M.C. and J.H.; Funding acquisition, M.C. All authors have read and agreed to the published version of the manuscript.
Funding
This research received no external funding.
Data Availability Statement
The original contributions presented in the study are included in the article, further inquiries can be directed to the corresponding author.
Conflicts of Interest
The authors declare no conflict of interest.
References
- Latif, H.; Hultmark, G.; Rahnama, S.; Maccarini, A.; Afshari, A. Performance Evaluation of Active Chilled Beam Systems for Office Buildings—A Literature Review. Sustain. Energy Technol. Assess. 2022, 52, 101999. [Google Scholar] [CrossRef]
- Ahmed, K.; Yoon, G.; Ukai, M.; Kurnitski, J. VAV Fan Coil and Demand Controlled Active Chilled Beam Systems Energy Efficiency and Thermal Comfort Performance Comparison in a Japanese Office Building. E3S Web Conf. 2024, 562, 06004. [Google Scholar] [CrossRef]
- Kiil, M.; Simson, R.; Thalfeldt, M.; Kurnitski, J. A Comparative Study on Cooling Period Thermal Comfort Assessment in Modern Open Office Landscape in Estonia. Atmosphere 2020, 11, 127. [Google Scholar] [CrossRef]
- Lin, Y.; Ichinose, T. Experimental Evaluation of Mitigation of Thermal Effects by “Katsuren Travertine” Paving Material. Energy Build. 2014, 81, 253–261. [Google Scholar] [CrossRef]
- Dezfouli, M.M.S.; Dehghani-Sanij, A.R.; Kadir, K.; Suhairi, R.; Rostami, S.; Sopian, K. Is a Fan Coil Unit (FCU) an Efficient Cooling System for Net-Zero Energy Buildings (NZEBs) in Tropical Regions? An Experimental Study on Thermal Comfort and Energy Performance of an FCU. Results Eng. 2023, 20, 101524. [Google Scholar] [CrossRef]
- Kostyák, A.; Szekeres, S.; Csáky, I. Investigation of Sensible Cooling Performance in the Case of an Air Handling Unit System with Indirect Evaporative Cooling: Indirect Evaporative Cooling Effects for the Additional Cooling System of Buildings. Buildings 2023, 13, 1800. [Google Scholar] [CrossRef]
- Võsa, K.V.; Ferrantelli, A.; Kurnitski, J. Cooling Thermal Comfort and Efficiency Parameters of Ceiling Panels, Underfloor Cooling, Fan-Assisted Radiators, and Fan Coil. Energies 2022, 15, 4156. [Google Scholar] [CrossRef]
- Ming, R.; Mustakallio, P.; Kosonen, R.; Kaukola, T.; Kilpeläinen, S.; Li, B.; Wu, Y.; Yao, R. Effect of Active Chilled Beam Layouts on Ventilation Performance and Thermal Comfort under Variable Heat Gain Conditions. Build. Environ. 2023, 228, 109872. [Google Scholar] [CrossRef]
- Chen, C.; Cai, W.; Wang, Y.; Lin, C.; Wang, L. Operating Characteristics and Efficiencies of an Active Chilled Beam Terminal Unit under Variable Air Volume Mode. Appl. Therm. Eng. 2015, 85, 71–79. [Google Scholar] [CrossRef]
- Yang, Q.; Zhu, J.; Xu, X.; Lu, J. Simultaneous Control of Indoor Air Temperature and Humidity for a Chilled Water Based Air Conditioning System Using Neural Networks. Energy Build. 2016, 110, 159–169. [Google Scholar] [CrossRef]
- Bahramnia, P.; Rostami, S.M.H.; Wang, J.; Kim, G.J. Modeling and Controlling of Temperature and Humidity in Building Heating, Ventilating, and Air Conditioning System Using Model Predictive Control. Energies 2019, 12, 4805. [Google Scholar] [CrossRef]
- Ma, Z.; Cui, S.; Chen, J. Demand Response through Ventilation and Latent Load Adjustment for Commercial Buildings in Humid Climate Zones. Appl. Energy 2024, 373, 123940. [Google Scholar] [CrossRef]
- Zhao, K.; Liu, X.H.; Zhang, T.; Jiang, Y. Performance of Temperature and Humidity Independent Control Air-Conditioning System in an Office Building. Energy Build. 2011, 43, 1895–1903. [Google Scholar] [CrossRef]
- Filipsson, P.; Trüschel, A.; Gräslund, J.; Dalenbäck, J.O. Modelling of Rooms with Active Chilled Beams. J. Build. Perform. Simul. 2020, 13, 409–418. [Google Scholar] [CrossRef]
- Deng, J.; He, S.; Wei, Q.; Liang, M.; Hao, Z.; Zhang, H. Research on Systematic Optimization Methods for Chilled Water Systems in a High-Rise Office Building. Energy Build. 2020, 209, 109695. [Google Scholar] [CrossRef]
- Qiu, S.; Li, Z.; Fan, D.; He, R.; Dai, X.; Li, Z. Chilled Water Temperature Resetting Using Model-Free Reinforcement Learning: Engineering Application. Energy Build. 2022, 255, 111694. [Google Scholar] [CrossRef]
- Zheng, Y.; Gao, Y.; Gao, J. Energy Saving in Building Air-Conditioning Systems Based on Hippopotamus Optimization Algorithm for Optimizing Cooling Water Temperature. Energies 2025, 18, 2476. [Google Scholar] [CrossRef]
- Typical Meteorological Years and Statistical Climate Data for the Polish Area for Energy Calculations of Buildings—Ministry of Investment and Development—Portal Gov.Pl. Available online: https://www.gov.pl/web/archiwum-inwestycje-rozwoj/dane-do-obliczen-energetycznych-budynkow (accessed on 2 June 2025).
- VDI 2078-2015-06; Calculation of Thermal Loads and Room Temperatures (Design Cooling Load and Annual Simulation). Verein Deutscher Ingenieure e.V.: Berlin, Germany, 2015.
- Kim, H.J.; Cho, Y.H. A Study on a Control Method with a Ventilation Requirement of a VAV System in Multi-Zone. Sustainability 2017, 9, 2066. [Google Scholar] [CrossRef]
- Yau, Y.H.; Tam, J.H. A Comparison Study for Active Chilled Beam and Variable Air Volume Systems for an Office Building. Energy Procedia 2018, 152, 378–383. [Google Scholar] [CrossRef]
Disclaimer/Publisher’s Note: The statements, opinions and data contained in all publications are solely those of the individual author(s) and contributor(s) and not of MDPI and/or the editor(s). MDPI and/or the editor(s) disclaim responsibility for any injury to people or property resulting from any ideas, methods, instructions or products referred to in the content. |
© 2025 by the authors. Licensee MDPI, Basel, Switzerland. This article is an open access article distributed under the terms and conditions of the Creative Commons Attribution (CC BY) license.