


Abstract
The effects of applying external electric fields on the coefficient of friction of a selected elastomer during mechanical interaction with steel and copper surface oil (counter samples) immersed in a pin-on-disc setup were studied and investigated. The synthetic base oils used were PAG 68 and PAO 6. The elastomer selected for the study is commonly used in the manufacture of rotary lip seals. During the investigations, the viscosity of the oils tested was also experimentally determined in the temperature range of between 286 K and 393 K. It was found that the external electric field had a significant effect on the friction coefficient, depending on the type of base oil, the angular velocity of the load force, and the counterpart. It was observed that for both oils tested, the coefficient of friction values decreased by about 30% when an external DC electric field was applied. In addition, a simple numerical model of the friction interface was proposed and studied. The experimental results were complemented by molecular simulations to determine the interaction between the lubricant molecule and the metal surface. Furthermore, molecular models of the metal surface and lubricant molecules were simulated using ReaxFF and COMPASS force fields to determine adsorption energies.
1. Introduction
Friction is one of the most common causes of machinery damage, lost performance, and wasted energy. Different types of friction can be caused by mechanical, chemical, and electrical phenomena. They are interdependent and the respective frictional forces are not a simple sum of them. It is estimated that global energy consumption was 9425 Mtoe (in 2014), of which 30% were consumed by transport. Of this energy, vehicles use about 30% to overcome friction [1].
One way to reduce friction and wear is to use new materials with higher tensile strength, new types of oil and/or oil additives, or, as is the subject of this article, to apply an external DC electric field to the friction contact area.
Friction is generally observed on a macroscopic scale, but its origin lies in the force interactions between molecules belonging to two surfaces moving in close contact and/or a lubricant. Interactions of different types (electrostatic and dispersive) between molecules induce forces that act on the atoms of the surrounding molecules and are called internal friction, while interactions between, for example, solid bodies that come into contact via the tops of surface irregularities are called external friction and are characterized by significant resistance to movement.
As a result of the occurrence of both frictions, a given pair of materials is characterized by the intensity of the friction, represented by the coefficient of friction [2,3,4,5,6,7].
The differences between molecules of different materials may be considered in terms of the geometry and composition of the molecule, both of which affect interactions with surrounding molecules. The forces that occur between a pair of atoms depend on the type of atom and the interatomic distance. The total interaction in the case of complex molecular systems is the resultant interaction of each atom-atom interaction [8]. The impact of molecular structure on different types of properties has been confirmed by many theoretical and experimental studies [9,10,11].
Understanding the relationship between material or lubricant type and friction requires a deep understanding of the molecular structure of the materials present in the system [12]. Molecular modelling is a powerful tool to gain insight into molecular phenomena, the interactions between molecules, and the behaviour of the system over time under specific conditions. As a result, a molecular simulation allows one to predict some macroscopic properties of materials analyzed on the basis of their molecular structure, which is often difficult to do using experimental methods [13,14,15,16,17].
Among the many molecular modelling methods, force fields (molecular mechanics) are one that is applicable to relatively large molecular systems and provides good accuracy with reasonable computational requirements. The first approach allows the simulation of systems much larger than force fields but does not provide insight into molecular-level effects. On the other hand, quantum mechanical/ab initio methods provide high accuracy but are computationally expensive and do not allow the simulation of large systems.
The opposite of, or complementary to, theoretical analysis using sophisticated mathematical models are experimental investigations which can be carried out on simple pin-on-disc or 4-ball wear test rigs. With such a set-up it is possible to perform a series of relatively simple experiments. For example, it is possible to select different lubricants with simple or complex chemical structures. To make it easier to interpret the results, From the wide range of commercial lubricants available on the market, it is best to perform analyzes on base oils that may contain polar and some electrically charged particles that tend to move in a certain direction and at a certain speed depending on the value and polarity of the external electric field [18].
Gajewski et al. [19] observed that during the rotation of a disc, natural triboelectrification occurs at the phase boundaries: metal disc-oil and oil-elastomer, and between particles moving and rubbing against each other. The direction and value of such a natural electric field depend, among other things, on the temperature and type of oil used.
The external DC electric field created by a DC power supply causes the movement of charged and polar particles at the interfaces of the two phases in the friction gap. This phenomenon causes a change in the viscosity of the oil and, consequently, in the coefficient of friction at the friction point on the surface of an elastomer and a metal disc [20].
As also stated by Gajewski et al. [21], the direction of the electric field has an influence on the braking torque with a wide range of variation from 5% to 50%, depending on the type of oil and disc. The results of the investigation showed that a negative polarity applied to the elastomer sides caused a greater change in the braking torque than a positive polarity. In this article, the authors present the results of the research for negative polarity only.
Liu et al. [22] observed that the application of a DC voltage with a small value (from 3.5 to 20 V), used to measure the resistance of the friction node, causes a reduction in the friction coefficient of the aforementioned node.
Based on research carried out by Gajewski et al. [23], it was found that there was a strong dependence between the external field and the coefficient of friction in the pin-on-disc system, as well as in the system that was a specific physical model of a real lip seal and crankshaft of an internal combustion engine.
The authors of the presented paper expect that the long-term effects of an external DC electric field will reduce the frictional force and thus make it possible to reduce the frictional energy losses occurring at the friction node. The aim is to extend the life of, for example, polymer seals and reduce the running costs of machinery such as cars and other motor vehicles.
Another important aspect of the experimental and theoretical analyses presented in the paper is to find correlations between the experimental results obtained on a dedicated experimental setup and the results achieved by molecular modelling.
2. Properties of the Material Tested
Lubricants
Commercially available PAO 6 and PAG 68 engine oils were used in the study. Both oils were supplied by commercial manufacturers, i.e., PAO 6 oil by Neste Oil, Germany and PAG oil by PCC Rokita, Poland. In order to include real viscosity values in future analyses, tests were carried out for this purpose. The results were also compared with the catalogue data provided by the manufacturers.
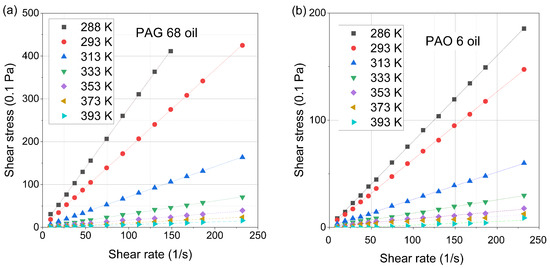
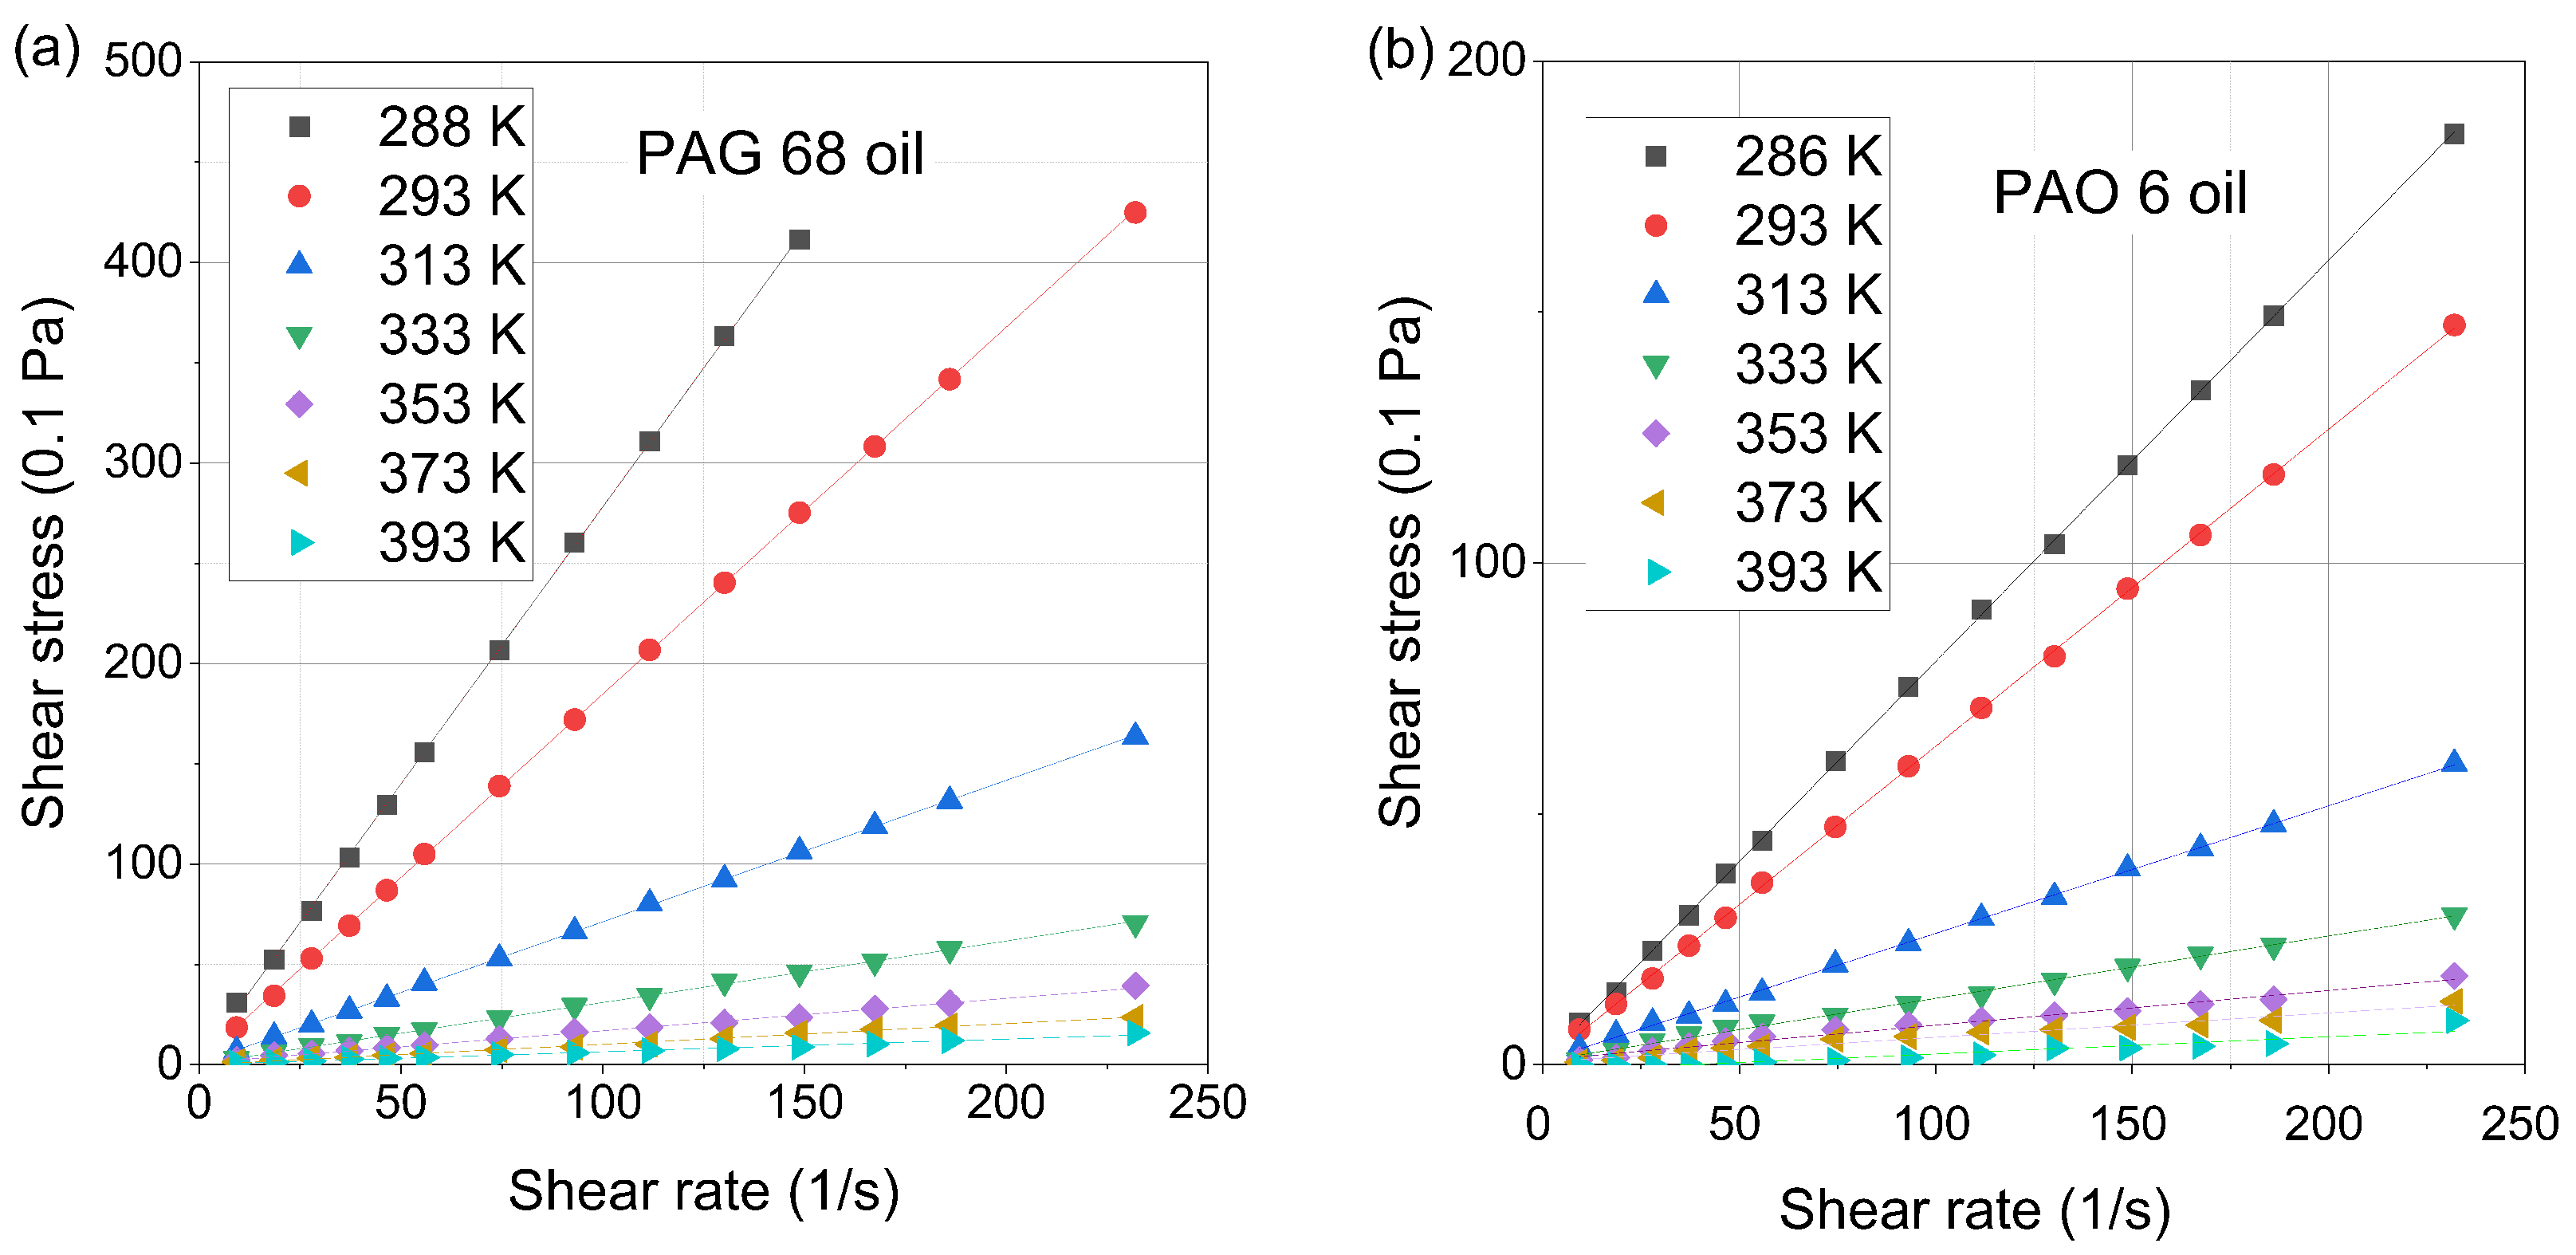
The tests were performed on a Brookfield DV3T Extra Rheometer viscometer. The viscometer has an accuracy of ±1.0% of the range and a repeatability of ±0.2%. The viscosity measurement consisted of determining the shear stress value for a given value of the shear rate. Due to the spindles used, the value of the shear rate varied from 9.3 1/s to 232 1/s. The temperature value also varied, changing from 286 K to 393 K, that is, the range in which the target test was performed.
Measurements were made immediately after opening the containers and the remaining quantities were stored in tightly closed containers under recommended ambient conditions. Unfortunately, the purity of the oils was not tested during an experiment. Also, it should be noted that no changes were observed in the properties of the oils during the period analysed in the tests carried out.
As can be seen from the results in Figure 1a,b in the test ranges, the oils tested are characterized by a linear dependence of shear stress on shear rate, according to the following Formula (1).
where: a—the slope of the line (interpreted as the dynamic viscosity); Pa· s, b—ordinate; Pa.
The slope values of the line and the coordinate as a function of temperature for the oils tested are summarized in Table 1. A linear trend is characteristic of the so-called Newtonian fluids. It should be noted that in the analyzed coordinate system (Shear rate–Shear stress), the slope of the line is interpreted as a value of the dynamic viscosity.
Table 1.
The slopes of lines and ordinates for measured temperature values.
For future analysis, it was possible to determine the dependence of kinematic viscosity on temperature by knowing the slope of the line in the shear rate-shear stress system and the value of the density of the detailed oils. The relationship between kinematic viscosity and dynamic viscosity is described by Equation (2)
where: and are the kinematic and dynamic viscosity respectively, is the density of the oil, for the oils analysed, it was assumed that PAO 6 oil has a density of 826.6 kg/m and PAG 68 oil has a density of 991.0 kg/m.
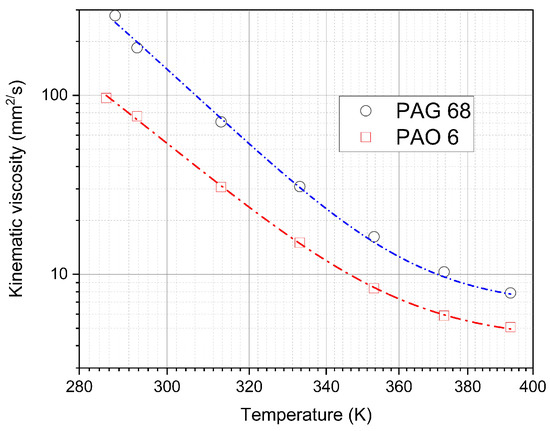
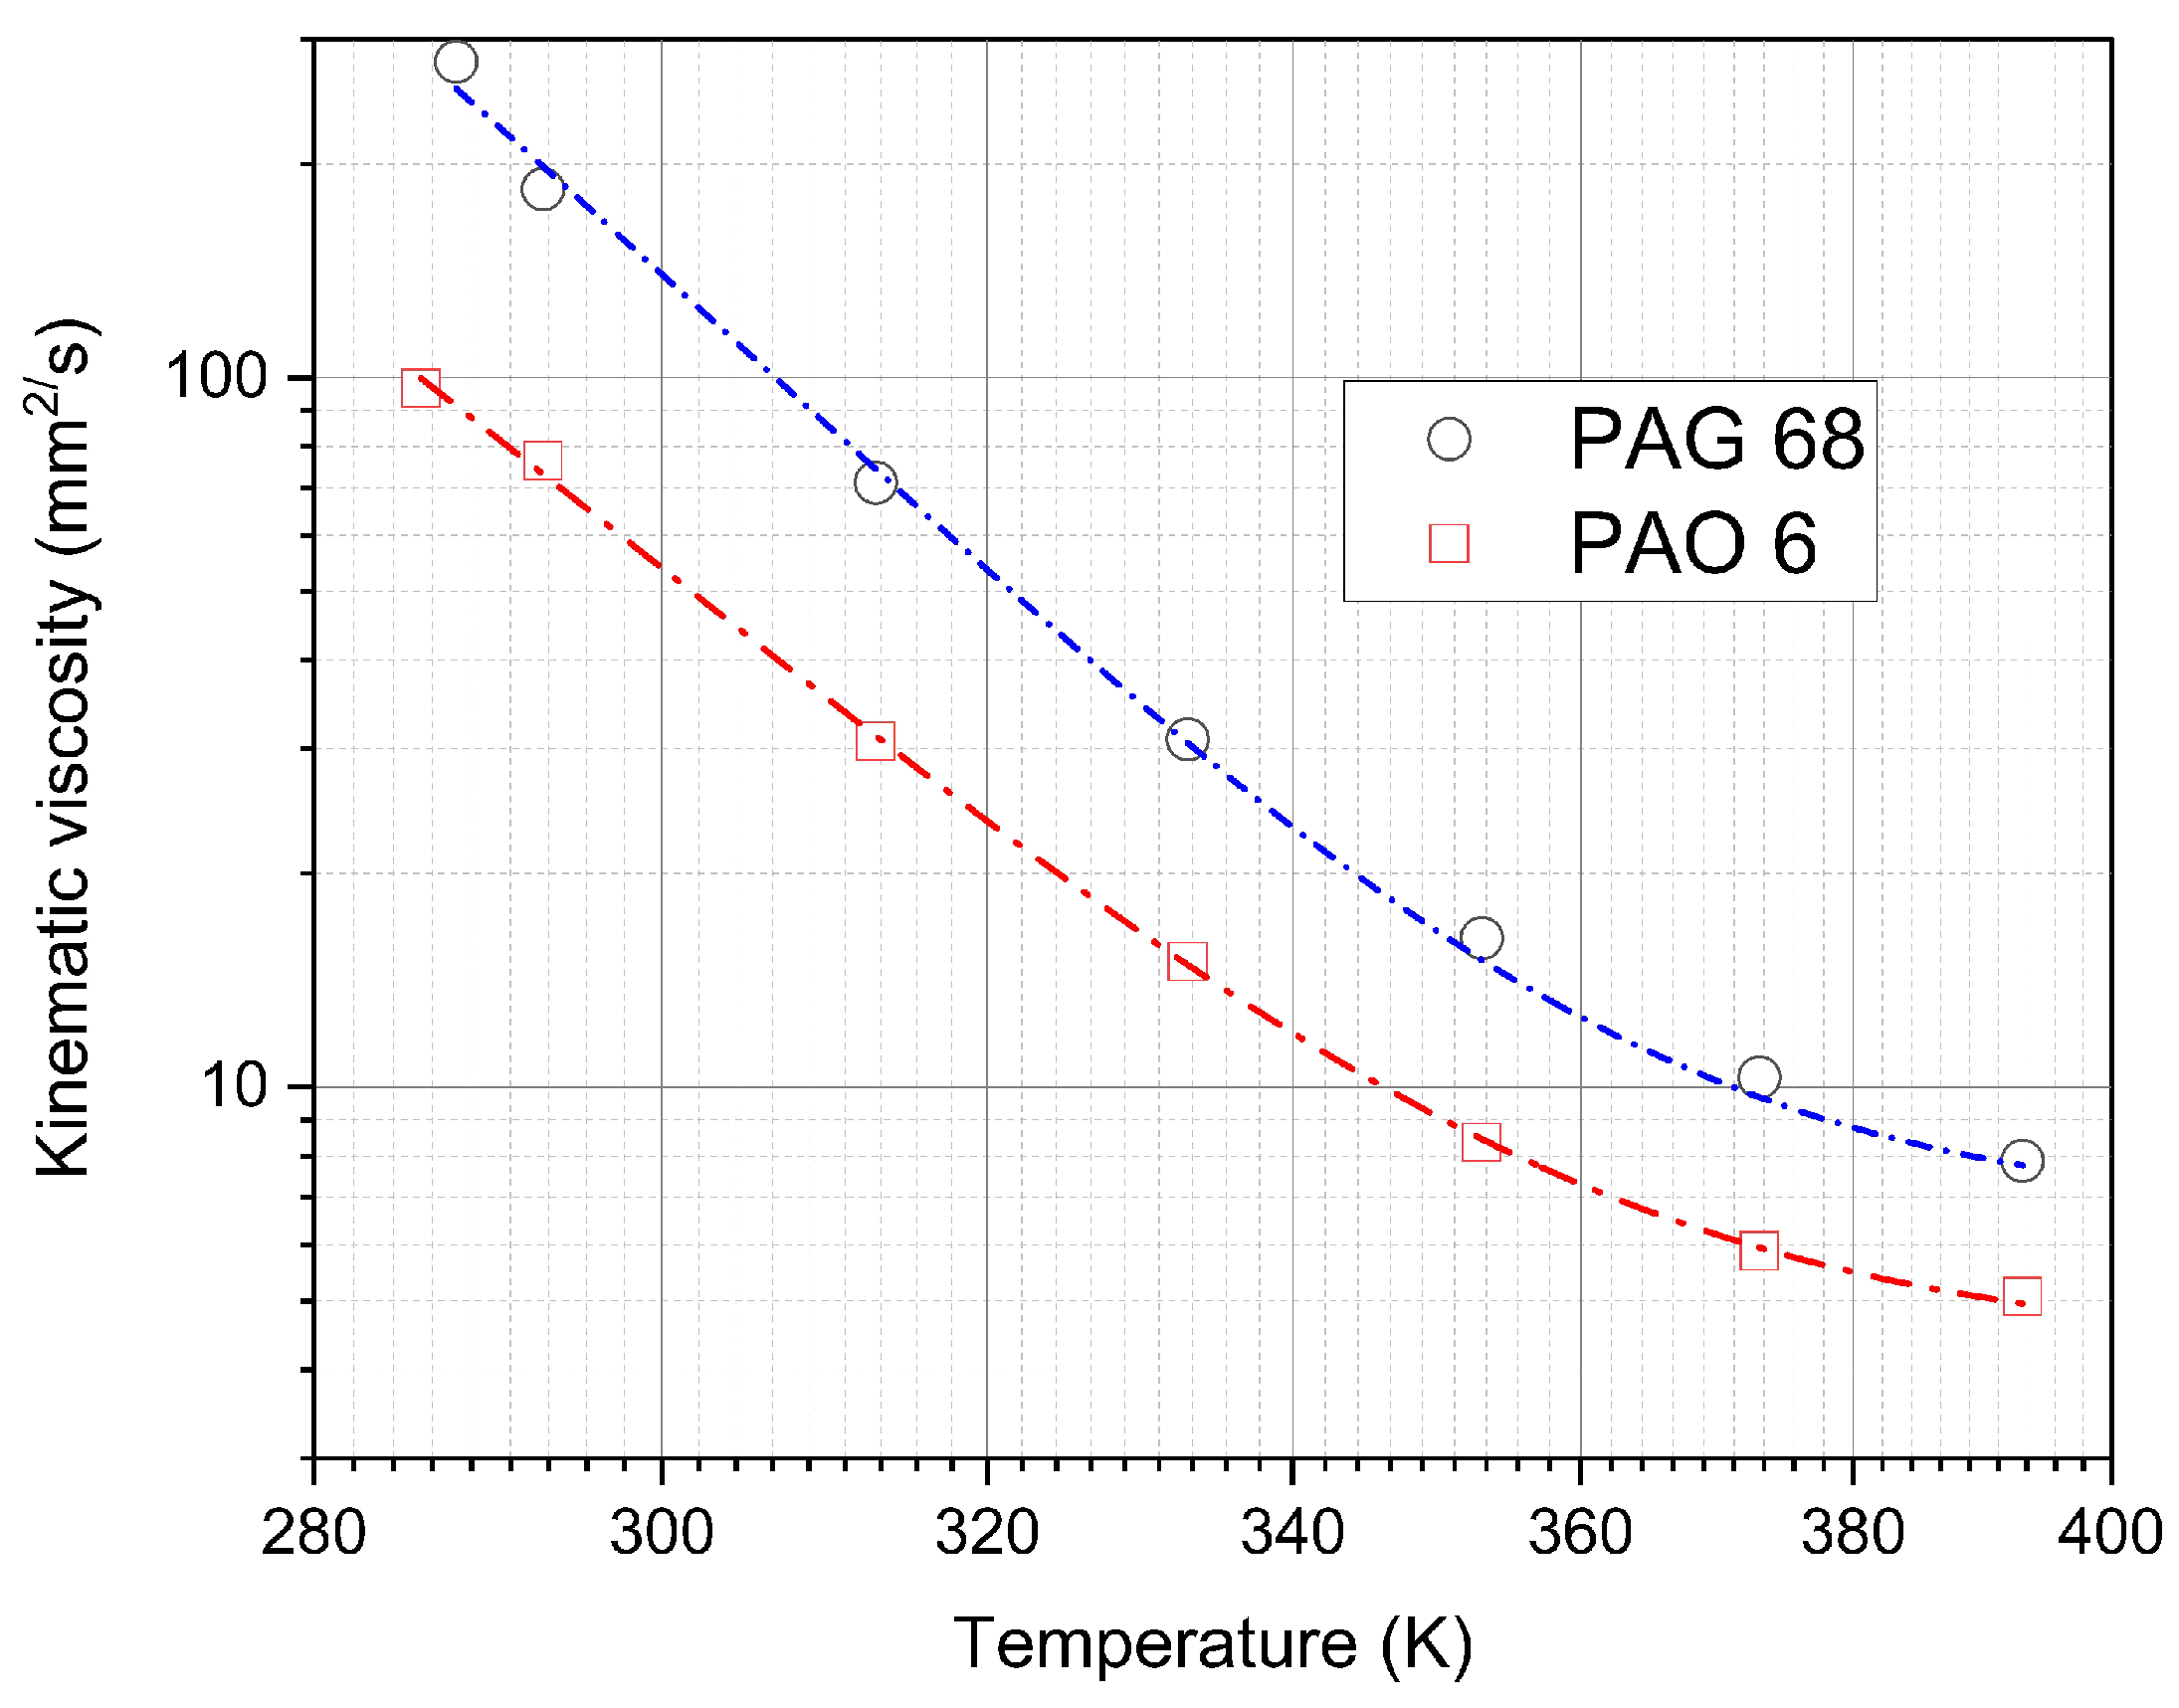
The result of the dependence of kinematic viscosity on the temperature in double logarithmic coordinates is shown in Figure 2. The measured data shown in Figure 2 was approximated by Equation (3) described by Stanciu [24].
where: A, B are coefficients, is kinematic viscosity, and T is the absolute temperature.
Table 2 summarizes the coefficients used in Equation (3). The chosen approximation functions fit the measurement data very well because the R-Square is close to unity.
Table 2.
The coefficients applied for fitting curves.
A comparison of the catalogue with experimental data for selected temperatures is summarised in Table 3.
Table 3.
Comparison of kinematic viscosity between experimental results obtained and catalogue data.
The experimental results obtained for the values of the kinematic viscosity coefficients for PAO 6 oil do not differ from the catalogue data, while the differences are already evident for the analyzed PAG 68 oil and amount to 4.5% at 40 °C and 16.75% at 100 °C, respectively.
During the study, it was also necessary to know the electrical properties of the oils tested. Resistivity and electrical permeability were measured using a KP-4 type measuring capacitor built according to the Polish standard PN-EN 60247 [citation—European standard EN 60247:2004]. Electrical permeability was determined from measurements taken with a QuadTech LCR bridge type 7600 Plus, and oil resistivity was measured with a Sonel MIC-2500 meter.
These properties, such as resistivity and relative permittivity, are summarized in Table 4. In the last row, the properties of the device materials used during the tests were also included in a specially constructed test stand.
Table 4.
The electrical properties and materials of the main experimental components used during the experiment.
3. Details of the Tribological Measurement
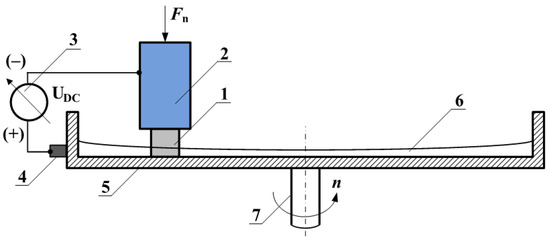
To determine the friction coefficient, a tribotester (pin-on-disc) was used, which is presented in Figure 3. The tribotester is made up of the following parts: the elastomer sample (pin) (1), a metal sample holder (2) to which DC voltage is applied (negative pole) (3), a carbon brush (4), a spinning metal disc (5) with oil (6) fixed to a shaft (7). The friction coefficient was measured using a NA1 MG-TAE1 strain gauge and a recorder allowed measurement data to be read and recorded. The angular velocity of the disc was regulated with an iG5A inverter.
Figure 3.
The pin–on–disc test scheme, 1—pin, 2—metal sample holder, 3—applied DC voltage, 4—carbon brush, 5—spinning metal disc, 6—investigated oil, 7—shaft.
The study of the coefficient of friction between an elastomer and metal discs was carried out under mixed friction conditions (from the measurements the coefficients of friction (, ) were determined for all possible configurations of the system were in the range of 0.05–0.08) with and without a DC electric potential in the Tribotester. During the tests, an elastomer slides on the discs made of steel X5CrNi18-10 or copper (97.4% Cu) and the experimental conditions of the set-up are shown in Table 5.
Table 5.
The parameters used in the experimental set-up.
Before the measurements were performed, the elastomer sample was grated on the tribotester with the same force and sliding speed as in the regular experiments. In all tests, the oils had an ambient temperature equal to 293 K.
In order to carry out the tests, during which the external DC electric field was established at a friction junction, the electrically separated sample holder was connected to the negative pole, a high-voltage power supply, while the positive pole was connected to the spinning disc with the use of a brush. During preliminary tests, a constant external electric field was not observed to have any effect on the operation of the measuring equipment on the test bench but would affect the change in oil temperature in the friction node—Joule heat of 10 mJ for t = 60 s.
The electrical resistivity between the sample holder and the spinning disc of cooper and steel for PAO 6 was about 1 T and for PAG 68 was about 2 G respectively.
The system was electrically powered with a voltage U of 5000 V. Based on preliminary research results, it was accepted that the contact pressure p would be 0.24, 0.68, and 1.10 MPa, while the sliding velocity u would be 0.2 and 0.4 m·s. For each pair of friction, the test was repeated 5 times, giving 5000 m of sliding distance.
3.1. Measurement Procedure
The tests were carried out using the following procedure and sequence: The friction force was measured for one hour without voltage, then after a one-hour break, the friction force was measured again for one hour, but with a voltage of 5000 V. After conducting five such measurement series and calculating the arithmetic means of the individual coefficients under the action of the DC electric field and without any external DC electric field , the relative friction coefficient was determined. Standard deviations were also calculated from the results obtained.
3.2. Numerical Investigation of External DC Electric Field
The two-dimensional modelling software, COMSOL, was used to observe the distribution of the external DC electric field between the holder and the disc. Knowing from the measurements that the current in the circuit is negligible, the electrostatic module (es) to model the system was selected. Also, an aspect related to the simulation carried out was the analysis of the electric field in the context of observing the spike effect and capturing the so-called voltage breakdown.
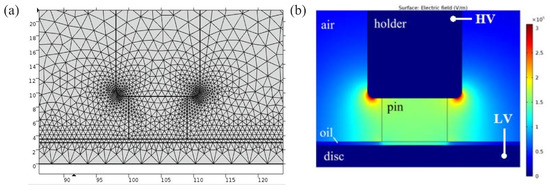
The numerical mesh used is shown in Figure 4a. The mesh consisted of a so-called unstructured mesh with a total number of triangular elements of about 7000. Details of the mesh are described in Table 6.
Figure 4.
Applied numerical mesh (a) and distribution of DC electric field (b) in the “pin–on–disc” system with DC voltage supply −5000 V.
Table 6.
Parameters used for the applied mesh.
Steady-state simulations were performed using standard solver settings. The applied boundary conditions are shown in Figure 4b. The physical and geometrical values used directly for the numerical analyses are described in Table 7.
Table 7.
The physical and geometrical values used during the numerical calculations.
In Figure 4b it was observed that the maximum of the external electric field occurs close to the holder and the pin (electric blade effect).
4. Molecular Simulation
The computational procedure involved the creation of molecular models of PAG and PAO, as well as models of Fe and Cu surfaces. First, the PAG and PAO models were optimized in two steps. The first step involved geometry optimization, and the second involved molecular dynamics simulation to determine the most stable conformation of the molecules. For metal surfaces, the MD simulation step was omitted. Such an approach was applied due to the fact that PAO and PAG are likely to form several conformers corresponding to the energy minimums, while in the case of metal surfaces such a phenomenon was not expected. The next steps were conducted to determine the adsorption energy of each molecule on all studied metal surfaces. For this purpose, systems consisting of PAO/PAG molecules located in the vacuum plate above the metal surface were evaluated using additional geometry optimization. The adsorption energy was calculated using the following Equation (4):
where: —adsorption energy, kJ/mol; —the energy of the system composed of a molecule adsorbed on the metal surface, kJ/mol; —the energy of the single molecule, kJ/mol; —the energy of the metal surface, kJ/mol.
The applied computational procedure for the determination of the adsorption energy is state-of-the-art in molecular modelling. Such an approach is adopted in numerous studies, using various types of molecules and adsorption materials, including, e.g., metal-doped nanotubes [25], surfaces [26,27] and zeolites [28].
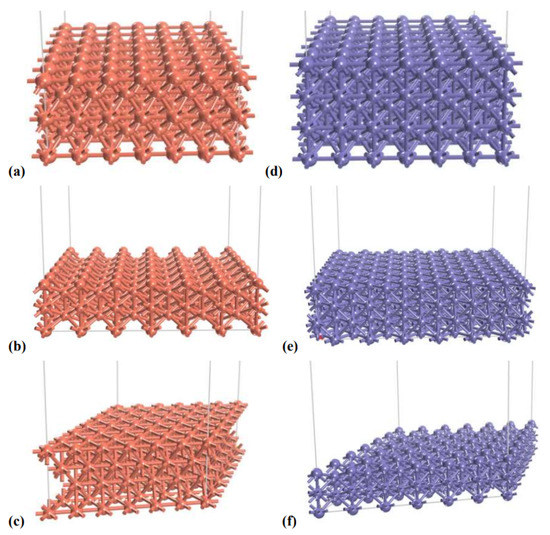
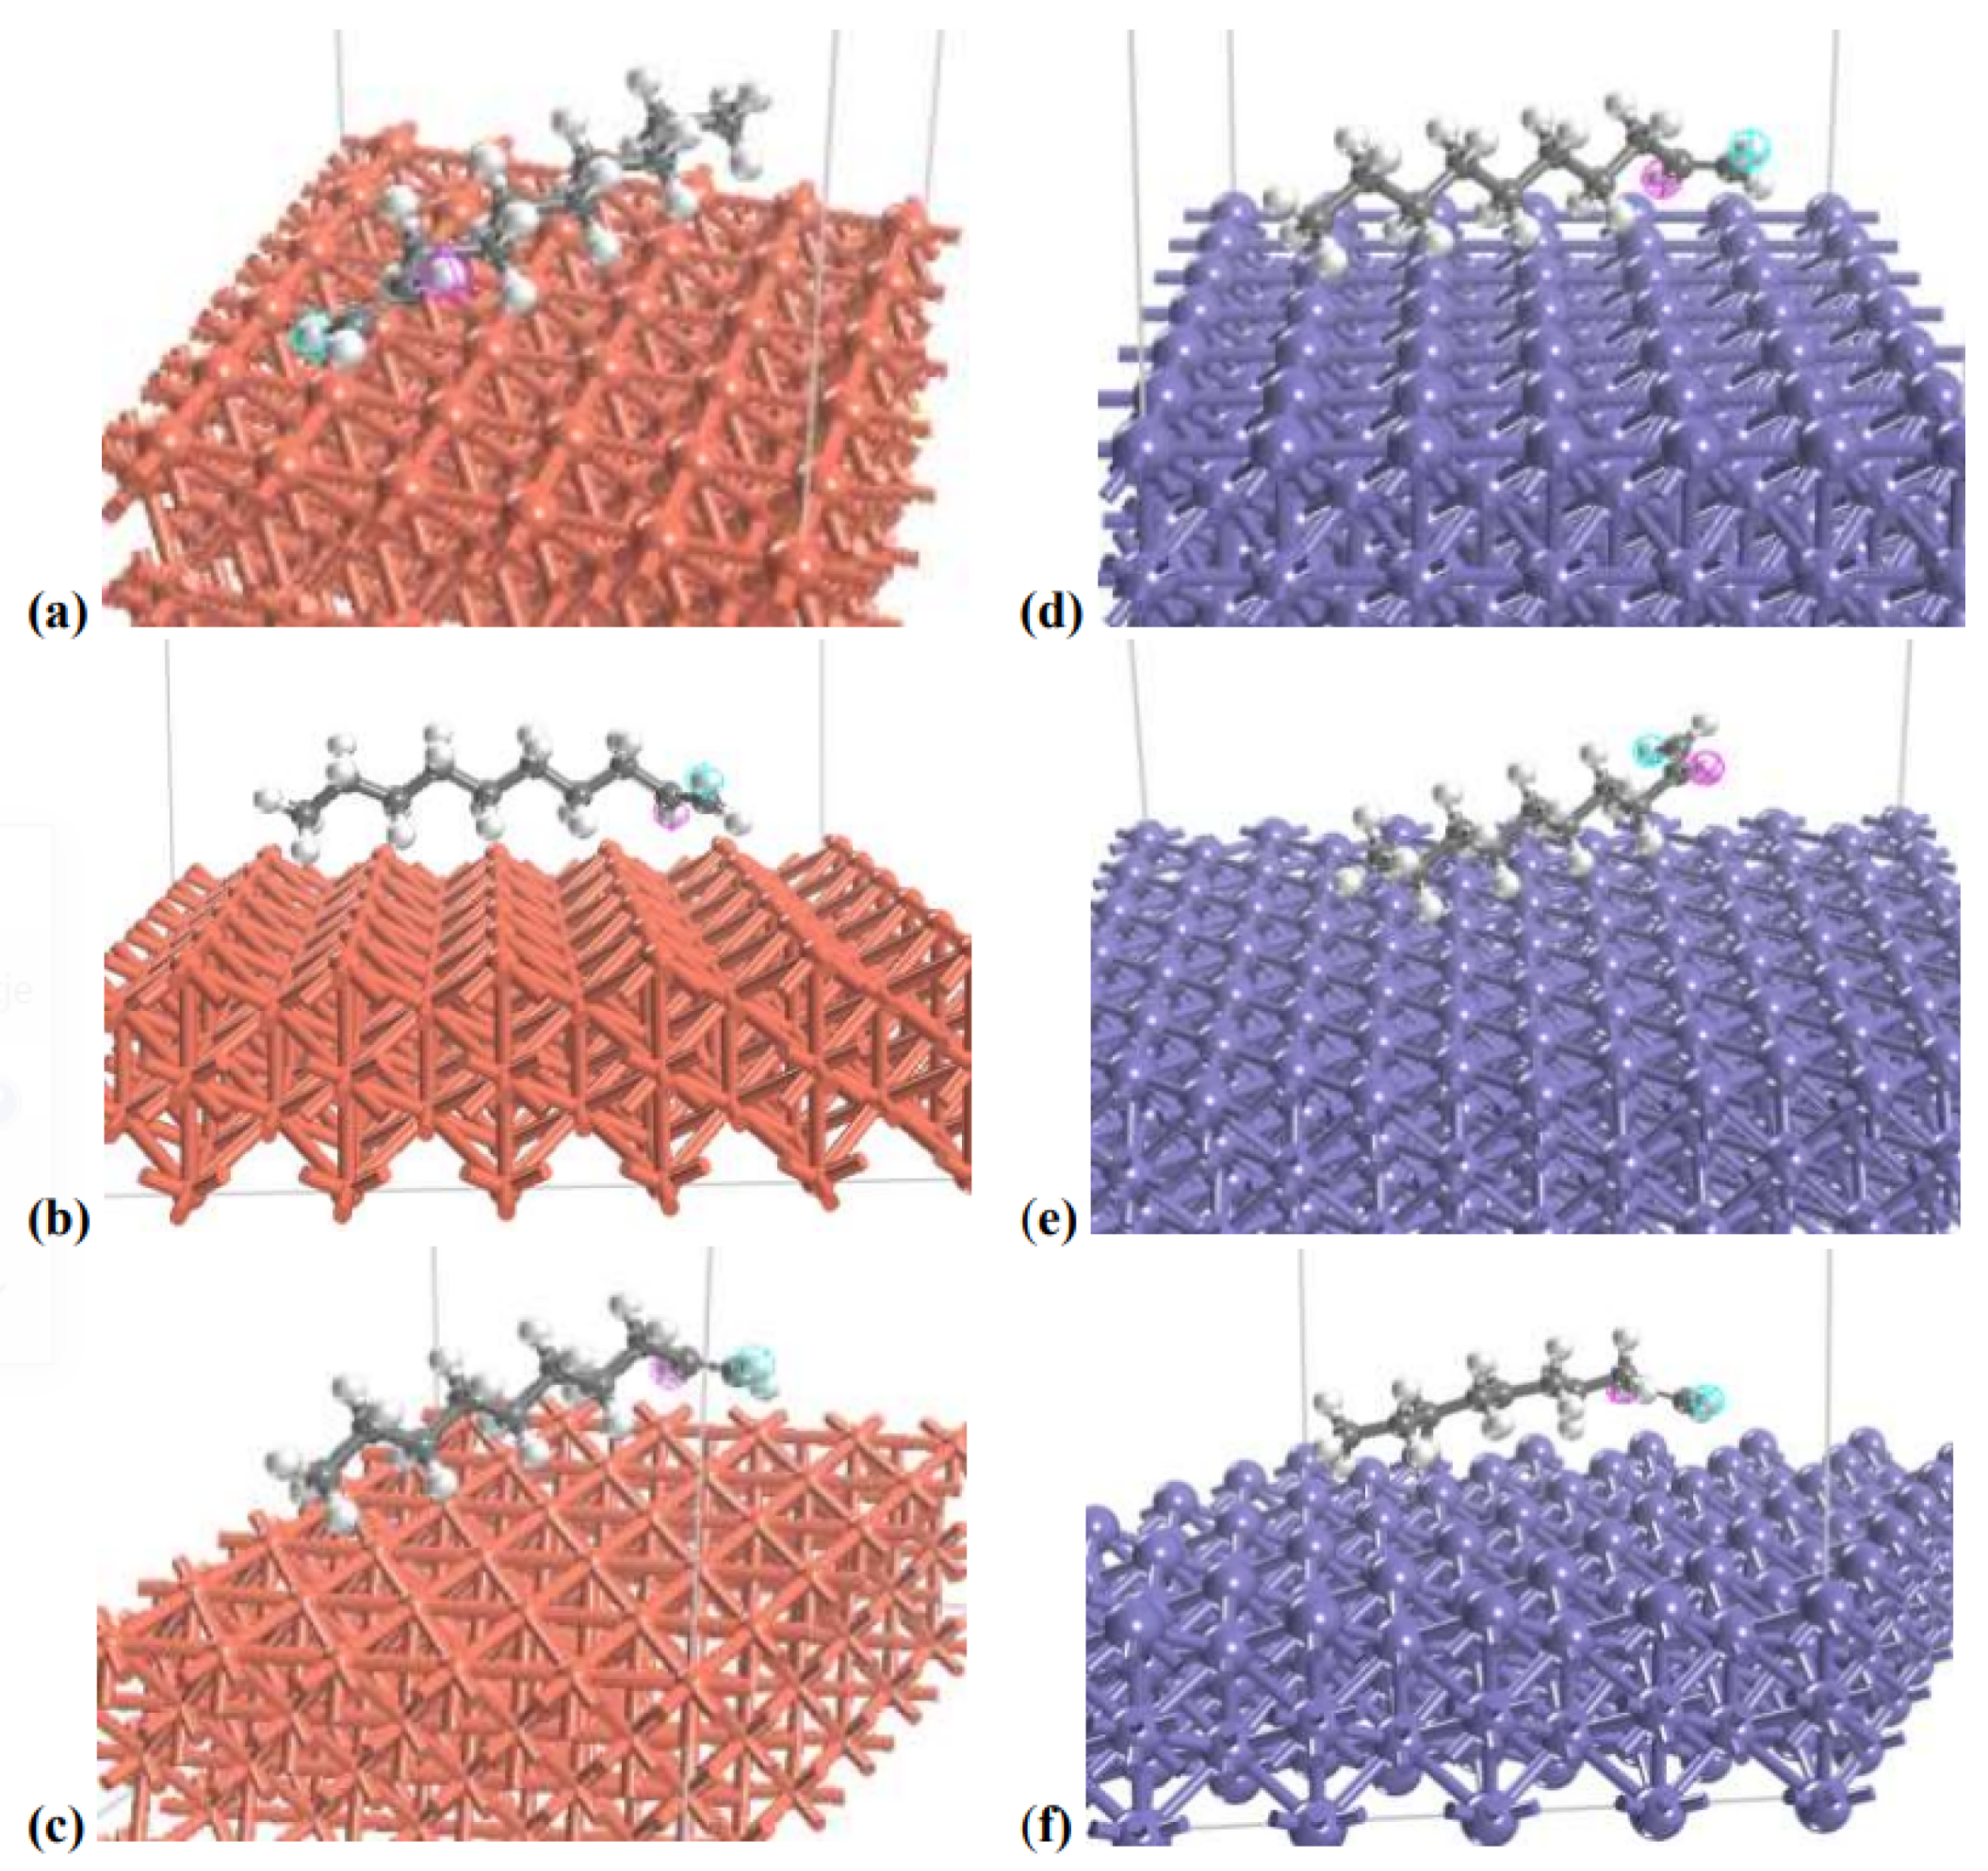
Molecular models of the metal surface are presented in Figure 5. They consist of periodic cells of 6 × 6 size and a vacuum slab of 20 Å. Table 8 presents the cell sizes for each model. In the present study, two metal surfaces have been taken into account–copper and iron with three different surface structures for each metal–Cu[100], Cu[110], Cu[111], and Fe[100], Fe[110], Fe[111].
Figure 5.
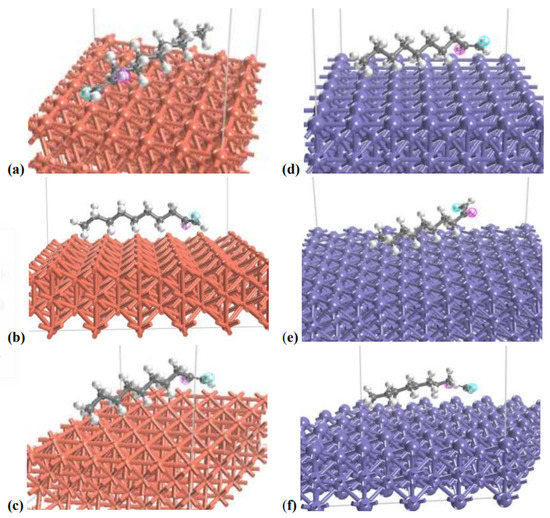
Periodic cells of surface models of Cu[100] (a), Cu[110] (b), Cu[111] (c), Fe[100] (d), Fe[110] (e) and Fe[111] (f) surfaces. Orange atom color represents copper, dark blue–iron.
Table 8.
Periodic cell dimensions for copper and iron surface models used in simulations.
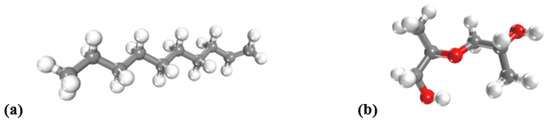
Two types of lubricant molecules were considered—PAO 6 (polyalphaolefin) and PAG 68 (polyalkene glycol). PAO 6 is represented by a 1-decene molecule, while the PAG 68 molecule is represented by a dimer of (poly)propylene glycol (PPG). The 1-decene molecule was chosen as the lubricant model because it is the basic building block of a wide range of polyalphaolefins (PAOs), including the PAO 6 used in the experiment. The molecular models of PAO and PAG are shown in Figure 6. Both PAO and PAG are isolated molecules with no periodic boundary conditions.
Figure 6.
Optimized structure of 1-decene (a) and dimer of (poly)propylene glycol (PPG) (b). C atoms are coloured grey, O atoms are coloured red, H atoms are coloured white.
The models were optimized using both a ReaxFF 6.0 force field (GULP) and a COMPASS force field (Forcite). The geometry optimization was performed using a cutoff of 18.5 Å and an atom-based summation method for both electrostatic and van der Waals interactions. The convergence criterion corresponding to the preset “ultra-fine” precision was used, with a force tolerance of 0.001 kcal/mol/Å and an energy tolerance of kcal/mol. Optimized lubricant molecules were placed on the metal surface and the resulting model was optimized with the same parameters. After optimization, the molecular dynamics simulation was performed using an NVT ensemble, at 298 K, with 1 fs time step, and 100,000 total steps, resulting in a simulation time of 100 ps.
The impact of intermolecular interaction between small molecules and large structures has been comprehensively explored by Chen Lu et. al. [29]. According to this study, “The total energy of the internal adsorption of [6, 6] CNB was significantly smaller than that of external adsorption”, “Therefore, the two adsorption modes (internal and external) had little effect on the contribution of electrostatic interactions in adsorption”, it was indicated, that internal (intramolecular) interactions between molecules have a small impact on the adsorption energy. Furthermore, as we focus on the impact of the electric field on adsorption energy, the interactions between molecules (intramolecular) have a very weak effect on electrostatic interactions in adsorption. Based on the abovementioned conclusions, a single molecule of 1-decene and PPG has been included in the studied models.
A force field method is a computational approach based on the fact that molecules, although different in structure and composition, contain similar elements. These elements are atoms or groups of atoms, so a set of parameters for specific pairs of atoms allows the simulation of a wide variety of molecules containing these atoms. For example, the C-H bond length is approximately 1.10 Å and varies by only ±0.05 Å depending on the type of molecule. As a result, the C-H atom pair can be treated as a bond of constant length. A force field contains energy functions related to the length of the bond, so a change in the length of the bond due to the translation of the atoms results in a change in energy. In this way, each pair contributes to the total energy of the simulated molecular system. The total energy description is a sum of energies corresponding to different types of interactions (Equation (5)):
where: E—bond stretching energy, kJ/mol; E—plane angles energy, kJ/mol; E—dihedral angles energy, kJ/mol; E—van der Waals energy, kJ/mol; —electrostatic interaction energy, kJ/mol; E—cross-terms energy, kJ/mol.
Different force fields contain different parameters to describe energy. A Universal ForceField (UFF) [30] includes parameters for all types of atoms, but its application is often limited by the precision it provides. A variety of forcefields have been developed which are only suitable for specific molecular systems in order to provide greater accuracy).
One of the forcefields designed to simulate organic molecules as well as condensed phase systems is COMPASS [31], which has been widely used for adsorption simulations on various surfaces [1D–3D]. Another force field suitable for the adsorption of hydrocarbon-like molecules on solid surfaces is ReaxFF [32,33,34], which is characterised by greater functionality than classical force fields due to the possibility of simulating bond breaking and formation, which is essential in the case of chemical adsorption.
5. Results
5.1. Experimental Results
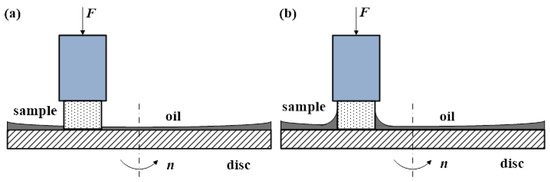
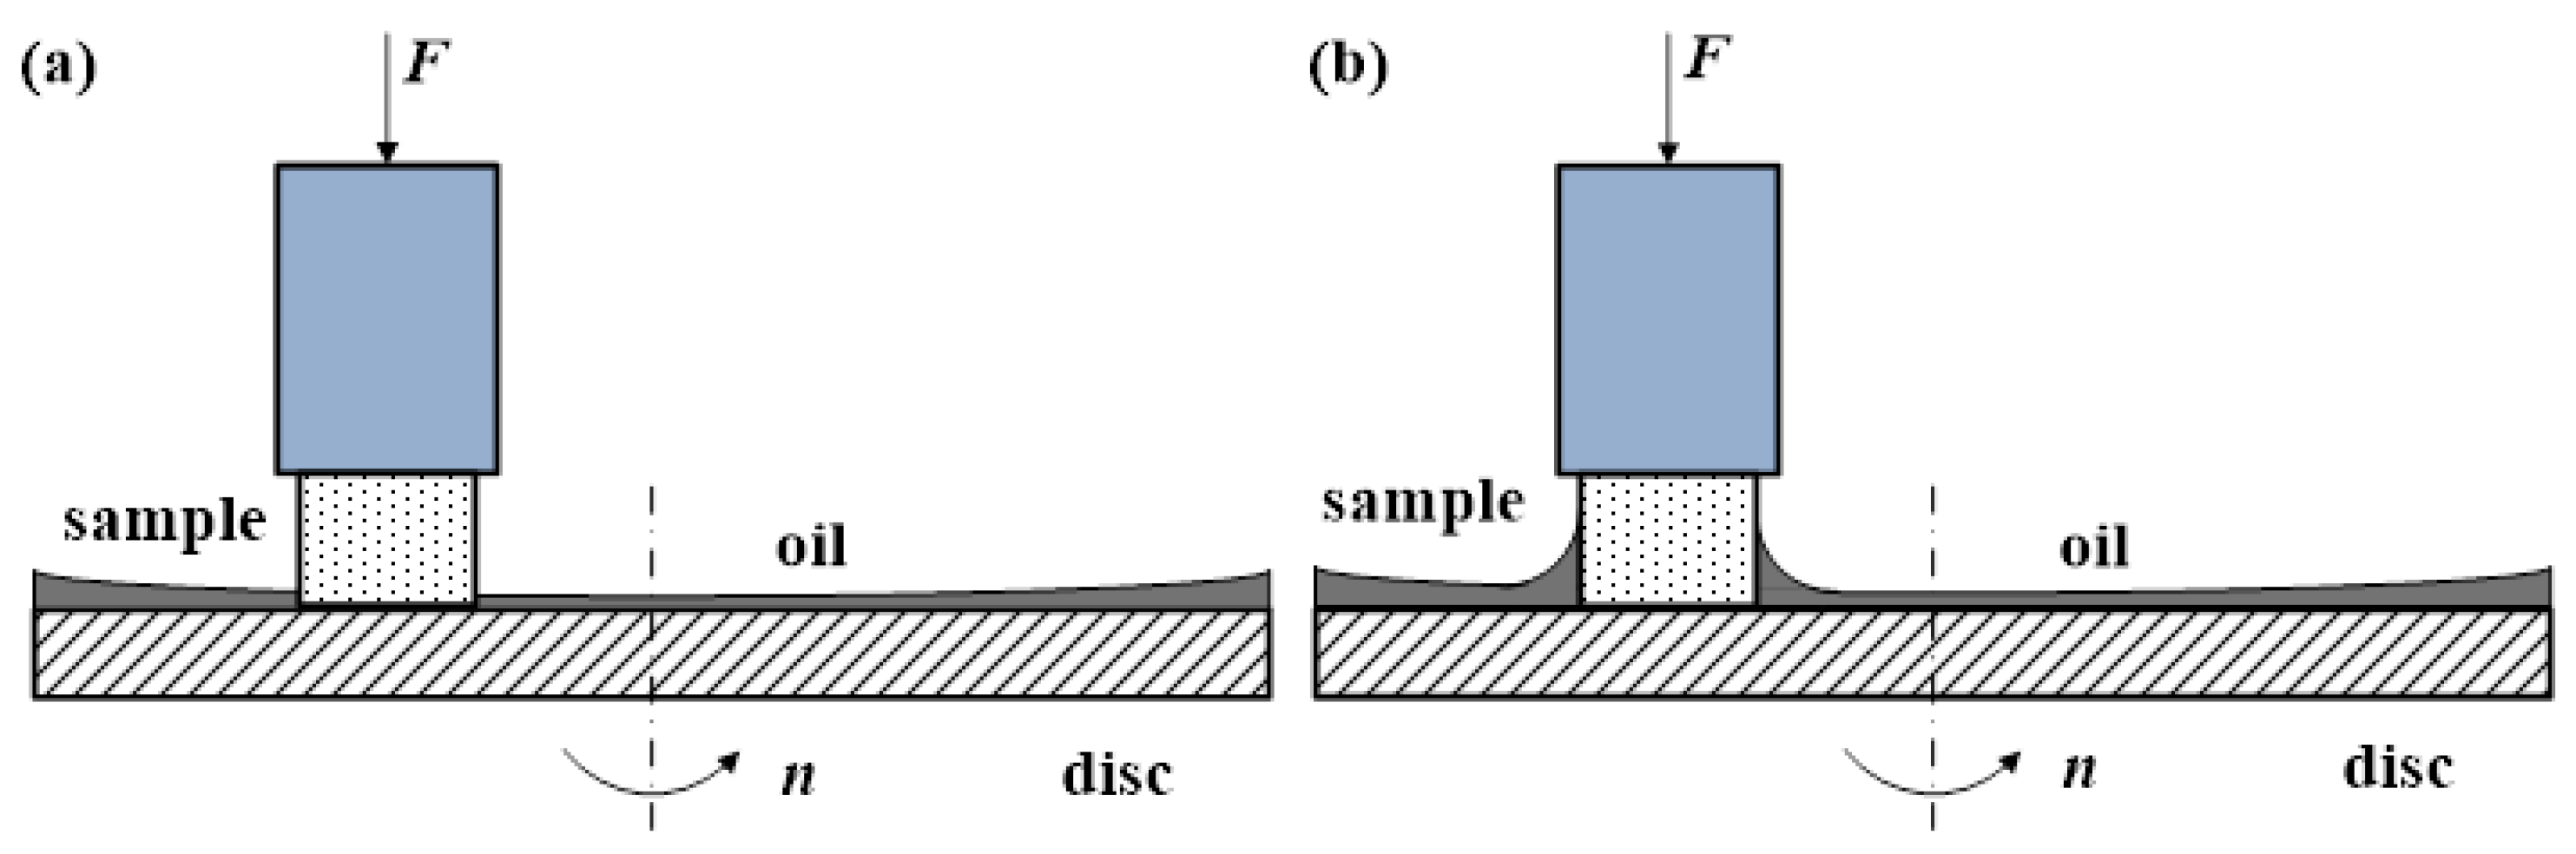
Figure 7a,b show a simplified schematic of the pin-on-disc system without and with DC voltage applied between the pin holder and the disc. During the test, a change in the shape of the oil film on the pin surface was observed when DC voltage was applied and the oil was drawn to the side surface of the pin above the oil level (Figure 7b). It appears that the high electric field distribution near the holder causes this effect.
Figure 7.
Simplified schematic of a “pin–on–disc” system: (a) without DC voltage supply, (b) with DC voltage supply.
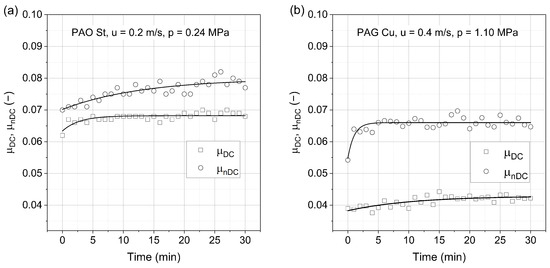
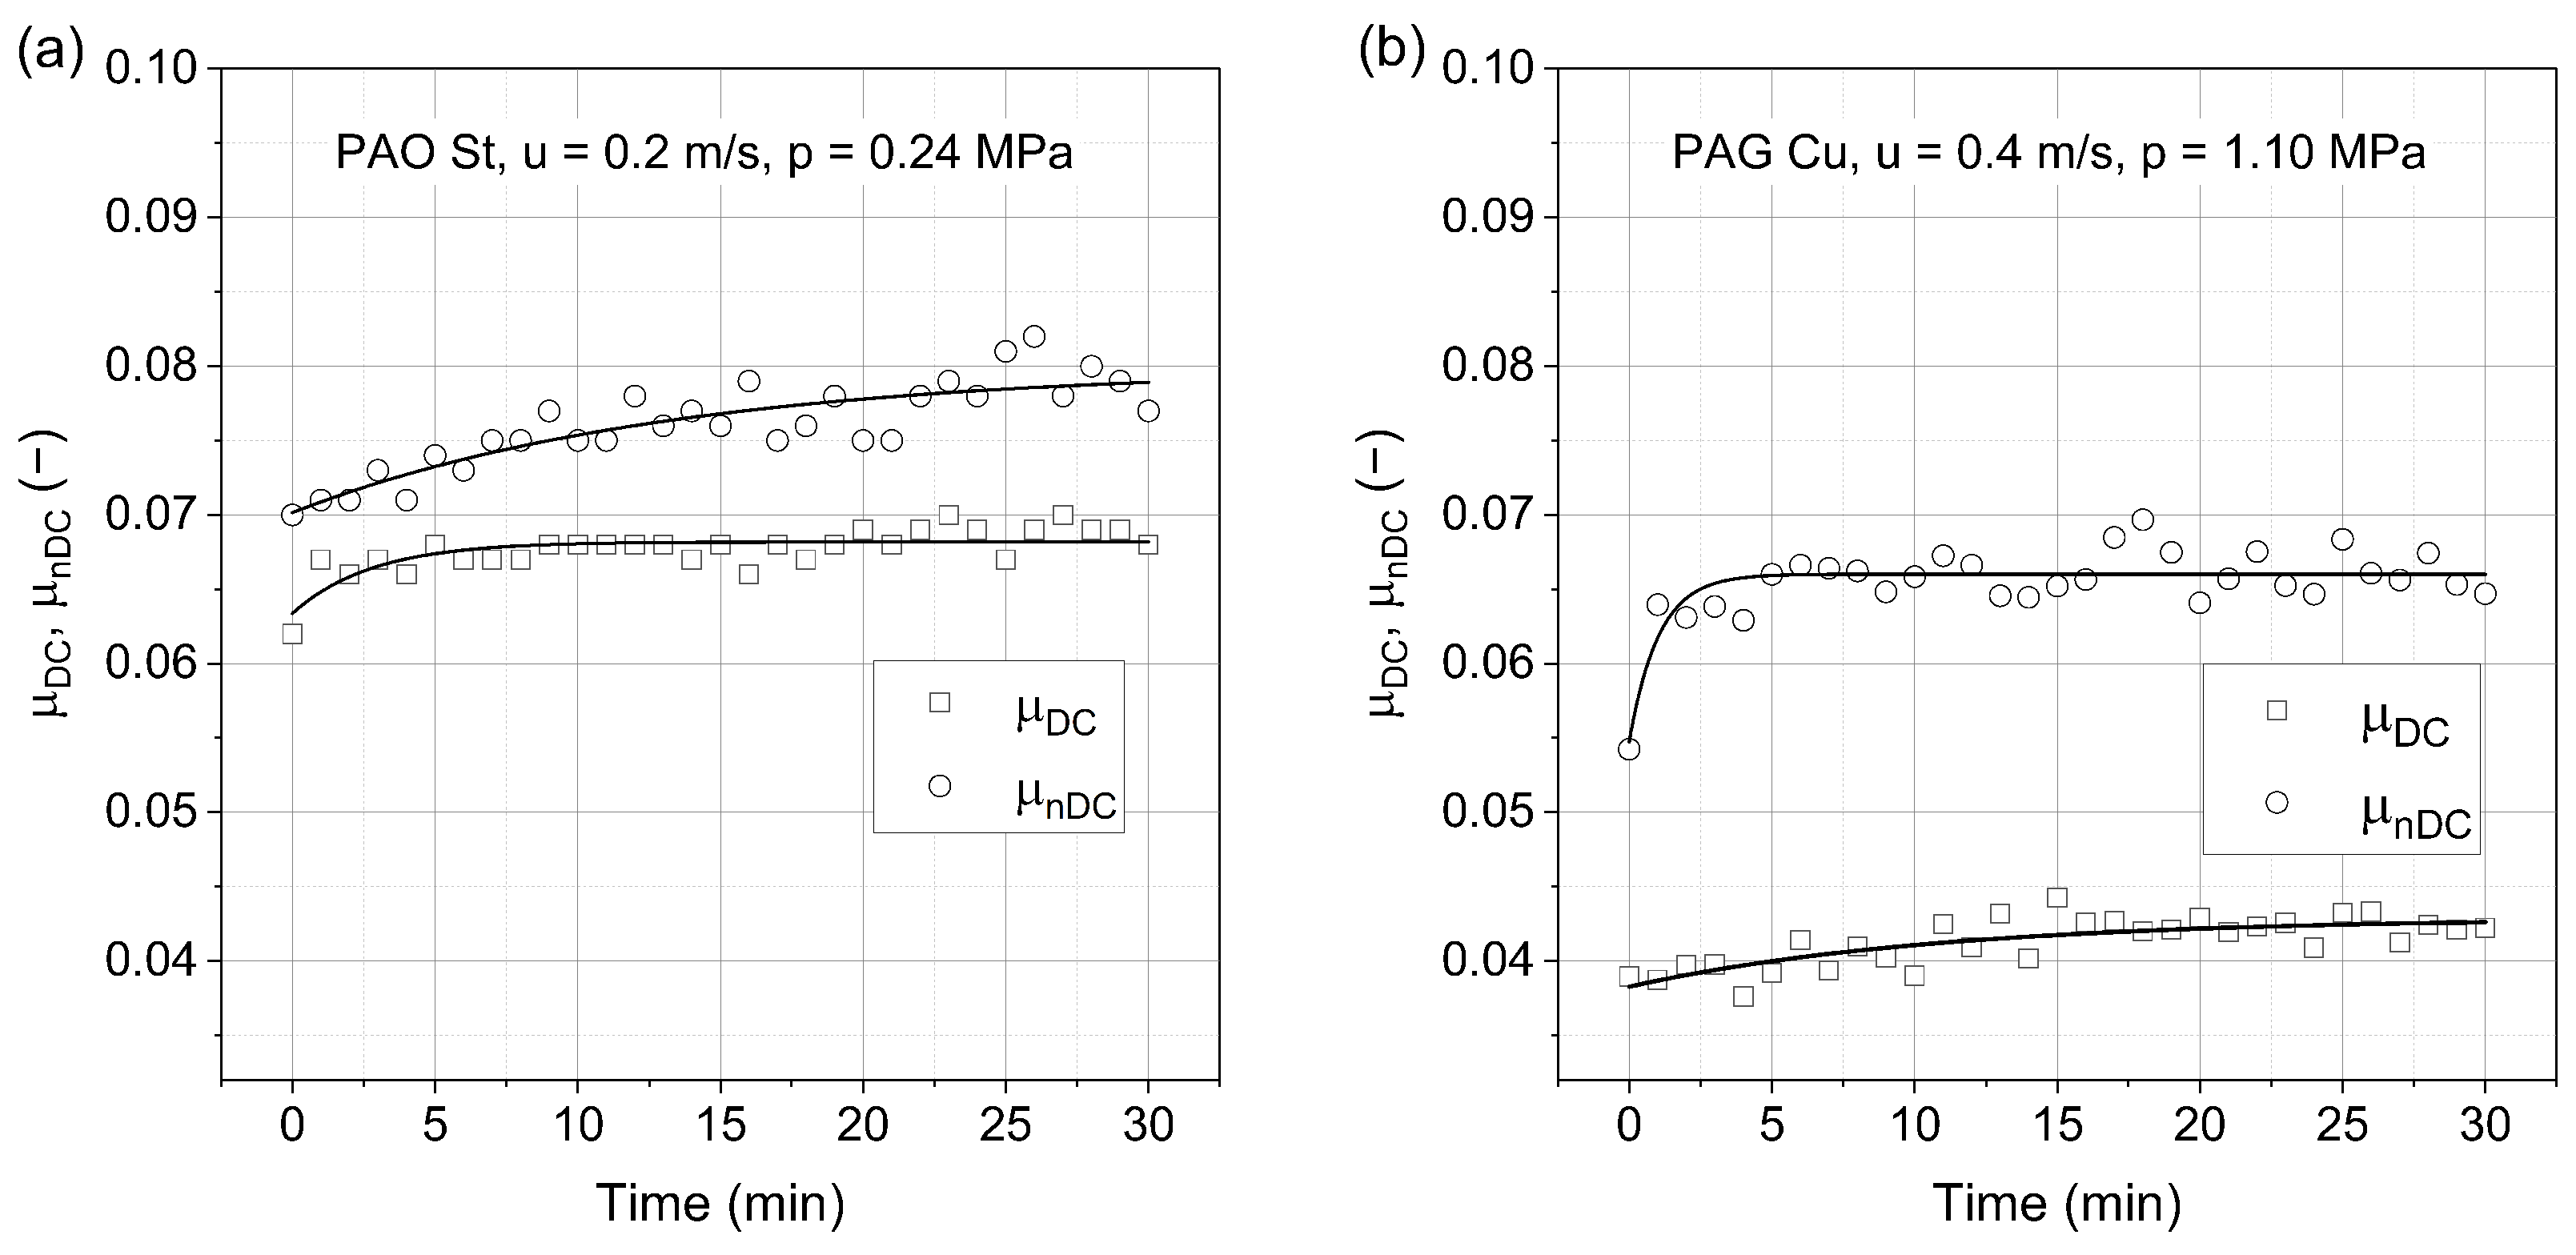
Figure 8a,b depict examples of variations in the friction coefficient as a function of time. As can be seen, the influence of an external constant electric field (shown as □) causes the friction coefficient to decrease. Also, the parameters achieve a steady state very quickly, already after about 10 min of measurement the friction coefficient values reach steady state values.
Figure 8.
Examples of friction coefficient evolution as a function of time for different tested configurations: (a) PAO St, (b) PAG Cu, where ∘—, □— for DC voltage supply = −5000 V.
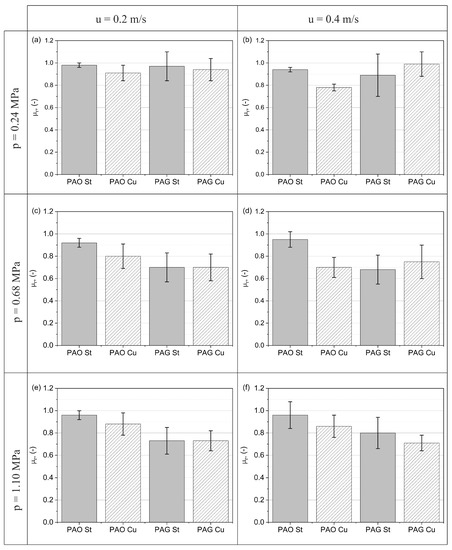
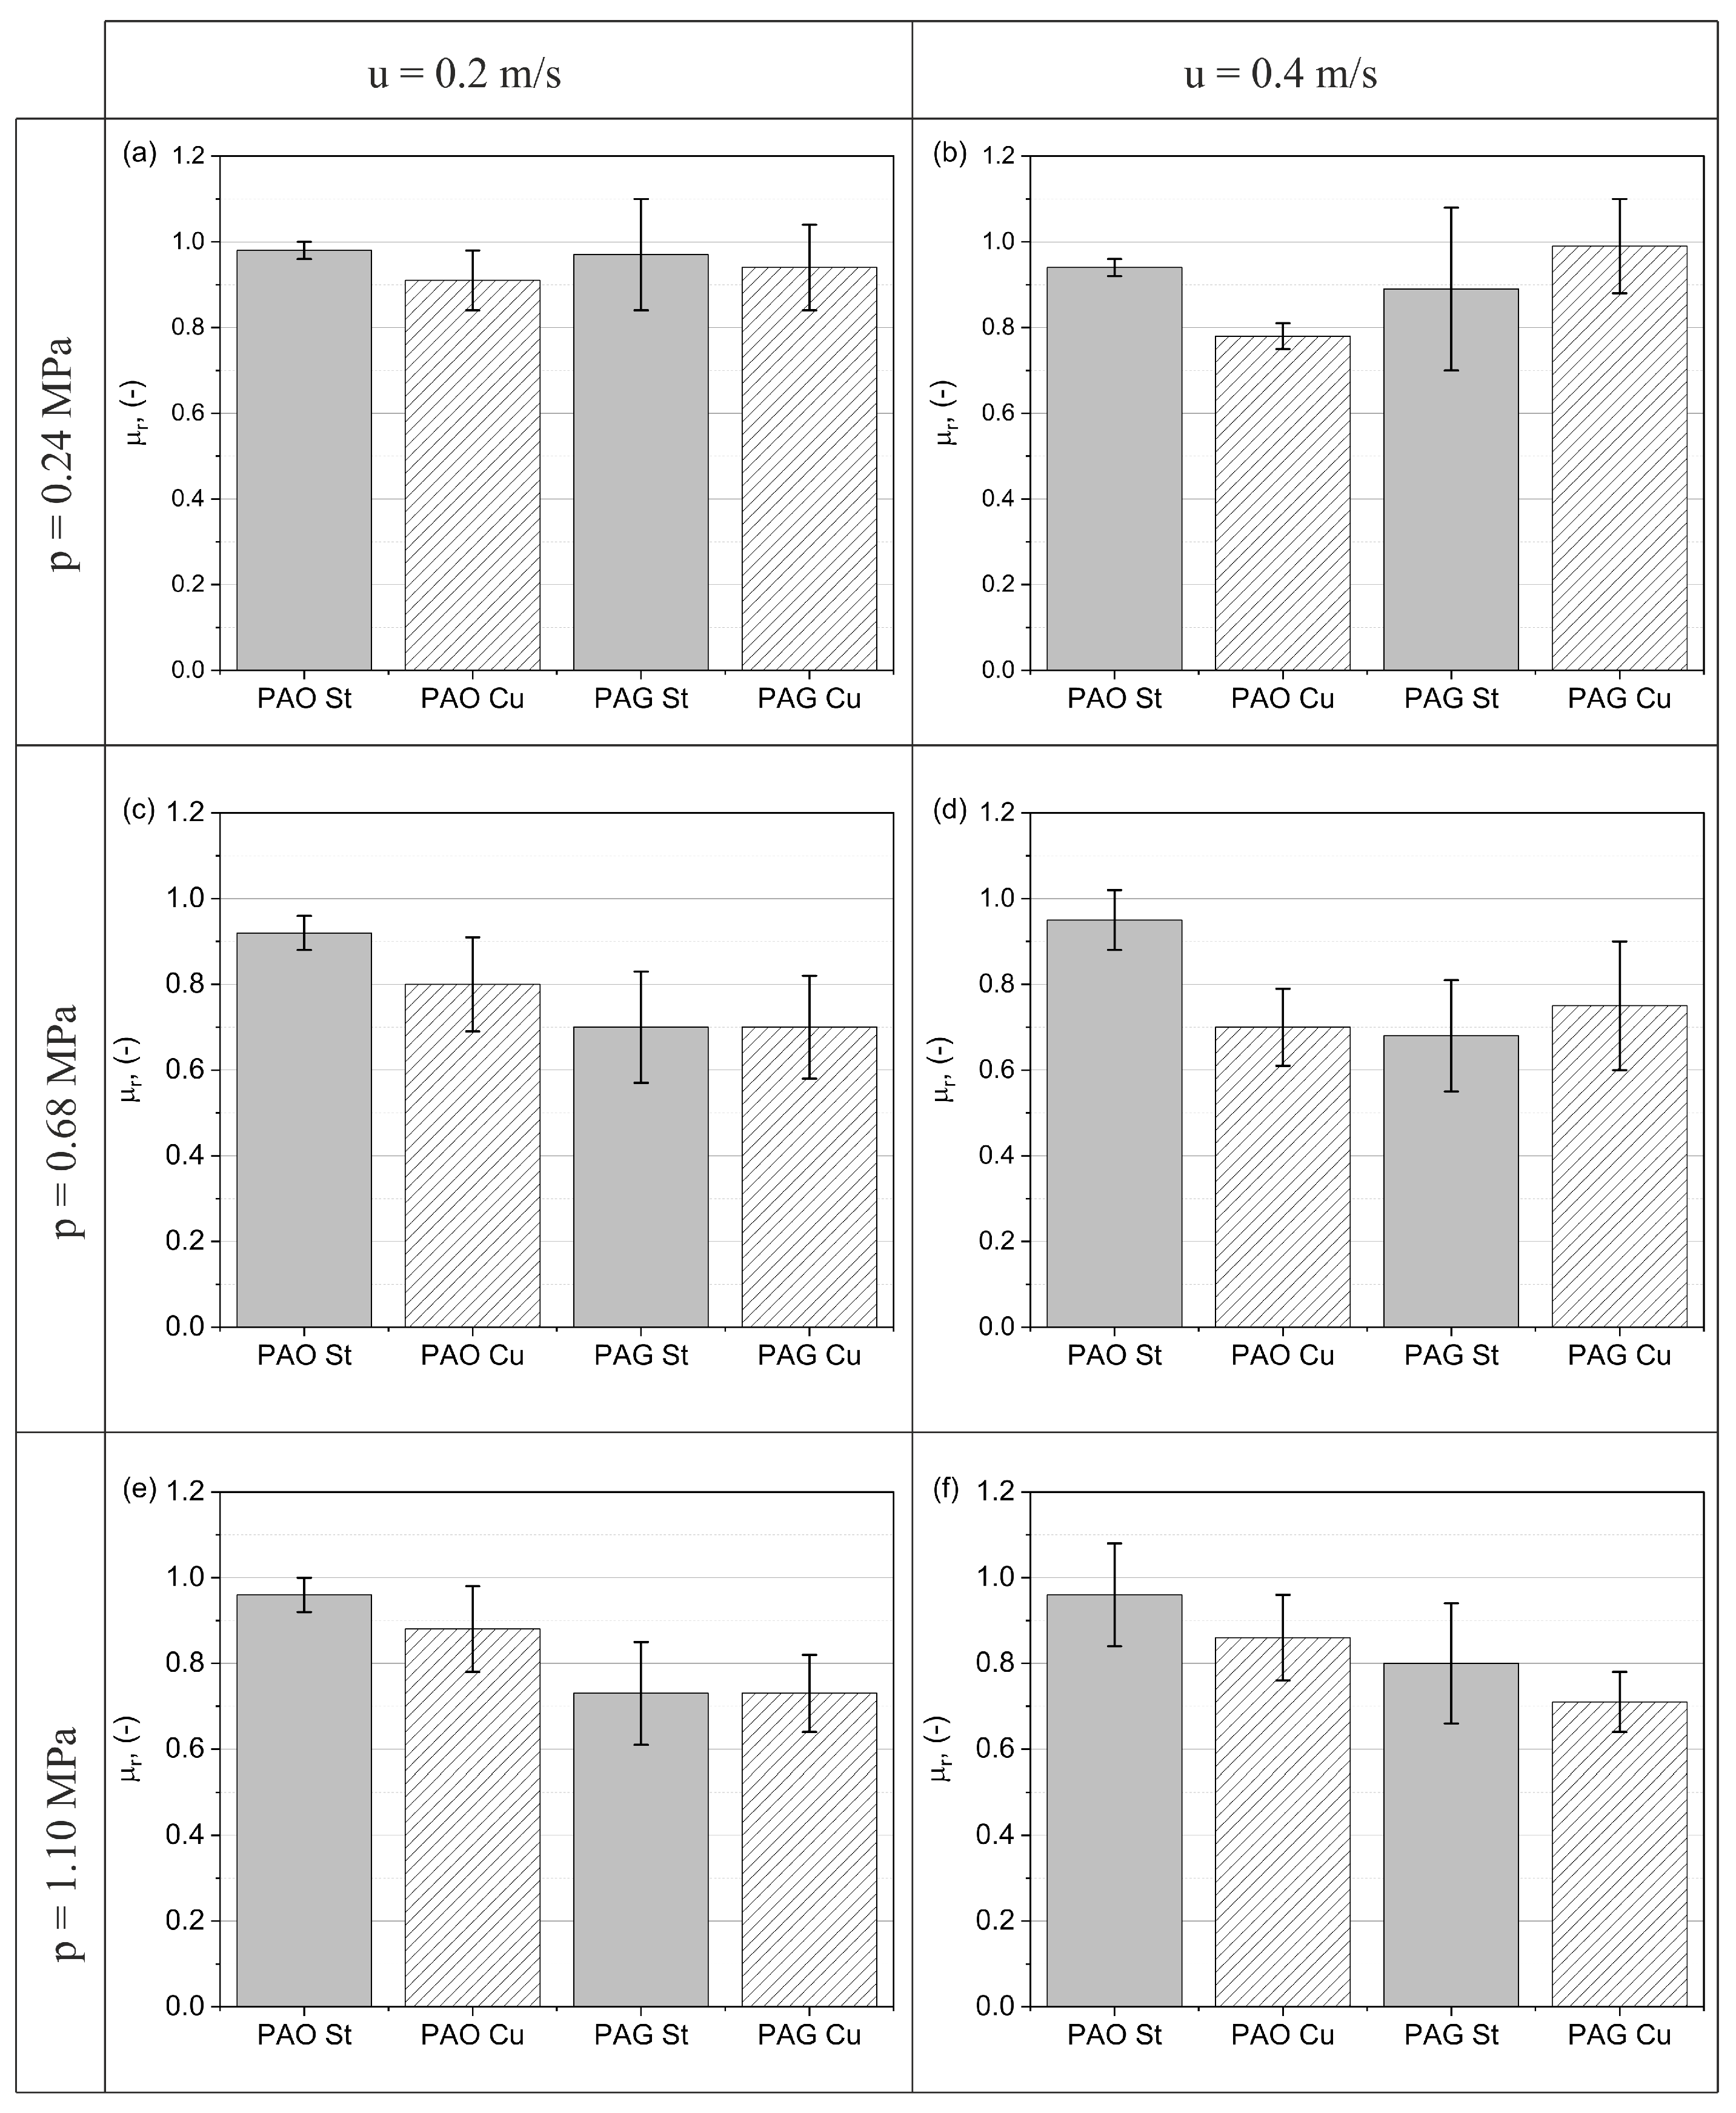
Figure 9 presents the relative friction coefficient of the elastomer tested that was slid across the steel and copper discs in the presence of different base oils. The relative friction coefficient (Equation (6)) means the ratio of the friction coefficient measured under the action of the DC electric field to the friction coefficient without any external DC electric field applied. The measurement procedure is explained in detail in Section 3.1.
Figure 9.
Relative coefficient of friction for different sliding velocities and contact pressures all used rubbing pairs. (a) u = 0.2 m/s, p = 0.24 MPa, (b) u = 0.4 m/s, p = 0.24 MPa, (c) u = 0.2 m/s, p = 0.68 MPa, (d) u = 0.4 m/s, p = 0.68 MPa, (e) u = 0.2 m/s, p = 1.10 MPa, (f) u = 0.4 m/s, p = 1.10 MPa.
The friction coefficient is a function of different sliding velocities u and different contact pressures p for tribological systems with and without applied DC voltage (5000 V).
As can be seen in Figure 9, the smallest changes in the relative coefficient of friction are observed for the PAO oil-steel disc system. The influence of the electric field is minimal in this case, regardless of the sliding speed and contact pressure. For the PAO oil system, larger changes in the relative coefficient of friction are observed for the copper plate system, which may indicate that the electric field forces are able to pull more oil particles into the oil film. For systems with PAG oil, changes in the relative coefficient of friction are comparable. When considering all systems, there is not much difference in the change in the coefficient of friction as a function of the sliding speed.
On the contrary, a large change in the relative friction coefficient can be observed for the two highest applied loads. At the lowest pressure, the number of oil particles is large enough that the subsequent oil particles drawn in by the electric field do not change the properties of the lubricating layer. For the other pressures, the lubricating layer is strengthened by the oil particles drawn in by the electric field (a phenomenon observed with the naked eye) (increasing the thickness of the lubricating layer), and a large effect of the electric field is observable.
5.2. Computational Results
The optimized structures of the copper and iron surfaces with a 1-decene molecule and a PAG molecule are presented in Figure 10. The adsorption energies of 1-decene and (poly)propylene glycol on all surfaces studied are presented in Table 9.
Figure 10.
Optimized structures of Cu[100] (a), Cu[110] (b), Cu[111] (c), Fe[100] (d), Fe[110] (e) and Fe[111] (f) surfaces with adsorbed 1-decene molecule. Grey atom color represents carbon, white—hydrogen, orange—copper, red—oxygen, dark blue—iron.
Table 9.
Adsorption energies of 1-decene and (poly)propylene glycol (PPG) calculated using a ReaxFF 6.0 and a COMPASS forcefield.
The adsorption energies obtained with the two ReaxFF and COMPASS variates depend on both the surface type and the forcefield type used. For ReaxFF, the adsorption energy of 1-decene in iron, the values range from −125.4 kJ/mol in the case of Fe(110) up to −155.4 kJ/mol for Fe(100), while in the case of copper surfaces, the values range between −44.6 kJ/mol for Cu(110) and −54.2 kJ/mol for Cu(100).
The COMPASS forcefield returns different adsorption energy values; however, both forcefields indicate that the adsorption of 1-decene on iron surfaces is stronger than on copper surfaces. For iron surfaces, the adsorption energies calculated using COMPASS vary from −293.8 to −435.4 kJ/mol. The adsorption energy values for the copper surfaces range between −181.9 kJ/mol and −210.0 kJ/mol.
In the case of (poly)propylene glycol, the adsorption energy values calculated using ReaxFF indicate that the adsorption on the iron surfaces is much stronger than on the copper surfaces—the adsorption energy values range between −42.1 kJ/mol and −85.7 kJ/mol for copper and between −246.8 kJ/mol and −400.8 kJ/mol for iron. The results obtained by using the COMPASS forcefield generally confirm that the adsorption on the iron surfaces is stronger. It must be emphasized that this relation is sharply observable for 1-decene, where the adsorption is always stronger in the case of Fe surfaces. However, the results for PPG indicate that the aforementioned relation is only partially true. Although, for the same surface type, e.g., Fe(100) and Cu(100), the adsorption is stronger in the case of Fe, the general comparison of PPG adsorbed on all types of Fe and Cu surfaces allows the authors to observe that there are exceptions from this rule. For example, the adsorption of PPG on Cu(100) (−182.9 kJ/mol) is weaker than on Fe(100) (−265.3 kJ/mol), however, it is stronger compared to Fe(111) (−153.5 kJ/mol). This is not observable in the case of ReaxFF. Nevertheless, the general trend of adsorption energies is similar in all cases.
Comparison of the adsorption energy for 1-decene and PPG on different surface and metal types allows several conclusions to be formulated. In the case of all Fe surfaces, the adsorption of PPG is always stronger than that of 1-decene. However, this effect is not visible for Cu surfaces, where both 1-decene and PPG present similar levels of interaction, with Ea in the range of −44.6 kJ/mol to −54.2 kJ/mol, except for one case, PPG on Cu(100), where Ea is equal to −85.7 kJ/mol. However, this follows the trend of a stronger interaction with PPG.
Despite differences in the adsorption energies obtained from the two forcefields used, the trend of adsorption energy values is preserved for both forcefields. It is visible that the interaction between 1-decene and (poly)propylene glycol with the iron surface is stronger than with the copper surface.
The presented computational results of adsorption energies may be referred to in the experiment. Interestingly, the effect of friction coefficient reduction observed experimentally shows dependence on the calculated adsorption energies and may be explained at a molecular level.
The general conclusion of the experiment is that the DC electric field reduces the friction coefficient; however, this effect is minor in the case of PAO 6 for both steel and copper discs, while in the case of PAG 68 (polyalkylene glycol), the impact of the electric field on the friction coefficient is significant. However, the reduction in friction coefficient is more intense in the case of copper compared to steel. At the same time, the adsorption energy values indicate that the interaction between (poly)propylene glycol (representing the PAG oil) and the iron surface is significantly stronger than that for the copper surface.
As a result, strong interaction between (poly)propylene glycol molecules and the iron surface contributes a large amount to the friction forces, whereas in the case of the copper surface, its contribution is limited. Strong adsorption of (poly)propylene glycol molecules prevents them from sliding on the surface, which is important in the case of higher relative velocities. The impact of adsorption energy on the friction coefficient is observable in a low contact pressure system (Figure 9a,b), where external mechanical forces do not overwhelm the influence of intermolecular interactions.
It must be underlined that the difference between the relative friction coefficient of steel and copper fades with the contact pressure decrease when internal mechanical forces are the main contributor to friction forces (cohesion) (Figure 9).
The impact of the electric field on the friction coefficient is explained by the polarity and the resulting dipole moment of the (poly)propylene glycol molecule. Because of the polarity of polyalkylene glycol molecules, the application of an electric field to the system generates additional forces that affect their interaction with the metal surface. In the case of a strong PPG molecule-iron surface interaction, the electric field can dramatically reduce the forces and weaken the interaction. On the contrary, for the copper surface, the interaction is weaker and the impact of the electric field is limited.
Nonpolar 1-decene and PAO 6 molecules are not affected while an electric field is applied; therefore, the impact of the electric field on the coefficient of friction is minor.
6. Conclusions
- 1
- All the results presented indicate that the application of a DC voltage between the sample holder and the metal disc generates an electric field which causes a reduction in friction in almost all the cases analysed. The highest observed decrease in friction coefficient due to an external constant electric field was for the PAG-St pair and amounted to 32% and the lowest decrease in friction was for the PAO-St pair and was a minimal change.
- 2
- The adsorption energies obtained from molecular modeling simulations show a correlation with those obtained from the experiment.
- (a)
- The higher values of the friction coefficient can be correlated with the higher values of the lubricant on the metal adsorption energy of the metal. Additionally, the effect of friction coefficient change under the action of an electric field can be explained by the resultant effect of the polarity/nonpolarity of the lubricant molecule with the lubricant-metal interaction energy.
- (b)
- In the case of nonpolar PAO 6 molecules, the electric field does not generate significant forces in the system, which would affect the orientation of molecules and/or the reduction of oil molecule–surface interactions.
- (c)
- Polar PAG molecules are sensitive to the external electric field as a result of their dipole moment. In this case, an external electric field generates new forces that act on the polar molecule and reduce its interaction with the metal surface. In this way, the strong interaction between PAG and the steel surface, which contributes significantly to friction forces, is reduced by the electric field. As a result, the application of the electric field dramatically reduces the friction coefficient.
- (d)
- In contrast, when the electric field is applied to the PAG—copper system, where the oil molecule—metal interactions are relatively weak, their removal by the electric field has a moderate effect on the friction forces.
Author Contributions
Conceptualization, M.G.; methodology, M.G., D.S. and S.P.; software, M.G. and D.S.; investigation, M.G. and S.P.; writing—original draft preparation, M.G., D.S. and S.P.; writing—review and editing, M.G., D.S. and S.P.; visualization, M.G., D.S. and S.P.; funding acquisition, M.G. All authors have read and agreed to the published version of the manuscript.
Funding
This research was funded by the National Science Centre, Cracow, Poland, grant number UMO-2016/21/B/ST8/02081.
Acknowledgments
Special thanks to the sainted memory of Juliusz Gajewski, the originator of the survey. The authors would like to thank Małgorzata Rutkowska-Gorczyca and Krystian Krochmalny from Wrocław University of Science and Technology, Poland for providing and assistance in conducting tests using a Glow Discharge Spectrometer and Scanning Electron Microscope.
Conflicts of Interest
The authors declare no conflict of interest.
Abbreviations
The following abbreviations are used in this manuscript:
| a | coefficient |
| A | coefficient |
| b | coefficient |
| B | coefficient |
| adsorption energy | |
| the system composed of a molecule adsorbed on the metal surface energy | |
| single molecule energy | |
| metal surface energy | |
| bond stretching energy | |
| plane angles energy | |
| dihedral angles energy | |
| van der Waals energy | |
| electrostatic interaction energy | |
| cross-terms energy | |
| R-Square | |
| T | absolute temperature |
| U | DC voltage |
| dynamic viscosity | |
| coefficient of friction under the action of the DC electric field applied | |
| coefficient of friction without external DC electric field | |
| kinematic viscosity | |
| density | |
| p | contact pressure |
| u | sliding velocity |
References
- Holmberg, K.; Erdemir, A. Influence of tribology on global energy consumption, costs and emissions. Friction 2017, 5, 263–284. [Google Scholar] [CrossRef] [Scilit]
- Loehle, S. Understanding of Adsorption Mechanism and Tribological Behaviors of C18 Fatty Acids on Iron-Based Surfaces: A Molecular Simulation Approach. Ecole Centrale de Lyon. 2014. Available online: https://tel.archives-ouvertes.fr/tel-00999372/document (accessed on 8 March 2022).
- Hutchings, I.M. Tribology Friction and Wear of Engineering Materials; Elsevier Butterworth Heinemann Ltd.: London, UK, 1992. [Google Scholar]
- Fischer, D.A.; Hu, Z.S.; Hsu, S.M. Molecular orientation and bonding of monolayer stearic acid on a copper surface prepared in air. Tribol. Lett. 1997, 3, 41–45. [Google Scholar] [CrossRef] [Scilit]
- Spikes, H. Tribology research in the twenty-first century. Tribol. Int. 2001, 34, 789–799. [Google Scholar] [CrossRef] [Scilit]
- Granick, S. Molecular Tribology. MRS Bull. 1991, 16, 33–35. [Google Scholar] [CrossRef] [Scilit]
- Pawlak, R.; Kawai, S.; Meier, T.; Glatzel, T.; Baratoff, A.; Meyer, E. Single-molecule manipulation experiments to explore friction and adhesion. J. Phys. D Appl. Phys. 2017, 50, 113003. [Google Scholar] [CrossRef] [Scilit]
- Bhushan, B. Modern Tribology Handbook; Two Volume Set; CRC Press: Boca Raton, FL, USA, 2000. [Google Scholar]
- Bouyer, J.; Fillon, M.; Helene, M.; Beaurain, J.; Giraudeau, C. Behavior of a two-lobe journal bearing with a scratched shaft: Comparison between theory and experiment. J. Tribol. 2019, 141, 021702. [Google Scholar] [CrossRef] [Scilit]
- Scaraggi, M.; Mezzapesa, F.P.; Carbone, G.; Ancona, A.; Sorgente, D.; Lugarà, P.M. Minimize friction of lubricated laser-microtextured-surfaces by tuning microholes depth. Tribol. Int. 2014, 75, 123–127. [Google Scholar] [CrossRef] [Scilit]
- Cuia, S.; Gu, L.; Fillon, M.; Wang, L.; Zhang, C. The effects of surface roughness on the transient characteristics of hydrodynamic cylindrical bearings during startup. Tribol. Int. 2018, 128, 421–428. [Google Scholar] [CrossRef] [Scilit]
- Vakis, A.I.; Yastrebov, V.A.; Scheibert, J.; Nicola, L.; Dini, D.; Minfray, C.; Almqvist, A.; Paggi, M.; Lee, S.; Limbert, G.; et al. Modeling and simulation in tribology across scales: An overview. Tribol. Int. 2018, 125, 169–199. [Google Scholar] [CrossRef] [Scilit]
- Cagin, W.A., III; Qi, Y.; Zhou, Y.; Che, J. First Principles Multiscale Modeling of Physico-Chemical Aspects of Tribology. Tribol. Ser. 2001, 39, 15–33. Available online: https://www.academia.edu/40023380 (accessed on 8 March 2022).
- Gao, G.T.; Mikulski, P.T.; Harrison, J.A. Molecular-scale tribology of amorphous carbon coating: Effects of film thickness, adhesion, and long-range interactions. J. Am. Chem. Soc. 2002, 124, 7202–7209. [Google Scholar] [CrossRef] [Scilit] [PubMed]
- Kim, H.-J.; Seo, K.-J.; Kang, K.H.; Kim, D.-E. Nano-lubrication: A review. Int. J. Precis. Eng. Manuf. 2016, 17, 829–841. [Google Scholar] [CrossRef] [Scilit]
- Zhang, L.C.; Mylvaganam, K. Nano-tribological analysis by molecular dynamics simulation—A review. J. Comput. Theor. Nanosci. 2006, 3, 167–188. [Google Scholar] [CrossRef] [Scilit]
- Hsu, S.M. Molecular basis of lubrication. Tribol. Int. 2004, 37, 553–559. [Google Scholar] [CrossRef] [Scilit]
- Gajewski, J.B.; Głogowski, M.J. How do the temperature, angular velocity and electric fields affect mechanical and electrokinetic phenomena in a friction junction? Tribol. Int. 2015, 87, 139–144. [Google Scholar] [CrossRef] [Scilit]
- Gajewski, J.B.; Głogowski, M.J.; Hałuszka, N. Effect of an electric field on friction of silicone rubber against steel in the motor base oil’s environment. Tribol. Int. 2017, 88, 214–217. [Google Scholar] [CrossRef] [Scilit]
- Gajewski, J.; Głogowski, M.; Paszkowski, M. Effect of rheological properties of PAG and PAO oils on the braking torque in a friction junction. In Proceedings of the 20th International Symposium on Surfactants in Solution, Coimbra, Portugal, 22–27 June 2014. [Google Scholar]
- Gajewski, J.B.; Głogowski, M.J.; Gatner, K.; Gawliński, M. ZDDP content in mineral and synthetic motor base oils and its effect on electrostatic and tribological phenomena in a rotating shaft–oil–lip seal system. Tribol. Int. 2010, 43, 1012–1016. [Google Scholar] [CrossRef] [Scilit]
- Liu, C.; Li, X.; Li, X.; Li, W.; Tian, Y.; Meng, Y. On-Line Feedback Control of Sliding Friction of Metals Lubricated by Adsorbed Boundary SDS Films. Lubricants 2022, 10, 148. [Google Scholar] [CrossRef] [Scilit]
- Gajewski, J.B.; Głogowski, M.J.; Wieleba, W. The effect of an electric field on the friction of selected elastomers against steel in a motor base oil’s environment. Tribologia 2015, 3, 21–31. Available online: https://bibliotekanauki.pl/articles/188744 (accessed on 8 March 2022).
- Stanciu, I. A new mathematical model for the viscosity of vegetable oils based on freely sliding molecules. Grasas y Aceites 2019, 70, e318. [Google Scholar] [CrossRef] [Scilit]
- Yokoyama, M.; Nakada, K.; Ishii, A. Density functional theory calculations for Pd adsorption on SO4 adsorbed on h-BN. Comput. Mater. Sci. 2014, 82, 231–236. [Google Scholar] [CrossRef] [Scilit]
- Karimadom, B.R.; Meyerstein, D.; Kornweitz, H. Calculating the adsorption energy of a charged adsorbent in a periodic metallic system—The case of BH4- hydrolysis on the Ag(111) surface. Phys. Chem. Chem. Phys. 2021, 23, 25667–25678. [Google Scholar] [CrossRef] [Scilit] [PubMed]
- Araujo, R.B.; Rodrigues, G.L.S.; Santos, E.S.d.; Pettersson, L.G.M. Adsorption energies on transition metal surfaces: Towards an accurate and balanced description. Nat. Commun. 2022, 13, 6853. [Google Scholar] [CrossRef] [Scilit] [PubMed]
- Sittiwong, J.; Hiruntrakool, K.; Rasrichai, A.; Opasmongkolchai, O.; Srifa, P.; Nilwanna, K.; Maihom, T.; Probst, M.; Limtrakul, J. Insights into glyphosate adsorption on Lewis acidic zeolites from theoretical modelling. Microporous Mesoporous Mater. 2022, 41, 112083. [Google Scholar] [CrossRef] [Scilit]
- Lu, C.; Chen, P.; Li, C.; Wang, J. Study of Intermolecular Interaction between Small Molecules and Carbon Nanobelt: Electrostatic, Exchange, Dispersive and Inductive Forces. Catalysts 2022, 12, 561. [Google Scholar] [CrossRef] [Scilit]
- Rappe, A.K.; Casewit, C.J.; Colwell, K.S.; Goddard, W.A., III; Skiff, W.M. UFF, a full periodic table force field for molecular mechanics and molecular dynamics simulations. J. Am. Chem. Soc. 1992, 114, 10024–10035. [Google Scholar] [CrossRef] [Scilit]
- Sun, H. COMPASS: An ab initio force-field optimized for condensed-phase applications overview with details on alkane and benzene compounds. J. Phys. Chem. B 1998, 102, 7338–7364. [Google Scholar] [CrossRef] [Scilit]
- Mueller, J.E.; van Duin, A.C.T.; Goddard, W.A. Development and validation of ReaxFF Reactive Force Field for hydrocarbon chemistry catalyzed by nickel. J. Phys. Chem. C 2010, 114, 4939–4949. [Google Scholar] [CrossRef] [Scilit]
- Mueller, J.E.; van Duin, A.C.T.; Goddard, W.A. Application of the ReaxFF Reactive Force Field to reactive dynamics of hydrocarbon chemisorption and decomposition. J. Phys. Chem. C 2010, 114, 5675–5685. [Google Scholar] [CrossRef] [Scilit]
- Senftle, T.P.; Hong, S.; Islam, M.M.; Kylasa, S.B.; Zheng, Y.; Shin, Y.K.; Junkermeier, C.; Engel-Herbert, R.; Janik, M.J.; Aktulga, H.M.; et al. The ReaxFF reactive force-field: Development, applications and future directions. Comput. Mater. 2016, 2, 15011. [Google Scholar] [CrossRef] [Scilit]

Disclaimer/Publisher’s Note: The statements, opinions and data contained in all publications are solely those of the individual author(s) and contributor(s) and not of MDPI and/or the editor(s). MDPI and/or the editor(s) disclaim responsibility for any injury to people or property resulting from any ideas, methods, instructions or products referred to in the content. |
© 2023 by the authors. Licensee MDPI, Basel, Switzerland. This article is an open access article distributed under the terms and conditions of the Creative Commons Attribution (CC BY) license (https://creativecommons.org/licenses/by/4.0/).